UNITED STATES
SECURITIES AND EXCHANGE COMMISSION
Washington, D.C. 20549
FORMN-CSR
CERTIFIED SHAREHOLDER REPORT OF REGISTERED
MANAGEMENT INVESTMENT COMPANIES
Investment Company Act file number:811-3618
BRIGHTHOUSE FUNDS TRUST II
(Exact name of registrant as specified in charter)
One Financial Center
Boston, MA 02111
(Address of principal executive offices)(Zip code)
| | |
| (Name and Address of Agent for Service) | | Copy to: |
| |
Michael Lawlor, Esq. -------------------------- c/o Brighthouse Investment Advisers, LLC One Financial Center Boston, MA 02111 | | Brian D. McCabe, Esq. ------------------------------- Ropes & Gray LLP Prudential Tower 800 Boylston Street Boston MA, 02199 |
Registrant’s telephone number, including area code:980-949-5130
Date of fiscal year end: December 31
Date of reporting period: December 31, 2018
1
Item 1: Report to Shareholders.
The following is a copy of the report transmitted to stockholders pursuant to Rule30e-1 under the Investment Company Act of 1940 (the “Act”):
2
Brighthouse Funds Trust II
Baillie Gifford International Stock Portfolio
Managed by Baillie Gifford Overseas Limited
Portfolio Manager Commentary*
PERFORMANCE
For the 12 months ended December 31, 2018, the Class A, B, and E shares of the Baillie Gifford International Stock Portfolio returned-17.01%,-17.19%, and-17.09%, respectively. The Portfolio’s benchmark, the MSCI All Country World (“ACWI”)ex-U.S. Index1, returned-14.20%.
MARKET ENVIRONMENT / CONDITIONS
2018 proved to be a turbulent year and one of the worst years for equity performance in a decade. Market weakness was widespread with most regions posting double digit declines. There was similarly indiscriminate write downs across all sectors and industries. Against this backdrop, the MSCI ACWIex-U.S. Index declined 14.20%. While it is often difficult to explain short-term swings in equity prices, the main reasons cited for the weakness over the year have tended to focus on factors such as an economic slowdown or threats to future growth from rising interest rates and trade wars, as opposed to specific issues at the corporate level.
Market confidence was fragile, with the first sharp fall in global stock prices in February. This coincided with the beginning in earnest of a trade war between the U.S. and China, with President Trump’s administration aiming an opening salvo at $60 billion worth of Chinese imports. The dispute moved to focus on the theft of intellectual property and the forced transfer of expertise from U.S. companies. Nervousness around what this might mean for global trade spilled into other markets, with sharpmid-year declines in emerging markets. European markets have also faced their share of woes with continued wrangling around Brexit (U.K. amendment to leave the European Union), weakness in the Italian economy and a disheartened electorate in France combining to weaken sentiment further.
PORTFOLIO REVIEW /PERIOD-END POSITIONING
The Portfolio underperformed its benchmark during 2018. As we would expect given our style of investing, performance was driven by the results of our stock picking approach as opposed to macro-economic considerations or asset allocation decisions. A number of holdings within the Portfolio made a significant contribution to relative performance, either negatively or positively.
ASOS (U.K.), the fast fashion retailer, was the largest detractor from relative performance. A profit warning in December saw a sharp decline in the ASOS share price. Issues at ASOS have centred on the company’s “Black Friday” strategy, where heavy discounting from competitors has proved a challenge whilst the company failed to realise the impact of the event in overseas markets such as Australia. Additionally, a strategic move to try to sell a narrower range of its own products proved unsuccessful, at a time when the company has been investing heavily in two new distribution centres in Atlanta and Berlin to drive growth. The company has revised down its guidance and margins are expected to be substantially impacted.
Naspers (South Africa) the media holdings company, invests in more than 100 companies but its largest holding is Tencent (in which it owns a 30% stake). Tencent (China) is an investment holding conglomerate, well known for online gaming and its WeChat social ecosystem. Chinese government gaming regulation and scrutiny of gaming addiction caused significant share price falls in Tencent over the year (which Naspers tends to move in line with). However, operationally, both companies have been performing well. Having had such negative pronouncements from the gaming regulator in the past, which passed without implication, our view currently is that Tencent is well placed to navigate the impact of any regulatory tightening. At year end, we continued to believe the long-term investment case remained strong for both companies. We took advantage of the short-term weakness in Tencent to buy a new holding for the Portfolio, which was funded by a partial reduction in Naspers.
On a more positive note, Edenred (France), the employee benefits vouchers business, has been executing on a transformation strategy focusing onde-risking its operational profile, which is starting to reap rewards and led to a sharp rise in the company’s share price. Gradual improvements in Brazil, which represents more than one third of revenues, are expected to sustain the recently accelerated earnings growth path. Ongoing developments in the digital payment world, where Edenred has an established foothold, open the doors to meaningful growth opportunities.
Constellation Software (Canada), a software company, was also amongst the strongest contributors. The company has reported strong earnings and growth results over the past twelve-months. Most recently, the company announced organic revenue growth was 5%year-on-year with the contribution of recurring revenue increasing to close to 70%. The company grows primarily through acquisitions, buying small software businesses that have a strong position in niche markets. Capital allocation discipline is notable with the founder Mark Leonard at the helm.
A number of new holdings were added to the Portfolio over the course of 2018. These included Spotify (Sweden), the online music streaming platform; HDFC (India), the largest mortgage lender in its domestic market; Tencent Music (China), the dominant music platform in China; and Danone (France), the world’s largest producer of organic foods. As discussed above, the Portfolio also took a holding in Tencent (China), the investment holding company. These new holdings were funded by sales made for fundamental stock-specific reasons such as that of Bureau Veritas (France), a testing and inspection company; Rakuten (Japan), thee-commerce company; and Baidu (China), an internet search provider.
The regional, sector, and industry positioning of the Portfolio are the product of such stock decisions made by the Portfolio managers rather than expressed views on international markets. At year end, the Portfolio remained relatively balanced at a regional level in comparison to the benchmark index, with an underweight to Japan being the most marked position at the close of the year in country terms.
BHFTII-1
Brighthouse Funds Trust II
Baillie Gifford International Stock Portfolio
Managed by Baillie Gifford Overseas Limited
Portfolio Manager Commentary*—(Continued)
At the sector level, deviations from the benchmark index remained more marked at year end, not changing significantly over the year. The Portfolio remained underweight in Health Care, Financials, Telecommunication Services, and Energy. At year end, the most significant overweights were the Industrials, Information Technology, and Consumer Discretionary sectors.
In industry terms, the most significant overweights for the Portfolio relative to the benchmark index at year end were in capital markets, internet & direct marketing retail, and machinery. We retained a significant underweight in oil, gas and consumable fuels, banks, and pharmaceuticals.
Jonathan Bates
Angus Franklin
Portfolio Managers
Baillie Gifford Overseas Limited
* This commentary may include statements that constitute “forward-looking statements” under the U.S. securities laws. Forward-looking statements include, among other things, projections, estimates, and information about possible or future results related to the Portfolio, market or regulatory developments. The views expressed above are not guarantees of future performance or economic results and involve certain risks, uncertainties and assumptions that could cause actual outcomes and results to differ materially from the views expressed herein. The views expressed above are subject to change at any time based upon economic, market, or other conditions and the subadvisory firm undertakes no obligation to update the views expressed herein. Any discussions of specific securities should not be considered a recommendation to buy or sell those securities. The views expressed above (including any forward-looking statement) may not be relied upon as investment advice or as an indication of the Portfolio’s trading intent. Information about the Portfolio’s holdings, asset allocation or country diversification is historical and is not an indication of future Portfolio composition, which may vary. Direct investment in any index is not possible. The performance of any index mentioned in this commentary has not been adjusted for ongoing management, distribution and operating expenses, and sales charges applicable to mutual fund investments. In addition, the returns do not reflect additional fees charged by separate accounts or variable insurance contracts that an investor in the Portfolio may pay. If these additional fees were reflected, performance would have been lower.
BHFTII-2
Brighthouse Funds Trust II
Baillie Gifford International Stock Portfolio
A $10,000 INVESTMENT COMPARED TO THE MSCI ALL COUNTRY WORLD EX-U.S. INDEX
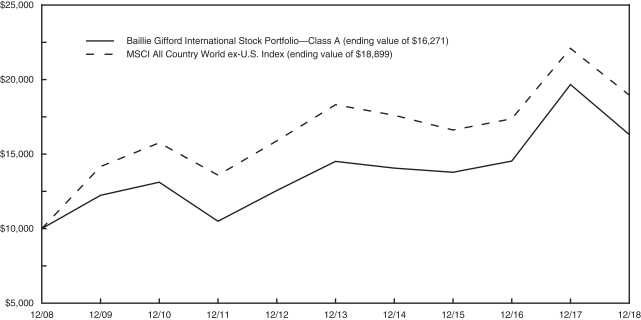
AVERAGE ANNUAL RETURNS (%) (FOR THE YEAR ENDED DECEMBER 31, 2018)
| | | | | | | | | | | | |
| | | | |
| | | 1 Year | | | 5 Year | | | 10 Year | |
| Baillie Gifford International Stock Portfolio | | | | | | | | | | | | |
Class A | | | -17.01 | | | | 2.34 | | | | 4.99 | |
Class B | | | -17.19 | | | | 2.10 | | | | 4.72 | |
Class E | | | -17.09 | | | | 2.20 | | | | 4.84 | |
| MSCI All Country Worldex-U.S. Index | | | -14.20 | | | | 0.68 | | | | 6.57 | |
1 The MSCI All Country World ex-U.S. Index is an unmanaged free float-adjusted market capitalization index that is designed to measure equity market performance in the global developed and emerging markets, excluding the U.S. The Index returns shown above were calculated with net dividends: they reflect the reinvestment of dividends after the deduction of the maximum possible withholding taxes.
Portfolio performance is calculated including reinvestment of all income and capital gain distributions. Performance numbers are net of all Portfolio expenses but do not include any insurance, sales, separate account or administrative charges of variable annuity or life insurance contracts or any additional expenses that participants may bear relating to the operations of their plans. If these charges were included, the returns would be lower. The performance of any index referenced above has not been adjusted for ongoing management, distribution and operating expenses, and sales charges applicable to mutual fund investments. Direct investment in any index is not possible. The performance of Class A shares, as set forth in the line graph above, will differ from that of other classes because of the difference in expenses paid by policyholders investing in the different share classes.
This information represents past performance and is not indicative of future results. Investment return and principal value may fluctuate so that shares, upon redemption, may be worth more or less than the original cost.
PORTFOLIO COMPOSITION AS OF DECEMBER 31, 2018
Top Holdings
| | | | |
| | | % of
Net Assets | |
| Taiwan Semiconductor Manufacturing Co., Ltd. | | | 3.4 | |
| SAP SE | | | 2.7 | |
| MercadoLibre, Inc. | | | 2.7 | |
| AIA Group, Ltd. | | | 2.5 | |
| Rio Tinto plc | | | 2.4 | |
| Deutsche Boerse AG | | | 2.4 | |
| Samsung Electronics Co., Ltd. | | | 2.2 | |
| Nestle S.A. | | | 2.1 | |
| Fairfax Financial Holdings, Ltd. | | | 1.9 | |
| Edenred | | | 1.9 | |
Top Countries
| | | | |
| | | % of
Net Assets | |
| United Kingdom | | | 13.9 | |
| Japan | | | 11.5 | |
| Germany | | | 8.7 | |
| Switzerland | | | 5.5 | |
| Ireland | | | 5.0 | |
| France | | | 4.9 | |
| Canada | | | 4.3 | |
| Taiwan | | | 4.2 | |
| Hong Kong | | | 4.1 | |
| Sweden | | | 4.1 | |
BHFTII-3
Brighthouse Funds Trust II
Baillie Gifford International Stock Portfolio
Understanding Your Portfolio’s Expenses
Shareholder Expense Example
As a shareholder of the Portfolio, you incur ongoing costs, including management fees; distribution and service(12b-1) fees; and other Portfolio expenses. This example is intended to help you understand your ongoing costs (in dollars) (referred to as “expenses”) of investing in the Portfolio and compare these costs with the ongoing costs of investing in other mutual funds. The example is based on an investment of $1,000 invested at the beginning of the period and held for the entire period, July 1, 2018 through December 31, 2018.
Actual Expenses
The first line for each share class of the Portfolio in the table below provides information about actual account values and actual expenses. You may use the information in this line, together with the amount you invested in the particular share class of the Portfolio, to estimate the expenses that you paid over the period. Simply divide your account value by $1,000 (for example, an $8,600 account value divided by $1,000 = 8.6), then multiply the result by the number in the first line under the heading entitled “Expenses Paid During Period” to estimate the expenses you paid on your account during this period.
Hypothetical Example for Comparison Purposes
The second line for each share class of the Portfolio in the table below provides information about hypothetical account values and hypothetical expenses based on the Portfolio’s actual expense ratio and an assumed rate of return of 5% per year before expenses, which is not the Portfolio’s actual return. The hypothetical account values and expenses may not be used to estimate the actual ending account balance or expenses you paid for the period. You may use this information to compare the ongoing costs of investing in the Portfolio and other funds. To do so, compare this 5% hypothetical example with the 5% hypothetical examples that appear in the shareholder reports of the other funds.
Please note that the expenses shown in the table are meant to highlight your ongoing costs only and do not reflect any fees or charges of your variable insurance product or any additional expenses that participants in certain eligible qualified plans may bear relating to the operations of their plan. Therefore, the second line for each share class in the table is useful in comparing ongoing costs only, and will not help you determine the relative total costs of owning different funds. In addition, if these other costs were included, your costs would have been higher.
| | | | | | | | | | | | | | | | | | |
Baillie Gifford International Stock Portfolio
| | | | Annualized
Expense
Ratio | | | Beginning
Account Value
July 1,
2018 | | | Ending
Account Value
December 31,
2018 | | | Expenses Paid
During Period**
July 1, 2018
to
December 31,
2018 | |
Class A (a) | | Actual | | | 0.71 | % | | $ | 1,000.00 | | | $ | 857.60 | | | $ | 3.32 | |
| | Hypothetical* | | | 0.71 | % | | $ | 1,000.00 | | | $ | 1,021.63 | | | $ | 3.62 | |
| | | | | |
Class B (a) | | Actual | | | 0.96 | % | | $ | 1,000.00 | | | $ | 857.00 | | | $ | 4.49 | |
| | Hypothetical* | | | 0.96 | % | | $ | 1,000.00 | | | $ | 1,020.37 | | | $ | 4.89 | |
| | | | | |
Class E (a) | | Actual | | | 0.86 | % | | $ | 1,000.00 | | | $ | 857.70 | | | $ | 4.03 | |
| | Hypothetical* | | | 0.86 | % | | $ | 1,000.00 | | | $ | 1,020.87 | | | $ | 4.38 | |
| * | Hypothetical assumes a rate of return of 5% per year before expenses. |
| ** | Expenses paid are equal to the Portfolio’s annualized expense ratio for the most recent six month period, as shown above, multiplied by the average account value over the period, multiplied by the number of days (184 days) in the most recent fiscal half-year, divided by 365 (to reflect theone-half year period). |
| (a) | The annualized expense ratio shown reflects the impact of the management fee waiver as described in Note 5 of the Notes to Financial Statements. |
BHFTII-4
Brighthouse Funds Trust II
Baillie Gifford International Stock Portfolio
Schedule of Investments as of December 31, 2018
Common Stocks—98.2% of Net Assets
| | | | | | | | |
| Security Description | | Shares | | | Value | |
|
| Argentina—2.7% | |
MercadoLibre, Inc. (a) | | | 155,633 | | | $ | 45,577,124 | |
| | | | | | | | |
|
| Australia—1.0% | |
Cochlear, Ltd. | | | 140,697 | | | | 17,096,483 | |
| | | | | | | | |
|
| Brazil—1.6% | |
Itau Unibanco Holding S.A. (ADR) | | | 1,853,662 | | | | 16,942,471 | |
Kroton Educacional S.A. | | | 4,164,500 | | | | 9,503,629 | |
| | | | | | | | |
| | | | | | | 26,446,100 | |
| | | | | | | | |
|
| Canada—4.3% | |
Constellation Software, Inc. | | | 44,429 | | | | 28,438,856 | |
Fairfax Financial Holdings, Ltd. | | | 74,426 | | | | 32,763,359 | |
Ritchie Bros. Auctioneers, Inc. (b) | | | 370,516 | | | | 12,123,283 | |
| | | | | | | | |
| | | | | | | 73,325,498 | |
| | | | | | | | |
|
| China—4.0% | |
Alibaba Group Holding, Ltd. (ADR) (a) (b) | | | 227,071 | | | | 31,124,622 | |
Tencent Holdings, Ltd. | | | 736,800 | | | | 29,206,035 | |
Tencent Music Entertainment Group (ADR) (a) (b) | | | 558,923 | | | | 7,388,962 | |
| | | | | | | | |
| | | | | | | 67,719,619 | |
| | | | | | | | |
|
| Denmark—2.5% | |
DSV A/S | | | 379,662 | | | | 25,034,829 | |
Novozymes A/S - B Shares | | | 372,104 | | | | 16,632,513 | |
| | | | | | | | |
| | | | | | | 41,667,342 | |
| | | | | | | | |
|
| Finland—2.4% | |
Kone Oyj - Class B | | | 558,025 | | | | 26,582,810 | |
Sampo Oyj - A Shares | | | 307,017 | | | | 13,496,822 | |
| | | | | | | | |
| | | | | | | 40,079,632 | |
| | | | | | | | |
|
| France—4.9% | |
Danone S.A. | | | 240,476 | | | | 16,948,612 | |
Edenred | | | 859,539 | | | | 31,508,269 | |
EssilorLuxottica S.A. | | | 121,889 | | | | 15,391,189 | |
Legrand S.A. | | | 331,017 | | | | 18,630,821 | |
| | | | | | | | |
| | | | | | | 82,478,891 | |
| | | | | | | | |
|
| Germany—8.7% | |
Brenntag AG | | | 229,696 | | | | 9,913,489 | |
Continental AG | | | 69,354 | | | | 9,590,153 | |
Deutsche Boerse AG | | | 333,728 | | | | 40,133,211 | |
MTU Aero Engines AG | | | 97,682 | | | | 17,742,118 | |
SAP SE | | | 459,355 | | | | 45,756,204 | |
Scout24 AG | | | 556,173 | | | | 25,597,936 | |
| | | | | | | | |
| | | | | | | 148,733,111 | |
| | | | | | | | |
|
| Hong Kong—4.1% | |
AIA Group, Ltd. | | | 5,262,200 | | | | 43,288,216 | |
Hong Kong Exchanges and Clearing, Ltd. | | | 948,000 | | | | 27,204,687 | |
| | | | | | | | |
| | | | | | | 70,492,903 | |
| | | | | | | | |
|
| India—1.8% | |
Housing Development Finance Corp., Ltd. | | | 1,109,992 | | | | 31,250,657 | |
| | | | | | | | |
|
| Ireland—5.0% | |
CRH plc | | | 779,090 | | | | 20,445,999 | |
James Hardie Industries plc | | | 838,564 | | | | 8,930,013 | |
Kingspan Group plc | | | 606,914 | | | | 25,994,443 | |
Ryanair Holdings plc (ADR) (a) | | | 417,048 | | | | 29,752,204 | |
| | | | | | | | |
| | | | | | | 85,122,659 | |
| | | | | | | | |
|
| Japan—11.5% | |
Denso Corp. | | | 408,500 | | | | 18,129,261 | |
FANUC Corp. | | | 83,500 | | | | 12,553,196 | |
Japan Exchange Group, Inc. | | | 1,894,800 | | | | 30,430,060 | |
Nidec Corp. | | | 197,200 | | | | 22,600,054 | |
Shimano, Inc. | | | 174,100 | | | | 24,750,766 | |
SMC Corp. | | | 80,300 | | | | 23,985,629 | |
Sony Corp. | | | 408,000 | | | | 19,648,013 | |
Sumitomo Mitsui Trust Holdings, Inc. | | | 585,300 | | | | 21,304,281 | |
Toyota Tsusho Corp. | | | 750,000 | | | | 22,058,095 | |
| | | | | | | | |
| | | | | | | 195,459,355 | |
| | | | | | | | |
|
| Netherlands—1.5% | |
Heineken Holding NV | | | 304,540 | | | | 25,631,201 | |
| | | | | | | | |
|
| Panama—1.1% | |
Copa Holdings S.A. - Class A | | | 242,804 | | | | 19,111,103 | |
| | | | | | | | |
|
| Peru—1.3% | |
Credicorp, Ltd. | | | 102,148 | | | | 22,643,147 | |
| | | | | | | | |
|
| Russia—0.6% | |
Magnit PJSC (GDR) | | | 854,138 | | | | 10,873,546 | |
| | | | | | | | |
|
| Singapore—1.6% | |
United Overseas Bank, Ltd. | | | 1,513,864 | | | | 27,134,190 | |
| | | | | | | | |
|
| South Africa—2.4% | |
Discovery, Ltd. | | | 1,702,346 | | | | 18,779,093 | |
Naspers, Ltd. - N Shares | | | 114,443 | | | | 22,732,658 | |
| | | | | | | | |
| | | | | | | 41,511,751 | |
| | | | | | | | |
|
| South Korea—3.0% | |
NAVER Corp. | | | 130,234 | | | | 14,190,006 | |
Samsung Electronics Co., Ltd. | | | 1,074,146 | | | | 37,166,173 | |
| | | | | | | | |
| | | | | | | 51,356,179 | |
| | | | | | | | |
|
| Spain—2.9% | |
Bankinter S.A. | | | 2,097,742 | | | | 16,765,775 | |
Grifols S.A. | | | 469,966 | | | | 12,275,643 | |
Industria de Diseno Textil S.A. | | | 790,927 | | | | 20,163,153 | |
| | | | | | | | |
| | | | | | | 49,204,571 | |
| | | | | | | | |
|
| Sweden—4.1% | |
Atlas Copco AB - B Shares | | | 1,173,440 | | | | 25,727,757 | |
Epiroc AB - Class B (a) | | | 2,067,087 | | | | 18,503,294 | |
See accompanying notes to financial statements.
BHFTII-5
Brighthouse Funds Trust II
Baillie Gifford International Stock Portfolio
Schedule of Investments as of December 31, 2018
Common Stocks—(Continued)
| | | | | | | | |
| Security Description | |
Shares | | | Value | |
|
| Sweden—(Continued) | |
Svenska Handelsbanken AB - A Shares (b) | | | 2,295,488 | | | $ | 25,428,716 | |
| | | | | | | | |
| | | | | | | 69,659,767 | |
| | | | | | | | |
|
| Switzerland—5.5% | |
Cie Financiere Richemont S.A. | | | 225,742 | | | | 14,507,859 | |
Credit Suisse Group AG (a) | | | 1,477,754 | | | | 16,285,060 | |
Nestle S.A. | | | 432,234 | | | | 35,140,990 | |
Panalpina Welttransport Holding AG (b) | | | 76,588 | | | | 10,192,032 | |
SGS S.A. | | | 7,859 | | | | 17,706,357 | |
| | | | | | | | |
| | | | | | | 93,832,298 | |
| | | | | | | | |
|
| Taiwan—4.2% | |
Hon Hai Precision Industry Co., Ltd. | | | 5,382,067 | | | | 12,422,462 | |
Taiwan Semiconductor Manufacturing Co., Ltd. | | | 8,020,000 | | | | 58,219,406 | |
| | | | | | | | |
| | | | | | | 70,641,868 | |
| | | | | | | | |
|
| United Kingdom—13.9% | |
ASOS plc (a) (b) | | | 299,662 | | | | 8,648,148 | |
boohoo Group plc (a) | | | 6,934,394 | | | | 14,205,122 | |
Burberry Group plc | | | 529,921 | | | | 11,658,854 | |
Experian plc | | | 1,111,686 | | | | 27,019,224 | |
Hargreaves Lansdown plc (b) | | | 1,126,766 | | | | 26,548,328 | |
Howden Joinery Group plc | | | 2,000,642 | | | | 11,064,734 | |
Just Eat plc (a) (b) | | | 3,003,763 | | | | 22,468,152 | |
Prudential plc | | | 1,485,688 | | | | 26,544,883 | |
Rio Tinto plc | | | 863,199 | | | | 41,158,081 | |
Rolls-Royce Holdings plc (a) | | | 773,191 | | | | 8,136,700 | |
St. James’s Place plc | | | 1,105,135 | | | | 13,241,127 | |
Unilever NV | | | 479,004 | | | | 26,026,673 | |
| | | | | | | | |
| | | | | | | 236,720,026 | |
| | | | | | | | |
|
| United States—1.6% | |
Pricesmart, Inc. (b) | | | 130,472 | | | | 7,710,895 | |
Spotify Technology S.A. (a) | | | 177,146 | | | | 20,106,071 | |
| | | | | | | | |
| | | | | | | 27,816,966 | |
| | | | | | | | |
Total Common Stocks
(Cost $1,505,827,225) | | | | | | | 1,671,585,987 | |
| | | | | | | | |
|
| Preferred Stock—0.3% | |
|
| Spain—0.3% | |
Grifols S.A. - Class B
(Cost $6,362,013) | | | 261,847 | | | | 4,827,692 | |
| | | | | | | | |
| Short-Term Investment—1.3% | |
| Security Description | |
Principal
Amount* | | | Value | |
|
| Repurchase Agreement—1.3% | |
Fixed Income Clearing Corp.
Repurchase Agreement dated 12/31/18 at 1.200%, due on 01/02/19 with a maturity value of $22,700,466; collateralized by U.S. Treasury Notes with rates ranging from 2.125% - 2.500%, maturity dates ranging from 03/31/24 - 05/15/24, and an aggregate market value of $23,153,469. | | | 22,698,953 | | | | 22,698,953 | |
| | | | | | | | |
Total Short-Term Investments
(Cost $22,698,953) | | | | | | | 22,698,953 | |
| | | | | | | | |
|
| Securities Lending Reinvestments (c)—6.4% | |
|
| Certificates of Deposit—0.1% | |
Banco Del Estado De Chile New York
2.820%, 1M LIBOR + 0.350%, 05/20/19 (d) | | | 1,000,000 | | | | 999,979 | |
Natixis New York
2.810%, 1M LIBOR + 0.370%, 02/14/19 (d) | | | 1,000,000 | | | | 1,000,187 | |
| | | | | | | | |
| | | | | | | 2,000,166 | |
| | | | | | | | |
|
| Commercial Paper—0.2% | |
HSBC Bank plc
2.842%, 1M LIBOR + 0.320%, 07/30/19 (d) | | | 1,000,000 | | | | 1,000,000 | |
ING Funding LLC
2.707%, 1M LIBOR + 0.320%, 02/08/19 (d) | | | 1,500,000 | | | | 1,500,139 | |
| | | | | | | | |
| | | | | | | 2,500,139 | |
| | | | | | | | |
|
| Repurchase Agreements—5.8% | |
Citigroup Global Markets, Ltd.
Repurchase Agreement dated 12/31/18 at 2.490%, due on 01/02/19 with a maturity value of $10,662,087; collateralized by U.S. Treasury Obligations with rates ranging from 0.375%- 1.875%, maturity dates ranging from 12/15/20 - 01/15/27, and an aggregate market value of $10,873,832. | | | 10,660,612 | | | | 10,660,612 | |
Repurchase Agreement dated 12/31/18 at 2.490%, due on 01/02/19 with a maturity value of $3,500,484; collateralized by U.S. Treasury Obligations with rates ranging from 1.625% - 2.875%, maturity dates ranging from 06/30/20 - 11/15/46, and an aggregate market value of $3,570,000. | | | 3,500,000 | | | | 3,500,000 | |
Deutsche Bank AG, London
Repurchase Agreement dated 12/31/18 at 2.750%, due on 01/02/19 with a maturity value of $10,001,528; collateralized by U.S. Treasury and Foreign Obligations with rates ranging from 1.000% - 2.590%, maturity dates ranging from 03/31/19 - 12/29/26, and an aggregate market value of $10,200,000. | | | 10,000,000 | | | | 10,000,000 | |
Deutsche Bank Securities, Inc.
Repurchase Agreement dated 12/31/18 at 3.200%, due on 01/02/19 with a maturity value of $8,685,588; collateralized by U.S. Treasury Obligations at 0.000%, maturity dates ranging from 08/15/30 - 08/15/39, and an aggregate market value of $8,857,725. | | | 8,684,044 | | | | 8,684,044 | |
See accompanying notes to financial statements.
BHFTII-6
Brighthouse Funds Trust II
Baillie Gifford International Stock Portfolio
Schedule of Investments as of December 31, 2018
Securities Lending Reinvestments (c)—(Continued)
| | | | | | | | |
| Security Description | |
Principal
Amount* | | | Value | |
|
| Repurchase Agreements—(Continued) | |
NBC Global Finance, Ltd.
Repurchase Agreement dated 12/31/18 at 2.560%, due on 01/02/19 with a maturity value of $5,500,782; collateralized by various Common Stock with an aggregate market value of $6,122,667. | | | 5,500,000 | | | $ | 5,500,000 | |
Repurchase Agreement dated 12/31/18 at 2.560%, due on 01/02/19 with a maturity value of $3,500,498; collateralized by various Common Stock with an aggregate market value of $3,896,243. | | | 3,500,000 | | | | 3,500,000 | |
Repurchase Agreement dated 12/31/18 at 2.560%, due on 01/02/19 with a maturity value of $14,001,991; collateralized by various Common Stock with an aggregate market value of $15,584,972. | | | 14,000,000 | | | | 14,000,000 | |
Nomura Securities International, Inc.
Repurchase Agreement dated 12/31/18 at 2.950%, due on 01/02/19 with a maturity value of $20,003,278; collateralized by U.S. Treasury Obligations with rates ranging from 0.000% - 6.500%, maturity dates ranging from 02/15/19 - 08/15/48, and an aggregate market value of $20,400,000. | | | 20,000,000 | | | | 20,000,000 | |
Societe Generale
Repurchase Agreement dated 12/31/18 at 2.530%, due on 01/02/19 with a maturity value of $3,800,534; collateralized by U.S. Treasury Obligations with rates ranging from 0.750% - 8.000%, maturity dates ranging from 09/30/19 - 08/15/46, and various Common Stock with an aggregate market value of $4,162,808. | | | 3,800,000 | | | | 3,800,000 | |
Repurchase Agreement dated 12/31/18 at 2.530%, due on 01/02/19 with a maturity value of $10,001,406; collateralized by U.S. Treasury Obligations with rates ranging from 0.750% - 8.000%, maturity dates ranging from 09/30/19 - 08/15/46, and various Common Stock with an aggregate market value of $10,954,759. | | | 10,000,000 | | | | 10,000,000 | |
Repurchase Agreement dated 12/31/18 at 2.530%, due on 01/02/19 with a maturity value of $7,501,054; collateralized by U.S. Treasury Obligations with rates ranging from 0.750% - 8.000%, maturity dates ranging from 09/30/19 - 08/15/46, and various Common Stock with an aggregate market value of $8,216,069. | | | 7,500,000 | | | | 7,500,000 | |
Repurchase Agreement dated 12/31/18 at 2.560%, due on 01/07/19 with a maturity value of $1,000,498; collateralized by U.S. Treasury Obligations with rates ranging from 0.750% - 8.000%, maturity dates ranging from 09/30/19 - 08/15/46, and various Common Stock with an aggregate market value of $1,095,476. | | | 1,000,000 | | | | 1,000,000 | |
Repurchase Agreement dated 12/31/18 at 2.560%, due on 01/07/19 with a maturity value of $500,249; collateralized by U.S. Treasury Obligations with rates ranging from 0.750% - 8.000%, maturity dates ranging from 09/30/19 - 08/15/46, and various Common Stock with an aggregate market value of $547,738. | | | 500,000 | | | | 500,000 | |
| | | | | | | | |
| | | | | | | 98,644,656 | |
| | | | | | | | |
|
| Time Deposit—0.3% | |
Royal Bank of Canada
2.420%, 01/02/19 | | | 5,000,000 | | | | 5,000,000 | |
| | | | | | | | |
Total Securities Lending Reinvestments
(Cost $108,144,656) | | | | | | | 108,144,961 | |
| | | | | | | | |
Total Investments—106.2%
(Cost $1,643,032,847) | | | | | | | 1,807,257,593 | |
Other assets and liabilities (net)—(6.2)% | | | | | | | (105,663,916 | ) |
| | | | | | | | |
| Net Assets—100.0% | | | | | | $ | 1,701,593,677 | |
| | | | | | | | |
| | | | |
| * | | Principal amount stated in U.S. dollars unless otherwise noted. |
| (a) | | Non-income producing security. |
| (b) | | All or a portion of the security was held on loan. As of December 31, 2018, the market value of securities loaned was $106,751,656 and the collateral received consisted of cash in the amount of $108,144,656 andnon-cash collateral with a value of $3,088,187. The cash collateral investments are disclosed in the Schedule of Investments and categorized as Securities Lending Reinvestments. Thenon-cash collateral received consists of U.S. government securities that are held in safe-keeping by the lending agent, or a third-party custodian, and cannot be sold or repledged by the Portfolio. As such, this non-cash collateral is excluded from the Statement of Assets and Liabilities. |
| (c) | | Represents investment of cash collateral received from securities on loan as of December 31, 2018. |
| (d) | | Variable or floating rate security. The stated rate represents the rate at December 31, 2018. Maturity date shown for callable securities reflects the earliest possible call date. For securities based on a published reference index and spread, the index and spread are indicated in the description above. For certain variable rate securities, the coupon rate is determined by the issuer/agent based on current market conditions. For certain asset- and mortgage-backed securities, the coupon rate may fluctuate based on changes of the underlying collateral or prepayments of principal. These securities do not indicate a reference index and spread in their description above. |
| (ADR)— | | American Depositary Receipt |
| (GDR)— | | Global Depositary Receipt |
| (LIBOR)— | | London Interbank Offered Rate |
| | | | |
Ten Largest Industries as of December 31, 2018 (Unaudited) | | % of
Net Assets | |
Capital Markets | | | 9.0 | |
Insurance | | | 7.9 | |
Banks | | | 7.6 | |
Internet & Direct Marketing Retail | | | 7.2 | |
Machinery | | | 6.3 | |
Software | | | 4.4 | |
Interactive Media & Services | | | 4.1 | |
Semiconductors & Semiconductor Equipment | | | 3.4 | |
Food Products | | | 3.1 | |
Airlines | | | 2.9 | |
See accompanying notes to financial statements.
BHFTII-7
Brighthouse Funds Trust II
Baillie Gifford International Stock Portfolio
Schedule of Investments as of December 31, 2018
Fair Value Hierarchy
Accounting principles generally accepted in the United States of America (“GAAP”) define fair market value as the price that the Portfolio would receive to sell an asset or pay to transfer a liability in an orderly transaction between market participants at the measurement date. It establishes a fair value hierarchy that prioritizes inputs to valuation methods and requires disclosure of the fair value hierarchy, separately for each major category of assets and liabilities, that segregates fair value measurements into three levels. Levels 1, 2 and 3 of the fair value hierarchy are defined as follows:
Level 1 - unadjusted quoted prices in active markets for identical investments
Level 2 - other significant observable inputs (including, but not limited to, quoted prices for similar assets or liabilities in markets that are either active or inactive; inputs other than quoted prices that are observable such as interest rates, yield curves, volatilities, prepayment speeds, loss severities, credit risks, default rates, or other market corroborated inputs)
Level 3 - significant unobservable inputs based on the best information available in the circumstances, to the extent observable inputs are unavailable (including the Portfolio’s own assumptions used in determining the fair value of investments and derivative financial instruments)
The inputs or methodologies used for valuing investments are not necessarily an indication of the risk associated with investing in them. Changes to the inputs or methodologies used may result in transfers between levels. A reconciliation of Level 3 securities, if any, will be disclosed following the fair value hierarchy table. For more information about the Portfolio’s policy regarding the valuation of investments, please refer to the Notes to Financial Statements.
The following table summarizes the fair value hierarchy of the Portfolio’s investments as of December 31, 2018:
| | | | | | | | | | | | | | | | |
| Description | | Level 1 | | | Level 2 | | | Level 3 | | | Total | |
| Common Stocks | |
Argentina | | $ | 45,577,124 | | | $ | — | | | $ | — | | | $ | 45,577,124 | |
Australia | | | — | | | | 17,096,483 | | | | — | | | | 17,096,483 | |
Brazil | | | 16,942,471 | | | | 9,503,629 | | | | — | | | | 26,446,100 | |
Canada | | | 73,325,498 | | | | — | | | | — | | | | 73,325,498 | |
China | | | 38,513,584 | | | | 29,206,035 | | | | — | | | | 67,719,619 | |
Denmark | | | — | | | | 41,667,342 | | | | — | | | | 41,667,342 | |
Finland | | | — | | | | 40,079,632 | | | | — | | | | 40,079,632 | |
France | | | — | | | | 82,478,891 | | | | — | | | | 82,478,891 | |
Germany | | | — | | | | 148,733,111 | | | | — | | | | 148,733,111 | |
Hong Kong | | | — | | | | 70,492,903 | | | | — | | | | 70,492,903 | |
India | | | — | | | | 31,250,657 | | | | — | | | | 31,250,657 | |
Ireland | | | 29,752,204 | | | | 55,370,455 | | | | — | | | | 85,122,659 | |
Japan | | | — | | | | 195,459,355 | | | | — | | | | 195,459,355 | |
Netherlands | | | — | | | | 25,631,201 | | | | — | | | | 25,631,201 | |
Panama | | | 19,111,103 | | | | — | | | | — | | | | 19,111,103 | |
Peru | | | 22,643,147 | | | | — | | | | — | | | | 22,643,147 | |
Russia | | | — | | | | 10,873,546 | | | | — | | | | 10,873,546 | |
Singapore | | | — | | | | 27,134,190 | | | | — | | | | 27,134,190 | |
South Africa | | | — | | | | 41,511,751 | | | | — | | | | 41,511,751 | |
South Korea | | | — | | | | 51,356,179 | | | | — | | | | 51,356,179 | |
Spain | | | — | | | | 49,204,571 | | | | — | | | | 49,204,571 | |
Sweden | | | — | | | | 69,659,767 | | | | — | | | | 69,659,767 | |
Switzerland | | | — | | | | 93,832,298 | | | | — | | | | 93,832,298 | |
Taiwan | | | — | | | | 70,641,868 | | | | — | | | | 70,641,868 | |
United Kingdom | | | — | | | | 236,720,026 | | | | — | | | | 236,720,026 | |
United States | | | 27,816,966 | | | | — | | | | — | | | | 27,816,966 | |
Total Common Stocks | | | 273,682,097 | | | | 1,397,903,890 | | | | — | | | | 1,671,585,987 | |
Total Preferred Stock* | | | — | | | | 4,827,692 | | | | — | | | | 4,827,692 | |
Total Short-Term Investment* | | | — | | | | 22,698,953 | | | | — | | | | 22,698,953 | |
Total Securities Lending Reinvestments* | | | — | | | | 108,144,961 | | | | — | | | | 108,144,961 | |
Total Investments | | $ | 273,682,097 | | | $ | 1,533,575,496 | | | $ | — | | | $ | 1,807,257,593 | |
| | | | | | | | | | | | | | | | | |
Collateral for Securities Loaned (Liability) | | $ | — | | | $ | (108,144,656 | ) | | $ | — | | | $ | (108,144,656 | ) |
| | | | |
| * | | See Schedule of Investments for additional detailed categorizations. |
See accompanying notes to financial statements.
BHFTII-8
Brighthouse Funds Trust II
Baillie Gifford International Stock Portfolio
Statement of Assets and Liabilities
December 31, 2018
| | | | |
Assets | |
Investments at value (a) (b) | | $ | 1,807,257,593 | |
Cash denominated in foreign currencies (c) | | | 716,305 | |
Receivable for: | |
Investments sold | | | 39,422 | |
Fund shares sold | | | 588,759 | |
Dividends and interest | | | 3,035,936 | |
Prepaid expenses | | | 5,250 | |
| | | | |
Total Assets | | | 1,811,643,265 | |
Liabilities | |
Collateral for securities loaned | | | 108,144,656 | |
Payables for: | |
Fund shares redeemed | | | 128,903 | |
Accrued Expenses: | |
Management fees | | | 990,233 | |
Distribution and service fees | | | 61,882 | |
Deferred trustees’ fees | | �� | 138,370 | |
Other expenses | | | 585,544 | |
| | | | |
Total Liabilities | | | 110,049,588 | |
| | | | |
Net Assets | | $ | 1,701,593,677 | |
| | | | |
Net Assets Consist of: | |
Paid in surplus | | $ | 1,406,018,918 | |
Distributable earnings (Accumulated losses) | | | 295,574,759 | |
| | | | |
Net Assets | | $ | 1,701,593,677 | |
| | | | |
Net Assets | |
Class A | | $ | 1,407,777,427 | |
Class B | | | 277,596,456 | |
Class E | | | 16,219,794 | |
Capital Shares Outstanding* | |
Class A | | | 127,690,302 | |
Class B | | | 25,589,404 | |
Class E | | | 1,486,833 | |
Net Asset Value, Offering Price and Redemption Price Per Share | |
Class A | | $ | 11.02 | |
Class B | | | 10.85 | |
Class E | | | 10.91 | |
| | | | |
| * | | The Portfolio is authorized to issue an unlimited number of shares. |
| (a) | | Identified cost of investments was $1,643,032,847. |
| (b) | | Includes securities loaned at value of $106,751,656. |
| (c) | | Identified cost of cash denominated in foreign currencies was $711,314. |
Statement of Operations
Year Ended December 31, 2018
| | | | |
Investment Income | |
Dividends (a) | | $ | 37,062,613 | |
Interest | | | 148,267 | |
Securities lending income | | | 317,442 | |
| | | | |
Total investment income | | | 37,528,322 | |
Expenses | |
Management fees | | | 14,766,331 | |
Administration fees | | | 67,179 | |
Custodian and accounting fees | | | 525,985 | |
Distribution and service fees—Class B | | | 824,654 | |
Distribution and service fees—Class E | | | 28,920 | |
Audit and tax services | | | 55,145 | |
Legal | | | 45,317 | |
Trustees’ fees and expenses | | | 33,732 | |
Shareholder reporting | | | 108,621 | |
Insurance | | | 12,210 | |
Miscellaneous | | | 133,886 | |
| | | | |
Total expenses | | | 16,601,980 | |
Less management fee waiver | | | (2,298,266 | ) |
| | | | |
Net expenses | | | 14,303,714 | |
| | | | |
Net Investment Income | | | 23,224,608 | |
| | | | |
Net Realized and Unrealized Gain (Loss) | |
| Net realized gain (loss) on: | |
Investments | | | 111,160,399 | |
Foreign currency transactions | | | (761,365 | ) |
| | | | |
Net realized gain | | | 110,399,034 | |
| | | | |
| Net change in unrealized depreciation on: | |
Investments | | | (473,003,808 | ) |
Foreign currency transactions | | | (122,236 | ) |
| | | | |
Net change in unrealized depreciation | | | (473,126,044 | ) |
| | | | |
Net realized and unrealized loss | | | (362,727,010 | ) |
| | | | |
Net Decrease in Net Assets From Operations | | $ | (339,502,402 | ) |
| | | | |
| | | | |
| (a) | | Net of foreign withholding taxes of $3,918,483. |
See accompanying notes to financial statements.
BHFTII-9
Brighthouse Funds Trust II
Baillie Gifford International Stock Portfolio
Statements of Changes in Net Assets
| | | | | | | | |
| | | Year Ended
December 31,
2018 | | | Year Ended
December 31,
2017 | |
Increase (Decrease) in Net Assets: | |
From Operations | |
Net investment income | | $ | 23,224,608 | | | $ | 21,464,894 | |
Net realized gain | | | 110,399,034 | | | | 109,990,740 | |
Net change in unrealized appreciation (depreciation) | | | (473,126,044 | ) | | | 407,661,229 | |
| | | | | | | | |
Increase (decrease) in net assets from operations | | | (339,502,402 | ) | | | 539,116,863 | |
| | | | | | | | |
From Distributions to Shareholders (a) | |
Class A | | | (18,443,225 | ) | | | (17,587,214 | ) |
Class B | | | (3,023,120 | ) | | | (3,469,294 | ) |
Class E | | | (196,972 | ) | | | (232,526 | ) |
| | | | | | | | |
Total distributions | | | (21,663,317 | ) | | | (21,289,034 | ) |
| | | | | | | | |
Increase (decrease) in net assets from capital share transactions | | | 214,440,920 | | | | (321,838,239 | ) |
| | | | | | | | |
Total increase (decrease) in net assets | | | (146,724,799 | ) | | | 195,989,590 | |
|
Net Assets | |
Beginning of period | | | 1,848,318,476 | | | | 1,652,328,886 | |
| | | | | | | | |
End of period | | $ | 1,701,593,677 | | | $ | 1,848,318,476 | (b) |
| | | | | | | | |
Other Information:
Capital Shares
Transactions in capital shares were as follows:
| | | | | | | | | | | | | | | | |
| | | Year Ended
December 31, 2018 | | | Year Ended
December 31, 2017 | |
| | | Shares | | | Value | | | Shares | | | Value | |
Class A | |
Sales | | | 23,146,832 | | | $ | 301,855,134 | | | | 431,646 | | | $ | 5,060,048 | |
Reinvestments | | | 1,382,551 | | | | 18,443,225 | | | | 1,487,920 | | | | 17,587,214 | |
Redemptions | | | (6,247,029 | ) | | | (85,040,301 | ) | | | (23,217,031 | ) | | | (280,691,731 | ) |
| | | | | | | | | | | | | | | | |
Net increase (decrease) | | | 18,282,354 | | | $ | 235,258,058 | | | | (21,297,465 | ) | | $ | (258,044,469 | ) |
| | | | | | | | | | | | | | | | |
Class B | |
Sales | | | 2,251,320 | | | $ | 28,354,279 | | | | 967,341 | | | $ | 11,333,315 | |
Reinvestments | | | 230,070 | | | | 3,023,120 | | | | 297,794 | | | | 3,469,294 | |
Redemptions | | | (3,877,975 | ) | | | (50,053,323 | ) | | | (6,445,066 | ) | | | (75,960,334 | ) |
| | | | | | | | | | | | | | | | |
Net decrease | | | (1,396,585 | ) | | $ | (18,675,924 | ) | | | (5,179,931 | ) | | $ | (61,157,725 | ) |
| | | | | | | | | | | | | | | | |
Class E | |
Sales | | | 155,694 | | | $ | 1,929,102 | | | | 85,936 | | | $ | 979,935 | |
Reinvestments | | | 14,911 | | | | 196,972 | | | | 19,874 | | | | 232,526 | |
Redemptions | | | (328,351 | ) | | | (4,267,288 | ) | | | (324,586 | ) | | | (3,848,506 | ) |
| | | | | | | | | | | | | | | | |
Net decrease | | | (157,746 | ) | | $ | (2,141,214 | ) | | | (218,776 | ) | | $ | (2,636,045 | ) |
| | | | | | | | | | | | | | | | |
Increase (decrease) derived from capital shares transactions | | | | | | $ | 214,440,920 | | | | | | | $ | (321,838,239 | ) |
| | | | | | | | | | | | | | | | |
| | | | |
| (a) | | Distributions from net investment income and realized gains are no longer required to be separately disclosed. The presentation for the year ended December 31, 2018 has been adjusted for this change (See Note 8). At December 31, 2017 the distributions were from net investment income. |
| (b) | | As part of the update in (a), it is also no longer required to disclose the Undistributed net investment income (Accumulated losses) which was $21,306,719 as of December 31, 2017. |
See accompanying notes to financial statements.
BHFTII-10
Brighthouse Funds Trust II
Baillie Gifford International Stock Portfolio
Financial Highlights
| | | | | | | | | | | | | | | | | | | | |
| Selected per share data | |
| | | Class A | |
| | | Year Ended December 31, | |
| | | 2018 | | | 2017 | | | 2016 | | | 2015 | | | 2014 | |
Net Asset Value, Beginning of Period | | $ | 13.43 | | | $ | 10.06 | | | $ | 9.71 | | | $ | 10.07 | | | $ | 10.54 | |
| | | | | | | | | | | | | | | | | | | | |
Income (Loss) from Investment Operations | |
Net investment income (a) | | | 0.16 | | | | 0.15 | | | | 0.15 | (b) | | | 0.16 | | | | 0.16 | |
Net realized and unrealized gain (loss) | | | (2.42 | ) | | | 3.37 | | | | 0.36 | | | | (0.34 | ) | | | (0.48 | ) |
| | | | | | | | | | | | | | | | | | | | |
Total income (loss) from investment operations | | | (2.26 | ) | | | 3.52 | | | | 0.51 | | | | (0.18 | ) | | | (0.32 | ) |
| | | | | | | | | | | | | | | | | | | | |
Less Distributions | |
Distributions from net investment income | | | (0.15 | ) | | | (0.15 | ) | | | (0.16 | ) | | | (0.18 | ) | | | (0.15 | ) |
| | | | | | | | | | | | | | | | | | | | |
Total distributions | | | (0.15 | ) | | | (0.15 | ) | | | (0.16 | ) | | | (0.18 | ) | | | (0.15 | ) |
| | | | | | | | | | | | | | | | | | | | |
Net Asset Value, End of Period | | $ | 11.02 | | | $ | 13.43 | | | $ | 10.06 | | | $ | 9.71 | | | $ | 10.07 | |
| | | | | | | | | | | | | | | | | | | | |
Total Return (%) (c) | | | (17.01 | ) | | | 35.15 | | | | 5.38 | | | | (1.97 | ) | | | (3.10 | ) |
|
Ratios/Supplemental Data | |
Gross ratio of expenses to average net assets (%) | | | 0.85 | | | | 0.85 | | | | 0.85 | | | | 0.87 | | | | 0.87 | |
Net ratio of expenses to average net assets (%) (d) | | | 0.72 | | | | 0.73 | | | | 0.73 | | | | 0.74 | | | | 0.75 | |
Ratio of net investment income to average net assets (%) | | | 1.28 | | | | 1.24 | | | | 1.49 | (b) | | | 1.56 | | | | 1.58 | |
Portfolio turnover rate (%) | | | 23 | | | | 8 | | | | 11 | | | | 12 | | | | 8 | |
Net assets, end of period (in millions) | | $ | 1,407.8 | | | $ | 1,469.7 | | | $ | 1,315.2 | | | $ | 1,361.8 | | | $ | 1,490.0 | |
| |
| | | Class B | |
| | | Year Ended December 31, | |
| | | 2018 | | | 2017 | | | 2016 | | | 2015 | | | 2014 | |
Net Asset Value, Beginning of Period | | $ | 13.22 | | | $ | 9.90 | | | $ | 9.56 | | | $ | 9.91 | | | $ | 10.38 | |
| | | | | | | | | | | | | | | | | | | | |
Income (Loss) from Investment Operations | |
Net investment income (a) | | | 0.14 | | | | 0.12 | | | | 0.12 | (b) | | | 0.13 | | | | 0.14 | |
Net realized and unrealized gain (loss) | | | (2.39 | ) | | | 3.32 | | | | 0.35 | | | | (0.33 | ) | | | (0.48 | ) |
| | | | | | | | | | | | | | | | | | | | |
Total income (loss) from investment operations | | | (2.25 | ) | | | 3.44 | | | | 0.47 | | | | (0.20 | ) | | | (0.34 | ) |
| | | | | | | | | | | | | | | | | | | | |
Less Distributions | |
Distributions from net investment income | | | (0.12 | ) | | | (0.12 | ) | | | (0.13 | ) | | | (0.15 | ) | | | (0.13 | ) |
| | | | | | | | | | | | | | | | | | | | |
Total distributions | | | (0.12 | ) | | | (0.12 | ) | | | (0.13 | ) | | | (0.15 | ) | | | (0.13 | ) |
| | | | | | | | | | | | | | | | | | | | |
Net Asset Value, End of Period | | $ | 10.85 | | | $ | 13.22 | | | $ | 9.90 | | | $ | 9.56 | | | $ | 9.91 | |
| | | | | | | | | | | | | | | | | | | | |
Total Return (%) (c) | | | (17.19 | ) | | | 34.89 | | | | 5.05 | | | | (2.17 | ) | | | (3.34 | ) |
|
Ratios/Supplemental Data | |
Gross ratio of expenses to average net assets (%) | | | 1.10 | | | | 1.10 | | | | 1.10 | | | | 1.12 | | | | 1.12 | |
Net ratio of expenses to average net assets (%) (d) | | | 0.97 | | | | 0.98 | | | | 0.98 | | | | 0.99 | | | | 1.00 | |
Ratio of net investment income to average net assets (%) | | | 1.09 | | | | 0.99 | | | | 1.25 | (b) | | | 1.31 | | | | 1.32 | |
Portfolio turnover rate (%) | | | 23 | | | | 8 | | | | 11 | | | | 12 | | | | 8 | |
Net assets, end of period (in millions) | | $ | 277.6 | | | $ | 356.7 | | | $ | 318.6 | | | $ | 336.0 | | | $ | 387.3 | |
Please see following page for Financial Highlights footnote legend.
See accompanying notes to financial statements.
BHFTII-11
Brighthouse Funds Trust II
Baillie Gifford International Stock Portfolio
Financial Highlights
| | | | | | | | | | | | | | | | | | | | |
| Selected per share data | |
| | | Class E | |
| | | Year Ended December 31, | |
| | | 2018 | | | 2017 | | | 2016 | | | 2015 | | | 2014 | |
Net Asset Value, Beginning of Period | | $ | 13.29 | | | $ | 9.96 | | | $ | 9.61 | | | $ | 9.97 | | | $ | 10.43 | |
| | | | | | | | | | | | | | | | | | | | |
Income (Loss) from Investment Operations | |
Net investment income (a) | | | 0.15 | | | | 0.13 | | | | 0.13 | (b) | | | 0.14 | | | | 0.15 | |
Net realized and unrealized gain (loss) | | | (2.40 | ) | | | 3.33 | | | | 0.36 | | | | (0.34 | ) | | | (0.48 | ) |
| | | | | | | | | | | | | | | | | | | | |
Total income (loss) from investment operations | | | (2.25 | ) | | | 3.46 | | | | 0.49 | | | | (0.20 | ) | | | (0.33 | ) |
| | | | | | | | | | | | | | | | | | | | |
Less Distributions | |
Distributions from net investment income | | | (0.13 | ) | | | (0.13 | ) | | | (0.14 | ) | | | (0.16 | ) | | | (0.13 | ) |
| | | | | | | | | | | | | | | | | | | | |
Total distributions | | | (0.13 | ) | | | (0.13 | ) | | | (0.14 | ) | | | (0.16 | ) | | | (0.13 | ) |
| | | | | | | | | | | | | | | | | | | | |
Net Asset Value, End of Period | | $ | 10.91 | | | $ | 13.29 | | | $ | 9.96 | | | $ | 9.61 | | | $ | 9.97 | |
| | | | | | | | | | | | | | | | | | | | |
Total Return (%) (c) | | | (17.09 | ) | | | 34.92 | | | | 5.24 | | | | (2.15 | ) | | | (3.19 | ) |
|
Ratios/Supplemental Data | |
Gross ratio of expenses to average net assets (%) | | | 1.00 | | | | 1.00 | | | | 1.00 | | | | 1.02 | | | | 1.02 | |
Net ratio of expenses to average net assets (%) (d) | | | 0.87 | | | | 0.88 | | | | 0.88 | | | | 0.89 | | | | 0.90 | |
Ratio of net investment income to average net assets (%) | | | 1.19 | | | | 1.08 | | | | 1.34 | (b) | | | 1.42 | | | | 1.43 | |
Portfolio turnover rate (%) | | | 23 | | | | 8 | | | | 11 | | | | 12 | | | | 8 | |
Net assets, end of period (in millions) | | $ | 16.2 | | | $ | 21.9 | | | $ | 18.6 | | | $ | 19.8 | | | $ | 22.8 | |
| | | | |
| (a) | | Per share amounts based on average shares outstanding during the period. |
| (b) | | Net investment income per share and the ratio of net investment income to average net assets include anon-recurring refund for overbilling of prior years’ custodianout-of-pocket fees which amounted to less than $0.01 per share and 0.05% of average net assets, respectively. |
| (c) | | Total return does not reflect any insurance, sales, separate account or administrative charges of variable annuity or life insurance contracts or any additional expenses that contract owners may bear under their variable contracts. If these charges were included, the returns would be lower. |
| (d) | | Includes the effects of management fee waivers (see Note 5 of the Notes to Financial Statements). |
See accompanying notes to financial statements.
BHFTII-12
Brighthouse Funds Trust II
Baillie Gifford International Stock Portfolio
Notes to Financial Statements—December 31, 2018
1. Organization
Brighthouse Funds Trust II (the “Trust”) is organized as a Delaware statutory trust and registered under the Investment Company Act of 1940, as amended (the “1940 Act”), as anopen-end management investment company. The Trust, which is managed by Brighthouse Investment Advisers, LLC (“Brighthouse Investment Advisers” or the “Adviser”), currently offers twenty-nine series, each of which operates as a distinct investment vehicle of the Trust. The series included in this report is Baillie Gifford International Stock Portfolio (the “Portfolio”), which is diversified. Shares of the Portfolio are not offered directly to the general public and are currently available only to separate accounts of insurance companies, including insurance companies affiliated with the Adviser (together, the “Insurance Companies”).
The Portfolio has registered and offers three classes of shares: Class A, B and E shares. Shares of each Class of the Portfolio represent an equal pro rata interest in the Portfolio and generally give the shareholder the same voting, dividend, liquidation, and other rights. Investment income, realized and unrealized capital gains and losses, the common expenses of the Portfolio, and certain Portfolio-level expense reductions, if any, are allocated on a pro rata basis to each Class based on the relative net assets of each Class to the net assets of the Portfolio. Each Class of shares differs in its respective distribution plan and such distribution expenses are allocated to the corresponding Class of shares.
2. Significant Accounting Policies
The preparation of financial statements in conformity with accounting principles generally accepted in the United States of America (“GAAP”) requires management to make estimates and assumptions that affect the reported amounts of assets and liabilities and disclosure of contingent assets and liabilities as of the date of the financial statements and the reported amounts of income and expenses during the reporting period. Actual results could differ from those estimates. In the preparation of these financial statements, management has evaluated events and transactions subsequent to December 31, 2018 through the date the financial statements were issued.
The Portfolio is an investment company and follows the accounting and reporting guidance of the Financial Accounting Standards Board (“FASB”) Accounting Standards Codification Topic946- Financial Services- Investment Companies. The following is a summary of significant accounting policies consistently followed by the Portfolio in the preparation of its financial statements.
Investment Valuation and Fair Value Measurements - The Portfolio values its portfolio investments for purposes of calculating its net asset value (“NAV”) using procedures approved by the Board of Trustees of the Trust (the “Board” or “Trustees”). Those procedures allow for a variety of methodologies to be used to value the Portfolio’s investments. The specific methodologies used for a particular investment may vary based on the market data available for a specific investment at the time the Portfolio calculates its NAV or based on other considerations. The procedures also permit a level of judgment to be used in the valuation process. The Portfolio follows the accounting and reporting guidance of FASB Accounting Standards Codification Topic820- Fair Value Measurement.
Domestic and foreign equity securities, such as common stock, exchange-traded funds, rights, warrants, and preferred stock, that are traded on a securities exchange on a valuation date are generally valued at their last quoted sale price or official closing price on the primary exchange for such security, or, if no sales occurred on that day, at the last reported bid price. Equity securities tradedover-the-counter (“OTC”) are generally valued at the last reported bid price. In the event of a major exchange closing during the trading day, the Adviser may use other market information obtained from quotation reporting systems, established market makers, or pricing services in valuing the securities. Valuation adjustments may be applied to certain foreign equity securities that are traded solely on foreign exchanges that close before the time as of which the Portfolio determines its NAV to account for the market movement between the close of the foreign exchanges and the time as of which the Portfolio determines its NAV. The Portfolio may use a systematic fair valuation model provided by a pricing service to value securities principally traded in these foreign markets in order to adjust for possible market movements or other changes that may occur between the close of the foreign exchanges and the time as of which the Portfolio determines its NAV. Foreign equity securities valued using these valuation adjustments are generally categorized as Level 2 within the fair value hierarchy. Equity securities that are actively traded, and have no valuation adjustments applied, are categorized as Level 1 within the fair value hierarchy. Other equity securities traded on inactive markets, or valued in reference to similar instruments traded on active markets, are generally categorized as Level 2 within the fair value hierarchy.
Investments in registeredopen-end management investment companies are valued at reported NAV per share on the valuation date and are categorized as Level 1 within the fair value hierarchy.
Debt securities, including corporate, convertible and municipal bonds and notes; obligations of the U.S. Treasury and U.S. government agencies; foreign sovereign issues; andnon-U.S. bonds, are generally valued on the basis of evaluated or composite bid quotations obtained from independent pricing services and/or brokers and dealers selected by the Adviser (each a “pricing service”), pursuant to the authorization of and subject to general oversight by the Board. Such pricing services may use matrix pricing, which considers observable inputs including, among other things, issuer details, maturity dates, interest rates, yield curves, rates of prepayment, credit risks/spreads, default rates, reported trades, broker-dealer quotes and quoted prices for similar assets. Short-term obligations with a
BHFTII-13
Brighthouse Funds Trust II
Baillie Gifford International Stock Portfolio
Notes to Financial Statements—December 31, 2018—(Continued)
remaining maturity of sixty days or less may be valued at amortized cost in the absence of market quotes, so long as the amortized cost value of such short-term debt instrument is approximately the same as the fair value of the instrument as determined without the use of amortized cost valuation. Floating rate loans are generally valued on the basis of an evaluated or composite average of aggregate bid and ask quotations supplied by brokers or dealers, as obtained from the pricing service. Securities that use similar valuation techniques and inputs as described above are generally categorized as Level 2 within the fair value hierarchy.
Foreign currency forward contracts are valued through an independent pricing service by interpolating between forward and spot currency rates in the London foreign exchange markets as of a designated hour on a valuation day. These contracts are generally categorized as Level 2 within the fair value hierarchy.
Options, whether on securities, indices, futures contracts, or otherwise, traded on exchanges are valued at the last sale price available as of the close of business on a valuation day or, if there is no such price available, at the last reported bid price. These types of options are categorized as Level 1 within the fair value hierarchy. Futures contracts that are traded on commodity exchanges are valued at their settlement prices established by the exchanges on which they are traded as of the close of such exchanges and are categorized as Level 1 within the fair value hierarchy.
Options, including options on swaps (“swaptions”), currencies, and futures contracts that are traded OTC are generally valued on the basis of interdealer bid and ask prices or prices provided by pricing service providers who use a series of techniques, including simulation pricing models, to determine the value of the contracts. The pricing models use inputs that are observed from actively quoted markets such as issuer details, indices, spreads, interest rates, yield curves, credit curves, measures of volatility and exchange rates. These contracts are generally categorized as Level 2 within the fair value hierarchy.
If no current market value quotation or other observable inputs are readily available or market value quotations are deemed to be unreliable for an investment, the fair value of the investment will be determined in accordance with procedures approved by, and under the general supervision of, the Board. In such a circumstance, the Board will be assisted in its responsibility to determine the fair value of an investment by the Valuation Committee (“Committee”) of Brighthouse Investment Advisers. The Committee provides general pricing oversight and fair value pricing determinations related to portfolio securities and meets on a regular basis to review reports relating to the valuation of the securities in the Portfolio. The Board has delegated to State Street Bank and Trust Company, the Trust’s custodian (“Custodian”), the responsibility for calculating the NAVs of the Trust’s Portfolios. The Committee is responsible for overseeing the calculation of the NAVs of the Portfolios by the custodian. The Committee also periodically reviews pricing services, including the pricing services providing fair value pricing for the Portfolio’s foreign securities, and is responsible for overseeing the correction of pricing errors and addressing other pricing issues that arise in the ordinary course of business, such as making real-time fair value determinations, as necessary.
No single standard for determining the fair value of an investment can be set forth because fair value depends upon the facts and circumstances with respect to each investment. Information relating to any relevant factors may be obtained by the Committee from any appropriate source, including the subadviser of the Portfolio, the custodian, a pricing service, market maker and/or broker for such security or the issuer. Appropriate methodologies for determining fair value under particular circumstances may include: matrix pricing, a discounted cash flow analysis, comparisons of securities with comparable characteristics, value based on multiples of earnings, discount from market price of similar marketable securities, or a combination of these and other methods.
Investment Transactions and Related Investment Income - Portfolio security transactions are recorded on the trade date. Dividend income is recorded on theex-dividend date or, for certain foreign securities, when notified. Interest income, which includes amortization of premium and accretion of discount on debt securities, is recorded on the accrual basis. Realized gains and losses on investments are determined on the identified cost basis, which is the same basis used for federal income tax purposes. Foreign income and foreign capital gains on some foreign securities may be subject to foreign taxes, which are accrued as applicable. These foreign taxes have been provided for in accordance with the Portfolio’s understanding of the applicable countries’ tax rules and rates.
Foreign Currency Translation -The books and records of the Portfolio are maintained in U.S. dollars. The values of securities, currencies, and other assets and liabilities denominated in currencies other than the U.S. dollar are translated into U.S. dollars based upon foreign exchange rates prevailing at the end of the period. Purchases and sales of investment securities, income, and expenses are translated on the respective dates of such transactions. Because the values of investment securities are translated at the foreign exchange rates prevailing at the end of the period, that portion of the results of operations arising from changes in exchange rates and that portion of the results of operations reflecting fluctuations arising from changes in market prices of the investment securities are not separated. Such fluctuations are included in the net realized and unrealized gain or loss on investments.
Net realized foreign exchange gains or losses arise from activity in forward foreign currency exchange contracts, sales of foreign currency, currency gains or losses realized between the trade and settlement dates on securities transactions, and the difference between the amounts of dividends, interest, and foreign withholding taxes recorded by the Portfolio and the U.S. dollar-equivalent of the amounts actually received or paid by the Portfolio. Net unrealized foreign exchange gains and losses arise from changes in the value of assets and liabilities, other than investment securities, resulting from changes in foreign exchange rates.
BHFTII-14
Brighthouse Funds Trust II
Baillie Gifford International Stock Portfolio
Notes to Financial Statements—December 31, 2018—(Continued)
Dividends and Distributions to Shareholders -The Portfolio records dividends and distributions on theex-dividend date. Net realized gains from securities transactions (if any) are generally distributed annually to shareholders. The timing and characterization of certain income and capital gains distributions are determined in accordance with federal tax regulations that may differ from GAAP. Permanent book and tax basis differences relating to shareholder distributions will result in reclassification between distributable earnings (accumulated losses) andpaid-in surplus.Book-tax differences are primarily due to adjustments to prior period accumulated balances. These adjustments have no impact on net assets or the results of operations.
Income Taxes -It is the Portfolio’s policy to comply with the requirements of the Internal Revenue Code of 1986, as amended, and regulations thereunder, applicable to regulated investment companies, and to distribute, with respect to each taxable year, all of its taxable income to shareholders. Therefore, no federal income tax provision is required. The Portfolio files U.S. federal tax returns. No income tax returns are currently under examination. The Portfolio’s federal tax returns for the prior three fiscal years remain subject to examination by the Internal Revenue Service. As of December 31, 2018, the Portfolio had no uncertain tax positions that would require financial statement recognition, or derecognition or disclosure.
Repurchase Agreements -The Portfolio may enter into repurchase agreements, under the terms of a Master Repurchase Agreement (“MRA”), with selected commercial banks and broker-dealers, under which the Portfolio acquires securities as collateral and agrees to resell the securities at an agreed-upon time and at an agreed-upon price. The Portfolio, through the Custodian or a subcustodian, under atri-party repurchase agreement, receives delivery of the underlying securities collateralizing any repurchase agreements. It is the Portfolio’s policy that the market value of the collateral be equal to at least 100% of the repurchase price in the case of a repurchase agreement ofone-day duration and equal to at least 102% of the repurchase price in the case of all other repurchase agreements. In the event of default or failure by a party to perform an obligation in connection with any repurchase transaction, the MRA gives thenon-defaulting party the right toset-off claims and to apply property held by it in connection with any repurchase transaction against obligations owed to it.
At December 31, 2018, the Portfolio had direct investments in repurchase agreements with a gross value of $22,698,953. Additionally, the Portfolio invested cash collateral for loans of portfolio securities in repurchase agreements with a gross value of $98,644,656. The combined value of all repurchase agreements is included as part of investments at value on the Statement of Assets and Liabilities. The value of the related collateral exceeded the value of the repurchase agreements at December 31, 2018.
Securities Lending - The Portfolio may lend its portfolio securities to certain qualified brokers who borrow securities in order to complete certain securities transactions. By lending its portfolio securities, the Portfolio attempts to increase its net investment income through the receipt of income on collateral held from securities on loan. Any gain or loss in the market price of the loaned securities that might occur and any interest earned or dividends declared during the term of the loan would accrue to the account of the Portfolio.
The Trust has entered into aNon-Custodial Securities Lending Agreement with JPMorgan Chase Bank, N.A. (the “Lending Agent”). Under the agreement, the Lending Agent is authorized to loan portfolio securities on the Portfolio’s behalf. In exchange, the Portfolio receives either cash or U.S. government securities as collateral against the loaned securities. The Portfolio receives collateral equal to at least 102% of the market value for loans secured by government securities or cash in the same currency as the loaned shares and 105% for all other loaned securities at each loan’s inception. Collateral representing at least 100% of the market value of the loaned securities is maintained for the duration of the loan. Any cash collateral received by the Portfolio is generally invested by the Lending Agent in short-term investments, which may include certificates of deposit, commercial paper, repurchase agreements, time deposits, master demand notes and money market funds. The market value of investments made with cash collateral received are disclosed in the Schedule of Investments and the valuation techniques are described in Note 2. If the market value of the collateral at the close of trading on a business day is less than 100% of the market value of the loaned securities at the close of trading on that day, the borrower is required to deliver, by the close of business on the following business day, an additional amount of collateral, so that the total amount of posted collateral is equal to at least 100% of the market value of all the loaned securities as of such preceding day. A portion of the income earned on the collateral is rebated to the borrower of the securities and the remainder is split between the Lending Agent and the Portfolio. On loans collateralized by U.S. government securities, a fee is received from the borrower and is allocated between the Portfolio and the Lending Agent.
Income received by the Portfolio in securities lending transactions during the year ended December 31, 2018 is reflected as securities lending income on the Statement of Operations. The values of any securities loaned by the Portfolio and the related collateral at December 31, 2018 are disclosed in the footnotes to the Schedule of Investments. The value of the related collateral received by the Portfolio exceeded the value of the securities out on loan at December 31, 2018.
The risks associated with lending portfolio securities include, but are not limited to, possible delays in receiving additional collateral or in the recovery of the loaned securities, possible loss of rights in the collateral should the borrower fail financially, as well as risk of loss in the value of the collateral or the value of the investments made with the collateral. The Lending Agent shall indemnify the Portfolio in the case of default of any securities borrower, subject to the terms of theNon-Custodial Securities Lending Agreement.
BHFTII-15
Brighthouse Funds Trust II
Baillie Gifford International Stock Portfolio
Notes to Financial Statements—December 31, 2018—(Continued)
All securities on loan are classified as Common Stocks in the Portfolio’s Schedule of Investments as of December 31, 2018, with a contractual maturity of overnight and continuous.
3. Certain Risks
In the normal course of business, the Portfolio invests in securities and enters into transactions where risks exist. Those risks include:
Market Risk:The value of securities held by the Portfolio may decline in response to certain events, including those directly involving the issuers whose securities are owned by the Portfolio; conditions affecting the general economy; overall market changes; local, regional or global political, social or economic instability; and currency, interest rate, and price fluctuations.
Credit and Counterparty Risk: The Portfolio may be exposed to counterparty risk, or the risk that an entity with which the Portfolio has unsettled or open transactions may default. The potential loss could exceed the value of the financial assets and liabilities recorded in the financial statements. Financial assets that potentially expose the Portfolio to credit and counterparty risk consist principally of cash due from counterparties and investments. The Portfolio manages counterparty risk by entering into agreements only with counterparties that it believes have the financial resources to honor their obligations and by monitoring the financial stability of those counterparties. The Adviser attempts to mitigate counterparty risk by (i) periodically assessing the creditworthiness of its trading partners, (ii) monitoring and/or limiting the amount of its net exposure to each individual counterparty based on its assessment, and (iii) requiring collateral from the counterparty for certain transactions. In order to preserve certain safeguards fornon-standard settlement trades, the Portfolio restricts its exposure to credit and counterparty losses by entering into master netting agreements (“Master Agreements”) with counterparties (approved brokers) with whom it undertakes a significant volume of transactions. Master Agreements govern the terms of certain transactions, and reduce the counterparty risk associated with relevant transactions by specifying credit protection mechanisms and providing standardization that improves legal certainty. Master Agreements can also help limit counterparty risk by specifying collateral posting arrangements atpre-arranged exposure levels.
Repurchase and reverse repurchase agreements are primarily executed under Global Master Repurchase Agreements (“GMRAs”) or Master Repurchase Agreements (“MRAs”), which provide the rights toset-off. Each repurchase and reverse repurchase agreement is initially collateralized at the transaction level. In the event of default, the total market value exposure will be offset against collateral exchanged to date, which would result in a net receivable/(payable) that would be due from/to the counterparty.
Foreign Investment Risk:The investments by the Portfolio in foreign securities may involve risks not present in domestic investments. Because securities may be denominated in foreign currencies, may require settlement in foreign currencies and may pay interest or dividends in foreign currencies, changes in the relationship of these foreign currencies to the U.S. dollar can significantly affect the value of the investments and earnings of the Portfolio. Foreign investments may also subject the Portfolio to foreign government exchange restrictions, expropriation, taxation or other political, social or economic developments, all of which could affect the market and/or credit risk of the investments. In addition to the risks described above, risks may arise from forward foreign currency contracts with respect to the potential inability of counterparties to meet the terms of their contracts.
Additional risks associated with each type of investment are described above within the respective security type notes. The Portfolio’s prospectus includes a discussion of the principal risks of investing in the Portfolio.
4. Investment Transactions
Aggregate cost of purchases and proceeds of sales of investment securities, excluding short-term securities, for the year ended December 31, 2018 were as follows:
| | | | | | | | | | | | |
Purchases | | | Sales | |
U.S. Government | | Non-U.S. Government | | | U.S. Government | | | Non-U.S. Government | |
| $0 | | $ | 637,450,728 | | | $ | 0 | | | $ | 430,306,989 | |
5. Investment Management Fees and Other Transactions with Affiliates
Investment Management Agreement -Brighthouse Investment Advisers is the investment adviser to the Portfolio. The Trust has entered into an investment management agreement with Brighthouse Investment Advisers with respect to the Portfolio. For providing investment management services to the Portfolio, Brighthouse Investment Advisers receives monthly compensation at the following annual rates:
| | | | | | |
Management Fees earned by
Brighthouse Investment
Advisers for the year ended
December 31, 2018 | | % per annum | | | Average Daily Net Assets |
| $14,766,331 | | | 0.860 | % | | Of the first $500 million |
| | | 0.800 | % | | Of the next $500 million |
| | | 0.750 | % | | On amounts in excess of $1 billion |
BHFTII-16
Brighthouse Funds Trust II
Baillie Gifford International Stock Portfolio
Notes to Financial Statements—December 31, 2018—(Continued)
Brighthouse Investment Advisers has entered into an investment subadvisory agreement with respect to managing the Portfolio. Baillie Gifford Overseas Limited (the “Subadviser”) is compensated by Brighthouse Investment Advisers to provide subadvisory services for the Portfolio.
Management Fee Waivers- Pursuant to an expense agreement, Brighthouse Investment Advisers has agreed, for the period April 30, 2018 to April 30, 2019, to reduce its advisory fees set out above under “Investment Management Agreement” for each class of the Portfolio as follows:
| | |
% per annum reduction | | Average Daily Net Assets |
| 0.080% | | On amounts over $156.25 million and under $400 million |
| 0.180% | | Of the next $100 million |
| 0.120% | | Of the next to $400 million |
| 0.150% | | On amounts in excess of $900 million |
An identical expense agreement was in place for the period May 1, 2017 to April 30, 2018. Amounts waived for the year ended December 31, 2018 are shown as management fee waivers in the Statement of Operations.
Certain officers and trustees of the Trust may also be officers of Brighthouse Investment Advisers; however, such officers and trustees receive no compensation from the Trust.
Transfer Agency Agreement -Brighthouse Financial, Inc. serves as the transfer agent for the Trust. Brighthouse Financial, Inc. receives no fees for its services to the Trust.
Distribution and Service Fees - The Trust has a distribution agreement with Brighthouse Securities, LLC (the “Distributor”) pursuant to which the Distributor serves as the general distributor of shares of each class (each a “Class”) of each Portfolio. The Distributor is an affiliate of the Trust. The Trust has adopted a Distribution and Services Plan (the “Plan”) relating to Class B and Class E shares of each Portfolio, under Rule 12b-1 under the 1940 Act, pursuant to which the Trust may pay the Distributor a fee (the “Service Fee”) at an annual rate not to exceed 0.25% of each such Portfolio’s average daily net assets attributable to the Class B and Class E shares of the Trust. Each Portfolio may not offer shares of each Class. The Plan also authorizes the Trust, on behalf of each of its Portfolios, may pay the Distributor a distribution Fee (the “Distribution Fee” and together with the Service Fee, the “Fees”) at an annual rate of up to 0.25% of each Portfolio’s average daily net assets attributable to the Class B and Class E shares in consideration of the services rendered in connection with the sale of such shares by the Distributor. Under the Distribution Agreement with respect to the Trust, Fees are currently paid at an annual rate of 0.25% of average daily net assets in the case of Class B shares and 0.15% of average daily net assets in the case of Class E shares. The Plan is known as a “compensation plan” because the Trust makes payments to the Distributor for services rendered regardless of the actual level of expenditures by the Distributor. Amounts incurred by the Portfolio for the year ended December 31, 2018 are shown as Distribution and service fees in the Statement of Operations.
Deferred Trustee Compensation -Each Trustee who is not currently an employee of the Adviser or any of its affiliates receives compensation from the Trust for his or her service to the Trust. A deferred compensation plan (the “Plan”) is available to the Trustees on a voluntary basis. Deferred amounts remain in the Trust until distributed in accordance with the provisions of the Plan. The value of a participating Trustee’s deferral account is based on theoretical investments of deferred amounts on the normal payment dates in certain portfolios of the Trust or Brighthouse Funds Trust I, an affiliate of the Trust, as designated by the participating Trustee. Changes in the value of participants’ deferral accounts are reflected as Trustees’ fees and expenses in the Statement of Operations. The portion of the accrued obligations allocated to the Portfolio under the Plan is reflected as Deferred trustees’ fees in the Statement of Assets and Liabilities.
6. Contractual Obligations
Under the Trust’s organizational documents, its officers and Trustees may be indemnified against certain liabilities and expenses arising out of the performance of their duties to the Trust. Additionally, the Trust has a variety of indemnification obligations under contracts with its service providers. The Trust’s maximum exposure under these arrangements is unknown, as this would involve future claims that may be made against the Trust that have not yet occurred.
7. Income Tax Information
The cost basis of investments for federal income tax purposes at December 31, 2018 was as follows:
| | | | |
Cost basis of investments | | $ | 1,645,434,788 | |
| | | | |
Gross unrealized appreciation | | | 269,300,032 | |
Gross unrealized depreciation | | | (107,477,227 | ) |
| | | | |
Net unrealized appreciation (depreciation) | | $ | 161,822,805 | |
| | | | |
BHFTII-17
Brighthouse Funds Trust II
Baillie Gifford International Stock Portfolio
Notes to Financial Statements—December 31, 2018—(Continued)
The tax character of distributions paid for the years ended December 31, 2018 and 2017 were as follows:
| | | | | | | | | | | | | | | | | | | | |
Ordinary Income | | | Long-Term Capital Gain | | | Total | |
2018 | | 2017 | | | 2018 | | | 2017 | | | 2018 | | | 2017 | |
| $21,663,317 | | $ | 21,289,034 | | | $ | — | | | $ | — | | | $ | 21,663,317 | | | $ | 21,289,034 | |
As of December 31, 2018, the components of distributable earnings (accumulated losses) on a federal income tax basis were as follows:
| | | | | | | | | | | | | | | | |
Undistributed
Ordinary
Income | | Undistributed
Long-Term
Capital Gain | | | Net
Unrealized
Appreciation | | | Accumulated
Capital Losses | | | Total | |
| $23,928,391 | | $ | 109,988,369 | | | $ | 161,805,946 | | | $ | — | | | $ | 295,722,706 | |
The Portfolio utilizes the provisions of the federal income tax laws that provide for the carryforward of capital losses for prior years, offsetting such losses against any future realized capital gains. Under the Regulated Investment Company Modernization Act of 2010, net capital losses recognized after December 22, 2010 may be carried forward indefinitely and their character is retained as short-term and/or long-term losses.
As of December 31, 2018, the Portfolio had no accumulated capital losses.
8. Recent Accounting Pronouncements and SEC Update
In August 2018, the FASB issued Accounting Standards Update 2018-13, Fair Value Measurement (Topic 820)—Disclosure Framework—Changes to the Disclosure Requirements for Fair Value Measurement (“ASU 2018-13”) which introduces new fair value disclosure requirements as well as eliminates and modifies certain existing fair value disclosure requirements. ASU 2018-13 is effective for fiscal years beginning after December 15, 2019, and interim periods within those fiscal years. Early adoption is permitted and, as such, management has elected to early adopt ASU 2018-13 effective with the current reporting period. The impact of the Portfolio’s adoption was limited to changes in the Portfolio’s financial statement disclosures regarding fair value, primarily those disclosures related to transfers between levels of the fair value hierarchy.
In August 2018, the Securities and Exchange Commission released its Final Rule on Disclosure Update and Simplification (the “Final Rule”) which is intended to simplify an issuer’s disclosure compliance efforts by removing redundant or outdated disclosures requirements without significantly altering the mix of information provided to investors. Effective with the current reporting period, the Portfolio adopted the Final Rule with the most notable impacts being that the Portfolio is no longer required to present the components of distributable earnings on the Statement of Assets and Liabilities or the sources of distributions to shareholders and the amounts of undistributed net investment income on the Statements of Changes in Net Assets.
BHFTII-18
Brighthouse Funds Trust II
Baillie Gifford International Stock Portfolio
Report of Independent Registered Public Accounting Firm
To the Shareholders of Baillie Gifford International Stock Portfolio and the Board of Trustees of Brighthouse Funds Trust II:
Opinion on the Financial Statements and Financial Highlights
We have audited the accompanying statement of assets and liabilities, including the schedule of investments, of the Baillie Gifford International Stock Portfolio (the “Portfolio”), one of the portfolios constituting the Brighthouse Funds Trust II, as of December 31, 2018, the related statement of operations for the year then ended, the statements of changes in net assets for each of the two years in the period then ended, the financial highlights for each of the five years in the period then ended, and the related notes. In our opinion, the financial statements and financial highlights present fairly, in all material respects, the financial position of the Baillie Gifford International Stock Portfolio of the Brighthouse Funds Trust II as of December 31, 2018, the results of its operations the year then ended, the changes in its net assets for each of the two years in the period then ended, and the financial highlights for each of the five years in the period then ended, in conformity with accounting principles generally accepted in the United States of America.
Basis for Opinion
These financial statements and financial highlights are the responsibility of the Portfolio’s management. Our responsibility is to express an opinion on the Portfolio’s financial statements and financial highlights based on our audits. We are a public accounting firm registered with the Public Company Accounting Oversight Board (United States) (PCAOB) and are required to be independent with respect to the Portfolio in accordance with the U.S. federal securities laws and the applicable rules and regulations of the Securities and Exchange Commission and the PCAOB.
We conducted our audits in accordance with the standards of the PCAOB. Those standards require that we plan and perform the audit to obtain reasonable assurance about whether the financial statements and financial highlights are free of material misstatement, whether due to error or fraud. The Portfolio is not required to have, nor were we engaged to perform, an audit of its internal control over financial reporting. As part of our audits we are required to obtain an understanding of internal control over financial reporting but not for the purpose of expressing an opinion on the effectiveness of the Portfolio’s internal control over financial reporting. Accordingly, we express no such opinion.
Our audits included performing procedures to assess the risks of material misstatement of the financial statements and financial highlights, whether due to error or fraud, and performing procedures that respond to those risks. Such procedures included examining, on a test basis, evidence regarding the amounts and disclosures in the financial statements and financial highlights. Our audits also included evaluating the accounting principles used and significant estimates made by management, as well as evaluating the overall presentation of the financial statements and financial highlights. Our procedures included confirmation of securities owned as of December 31, 2018, by correspondence with the custodian and brokers when replies were not received from brokers, we performed other auditing procedures. We believe that our audits provide a reasonable basis for our opinion.
/s/ Deloitte & Touche LLP
Boston, Massachusetts
February 25, 2019
We have served as the auditor of one or more of the Brighthouse investment companies since 1983.
BHFTII-19
Brighthouse Funds Trust II
Trustees and Officers
MANAGEMENT OF THE TRUSTS
The Boards of Trustees (the “Board”) of Brighthouse Funds Trust I and Brighthouse Funds Trust II (“BHF I” and “BHF II”, respectively, and collectively the “Trusts”) supervise the Trusts and are responsible for representing the interests of shareholders. The Trustees, the Chairman of the Board and the Chairmen of each subcommittee are the same for both Trusts. The Trustees of each Trust meet periodically throughout the year to oversee the Portfolios’ activities, reviewing, among other things, each Portfolio’s performance and its contractual arrangements with various service providers. The Trustees of each Trust elect the officers of the Trust, who are responsible for administering the Trust’sday-to-day operations.
Trustees and Officers
The Trustees and executive officers of the Trusts, as well as their principal occupations during the past five years, are set forth below. Unless otherwise indicated, the business address of each is c/o Brighthouse Funds, One Financial Center, Boston, Massachusetts 02111. Each Trustee who is deemed an “interested person,” as such term is defined in the 1940 Act, is referred to as an “Interested Trustee.” Those Trustees who are not “interested persons,” as such term is defined in the 1940 Act, are referred to as “Independent Trustees.” There is no limit to the term a Trustee may serve. Trustees serve until their death, resignation or removal in accordance with the BHF I Trust’s and BHF II Trust’s respective organizational documents and policies adopted by the Boards of the respective Trusts from time to time. Officers hold office at the pleasure of each Board and serve until their removal or resignation in accordance with the Trusts’ respective organizational documents and policies adopted by the Board of each Trust from time to time.
| | | | | | | | | | |
Name and Year of Birth | | Current
Position(s)
Held with
Registrant | | Term of Office
and Length of
Time Served | | Principal Occupation(s) During the Past 5 Years(1) | | Number of
Portfolios in
Brighthouse Funds
Complex(2)
Overseen
by Trustee | | Other Directorships Held
by Trustee During
the Past 5 Years(1) |
| Interested Trustee |
John Rosenthal* (1960) | | Trustee | | Indefinite;
From
May
2016
(Trust I
and
Trust II) to
present | | Chief Investment Officer, Brighthouse Financial, Inc. (2017 to present); until 2017, Senior Managing Director and Head of Global Portfolio Management, MetLife, Inc. | | 72 | | None |
|
| Independent Trustees |
Dawn M. Vroegop (1966) | | Trustee and Chairman of the Board | | Indefinite;
From
December
2000
(Trust I)/
May
2009
(Trust II)
to present
as
Trustee;
From
May
2016
(Trust I
and
Trust II)
until
present as
Chairman | | Private Investor. | | 72 | | Trustee, Driehaus Mutual Funds.** |
BHFTII-20
Brighthouse Funds Trust II
Trustees and Officers—(Continued)
| | | | | | | | | | |
Name and Year of Birth | | Current
Position(s)
Held with
Registrant | | Term of Office
and Length of
Time Served | | Principal Occupation(s) During the Past 5 Years(1) | | Number of
Portfolios in
Brighthouse Funds
Complex(2)
Overseen
by Trustee | | Other Directorships Held
by Trustee During
the Past 5 Years(1) |
Stephen M. Alderman (1959) | | Trustee | | Indefinite;
From
December
2000
(Trust I)/
April
2012
(Trust II)
to present | | Shareholder in the law firm of Garfield and Merel, Ltd. | | 72 | | None |
| | | | | |
Robert J. Boulware (1956) | | Trustee | | Indefinite;
From
March
2008
(Trust I)/
April
2012
(Trust II)
to present | | Managing Director, Pilgrim Funds, LLC (private equity fund). | | 72 | | Trustee, Vertical Capital Income Fund(closed-end fund);** Director, Gainsco, Inc. (auto insurance);** Trustee, SharesPost 100 Fund(closed-end fund).** |
| | | | | |
Susan C. Gause (1952) | | Trustee | | Indefinite;
From
March
2008
(Trust I)/
April
2012
(Trust II)
to present | | Private Investor. | | 72 | | Trustee, HSBC Funds.** |
| | | | | |
Nancy Hawthorne (1951) | | Trustee | | Indefinite;
From
May
2003
(Trust II)/
April
2012
(Trust I) to
present | | Partner, Hawthorne Financial Advisors, LLC (registered investment advisor); until 2014, Chief Executive Officer, Clerestory LLC (corporate advisor). | | 72 | | Director and Chairman of the Board of Directors, THL Credit, Inc.;** Director and Chairman of the Board, Avid Technology, Inc.;** Director, CRA International, Inc.** |
| | | | | |
Barbara A. Nugent (1956) | | Trustee | | Indefinite;
From
January
2014
(Trust I
and
Trust II) to
present | | President, True North Board Governance, LLC (consulting); until December 2013, partner in the law firm of Stradley Ronon Stevens & Young, LLP. | | 72 | | Independent Lead Trustee, BMT Investment Funds** |
| | | | | |
Christopher J. Towle (1957) | | Trustee | | Indefinite;
From
April
2018
(Trust I
and
Trust II) to
present | | Retired; until 2014, Partner, Portfolio Manager, Director of High Yield and Convertible Strategies, Lord Abbett & Co. | | 72 | | Trustee, Driehaus Mutual Funds** |
BHFTII-21
Brighthouse Funds Trust II
Trustees and Officers—(Continued)
Officers
| | | | | | |
Name and Year of Birth | | Position(s)
Held with
Registrant | | Length of
Time Served | | Principal Occupation(s)
During the Past 5 Years(1) |
| Executive Officers | | | | | | |
Kristi Slavin (1973) | | President and Chief Executive Officer, of Trust I and Trust II | | From May
2016
(Trust I
and
Trust II) to
present | | President, Brighthouse Investment Advisers, LLC (2016-present); formerly, Senior Vice President, MetLife Advisers, LLC; Vice President, MetLife, Inc.; Vice President, Trust I and Trust II(2015-2016). |
| | | |
Alan R. Otis (1971) | | Chief Financial Officer and Treasurer, of Trust I and Trust II | | From
November
2017
(Trust I
and
Trust II) to
present | | Senior Vice President, Brighthouse Investment Advisers, LLC (2017-present); formerly, Vice President, Brighthouse Investment Advisers, LLC (2012-2017); Assistant Treasurer, Trust I and Trust II(2012-2017). |
| | | |
Andrew L. Gangolf (1954) | | Secretary, of Trust I and Trust II | | From May
2011
(Trust I
and
Trust II) to
present | | Executive Vice President, Brighthouse Investment Advisers, LLC (2017-present); formerly, Senior Vice President, MetLife Advisers, LLC (2011-2017); until 2011, Senior Vice President & Assistant General Counsel, AllianceBernstein Investments, Inc. |
| | | |
Steven E. Hartstein (1963) | | Chief Compliance Officer (“CCO”), of Trust I and Trust II | | From
February
2014
(Trust I
and
Trust II) to
present | | Senior Vice President and CCO, Brighthouse Investment Advisers, LLC (2017-present); Head of Investments Compliance, Vice President, Brighthouse Financial, Inc. (2017-present); formerly, Vice President, MetLife, Inc. (2013-2017); Senior Vice President and CCO, MetLife Advisers, LLC (2013-2017.) |
| | | |
Victor Soto (1978) | | Vice President of Trust I and Trust II | | From May
2018
(Trust I
and
Trust II) to
present | | Executive Vice President, Brighthouse Investment Advisers, LLC (2016-present); Assistant Vice President, MetLife Inc. (2015-2017); Portfolio Manager, 1st Global (2013-2015). |
| * | Mr. Rosenthal is an “interested person” of the Trusts because of his position with Brighthouse Financial, Inc., the current parent company of Brighthouse Investment Advisers, LLC. |
| ** | Indicates a directorship with a registered investment company or a company subject to the reporting requirements of the Securities Exchange Act of 1934, as amended. |
| (1) | Previous positions during the past five years with the Trusts, Brighthouse Financial, Inc., MetLife, Inc. or the Manager are omitted if not materially different. |
| (2) | The Fund Complex includes 43 BHF I Portfolios and 29 BHF II Portfolios. |
BHFTII-22
Brighthouse Funds Trust II
Baillie Gifford International Stock Portfolio
Board of Trustees’ Consideration of Advisory and Sub-Advisory Agreements
At anin-person meeting held on November6-8, 2018 (the “November Meeting”), the Boards of Trustees (the “Board”) of Brighthouse Funds Trust I and Brighthouse Funds Trust II (“BFT I” and “BFT II,” respectively, and collectively, the “Trusts”), including a majority of the Trustees who are not “interested persons” of the Trusts (the “Independent Trustees”) under the Investment Company Act of 1940 (the “1940 Act”), approved the continuation of the Trusts’ advisory agreements (each, an “Advisory Agreement”) with Brighthouse Investment Advisers, LLC (the “Adviser”) and the applicablesub-advisory agreements (each a “Sub-Advisory Agreement,” and collectively with the Advisory Agreement, the “Agreements”) between the Adviser and the investmentsub-advisers (each a “Sub-Adviser,” and collectively, the “Sub-Advisers”) for the series of the Trusts (each a “Portfolio,” and collectively, the “Portfolios”).
In making those approvals, the Board reviewed a variety of materials that were provided for the specific purpose of the annual contract renewal process. In addition, various materials provided to and discussed with the Board throughout the year informed the Board’s decision to renew the Agreements. In particular, the information for each Portfolio included, but was not limited to, investment performance reports, and reports on expenses, legal and compliance matters, asset pricing, brokerage commissions and trade execution.
The Board met in person with personnel of the Adviser on October 17, 2018 for the specific purpose of giving preliminary consideration to the proposed continuation of the Agreements (the “October Meeting”). At that meeting, the Adviser reviewed with the Board the performance and fees experienced by each Portfolio, as well as other information. During and after the October Meeting, the Independent Trustees communicatedfollow-up matters for management to address at the November Meeting. The Independent Trustees were advised by independent legal counsel throughout the contract renewal process, and met with independent legal counsel in several executive sessions outside of the presence of management.
Information furnished and reviewed specifically in connection with the renewal process included, but was not limited to, a report for each Portfolio that was prepared by Broadridge (“Broadridge”), an independent organization. In addition, the Independent Trustees reviewed a report that was prepared by JDL Consultants, LLC (“JDL”), an independent consultant to the Independent Trustees (“JDL Report”), which examined the comparative fees, expenses and performance of each Portfolio, based upon the Broadridge reports. Also, the Board reviewed the responses to wide-ranging questions from the Independent Trustees relating to the business, operations and performance of the Adviser and theSub-Advisers that the Adviser andSub-Advisers had prepared specifically for the renewal process, and reviewed aPortfolio-by-Portfolio analysis of the profitability to the Adviser of each Advisory Agreement, which was prepared by the Adviser for the renewal process.
At the November Meeting, the Board, including a majority of the Independent Trustees, concluded that the nature, extent and quality of services provided by the Adviser and eachSub-Adviser supported the renewal of the Agreements. The Board also concluded that the investment performance of each Portfolio was such that each Agreement should continue, and that the fees paid by each Portfolio to the Adviser appeared to be reasonable in light of the nature, extent and quality of the services provided by the Adviser andSub-Adviser. Further, the Board concluded that the Adviser’s profitability in providing services under the Advisory Agreements did not appear unreasonable in light of the nature, extent and quality of the services provided by the Adviser. Finally, the Board reviewed the extent to which the investment advisory fees paid by the Portfolios shared economies of scale with investors or entailed the potential to share economies of scale with investors and concluded that those considerations generally supported the renewal of each Agreement. In approving the renewal of each of the Agreements, the Board, including the Independent Trustees, gave attention to all of the information that was furnished and each Trustee placed varying degrees of importance on the various pieces of information that were provided to them. The Board evaluated the information available to it on aPortfolio-by-Portfolio basis, and its decision was made separately with respect to each Portfolio. The following paragraphs provide more information about some of the primary factors that were relevant to the Board’s decision. The Board did not identify any single factor as determinative, and the Trustees generally attributed different weights to various factors for the various Portfolios.
Nature, extent and quality of services. The Board evaluated the nature, extent and quality of the services that the Adviser and theSub-Advisers, as relevant, have provided to the Portfolios. The Board considered the Adviser’s services as investment manager to the Portfolios, including its services relating to the hiring and oversight of theSub-Advisers, trading practices and oversight of transition management (as applicable), compliance programs and personnel, and risk management, among other things. The Adviser’s services in coordinating and overseeing the activities of the Trusts’ other service providers were also considered. The Board considered information received from the Trusts’ Chief Compliance Officer (“CCO”) regarding the Portfolios’ compliance policies and procedures that were established pursuant to Rule38a-l under the 1940 Act. The Board also noted that the Adviser’s investment, compliance and legal staff conduct regular and periodic telephonic andin-person meetings with theSub-Advisers to review and assess the services that are provided to the Portfolios, and that personnel of the Adviser prepare and present reports to the Independent Trustees regarding those meetings. In addition, throughout the year, the Board considered the expertise, experience and performance of the personnel of the Adviser who performed the various services that are mentioned above.
BHFTII-23
Brighthouse Funds Trust II
Baillie Gifford International Stock Portfolio
Board of Trustees’ Consideration of Advisory and Sub-Advisory Agreements—(Continued)
With respect to the services provided by each of theSub-Advisers, the Board considered a variety of information that the Adviser and eachSub-Adviser prepared for the Board’s review. The Board considered eachSub-Adviser’s investment process and philosophy, and the investment performance experienced by the Portfolio (as described in more detail below). The Board took into account that eachSub-Adviser’s responsibilities include the development and maintenance of an investment program for the applicable Portfolio that is consistent with the Portfolio’s investment objectives, the selection of investment securities and the placement of orders for the purchase and sale of such securities, as well as the implementation of compliance controls related to performance of these services. In particular, the Board considered, among other things, theSub-Adviser’s current level of staffing as well as its compensation program and its overall resources. The Board reviewed eachSub-Adviser’s history and investment experience, as well as information provided regarding the qualifications, background and responsibilities of theSub-Adviser’s investment and compliance personnel who provide services to the Portfolios. The Board also considered, among other things, eachSub-Adviser’s compliance program and regulatory and disciplinary history. In its review, the Board also took into account information regarding any services and/or payments provided to the Adviser by theSub-Advisers in connection with marketing activities and considered representations from the Adviser that those payments were not considered in the Adviser’s recommendation to renew any of theSub-Advisory Agreements.
Performance. The Board placed emphasis on the performance of each Portfolio in light of, among other things, its importance to investors. The Board considered the Adviser’s quarterly reviews with the Board of detailed information about each Portfolio’s investment strategies and performance results and composition, including discussions regarding the relevant effect of current market conditions. The Board reviewed and considered the reports prepared by Broadridge, which provided a statistical analysis comparing the Portfolios’ investment performance to that of comparable funds underlying variable insurance products (the “Performance Universe”). The Independent Trustees also met separately with representatives of JDL during the October Meeting to review the JDL Report. The Board also compared the performance records of the Portfolios to those of comparable funds and other accounts that were managed by the relevantSub-Adviser, to the extent such information was available. The Board considered each Portfolio’s performance for periods subsequent to the performance period covered by the Broadridge reports, and the Adviser’s discussion of the same, including the effect of current market conditions on each Portfolio’s more recent performance. The Board also noted that while it found the data provided by Broadridge generally useful, it recognized the limitations of such data, including, in particular, that notable differences may exist between a Portfolio and those of the other funds in a Broadridge category (for example, the investment objectives(s) and investment strategies) and that the results of the performance comparisons may vary depending on (i) the end dates for the performance periods that were selected and (ii) the selection of the peer groups.
The Board focused particular attention on Portfolios with less favorable performance records. The Board noted the Adviser’s focus on eachSub-Adviser’s performance and that the Adviser has been active in monitoring and responding to any performance issues with respect to the Portfolios.
Fees and Expenses. The Board gave consideration to the level and method of computing the fees payable under the Agreements. The Board considered the Broadridge report for each of the Portfolios, which included comparisons for each Portfolio of its contractual management andsub-adviser fees (at current and various asset levels), and total expenses, with those of its peers, including as those peers were divided into a broad group of peer funds (“Expense Universe”), a narrower group of peer funds (“Expense Group”), a broad group of peersub-advised funds (“Sub-advised Expense Universe”), and a narrower group of peersub-advised funds (“Sub-advised Expense Group”). Broadridge selected the peer funds which were similarly situated funds underlying variable insurance products deemed to be comparable to the Portfolios. The Independent Trustees, with the assistance of JDL, also examined the JDL Report. The Board compared the fee payable to aSub-Adviser by the Adviser with respect to the Portfolio to the fee payable to theSub-Adviser by other comparable funds and other accounts, to the extent such information was available.
The Board noted that thesub-advisory fees for the Portfolios are paid by the Adviser out of the advisory fees, and that the Adviser negotiates the fees at arm’s length. The Board also considered that the Adviser had entered into expense limitation or management fee waiver agreements with certain of the Portfolios pursuant to which the Adviser had agreed to waive a portion of its advisory fee and/or reimburse certain expenses as a means of limiting a Portfolio’s total annual operating expenses.
Profitability. The Board examined the profitability to the Adviser of each Advisory Agreement, on aPortfolio-by-Portfolio basis. The Board also considered that an affiliate of the Adviser, Brighthouse Securities, LLC, serves as distributor for the Trusts, and, as such, receives Rule12b-1 payments to support the distribution of the Portfolios. The Board considered the profitability to theSub-Advisers and their affiliates as a result of their relationships with the Portfolios, to the extent available, and the Board considered the ability of the Adviser to negotiate with aSub-Adviser at arm’s length. In reviewing the profitability analyses, the Board recognized that expense allocation methodologies are inherently subjective and various expense allocation methodologies may be reasonable while producing different results.
BHFTII-24
Brighthouse Funds Trust II
Baillie Gifford International Stock Portfolio
Board of Trustees’ Consideration of Advisory and Sub-Advisory Agreements—(Continued)
Economies of scale. The Board also considered each Portfolio’s fees in light of its size. The Board noted the fee schedules for the Portfolios that contain breakpoints that reduce the fee rate above specified asset levels. The Board noted those Portfolios that did not have breakpoints in their advisory fee and took into account management’s discussion of the same. The Board noted that those Portfolios with Advisory Agreements containing breakpoints generally have breakpoints in the correspondingSub-Advisory Agreement. The Board considered the effective fees under the Advisory Agreement andSub-Advisory Agreement for each Portfolio as a percentage of assets at different asset levels and possible economies of scale that may be realized if the assets of the Portfolio grow. The Board examined, among other data, the effect of a Portfolio’s growth in size, and reduction in size, on various fee schedules and the Board reviewed the Broadridge and JDL Reports, which compared fees among peers. The Board also generally noted that if a Portfolio’s assets increase over time, the Portfolio may realize other economies of scale if assets increase proportionally more than certain other fixed expenses.
Other factors. The Board considered other benefits that may be realized by the Adviser and its affiliates from their relationship with the Trusts. Among them, the Board recognized that Brighthouse Securities, LLC, as the distributor for the Trusts, receives payments pursuant to Rule12b-1 from the Portfolios to compensate for the provision of shareholder services and distribution activities, which could lead to growth in the Trusts’ assets and corresponding benefits from such growth, including economies of scale. The Board considered other benefits that may be realized by eachSub-Adviser and its affiliates from their relationship with the Trusts, including the opportunity to provide advisory services to additional portfolios of the Trusts and reputational benefits. In conjunction with these considerations, the Board noted the ongoing commitment of the Adviser to the Portfolios.
The Board requested, received, and considered information from the Adviser regarding possible conflicts of interest in the form of material benefits to the Adviser resulting from the Adviser’s affiliations and business relationships, as relevant. The Board considered the services that are provided to the Trusts by its service providers, and the manner in which any conflicts were mitigated.
* * *
Baillie Gifford International Stock Portfolio. The Board also considered the following information in relation to the Agreements with the Adviser and Baillie Gifford Overseas Limited regarding the Portfolio:
Among other data relating specifically to the Portfolio’s performance, the Board considered that the Portfolio outperformed the median of its Performance Universe and the average of its Morningstar Category for the three- and five-year periods ended June 30, 2018, but underperformed the median of its Performance Universe and the average of its Morningstar Category for theone-year period ended June 30, 2018. The Board further considered that the Portfolio outperformed its benchmark, the MSCI All Country World Indexex-U.S., for theone-, three-, and five-year periods ended September 30, 2018.
The Board also considered that the Portfolio’s actual management fees and total expenses (exclusive of12b-1 fees) were below the Expense Group median, the Expense Universe median, and theSub-advised Expense Universe median. The Board noted that the Portfolio’s contractual management fees were above the asset-weighted average of comparable funds selected by Broadridge at the Portfolio’s current size. The Board also noted that the Portfolio’s contractualsub-advisory fees were below the averages of theSub-advised Expense Group andSub-advised Expense Universe at the Portfolio’s current size.
BHFTII-25
Brighthouse Funds Trust II
BlackRock Bond Income Portfolio
Managed by BlackRock Advisors, LLC
Portfolio Manager Commentary*
PERFORMANCE
For the 12 months ended December 31, 2018, the Class A, B, and E shares of the BlackRock Bond Income Portfolio returned-0.36%,-0.62%, and-0.52%, respectively. The Portfolio’s benchmark, the Bloomberg Barclays U.S. Aggregate Bond Index1, returned 0.01%.
MARKET ENVIRONMENT / CONDITIONS
Coming into 2018, synchronized global growth was a prevalent theme, with the U.S. taking the lead from Europe and China in driving economic expansion. Unprecedented U.S. fiscal stimulus and plans for more government spending were turning past headwinds to U.S. growth into tailwinds. But as 2018 began, market conditions were heavily impacted bygeo-political uncertainty. These tailwinds initially pushed Treasury yields higher in the first quarter before rallying in the second quarter as bouts of volatility hit the market — first in equities, and then in investment grade (“IG”) credit and emerging markets, ultimately causing these sectors to come under pressure. The moves were largely driven by trade protectionism in the U.S., as well as more idiosyncratic uncertainty in certain countries including Italy and Turkey.
Reversing trend in the third quarter of 2018, U.S. Treasury yields notched highs of around 3.10% as evolving trade discussions, hawkish speeches from Federal Open Market Committee (the “FOMC”) members, and continued levels of elevated supply pushed rates higher. Above-trend U.S. growth continued throughout 2018, with the unemployment rate reaching its lowest levels since 1969. The fourth quarter was marked by a continuedsell-off in rates to seven-year highs early on, but later retraced as tightening financial conditions and a shift in tone from the FOMC saw global rates rallying to end the year and as risk assets came under pressure. After hiking rates for the fourth time in 2018 Federal Reserve (the “Fed”) Chairman Jerome Powell commented, “There’s significant uncertainty about both the path and the ultimate destination of any further rate increases.”
Throughout the year, The European Central Bank (the “ECB”) left interest rates unchanged but signaled the end of its quantitative easing program. In the U.K., Brexit (U.K. amendment to leave the European Union) negotiations dominated headlines, with Prime Minister Theresa May delaying the Parliamentary vote for her proposed Brexit Withdrawal Agreement as she continued to rally support after surviving a vote of confidence against her.
PORTFOLIO REVIEW /PERIOD-END POSITIONING
The main detractors to performance during the year included yield curve positioning during the first half of the year, along with allocations to emerging markets debt and Agency Mortgages. The main drivers of positive performance for the year were the Portfolio’s overweight in securitized assets(non-Agency Mortgages, Commercial Mortgages, and Collateralized Loan Obligations), as well as duration positioning.
We began 2018 positioned with a preference for the front end of the yield curve given the attractive risk versus reward profile relative to longer-dated Treasuries and an emphasis on carry-oriented opportunities within high quality assets with less interest rate risk by holding overweight exposure to securitized assets(Non-Agency Mortgages and Collateralized Loan Obligations, in particular).
During the first quarter of 2018, while maintaining an underweight, we tactically increased duration as a hedge, mostly concentrated on the front end of the yield curve. We were also convicted on emerging markets and ended the first quarter with a continued overweight in the sector as synchronized developed market growth bodes well for the asset class. Fundamentals and technicals remained extremely supportive, while valuations resembled broader market richness. We maintained the Portfolio’s allocation to emerging markets within Asia, with a preference for Indonesia and China, and select countries in Latin America.
Into the second quarter of 2018, we maintained the Portfolio’s underweight duration position relative to the benchmark. While firming inflation and growth in the U.S. this year, alongside increased Treasury issuance needs has put upward pressure on rates, geopolitical risk and dovish ECB rhetoric place a meaningful cap on how high they can go in the near term. For these reasons, we remained tactical in our duration management given these crosscurrents. Meanwhile, we reduced the Portfolio’s overweight to emerging markets across countries given the broad-based selling pressure in the sector during the second quarter amidst tightening financial conditions from a stronger U.S. dollar and higher developed market rates. At the end of the quarter, we held long U.S. dollar exposure versus other developed market currencies as a hedge in the Portfolio.
Going into the third quarter of the year, we increased the Portfolio’s overweight to the front end of the curve with a steepening bias. Given the elevated market volatility, as well as rich valuations, we continued to be cautious on broad corporate credit for the quarter, and tactically added back to IG credit on specific new issues to move to neutral relative to the benchmark.
During the fourth quarter, as the Fed started to shift to a more dovish tone, we reduced the Portfolio’s overweight in duration, largely on the front end of the curve, while rotating exposure further out on the curve. As we expected to see more market volatilities into 2019, we moved overweight allocations into higher quality and more liquid sectors in the Portfolio, such as Agency Mortgages and U.S. Municipals, which should benefit from more accommodative monetary policy going forward. We also used this opportunity to rotate from floating to fixed rate exposure in lower quality credit, reducing the Portfolio’s bank loan exposure in favor of high yield bonds while adding to IG credit for high quality income. In emerging markets, while still being modestly positive on the sector, we rotated some exposures into local currency markets from hard currency bonds on attractive entry points given the largere-pricing over the summer.
BHFTII-1
Brighthouse Funds Trust II
BlackRock Bond Income Portfolio
Managed by BlackRock Advisors, LLC
Portfolio Manager Commentary*—(Continued)
The Portfolio employed derivatives as a tool in seeking efficient management of the Portfolio. During the period, the use of derivatives provided exposures through means believed to be advantageous to the Portfolio, including achieving various market exposures and reducing certain risks, and these derivatives performed as expected.
Rick Rieder
Bob Miller
David Rogal
Portfolio Managers
BlackRock Advisors, LLC
* This commentary may include statements that constitute “forward-looking statements” under the U.S. securities laws. Forward-looking statements include, among other things, projections, estimates, and information about possible or future results related to the Portfolio, market or regulatory developments. The views expressed above are not guarantees of future performance or economic results and involve certain risks, uncertainties and assumptions that could cause actual outcomes and results to differ materially from the views expressed herein. The views expressed above are subject to change at any time based upon economic, market, or other conditions and the subadvisory firm undertakes no obligation to update the views expressed herein. Any discussions of specific securities should not be considered a recommendation to buy or sell those securities. The views expressed above (including any forward-looking statement) may not be relied upon as investment advice or as an indication of the Portfolio’s trading intent. Information about the Portfolio’s holdings, asset allocation or country diversification is historical and is not an indication of future Portfolio composition, which may vary. Direct investment in any index is not possible. The performance of any index mentioned in this commentary has not been adjusted for ongoing management, distribution and operating expenses, and sales charges applicable to mutual fund investments. In addition, the returns do not reflect additional fees charged by separate accounts or variable insurance contracts that an investor in the Portfolio may pay. If these additional fees were reflected, performance would have been lower.
BHFTII-2
Brighthouse Funds Trust II
BlackRock Bond Income Portfolio
A $10,000 INVESTMENT COMPARED TO THE BLOOMBERG BARCLAYS U.S. AGGREGATE BOND INDEX
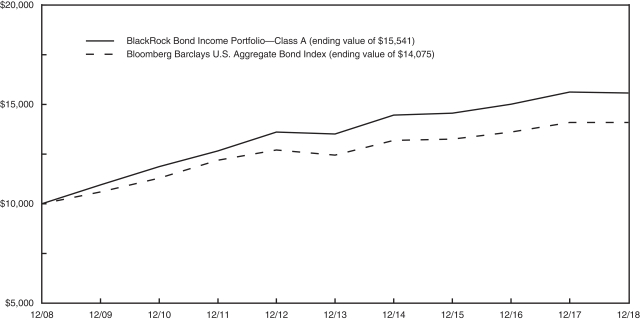
AVERAGE ANNUAL RETURNS (%) (FOR THE YEAR ENDED DECEMBER 31, 2018)
| | | | | | | | | | | | |
| | | | |
| | | 1 Year | | | 5 Year | | | 10 Year | |
| BlackRock Bond Income Portfolio | | | | | | | | | | | | |
Class A | | | -0.36 | | | | 2.88 | | | | 4.51 | |
Class B | | | -0.62 | | | | 2.62 | | | | 4.25 | |
Class E | | | -0.52 | | | | 2.72 | | | | 4.35 | |
| Bloomberg Barclays U.S. Aggregate Bond Index | | | 0.01 | | | | 2.52 | | | | 3.48 | |
1 The Bloomberg Barclays U.S. Aggregate Bond Index is a broad based benchmark that measures the investment grade, U.S. dollar-denominated, fixed-rate taxable bond market, including Treasuries, government-related and corporate securities, mortgage-backed securities, asset-backed securities, and commercialmortgage-backed securities.
Portfolio performance is calculated including reinvestment of all income and capital gain distributions. Performance numbers are net of all Portfolio expenses but do not include any insurance, sales, separate account or administrative charges of variable annuity or life insurance contracts or any additional expenses that participants may bear relating to the operations of their plans. If these charges were included, the returns would be lower. The performance of any index referenced above has not been adjusted for ongoing management, distribution and operating expenses, and sales charges applicable to mutual fund investments. Direct investment in any index is not possible. The performance of Class A shares, as set forth in the line graph above, will differ from that of other classes because of the difference in expenses paid by policyholders investing in the different share classes.
This information represents past performance and is not indicative of future results. Investment return and principal value may fluctuate so that shares, upon redemption, may be worth more or less than the original cost.
PORTFOLIO COMPOSITION AS OF DECEMBER 31, 2018
Top Sectors
| | | | |
| | | % of
Net Assets | |
| U.S. Treasury & Government Agencies | | | 48.3 | |
| Corporate Bonds & Notes | | | 35.7 | |
| Asset-Backed Securities | | | 10.7 | |
| Municipals | | | 7.4 | |
| Mortgage-Backed Securities | | | 4.6 | |
| Foreign Government | | | 2.6 | |
| Floating Rate Loans | | | 1.3 | |
| Purchased Options | | | 0.2 | |
BHFTII-3
Brighthouse Funds Trust II
BlackRock Bond Income Portfolio
Understanding Your Portfolio’s Expenses
Shareholder Expense Example
As a shareholder of the Portfolio, you incur ongoing costs, including management fees; distribution and service(12b-1) fees; and other Portfolio expenses. This example is intended to help you understand your ongoing costs (in dollars) (referred to as “expenses”) of investing in the Portfolio and compare these costs with the ongoing costs of investing in other mutual funds. The example is based on an investment of $1,000 invested at the beginning of the period and held for the entire period, July 1, 2018 through December 31, 2018.
Actual Expenses
The first line for each share class of the Portfolio in the table below provides information about actual account values and actual expenses. You may use the information in this line, together with the amount you invested in the particular share class of the Portfolio, to estimate the expenses that you paid over the period. Simply divide your account value by $1,000 (for example, an $8,600 account value divided by $1,000 = 8.6), then multiply the result by the number in the first line under the heading entitled “Expenses Paid During Period” to estimate the expenses you paid on your account during this period.
Hypothetical Example for Comparison Purposes
The second line for each share class of the Portfolio in the table below provides information about hypothetical account values and hypothetical expenses based on the Portfolio’s actual expense ratio and an assumed rate of return of 5% per year before expenses, which is not the Portfolio’s actual return. The hypothetical account values and expenses may not be used to estimate the actual ending account balance or expenses you paid for the period. You may use this information to compare the ongoing costs of investing in the Portfolio and other funds. To do so, compare this 5% hypothetical example with the 5% hypothetical examples that appear in the shareholder reports of the other funds.
Please note that the expenses shown in the table are meant to highlight your ongoing costs only and do not reflect any fees or charges of your variable insurance product or any additional expenses that participants in certain eligible qualified plans may bear relating to the operations of their plan. Therefore, the second line for each share class in the table is useful in comparing ongoing costs only, and will not help you determine the relative total costs of owning different funds. In addition, if these other costs were included, your costs would have been higher.
| | | | | | | | | | | | | | | | | | |
BlackRock Bond Income Portfolio | | | | Annualized
Expense
Ratio | | | Beginning
Account Value
July 1,
2018 | | | Ending
Account Value
December 31,
2018 | | | Expenses Paid
During Period**
July 1, 2018
to
December 31,
2018 | |
Class A | | Actual | | | 0.38 | % | | $ | 1,000.00 | | | $ | 1,010.40 | | | $ | 1.93 | |
| | Hypothetical* | | | 0.38 | % | | $ | 1,000.00 | | | $ | 1,023.29 | | | $ | 1.94 | |
| | | | | |
Class B | | Actual | | | 0.63 | % | | $ | 1,000.00 | | | $ | 1,009.10 | | | $ | 3.19 | |
| | Hypothetical* | | | 0.63 | % | | $ | 1,000.00 | | | $ | 1,022.03 | | | $ | 3.21 | |
| | | | | |
Class E | | Actual | | | 0.53 | % | | $ | 1,000.00 | | | $ | 1,009.60 | | | $ | 2.68 | |
| | Hypothetical* | | | 0.53 | % | | $ | 1,000.00 | | | $ | 1,022.53 | | | $ | 2.70 | |
| * | Hypothetical assumes a rate of return of 5% per year before expenses. |
| ** | Expenses paid are equal to the Portfolio’s annualized expense ratio for the most recent six month period, as shown above, multiplied by the average account value over the period, multiplied by the number of days (184 days) in the most recent fiscal half-year, divided by 365 (to reflect theone-half year period). |
BHFTII-4
Brighthouse Funds Trust II
BlackRock Bond Income Portfolio
Schedule of Investments as of December 31, 2018
U.S. Treasury & Government Agencies—48.3% of Net Assets
| | | | | | | | |
| Security Description | | Principal
Amount* | | | Value | |
|
| Agency Sponsored Mortgage - Backed—38.3% | |
Fannie Mae 15 Yr. Pool
2.000%, 10/01/31 | | | 257,114 | | | $ | 246,128 | |
2.000%, 11/01/31 | | | 3,164,921 | | | | 3,029,710 | |
2.000%, 12/01/31 | | | 337,630 | | | | 323,202 | |
2.000%, 03/01/32 | | | 2,010,720 | | | | 1,924,813 | |
2.500%, 09/01/27 | | | 293,389 | | | | 289,340 | |
2.500%, 02/01/28 | | | 34,642 | | | | 34,180 | |
2.500%, 04/01/28 | | | 85,287 | | | | 84,150 | |
2.500%, 08/01/28 | | | 234,161 | | | | 231,033 | |
2.500%, 01/01/30 | | | 1,253,273 | | | | 1,227,250 | |
2.500%, 02/01/30 | | | 153,392 | | | | 150,858 | |
2.500%, 03/01/30 | | | 255,646 | | | | 250,336 | |
2.500%, 07/01/30 | | | 882,158 | | | | 863,686 | |
2.500%, 08/01/30 | | | 3,011,617 | | | | 2,950,994 | |
2.500%, 09/01/30 | | | 1,461,450 | | | | 1,431,081 | |
2.500%, 11/01/30 | | | 3,014,397 | | | | 2,951,738 | |
2.500%, 03/01/31 | | | 173,133 | | | | 170,715 | |
2.500%, 06/01/31 | | | 832,057 | | | | 812,944 | |
2.500%, 07/01/31 | | | 466,382 | | | | 455,669 | |
2.500%, 08/01/31 | | | 82,652 | | | | 80,754 | |
2.500%, 10/01/31 | | | 4,041,825 | | | | 3,948,982 | |
2.500%, 11/01/31 | | | 2,507,766 | | | | 2,450,183 | |
2.500%, 02/01/32 | | | 119,443 | | | | 116,699 | |
2.500%, 03/01/32 | | | 388,353 | | | | 379,432 | |
2.500%, 08/01/32 | | | 2,909,648 | | | | 2,842,812 | |
2.500%, 02/01/33 | | | 5,160,033 | | | | 5,052,805 | |
3.000%, 04/01/28 | | | 180,358 | | | | 180,538 | |
3.000%, 05/01/28 | | | 233,740 | | | | 233,971 | |
3.000%, 10/01/28 | | | 401,173 | | | | 401,157 | |
3.000%, 11/01/28 | | | 3,006,697 | | | | 3,009,685 | |
3.000%, 12/01/28 | | | 914,680 | | | | 915,100 | |
3.000%, 01/01/29 | | | 301,685 | | | | 301,651 | |
3.000%, 04/01/29 | | | 1,333,492 | | | | 1,334,816 | |
3.000%, 05/01/29 | | | 1,819,295 | | | | 1,819,816 | |
3.000%, 08/01/29 | | | 2,015,020 | | | | 2,013,940 | |
3.000%, 10/01/29 | | | 527,155 | | | | 527,679 | |
3.000%, 03/01/30 | | | 1,054,683 | | | | 1,055,732 | |
3.000%, 04/01/30 | | | 888,094 | | | | 888,976 | |
3.000%, 05/01/30 | | | 1,344,887 | | | | 1,346,225 | |
3.000%, 07/01/30 | | | 1,073,558 | | | | 1,074,328 | |
3.000%, 08/01/30 | | | 4,949,924 | | | | 4,954,856 | |
3.000%, 09/01/30 | | | 1,170,581 | | | | 1,171,156 | |
3.000%, 08/01/31 | | | 5,041,225 | | | | 5,038,484 | |
3.000%, 09/01/31 | | | 506,995 | | | | 506,251 | |
3.000%, 03/01/32 | | | 1,030,719 | | | | 1,029,207 | |
3.000%, TBA (a) | | | 9,777,000 | | | | 9,756,013 | |
3.500%, 08/01/28 | | | 552,042 | | | | 560,814 | |
3.500%, 10/01/28 | | | 3,065,975 | | | | 3,114,677 | |
3.500%, 11/01/28 | | | 3,268,973 | | | | 3,316,884 | |
3.500%, 02/01/29 | | | 4,738,957 | | | | 4,807,518 | |
3.500%, 04/01/29 | | | 1,139,711 | | | | 1,153,961 | |
3.500%, 05/01/29 | | | 3,037,480 | | | | 3,079,189 | |
3.500%, 06/01/29 | | | 2,217,553 | | | | 2,248,680 | |
3.500%, 07/01/29 | | | 1,368,878 | | | | 1,388,541 | |
3.500%, 09/01/29 | | | 193,597 | | | | 196,330 | |
3.500%, 08/01/30 | | | 942,815 | | | | 956,106 | |
|
| Agency Sponsored Mortgage - Backed—(Continued) | |
Fannie Mae 15 Yr. Pool
3.500%, 11/01/32 | | | 225,161 | | | | 228,291 | |
3.500%, 01/01/33 | | | 148,239 | | | | 150,297 | |
4.000%, 10/01/33 | | | 13,055,776 | | | | 13,394,129 | |
4.500%, 12/01/20 | | | 157,692 | | | | 160,519 | |
4.500%, 02/01/25 | | | 303,549 | | | | 312,066 | |
4.500%, 04/01/25 | | | 64,908 | | | | 66,812 | |
4.500%, 07/01/25 | | | 251,115 | | | | 258,255 | |
4.500%, 06/01/26 | | | 1,647,988 | | | | 1,696,324 | |
Fannie Mae 20 Yr. Pool
3.000%, 10/01/36 | | | 113,868 | | | | 112,768 | |
3.000%, 11/01/36 | | | 1,161,315 | | | | 1,150,100 | |
3.000%, 12/01/36 | | | 1,739,348 | | | | 1,722,552 | |
5.000%, 05/01/23 | | | 1,655 | | | | 1,735 | |
Fannie Mae 30 Yr. Pool
3.000%, 12/01/42 | | | 7,064,423 | | | | 6,955,819 | |
3.000%, 01/01/43 | | | 4,820,070 | | | | 4,744,800 | |
3.000%, 02/01/43 | | | 2,299,876 | | | | 2,263,526 | |
3.000%, 03/01/43 | | | 18,691,484 | | | | 18,391,702 | |
3.000%, 04/01/43 | | | 12,646,086 | | | | 12,443,567 | |
3.000%, 05/01/43 | | | 17,002,095 | | | | 16,731,256 | |
3.000%, 06/01/43 | | | 2,205,871 | | | | 2,170,414 | |
3.000%, 07/01/43 | | | 1,246,525 | | | | 1,226,172 | |
3.000%, 08/01/43 | | | 1,007,808 | | | | 991,428 | |
3.000%, 06/01/46 | | | 782,165 | | | | 766,324 | |
3.000%, 08/01/46 | | | 85,071 | | | | 83,445 | |
3.000%, 09/01/46 | | | 1,196,937 | | | | 1,172,258 | |
3.000%, 11/01/46 | | | 4,156,907 | | | | 4,068,149 | |
3.000%, 01/01/47 | | | 401,354 | | | | 393,048 | |
3.000%, 02/01/47 | | | 972,414 | | | | 951,703 | |
3.000%, 03/01/47 | | | 3,185,493 | | | | 3,115,684 | |
3.000%, TBA (a) | | | 9,948,058 | | | | 9,707,451 | |
3.500%, 01/01/42 | | | 736,466 | | | | 742,689 | |
3.500%, 04/01/42 | | | 442,164 | | | | 445,754 | |
3.500%, 05/01/42 | | | 322,288 | | | | 324,655 | |
3.500%, 06/01/42 | | | 769,712 | | | | 775,947 | |
3.500%, 07/01/42 | | | 118,306 | | | | 119,266 | |
3.500%, 08/01/42 | | | 194,573 | | | | 196,152 | |
3.500%, 10/01/42 | | | 1,047,044 | | | | 1,055,545 | |
3.500%, 11/01/42 | | | 2,348,126 | | | | 2,367,172 | |
3.500%, 12/01/42 | | | 1,180,678 | | | | 1,190,253 | |
3.500%, 02/01/43 | | | 1,405,779 | | | | 1,417,034 | |
3.500%, 03/01/43 | | | 1,495,295 | | | | 1,504,531 | |
3.500%, 04/01/43 | | | 47,244 | | | | 47,627 | |
3.500%, 05/01/43 | | | 277,874 | | | | 280,103 | |
3.500%, 06/01/43 | | | 1,188,493 | | | | 1,196,499 | |
3.500%, 07/01/43 | | | 9,381,406 | | | | 9,456,711 | |
3.500%, 08/01/43 | | | 7,001,401 | | | | 7,055,671 | |
3.500%, 09/01/43 | | | 108,606 | | | | 109,212 | |
3.500%, 11/01/43 | | | 1,149,787 | | | | 1,155,828 | |
3.500%, 01/01/44 | | | 1,102,519 | | | | 1,110,883 | |
3.500%, 05/01/44 | | | 12,595,855 | | | | 12,721,224 | |
3.500%, 06/01/44 | | | 10,252,078 | | | | 10,335,197 | |
3.500%, 07/01/44 | | | 53,126 | | | | 53,405 | |
3.500%, 02/01/45 | | | 1,046,628 | | | | 1,055,126 | |
3.500%, 07/01/45 | | | 3,165,137 | | | | 3,180,543 | |
See accompanying notes to financial statements.
BHFTII-5
Brighthouse Funds Trust II
BlackRock Bond Income Portfolio
Schedule of Investments as of December 31, 2018
U.S. Treasury & Government Agencies—(Continued)
| | | | | | | | |
| Security Description | | Principal
Amount* | | | Value | |
|
| Agency Sponsored Mortgage - Backed—(Continued) | |
Fannie Mae 30 Yr. Pool
3.500%, 10/01/45 | | | 1,599,493 | | | $ | 1,614,291 | |
3.500%, 11/01/45 | | | 3,367,462 | | | | 3,393,219 | |
3.500%, 12/01/45 | | | 802,851 | | | | 808,889 | |
3.500%, 03/01/46 | | | 1,167,058 | | | | 1,171,112 | |
3.500%, 04/01/46 | | | 1,752,359 | | | | 1,759,385 | |
3.500%, 05/01/46 | | | 737,017 | | | | 739,539 | |
3.500%, 06/01/46 | | | 3,213,965 | | | | 3,224,828 | |
3.500%, 08/01/46 | | | 1,522,956 | | | | 1,528,010 | |
3.500%, 09/01/46 | | | 1,610,502 | | | | 1,617,066 | |
3.500%, 11/01/46 | | | 2,964,017 | | | | 2,981,504 | |
3.500%, 12/01/46 | | | 3,475,757 | | | | 3,489,163 | |
3.500%, 01/01/47 | | | 7,599,407 | | | | 7,650,502 | |
3.500%, 02/01/47 | | | 600,242 | | | | 603,444 | |
3.500%, 05/01/47 | | | 2,019,794 | | | | 2,028,608 | |
3.500%, 06/01/47 | | | 1,233,055 | | | | 1,236,467 | |
3.500%, 07/01/47 | | | 878,413 | | | | 882,174 | |
3.500%, 09/01/47 | | | 855,521 | | | | 859,182 | |
3.500%, 10/01/47 | | | 268,289 | | | | 269,388 | |
3.500%, 11/01/47 | | | 1,471,674 | | | | 1,481,094 | |
3.500%, 12/01/47 | | | 9,988,380 | | | | 10,032,463 | |
3.500%, 01/01/48 | | | 6,479,557 | | | | 6,506,391 | |
4.000%, 08/01/33 | | | 1,125,628 | | | | 1,147,834 | |
4.000%, 06/01/39 | | | 864,286 | | | | 888,901 | |
4.000%, 12/01/39 | | | 79,003 | | | | 81,248 | |
4.000%, 07/01/40 | | | 1,037,566 | | | | 1,067,062 | |
4.000%, 08/01/40 | | | 1,887,183 | | | | 1,941,116 | |
4.000%, 10/01/40 | | | 5,087,027 | | | | 5,232,418 | |
4.000%, 11/01/40 | | | 344,388 | | | | 354,232 | |
4.000%, 12/01/40 | | | 1,732,037 | | | | 1,781,543 | |
4.000%, 04/01/41 | | | 163,861 | | | | 168,541 | |
4.000%, 09/01/41 | | | 4,270,586 | | | | 4,392,667 | |
4.000%, 10/01/41 | | | 298,037 | | | | 306,558 | |
4.000%, 12/01/41 | | | 1,170,712 | | | | 1,210,043 | |
4.000%, 01/01/42 | | | 1,148,424 | | | | 1,181,255 | |
4.000%, 02/01/42 | | | 2,911,402 | | | | 2,994,612 | |
4.000%, 05/01/42 | | | 1,130,213 | | | | 1,165,524 | |
4.000%, 06/01/42 | | | 598,914 | | | | 616,033 | |
4.000%, 07/01/42 | | | 4,199,620 | | | | 4,338,450 | |
4.000%, 08/01/42 | | | 317,192 | | | | 326,258 | |
4.000%, 09/01/42 | | | 784,160 | | | | 806,549 | |
4.000%, 12/01/42 | | | 2,252,574 | | | | 2,323,736 | |
4.000%, 01/01/43 | | | 954,270 | | | | 981,506 | |
4.000%, 03/01/43 | | | 195,888 | | | | 201,447 | |
4.000%, 10/01/43 | | | 718,711 | | | | 739,240 | |
4.000%, 11/01/43 | | | 3,398,253 | | | | 3,512,413 | |
4.000%, 01/01/44 | | | 2,492,362 | | | | 2,575,791 | |
4.000%, 02/01/44 | | | 2,430,489 | | | | 2,512,136 | |
4.000%, 05/01/44 | | | 3,548,102 | | | | 3,666,659 | |
4.000%, 07/01/44 | | | 230,032 | | | | 235,688 | |
4.000%, 08/01/44 | | | 791,465 | | | | 818,052 | |
4.000%, 12/01/44 | | | 2,190,413 | | | | 2,258,316 | |
4.000%, 01/01/45 | | | 350,326 | | | | 361,389 | |
4.000%, 02/01/45 | | | 1,132,727 | | | | 1,166,839 | |
4.000%, 03/01/45 | | | 983,409 | | | | 1,010,448 | |
4.000%, 04/01/45 | | | 873,909 | | | | 901,503 | |
|
| Agency Sponsored Mortgage - Backed—(Continued) | |
Fannie Mae 30 Yr. Pool
4.000%, 05/01/45 | | | 876,019 | | | | 903,209 | |
4.000%, 10/01/45 | | | 5,904,620 | | | | 6,085,360 | |
4.000%, 11/01/45 | | | 2,192,885 | | | | 2,262,443 | |
4.000%, 12/01/45 | | | 4,566,204 | | | | 4,700,681 | |
4.000%, 01/01/46 | | | 4,690,397 | | | | 4,800,359 | |
4.000%, 02/01/46 | | | 1,587,377 | | | | 1,633,215 | |
4.000%, 06/01/46 | | | 3,729,725 | | | | 3,816,723 | |
4.000%, 11/01/46 | | | 277,219 | | | | 285,415 | |
4.000%, 01/01/47 | | | 401,634 | | | | 413,452 | |
4.000%, 03/01/47 | | | 69,518,145 | | | | 71,453,677 | |
4.000%, 08/01/47 | | | 1,008,572 | | | | 1,033,561 | |
4.000%, 03/01/48 | | | 2,618,134 | | | | 2,696,780 | |
4.000%, 04/01/48 | | | 1,631,712 | | | | 1,680,440 | |
4.000%, 08/01/48 | | | 10,217,236 | | | | 10,469,732 | |
4.500%, 08/01/39 | | | 1,261,111 | | | | 1,321,000 | |
4.500%, 11/01/39 | | | 375,774 | | | | 393,813 | |
4.500%, 01/01/40 | | | 39,292 | | | | 41,175 | |
4.500%, 04/01/40 | | | 90,501 | | | | 94,839 | |
4.500%, 05/01/40 | | | 232,820 | | | | 243,980 | |
4.500%, 06/01/40 | | | 215,227 | | | | 225,544 | |
4.500%, 07/01/40 | | | 449,082 | | | | 470,609 | |
4.500%, 08/01/40 | | | 2,970,165 | | | | 3,112,558 | |
4.500%, 11/01/40 | | | 843,631 | | | | 884,073 | |
4.500%, 07/01/41 | | | 253,231 | | | | 265,254 | |
4.500%, 08/01/41 | | | 34,457 | | | | 35,696 | |
4.500%, 09/01/41 | | | 901,333 | | | | 942,457 | |
4.500%, 10/01/41 | | | 182,184 | | | | 190,749 | |
4.500%, 01/01/42 | | | 174,948 | | | | 183,332 | |
4.500%, 06/01/42 | | | 82,745 | | | | 85,740 | |
4.500%, 08/01/42 | | | 1,039,958 | | | | 1,084,027 | |
4.500%, 09/01/42 | | | 2,691,670 | | | | 2,820,576 | |
4.500%, 09/01/43 | | | 1,068,510 | | | | 1,113,106 | |
4.500%, 10/01/43 | | | 1,309,619 | | | | 1,362,586 | |
4.500%, 12/01/43 | | | 1,611,736 | | | | 1,679,059 | |
4.500%, 01/01/44 | | | 1,689,934 | | | | 1,760,356 | |
4.500%, 09/01/45 | | | 746,019 | | | | 784,588 | |
4.500%, 11/01/45 | | | 479,396 | | | | 503,374 | |
4.500%, 12/01/45 | | | 1,211,234 | | | | 1,266,306 | |
4.500%, 09/01/46 | | | 623,107 | | | | 655,800 | |
4.500%, 09/01/47 | | | 83,239 | | | | 86,400 | |
4.500%, 10/01/47 | | | 211,176 | | | | 219,879 | |
4.500%, 11/01/47 | | | 54,044 | | | | 56,193 | |
4.500%, 12/01/47 | | | 67,040 | | | | 69,703 | |
4.500%, 02/01/48 | | | 122,420 | | | | 127,063 | |
4.500%, 03/01/48 | | | 228,084 | | | | 236,963 | |
4.500%, 04/01/48 | | | 1,401,331 | | | | 1,473,959 | |
4.500%, 05/01/48 | | | 18,918,285 | | | | 19,831,170 | |
4.500%, 07/01/48 | | | 269,983 | | | | 282,464 | |
4.500%, 08/01/48 | | | 578,179 | | | | 609,761 | |
4.500%, TBA (a) | | | 88,200,000 | | | | 91,291,705 | |
5.000%, 11/01/32 | | | 3,607 | | | | 3,787 | |
5.000%, 09/01/35 | | | 202,656 | | | | 215,246 | |
5.000%, 06/01/39 | | | 8,797,920 | | | | 9,283,776 | |
5.000%, 04/01/41 | | | 35,810 | | | | 38,027 | |
See accompanying notes to financial statements.
BHFTII-6
Brighthouse Funds Trust II
BlackRock Bond Income Portfolio
Schedule of Investments as of December 31, 2018
U.S. Treasury & Government Agencies—(Continued)
| | | | | | | | |
| Security Description | | Principal
Amount* | | | Value | |
|
| Agency Sponsored Mortgage - Backed—(Continued) | |
Fannie Mae 30 Yr. Pool
5.000%, 07/01/41 | | | 381,011 | | | $ | 403,120 | |
5.000%, 08/01/41 | | | 349,820 | | | | 370,119 | |
5.000%, 01/01/42 | | | 51,157 | | | | 53,614 | |
5.000%, TBA (a) | | | 77,579,000 | | | | 81,286,243 | |
5.500%, 11/01/32 | | | 946,603 | | | | 1,013,258 | |
5.500%, 12/01/32 | | | 169,969 | | | | 181,946 | |
5.500%, 01/01/33 | | | 655,103 | | | | 700,135 | |
5.500%, 12/01/33 | | | 227,598 | | | | 244,153 | |
5.500%, 05/01/34 | | | 1,785,578 | | | | 1,924,001 | |
5.500%, 08/01/37 | | | 1,847,873 | | | | 1,991,323 | |
5.500%, 02/01/38 | | | 298,014 | | | | 319,729 | |
5.500%, 03/01/38 | | | 196,772 | | | | 211,841 | |
5.500%, 04/01/38 | | | 111,313 | | | | 117,853 | |
5.500%, 06/01/38 | | | 298,638 | | | | 316,582 | |
5.500%, 12/01/38 | | | 116,956 | | | | 123,827 | |
5.500%, 01/01/39 | | | 294,503 | | | | 315,955 | |
5.500%, 08/01/39 | | | 193,396 | | | | 205,282 | |
5.500%, 12/01/39 | | | 431,050 | | | | 459,092 | |
5.500%, 04/01/40 | | | 69,525 | | | | 74,112 | |
5.500%, 04/01/41 | | | 277,166 | | | | 295,832 | |
5.500%, TBA (a) | | | 3,696,000 | | | | 3,913,724 | |
6.000%, 02/01/34 | | | 207,103 | | | | 225,887 | |
6.000%, 08/01/34 | | | 154,527 | | | | 168,567 | |
6.000%, 04/01/35 | | | 2,455,232 | | | | 2,678,050 | |
6.000%, 06/01/36 | | | 295,906 | | | | 325,090 | |
6.000%, 02/01/38 | | | 514,157 | | | | 560,236 | |
6.000%, 03/01/38 | | | 155,384 | | | | 169,714 | |
6.000%, 05/01/38 | | | 503,232 | | | | 551,068 | |
6.000%, 10/01/38 | | | 620,445 | | | | 677,012 | |
6.000%, 12/01/38 | | | 189,397 | | | | 206,697 | |
6.000%, 04/01/40 | | | 1,987,402 | | | | 2,168,522 | |
6.000%, 09/01/40 | | | 206,076 | | | | 224,020 | |
6.000%, 06/01/41 | | | 458,158 | | | | 500,012 | |
6.500%, 05/01/40 | | | 2,891,751 | | | | 3,267,732 | |
Fannie Mae Connecticut Avenue Securities (CMO)
6.106%, 1M LIBOR + 3.600%, 01/25/30 (b) | | | 1,105,163 | | | | 1,097,748 | |
6.506%, 1M LIBOR + 4.000%, 05/25/30 (b) | | | 1,140,000 | | | | 1,143,109 | |
6.756%, 1M LIBOR + 4.250%, 04/25/29 (b) | | | 1,620,000 | | | | 1,779,930 | |
Fannie Mae Pool
4.000%, 01/01/41 | | | 432,499 | | | | 443,541 | |
Fannie Mae REMICS (CMO)
5.000%, 04/25/35 | | | 47,548 | | | | 49,096 | |
FannieMae-ACES (CMO)
2.632%, 01/25/39 (b) (c) | | | 2,848,879 | | | | 255,564 | |
2.961%, 02/25/27 (b) | | | 1,598,000 | | | | 1,555,309 | |
2.986%, 12/25/27 (b) | | | 507,000 | | | | 496,062 | |
Freddie Mac 15 Yr. Gold Pool
2.500%, 04/01/27 | | | 122,509 | | | | 121,072 | |
2.500%, 10/01/28 | | | 424,051 | | | | 419,069 | |
2.500%, 08/01/29 | | | 987,440 | | | | 973,529 | |
2.500%, 12/01/29 | | | 285,964 | | | | 280,751 | |
2.500%, 05/01/30 | | | 1,052,887 | | | | 1,030,666 | |
2.500%, 07/01/30 | | | 714,960 | | | | 700,061 | |
2.500%, 08/01/30 | | | 2,446,290 | | | | 2,392,897 | |
2.500%, 09/01/30 | | | 2,680,195 | | | | 2,619,592 | |
2.500%, 04/01/31 | | | 1,914,013 | | | | 1,869,686 | |
|
| Agency Sponsored Mortgage - Backed—(Continued) | |
Freddie Mac 15 Yr. Gold Pool
2.500%, TBA (a) | | | 7,117,000 | | | | 6,942,208 | |
3.000%, 01/01/30 | | | 786,329 | | | | 786,762 | |
3.000%, 04/01/30 | | | 4,119,365 | | | | 4,120,423 | |
3.000%, 05/01/30 | | | 661,497 | | | | 662,119 | |
3.000%, 06/01/30 | | | 28,363 | | | | 28,357 | |
3.000%, 07/01/30 | | | 1,503,608 | | | | 1,502,587 | |
3.000%, 08/01/30 | | | 483,786 | | | | 483,011 | |
3.000%, TBA (a) | | | 9,130,000 | | | | 9,095,508 | |
3.500%, TBA (a) | | | 6,274,000 | | | | 6,349,938 | |
4.000%, TBA (a) | | | 2,651,000 | | | | 2,712,340 | |
Freddie Mac 30 Yr. Gold Pool
3.000%, 12/01/42 | | | 2,604,581 | | | | 2,561,547 | |
3.000%, 01/01/43 | | | 1,737,784 | | | | 1,708,499 | |
3.000%, 03/01/43 | | | 3,757,086 | | | | 3,692,940 | |
3.000%, 07/01/43 | | | 10,918,516 | | | | 10,727,948 | |
3.000%, 12/01/46 | | | 3,008,624 | | | | 2,940,702 | |
3.000%, TBA (a) | | | 36,349,779 | | | | 35,429,141 | |
3.500%, 04/01/42 | | | 2,221,386 | | | | 2,238,423 | |
3.500%, 05/01/42 | | | 110,238 | | | | 110,958 | |
3.500%, 08/01/42 | | | 2,711,634 | | | | 2,734,054 | |
3.500%, 10/01/42 | | | 143,341 | | | | 143,798 | |
3.500%, 11/01/42 | | | 1,043,408 | | | | 1,051,393 | |
3.500%, 01/01/43 | | | 1,282,136 | | | | 1,291,976 | |
3.500%, 06/01/43 | | | 300,086 | | | | 302,359 | |
3.500%, 12/01/43 | | | 4,971,202 | | | | 5,009,354 | |
3.500%, 01/01/44 | | | 22,521,547 | | | | 22,694,907 | |
3.500%, 04/01/44 | | | 2,231,133 | | | | 2,248,217 | |
3.500%, 05/01/44 | | | 553,096 | | | | 557,433 | |
3.500%, 06/01/44 | | | 391,329 | | | | 394,289 | |
3.500%, 07/01/44 | | | 111,684 | | | | 112,714 | |
3.500%, 08/01/44 | | | 422,328 | | | | 425,438 | |
3.500%, 09/01/44 | | | 877,169 | | | | 883,953 | |
3.500%, 11/01/44 | | | 23,471 | | | | 23,613 | |
3.500%, 01/01/45 | | | 168,955 | | | | 169,730 | |
3.500%, 05/01/45 | | | 251,146 | | | | 252,008 | |
3.500%, 06/01/45 | | | 214,760 | | | | 215,544 | |
3.500%, 07/01/45 | | | 6,014 | | | | 6,036 | |
3.500%, 08/01/45 | | | 6,501,625 | | | | 6,549,532 | |
3.500%, 09/01/45 | | | 186,249 | | | | 187,834 | |
3.500%, 10/01/45 | | | 23,692 | | | | 23,779 | |
3.500%, 01/01/46 | | | 1,083,740 | | | | 1,087,698 | |
3.500%, 02/01/46 | | | 74,986 | | | | 75,260 | |
3.500%, 03/01/46 | | | 774,728 | | | | 777,557 | |
3.500%, 05/01/46 | | | 883,446 | | | | 886,672 | |
3.500%, 07/01/46 | | | 7,994,876 | | | | 8,040,164 | |
3.500%, 03/01/47 | | | 2,241,155 | | | | 2,252,122 | |
3.500%, 07/01/47 | | | 342,329 | | | | 344,852 | |
3.500%, 10/01/47 | | | 1,364,569 | | | | 1,372,938 | |
3.500%, 12/01/47 | | | 1,685,581 | | | | 1,693,307 | |
3.500%, 01/01/48 | | | 560,802 | | | | 563,156 | |
3.500%, TBA (a) | | | 8,027,164 | | | | 8,024,637 | |
4.000%, 08/01/40 | | | 287,408 | | | | 295,716 | |
4.000%, 09/01/40 | | | 317,780 | | | | 326,868 | |
4.000%, 10/01/40 | | | 137,541 | | | | 141,521 | |
4.000%, 11/01/40 | | | 620,560 | | | | 638,498 | |
4.000%, 04/01/41 | | | 16,524 | | | | 17,002 | |
See accompanying notes to financial statements.
BHFTII-7
Brighthouse Funds Trust II
BlackRock Bond Income Portfolio
Schedule of Investments as of December 31, 2018
U.S. Treasury & Government Agencies—(Continued)
| | | | | | | | |
| Security Description | | Principal
Amount* | | | Value | |
|
| Agency Sponsored Mortgage - Backed—(Continued) | |
Freddie Mac 30 Yr. Gold Pool
4.000%, 10/01/41 | | | 542,662 | | | $ | 558,366 | |
4.000%, 09/01/43 | | | 444,483 | | | | 457,605 | |
4.000%, 04/01/44 | | | 993,026 | | | | 1,020,649 | |
4.000%, 07/01/44 | | | 336,562 | | | | 345,863 | |
4.000%, 08/01/44 | | | 3,203,492 | | | | 3,297,970 | |
4.000%, 02/01/45 | | | 291,848 | | | | 298,934 | |
4.000%, 09/01/45 | | | 1,246,445 | | | | 1,274,627 | |
4.000%, 10/01/45 | | | 1,786,465 | | | | 1,831,606 | |
4.000%, 12/01/45 | | | 12,275,447 | | | | 12,534,012 | |
4.000%, 01/01/47 | | | 5,812,797 | | | | 5,975,792 | |
4.000%, 08/01/47 | | | 2,285,772 | | | | 2,349,572 | |
4.000%, TBA (a) | | | 26,809,000 | | | | 27,329,882 | |
4.500%, 02/01/39 | | | 1,156,615 | | | | 1,200,191 | |
4.500%, 08/01/39 | | | 1,036,400 | | | | 1,085,409 | |
4.500%, 12/01/39 | | | 254,233 | | | | 266,277 | |
4.500%, 07/01/40 | | | 79,155 | | | | 82,904 | |
4.500%, 05/01/41 | | | 1,609,730 | | | | 1,685,988 | |
4.500%, 05/01/42 | | | 1,492,153 | | | | 1,562,764 | |
4.500%, 10/01/43 | | | 798,638 | | | | 828,420 | |
4.500%, 12/01/43 | | | 1,858,455 | | | | 1,934,935 | |
4.500%, 07/01/47 | | | 1,887,240 | | | | 1,981,106 | |
4.500%, 08/01/48 | | | 10,163,960 | | | | 10,645,962 | |
4.500%, TBA (a) | | | 2,009,000 | | | | 2,080,135 | |
5.000%, 10/01/41 | | | 632,207 | | | | 669,377 | |
5.000%, 11/01/41 | | | 5,413,337 | | | | 5,731,621 | |
5.500%, 02/01/35 | | | 147,086 | | | | 158,814 | |
5.500%, 09/01/39 | | | 180,404 | | | | 192,720 | |
5.500%, 01/01/40 | | | 97,675 | | | | 103,383 | |
5.500%, 07/01/40 | | | 29,786 | | | | 31,521 | |
5.500%, 06/01/41 | | | 2,182,633 | | | | 2,349,778 | |
Freddie Mac Gold Pool
3.000%, 09/01/27 | | | 585,625 | | | | 584,014 | |
3.000%, 07/01/28 | | | 316,195 | | | | 315,325 | |
Freddie Mac Multifamily Structured Pass-Through Certificates (CMO)
0.846%, 06/25/27 (b) (c) | | | 2,627,661 | | | | 141,271 | |
2.653%, 08/25/26 | | | 270,000 | | | | 259,968 | |
2.770%, 05/25/25 | | | 1,110,000 | | | | 1,090,210 | |
3.120%, 09/25/26 (b) | | | 1,080,000 | | | | 1,072,781 | |
3.224%, 03/25/27 | | | 771,000 | | | | 769,513 | |
3.347%, 11/25/26 (b) | | | 490,000 | | | | 493,428 | |
3.430%, 01/25/27 (b) | | | 410,000 | | | | 415,181 | |
3.444%, 12/25/27 | | | 210,000 | | | | 211,890 | |
3.531%, 07/25/23 (b) | | | 500,000 | | | | 511,559 | |
3.590%, 01/25/25 | | | 291,000 | | | | 298,279 | |
Freddie Mac Structured Agency Credit Risk Debt Notes (CMO)
4.306%, 1M LIBOR + 1.800%, 07/25/30 (b) | | | 194,389 | | | | 186,699 | |
4.656%, 1M LIBOR + 2.150%, 12/25/30 (144A) (b) | | | 950,000 | | | | 922,265 | |
5.956%, 1M LIBOR + 3.450%, 10/25/29 (b) | | | 467,815 | | | | 495,039 | |
6.306%, 1M LIBOR + 3.800%, 03/25/29 (b) | | | 1,310,000 | | | | 1,412,963 | |
6.956%, 1M LIBOR + 4.450%, 03/25/30 (b) | | | 682,210 | | | | 721,834 | |
FREMF Mortgage Trust (CMO)
3.981%, 05/25/50 (144A) (b) | | | 275,556 | | | | 266,836 | |
4.051%, 04/25/48 (144A) (b) | | | 360,000 | | | | 355,290 | |
4.229%, 08/25/50 (144A) (b) | | | 440,000 | | | | 426,394 | |
|
| Agency Sponsored Mortgage - Backed—(Continued) | |
FRESB Mortgage Trust (CMO)
3.480%, 06/25/28 (b) | | | 717,789 | | | $ | 719,044 | |
3.660%, 06/25/28 (b) | | | 423,207 | | | | 428,479 | |
Ginnie Mae I 30 Yr. Pool
3.000%, 02/15/45 | | | 1,352,876 | | | | 1,337,340 | |
3.500%, 01/15/42 | | | 397,866 | | | | 402,438 | |
3.500%, 02/15/42 | | | 164,269 | | | | 166,088 | |
3.500%, 04/15/42 | | | 305,482 | | | | 309,020 | |
3.500%, 05/15/42 | | | 342,261 | | | | 346,845 | |
3.500%, 08/15/42 | | | 473,225 | | | | 479,148 | |
3.500%, 11/15/42 | | | 295,076 | | | | 298,013 | |
3.500%, 12/15/42 | | | 1,050,315 | | | | 1,064,328 | |
3.500%, 01/15/43 | | | 467,523 | | | | 472,176 | |
3.500%, 02/15/43 | | | 719,314 | | | | 726,999 | |
3.500%, 03/15/43 | | | 379,153 | | | | 382,853 | |
3.500%, 04/15/43 | | | 2,135,047 | | | | 2,160,680 | |
3.500%, 05/15/43 | | | 2,428,756 | | | | 2,456,788 | |
3.500%, 06/15/43 | | | 636,109 | | | | 643,816 | |
3.500%, 07/15/43 | | | 2,280,832 | | | | 2,311,300 | |
4.000%, 03/15/41 | | | 813,705 | | | | 838,557 | |
4.000%, 12/15/41 | | | 25,326 | | | | 25,960 | |
4.500%, 02/15/42 | | | 10,008,685 | | | | 10,452,962 | |
4.500%, 03/15/47 | | | 144,952 | | | | 151,475 | |
4.500%, 04/15/47 | | | 377,345 | | | | 394,471 | |
4.500%, 05/15/47 | | | 133,675 | | | | 139,778 | |
5.000%, 12/15/38 | | | 283,308 | | | | 300,379 | |
5.000%, 07/15/39 | | | 673,516 | | | | 714,037 | |
5.000%, 10/15/39 | | | 362,877 | | | | 384,832 | |
5.000%, 09/15/40 | | | 25,290 | | | | 26,796 | |
5.000%, 12/15/40 | | | 910,782 | | | | 965,632 | |
5.500%, 04/15/33 | | | 25,555 | | | | 27,659 | |
6.500%, 04/15/33 | | | 45,629 | | | | 49,127 | |
8.500%, 05/15/22 | | | 435 | | | | 436 | |
Ginnie Mae II 30 Yr. Pool
3.000%, 12/20/44 | | | 164,923 | | | | 163,315 | |
3.000%, 04/20/45 | | | 3,199,303 | | | | 3,159,183 | |
3.000%, 06/20/45 | | | 8,356,749 | | | | 8,250,230 | |
3.000%, 07/20/45 | | | 86,622 | | | | 85,509 | |
3.000%, 08/20/45 | | | 86,537 | | | | 85,416 | |
3.000%, 10/20/45 | | | 1,035,726 | | | | 1,022,203 | |
3.000%, 12/20/45 | | | 90,637 | | | | 89,426 | |
3.000%, 04/20/46 | | | 18,457,501 | | | | 18,199,395 | |
3.000%, 05/20/46 | | | 131,043 | | | | 129,230 | |
3.000%, 06/20/46 | | | 2,994,244 | | | | 2,950,529 | |
3.000%, 07/20/46 | | | 6,167,106 | | | | 6,078,006 | |
3.000%, 08/20/46 | | | 1,161,482 | | | | 1,144,521 | |
3.000%, 09/20/46 | | | 11,297,488 | | | | 11,137,701 | |
3.000%, 10/20/46 | | | 448,432 | | | | 441,745 | |
3.000%, 11/20/46 | | | 291,244 | | | | 286,857 | |
3.000%, 12/20/46 | | | 1,106,665 | | | | 1,089,820 | |
3.500%, 04/20/43 | | | 2,109,366 | | | | 2,134,721 | |
3.500%, 05/20/43 | | | 1,133,520 | | | | 1,147,160 | |
3.500%, 07/20/43 | | | 88,467 | | | | 89,531 | |
3.500%, 02/20/44 | | | 2,629,077 | | | | 2,649,360 | |
3.500%, 05/20/45 | | | 739,616 | | | | 746,231 | |
3.500%, 04/20/46 | | | 35,574,367 | | | | 35,876,137 | |
See accompanying notes to financial statements.
BHFTII-8
Brighthouse Funds Trust II
BlackRock Bond Income Portfolio
Schedule of Investments as of December 31, 2018
U.S. Treasury & Government Agencies—(Continued)
| | | | | | | | |
| Security Description | | Principal
Amount* | | | Value | |
|
| Agency Sponsored Mortgage - Backed—(Continued) | |
Ginnie Mae II 30 Yr. Pool
3.500%, 05/20/46 | | | 1,609,382 | | | $ | 1,622,538 | |
3.500%, 06/20/46 | | | 18,366,605 | | | | 18,513,921 | |
3.500%, 07/20/46 | | | 3,125,827 | | | | 3,149,937 | |
3.500%, 09/20/46 | | | 597,400 | | | | 601,916 | |
3.500%, 10/20/46 | | | 2,376,958 | | | | 2,396,341 | |
3.500%, 11/20/46 | | | 14,374,234 | | | | 14,478,968 | |
3.500%, TBA (a) | | | 990,496 | | | | 997,251 | |
4.000%, 04/20/39 | | | 46,938 | | | | 48,483 | |
4.000%, 07/20/39 | | | 349,069 | | | | 360,590 | |
4.000%, 09/20/40 | | | 95,634 | | | | 98,922 | |
4.000%, 10/20/40 | | | 1,067,664 | | | | 1,102,927 | |
4.000%, 11/20/40 | | | 594,567 | | | | 614,189 | |
4.000%, 12/20/40 | | | 2,236,834 | | | | 2,310,705 | |
4.000%, 01/20/41 | | | 1,964,791 | | | | 2,029,724 | |
4.000%, 02/20/41 | | | 34,718 | | | | 35,863 | |
4.000%, 07/20/43 | | | 185,301 | | | | 191,343 | |
4.000%, 08/20/44 | | | 759,769 | | | | 783,851 | |
4.000%, 10/20/46 | | | 162,019 | | | | 166,437 | |
4.000%, TBA (a) | | | 97,287,500 | | | | 99,629,003 | |
4.500%, 12/20/39 | | | 79,174 | | | | 83,078 | |
4.500%, 01/20/40 | | | 98,645 | | | | 103,511 | |
4.500%, 02/20/40 | | | 77,488 | | | | 81,312 | |
4.500%, 05/20/40 | | | 5,294 | | | | 5,555 | |
4.500%, 09/20/48 | | | 917,176 | | | | 957,709 | |
4.500%, TBA (a) | | | 51,030,500 | | | | 52,805,071 | |
5.000%, 10/20/33 | | | 821,679 | | | | 879,967 | |
5.000%, 10/20/39 | | | 278,993 | | | | 296,843 | |
5.000%, 07/20/42 | | | 360,532 | | | | 380,367 | |
5.000%, TBA (a) | | | 7,233,000 | | | | 7,524,727 | |
Government National Mortgage Association (CMO)
0.578%, 06/16/53 (b) (c) | | | 1,312,402 | | | | 31,640 | |
0.674%, 02/16/50 (b) (c) | | | 1,850,636 | | | | 82,565 | |
0.727%, 03/16/55 (b) (c) | | | 3,472,362 | | | | 182,435 | |
0.747%, 11/16/53 (b) (c) | | | 1,064,506 | | | | 37,138 | |
0.773%, 05/16/59 (b) (c) | | | 2,154,132 | | | | 144,901 | |
0.790%, 09/16/51 (b) (c) | | | 17,565,443 | | | | 924,336 | |
0.807%, 05/16/59 (b) (c) | | | 3,066,569 | | | | 207,336 | |
0.825%, 08/16/41 (c) | | | 3,097,510 | | | | 43,290 | |
0.890%, 09/16/55 (b) (c) | | | 2,157,108 | | | | 141,722 | |
0.891%, 11/16/55 (b) (c) | | | 3,387,303 | | | | 208,701 | |
0.907%, 06/16/58 (b) (c) | | | 2,702,827 | | | | 200,319 | |
0.926%, 08/15/58 (b) (c) | | | 6,843,319 | | | | 517,915 | |
0.952%, 09/16/56 (b) (c) | | | 1,360,393 | | | | 105,599 | |
0.965%, 02/16/58 (b) (c) | | | 5,300,940 | | | | 366,334 | |
0.997%, 09/16/58 (b) (c) | | | 1,998,805 | | | | 161,345 | |
1.000%, 02/16/39 (c) | | | 2,281,165 | | | | 19,187 | |
1.003%, 08/16/58 (b) (c) | | | 3,796,361 | | | | 285,632 | |
1.032%, 05/16/58 (b) (c) | | | 2,587,263 | | | | 191,452 | |
1.062%, 12/16/57 (b) (c) | | | 3,733,276 | | | | 293,120 | |
1.124%, 04/16/58 (b) (c) | | | 1,560,838 | | | | 129,368 | |
2.000%, 03/16/35 | | | 199,252 | | | | 181,609 | |
2.250%, 12/16/38 | | | 313,442 | | | | 291,129 | |
| | | | | | | | |
| | | | | | | 1,350,063,958 | |
| | | | | | | | |
|
| U.S. Treasury—10.0% | |
U.S. Treasury Bonds
2.875%, 05/15/43 | | | 8,084,000 | | | | 7,905,833 | |
2.875%, 11/15/46 (d) | | | 2,181,000 | | | | 2,124,424 | |
3.000%, 02/15/47 | | | 1,447,000 | | | | 1,445,504 | |
3.000%, 08/15/48 (e) | | | 15,110,000 | | | | 15,064,576 | |
3.125%, 02/15/43 (e) | | | 7,953,000 | | | | 8,126,612 | |
3.625%, 08/15/43 | | | 7,590,000 | | | | 8,415,949 | |
3.750%, 11/15/43 | | | 8,055,000 | | | | 9,113,068 | |
4.250%, 05/15/39 | | | 2,095,000 | | | | 2,530,740 | |
4.375%, 11/15/39 | | | 2,042,000 | | | | 2,507,030 | |
4.500%, 08/15/39 | | | 2,035,000 | | | | 2,539,415 | |
U.S. Treasury Notes
1.000%, 10/15/19 | | | 20,393,000 | | | | 20,135,698 | |
1.125%, 06/30/21 | | | 14,275,000 | | | | 13,814,024 | |
1.250%, 08/31/19 (d) | | | 20,393,000 | | | | 20,208,985 | |
1.625%, 06/30/20 | | | 12,746,000 | | | | 12,572,708 | |
1.625%, 07/31/20 | | | 12,746,000 | | | | 12,564,007 | |
1.625%, 10/31/23 | | | 11,216,000 | | | | 10,764,630 | |
1.875%, 04/30/22 | | | 14,275,000 | | | | 14,001,565 | |
2.000%, 04/30/24 | | | 12,236,000 | | | | 11,912,672 | |
2.000%, 05/31/24 | | | 12,236,000 | | | | 11,905,197 | |
2.000%, 08/15/25 | | | 5,098,000 | | | | 4,916,489 | |
2.000%, 11/15/26 | | | 8,440,000 | | | | 8,062,354 | |
2.125%, 09/30/21 | | | 14,275,000 | | | | 14,138,124 | |
2.250%, 07/31/21 | | | 14,275,000 | | | | 14,193,948 | |
2.250%, 01/31/24 | | | 11,216,000 | | | | 11,069,464 | |
2.250%, 11/15/25 | | | 5,098,000 | | | | 4,987,725 | |
2.250%, 02/15/27 (e) | | | 8,263,000 | | | | 8,029,491 | |
2.625%, 08/31/20 (d) | | | 27,790,000 | | | | 27,823,583 | |
2.625%, 05/15/21 (d) | | | 23,914,000 | | | | 23,986,585 | |
2.750%, 08/31/23 (d) | | | 27,100,000 | | | | 27,403,074 | |
2.750%, 08/31/25 | | | 11,460,000 | | | | 11,576,036 | |
2.875%, 08/15/28 | | | 9,650,000 | | | | 9,806,092 | |
| | | | | | | | |
| | | | | | | 353,645,602 | |
| | | | | | | | |
Total U.S. Treasury & Government Agencies
(Cost $1,714,643,655) | | | | | | | 1,703,709,560 | |
| | | | | | | | |
|
| Corporate Bonds & Notes—35.7% | |
|
| Advertising—0.0% | |
ACE03 MH1 B2
Zero Coupon, 08/15/30 | | | 642,759 | | | | 477,969 | |
| Interpublic Group of Cos., Inc. (The) | |
3.500%, 10/01/20 | | | 495,000 | | | | 495,522 | |
3.750%, 10/01/21 | | | 265,000 | | | | 266,563 | |
| | | | | | | | |
| | | | | | | 1,240,054 | |
| | | | | | | | |
|
| Aerospace/Defense—1.3% | |
BAE Systems Holdings, Inc.
2.850%, 12/15/20 (144A) | | | 2,599,000 | | | | 2,564,248 | |
3.850%, 12/15/25 (144A) | | | 1,765,000 | | | | 1,750,695 | |
4.750%, 10/07/44 (144A) | | | 132,000 | | | | 132,714 | |
Boeing Co. (The)
| |
6.125%, 02/15/33 | | | 275,000 | | | | 348,369 | |
See accompanying notes to financial statements.
BHFTII-9
Brighthouse Funds Trust II
BlackRock Bond Income Portfolio
Schedule of Investments as of December 31, 2018
Corporate Bonds & Notes—(Continued)
| | | | | | | | |
| Security Description | | Principal
Amount* | | | Value | |
|
| Aerospace/Defense—(Continued) | |
General Dynamics Corp.
3.750%, 05/15/28 | | | 1,015,000 | | | $ | 1,026,452 | |
Harris Corp.
2.700%, 04/27/20 | | | 706,000 | | | | 699,890 | |
4.400%, 06/15/28 | | | 2,865,000 | | | | 2,853,731 | |
5.054%, 04/27/45 | | | 1,115,000 | | | | 1,148,444 | |
L3 Technologies, Inc.
3.850%, 06/15/23 | | | 2,205,000 | | | | 2,208,295 | |
3.850%, 12/15/26 | | | 1,885,000 | | | | 1,825,754 | |
4.400%, 06/15/28 | | | 340,000 | | | | 340,128 | |
4.950%, 02/15/21 | | | 435,000 | | | | 445,124 | |
Lockheed Martin Corp.
2.900%, 03/01/25 | | | 670,000 | | | | 643,172 | |
3.550%, 01/15/26 | | | 815,000 | | | | 809,108 | |
3.600%, 03/01/35 | | | 2,306,000 | | | | 2,149,463 | |
3.800%, 03/01/45 | | | 675,000 | | | | 617,170 | |
4.070%, 12/15/42 | | | 1,160,000 | | | | 1,108,323 | |
4.090%, 09/15/52 | | | 594,000 | | | | 557,077 | |
4.700%, 05/15/46 | | | 2,005,000 | | | | 2,094,145 | |
Northrop Grumman Corp.
2.550%, 10/15/22 | | | 2,940,000 | | | | 2,847,545 | |
2.930%, 01/15/25 | | | 3,065,000 | | | | 2,909,574 | |
3.250%, 01/15/28 | | | 3,106,000 | | | | 2,904,015 | |
3.850%, 04/15/45 | | | 690,000 | | | | 610,033 | |
4.030%, 10/15/47 | | | 1,180,000 | | | | 1,074,774 | |
Raytheon Co.
7.200%, 08/15/27 | | | 530,000 | | | | 667,361 | |
United Technologies Corp.
1.950%, 11/01/21 | | | 3,825,000 | | | | 3,671,646 | |
4.125%, 11/16/28 | | | 4,050,000 | | | | 4,021,513 | |
4.150%, 05/15/45 | | | 696,000 | | | | 623,294 | |
4.500%, 06/01/42 | | | 2,485,000 | | | | 2,344,294 | |
| | | | | | | | |
| | | | | | | 44,996,351 | |
| | | | | | | | |
|
| Agriculture—0.3% | |
| Altria Group, Inc. | |
2.850%, 08/09/22 | | | 475,000 | | | | 455,966 | |
4.000%, 01/31/24 (f) | | | 2,440,000 | | | | 2,397,736 | |
| BAT Capital Corp. | |
3.222%, 08/15/24 | | | 2,625,000 | | | | 2,417,525 | |
4.540%, 08/15/47 | | | 1,818,000 | | | | 1,449,059 | |
Reynolds American, Inc.
4.450%, 06/12/25 | | | 5,615,000 | | | | 5,416,514 | |
| | | | | | | | |
| | | | | | | 12,136,800 | |
| | | | | | | | |
|
| Airlines—0.6% | |
Air Canada Pass-Through Trust
3.700%, 01/15/26 (144A) | | | 10,000 | | | | 9,487 | |
American Airlines Group, Inc.
4.625%, 03/01/20 (144A) | | | 2,214,000 | | | | 2,202,930 | |
American Airlines Pass-Through Trust
3.375%, 05/01/27 | | | 2,386,537 | | | | 2,268,021 | |
3.700%, 05/01/23 | | | 40,842 | | | | 39,380 | |
3.700%, 10/15/25 | | | 137,670 | | | | 133,119 | |
|
| Airlines—(Continued) | |
| American Airlines Pass-Through Trust | |
4.400%, 09/22/23 | | | 1,720,441 | | | | 1,687,237 | |
4.950%, 02/15/25 | | | 131,625 | | | | 131,929 | |
5.250%, 01/15/24 | | | 55,595 | | | | 57,207 | |
Azul Investments LLP
5.875%, 10/26/24 (144A) | | | 200,000 | | | | 186,752 | |
| Delta Air Lines, Inc. | |
2.600%, 12/04/20 | | | 3,005,000 | | | | 2,954,259 | |
2.875%, 03/13/20 | | | 8,220,000 | | | | 8,164,356 | |
3.400%, 04/19/21 | | | 265,000 | | | | 262,779 | |
Gol Finance, Inc.
7.000%, 01/31/25 (144A) | | | 1,274,000 | | | | 1,129,082 | |
Turkish Airlines Pass-Through Trust
4.200%, 03/15/27 (144A) | | | 1,058,805 | | | | 914,596 | |
U.S. Airways Pass-Through Trust
5.375%, 11/15/21 | | | 161,384 | | | | 166,279 | |
6.750%, 06/03/21 | | | 43,351 | | | | 45,292 | |
United Airlines Pass-Through Trust
2.875%, 10/07/28 | | | 217,842 | | | | 200,044 | |
3.450%, 12/01/27 | | | 8,791 | | | | 8,314 | |
3.650%, 01/07/26 | | | 47,859 | | | | 46,778 | |
4.600%, 03/01/26 | | | 595,000 | | | | 595,186 | |
4.750%, 04/11/22 | | | 315,357 | | | | 316,145 | |
| | | | | | | | |
| | | | | | | 21,519,172 | |
| | | | | | | | |
|
| Auto Manufacturers—2.0% | |
BMW U.S. Capital LLC
2.800%, 04/11/26 (144A) | | | 900,000 | | | | 825,227 | |
Daimler Finance North America LLC
2.300%, 02/12/21 (144A) | | | 1,015,000 | | | | 990,248 | |
3.100%, 05/04/20 (144A) | | | 3,130,000 | | | | 3,112,470 | |
3.350%, 05/04/21 (144A) | | | 3,770,000 | | | | 3,758,195 | |
3.750%, 11/05/21 (144A) | | | 890,000 | | | | 892,981 | |
Ford Motor Credit Co. LLC
2.979%, 08/03/22 | | | 2,125,000 | | | | 1,960,209 | |
3.096%, 05/04/23 | | | 1,930,000 | | | | 1,744,577 | |
3.157%, 08/04/20 | | | 500,000 | | | | 489,884 | |
3.200%, 01/15/21 | | | 1,310,000 | | | | 1,269,308 | |
3.219%, 01/09/22 | | | 9,970,000 | | | | 9,362,095 | |
3.336%, 03/18/21 | | | 205,000 | | | | 198,907 | |
5.750%, 02/01/21 (f) | | | 2,714,000 | | | | 2,767,912 | |
5.875%, 08/02/21 | | | 670,000 | | | | 687,104 | |
General Motors Co.
5.400%, 04/01/48 (f) | | | 300,000 | | | | 255,799 | |
6.250%, 10/02/43 | | | 250,000 | | | | 234,587 | |
6.750%, 04/01/46 | | | 370,000 | | | | 358,572 | |
General Motors Financial Co., Inc.
3.100%, 01/15/19 | | | 814,000 | | | | 813,968 | |
3.150%, 06/30/22 | | | 4,710,000 | | | | 4,489,766 | |
3.200%, 07/06/21 | | | 6,650,000 | | | | 6,495,504 | |
4.000%, 01/15/25 | | | 2,576,000 | | | | 2,409,757 | |
4.000%, 10/06/26 | | | 390,000 | | | | 350,297 | |
4.200%, 03/01/21 (f) | | | 815,000 | | | | 814,466 | |
4.200%, 11/06/21 | | | 7,200,000 | | | | 7,196,299 | |
See accompanying notes to financial statements.
BHFTII-10
Brighthouse Funds Trust II
BlackRock Bond Income Portfolio
Schedule of Investments as of December 31, 2018
Corporate Bonds & Notes—(Continued)
| | | | | | | | |
| Security Description | | Principal
Amount* | | | Value | |
|
| Auto Manufacturers—(Continued) | |
Hyundai Capital America
2.550%, 04/03/20 (144A) | | | 8,645,000 | | | $ | 8,534,592 | |
Hyundai Capital Services, Inc.
3.000%, 08/29/22 (144A) | | | 1,220,000 | | | | 1,180,296 | |
Toyota Motor Corp.
3.669%, 07/20/28 | | | 535,000 | | | | 541,795 | |
Toyota Motor Credit Corp.
3.050%, 01/11/28 (f) | | | 950,000 | | | | 917,231 | |
Volkswagen Group of America Finance LLC
2.400%, 05/22/20 (144A) | | | 2,000,000 | | | | 1,968,617 | |
3.875%, 11/13/20 (144A) | | | 3,075,000 | | | | 3,089,402 | |
4.000%, 11/12/21 (144A) | | | 3,215,000 | | | | 3,221,444 | |
| | | | | | | | |
| | | | | | | 70,931,509 | |
| | | | | | | | |
|
| Auto Parts & Equipment—0.1% | |
Aptiv plc
4.250%, 01/15/26 | | | 364,000 | | | | 354,280 | |
ZF North America Capital, Inc.
4.750%, 04/29/25 (144A) | | | 3,203,000 | | | | 2,982,173 | |
| | | | | | | | |
| | | | | | | 3,336,453 | |
| | | | | | | | |
|
| Banks—9.9% | |
ABN AMRO Bank NV
2.650%, 01/19/21 (144A) | | | 2,590,000 | | | | 2,552,720 | |
Banco Espirito Santo S.A.
4.000%, 01/21/19 (EUR) (g) (k) | | | 200,000 | | | | 64,162 | |
Banco Mercantil del Norte S.A.
6.875%, 5Y H15 + 5.035%, 07/06/22 (144A) (b) | | | 251,000 | | | | 242,845 | |
Banco Santander S.A.
3.848%, 04/12/23 (f) | | | 2,000,000 | | | | 1,943,214 | |
Bank of America Corp.
2.328%, 3M LIBOR + 0.630%, 10/01/21 (b) | | | 11,882,000 | | | | 11,649,744 | |
2.369%, 3M LIBOR + 0.660%, 07/21/21 (b) | | | 3,945,000 | | | | 3,874,305 | |
2.625%, 10/19/20 | | | 1,475,000 | | | | 1,459,264 | |
3.300%, 01/11/23 | | | 640,000 | | | | 630,274 | |
3.366%, 3M LIBOR + 0.810%, 01/23/26 (b) | | | 1,180,000 | | | | 1,128,665 | |
3.419%, 3M LIBOR + 1.040%, 12/20/28 (b) | | | 7,700,000 | | | | 7,197,221 | |
3.499%, 3M LIBOR + 0.630%, 05/17/22 (b) | | | 2,350,000 | | | | 2,350,264 | |
3.500%, 04/19/26 | | | 510,000 | | | | 491,196 | |
3.875%, 08/01/25 | | | 3,970,000 | | | | 3,929,143 | |
3.950%, 04/21/25 | | | 2,075,000 | | | | 2,011,406 | |
3.970%, 3M LIBOR + 1.070%, 03/05/29 (b) | | | 960,000 | | | | 933,711 | |
4.183%, 11/25/27 | | | 955,000 | | | | 918,439 | |
4.200%, 08/26/24 | | | 3,245,000 | | | | 3,218,151 | |
5.700%, 01/24/22 | | | 2,545,000 | | | | 2,697,263 | |
Bank of New York Mellon Corp. (The)
4.625%, 3M LIBOR + 3.131%, 09/20/26 (b) | | | 2,405,000 | | | | 2,131,425 | |
Barclays plc
4.338%, 3M LIBOR + 1.356%, 05/16/24 (b) (f) | | | 2,655,000 | | | | 2,581,163 | |
4.950%, 01/10/47 | | | 2,031,000 | | | | 1,797,050 | |
4.972%, 3M LIBOR + 1.902%, 05/16/29 (b) | | | 3,060,000 | | | | 2,952,084 | |
BBVA Bancomer S.A.
6.750%, 09/30/22 (144A) (f) | | | 251,000 | | | | 264,494 | |
BNP Paribas S.A.
2.950%, 05/23/22 (144A) | | | 4,050,000 | | | | 3,902,895 | |
|
| Banks—(Continued) | |
BNP Paribas S.A.
3.800%, 01/10/24 (144A) | | | 2,148,000 | | | | 2,091,196 | |
7.000%, 5Y USD ICE Swap + 3.980%, 08/16/28 (144A) (b) | | | 765,000 | | | | 727,706 | |
BPCE S.A.
3.000%, 05/22/22 (144A) | | | 3,500,000 | | | | 3,380,790 | |
Citigroup, Inc.
2.500%, 07/29/19 | | | 3,634,000 | | | | 3,621,633 | |
2.876%, 3M LIBOR + 0.950%, 07/24/23 (b) | | | 1,535,000 | | | | 1,485,010 | |
2.900%, 12/08/21 | | | 5,235,000 | | | | 5,150,099 | |
3.750%, 06/16/24 | | | 1,630,000 | | | | 1,618,452 | |
3.887%, 3M LIBOR + 1.563%, 01/10/28 (b) | | | 760,000 | | | | 731,052 | |
4.400%, 06/10/25 | | | 1,530,000 | | | | 1,497,974 | |
4.450%, 09/29/27 | | | 500,000 | | | | 482,122 | |
Citizens Bank N.A.
2.250%, 03/02/20 | | | 6,026,000 | | | | 5,960,749 | |
2.650%, 05/26/22 | | | 4,875,000 | | | | 4,736,010 | |
Credit Suisse Group AG
4.207%, 3M LIBOR + 1.240%, 06/12/24 (144A) (b) | | | 2,265,000 | | | | 2,259,001 | |
7.250%, 5Y USD ICE Swap + 4.332%, 09/12/25 (144A) (b) | | | 2,035,000 | | | | 1,919,717 | |
Credit Suisse Group Funding Guernsey, Ltd.
2.750%, 03/26/20 | | | 4,269,000 | | | | 4,222,392 | |
3.125%, 12/10/20 | | | 8,102,000 | | | | 8,021,132 | |
Deutsche Bank AG
2.700%, 07/13/20 | | | 3,815,000 | | | | 3,710,016 | |
2.950%, 08/20/20 (f) | | | 1,874,000 | | | | 1,818,626 | |
4.250%, 02/04/21 | | | 4,445,000 | | | | 4,379,679 | |
4.250%, 10/14/21 | | | 1,040,000 | | | | 1,016,819 | |
Discover Bank
4.650%, 09/13/28 | | | 440,000 | | | | 428,892 | |
Fifth Third Bank
2.250%, 06/14/21 | | | 3,062,000 | | | | 2,988,995 | |
Gilex Holding S.a.r.l.
8.500%, 05/02/23 (144A) | | | 694,000 | | | | 701,814 | |
Goldman Sachs Group, Inc. (The)
2.000%, 04/25/19 | | | 950,000 | | | | 946,688 | |
2.350%, 11/15/21 | | | 4,120,000 | | | | 3,972,369 | |
2.750%, 09/15/20 | | | 1,326,000 | | | | 1,312,056 | |
2.754%, 02/08/19 (144A) | | | 22,000,000 | | | | 21,986,275 | |
3.691%, 3M LIBOR + 1.510%, 06/05/28 (b) | | | 5,135,000 | | | | 4,774,969 | |
3.786%, 3M LIBOR + 1.170%, 05/15/26 (b) | | | 1,310,000 | | | | 1,257,304 | |
4.017%, 3M LIBOR + 1.373%, 10/31/38 (b) | | | 1,370,000 | | | | 1,205,174 | |
4.223%, 3M LIBOR + 1.301%, 05/01/29 (b) | | | 2,935,000 | | | | 2,826,289 | |
HSBC Holdings plc
2.650%, 01/05/22 | | | 3,200,000 | | | | 3,104,278 | |
3.950%, 3M LIBOR + 0.987%, 05/18/24 (b) | | | 1,525,000 | | | | 1,516,674 | |
5.100%, 04/05/21 | | | 1,600,000 | | | | 1,654,518 | |
6.000%, 5Y USD ICE Swap + 3.746%, 05/22/27 (b) | | | 3,575,000 | | | | 3,219,216 | |
HSBC USA, Inc.
2.350%, 03/05/20 | | | 4,175,000 | | | | 4,132,331 | |
ING Bank NV
5.800%, 09/25/23 (144A) | | | 1,460,000 | | | | 1,524,917 | |
ING Groep NV
4.100%, 10/02/23 | | | 3,815,000 | | | | 3,812,437 | |
See accompanying notes to financial statements.
BHFTII-11
Brighthouse Funds Trust II
BlackRock Bond Income Portfolio
Schedule of Investments as of December 31, 2018
Corporate Bonds & Notes—(Continued)
| | | | | | | | |
| Security Description | | Principal
Amount* | | | Value | |
|
| Banks—(Continued) | |
Intesa Sanpaolo S.p.A.
5.017%, 06/26/24 (144A) | | | 4,675,000 | | | $ | 4,230,208 | |
6.500%, 02/24/21 (144A) | | | 800,000 | | | | 820,117 | |
Itau Unibanco Holding S.A.
6.125%, 5Y H15 + 3.981%, 12/12/22 (144A) (b) | | | 400,000 | | | | 375,000 | |
6.500%, 5Y H15 + 3.863%, 03/19/23 (144A) (b) | | | 200,000 | | | | 189,250 | |
JPMorgan Chase & Co.
2.550%, 03/01/21 | | | 1,969,000 | | | | 1,941,153 | |
2.972%, 01/15/23 | | | 1,474,000 | | | | 1,437,038 | |
3.514%, 3M LIBOR + 0.610%, 06/18/22 (b) | | | 2,730,000 | | | | 2,736,072 | |
3.540%, 3M LIBOR + 1.380%, 05/01/28 (b) | | | 1,565,000 | | | | 1,493,073 | |
3.559%, 3M LIBOR + 0.730%, 04/23/24 (b) | | | 725,000 | | | | 719,474 | |
3.782%, 3M LIBOR + 1.337%, 02/01/28 (b) | | | 2,630,000 | | | | 2,554,366 | |
3.797%, 3M LIBOR + 0.890%, 07/23/24 (b) | | | 3,998,000 | | | | 4,004,968 | |
3.882%, 3M LIBOR + 1.360%, 07/24/38 (b) | | | 3,100,000 | | | | 2,824,427 | |
4.023%, 3M LIBOR + 1.000%, 12/05/24 (b) | | | 6,635,000 | | | | 6,691,071 | |
4.203%, 3M LIBOR + 1.260%, 07/23/29 (b) (f) | | | 2,210,000 | | | | 2,204,627 | |
4.452%, 3M LIBOR + 1.330%, 12/05/29 (b) | | | 1,000,000 | | | | 1,017,780 | |
4.625%, 05/10/21 | | | 1,708,000 | | | | 1,757,683 | |
KeyBank N.A.
3.350%, 06/15/21 | | | 440,000 | | | | 441,356 | |
KeyCorp
4.150%, 10/29/25 | | | 890,000 | | | | 904,437 | |
Lloyds Banking Group plc
3.750%, 01/11/27 | | | 1,715,000 | | | | 1,576,402 | |
4.450%, 05/08/25 | | | 1,820,000 | | | | 1,807,970 | |
4.650%, 03/24/26 | | | 4,530,000 | | | | 4,261,060 | |
Mitsubishi UFJ Financial Group, Inc.
2.998%, 02/22/22 (f) | | | 256,000 | | | | 252,404 | |
3.455%, 03/02/23 | | | 8,320,000 | | | | 8,268,446 | |
3.535%, 07/26/21 | | | 265,000 | | | | 265,753 | |
Mizuho Financial Group, Inc.
2.273%, 09/13/21 | | | 942,000 | | | | 912,046 | |
2.601%, 09/11/22 | | | 425,000 | | | | 411,049 | |
2.953%, 02/28/22 | | | 12,595,000 | | | | 12,347,175 | |
3.922%, 3M LIBOR + 1.000%, 09/11/24 (b) | | | 690,000 | | | | 697,251 | |
Morgan Stanley
2.750%, 05/19/22 | | | 4,900,000 | | | | 4,766,886 | |
3.591%, 3M LIBOR + 1.340%, 07/22/28 (b) | | | 5,530,000 | | | | 5,226,637 | |
3.625%, 01/20/27 | | | 1,840,000 | | | | 1,749,673 | |
3.772%, 3M LIBOR + 1.140%, 01/24/29 (b) | | | 3,140,000 | | | | 3,006,050 | |
6.250%, 08/09/26 | | | 1,661,000 | | | | 1,840,138 | |
Nordea Bank Abp
2.125%, 05/29/20 (144A) | | | 2,810,000 | | | | 2,766,936 | |
3.750%, 08/30/23 (144A) | | | 1,830,000 | | | | 1,804,934 | |
Northern Trust Corp.
3.375%, 3M LIBOR + 1.131%, 05/08/32 (b) | | | 1,630,000 | | | | 1,517,574 | |
Promerica Financial Corp.
9.700%, 05/14/24 (144A) | | | 747,000 | | | | 769,410 | |
Royal Bank of Scotland Group plc
3.498%, 3M LIBOR + 1.480%, 05/15/23 (b) | | | 1,370,000 | | | | 1,317,354 | |
4.892%, 3M LIBOR + 1.754%, 05/18/29 (b) | | | 310,000 | | | | 296,080 | |
5.076%, 3M LIBOR + 1.905%, 01/27/30 (b) | | | 3,015,000 | | | | 2,909,024 | |
Santander UK Group Holdings plc
2.875%, 08/05/21 | | | 4,355,000 | | | | 4,201,068 | |
Santander UK plc
5.000%, 11/07/23 (144A) | | | 3,760,000 | | | | 3,671,602 | |
|
| Banks—(Continued) | |
Standard Chartered plc
4.247%, 3M LIBOR + 1.150%, 01/20/23 (144A) (b) | | | 4,865,000 | | | | 4,816,141 | |
State Street Corp.
2.650%, 05/19/26 (f) | | | 1,246,000 | | | | 1,167,221 | |
5.625%, 3M LIBOR + 2.539%, 12/15/23 (b) (f) | | | 2,815,000 | | | | 2,660,175 | |
Sumitomo Mitsui Trust Bank, Ltd.
1.950%, 09/19/19 (144A) | | | 5,465,000 | | | | 5,416,533 | |
2.050%, 03/06/19 (144A) | | | 15,092,000 | | | | 15,065,802 | |
SunTrust Banks, Inc.
4.000%, 05/01/25 | | | 610,000 | | | | 612,220 | |
Synchrony Bank
3.650%, 05/24/21 | | | 2,600,000 | | | | 2,543,864 | |
Toronto-Dominion Bank (The)
3.500%, 07/19/23 | | | 1,020,000 | | | | 1,026,958 | |
U.S. Bancorp
2.950%, 07/15/22 | | | 1,825,000 | | | | 1,800,077 | |
U.S. Bank N.A.
3.104%, 3M LIBOR + 0.290%, 05/21/21 (b) | | | 1,050,000 | | | | 1,048,411 | |
UBS Group Funding Switzerland AG
2.859%, 3M LIBOR + 0.954%, 08/15/23 (144A) (b) | | | 3,575,000 | | | | 3,438,208 | |
2.950%, 09/24/20 (144A) | | | 4,195,000 | | | | 4,149,894 | |
4.125%, 09/24/25 (144A) | | | 5,280,000 | | | | 5,246,228 | |
UniCredit S.p.A.
5.861%, 5Y USD ICE Swap + 3.703%,
06/19/32 (144A) (b) (f) | | | 2,645,000 | | | | 2,321,686 | |
Wells Fargo & Co.
2.500%, 03/04/21 | | | 4,185,000 | | | | 4,117,667 | |
2.600%, 07/22/20 | | | 1,285,000 | | | | 1,272,335 | |
2.625%, 07/22/22 | | | 2,945,000 | | | | 2,839,605 | |
3.500%, 03/08/22 | | | 1,340,000 | | | | 1,335,479 | |
3.584%, 3M LIBOR + 1.310%, 05/22/28 (b) | | | 2,310,000 | | | | 2,219,016 | |
Wells Fargo Bank N.A.
3.325%, 3M LIBOR + 0.490%, 07/23/21 (b) | | | 350,000 | | | | 349,650 | |
3.550%, 08/14/23 | | | 2,815,000 | | | | 2,804,660 | |
| | | | | | | | |
| | | | | | | 350,353,321 | |
| | | | | | | | |
|
| Beverages—0.5% | |
Anheuser-Busch Cos. LLC / Anheuser-Busch InBev Worldwide, Inc. 4.700%, 02/01/36 (144A) | | | 5,815,000 | | | | 5,414,884 | |
4.900%, 02/01/46 (144A) | | | 1,650,000 | | | | 1,532,141 | |
Anheuser-Busch InBev Finance, Inc.
3.300%, 02/01/23 (f) | | | 5,200,000 | | | | 5,063,047 | |
Constellation Brands, Inc.
3.209%, 3M LIBOR + 0.700%, 11/15/21 (b) | | | 1,895,000 | | | | 1,872,301 | |
Keurig Dr Pepper, Inc.
3.551%, 05/25/21 (144A) | | | 840,000 | | | | 838,696 | |
4.057%, 05/25/23 (144A) | | | 1,227,000 | | | | 1,221,933 | |
PepsiCo, Inc.
4.000%, 05/02/47 (f) | | | 1,360,000 | | | | 1,331,492 | |
| | | | | | | | |
| | | | | | | 17,274,494 | |
| | | | | | | | |
|
| Biotechnology—0.4% | |
Amgen, Inc.
4.400%, 05/01/45 | | | 1,323,000 | | | | 1,240,506 | |
See accompanying notes to financial statements.
BHFTII-12
Brighthouse Funds Trust II
BlackRock Bond Income Portfolio
Schedule of Investments as of December 31, 2018
Corporate Bonds & Notes—(Continued)
| | | | | | | | |
| Security Description | | Principal
Amount* | | | Value | |
|
| Biotechnology—(Continued) | |
Baxalta, Inc.
5.250%, 06/23/45 | | | 268,000 | | | $ | 271,991 | |
Celgene Corp.
3.250%, 08/15/22 | | | 1,160,000 | | | | 1,138,811 | |
3.250%, 02/20/23 | | | 1,910,000 | | | | 1,864,917 | |
3.550%, 08/15/22 | | | 1,130,000 | | | | 1,117,532 | |
3.950%, 10/15/20 | | | 240,000 | | | | 242,537 | |
Gilead Sciences, Inc.
2.500%, 09/01/23 | | | 1,047,000 | | | | 1,009,965 | |
3.700%, 04/01/24 | | | 2,205,000 | | | | 2,201,159 | |
4.000%, 09/01/36 | | | 755,000 | | | | 689,021 | |
4.150%, 03/01/47 | | | 862,000 | | | | 795,148 | |
4.500%, 02/01/45 | | | 547,000 | | | | 526,753 | |
4.600%, 09/01/35 | | | 419,000 | | | | 423,466 | |
5.650%, 12/01/41 | | | 1,190,000 | | | | 1,316,231 | |
| | | | | | | | |
| | | | | | | 12,838,037 | |
| | | | | | | | |
|
| Building Materials—0.0% | |
Johnson Controls International plc
5.125%, 09/14/45 | | | 500,000 | | | | 497,486 | |
LafargeHolcim Finance U.S. LLC
4.750%, 09/22/46 (144A) | | | 1,290,000 | | | | 1,121,746 | |
| | | | | | | | |
| | | | | | | 1,619,232 | |
| | | | | | | | |
|
| Chemicals—0.4% | |
Air Liquide Finance S.A.
2.500%, 09/27/26 (144A) | | | 560,000 | | | | 515,039 | |
Cydsa S.A.B. de C.V.
6.250%, 10/04/27 (144A) | | | 840,000 | | | | 754,950 | |
Dow Chemical Co. (The)
4.375%, 11/15/42 | | | 280,000 | | | | 246,018 | |
4.625%, 10/01/44 | | | 755,000 | | | | 683,783 | |
9.000%, 04/01/21 | | | 1,125,000 | | | | 1,247,447 | |
DowDuPont, Inc.
4.493%, 11/15/25 | | | 5,270,000 | | | | 5,428,313 | |
5.419%, 11/15/48 | | | 2,880,000 | | | | 2,996,103 | |
Petkim Petrokimya Holding A/S
5.875%, 01/26/23 (144A) | | | 526,000 | | | | 477,328 | |
SABIC Capital II B.V.
4.000%, 10/10/23 (144A) | | | 527,000 | | | | 524,365 | |
| Sherwin-Williams Co. (The) | |
4.000%, 12/15/42 | | | 240,000 | | | | 202,043 | |
4.500%, 06/01/47 | | | 565,000 | | | | 510,185 | |
| | | | | | | | |
| | | | | | | 13,585,574 | |
| | | | | | | | |
|
| Commercial Services—0.2% | |
Boston University
4.061%, 10/01/48 | | | 693,000 | | | | 696,175 | |
George Washington University (The)
4.126%, 09/15/48 | | | 1,328,000 | | | | 1,330,886 | |
S&P Global, Inc.
4.000%, 06/15/25 | | | 300,000 | | | | 305,604 | |
Total System Services, Inc.
3.750%, 06/01/23 | | | 595,000 | | | | 590,124 | |
|
| Commercial Services—(Continued) | |
Total System Services, Inc.
3.800%, 04/01/21 | | | 550,000 | | | | 549,871 | |
4.800%, 04/01/26 | | | 2,815,000 | | | | 2,838,211 | |
University of Notre Dame du Lac
3.394%, 02/15/48 | | | 800,000 | | | | 757,232 | |
University of Southern California
3.028%, 10/01/39 | | | 115,000 | | | | 104,411 | |
Wesleyan University
4.781%, 07/01/2116 | | | 938,000 | | | | 960,997 | |
| | | | | | | | |
| | | | | | | 8,133,511 | |
| | | | | | | | |
|
| Computers—0.5% | |
Apple, Inc.
2.700%, 05/13/22 | | | 1,490,000 | | | | 1,473,327 | |
2.850%, 05/11/24 | | | 4,515,000 | | | | 4,402,883 | |
3.000%, 02/09/24 | | | 1,525,000 | | | | 1,505,934 | |
3.450%, 02/09/45 | | | 683,000 | | | | 605,660 | |
3.850%, 05/04/43 | | | 1,990,000 | | | | 1,894,193 | |
4.500%, 02/23/36 | | | 280,000 | | | | 296,901 | |
4.650%, 02/23/46 | | | 1,671,000 | | | | 1,776,898 | |
Dell International LLC / EMC Corp.
8.350%, 07/15/46 (144A) | | | 326,000 | | | | 353,340 | |
DXC Technology Co.
2.875%, 03/27/20 | | | 1,279,000 | | | | 1,267,781 | |
IBM Credit LLC
3.450%, 11/30/20 | | | 1,370,000 | | | | 1,376,209 | |
International Business Machines Corp.
2.900%, 11/01/21 | | | 592,000 | | | | 583,962 | |
Seagate HDD Cayman
4.250%, 03/01/22 | | | 665,000 | | | | 635,501 | |
| | | | | | | | |
| | | | | | | 16,172,589 | |
| | | | | | | | |
|
| Diversified Financial Services—0.9% | |
AerCap Ireland Capital DAC / AerCap Global Aviation Trust
4.500%, 05/15/21 | | | 1,215,000 | | | | 1,218,461 | |
4.625%, 10/30/20 | | | 3,530,000 | | | | 3,553,959 | |
Air Lease Corp.
2.625%, 07/01/22 | | | 1,535,000 | | | | 1,454,960 | |
Alpha Holding S.A. de C.V.
10.000%, 12/19/22 (144A) | | | 253,000 | | | | 184,690 | |
American Express Co.
3.700%, 11/05/21 | | | 2,175,000 | | | | 2,194,444 | |
3.700%, 08/03/23 | | | 1,295,000 | | | | 1,298,664 | |
American Express Credit Corp.
2.250%, 08/15/19 | | | 1,959,000 | | | | 1,950,130 | |
Capital One Financial Corp.
2.400%, 10/30/20 | | | 2,166,000 | | | | 2,120,146 | |
3.450%, 04/30/21 | | | 1,510,000 | | | | 1,506,847 | |
3.750%, 03/09/27 | | | 680,000 | | | | 631,922 | |
CME Group, Inc.
3.750%, 06/15/28 | | | 85,000 | | | | 86,193 | |
Credivalores-Crediservicios SAS
9.750%, 07/27/22 (144A) | | | 655,000 | | | | 569,850 | |
Discover Financial Services
4.100%, 02/09/27 | | | 1,108,000 | | | | 1,034,941 | |
See accompanying notes to financial statements.
BHFTII-13
Brighthouse Funds Trust II
BlackRock Bond Income Portfolio
Schedule of Investments as of December 31, 2018
Corporate Bonds & Notes—(Continued)
| | | | | | | | |
| Security Description | | Principal
Amount* | | | Value | |
|
| Diversified Financial Services—(Continued) | |
Docuformas SAPI de C.V.
9.250%, 10/11/22 (144A) | | | 320,000 | | | $ | 283,200 | |
GE Capital International Funding Co.
4.418%, 11/15/35 | | | 3,000,000 | | | | 2,523,921 | |
Intercontinental Exchange, Inc.
3.450%, 09/21/23 | | | 930,000 | | | | 934,669 | |
3.750%, 09/21/28 | | | 355,000 | | | | 355,332 | |
4.000%, 10/15/23 | | | 1,495,000 | | | | 1,530,227 | |
Nuveen LLC
4.000%, 11/01/28 (144A) | | | 915,000 | | | | 943,426 | |
Synchrony Financial
2.600%, 01/15/19 | | | 1,706,000 | | | | 1,705,419 | |
2.700%, 02/03/20 | | | 1,079,000 | | | | 1,060,549 | |
Tarjeta Naranja S.A.
52.292%, BADLAR + 3.500%, 04/11/22 (144A) (b) | | | 1,016,000 | | | | 406,400 | |
Unifin Financiera S.A.B. de C.V.
7.250%, 09/27/23 (144A) | | | 251,000 | | | | 231,166 | |
8.875%, 5Y H15 + 6.308%, 01/29/25 (144A) (b) | | | 384,000 | | | | 316,800 | |
Visa, Inc.
3.150%, 12/14/25 | | | 1,300,000 | | | | 1,278,116 | |
4.150%, 12/14/35 | | | 876,000 | | | | 906,925 | |
4.300%, 12/14/45 | | | 645,000 | | | | 671,084 | |
| | | | | | | | |
| | | | | | | 30,952,441 | |
| | | | | | | | |
|
| Electric—2.0% | |
AEP Texas, Inc.
3.950%, 06/01/28 (144A) | | | 2,490,000 | | | | 2,495,202 | |
AEP Transmission Co. LLC
4.250%, 09/15/48 | | | 1,400,000 | | | | 1,412,732 | |
AES Panama SRL
6.000%, 06/25/22 (144A) | | | 213,000 | | | | 214,331 | |
Alabama Power Co.
3.750%, 03/01/45 | | | 190,000 | | | | 175,488 | |
4.150%, 08/15/44 | | | 240,000 | | | | 235,125 | |
4.300%, 07/15/48 | | | 1,335,000 | | | | 1,339,108 | |
Alliant Energy Finance LLC
3.750%, 06/15/23 (144A) | | | 525,000 | | | | 528,207 | |
Ameren Illinois Co.
3.800%, 05/15/28 | | | 1,090,000 | | | | 1,109,497 | |
Baltimore Gas & Electric Co.
3.500%, 08/15/46 | | | 805,000 | | | | 710,927 | |
3.750%, 08/15/47 | | | 715,000 | | | | 656,624 | |
4.250%, 09/15/48 | | | 680,000 | | | | 676,281 | |
CenterPoint Energy Houston Electric LLC
3.550%, 08/01/42 | | | 560,000 | | | | 510,131 | |
3.950%, 03/01/48 | | | 440,000 | | | | 428,147 | |
Consumers Energy Co.
4.050%, 05/15/48 | | | 390,000 | | | | 385,149 | |
DTE Electric Co.
4.050%, 05/15/48 | | | 1,745,000 | | | | 1,731,725 | |
DTE Energy Co.
3.700%, 08/01/23 | | | 820,000 | | | | 814,208 | |
| Duke Energy Carolinas LLC | |
3.700%, 12/01/47 | | | 715,000 | | | | 650,401 | |
3.950%, 11/15/28 | | | 1,625,000 | | | | 1,665,557 | |
|
| Electric—(Continued) | |
Duke Energy Corp.
3.750%, 09/01/46 | | | 2,280,000 | | | | 1,974,019 | |
4.800%, 12/15/45 | | | 215,000 | | | | 219,269 | |
Duke Energy Florida LLC
3.800%, 07/15/28 | | | 815,000 | | | | 822,123 | |
4.200%, 07/15/48 | | | 570,000 | | | | 568,384 | |
Duke Energy Progress LLC
3.000%, 09/15/21 | | | 480,000 | | | | 480,667 | |
3.250%, 08/15/25 | | | 1,145,000 | | | | 1,114,698 | |
3.700%, 09/01/28 | | | 2,905,000 | | | | 2,936,307 | |
Electricite de France S.A.
4.500%, 09/21/28 (144A) | | | 1,370,000 | | | | 1,328,661 | |
Emera U.S. Finance L.P.
2.150%, 06/15/19 | | | 2,058,000 | | | | 2,041,181 | |
Entergy Corp.
2.950%, 09/01/26 | | | 350,000 | | | | 323,073 | |
Entergy Louisiana LLC
4.200%, 09/01/48 | | | 1,570,000 | | | | 1,551,771 | |
5.400%, 11/01/24 | | | 405,000 | | | | 445,151 | |
Exelon Corp.
2.450%, 04/15/21 | | | 549,000 | | | | 536,923 | |
4.450%, 04/15/46 | | | 2,800,000 | | | | 2,666,617 | |
4.950%, 06/15/35 | | | 501,000 | | | | 504,819 | |
FirstEnergy Transmission LLC
4.350%, 01/15/25 (144A) | | | 3,915,000 | | | | 3,957,520 | |
Florida Power & Light Co.
3.950%, 03/01/48 | | | 1,278,000 | | | | 1,250,037 | |
4.125%, 06/01/48 | | | 1,320,000 | | | | 1,325,353 | |
Generacion Mediterranea S.A. / Generacion Frias S.A. / Central Termica Roca S.A.
9.625%, 07/27/23 (144A) (f) | | | 1,182,000 | | | | 995,847 | |
Genneia S.A.
8.750%, 01/20/22 (144A) | | | 1,216,000 | | | | 1,097,440 | |
Inkia Energy, Ltd.
5.875%, 11/09/27 (144A) | | | 349,000 | | | | 323,265 | |
Kansas City Power & Light Co.
4.200%, 03/15/48 | | | 1,350,000 | | | | 1,311,239 | |
Mid-Atlantic Interstate Transmission LLC
4.100%, 05/15/28 (144A) | | | 575,000 | | | | 571,249 | |
MidAmerican Energy Co.
4.400%, 10/15/44 | | | 837,000 | | | | 863,496 | |
Northern States Power Co.
3.400%, 08/15/42 | | | 1,370,000 | | | | 1,236,398 | |
4.000%, 08/15/45 | | | 780,000 | | | | 761,207 | |
4.200%, 09/01/48 | | | 630,000 | | | | 620,559 | |
Ohio Power Co.
6.600%, 02/15/33 | | | 955,000 | | | | 1,193,169 | |
Oncor Electric Delivery Co. LLC
4.550%, 12/01/41 | | | 970,000 | | | | 1,012,650 | |
Orazul Energy Egenor S. en C. por A.
5.625%, 04/28/27 (144A) | | | 549,000 | | | | 485,179 | |
Pacific Gas & Electric Co.
6.050%, 03/01/34 | | | 650,000 | | | | 602,953 | |
PacifiCorp
4.125%, 01/15/49 | | | 475,000 | | | | 468,146 | |
See accompanying notes to financial statements.
BHFTII-14
Brighthouse Funds Trust II
BlackRock Bond Income Portfolio
Schedule of Investments as of December 31, 2018
Corporate Bonds & Notes—(Continued)
| | | | | | | | |
| Security Description | | Principal
Amount* | | | Value | |
|
| Electric—(Continued) | |
Public Service Electric & Gas Co.
3.650%, 09/01/28 | | | 1,780,000 | | | $ | 1,803,327 | |
Southern Co. (The)
4.400%, 07/01/46 | | | 2,085,000 | | | | 1,919,678 | |
Southwestern Electric Power Co.
4.100%, 09/15/28 | | | 910,000 | | | | 912,728 | |
Stoneway Capital Corp.
10.000%, 03/01/27 (144A) | | | 1,630,440 | | | | 1,465,358 | |
10.000%, 03/01/27 | | | 635,024 | | | | 570,727 | |
Tampa Electric Co.
2.600%, 09/15/22 | | | 700,000 | | | | 678,583 | |
4.300%, 06/15/48 | | | 260,000 | | | | 248,807 | |
4.450%, 06/15/49 | | | 680,000 | | | | 663,879 | |
Trans-Allegheny Interstate Line Co.
3.850%, 06/01/25 (144A) | | | 1,975,000 | | | | 1,967,512 | |
Virginia Electric & Power Co.
2.750%, 03/15/23 | | | 2,130,000 | | | | 2,077,323 | |
3.500%, 03/15/27 | | | 2,495,000 | | | | 2,458,486 | |
4.000%, 01/15/43 | | | 1,650,000 | | | | 1,567,372 | |
4.000%, 11/15/46 | | | 1,050,000 | | | | 994,597 | |
4.200%, 05/15/45 | | | 250,000 | | | | 242,850 | |
4.450%, 02/15/44 | | | 287,000 | | | | 288,981 | |
4.600%, 12/01/48 | | | 160,000 | | | | 167,122 | |
WEC Energy Group, Inc.
3.375%, 06/15/21 | | | 390,000 | | | | 389,740 | |
| | | | | | | | |
| | | | | | | 69,745,280 | |
| | | | | | | | |
|
| Electronics—0.1% | |
Corning, Inc.
4.375%, 11/15/57 | | | 2,760,000 | | | | 2,309,604 | |
Honeywell International, Inc.
3.812%, 11/21/47 | | | 495,000 | | | | 470,611 | |
Tyco Electronics Group S.A.
3.125%, 08/15/27 | | | 645,000 | | | | 596,967 | |
3.450%, 08/01/24 | | | 300,000 | | | | 291,980 | |
| | | | | | | | |
| | | | | | | 3,669,162 | |
| | | | | | | | |
|
| Engineering & Construction—0.0% | |
Aeropuerto Internacional de Tocumen S.A.
5.625%, 05/18/36 (144A) | | | 276,000 | | | | 280,485 | |
Aeropuertos Argentina S.A.
6.875%, 02/01/27 (144A) | | | 539,000 | | | | 497,228 | |
Aeropuertos Dominicanos Siglo S.A.
6.750%, 03/30/29 (144A) | | | 279,000 | | | | 268,014 | |
Mexico City Airport Trust
4.250%, 10/31/26 (144A) | | | 505,000 | | | | 450,081 | |
| | | | | | | | |
| | | | | | | 1,495,808 | |
| | | | | | | | |
|
| Environmental Control—0.1% | |
Republic Services, Inc.
2.900%, 07/01/26 | | | 750,000 | | | | 707,792 | |
3.950%, 05/15/28 | | | 955,000 | | | | 956,198 | |
4.750%, 05/15/23 | | | 510,000 | | | | 533,804 | |
|
| Environmental Control—(Continued) | |
Waste Management, Inc.
3.900%, 03/01/35 | | | 967,000 | | | | 939,482 | |
| | | | | | | | |
| | | | | | | 3,137,276 | |
| | | | | | | | |
|
| Food—0.3% | |
Campbell Soup Co.
8.875%, 05/01/21 | | | 680,000 | | | | 751,630 | |
Conagra Brands, Inc.
3.800%, 10/22/21 | | | 455,000 | | | | 455,140 | |
General Mills, Inc.
3.200%, 04/16/21 | | | 890,000 | | | | 885,313 | |
4.000%, 04/17/25 | | | 983,000 | | | | 967,831 | |
Kroger Co. (The)
2.650%, 10/15/26 | | | 2,415,000 | | | | 2,149,638 | |
MARB BondCo plc
6.875%, 01/19/25 (144A) | | | 1,529,000 | | | | 1,417,016 | |
Marfrig Holdings Europe B.V.
8.000%, 06/08/23 (144A) | | | 512,000 | | | | 513,280 | |
| Tyson Foods, Inc. | |
3.550%, 06/02/27 (f) | | | 1,420,000 | | | | 1,323,190 | |
3.900%, 09/28/23 | | | 225,000 | | | | 224,672 | |
3.950%, 08/15/24 | | | 1,745,000 | | | | 1,734,750 | |
5.100%, 09/28/48 | | | 200,000 | | | | 192,174 | |
| | | | | | | | |
| | | | | | | 10,614,634 | |
| | | | | | | | |
|
| Forest Products & Paper—0.1% | |
Eldorado Intl. Finance GmbH
8.625%, 06/16/21 (144A) | | | 609,000 | | | | 631,076 | |
Georgia-Pacific LLC
3.734%, 07/15/23 (144A) | | | 800,000 | | | | 807,566 | |
5.400%, 11/01/20 (144A) | | | 935,000 | | | | 968,639 | |
7.375%, 12/01/25 | | | 935,000 | | | | 1,127,970 | |
Klabin Finance S.A.
4.875%, 09/19/27 (144A) | | | 1,024,000 | | | | 929,280 | |
Suzano Austria GmbH
6.000%, 01/15/29 (144A) | | | 881,000 | | | | 899,061 | |
| | | | | | | | |
| | | | | | | 5,363,592 | |
| | | | | | | | |
|
| Gas—0.1% | |
NiSource, Inc.
2.650%, 11/17/22 | | | 240,000 | | | | 229,759 | |
3.490%, 05/15/27 | | | 1,825,000 | | | | 1,742,471 | |
| | | | | | | | |
| | | | | | | 1,972,230 | |
| | | | | | | | |
|
| Healthcare-Products—0.7% | |
Abbott Laboratories
3.400%, 11/30/23 | | | 350,000 | | | | 348,909 | |
3.750%, 11/30/26 | | | 3,109,000 | | | | 3,072,066 | |
Baxter International, Inc.
1.700%, 08/15/21 | | | 140,000 | | | | 134,310 | |
Becton Dickinson & Co.
2.133%, 06/06/19 | | | 1,630,000 | | | | 1,620,510 | |
2.675%, 12/15/19 | | | 2,345,000 | | | | 2,322,737 | |
2.894%, 06/06/22 | | | 3,240,000 | | | | 3,137,853 | |
3.300%, 03/01/23 | | | 1,420,000 | | | | 1,395,020 | |
See accompanying notes to financial statements.
BHFTII-15
Brighthouse Funds Trust II
BlackRock Bond Income Portfolio
Schedule of Investments as of December 31, 2018
Corporate Bonds & Notes—(Continued)
| | | | | | | | |
| Security Description | | Principal
Amount* | | | Value | |
|
| Healthcare-Products—(Continued) | |
Becton Dickinson & Co.
4.685%, 12/15/44 | | | 367,000 | | | $ | 343,941 | |
Covidien International Finance S.A.
2.950%, 06/15/23 | | | 870,000 | | | | 851,760 | |
Edwards Lifesciences Corp.
4.300%, 06/15/28 | | | 485,000 | | | | 490,642 | |
Medtronic, Inc.
3.500%, 03/15/25 | | | 1,650,000 | | | | 1,644,192 | |
4.375%, 03/15/35 | | | 3,410,000 | | | | 3,494,877 | |
Thermo Fisher Scientific, Inc.
2.950%, 09/19/26 | | | 2,425,000 | | | | 2,239,089 | |
3.000%, 04/15/23 | | | 860,000 | | | | 836,634 | |
4.150%, 02/01/24 | | | 1,995,000 | | | | 2,020,756 | |
4.500%, 03/01/21 | | | 1,720,000 | | | | 1,757,851 | |
| | | | | | | | |
| | | | | | | 25,711,147 | |
| | | | | | | | |
|
| Healthcare-Services—0.7% | |
| Aetna, Inc. | |
4.125%, 11/15/42 | | | 475,000 | | | | 411,724 | |
4.500%, 05/15/42 | | | 881,000 | | | | 818,880 | |
4.750%, 03/15/44 | | | 690,000 | | | | 659,175 | |
AHS Hospital Corp.
5.024%, 07/01/45 | | | 490,000 | | | | 544,993 | |
Anthem, Inc.
3.500%, 08/15/24 | | | 290,000 | | | | 284,432 | |
4.101%, 03/01/28 | | | 905,000 | | | | 887,547 | |
Baylor Scott & White Holdings
4.185%, 11/15/45 | | | 775,000 | | | | 764,990 | |
Catholic Health Initiatives
4.350%, 11/01/42 | | | 550,000 | | | | 498,119 | |
Cigna Holding Co.
3.250%, 04/15/25 | | | 2,382,000 | | | | 2,267,412 | |
Dignity Health
2.637%, 11/01/19 | | | 1,319,000 | | | | 1,311,314 | |
| Kaiser Foundation Hospitals | |
3.500%, 04/01/22 | | | 1,288,000 | | | | 1,309,419 | |
4.150%, 05/01/47 | | | 383,000 | | | | 378,830 | |
Laboratory Corp. of America Holdings
2.625%, 02/01/20 | | | 1,583,000 | | | | 1,571,819 | |
Mercy Healthcare System
4.302%, 07/01/28 | | | 505,000 | | | | 515,449 | |
Montefiore Obligated Group
5.246%, 11/01/48 | | | 1,089,000 | | | | 1,055,625 | |
Ochsner Clinic Foundation
5.897%, 05/15/45 | | | 638,000 | | | | 773,444 | |
PeaceHealth Obligated Group
4.787%, 11/15/48 | | | 894,000 | | | | 946,445 | |
Providence St Joseph Health Obligated Group
3.930%, 10/01/48 | | | 887,000 | | | | 846,182 | |
Southern Baptist Hospital of Florida, Inc.
4.857%, 07/15/45 | | | 650,000 | | | | 708,357 | |
SSM Health Care Corp.
3.688%, 06/01/23 | | | 953,000 | | | | 961,686 | |
Sutter Health
3.695%, 08/15/28 | | | 1,045,000 | | | | 1,048,509 | |
|
| Healthcare-Services—(Continued) | |
Trinity Health Corp.
4.125%, 12/01/45 | | | 502,000 | | | | 477,640 | |
UnitedHealth Group, Inc.
3.100%, 03/15/26 | | | 590,000 | | | | 569,684 | |
3.700%, 12/15/25 | | | 1,055,000 | | | | 1,066,035 | |
3.750%, 07/15/25 | | | 1,730,000 | | | | 1,752,011 | |
3.750%, 10/15/47 | | | 1,050,000 | | | | 962,371 | |
3.850%, 06/15/28 | | | 450,000 | | | | 455,185 | |
4.200%, 01/15/47 | | | 790,000 | | | | 786,102 | |
4.450%, 12/15/48 | | | 335,000 | | | | 345,332 | |
4.625%, 07/15/35 | | | 377,000 | | | | 400,575 | |
| | | | | | | | |
| | | | | | | 25,379,286 | |
| | | | | | | | |
|
| Holding Companies-Diversified—0.0% | |
Grupo KUO S.A.B. de C.V.
5.750%, 07/07/27 (144A) | | | 1,068,000 | | | | 968,142 | |
| | | | | | | | |
|
| Household Products/Wares—0.0% | |
Controladora Mabe S.A. de C.V.
5.600%, 10/23/28 (144A) | | | 843,000 | | | | 791,156 | |
| | | | | | | | |
|
| Insurance—0.5% | |
Ambac Assurance Corp.
5.100%, 06/07/20 (144A) | | | 162,922 | | | | 216,686 | |
Ambac LSNI LLC
7.803%, 3M LIBOR + 5.000%, 02/12/23 (144A) (b) | | | 1,002,619 | | | | 1,003,873 | |
Aon Corp.
4.500%, 12/15/28 | | | 2,175,000 | | | | 2,203,119 | |
Aon plc
4.750%, 05/15/45 | | | 485,000 | | | | 476,517 | |
AXA Equitable Holdings, Inc.
3.900%, 04/20/23 (144A) | | | 260,000 | | | | 256,763 | |
5.000%, 04/20/48 (144A) | | | 780,000 | | | | 684,439 | |
Hartford Financial Services Group, Inc. (The)
4.300%, 04/15/43 | | | 325,000 | | | | 302,312 | |
Marsh & McLennan Cos., Inc.
3.500%, 06/03/24 | | | 2,605,000 | | | | 2,565,825 | |
3.500%, 03/10/25 | | | 880,000 | | | | 864,849 | |
3.750%, 03/14/26 | | | 94,000 | | | | 92,936 | |
4.050%, 10/15/23 | | | 680,000 | | | | 689,897 | |
4.200%, 03/01/48 (f) | | | 1,215,000 | | | | 1,105,092 | |
4.350%, 01/30/47 | | | 191,000 | | | | 178,365 | |
Principal Financial Group, Inc.
4.300%, 11/15/46 | | | 360,000 | | | | 331,687 | |
Prudential Financial, Inc.
3.878%, 03/27/28 | | | 2,120,000 | | | | 2,131,756 | |
Travelers Cos., Inc. (The)
4.600%, 08/01/43 | | | 945,000 | | | | 981,106 | |
Trinity Acquisition plc
4.400%, 03/15/26 | | | 515,000 | | | | 512,008 | |
Willis North America, Inc.
3.600%, 05/15/24 | | | 2,565,000 | | | | 2,504,182 | |
| | | | | | | | |
| | | | | | | 17,101,412 | |
| | | | | | | | |
See accompanying notes to financial statements.
BHFTII-16
Brighthouse Funds Trust II
BlackRock Bond Income Portfolio
Schedule of Investments as of December 31, 2018
Corporate Bonds & Notes—(Continued)
| | | | | | | | |
| Security Description | | Principal
Amount* | | | Value | |
|
| Internet—0.1% | |
Alibaba Group Holding, Ltd.
3.600%, 11/28/24 (f) | | | 1,400,000 | | | $ | 1,369,364 | |
Baidu, Inc.
4.375%, 05/14/24 | | | 915,000 | | | | 922,527 | |
| | | | | | | | |
| | | | | | | 2,291,891 | |
| | | | | | | | |
|
| Iron/Steel—0.1% | |
Nucor Corp.
5.200%, 08/01/43 | | | 585,000 | | | | 621,169 | |
Samarco Mineracao S.A.
4.125%, 11/01/22 | | | 602,000 | | | | 454,510 | |
Steel Dynamics, Inc.
5.125%, 10/01/21 | | | 1,086,000 | | | | 1,084,642 | |
| | | | | | | | |
| | | | | | | 2,160,321 | |
| | | | | | | | |
|
| Media—1.7% | |
Cablevision S.A.
6.500%, 06/15/21 (144A) | | | 227,000 | | | | 218,771 | |
CBS Corp.
2.300%, 08/15/19 | | | 2,077,000 | | | | 2,061,626 | |
Charter Communications Operating LLC / Charter Communications Operating Capital Corp.
3.579%, 07/23/20 | | | 6,710,000 | | | | 6,701,670 | |
4.500%, 02/01/24 | | | 2,115,000 | | | | 2,111,645 | |
4.908%, 07/23/25 | | | 2,902,000 | | | | 2,884,317 | |
5.750%, 04/01/48 | | | 1,940,000 | | | | 1,818,841 | |
6.384%, 10/23/35 | | | 3,898,000 | | | | 4,004,683 | |
Comcast Corp.
3.150%, 03/01/26 | | | 2,980,000 | | | | 2,852,719 | |
3.200%, 07/15/36 | | | 4,806,000 | | | | 4,138,874 | |
3.300%, 10/01/20 | | | 4,085,000 | | | | 4,099,872 | |
3.375%, 02/15/25 | | | 290,000 | | | | 284,156 | |
3.400%, 07/15/46 | | | 2,495,000 | | | | 2,070,352 | |
4.150%, 10/15/28 | | | 1,405,000 | | | | 1,427,557 | |
4.250%, 10/15/30 | | | 1,135,000 | | | | 1,148,649 | |
4.400%, 08/15/35 | | | 1,001,000 | | | | 969,358 | |
4.950%, 10/15/58 | | | 785,000 | | | | 799,303 | |
COX Communications, Inc.
3.150%, 08/15/24 (144A) | | | 4,170,000 | | | | 4,011,248 | |
Discovery Communications LLC
3.800%, 03/13/24 | | | 1,616,000 | | | | 1,576,350 | |
3.950%, 06/15/25 (144A) | | | 1,230,000 | | | | 1,182,021 | |
4.375%, 06/15/21 | | | 1,370,000 | | | | 1,394,095 | |
5.200%, 09/20/47 | | | 435,000 | | | | 402,189 | |
NBCUniversal Enterprise, Inc.
5.250%, 03/19/21 (144A) (f) | | | 2,305,000 | | | | 2,333,813 | |
NBCUniversal Media LLC
4.450%, 01/15/43 | | | 915,000 | | | | 883,127 | |
Time Warner Cable LLC
4.125%, 02/15/21 | | | 2,130,000 | | | | 2,139,407 | |
4.500%, 09/15/42 | | | 161,000 | | | | 129,581 | |
5.000%, 02/01/20 | | | 1,055,000 | | | | 1,069,674 | |
5.500%, 09/01/41 | | | 588,000 | | | | 520,276 | |
Viacom, Inc.
6.875%, 04/30/36 | | | 850,000 | | | | 913,022 | |
|
| Media—(Continued) | |
Warner Media LLC
2.100%, 06/01/19 | | | 3,352,000 | | | | 3,336,421 | |
3.600%, 07/15/25 | | | 820,000 | | | | 776,988 | |
4.650%, 06/01/44 | | | 440,000 | | | | 385,561 | |
4.850%, 07/15/45 | | | 1,980,000 | | | | 1,771,682 | |
| | | | | | | | |
| | | | | | | 60,417,848 | |
| | | | | | | | |
|
| Mining—0.2% | |
Anglo American Capital plc
3.625%, 09/11/24 (144A) | | | 2,075,000 | | | | 1,958,573 | |
Barrick Gold Corp.
5.250%, 04/01/42 | | | 720,000 | | | | 720,419 | |
BHP Billiton Finance USA, Ltd.
5.000%, 09/30/43 | | | 760,000 | | | | 828,132 | |
Largo Resources, Ltd.
9.250%, 06/01/21 (144A) | | | 96,000 | | | | 100,920 | |
Newmont Mining Corp.
3.500%, 03/15/22 | | | 2,740,000 | | | | 2,711,283 | |
| | | | | | | | |
| | | | | | | 6,319,327 | |
| | | | | | | | |
|
| Miscellaneous Manufacturing—0.0% | |
Eaton Corp.
2.750%, 11/02/22 | | | 1,285,000 | | | | 1,249,715 | |
General Electric Co.
4.500%, 03/11/44 | | | 599,000 | | | | 489,128 | |
| | | | | | | | |
| | | | | | | 1,738,843 | |
| | | | | | | | |
|
| Oil & Gas—1.8% | |
Anadarko Petroleum Corp.
Zero Coupon, 10/10/36 (m) | | | 2,000,000 | | | | 835,379 | |
6.200%, 03/15/40 | | | 1,690,000 | | | | 1,750,668 | |
Apache Corp.
2.625%, 01/15/23 | | | 985,000 | | | | 930,382 | |
4.750%, 04/15/43 (f) | | | 2,090,000 | | | | 1,794,363 | |
5.100%, 09/01/40 | | | 720,000 | | | | 646,181 | |
BP Capital Markets America, Inc.
3.790%, 02/06/24 | | | 1,190,000 | | | | 1,202,758 | |
Cimarex Energy Co.
3.900%, 05/15/27 (f) | | | 1,790,000 | | | | 1,661,923 | |
4.375%, 06/01/24 | | | 2,595,000 | | | | 2,580,367 | |
Concho Resources, Inc.
3.750%, 10/01/27 | | | 3,130,000 | | | | 2,948,158 | |
4.375%, 01/15/25 | | | 1,535,000 | | | | 1,516,747 | |
Continental Resources, Inc.
3.800%, 06/01/24 | | | 1,515,000 | | | | 1,434,100 | |
4.500%, 04/15/23 (f) | | | 5,340,000 | | | | 5,255,202 | |
5.000%, 09/15/22 | | | 3,056,000 | | | | 3,034,165 | |
Devon Energy Corp.
4.000%, 07/15/21 | | | 885,000 | | | | 885,840 | |
EOG Resources, Inc.
3.900%, 04/01/35 | | | 275,000 | | | | 259,900 | |
4.150%, 01/15/26 | | | 537,000 | | | | 551,417 | |
Exxon Mobil Corp.
1.819%, 03/15/19 | | | 3,300,000 | | | | 3,293,920 | |
See accompanying notes to financial statements.
BHFTII-17
Brighthouse Funds Trust II
BlackRock Bond Income Portfolio
Schedule of Investments as of December 31, 2018
Corporate Bonds & Notes—(Continued)
| | | | | | | | |
| Security Description | | Principal
Amount* | | | Value | |
|
| Oil & Gas—(Continued) | |
Frontera Energy Corp.
9.700%, 06/25/23 (144A) | | | 603,000 | | | $ | 594,709 | |
Hess Corp.
5.800%, 04/01/47 | | | 740,000 | | | | 665,432 | |
Marathon Oil Corp.
2.700%, 06/01/20 | | | 2,850,000 | | | | 2,807,470 | |
Marathon Petroleum Corp.
4.750%, 12/15/23 (144A) | | | 4,910,000 | | | | 5,037,806 | |
5.125%, 03/01/21 | | | 3,285,000 | | | | 3,380,260 | |
5.850%, 12/15/45 | | | 660,000 | | | | 652,393 | |
Odebrecht Drilling Norbe VIII/IX, Ltd.
6.350%, 12/01/21 (144A) | | | 375,720 | | | | 360,879 | |
Odebrecht Offshore Drilling Finance, Ltd.
6.720%, 12/01/22 (144A) | | | 359,806 | | | | 334,169 | |
7.720%, PIK, 12/01/26 (144A) (h) | | | 12,144 | | | | 3,157 | |
Petrobras Global Finance B.V.
5.999%, 01/27/28 | | | 877,000 | | | | 825,704 | |
7.375%, 01/17/27 | | | 1,641,000 | | | | 1,686,127 | |
8.750%, 05/23/26 | | | 877,000 | | | | 983,555 | |
Pioneer Natural Resources Co.
3.950%, 07/15/22 | | | 270,000 | | | | 270,789 | |
4.450%, 01/15/26 | | | 3,373,000 | | | | 3,407,095 | |
Puma International Financing S.A.
5.000%, 01/24/26 (144A) | | | 806,000 | | | | 624,715 | |
5.125%, 10/06/24 (144A) | | | 200,000 | | | | 159,676 | |
Resolute Energy Corp.
8.500%, 05/01/20 | | | 2,260,000 | | | | 2,226,100 | |
Shell International Finance B.V.
2.250%, 01/06/23 | | | 2,775,000 | | | | 2,668,524 | |
3.250%, 05/11/25 | | | 760,000 | | | | 749,724 | |
3.625%, 08/21/42 | | | 640,000 | | | | 580,941 | |
4.125%, 05/11/35 | | | 421,000 | | | | 421,972 | |
Tecpetrol S.A.
4.875%, 12/12/22 (144A) | | | 333,000 | | | | 306,360 | |
Valero Energy Corp.
3.400%, 09/15/26 | | | 939,000 | | | | 860,468 | |
3.650%, 03/15/25 | | | 1,471,000 | | | | 1,404,365 | |
YPF S.A. | | | | | | | | |
8.750%, 04/04/24 (144A) | | | 345,000 | | | | 324,300 | |
8.750%, 04/04/24 | | | 501,000 | | | | 470,940 | |
| | | | | | | | |
| | | | | | | 62,389,100 | |
| | | | | | | | |
|
| Oil & Gas Services—0.2% | |
Halliburton Co.
3.800%, 11/15/25 (f) | | | 5,625,000 | | | | 5,455,134 | |
5.000%, 11/15/45 (f) | | | 234,000 | | | | 231,705 | |
Odebrecht Oil & Gas Finance, Ltd.
Zero Coupon, 02/18/19 (144A) (m) | | | 63,301 | | | | 652 | |
Schlumberger Holdings Corp.
3.000%, 12/21/20 (144A) | | | 1,832,000 | | | | 1,815,747 | |
| | | | | | | | |
| | | | | | | 7,503,238 | |
| | | | | | | | |
|
| Packaging & Containers—0.1% | |
Reynolds Group Issuer, Inc. / Reynolds Group Issuer LLC
5.750%, 10/15/20 | | | 2,190,183 | | | | 2,184,708 | |
| | | | | | | | |
|
| Pharmaceuticals—2.0% | |
AbbVie, Inc.
2.300%, 05/14/21 | | 650,000 | | | 634,748 | |
3.600%, 05/14/25 | | | 1,595,000 | | | | 1,530,571 | |
3.750%, 11/14/23 | | | 1,170,000 | | | | 1,164,009 | |
4.250%, 11/14/28 | | | 1,035,000 | | | | 1,005,401 | |
4.400%, 11/06/42 | | | 880,000 | | | | 777,993 | |
4.500%, 05/14/35 | | | 2,365,000 | | | | 2,190,058 | |
Allergan Finance LLC
3.250%, 10/01/22 | | | 1,015,000 | | | | 992,334 | |
Allergan Funding SCS
3.450%, 03/15/22 | | | 3,840,000 | | | | 3,781,083 | |
3.800%, 03/15/25 | | | 9,838,000 | | | | 9,608,191 | |
Bayer U.S. Finance II LLC
3.375%, 07/15/24 (144A) | | | 285,000 | | | | 271,092 | |
3.600%, 07/15/42 (144A) | | | 570,000 | | | | 421,076 | |
Cigna Corp.
3.200%, 09/17/20 (144A) | | | 7,505,000 | | | | 7,472,812 | |
CVS Health Corp.
3.700%, 03/09/23 | | | 2,395,000 | | | | 2,369,225 | |
4.000%, 12/05/23 | | | 2,205,000 | | | | 2,211,160 | |
4.100%, 03/25/25 | | | 2,945,000 | | | | 2,919,154 | |
4.780%, 03/25/38 | | | 740,000 | | | | 709,883 | |
5.050%, 03/25/48 | | | 2,250,000 | | | | 2,191,280 | |
5.125%, 07/20/45 | | | 5,110,000 | | | | 4,980,400 | |
GlaxoSmithKline Capital plc
2.850%, 05/08/22 | | | 2,930,000 | | | | 2,893,277 | |
GlaxoSmithKline Capital, Inc.
3.875%, 05/15/28 | | | 840,000 | | | | 854,144 | |
Johnson & Johnson
2.450%, 03/01/26 | | | 275,000 | | | | 258,373 | |
2.625%, 01/15/25 | | | 1,455,000 | | | | 1,401,498 | |
3.625%, 03/03/37 | | | 305,000 | | | | 293,710 | |
Merck & Co., Inc.
3.600%, 09/15/42 | | | 245,000 | | | | 231,741 | |
Shire Acquisitions Investments Ireland DAC
1.900%, 09/23/19 | | | 6,480,000 | | | | 6,389,291 | |
2.400%, 09/23/21 | | | 695,000 | | | | 672,025 | |
3.200%, 09/23/26 | | | 2,784,000 | | | | 2,520,623 | |
Takeda Pharmaceutical Co., Ltd.
3.800%, 11/26/20 (144A) | | | 1,360,000 | | | | 1,367,933 | |
4.400%, 11/26/23 (144A) | | | 2,395,000 | | | | 2,421,075 | |
5.000%, 11/26/28 (144A) (f) | | | 2,170,000 | | | | 2,217,672 | |
Wyeth LLC
5.950%, 04/01/37 | | | 1,685,000 | | | | 2,030,522 | |
6.450%, 02/01/24 | | | 275,000 | | | | 314,869 | |
| | | | | | | | |
| | | | | | | 69,097,223 | |
| | | | | | | | |
See accompanying notes to financial statements.
BHFTII-18
Brighthouse Funds Trust II
BlackRock Bond Income Portfolio
Schedule of Investments as of December 31, 2018
Corporate Bonds & Notes—(Continued)
| | | | | | | | |
| Security Description | | Principal
Amount* | | | Value | |
|
| Pipelines—2.4% | |
Andeavor Logistics L.P. / Tesoro Logistics Finance Corp.
4.250%, 12/01/27 | | | 535,000 | | | $ | 505,331 | |
5.200%, 12/01/47 | | | 1,240,000 | | | | 1,117,746 | |
5.250%, 01/15/25 | | | 100,000 | | | | 101,825 | |
5.500%, 10/15/19 | | | 2,260,000 | | | | 2,279,056 | |
Buckeye Partners L.P.
4.875%, 02/01/21 | | | 3,363,000 | | | | 3,400,256 | |
Enbridge, Inc.
2.900%, 07/15/22 | | | 2,120,000 | | | | 2,051,554 | |
3.700%, 07/15/27 (f) | | | 1,690,000 | | | | 1,601,576 | |
5.500%, 3M LIBOR + 3.418%, 07/15/77 (b) | | | 1,510,000 | | | | 1,280,069 | |
Energy Transfer L.P.
4.250%, 03/15/23 | | | 4,600,000 | | | | 4,427,500 | |
5.875%, 01/15/24 | | | 2,789,000 | | | | 2,847,234 | |
Energy Transfer Operating L.P.
4.900%, 02/01/24 | | | 330,000 | | | | 334,000 | |
5.200%, 02/01/22 | | | 550,000 | | | | 564,803 | |
6.500%, 02/01/42 | | | 2,650,000 | | | | 2,647,803 | |
Energy Transfer Partners L.P. / Regency Energy Finance Corp.
4.500%, 11/01/23 | | | 2,740,000 | | | | 2,740,891 | |
5.000%, 10/01/22 (f) | | | 630,000 | | | | 642,906 | |
5.750%, 09/01/20 | | | 190,000 | | | | 194,974 | |
5.875%, 03/01/22 | | | 3,395,000 | | | | 3,532,251 | |
Enterprise Products Operating LLC
4.450%, 02/15/43 | | | 1,429,000 | | | | 1,298,376 | |
4.800%, 02/01/49 | | | 215,000 | | | | 209,151 | |
5.100%, 02/15/45 | | | 501,000 | | | | 503,452 | |
Kinder Morgan Energy Partners L.P.
5.000%, 03/01/43 | | | 360,000 | | | | 327,027 | |
5.800%, 03/15/35 | | | 585,000 | | | | 599,018 | |
6.375%, 03/01/41 | | | 260,000 | | | | 276,200 | |
Kinder Morgan, Inc.
3.050%, 12/01/19 | | | 2,040,000 | | | | 2,028,270 | |
3.150%, 01/15/23 | | | 3,310,000 | | | | 3,211,409 | |
5.050%, 02/15/46 | | | 3,185,000 | | | | 2,912,858 | |
5.550%, 06/01/45 | | | 170,000 | | | | 168,567 | |
MPLX L.P.
4.875%, 12/01/24 | | | 3,835,000 | | | | 3,903,477 | |
4.875%, 06/01/25 | | | 1,101,000 | | | | 1,110,136 | |
5.200%, 03/01/47 | | | 754,000 | | | | 694,924 | |
Northwest Pipeline LLC
4.000%, 04/01/27 | | | 2,735,000 | | | | 2,659,777 | |
Plains All American Pipeline L.P. / PAA Finance Corp.
3.650%, 06/01/22 | | | 280,000 | | | | 274,871 | |
Sabine Pass Liquefaction LLC
5.625%, 04/15/23 | | | 3,230,000 | | | | 3,402,882 | |
5.625%, 03/01/25 | | | 3,475,000 | | | | 3,610,061 | |
5.750%, 05/15/24 | | | 3,380,000 | | | | 3,542,597 | |
5.875%, 06/30/26 | | | 2,681,000 | | | | 2,839,928 | |
Spectra Energy Partners L.P.
4.500%, 03/15/45 | | | 2,060,000 | | | | 1,865,130 | |
Sunoco Logistics Partners Operations L.P.
5.400%, 10/01/47 | | | 2,610,000 | | | | 2,341,027 | |
Texas Eastern Transmission L.P.
4.150%, 01/15/48 (144A) | | | 625,000 | | | | 557,059 | |
|
| Pipelines—(Continued) | |
Texas Eastern Transmission L.P.
3.500%, 01/15/28 (144A) | | | 1,240,000 | | | | 1,171,414 | |
TransCanada PipeLines, Ltd.
4.250%, 05/15/28 | | | 940,000 | | | | 931,478 | |
4.875%, 01/15/26 | | | 2,035,000 | | | | 2,105,916 | |
6.100%, 06/01/40 | | | 1,235,000 | | | | 1,370,593 | |
Transcontinental Gas Pipe Line Co. LLC
4.000%, 03/15/28 | | | 1,750,000 | | | | 1,712,238 | |
4.600%, 03/15/48 | | | 390,000 | | | | 365,158 | |
7.850%, 02/01/26 | | | 895,000 | | | | 1,082,415 | |
Transportadora de Gas Internacional S.A. ESP
5.550%, 11/01/28 (144A) | | | 427,000 | | | | 431,804 | |
Williams Cos., Inc. (The)
3.700%, 01/15/23 | | | 1,070,000 | | | | 1,043,738 | |
4.000%, 11/15/21 | | | 675,000 | | | | 677,597 | |
4.000%, 09/15/25 | | | 1,765,000 | | | | 1,704,990 | |
4.125%, 11/15/20 | | | 1,500,000 | | | | 1,511,655 | |
4.550%, 06/24/24 | | | 680,000 | | | | 686,555 | |
5.750%, 06/24/44 | | | 1,480,000 | | | | 1,489,183 | |
7.500%, 01/15/31 | | | 645,000 | | | | 770,445 | |
7.875%, 09/01/21 | | | 390,000 | | | | 425,885 | |
| | | | | | | | |
| | | | | | | 86,087,036 | |
| | | | | | | | |
|
| Real Estate Investment Trusts—0.3% | |
American Tower Corp.
3.000%, 06/15/23 | | | 1,520,000 | | | | 1,462,338 | |
3.300%, 02/15/21 | | | 1,342,000 | | | | 1,334,257 | |
3.450%, 09/15/21 | | | 500,000 | | | | 499,885 | |
CC Holdings GS V LLC / Crown Castle GS III Corp.
3.849%, 04/15/23 | | | 850,000 | | | | 841,695 | |
Crown Castle International Corp.
2.250%, 09/01/21 | | | 2,481,000 | | | | 2,398,578 | |
3.200%, 09/01/24 | | | 3,660,000 | | | | 3,463,999 | |
3.400%, 02/15/21 | | | 668,000 | | | | 667,744 | |
Trust F/1401
6.950%, 01/30/44 | | | 280,000 | | | | 264,603 | |
| | | | | | | | |
| | | | | | | 10,933,099 | |
| | | | | | | | |
|
| Retail—0.5% | |
Home Depot, Inc. (The)
3.500%, 09/15/56 | | | 570,000 | | | | 480,092 | |
3.900%, 12/06/28 | | | 710,000 | | | | 727,679 | |
5.875%, 12/16/36 | | | 405,000 | | | | 485,536 | |
Lowe’s Cos., Inc.
4.375%, 09/15/45 | | | 1,405,000 | | | | 1,263,325 | |
McDonald’s Corp.
3.350%, 04/01/23 | | | 1,240,000 | | | | 1,233,657 | |
3.700%, 01/30/26 | | | 1,390,000 | | | | 1,363,260 | |
3.700%, 02/15/42 | | | 575,000 | | | | 497,707 | |
4.450%, 03/01/47 | | | 765,000 | | | | 732,433 | |
4.450%, 09/01/48 | | | 255,000 | | | | 242,922 | |
4.700%, 12/09/35 | | | 1,035,000 | | | | 1,040,611 | |
4.875%, 12/09/45 | | | 930,000 | | | | 940,327 | |
Walgreens Boots Alliance, Inc.
3.450%, 06/01/26 | | | 4,090,000 | | | | 3,845,901 | |
See accompanying notes to financial statements.
BHFTII-19
Brighthouse Funds Trust II
BlackRock Bond Income Portfolio
Schedule of Investments as of December 31, 2018
Corporate Bonds & Notes—(Continued)
| | | | | | | | |
| Security Description | | Principal
Amount* | | | Value | |
|
| Retail—(Continued) | |
Walgreens Boots Alliance, Inc.
3.800%, 11/18/24 | | | 1,870,000 | | | $ | 1,840,158 | |
4.800%, 11/18/44 | | | 114,000 | | | | 104,456 | |
Walmart, Inc.
3.550%, 06/26/25 | | | 1,370,000 | | | | 1,385,718 | |
4.050%, 06/29/48 | | | 650,000 | | | | 648,624 | |
| | | | | | | | |
| | | | | | | 16,832,406 | |
| | | | | | | | |
|
| Semiconductors—1.1% | |
Analog Devices, Inc.
2.500%, 12/05/21 | | | 1,895,000 | | | | 1,849,720 | |
3.500%, 12/05/26 | | | 835,000 | | | | 799,609 | |
3.900%, 12/15/25 | | | 347,000 | | | | 340,685 | |
5.300%, 12/15/45 | | | 593,000 | | | | 624,599 | |
Applied Materials, Inc.
3.900%, 10/01/25 | | | 2,110,000 | | | | 2,124,259 | |
4.350%, 04/01/47 (f) | | | 977,000 | | | | 958,952 | |
5.100%, 10/01/35 | | | 1,139,000 | | | | 1,213,339 | |
Broadcom Corp. / Broadcom Cayman Finance, Ltd.
2.375%, 01/15/20 | | | 1,782,000 | | | | 1,759,551 | |
3.000%, 01/15/22 | | | 10,267,000 | | | | 9,873,385 | |
Lam Research Corp.
2.750%, 03/15/20 | | | 1,335,000 | | | | 1,322,287 | |
2.800%, 06/15/21 | | | 660,000 | | | | 652,624 | |
NVIDIA Corp.
3.200%, 09/16/26 | | | 1,590,000 | | | | 1,509,665 | |
NXP B.V. / NXP Funding LLC
3.875%, 09/01/22 (144A) | | | 2,956,000 | | | | 2,837,760 | |
4.125%, 06/01/21 (144A) | | | 3,755,000 | | | | 3,708,062 | |
4.625%, 06/15/22 (144A) | | | 715,000 | | | | 704,275 | |
4.875%, 03/01/24 (144A) | | | 1,085,000 | | | | 1,089,763 | |
QUALCOMM, Inc.
2.600%, 01/30/23 | | | 2,160,000 | | | | 2,078,499 | |
2.900%, 05/20/24 | | | 945,000 | | | | 899,760 | |
4.300%, 05/20/47 | | | 2,255,000 | | | | 2,005,539 | |
4.800%, 05/20/45 | | | 841,000 | | | | 802,088 | |
Texas Instruments, Inc.
2.250%, 05/01/23 | | | 550,000 | | | | 528,505 | |
4.150%, 05/15/48 | | | 660,000 | | | | 659,552 | |
| | | | | | | | |
| | | | | | | 38,342,478 | |
| | | | | | | | |
|
| Software—0.8% | |
Autodesk, Inc.
3.500%, 06/15/27 | | | 2,130,000 | | | | 1,981,847 | |
Fidelity National Information Services, Inc.
3.000%, 08/15/26 | | | 4,510,000 | | | | 4,151,221 | |
4.500%, 08/15/46 | | | 15,000 | | | | 13,660 | |
4.750%, 05/15/48 | | | 1,560,000 | | | | 1,452,063 | |
Fiserv, Inc.
3.850%, 06/01/25 | | | 440,000 | | | | 436,273 | |
4.200%, 10/01/28 | | | 1,240,000 | | | | 1,238,283 | |
Microsoft Corp.
3.450%, 08/08/36 | | | 4,100,000 | | | | 3,884,425 | |
3.500%, 02/12/35 | | | 1,449,000 | | | | 1,384,418 | |
3.700%, 08/08/46 | | | 4,105,000 | | | | 3,951,818 | |
|
| Software—(Continued) | |
Oracle Corp.
2.400%, 09/15/23 | | | 510,000 | | | | 489,380 | |
2.500%, 10/15/22 | | | 235,000 | | | | 228,703 | |
2.650%, 07/15/26 | | | 2,280,000 | | | | 2,114,129 | |
3.250%, 11/15/27 | | | 489,000 | | | | 471,913 | |
3.400%, 07/08/24 | | | 1,130,000 | | | | 1,127,669 | |
3.900%, 05/15/35 | | | 1,422,000 | | | | 1,362,606 | |
4.000%, 07/15/46 | | | 1,364,000 | | | | 1,274,552 | |
4.000%, 11/15/47 | | | 595,000 | | | | 554,501 | |
VMware, Inc.
2.300%, 08/21/20 | | | 1,729,000 | | | | 1,693,190 | |
| | | | | | | | |
| | | | | | | 27,810,651 | |
| | | | | | | | |
|
| Sovereign—0.0% | |
Oman Sovereign Sukuk SAOC
5.932%, 10/31/25 (144A) | | | 1,437,000 | | | | 1,365,374 | |
| | | | | | | | |
|
| Telecommunications—2.0% | |
AT&T, Inc.
3.400%, 05/15/25 | | | 615,000 | | | | 578,109 | |
4.125%, 02/17/26 | | | 385,000 | | | | 376,158 | |
4.300%, 02/15/30 | | | 8,555,000 | | | | 8,089,837 | |
4.350%, 06/15/45 (f) | | | 4,340,000 | | | | 3,672,332 | |
5.150%, 02/15/50 | | | 2,080,000 | | | | 1,929,464 | |
5.250%, 03/01/37 | | | 1,953,000 | | | | 1,919,875 | |
Axtel S.A.B. de CV
6.375%, 11/14/24 | | | 200,000 | | | | 189,698 | |
6.375%, 11/14/24 (144A) | | | 920,000 | | | | 872,611 | |
Cisco Systems, Inc.
2.950%, 02/28/26 | | | 605,000 | | | | 577,129 | |
Deutsche Telekom International Finance B.V.
4.375%, 06/21/28 (144A) | | | 1,100,000 | | | | 1,083,726 | |
Digicel Group, Ltd.
7.125%, 04/01/22 (144A) | | | 386,000 | | | | 179,490 | |
Juniper Networks, Inc.
3.300%, 06/15/20 | | | 1,478,000 | | | | 1,472,244 | |
Oi S.A.
10.000%, 4.000% PIK, 07/27/25 (h) | | | 828,000 | | | | 818,685 | |
Rogers Communications, Inc.
5.000%, 03/15/44 | | | 214,000 | | | | 222,819 | |
Sprint Spectrum Co. LLC / Sprint Spectrum Co. II LLC / Sprint Spectrum Co. III LLC
3.360%, 09/20/21 (144A) | | | 2,527,938 | | | | 2,496,338 | |
4.738%, 03/20/25 (144A) | | | 9,605,000 | | | | 9,424,906 | |
Telefonica Emisiones S.A.U.
4.665%, 03/06/38 | | | 1,895,000 | | | | 1,716,051 | |
TELUS Corp.
4.600%, 11/16/48 | | | 235,000 | | | | 234,649 | |
Verizon Communications, Inc.
3.203%, 3M LIBOR + 0.550%, 05/22/20 (b) | | | 4,870,000 | | | | 4,859,366 | |
4.125%, 08/15/46 | | | 1,160,000 | | | | 1,024,856 | |
4.329%, 09/21/28 | | | 11,893,000 | | | | 11,949,240 | |
4.400%, 11/01/34 | | | 760,000 | | | | 733,209 | |
4.500%, 08/10/33 | | | 3,260,000 | | | | 3,220,567 | |
5.500%, 03/16/47 (f) | | | 4,200,000 | | | | 4,472,151 | |
See accompanying notes to financial statements.
BHFTII-20
Brighthouse Funds Trust II
BlackRock Bond Income Portfolio
Schedule of Investments as of December 31, 2018
Corporate Bonds & Notes—(Continued)
| | | | | | | | |
| Security Description | | Principal
Amount* | | | Value | |
|
| Telecommunications—(Continued) | |
Vodafone Group plc
3.750%, 01/16/24 | | | 4,154,000 | | | $ | 4,094,034 | |
4.125%, 05/30/25 | | | 1,250,000 | | | | 1,235,402 | |
5.250%, 05/30/48 (f) | | | 2,985,000 | | | | 2,806,011 | |
| | | | | | | | |
| | | | | | | 70,248,957 | |
| | | | | | | | |
|
| Transportation—0.6% | |
Burlington Northern Santa Fe LLC
4.125%, 06/15/47 | | | 970,000 | | | | 940,111 | |
4.150%, 04/01/45 | | | 490,000 | | | | 475,728 | |
4.150%, 12/15/48 | | | 105,000 | | | | 102,408 | |
4.700%, 09/01/45 | | | 665,000 | | | | 696,280 | |
6.150%, 05/01/37 | | | 234,000 | | | | 285,343 | |
CSX Corp.
4.250%, 03/15/29 | | | 1,100,000 | | | | 1,117,545 | |
4.250%, 11/01/66 | | | 635,000 | | | | 549,855 | |
4.750%, 11/15/48 | | | 560,000 | | | | 568,025 | |
FedEx Corp.
3.875%, 08/01/42 | | | 925,000 | | | | 769,030 | |
3.900%, 02/01/35 | | | 1,975,000 | | | | 1,789,923 | |
4.050%, 02/15/48 | | | 2,470,000 | | | | 2,071,897 | |
4.900%, 01/15/34 | | | 190,000 | | | | 194,363 | |
Hidrovias International Finance S.a.r.l.
5.950%, 01/24/25 (144A) | | | 588,000 | | | | 535,086 | |
Norfolk Southern Corp.
2.900%, 06/15/26 | | | 1,310,000 | | | | 1,232,514 | |
3.650%, 08/01/25 | | | 1,125,000 | | | | 1,131,373 | |
4.050%, 08/15/52 (f) | | | 630,000 | | | | 563,510 | |
Rumo Luxembourg S.a.r.l.
5.875%, 01/18/25 (144A) | | | 679,000 | | | | 649,301 | |
7.375%, 02/09/24 (144A) | | | 604,000 | | | | 629,610 | |
Ryder System, Inc.
3.750%, 06/09/23 | | | 135,000 | | | | 134,162 | |
Union Pacific Corp.
3.375%, 02/01/35 | | | 1,148,000 | | | | 1,005,757 | |
3.600%, 09/15/37 | | | 1,475,000 | | | | 1,319,781 | |
3.750%, 07/15/25 | | | 1,070,000 | | | | 1,080,629 | |
3.799%, 10/01/51 | | | 310,000 | | | | 263,335 | |
3.875%, 02/01/55 | | | 1,196,000 | | | | 1,022,819 | |
Union Pacific Railroad Co. Pass-Through Trust
3.227%, 05/14/26 | | | 735,629 | | | | 722,495 | |
| | | | | | | | |
| | | | | | | 19,850,880 | |
| | | | | | | | |
|
| Trucking & Leasing—0.1% | |
GATX Corp.
2.600%, 03/30/20 (f) | | | 1,747,000 | | | | 1,729,790 | |
3.850%, 03/30/27 | | | 650,000 | | | | 617,936 | |
Penske Truck Leasing Co. L.P. / PTL Finance Corp.
3.400%, 11/15/26 (144A) | | | 2,690,000 | | | | 2,515,320 | |
| | | | | | | | |
| | | | | | | 4,863,046 | |
| | | | | | | | |
Total Corporate Bonds & Notes
(Cost $1,289,307,054) | | | | | | | 1,261,475,089 | |
| | | | | | | | |
| Asset-Backed Securities—10.7% | |
| Security Description | | Principal
Amount* | | | Value | |
|
| Asset-Backed - Home Equity—1.0% | |
ACE Securities Corp. Home Equity Loan Trust
2.636%, 1M LIBOR + 0.130%, 05/25/37 (b) | | | 1,181,953 | | | | 339,951 | |
Bayview Financial Revolving Asset Trust
3.506%, 1M LIBOR + 1.000%, 05/28/39 (144A) (b) | | | 7,356,591 | | | | 6,345,059 | |
3.506%, 1M LIBOR + 1.000%, 12/28/40 (144A) (b) | | | 498,533 | | | | 483,505 | |
Bear Stearns Asset-Backed Securities Trust
2.856%, 1M LIBOR + 0.350%, 04/25/37 (b) | | | 2,569,757 | | | | 2,013,321 | |
3.515%, 1M LIBOR + 1.200%, 01/25/36 (b) | | | 78,041 | | | | 77,614 | |
4.231%, 1M LIBOR + 1.725%, 08/25/34 (b) | | | 89,088 | | | | 88,358 | |
Citigroup Mortgage Loan Trust
2.706%, 1M LIBOR + 0.200%, 05/25/37 (b) | | | 2,678,059 | | | | 1,980,085 | |
2.756%, 1M LIBOR + 0.250%, 08/25/36 (b) | | | 1,810,000 | | | | 1,767,341 | |
2.776%, 1M LIBOR + 0.270%, 05/25/37 (b) | | | 1,216,491 | | | | 907,188 | |
Countrywide Asset-Backed Certificates
2.826%, 1M LIBOR + 0.320%, 10/25/36 (b) | | | 1,260,766 | | | | 1,195,783 | |
| Countrywide Home Equity Loan Trust | |
5.842%, 06/25/35 | | | 53,349 | | | | 90,821 | |
6.155%, 06/25/35 | | | 408,162 | | | | 435,669 | |
Home Equity Mortgage Loan Asset-Backed Trust
4.531%, 1M LIBOR + 2.025%, 07/25/34 (b) | | | 259,397 | | | | 258,325 | |
Home Equity Mortgage Trust
5.867%, 07/25/36 | | | 734,570 | | | | 244,539 | |
Home Loan Mortgage Loan Trust
3.175%, 1M LIBOR + 0.720%, 04/15/36 (b) | | | 886,947 | | | | 813,357 | |
Irwin Home Equity Loan Trust
6.530%, 09/25/37 (144A) | | | 242,043 | | | | 234,996 | |
MASTR Asset-Backed Securities Trust
2.656%, 1M LIBOR + 0.150%, 06/25/36 (b) | | | 954,222 | | | | 517,936 | |
2.766%, 1M LIBOR + 0.260%, 06/25/36 (144A) (b) | | | 623,424 | | | | 485,430 | |
2.786%, 1M LIBOR + 0.280%, 05/25/37 (b) | | | 621,846 | | | | 524,609 | |
Mill City Mortgage Trust
1.000%, 06/01/57 (144A) | | | 3,560,000 | | | | 569,600 | |
4.000%, 06/01/57 (144A) | | | 2,063,928 | | | | 2,026,777 | |
Morgan Stanley ABS Capital I, Inc. Trust
2.636%, 1M LIBOR + 0.130%, 11/25/36 (b) | | | 4,754,485 | | | | 2,829,354 | |
Nationstar Home Equity Loan Trust
2.686%, 1M LIBOR + 0.180%, 06/25/37 (b) | | | 107,940 | | | | 107,183 | |
Option One Mortgage Loan Trust
2.716%, 1M LIBOR + 0.210%, 03/25/37 (b) | | | 930,000 | | | | 608,251 | |
5.820%, 03/25/37 | | | 4,505,907 | | | | 4,412,367 | |
5.866%, 01/25/37 | | | 2,429,205 | | | | 2,271,721 | |
Securitized Asset Backed Receivables LLC Trust
2.696%, 1M LIBOR + 0.190%, 11/25/36 (144A) (b) | | | 1,030,960 | | | | 606,642 | |
Security National Mortgage Loan Trust
2.856%, 1M LIBOR + 0.350%, 04/25/37 (144A) (b) | | | 311,673 | | | | 306,242 | |
WaMu Asset-Backed Certificates WaMu Trust
2.756%, 1M LIBOR + 0.250%, 04/25/37 (b) | | | 3,284,847 | | | | 1,686,129 | |
2.866%, 1M LIBOR + 0.360%, 04/25/37 (b) | | | 349,015 | | | | 181,250 | |
Yale Mortgage Loan Trust
2.906%, 1M LIBOR + 0.400%, 06/25/37 (144A) (b) | | | 892,580 | | | | 367,321 | |
| | | | | | | | |
| | | | | | | 34,776,724 | |
| | | | | | | | |
|
| Asset-Backed - Manufactured Housing—0.5% | |
Bank of America Manufactured Housing Contract Trust
7.070%, 02/10/22 (b) | | | 470,000 | | | | 393,169 | |
7.930%, 12/10/25 (b) | | | 4,000,000 | | | | 2,594,818 | |
See accompanying notes to financial statements.
BHFTII-21
Brighthouse Funds Trust II
BlackRock Bond Income Portfolio
Schedule of Investments as of December 31, 2018
Asset-Backed Securities—(Continued)
| | | | | | | | |
| Security Description | | Principal
Amount* | | | Value | |
|
| Asset-Backed - Manufactured Housing—(Continued) | |
BCMSC Trust
7.575%, 06/15/30 (b) | | | 1,270,292 | | | $ | 412,468 | |
7.830%, 06/15/30 (b) | | | 1,178,847 | | | | 395,661 | |
8.290%, 06/15/30 (b) | | | 2,018,917 | | | | 717,426 | |
Conseco Finance Corp.
6.280%, 09/01/30 | | | 470,988 | | | | 497,617 | |
6.830%, 04/01/30 (b) | | | 140,717 | | | | 125,436 | |
6.980%, 09/01/30 (b) | | | 1,051,501 | | | | 900,261 | |
7.500%, 03/01/30 (b) | | | 468,692 | | | | 323,770 | |
7.860%, 03/01/30 (b) | | | 641,007 | | | | 457,328 | |
Conseco Finance Securitizations Corp.
7.960%, 05/01/31 | | | 970,358 | | | | 565,424 | |
7.970%, 05/01/32 | | | 2,293,008 | | | | 1,002,403 | |
8.060%, 09/01/29 (b) | | | 655,478 | | | | 305,054 | |
8.200%, 05/01/31 | | | 1,773,107 | | | | 1,061,299 | |
Credit Suisse First Boston Mortgage Securities Corp.
8.100%, 09/25/31 (b) | | | 720,000 | | | | 761,393 | |
Credit-Based Asset Servicing & Securitization LLC
6.250%, 10/25/36 (144A) | | | 344,000 | | | | 344,799 | |
Greenpoint Manufactured Housing
8.290%, 12/15/29 (b) | | | 440,000 | | | | 465,893 | |
9.230%, 12/15/29 (b) | | | 532,234 | | | | 434,572 | |
Lehman ABS Manufactured Housing Contract Trust
6.630%, 04/15/40 (b) | | | 2,430,000 | | | | 2,545,185 | |
Oakwood Mortgage Investors, Inc.
6.930%, 09/15/31 (b) | | | 264,203 | | | | 224,086 | |
7.620%, 06/15/32 (b) | | | 812,435 | | | | 672,716 | |
Origen Manufactured Housing Contract Trust
3.655%, 1M LIBOR + 1.200%, 10/15/37 (144A) (b) | | | 866,578 | | | | 825,913 | |
7.820%, 03/15/32 (b) | | | 340,241 | | | | 334,911 | |
| | | | | | | | |
| | | | | | | 16,361,602 | |
| | | | | | | | |
|
| Asset-Backed - Other—8.7% | |
Ajax Mortgage Loan Trust
Zero Coupon, 02/26/57 (144A) (i) (j) | | | 1,071,671 | | | | 300,068 | |
Zero Coupon, 06/25/57 (144A) | | | 1,461,140 | | | | 1,347,978 | |
Zero Coupon, 12/25/57 (144A) (b) | | | 1,710,373 | | | | 769,668 | |
Zero Coupon, 04/25/58 (144A) | | | 797,019 | | | | 438,361 | |
Zero Coupon, 06/25/58 (144A) (b) | | | 600,000 | | | | 172,200 | |
Zero Coupon, 08/25/58 (144A) (b) | | | 822,226 | | | | 460,446 | |
Zero Coupon, 11/25/58 (144A) (i) (j) | | | 2,000,000 | | | | 834,506 | |
3.750%, 12/25/57 (144A) | | | 3,581,832 | | | | 3,594,308 | |
3.750%, 08/25/58 (144A) (b) | | | 3,390,197 | | | | 3,327,817 | |
3.850%, 04/25/58 (144A) | | | 3,323,761 | | | | 3,329,809 | |
4.375%, 06/25/57 (144A) | | | 4,853,000 | | | | 4,830,665 | |
4.375%, 06/25/58 (144A) (b) (i) (j) | | | 1,380,000 | | | | 1,372,814 | |
4.375%, 11/25/58 (144A) (b) (i) (j) | | | 5,870,000 | | | | 5,841,749 | |
5.250%, 06/25/57 (144A) | | | 567,000 | | | | 554,241 | |
5.250%, 06/25/58 (144A) (b) (i) (j) | | | 230,000 | | | | 224,891 | |
5.250%, 11/25/58 (144A) (b) (i) (j) | | | 780,000 | | | | 762,674 | |
Allegro CLO, Ltd.
3.233%, 3M LIBOR + 1.080%, 10/21/28 (144A) (b) | | | 1,370,000 | | | | 1,355,666 | |
3.676%, 3M LIBOR + 1.240%, 10/16/30 (144A) (b) | | | 400,000 | | | | 397,125 | |
|
| Asset-Backed - Other—(Continued) | |
ALM, Ltd.
2.604%, 3M LIBOR + 1.250%, 10/18/27 (144A) (b) | | | 900,000 | | | | 884,915 | |
3.326%, 3M LIBOR + 0.890%, 04/16/27 (144A) (b) | | | 360,000 | | | | 356,993 | |
3.355%, 3M LIBOR + 0.910%, 10/18/27 (144A) (b) | | | 1,450,000 | | | | 1,435,754 | |
3.836%, 3M LIBOR + 1.400%, 07/15/26 (144A) (b) | | | 459,000 | | | | 445,298 | |
3.936%, 3M LIBOR + 1.500%, 07/15/27 (144A) (b) | | | 1,810,000 | | | | 1,783,690 | |
4.086%, 3M LIBOR + 1.650%, 04/16/27 (144A) (b) | | | 1,385,000 | | | | 1,313,317 | |
4.336%, 3M LIBOR + 1.900%, 07/15/27 (144A) (b) | | | 720,000 | | | | 694,222 | |
AMMC CLO, Ltd.
3.818%, 3M LIBOR + 1.200%, 11/10/30 (144A) (b) | | | 500,000 | | | | 495,429 | |
Anchorage Capital CLO, Ltd.
3.686%, 3M LIBOR + 1.250%, 10/13/30 (144A) (b) | | | 835,000 | | | | 828,636 | |
3.706%, 3M LIBOR + 1.270%, 07/15/30 (144A) (b) | | | 710,000 | | | | 703,327 | |
3.736%, 3M LIBOR + 1.300%, 10/15/27 (144A) (b) | | | 1,130,000 | | | | 1,107,957 | |
3.886%, 3M LIBOR + 1.450%, 01/15/30 (144A) (b) | | | 2,410,000 | | | | 2,362,171 | |
4.009%, 3M LIBOR + 1.500%, 01/28/31 (144A) (b) | | | 1,270,000 | | | | 1,227,204 | |
4.109%, 3M LIBOR + 1.600%, 07/28/28 (144A) (b) | | | 800,000 | | | | 780,180 | |
4.136%, 3M LIBOR + 1.700%, 10/15/27 (144A) (b) | | | 250,000 | | | | 238,288 | |
4.286%, 3M LIBOR + 1.850%, 01/15/30 (144A) (b) | | | 1,010,000 | | | | 957,803 | |
4.359%, 3M LIBOR + 1.850%, 01/28/31 (144A) (b) | | | 1,390,000 | | | | 1,309,070 | |
4.586%, 3M LIBOR + 2.150%, 10/13/30 (144A) (b) | | | 590,000 | | | | 568,456 | |
Apidos CLO
3.430%, 3M LIBOR + 0.980%, 01/19/25 (144A) (b) | | | 224,269 | | | | 224,153 | |
Arbor Realty Collateralized Loan Obligation, Ltd.
3.445%, 1M LIBOR + 0.990%, 12/15/27 (144A) (b) | | | 1,200,000 | | | | 1,197,064 | |
Arbor Realty Commercial Real Estate Notes, Ltd.
3.445%, 1M LIBOR + 0.990%, 08/15/27 (144A) (b) | | | 570,000 | | | | 561,485 | |
4.155%, 1M LIBOR + 1.700%, 09/15/26 (144A) (b) | | | 1,590,000 | | | | 1,597,430 | |
Ares CLO, Ltd.
3.606%, 3M LIBOR + 1.170%, 10/15/30 (144A) (b) | | | 390,000 | | | | 383,872 | |
Atrium
4.119%, 3M LIBOR + 1.650%, 04/22/27 (144A) (b) | | | 1,119,000 | | | | 1,077,699 | |
Avery Point CLO, Ltd.
3.429%, 3M LIBOR + 0.980%, 07/17/26 (144A) (b) | | | 1,000,538 | | | | 997,027 | |
3.936%, 3M LIBOR + 1.500%, 01/15/28 (144A) (b) | | | 2,820,000 | | | | 2,820,020 | |
B2R Mortgage Trust
2.524%, 05/15/48 (144A) | | | 198,305 | | | | 196,135 | |
3.336%, 11/15/48 (144A) | | | 326,258 | | | | 324,925 | |
Babson CLO, Ltd.
3.659%, 3M LIBOR + 1.190%, 10/20/30 (144A) (b) | | | 870,000 | | | | 865,013 | |
3.869%, 3M LIBOR + 1.400%, 01/20/31 (144A) (b) | | | 250,000 | | | | 242,135 | |
Benefit Street Partners CLO, Ltd.
3.225%, 3M LIBOR + 0.780%, 07/18/27 (144A) (b) | | | 820,000 | | | | 809,206 | |
3.559%, 3M LIBOR + 1.090%, 04/20/31 (144A) (b) | | | 440,000 | | | | 432,919 | |
3.569%, 3M LIBOR + 1.100%, 01/20/31 (144A) (b) | | | 2,000,000 | | | | 1,969,812 | |
3.685%, 3M LIBOR + 1.240%, 10/18/29 (144A) (b) | | | 3,800,000 | | | | 3,773,978 | |
BlueMountain CLO, Ltd.
3.649%, 3M LIBOR + 1.180%, 10/22/30 (144A) (b) | | | 760,000 | | | | 750,277 | |
Bowman Park CLO, Ltd.
3.857%, 3M LIBOR + 1.180%, 11/23/25 (144A) (b) | | | 1,100,000 | | | | 1,096,986 | |
BSPRT Issuer, Ltd.
3.559%, 1M LIBOR + 1.050%, 03/15/28 (144A) (b) | | | 390,000 | | | | 389,068 | |
3.805%, 1M LIBOR + 1.350%, 06/15/27 (144A) (b) | | | 293,169 | | | | 293,260 | |
C-BASS Trust
2.485%, 1M LIBOR + 0.170%, 04/25/37 (b) | | | 414,281 | | | | 306,454 | |
2.666%, 1M LIBOR + 0.160%, 10/25/36 (b) | | | 269,192 | | | | 203,651 | |
See accompanying notes to financial statements.
BHFTII-22
Brighthouse Funds Trust II
BlackRock Bond Income Portfolio
Schedule of Investments as of December 31, 2018
Asset-Backed Securities—(Continued)
| | | | | | | | |
| Security Description | | Principal
Amount* | | | Value | |
|
| Asset-Backed - Other—(Continued) | |
Carlyle Global Market Strategies CLO, Ltd.
3.335%, 3M LIBOR + 0.890%, 01/18/29 (144A) (b) | | | 510,000 | | | $ | 502,786 | |
3.419%, 3M LIBOR + 0.970%, 04/17/31 (144A) (b) | | | 970,000 | | | | 952,852 | |
3.559%, 3M LIBOR + 1.050%, 07/27/31 (144A) (b) | | | 4,100,000 | | | | 4,044,293 | |
3.919%, 3M LIBOR + 1.450%, 01/20/29 (144A) (b) | | | 7,485,000 | | | | 7,485,090 | |
4.109%, 3M LIBOR + 1.600%, 07/28/28 (144A) (b) | | | 640,000 | | | | 631,883 | |
Carlyle U.S. CLO, Ltd.
3.616%, 3M LIBOR + 1.180%, 01/15/30 (144A) (b) | | | 1,550,000 | | | | 1,540,082 | |
Carrington Mortgage Loan Trust
2.626%, 1M LIBOR + 0.120%, 10/25/36 (b) | | | 476,369 | | | | 348,647 | |
2.666%, 1M LIBOR + 0.160%, 10/25/36 (b) | | | 614,941 | | | | 538,124 | |
2.726%, 1M LIBOR + 0.220%, 10/25/36 (b) | | | 730,000 | | | | 491,500 | |
2.746%, 1M LIBOR + 0.240%, 08/25/36 (b) | | | 4,800,000 | | | | 3,595,836 | |
CBAM, Ltd.
3.719%, 3M LIBOR + 1.250%, 07/20/30 (144A) (b) | | | 2,000,000 | | | | 1,972,680 | |
4.199%, 3M LIBOR + 1.750%, 10/17/29 (144A) (b) | | | 1,020,000 | | | | 999,725 | |
Cedar Funding CLO, Ltd.
3.449%, 3M LIBOR + 0.980%, 04/20/31 (144A) (b) | | | 380,000 | | | | 371,878 | |
3.549%, 3M LIBOR + 1.100%, 07/17/31 (144A) (b) | | | 770,000 | | | | 757,658 | |
3.559%, 3M LIBOR + 1.090%, 10/20/28 (144A) (b) | | | 3,680,000 | | | | 3,646,965 | |
3.699%, 3M LIBOR + 1.250%, 10/17/30 (144A) (b) | | | 5,150,000 | | | | 5,135,302 | |
Cent CLO, Ltd.
3.506%, 3M LIBOR + 1.070%, 10/15/26 (144A) (b) | | | 1,130,000 | | | | 1,119,418 | |
Chase Funding Trust
6.333%, 04/25/32 | | | 323,956 | | | | 327,716 | |
CIFC Funding, Ltd.
3.445%, 3M LIBOR + 1.000%, 04/18/31 (144A) (b) | | | 589,000 | | | | 577,606 | |
4.186%, 3M LIBOR + 1.750%, 07/16/30 (144A) (b) | | | 250,000 | | | | 245,674 | |
Citicorp Residential Mortgage Trust
5.127%, 06/25/37 | | | 1,030,000 | | | | 967,908 | |
Citigroup Mortgage Loan Trust, Inc.
2.826%, 1M LIBOR + 0.320%, 11/25/36 (b) | | | 990,000 | | | | 834,870 | |
Countrywide Asset-Backed Certificates
2.666%, 1M LIBOR + 0.160%, 12/25/35 (b) | | | 1,832,286 | | | | 1,799,329 | |
2.726%, 1M LIBOR + 0.220%, 12/25/25 (b) | | | 70,386 | | | | 77,105 | |
Countrywide Asset-Backed Certificates Trust
2.666%, 1M LIBOR + 0.160%, 09/25/46 (b) | | | 117,482 | | | | 115,039 | |
Countrywide Revolving Home Equity Loan Resecuritization Trust
2.755%, 1M LIBOR + 0.300%, 12/15/33 (144A) (b) | | | 579,812 | | | | 542,031 | |
Countrywide Revolving Home Equity Loan Trust
2.635%, 1M LIBOR + 0.180%, 05/15/35 (b) | | | 383,650 | | | | 368,897 | |
Credit-Based Asset Servicing & Securitization LLC
3.459%, 12/25/36 | | | 206,346 | | | | 184,991 | |
CWABS Asset-Backed Certificates Trust
5.669%, 05/25/36 (b) | | | 381,875 | | | | 372,312 | |
5.690%, 05/25/36 (b) | | | 1,392,665 | | | | 1,354,596 | |
CWHEQ Revolving Home Equity Loan Resuritization Trust
2.695%, 1M LIBOR + 0.240%, 12/15/35 (144A) (b) | | | 430,917 | | | | 414,769 | |
CWHEQ Revolving Home Equity Loan Trust
2.605%, 1M LIBOR + 0.150%, 11/15/36 (b) | | | 765,122 | | | | 625,535 | |
DCP Rights LLC
5.463%, 10/25/44 (144A) | | | 6,668,360 | | | | 6,811,357 | |
Dorchester Park CLO DAC
3.919%, 3M LIBOR + 1.450%, 04/20/28 (144A) (b) | | | 934,000 | | | | 907,012 | |
Dryden CLO, Ltd.
3.556%, 3M LIBOR + 1.120%, 01/15/31 (144A) (b) | | | 6,020,000 | | | | 5,963,827 | |
|
| Asset-Backed - Other—(Continued) | |
| Dryden Senior Loan Fund | |
3.336%, 3M LIBOR + 0.900%, 10/15/27 (144A) (b) | | | 1,630,000 | | | | 1,624,833 | |
3.816%, 3M LIBOR + 1.200%, 08/15/30 (144A) (b) | | | 2,205,000 | | | | 2,187,775 | |
4.286%, 3M LIBOR + 1.850%, 10/15/27 (144A) (b) | | | 660,000 | | | | 639,937 | |
Elevation CLO, Ltd.
4.540%, 3M LIBOR + 2.050%, 10/25/30 (144A) (b) | | | 1,125,000 | | | | 1,053,145 | |
Finance of America Structured Securities Trust
6.000%, 09/25/28 (144A) (b) | | | 596,000 | | | | 571,206 | |
First Franklin Mortgage Loan Trust
2.646%, 1M LIBOR + 0.140%, 12/25/36 (b) | | 5,442,877 | | | 3,184,429 | |
2.656%, 1M LIBOR + 0.150%, 12/25/36 (b) | | | 3,110,382 | | | | 2,653,850 | |
2.716%, 1M LIBOR + 0.210%, 12/25/36 (b) | | | 10,012,511 | | | | 5,930,555 | |
Flatiron CLO, Ltd.
3.326%, 3M LIBOR + 0.890%, 04/15/27 (144A) (b) | | | 970,000 | | | | 962,756 | |
Fremont Home Loan Trust
2.646%, 1M LIBOR + 0.140%, 02/25/37 (b) | | | 2,474,716 | | | | 1,899,534 | |
Galaxy CLO, Ltd.
4.296%, 3M LIBOR + 1.680%, 11/15/26 (144A) (b) | | | 430,000 | | | | 409,347 | |
GE-WMC Asset-Backed Pass-Through Certificates
2.756%, 1M LIBOR + 0.250%, 12/25/35 (b) | | | 172,996 | | | | 171,767 | |
GE-WMC Mortgage Securities Trust
2.656%, 1M LIBOR + 0.150%, 08/25/36 (b) | | | 7,181,108 | | | | 4,388,547 | |
Greystone Commercial Real Estate Notes, Ltd.
4.005%, 1M LIBOR + 1.550%, 03/15/27 (144A) (b) | | | 400,000 | | | | 398,116 | |
Greywolf CLO, Ltd.
4.799%, 3M LIBOR + 2.350%, 01/17/27 (144A) (b) | | | 320,000 | | | | 319,951 | |
Highbridge Loan Management, Ltd.
3.582%, 3M LIBOR + 1.000%, 02/05/31 (144A) (b) | | | 1,390,000 | | | | 1,362,460 | |
Home Equity Mortgage Loan Asset-Backed Trust
2.706%, 1M LIBOR + 0.200%, 07/25/37 (b) | | | 1,146,680 | | | | 716,904 | |
ICG U.S. CLO, Ltd.
3.590%, 3M LIBOR + 1.140%, 10/19/28 (144A) (b) | | | 1,065,000 | | | | 1,054,933 | |
Invitation Homes Trust
4.455%, 1M LIBOR + 2.000%, 07/17/37 (144A) (b) | | | 712,107 | | | | 704,963 | |
4.955%, 1M LIBOR + 2.500%, 03/17/37 (144A) (b) | | | 410,000 | | | | 406,702 | |
Knollwood CDO, Ltd.
4.355%, 3M LIBOR + 3.200%,
01/10/39 (144A) (b) (i) (j) | | | 899,417 | | | | 0 | |
LCM, Ltd.
3.379%, 3M LIBOR + 0.870%, 10/20/27 (144A) (b) | | | 1,010,000 | | | | 1,001,606 | |
3.539%, 3M LIBOR + 1.070%, 01/20/31 (144A) (b) | | | 2,590,000 | | | | 2,559,852 | |
Lehman ABS Mortgage Loan Trust
2.596%, 1M LIBOR + 0.090%, 06/25/37 (144A) (b) | | | 204,175 | | | | 144,847 | |
Lendmark Funding Trust
2.830%, 12/22/25 (144A) | | | 5,270,000 | | | | 5,199,729 | |
Litigation Fee Residual Funding LLC
4.000%, 10/30/27 (144A) | | | 2,518,496 | | | | 2,507,237 | |
LoanCore Issuer, Ltd.
3.585%, 1M LIBOR + 1.130%, 05/15/28 (144A) (b) | | | 2,210,000 | | | | 2,181,623 | |
Long Beach Mortgage Loan Trust
2.616%, 1M LIBOR + 0.110%, 10/25/36 (b) | | | 554,922 | | | | 237,511 | |
2.656%, 1M LIBOR + 0.150%, 06/25/36 (b) | | | 623,419 | | | | 344,150 | |
2.666%, 1M LIBOR + 0.160%, 05/25/36 (b) | | | 3,625,760 | | | | 1,626,261 | |
2.666%, 1M LIBOR + 0.160%, 10/25/36 (b) | | | 2,205,033 | | | | 949,790 | |
2.666%, 1M LIBOR + 0.160%, 11/25/36 (b) | | | 2,680,840 | | | | 1,113,204 | |
2.686%, 1M LIBOR + 0.180%, 03/25/46 (b) | | | 1,192,328 | | | | 887,554 | |
See accompanying notes to financial statements.
BHFTII-23
Brighthouse Funds Trust II
BlackRock Bond Income Portfolio
Schedule of Investments as of December 31, 2018
Asset-Backed Securities—(Continued)
| | | | | | | | |
| Security Description | | Principal
Amount* | | | Value | |
|
| Asset-Backed - Other—(Continued) | |
Long Beach Mortgage Loan Trust
2.686%, 1M LIBOR + 0.180%, 05/25/46 (b) | | | 2,037,915 | | | $ | 817,436 | |
2.726%, 1M LIBOR + 0.220%, 11/25/36 (b) | | | 788,845 | | | | 330,550 | |
2.766%, 1M LIBOR + 0.260%, 05/25/36 (b) | | | 2,517,886 | | | | 1,149,957 | |
Madison Park Funding, Ltd.
3.400%, 3M LIBOR + 0.950%, 04/19/30 (144A) (b) | | | 1,330,000 | | | | 1,314,068 | |
3.659%, 3M LIBOR + 1.190%, 10/21/30 (144A) (b) | | | 5,000,000 | | | | 4,973,960 | |
3.709%, 3M LIBOR + 1.200%, 07/29/30 (144A) (b) | | | 2,030,000 | | | | 2,015,372 | |
Marathon CRE Issuer, Ltd.
3.605%, 1M LIBOR + 1.150%, 06/15/28 (144A) (b) | | | 510,000 | | | | 509,996 | |
Marble Point CLO, Ltd.
3.625%, 3M LIBOR + 1.180%, 12/18/30 (144A) (b) | | | 580,000 | | | | 573,426 | |
Merrill Lynch First Franklin Mortgage Loan Trust
2.746%, 1M LIBOR + 0.240%, 05/25/37 (b) | | | 10,885,316 | | | | 7,279,257 | |
Mountain Hawk II CLO, Ltd.
4.069%, 3M LIBOR + 1.600%, 07/20/24 (144A) (b) | | | 1,138,000 | | | | 1,129,885 | |
MP CLO, Ltd.
3.719%, 3M LIBOR + 1.250%, 10/20/30 (144A) (b) | | | 1,010,000 | | | | 1,002,650 | |
Neuberger Berman Loan Advisers CLO, Ltd.
3.615%, 3M LIBOR + 1.170%, 10/18/30 (144A) (b) | | | 1,770,000 | | | | 1,750,137 | |
Nomura Asset Acceptance Corp. Alternative Loan Trust
2.906%, 1M LIBOR + 0.400%, 10/25/36 (144A) (b) | | | 341,472 | | | | 304,787 | |
OCP CLO, Ltd.
3.328%, 3M LIBOR + 0.820%, 10/26/27 (144A) (b) | | | 270,000 | | | | 268,845 | |
3.565%, 3M LIBOR + 1.120%, 10/18/28 (144A) (b) | | | 2,366,000 | | | | 2,343,828 | |
3.588%, 3M LIBOR + 1.080%, 04/26/31 (144A) (b) | | | 160,000 | | | | 157,344 | |
3.696%, 3M LIBOR + 1.260%, 07/15/30 (144A) (b) | | | 3,270,000 | | | | 3,247,816 | |
4.595%, 3M LIBOR + 1.950%, 11/20/30 (144A) (b) | | | 250,000 | | | | 232,344 | |
Octagon Investment Partners, Ltd.
3.356%, 3M LIBOR + 1.020%, 07/17/30 (144A) (b) | | | 3,370,000 | | | | 3,317,216 | |
3.396%, 3M LIBOR + 0.960%, 04/16/31 (144A) (b) | | | 2,210,000 | | | | 2,171,007 | |
3.490%, 3M LIBOR + 1.000%, 01/25/31 (144A) (b) | | | 3,420,000 | | | | 3,371,422 | |
3.546%, 3M LIBOR + 0.900%, 05/21/27 (144A) (b) | | | 4,670,000 | | | | 4,637,221 | |
3.659%, 3M LIBOR + 1.190%, 01/20/31 (144A) (b) | | | 430,000 | | | | 423,309 | |
3.996%, 3M LIBOR + 1.350%, 05/21/27 (144A) (b) | | | 3,090,000 | | | | 3,034,167 | |
OFSI Fund, Ltd.
3.566%, 3M LIBOR + 1.130%, 03/20/25 (144A) (b) | | | 4,190,000 | | | | 4,125,059 | |
OHA Loan Funding, Ltd.
3.717%, 3M LIBOR + 1.040%, 05/23/31 (144A) (b) | | | 5,670,000 | | | | 5,550,074 | |
OneMain Financial Issuance Trust
4.100%, 03/20/28 (144A) | | | 178,301 | | | | 178,720 | |
4.320%, 07/18/25 (144A) | | | 3,100,000 | | | | 3,102,159 | |
OZLM Funding, Ltd.
3.719%, 3M LIBOR + 1.250%, 10/22/30 (144A) (b) | | | 10,705,000 | | | | 10,624,659 | |
5.469%, 3M LIBOR + 3.000%, 01/22/29 (144A) (b) | | | 3,950,000 | | | | 3,950,711 | |
OZLM, Ltd.
3.656%, 3M LIBOR + 1.220%, 11/22/30 (144A) (b) | | | 690,000 | | | | 684,729 | |
3.959%, 3M LIBOR + 1.490%, 01/20/29 (144A) (b) | | | 1,950,000 | | | | 1,949,290 | |
4.136%, 3M LIBOR + 1.700%, 01/15/29 (144A) (b) | | | 2,570,000 | | | | 2,516,346 | |
4.369%, 3M LIBOR + 1.900%, 01/20/31 (144A) (b) | | | 320,000 | | | | 302,237 | |
4.569%, 3M LIBOR + 2.100%, 01/20/29 (144A) (b) | | | 810,000 | | | | 807,909 | |
Palmer Square CLO, Ltd.
3.475%, 3M LIBOR + 1.030%, 04/18/31 (144A) (b) | | | 1,040,000 | | | | 1,020,155 | |
3.579%, 3M LIBOR + 1.130%, 01/17/31 (144A) (b) | | | 1,312,000 | | | | 1,288,320 | |
3.966%, 3M LIBOR + 1.350%, 08/15/26 (144A) (b) | | | 945,000 | | | | 934,710 | |
|
| Asset-Backed - Other—(Continued) | |
Parallel Ltd.
4.219%, 3M LIBOR + 1.750%, 07/20/27 (144A) (b) | | | 350,000 | | | | 335,653 | |
Progress Residential Trust
2.740%, 06/12/32 (144A) | | | 1,110,732 | | | | 1,096,671 | |
2.768%, 08/17/34 (144A) | | | 927,022 | | | | 909,036 | |
4.778%, 03/17/35 (144A) | | | 120,000 | | | | 118,817 | |
6.005%, 1M LIBOR + 3.550%, 01/17/34 (144A) (b) | | | 347,000 | | | | 346,998 | |
6.643%, 11/12/32 (144A) | | | 250,000 | | | | 255,390 | |
PRPM LLC
4.250%, 01/25/22 (144A) | | | 96,867 | | | | 96,678 | |
Race Point CLO, Ltd.
3.646%, 3M LIBOR + 1.210%, 10/15/30 (144A) (b) | | | 1,170,000 | | | | 1,158,478 | |
RAMP Trust
2.676%, 1M LIBOR + 0.170%, 02/25/37 (b) | | | 714,122 | | | | 365,633 | |
2.776%, 1M LIBOR + 0.270%, 11/25/36 (b) | | | 2,354,813 | | | | 1,965,076 | |
Regatta VI Funding, Ltd.
3.549%, 3M LIBOR + 1.080%, 07/20/28 (144A) (b) | | | 2,910,000 | | | | 2,881,662 | |
Rockford Tower CLO, Ltd.
3.659%, 3M LIBOR + 1.190%, 10/20/30 (144A) (b) | | | 2,590,000 | | | | 2,563,212 | |
3.806%, 3M LIBOR + 1.370%, 04/15/29 (144A) (b) | | | 3,550,000 | | | | 3,530,141 | |
4.186%, 3M LIBOR + 1.750%, 10/15/29 (144A) (b) | | | 1,590,000 | | | | 1,581,121 | |
4.236%, 3M LIBOR + 1.800%, 04/15/29 (144A) (b) | | | 1,500,000 | | | | 1,490,370 | |
4.736%, 3M LIBOR + 2.300%, 10/15/29 (144A) (b) | | | 310,000 | | | | 300,277 | |
RR 3, Ltd.
3.526%, 3M LIBOR + 1.090%, 01/15/30 (144A) (b) | | | 560,000 | | | | 555,323 | |
SG Mortgage Securities Trust
2.716%, 1M LIBOR + 0.210%, 10/25/36 (b) | | | 570,000 | | | | 446,954 | |
Silver Creek CLO, Ltd.
3.709%, 3M LIBOR + 1.240%, 07/20/30 (144A) (b) | | | 1,330,000 | | | | 1,315,749 | |
Sound Point CLO II, Ltd.
3.578%, 3M LIBOR + 1.070%, 01/26/31 (144A) (b) | | | 500,000 | | | | 491,547 | |
Sound Point CLO, Ltd.
4.007%, 3M LIBOR + 1.530%, 01/23/29 (144A) (b) | | | 3,080,000 | | | | 3,074,570 | |
4.129%, 3M LIBOR + 1.660%, 10/20/28 (144A) (b) | | | 1,240,000 | | | | 1,240,051 | |
Soundview Home Loan Trust
3.301%, 1M LIBOR + 0.795%, 01/25/35 (b) | | | 24,775 | | | | 23,565 | |
SpringCastle America Funding LLC
3.050%, 04/25/29 (144A) | | | 2,845,146 | | | | 2,817,687 | |
Springleaf Funding Trust
3.620%, 11/15/24 (144A) | | | 2,062,000 | | | | 2,058,721 | |
Steele Creek CLO, Ltd.
3.686%, 3M LIBOR + 1.250%, 01/15/30 (144A) (b) | | | 670,000 | | | | 664,838 | |
Symphony CLO, Ltd.
3.466%, 3M LIBOR + 1.030%, 10/15/25 (144A) (b) | | | 8,213,389 | | | | 8,179,756 | |
TCI-Flatiron CLO,Ltd.
3.840%, 3M LIBOR + 1.200%, 11/17/30 (144A) (b) | | | 1,080,000 | | | | 1,072,155 | |
TIAA CLO, Ltd.
3.586%, 3M LIBOR + 1.150%, 01/16/31 (144A) (b) | | | 571,000 | | | | 564,000 | |
3.749%, 3M LIBOR + 1.280%, 04/20/29 (144A) (b) | | | 900,000 | | | | 895,639 | |
Tricon American Homes Trust
4.564%, 05/17/37 (144A) | | | 260,000 | | | | 256,708 | |
4.960%, 05/17/37 (144A) | | | 180,000 | | | | 179,280 | |
5.104%, 01/17/36 (144A) | | | 340,000 | | | | 341,866 | |
Venture CLO, Ltd.
3.403%, 3M LIBOR + 1.070%, 07/18/31 (144A) (b) | | | 420,000 | | | | 409,649 | |
See accompanying notes to financial statements.
BHFTII-24
Brighthouse Funds Trust II
BlackRock Bond Income Portfolio
Schedule of Investments as of December 31, 2018
Asset-Backed Securities—(Continued)
| | | | | | | | |
| Security Description | | Principal
Amount* | | | Value | |
|
| Asset-Backed - Other—(Continued) | |
Vibrant CLO, Ltd.
4.019%, 3M LIBOR + 1.550%, 01/20/29 (144A) (b) | | | 1,020,000 | | | $ | 1,020,150 | |
Voya CLO, Ltd.
3.566%, 3M LIBOR + 1.130%, 10/15/30 (144A) (b) | | | 1,020,000 | | | | 1,002,232 | |
Washington Mutural Asset-Backed Certificates Trust
2.661%, 1M LIBOR + 0.155%, 10/25/36 (b) | | | 914,002 | | | | 743,794 | |
2.686%, 1M LIBOR + 0.180%, 09/25/36 (b) | | | 2,238,480 | | | | 1,053,090 | |
2.726%, 1M LIBOR + 0.220%, 02/25/37 (b) | | | 2,194,105 | | | | 939,044 | |
Wellfleet CLO, Ltd.
3.789%, 3M LIBOR + 1.320%, 04/20/29 (144A) (b) | | | 850,000 | | | | 846,846 | |
West CLO, Ltd.
3.749%, 3M LIBOR + 1.160%, 11/07/25 (144A) (b) | | | 1,180,671 | | | | 1,180,089 | |
York CLO, Ltd.
3.719%, 3M LIBOR + 1.250%, 10/20/29 (144A) (b) | | | 630,000 | | | | 625,904 | |
4.219%, 3M LIBOR + 1.750%, 10/20/29 (144A) (b) | | | 850,000 | | | | 833,370 | |
| | | | | | | | |
| | | | | | | 309,159,500 | |
| | | | | | | | |
|
| Asset-Backed - Student Loan—0.5% | |
Navient Private Education Loan Trust
3.500%, 12/16/58 (144A) (b) | | | 970,000 | | | | 926,866 | |
4.205%, 1M LIBOR + 1.750%, 10/17/44 (144A) (b) | | | 4,595,000 | | | | 4,655,173 | |
Scholar Funding Trust
3.156%, 1M LIBOR + 0.650%, 01/30/45 (144A) (b) | | | 4,398,797 | | | | 4,376,003 | |
SLM Private Credit Student Loan Trust
3.118%, 3M LIBOR + 0.330%, 03/15/24 (b) | | | 2,955,780 | | | | 2,944,722 | |
SLM Private Education Loan Trust
2.500%, 03/15/47 (144A) | | | 720,000 | | | | 716,390 | |
3.000%, 05/16/44 (144A) | | | 970,000 | | | | 966,000 | |
3.855%, 1M LIBOR + 1.400%, 10/15/31 (144A) (b) | | | 950,393 | | | | 954,124 | |
SMB Private Education Loan Trust
3.500%, 12/17/40 (144A) | | | 1,340,000 | | | | 1,303,399 | |
| | | | | | | | |
| | | | | | | 16,842,677 | |
| | | | | | | | |
Total Asset-Backed Securities
(Cost $377,891,534) | | | | | | | 377,140,503 | |
| | | | | | | | |
|
| Municipals—7.4% | |
Adams & Weld Counties School District No. 27J
5.000%, 12/01/42 | | | 500,000 | | | | 570,120 | |
Alabama ST
5.000%, 11/01/38 | | | 530,000 | | | | 620,609 | |
American Municipal Power, Inc., Build America Bonds
6.449%, 02/15/44 | | | 355,000 | | | | 455,806 | |
7.834%, 02/15/41 | | | 425,000 | | | | 622,833 | |
Anne Arundel County
5.000%, 10/01/47 | | | 500,000 | | | | 573,080 | |
Arizona Health Facilities Authority
2.420%, 3M LIBOR + 0.000%, 01/01/37 (b) | | | 780,000 | | | | 742,732 | |
Arizona State University
5.000%, 07/01/43 | | | 330,000 | | | | 374,662 | |
Atlanta GA Water & Wastewater Revenue
5.000%, 11/01/41 | |
| 760,000
|
| |
| 867,586
|
|
5.000%, 11/01/43 | | | 460,000 | | | | 524,359 | |
Atlanta GA Water & Wastewater Revenue | | | | | | | | |
Series B
5.000%, 11/01/47 | | | 500,000 | | | | 568,305 | |
Aurora, CO Water Revenue
5.000%, 08/01/41 | | | 1,020,000 | | | | 1,150,703 | |
5.000%, 08/01/46 | | | 1,190,000 | | | | 1,340,773 | |
Austin TX Water & Wastewater System Rev.
5.000%, 11/15/43 | | | 500,000 | | | | 550,775 | |
Bay Area Toll Bridge Authority, Build America Bonds
6.918%, 04/01/40 | | | 1,575,000 | | | | 2,102,704 | |
7.043%, 04/01/50 | | | 1,865,000 | | | | 2,649,773 | |
Berks County Industrial Development Authority
5.000%, 11/01/47 | | | 510,000 | | | | 551,534 | |
5.000%, 11/01/50 | | | 480,000 | | | | 516,120 | |
Buckeye Tobacco Settlement Financing Authority
5.875%, 06/01/47 | | | 2,100,000 | | | | 1,992,354 | |
Buena Park School District
5.000%, 08/01/47 | | | 260,000 | | | | 295,693 | |
California Health Facilities Financing Authority
5.000%, 08/15/33 | | | 495,000 | | | | 574,373 | |
Series A | | | | | | | | |
5.000%, 08/15/47 | | | 500,000 | | | | 548,725 | |
California Infrastructure & Economic Development Bank
5.000%, 05/15/47 | | | 220,000 | | | | 250,105 | |
5.000%, 05/15/52 | | | 220,000 | | | | 248,780 | |
California Municipal Finance Authority
5.000%, 12/31/47 | | | 310,000 | | | | 336,579 | |
California Pollution Control Financing Authority
5.000%, 11/21/45 (144A) | | | 450,000 | | | | 465,426 | |
California State Public Works Board, Build America Bond
8.361%, 10/01/34 | | | 760,000 | | | | 1,104,257 | |
Canaveral Port Authority
5.000%, 06/01/45 | | | 520,000 | | | | 562,978 | |
5.000%, 06/01/48 | | | 520,000 | | | | 572,426 | |
Central Puget Sound Regional Transit Authority
5.000%, 11/01/50 | | | 510,000 | | | | 569,196 | |
Central Texas Regional Mobility Authority
5.000%, 01/01/45 | | | 350,000 | | | | 376,474 | |
5.000%, 01/01/46 | | | 350,000 | | | | 377,815 | |
Chesapeake Bay Bridge & Tunnel District
5.000%, 07/01/41 | | | 360,000 | | | | 405,428 | |
5.000%, 07/01/51 | | | 275,000 | | | | 297,091 | |
Chicago O’Hare International Airport
4.472%, 01/01/49 | | | 2,320,000 | | | | 2,353,663 | |
City & County of Denver
5.000%, 08/01/48 | | | 610,000 | | | | 680,309 | |
Series A | | | | | | | | |
5.000%, 08/01/44 | | | 850,000 | | | | 952,212 | |
City of Cartersville GA
5.000%, 06/01/48 | | | 510,000 | | | | 581,854 | |
City of Columbia SC Waterworks & Sewer System Revenue
5.000%, 02/01/42 | | | 390,000 | | | | 447,233 | |
5.000%, 02/01/48 | | | 420,000 | | | | 479,497 | |
City of New York NY
5.000%, 04/01/40 | | | 740,000 | | | | 844,562 | |
5.000%, 04/01/45 | | | 600,000 | | | | 681,696 | |
City of Portland
5.000%, 06/15/37 | | | 320,000 | | | | 376,352 | |
5.000%, 06/15/40 | | | 350,000 | | | | 407,852 | |
See accompanying notes to financial statements.
BHFTII-25
Brighthouse Funds Trust II
BlackRock Bond Income Portfolio
Schedule of Investments as of December 31, 2018
Municipals—(Continued)
| | | | | | | | |
| Security Description | | Principal
Amount* | | | Value | |
Clark County School District
5.000%, 06/15/30 | | | 270,000 | | | $ | 314,385 | |
5.000%, 06/15/31 | | | 570,000 | | | | 660,653 | |
5.000%, 06/15/33 | | | 630,000 | | | | 724,607 | |
Series A | | | | | | | | |
5.000%, 06/15/34 | | | 600,000 | | | | 684,312 | |
Colorado Health Facilities Authority
5.250%, 02/01/31 | | | 325,000 | | | | 341,426 | |
Colorado Springs CO Utilities System Revenue
5.000%, 11/15/42 | | | 260,000 | | | | 297,164 | |
| Commonwealth Financing Authority | | | | | | |
4.144%, 06/01/38 | | | 730,000 | | | | 737,687 | |
Series A | | | | | | | | |
3.864%, 06/01/38 | | | 720,000 | | | | 710,050 | |
Commonwealth of Massachusetts
5.000%, 11/01/42 | | | 620,000 | | | | 705,721 | |
5.000%, 11/01/45 | | | 540,000 | | | | 612,436 | |
Series A | | | | | | | | |
5.000%, 01/01/45 | | | 700,000 | | | | 795,459 | |
Commonwealth of Massachusetts Transportation Fund Revenue
5.000%, 06/01/48 | | | 1,030,000 | | | | 1,175,117 | |
Commonwealth of Puerto Rico
8.000%, 07/01/35 (g) | | | 5,000,000 | | | | 2,687,500 | |
Connecticut State Health & Educational Facility Authority
5.000%, 07/01/45 | | | 1,640,000 | | | | 1,774,367 | |
County of Clark NV | | | | | | | | |
Series A | | | | | | | | |
5.000%, 06/01/43 | | | 960,000 | | | | 1,097,760 | |
5.000%, 05/01/48 | | | 2,185,000 | | | | 2,479,560 | |
County of Franklin OH Sales Tax Revenue
5.000%, 06/01/43 | | | 460,000 | | | | 529,639 | |
5.000%, 06/01/48 | | | 900,000 | | | | 1,032,300 | |
County of King WA Sewer Revenue
5.000%, 07/01/42 | | | 320,000 | | | | 364,845 | |
5.000%, 07/01/47 | | | 520,000 | | | | 573,669 | |
Dallas Area Rapid Transit
5.000%, 12/01/41 | | | 680,000 | | | | 759,805 | |
5.000%, 12/01/46 | | | 920,000 | | | | 1,024,944 | |
Denton Independent School District
5.000%, 08/15/43 | | | 780,000 | | | | 885,604 | |
Denver City & County, CO Airport System Revenue
5.000%, 11/15/29 | | | 380,000 | | | | 441,986 | |
5.000%, 11/15/30 | | | 305,000 | | | | 352,428 | |
District of Columbia Water & Sewer Authority
5.000%, 10/01/49 | | | 420,000 | | | | 476,826 | |
DuBois Hospital Authority
5.000%, 07/15/43 | | | 360,000 | | | | 395,363 | |
Dutchess County Local Development Corp.
5.000%, 07/01/46 | | | 1,025,000 | | | | 1,119,935 | |
Florida Department of Management Services | | | | | | | | |
Series A, COPs | | | | | | | | |
5.000%, 11/01/27 | | | 510,000 | | | | 615,810 | |
5.000%, 11/01/28 | | | 520,000 | | | | 634,665 | |
5.000%, 11/01/29 | | | 250,000 | | | | 308,425 | |
Grand Parkway Transportation Corp.
5.000%, 10/01/43 | | | 1,470,000 | | | | 1,665,142 | |
Grant County Public Utility District No. 2
4.584%, 01/01/40 | | | 315,000 | | | | 331,210 | |
Great Lakes Water Authority Water Supply System Revenue
5.250%, 07/01/33 | | | 150,000 | | | | 173,919 | |
Houston Independent School District
5.000%, 07/15/36 | | | 420,000 | | | | 491,471 | |
Idaho Health Facilities Authority
5.000%, 12/01/47 | | | 320,000 | | | | 356,205 | |
Indiana Finance Authority
5.000%, 02/01/35 | | | 480,000 | | | | 566,650 | |
5.000%, 10/01/45 | | | 870,000 | | | | 948,674 | |
Indiana Housing & Community Development Authority
3.800%, 07/01/38 | | | 260,000 | | | | 260,985 | |
JobsOhio Beverage System
3.985%, 01/01/29 | | | 835,000 | | | | 860,417 | |
Kentucky Economic Development Finance Authority
5.250%, 06/01/50 | | | 330,000 | | | | 345,507 | |
Kentucky Turnpike Authority
5.000%, 07/01/20 | | | 370,000 | | | | 386,654 | |
Las Vegas Convention & Visitors Authority
5.000%, 07/01/43 | | | 500,000 | | | | 559,285 | |
Las Vegas Valley Water District
5.000%, 06/01/46 | | | 300,000 | | | | 334,323 | |
Lexington County Health Services District, Inc.
5.000%, 11/01/41 | | | 300,000 | | | | 321,435 | |
Long Beach, CA Harbor Revenue
5.000%, 05/15/47 | | | 580,000 | | | | 658,358 | |
Los Angeles County Metropolitan Transportation Authority
5.000%, 07/01/42 | | | 850,000 | | | | 975,953 | |
Los Angeles Department of Water & Power Power System Revenue
6.574%, 07/01/45 | | | 395,000 | | | | 547,719 | |
Los Angeles, CA Community College District, Build America Bond
6.600%, 08/01/42 | | | 2,280,000 | | | | 3,132,766 | |
Los Angeles, CA Department of Water & Power Revenue, Build America Bond
6.603%, 07/01/50 | | | 565,000 | | | | 797,407 | |
Los Angeles, CA Unified School District, Build America Bond
6.758%, 07/01/34 | | | 640,000 | | | | 823,622 | |
Louisiana Public Facilities Authority
5.000%, 07/01/48 | | | 340,000 | | | | 370,416 | |
Maryland Stadium Authority
5.000%, 05/01/41 | | | 460,000 | | | | 512,730 | |
| Massachusetts Bay Transportation Authority | |
5.000%, 07/01/39 | | | 320,000 | | | | 363,565 | |
5.000%, 07/01/40 | | | 340,000 | | | | 385,475 | |
5.000%, 07/01/41 | | | 360,000 | | | | 407,578 | |
5.000%, 07/01/42 | | | 370,000 | | | | 418,607 | |
5.000%, 07/01/43 | | | 300,000 | | | | 338,934 | |
| Massachusetts Development Finance Agency | |
5.000%, 07/01/43 | | | 680,000 | | | | 742,261 | |
5.000%, 09/01/45 | | | 290,000 | | | | 324,545 | |
5.000%, 07/01/47 | | | 500,000 | | | | 549,755 | |
5.000%, 07/01/48 | | | 1,280,000 | | | | 1,391,885 | |
5.000%, 07/01/53 | | | 720,000 | | | | 775,231 | |
See accompanying notes to financial statements.
BHFTII-26
Brighthouse Funds Trust II
BlackRock Bond Income Portfolio
Schedule of Investments as of December 31, 2018
Municipals—(Continued)
| | | | | | | | |
| Security Description | | Principal
Amount* | | | Value | |
Massachusetts Educational Financing Authority
5.000%, 01/01/22 | | | 500,000 | | | $ | 536,895 | |
| Massachusetts Housing Finance Agency | |
4.500%, 12/01/39 | | | 265,000 | | | | 273,952 | |
4.500%, 12/01/48 | | | 330,000 | | | | 340,880 | |
4.600%, 12/01/44 | | | 285,000 | | | | 294,345 | |
Massachusetts Port Authority
5.000%, 07/01/43 | | | 460,000 | | | | 507,053 | |
Massachusetts School Building Authority
5.250%, 02/15/48 | | | 770,000 | | | | 891,953 | |
Massachusetts Water Resources Authority
5.000%, 08/01/40 | | | 270,000 | | | | 304,015 | |
Mesquite Independent School District
5.000%, 08/15/42 | | | 570,000 | | | | 638,440 | |
Metropolitan Atlanta Rapid Transit Authority
Series A
5.000%, 07/01/41 | | | 510,000 | | | | 566,921 | |
5.000%, 07/01/42 | | | 510,000 | | | | 566,605 | |
Series B
5.000%, 07/01/45 | | | 400,000 | | | | 449,056 | |
Metropolitan Government of Nashville & Davidson County, Health & Educational Facilities Board
5.000%, 07/01/40 | | | 260,000 | | | | 280,535 | |
5.000%, 07/01/46 | | | 690,000 | | | | 741,232 | |
Metropolitan St. Louis Sewer District
5.000%, 05/01/42 | | | 710,000 | | | | 808,875 | |
Series A | |
5.000%, 05/01/47 | | | 650,000 | | | | 735,416 | |
Metropolitan Transportation Authority
5.000%, 11/15/42 | |
| 670,000
|
| |
| 758,413
|
|
5.000%, 11/15/45 | |
| 250,000
|
| |
| 270,780
|
|
5.250%, 11/15/57 | | | 820,000 | | | | 908,839 | |
Metropolitan Transportation Authority, Build America Bonds
6.668%, 11/15/39 | | 170,000 | | | 221,401 | |
6.687%, 11/15/40 | | | 590,000 | | | | 760,734 | |
6.814%, 11/15/40 | | | 1,005,000 | | | | 1,334,911 | |
Metropolitan Washington Airports Authority
5.000%, 10/01/32 | | | 890,000 | | | | 1,008,868 | |
5.000%, 10/01/43 | | | 790,000 | | | | 882,248 | |
Metropolitan Washington Airports Authority Dulles Toll Road Revenue, Build America Bond
7.462%, 10/01/46 | | | 560,000 | | | | 804,378 | |
Miami-Dade County, FL
5.000%, 07/01/35 | | | 345,000 | | | | 392,990 | |
Miami-Dade County, FL Aviation Revenue
2.504%, 10/01/24 | | | 1,000,000 | | | | 967,360 | |
3.354%, 10/01/29 | | | 195,000 | | | | 186,245 | |
3.454%, 10/01/30 | | | 355,000 | | | | 339,298 | |
3.504%, 10/01/31 | | | 330,000 | | | | 314,266 | |
5.000%, 10/01/38 | | | 1,025,000 | | | | 1,118,531 | |
5.000%, 10/01/40 | | | 500,000 | | | | 554,065 | |
Series C
4.062%, 10/01/31 | | | 495,000 | | | | 507,717 | |
Miami-Dade County, FL Educational Facilities Authority
5.000%, 04/01/53 | | | 840,000 | | | | 926,176 | |
5.073%, 04/01/50 | | | 655,000 | | | | 737,202 | |
Series A
5.000%, 04/01/48 | | | 530,000 | | | | 589,641 | |
Michigan Finance Authority
5.000%, 11/15/41 | | | 330,000 | | | | 355,532 | |
5.000%, 12/01/47 | | | 1,810,000 | | | | 1,932,265 | |
Michigan State Housing Development Authority
3.550%, 10/01/33 | | | 300,000 | | | | 300,435 | |
4.000%, 10/01/43 | | | 290,000 | | | | 288,182 | |
4.050%, 10/01/48 | | | 140,000 | | | | 139,034 | |
4.150%, 10/01/53 | | | 690,000 | | | | 689,965 | |
Mississippi State Hospital Equipment & Facilities Authority, Baptist Memorial Health Care
5.000%, 09/01/46 | | | 630,000 | | | | 670,333 | |
Missouri State Health & Educational Facilities Authority Revenue
3.652%, 08/15/57 | | | 800,000 | | | | 755,280 | |
5.000%, 11/15/29 | | | 340,000 | | | | 386,077 | |
Municipal Electric Authority of Georgia, Build America Bond
6.637%, 04/01/57 | | | 1,000,000 | | | | 1,057,240 | |
New Hope Cultural Education Facilities Finance Corp.
5.000%, 08/15/47 | | | 380,000 | | | | 422,670 | |
New Jersey State Turnpike Authority, Build America Bond
7.414%, 01/01/40 | | | 1,451,000 | | | | 2,044,459 | |
New Jersey Transportation Trust Fund Authority
5.000%, 06/15/29 | | | 380,000 | | | | 421,823 | |
New Orleans Aviation Board
5.000%, 01/01/40 | | | 530,000 | | | | 569,686 | |
New York City Housing Development Corp
3.700%, 11/01/38 | | | 320,000 | | | | 318,208 | |
3.850%, 11/01/43 | | | 950,000 | | | | 948,451 | |
4.000%, 11/01/53 | | | 1,010,000 | | | | 1,004,314 | |
New York City Transitional Finance Authority Building Aid Revenue
5.000%, 07/15/40 | | | 370,000 | | | | 410,593 | |
New York City Transitional Finance Authority Future Tax Secured Revenue
3.050%, 05/01/27 | | | 1,670,000 | | | | 1,606,891 | |
3.550%, 05/01/25 | | | 1,475,000 | | | | 1,490,679 | |
5.000%, 08/01/31 | | | 190,000 | | | | 219,340 | |
5.000%, 02/01/35 | | | 410,000 | | | | 463,886 | |
5.000%, 05/01/36 | | | 390,000 | | | | 441,227 | |
New York City Water & Sewer System
5.000%, 06/15/39 | | | 1,070,000 | | | | 1,230,682 | |
5.000%, 06/15/40 | | | 770,000 | | | | 882,920 | |
5.000%, 06/15/47 | | | 985,000 | | | | 1,105,633 | |
5.375%, 06/15/43 | | | 2,360,000 | | | | 2,503,630 | |
5.500%, 06/15/43 | | | 2,825,000 | | | | 3,009,783 | |
5.882%, 06/15/44 | | | 1,150,000 | | | | 1,474,587 | |
New York City Water & Sewer System, Build America Bonds
5.440%, 06/15/43 | | | 505,000 | | | | 612,025 | |
5.750%, 06/15/41 | | | 675,000 | | | | 844,162 | |
New York Convention Center Development Corp.
5.000%, 11/15/40 | | | 370,000 | | | | 412,439 | |
5.000%, 11/15/46 | | | 920,000 | | | | 1,030,253 | |
See accompanying notes to financial statements.
BHFTII-27
Brighthouse Funds Trust II
BlackRock Bond Income Portfolio
Schedule of Investments as of December 31, 2018
Municipals—(Continued)
| | | | | | | | |
| Security Description | | Principal
Amount* | | | Value | |
New York State Dormitory Authority
5.000%, 02/15/31 | | | 330,000 | | | $ | 382,173 | |
5.000%, 03/15/32 | | | 580,000 | | | | 662,766 | |
5.000%, 02/15/36 | | | 620,000 | | | | 712,504 | |
5.000%, 02/15/37 | | | 360,000 | | | | 412,243 | |
5.000%, 02/15/38 | | | 330,000 | | | | 376,547 | |
5.000%, 02/15/39 | | | 330,000 | | | | 375,477 | |
5.000%, 03/15/39 | | | 810,000 | | | | 929,540 | |
5.000%, 02/15/40 | | | 380,000 | | | | 431,756 | |
5.000%, 02/15/41 | | | 620,000 | | | | 702,944 | |
5.000%, 02/15/42 | | | 840,000 | | | | 951,703 | |
5.000%, 02/15/43 | | | 540,000 | | | | 611,372 | |
Series A | | | | | | | | |
5.000%, 03/15/41 | | | 530,000 | | | | 605,483 | |
5.000%, 03/15/42 | | | 530,000 | | | | 605,032 | |
5.000%, 03/15/43 | | | 1,050,000 | | | | 1,190,793 | |
5.000%, 03/15/48 | | | 2,590,000 | | | | 2,959,748 | |
5.000%, 10/01/48 | | | 335,000 | | | | 440,840 | |
Series B | | | | | | | | |
5.000%, 10/01/38 | | | 830,000 | | | | 972,619 | |
New York State Dormitory Authority, Build America Bond
5.389%, 03/15/40 | | | 1,075,000 | | | | 1,259,201 | |
New York State Urban Development Corp.
2.860%, 03/15/24 | | | 2,030,000 | | | | 2,013,557 | |
3.120%, 03/15/25 | | | 980,000 | | | | 971,974 | |
3.320%, 03/15/29 | | | 1,285,000 | | | | 1,254,314 | |
New York Transportation Development Corp.
5.000%, 07/01/46 | | | 340,000 | | | | 357,476 | |
5.250%, 01/01/50 | | | 2,060,000 | | | | 2,189,018 | |
North Carolina Department of Transportation
5.000%, 06/30/54 | | | 1,000,000 | | | | 1,040,430 | |
North Carolina Turnpike Authority
5.000%, 01/01/35 | | | 360,000 | | | | 412,070 | |
Ohio Turnpike & Infrastructure Commission
5.000%, 02/15/48 | | | 550,000 | | | | 589,418 | |
Omaha Public Power District
5.000%, 02/01/42 | | | 600,000 | | | | 682,644 | |
Orange County Local Transportation Authority, Build America Bond 6.908%, 02/15/41 | | | 1,420,000 | | | | 1,879,583 | |
Oregon School Boards Association
4.759%, 06/30/28 | | | 1,740,000 | | | | 1,878,034 | |
5.490%, 06/30/23 | | | 1,410,000 | | | | 1,570,500 | |
Pennsylvania Economic Development Financing Authority
5.000%, 12/31/38 | | | 510,000 | | | | 546,485 | |
Pennsylvania State University | | | | | | | | |
5.000%, 09/01/43 | | | 360,000 | | | | 414,443 | |
5.000%, 09/01/48 | | | 420,000 | | | | 481,631 | |
Pennsylvania Turnpike Commission | | | | | | | | |
5.000%, 12/01/46 | | | 320,000 | | | | 347,821 | |
Series A | | | | | | | | |
5.000%, 12/01/48 | | | 3,300,000 | | | | 3,705,570 | |
Series B | | | | | | | | |
5.000%, 12/01/43 | | | 1,010,000 | | | | 1,121,625 | |
Permanent University Fund - University of Texas System
3.376%, 07/01/47 | | | 660,000 | | | | 597,815 | |
Port Authority of New York & New Jersey
4.458%, 10/01/62 | | | 1,290,000 | | | | 1,312,459 | |
4.810%, 10/15/65 | | | 360,000 | | | | 390,917 | |
4.960%, 08/01/46 | | | 1,910,000 | | | | 2,192,775 | |
5.000%, 11/15/47 | | | 290,000 | | | | 321,735 | |
Port of Seattle
5.000%, 05/01/43 | | | 260,000 | | | | 284,999 | |
Public Power Generation Agency Revenue
5.000%, 01/01/35 | | | 360,000 | | | | 400,342 | |
Regents of the University of California Medical Center Pooled Revenue, Build America Bonds | | | | | | | | |
6.583%, 05/15/49 | | | 1,455,000 | | | | 1,924,543 | |
Series L
| | | | | | | | |
5.000%, 05/15/47 | | | 460,000 | | | | 511,704 | |
Riverside, CA, Electric Revenue, Buld America Bond
7.605%, 10/01/40 | | | 525,000 | | | | 768,133 | |
Royal Oak Hospital Finance Authority
5.000%, 09/01/39 | | | 450,000 | | | | 486,009 | |
Sacramento County Sanitation Districts Financing Authority
2.365%, 3M LIBOR + 0.000%, 12/01/35 (b) | | | 560,000 | | | | 543,900 | |
Salt Lake City Corp. Airport Revenue
5.000%, 07/01/47 | | 1,510,000 | | | 1,670,623 | |
Salt River Arizona Project Agricultural Improvement & Power
District
5.000%, 01/01/36 | | 520,000 | | | 609,955 | |
Series A | | | | | | | | |
5.000%, 12/01/45 | | | 1,870,000 | | | | 2,076,242 | |
San Antonio TX Electric & Gas Systems Revenue
5.000%, 02/01/48 | | | 250,000 | | | | 269,650 | |
San Antonio Water System
5.000%, 05/15/39 | | | 1,300,000 | | | | 1,450,423 | |
San Antonio, TX Electric & Gas Systems Revenue, Build Amereica Bond
5.808%, 02/01/41 | | | 470,000 | | | | 595,965 | |
San Diego County Regional Airport Authority
5.000%, 07/01/47 | | | 470,000 | | | | 529,511 | |
San Diego Public Facilities Financing Authority
5.000%, 05/15/39 | | | 475,000 | | | | 544,792 | |
San Diego Unified School District
5.000%, 07/01/41 | | | 780,000 | | | | 898,739 | |
San Francisco City & County AirportComm-San Francisco International Airport
5.000%, 05/01/46 | | | 980,000 | | | | 1,074,903 | |
5.000%, 05/01/47 | | | 620,000 | | | | 685,708 | |
San Jose Redevelopment Agency Successor Agency
2.958%, 08/01/24 | | | 1,195,000 | | | | 1,182,572 | |
South Carolina Ports Authority
5.000%, 07/01/55 | | | 470,000 | | | | 508,371 | |
South Carolina Public Service Authority
2.388%, 12/01/23 | | | 1,085,000 | | | | 1,029,589 | |
5.000%, 12/01/49 | | | 700,000 | | | | 729,239 | |
5.000%, 12/01/50 | | | 700,000 | | | | 733,166 | |
See accompanying notes to financial statements.
BHFTII-28
Brighthouse Funds Trust II
BlackRock Bond Income Portfolio
Schedule of Investments as of December 31, 2018
Municipals—(Continued)
| | | | | | | | |
| Security Description | | Principal
Amount* | | | Value | |
State of California
2.250%, 10/01/23 | | | 1,265,000 | | | $ | 1,231,288 | |
4.600%, 04/01/38 | | | 3,690,000 | | | | 3,805,681 | |
State of California General Obligation Unlimited, Build America Bonds 7.300%, 10/01/39 | | | 860,000 | | | | 1,180,539 | |
7.350%, 11/01/39 | | | 550,000 | | | | 759,269 | |
7.500%, 04/01/34 | | | 1,125,000 | | | | 1,533,071 | |
7.550%, 04/01/39 | | | 1,375,000 | | | | 1,969,756 | |
State of Connecticut
3.310%, 01/15/26 | | | 1,445,000 | | | | 1,416,519 | |
State of District of Columbia
5.000%, 06/01/42 | | | 500,000 | | | | 567,080 | |
State of Illinois | | | | | | | | |
Series A | | | | | | | | |
5.000%, 05/01/20 | | | 400,000 | | | | 410,688 | |
5.000%, 12/01/24 | | | 250,000 | | | | 266,833 | |
Series D | | | | | | | | |
5.000%, 11/01/22 | | | 490,000 | | | | 516,813 | |
5.000%, 11/01/24 | | | 1,280,000 | | | | 1,365,760 | |
5.000%, 11/01/25 | | | 3,450,000 | | | | 3,688,188 | |
State of Illinois, General Obligation Unlimited
5.100%, 06/01/33 | | | 4,320,000 | | | | 4,118,818 | |
State of Minnesota | | | | | | | | |
Series A | | | | | | | | |
5.000%, 08/01/31 | | | 260,000 | | | | 314,314 | |
5.000%, 08/01/32 | | | 270,000 | | | | 324,875 | |
5.000%, 08/01/33 | | | 260,000 | | | | 311,623 | |
5.000%, 08/01/34 | | | 260,000 | | | | 310,167 | |
5.000%, 08/01/35 | | | 500,000 | | | | 594,150 | |
State of Mississippi
5.000%, 11/01/35 | | | 280,000 | | | | 321,535 | |
State of Missouri
3.086%, 09/15/51 | | | 1,450,000 | | | | 1,238,981 | |
3.651%, 01/15/46 | | | 330,000 | | | | 317,929 | |
State of Ohio
5.000%, 03/15/32 | | | 930,000 | | | | 1,042,195 | |
5.000%, 05/01/34 | | | 420,000 | | | | 476,091 | |
5.000%, 05/01/35 | | | 420,000 | | | | 475,045 | |
5.000%, 05/01/36 | | | 1,015,000 | | | | 1,144,879 | |
5.000%, 05/01/37 | | | 760,000 | | | | 854,909 | |
State of Texas
5.000%, 04/01/40 | | | 380,000 | | | | 429,138 | |
5.000%, 04/01/43 | | | 610,000 | | | | 685,079 | |
State of Virginia
5.000%, 06/01/40 | | | 700,000 | | | | 802,900 | |
5.000%, 12/01/40 | | | 720,000 | | | | 825,840 | |
5.000%, 12/01/41 | | | 690,000 | | | | 790,222 | |
State of Washington General Obligation Unlimited
5.000%, 07/01/30 | | | 1,440,000 | | | | 1,635,826 | |
5.000%, 08/01/30 | | | 415,000 | | | | 484,338 | |
5.000%, 08/01/40 | | | 1,300,000 | | | | 1,460,413 | |
5.000%, 02/01/41 | | | 610,000 | | | | 689,916 | |
5.000%, 08/01/41 | | | 400,000 | | | | 455,236 | |
5.000%, 08/01/42 | | | 420,000 | | | | 477,658 | |
State of Wisconsin
3.154%, 05/01/27 | | | 1,220,000 | | | | 1,202,859 | |
5.000%, 05/01/32 | | | 340,000 | | | | 388,382 | |
5.000%, 05/01/33 | | | 310,000 | | | | 353,335 | |
5.000%, 11/01/33 | | | 420,000 | | | | 491,938 | |
5.000%, 05/01/34 | | | 400,000 | | | | 455,416 | |
5.000%, 05/01/36 | | | 490,000 | | | | 555,439 | |
5.000%, 05/01/38 | | | 500,000 | | | | 561,515 | |
Sumter Landing Community Development District
4.172%, 10/01/47 | | | 385,000 | | | | 383,691 | |
| Tennessee Housing Development Agency | | | | | | |
3.750%, 07/01/38 | | | 280,000 | | | | 279,989 | |
3.850%, 07/01/43 | | | 130,000 | | | | 129,386 | |
3.950%, 01/01/49 | | | 100,000 | | | | 100,000 | |
Texas Municipal Gas Acquisition & Supply Corp. I
6.250%, 12/15/26 | | | 260,000 | | | | 297,084 | |
Texas Private Activity Bond Surface Transportation Corp.
5.000%, 12/31/55 | | | 170,000 | | | | 178,274 | |
Texas Water Development Board
5.000%, 10/15/38 | | | 750,000 | | | | 873,562 | |
5.000%, 10/15/43 | | | 750,000 | | | | 858,300 | |
5.000%, 10/15/47 | | | 300,000 | | | | 340,557 | |
5.000%, 04/15/49 | | | 4,870,000 | | | | 5,583,504 | |
Tobacco Settlement Finance Authority
7.467%, 06/01/47 | | | 1,200,000 | | | | 1,175,676 | |
Tobacco Settlement Financing Corp.
6.706%, 06/01/46 | | | 275,000 | | | | 259,509 | |
TSASC, Inc.
5.000%, 06/01/41 | | | 560,000 | | | | 577,819 | |
University of California CA, Revenue
3.063%, 07/01/25 | | | 665,000 | | | | 656,308 | |
4.601%, 05/15/31 | | | 650,000 | | | | 697,872 | |
4.858%, 05/15/12 | | | 980,000 | | | | 1,028,726 | |
University of Houston
5.000%, 02/15/33 | | | 390,000 | | | | 444,464 | |
5.000%, 02/15/34 | | | 350,000 | | | | 397,429 | |
5.000%, 02/15/35 | | | 800,000 | | | | 905,104 | |
5.000%, 02/15/36 | | | 1,040,000 | | | | 1,172,371 | |
University of Oregon
5.000%, 04/01/46 | | | 380,000 | | | | 425,201 | |
University of Texas
2.756%, 05/15/26 | | | 1,810,000 | | | | 1,751,501 | |
2.836%, 05/15/27 | | | 805,000 | | | | 774,450 | |
Upper Arlington City School District
5.000%, 12/01/48 | | | 670,000 | | | | 762,286 | |
Virginia Small Business Financing Authority
5.000%, 12/31/52 | | | 710,000 | | | | 755,958 | |
5.000%, 12/31/56 | | | 720,000 | | | | 763,949 | |
Washington Metropolitan Area Transit Authority
5.000%, 07/01/36 | | | 290,000 | | | | 333,677 | |
Washington State Convention Center Public Facilities District
5.000%, 07/01/58 | | | 1,990,000 | | | | 2,200,562 | |
Water Revenue Authority of Georgia, Build America Bond
5.000%, 11/01/40 | | | 250,000 | | | | 277,850 | |
Weld County School District No. 2
5.250%, 12/01/41 | | | 560,000 | | | | 646,005 | |
See accompanying notes to financial statements.
BHFTII-29
Brighthouse Funds Trust II
BlackRock Bond Income Portfolio
Schedule of Investments as of December 31, 2018
Municipals—(Continued)
| | | | | | | | |
| Security Description | | Principal
Amount* | | | Value | |
West Virginia Hospital Finance Authority
5.000%, 06/01/19 | | | 365,000 | | | $ | 369,679 | |
5.000%, 06/01/20 | | | 390,000 | | | | 405,471 | |
5.000%, 06/01/21 | | | 390,000 | | | | 415,311 | |
5.000%, 06/01/22 | | | 425,000 | | | | 463,016 | |
5.000%, 06/01/23 | | | 355,000 | | | | 394,352 | |
5.000%, 06/01/24 | | | 375,000 | | | | 423,581 | |
Wisconsin Health & Educational Facilities Authority
5.000%, 12/15/44 | | | 310,000 | | | | 330,829 | |
| | | | | | | | |
Total Municipals
(Cost $264,368,329) | | | | | | | 261,061,318 | |
| | | | | | | | |
|
| Mortgage-Backed Securities—4.6% | |
|
| Collateralized Mortgage Obligations—1.7% | |
Alternative Loan Trust
| |
6.000%, 04/25/37 | | | 150,463 | | | | 107,858 | |
American Home Mortgage Assets Trust
3.077%, 12M MTA + 0.920%, 11/25/46 (b) | | | 300,121 | | | | 149,178 | |
3.097%, 12M MTA + 0.940%, 10/25/46 (b) | | | 522,138 | | | | 456,845 | |
APS Resecuritization Trust
5.106%, 1M LIBOR + 2.600%, 04/27/47 (144A) (b) | | | 679,411 | | | | 691,080 | |
5.356%, 1M LIBOR + 2.850%, 09/27/46 (144A) (b) | | | 2,807,966 | | | | 2,895,217 | |
Ari Investments LLC
4.480%, 01/06/25 (k) | | | 1,023,181 | | | | 1,023,181 | |
Banc of America Alternative Loan Trust
5.500%, 10/25/35 | | | 1,168,237 | | | | 1,150,334 | |
Bear Stearns Asset-Backed Securities Trust
6.250%, 12/25/35 | | | 2,472,383 | | | | 2,378,476 | |
6.250%, 02/25/36 | | | 2,912,882 | | | | 2,548,009 | |
Chase Mortgage Finance Trust
6.000%, 12/25/37 | | | 9,493,651 | | | | 7,016,016 | |
CIM Trust
3.015%, 06/25/57 (144A) (b) | | | 631,432 | | | | 609,308 | |
Countrywide Alternative Loan Trust
2.646%, 1M LIBOR + 0.140%, 04/25/47 (b) | | | 828,526 | | | | 783,942 | |
2.660%, 1M LIBOR + 0.190%, 03/20/47 (b) | | | 1,849,636 | | | | 1,550,780 | |
2.670%, 1M LIBOR + 0.200%, 07/20/46 (b) | | | 2,936,367 | | | | 2,219,372 | |
2.696%, 1M LIBOR + 0.190%, 10/25/46 (b) | | | 1,138,438 | | | | 1,083,800 | |
2.716%, 1M LIBOR + 0.210%, 07/25/46 (b) | | | 1,511,497 | | | | 1,421,966 | |
2.736%, 1M LIBOR + 0.230%, 11/25/36 (b) | | | 566,320 | | | | 436,801 | |
2.856%, 1M LIBOR + 0.350%, 06/25/35 (b) | | | 1,577,760 | | | | 1,397,362 | |
3.106%, 1M LIBOR + 0.600%, 01/25/36 (b) | | | 626,904 | | | | 529,580 | |
3.887%, 12M MTA + 1.730%, 11/25/46 (b) | | | 3,251,232 | | | | 2,805,861 | |
5.500%, 04/25/37 | | | 898,249 | | | | 706,598 | |
6.000%, 05/25/37 | | | 3,237,922 | | | | 2,291,381 | |
Countrywide Home Loan Mortgage Pass-Through Trust
3.117%, 12M MTA + 0.960%, 04/25/46 (b) | | | 4,082,871 | | | | 2,059,396 | |
Credit Suisse Mortgage Capital Certificates
2.675%, 1M LIBOR + 0.180%, 03/27/36 (144A) (b) | | | 2,142,162 | | | | 1,802,979 | |
6.500%, 10/27/37 (144A) | | | 2,615,084 | | | | 1,496,214 | |
CSFB Mortgage-Backed Pass-Through Certificates
3.856%, 1M LIBOR + 1.350%, 11/25/35 (b) | | | 472,072 | | | | 168,252 | |
DeutscheALT-A Securities Mortgage Loan Trust
2.676%, 1M LIBOR + 0.170%, 08/25/47 (b) | | | 566,619 | | | | 386,509 | |
|
| Collateralized Mortgage Obligations—(Continued) | |
DeutscheALT-A Securities, Inc. Alternate Loan Trust
2.822%, 1M LIBOR + 0.500%, 01/27/37 (144A) (b) | | | 133,087 | | | | 126,048 | |
GreenPoint Mortgage Funding Trust
4.157%, 12M MTA + 2.000%, 03/25/36 (b) | | | 199,586 | | | | 188,502 | |
GSR Mortgage Loan Trust
6.000%, 07/25/37 | | | 719,833 | | | | 631,992 | |
IndyMac INDX Mortgage Loan Trust
3.743%, 09/25/37 (b) | | | 894,436 | | | | 617,888 | |
JPMorgan Alternative Loan Trust
2.716%, 1M LIBOR + 0.210%, 03/25/37 (b) | | | 1,281,458 | | | | 1,174,855 | |
4.107%, 05/25/37 (b) | | | 319,345 | | | | 284,113 | |
JPMorgan Mortgage Trust
6.500%, 08/25/36 | | | 284,062 | | | | 208,070 | |
LSTAR Securities Investment, Ltd.
3.849%, 1M LIBOR + 1.550%, 04/01/21 (144A) (b) | | | 1,409,564 | | | | 1,379,720 | |
MASTR Resecuritization Trust
2.721%, 08/25/37 (144A) (b) | | | 487,144 | | | | 343,881 | |
MCM Capital LLC
Zero Coupon, 10/25/28 (m) | | | 5,300,000 | | | | 1,506,260 | |
4.000%, 10/25/28 | | | 3,890,000 | | | | 3,839,430 | |
Merrill Lynch Mortgage Investors Trust
3.856%, 05/25/36 (b) | | | 1,620,968 | | | | 1,466,982 | |
Mortgage Loan Resecuritization Trust
2.689%, 1M LIBOR + 0.340%, 04/16/36 (144A) (b) | | | 3,845,419 | | | | 3,359,481 | |
Nomura Asset Acceptance Corp. Alternative Loan Trust
6.634%, 05/25/36 | | | 266,767 | | | | 99,447 | |
Seasoned Credit Risk Transfer Trust
Zero Coupon, 07/25/56 (m) | | | 835,092 | | | | 58,012 | |
1.236%, 07/25/56 (b) (c) | | | 1,106,185 | | | | 126,568 | |
4.750%, 07/25/56 (b) | | | 540,000 | | | | 518,123 | |
4.750%, 05/25/57 (b) | | | 150,000 | | | | 141,469 | |
6.879%, 05/25/57 (b) | | | 169,869 | | | | 85,729 | |
Structured Adjustable Rate Mortgage Loan Trust
3.790%, 04/25/36 (b) | | | 379,034 | | | | 312,945 | |
3.960%, 04/25/47 (b) | | | 1,075,390 | | | | 829,206 | |
Structured Asset Mortgage Investments Trust
2.696%, 1M LIBOR + 0.190%, 06/25/36 (b) | | | 1,485,344 | | | | 1,398,083 | |
2.716%, 1M LIBOR + 0.210%, 05/25/46 (b) | | | 273,901 | | | | 230,406 | |
2.736%, 1M LIBOR + 0.230%, 02/25/36 (b) | | | 1,983,437 | | | | 1,889,612 | |
| | | | | | | | |
| | | | | | | 60,983,117 | |
| | | | | | | | |
|
| Commercial Mortgage-Backed Securities—2.9% | |
AOA Mortgage Trust
3.010%, 12/13/29 (144A) (b) | | | 460,000 | | | | 448,961 | |
AREIT Trust
3.290%, 1M LIBOR + 0.850%, 02/14/35 (144A) (b) | | | 228,892 | | | | 228,765 | |
Ashford Hospitality Trust, Inc.
4.555%, 1M LIBOR + 2.100%, 04/15/35 (144A) (b) | | | 640,000 | | | | 630,413 | |
Atrium Hotel Portfolio Trust
4.405%, 1M LIBOR + 1.950%, 12/15/36 (144A) (b) | | | 1,540,000 | | | | 1,520,828 | |
5.505%, 1M LIBOR + 3.050%, 12/15/36 (144A) (b) | | | 480,000 | | | | 469,375 | |
BAMLL Commercial Mortgage Securities Trust
3.596%, 04/14/33 (144A) (b) | | | 250,000 | | | | 236,440 | |
3.606%, 08/14/34 (144A) (b) | | | 2,470,000 | | | | 2,227,098 | |
3.955%, 1M LIBOR + 1.500%, 11/15/32 (144A) (b) | | | 300,000 | | | | 300,000 | |
4.455%, 1M LIBOR + 2.000%, 11/15/32 (144A) (b) | | | 630,000 | | | | 630,000 | |
See accompanying notes to financial statements.
BHFTII-30
Brighthouse Funds Trust II
BlackRock Bond Income Portfolio
Schedule of Investments as of December 31, 2018
Mortgage-Backed Securities—(Continued)
| | | | | | | | |
| Security Description | | Principal
Amount* | | | Value | |
|
| Commercial Mortgage-Backed Securities—(Continued) | |
Banc of America Commercial Mortgage Trust
0.630%, 02/15/50 (b) (c) | | | 4,070,000 | | | $ | 182,131 | |
1.287%, 02/15/50 (144A) (b) (c) | | | 2,000,000 | | | | 172,440 | |
5.482%, 01/15/49 (b) | | | 142,151 | | | | 142,534 | |
Bancorp Commercial Mortgage Trust (The)
3.305%, 1M LIBOR + 0.850%, 01/15/33 (144A) (b) | | | 640,252 | | | | 634,662 | |
BANK
4.217%, 08/15/61 | | | 530,000 | | | | 548,919 | |
Bayview Commercial Asset Trust
2.756%, 1M LIBOR + 0.250%, 10/25/36 (144A) (b) | | | 243,388 | | | | 229,597 | |
2.806%, 1M LIBOR + 0.300%, 01/25/36 (144A) (b) | | | 131,700 | | | | 125,159 | |
2.806%, 1M LIBOR + 0.300%, 10/25/36 (144A) (b) | | | 247,658 | | | | 234,213 | |
2.866%, 1M LIBOR + 0.360%, 04/25/36 (144A) (b) | | | 155,886 | | | | 149,639 | |
2.956%, 1M LIBOR + 0.450%, 01/25/36 (144A) (b) | | | 98,043 | | | | 93,687 | |
4.006%, 1M LIBOR + 1.500%, 12/25/37 (144A) (b) | | | 720,000 | | | | 539,870 | |
BB-UBS Trust
0.596%, 11/05/36 (144A) (b) (c) | | | 85,480,000 | | | | 2,835,064 | |
4.026%, 11/05/36 (144A) (b) | | | 330,000 | | | | 311,111 | |
BBCMS Mortgage Trust
3.177%, 1M LIBOR + 0.722%, 03/15/37 (144A) (b) | | | 280,000 | | | | 275,072 | |
Bear Stearns Commercial Mortgage Securities Trust
5.465%, 01/12/45 (b) | | | 268,375 | | | | 269,840 | |
Benchmark Mortgage Trust
4.208%, 07/15/51 | | | 400,000 | | | | 415,613 | |
BHMS Mortgage Trust
3.705%, 1M LIBOR + 1.250%, 07/15/35 (144A) (b) | | | 780,000 | | | | 776,143 | |
4.355%, 1M LIBOR + 1.900%, 07/15/35 (144A) (b) | | | 270,000 | | | | 266,295 | |
BSPRT Issuer, Ltd.
3.275%, 1M LIBOR + 0.820%, 10/15/34 (144A) (b) | | | 67,760 | | | | 67,668 | |
BWAY Mortgage Trust
3.446%, 03/10/33 (144A) | | | 1,495,000 | | | | 1,458,998 | |
3.454%, 03/10/33 (144A) | | | 2,690,000 | | | | 2,678,778 | |
3.633%, 03/10/33 (144A) | | | 600,000 | | | | 583,693 | |
BX Commercial Mortgage Trust
5.455%, 1M LIBOR + 3.000%, 11/15/35 (144A) (b) | | | 4,423,400 | | | | 4,376,424 | |
BXP Trust
3.552%, 08/13/37 (144A) (b) | | | 760,000 | | | | 690,924 | |
CCRESG Commercial Mortgage Trust
5.488%, 04/10/29 (144A) (b) | | | 230,000 | | | | 234,965 | |
CD Mortgage Trust
3.631%, 02/10/50 | | | 350,000 | | | | 350,628 | |
5.648%, 10/15/48 | | | 422,795 | | | | 434,483 | |
CFCRE Commercial Mortgage Trust
0.728%, 05/10/58 (b) (c) | | | 2,370,000 | | | | 109,307 | |
1.732%, 05/10/58 (b) (c) | | | 2,516,207 | | | | 236,808 | |
CGDBB Commercial Mortgage Trust
3.245%, 1M LIBOR + 0.790%, 07/15/32 (144A) (b) | | | 1,490,000 | | | | 1,476,071 | |
4.055%, 1M LIBOR + 1.600%, 07/15/32 (144A) (b) | | | 1,110,000 | | | | 1,092,012 | |
4.605%, 1M LIBOR + 2.150%, 07/15/32 (144A) (b) | | | 1,680,000 | | | | 1,653,636 | |
Citigroup Commercial Mortgage Trust
4.834%, 04/15/49 (b) | | | 40,000 | | | | 40,801 | |
CLNS Trust
5.900%, 1M LIBOR + 3.500%, 06/11/32 (144A) (b) | | | 665,000 | | | | 659,735 | |
Commercial Mortgage Pass-Through Certificates Mortgage Trust
0.060%, 02/10/35 (144A) (b) (c) | | | 60,958,000 | | | | 337,098 | |
1.065%, 03/10/46 (b) (c) | | | 25,113,101 | | | | 714,458 | |
|
| Commercial Mortgage-Backed Securities—(Continued) | |
Commercial Mortgage Pass-Through Certificates Mortgage Trust
3.179%, 10/10/36 (144A) (b) | | | 270,000 | | | | 244,745 | |
3.183%, 02/10/48 | | | 513,000 | | | | 506,033 | |
3.187%, 1M LIBOR + 0.800%, 08/13/27 (144A) (b) | | | 700,000 | | | | 699,394 | |
3.550%, 07/15/47 | | | 550,000 | | | | 553,456 | |
3.685%, 05/10/48 (144A) (b) | | | 730,000 | | | | 721,050 | |
3.796%, 08/10/47 | | | 540,000 | | | | 550,768 | |
3.977%, 05/10/47 | | | 1,394,000 | | | | 1,434,823 | |
3.987%, 1M LIBOR + 1.600%, 02/13/32 (144A) (b) | | | 1,280,000 | | | | 1,274,321 | |
4.006%, 04/10/47 | | | 400,000 | | | | 411,942 | |
4.051%, 04/10/47 | | | 1,896,000 | | | | 1,956,548 | |
4.236%, 02/10/47 (b) | | | 320,000 | | | | 333,055 | |
4.300%, 07/10/48 (b) | | | 1,600,000 | | | | 1,587,462 | |
4.418%, 12/10/47 (b) | | | 420,000 | | | | 421,264 | |
4.544%, 08/10/48 (b) | | | 1,256,000 | | | | 1,227,298 | |
4.637%, 1M LIBOR + 2.250%, 02/13/32 (144A) (b) | | | 550,000 | | | | 548,640 | |
5.637%, 1M LIBOR + 3.250%, 02/13/32 (144A) (b) | | | 50,000 | | | | 49,483 | |
5.682%, 06/10/44 (144A) (b) | | | 184,711 | | | | 187,305 | |
Commercial Mortgage Trust
3.685%, 05/10/48 (144A) (b) | | | 1,740,000 | | | | 1,718,876 | |
Core Industrial Trust
3.077%, 02/10/34 (144A) | | | 1,975,068 | | | | 1,966,090 | |
3.849%, 02/10/34 (144A) (b) | | | 2,360,000 | | | | 2,293,284 | |
Credit Suisse First Boston Mortgage Securities Corp.
4.952%, 07/15/37 (b) | | | 60,336 | | | | 60,864 | |
5.234%, 10/15/39 (144A) (b) | | | 250,000 | | | | 250,329 | |
Credit Suisse Mortgage Capital Certificates Trust
3.405%, 1M LIBOR + 0.950%, 12/15/30 (144A) (b) | | | 280,000 | | | | 278,850 | |
4.055%, 1M LIBOR + 1.600%, 11/15/33 (144A) (b) | | | 201,070 | | | | 201,570 | |
CSAIL Commercial Mortgage Trust
0.135%, 11/15/50 (b) (c) | | | 3,940,000 | | | | 64,990 | |
DBJPM Mortgage Trust
1.000%, 06/10/50 (b) (c) | | | 2,060,000 | | | | 128,907 | |
DBUBS Mortgage Trust
3.452%, 10/10/34 (144A) | | | 850,000 | | | | 844,269 | |
3.530%, 10/10/34 (144A) (b) | | | 1,710,000 | | | | 1,594,126 | |
Eleven Madison Trust Mortgage Trust
3.555%, 09/10/35 (144A) (b) | | | 440,000 | | | | 442,528 | |
GAHR Commercial Mortgage Trust
3.382%, 12/15/34 (144A) (b) | | | 630,000 | | | | 618,362 | |
GPMT, Ltd.
3.379%, 1M LIBOR + 0.900%, 11/21/35 (144A) (b) | | | 869,000 | | | | 864,937 | |
GS Mortgage Securities Corp. II
5.366%, 05/03/32 (144A) | | | 840,000 | | | | 934,846 | |
GS Mortgage Securities Corp. Trust
2.856%, 05/10/34 (144A) | | | 710,000 | | | | 703,750 | |
3.435%, 12/10/27 (144A) (b) | | | 11,042,358 | | | | 10,931,221 | |
3.755%, 1M LIBOR + 1.300%, 07/15/32 (144A) (b) | | | 80,000 | | | | 79,121 | |
3.955%, 1M LIBOR + 1.500%, 07/15/32 (144A) (b) | | | 170,000 | | | | 167,357 | |
4.255%, 1M LIBOR + 1.800%, 07/15/32 (144A) (b) | | | 70,000 | | | | 68,918 | |
4.805%, 1M LIBOR + 2.350%, 02/15/37 (144A) (b) | | | 230,000 | | | | 229,943 | |
4.955%, 1M LIBOR + 2.500%, 07/15/32 (144A) (b) | | | 30,000 | | | | 29,503 | |
GS Mortgage Securities Trust
3.000%, 08/10/50 (144A) | | | 240,000 | | | | 199,542 | |
3.345%, 07/10/48 | | | 131,650 | | | | 112,176 | |
3.931%, 09/10/47 | | | 800,000 | | | | 819,876 | |
See accompanying notes to financial statements.
BHFTII-31
Brighthouse Funds Trust II
BlackRock Bond Income Portfolio
Schedule of Investments as of December 31, 2018
Mortgage-Backed Securities—(Continued)
| | | | | | | | |
| Security Description | | Principal
Amount* | | | Value | |
|
| Commercial Mortgage-Backed Securities—(Continued) | |
GS Mortgage Securities Trust
4.411%, 07/10/48 (b) | | | 500,000 | | | $ | 494,337 | |
4.529%, 04/10/47 (b) | | | 50,000 | | | | 49,715 | |
4.689%, 06/10/47 (144A) (b) | | | 30,000 | | | | 26,811 | |
HMH Trust
3.062%, 07/05/31 (144A) | | | 1,210,000 | | | | 1,184,693 | |
IMT Trust
3.478%, 06/15/34 (144A) | | | 540,000 | | | | 542,904 | |
3.497%, 06/15/34 (144A) (b) | | | 570,000 | | | | 544,486 | |
JPMBB Commercial Mortgage Securities Trust
0.805%, 05/15/48 (b) (c) | | | 1,140,573 | | | | 34,016 | |
0.878%, 09/15/47 (b) (c) | | | 1,521,122 | | | | 58,610 | |
3.775%, 08/15/47 | | | 550,000 | | | | 558,549 | |
3.801%, 09/15/47 | | | 220,000 | | | | 223,645 | |
4.117%, 12/15/48 (144A) (b) | | | 300,000 | | | | 283,137 | |
JPMCC Commercial Mortgage Securities Trust
4.050%, 09/15/50 | | | 110,000 | | | | 108,095 | |
4.646%, 03/15/50 (144A) (b) | | | 650,000 | | | | 614,972 | |
JPMDB Commercial Mortgage Securities Trust
0.750%, 12/15/49 (144A) (b) (c) | | | 2,067,000 | | | | 101,237 | |
JPMorgan Chase Commercial Mortgage Securities Trust
0.513%, 04/15/46 (b) (c) | | | 4,900,000 | | | | 105,036 | |
0.750%, 08/15/49 (144A) (b) (c) | | | 5,300,000 | | | | 240,257 | |
0.798%, 12/15/49 (b) (c) | | | 964,491 | | | | 36,640 | |
2.854%, 10/06/38 (144A) (b) | | | 1,670,000 | | | | 1,586,990 | |
3.755%, 1M LIBOR + 1.300%, 06/15/45 (144A) (b) | | | 130,000 | | | | 132,681 | |
4.241%, 01/15/49 (b) | | | 970,000 | | | | 904,628 | |
Lehman Brothers Small Balance Commercial Mortgage Trust
2.756%, 1M LIBOR + 0.250%, 03/25/37 (144A) (b) | | | 551,115 | | | | 529,638 | |
LSTAR Commercial Mortgage Trust
1.111%, 03/10/50 (144A) (b) (c) | | | 890,408 | | | | 41,895 | |
Merrill Lynch Mortgage Trust
6.316%, 09/12/42 (144A) (b) | | | 490,000 | | | | 501,017 | |
Morgan Stanley Bank of America Merrill Lynch Trust
1.187%, 12/15/47 (144A) (b) (c) | | | 1,810,000 | | | | 101,940 | |
1.437%, 11/15/49 (b) (c) | | | 1,094,056 | | | | 86,417 | |
3.060%, 10/15/48 (144A) | | | 322,000 | | | | 273,734 | |
3.892%, 06/15/47 | | | 3,000,000 | | | | 3,066,618 | |
4.132%, 07/15/50 (144A) (b) | | | 297,000 | | | | 268,687 | |
4.527%, 10/15/48 (b) | | | 170,000 | | | | 170,418 | |
4.558%, 05/15/50 (b) | | | 300,000 | | | | 296,786 | |
Morgan Stanley Capital Trust
2.202%, 06/15/50 (144A) (b) (c) | | | 1,190,000 | | | | 178,941 | |
2.546%, 06/15/50 (144A) | | | 1,510,000 | | | | 1,152,998 | |
3.446%, 07/13/29 (144A) (b) | | | 540,000 | | | | 517,141 | |
4.031%, 05/15/48 (144A) (b) | | | 110,000 | | | | 98,315 | |
4.031%, 05/15/48 (b) | | | 150,000 | | | | 147,092 | |
4.177%, 07/15/51 | | | 470,000 | | | | 484,901 | |
4.281%, 06/15/50 (b) | | | 339,000 | | | | 326,435 | |
4.405%, 1M LIBOR + 1.950%, 11/15/34 (144A) (b) | | | 330,000 | | | | 325,181 | |
5.005%, 1M LIBOR + 2.550%, 07/15/35 (144A) (b) | | | 640,000 | | | | 629,592 | |
5.055%, 1M LIBOR + 2.600%, 11/15/34 (144A) (b) | | | 1,977,000 | | | | 1,943,604 | |
5.241%, 10/12/52 (b) | | | 45,955 | | | | 46,076 | |
5.505%, 1M LIBOR + 3.050%, 11/15/34 (144A) (b) | | | 610,000 | | | | 601,625 | |
Natixis Commercial Mortgage Securities Trust
3.257%, 1M LIBOR + 0.950%, 06/15/35 (144A) (b) | | | 240,000 | | | | 237,035 | |
|
| Commercial Mortgage-Backed Securities—(Continued) | |
Olympic Tower Mortgage Trust
0.379%, 05/10/39 (144A) (b) (c) | | | 13,300,000 | | | | 388,387 | |
3.945%, 05/10/39 (144A) (b) | | | 1,345,000 | | | | 1,200,672 | |
One Market Plaza Trust
Zero Coupon, 02/10/32 (144A) (b) (c) | | | 4,222,000 | | | | 4 | |
0.090%, 02/10/32 (144A) (b) (c) | | | 21,110,000 | | | | 92,251 | |
Park Avenue Mortgage Trust
4.574%, 1M LIBOR + 2.119%, 09/15/34 (144A) (b) | | | 1,750,000 | | | | 1,714,766 | |
Park Avenue Trust
0.149%, 06/05/37 (144A) (b) (c) | | 5,000,000 | | | 71,830 | |
3.657%, 06/05/37 (144A) (b) | | | 207,000 | | | | 185,802 | |
Prima Capital CRE Securitization, Ltd.
4.000%, 08/24/49 (144A) | | | 260,000 | | | | 256,658 | |
Resource Capital Corp., Ltd.
3.255%, 1M LIBOR + 0.800%, 07/15/34 (144A) (b) | | | 347,608 | | | | 347,718 | |
4.455%, 1M LIBOR + 2.000%, 07/15/34 (144A) (b) | | | 331,911 | | | | 325,559 | |
UBS Commercial Mortgage Trust
1.010%, 12/15/51 (b) (c) | | | 1,440,000 | | | | 108,829 | |
Velocity Commercial Capital Loan Trust
3.661%, 10/25/46 (b) | | | 150,000 | | | | 150,243 | |
4.240%, 11/25/47 (144A) (b) | | | 223,711 | | | | 221,741 | |
4.450%, 05/25/47 (144A) (b) | | | 150,000 | | | | 148,013 | |
4.458%, 10/25/46 (b) | | | 100,000 | | | | 100,006 | |
4.936%, 1M LIBOR + 2.430%, 06/25/45 (144A) (b) | | | 43,149 | | | | 43,274 | |
5.000%, 11/25/47 (144A) (b) | | | 130,756 | | | | 129,387 | |
5.350%, 05/25/47 (144A) (b) | | | 150,000 | | | | 150,456 | |
5.498%, 10/25/46 (b) | | | 140,000 | | | | 142,853 | |
7.226%, 10/25/46 (b) | | | 160,000 | | | | 165,151 | |
Waldorf Astoria Boca Raton Trust
3.805%, 1M LIBOR + 1.350%, 06/15/29 (144A) (b) | | | 1,590,000 | | | | 1,586,892 | |
Wells Fargo Commercial Mortgage Trust
0.763%, 05/15/51 (b) (c) | | | 3,984,793 | | | | 217,096 | |
0.932%, 12/15/48 (b) (c) | | | 1,308,820 | | | | 63,056 | |
1.265%, 08/15/49 (144A) (b) (c) | | | 1,430,000 | | | | 108,208 | |
2.600%, 11/15/50 (144A) (b) | | | 505,000 | | | | 403,491 | |
3.282%, 1M LIBOR + 0.850%, 12/13/31 (144A) (b) | | | 490,000 | | | | 487,679 | |
3.453%, 07/15/50 | | | 449,000 | | | | 440,462 | |
3.599%, 12/15/48 (b) | | | 35,000 | | | | 31,913 | |
3.718%, 12/15/48 | | | 190,000 | | | | 192,124 | |
3.749%, 06/15/36 (144A) (b) | | | 270,000 | | | | 272,938 | |
3.809%, 12/15/48 | | | 630,000 | | | | 643,605 | |
4.355%, 09/15/50 (144A) (b) | | | 150,000 | | | | 135,185 | |
4.612%, 1M LIBOR + 2.157%, 12/15/36 (144A) (b) | | | 270,000 | | | | 266,550 | |
WF-RBS Commercial Mortgage Trust
3.405%, 1M LIBOR + 0.950%, 03/15/44 (144A) (b) | | | 23,999 | | | | 24,074 | |
3.678%, 08/15/47 | | | 595,000 | | | | 603,860 | |
3.758%, 09/15/57 (b) | | | 1,540,000 | | | | 1,459,348 | |
| | | | | | | | |
| | | | | | | 103,139,784 | |
| | | | | | | | |
Total Mortgage-Backed Securities
(Cost $167,840,118) | | | | | | | 164,122,901 | |
| | | | | | | | |
See accompanying notes to financial statements.
BHFTII-32
Brighthouse Funds Trust II
BlackRock Bond Income Portfolio
Schedule of Investments as of December 31, 2018
Foreign Government—2.6%
| | | | | | | | |
| Security Description | | Principal
Amount* | | | Value | |
|
| Municipal —0.0% | |
Provincia de Rio Negro
7.750%, 12/07/25 (144A) | | | 600,000 | | | $ | 420,006 | |
| | | | | | | | |
|
| Sovereign—2.6% | |
Argentina Bonar Bonds
8.000%, 10/08/20 | | | 1,272,000 | | | | 1,164,040 | |
8.750%, 05/07/24 | | | 1,255,133 | | | | 1,170,412 | |
Argentine Republic Government International Bonds
4.625%, 01/11/23 | | | 628,000 | | | | 496,120 | |
5.625%, 01/26/22 | | | 1,839,000 | | | | 1,551,656 | |
5.875%, 01/11/28 (f) | | | 758,000 | | | | 544,813 | |
6.875%, 04/22/21 | | | 1,689,000 | | | | 1,526,028 | |
6.875%, 01/11/48 (f) | | | 1,738,000 | | | | 1,210,083 | |
7.125%, 06/28/2117 | | | 1,020,000 | | | | 729,300 | |
7.625%, 04/22/46 | | | 1,259,000 | | | | 912,146 | |
Bonos de la Nacion Argentina con Ajuste por CER
4.000%, 03/06/20 (ARS) (n) | | | 12,117,000 | | | | 405,402 | |
Brazilian Government International Bond
4.625%, 01/13/28 (f) | | | 740,000 | | | | 711,517 | |
Colombia Government International Bond
3.875%, 04/25/27 (f) | | | 9,097,000 | | | | 8,687,635 | |
Colombian TES
7.000%, 06/30/32 (COP) | | | 6,598,000,000 | | | | 2,004,242 | |
7.500%, 08/26/26 (COP) | | | 9,136,000,000 | | | | 2,964,104 | |
Dominican Republic International Bond
5.950%, 01/25/27 | | | 687,000 | | | | 684,424 | |
Ecuador Government International Bond
7.875%, 01/23/28 | | | 463,000 | | | | 376,188 | |
Egypt Government International Bonds
4.750%, 04/16/26 (144A) (EUR) | | | 502,000 | | | | 520,368 | |
5.577%, 02/21/23 (144A) | | | 348,000 | | | | 329,786 | |
5.750%, 04/29/20 | | | 1,166,000 | | | | 1,175,183 | |
6.125%, 01/31/22 | | | 592,000 | | | | 580,799 | |
7.903%, 02/21/48 (144A) | | | 880,000 | | | | 757,046 | |
Hungary Government International Bond
5.375%, 03/25/24 | | | 3,500,000 | | | | 3,746,050 | |
Indonesia Government International Bond
4.100%, 04/24/28 (f) | | | 2,460,000 | | | | 2,393,368 | |
Indonesia Treasury Bond
7.500%, 05/15/38 (IDR) | | | 30,285,000,000 | | | | 1,937,566 | |
Mexican Bonos
7.500%, 06/03/27 (MXN) | | | 18,052,300 | | | | 853,178 | |
7.750%, 11/23/34 (MXN) | | | 33,471,800 | | | | 1,544,658 | |
7.750%, 11/13/42 (MXN) | | | 43,000,000 | | | | 1,932,049 | |
8.500%, 11/18/38 (MXN) | | | 42,000,000 | | | | 2,057,026 | |
10.000%, 11/20/36 (MXN) | | | 20,000,000 | | | | 1,120,063 | |
Mexico Government International Bonds
3.750%, 01/11/28 (f) | | | 1,936,000 | | | | 1,812,115 | |
4.150%, 03/28/27 | | | 23,125,000 | | | | 22,359,794 | |
Nigeria Government International Bond
9.248%, 01/21/49 (144A) | | | 1,273,000 | | | | 1,234,611 | |
Panama Government International Bond
3.750%, 03/16/25 | | | 3,490,000 | | | | 3,456,880 | |
Peruvian Government International Bonds
4.125%, 08/25/27 (f) | | | 1,233,000 | | | | 1,273,073 | |
7.350%, 07/21/25 | | | 2,900,000 | | | | 3,523,500 | |
|
| Sovereign—(Continued) | |
Philippine Government International Bond
3.000%, 02/01/28 | | | 7,002,000 | | | | 6,625,236 | |
Republic of South Africa Government Bond
8.750%, 02/28/48 (ZAR) | | | 15,570,000 | | | | 963,473 | |
Republic of South Africa Government International Bond
4.850%, 09/27/27 (f) | | | 536,000 | | | | 499,498 | |
Russian Foreign Bond - Eurobond
4.250%, 06/23/27 | | | 800,000 | | | | 760,557 | |
Turkey Government International Bond
5.125%, 02/17/28 | | | 751,000 | | | | 657,440 | |
Uruguay Government International Bond
4.375%, 10/27/27 | | | 3,975,565 | | | | 3,977,195 | |
| | | | | | | | |
| | | | | | | 91,228,622 | |
| | | | | | | | |
Total Foreign Government
(Cost $95,387,184) | | | | | | | 91,648,628 | |
| | | | | | | | |
|
| Floating Rate Loans (o)—1.3% | |
|
| Commercial Services—0.2% | |
Goldman Sachs Lending Partners, LLC
Term Loan A, 4.272%, 1M LIBOR + 1.750%, 08/26/20 (i) (j) | | | 1,504,182 | | | | 1,504,182 | |
Term Loan B, 4.474%, 1M LIBOR + 2.100%, 08/26/20 (i) (j) | | | 3,665,118 | | | | 3,665,118 | |
| | | | | | | | |
| | | | | | | 5,169,300 | |
| | | | | | | | |
|
| Distribution/Wholesale—0.3% | |
Chimera Special Holding LLC
Term Loan, 4.347%, 1M LIBOR + 2.000%, 11/01/20 (k) | | | 10,458,553 | | | | 10,458,553 | |
| | | | | | | | |
|
| Diversified Financial Services—0.7% | |
Caliber Home Loans, Inc.
Revolver, 5.988%, 3M LIBOR + 3.250%, 03/03/23 (k) | | | 4,581,545 | | | | 4,570,091 | |
LSTAR Securities Financing Vehicle:
Term Loan, 4.349%, 1M LIBOR + 2.000%,
04/01/21 (i) (j) (k) | | | 11,518,159 | | | | 11,477,845 | |
Roundpoint Mortgage Servicing Corp.
Term Loan, 5.724%, 3M LIBOR + 3.375%,
08/08/20 (i) (j) (k) (l) | | | 8,397,567 | | | | 8,397,567 | |
| | | | | | | | |
| | | | | | | 24,445,503 | |
| | | | | | | | |
|
| Entertainment—0.1% | |
Stars Group Holdings B.V. (The)
Incremental Term Loan, 6.303%, 3M LIBOR + 3.500%, 07/10/25 | | | 1,405,574 | | | | 1,365,666 | |
| | | | | | | | |
|
| Iron/Steel—0.0% | |
Samarco Mineracao S.A.
Delayed Draw Term Loan, 12/31/18 | | | 543,000 | | | | 399,105 | |
| | | | | | | | |
|
| Miscellaneous Manufacturing—0.0% | |
Gates Global LLC
Term Loan B, 5.272%, 1M LIBOR + 2.750%, 04/01/24 | | | 118,776 | | | | 113,189 | |
| | | | | | | | |
See accompanying notes to financial statements.
BHFTII-33
Brighthouse Funds Trust II
BlackRock Bond Income Portfolio
Schedule of Investments as of December 31, 2018
Floating Rate Loans (o)—(Continued)
| | | | | | | | |
| Security Description | | Shares/
Principal
Amount* | | | Value | |
|
| Pipelines—0.0% | |
AL Midcoast Holdings LLC
Term Loan B, 8.303%, 3M LIBOR + 5.500%, 07/31/25 | | | 1,097,250 | | | $ | 1,060,218 | |
| | | | | | | | |
|
| Retail—0.0% | |
Foundation Building Materials, LLC
Term Loan B, 5.705%, 1M LIBOR + 3.250%, 08/13/25 | | | 1,175,000 | | | | 1,117,719 | |
| | | | | | | | |
Total Floating Rate Loans
(Cost $44,415,088) | | | | | | | 44,129,253 | |
| | | | | | | | |
|
| Escrow Shares—0.0% | |
|
| Savings & Loans—0.0% | |
Washington Mutual Bank (i) (j) | | | 5,027,000 | | | | 1 | |
Washington Mutual Bank (i) (j) | | | 1,310,000 | | | | 0 | |
Washington Mutual Bank (i) (j) | | | 2,440,000 | | | | 0 | |
| | | | | | | | |
Total Escrow Shares
(Cost $0) | | | | | | | 1 | |
| | | | | | | | |
|
| Short-Term Investments—3.5% | |
|
| Foreign Government—3.2% | |
Japan Treasury Bill
Zero Coupon, 01/21/19 (p) | | | 12,245,750,000 | | | | 111,733,796 | |
| | | | | | | | |
|
| Commercial Paper—0.2% | |
AT&T, Inc.
2.911%, 03/07/19 (p) | | | 5,060,000 | | | | 5,031,558 | |
General Motors Financial Co., Inc.
3.690%, 03/27/19 (p) | | | 3,450,000 | | | | 3,423,832 | |
| | | | | | | | |
| | | | | | | 8,455,390 | |
| | | | | | | | |
|
| Repurchase Agreement—0.1% | |
Fixed Income Clearing Corp.
Repurchase Agreement dated 12/31/18 at 1.200%, due on 01/02/19 with a maturity value of $2,767,434; collateralized by U.S. Treasury Note at 2.875%, maturing 10/31/23, with a market value of $2,826,909. | | | 2,767,249 | | | | 2,767,249 | |
| | | | | | | | |
Total Short-Term Investments
(Cost $120,443,584) | | | | | | | 122,956,435 | |
| | | | | | | | |
|
| Securities Lending Reinvestments (q)—2.5% | |
|
| Certificates of Deposit—1.8% | |
Banco Del Estado De Chile New York
2.820%, 1M LIBOR + 0.350%, 05/20/19 (b) | | | 1,000,000 | | | | 999,979 | |
Bank of Nova Scotia
3.072%, 3M LIBOR + 0.280%, 03/20/19 (b) | | | 3,500,000 | | | | 3,501,396 | |
Barclays Bank plc
2.547%, 1M LIBOR + 0.200%, 02/04/19 (b) | | | 3,500,000 | | | | 3,499,668 | |
|
| Certificates of Deposit—(Continued) | |
Canadian Imperial Bank of Commerce
2.556%, 3M LIBOR + 0.120%, 01/14/19 (b) | | | 1,000,000 | �� | | | 999,872 | |
2.739%, 1M LIBOR + 0.270%, 07/19/19 (b) | | | 2,000,000 | | | | 1,999,188 | |
China Construction Bank Corp.
2.550%, 01/07/19 | | | 3,000,000 | | | | 3,000,000 | |
Citibank N.A.
2.490%, 02/04/19 | | | 3,000,000 | | | | 2,999,583 | |
Commonwealth Bank of Australia
2.617%, 3M LIBOR + 0.140%, 04/23/19 (b) | | | 1,000,000 | | | | 1,000,003 | |
Credit Agricole S.A.
2.500%, 02/12/19 | | | 2,000,000 | | | | 1,999,660 | |
Credit Industriel et Commercial
Zero Coupon, 01/25/19 | | | 987,228 | | | | 998,300 | |
Credit Industriel et Commercial (NY)
2.629%, 1M LIBOR + 0.250%, 02/05/19 (b) | | | 1,500,000 | | | | 1,500,038 | |
Credit Suisse AG
2.620%, 04/01/19 | | | 3,000,000 | | | | 2,998,446 | |
Mizuho Bank, Ltd., New York
2.649%, 1M LIBOR + 0.300%, 05/01/19 (b) | | | 2,000,000 | | | | 2,000,012 | |
Natixis S.A. New York
2.705%, 3M LIBOR + 0.090%, 05/10/19 (b) | | | 1,000,000 | | | | 999,370 | |
Royal Bank of Canada New York
2.650%, 1M LIBOR + 0.250%, 01/11/19 (b) | | | 2,500,000 | | | | 2,500,020 | |
2.665%, 1M LIBOR + 0.210%, 09/17/19 (b) | | | 2,000,000 | | | | 1,997,954 | |
Skandinaviska Enskilda Banken
2.645%, 1M LIBOR + 0.190%, 04/17/19 (b) | | | 3,000,000 | | | | 2,999,754 | |
Standard Chartered plc
2.686%, 1M LIBOR + 0.180%, 02/25/19 (b) | | | 2,000,000 | | | | 1,999,942 | |
Sumitomo Mitsui Banking Corp.
2.590%, 1M LIBOR + 0.190%, 04/11/19 (b) | | | 5,000,000 | | | | 4,998,165 | |
Sumitomo Mitsui Banking Corp., New York
2.549%, 1M LIBOR + 0.200%, 04/03/19 (b) | | | 1,000,030 | | | | 999,704 | |
Svenska Handelsbanken AB
2.620%, 3M LIBOR + 0.100%, 04/30/19 (b) | | | 4,000,000 | | | | 3,999,820 | |
Toronto-Dominion Bank
2.665%, 1M LIBOR + 0.210%, 09/17/19 (b) | | | 5,000,000 | | | | 4,995,240 | |
U.S. Bank N.A.
2.764%, 1M LIBOR + 0.260%, 07/23/19 (b) | | | 2,000,000 | | | | 2,000,000 | |
Wells Fargo Bank N.A.
2.560%, 3M LIBOR + 0.140%, 07/11/19 (b) | | | 5,000,000 | | | | 5,004,337 | |
Westpac Banking Corp.
2.850%, FEDEFF PRV + 0.450%, 02/15/19 (b) | | | 3,000,000 | | | | 2,999,981 | |
| | | | | | | | |
| | | | | | | 62,990,432 | |
| | | | | | | | |
|
| Commercial Paper—0.4% | |
Alpine Securities Ltd.
2.529%, 1M LIBOR + 0.180%, 04/03/19 (b) | | | 2,000,000 | | | | 1,999,446 | |
Banco Santander S.A.
2.740%, 02/07/19 | | | 2,482,494 | | | | 2,492,720 | |
HSBC Bank plc
2.842%, 1M LIBOR + 0.320%, 07/30/19 (b) | | | 1,000,000 | | | | 1,000,000 | |
ING Funding LLC
2.725%, 3M LIBOR + 0.110%, 05/10/19 (b) | | | 1,500,000 | | | | 1,499,823 | |
UBS AG
2.779%, 1M LIBOR + 0.430%, 02/01/19 (b) | | | 4,000,000 | | | | 4,000,980 | |
See accompanying notes to financial statements.
BHFTII-34
Brighthouse Funds Trust II
BlackRock Bond Income Portfolio
Schedule of Investments as of December 31, 2018
Securities Lending Reinvestments (q)—(Continued)
| | | | | | | | |
| Security Description | | Principal
Amount* | | | Value | |
|
| Commercial Paper—(Continued) | |
Westpac Banking Corp.
2.784%, 1M LIBOR + 0.280%, 05/24/19 (b) | | | 2,000,000 | | | $ | 1,999,920 | |
| | | | | | | | |
| | | | | | | 12,992,889 | |
| | | | | | | | |
|
| Repurchase Agreements—0.3% | |
Citadel Clearing LLC
Repurchase Agreement dated 12/31/18 at 3.000%, due on 04/02/19 with a maturity value of $1,511,500; collateralized by various Common Stock with an aggregate market value of $1,650,275. | | | 1,500,000 | | | | 1,500,000 | |
Citigroup Global Markets, Inc.
Repurchase Agreement dated 12/31/18 at 2.790%, due on 02/04/19 with a maturity value of $1,002,713; collateralized by U.S. Treasury Obligations at 0.000%, maturing 02/12/19, and various Common Stock with an aggregate market value of $1,088,319. | | | 1,000,000 | | | | 1,000,000 | |
Merrill Lynch, Pierce, Fenner & Smith, Inc.
Repurchase Agreement dated 12/31/18 at 2.940%, due on 04/02/19 with a maturity value of $3,022,540; collateralized by various Common Stock with an aggregate market value of $3,300,000. | | | 3,000,000 | | | | 3,000,000 | |
Repurchase Agreement dated 12/31/18 at 2.940%, due on 04/02/19 with a maturity value of $5,339,821; collateralized by various Common Stock with an aggregate market value of $5,830,000. | | | 5,300,000 | | | | 5,300,000 | |
| | | | | | | | |
| | | | | | | 10,800,000 | |
| | | | | | | | |
Total Securities Lending Reinvestments
(Cost $86,791,567) | | | | | | | 86,783,321 | |
| | | | | | | | |
Total Purchased Options—0.2% (r)
(Cost $6,613,154) | | | | | | | 7,011,429 | |
| | | | | | | | |
Total Investments—116.8%
(Cost $4,167,701,267) | | | | | | | 4,120,038,438 | |
Unfunded Loan Commitments—(0.1)%
(Cost $(2,241,504)) | | | | | | | (2,241,504 | ) |
Net Investments—116.7%
(Cost $4,165,459,763) | | | | | | | 4,117,796,934 | |
Other assets and liabilities (net)—(16.7)% | | | | | | | (588,212,974 | ) |
| | | | | | | | |
| Net Assets—100.0% | | | | | | $ | 3,529,583,960 | |
| | | | | | | | |
| | | | |
| * | | Principal and notional amounts stated in U.S. dollars unless otherwise noted. |
| (a) | | TBA (To Be Announced) Securities are purchased on a forward commitment basis with an approximate principal amount and no defined maturity date. The actual principal and maturity date will be determined upon settlement date. |
| (b) | | Variable or floating rate security. The stated rate represents the rate at December 31, 2018. Maturity date shown for callable securities reflects the earliest possible call date. For securities based on a published reference index and spread, the index and spread are indicated in the description above. For certain variable rate securities, the coupon rate is determined by the issuer/agent based on current market conditions. For certain asset- and mortgage-backed securities, the coupon rate may fluctuate based on changes of the underlying collateral or prepayments of principal. These securities do not indicate a reference index and spread in their description above. |
| (c) | | Interest only security. |
| (d) | | All or a portion of the security was pledged as collateral against open reverse repurchase agreements. As of December 31, 2018, the value of securities pledged amounted to $99,626,842. |
| (e) | | All or a portion of the security was pledged as collateral against open futures contracts. As of December 31, 2018, the market value of securities pledged was $7,553,001. |
| (f) | | All or a portion of the security was held on loan. As of December 31, 2018, the market value of securities loaned was $56,966,622 and the collateral received consisted of cash in the amount of $86,769,752. The cash collateral investments are disclosed in the Schedule of Investments and categorized as Securities Lending Reinvestments. |
| (g) | | Non-income producing; security is in default and/or issuer is in bankruptcy. |
| (h) | | Payment-in-kind security for which part of the income earned may be paid as additional principal. |
| (i) | | Significant unobservable inputs were used in the valuation of this portfolio security; i.e. Level 3. |
| (j) | | Security was valued in good faith under procedures approved by the Board of Trustees. As of December 31, 2018, these securities represent 0.9% of net assets. |
| (k) | | Restricted securities are not registered under the Securities Act of 1933 and are subject to legal restrictions on resale. These securities generally may be resold in transactions exempt from registration or to the public if the securities are subsequently registered. Disposal of these securities may involve time-consuming negotiations and prompt sale at an acceptable price may be difficult. As of December 31, 2018, the market value of restricted securities was $33,749,895, which is 1.0% of net assets. See details shown in the Restricted Securities table that follows. |
| (l) | | Unfunded or partially unfunded loan commitments. The Portfolio may enter into certain credit agreements for which all or a portion may be unfunded. The Portfolio is obligated to fund these commitments at the borrower’s discretion. |
| (m) | | Principal only security. |
| (n) | | Principal amount of security is adjusted for inflation. |
| (o) | | Floating rate loans (“Senior Loans”) often require prepayments from excess cash flows or permit the borrowers to repay at their election. The degree to which borrowers repay, whether as a contractual requirement or at their election, cannot be predicted with accuracy. As a result, the actual remaining maturity may be substantially less than the stated maturities shown. However, Senior Loans will have an expected average life of approximately two to four years. The stated interest rate represents the weighted average interest rate of all contracts within the senior loan facility and includes commitment fees on unfunded loan commitments, if any. Senior Loans typically have rates of interest which are determined either daily, monthly, quarterly or semi-annually by reference to a base lending rate, plus a premium. These base rates are primarily the London Interbank Offered Rate (“LIBOR”) and secondarily, the prime rate offered by one or more major United States banks (the “Prime Rate”) and the certificate of deposit (“CD”) rate or other base lending rates used by commercial lenders. |
| (p) | | The rate shown represents current yield to maturity. |
| (q) | | Represents investment of cash collateral received from securities on loan as of December 31, 2018. |
| (r) | | For a breakout of open positions, see details shown in the Purchased Options table that follows. |
| (144A)— | | Securities exempt from registration under Rule 144A of the Securities Act of 1933. These securities may be resold in transactions exempt from registration, normally to qualified institutional buyers. As of December 31, 2018, the market value of 144A securities was $622,909,066, which is 17.6% of net assets. |
See accompanying notes to financial statements.
BHFTII-35
Brighthouse Funds Trust II
BlackRock Bond Income Portfolio
Schedule of Investments as of December 31, 2018
| | | | | | | | | | | | | | | | |
Restricted Securities | | Acquisition
Date | | | Principal
Amount | | | Cost | | | Value | |
Ari Investments LLC, 4.480%, 01/06/25 | | | 12/14/17 | | | $ | 1,023,181 | | | $ | 1,023,181 | | | $ | 1,023,181 | |
Banco Espirito Santo S.A., 4.000%, 01/21/19 | | | 12/12/14 | | | | 200,000 | | | | 248,422 | | | | 64,162 | |
Caliber Home Loans, Inc., 5.988%, 04/24/21 | | | 06/27/18 - 12/13/18 | | | | 4,581,545 | | | | 4,581,546 | | | | 4,570,091 | |
Chimera Special Holding LLC, 4.347%, 10/04/19 | | | 02/15/18 | | | | 10,458,553 | | | | 10,458,899 | | | | 10,458,553 | |
LSTAR Securities Financing Vehicle, 4.349%, 04/01/21 | | | 04/10/18 | | | | 11,518,159 | | | | 11,487,682 | | | | 11,477,845 | |
Roundpoint Mortgage Servicing Corp., 5.724%, 08/08/20 | | | 08/27/18 | | | | 6,156,063 | | | | 6,156,042 | | | | 6,156,063 | |
| | | | | | | | | | | | | | | | |
| | | | | | | | | | | | | | $ | 33,749,895 | |
| | | | | | | | | | | | | | | | |
Reverse Repurchase Agreements
| | | | | | | | | | | | | | | | | | | | | | | | |
Counterparty | | Interest Rate | | | Settlement
Date | | | Maturity
Date | | | Principal
Amount | | | Net Closing
Amount | |
Barclays Capital, Inc. | | | 3.180 | % | | | 12/31/18 | | | | 01/02/19 | | | | USD | | | | 27,608,125 | | | $ | 27,608,125 | |
BNP Paribas S.A. | | | 3.120 | % | | | 12/31/18 | | | | 01/02/19 | | | | USD | | | | 28,067,900 | | | | 28,067,900 | |
Merill Lynch Pierce Fenner & Smith, Inc. | | | 3.200 | % | | | 12/31/18 | | | | 01/02/19 | | | | USD | | | | 44,522,058 | | | | 44,522,058 | |
| | | | | | | | | | | | | | | | | | | | | | | | |
Total | | | $ | 100,198,083 | |
| | | | | | | | | | | | | | | | | | | | | | | | |
Securities pledged as collateral against open reverse repurchase agreements are noted in the Schedule of Investments.
TBA Forward Sale Commitments
| | | | | | | | | | | | | | | | | | | | |
Security Description | | Interest Rate | | | Maturity | | | Face Amount | | | Cost | | | Value | |
Fannie Mae 15 Yr. Pool | | | 2.000 | % | | | TBA | | | $ | (5,677,000 | ) | | $ | (5,381,619 | ) | | $ | (5,433,970 | ) |
Fannie Mae 15 Yr. Pool | | | 2.500 | % | | | TBA | | | | (1,039,200 | ) | | | (1,015,686 | ) | | | (1,014,916 | ) |
Fannie Mae 15 Yr. Pool | | | 3.500 | % | | | TBA | | | | (11,483,000 | ) | | | (11,541,035 | ) | | | (11,623,063 | ) |
Fannie Mae 15 Yr. Pool | | | 4.000 | % | | | TBA | | | | (10,417,000 | ) | | | (10,602,553 | ) | | | (10,659,144 | ) |
Fannie Mae 30 Yr. Pool | | | 3.500 | % | | | TBA | | | | (53,000 | ) | | | (52,783 | ) | | | (53,007 | ) |
Fannie Mae 30 Yr. Pool | | | 3.500 | % | | | TBA | | | | (110,924,468 | ) | | | (109,765,638 | ) | | | (110,866,217 | ) |
Fannie Mae 30 Yr. Pool | | | 4.000 | % | | | TBA | | | | (81,796,000 | ) | | | (81,463,704 | ) | | | (83,408,037 | ) |
Fannie Mae 30 Yr. Pool | | | 4.500 | % | | | TBA | | | | (28,073,000 | ) | | | (29,000,571 | ) | | | (29,083,371 | ) |
Fannie Mae 30 Yr. Pool | | | 6.000 | % | | | TBA | | | | (2,002,000 | ) | | | (2,152,463 | ) | | | (2,150,489 | ) |
Ginnie Mae I 30 Yr. Pool | | | 4.500 | % | | | TBA | | | | (3,100,000 | ) | | | (3,202,687 | ) | | | (3,207,836 | ) |
Ginnie Mae II 30 Yr. Pool | | | 3.000 | % | | | TBA | | | | (1,756,000 | ) | | | (1,729,111 | ) | | | (1,723,692 | ) |
Ginnie Mae II 30 Yr. Pool | | | 3.000 | % | | | TBA | | | | (4,976,518 | ) | | | (4,868,094 | ) | | | (4,894,106 | ) |
| | | | | | | | | | | | | | | | | | | | |
Totals | | | $ | (260,775,944 | ) | | $ | (264,117,848 | ) |
| | | | | | | | | | | | | | | | | | | | |
Forward Foreign Currency Exchange Contracts
| | | | | | | | | | | | | | | | | | | | | | |
Contracts to Buy | | | Counterparty | | Settlement
Date | | | In Exchange
for | | | Unrealized
Appreciation/
(Depreciation) | |
| ARS | | | 7,011,000 | | | BNP | | | 01/16/19 | | | | USD | | | | 180,000 | | | $ | 2,813 | |
| ARS | | | 3,586,500 | | | CBNA | | | 01/16/19 | | | | USD | | | | 90,000 | | | | 3,519 | |
| ARS | | | 6,951,600 | | | CBNA | | | 01/16/19 | | | | USD | | | | 180,000 | | | | 1,264 | |
| ARS | | | 9,994,400 | | | CBNA | | | 01/16/19 | | | | USD | | | | 260,000 | | | | 606 | |
| ARS | | | 3,591,000 | | | DBAG | | | 01/16/19 | | | | USD | | | | 90,000 | | | | 3,636 | |
| ARS | | | 3,591,000 | | | DBAG | | | 01/16/19 | | | | USD | | | | 90,000 | | | | 3,636 | |
| ARS | | | 14,378,400 | | | DBAG | | | 01/16/19 | | | | USD | | | | 360,000 | | | | 14,920 | |
| ARS | | | 3,592,908 | | | BNP | | | 03/07/19 | | | | USD | | | | 85,241 | | | | 2,637 | |
| ARS | | | 11,995,200 | | | BNP | | | 03/11/19 | | | | USD | | | | 288,000 | | | | 4,008 | |
| BRL | | | 1,398,258 | | | CBNA | | | 01/03/19 | | | | USD | | | | 360,000 | | | | 771 | |
| BRL | | | 15,291,505 | | | CBNA | | | 01/03/19 | | | | USD | | | | 3,937,000 | | | | 8,431 | |
| BRL | | | 1,379,160 | | | GSI | | | 01/03/19 | | | | USD | | | | 360,000 | | | | (4,156 | ) |
| BRL | | | 1,815,887 | | | GSI | | | 01/03/19 | | | | USD | | | | 468,640 | | | | (115 | ) |
| BRL | | | 1,823,876 | | | GSI | | | 01/03/19 | | | | USD | | | | 469,950 | | | | 637 | |
| BRL | | | 2,782,080 | | | GSI | | | 01/03/19 | | | | USD | | | | 717,993 | | | | (176 | ) |
See accompanying notes to financial statements.
BHFTII-36
Brighthouse Funds Trust II
BlackRock Bond Income Portfolio
Schedule of Investments as of December 31, 2018
Forward Foreign Currency Exchange Contracts—(Continued)
| | | | | | | | | | | | | | | | | | | | | | |
Contracts to Buy | | | Counterparty | | Settlement
Date | | | In Exchange
for | | | Unrealized
Appreciation/
(Depreciation) | |
| BRL | | | 7,572,976 | | | GSI | | | 01/03/19 | | | | USD | | | | 1,954,417 | | | $ | (479 | ) |
| BRL | | | 7,744,379 | | | GSI | | | 01/03/19 | | | | USD | | | | 1,998,653 | | | | (490 | ) |
| BRL | | | 1,819,411 | | | GSI | | | 02/04/19 | | | | USD | | | | 469,950 | | | | (1,362 | ) |
| BRL | | | 2,787,480 | | | GSI | | | 02/04/19 | | | | USD | | | | 720,000 | | | | (2,086 | ) |
| BRL | | | 7,587,675 | | | GSI | | | 02/04/19 | | | | USD | | | | 1,959,880 | | | | (5,679 | ) |
| CAD | | | 10,305,481 | | | TDB | | | 03/20/19 | | | | USD | | | | 7,564,000 | | | | (1,743 | ) |
| CLP | | | 482,655,600 | | | BNP | | | 01/16/19 | | | | USD | | | | 720,000 | | | | (24,359 | ) |
| CLP | | | 482,655,600 | | | BNP | | | 01/16/19 | | | | USD | | | | 720,000 | | | | (24,359 | ) |
| CLP | | | 743,526,144 | | | DBAG | | | 01/16/19 | | | | USD | | | | 1,111,200 | | | | (39,572 | ) |
| COP | | | 1,533,085,000 | | | BNP | | | 01/11/19 | | | | USD | | | | 485,000 | | | | (13,120 | ) |
| COP | | | 1,548,415,850 | | | GSI | | | 01/16/19 | | | | USD | | | | 485,000 | | | | (8,519 | ) |
| GBP | | | 14,198,000 | | | BBP | | | 03/20/19 | | | | USD | | | | 18,029,033 | | | | 135,136 | |
| IDR | | | 40,869,465,000 | | | BBP | | | 01/18/19 | | | | USD | | | | 2,653,000 | | | | 184,830 | |
| KRW | | | 1,603,152,000 | | | BOA | | | 02/07/19 | | | | USD | | | | 1,440,000 | | | | (1,808 | ) |
| MXN | | | 9,433,082 | | | GSI | | | 01/16/19 | | | | USD | | | | 469,950 | | | | 9,188 | |
| RUB | | | 59,149,400 | | | BOA | | | 01/16/19 | | | | USD | | | | 890,000 | | | | (41,889 | ) |
| TRY | | | 2,873,041 | | | JPMC | | | 06/19/19 | | | | USD | | | | 536,503 | | | | (38,631 | ) |
| TWD | | | 44,442,720 | | | BNP | | | 01/03/19 | | | | USD | | | | 1,445,762 | | | | 141 | |
| ZAR | | | 10,144,152 | | | BNP | | | 01/10/19 | | | | USD | | | | 720,000 | | | | (15,470 | ) |
| ZAR | | | 12,818,142 | | | NTC | | | 01/16/19 | | | | USD | | | | 900,000 | | | | (10,412 | ) |
| ZAR | | | 25,264,060 | | | UBSA | | | 01/16/19 | | | | USD | | | | 1,790,000 | | | | (36,657 | ) |
|
Contracts to Deliver | |
| ARS | | | 1,601,200 | | | GSI | | | 01/16/19 | | | | USD | | | | 40,000 | | | | (1,752 | ) |
| ARS | | | 15,801,482 | | | JPMC | | | 01/16/19 | | | | USD | | | | 410,000 | | | | (2,027 | ) |
| ARS | | | 8,261,500 | | | BNP | | | 02/11/19 | | | | USD | | | | 205,000 | | | | (3,072 | ) |
| ARS | | | 8,261,500 | | | JPMC | | | 02/11/19 | | | | USD | | | | 205,000 | | | | (3,072 | ) |
| BRL | | | 15,291,505 | | | CBNA | | | 01/03/19 | | | | USD | | | | 3,946,398 | | | | 967 | |
| BRL | | | 1,398,258 | | | CBNA | | | 01/03/19 | | | | USD | | | | 360,859 | | | | 88 | |
| BRL | | | 7,744,379 | | | GSI | | | 01/03/19 | | | | USD | | | | 1,977,120 | | | | (21,043 | ) |
| BRL | | | 7,572,976 | | | GSI | | | 01/03/19 | | | | USD | | | | 1,959,880 | | | | 5,942 | |
| BRL | | | 2,782,080 | | | GSI | | | 01/03/19 | | | | USD | | | | 720,000 | | | | 2,183 | |
| BRL | | | 1,823,876 | | | GSI | | | 01/03/19 | | | | USD | | | | 470,702 | | | | 115 | |
| BRL | | | 1,815,887 | | | GSI | | | 01/03/19 | | | | USD | | | | 469,950 | | | | 1,425 | |
| BRL | | | 1,379,160 | | | GSI | | | 01/03/19 | | | | USD | | | | 355,931 | | | | 87 | |
| BRL | | | 1,436,710 | | | DBAG | | | 01/16/19 | | | | USD | | | | 370,000 | | | | (346 | ) |
| CHF | | | 3,684,394 | | | CBNA | | | 03/20/19 | | | | USD | | | | 3,782,000 | | | | 6,602 | |
| CLP | | | 612,314,739 | | | BNP | | | 01/16/19 | | | | USD | | | | 888,185 | | | | 5,669 | |
| CLP | | | 142,795,670 | | | BNP | | | 01/16/19 | | | | USD | | | | 213,015 | | | | 7,207 | |
| CLP | | | 6,703,100 | | | CBNA | | | 01/16/19 | | | | USD | | | | 10,000 | | | | 339 | |
| COP | | | 1,556,992,105 | | | BNP | | | 01/11/19 | | | | USD | | | | 485,000 | | | | 5,761 | |
| COP | | | 6,560,690,000 | | | GSI | | | 01/23/19 | | | | USD | | | | 1,986,884 | | | | (31,282 | ) |
| COP | | | 7,500,000,000 | | | JPMC | | | 01/23/19 | | | | USD | | | | 2,268,603 | | | | (38,509 | ) |
| EUR | | | 489,471 | | | NIP | | | 01/16/19 | | | | USD | | | | 559,528 | | | | (1,888 | ) |
| GBP | | | 14,198,000 | | | MSIP | | | 03/20/19 | | | | USD | | | | 17,999,940 | | | | (164,229 | ) |
| IDR | | | 31,991,482,407 | | | BNP | | | 01/16/19 | | | | USD | | | | 2,210,380 | | | | (11,464 | ) |
| IDR | | | 39,123,791,000 | | | JPMC | | | 01/18/19 | | | | USD | | | | 2,653,000 | | | | (63,617 | ) |
| JPY | | | 12,253,976,495 | | | JPMC | | | 01/22/19 | | | | USD | | | | 109,821,846 | | | | (2,113,398 | ) |
| JPY | | | 78,858,000 | | | CBNA | | | 02/05/19 | | | | USD | | | | 698,719 | | | | (22,415 | ) |
| JPY | | | 698,253,930 | | | DBAG | | | 02/05/19 | | | | USD | | | | 6,198,052 | | | | (187,286 | ) |
| JPY | | | 698,253,930 | | | DBAG | | | 02/05/19 | | | | USD | | | | 6,185,835 | | | | (199,503 | ) |
| JPY | | | 698,253,930 | | | NAB | | | 02/05/19 | | | | USD | | | | 6,162,150 | | | | (223,188 | ) |
| KRW | | | 1,808,532,660 | | | CBNA | | | 01/16/19 | | | | USD | | | | 1,606,000 | | | | (15,445 | ) |
| KRW | | | 1,590,912,000 | | | MSIP | | | 02/07/19 | | | | USD | | | | 1,440,000 | | | | 12,789 | |
| MXN | | | 35,838,876 | | | CBNA | | | 01/16/19 | | | | USD | | | | 1,780,000 | | | | (40,377 | ) |
| MXN | | | 19,118,750 | | | JPMC | | | 01/16/19 | | | | USD | | | | 939,900 | | | | (31,206 | ) |
See accompanying notes to financial statements.
BHFTII-37
Brighthouse Funds Trust II
BlackRock Bond Income Portfolio
Schedule of Investments as of December 31, 2018
Forward Foreign Currency Exchange Contracts—(Continued)
| | | | | | | | | | | | | | | | | | | | | | |
Contracts to Deliver | | | Counterparty | | Settlement
Date | | | In Exchange
for | | | Unrealized
Appreciation/
(Depreciation) | |
| MXN | | | 19,118,750 | | | JPMC | | | 01/16/19 | | | | USD | | | | 939,900 | | | $ | (31,206 | ) |
| MXN | | | 85,320,000 | | | CBNA | | | 01/23/19 | | | | USD | | | | 4,219,000 | | | | (109,789 | ) |
| MXN | | | 74,360,000 | | | CBNA | | | 01/23/19 | | | | USD | | | | 3,710,579 | | | | (62,144 | ) |
| MXN | | | 42,884,000 | | | GSI | | | 02/05/19 | | | | USD | | | | 2,125,017 | | | | (46,181 | ) |
| MXN | | | 30,000,000 | | | GSI | | | 02/05/19 | | | | USD | | | | 1,469,933 | | | | (48,955 | ) |
| RUB | | | 59,994,900 | | | BOA | | | 01/16/19 | | | | USD | | | | 890,000 | | | | 29,766 | |
| TWD | | | 44,442,720 | | | BNP | | | 01/03/19 | | | | USD | | | | 1,440,000 | | | | (5,903 | ) |
| ZAR | | | 10,241,712 | | | BNP | | | 01/10/19 | | | | USD | | | | 720,000 | | | | 8,694 | |
| ZAR | | | 38,539,016 | | | BNP | | | 01/16/19 | | | | USD | | | | 2,680,000 | | | | 5,366 | |
| ZAR | | | 138,795 | | | CBNA | | | 01/16/19 | | | | USD | | | | 10,000 | | | | 368 | |
| ZAR | | | 10,000,000 | | | BOA | | | 01/23/19 | | | | USD | | | | 687,899 | | | | (5,512 | ) |
| ZAR | | | 4,960,000 | | | BOA | | | 01/23/19 | | | | USD | | | | 341,348 | | | | (2,584 | ) |
| | |
Cross Currency Contracts to Buy | | | | | | |
| CAD | | | 4,279,613 | | | BNP | | | 03/20/19 | | | | EUR | | | | 2,725,000 | | | | (1,903 | ) |
| CAD | | | 7,598,343 | | | BNP | | | 03/20/19 | | | | EUR | | | | 4,839,000 | | | | (4,338 | ) |
| | | | | | | | | | | | | | | | | | | | | | |
Net Unrealized Depreciation | | | $ | (3,295,175 | ) |
| | | | | | | | | | | | | | | | | | | | | | |
Futures Contracts
| | | | | | | | | | | | | | | | | | | | |
Futures Contracts—Long | | Expiration
Date | | | Number of
Contracts | | | Notional Value | | | Value/
Unrealized
Appreciation/
(Depreciation) | |
U.S. Treasury Note 2 Year Futures | | | 03/29/19 | | | | 1,588 | | | | USD | | | | 337,152,250 | | | $ | 2,212,885 | |
U.S. Treasury Note 5 Year Futures | | | 03/29/19 | | | | 3,346 | | | | USD | | | | 383,744,375 | | | | 5,144,203 | |
U.S. Treasury Note Ultra 10 Year Futures | | | 03/20/19 | | | | 590 | | | | USD | | | | 76,746,094 | | | | 1,861,376 | |
U.S. Treasury Ultra Long Bond Futures | | | 03/20/19 | | | | 932 | | | | USD | | | | 149,731,625 | | | | 7,594,574 | |
|
Futures Contracts—Short | |
90 Day Eurodollar Futures | | | 12/14/20 | | | | (1,135 | ) | | | USD | | | | (276,741,375 | ) | | | (1,150,924 | ) |
Euro-Bund Futures | | | 03/07/19 | | | | (326 | ) | | | EUR | | | | (53,314,040 | ) | | | (342,709 | ) |
Euro-Buxl 30 Year Bond Futures | | | 03/07/19 | | | | (44 | ) | | | EUR | | | | (7,947,280 | ) | | | (17,751 | ) |
Japanese Government 10 Year Bond Futures | | | 03/13/19 | | | | (18 | ) | | | JPY | | | | (2,744,640,000 | ) | | | (121,581 | ) |
U.S. Treasury Long Bond Futures | | | 03/20/19 | | | | (83 | ) | | | USD | | | | (12,118,000 | ) | | | (285,111 | ) |
U.S. Treasury Note 10 Year Futures | | | 03/20/19 | | | | (1,515 | ) | | | USD | | | | (184,853,672 | ) | | | (3,123,444 | ) |
| | | | | | | | | | | | | | | | | | | | |
Net Unrealized Appreciation | | | $ | 11,771,518 | |
| | | | | | | | | | | | | | | | | |
Purchased Options
| | | | | | | | | | | | | | | | | | | | | | | | | | | | | | | | | | | | |
Foreign Currency Options | | Strike
Price | | | Counterparty | | Expiration
Date | | | Number of
Contracts | | | Notional
Amount | | | Premiums
Paid | | | Market
Value | | | Unrealized
Appreciation/
(Depreciation) | |
USD Put/BRL Call | | BRL | | | 3.600 | | | DBAG | | | 01/07/19 | | | | 4,240,000 | | | | USD | | | | 4,240,000 | | | $ | 11,617 | | | $ | 4 | | | $ | (11,613) | |
USD Put/BRL Call | | BRL | | | 3.600 | | | GSI | | | 01/08/19 | | | | 1,980,000 | | | | USD | | | | 1,980,000 | | | | 26,019 | | | | 4 | | | | (26,015) | |
USD Call/BRL Put | | BRL | | | 3.920 | | | MSIP | | | 01/10/19 | | | | 1,440,000 | | | | USD | | | | 1,440,000 | | | | 9,586 | | | | 9,216 | | | | (370) | |
USD Put/BRL Call | | BRL | | | 3.740 | | | MSIP | | | 01/10/19 | | | | 1,440,000 | | | | USD | | | | 1,440,000 | | | | 27,213 | | | | 1,146 | | | | (26,067) | |
USD Put/BRL Call | | BRL | | | 3.900 | | | GSI | | | 02/07/19 | | | | 1,440,000 | | | | USD | | | | 1,440,000 | | | | 29,513 | | | | 30,183 | | | | 670 | |
USD Put/BRL Call | | BRL | | | 3.500 | | | DBAG | | | 02/07/19 | | | | 3,074,000 | | | | USD | | | | 3,074,000 | | | | 5,134 | | | | 89 | | | | (5,045) | |
USD Put/KRW Call | | KRW | | | 1,110.000 | | | CBNA | | | 01/31/19 | | | | 1,606,000 | | | | USD | | | | 1,606,000 | | | | 16,196 | | | | 13,394 | | | | (2,803) | |
USD Put/KRW Call | | KRW | | | 1,115.000 | | | CBNA | | | 02/07/19 | | | | 1,440,000 | | | | USD | | | | 1,440,000 | | | | 17,114 | | | | 16,839 | | | | (275) | |
USD Put/ZAR Call | | ZAR | | | 13.500 | | | JPMC | | | 02/21/19 | | | | 1,144,500 | | | | USD | | | | 1,144,500 | | | | 15,327 | | | | 4,959 | | | | (10,368) | |
USD Put/JPY Call | | JPY | | | 112.000 | | | DBAG | | | 04/03/19 | | | | 25,202,000 | | | | USD | | | | 25,202,000 | | | | 595,523 | | | | 860,422 | | | | 264,898 | |
USD Call/JPY Put | | JPY | | | 112.000 | | | DBAG | | | 04/03/19 | | | | 25,202,000 | | | | USD | | | | 25,202,000 | | | | 640,383 | | | | 139,695 | | | | (500,688) | |
| | | | | | | | | | | | | | | | | | | | | | | | | | | | | | | | | | | | |
Totals | | | $ | 1,393,625 | | | $ | 1,075,951 | | | $ | (317,676) | |
| | | | | | | | | | | | | | | | | | | | | | | | | | | | | | | | | | | | |
See accompanying notes to financial statements.
BHFTII-38
Brighthouse Funds Trust II
BlackRock Bond Income Portfolio
Schedule of Investments as of December 31, 2018
Purchased Options—(Continued)
| | | | | | | | | | | | | | | | | | | | | | | | | | | | | | | | | | | | | | | | | | | | |
Interest Rate Swaptions | | Strike
Rate | | | Counterparty | | | Floating Rate
Index | | | Pay/
Receive
Floating
Rate | | | Expiration
Date | | | Number of
Contracts | | | Notional
Amount | | | Premiums
Paid | | | Market
Value | | | Unrealized
Appreciation/
(Depreciation) | |
Call - OTC - 10 Yr. IRS | | | 2.750 | % | | | CBNA | | | | 3M LIBOR | | | | Pay | | | | 04/24/19 | | | | 17,910,000 | | | | USD | | | | 17,910,000 | | | $ | 52,387 | | | $ | 260,696 | | | $ | 208,309 | |
Call - OTC - 10 Yr. IRS | | | 2.750 | % | | | CBNA | | | | 3M LIBOR | | | | Pay | | | | 04/24/19 | | | | 4,340,000 | | | | USD | | | | 4,340,000 | | | | 14,973 | | | | 64,047 | | | | 49,075 | |
Call - OTC - 10 Yr. IRS | | | 2.700 | % | | | BBP | | | | 3M LIBOR | | | | Pay | | | | 06/10/19 | | | | 9,314,000 | | | | USD | | | | 9,314,000 | | | | 73,814 | | | | 137,340 | | | | 63,526 | |
Call - OTC - 10 Yr. IRS | | | 3.041 | % | | | JPMC | | | | 3M LIBOR | | | | Pay | | | | 04/27/38 | | | | 52,790,000 | | | | USD | | | | 52,790,000 | | | | 2,520,612 | | | | 3,004,675 | | | | 484,063 | |
Put - OTC - 10 Yr. IRS | | | 3.770 | % | | | CBNA | | | | 3M LIBOR | | | | Receive | | | | 04/24/19 | | | | 11,125,000 | | | | USD | | | | 11,125,000 | | | | 37,130 | | | | 1,405 | | | | (35,725 | ) |
Put - OTC - 10 Yr. IRS | | | 3.041 | % | | | JPMC | | | | 3M LIBOR | | | | Receive | | | | 04/27/38 | | | | 52,790,000 | | | | USD | | | | 52,790,000 | | | | 2,520,612 | | | | 2,467,315 | | | | (53,297 | ) |
| | | | | | | | | | | | | | | | | | | | | | | | | | | | | | | | | | | | | | | | | | | | |
Totals | | | $ | 5,219,528 | | | $ | 5,935,478 | | | $ | 715,951 | |
| | | | | | | | | | | | | | | | | | | | | | | | | | | | | | | | | | | | | | | | | | | | |
Written Options
| | | | | | | | | | | | | | | | | | | | | | | | | | | | | | | | | | | | | | | | |
Foreign Currency Options | | Strike
Price | | | Counterparty | | | Expiration
Date | | | Number of
Contracts | | | Notional
Amount | | | Premiums
Received | | | Market
Value | | | Unrealized
Appreciation/
(Depreciation) | |
USD Call/BRL Put | | | BRL | | | | 3.900 | | | | MSIP | | | | 01/10/19 | | | | (1,440,000 | ) | | | USD | | | | (1,440,000 | ) | | $ | (16,294 | ) | | $ | (11,900 | ) | | $ | 4,394 | |
USD Call/JPY Put | | | JPY | | | | 112.000 | | | | MSIP | | | | 04/03/19 | | | | (25,202,000 | ) | | | USD | | | | (25,202,000 | ) | | | (455,148 | ) | | | (139,695 | ) | | | 315,453 | |
USD Call/KRW Put | | | KRW | | | | 1,140.000 | | | | JPMC | | | | 02/07/19 | | | | (720,000 | ) | | | USD | | | | (720,000 | ) | | | (5,151 | ) | | | (2,208 | ) | | | 2,943 | |
USD Call/MXN Put | | | MXN | | | | 20.900 | | | | CBNA | | | | 01/11/19 | | | | (1,440,000 | ) | | | USD | | | | (1,440,000 | ) | | | (29,606 | ) | | | (286 | ) | | | 29,320 | |
USD Put/BRL Call | | | BRL | | | | 3.600 | | | | MSIP | | | | 01/10/19 | | | | (1,440,000 | ) | | | USD | | | | (1,440,000 | ) | | | (7,718 | ) | | | (26 | ) | | | 7,692 | |
USD Put/BRL Call | | | BRL | | | | 3.750 | | | | GSI | | | | 02/07/19 | | | | (2,160,000 | ) | | | USD | | | | (2,160,000 | ) | | | (14,094 | ) | | | (12,826 | ) | | | 1,268 | |
USD Put/JPY Call | | | JPY | | | | 112.000 | | | | MSIP | | | | 04/03/19 | | | | (25,202,000 | ) | | | USD | | | | (25,202,000 | ) | | | (457,920 | ) | | | (860,420 | ) | | | (402,500 | ) |
USD Put/KRW Call | | | KRW | | | | 1,085.000 | | | | JPMC | | | | 02/07/19 | | | | (720,000 | ) | | | USD | | | | (720,000 | ) | | | (2,258 | ) | | | (1,731 | ) | | | 527 | |
USD Put/KRW Call | | | KRW | | | | 1,085.000 | | | | CBNA | | | | 02/07/19 | | | | (1,440,000 | ) | | | USD | | | | (1,440,000 | ) | | | (4,284 | ) | | | (3,462 | ) | | | 822 | |
| | | | | | | | | | | | | | | | | | | | | | | | | | | | | | | | | | | | | | | | |
Totals | | | $ | (992,473 | ) | | $ | (1,032,554 | ) | | $ | (40,081 | ) |
| | | | | | | | | | | | | | | | | | | | | | | | | | | | | | | | | | | | | | | | |
| | | | | | | | | | | | | | | | | | | | | | | | | | | | | | | | | | | | | | | | |
Interest Rate Swaptions | | Strike
Rate | | | Counterparty | | Floating
Rate Index | | Pay/
Receive
Floating
Rate | | | Expiration
Date | | | Number of
Contracts | | | Notional
Amount | | | Premiums
Received | | | Market
Value | | | Unrealized
Appreciation/
(Depreciation) | |
Call - OTC - 2 Yr. IRS | | | 2.750 | % | | CBNA | | 3M LIBOR | | | Receive | | | | 10/16/20 | | | | (141,750,000 | ) | | | USD | | | | (141,750,000 | ) | | $ | (602,438 | ) | | $ | (1,559,009 | ) | | $ | (956,571 | ) |
Put - OTC - 2 Yr. IRS | | | 3.750 | % | | CBNA | | 3M LIBOR | | | Pay | | | | 10/16/20 | | | | (141,750,000 | ) | | | USD | | | | (141,750,000 | ) | | | (552,825 | ) | | | (173,304 | ) | | | 379,521 | |
| | | | | | | | | | | | | | | | | | | | | | | | | | | | | | | | | | | | | | | | |
Totals | | | $ | (1,155,263 | ) | | $ | (1,732,313 | ) | | $ | (577,050 | ) |
| | | | | | | | | | | | | | | | | | | | | | | | | | | | | | | | | | | | | | | | |
Swap Agreements
OTC Cross—Currency Swaps
| | | | | | | | | | | | | | | | | | | | | | | | | | | | | | | | | | | | |
Receive | | Pay | | Maturity
Date(a) | | | Counterparty | | Notional
Amount of
Currency
Received | | | Notional
Amount of
Currency
Delivered | | | Market
Value | | | Upfront
Premium
(Received) | | | Unrealized
(Depreciation) | |
| Floating rate equal to 3M USD-LIBOR plus 0.000% based on the notional amount of currency delivered | | Fixed rate equal to 16.770% based on the notional amount of currency received | | | 06/19/24 | | | JPMC | | | USD | | | | 536,503 | | | | TRY | | | | 2,873,041 | | | $ | (28,781 | ) | | $ | (489 | ) | | $ | (28,292 | ) |
| | | | | | | | | | | | | | | | | | | | | | | | | | | | | | | | | | | | |
| | | | |
| (a) | | At the maturity date, the notional amount of the the currency received will be exchanged back for the notional amount of the currency delivered. |
OTC Interest Rate Swaps
| | | | | | | | | | | | | | | | | | | | | | | | | | | | | | | | | | | | | | | | | | |
Pay/Receive
Floating Rate | | Floating
Rate Index | | | Payment
Frequency | | | Fixed
Rate | | | Payment
Frequency | | | Maturity
Date | | | Counterparty | | Notional
Amount | | | Market
Value | | | Upfront
Premium
Paid/
(Received) | | | Unrealized
Appreciation/
(Depreciation)(1) | |
Pay | | | 1-Day CDI | | | | Maturity | | | | 7.420 | % | | | Maturity | | | | 01/04/21 | | | CSI | | | BRL | | | | 25,376,156 | | | $ | 11,365 | | | $ | — | | | $ | 11,365 | |
Pay | | | 1-Day CDI | | | | Maturity | | | | 7.430 | % | | | Maturity | | | | 01/04/21 | | | JPMC | | | BRL | | | | 10,846,585 | | | | 4,592 | | | | — | | | | 4,592 | |
Pay | | | 1-Day CDI | | | | Maturity | | | | 7.460 | % | | | Maturity | | | | 01/04/21 | | | BOA | | | BRL | | | | 14,557,259 | | | | 8,135 | | | | — | | | | 8,135 | |
See accompanying notes to financial statements.
BHFTII-39
Brighthouse Funds Trust II
BlackRock Bond Income Portfolio
Schedule of Investments as of December 31, 2018
OTC Interest Rate Swaps—(Continued)
| | | | | | | | | | | | | | | | | | | | | | | | | | | | | | | | | | | | | | | | | | |
Pay/Receive
Floating Rate | | Floating
Rate Index | | | Payment
Frequency | | | Fixed
Rate | | | Payment
Frequency | | | Maturity
Date | | | Counterparty | | Notional
Amount | | | Market
Value | | | Upfront
Premium
Paid/
(Received) | | | Unrealized
Appreciation/
(Depreciation)(1) | |
Pay | | | 1-Day CDI | | | | Maturity | | | | 7.479 | % | | | Maturity | | | | 01/04/21 | | | BOA | | | BRL | | | | 50,780,000 | | | $ | 32,539 | | | $ | — | | | $ | 32,539 | |
Pay | | | 1-Day CDI | | | | Maturity | | | | 8.531 | % | | | Maturity | | | | 01/02/23 | | | CBNA | | | BRL | | | | 29,110,000 | | | | 22,227 | | | | — | | | | 22,227 | |
Pay | | | 28-Day TIIE | | | | Monthly | | | | 6.270 | % | | | Monthly | | | | 12/05/25 | | | BOA | | | MXN | | | | 2,209,451 | | | | (14,337 | ) | | | — | | | | (14,337 | ) |
Pay | | | 28-Day TIIE | | | | Monthly | | | | 6.325 | % | | | Monthly | | | | 07/17/25 | | | CBNA | | | MXN | | | | 19,973,500 | | | | (120,321 | ) | | | — | | | | (120,321 | ) |
Pay | | | 28-Day TIIE | | | | Monthly | | | | 6.330 | % | | | Monthly | | | | 08/06/25 | | | CBNA | | | MXN | | | | 59,593,000 | | | | (361,047 | ) | | | — | | | | (361,047 | ) |
Receive | | | 28-Day TIIE | | | | Monthly | | | | 6.307 | % | | | Monthly | | | | 08/11/25 | | | DBAG | | | MXN | | | | 74,533,884 | | | | 456,713 | | | | — | | | | 456,713 | |
Receive | | | 28-Day TIIE | | | | Monthly | | | | 6.310 | % | | | Monthly | | | | 08/11/25 | | | BOA | | | MXN | | | | 20,079,000 | | | | 122,889 | | | | — | | | | 122,889 | |
Receive | | | 28-Day TIIE | | | | Monthly | | | | 6.310 | % | | | Monthly | | | | 08/11/25 | | | BOA | | | MXN | | | | 20,079,000 | | | | 122,889 | | | | — | | | | 122,889 | |
| | | | | | | | | | | | | | | | | | | | | | | | | | | | | | | | | | | | | | | | | | |
Totals | | | $ | 285,644 | | | $ | — | | | $ | 285,644 | |
| | | | | | | | | | | | | | | | | | | | | | | | | | | | | | | | | | | | | | | | | | |
Centrally Cleared Interest Rate Swaps
| | | | | | | | | | | | | | | | | | | | | | | | | | | | | | | | | | | | | | | | |
Pay/Receive
Floating Rate | | Floating
Rate Index | | | Payment
Frequency | | | Fixed
Rate | | | Payment
Frequency | | | Maturity
Date | | | Notional
Amount | | | Market
Value | | | Upfront
Premiums
Paid/
(Received) | | | Unrealized
Appreciation/
(Depreciation) | |
Pay | | | 12M UKRPI | | | | Maturity | | | | 3.570 | % | | | Maturity | | | | 11/15/28 | | | | GBP | | | | 11,530,000 | | | $ | 26,294 | | | $ | (5,202 | ) | | $ | 31,496 | |
Pay | | | 28-Day TIIE | | | | Monthly | | | | 6.320 | % | | | Monthly | | | | 07/17/25 | | | | MXN | | | | 40,086,000 | | | | (242,421 | ) | | | — | | | | (242,421 | ) |
Pay | | | 28-Day TIIE | | | | Monthly | | | | 8.205 | % | | | Monthly | | | | 10/07/20 | | | | MXN | | | | 92,528,424 | | | | (33,550 | ) | | | 73 | | | | (33,623 | ) |
Pay | | | 28-Day TIIE | | | | Monthly | | | | 8.206 | % | | | Monthly | | | | 10/07/20 | | | | MXN | | | | 188,281,000 | | | | (68,075 | ) | | | 148 | | | | (68,223 | ) |
Pay | | | 3M LIBOR | | | | Quarterly | | | | 2.131% | | | | Semi-Annually | | | | 08/25/25 | | | | USD | | | | 1,285,000 | | | | (38,985 | ) | | | — | | | | (38,985 | ) |
Pay | | | 3M LIBOR | | | | Quarterly | | | | 3.348% | | | | Semi-Annually | | | | 04/26/29 | | | | USD | | | | 1,802,000 | | | | 95,859 | | | | 37 | | | | 95,822 | |
Pay | | | 6M EURIBOR | | | | Semi-Annually | | | | 0.242% | | | | Annually | | | | 12/14/21 | | | | EUR | | | | 77,890,000 | | | | 112,463 | | | | 3,806 | | | | 108,657 | |
Pay | | | 6M EURIBOR | | | | Semi-Annually | | | | 0.323% | | | | Annually | | | | 11/16/21 | | | | EUR | | | | 156,876,000 | | | | 411,642 | | | | 2,938 | | | | 408,704 | |
Pay | | | 6M EURIBOR | | | | Semi-Annually | | | | 0.375% | | | | Annually | | | | 11/09/21 | | | | EUR | | | | 155,836,000 | | | | 513,007 | | | | 847 | | | | 512,160 | |
Pay | | | 6M EURIBOR | | | | Semi-Annually | | | | 0.380% | | | | Annually | | | | 11/09/21 | | | | EUR | | | | 155,836,000 | | | | 521,988 | | | | (4,490 | ) | | | 526,478 | |
Pay | | | 6M EURIBOR | | | | Semi-Annually | | | | 0.815% | | | | Annually | | | | 02/15/28 | | | | EUR | | | | 36,200,000 | | | | 285,712 | | | | 904 | | | | 284,808 | |
Receive | | | 28-Day TIIE | | | | Monthly | | | | 7.105% | | | | Monthly | | | | 10/14/22 | | | | MXN | | | | 48,327,742 | | | | 118,680 | | | | 47 | | | | 118,633 | |
Receive | | | 28-Day TIIE | | | | Monthly | | | | 7.110% | | | | Monthly | | | | 10/14/22 | | | | MXN | | | | 36,666,258 | | | | 89,736 | | | | 35 | | | | 89,701 | |
Receive | | | 28-Day TIIE | | | | Monthly | | | | 7.361% | | | | Monthly | | | | 01/28/19 | | | | MXN | | | | 300,263,934 | | | | 14,058 | | | | — | | | | 14,058 | |
Receive | | | 3M LIBOR | | | | Semi-Annually | | | | 2.272% | | | | Quarterly | | | | 09/11/25 | | | | USD | | | | 955,000 | | | | 21,017 | | | | — | | | | 21,017 | |
Receive | | | 3M LIBOR | | | | Semi-Annually | | | | 2.855% | | | | Quarterly | | | | 12/24/28 | | | | USD | | | | 712,000 | | | | (7,465 | ) | | | 15 | | | | (7,480 | ) |
Receive | | | 3M LIBOR | | | | Semi-Annually | | | | 2.915% | | | | Quarterly | | | | 08/23/26 | | | | USD | | | | 110,000 | | | | (1,981 | ) | | | 2 | | | | (1,983 | ) |
Receive | | | 3M LIBOR | | | | Semi-Annually | | | | 2.932% | | | | Quarterly | | | | 06/12/29 | | | | USD | | | | 2,887,000 | | | | (46,755 | ) | | | 59 | | | | (46,814 | ) |
Receive | | | 3M LIBOR | | | | Semi-Annually | | | | 3.156% | | | | Quarterly | | | | 10/03/28 | | | | USD | | | | 1,279,000 | | | | (47,314 | ) | | | 26 | | | | (47,340 | ) |
Receive | | | 3M LIBOR | | | | Semi-Annually | | | | 3.232% | | | | Quarterly | | | | 04/26/29 | | | | USD | | | | 621,000 | | | | (26,707 | ) | | | 13 | | | | (26,720 | ) |
Receive | | | 3M LIBOR | | | | Semi-Annually | | | | 3.264% | | | | Quarterly | | | | 04/26/29 | | | | USD | | | | 2,560,000 | | | | (117,293 | ) | | | 52 | | | | (117,345 | ) |
Receive | | | 6M LIBOR | | | | Semi-Annually | | | | 1.335% | | | | Semi-Annually | | | | 12/10/21 | | | | GBP | | | | 71,115,000 | | | | (7,442 | ) | | | (168 | ) | | | (7,274 | ) |
Receive | | | 6M LIBOR | | | | Semi-Annually | | | | 1.425% | | | | Semi-Annually | | | | 11/16/21 | | | | GBP | | | | 143,235,000 | | | | (182,567 | ) | | | 3,026 | | | | (185,593 | ) |
Receive | | | 6M LIBOR | | | | Semi-Annually | | | | 1.543% | | | | Semi-Annually | | | | 11/15/22 | | | | GBP | | | | 72,290,000 | | | | (119,811 | ) | | | 1,705 | | | | (121,516 | ) |
Receive | | | 6M LIBOR | | | | Semi-Annually | | | | 1.550% | | | | Semi-Annually | | | | 11/09/21 | | | | GBP | | | | 282,965,000 | | | | (807,462 | ) | | | 34,731 | | | | (842,193 | ) |
Receive | | | 6M LIBOR | | | | Semi-Annually | | | | 1.583% | | | | Semi-Annually | | | | 11/21/28 | | | | GBP | | | | 15,288,702 | | | | (284,477 | ) | | | 2,363 | | | | (286,840 | ) |
Receive | | | 6M LIBOR | | | | Semi-Annually | | | | 1.660% | | | | Semi-Annually | | | | 11/08/22 | | | | GBP | | | | 71,766,000 | | | | (224,484 | ) | | | 7,704 | | | | (232,188 | ) |
Receive | | | 6M LIBOR | | | | Semi-Annually | | | | 1.670% | | | | Semi-Annually | | | | 11/08/22 | | | | GBP | | | | 71,766,000 | | | | (233,320 | ) | | | 17,395 | | | | (250,715 | ) |
| | | | | | | | | | | | | | | | | | | | | | | | | | | | | | | | | | | | | | | | |
Totals | | | $ | (279,653 | ) | | $ | 66,066 | | | $ | (345,719 | ) |
| | | | | | | | | | | | | | | | | | | | | | | | | | | | | | | | | | | | | | | | |
Centrally Cleared Credit Default Swaps on Credit Indices—Sell Protection (d)
| | | | | | | | | | | | | | | | | | | | | | | | | | | | | | | | | | |
Reference Obligation | | Fixed Deal
Receive Rate | | | Payment
Frequency | | | Maturity
Date | | Implied Credit
Spread at
December 31,
2018(b) | | | Notional
Amount(c) | | | Market
Value | | | Upfront
Premiums
Paid | | | Unrealized
Appreciation | |
CDX.NA. HY.31.V3 | | | 5.000% | | | | Quarterly | | | 12/20/23 | | | 4.505% | | | | USD | | | | 17,570,000 | | | $ | 350,223 | | | $ | 184,245 | | | $ | 165,978 | |
| | | | | | | | | | | | | | | | | | | | | | | | | | | | | | | | | | |
See accompanying notes to financial statements.
BHFTII-40
Brighthouse Funds Trust II
BlackRock Bond Income Portfolio
Schedule of Investments as of December 31, 2018
OTC Credit Default Swaps on Sovereign Issues—Buy Protection (a)
| | | | | | | | | | | | | | | | | | | | | | | | | | | | | | | | | | | | |
Reference Obligation | | Fixed Deal
(Pay) Rate | | | Payment
Frequency | | | Maturity
Date | | Counterparty | | Implied Credit
Spread at
December 31,
2018(b) | | | Notional
Amount(c) | | | Market
Value | | | Upfront
Premium
Paid/(Received) | | | Unrealized
Appreciation/
(Depreciation) | |
Brazil Government International Bond
4.250%, due 01/07/25 | | | (1.000%) | | | | Quarterly | | | 12/20/23 | | BBP | | | 2.051% | | | | USD | | | | 1,472,000 | | | $ | 69,248 | | | $ | 64,892 | | | $ | 4,356 | |
Brazil Government International Bond
4.250%, due 01/07/25 | | | (1.000%) | | | | Quarterly | | | 12/20/23 | | BBP | | | 2.051% | | | | USD | | | | 1,471,000 | | | | 69,201 | | | | 64,848 | | | | 4,353 | |
Brazil Government International Bond
4.250%, due 01/07/25 | | | (1.000%) | | | | Quarterly | | | 12/20/23 | | BBP | | | 2.051% | | | | USD | | | | 868,720 | | | | 40,867 | | | | 39,811 | | | | 1,056 | |
Brazil Government International Bond
4.250%, due 01/07/25 | | | (1.000%) | | | | Quarterly | | | 12/20/23 | | BBP | | | 2.051% | | | | USD | | | | 736,000 | | | | 34,624 | | | | 31,700 | | | | 2,924 | |
Brazil Government International Bond
4.250%, due 01/07/25 | | | (1.000%) | | | | Quarterly | | | 12/20/23 | | BBP | | | 2.051% | | | | USD | | | | 736,000 | | | | 34,624 | | | | 31,856 | | | | 2,768 | |
Brazil Government International Bond
4.250%, due 01/07/25 | | | (1.000%) | | | | Quarterly | | | 12/20/23 | | BBP | | | 2.051% | | | | USD | | | | 736,000 | | | | 34,624 | | | | 32,951 | | | | 1,673 | |
Brazil Government International Bond
4.250%, due 01/07/25 | | | (1.000%) | | | | Quarterly | | | 12/20/23 | | BBP | | | 2.051% | | | | USD | | | | 736,000 | | | | 34,624 | | | | 32,132 | | | | 2,492 | |
Brazil Government International Bond
4.250%, due 01/07/25 | | | (1.000%) | | | | Quarterly | | | 12/20/23 | | BBP | | | 2.051% | | | | USD | | | | 736,000 | | | | 34,624 | | | | 32,132 | | | | 2,492 | |
Brazil Government International Bond
4.250%, due 01/07/25 | | | (1.000%) | | | | Quarterly | | | 12/20/23 | | BBP | | | 2.051% | | | | USD | | | | 736,000 | | | | 34,624 | | | | 32,132 | | | | 2,492 | |
Brazil Government International Bond
4.250%, due 01/07/25 | | | (1.000%) | | | | Quarterly | | | 12/20/23 | | BBP | | | 2.051% | | | | USD | | | | 736,000 | | | | 34,624 | | | | 32,760 | | | | 1,864 | |
Brazil Government International Bond
4.250%, due 01/07/25 | | | (1.000%) | | | | Quarterly | | | 12/20/23 | | BBP | | | 2.051% | | | | USD | | | | 736,000 | | | | 34,624 | | | | 32,760 | | | | 1,864 | |
Brazil Government International Bond
4.250%, due 01/07/25 | | | (1.000%) | | | | Quarterly | | | 12/20/23 | | BBP | | | 2.051% | | | | USD | | | | 735,280 | | | | 34,590 | | | | 33,852 | | | | 738 | |
Brazil Government International Bond
4.250%, due 01/07/25 | | | (1.000%) | | | | Quarterly | | | 12/20/23 | | BBP | | | 2.051% | | | | USD | | | | 735,000 | | | | 34,577 | | | | 31,657 | | | | 2,920 | |
Brazil Government International Bond
4.250%, due 01/07/25 | | | (1.000%) | | | | Quarterly | | | 12/20/23 | | BBP | | | 2.051% | | | | USD | | | | 735,000 | | | | 34,577 | | | | 32,088 | | | | 2,489 | |
Brazil Government International Bond
4.250%, due 01/07/25 | | | (1.000%) | | | | Quarterly | | | 12/20/23 | | BBP | | | 2.051% | | | | USD | | | | 735,000 | | | | 34,577 | | | | 32,088 | | | | 2,489 | |
Brazil Government International Bond
4.250%, due 01/07/25 | | | (1.000%) | | | | Quarterly | | | 12/20/23 | | CBNA | | | 2.051% | | | | USD | | | | 8,843,193 | | | | 416,013 | | | | 769,298 | | | | (353,285) | |
Brazil Government International Bond
4.250%, due 01/07/25 | | | (1.000%) | | | | Quarterly | | | 12/20/23 | | GSI | | | 2.051% | | | | USD | | | | 3,050,000 | | | | 143,482 | | | | 258,895 | | | | (115,413) | |
Brazil Government International Bond
4.250%, due 01/07/25 | | | (1.000%) | | | | Quarterly | | | 12/20/23 | | GSI | | | 2.051% | | | | USD | | | | 504,000 | | | | 23,710 | | | | 22,380 | | | | 1,330 | |
Mexico Government International Bond
7.500%, due 04/08/33 | | | (1.000%) | | | | Quarterly | | | 06/20/20 | | JPMC | | | 0.885% | | | | USD | | | | 3,824,276 | | | | (6,369) | | | | 33,406 | | | | (39,775) | |
Mexico Government International Bond
7.500%, due 04/08/33 | | | (1.000%) | | | | Quarterly | | | 09/20/20 | | BOA | | | 0.912% | | | | USD | | | | 3,824,276 | | | | (5,696) | | | | 50,241 | | | | (55,937) | |
Mexico Government International Bond
4.150%, due 03/28/27 | | | (1.000%) | | | | Quarterly | | | 12/20/23 | | BNP | | | 1.549% | | | | USD | | | | 709,000 | | | | 17,647 | | | | 15,714 | | | | 1,933 | |
Mexico Government International Bond
4.150%, due 03/28/27 | | | (1.000%) | | | | Quarterly | | | 12/20/23 | | BNP | | | 1.549% | | | | USD | | | | 709,000 | | | | 17,647 | | | | 15,714 | | | | 1,933 | |
Mexico Government International Bond
4.150%, due 03/28/27 | | | (1.000%) | | | | Quarterly | | | 12/20/23 | | BNP | | | 1.549% | | | | USD | | | | 616,000 | | | | 15,333 | | | | 4,687 | | | | 10,646 | |
Mexico Government International Bond
4.150%, due 03/28/27 | | | (1.000%) | | | | Quarterly | | | 12/20/23 | | BNP | | | 1.549% | | | | USD | | | | 616,000 | | | | 15,333 | | | | 4,961 | | | | 10,372 | |
Mexico Government International Bond
4.150%, due 03/28/27 | | | (1.000%) | | | | Quarterly | | | 12/20/23 | | BNP | | | 1.549% | | | | USD | | | | 616,000 | | | | 15,333 | | | | 4,961 | | | | 10,372 | |
Mexico Government International Bond
4.150%, due 03/28/27 | | | (1.000%) | | | | Quarterly | | | 12/20/23 | | BNP | | | 1.549% | | | | USD | | | | 615,000 | | | | 15,308 | | | | 4,953 | | | | 10,355 | |
Mexico Government International Bond
4.150%, due 03/28/27 | | | (1.000%) | | | | Quarterly | | | 12/20/23 | | BNP | | | 1.549% | | | | USD | | | | 582,000 | | | | 14,486 | | | | 12,899 | | | | 1,587 | |
Mexico Government International Bond
4.150%, due 03/28/27 | | | (1.000%) | | | | Quarterly | | | 12/20/23 | | BNP | | | 1.549% | | | | USD | | | | 449,000 | | | | 11,176 | | | | 4,301 | | | | 6,875 | |
See accompanying notes to financial statements.
BHFTII-41
Brighthouse Funds Trust II
BlackRock Bond Income Portfolio
Schedule of Investments as of December 31, 2018
OTC Credit Default Swaps on Sovereign Issues—Buy Protection (a)—(Continued)
| | | | | | | | | | | | | | | | | | | | | | | | | | | | | | | | | | | | |
Reference Obligation | | Fixed Deal
(Pay) Rate | | | Payment
Frequency | | | Maturity
Date | | Counterparty | | Implied Credit
Spread at
December 31,
2018(b) | | | Notional
Amount(c) | | | Market
Value | | | Upfront
Premium
Paid/(Received) | | | Unrealized
Appreciation/
(Depreciation) | |
Mexico Government International Bond
4.150%, due 03/28/27 | | | (1.000%) | | | | Quarterly | | | 12/20/23 | | BBP | | | 1.549% | | | | USD | | | | 1,386,000 | | | $ | 34,498 | | | $ | 10,536 | | | $ | 23,962 | |
Mexico Government International Bond
4.150%, due 03/28/27 | | | (1.000%) | | | | Quarterly | | | 12/20/23 | | BBP | | | 1.549% | | | | USD | | | | 1,235,000 | | | | 30,740 | | | | 9,663 | | | | 21,077 | |
Mexico Government International Bond
4.150%, due 03/28/27 | | | (1.000%) | | | | Quarterly | | | 12/20/23 | | BBP | | | 1.549% | | | | USD | | | | 617,000 | | | | 15,357 | | | | 4,690 | | | | 10,667 | |
Mexico Government International Bond
4.150%, due 03/28/27 | | | (1.000%) | | | | Quarterly | | | 12/20/23 | | CBNA | | | 1.549% | | | | USD | | | | 2,400,000 | | | | 59,738 | | | | 52,482 | | | | 7,256 | |
Mexico Government International Bond
4.150%, due 03/28/27 | | | (1.000%) | | | | Quarterly | | | 12/20/23 | | CBNA | | | 1.549% | | | | USD | | | | 1,880,000 | | | | 46,794 | | | | 18,050 | | | | 28,744 | |
Mexico Government International Bond
4.150%, due 03/28/27 | | | (1.000%) | | | | Quarterly | | | 12/20/23 | | CBNA | | | 1.549% | | | | USD | | | | 1,120,000 | | | | 27,878 | | | | 10,753 | | | | 17,125 | |
Mexico Government International Bond
4.150%, due 03/28/27 | | | (1.000%) | | | | Quarterly | | | 12/20/23 | | CBNA | | | 1.549% | | | | USD | | | | 853,081 | | | | 21,234 | | | | 20,131 | | | | 1,103 | |
Mexico Government International Bond
4.150%, due 03/28/27 | | | (1.000%) | | | | Quarterly | | | 12/20/23 | | CBNA | | | 1.549% | | | | USD | | | | 847,845 | | | | 21,103 | | | | 15,130 | | | | 5,973 | |
Mexico Government International Bond
4.150%, due 03/28/27 | | | (1.000%) | | | | Quarterly | | | 12/20/23 | | CBNA | | | 1.549% | | | | USD | | | | 708,000 | | | | 17,623 | | | | 3,967 | | | | 13,656 | |
Mexico Government International Bond
4.150%, due 03/28/27 | | | (1.000%) | | | | Quarterly | | | 12/20/23 | | CBNA | | | 1.549% | | | | USD | | | | 707,000 | | | | 17,598 | | | | 13,550 | | | | 4,048 | |
Mexico Government International Bond
4.150%, due 03/28/27 | | | (1.000%) | | | | Quarterly | | | 12/20/23 | | CBNA | | | 1.549% | | | | USD | | | | 707,000 | | | | 17,598 | | | | 15,406 | | | | 2,192 | |
Mexico Government International Bond
4.150%, due 03/28/27 | | | (1.000%) | | | | Quarterly | | | 12/20/23 | | CBNA | | | 1.549% | | | | USD | | | | 706,000 | | | | 17,573 | | | | 13,995 | | | | 3,578 | |
Mexico Government International Bond
4.150%, due 03/28/27 | | | (1.000%) | | | | Quarterly | | | 12/20/23 | | CBNA | | | 1.549% | | | | USD | | | | 706,000 | | | | 17,573 | | | | 16,002 | | | | 1,571 | |
Mexico Government International Bond
4.150%, due 03/28/27 | | | (1.000%) | | | | Quarterly | | | 12/20/23 | | CBNA | | | 1.549% | | | | USD | | | | 606,000 | | | | 15,084 | | | | 3,260 | | | | 11,824 | |
Mexico Government International Bond
4.150%, due 03/28/27 | | | (1.000%) | | | | Quarterly | | | 12/20/23 | | CBNA | | | 1.549% | | | | USD | | | | 606,000 | | | | 15,084 | | | | 3,531 | | | | 11,553 | |
Mexico Government International Bond
4.150%, due 03/28/27 | | | (1.000%) | | | | Quarterly | | | 12/20/23 | | CBNA | | | 1.549% | | | | USD | | | | 601,000 | | | | 14,959 | | | | 4,435 | | | | 10,524 | |
Mexico Government International Bond
4.150%, due 03/28/27 | | | (1.000%) | | | | Quarterly | | | 12/20/23 | | CBNA | | | 1.549% | | | | USD | | | | 590,000 | | | | 14,685 | | | | 3,569 | | | | 11,116 | |
Mexico Government International Bond
4.150%, due 03/28/27 | | | (1.000%) | | | | Quarterly | | | 12/20/23 | | DBAG | | | 1.549% | | | | USD | | | | 575,000 | | | | 14,312 | | | | 5,636 | | | | 8,676 | |
Mexico Government International Bond
4.150%, due 03/28/27 | | | (1.000%) | | | | Quarterly | | | 12/20/23 | | DBAG | | | 1.549% | | | | USD | | | | 574,000 | | | | 14,287 | | | | 5,626 | | | | 8,661 | |
Mexico Government International Bond
4.150%, due 03/28/27 | | | (1.000%) | | | | Quarterly | | | 12/20/23 | | MSIP | | | 1.549% | | | | USD | | | | 589,000 | | | | 14,661 | | | | 4,874 | | | | 9,787 | |
Mexico Government International Bond
4.150%, due 03/28/27 | | | (1.000%) | | | | Quarterly | | | 12/20/23 | | MSIP | | | 1.549% | | | | USD | | | | 406,000 | | | | 10,106 | | | | 4,167 | | | | 5,939 | |
Philippines Government International Bond
10.625%, due 03/16/25 | | | (1.000%) | | | | Quarterly | | | 12/20/23 | | BNP | | | 0.866% | | | | USD | | | | 5,396,000 | | | | (33,207) | | | | (25,366) | | | | (7,841) | |
Republic of Colombia
10.375%, due 01/28/33 | | | (1.000%) | | | | Quarterly | | | 12/20/23 | | BOA | | | 1.568% | | | | USD | | | | 428,000 | | | | 11,022 | | | | 4,687 | | | | 6,335 | |
Republic of Colombia
10.375%, due 01/28/33 | | | (1.000%) | | | | Quarterly | | | 12/20/23 | | BBP | | | 1.568% | | | | USD | | | | 721,000 | | | | 18,567 | | | | 13,821 | | | | 4,746 | |
Republic of Colombia
10.375%, due 01/28/33 | | | (1.000%) | | | | Quarterly | | | 12/20/23 | | BBP | | | 1.568% | | | | USD | | | | 720,000 | | | | 18,542 | | | | 13,802 | | | | 4,740 | |
Republic of Colombia
10.375%, due 01/28/33 | | | (1.000%) | | | | Quarterly | | | 12/20/23 | | CBNA | | | 1.568% | | | | USD | | | | 704,000 | | | | 18,130 | | | | 13,188 | | | | 4,942 | |
Republic of Colombia
10.375%, due 01/28/33 | | | (1.000%) | | | | Quarterly | | | 12/20/23 | | CBNA | | | 1.568% | | | | USD | | | | 704,000 | | | | 18,130 | | | | 14,270 | | | | 3,860 | |
Republic of Colombia
10.375%, due 01/28/33 | | | (1.000%) | | | | Quarterly | | | 12/20/23 | | CBNA | | | 1.568% | | | | USD | | | | 704,000 | | | | 18,129 | | | | 13,497 | | | | 4,632 | |
See accompanying notes to financial statements.
BHFTII-42
Brighthouse Funds Trust II
BlackRock Bond Income Portfolio
Schedule of Investments as of December 31, 2018
OTC Credit Default Swaps on Sovereign Issues—Buy Protection (a)—(Continued)
| | | | | | | | | | | | | | | | | | | | | | | | | | | | | | | | | | | | |
Reference Obligation | | Fixed Deal
(Pay) Rate | | | Payment
Frequency | | | Maturity
Date | | Counterparty | | Implied Credit
Spread at
December 31,
2018(b) | | | Notional
Amount(c) | | | Market
Value | | | Upfront
Premium
Paid/(Received) | | | Unrealized
Appreciation/
(Depreciation) | |
Republic of Colombia
10.375%, due 01/28/33 | | | (1.000%) | | | | Quarterly | | | 12/20/23 | | CBNA | | | 1.568% | | | | USD | | | | 703,000 | | | $ | 18,104 | | | $ | 13,942 | | | $ | 4,162 | |
Republic of Colombia
10.375%, due 01/23/33 | | | (1.000%) | | | | Quarterly | | | 12/20/23 | | CBNA | | | 1.568% | | | | USD | | | | 589,000 | | | | 15,168 | | | | 4,504 | | | | 10,664 | |
Republic of Colombia
10.375%, due 01/28/33 | | | (1.000%) | | | | Quarterly | | | 12/20/23 | | BNP | | | 1.568% | | | | USD | | | | 305,289 | | | | 7,862 | | | | 5,171 | | | | 2,691 | |
Republic of Colombia
10.375%, due 01/28/33 | | | (1.000%) | | | | Quarterly | | | 12/20/23 | | BNP | | | 1.568% | | | | USD | | | | 274,424 | | | | 7,067 | | | | 4,286 | | | | 2,781 | |
Republic of Colombia
10.375%, due 01/28/33 | | | (1.000%) | | | | Quarterly | | | 12/20/23 | | CBNA | | | 1.568% | | | | USD | | | | 225,000 | | | | 5,794 | | | | 4,214 | | | | 1,580 | |
Republic of Colombia
10.375%, due 01/28/33 | | | (1.000%) | | | | Quarterly | | | 12/20/23 | | DBAG | | | 1.568% | | | | USD | | | | 719,000 | | | | 18,516 | | | | 13,783 | | | | 4,733 | |
Turkey Government International Bond
11.280%, due 01/15/30 | | | (1.000%) | | | | Quarterly | | | 12/20/23 | | MSIP | | | 3.591% | | | | USD | | | | 251,800 | | | | 27,747 | | | | 28,227 | | | | (480) | |
| | | | | | | | | | | | | | | | | | | | | | | | | | | | | | | | | | | | |
Totals | | | $ | 1,916,088 | | | $ | 2,121,548 | | | $ | (205,460) | |
| | | | | | | | | | | | | | | | | | | | | | | | | | | | | | | | | | | | |
OTC Credit Default Swaps on Sovereign Issues—Sell Protection (d)
| | | | | | | | | | | | | | | | | | | | | | | | | | | | | | | | | | |
Reference Obligation | | Fixed Deal
Receive Rate | | | Payment
Frequency | | Maturity
Date | | Counterparty | | Implied Credit
Spread at
December 31,
2018(b) | | | Notional
Amount(c) | | | Market
Value | | | Upfront
Premium
(Received) | | | Unrealized
Appreciation | |
Mexico Government International Bond
7.500%, due 04/08/33 | | | 1.000% | | | Quarterly | | 06/20/20 | | BOA | | | 0.885% | | | | USD | | | | 3,824,276 | | | $ | 6,368 | | | $ | (38,756) | | | $ | 45,124 | |
Mexico Government International Bond
7.500%, due 04/08/33 | | | 1.000% | | | Quarterly | | 09/20/20 | | JPMC | | | 0.912% | | | | USD | | | | 3,824,276 | | | | 5,696 | | | | (43,741) | | | | 49,437 | |
| | | | | | | | | | | | | | | | | | | | | | | | | | | | | | | | | | |
Totals | | | $ | 12,064 | | | $ | (82,497) | | | $ | 94,561 | |
| | | | | | | | | | | | | | | | | | | | | | | | | | | | | | | | | | |
OTC Credit Default Swaps on Credit Indices—Buy Protection (a)
| | | | | | | | | | | | | | | | | | | | | | | | | | | | | | | | | | | | |
Reference Obligation | | Fixed Deal
(Pay) Rate | | | Payment
Frequency | | | Maturity
Date | | Counterparty | | Implied Credit
Spread at
December 31,
2018(b) | | | Notional
Amount(c) | | | Market
Value | | | Upfront
Premium
Paid/(Received) | | | Unrealized
Appreciation/
(Depreciation) | |
CMBX.NA.A.V9 | | | (2.000%) | | | | Monthly | | | 09/17/58 | | CBNA | | | 2.703% | | | | USD | | | | 510,000 | | | $ | 20,695 | | | $ | 10,212 | | | $ | 10,483 | |
CMBX.NA.A.V9 | | | (2.000%) | | | | Monthly | | | 09/17/58 | | CSI | | | 2.703% | | | | USD | | | | 600,000 | | | | 24,347 | | | | 10,952 | | | | 13,395 | |
CMBX.NA.A.V9 | | | (2.000%) | | | | Monthly | | | 09/17/58 | | CSI | | | 2.703% | | | | USD | | | | 510,000 | | | | 20,695 | | | | 9,582 | | | | 11,113 | |
CMBX.NA.A.V9 | | | (2.000%) | | | | Monthly | | | 09/17/58 | | CSI | | | 2.703% | | | | USD | | | | 481,000 | | | | 19,518 | | | | 8,172 | | | | 11,346 | |
CMBX.NA.A.V9 | | | (2.000%) | | | | Monthly | | | 09/17/58 | | GSI | | | 2.703% | | | | USD | | | | 260,000 | | | | 10,550 | | | | 5,203 | | | | 5,347 | |
CMBX.NA.AAA.V6 | | | (0.500%) | | | | Monthly | | | 05/11/63 | | DBAG | | | 0.314% | | | | USD | | | | 1,670,000 | | | | (10,206) | | | | 242 | | | | (10,448) | |
CMBX.NA.AAA.V6 | | | (0.500%) | | | | Monthly | | | 05/11/63 | | DBAG | | | 0.314% | | | | USD | | | | 2,340,000 | | | | (14,301) | | | | (883) | | | | (13,418) | |
CMBX.NA.AAA.V6 | | | (0.500%) | | | | Monthly | | | 05/11/63 | | DBAG | | | 0.314% | | | | USD | | | | 2,680,000 | | | | (16,379) | | | | 745 | | | | (17,124) | |
CMBX.NA.AAA.V9 | | | (0.500%) | | | | Monthly | | | 09/17/58 | | CSI | | | 0.561% | | | | USD | | | | 1,610,000 | | | | 6,032 | | | | 19,805 | | | | (13,773) | |
CMBX.NA.AAA.V9 | | | (0.500%) | | | | Monthly | | | 09/17/58 | | DBAG | | | 0.561% | | | | USD | | | | 1,280,000 | | | | 4,795 | | | | 15,972 | | | | (11,177) | |
CMBX.NA.AAA.V9 | | | (0.500%) | | | | Monthly | | | 09/17/58 | | MSIP | | | 0.561% | | | | USD | | | | 1,960,000 | | | | 7,343 | | | | 26,423 | | | | (19,080) | |
CMBX.NA.AAA.V9 | | | (0.500%) | | | | Monthly | | | 09/17/58 | | MSIP | | | 0.561% | | | | USD | | | | 1,090,000 | | | | 4,084 | | | | 13,409 | | | | (9,325) | |
CMBX.NA.AAA.V9 | | | (0.500%) | | | | Monthly | | | 09/17/58 | | MSIP | | | 0.561% | | | | USD | | | | 900,000 | | | | 3,372 | | | | 11,071 | | | | (7,699) | |
CMBX.NA.BBB-.V6 | | | (3.000%) | | | | Monthly | | | 05/11/63 | | JPMC | | | 8.287% | | | | USD | | | | 340,000 | | | | 54,828 | | | | 34,298 | | | | 20,530 | |
| | | | | | | | | | | | | | | | | | | | | | | | | | | | | | | | | | | | |
Totals | | | $ | 135,373 | | | $ | 165,203 | | | $ | (29,830) | |
| | | | | | | | | | | | | | | | | | | | | | | | | | | | | | | | | | | | |
See accompanying notes to financial statements.
BHFTII-43
Brighthouse Funds Trust II
BlackRock Bond Income Portfolio
Schedule of Investments as of December 31, 2018
OTC Credit Default Swaps on Credit Indices—Sell Protection (d)
| | | | | | | | | | | | | | | | | | | | | | | | | | | | | | | | | | | | |
Reference Obligation | | Fixed Deal
Receive Rate | | | Payment
Frequency | | | Maturity
Date | | Counterparty | | Implied Credit
Spread at
December 31,
2018(b) | | | Notional
Amount(c) | | | Market
Value | | | Upfront
Premium
(Received) | | | Unrealized
Appreciation/
(Depreciation) | |
CMBX.NA.A.V10 | | | 2.000% | | | | Monthly | | | 11/17/59 | | DBAG | | | 2.656% | | | | USD | | | | 660,000 | | | $ | (28,104) | | | $ | (30,601) | | | $ | 2,497 | |
CMBX.NA.A.V10 | | | 2.000% | | | | Monthly | | | 11/17/59 | | DBAG | | | 2.656% | | | | USD | | | | 1,310,000 | | | | (55,782) | | | | (59,736) | | | | 3,954 | |
CMBX.NA.A.V8 | | | 2.000% | | | | Monthly | | | 10/17/57 | | GSI | | | 2.743% | | | | USD | | | | 670,000 | | | | (25,020) | | | | (38,377) | | | | 13,357 | |
CMBX.NA.A.V8 | | | 2.000% | | | | Monthly | | | 10/17/57 | | MSIP | | | 2.743% | | | | USD | | | | 190,000 | | | | (7,095) | | | | (22,074) | | | | 14,979 | |
CMBX.NA.AAA.V7 | | | 0.500% | | | | Monthly | | | 01/17/47 | | CSI | | | 0.375% | | | | USD | | | | 5,000,000 | | | | 27,778 | | | | (156,398) | | | | 184,176 | |
CMBX.NA.AM.V4 | | | 0.500% | | | | Monthly | | | 02/17/51 | | DBAG | | | 6.842% | | | | USD | | | | 2,370,000 | | | | (10,369) | | | | (359,977) | | | | 349,608 | |
CMBX.NA.BBB-.V10 | | | 3.000% | | | | Monthly | | | 11/17/59 | | JPMC | | | 4.924% | | | | USD | | | | 40,000 | | | | (4,601) | | | | (3,575) | | | | (1,026) | |
CMBX.NA.BBB-.V6 | | | 3.000% | | | | Monthly | | | 05/11/63 | | CSI | | | 8.287% | | | | USD | | | | 340,000 | | | | (54,828) | | | | (28,925) | | | | (25,903) | |
CMBX.NA.BBB-.V9 | | | 3.000% | | | | Monthly | | | 09/17/58 | | CSI | | | 5.285% | | | | USD | | | | 1,056,000 | | | | (128,238) | | | | (94,658) | | | | (33,580) | |
CMBX.NA.BBB-.V9 | | | 3.000% | | | | Monthly | | | 09/17/58 | | DBAG | | | 5.285% | | | | USD | | | | 718,000 | | | | (87,192) | | | | (88,116) | | | | 924 | |
CMBX.NA.BBB-.V9 | | | 3.000% | | | | Monthly | | | 09/17/58 | | DBAG | | | 5.285% | | | | USD | | | | 860,000 | | | | (104,436) | | | | (94,404) | | | | (10,032) | |
CMBX.NA.BBB-.V9 | | | 3.000% | | | | Monthly | | | 09/17/58 | | JPMC | | | 5.285% | | | | USD | | | | 272,000 | | | | (33,031) | | | | (24,444) | | | | (8,587) | |
CMBX.NA.BBB-.V9 | | | 3.000% | | | | Monthly | | | 09/17/58 | | MSIP | | | 5.285% | | | | USD | | | | 21,000 | | | | (2,550) | | | | (2,619) | | | | 69 | |
CMBX.NA.BBB-.V9 | | | 3.000% | | | | Monthly | | | 09/17/58 | | MSIP | | | 5.285% | | | | USD | | | | 290,000 | | | | (35,217) | | | | (37,644) | | | | 2,427 | |
CMBX.NA.BBB-.V9 | | | 3.000% | | | | Monthly | | | 09/17/58 | | MSIP | | | 5.285% | | | | USD | | | | 320,000 | | | | (38,860) | | | | (32,777) | | | | (6,083) | |
CMBX.NA.BBB-.V9 | | | 3.000% | | | | Monthly | | | 09/17/58 | | MSIP | | | 5.285% | | | | USD | | | | 500,000 | | | | (60,719) | | | | (53,964) | | | | (6,755) | |
| | | | | | | | | | | | | | | | | | | | | | | | | | | | | | | | | | | | |
Totals | | | $ | (648,264) | | | $ | (1,128,289) | | | $ | 480,025 | |
| | | | | | | | | | | | | | | | | | | | | | | | | | | | | | | | | | | | |
Securities in the amount of $ 1,022,842 and cash in the amount of $110,000 have been received at the custodian bank as collateral for OTC swap contracts.
| | | | |
| (a) | | If the Portfolio is a buyer of protection and a credit event occurs, as defined under the terms of that particular swap agreement, the Portfolio will either (i) receive from the seller of protection an amount equal to the notional amount of the swap and deliver the referenced obligation or underlying securities comprising the referenced index or (ii) receive a net settlement amount in the form of cash or securities equal to the notional amount of the swap less the recovery value of the referenced obligation or underlying securities comprising the referenced index. |
| (b) | | Implied credit spreads, represented in absolute terms, utilized in determining the market value of credit default swap agreements on corporate issues or indices as of period end serve as an indicator of the current status of the payment/performance risk and represent the likelihood or risk of default for the credit derivative. The implied credit spread of a particular referenced entity reflects the cost of buying/selling protection and may include upfront payments required to be made to enter into the agreement. Wider credit spreads represent a deterioration of the referenced entity’s credit soundness and a greater likelihood or risk of default or other credit event occurring as defined under the terms of the agreement. A credit spread identified as “Defaulted” indicates a credit event has occurred for the referenced entity or obligation. |
| (c) | | The maximum potential amount of future undiscounted payments that the Portfolio could be required to make under a credit default swap contract would be the notional amount of the contract. These potential amounts would be partially offset by any recovery values of the referenced debt obligation or net amounts received from the settlement of purchased protection credit default swap contracts entered into by the Portfolio for the same referenced debt obligation. |
| (d) | | If the Portfolio is a seller of protection and a credit event occurs, as defined under the terms of that particular swap agreement, the Portfolio will either (i) pay to the buyer of protection an amount equal to the notional amount of the swap and take delivery of the referenced obligation or underlying securities comprising the referenced index or (ii) pay a net settlement amount in the form of cash or securities equal to the notional amount of the swap less the recovery value of the referenced obligation or underlying securities comprising the referenced index. |
| (1) | | There is no upfront payment premium paid or (received) therefore Market Value equals Unrealized Appreciation/(Depreciation). |
Glossary of Abbreviations
Counterparties
| | | | |
| (BBP)— | | Barclays Bank plc |
| (BNP)— | | BNP Paribas S.A. |
| (BOA)— | | Bank of America N.A. |
| (CBNA)— | | Citibank N.A. |
| (CSI)— | | Credit Suisse International |
| (DBAG)— | | Deutsche Bank AG |
| (GSI)— | | Goldman Sachs International |
| (JPMC)— | | JPMorgan Chase Bank N.A. |
| (MSIP)— | | Morgan Stanley & Co. International plc |
| (NAB)— | | National Australia Bank Ltd. |
| (NIP)— | | Nomura International plc |
| (NTC)— | | Northern Trust Co. |
| (TDB)— | | Toronto Dominion Bank |
| (UBSA)— | | UBS AG |
Currencies
| | | | |
| (ARS)— | | Argentine Peso |
| (BRL)— | | Brazilian Real |
| (CAD)— | | Canadian Dollar |
| (CHF)— | | Swiss Franc |
| (CLP)— | | Chilean Peso |
| (COP)— | | Colombian Peso |
| (EUR)— | | Euro |
| (GBP)— | | British Pound |
| (IDR)— | | Indonesian Rupiah |
| (JPY)— | | Japanese Yen |
| (KRW)— | | South Korean Won |
| (MXN)— | | Mexican Peso |
| (RUB)— | | Russian Ruble |
| (TRY)— | | Turkish Lira |
| (TWD)— | | Taiwanese Dollar |
| (USD)— | | United States Dollar |
| (ZAR)— | | South African Rand |
See accompanying notes to financial statements.
BHFTII-44
Brighthouse Funds Trust II
BlackRock Bond Income Portfolio
Schedule of Investments as of December 31, 2018
Glossary of Abbreviations—(Continued)
Index Abbreviations
| | | | |
| (BADLAR)— | | Buenos Aires Deposits of Large Amount Rate Index |
| (CDI)— | | Brazil Interbank Deposit Rate |
| (CDX.NA.HY)— | | Markit North America High Yield CDS Index |
| (CMBX.NA.A)— | | Markit North America A Rated CMBS Index |
| (CMBX.NA.AAA)— | | Markit North America AAA Rated CMBS Index |
| (CMBX.NA.AM)— | | Markit North America Mezzanine AAA Rated CMBS Index |
| (CMBX.NA.BBB-)— | | Markit North AmericaBBB- Rated CMBS Index |
| (CMT)— | | Constant Maturity Treasury Index |
| (EURIBOR)— | | Euro Interbank Offered Rate |
| (FEDEFF PRV)— | | Effective Federal Funds Rate |
| (H15)— | | U.S. Treasury Yield Curve Rate T-Note Constant Maturity Index |
| (ICE)— | | Intercontinental Exchange, Inc. |
| (LIBOR)— | | London Interbank Offered Rate |
| (MTA)— | | Monthly Treasury Average Index |
| (TIIE)— | | Mexican Interbank Equilibrium Interest Rate |
| (UKRPI)— | | United Kingdom Retail Price Index |
Other Abbreviations
| | | | |
| (ACES)— | | Alternative Credit Enhancement Securities |
| (CDO)— | | Collateralized Debt Obligation |
| (CLO)— | | Collateralized Loan Obligation |
| (CMO)— | | Collateralized Mortgage Obligation |
| (IRS)— | | Interest Rate Swap |
| (REMIC)— | | Real Estate Mortgage Investment Conduit |
See accompanying notes to financial statements.
BHFTII-45
Brighthouse Funds Trust II
BlackRock Bond Income Portfolio
Schedule of Investments as of December 31, 2018
Fair Value Hierarchy
Accounting principles generally accepted in the United States of America (“GAAP”) define fair market value as the price that the Portfolio would receive to sell an asset or pay to transfer a liability in an orderly transaction between market participants at the measurement date. It establishes a fair value hierarchy that prioritizes inputs to valuation methods and requires disclosure of the fair value hierarchy, separately for each major category of assets and liabilities, that segregates fair value measurements into three levels. Levels 1, 2 and 3 of the fair value hierarchy are defined as follows:
Level 1 - unadjusted quoted prices in active markets for identical investments
Level 2 - other significant observable inputs (including, but not limited to, quoted prices for similar assets or liabilities in markets that are either active or inactive; inputs other than quoted prices that are observable such as interest rates, yield curves, volatilities, prepayment speeds, loss severities, credit risks, default rates, or other market corroborated inputs)
Level 3 - significant unobservable inputs based on the best information available in the circumstances, to the extent observable inputs are unavailable (including the Portfolio’s own assumptions used in determining the fair value of investments and derivative financial instruments)
The inputs or methodologies used for valuing investments are not necessarily an indication of the risk associated with investing in them. Changes to the inputs or methodologies used may result in transfers between levels. A reconciliation of Level 3 securities, if any, will be disclosed following the fair value hierarchy table. For more information about the Portfolio’s policy regarding the valuation of investments, please refer to the Notes to Financial Statements.
The following table summarizes the fair value hierarchy of the Portfolio’s investments as of December 31, 2018:
| | | | | | | | | | | | | | | | |
| Description | | Level 1 | | | Level 2 | | | Level 3 | | | Total | |
Total U.S. Treasury & Government Agencies* | | $ | — | | | $ | 1,703,709,560 | | | $ | — | | | $ | 1,703,709,560 | |
Total Corporate Bonds & Notes* | | | — | | | | 1,261,475,089 | | | | — | | | | 1,261,475,089 | |
| Asset-Backed Securities | |
Asset-Backed - Home Equity | | | — | | | | 34,776,724 | | | | — | | | | 34,776,724 | |
Asset-Backed - Manufactured Housing | | | — | | | | 16,361,602 | | | | — | | | | 16,361,602 | |
Asset-Backed - Other | | | — | | | | 299,822,798 | | | | 9,336,702 | | | | 309,159,500 | |
Asset-Backed - Student Loan | | | — | | | | 16,842,677 | | | | — | | | | 16,842,677 | |
Total Asset-Backed Securities | | | — | | | | 367,803,801 | | | | 9,336,702 | | | | 377,140,503 | |
Total Municipals | | | — | | | | 261,061,318 | | | | — | | | | 261,061,318 | |
Total Mortgage-Backed Securities* | | | — | | | | 164,122,901 | | | | — | | | | 164,122,901 | |
Total Foreign Government* | | | — | | | | 91,648,628 | | | | — | | | | 91,648,628 | |
| Floating Rate Loans | |
Commercial Services | | | — | | | | — | | | | 5,169,300 | | | | 5,169,300 | |
Distribution/Wholesale | | | — | | | | 10,458,553 | | | | — | | | | 10,458,553 | |
Diversified Financial Services (Less Unfunded Loan Commitments of $2,241,504) | | | — | | | | 4,570,091 | | | | 17,633,908 | | | | 22,203,999 | |
Entertainment | | | — | | | | 1,365,666 | | | | — | | | | 1,365,666 | |
Iron/Steel | | | — | | | | 399,105 | | | | — | | | | 399,105 | |
Miscellaneous Manufacturing | | | — | | | | 113,189 | | | | — | | | | 113,189 | |
Pipelines | | | — | | | | 1,060,218 | | | | — | | | | 1,060,218 | |
Retail | | | — | | | | 1,117,719 | | | | — | | | | 1,117,719 | |
Total Floating Rate Loans (Less Unfunded Loan Commitments) | | | — | | | | 19,084,541 | | | | 22,803,208 | | | | 41,887,749 | |
Total Escrow Shares* | | | — | | | | — | | | | 1 | | | | 1 | |
Total Short-Term Investments* | | | — | | | | 122,956,435 | | | | — | | | | 122,956,435 | |
Total Securities Lending Reinvestments* | | | — | | | | 86,783,321 | | | | — | | | | 86,783,321 | |
Total Purchased Options* | | | — | | | | 7,011,429 | | | | — | | | | 7,011,429 | |
Total Investments | | $ | — | | | $ | 4,085,657,023 | | | $ | 32,139,911 | | | $ | 4,117,796,934 | |
| | | | | | | | | | | | | | | | | |
Collateral for Securities Loaned (Liability) | | $ | — | | | $ | (86,769,752 | ) | | $ | — | | | $ | (86,769,752 | ) |
Total Reverse Repurchase Agreements (Liability) | | $ | — | | | $ | (100,198,083 | ) | | $ | — | | | $ | (100,198,083 | ) |
TBA Forward Sales Commitments | | $ | — | | | $ | (264,117,848 | ) | | $ | — | | | $ | (264,117,848 | ) |
| Forward Contracts | |
Forward Foreign Currency Exchange Contracts (Unrealized Appreciation) | | $ | — | | | $ | 469,541 | | | $ | — | | | $ | 469,541 | |
Forward Foreign Currency Exchange Contracts (Unrealized Depreciation) | | | — | | | | (3,764,716 | ) | | | — | | | | (3,764,716 | ) |
Total Forward Contracts | | $ | — | | | $ | (3,295,175 | ) | | $ | — | | | $ | (3,295,175 | ) |
| Futures Contracts | |
Futures Contracts (Unrealized Appreciation) | | $ | 16,813,038 | | | $ | — | | | $ | — | | | $ | 16,813,038 | |
Futures Contracts (Unrealized Depreciation) | | | (5,041,520 | ) | | | — | | | | — | | | | (5,041,520 | ) |
Total Futures Contracts | | $ | 11,771,518 | | | $ | — | | | $ | — | | | $ | 11,771,518 | |
See accompanying notes to financial statements.
BHFTII-46
Brighthouse Funds Trust II
BlackRock Bond Income Portfolio
Schedule of Investments as of December 31, 2018
Fair Value Hierarchy—(Continued)
| | | | | | | | | | | | | | | | |
| Description | | Level 1 | | | Level 2 | | | Level 3 | | | Total | |
| Written Options | |
Foreign Currency Written Options at Value | | $ | — | | | $ | (1,032,554 | ) | | $ | — | | | $ | (1,032,554 | ) |
Interest Rate Swaptions at Value | | | — | | | | (1,732,313 | ) | | | — | | | | (1,732,313 | ) |
Total Written Options | | $ | — | | | $ | (2,764,867 | ) | | $ | — | | | $ | (2,764,867 | ) |
| Centrally Cleared Swap Contracts | |
Centrally Cleared Swap Contracts (Unrealized Appreciation) | | $ | — | | | $ | 2,377,512 | | | $ | — | | | $ | 2,377,512 | |
Centrally Cleared Swap Contracts (Unrealized Depreciation) | | | — | | | | (2,557,253 | ) | | | — | | | | (2,557,253 | ) |
Total Centrally Cleared Swap Contracts | | $ | — | | | $ | (179,741 | ) | | $ | — | | | $ | (179,741 | ) |
| OTC Swap Contracts | |
OTC Swap Contracts at Value (Assets) | | $ | — | | | $ | 2,958,810 | | | $ | — | | | $ | 2,958,810 | |
OTC Swap Contracts at Value (Liabilities) | | | — | | | | (1,286,686 | ) | | | — | | | | (1,286,686 | ) |
Total OTC Swap Contracts | | $ | — | | | $ | 1,672,124 | | | $ | — | | | $ | 1,672,124 | |
| | | | |
| * | | See Schedule of Investments for additional detailed categorizations. |
Level 3 investments at the beginning and/or end of the period in relation to net assets were not significant and accordingly, a reconciliation of Level 3 assets for the year ended December 31, 2018 is not presented.
Transfers from Level 3 to Level 2 in the amount of $930,082 were due to the resumption of trading activity which resulted in the availability of significant observable inputs.
See accompanying notes to financial statements.
BHFTII-47
Brighthouse Funds Trust II
BlackRock Bond Income Portfolio
Statement of Assets and Liabilities
December 31, 2018
| | | | |
Assets | |
Investments at value (a) (b) (c) | | $ | 4,117,796,934 | |
Cash | | | 3,108,570 | |
Cash denominated in foreign currencies (d) | | | 31,189,428 | |
Cash collateral (e) | | | 7,409,458 | |
OTC swap contracts at market value (f) | | | 2,958,810 | |
Unrealized appreciation on forward foreign currency exchange contracts | | | 469,541 | |
Receivable for: | |
Investments sold | | | 4,881,926 | |
TBA securities sold (g) | | | 676,199,519 | |
Fund shares sold | | | 101,626 | |
Principal paydowns | | | 920 | |
Interest | | | 25,370,077 | |
Variation margin on futures contracts | | | 1,078,668 | |
Interest on OTC swap contracts | | | 150,717 | |
Prepaid expenses | | | 9,995 | |
Other assets | | | 2,852 | |
| | | | |
Total Assets | | | 4,870,729,041 | |
Liabilities | |
Written options at value (h) | | | 2,764,867 | |
TBA forward sales commitments, at value | | | 264,117,848 | |
Reverse repurchase agreements | | | 100,198,083 | |
Cash collateral (i) | | | 6,730,000 | |
OTC swap contracts at market value (j) | | | 1,286,686 | |
Unrealized depreciation on forward foreign currency exchange contracts | | | 3,764,716 | |
Collateral for securities loaned | | | 86,769,752 | |
Payables for: | |
Investments purchased | | | 2,308,539 | |
TBA securities purchased (g) | | | 865,645,065 | |
Fund shares redeemed | | | 4,775,944 | |
Interest on reverse repurchase agreements | | | 8,829 | |
Foreign taxes | | | 111 | |
Variation margin on centrally cleared swap contracts | | | 13,058 | |
Interest on forward sales commitments | | | 362,487 | |
Interest on OTC swap contracts | | | 160,475 | |
Accrued Expenses: | |
Management fees | | | 1,008,411 | |
Distribution and service fees | | | 110,037 | |
Deferred trustees’ fees | | | 111,638 | |
Other expenses | | | 1,008,535 | |
| | | | |
Total Liabilities | | | 1,341,145,081 | |
| | | | |
Net Assets | | $ | 3,529,583,960 | |
| | | | |
Net Assets Consist of: | |
Paid in surplus | | $ | 3,613,553,720 | |
Distributable earnings (Accumulated losses) (k) | | | (83,969,760 | ) |
| | | | |
Net Assets | | $ | 3,529,583,960 | |
| | | | |
Net Assets | |
Class A | | $ | 2,977,186,525 | |
Class B | | | 455,631,719 | |
Class E | | | 96,765,716 | |
Capital Shares Outstanding* | |
Class A | | | 28,922,077 | |
Class B | | | 4,510,592 | |
Class E | | | 949,016 | |
Net Asset Value, Offering Price and Redemption Price Per Share | |
Class A | | $ | 102.94 | |
Class B | | | 101.01 | |
Class E | | | 101.96 | |
| | | | |
| * | | The Portfolio is authorized to issue an unlimited number of shares. |
| (a) | | Identified cost of investments was $4,165,459,763. |
| (b) | | Includes securities loaned at value of $56,966,622. |
| (c) | | Investments at value is net of unfunded loan commitments of $2,241,504. |
| (d) | | Identified cost of cash denominated in foreign currencies was $30,580,358. |
| (e) | | Includes collateral of $1,890,000 for OTC swap contracts and $5,519,458 for centrally cleared swap contracts. |
| (f) | | Net premium paid on OTC swap contracts was $1,989,471. |
| (g) | | Included within TBA securities sold is $570,908,374 related to TBA forward sale commitments and included within TBA securities purchased is $307,927,299 related to TBA forward sale commitments. |
| (h) | | Premiums received on written options were $2,147,736. |
| (i) | | Includes collateral of $1,360,000 for OTC swap contracts and $5,370,000 for purchased option contracts. |
| (j) | | Net premium received on OTC swap contracts was $913,995. |
| (k) | | Includes foreign capital gains tax of $111. |
Statement of Operations
Year Ended December 31, 2018
| | | | |
Investment Income | |
Dividends | | $ | 454,638 | |
Interest (a) | | | 135,979,677 | |
Securities lending income | | | 430,853 | |
| | | | |
Total investment income | | | 136,865,168 | |
Expenses | |
Management fees | | | 12,360,919 | |
Administration fees | | | 132,098 | |
Custodian and accounting fees | | | 893,947 | |
Distribution and service fees—Class B | | | 1,219,534 | |
Distribution and service fees—Class E | | | 154,967 | |
Interest expense | | | 2,343,215 | |
Audit and tax services | | | 126,406 | |
Legal | | | 47,498 | |
Trustees’ fees and expenses | | | 33,734 | |
Shareholder reporting | | | 240,319 | |
Insurance | | | 24,590 | |
Miscellaneous | | | 60,559 | |
| | | | |
Total expenses | | | 17,637,786 | |
| | | | |
Net Investment Income | | | 119,227,382 | |
| | | | |
Net Realized and Unrealized Loss | |
| Net realized gain (loss) on: | |
Investments (b) | | | (84,441,523 | ) |
Purchased options | | | (10,307,030 | ) |
Futures contracts | | | (8,779,748 | ) |
Written options | | | 11,697,060 | |
Swap contracts | | | (220,942 | ) |
Foreign currency transactions | | | 19,090 | |
Forward foreign currency transactions | | | 3,775,307 | |
| | | | |
Net realized loss | | | (88,257,786 | ) |
| | | | |
| Net change in unrealized appreciation (depreciation) on: | |
Investments (c) | | | (65,030,041 | ) |
Purchased options | | | 5,290,977 | |
Futures contracts | | | 11,359,922 | |
Written options | | | (3,505,464 | ) |
Swap contracts | | | 1,867,101 | |
Foreign currency transactions | | | 457,992 | |
Forward foreign currency transactions | | | (1,557,238 | ) |
| | | | |
Net change in unrealized depreciation | | | (51,116,751 | ) |
| | | | |
Net realized and unrealized loss | | | (139,374,537 | ) |
| | | | |
Net Decrease in Net Assets From Operations | | $ | (20,147,155 | ) |
| | | | |
| | | | |
| (a) | | Net of foreign withholding taxes of $119,765. |
| (b) | | Net of foreign capital gains tax of $133,628. |
| (c) | | Includes change in foreign capital gains tax of $129,363. |
See accompanying notes to financial statements.
BHFTII-48
Brighthouse Funds Trust II
BlackRock Bond Income Portfolio
Statements of Changes in Net Assets
| | | | | | | | | | | | |
| | | Year Ended
December 31,
2018 | | | Year Ended
December 31,
2017 | |
Increase (Decrease) in Net Assets: | |
From Operations | |
Net investment income | | $ | 119,227,382 | | | $ | 113,865,262 | | | | | |
Net realized loss | | | (88,257,786 | ) | | | (18,825,284 | ) | | | | |
Net change in unrealized appreciation (depreciation) | | | (51,116,751 | ) | | | 59,037,227 | | | | | |
| | | | | | | | | | | | |
Increase (decrease) in net assets from operations | | | (20,147,155 | ) | | | 154,077,205 | | | | | |
| | | | | | | | | | | | |
From Distributions to Shareholders (a) | |
Class A | | | (107,235,041 | ) | | | (100,635,202 | ) | | | | |
Class B | | | (15,497,327 | ) | | | (15,212,013 | ) | | | | |
Class E | | | (3,386,449 | ) | | | (3,438,021 | ) | | | | |
| | | | | | | | | | | | |
Total distributions | | | (126,118,817 | ) | | | (119,285,236 | ) | | | | |
| | | | | | | | | | | | |
Increase (decrease) in net assets from capital share transactions | | | (205,016,090 | ) | | | 25,210,294 | | | | | |
| | | | | | | | | | | | |
Total increase (decrease) in net assets | | | (351,282,062 | ) | | | 60,002,263 | | | | | |
|
Net Assets | |
Beginning of period | | | 3,880,866,022 | | | | 3,820,863,759 | | | | | |
| | | | | | | | | | | | |
End of period | | $ | 3,529,583,960 | | | $ | 3,880,866,022 | (b) | | | | |
| | | | | | | | | | | | |
Other Information:
Capital Shares
Transactions in capital shares were as follows:
| | | | | | | | | | | | | | | | |
| | | Year Ended
December 31, 2018 | | | Year Ended
December 31, 2017 | |
| | | Shares | | | Value | | | Shares | | | Value | |
Class A | |
Sales | | | 777,927 | | | $ | 81,978,175 | | | | 719,265 | | | $ | 76,744,253 | |
Reinvestments | | | 1,058,171 | | | | 107,235,041 | | | | 950,734 | | | | 100,635,202 | |
Redemptions | | | (3,363,241 | ) | | | (345,154,048 | ) | | | (1,289,986 | ) | | | (137,935,585 | ) |
| | | | | | | | | | | | | | | | |
Net increase (decrease) | | | (1,527,143 | ) | | $ | (155,940,832 | ) | | | 380,013 | | | $ | 39,443,870 | |
| | | | | | | | | | | | | | | | |
Class B | |
Sales | | | 333,450 | | | $ | 33,923,102 | | | | 366,024 | | | $ | 38,383,912 | |
Reinvestments | | | 155,627 | | | | 15,497,327 | | | | 146,185 | | | | 15,212,013 | |
Redemptions | | | (879,364 | ) | | | (88,986,835 | ) | | | (571,544 | ) | | | (59,986,157 | ) |
| | | | | | | | | | | | | | | | |
Net decrease | | | (390,287 | ) | | $ | (39,566,406 | ) | | | (59,335 | ) | | $ | (6,390,232 | ) |
| | | | | | | | | | | | | | | | |
Class E | |
Sales | | | 42,286 | | | $ | 4,357,181 | | | | 61,074 | | | $ | 6,459,645 | |
Reinvestments | | | 33,709 | | | | 3,386,449 | | | | 32,756 | | | | 3,438,021 | |
Redemptions | | | (168,813 | ) | | | (17,252,482 | ) | | | (167,697 | ) | | | (17,741,010 | ) |
| | | | | | | | | | | | | | | | |
Net decrease | | | (92,818 | ) | | $ | (9,508,852 | ) | | | (73,867 | ) | | $ | (7,843,344 | ) |
| | | | | | | | | | | | | | | | |
Increase (decrease) derived from capital shares transactions | | | | | | $ | (205,016,090 | ) | | | | | | $ | 25,210,294 | |
| | | | | | | | | | | | | | | | |
| | | | |
| (a) | | Distributions from net investment income and realized gains are no longer required to be separately disclosed. The presentation for the year ended December 31, 2018 has been adjusted for this change (See Note 9). At December 31, 2017 the distributions were from net investment income. |
| (b) | | As part of the update in (a), it is also no longer required to disclose the Undistributed net investment income (Accumulated losses) which was $126,493,176 as of December 31, 2017. |
See accompanying notes to financial statements.
BHFTII-49
Brighthouse Funds Trust II
BlackRock Bond Income Portfolio
Financial Highlights
| | | | | | | | | | | | | | | | | | | | |
| Selected per share data | |
| | | Class A | |
| | | Year Ended December 31, | |
| | | 2018 | | | 2017 | | | 2016 | | | 2015 | | | 2014 | |
Net Asset Value, Beginning of Period | | $ | 106.93 | | | $ | 106.00 | | | $ | 106.14 | | | $ | 110.97 | | | $ | 107.33 | |
| | | | | | | | | | | | | | | | | | | | |
Income (Loss) from Investment Operations | |
Net investment income (a) | | | 3.33 | | | | 3.18 | | | | 2.76 | (b) | | | 2.73 | | | | 3.18 | |
Net realized and unrealized gain (loss) | | | (3.77 | ) | | | 1.13 | | | | 0.61 | | | | (2.08 | ) | | | 4.28 | |
| | | | | | | | | | | | | | | | | | | | |
Total income (loss) from investment operations | | | (0.44 | ) | | | 4.31 | | | | 3.37 | | | | 0.65 | | | | 7.46 | |
| | | | | | | | | | | | | | | | | | | | |
Less Distributions | |
Distributions from net investment income | | | (3.55 | ) | | | (3.38 | ) | | | (3.51 | ) | | | (4.24 | ) | | | (3.82 | ) |
Distributions from net realized capital gains | | | 0.00 | | | | 0.00 | | | | 0.00 | | | | (1.24 | ) | | | 0.00 | |
| | | | | | | | | | | | | | | | | | | | |
Total distributions | | | (3.55 | ) | | | (3.38 | ) | | | (3.51 | ) | | | (5.48 | ) | | | (3.82 | ) |
| | | | | | | | | | | | | | | | | | | | |
Net Asset Value, End of Period | | $ | 102.94 | | | $ | 106.93 | | | $ | 106.00 | | | $ | 106.14 | | | $ | 110.97 | |
| | | | | | | | | | | | | | | | | | | | |
Total Return (%) (c) | | | (0.36 | ) | | | 4.10 | | | | 3.12 | | | | 0.59 | | | | 7.08 | |
| | | | | |
Ratios/Supplemental Data | | | | | | | | | | | | | | | | | | | | |
Gross ratio of expenses to average net assets (%) | | | 0.43 | | | | 0.51 | | | | 0.37 | | | | 0.36 | | | | 0.35 | |
Gross ratio of expenses to average net assets excluding interest expense (%) | | | 0.37 | | | | 0.37 | | | | 0.36 | | | | 0.36 | | | | 0.35 | |
Net ratio of expenses to average net assets (%) (d) | | | 0.43 | | | | 0.51 | | | | 0.37 | | | | 0.36 | | | | 0.35 | |
Net ratio of expenses to average net assets excluding interest expense (%) (d) | | | 0.37 | | | | 0.37 | | | | 0.36 | | | | 0.36 | | | | 0.35 | |
Ratio of net investment income to average net assets (%) | | | 3.22 | | | | 2.98 | | | | 2.56 | (b) | | | 2.50 | | | | 2.91 | |
Portfolio turnover rate (%) | | | 439 | (e) | | | 615 | (e) | | | 571 | (e) | | | 824 | (e) | | | 679 | (e) |
Net assets, end of period (in millions) | | $ | 2,977.2 | | | $ | 3,256.0 | | | $ | 3,187.2 | | | $ | 3,178.0 | | | $ | 3,686.9 | |
| |
| | | Class B | |
| | | Year Ended December 31, | |
| | | 2018 | | | 2017 | | | 2016 | | | 2015 | | | 2014 | |
Net Asset Value, Beginning of Period | | $ | 104.98 | | | $ | 104.12 | | | $ | 104.31 | | | $ | 109.16 | | | $ | 105.64 | |
| | | | | | | | | | | | | | | | | | | | |
Income (Loss) from Investment Operations | |
Net investment income (a) | | | 3.02 | | | | 2.86 | | | | 2.45 | (b) | | | 2.42 | | | | 2.87 | |
Net realized and unrealized gain (loss) | | | (3.71 | ) | | | 1.11 | | | | 0.59 | | | | (2.05 | ) | | | 4.20 | |
| | | | | | | | | | | | | | | | | | | | |
Total income (loss) from investment operations | | | (0.69 | ) | | | 3.97 | | | | 3.04 | | | | 0.37 | | | | 7.07 | |
| | | | | | | | | | | | | | | | | | | | |
Less Distributions | |
Distributions from net investment income | | | (3.28 | ) | | | (3.11 | ) | | | (3.23 | ) | | | (3.98 | ) | | | (3.55 | ) |
Distributions from net realized capital gains | | | 0.00 | | | | 0.00 | | | | 0.00 | | | | (1.24 | ) | | | 0.00 | |
| | | | | | | | | | | | | | | | | | | | |
Total distributions | | | (3.28 | ) | | | (3.11 | ) | | | (3.23 | ) | | | (5.22 | ) | | | (3.55 | ) |
| | | | | | | | | | | | | | | | | | | | |
Net Asset Value, End of Period | | $ | 101.01 | | | $ | 104.98 | | | $ | 104.12 | | | $ | 104.31 | | | $ | 109.16 | |
| | | | | | | | | | | | | | | | | | | | |
Total Return (%) (c) | | | (0.62 | ) | | | 3.85 | | | | 2.86 | | | | 0.34 | | | | 6.81 | |
| | | | | |
Ratios/Supplemental Data | | | | | | | | | | | | | | | | | | | | |
Gross ratio of expenses to average net assets (%) | | | 0.68 | | | | 0.76 | | | | 0.62 | | | | 0.61 | | | | 0.60 | |
Gross ratio of expenses to average net assets excluding interest expense (%) | | | 0.62 | | | | 0.62 | | | | 0.61 | | | | 0.61 | | | | 0.60 | |
Net ratio of expenses to average net assets (%) (d) | | | 0.68 | | | | 0.76 | | | | 0.62 | | | | 0.61 | | | | 0.60 | |
Net ratio of expenses to average net assets excluding interest expense (%) (d) | | | 0.62 | | | | 0.62 | | | | 0.61 | | | | 0.61 | | | | 0.60 | |
Ratio of net investment income to average net assets (%) | | | 2.97 | | | | 2.73 | | | | 2.31 | (b) | | | 2.26 | | | | 2.67 | |
Portfolio turnover rate (%) | | | 439 | (e) | | | 615 | (e) | | | 571 | (e) | | | 824 | (e) | | | 679 | (e) |
Net assets, end of period (in millions) | | $ | 455.6 | | | $ | 514.5 | | | $ | 516.4 | | | $ | 514.1 | | | $ | 519.5 | |
Please see following page for Financial Highlights footnote legend.
See accompanying notes to financial statements.
BHFTII-50
Brighthouse Funds Trust II
BlackRock Bond Income Portfolio
Financial Highlights
| | | | | | | | | | | | | | | | | | | | |
| | | Class E | |
| | | Year Ended December 31, | |
| | | 2018 | | | 2017 | | | 2016 | | | 2015 | | | 2014 | |
Net Asset Value, Beginning of Period | | $ | 105.94 | | | $ | 105.03 | | | $ | 105.18 | | | $ | 110.00 | | | $ | 106.41 | |
| | | | | | | | | | | | | | | | | | | | |
Income (Loss) from Investment Operations | | | | | | | | | | | | | | | | | | | | |
Net investment income (a) | | | 3.15 | | | | 2.99 | | | | 2.57 | (b) | | | 2.55 | | | | 3.00 | |
Net realized and unrealized gain (loss) | | | (3.75 | ) | | | 1.12 | | | | 0.60 | | | | (2.07 | ) | | | 4.23 | |
| | | | | | | | | | | | | | | | | | | | |
Total income (loss) from investment operations | | | (0.60 | ) | | | 4.11 | | | | 3.17 | | | | 0.48 | | | | 7.23 | |
| | | | | | | | | | | | | | | | | | | | |
Less Distributions | | | | | | | | | | | | | | | | | | | | |
Distributions from net investment income | | | (3.38 | ) | | | (3.20 | ) | | | (3.32 | ) | | | (4.06 | ) | | | (3.64 | ) |
Distributions from net realized capital gains | | | 0.00 | | | | 0.00 | | | | 0.00 | | | | (1.24 | ) | | | 0.00 | |
| | | | | | | | | | | | | | | | | | | | |
Total distributions | | | (3.38 | ) | | | (3.20 | ) | | | (3.32 | ) | | | (5.30 | ) | | | (3.64 | ) |
| | | | | | | | | | | | | | | | | | | | |
Net Asset Value, End of Period | | $ | 101.96 | | | $ | 105.94 | | | $ | 105.03 | | | $ | 105.18 | | | $ | 110.00 | |
| | | | | | | | | | | | | | | | | | | | |
Total Return (%) (c) | | | (0.52 | ) | | | 3.95 | | | | 2.98 | | | | 0.44 | | | | 6.92 | |
| | | | | |
Ratios/Supplemental Data | | | | | | | | | | | | | | | | | | | | |
Gross ratio of expenses to average net assets (%) | | | 0.58 | | | | 0.65 | | | | 0.52 | | | | 0.51 | | | | 0.50 | |
Gross ratio of expenses to average net assets excluding interest expense (%) | | | 0.52 | | | | 0.52 | | | | 0.51 | | | | 0.51 | | | | 0.50 | |
Net ratio of expenses to average net assets (%) (d) | | | 0.58 | | | | 0.65 | | | | 0.52 | | | | 0.51 | | | | 0.50 | |
Net ratio of expenses to average net assets excluding interest expense (%) (d) | | | 0.52 | | | | 0.52 | | | | 0.51 | | | | 0.51 | | | | 0.50 | |
Ratio of net investment income to average net assets (%) | | | 3.07 | | | | 2.82 | | | | 2.40 | (b) | | | 2.35 | | | | 2.78 | |
Portfolio turnover rate (%) | | | 439 | (e) | | | 615 | (e) | | | 571 | (e) | | | 824 | (e) | | | 679 | (e) |
Net assets, end of period (in millions) | | $ | 96.8 | | | $ | 110.4 | | | $ | 117.2 | | | $ | 126.2 | | | $ | 143.8 | |
| | | | |
| (a) | | Per share amounts based on average shares outstanding during the period. |
| (b) | | Net investment income per share and the ratio of net investment income to average net assets include anon-recurring refund for overbilling of prior years’ custodianout-of-pocket fees which amounted to $0.01 per share and 0.01% of average net assets, respectively. |
| (c) | | Total return does not reflect any insurance, sales, separate account or administrative charges of variable annuity or life insurance contracts or any additional expenses that contract owners may bear under their variable contracts. If these charges were included, the returns would be lower. |
| (d) | | Includes the effects of management fee waivers (see Note 6 of the Notes to Financial Statements). |
| (e) | | Includes mortgage dollar roll and TBA transactions; excluding these transactions the portfolio turnover rates would have been 92%, 168%, 178%, 278% and 276% for the years ended December 31, 2018, 2017, 2016, 2015 and 2014, respectively. |
See accompanying notes to financial statements.
BHFTII-51
Brighthouse Funds Trust II
BlackRock Bond Income Portfolio
Notes to Financial Statements—December 31, 2018
1. Organization
Brighthouse Funds Trust II (the “Trust”) is organized as a Delaware statutory trust and registered under the Investment Company Act of 1940, as amended (the “1940 Act”), as anopen-end management investment company. The Trust, which is managed by Brighthouse Investment Advisers, LLC (“Brighthouse Investment Advisers” or the “Adviser”), currently offers twenty-nine series, each of which operates as a distinct investment vehicle of the Trust. The series included in this report is BlackRock Bond Income Portfolio (the “Portfolio”), which is diversified. Shares of the Portfolio are not offered directly to the general public and are currently available only to separate accounts of insurance companies, including insurance companies affiliated with the Adviser (together, the “Insurance Companies”).
The Portfolio has registered and offers three classes of shares: Class A, B and E shares. Shares of each Class of the Portfolio represent an equal pro rata interest in the Portfolio and generally give the shareholder the same voting, dividend, liquidation, and other rights. Investment income, realized and unrealized capital gains and losses, the common expenses of the Portfolio, and certain Portfolio-level expense reductions, if any, are allocated on a pro rata basis to each Class based on the relative net assets of each Class to the net assets of the Portfolio. Each Class of shares differs in its respective distribution plan and such distribution expenses are allocated to the corresponding Class of shares.
2. Significant Accounting Policies
The preparation of financial statements in conformity with accounting principles generally accepted in the United States of America (“GAAP”) requires management to make estimates and assumptions that affect the reported amounts of assets and liabilities and disclosure of contingent assets and liabilities as of the date of the financial statements and the reported amounts of income and expenses during the reporting period. Actual results could differ from those estimates. In the preparation of these financial statements, management has evaluated events and transactions subsequent to December 31, 2018 through the date the financial statements were issued.
The Portfolio is an investment company and follows the accounting and reporting guidance of the Financial Accounting Standards Board (“FASB”) Accounting Standards Codification Topic 946—Financial Services—Investment Companies. The following is a summary of significant accounting policies consistently followed by the Portfolio in the preparation of its financial statements.
Investment Valuation and Fair Value Measurements - The Portfolio values its portfolio investments for purposes of calculating its net asset value (“NAV”) using procedures approved by the Board of Trustees of the Trust (the “Board” or “Trustees”). Those procedures allow for a variety of methodologies to be used to value the Portfolio’s investments. The specific methodologies used for a particular investment may vary based on the market data available for a specific investment at the time the Portfolio calculates its NAV or based on other considerations. The procedures also permit a level of judgment to be used in the valuation process. The Portfolio follows the accounting and reporting guidance of FASB Accounting Standards Codification Topic 820—Fair Value Measurement.
Debt securities, including corporate, convertible and municipal bonds and notes; obligations of the U.S. Treasury and U.S. government agencies; foreign sovereign issues; andnon-U.S. bonds, are generally valued on the basis of evaluated or composite bid quotations obtained from independent pricing services and/or brokers and dealers selected by the Adviser (each a “pricing service”), pursuant to the authorization of and subject to general oversight by the Board. Such pricing services may use matrix pricing, which considers observable inputs including, among other things, issuer details, maturity dates, interest rates, yield curves, rates of prepayment, credit risks/spreads, default rates, reported trades, broker-dealer quotes and quoted prices for similar assets. Short-term obligations with a remaining maturity of sixty days or less may be valued at amortized cost in the absence of market quotes, so long as the amortized cost value of such short-term debt instrument is approximately the same as the fair value of the instrument as determined without the use of amortized cost valuation. Floating rate loans are generally valued on the basis of an evaluated or composite average of aggregate bid and ask quotations supplied by brokers or dealers, as obtained from the pricing service. Securities that use similar valuation techniques and inputs as described above are generally categorized as Level 2 within the fair value hierarchy.
Mortgage- and asset-backed securities are generally valued on the basis of evaluated or composite bid quotations obtained from pricing services selected by the Adviser pursuant to authorization of and subject to general oversight by the Board. These securities are usually issued as separate tranches, or classes, of securities within each deal. The pricing models for these securities usually consider tranche-level attributes, current market data, estimated cash flows and market-based yield spreads for each tranche and incorporate deal collateral performance, as available. Mortgage- and asset-backed securities that use similar valuation techniques and inputs as described above are generally categorized as Level 2 within the fair value hierarchy.
Domestic and foreign equity securities, such as common stock, exchange-traded funds, rights, warrants, and preferred stock, that are traded on a securities exchange on a valuation date are generally valued at their last quoted sale price or official closing price on the primary exchange for such security, or, if no sales occurred on that day, at the last reported bid price. Equity securities tradedover-the-counter (“OTC”) are generally valued at the last reported bid price. In the event of a major exchange closing during the trading day, the Adviser may use other market information obtained from quotation reporting systems, established market makers, or pricing services in valuing the securities. Valuation adjustments may be applied to certain foreign equity securities that are traded
BHFTII-52
Brighthouse Funds Trust II
BlackRock Bond Income Portfolio
Notes to Financial Statements—December 31, 2018—(Continued)
solely on foreign exchanges that close before the time as of which the Portfolio determines its NAV to account for the market movement between the close of the foreign exchanges and the time as of which the Portfolio determines its NAV. The Portfolio may use a systematic fair valuation model provided by a pricing service to value securities principally traded in these foreign markets in order to adjust for possible market movements or other changes that may occur between the close of the foreign exchanges and the time as of which the Portfolio determines its NAV. Foreign equity securities valued using these valuation adjustments are generally categorized as Level 2 within the fair value hierarchy. Equity securities that are actively traded, and have no valuation adjustments applied, are categorized as Level 1 within the fair value hierarchy. Other equity securities traded on inactive markets, or valued in reference to similar instruments traded on active markets, are generally categorized as Level 2 within the fair value hierarchy.
Investments in registeredopen-end management investment companies are valued at reported NAV per share on the valuation date and are categorized as Level 1 within the fair value hierarchy.
Foreign currency forward contracts are valued through an independent pricing service by interpolating between forward and spot currency rates in the London foreign exchange markets as of a designated hour on a valuation day. These contracts are generally categorized as Level 2 within the fair value hierarchy.
Options, whether on securities, indices, futures contracts, or otherwise, traded on exchanges are valued at the last sale price available as of the close of business on a valuation day or, if there is no such price available, at the last reported bid price. These types of options are categorized as Level 1 within the fair value hierarchy. Futures contracts that are traded on commodity exchanges are valued at their settlement prices established by the exchanges on which they are traded as of the close of such exchanges and are categorized as Level 1 within the fair value hierarchy.
Options, including options on swaps (“swaptions”), currencies, and futures contracts that are traded OTC are generally valued on the basis of interdealer bid and ask prices or prices provided by pricing service providers who use a series of techniques, including simulation pricing models, to determine the value of the contracts. The pricing models use inputs that are observed from actively quoted markets such as issuer details, indices, spreads, interest rates, yield curves, credit curves, measures of volatility and exchange rates. These contracts are generally categorized as Level 2 within the fair value hierarchy.
Swap contracts (other than centrally cleared swaps) aremarked-to-market daily based on quotations and prices supplied by market makers, broker-dealers and other pricing services. Such quotations and prices are derived utilizing observable data, including the underlying reference securities or indices, credit spread quotations and expected default recovery rates determined by the pricing service. These contracts are generally categorized as Level 2 within the fair value hierarchy.
Centrally cleared swaps listed or traded on a multilateral or trade facility platform, such as a registered exchange, are valued at the daily settlement price determined by the respective exchange or a pricing service when the exchange price is not available. For centrally cleared credit default swaps, the clearing facility requires its members to provide actionable price levels across complete term structures. These levels along with external third-party prices are used to produce daily settlement prices. These securities are categorized as Level 2 within the fair value hierarchy. Centrally cleared interest rate swaps are valued using a pricing model that references the underlying rates, including the overnight index swap rate and London Interbank Offered Rate (“LIBOR”) forward rate to produce the daily settlement price. These securities are categorized as Level 2 within the fair value hierarchy.
If no current market value quotation or other observable inputs are readily available or market value quotations are deemed to be unreliable for an investment, the fair value of the investment will be determined in accordance with procedures approved by, and under the general supervision of, the Board. In such a circumstance, the Board will be assisted in its responsibility to determine the fair value of an investment by the Valuation Committee (“Committee”) of Brighthouse Investment Advisers. The Committee provides general pricing oversight and fair value pricing determinations related to portfolio securities and meets on a regular basis to review reports relating to the valuation of the securities in the Portfolio. The Board has delegated to State Street Bank and Trust Company, the Trust’s Custodian (“Custodian”), the responsibility for calculating the NAVs of the Trust’s Portfolios. The Committee is responsible for overseeing the calculation of the NAVs of the Portfolios by the Custodian. The Committee also periodically reviews pricing services, including the pricing services providing fair value pricing for the Portfolio’s foreign securities, and is responsible for overseeing the correction of pricing errors and addressing other pricing issues that arise in the ordinary course of business, such as making real-time fair value determinations, as necessary.
No single standard for determining the fair value of an investment can be set forth because fair value depends upon the facts and circumstances with respect to each investment. Information relating to any relevant factors may be obtained by the Committee from any appropriate source, including the subadviser of the Portfolio, the Custodian, a pricing service, market maker and/or broker for such security or the issuer. Appropriate methodologies for determining fair value under particular circumstances may include: matrix pricing, a discounted cash flow analysis, comparisons of securities with comparable characteristics, value based on multiples of earnings, discount from market price of similar marketable securities, or a combination of these and other methods.
BHFTII-53
Brighthouse Funds Trust II
BlackRock Bond Income Portfolio
Notes to Financial Statements—December 31, 2018—(Continued)
Investment Transactions and Related Investment Income - Portfolio security transactions are recorded on the trade date. Dividend income is recorded on theex-dividend date or, for certain foreign securities, when notified. Interest income, which includes amortization of premium and accretion of discount on debt securities, is recorded on the accrual basis. Realized gains and losses on investments are determined on the identified cost basis, which is the same basis used for federal income tax purposes. Foreign income and foreign capital gains on some foreign securities may be subject to foreign taxes, which are accrued as applicable. These foreign taxes have been provided for in accordance with the Portfolio’s understanding of the applicable countries’ tax rules and rates.
Foreign Currency Translation -The books and records of the Portfolio are maintained in U.S. dollars. The values of securities, currencies, and other assets and liabilities denominated in currencies other than the U.S. dollar are translated into U.S. dollars based upon foreign exchange rates prevailing at the end of the period. Purchases and sales of investment securities, income, and expenses are translated on the respective dates of such transactions. Because the values of investment securities are translated at the foreign exchange rates prevailing at the end of the period, that portion of the results of operations arising from changes in exchange rates and that portion of the results of operations reflecting fluctuations arising from changes in market prices of the investment securities are not separated. Such fluctuations are included in the net realized and unrealized gain or loss on investments.
Net realized foreign exchange gains or losses arise from activity in forward foreign currency exchange contracts, sales of foreign currency, currency gains or losses realized between the trade and settlement dates on securities transactions, and the difference between the amounts of dividends, interest, and foreign withholding taxes recorded by the Portfolio and the U.S. dollar-equivalent of the amounts actually received or paid by the Portfolio. Net unrealized foreign exchange gains and losses arise from changes in the value of assets and liabilities, other than investment securities, resulting from changes in foreign exchange rates.
Dividends and Distributions to Shareholders -The Portfolio records dividends and distributions on theex-dividend date. Net realized gains from securities transactions (if any) are generally distributed annually to shareholders. The timing and characterization of certain income and capital gains distributions are determined in accordance with federal tax regulations that may differ from GAAP. Permanent book and tax basis differences relating to shareholder distributions will result in reclassification between distributable earnings (accumulated losses) andpaid-in surplus. These adjustments have no impact on net assets or the results of operations.
Income Taxes -It is the Portfolio’s policy to comply with the requirements of the Internal Revenue Code of 1986, as amended, and regulations thereunder, applicable to regulated investment companies, and to distribute, with respect to each taxable year, all of its taxable income to shareholders. Therefore, no federal income tax provision is required. The Portfolio files U.S. federal tax returns. No income tax returns are currently under examination. The Portfolio’s federal tax returns for the prior three fiscal years remain subject to examination by the Internal Revenue Service. As of December 31, 2018, the Portfolio had no uncertain tax positions that would require financial statement recognition, or derecognition or disclosure.
Mortgage Dollar Rolls -The Portfolio may enter into mortgage “dollar rolls” in which a Portfolio sellsto-be-announced (“TBA”) mortgage-backed securities for delivery in the current month and simultaneously contracts to repurchase substantially similar (same type, coupon, and maturity) securities on a specified future date. For the duration of the transaction, or roll period, the Portfolio foregoes principal (including prepayments of principal) and interest paid on the securities sold. Dollar rolls are accounted for as purchase and sale transactions; gain or loss is recognized at the commencement of the term of the dollar roll and each time the mortgage-backed security is rolled.
Mortgage dollar roll transactions involve the risk that the market value of the securities that the Portfolio is required to repurchase or reacquire may be less than the agreed-upon repurchase price of those securities and that the investment performance of securities purchased with proceeds from these transactions does not exceed the income, capital appreciation, and gain or loss that would have been realized on the securities transferred or sold, as applicable, as part of the treasury or mortgage dollar roll.
Mortgage-Related and Other Asset-Backed Securities - The Portfolio may invest in mortgage-related or other asset-backed securities. These securities may include mortgage pass-through securities, collateralized mortgage obligations (“CMOs”), commercial mortgage-backed securities, CMO residuals, stripped mortgage-backed securities (“SMBS”), and other securities that directly or indirectly represent a participation in, or are secured by or payable from, mortgage loans on real property or other receivables. The value of some mortgage- or asset-backed securities may be particularly sensitive to changes in prevailing interest rates. Early repayment of principal on some mortgage-related securities may expose the Portfolio to a lower rate of return upon reinvestment of principal. The value of these securities may fluctuate in response to the market’s perception of the creditworthiness of the issuers. Additionally, although mortgages and mortgage-related securities are generally supported by some form of government or private guarantee and/or insurance, there is no assurance that private guarantors or insurers will meet their obligations.
In one type of SMBS, one class receives all of the interest from the mortgage assets (the interest-only or “IO” class), while the other class will receive all of the principal (the principal-only or “PO” class). Because principal will not be received at the maturity of an IO, adjustments are made to the book value of the security until maturity. These adjustments are netted against payments received for the IOs and the net amount is included in interest income on the Statement of Operations of the Portfolio. Payments received for POs are treated as reductions to the cost and par value of the securities. Details of mortgage-related and other asset-backed securities held by the Portfolio are included in the Portfolio’s Schedule of Investments.
BHFTII-54
Brighthouse Funds Trust II
BlackRock Bond Income Portfolio
Notes to Financial Statements—December 31, 2018—(Continued)
The Portfolio may invest a significant portion of its assets in securities of issuers that hold mortgage- and asset-backed securities and direct investments in securities backed by commercial and residential mortgage loans and other financial assets. The value and related income of these securities are sensitive to changes in economic conditions, including delinquencies and/or defaults, and may be negatively impacted by increased volatility of market prices and periods of illiquidity.
TBA Purchase and Forward Sale Commitments -The Portfolio may enter into TBA commitments to purchase or sell securities for a fixed price at a future date. TBA commitments are considered securities in themselves, and involve a risk of loss if the value of the security to be purchased or sold declines or increases prior to the settlement date, which is in addition to the risk of decline in the value of the Portfolio’s other assets. TBA forward sale commitments are valued at the current market value of the underlying securities, according to the procedures described under “Investment Valuation and Fair Value Measurements”.
When-Issued and Delayed-Delivery Securities- The Portfolio may purchase securities on a when-issued or delayed-delivery basis. Settlement of such transactions will occur beyond the customary settlement period. The Portfolio may purchase securities under such conditions only with the intention of actually acquiring them, but may enter into a separate agreement to sell the securities before the settlement date. Since the value of securities purchased may fluctuate prior to settlement, the Portfolio may be required to pay more at settlement than the security is worth. In addition, the Portfolio is not entitled to any of the interest earned prior to settlement.
Upon making a commitment to purchase a security on a when-issued or delayed-delivery basis, the Portfolio will hold liquid assets in a segregated account with the Portfolio’s Custodian, or set aside liquid assets in the Portfolio’s records, worth at least the equivalent of the amount due. The liquid assets will be monitored on a daily basis and adjusted as necessary to maintain the necessary value.
High-Yield Debt Securities - The Portfolio may invest in high-yield debt securities, or “junk bonds,” which are securities that are rated below “investment grade” or, if not rated, are of equivalent quality. A portfolio with high-yield debt securities generally will be exposed to greater market risk and credit risk than a portfolio that invests only in investment grade debt securities because issuers of high-yield debt securities are generally less secure financially, are more likely to default on their obligations, and their securities are more sensitive to interest rate changes and downturns in the economy. In addition, the secondary market for lower-rated debt securities may not be as liquid as that for more highly rated debt securities. As a result, the Portfolio’s subadviser may find it more difficult to value lower-rated debt securities or sell them and may have to sell them at prices significantly lower than the values assigned to them by the Portfolio.
Floating Rate Loans - The Portfolio may invest in loans arranged through private negotiation between one or more financial institutions. The Portfolio’s investment in any such loan may be in the form of a participation in or an assignment of the loan. In connection with purchasing participations, the Portfolio generally will have no right to enforce compliance by the borrower with the terms of the loan agreement relating to the loan, nor any rights ofset-off against the borrower. The Portfolio may not benefit directly from any collateral supporting the loan in which it has purchased the participation or assignment. The purchase of assignments will typically result in the Portfolio having a direct contractual relationship with the borrower, and the Portfolio may enforce compliance by the borrower with the terms of the loan agreement.
The Portfolio may invest in multiple series or tranches of a loan, which may have varying terms and carry different associated risks. When the Portfolio purchases assignments, it acquires direct rights against the borrower of the loan. These loans may include participations in bridge loans, which are loans taken out by borrowers for a short period (typically less than one year) pending arrangement of more permanent financing.
The Portfolio will assume the credit risk of both the borrower and the lender that is selling the participation. In the event of the insolvency of the lender selling the participation, the Portfolio may be treated as a general creditor of the lender and may not benefit from anyset-off between the lender and the borrower.
Unfunded Loan Commitments - The Portfolio may enter into certain credit agreements, all or a portion of which may be unfunded. The Portfolio is obligated to fund these commitments at the borrower’s discretion. These commitments, if any, are disclosed in the Schedule of Investments. As of December 31, 2018, the Portfolio had open unfunded loan commitments of $2,241,504. At December 31, 2018, the Portfolio had sufficient cash and/or securities to cover these commitments.
Repurchase Agreements -The Portfolio may enter into repurchase agreements, under the terms of a Master Repurchase Agreement (“MRA”), with selected commercial banks and broker-dealers, under which the Portfolio acquires securities as collateral and agrees to resell the securities at an agreed-upon time and at an agreed-upon price. The Portfolio, through the Custodian or a subcustodian, under atri-party repurchase agreement, receives delivery of the underlying securities collateralizing any repurchase agreements. It is the Portfolio’s policy that the market value of the collateral be equal to at least 100% of the repurchase price in the case of a repurchase agreement ofone-day duration and equal to at least 102% of the repurchase price in the case of all other repurchase agreements. In the event of default or failure by a party to perform an obligation in connection with any repurchase transaction, the MRA gives thenon-defaulting party the right toset-off claims and to apply property held by it in connection with any repurchase transaction against obligations owed to it.
BHFTII-55
Brighthouse Funds Trust II
BlackRock Bond Income Portfolio
Notes to Financial Statements—December 31, 2018—(Continued)
At December 31, 2018, the Portfolio had direct investments in repurchase agreements with a gross value of $2,767,249. Additionally, the Portfolio invested cash collateral for loans of portfolio securities in repurchase agreements with a gross value of $10,800,000. The combined value of all repurchase agreements is included as part of investments at value on the Statement of Assets and Liabilities. The value of the related collateral exceeded the value of the repurchase agreements at December 31, 2018.
Securities Lending - The Portfolio may lend its portfolio securities to certain qualified brokers who borrow securities in order to complete certain securities transactions. By lending its portfolio securities, the Portfolio attempts to increase its net investment income through the receipt of income on collateral held from securities on loan. Any gain or loss in the market price of the loaned securities that might occur and any interest earned or dividends declared during the term of the loan would accrue to the account of the Portfolio.
The Trust has entered into aNon-Custodial Securities Lending Agreement with JPMorgan Chase Bank, N.A. (the “Lending Agent”). Under the agreement, the Lending Agent is authorized to loan portfolio securities on the Portfolio’s behalf. In exchange, the Portfolio receives either cash or U.S. government securities as collateral against the loaned securities. The Portfolio receives collateral equal to at least 102% of the market value for loans secured by government securities or cash in the same currency as the loaned shares and 105% for all other loaned securities at each loan’s inception. Collateral representing at least 100% of the market value of the loaned securities is maintained for the duration of the loan. Any cash collateral received by the Portfolio is generally invested by the Lending Agent in short-term investments, which may include certificates of deposit, commercial paper, repurchase agreements, time deposits, master demand notes and money market funds. The market value of investments made with cash collateral received are disclosed in the Schedule of Investments and the valuation techniques are described in Note 2. If the market value of the collateral at the close of trading on a business day is less than 100% of the market value of the loaned securities at the close of trading on that day, the borrower is required to deliver, by the close of business on the following business day, an additional amount of collateral, so that the total amount of posted collateral is equal to at least 100% of the market value of all the loaned securities as of such preceding day. A portion of the income earned on the collateral is rebated to the borrower of the securities and the remainder is split between the Lending Agent and the Portfolio. On loans collateralized by U.S. government securities, a fee is received from the borrower and is allocated between the Portfolio and the Lending Agent.
Income received by the Portfolio in securities lending transactions during the year ended December 31, 2018 is reflected as securities lending income on the Statement of Operations. The values of any securities loaned by the Portfolio and the related collateral at December 31, 2018 are disclosed in the footnotes to the Schedule of Investments. The value of the related collateral received by the Portfolio exceeded the value of the securities out on loan at December 31, 2018.
The risks associated with lending portfolio securities include, but are not limited to, possible delays in receiving additional collateral or in the recovery of the loaned securities, possible loss of rights in the collateral should the borrower fail financially, as well as risk of loss in the value of the collateral or the value of the investments made with the collateral. The Lending Agent shall indemnify the Portfolio in the case of default of any securities borrower, subject to the terms of theNon-Custodial Securities Lending Agreement.
Reverse Repurchase Agreements - The Portfolio may enter into reverse repurchase agreements with qualified institutions. In a reverse repurchase agreement, the Portfolio transfers securities in exchange for cash to a financial institution or counterparty, concurrently with an agreement by the Portfolio to re-acquire the same securities at an agreed-upon price and date. During the reverse repurchase agreement period, the Portfolio continues to receive principal and interest payments on these securities. The Portfolio will establish a segregated account with its Custodian in which it will maintain liquid assets equal in value to its obligations in respect of reverse repurchase agreements. Reverse repurchase agreements involve the risk that the market value of the securities transferred by the Portfolio may decline below the agreed-upon reacquisition price of the securities. In the event of default or failure by a party to perform an obligation in connection with any reverse repurchase transaction, the MRA entitles thenon-defaulting party with a right toset-off claims and apply property held by it in respect of any reverse repurchase transaction against obligations owed to it. Cash received in exchange for securities transferred under reverse repurchase agreements plus accrued interest payments to be made by the Portfolio to counterparties are reflected as reverse repurchase agreements on the Statement of Assets and Liabilities.
For the year ended December 31, 2018, the Portfolio had an outstanding reverse repurchase agreement balance for 115 days. The average amount of borrowings was $511,262,442 and the annualized weighted average interest rate was 1.28% during the 115 day period.
BHFTII-56
Brighthouse Funds Trust II
BlackRock Bond Income Portfolio
Notes to Financial Statements—December 31, 2018—(Continued)
The following table summarizes open reverse repurchase agreements by counterparty which are subject to offset under an MRA on a net basis as of December 31, 2018:
| | | | | | | | | | | | |
Counterparty | | Reverse
Repurchase
Agreements | | | Collateral
Pledged | | | Net
Amount* | |
Barclays Capital, Inc. | | $ | (27,608,125 | ) | | $ | 27,403,074 | | | $ | (205,051 | ) |
BNP Paribas S.A. | | | (28,067,900 | ) | | | 27,823,583 | | | | (244,317 | ) |
Merrill Lynch Pierce Fenner & Smith, Inc. | | | (44,522,058 | ) | | | 44,400,185 | | | | (121,873 | ) |
| | | | | | | | | | | | |
| | $ | (100,198,083 | ) | | $ | 99,626,842 | | | $ | (571,241 | ) |
| | | | | | | | | | | | |
| | | | |
| * | | Net amount represents the net amount payable due to the counterparty in the event of default. |
The following table provides a breakdown of transactions accounted for as secured borrowings, the gross obligations by the type of collateral pledged, and the remaining contractual maturities of those transactions.
| | | | | | | | | | | | | | | | | | | | |
| | | Remaining Contractual Maturity of the Agreements
As of December 31, 2018 | |
| | | Overnight and
Continuous | | | Up to
30 Days | | | 31 - 90
Days | | | Greater than
90 days | | | Total | |
| Securities Lending Transactions | |
Corporate Bonds & Notes | | $ | (65,262,872 | ) | | $ | — | | | $ | — | | | $ | — | | | $ | (65,262,872 | ) |
Foreign Government | | | (21,506,880 | ) | | | — | | | | — | | | | — | | | | (21,506,880 | ) |
| Reverse Repurchase Agreements | | | | | | | | | | | | | | | | | | | | |
U. S. Treasury | | | — | | | | (100,198,083 | ) | | | — | | | | — | | | | (100,198,083 | ) |
Total | | $ | (86,769,752 | ) | | $ | (100,198,083 | ) | | $ | — | | | $ | — | | | $ | (186,967,835 | ) |
Total Borrowings | | $ | (86,769,752 | ) | | $ | (100,198,083 | ) | | $ | — | | | $ | — | | | $ | (186,967,835 | ) |
Gross amount of recognized liabilities for securities lending transactions and reverse repurchase agreements. | | | $ | (186,967,835 | ) |
| | | | | | | | | | | | | | | | | | | | |
3. Investments in Derivative Instruments
Forward Foreign Currency Exchange Contracts - The Portfolio may enter into forward foreign currency exchange contracts to obtain investment exposure, enhance return or hedge or protect its portfolio holdings against the risk of future movements in certain foreign currency exchange rates. When entering into these contracts, the Portfolio agrees to receive or deliver a fixed quantity of foreign currency for an agreed-upon price on an agreed-upon future date. These contracts are valued daily and the Portfolio’s net equity therein, representing unrealized gain or loss on the contracts as measured by the difference between the forward foreign exchange rates at the dates of entry into the contracts and the forward foreign exchange rates at the valuation date, is included in the Statement of Assets and Liabilities. When a contract is closed, the Portfolio recognizes a realized gain or loss equal to the difference between the value of the contract at the time it was opened and the value at the time it was closed.
Realized and unrealized gains and losses on forward foreign currency exchange contracts are included in the Statement of Operations. These contracts involve market and/or credit risk in excess of the amount recognized in the Statement of Assets and Liabilities. The use of forward foreign currency exchange contracts does not eliminate fluctuations in the underlying prices of the securities of the Portfolio, but it does establish a rate of exchange that can be achieved in the future. Although forward foreign currency exchange contracts may limit the risk of loss due to a decline in the value of the currency holdings, they also limit any potential gain that might result should the value of the currency increase. In addition, the Portfolio could be exposed to losses if the counterparties to the contracts are unable to meet the terms of the contracts. The Portfolio may also experience losses even when such contracts are used for hedging purposes. The Portfolio’s maximum potential loss from such contracts is the aggregate face value in U.S. dollars at the time the contract was opened.
Futures Contracts - The Portfolio may buy and sell futures contracts as a hedge, to maintain investment exposure to a target asset class or to enhance return. The Portfolio may be subject to fluctuations in equity prices, interest rates, commodity prices, and foreign currency exchange rates in the normal course of pursuing its investment objective. Futures contracts are standardized agreements to buy or sell a security, or deliver a final cash settlement price in connection with an index, interest rate, currency, or other asset. The Portfolio must deposit an amount (“initial margin”) equal to a certain percentage of the face value of the futures contract. The initial margin may be in the form of cash or securities, which is returned when the Portfolio’s obligations under the contract have been satisfied. If cash is deposited as the initial margin, it is shown as cash collateral on the Statement of Assets and Liabilities. Futures contracts aremarked-to-market daily and subsequent payments (“variation margin”) are made or received by the Portfolio depending on whether unrealized gains or losses are incurred. These amounts are reflected as receivables or payables on the Statement of Assets and Liabilities and as a component of net change in unrealized appreciation/depreciation on the Statement of Operations. When the
BHFTII-57
Brighthouse Funds Trust II
BlackRock Bond Income Portfolio
Notes to Financial Statements—December 31, 2018—(Continued)
contract is closed or expires, the Portfolio records a realized gain or loss equal to the difference between the value of the contract at the time it was opened and the value at the time it was closed. Risks of entering into futures contracts (and related options) include the possibility that the market for these instruments may be illiquid and that a change in the value of the contract or option may not correlate perfectly with changes in the value of the underlying instrument. If futures contracts areexchange-traded, the exchange’s clearinghouse, as counterparty to all exchange-traded futures, guarantees the futures contracts against default. For OTC futures, the Portfolio’s ability to terminate the positions may be more limited than in the case of exchange-traded positions and may also involve the risk that securities dealers participating in such transactions would fail to meet their obligations to the Portfolio.
Options Contracts - An option contract purchased by the Portfolio gives the Portfolio the right, but not the obligation, to buy (call) or sell (put) an underlying instrument at a fixed exercise price during a specified period. Call options written by the Portfolio give the holder the right to buy the underlying instrument from the Portfolio at a fixed exercise price; put options written by the Portfolio give the holder the right to sell the underlying instrument to the Portfolio at a fixed exercise price.
The Portfolio may use options to hedge against changes in values of securities the Portfolio owns or expects to purchase, to maintain investment exposure to a target asset class or to enhance return. Writing puts or buying calls tend to increase the Portfolio’s exposure to the underlying instrument and writing calls or buying puts tends to decrease the Portfolio’s exposure to the underlying instrument, and can be used to hedge other Portfolio investments. For options used to hedge the Portfolio’s investments, the potential risk to the Portfolio is that the change in value of options contracts may not correspond perfectly to the change in value of the hedged instruments. The Portfolio also bears the risk of an unfavorable change in the value of the underlying instrument or the risk that the Portfolio may not be able to enter into a closing transaction due to an illiquid market. The Portfolio’s maximum risk of loss from counterparty credit risk, as opposed to investment and other types of risk, in respect of purchased options is typically the premium initially paid for the option plus any unrealized gains.
The main risk associated with purchasing an option is that the option expires without being exercised. In this case, the option is worthless when it expires and the premium paid for the option is considered a realized loss. The risk associated with writing a call option is that the Portfolio may forgo the opportunity for a profit if the market value of the underlying instrument increases and the option is exercised, requiring the Portfolio to sell the underlying instrument at a price below its market value. When the Portfolio writes a call option on a security it does not own, its exposure on such an option is theoretically unlimited. The risk in writing a put option is that the Portfolio may incur a loss if the market value of the underlying instrument decreases and the option is exercised, requiring the Portfolio to purchase the underlying instrument at a price above its market value. In addition, the Portfolio risks not being able to enter into a closing transaction for the written option as the result of an illiquid market for the option.
Purchases of put and call options are recorded as investments, the value of which aremarked-to-market daily. When the Portfolio enters into a closing sale transaction, the Portfolio will realize a gain or loss depending on whether the sales proceeds from the closing sale transaction are greater or less than the premium initially paid for the option. When the Portfolio exercises a put option, it will realize a gain or loss from the sale of the underlying instrument and the proceeds from such sale will be decreased by the premium originally paid for the put option. When the Portfolio exercises a call option, the cost of the security which the Portfolio purchases upon exercise will be increased by the premium originally paid for the call option.
The premium received by the Portfolio for a written option is recorded as an asset and an equivalent liability. The liability is subsequentlymarked-to-market to reflect the current value of the option written. When a written option expires without being exercised or the Portfolio enters into a closing purchase transaction, the Portfolio realizes a gain (or loss if the cost of the closing purchase transaction exceeds the premium received when the option was sold) without regard to any unrealized gain or loss on the underlying instrument and the liability related to such option is eliminated. When a written call option is exercised, the Portfolio realizes a gain or loss, as adjusted for the premium received, from the sale of the underlying instrument. When a written put option is exercised, the premium received by the Portfolio is offset against the amount paid for the purchase of the underlying instrument.
The purpose of inflation-capped options is to protect the buyer from inflation, above a specified rate, eroding the value of investments in inflation-linked products with a given notional exposure. Inflation-capped options are used to give downside protection to investments in inflation-linked products by establishing a floor on the value of such products.
Swaptions are similar to options on securities except that instead of selling or purchasing the right to buy or sell a security, the writer or purchaser of the swaptions is granting or buying the right to enter into a previously agreed upon interest rate or credit default swap agreement at any time before the expiration of the option.
Options on Exchange-Traded Futures Contract (“Futures Option”) is an option contract in which the underlying instrument is a single futures contract.
Swap Agreements - The Portfolio may enter into swap agreements in which the Portfolio and a counterparty agree to either make periodic net payments on a specified notional amount or net payment upon termination. Swap agreements are either privately negotiated in the OTC market (“OTC swaps”) or executed in a multilateral or other trade facility platform, such as a registered commodities exchange (“centrally cleared swaps”). The Portfolio may enter into swap agreements for the purposes of managing
BHFTII-58
Brighthouse Funds Trust II
BlackRock Bond Income Portfolio
Notes to Financial Statements—December 31, 2018—(Continued)
exposure to interest rate, credit or market risk, or for other purposes. In connection with these agreements, securities or cash may be paid or received, as applicable, by the Portfolio as collateral or margin in accordance with the terms of the respective swap agreements to provide assets of value and recourse in the event of default or bankruptcy/insolvency. Securities posted by the Portfolio as collateral for swap contracts are identified in the Schedule of Investments and restricted cash, if any, is reflected on the Statement of Assets and Liabilities.
Centrally Cleared Swaps:Clearinghouses currently offer clearing derivative transactions which include interest rate and credit derivatives. In a cleared derivative transaction, a Portfolio typically enters into the transaction with a financial institution counterparty, and performance of the transaction is effectively guaranteed by a central clearinghouse, thereby reducing or eliminating the Portfolio’s exposure to the credit risk of the original counterparty. The Portfolio typically will be required to post specified levels of margin with the clearinghouse or at the instruction of the clearinghouse; the margin required by a clearinghouse may be greater than the margin the Portfolio would be required to post in an uncleared derivative transaction.
Swap agreements aremarked-to-market daily. The fair value of an OTC swap is reflected on the Statement of Assets and Liabilities. The changes in value, if any, are reflected as a component of net change in unrealized appreciation/depreciation on the Statement of Operations. Daily changes in valuation of centrally cleared swaps, if any, are recorded as a receivable or payable for variation margin on the Statement of Assets and Liabilities and as a component of unrealized appreciation/depreciation on the Statement of Operations. Upfront payments paid or received upon entering into the swap agreement compensate for differences between the stated terms of the swap agreement and prevailing market conditions (such as credit spreads, currency exchange rates, interest rates, and other relevant factors). Upon termination or maturity of the swap, upfront premiums are recorded as realized gains or losses on the Statement of Operations. A liquidation payment received or made at the termination of the swap is recorded as realized gain or loss on the Statement of Operations. Net periodic payments received or paid by the Portfolio are included as part of realized gains or losses on the Statement of Operations.
Swap transactions involve, to varying degrees, elements of interest rate, credit, and market risk in excess of the amounts recognized in the Statement of Assets and Liabilities. Such risks involve the possibility that there will be no liquid market for these agreements, that the counterparty to the agreements may default on its obligation to perform, or that there may be unfavorable changes in market conditions or interest rates. In addition, entering into swap agreements involves documentation risk resulting from the possibility that the parties to a swap agreement may disagree as to the meaning of contractual terms in the agreement. The Portfolio may enter into swap transactions with counterparties in accordance with guidelines established by the Board. These guidelines provide for a minimum credit rating for each counterparty and various credit enhancement techniques (for example, collateralization of amounts due from counterparties) to limit exposure to counterparties that have lower credit ratings. A Portfolio’s maximum risk of loss from counterparty credit risk is the discounted value of the net cash flows to be received from the counterparty over the contract’s remaining life, to the extent that amount is positive, or the fair value of the contract. The risk may be mitigated by having a master netting arrangement between the Portfolio and the counterparty and by the posting of collateral by the counterparty to cover the Portfolio’s exposure to the counterparty. Counterparty risk related to centrally cleared swaps is mitigated due to the protection against defaults provided by the exchange on which these contracts trade.
Credit Default Swaps: The Portfolio is subject to credit risk in the normal course of pursuing its investment objectives. The Portfolio may enter into credit default swaps to manage its exposure to the market or certain sectors of the market, to reduce its risk exposure to defaults of corporate and/or sovereign issuers, or to create exposure to corporate and/or sovereign issuers to which they are not otherwise exposed. Credit default swaps involve one party making a stream of payments (referred to as the buyer of protection) to another party (referred to as the seller of protection) in exchange for the right to receive a specified return if a credit event occurs for the referenced entity, obligation or index. A credit event is defined under the terms of each swap agreement and may include, but is not limited to, underlying entity default, bankruptcy, write-down, principal shortfall or interest shortfall. As the seller of protection, if an underlying credit event occurs, the Portfolio will either pay the buyer an amount equal to the notional amount of the swap and take delivery of the referenced obligation (or underlying securities comprising the referenced index), or pay a net settlement amount in the form of cash or securities equal to the notional amount of the swap less the recovery value of the referenced obligation (or underlying securities comprising the referenced index). In return, the Portfolio would receive from the counterparty an upfront or periodic stream of payments throughout the life of the credit default swap agreement provided that no credit event has occurred. As the seller of protection, the Portfolio will effectively add leverage to its portfolio because, in addition to its total net assets, the Portfolio would be subject to investment exposure on the notional amount of the credit default swap.
The Portfolio may also purchase credit default swap contracts in order to hedge against the risk of default of debt securities held in its portfolio. This would involve the risk that the investment may be worthless when it expires and would only generate income in the event of an actual default by the issuer of the underlying obligation (as opposed to a credit downgrade or other indication of financial instability). It would also involve credit risk, whereby the seller may fail to satisfy its payment obligations to the Portfolio in the event of a default. As the buyer of protection, if an underlying credit event occurs, the Portfolio will either receive from the seller of protection an amount equal to the notional amount of the swap and deliver the referenced obligation (or underlying securities comprising the referenced index), or receive a net settlement amount in the form of cash or securities equal to the notional amount of
BHFTII-59
Brighthouse Funds Trust II
BlackRock Bond Income Portfolio
Notes to Financial Statements—December 31, 2018—(Continued)
the swap less the recovery value of the referenced obligation (or underlying securities comprising the referenced index). If no credit event occurs and the Portfolio is a buyer of protection, the Portfolio will typically recover nothing under the credit default swap agreement, but it will have had to pay the required upfront payment or stream of continuing payments under the credit default swap agreement. Recovery values are at times established through the credit event auction process in which market participants are ensured that a transparent price has been set for the defaulted obligation.
Credit default swap agreements on credit indices involve one party making a stream of payments to another party in exchange for the right to receive a specified return in the event of a write-down, principal shortfall, interest shortfall or default of all or part of the referenced entities comprising the credit index. A credit index is a basket of credit instruments or exposures designed to be representative of some part of the credit market as a whole. An index credit default swap references all the names in the index, and if there is a credit event involving an entity in the index, the credit event is settled based on that entity’s weight in the index. A Portfolio may use credit default swaps on credit indices as a hedge for credit default swaps or bonds held in the portfolio, which is less expensive than it would be to buy many individual credit default swaps to achieve similar effect. Credit default swaps on indices are benchmarks for protecting investors owning bonds against default, and may be used to speculate on changes in credit quality.
Implied credit spreads, represented in absolute terms, utilized in determining the market value of credit default swap agreements on a credit index or corporate or sovereign issuer, serve as some indication of the status of the payment/performance risk and the likelihood or risk of default for the credit derivative. The implied credit spread of a particular referenced entity or index also reflects the cost of buying/selling protection and may reflect upfront payments required to be made to enter into the agreement. Wider credit spreads generally represent a deterioration of the referenced entity’s credit soundness and a greater likelihood or risk of default or other credit event occurring as defined under the terms of the particular swap agreement. When no implied credit spread is available for a credit default swap, the current unrealized appreciation/depreciation on the position may be used as an indicator of the current status of the payment/performance risk.
The maximum potential amount of future payments (undiscounted) that the Portfolio as a seller of protection could be required to make under a credit default swap agreement equals the notional amount of the agreement. Notional amounts of all credit default swap agreements outstanding as of December 31, 2018, for which the Portfolio is the seller of protection, are disclosed in the Schedule of Investments. These potential amounts would be partially offset by any recovery values of the respective referenced obligations, upfront payments received upon entering into the agreement or net amounts received from the settlement of buy protection credit default swap agreements entered into by the Portfolio for the same referenced entity or entities.
Interest Rate Swaps: The Portfolio may enter into interest rate swaps to manage its exposure to interest rates or to protect against currency fluctuations, to adjust its interest rate sensitivity (duration), to preserve a return or spread on a particular investment, or otherwise as a substitute for a direct investment in debt securities. The Portfolio is subject to interest rate risk exposure in the normal course of pursuing its investment objectives. Because the Portfolio holds fixed rate bonds, the value of these bonds may decrease if interest rates rise. To help hedge against this risk and to maintain its ability to generate income at prevailing market rates, the Portfolio may enter into interest rate swap agreements. Interest rate swaps are agreements in which one party pays a stream of interest payments, either fixed or floating rate, for another party’s stream of interest payments, either fixed or floating, on the same notional amount for a specified period of time. Other forms of interest rate swap agreements may include: (1) interest rate caps, under which, in return for a premium, one party agrees to make payments to the other to the extent that interest rates exceed a specified rate, or “cap”; (2) interest rate floors, under which, in return for a premium, one party agrees to make payments to the other to the extent that interest rates fall below a specified rate, or “floor”; and (3) interest rate collars, under which a party sells a cap and purchases a floor or vice versa in an attempt to protect itself against interest rate movements exceeding given minimum or maximum levels; and (4) basis swaps, under which two parties can exchange variable interest rates based on different segments of money markets. The Portfolio’s maximum risk of loss from counterparty credit risk, as opposed to investment and other types of risk, in respect of interest rate swaps is typically the discounted net value of the cash flows to be received from the counterparty over the contract’s remaining life, to the extent that amount is positive.
Currency Swaps: The Portfolio may enter into currency swap agreements to gain or mitigate exposure to currency risk. A currency swap is an agreement to exchange cash flows on a notional amount of two or more currencies based on the relative value differential among them. Such swaps may involve initial and final exchanges that correspond to the agreed upon notional amount. Currency swaps usually involve the delivery of the entire principal value of one designated currency in exchange for the other designated currency. Therefore, the entire principal value of a currency swap is subject to the risk that the other party to the swap will default on its contractual delivery obligations. If there is a default by the counterparty, the Portfolio may have contractual remedies pursuant to the agreements related to the transaction.
BHFTII-60
Brighthouse Funds Trust II
BlackRock Bond Income Portfolio
Notes to Financial Statements—December 31, 2018—(Continued)
The following table summarizes the fair value of derivatives held by the Portfolio at December 31, 2018 by category of risk exposure:
| | | | | | | | | | | | |
| | | Asset Derivatives | | | Liability Derivatives | |
Risk Exposure | | Statement of Assets &
Liabilities Location | | Fair Value | | | Statement of Assets &
Liabilities Location | | Fair Value | |
Interest Rate | | Investments at market value (a) | | $ | 5,935,478 | | | | | | | |
| | OTC swap contracts at market value (b) | | | 781,349 | | | OTC swap contracts at market value (b) | | $ | 495,705 | |
| | Unrealized appreciation on centrally cleared swap contracts (c) (d) | | | 2,211,534 | | | Unrealized depreciation on centrally cleared swap contracts (c) (d) | | | 2,557,253 | |
| | Unrealized appreciation on futures contracts (d) (e) | | | 16,813,038 | | | Unrealized depreciation on futures contracts (d) (e) | | | 5,041,520 | |
| | | | | | | | Written options at value | | | 1,732,313 | |
Credit | | OTC swap contracts at market value (b) | | | 2,177,461 | | | OTC swap contracts at market value (b) | | | 762,200 | |
| | Unrealized appreciation on centrally cleared swap contracts (c) (d) | | | 165,978 | | | | | | | |
Foreign Exchange | | Investments at market value (a) | | | 1,075,951 | | | | | | | |
| | | | | | | | OTC swap contracts at market value (b) | | | 28,781 | |
| | Unrealized appreciation on forward foreign currency exchange contracts | | | 469,541 | | | Unrealized depreciation on forward foreign currency exchange contracts | | | 3,764,716 | |
| | | | | | | | Written options at value | | | 1,032,554 | |
| | | | | | | | | | | | |
| Total | | | | $ | 29,630,330 | | | | | $ | 15,415,042 | |
| | | | | | | | | | | | |
| | | | |
| (a) | | Represents purchased options which are part of investments at value as shown in the Statement of Assets and Liabilities. |
| (b) | | Excludes OTC swap interest receivable of $150,717 and OTC swap interest payable of $160,475. |
| (c) | | Represents the unrealized appreciation/depreciation of centrally cleared swaps as reported in the Schedule of Investments. Only the variation margin is reported within the Statement of Assets and Liabilities. |
| (d) | | Financial instrument not subject to a master netting agreement. |
| (e) | | Includes cumulative appreciation/depreciation of futures contracts as reported in the Schedule of Investments. Only the current day’s variation margin is reported within the Statement of Assets and Liabilities. |
The Portfolio is required to disclose the impact of offsetting assets and liabilities represented in the Statement of Assets and Liabilities to enable users of the financial statements to evaluate the effect or potential effect of netting arrangements on its financial position for recognized assets and liabilities.
The following table presents the Portfolio’s derivative assets by counterparty net of amounts available for offset under a master netting agreement ("MNA") (see Note 4), or similar agreement, and net of the related collateral received by the Portfolio as of December 31, 2018.
| | | | | | | | | | | | | | | | |
Counterparty | | Derivative Assets
subject to an MNA
by Counterparty | | | Financial
Instruments
available for offset | | | Collateral
Received† | | | Net
Amount* | |
Bank of America N.A. | | $ | 333,608 | | | $ | (71,826 | ) | | $ | (250,000 | ) | | $ | 11,782 | |
Barclays Bank plc | | | 1,169,639 | | | | — | | | | (1,022,842 | ) | | | 146,797 | |
BNP Paribas S.A. | | | 179,488 | | | | (137,195 | ) | | | (42,293 | ) | | | — | |
Citibank N.A. | | | 1,256,250 | | | | (1,256,250 | ) | | | — | | | | — | |
Credit Suisse International | | | 109,735 | | | | (109,735 | ) | | | — | | | | — | |
Deutsche Bank AG | | | 1,531,025 | | | | (753,476 | ) | | | (777,549 | ) | | | — | |
Goldman Sachs International | | | 227,506 | | | | (210,121 | ) | | | — | | | | 17,385 | |
JPMorgan Chase Bank N.A. | | | 5,542,065 | | | | (2,398,387 | ) | | | (3,143,678 | ) | | | — | |
Morgan Stanley & Co. International plc | | | 90,464 | | | | (90,464 | ) | | | — | | | | — | |
| | | | | | | | | | | | | | | | |
| | $ | 10,439,780 | | | $ | (5,027,454 | ) | | $ | (5,236,362 | ) | | $ | 175,964 | |
| | | | | | | | | | | | | | | | |
BHFTII-61
Brighthouse Funds Trust II
BlackRock Bond Income Portfolio
Notes to Financial Statements—December 31, 2018—(Continued)
The following table presents the Portfolio’s derivative liabilities by counterparty net of amounts available for offset under an MNA, or similar agreement, and net of the related collateral pledged by the Portfolio as of December 31, 2018.
| | | | | | | | | | | | | | | | |
Counterparty | | Derivative Liabilities
subject to an MNA
by Counterparty | | | Financial
Instruments
available for offset | | | Collateral
Pledged† | | | Net
Amount** | |
Bank of America N.A. | | $ | 71,826 | | | $ | (71,826 | ) | | $ | — | | | $ | — | |
BNP Paribas S.A. | | | 137,195 | | | | (137,195 | ) | | | — | | | | — | |
Citibank N.A. | | | 2,467,599 | | | | (1,256,250 | ) | | | (930,000 | ) | | | 281,349 | |
Credit Suisse International | | | 183,066 | | | | (109,735 | ) | | | (73,331 | ) | | | — | |
Deutsche Bank AG | | | 753,476 | | | | (753,476 | ) | | | — | | | | — | |
Goldman Sachs International | | | 210,121 | | | | (210,121 | ) | | | — | | | | — | |
JPMorgan Chase Bank N.A. | | | 2,398,387 | | | | (2,398,387 | ) | | | — | | | | — | |
Morgan Stanley & Co. International plc | | | 1,320,711 | | | | (90,464 | ) | | | (880,000 | ) | | | 350,247 | |
National Australia Bank Ltd. | | | 223,188 | | | | — | | | | — | | | | 223,188 | |
Nomura International plc | | | 1,888 | | | | — | | | | — | | | | 1,888 | |
Northern Trust Co. | | | 10,412 | | | | — | | | | — | | | | 10,412 | |
Toronto Dominion Bank | | | 1,743 | | | | — | | | | — | | | | 1,743 | |
UBS AG | | | 36,657 | | | | — | | | | — | | | | 36,657 | |
| | | | | | | | | | | | | | | | |
| | $ | 7,816,269 | | | $ | (5,027,454 | ) | | $ | (1,883,331 | ) | | $ | 905,484 | |
| | | | | | | | | | | | | | | | |
| | | | |
| * | | Net amount represents the net amount receivable from the counterparty in the event of default. |
| ** | | Net amount represents the net amount payable due to the counterparty in the event of default. |
| † | | In some instances, the actual collateral received and/or pledged may be more than the amount shown here due to overcollateralization. |
The following tables summarize the effect of derivative instruments on the Statement of Operations, classified by derivative type and category of risk exposure, for the year ended December 31, 2018:
| | | | | | | | | | | | | | | | |
Statement of OperationsLocation-Net
Realized Gain (Loss) | | Interest
Rate | | | Credit | | | Foreign
Exchange | | | Total | |
Purchased options | | $ | (2,222,892 | ) | | $ | — | | | $ | (8,084,138 | ) | | $ | (10,307,030 | ) |
Forward foreign currency transactions | | | — | | | | — | | | | 3,775,307 | | | | 3,775,307 | |
Swap contracts | | | (1,338,421 | ) | | | 1,117,479 | | | | — | | | | (220,942 | ) |
Futures contracts | | | (8,779,748 | ) | | | — | | | | — | | | | (8,779,748 | ) |
Written options | | | 6,956,779 | | | | 46,543 | | | | 4,693,738 | | | | 11,697,060 | |
| | | | | | | | | | | | | | | | |
| | $ | (5,384,282 | ) | | $ | 1,164,022 | | | $ | 384,907 | | | $ | (3,835,353 | ) |
| | | | | | | | | | | | | | | | |
| | | | |
Statement of OperationsLocation-Net
Change in Unrealized Appreciation (Depreciation) | | Interest
Rate | | | Credit | | | Foreign
Exchange | | | Total | |
Purchased options | | $ | 3,149,565 | | | $ | — | | | $ | 2,141,412 | | | $ | 5,290,977 | |
Forward foreign currency transactions | | | — | | | | — | | | | (1,557,238 | ) | | | (1,557,238 | ) |
Futures contracts | | | 11,359,922 | | | | — | | | | — | | | | 11,359,922 | |
Swap contracts | | | 2,156,044 | | | | (260,651 | ) | | | (28,292 | ) | | | 1,867,101 | |
Written options | | | (1,946,834 | ) | | | — | | | | (1,558,630 | ) | | | (3,505,464 | ) |
| | | | | | | | | | | | | | | | |
| | $ | 14,718,697 | | | $ | (260,651 | ) | | $ | (1,002,748 | ) | | $ | 13,455,298 | |
| | | | | | | | | | | | | | | | |
For the year ended December 31, 2018, the average notional par or face amount outstanding for each derivative type was as follows:
| | | | |
Derivative Description | | Average
Notional Par or
Face Amount‡ | |
Purchased options | | $ | 1,880,603,006 | |
Forward foreign currency transactions | | | 468,682,532 | |
Futures contracts long | | | 1,541,160,820 | |
Futures contracts short | | | (684,286,118 | ) |
Swap contracts | | | 652,002,661 | |
Written options | | | (1,075,520,134 | ) |
| | | | |
| ‡ | | Averages are based on activity levels during the period for which the amounts are outstanding. |
BHFTII-62
Brighthouse Funds Trust II
BlackRock Bond Income Portfolio
Notes to Financial Statements—December 31, 2018—(Continued)
4. Certain Risks
In the normal course of business, the Portfolio invests in securities and enters into transactions where risks exist. Those risks include:
Market Risk:The value of securities held by the Portfolio may decline in response to certain events, including those directly involving the issuers whose securities are owned by the Portfolio; conditions affecting the general economy; overall market changes; local, regional or global political, social or economic instability; and currency, interest rate, and price fluctuations.
Credit and Counterparty Risk: The Portfolio may be exposed to counterparty risk, or the risk that an entity with which the Portfolio has unsettled or open transactions may default. The potential loss could exceed the value of the financial assets and liabilities recorded in the financial statements. Financial assets that potentially expose the Portfolio to credit and counterparty risk consist principally of cash due from counterparties and investments. The Portfolio manages counterparty risk by entering into agreements only with counterparties that it believes have the financial resources to honor their obligations and by monitoring the financial stability of those counterparties. The Adviser attempts to mitigate counterparty risk by (i) periodically assessing the creditworthiness of its trading partners, (ii) monitoring and/or limiting the amount of its net exposure to each individual counterparty based on its assessment, and (iii) requiring collateral from the counterparty for certain transactions. In order to preserve certain safeguards fornon-standard settlement trades, the Portfolio restricts its exposure to credit and counterparty losses by entering into master netting agreements (“Master Agreements”) with counterparties (approved brokers) with whom it undertakes a significant volume of transactions. Master Agreements govern the terms of certain transactions, and reduce the counterparty risk associated with relevant transactions by specifying credit protection mechanisms and providing standardization that improves legal certainty. Master Agreements can also help limit counterparty risk by specifying collateral posting arrangements atpre-arranged exposure levels. Collateral requirements may differ by type of derivative or investment, as applicable. Collateral or margin requirements are set by the broker or exchange clearing house for exchange-traded derivatives (e.g., futures contracts and exchange-traded options), while collateral terms are contract specific for OTC traded derivatives (e.g., forward foreign currency exchange contracts, swap agreements and OTC options).
For derivatives traded under an International Swaps and Derivatives Association, Inc. Master Agreement (“ISDA Master Agreement”) or similar master agreement, the collateral requirements are netted across all transactions traded under such agreement and one amount is posted from one party to the other to collateralize such obligations. The ISDA Master Agreement gives each party to the agreement the right to terminate all transactions traded under such agreement if there is a certain deterioration in the credit quality of the other party. The ISDA Master Agreement gives the Portfolio the right, upon an event of default by the applicable counterparty or a termination of the agreement, to close out all transactions traded under such agreement and to net amounts owed under each transaction to one net amount payable by one party to the other. This right to close out and net payments across all transactions traded under the ISDA Master Agreement could result in a reduction of the Portfolio’s credit risk to such counterparty equal to any amounts payable by the Portfolio under the applicable transactions, if any. However, absent an event of default by the counterparty or a termination of the agreement, the ISDA Master Agreement does not result in an offset of reported amounts of assets and liabilities in the Statement of Assets and Liabilities across transactions between the Portfolio and the applicable counterparty. The enforceability of the right to offset may vary by jurisdiction. Cash collateral that has been pledged to cover obligations of the Portfolio under derivative contracts, if any, will be reported separately in the Statement of Assets and Liabilities. Securities pledged as collateral, if any, for the same purpose are noted in the Schedule of Investments.
Repurchase and reverse repurchase agreements are primarily executed under Global Master Repurchase Agreements (“GMRAs”) or Master Repurchase Agreements (“MRAs”), which provide the rights toset-off. Each repurchase and reverse repurchase agreement is initially collateralized at the transaction level. In the event of default, the total market value exposure will be offset against collateral exchanged to date, which would result in a net receivable/(payable) that would be due from/to the counterparty.
Master Securities Forward Transaction Agreements (“MSFTA”) govern the considerations and factors surrounding the settlement of certain forward settling transactions, such as TBA securities and delayed-delivery or secured borrowings transactions by and between the Portfolio and select counterparties. The MSFTA maintain provisions for, among other things, initiation and confirmation, payment and transfer, events of default, termination, and maintenance of collateral.
Customer Account Agreements and related addenda govern cleared derivatives transactions such as futures, options on futures, and cleared OTC derivatives. Cleared derivative transactions require posting of initial margin as determined by each relevant clearing agency, which is segregated at a broker account registered with the Commodities Futures Trading Commission (“CFTC”), or the applicable regulator. In the U.S., counterparty risk is significantly reduced as creditors of the futures broker do not have claim to portfolio assets in the segregated account. Additionally, portability of exposure in the event of default further reduces risk to the Portfolio. Variation margin, or changes in market value, are exchanged daily, but may not be netted between futures and cleared OTC derivatives.
Foreign Investment Risk:The investments by the Portfolio in foreign securities may involve risks not present in domestic investments. Because securities may be denominated in foreign currencies, may require settlement in foreign currencies and may pay interest or
BHFTII-63
Brighthouse Funds Trust II
BlackRock Bond Income Portfolio
Notes to Financial Statements—December 31, 2018—(Continued)
dividends in foreign currencies, changes in the relationship of these foreign currencies to the U.S. dollar can significantly affect the value of the investments and earnings of the Portfolio. Foreign investments may also subject the Portfolio to foreign government exchange restrictions, expropriation, taxation or other political, social or economic developments, all of which could affect the market and/or credit risk of the investments. In addition to the risks described above, risks may arise from forward foreign currency contracts with respect to the potential inability of counterparties to meet the terms of their contracts.
Additional risks associated with each type of investment are described above within the respective security type notes. The Portfolio’s prospectus includes a discussion of the principal risks of investing in the Portfolio.
5. Investment Transactions
Aggregate cost of purchases and proceeds of sales of investment securities, including mortgage dollar rolls and TBA transactions but excluding short-term securities, for the year ended December 31, 2018 were as follows:
| | | | | | | | | | | | |
Purchases | | | Sales | |
U.S. Government | | Non-U.S. Government | | | U.S. Government | | | Non-U.S. Government | |
$15,485,649,450 | | $ | 1,775,470,101 | | | $ | 16,384,396,986 | | | $ | 1,894,972,196 | |
Purchases and sales of mortgage dollar rolls and TBA transactions for the year ended December 31, 2018 were as follows:
| | | | |
Purchases | | Sales | |
$13,829,511,163 | | $ | 13,827,993,193 | |
The Portfolio engaged in security transactions with other accounts managed by BlackRock Advisors, LLC, the subadviser to the Portfolio, that amounted to $1,957,955 in purchases and $3,442,594 in sales of investments, which are included above, and resulted in realized losses of $139,589.
6. Investment Management Fees and Other Transactions with Affiliates
Investment Management Agreement -Brighthouse Investment Advisers is the investment adviser to the Portfolio. The Trust has entered into an investment management agreement with Brighthouse Investment Advisers with respect to the Portfolio. For providing investment management services to the Portfolio, Brighthouse Investment Advisers receives monthly compensation at the following annual rates:
| | | | | | |
Management
Fees earned by
Brighthouse Investment
Advisers for the year ended
December 31, 2018 | | % per annum | | | Average Daily Net
Assets |
| $12,360,919 | | | 0.400 | % | | Of the first $1 billion |
| | | 0.350 | % | | Of the next $1 billion |
| | | 0.300 | % | | Of the next $1 billion |
| | | 0.250 | % | | On amounts in excess of $3 billion |
Brighthouse Investment Advisers has entered into an investment subadvisory agreement with respect to managing the Portfolio. BlackRock Advisors, LLC (the “Subadviser”) is compensated by Brighthouse Investment Advisers to provide subadvisory services for the Portfolio.
Management Fee Waivers- Pursuant to an expense agreement, Brighthouse Investment Advisers has agreed, for the period April 30, 2018 to April 30, 2019, to reduce its advisory fees set out above under “Investment Management Agreement” for each class of the Portfolio as follows:
| | | | |
% per annum | | Average Daily Net Assets | |
| 0.030% | | | Of the first $1 billion | |
| 0.025% | | | Of the next $1 billion | |
Any reductions in total advisory fees paid by the Portfolio due to these waivers may be reduced or eliminated by changes in the advisory fee structure at higher asset levels. Brighthouse Investment Advisers will receive advisory fees equal to 0.325% of the Portfolio’s average daily net assets for amounts over $2 billion but less than $3 billion (0.025% over the contractual advisory fee rate) and 0.325% for amounts over $3 billion but less than $3.4 billion (0.075% over the contractual advisory fee rate). As a result, the dollar amount of the waiver will be reduced as assets grow beyond $2 billion up to $3.4 billion, but the advisory fee net of waivers will never exceed the contractual dollar amount that would otherwise be payable under the advisory fee.
BHFTII-64
Brighthouse Funds Trust II
BlackRock Bond Income Portfolio
Notes to Financial Statements—December 31, 2018—(Continued)
An identical agreement was in place for the period May 1, 2017 to April 30, 2018. No fees were waived during the year ended December 31, 2018.
Certain officers and trustees of the Trust may also be officers of Brighthouse Investment Advisers; however, such officers and trustees receive no compensation from the Trust.
Transfer Agency Agreement -Brighthouse Financial, Inc. serves as the transfer agent for the Trust. Brighthouse Financial, Inc. receives no fees for its services to the Trust.
Distribution and Service Fees - The Trust has a distribution agreement with Brighthouse Securities, LLC (the “Distributor”) pursuant to which the Distributor serves as the general distributor of shares of each class (each a “Class”) of each Portfolio. The Distributor is an affiliate of the Trust. The Trust has adopted a Distribution and Services Plan (the “Plan”) relating to Class B and Class E shares of each Portfolio, under Rule 12b-1 under the 1940 Act, pursuant to which the Trust may pay the Distributor a fee (the “Service Fee”) at an annual rate not to exceed 0.25% of each such Portfolio’s average daily net assets attributable to the Class B and Class E shares of the Trust. Each Portfolio may not offer shares of each Class. The Plan also authorizes the Trust, on behalf of each of its Portfolios, may pay the Distributor a distribution Fee (the “Distribution Fee” and together with the Service Fee, the “Fees”) at an annual rate of up to 0.25% of each Portfolio’s average daily net assets attributable to the Class B and Class E shares in consideration of the services rendered in connection with the sale of such shares by the Distributor. Under the Distribution Agreement with respect to the Trust, Fees are currently paid at an annual rate of 0.25% of average daily net assets in the case of Class B shares and 0.15% of average daily net assets in the case of Class E shares. The Plan is known as a “compensation plan” because the Trust makes payments to the Distributor for services rendered regardless of the actual level of expenditures by the Distributor. Amounts incurred by the Portfolio for the year ended December 31, 2018 are shown as Distribution and service fees in the Statement of Operations.
Deferred Trustee Compensation -Each Trustee who is not currently an employee of the Adviser or any of its affiliates receives compensation from the Trust for his or her service to the Trust. A deferred compensation plan (the “Plan”) is available to the Trustees on a voluntary basis. Deferred amounts remain in the Trust until distributed in accordance with the provisions of the Plan. The value of a participating Trustee’s deferral account is based on theoretical investments of deferred amounts on the normal payment dates in certain portfolios of the Trust or Brighthouse Funds Trust I, an affiliate of the Trust, as designated by the participating Trustee. Changes in the value of participants’ deferral accounts are reflected as Trustees’ fees and expenses in the Statement of Operations. The portion of the accrued obligations allocated to the Portfolio under the Plan is reflected as Deferred trustees’ fees in the Statement of Assets and Liabilities.
7. Contractual Obligations
Under the Trust’s organizational documents, its officers and Trustees may be indemnified against certain liabilities and expenses arising out of the performance of their duties to the Trust. Additionally, the Trust has a variety of indemnification obligations under contracts with its service providers. The Trust’s maximum exposure under these arrangements is unknown, as this would involve future claims that may be made against the Trust that have not yet occurred.
8. Income Tax Information
The cost basis of investments for federal income tax purposes at December 31, 2018 was as follows:
| | | | |
Cost basis of investments | | $ | 3,909,151,200 | |
| | | | |
Gross unrealized appreciation | | | 107,075,946 | |
Gross unrealized depreciation | | | (165,389,692 | ) |
| | | | |
Net unrealized appreciation (depreciation) | | $ | (58,313,746 | ) |
| | | | |
The tax character of distributions paid for the years ended December 31, 2018 and 2017 were as follows:
| | | | | | | | | | | | | | | | | | | | |
Ordinary Income | | | Long-Term Capital Gain | | | Total | |
2018 | | 2017 | | | 2018 | | | 2017 | | | 2018 | | | 2017 | |
| $126,118,817 | | $ | 119,285,236 | | | $ | — | | | $ | — | | | $ | 126,118,817 | | | $ | 119,285,236 | |
As of December 31, 2018, the components of distributable earnings (accumulated losses) on a federal income tax basis were as follows:
| | | | | | | | | | | | | | | | |
Undistributed
Ordinary
Income | | Undistributed
Long-Term
Capital Gain | | | Net
Unrealized
Depreciation | | | Accumulated
Capital
Losses | | | Total | |
$126,610,528 | | $ | — | | | $ | (57,696,157 | ) | | $ | (152,772,496 | ) | | $ | (83,858,125 | ) |
BHFTII-65
Brighthouse Funds Trust II
BlackRock Bond Income Portfolio
Notes to Financial Statements—December 31, 2018—(Continued)
The Portfolio utilizes the provisions of the federal income tax laws that provide for the carryforward of capital losses for prior years, offsetting such losses against any future realized capital gains. Under the Regulated Investment Company Modernization Act of 2010, net capital losses recognized after December 22, 2010 may be carried forward indefinitely and their character is retained as short-term and/or long-term losses.
As of December 31, 2018, the Portfolio had short-term accumulated capital losses of $92,349,595 and long-term accumulated capital losses of $60,422,901.
9.Recent Accounting Pronouncements and SEC Update
In March 2017, FASB issued Accounting Standards UpdateNo. 2017-08, Receivables—Nonrefundable Fees and Other Costs (Subtopic310-20)—Premium Amortization on Purchased Callable Debt Securities (“ASU2017-08”) which amends the amortization period for certain purchased callable debt securities. Under the standards update, the premium amortization of purchased callable debt securities that have explicit,non-contingent call features and are callable at fixed prices will be amortized to the earliest call date. The guidance will be applied on a modified retrospective basis and is effective for fiscal years, and their interim periods, beginning after December 15, 2018. Management is currently evaluating the impact of this standards update to the Portfolio.
In August 2018, the FASB issued Accounting Standards Update 2018-13, Fair Value Measurement (Topic 820)—Disclosure Framework—Changes to the Disclosure Requirements for Fair Value Measurement (“ASU 2018-13”) which introduces new fair value disclosure requirements as well as eliminates and modifies certain existing fair value disclosure requirements. ASU 2018-13 is effective for fiscal years beginning after December 15, 2019, and interim periods within those fiscal years. Early adoption is permitted and, as such, management has elected to early adopt ASU 2018-13 effective with the current reporting period. The impact of the Portfolio’s adoption was limited to changes in the Portfolio’s financial statement disclosures regarding fair value, primarily those disclosures related to transfers between levels of the fair value hierarchy.
In August 2018, the Securities and Exchange Commission released its Final Rule on Disclosure Update and Simplification (the “Final Rule”) which is intended to simplify an issuer’s disclosure compliance efforts by removing redundant or outdated disclosures requirements without significantly altering the mix of information provided to investors. Effective with the current reporting period, the Portfolio adopted the Final Rule with the most notable impacts being that the Portfolio is no longer required to present the components of distributable earnings on the Statement of Assets and Liabilities or the sources of distributions to shareholders and the amounts of undistributed net investment income on the Statements of Changes in Net Assets.
BHFTII-66
Brighthouse Funds Trust II
BlackRock Bond Income Portfolio
Report of Independent Registered Public Accounting Firm
To the Shareholders of BlackRock Bond Income Portfolio and the Board of Trustees of Brighthouse Funds Trust II:
Opinion on the Financial Statements and Financial Highlights
We have audited the accompanying statement of assets and liabilities, including the schedule of investments, of the BlackRock Bond Income Portfolio (the “Portfolio”), one of the portfolios constituting the Brighthouse Funds Trust II, as of December 31, 2018, the related statement of operations for the year then ended, the statements of changes in net assets for each of the two years in the period then ended, the financial highlights for each of the five years in the period then ended, and the related notes. In our opinion, the financial statements and financial highlights present fairly, in all material respects, the financial position of the BlackRock Bond Income Portfolio of the Brighthouse Funds Trust II as of December 31, 2018, the results of its operations for the year then ended, the changes in its net assets for each of the two years in the period then ended, and the financial highlights for each of the five years in the period then ended, in conformity with accounting principles generally accepted in the United States of America.
Basis for Opinion
These financial statements and financial highlights are the responsibility of the Portfolio’s management. Our responsibility is to express an opinion on the Portfolio’s financial statements and financial highlights based on our audits. We are a public accounting firm registered with the Public Company Accounting Oversight Board (United States) (PCAOB) and are required to be independent with respect to the Portfolio in accordance with the U.S. federal securities laws and the applicable rules and regulations of the Securities and Exchange Commission and the PCAOB.
We conducted our audits in accordance with the standards of the PCAOB. Those standards require that we plan and perform the audit to obtain reasonable assurance about whether the financial statements and financial highlights are free of material misstatement, whether due to error or fraud. The Portfolio is not required to have, nor were we engaged to perform, an audit of its internal control over financial reporting. As part of our audits we are required to obtain an understanding of internal control over financial reporting but not for the purpose of expressing an opinion on the effectiveness of the Portfolio’s internal control over financial reporting. Accordingly, we express no such opinion.
Our audits included performing procedures to assess the risks of material misstatement of the financial statements and financial highlights, whether due to error or fraud, and performing procedures that respond to those risks. Such procedures included examining, on a test basis, evidence regarding the amounts and disclosures in the financial statements and financial highlights. Our audits also included evaluating the accounting principles used and significant estimates made by management, as well as evaluating the overall presentation of the financial statements and financial highlights. Our procedures included confirmation of securities owned as of December 31, 2018, by correspondence with the custodian, brokers and agent banks; when replies were not received from brokers or agent banks, we performed other auditing procedures. We believe that our audits provide a reasonable basis for our opinion.
/s/ Deloitte & Touche LLP
Boston, Massachusetts
February 25, 2019
We have served as the auditor of one or more of the Brighthouse investment companies since 1983.
BHFTII-67
Brighthouse Funds Trust II
Trustees and Officers
MANAGEMENT OF THE TRUSTS
The Boards of Trustees (the “Board”) of Brighthouse Funds Trust I and Brighthouse Funds Trust II (“BHF I” and “BHF II”, respectively, and collectively the “Trusts”) supervise the Trusts and are responsible for representing the interests of shareholders. The Trustees, the Chairman of the Board and the Chairmen of each subcommittee are the same for both Trusts. The Trustees of each Trust meet periodically throughout the year to oversee the Portfolios’ activities, reviewing, among other things, each Portfolio’s performance and its contractual arrangements with various service providers. The Trustees of each Trust elect the officers of the Trust, who are responsible for administering the Trust’sday-to-day operations.
Trustees and Officers
The Trustees and executive officers of the Trusts, as well as their principal occupations during the past five years, are set forth below. Unless otherwise indicated, the business address of each is c/o Brighthouse Funds, One Financial Center, Boston, Massachusetts 02111. Each Trustee who is deemed an “interested person,” as such term is defined in the 1940 Act, is referred to as an “Interested Trustee.” Those Trustees who are not “interested persons,” as such term is defined in the 1940 Act, are referred to as “Independent Trustees.” There is no limit to the term a Trustee may serve. Trustees serve until their death, resignation or removal in accordance with the BHF I Trust’s and BHF II Trust’s respective organizational documents and policies adopted by the Boards of the respective Trusts from time to time. Officers hold office at the pleasure of each Board and serve until their removal or resignation in accordance with the Trusts’ respective organizational documents and policies adopted by the Board of each Trust from time to time.
| | | | | | | | | | |
Name and Year of Birth | | Current
Position(s)
Held with
Registrant | | Term of Office
and Length of
Time Served | | Principal Occupation(s) During the Past 5 Years(1) | | Number of
Portfolios in
Brighthouse Funds
Complex(2)
Overseen
by Trustee | | Other Directorships Held
by Trustee During
the Past 5 Years(1) |
| Interested Trustee |
John Rosenthal* (1960) | | Trustee | | Indefinite;
From
May
2016
(Trust I
and
Trust II) to
present | | Chief Investment Officer, Brighthouse Financial, Inc. (2017 to present); until 2017, Senior Managing Director and Head of Global Portfolio Management, MetLife, Inc. | | 72 | | None |
|
| Independent Trustees |
Dawn M. Vroegop (1966) | | Trustee and Chairman of the Board | | Indefinite;
From
December
2000
(Trust I)/
May
2009
(Trust II)
to present
as
Trustee;
From
May
2016
(Trust I
and
Trust II)
until
present as
Chairman | | Private Investor. | | 72 | | Trustee, Driehaus Mutual Funds.** |
BHFTII-68
Brighthouse Funds Trust II
Trustees and Officers—(Continued)
| | | | | | | | | | |
Name and Year of Birth | | Current
Position(s)
Held with
Registrant | | Term of Office
and Length of
Time Served | | Principal Occupation(s) During the Past 5 Years(1) | | Number of
Portfolios in
Brighthouse Funds
Complex(2)
Overseen
by Trustee | | Other Directorships Held
by Trustee During
the Past 5 Years(1) |
Stephen M. Alderman (1959) | | Trustee | | Indefinite;
From
December
2000
(Trust I)/
April
2012
(Trust II)
to present | | Shareholder in the law firm of Garfield and Merel, Ltd. | | 72 | | None |
| | | | | |
Robert J. Boulware (1956) | | Trustee | | Indefinite;
From
March
2008
(Trust I)/
April
2012
(Trust II)
to present | | Managing Director, Pilgrim Funds, LLC (private equity fund). | | 72 | | Trustee, Vertical Capital Income Fund(closed-end fund);** Director, Gainsco, Inc. (auto insurance);** Trustee, SharesPost 100 Fund(closed-end fund).** |
| | | | | |
Susan C. Gause (1952) | | Trustee | | Indefinite;
From
March
2008
(Trust I)/
April
2012
(Trust II)
to present | | Private Investor. | | 72 | | Trustee, HSBC Funds.** |
| | | | | |
Nancy Hawthorne (1951) | | Trustee | | Indefinite;
From
May
2003
(Trust II)/
April
2012
(Trust I) to
present | | Partner, Hawthorne Financial Advisors, LLC (registered investment advisor); until 2014, Chief Executive Officer, Clerestory LLC (corporate advisor). | | 72 | | Director and Chairman of the Board of Directors, THL Credit, Inc.;** Director and Chairman of the Board, Avid Technology, Inc.;** Director, CRA International, Inc.** |
| | | | | |
Barbara A. Nugent (1956) | | Trustee | | Indefinite;
From
January
2014
(Trust I
and
Trust II) to
present | | President, True North Board Governance, LLC (consulting); until December 2013, partner in the law firm of Stradley Ronon Stevens & Young, LLP. | | 72 | | Independent Lead Trustee, BMT Investment Funds** |
| | | | | |
Christopher J. Towle (1957) | | Trustee | | Indefinite;
From
April
2018
(Trust I
and
Trust II) to
present | | Retired; until 2014, Partner, Portfolio Manager, Director of High Yield and Convertible Strategies, Lord Abbett & Co. | | 72 | | Trustee, Driehaus Mutual Funds** |
BHFTII-69
Brighthouse Funds Trust II
Trustees and Officers—(Continued)
Officers
| | | | | | |
Name and Year of Birth | | Position(s)
Held with
Registrant | | Length of
Time Served | | Principal Occupation(s)
During the Past 5 Years(1) |
| Executive Officers | | | | | | |
Kristi Slavin (1973) | | President and Chief Executive Officer, of Trust I and Trust II | | From May
2016
(Trust I
and
Trust II) to
present | | President, Brighthouse Investment Advisers, LLC (2016-present); formerly, Senior Vice President, MetLife Advisers, LLC; Vice President, MetLife, Inc.; Vice President, Trust I and Trust II(2015-2016). |
| | | |
Alan R. Otis (1971) | | Chief Financial Officer and Treasurer, of Trust I and Trust II | | From
November
2017
(Trust I
and
Trust II) to
present | | Senior Vice President, Brighthouse Investment Advisers, LLC (2017-present); formerly, Vice President, Brighthouse Investment Advisers, LLC (2012-2017); Assistant Treasurer, Trust I and Trust II(2012-2017). |
| | | |
Andrew L. Gangolf (1954) | | Secretary, of Trust I and Trust II | | From May
2011
(Trust I
and
Trust II) to
present | | Executive Vice President, Brighthouse Investment Advisers, LLC (2017-present); formerly, Senior Vice President, MetLife Advisers, LLC (2011-2017); until 2011, Senior Vice President & Assistant General Counsel, AllianceBernstein Investments, Inc. |
| | | |
Steven E. Hartstein (1963) | | Chief Compliance Officer (“CCO”), of Trust I and Trust II | | From
February
2014
(Trust I
and
Trust II) to
present | | Senior Vice President and CCO, Brighthouse Investment Advisers, LLC (2017-present); Head of Investments Compliance, Vice President, Brighthouse Financial, Inc. (2017-present); formerly, Vice President, MetLife, Inc. (2013-2017); Senior Vice President and CCO, MetLife Advisers, LLC (2013-2017.) |
| | | |
Victor Soto (1978) | | Vice President of Trust I and Trust II | | From May
2018
(Trust I
and
Trust II) to
present | | Executive Vice President, Brighthouse Investment Advisers, LLC (2016-present); Assistant Vice President, MetLife Inc. (2015-2017); Portfolio Manager, 1st Global (2013-2015). |
| * | Mr. Rosenthal is an “interested person” of the Trusts because of his position with Brighthouse Financial, Inc., the current parent company of Brighthouse Investment Advisers, LLC. |
| ** | Indicates a directorship with a registered investment company or a company subject to the reporting requirements of the Securities Exchange Act of 1934, as amended. |
| (1) | Previous positions during the past five years with the Trusts, Brighthouse Financial, Inc., MetLife, Inc. or the Manager are omitted if not materially different. |
| (2) | The Fund Complex includes 43 BHF I Portfolios and 29 BHF II Portfolios. |
BHFTII-70
Brighthouse Funds Trust II
BlackRock Bond Income Portfolio
Board of Trustees’ Consideration of Advisory and Sub-Advisory Agreements
At anin-person meeting held on November6-8, 2018 (the “November Meeting”), the Boards of Trustees (the “Board”) of Brighthouse Funds Trust I and Brighthouse Funds Trust II (“BFT I” and “BFT II,” respectively, and collectively, the “Trusts”), including a majority of the Trustees who are not “interested persons” of the Trusts (the “Independent Trustees”) under the Investment Company Act of 1940 (the “1940 Act”), approved the continuation of the Trusts’ advisory agreements (each, an “Advisory Agreement”) with Brighthouse Investment Advisers, LLC (the “Adviser”) and the applicablesub-advisory agreements (each a “Sub-Advisory Agreement,” and collectively with the Advisory Agreement, the “Agreements”) between the Adviser and the investmentsub-advisers (each a “Sub-Adviser,” and collectively, the “Sub-Advisers”) for the series of the Trusts (each a “Portfolio,” and collectively, the “Portfolios”).
In making those approvals, the Board reviewed a variety of materials that were provided for the specific purpose of the annual contract renewal process. In addition, various materials provided to and discussed with the Board throughout the year informed the Board’s decision to renew the Agreements. In particular, the information for each Portfolio included, but was not limited to, investment performance reports, and reports on expenses, legal and compliance matters, asset pricing, brokerage commissions and trade execution.
The Board met in person with personnel of the Adviser on October 17, 2018 for the specific purpose of giving preliminary consideration to the proposed continuation of the Agreements (the “October Meeting”). At that meeting, the Adviser reviewed with the Board the performance and fees experienced by each Portfolio, as well as other information. During and after the October Meeting, the Independent Trustees communicatedfollow-up matters for management to address at the November Meeting. The Independent Trustees were advised by independent legal counsel throughout the contract renewal process, and met with independent legal counsel in several executive sessions outside of the presence of management.
Information furnished and reviewed specifically in connection with the renewal process included, but was not limited to, a report for each Portfolio that was prepared by Broadridge (“Broadridge”), an independent organization. In addition, the Independent Trustees reviewed a report that was prepared by JDL Consultants, LLC (“JDL”), an independent consultant to the Independent Trustees (“JDL Report”), which examined the comparative fees, expenses and performance of each Portfolio, based upon the Broadridge reports. Also, the Board reviewed the responses to wide-ranging questions from the Independent Trustees relating to the business, operations and performance of the Adviser and theSub-Advisers that the Adviser andSub-Advisers had prepared specifically for the renewal process, and reviewed aPortfolio-by-Portfolio analysis of the profitability to the Adviser of each Advisory Agreement, which was prepared by the Adviser for the renewal process.
At the November Meeting, the Board, including a majority of the Independent Trustees, concluded that the nature, extent and quality of services provided by the Adviser and eachSub-Adviser supported the renewal of the Agreements. The Board also concluded that the investment performance of each Portfolio was such that each Agreement should continue, and that the fees paid by each Portfolio to the Adviser appeared to be reasonable in light of the nature, extent and quality of the services provided by the Adviser andSub-Adviser. Further, the Board concluded that the Adviser’s profitability in providing services under the Advisory Agreements did not appear unreasonable in light of the nature, extent and quality of the services provided by the Adviser. Finally, the Board reviewed the extent to which the investment advisory fees paid by the Portfolios shared economies of scale with investors or entailed the potential to share economies of scale with investors and concluded that those considerations generally supported the renewal of each Agreement. In approving the renewal of each of the Agreements, the Board, including the Independent Trustees, gave attention to all of the information that was furnished and each Trustee placed varying degrees of importance on the various pieces of information that were provided to them. The Board evaluated the information available to it on aPortfolio-by-Portfolio basis, and its decision was made separately with respect to each Portfolio. The following paragraphs provide more information about some of the primary factors that were relevant to the Board’s decision. The Board did not identify any single factor as determinative, and the Trustees generally attributed different weights to various factors for the various Portfolios.
Nature, extent and quality of services. The Board evaluated the nature, extent and quality of the services that the Adviser and theSub-Advisers, as relevant, have provided to the Portfolios. The Board considered the Adviser’s services as investment manager to the Portfolios, including its services relating to the hiring and oversight of theSub-Advisers, trading practices and oversight of transition management (as applicable), compliance programs and personnel, and risk management, among other things. The Adviser’s services in coordinating and overseeing the activities of the Trusts’ other service providers were also considered. The Board considered information received from the Trusts’ Chief Compliance Officer (“CCO”) regarding the Portfolios’ compliance policies and procedures that were established pursuant to Rule38a-l under the 1940 Act. The Board also noted that the Adviser’s investment, compliance and legal staff conduct regular and periodic telephonic andin-person meetings with theSub-Advisers to review and assess the services that are provided to the Portfolios, and that personnel of the Adviser prepare and present reports to the Independent Trustees regarding those meetings. In addition, throughout the year, the Board considered the expertise, experience and performance of the personnel of the Adviser who performed the various services that are mentioned above.
BHFTII-71
Brighthouse Funds Trust II
BlackRock Bond Income Portfolio
Board of Trustees’ Consideration of Advisory and Sub-Advisory Agreements—(Continued)
With respect to the services provided by each of theSub-Advisers, the Board considered a variety of information that the Adviser and eachSub-Adviser prepared for the Board’s review. The Board considered eachSub-Adviser’s investment process and philosophy, and the investment performance experienced by the Portfolio (as described in more detail below). The Board took into account that eachSub-Adviser’s responsibilities include the development and maintenance of an investment program for the applicable Portfolio that is consistent with the Portfolio’s investment objectives, the selection of investment securities and the placement of orders for the purchase and sale of such securities, as well as the implementation of compliance controls related to performance of these services. In particular, the Board considered, among other things, theSub-Adviser’s current level of staffing as well as its compensation program and its overall resources. The Board reviewed eachSub-Adviser’s history and investment experience, as well as information provided regarding the qualifications, background and responsibilities of theSub-Adviser’s investment and compliance personnel who provide services to the Portfolios. The Board also considered, among other things, eachSub-Adviser’s compliance program and regulatory and disciplinary history. In its review, the Board also took into account information regarding any services and/or payments provided to the Adviser by theSub-Advisers in connection with marketing activities and considered representations from the Adviser that those payments were not considered in the Adviser’s recommendation to renew any of theSub-Advisory Agreements.
Performance. The Board placed emphasis on the performance of each Portfolio in light of, among other things, its importance to investors. The Board considered the Adviser’s quarterly reviews with the Board of detailed information about each Portfolio’s investment strategies and performance results and composition, including discussions regarding the relevant effect of current market conditions. The Board reviewed and considered the reports prepared by Broadridge, which provided a statistical analysis comparing the Portfolios’ investment performance to that of comparable funds underlying variable insurance products (the “Performance Universe”). The Independent Trustees also met separately with representatives of JDL during the October Meeting to review the JDL Report. The Board also compared the performance records of the Portfolios to those of comparable funds and other accounts that were managed by the relevantSub-Adviser, to the extent such information was available. The Board considered each Portfolio’s performance for periods subsequent to the performance period covered by the Broadridge reports, and the Adviser’s discussion of the same, including the effect of current market conditions on each Portfolio’s more recent performance. The Board also noted that while it found the data provided by Broadridge generally useful, it recognized the limitations of such data, including, in particular, that notable differences may exist between a Portfolio and those of the other funds in a Broadridge category (for example, the investment objectives(s) and investment strategies) and that the results of the performance comparisons may vary depending on (i) the end dates for the performance periods that were selected and (ii) the selection of the peer groups.
The Board focused particular attention on Portfolios with less favorable performance records. The Board noted the Adviser’s focus on eachSub-Adviser’s performance and that the Adviser has been active in monitoring and responding to any performance issues with respect to the Portfolios.
Fees and Expenses. The Board gave consideration to the level and method of computing the fees payable under the Agreements. The Board considered the Broadridge report for each of the Portfolios, which included comparisons for each Portfolio of its contractual management andsub-adviser fees (at current and various asset levels), and total expenses, with those of its peers, including as those peers were divided into a broad group of peer funds (“Expense Universe”), a narrower group of peer funds (“Expense Group”), a broad group of peersub-advised funds (“Sub-advised Expense Universe”), and a narrower group of peersub-advised funds (“Sub-advised Expense Group”). Broadridge selected the peer funds which were similarly situated funds underlying variable insurance products deemed to be comparable to the Portfolios. The Independent Trustees, with the assistance of JDL, also examined the JDL Report. The Board compared the fee payable to aSub-Adviser by the Adviser with respect to the Portfolio to the fee payable to theSub-Adviser by other comparable funds and other accounts, to the extent such information was available.
The Board noted that thesub-advisory fees for the Portfolios are paid by the Adviser out of the advisory fees, and that the Adviser negotiates the fees at arm’s length. The Board also considered that the Adviser had entered into expense limitation or management fee waiver agreements with certain of the Portfolios pursuant to which the Adviser had agreed to waive a portion of its advisory fee and/or reimburse certain expenses as a means of limiting a Portfolio’s total annual operating expenses.
Profitability. The Board examined the profitability to the Adviser of each Advisory Agreement, on aPortfolio-by-Portfolio basis. The Board also considered that an affiliate of the Adviser, Brighthouse Securities, LLC, serves as distributor for the Trusts, and, as such, receives Rule12b-1 payments to support the distribution of the Portfolios. The Board considered the profitability to theSub-Advisers and their affiliates as a result of their relationships with the Portfolios, to the extent available, and the Board considered the ability of the Adviser to negotiate with aSub-Adviser at arm’s length. In reviewing the profitability analyses, the Board recognized that expense allocation methodologies are inherently subjective and various expense allocation methodologies may be reasonable while producing different results.
BHFTII-72
Brighthouse Funds Trust II
BlackRock Bond Income Portfolio
Board of Trustees’ Consideration of Advisory and Sub-Advisory Agreements—(Continued)
Economies of scale. The Board also considered each Portfolio’s fees in light of its size. The Board noted the fee schedules for the Portfolios that contain breakpoints that reduce the fee rate above specified asset levels. The Board noted those Portfolios that did not have breakpoints in their advisory fee and took into account management’s discussion of the same. The Board noted that those Portfolios with Advisory Agreements containing breakpoints generally have breakpoints in the correspondingSub-Advisory Agreement. The Board considered the effective fees under the Advisory Agreement andSub-Advisory Agreement for each Portfolio as a percentage of assets at different asset levels and possible economies of scale that may be realized if the assets of the Portfolio grow. The Board examined, among other data, the effect of a Portfolio’s growth in size, and reduction in size, on various fee schedules and the Board reviewed the Broadridge and JDL Reports, which compared fees among peers. The Board also generally noted that if a Portfolio’s assets increase over time, the Portfolio may realize other economies of scale if assets increase proportionally more than certain other fixed expenses.
Other factors. The Board considered other benefits that may be realized by the Adviser and its affiliates from their relationship with the Trusts. Among them, the Board recognized that Brighthouse Securities, LLC, as the distributor for the Trusts, receives payments pursuant to Rule12b-1 from the Portfolios to compensate for the provision of shareholder services and distribution activities, which could lead to growth in the Trusts’ assets and corresponding benefits from such growth, including economies of scale. The Board considered other benefits that may be realized by eachSub-Adviser and its affiliates from their relationship with the Trusts, including the opportunity to provide advisory services to additional portfolios of the Trusts and reputational benefits. In conjunction with these considerations, the Board noted the ongoing commitment of the Adviser to the Portfolios.
The Board requested, received, and considered information from the Adviser regarding possible conflicts of interest in the form of material benefits to the Adviser resulting from the Adviser’s affiliations and business relationships, as relevant. The Board considered the services that are provided to the Trusts by its service providers, and the manner in which any conflicts were mitigated.
* * *
BlackRock Bond Income Portfolio. The Board also considered the following information in relation to the Agreements with the Adviser and BlackRock Advisors, LLC regarding the Portfolio:
Among other data relating specifically to the Portfolio’s performance, the Board considered that the Portfolio outperformed the median of its Performance Universe and the average of its Morningstar Category for theone-, three-, and five- year periods ended June 30, 2018. The Board further considered that the Portfolio outperformed its benchmark, the Bloomberg Barclays U.S. Aggregate Bond Index, for the three- and five-year periods ended September 30, 2018, and underperformed its benchmark index for theone-year period ended September 30, 2018.
The Board also considered that the Portfolio’s actual management fees and total expenses (exclusive of12b-l fees) were below the Expense Group median, the Expense Universe median, and theSub-advised Expense Universe median, and were the lowest in theSub-advised Expense Universe. The Board noted that the Portfolio’s contractual management fees were below the asset-weighted average of comparable funds selected by Broadridge at the Portfolio’s current size. The Board also noted that the Portfolio’s contractualsub-advisory fees were below the averages of theSub-advised Expense Group and theSub-advised Expense Universe at the Portfolio’s current size.
BHFTII-73
Brighthouse Funds Trust II
BlackRock Capital Appreciation Portfolio
Managed by BlackRock Advisors, LLC
Portfolio Manager Commentary*
PERFORMANCE
For the 12 months ended December 31, 2018, the Class A, B, and E shares of the BlackRock Capital Appreciation Portfolio returned 2.43%, 2.18%, and 2.26%, respectively. The Portfolio’s benchmark, the Russell 1000 Growth Index1, returned-1.51%.
MARKET ENVIRONMENT / CONDITIONS
Global markets had a difficult year with global stocks, crude oil, and U.S. Treasuries all having their worst performance in multiple years. The year began with optimism but concerns of overheating set in and markets responded with the S&P 500 Index experiencing a steep correction and the VIX (a common measure of volatility) rising above 50. Market attention then shifted from domestic to international issues including the U.S. trade negotiations, the accelerating U.S. dollar putting pressure on emerging markets, European growth taking an unexpected downward turn as Eurozone PMIs (purchasing managers index) began to slide, and minimal progress being made on Brexit (the U.K.’s plan to leave the European Union). The year ended turbulently with the S&P 500 Index experiencing another steep correction. The initial selling pressure was driven by hedge funds, but real money later joined. Oil was also impacted, pushing Brent oil prices to 2017 lows. Finally, the Federal Reserve’s fourth rate hike of the year was poorly received. The S&P 500 Index ended the year with P/E multiplesde-rating by almost 23%.
PORTFOLIO REVIEW /PERIOD-END POSITIONING
The Portfolio outperformed the Russell 1000 Growth Index during the12-month period.
On a sector basis, the largest contributor to relative performance was Consumer Discretionary where internet & direct marketing retail holdings had the most positive impact. Selection in hotels, restaurants & leisure and a lack of exposure to media also added value within the sector. Health Care and Industrials were additional sources of strength. Equipment & supplies and life sciences tools & services holdings drove gains in Health Care, while positioning to machinery and zero exposure to air freight & logistics benefited in Industrials. Conversely, Communication Services detracted from performance with entertainment holdings hindering results. Consumer Staples and Materials also weighed on performance. Selection in beverages was a drag in Consumer Staples, while positioning to construction materials was a weakness within Materials.
In stock specifics, the top individual contributors were Amazon.com, Inc. and Netflix, Inc. Amazon outperformed as the company delivered a series of strong earnings reports, with revenue acceleration in North America, International, Prime, Amazon Web Services (“AWS”), and advertising. In addition, especially notable has been Amazon’s operating margin expansion, driven by advertising, subscription services, AWS, and shipping efficiencies. Our view remained that Amazon has many years of profitable growth ahead and, accordingly, we maintained the Portfolio’s overweight position. Netflix continued to outperform after a series of strong earnings reports. The company exceeded 23 million global net subscriber additions for 2017 and is on pace to exceed 28 million in 2018, ahead of our forecasts. Overall, our thesis is playing out as the flywheel of content and subscriber additions is benefiting Netflix as it gains scale. At year end, we continued to believe the stock was far from pricing in the company’s long-term growth and profitability potential.
The top detractors over the annual period were Tencent Holdings, Ltd. and Constellation Brands, Inc. Tencent underperformed amid U.S./China trade tensions, weakness in the Chinese stock market, regulatory uncertainty, and questions around timing of game launches and monetization. In addition, data showed a modest decline in Tencent’s share of mobile user time spent. Our view remained bullish as the company still dominates mobile time spent in China, enabling it to monetize along multiple channels, including gaming, advertising, payments, ande-commerce among others. Constellation has underperformed as investors fear that Mexican import beer decelerates along with beer profit margin growth and reinvestment risk in Canopy Growth. Constellation announced a $4 billion investment in Canopy Growth during the second quarter. At year end, we expected Constellation’s core fundamentals to stay on track, including high single digit volume growth for beer and continued beer margin expansion and remained positive on the Canopy investment.
The largest sector overweight in the Portfolio atyear-end was Health Care, followed by Communication Services. Industrials and Consumer Staples were the largest underweights.
Lawrence Kemp
Portfolio Manager
BlackRock Advisors, LLC
* This commentary may include statements that constitute “forward-looking statements” under the U.S. securities laws. Forward-looking statements include, among other things, projections, estimates, and information about possible or future results related to the Portfolio, market or regulatory developments. The views expressed above are not guarantees of future performance or economic results and involve certain risks, uncertainties and assumptions that could cause actual outcomes and results to differ materially from the views expressed herein. The views expressed above are subject to change at any time based upon economic, market, or other conditions and the subadvisory firm undertakes no obligation to update the views expressed herein. Any discussions of specific securities should not be considered a recommendation to buy or sell those securities. The views expressed above (including any forward-looking statement) may not be relied upon as investment advice or as an indication of the Portfolio’s trading intent. Information about the Portfolio’s holdings, asset allocation or country diversification is historical and is not an indication of future Portfolio composition, which may vary. Direct investment in any index is not possible. The performance of any index mentioned in this commentary has not been adjusted for ongoing management, distribution and operating expenses, and sales charges applicable to mutual fund investments. In addition, the returns do not reflect additional fees charged by separate accounts or variable insurance contracts that an investor in the Portfolio may pay. If these additional fees were reflected, performance would have been lower.
BHFTII-1
Brighthouse Funds Trust II
BlackRock Capital Appreciation Portfolio
A $10,000 INVESTMENT COMPARED TO THE RUSSELL 1000 GROWTH INDEX
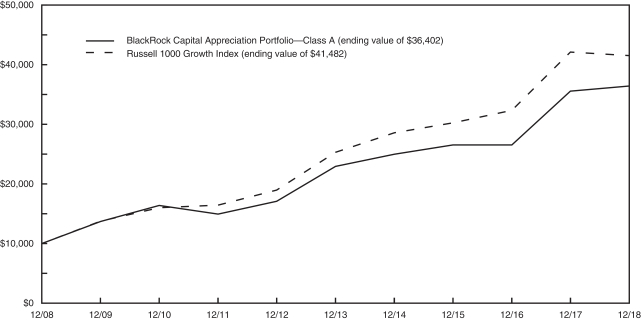
AVERAGE ANNUAL RETURNS (%) (FOR THE YEAR ENDED DECEMBER 31, 2018)
| | | | | | | | | | | | |
| | | | |
| | | 1 Year | | | 5 Year | | | 10 Year | |
| BlackRock Capital Appreciation Portfolio | | | | | | | | | | | | |
Class A | | | 2.43 | | | | 9.70 | | | | 13.79 | |
Class B | | | 2.18 | | | | 9.43 | | | | 13.51 | |
Class E | | | 2.26 | | | | 9.54 | | | | 13.63 | |
| Russell 1000 Growth Index | | | -1.51 | | | | 10.41 | | | | 15.29 | |
1 The Russell 1000 Growth Index is an unmanaged measure of performance of the largest capitalized U.S. companies, within the Russell 1000 companies, that have higher price-to-book ratios and forecasted growth values.
Portfolio performance is calculated including reinvestment of all income and capital gain distributions. Performance numbers are net of all Portfolio expenses but do not include any insurance, sales, separate account or administrative charges of variable annuity or life insurance contracts or any additional expenses that participants may bear relating to the operations of their plans. If these charges were included, the returns would be lower. The performance of any index referenced above has not been adjusted for ongoing management, distribution and operating expenses, and sales charges applicable to mutual fund investments. Direct investment in any index is not possible. The performance of Class A shares, as set forth in the line graph above, will differ from that of other classes because of the difference in expenses paid by policyholders investing in the different share classes.
This information represents past performance and is not indicative of future results. Investment return and principal value may fluctuate so that shares, upon redemption, may be worth more or less than the original cost.
PORTFOLIO COMPOSITION AS OF DECEMBER 31, 2018
Top Holdings
| | | | |
| | | % of
Net Assets | |
| Amazon.com, Inc. | | | 8.9 | |
| Microsoft Corp. | | | 6.4 | |
| Visa, Inc. - Class A | | | 5.3 | |
| Alphabet, Inc. - Class A | | | 4.1 | |
| UnitedHealth Group, Inc. | | | 3.9 | |
| MasterCard, Inc. - Class A | | | 3.4 | |
| Salesforce.com, Inc. | | | 3.0 | |
| Netflix, Inc. | | | 2.8 | |
| Tencent Holdings, Ltd. | | | 2.7 | |
| Booking Holdings, Inc. | | | 2.6 | |
Top Sectors
| | | | |
| | | % of
Net Assets | |
| Information Technology | | | 32.2 | |
| Health Care | | | 19.0 | |
| Consumer Discretionary | | | 15.9 | |
| Communication Services | | | 14.8 | |
| Industrials | | | 5.8 | |
| Financials | | | 5.2 | |
| Consumer Staples | | | 1.8 | |
| Real Estate | | | 1.7 | |
| Materials | | | 1.5 | |
BHFTII-2
Brighthouse Funds Trust II
BlackRock Capital Appreciation Portfolio
Understanding Your Portfolio’s Expenses
Shareholder Expense Example
As a shareholder of the Portfolio, you incur ongoing costs, including management fees; distribution and service(12b-1) fees; and other Portfolio expenses. This example is intended to help you understand your ongoing costs (in dollars) (referred to as “expenses”) of investing in the Portfolio and compare these costs with the ongoing costs of investing in other mutual funds. The example is based on an investment of $1,000 invested at the beginning of the period and held for the entire period, July 1, 2018 through December 31, 2018.
Actual Expenses
The first line for each share class of the Portfolio in the table below provides information about actual account values and actual expenses. You may use the information in this line, together with the amount you invested in the particular share class of the Portfolio, to estimate the expenses that you paid over the period. Simply divide your account value by $1,000 (for example, an $8,600 account value divided by $1,000 = 8.6), then multiply the result by the number in the first line under the heading entitled “Expenses Paid During Period” to estimate the expenses you paid on your account during this period.
Hypothetical Example for Comparison Purposes
The second line for each share class of the Portfolio in the table below provides information about hypothetical account values and hypothetical expenses based on the Portfolio’s actual expense ratio and an assumed rate of return of 5% per year before expenses, which is not the Portfolio’s actual return. The hypothetical account values and expenses may not be used to estimate the actual ending account balance or expenses you paid for the period. You may use this information to compare the ongoing costs of investing in the Portfolio and other funds. To do so, compare this 5% hypothetical example with the 5% hypothetical examples that appear in the shareholder reports of the other funds.
Please note that the expenses shown in the table are meant to highlight your ongoing costs only and do not reflect any fees or charges of your variable insurance product or any additional expenses that participants in certain eligible qualified plans may bear relating to the operations of their plan. Therefore, the second line for each share class in the table is useful in comparing ongoing costs only, and will not help you determine the relative total costs of owning different funds. In addition, if these other costs were included, your costs would have been higher.
| | | | | | | | | | | | | | | | | | |
BlackRock Capital Appreciation Portfolio
| | | | Annualized
Expense
Ratio | | | Beginning
Account Value
July 1,
2018 | | | Ending
Account Value
December 31,
2018 | | | Expenses Paid
During Period**
July 1, 2018
to
December 31,
2018 | |
Class A (a) | | Actual | | | 0.63 | % | | $ | 1,000.00 | | | $ | 895.10 | | | $ | 3.01 | |
| | Hypothetical* | | | 0.63 | % | | $ | 1,000.00 | | | $ | 1,022.03 | | | $ | 3.21 | |
| | | | | |
Class B (a) | | Actual | | | 0.88 | % | | $ | 1,000.00 | | | $ | 894.00 | | | $ | 4.20 | |
| | Hypothetical* | | | 0.88 | % | | $ | 1,000.00 | | | $ | 1,020.77 | | | $ | 4.48 | |
| | | | | |
Class E (a) | | Actual | | | 0.78 | % | | $ | 1,000.00 | | | $ | 894.50 | | | $ | 3.72 | |
| | Hypothetical* | | | 0.78 | % | | $ | 1,000.00 | | | $ | 1,021.27 | | | $ | 3.97 | |
| * | Hypothetical assumes a rate of return of 5% per year before expenses. |
| ** | Expenses paid are equal to the Portfolio’s annualized expense ratio for the most recent six month period, as shown above, multiplied by the average account value over the period, multiplied by the number of days (184 days) in the most recent fiscal half-year, divided by 365 (to reflect theone-half year period). |
| (a) | The annualized expense ratio shown reflects the impact of the management fee waiver as described in Note 5 of the Notes to Financial Statements. |
BHFTII-3
Brighthouse Funds Trust II
BlackRock Capital Appreciation Portfolio
Schedule of Investments as of December 31, 2018
Common Stocks—97.2% of Net Assets
| | | | | | | | |
| Security Description | | Shares | | | Value | |
|
| Automobiles—0.8% | |
Tesla, Inc. (a) (b) | | | 35,143 | | | $ | 11,695,590 | |
| | | | | | | | |
|
| Banks—0.6% | |
First Republic Bank (a) | | | 100,741 | | | | 8,754,393 | |
| | | | | | | | |
|
| Beverages—1.8% | |
Constellation Brands, Inc. - Class A | | | 169,772 | | | | 27,302,733 | |
| | | | | | | | |
|
| Biotechnology—1.7% | |
BioMarin Pharmaceutical, Inc. (b) | | | 76,544 | | | | 6,517,722 | |
Vertex Pharmaceuticals, Inc. (b) | | | 120,454 | | | | 19,960,432 | |
| | | | | | | | |
| | | | | | | 26,478,154 | |
| | | | | | | | |
|
| Capital Markets—3.4% | |
CME Group, Inc. (a) | | | 121,940 | | | | 22,939,353 | |
S&P Global, Inc. | | | 172,506 | | | | 29,315,670 | |
| | | | | | | | |
| | | | | | | 52,255,023 | |
| | | | | | | | |
|
| Chemicals—1.5% | |
Sherwin-Williams Co. (The) (a) | | | 59,694 | | | | 23,487,201 | |
| | | | | | | | |
|
| Diversified Financial Services—1.2% | |
Berkshire Hathaway, Inc. - Class B (a) (b) | | | 92,141 | | | | 18,813,349 | |
| | | | | | | | |
|
| Entertainment—5.4% | |
Activision Blizzard, Inc. (a) | | | 259,699 | | | | 12,094,183 | |
Electronic Arts, Inc. (b) | | | 352,191 | | | | 27,791,392 | |
Netflix, Inc. (a) (b) | | | 161,608 | | | | 43,255,997 | |
| | | | | | | | |
| | | | | | | 83,141,572 | |
| | | | | | | | |
|
| Equity Real Estate Investment Trusts—1.7% | |
SBA Communications Corp. (b) | | | 164,820 | | | | 26,682,710 | |
| | | | | | | | |
|
| Health Care Equipment & Supplies—7.6% | |
Align Technology, Inc. (a) (b) | | | 112,386 | | | | 23,537,000 | |
Becton Dickinson & Co. (a) | | | 145,994 | | | | 32,895,368 | |
Boston Scientific Corp. (b) | | | 1,006,800 | | | | 35,580,312 | |
Intuitive Surgical, Inc. (a) (b) | | | 52,788 | | | | 25,281,229 | |
| | | | | | | | |
| | | | | | | 117,293,909 | |
| | | | | | | | |
|
| Health Care Providers & Services—5.4% | |
Centene Corp. (b) | | | 187,596 | | | | 21,629,819 | |
UnitedHealth Group, Inc. | | | 242,906 | | | | 60,512,743 | |
| | | | | | | | |
| | | | | | | 82,142,562 | |
| | | | | | | | |
|
| Hotels, Restaurants & Leisure—1.0% | |
Domino’s Pizza, Inc. (a) | | | 62,798 | | | | 15,573,276 | |
| | | | | | | | |
|
| Industrial Conglomerates—1.0% | |
Roper Technologies, Inc. | | | 58,041 | | | | 15,469,087 | |
| | | | | | | | |
|
| Interactive Media & Services—9.4% | |
Alphabet, Inc. - Class A (b) | | | 59,677 | | | | 62,360,078 | |
Facebook, Inc. - Class A (b) | | | 203,840 | | | | 26,721,385 | |
IAC/InterActiveCorp (b) | | | 73,140 | | | | 13,387,546 | |
|
| Interactive Media & Services—(Continued) | |
Tencent Holdings, Ltd. | | | 1,059,900 | | | | 42,013,404 | |
| | | | | | | | |
| | | | | | | 144,482,413 | |
| | | | | | | | |
|
| Internet & Direct Marketing Retail—13.1% | |
Amazon.com, Inc. (b) | | | 91,081 | | | | 136,800,929 | |
Booking Holdings, Inc. (b) | | | 22,990 | | | | 39,598,436 | |
MercadoLibre, Inc. (a) | | | 83,913 | | | | 24,573,922 | |
| | | | | | | | |
| | | | | | | 200,973,287 | |
| | | | | | | | |
|
| IT Services—10.4% | |
MasterCard, Inc. - Class A | | | 273,414 | | | | 51,579,551 | |
PayPal Holdings, Inc. (b) | | | 331,867 | | | | 27,906,696 | |
Visa, Inc. - Class A | | | 613,645 | | | | 80,964,322 | |
| | | | | | | | |
| | | | | | | 160,450,569 | |
| | | | | | | | |
|
| Life Sciences Tools & Services—1.7% | |
Illumina, Inc. (b) | | | 86,666 | | | | 25,993,733 | |
| | | | | | | | |
|
| Machinery—0.9% | |
Xylem, Inc. | | | 215,550 | | | | 14,381,496 | |
| | | | | | | | |
|
| Pharmaceuticals—2.6% | |
Novartis AG (ADR) | | | 296,333 | | | | 25,428,335 | |
Zoetis, Inc. | | | 170,410 | | | | 14,576,871 | |
| | | | | | | | |
| | | | | | | 40,005,206 | |
| | | | | | | | |
|
| Professional Services—2.2% | |
CoStar Group, Inc. (a) (b) | | | 101,492 | | | | 34,237,311 | |
| | | | | | | | |
|
| Road & Rail—1.6% | |
Union Pacific Corp. | | | 180,485 | | | | 24,948,442 | |
| | | | | | | | |
|
| Semiconductors & Semiconductor Equipment—3.0% | |
ASML Holding NV (a) | | | 180,657 | | | | 28,113,842 | |
NVIDIA Corp. | | | 134,912 | | | | 18,010,752 | |
| | | | | | | | |
| | | | | | | 46,124,594 | |
| | | | | | | | |
|
| Software—17.2% | |
Adobe, Inc. (b) | | | 168,850 | | | | 38,200,624 | |
Autodesk, Inc. (b) | | | 181,277 | | | | 23,314,035 | |
Intuit, Inc. | | | 179,626 | | | | 35,359,378 | |
Microsoft Corp. | | | 974,382 | | | | 98,967,980 | |
Salesforce.com, Inc. (a) (b) | | | 338,106 | | | | 46,310,379 | |
ServiceNow, Inc. (a) (b) | | | 129,870 | | | | 23,123,353 | |
| | | | | | | | |
| | | | | | | 265,275,749 | |
| | | | | | | | |
|
| Technology Hardware, Storage & Peripherals—0.9% | |
Apple, Inc. | | | 86,576 | | | | 13,656,498 | |
| | | | | | | | |
|
| Textiles, Apparel & Luxury Goods—1.1% | |
NIKE, Inc. - Class B | | | 235,619 | | | | 17,468,793 | |
| | | | | | | | |
Total Common Stocks
(Cost $1,186,269,287) | | | | | | | 1,497,087,650 | |
| | | | | | | | |
See accompanying notes to financial statements.
BHFTII-4
Brighthouse Funds Trust II
BlackRock Capital Appreciation Portfolio
Schedule of Investments as of December 31, 2018
Preferred Stock—0.7%
| | | | | | | | |
| Security Description | | Shares/
Principal
Amount* | | | Value | |
|
| Software—0.7% | |
Palantir Technologies, Inc. -
Series I, (b) (c) (d) (e)
(Cost $15,555,193) | | | 2,537,552 | | | $ | 10,606,968 | |
| | | | | | | | |
|
| Short-Term Investment—2.5% | |
|
| Repurchase Agreement—2.5% | |
Fixed Income Clearing Corp.
Repurchase Agreement dated 12/31/18 at 1.200%, due on 01/02/19 with a maturity value of $38,912,981; collateralized by U.S. Treasury Note at 2.250%, maturing 01/31/24, with a market value of $39,691,669. | | | 38,910,387 | | | | 38,910,387 | |
| | | | | | | | |
Total Short-Term Investments
(Cost $38,910,387) | | | | | | | 38,910,387 | |
| | | | | | | | |
|
| Securities Lending Reinvestments (f)—12.4% | |
|
| Certificates of Deposit—5.8% | |
Banco Del Estado De Chile New York
2.720%, 1M LIBOR + 0.250%, 03/20/19 (g) | | | 3,000,000 | | | | 2,999,742 | |
Bank of Montreal (Chicago)
2.710%, 1M LIBOR + 0.330%, 08/06/19 (g) | | | 2,000,000 | | | | 1,999,950 | |
Bank of Nova Scotia
2.890%, SOFR + 0.430%, 05/16/19 (g) | | | 5,000,000 | | | | 4,999,996 | |
3.072%, 3M LIBOR + 0.280%, 03/20/19 (g) | | | 2,000,000 | | | | 2,000,798 | |
Barclays Bank plc
2.500%, 02/01/19 | | | 1,000,000 | | | | 999,871 | |
2.547%, 1M LIBOR + 0.200%, 02/04/19 (g) | | | 2,500,000 | | | | 2,499,762 | |
Canadian Imperial Bank of Commerce
2.556%, 3M LIBOR + 0.120%, 01/14/19 (g) | | | 1,000,000 | | | | 999,872 | |
2.740%, 1M LIBOR + 0.270%, 07/19/19 (g) | | | 2,000,000 | | | | 1,999,188 | |
China Construction Bank Corp.
2.550%, 01/07/19 | | | 2,000,000 | | | | 2,000,000 | |
Citibank N.A.
2.490%, 02/04/19 | | | 2,000,000 | | | | 1,999,722 | |
Commonwealth Bank of Australia
2.617%, 3M LIBOR + 0.140%, 04/23/19 (g) | | | 1,500,000 | | | | 1,500,005 | |
2.642%, 1M LIBOR + 0.210%, 09/13/19 (g) | | | 2,000,000 | | | | 2,000,000 | |
Credit Agricole S.A.
2.500%, 02/12/19 | | | 5,000,000 | | | | 4,999,150 | |
2.799%, 1M LIBOR + 0.320%, 05/21/19 (g) | | | 3,000,000 | | | | 3,000,189 | |
Credit Industriel et Commercial
Zero Coupon, 01/25/19 | | | 4,393,165 | | | | 4,442,435 | |
Credit Suisse AG
2.620%, 04/01/19 | | | 6,000,000 | | | | 5,996,892 | |
Industrial & Commercial Bank of China, Ltd.
2.850%, 02/15/19 | | | 3,000,000 | | | | 2,999,778 | |
MUFG Bank Ltd.
2.649%, 1M LIBOR + 0.300%, 05/01/19 (g) | | | 3,000,000 | | | | 3,000,018 | |
Natixis New York
2.705%, 3M LIBOR + 0.090%, 05/10/19 (g) | | | 1,000,000 | | | | 999,370 | |
Skandinaviska Enskilda Banken
| |
2.645%, 1M LIBOR + 0.190%, 04/17/19 (g) | | | 5,000,000 | | | | 4,999,590 | |
|
| Certificates of Deposit—(Continued) | |
Societe Generale
2.719%, 3M LIBOR + 0.160%, 05/07/19 (g) | | | 2,000,000 | | | $ | 1,999,112 | |
Standard Chartered plc
2.686%, 1M LIBOR + 0.180%, 02/25/19 (g) | | | 6,000,000 | | | | 5,999,826 | |
State Street Bank and Trust
2.725%, 1M LIBOR + 0.270%, 05/15/19 (g) | | | 5,000,000 | | | | 4,999,900 | |
Sumitomo Mitsui Banking Corp.
2.590%, 1M LIBOR + 0.190%, 04/11/19 (g) | | | 2,000,000 | | | | 1,999,266 | |
2.700%, 02/25/19 | | | 2,000,000 | | | | 2,000,184 | |
Svenska Handelsbanken AB
2.620%, 3M LIBOR + 0.100%, 04/30/19 (g) | | | 4,000,000 | | | | 3,999,820 | |
2.822%, 1M LIBOR + 0.300%, 10/31/19 (g) | | | 2,000,000 | | | | 1,999,532 | |
U.S. Bank N.A.
2.764%, 1M LIBOR + 0.260%, 07/23/19 (g) | | | 1,000,000 | | | | 1,000,000 | |
| Wells Fargo Bank N.A. | |
2.560%, 3M LIBOR + 0.140%, 07/11/19 (g) | | | 4,000,000 | | | | 4,003,470 | |
2.730%, 3M LIBOR + 0.210%, 10/25/19 (g) | | | 2,000,000 | | | | 2,000,000 | |
Westpac Banking Corp.
2.850%, FEDEFF PRV + 0.450%, 02/15/19 (g) | | | 3,000,000 | | | | 2,999,981 | |
| | | | | | | | |
| | | | | | | 89,437,419 | |
| | | | | | | | |
|
| Commercial Paper—1.5% | |
Alpine Securities Ltd.
2.529%, 1M LIBOR + 0.180%, 04/03/19 (g) | | | 2,000,000 | | | | 1,999,446 | |
Banco Santander S.A.
2.500%, 01/16/19 | | | 3,974,444 | | | | 3,995,184 | |
2.740%, 02/07/19 | | | 2,978,993 | | | | 2,991,264 | |
ING Funding LLC
2.707%, 1M LIBOR + 0.320%, 02/08/19 (g) | | | 4,000,000 | | | | 4,000,372 | |
Sheffield Receivables Co.
2.930%, SOFR + 0.470%, 05/30/19 (g) | | | 2,000,000 | | | | 1,999,968 | |
UBS AG
2.779%, 1M LIBOR + 0.430%, 02/01/19 (g) | | | 5,000,000 | | | | 5,001,225 | |
Westpac Banking Corp.
2.784%, 1M LIBOR + 0.280%, 05/24/19 (g) | | | 3,000,000 | | | | 2,999,880 | |
| | | | | | | | |
| | | | | | | 22,987,339 | |
| | | | | | | | |
|
| Repurchase Agreements—4.6% | |
Citadel Clearing LLC
Repurchase Agreement dated 12/31/18 at 3.000%, due on 04/02/19 with a maturity value of $7,557,500; collateralized by various Common Stock with an aggregate market value of $8,251,375. | | | 7,500,000 | | | | 7,500,000 | |
Citigroup Global Markets, Inc.
Repurchase Agreement dated 12/31/18 at 2.790%, due on 02/04/19 with a maturity value of $2,005,425; collateralized by U.S. Treasury Obligations at 0.000%, maturing 02/12/19, and various Common Stock with an aggregate market value of $2,176,637. | | | 2,000,000 | | | | 2,000,000 | |
Repurchase Agreement dated 12/31/18 at 2.940%, due on 04/02/19 with a maturity value of $100,751; collateralized by U.S. Treasury Obligations with rates ranging from 1.125% - 2.750%, maturity dates ranging from 01/31/19 - 08/15/24, and an aggregate market value of $102,000. | | | 100,000 | | | | 100,000 | |
See accompanying notes to financial statements.
BHFTII-5
Brighthouse Funds Trust II
BlackRock Capital Appreciation Portfolio
Schedule of Investments as of December 31, 2018
Securities Lending Reinvestments (f)—(Continued)
| | | | | | | | |
| Security Description | | Principal
Amount* | | | Value | |
|
| Repurchase Agreements—(Continued) | |
Citigroup Global Markets, Ltd.
Repurchase Agreement dated 12/31/18 at 2.490%, due on 01/02/19 with a maturity value of $600,083; collateralized by U.S. Treasury Obligations with rates ranging from 0.375% - 1.875%, maturity dates ranging from 12/15/20 - 01/15/27, and an aggregate market value of $612,000. | | | 600,000 | | | $ | 600,000 | |
Repurchase Agreement dated 12/31/18 at 2.490%, due on 01/02/19 with a maturity value of $900,125; collateralized by U.S. Treasury Obligations with rates ranging from 1.625% - 2.875%, maturity dates ranging from 06/30/20 - 11/15/46, and an aggregate market value of $918,000. | | | 900,000 | | | | 900,000 | |
Deutsche Bank AG, London
Repurchase Agreement dated 12/31/18 at 2.750%, due on 01/02/19 with a maturity value of $400,061; collateralized by U.S. Treasury and Foreign Obligations with rates ranging from 1.000% - 2.590%, maturity dates ranging from 03/31/19 - 12/29/26, and an aggregate market value of $408,000. | | | 400,000 | | | | 400,000 | |
Deutsche Bank Securities, Inc.
Repurchase Agreement dated 12/31/18 at 3.200%, due on 01/02/19 with a maturity value of $7,879,259; collateralized by U.S. Treasury Obligations at 0.000%, maturity dates ranging from 08/15/30 - 08/15/39, and an aggregate market value of $8,035,415. | | | 7,877,858 | | | | 7,877,858 | |
Merrill Lynch, Pierce, Fenner & Smith, Inc.
Repurchase Agreement dated 12/31/18 at 2.940%, due on 04/02/19 with a maturity value of $1,209,016; collateralized by various Common Stock with an aggregate market value of $1,320,000. | | | 1,200,000 | | | | 1,200,000 | |
Repurchase Agreement dated 12/31/18 at 2.940%, due on 04/02/19 with a maturity value of $7,052,593; collateralized by various Common Stock with an aggregate market value of $7,700,000. | | | 7,000,000 | | | | 7,000,000 | |
NBC Global Finance, Ltd.
Repurchase Agreement dated 12/31/18 at 2.560%, due on 01/02/19 with a maturity value of $1,400,199; collateralized by various Common Stock with an aggregate market value of $1,558,497. | | | 1,400,000 | | | | 1,400,000 | |
Repurchase Agreement dated 12/31/18 at 2.560%, due on 01/02/19 with a maturity value of $5,000,711; collateralized by various Common Stock with an aggregate market value of $5,566,061. | | | 5,000,000 | | | | 5,000,000 | |
Repurchase Agreement dated 12/31/18 at 2.560%, due on 01/02/19 with a maturity value of $4,800,683; collateralized by various Common Stock with an aggregate market value of $5,343,419. | | | 4,800,000 | | | | 4,800,000 | |
Societe Generale
Repurchase Agreement dated 12/31/18 at 2.530%, due on 01/02/19 with a maturity value of $5,000,703; collateralized by U.S. Treasury Obligations with rates ranging from 0.750% - 8.000%, maturity dates ranging from 09/30/19 - 08/15/46, and various Common Stock with an aggregate market value of $5,477,379. | | | 5,000,000 | | | | 5,000,000 | |
|
| Repurchase Agreements—(Continued) | |
Societe Generale
Repurchase Agreement dated 12/31/18 at 2.530%, due on 01/02/19 with a maturity value of $1,200,169; collateralized by U.S. Treasury Obligations with rates ranging from 0.750% - 8.000%, maturity dates ranging from 09/30/19 - 08/15/46, and various Common Stock with an aggregate market value of $1,314,571. | | | 1,200,000 | | | | 1,200,000 | |
Repurchase Agreement dated 12/31/18 at 2.530%, due on 01/02/19 with a maturity value of $10,001,406; collateralized by U.S. Treasury Obligations with rates ranging from 0.750% - 8.000%, maturity dates ranging from 09/30/19 - 08/15/46, and various Common Stock with an aggregate market value of $10,954,759. | | | 10,000,000 | | | | 10,000,000 | |
Repurchase Agreement dated 12/31/18 at 2.560%, due on 01/07/19 with a maturity value of $15,007,467; collateralized by U.S. Treasury Obligations with rates ranging from 0.750% - 8.000%, maturity dates ranging from 09/30/19 - 08/15/46, and various Common Stock with an aggregate market value of $16,432,138. | | | 15,000,000 | | | | 15,000,000 | |
| | | | | | | | |
| | | | | | | 69,977,858 | |
| | | | | | | | |
|
| Time Deposit—0.5% | |
Royal Bank of Canada
2.420%, 01/02/19 | | | 7,000,000 | | | | 7,000,000 | |
| | | | | | | | |
Total Securities Lending Reinvestments
(Cost $189,408,606) | | | | | | | 189,402,616 | |
| | | | | | | | |
Total Investments—112.8%
(Cost $1,430,143,473) | | | | | | | 1,736,007,621 | |
Other assets and liabilities (net)—(12.8)% | | | | | | | (196,333,563 | ) |
| | | | | | | | |
| Net Assets—100.0% | | | | | | $ | 1,539,674,058 | |
| | | | | | | | |
| |
| | | | |
| * | | Principal amount stated in U.S. dollars unless otherwise noted. |
| (a) | | All or a portion of the security was held on loan. As of December 31, 2018, the market value of securities loaned was $187,845,655 and the collateral received consisted of cash in the amount of $189,324,461. The cash collateral investments are disclosed in the Schedule of Investments and categorized as Securities Lending Reinvestments. |
| (b) | | Non-income producing security. |
| (c) | | Restricted securities are not registered under the Securities Act of 1933 and are subject to legal restrictions on resale. These securities generally may be resold in transactions exempt from registration or to the public if the securities are subsequently registered. Disposal of these securities may involve time-consuming negotiations and prompt sale at an acceptable price may be difficult. As of December 31, 2018, the market value of restricted securities was $10,606,968, which is 0.7% of net assets. See details shown in the Restricted Securities table that follows. |
| (d) | | Security was valued in good faith under procedures approved by the Board of Trustees. As of December 31, 2018, these securities represent 0.7% of net assets. |
| (e) | | Significant unobservable inputs were used in the valuation of this portfolio security; i.e. Level 3. |
| (f) | | Represents investment of cash collateral received from securities on loan as of December 31, 2018. |
See accompanying notes to financial statements.
BHFTII-6
Brighthouse Funds Trust II
BlackRock Capital Appreciation Portfolio
Schedule of Investments as of December 31, 2018
| | | | |
| (g) | | Variable or floating rate security. The stated rate represents the rate at December 31, 2018. Maturity date shown for callable securities reflects the earliest possible call date. For securities based on a published reference index and spread, the index and spread are indicated in the description above. For certain variable rate securities, the coupon rate is determined by the issuer/agent based on current market conditions. For certain asset- and mortgage-backed securities, the coupon rate may fluctuate based on changes of the underlying collateral or prepayments of principal. These securities do not indicate a reference index and spread in their description above. |
| (ADR)— | | American Depositary Receipt |
| (FEDEFF PRV)— | | Effective Federal Funds Rate |
| (LIBOR)— | | London Interbank Offered Rate |
| (SOFR)— | | Secured Overnight Financing Rate |
| | | | | | | | | | | | | | | | |
Restricted Securities | | Acquisition
Date | | | Shares | | | Cost | | | Value | |
Palantir Technologies, Inc.—Series I | | | 02/07/14 | | | | 2,537,552 | | | $ | 15,555,193 | | | $ | 10,606,968 | |
| | | | | | | | | | | | | | | | |
See accompanying notes to financial statements.
BHFTII-7
Brighthouse Funds Trust II
BlackRock Capital Appreciation Portfolio
Schedule of Investments as of December 31, 2018
Fair Value Hierarchy
Accounting principles generally accepted in the United States of America (“GAAP”) define fair market value as the price that the Portfolio would receive to sell an asset or pay to transfer a liability in an orderly transaction between market participants at the measurement date. It establishes a fair value hierarchy that prioritizes inputs to valuation methods and requires disclosure of the fair value hierarchy, separately for each major category of assets and liabilities, that segregates fair value measurements into three levels. Levels 1, 2 and 3 of the fair value hierarchy are defined as follows:
Level 1 - unadjusted quoted prices in active markets for identical investments
Level 2 - other significant observable inputs (including, but not limited to, quoted prices for similar assets or liabilities in markets that are either active or inactive; inputs other than quoted prices that are observable such as interest rates, yield curves, volatilities, prepayment speeds, loss severities, credit risks, default rates, or other market corroborated inputs)
Level 3 - significant unobservable inputs based on the best information available in the circumstances, to the extent observable inputs are unavailable (including the Portfolio’s own assumptions used in determining the fair value of investments and derivative financial instruments)
The inputs or methodologies used for valuing investments are not necessarily an indication of the risk associated with investing in them. Changes to the inputs or methodologies used may result in transfers between levels. A reconciliation of Level 3 securities, if any, will be disclosed following the fair value hierarchy table. For more information about the Portfolio’s policy regarding the valuation of investments, please refer to the Notes to Financial Statements.
The following table summarizes the fair value hierarchy of the Portfolio’s investments as of December 31, 2018:
| | | | | | | | | | | | | | | | |
| Description | | Level 1 | | | Level 2 | | | Level 3 | | | Total | |
| Common Stocks | |
Automobiles | | $ | 11,695,590 | | | $ | — | | | $ | — | | | $ | 11,695,590 | |
Banks | | | 8,754,393 | | | | — | | | | — | | | | 8,754,393 | |
Beverages | | | 27,302,733 | | | | — | | | | — | | | | 27,302,733 | |
Biotechnology | | | 26,478,154 | | | | — | | | | — | | | | 26,478,154 | |
Capital Markets | | | 52,255,023 | | | | — | | | | — | | | | 52,255,023 | |
Chemicals | | | 23,487,201 | | | | — | | | | — | | | | 23,487,201 | |
Diversified Financial Services | | | 18,813,349 | | | | — | | | | — | | | | 18,813,349 | |
Entertainment | | | 83,141,572 | | | | — | | | | — | | | | 83,141,572 | |
Equity Real Estate Investment Trusts | | | 26,682,710 | | | | — | | | | — | | | | 26,682,710 | |
Health Care Equipment & Supplies | | | 117,293,909 | | | | — | | | | — | | | | 117,293,909 | |
Health Care Providers & Services | | | 82,142,562 | | | | — | | | | — | | | | 82,142,562 | |
Hotels, Restaurants & Leisure | | | 15,573,276 | | | | — | | | | — | | | | 15,573,276 | |
Industrial Conglomerates | | | 15,469,087 | | | | — | | | | — | | | | 15,469,087 | |
Interactive Media & Services | | | 102,469,009 | | | | 42,013,404 | | | | — | | | | 144,482,413 | |
Internet & Direct Marketing Retail | | | 200,973,287 | | | | — | | | | — | | | | 200,973,287 | |
IT Services | | | 160,450,569 | | | | — | | | | — | | | | 160,450,569 | |
Life Sciences Tools & Services | | | 25,993,733 | | | | — | | | | — | | | | 25,993,733 | |
Machinery | | | 14,381,496 | | | | — | | | | — | | | | 14,381,496 | |
Pharmaceuticals | | | 40,005,206 | | | | — | | | | — | | | | 40,005,206 | |
Professional Services | | | 34,237,311 | | | | — | | | | — | | | | 34,237,311 | |
Road & Rail | | | 24,948,442 | | | | — | | | | — | | | | 24,948,442 | |
Semiconductors & Semiconductor Equipment | | | 46,124,594 | | | | — | | | | — | | | | 46,124,594 | |
Software | | | 265,275,749 | | | | — | | | | — | | | | 265,275,749 | |
Technology Hardware, Storage & Peripherals | | | 13,656,498 | | | | — | | | | — | | | | 13,656,498 | |
Textiles, Apparel & Luxury Goods | | | 17,468,793 | | | | — | | | | — | | | | 17,468,793 | |
Total Common Stocks | | | 1,455,074,246 | | | | 42,013,404 | | | | — | | | | 1,497,087,650 | |
Total Preferred Stock* | | | — | | | | — | | | | 10,606,968 | | | | 10,606,968 | |
Total Short-Term Investment* | | | — | | | | 38,910,387 | | | | — | | | | 38,910,387 | |
Total Securities Lending Reinvestments* | | | — | | | | 189,402,616 | | | | — | | | | 189,402,616 | |
Total Investments | | $ | 1,455,074,246 | | | $ | 270,326,407 | | | $ | 10,606,968 | | | $ | 1,736,007,621 | |
| | | | | | | | | | | | | | | | | |
Collateral for Securities Loaned (Liability) | | $ | — | | | $ | (189,324,461 | ) | | $ | — | | | $ | (189,324,461 | ) |
| | | | |
| * | | See Schedule of Investments for additional detailed categorizations. |
Level 3 investments at the beginning and/or end of the period in relation to net assets were not significant and accordingly, a reconciliation of Level 3 assets for the year ended December 31, 2018 is not presented.
See accompanying notes to financial statements.
BHFTII-8
Brighthouse Funds Trust II
BlackRock Capital Appreciation Portfolio
Statement of Assets and Liabilities
December 31, 2018
| | | | |
Assets | |
Investments at value (a) (b) | | $ | 1,736,007,621 | |
Cash denominated in foreign currencies (c) | | | 25 | |
Receivable for: | |
Fund shares sold | | | 189,450 | |
Dividends and interest | | | 160,510 | |
Prepaid expenses | | | 4,851 | |
| | | | |
Total Assets | | | 1,736,362,457 | |
Liabilities | |
Collateral for securities loaned | | | 189,324,461 | |
Payables for: | |
Investments purchased | | | 5,752,906 | |
Fund shares redeemed | | | 438,816 | |
Accrued Expenses: | |
Management fees | | | 812,060 | |
Distribution and service fees | | | 42,752 | |
Deferred trustees’ fees | | | 113,813 | |
Other expenses | | | 203,591 | |
| | | | |
Total Liabilities | | | 196,688,399 | |
| | | | |
Net Assets | | $ | 1,539,674,058 | |
| | | | |
Net Assets Consist of: | |
Paid in surplus | | $ | 950,120,957 | |
Distributable earnings (Accumulated losses) | | | 589,553,101 | |
| | | | |
Net Assets | | $ | 1,539,674,058 | |
| | | | |
Net Assets | |
Class A | | $ | 1,327,666,011 | |
Class B | | | 173,673,575 | |
Class E | | | 38,334,472 | |
Capital Shares Outstanding* | |
Class A | | | 34,188,580 | |
Class B | | | 4,657,530 | |
Class E | | | 1,007,150 | |
Net Asset Value, Offering Price and Redemption Price Per Share | |
Class A | | $ | 38.83 | |
Class B | | | 37.29 | |
Class E | | | 38.06 | |
| | | | |
| * | | The Portfolio is authorized to issue an unlimited number of shares. |
| (a) | | Identified cost of investments was $1,430,143,473. |
| (b) | | Includes securities loaned at value of $187,845,655. |
| (c) | | Identified cost of cash denominated in foreign currencies was $25. |
Statement of Operations
Year Ended December 31, 2018
| | | | |
Investment Income | |
Dividends (a) | | $ | 14,321,326 | |
Interest | | | 118,232 | |
Securities lending income | | | 727,431 | |
| | | | |
Total investment income | | | 15,166,989 | |
Expenses | |
Management fees | | | 12,637,976 | |
Administration fees | | | 65,819 | |
Custodian and accounting fees | | | 124,556 | |
Distribution and service fees—Class B | | | 478,051 | |
Distribution and service fees—Class E | | | 65,949 | |
Audit and tax services | | | 44,663 | |
Legal | | | 45,317 | |
Trustees’ fees and expenses | | | 33,734 | |
Shareholder reporting | | | 109,900 | |
Insurance | | | 11,842 | |
Miscellaneous | | | 24,781 | |
| | | | |
Total expenses | | | 13,642,588 | |
Less management fee waiver | | | (1,689,385 | ) |
Less broker commission recapture | | | (52 | ) |
| | | | |
Net expenses | | | 11,953,151 | |
| | | | |
Net Investment Income | | | 3,213,838 | |
| | | | |
Net Realized and Unrealized Gain (Loss) | |
| Net realized gain (loss) on: | |
Investments | | | 280,554,815 | |
Foreign currency transactions | | | (1,662 | ) |
| | | | |
Net realized gain | | | 280,553,153 | |
| | | | |
| Net change in unrealized depreciation on: | |
Investments | | | (203,139,927 | ) |
Foreign currency transactions | | | (1 | ) |
| | | | |
Net change in unrealized depreciation | | | (203,139,928 | ) |
| | | | |
Net realized and unrealized gain | | | 77,413,225 | |
| | | | |
Net Increase in Net Assets From Operations | | $ | 80,627,063 | |
| | | | |
| | | | |
| (a) | | Net of foreign withholding taxes of $37,212. |
See accompanying notes to financial statements.
BHFTII-9
Brighthouse Funds Trust II
BlackRock Capital Appreciation Portfolio
Statements of Changes in Net Assets
| | | | | | | | |
| | | Year Ended
December 31,
2018 | | | Year Ended
December 31,
2017 | |
Increase (Decrease) in Net Assets: | |
From Operations | |
Net investment income | | $ | 3,213,838 | | | $ | 3,140,550 | |
Net realized gain | | | 280,553,153 | | | | 237,065,755 | |
Net change in unrealized appreciation (depreciation) | | | (203,139,928 | ) | | | 293,564,173 | |
| | | | | | | | |
Increase in net assets from operations | | | 80,627,063 | | | | 533,770,478 | |
| | | | | | | | |
From Distributions to Shareholders (a) | |
Class A | | | (207,685,022 | ) | | | (39,459,638 | ) |
Class B | | | (25,627,882 | ) | | | (4,251,821 | ) |
Class E | | | (5,905,674 | ) | | | (902,466 | ) |
| | | | | | | | |
Total distributions | | | (239,218,578 | ) | | | (44,613,925 | ) |
| | | | | | | | |
Decrease in net assets from capital share transactions | | | (187,845,257 | ) | | | (304,649,608 | ) |
| | | | | | | | |
Total increase (decrease) in net assets | | | (346,436,772 | ) | | | 184,506,945 | |
|
Net Assets | |
Beginning of period | | | 1,886,110,830 | | | | 1,701,603,885 | |
| | | | | | | | |
End of period | | $ | 1,539,674,058 | | | $ | 1,886,110,830 | (b) |
| | | | | | | | |
Other Information:
Capital Shares
Transactions in capital shares were as follows:
| | | | | | | | | | | | | | | | |
| | | Year Ended
December 31, 2018 | | | Year Ended
December 31, 2017 | |
| | | Shares | | | Value | | | Shares | | | Value | |
Class A | |
Sales | | | 541,953 | | | $ | 24,324,099 | | | | 407,722 | | | $ | 15,832,740 | |
Reinvestments | | | 4,701,947 | | | | 207,685,022 | | | | 1,041,701 | | | | 39,459,638 | |
Redemptions | | | (9,310,034 | ) | | | (432,378,880 | ) | | | (8,505,197 | ) | | | (332,501,185 | ) |
| | | | | | | | | | | | | | | | |
Net decrease | | | (4,066,134 | ) | | $ | (200,369,759 | ) | | | (7,055,774 | ) | | $ | (277,208,807 | ) |
| | | | | | | | | | | | | | | | |
Class B | |
Sales | | | 676,125 | | | $ | 28,743,042 | | | | 181,939 | | | $ | 6,746,572 | |
Reinvestments | | | 603,435 | | | | 25,627,882 | | | | 115,980 | | | | 4,251,821 | |
Redemptions | | | (999,607 | ) | | | (43,641,060 | ) | | | (942,060 | ) | | | (35,531,615 | ) |
| | | | | | | | | | | | | | | | |
Net increase (decrease) | | | 279,953 | | | $ | 10,729,864 | | | | (644,141 | ) | | $ | (24,533,222 | ) |
| | | | | | | | | | | | | | | | |
Class E | |
Sales | | | 230,760 | | | $ | 10,279,382 | | | | 170,692 | | | $ | 6,603,842 | |
Reinvestments | | | 136,295 | | | | 5,905,674 | | | | 24,221 | | | | 902,466 | |
Redemptions | | | (328,183 | ) | | | (14,390,418 | ) | | | (271,074 | ) | | | (10,413,887 | ) |
| | | | | | | | | | | | | | | | |
Net increase (decrease) | | | 38,872 | | | $ | 1,794,638 | | | | (76,161 | ) | | $ | (2,907,579 | ) |
| | | | | | | | | | | | | | | | |
Decrease derived from capital shares transactions | | | | | | $ | (187,845,257 | ) | | | | | | $ | (304,649,608 | ) |
| | | | | | | | | | | | | | | | |
| | | | |
| (a) | | Distributions from net investment income and realized gains are no longer required to be separately disclosed. The presentation for the year ended December 31, 2018 has been adjusted for this change (See Note 8). At December 31, 2017 the distributions were as follows. |
| | | | | | | | |
| | | Distributions from net
investment income: | | | Distributions from
realized capital
gains: | |
Class A | | $ | (1,710,196 | ) | | $ | (37,749,442 | ) |
Class B | | | — | | | | (4,251,821 | ) |
Class E | | | — | | | | (902,466 | ) |
| | | | |
| (b) | | As part of the update in (a), it is also no longer required to disclose the Undistributed net investment income (Accumulated losses) which was $2,941,810 as of December 31, 2017. |
See accompanying notes to financial statements.
BHFTII-10
Brighthouse Funds Trust II
BlackRock Capital Appreciation Portfolio
Financial Highlights
| | | | | | | | | | | | | | | | | | | | |
| Selected per share data | |
| | | Class A | |
| | | Year Ended December 31, | |
| | | 2018 | | | 2017 | | | 2016 | | | 2015 | | | 2014 | |
Net Asset Value, Beginning of Period | | $ | 43.42 | | | $ | 33.23 | | | $ | 36.50 | | | $ | 41.19 | | | $ | 37.85 | |
| | | | | | | | | | | | | | | | | | | | |
Income (Loss) from Investment Operations | |
Net investment income (a) | | | 0.09 | | | | 0.08 | | | | 0.04 | (b) | | | 0.01 | | | | 0.01 | |
Net realized and unrealized gain (loss) | | | 1.74 | | | | 11.06 | | | | (0.15 | ) | | | 2.69 | | | | 3.35 | |
| | | | | | | | | | | | | | | | | | | | |
Total income (loss) from investment operations | | | 1.83 | | | | 11.14 | | | | (0.11 | ) | | | 2.70 | | | | 3.36 | |
| | | | | | | | | | | | | | | | | | | | |
Less Distributions | |
Distributions from net investment income | | | (0.06 | ) | | | (0.04 | ) | | | 0.00 | | | | 0.00 | | | | (0.02 | ) |
Distributions from net realized capital gains | | | (6.36 | ) | | | (0.91 | ) | | | (3.16 | ) | | | (7.39 | ) | | | 0.00 | |
| | | | | | | | | | | | | | | | | | | | |
Total distributions | | | (6.42 | ) | | | (0.95 | ) | | | (3.16 | ) | | | (7.39 | ) | | | (0.02 | ) |
| | | | | | | | | | | | | | | | | | | | |
Net Asset Value, End of Period | | $ | 38.83 | | | $ | 43.42 | | | $ | 33.23 | | | $ | 36.50 | | | $ | 41.19 | |
| | | | | | | | | | | | | | | | | | | | |
Total Return (%) (c) | | | 2.43 | | | | 33.93 | | | | 0.09 | | | | 6.28 | | | | 8.90 | |
|
Ratios/Supplemental Data | |
Gross ratio of expenses to average net assets (%) | | | 0.72 | | | | 0.72 | | | | 0.72 | | | | 0.71 | | | | 0.71 | |
Net ratio of expenses to average net assets (%) (d) | | | 0.63 | | | | 0.63 | | | | 0.66 | | | | 0.66 | | | | 0.71 | |
Ratio of net investment income to average net assets (%) | | | 0.21 | | | | 0.20 | | | | 0.13 | (b) | | | 0.03 | | | | 0.02 | |
Portfolio turnover rate (%) | | | 45 | | | | 48 | | | | 87 | | | | 70 | | | | 99 | |
Net assets, end of period (in millions) | | $ | 1,327.7 | | | $ | 1,661.1 | | | $ | 1,505.8 | | | $ | 1,609.7 | | | $ | 1,781.3 | |
| |
| | | Class B | |
| | | Year Ended December 31, | |
| | | 2018 | | | 2017 | | | 2016 | | | 2015 | | | 2014 | |
Net Asset Value, Beginning of Period | | $ | 41.96 | | | $ | 32.19 | | | $ | 35.54 | | | $ | 40.38 | | | $ | 37.17 | |
| | | | | | | | | | | | | | | | | | | | |
Income (Loss) from Investment Operations | |
Net investment loss (a) | | | (0.02 | ) | | | (0.02 | ) | | | (0.04 | )(b) | | | (0.08 | ) | | | (0.09 | ) |
Net realized and unrealized gain (loss) | | | 1.71 | | | | 10.70 | | | | (0.15 | ) | | | 2.63 | | | | 3.30 | |
| | | | | | | | | | | | | | | | | | | | |
Total income (loss) from investment operations | | | 1.69 | | | | 10.68 | | | | (0.19 | ) | | | 2.55 | | | | 3.21 | |
| | | | | | | | | | | | | | | | | | | | |
Less Distributions | |
Distributions from net realized capital gains | | | (6.36 | ) | | | (0.91 | ) | | | (3.16 | ) | | | (7.39 | ) | | | 0.00 | |
| | | | | | | | | | | | | | | | | | | | |
Total distributions | | | (6.36 | ) | | | (0.91 | ) | | | (3.16 | ) | | | (7.39 | ) | | | 0.00 | |
| | | | | | | | | | | | | | | | | | | | |
Net Asset Value, End of Period | | $ | 37.29 | | | $ | 41.96 | | | $ | 32.19 | | | $ | 35.54 | | | $ | 40.38 | |
| | | | | | | | | | | | | | | | | | | | |
Total Return (%) (c) | | | 2.18 | | | | 33.57 | | | | (0.15 | ) | | | 6.01 | | | | 8.64 | |
|
Ratios/Supplemental Data | |
Gross ratio of expenses to average net assets (%) | | | 0.97 | | | | 0.97 | | | | 0.97 | | | | 0.96 | | | | 0.96 | |
Net ratio of expenses to average net assets (%) (d) | | | 0.88 | | | | 0.88 | | | | 0.91 | | | | 0.91 | | | | 0.96 | |
Ratio of net investment loss to average net assets (%) | | | (0.04 | ) | | | (0.05 | ) | | | (0.12 | )(b) | | | (0.22 | ) | | | (0.23 | ) |
Portfolio turnover rate (%) | | | 45 | | | | 48 | | | | 87 | | | | 70 | | | | 99 | |
Net assets, end of period (in millions) | | $ | 173.7 | | | $ | 183.7 | | | $ | 161.6 | | | $ | 177.9 | | | $ | 184.6 | |
Please see following page for Financial Highlights footnote legend.
See accompanying notes to financial statements.
BHFTII-11
Brighthouse Funds Trust II
BlackRock Capital Appreciation Portfolio
Financial Highlights
| | | | | | | | | | | | | | | | | | | | |
| Selected per share data | |
| | | Class E | |
| | | Year Ended December 31, | |
| | | 2018 | | | 2017 | | | 2016 | | | 2015 | | | 2014 | |
Net Asset Value, Beginning of Period | | $ | 42.68 | | | $ | 32.69 | | | $ | 36.01 | | | $ | 40.79 | | | $ | 37.51 | |
| | | | | | | | | | | | | | | | | | | | |
Income (Loss) from Investment Operations | |
Net investment income (loss) (a) | | | 0.03 | | | | 0.02 | | | | (0.01 | )(b) | | | (0.05 | ) | | | (0.05 | ) |
Net realized and unrealized gain (loss) | | | 1.71 | | | | 10.88 | | | | (0.15 | ) | | | 2.66 | | | | 3.33 | |
| | | | | | | | | | | | | | | | | | | | |
Total income (loss) from investment operations | | | 1.74 | | | | 10.90 | | | | (0.16 | ) | | | 2.61 | | | | 3.28 | |
| | | | | | | | | | | | | | | | | | | | |
Less Distributions | |
Distributions from net realized capital gains | | | (6.36 | ) | | | (0.91 | ) | | | (3.16 | ) | | | (7.39 | ) | | | 0.00 | |
| | | | | | | | | | | | | | | | | | | | |
Total distributions | | | (6.36 | ) | | | (0.91 | ) | | | (3.16 | ) | | | (7.39 | ) | | | 0.00 | |
| | | | | | | | | | | | | | | | | | | | |
Net Asset Value, End of Period | | $ | 38.06 | | | $ | 42.68 | | | $ | 32.69 | | | $ | 36.01 | | | $ | 40.79 | |
| | | | | | | | | | | | | | | | | | | | |
Total Return (%) (c) | | | 2.26 | | | | 33.73 | | | | (0.06 | ) | | | 6.11 | | | | 8.74 | |
|
Ratios/Supplemental Data | |
Gross ratio of expenses to average net assets (%) | | | 0.87 | | | | 0.87 | | | | 0.87 | | | | 0.86 | | | | 0.86 | |
Net ratio of expenses to average net assets (%) (d) | | | 0.78 | | | | 0.78 | | | | 0.81 | | | | 0.81 | | | | 0.86 | |
Ratio of net investment income (loss) to average net assets (%) | | | 0.06 | | | | 0.05 | | | | (0.02 | )(b) | | | (0.12 | ) | | | (0.13 | ) |
Portfolio turnover rate (%) | | | 45 | | | | 48 | | | | 87 | | | | 70 | | | | 99 | |
Net assets, end of period (in millions) | | $ | 38.3 | | | $ | 41.3 | | | $ | 34.1 | | | $ | 40.8 | | | $ | 41.5 | |
| | | | |
| (a) | | Per share amounts based on average shares outstanding during the period. |
| (b) | | Net investment income per share and the ratio of net investment income to average net assets include anon-recurring refund for overbilling of prior years’ custodianout-of-pocket fees which amounted to less than $0.01 per share and 0.01% of average net assets, respectively. |
| (c) | | Total return does not reflect any insurance, sales, separate account or administrative charges of variable annuity or life insurance contracts or any additional expenses that contract owners may bear under their variable contracts. If these charges were included, the returns would be lower. |
| (d) | | Includes the effects of management fee waivers (see Note 5 of the Notes to Financial Statements). |
See accompanying notes to financial statements.
BHFTII-12
Brighthouse Funds Trust II
BlackRock Capital Appreciation Portfolio
Notes to Financial Statements—December 31, 2018
1. Organization
Brighthouse Funds Trust II (the “Trust”) is organized as a Delaware statutory trust and registered under the Investment Company Act of 1940, as amended (the “1940 Act”), as anopen-end management investment company. The Trust, which is managed by Brighthouse Investment Advisers, LLC (“Brighthouse Investment Advisers” or the “Adviser”), currently offers twenty-nine series, each of which operates as a distinct investment vehicle of the Trust. The series included in this report is BlackRock Capital Appreciation Portfolio (the “Portfolio”), which is diversified. Shares in the Portfolio are not offered directly to the general public and are currently available only to separate accounts established by life insurance companies affiliated with the Adviser and Metropolitan Life Insurance Company (the “Insurance Companies”).
The Portfolio has registered and offers three classes of shares: Class A, B and E shares. Shares of each Class of the Portfolio represent an equal pro rata interest in the Portfolio and generally give the shareholder the same voting, dividend, liquidation, and other rights. Investment income, realized and unrealized capital gains and losses, the common expenses of the Portfolio, and certain Portfolio-level expense reductions, if any, are allocated on a pro rata basis to each Class based on the relative net assets of each Class to the net assets of the Portfolio. Each Class of shares differs in its respective distribution plan and such distribution expenses are allocated to the corresponding Class of shares.
2. Significant Accounting Policies
The preparation of financial statements in conformity with accounting principles generally accepted in the United States of America (“GAAP”) requires management to make estimates and assumptions that affect the reported amounts of assets and liabilities and disclosure of contingent assets and liabilities as of the date of the financial statements and the reported amounts of income and expenses during the reporting period. Actual results could differ from those estimates. In the preparation of these financial statements, management has evaluated events and transactions subsequent to December 31, 2018 through the date the financial statements were issued.
The Portfolio is an investment company and follows the accounting and reporting guidance of the Financial Accounting Standards Board (“FASB”) Accounting Standards Codification Topic 946—Financial Services—Investment Companies. The following is a summary of significant accounting policies consistently followed by the Portfolio in the preparation of its financial statements.
Investment Valuation and Fair Value Measurements - The Portfolio values its portfolio investments for purposes of calculating its net asset value (“NAV”) using procedures approved by the Board of Trustees of the Trust (the “Board” or “Trustees”). Those procedures allow for a variety of methodologies to be used to value the Portfolio’s investments. The specific methodologies used for a particular investment may vary based on the market data available for a specific investment at the time the Portfolio calculates its NAV or based on other considerations. The procedures also permit a level of judgment to be used in the valuation process. The Portfolio follows the accounting and reporting guidance of FASB Accounting Standards Codification Topic 820—Fair Value Measurement.
Domestic and foreign equity securities, such as common stock, exchange-traded funds, rights, warrants, and preferred stock, that are traded on a securities exchange on a valuation date are generally valued at their last quoted sale price or official closing price on the primary exchange for such security, or, if no sales occurred on that day, at the last reported bid price. Equity securities tradedover-the-counter (“OTC”) are generally valued at the last reported bid price. In the event of a major exchange closing during the trading day, the Adviser may use other market information obtained from quotation reporting systems, established market makers, or pricing services in valuing the securities. Valuation adjustments may be applied to certain foreign equity securities that are traded solely on foreign exchanges that close before the time as of which the Portfolio determines its NAV to account for the market movement between the close of the foreign exchanges and the time as of which the Portfolio determines its NAV. The Portfolio may use a systematic fair valuation model provided by a pricing service to value securities principally traded in these foreign markets in order to adjust for possible market movements or other changes that may occur between the close of the foreign exchanges and the time as of which the Portfolio determines its NAV. Foreign equity securities valued using these valuation adjustments are generally categorized as Level 2 within the fair value hierarchy. Equity securities that are actively traded, and have no valuation adjustments applied, are categorized as Level 1 within the fair value hierarchy. Other equity securities traded on inactive markets, or valued in reference to similar instruments traded on active markets, are generally categorized as Level 2 within the fair value hierarchy.
Investments in registeredopen-end management investment companies are valued at reported NAV per share on the valuation date and are categorized as Level 1 within the fair value hierarchy.
Debt securities, including corporate, convertible and municipal bonds and notes; obligations of the U.S. Treasury and U.S. government agencies; foreign sovereign issues; andnon-U.S. bonds, are generally valued on the basis of evaluated or composite bid quotations obtained from independent pricing services and/or brokers and dealers selected by the Adviser (each a “pricing service”), pursuant to the authorization of and subject to general oversight by the Board. Such pricing services may use matrix pricing, which considers observable inputs including, among other things, issuer details, maturity dates, interest rates, yield curves, rates of prepayment, credit risks/spreads, default rates, reported trades, broker-dealer quotes and quoted prices for similar assets. Short-term obligations with a
BHFTII-13
Brighthouse Funds Trust II
BlackRock Capital Appreciation Portfolio
Notes to Financial Statements—December 31, 2018—(Continued)
remaining maturity of sixty days or less may be valued at amortized cost in the absence of market quotes, so long as the amortized cost value of such short-term debt instrument is approximately the same as the fair value of the instrument as determined without the use of amortized cost valuation. Floating rate loans are generally valued on the basis of an evaluated or composite average of aggregate bid and ask quotations supplied by brokers or dealers, as obtained from the pricing service. Securities that use similar valuation techniques and inputs as described above are generally categorized as Level 2 within the fair value hierarchy.
Options, whether on securities, indices, futures contracts, or otherwise, traded on exchanges are valued at the last sale price available as of the close of business on a valuation day or, if there is no such price available, at the last reported bid price. These types of options are categorized as Level 1 within the fair value hierarchy. Futures contracts that are traded on commodity exchanges are valued at their settlement prices established by the exchanges on which they are traded as of the close of such exchanges and are categorized as Level 1 within the fair value hierarchy.
If no current market value quotation or other observable inputs are readily available or market value quotations are deemed to be unreliable for an investment, the fair value of the investment will be determined in accordance with procedures approved by, and under the general supervision of, the Board. In such a circumstance, the Board will be assisted in its responsibility to determine the fair value of an investment by the Valuation Committee (“Committee”) of Brighthouse Investment Advisers. The Committee provides general pricing oversight and fair value pricing determinations related to portfolio securities and meets on a regular basis to review reports relating to the valuation of the securities in the Portfolio. The Board has delegated to State Street Bank and Trust Company, the Trust’s custodian (“Custodian”), the responsibility for calculating the NAVs of the Trust’s Portfolios. The Committee is responsible for overseeing the calculation of the NAVs of the Portfolios by the custodian. The Committee also periodically reviews pricing services, including the pricing services providing fair value pricing for the Portfolio’s foreign securities, and is responsible for overseeing the correction of pricing errors and addressing other pricing issues that arise in the ordinary course of business, such as making real-time fair value determinations, as necessary.
No single standard for determining the fair value of an investment can be set forth because fair value depends upon the facts and circumstances with respect to each investment. Information relating to any relevant factors may be obtained by the Committee from any appropriate source, including the subadviser of the Portfolio, the custodian, a pricing service, market maker and/or broker for such security or the issuer. Appropriate methodologies for determining fair value under particular circumstances may include: matrix pricing, a discounted cash flow analysis, comparisons of securities with comparable characteristics, value based on multiples of earnings, discount from market price of similar marketable securities, or a combination of these and other methods.
Investment Transactions and Related Investment Income - Portfolio security transactions are recorded on the trade date. Dividend income is recorded on theex-dividend date or, for certain foreign securities, when notified. Interest income, which includes amortization of premium and accretion of discount on debt securities, is recorded on the accrual basis. Realized gains and losses on investments are determined on the identified cost basis, which is the same basis used for federal income tax purposes. Foreign income and foreign capital gains on some foreign securities may be subject to foreign taxes, which are accrued as applicable. These foreign taxes have been provided for in accordance with the Portfolio’s understanding of the applicable countries’ tax rules and rates.
Foreign Currency Translation -The books and records of the Portfolio are maintained in U.S. dollars. The values of securities, currencies, and other assets and liabilities denominated in currencies other than the U.S. dollar are translated into U.S. dollars based upon foreign exchange rates prevailing at the end of the period. Purchases and sales of investment securities, income, and expenses are translated on the respective dates of such transactions. Because the values of investment securities are translated at the foreign exchange rates prevailing at the end of the period, that portion of the results of operations arising from changes in exchange rates and that portion of the results of operations reflecting fluctuations arising from changes in market prices of the investment securities are not separated. Such fluctuations are included in the net realized and unrealized gain or loss on investments.
Net realized foreign exchange gains or losses arise from activity in forward foreign currency exchange contracts, sales of foreign currency, currency gains or losses realized between the trade and settlement dates on securities transactions, and the difference between the amounts of dividends, interest, and foreign withholding taxes recorded by the Portfolio and the U.S. dollar-equivalent of the amounts actually received or paid by the Portfolio. Net unrealized foreign exchange gains and losses arise from changes in the value of assets and liabilities, other than investment securities, resulting from changes in foreign exchange rates.
Dividends and Distributions to Shareholders -The Portfolio records dividends and distributions on theex-dividend date. Net realized gains from securities transactions (if any) are generally distributed annually to shareholders. The timing and characterization of certain income and capital gains distributions are determined in accordance with federal tax regulations that may differ from GAAP. Permanent book and tax basis differences relating to shareholder distributions will result in reclassification between distributable earnings (accumulated losses) andpaid-in surplus. These adjustments have no impact on net assets or the results of operations.
Income Taxes -It is the Portfolio’s policy to comply with the requirements of the Internal Revenue Code of 1986, as amended, and regulations thereunder, applicable to regulated investment companies, and to distribute, with respect to each taxable year, all of its taxable income to shareholders. Therefore, no federal income tax provision is required. The Portfolio files U.S. federal tax returns. No
BHFTII-14
Brighthouse Funds Trust II
BlackRock Capital Appreciation Portfolio
Notes to Financial Statements—December 31, 2018—(Continued)
income tax returns are currently under examination. The Portfolio’s federal tax returns for the prior three fiscal years remain subject to examination by the Internal Revenue Service. As of December 31, 2018, the Portfolio had no uncertain tax positions that would require financial statement recognition, or derecognition or disclosure.
Directed Brokerage Agreement -The Trust has entered into a directed brokerage arrangement with Capital Institutional Services, Inc. (“CAPIS”). Under this arrangement, the Portfolio directs certain trades to CAPIS in return for a recapture credit. CAPIS issues a cash rebate to the Portfolio. Amounts paid to the Portfolio are shown separately as broker commission recapture on the Statement of Operations of the Portfolio. Additionally, these amounts have been excluded from the calculation of the net ratio of expenses to average net assets presented in the Financial Highlights for each share class.
Repurchase Agreements -The Portfolio may enter into repurchase agreements, under the terms of a Master Repurchase Agreement (“MRA”), with selected commercial banks and broker-dealers, under which the Portfolio acquires securities as collateral and agrees to resell the securities at an agreed-upon time and at an agreed-upon price. The Portfolio, through the Custodian or a subcustodian, under atri-party repurchase agreement, receives delivery of the underlying securities collateralizing any repurchase agreements. It is the Portfolio’s policy that the market value of the collateral be equal to at least 100% of the repurchase price in the case of a repurchase agreement ofone-day duration and equal to at least 102% of the repurchase price in the case of all other repurchase agreements. In the event of default or failure by a party to perform an obligation in connection with any repurchase transaction, the MRA gives the non-defaulting party the right toset-off claims and to apply property held by it in connection with any repurchase transaction against obligations owed to it.
At December 31, 2018, the Portfolio had direct investments in repurchase agreements with a gross value of $38,910,387. Additionally, the Portfolio invested cash collateral for loans of portfolio securities in repurchase agreements with a gross value of $69,977,858. The combined value of all repurchase agreements is included as part of investments at value on the Statement of Assets and Liabilities. The value of the related collateral exceeded the value of the repurchase agreements at December 31, 2018.
Securities Lending - The Portfolio may lend its portfolio securities to certain qualified brokers who borrow securities in order to complete certain securities transactions. By lending its portfolio securities, the Portfolio attempts to increase its net investment income through the receipt of income on collateral held from securities on loan. Any gain or loss in the market price of the loaned securities that might occur and any interest earned or dividends declared during the term of the loan would accrue to the account of the Portfolio.
The Trust has entered into aNon-Custodial Securities Lending Agreement with JPMorgan Chase Bank, N.A. (the “Lending Agent”). Under the agreement, the Lending Agent is authorized to loan portfolio securities on the Portfolio’s behalf. In exchange, the Portfolio receives either cash or U.S. government securities as collateral against the loaned securities. The Portfolio receives collateral equal to at least 102% of the market value for loans secured by government securities or cash in the same currency as the loaned shares and 105% for all other loaned securities at each loan’s inception. Collateral representing at least 100% of the market value of the loaned securities is maintained for the duration of the loan. Any cash collateral received by the Portfolio is generally invested by the Lending Agent in short-term investments, which may include certificates of deposit, commercial paper, repurchase agreements, time deposits, master demand notes and money market funds. The market value of investments made with cash collateral received are disclosed in the Schedule of Investments and the valuation techniques are described in Note 2. If the market value of the collateral at the close of trading on a business day is less than 100% of the market value of the loaned securities at the close of trading on that day, the borrower is required to deliver, by the close of business on the following business day, an additional amount of collateral, so that the total amount of posted collateral is equal to at least 100% of the market value of all the loaned securities as of such preceding day. A portion of the income earned on the collateral is rebated to the borrower of the securities and the remainder is split between the Lending Agent and the Portfolio. On loans collateralized by U.S. government securities, a fee is received from the borrower and is allocated between the Portfolio and the Lending Agent.
Income received by the Portfolio in securities lending transactions during the year ended December 31, 2018 is reflected as securities lending income on the Statement of Operations. The values of any securities loaned by the Portfolio and the related collateral at December 31, 2018 are disclosed in the footnotes to the Schedule of Investments. The value of the related collateral received by the Portfolio exceeded the value of the securities out on loan at December 31, 2018.
The risks associated with lending portfolio securities include, but are not limited to, possible delays in receiving additional collateral or in the recovery of the loaned securities, possible loss of rights in the collateral should the borrower fail financially, as well as risk of loss in the value of the collateral or the value of the investments made with the collateral. The Lending Agent shall indemnify the Portfolio in the case of default of any securities borrower, subject to the terms of theNon-Custodial Securities Lending Agreement.
All securities on loan are classified as Common Stocks in the Portfolio’s Schedule of Investments as of December 31, 2018, with a contractual maturity of overnight and continuous.
BHFTII-15
Brighthouse Funds Trust II
BlackRock Capital Appreciation Portfolio
Notes to Financial Statements—December 31, 2018—(Continued)
3. Certain Risks
In the normal course of business, the Portfolio invests in securities and enters into transactions where risks exist. Those risks include:
Market Risk:The value of securities held by the Portfolio may decline in response to certain events, including those directly involving the issuers whose securities are owned by the Portfolio; conditions affecting the general economy; overall market changes; local, regional or global political, social or economic instability; and currency, interest rate, and price fluctuations.
Credit and Counterparty Risk: The Portfolio may be exposed to counterparty risk, or the risk that an entity with which the Portfolio has unsettled or open transactions may default. The potential loss could exceed the value of the financial assets and liabilities recorded in the financial statements. Financial assets that potentially expose the Portfolio to credit and counterparty risk consist principally of cash due from counterparties and investments. The Portfolio manages counterparty risk by entering into agreements only with counterparties that it believes have the financial resources to honor their obligations and by monitoring the financial stability of those counterparties. The Adviser attempts to mitigate counterparty risk by (i) periodically assessing the creditworthiness of its trading partners, (ii) monitoring and/or limiting the amount of its net exposure to each individual counterparty based on its assessment, and (iii) requiring collateral from the counterparty for certain transactions. In order to preserve certain safeguards fornon-standard settlement trades, the Portfolio restricts its exposure to credit and counterparty losses by entering into master netting agreements (“Master Agreements”) with counterparties (approved brokers) with whom it undertakes a significant volume of transactions. Master Agreements govern the terms of certain transactions, and reduce the counterparty risk associated with relevant transactions by specifying credit protection mechanisms and providing standardization that improves legal certainty. Master Agreements can also help limit counterparty risk by specifying collateral posting arrangements atpre-arranged exposure levels.
Repurchase and reverse repurchase agreements are primarily executed under Global Master Repurchase Agreements (“GMRAs”) or Master Repurchase Agreements (“MRAs”), which provide the rights toset-off. Each repurchase and reverse repurchase agreement is initially collateralized at the transaction level. In the event of default, the total market value exposure will be offset against collateral exchanged to date, which would result in a net receivable/(payable) that would be due from/to the counterparty.
Additional risks associated with each type of investment are described above within the respective security type notes. The Portfolio’s prospectus includes a discussion of the principal risks of investing in the Portfolio.
4. Investment Transactions
Aggregate cost of purchases and proceeds of sales of investment securities, excluding short-term securities, for the year ended December 31, 2018 were as follows:
| | | | | | | | | | | | |
Purchases | | | Sales | |
U.S. Government | | Non-U.S. Government | | | U.S. Government | | | Non-U.S. Government | |
| $0 | | $ | 815,177,831 | | | $ | 0 | | | $ | 1,253,469,834 | |
5. Investment Management Fees and Other Transactions with Affiliates
Investment Management Agreement- Brighthouse Investment Advisers is the investment adviser to the Portfolio. The Trust has entered into an investment management agreement with Brighthouse Investment Advisers with respect to the Portfolio. For providing investment management services to the Portfolio, Brighthouse Investment Advisers receives monthly compensation at the following annual rates:
| | | | | | |
Management
Fees earned by
Brighthouse
Investment Advisers
for the year ended
December 31, 2018 | | % per annum | | | Average Daily Net Assets |
| $12,637,976 | | | 0.730 | % | | Of the first $1 billion |
| | | 0.650 | % | | On amounts in excess of $1 billion |
Brighthouse Investment Advisers has entered into an investment subadvisory agreement with respect to managing the Portfolio. BlackRock Advisors, LLC (the “Subadviser”) is compensated by Brighthouse Investment Advisers to provide subadvisory services for the Portfolio.
BHFTII-16
Brighthouse Funds Trust II
BlackRock Capital Appreciation Portfolio
Notes to Financial Statements—December 31, 2018—(Continued)
Management Fee Waivers- Pursuant to an expense agreement, Brighthouse Investment Advisers has agreed, for the period April 30, 2018 to April 30, 2019, to reduce its advisory fees set out above under “Investment Management Agreement” for each class of the Portfolio as follows:
| | |
% per annum | | Average Daily Net Assets |
| 0.115% | | Of the first $1 billion |
| 0.050% | | On the next $500 million |
| 0.090% | | On the next $1 billion |
| 0.110% | | On amounts in excess of $2.5 billion |
An identical expense agreement was in place for the period May 1, 2017 to April 30, 2018. Amounts waived for the year ended December 31, 2018 are shown as management fee waivers in the Statement of Operations.
Certain officers and trustees of the Trust may also be officers of the Adviser; however, such officers and trustees receive no compensation from the Trust.
Transfer Agency Agreement- Brighthouse Financial, Inc. serves as the transfer agent for the Trust. Brighthouse Financial, Inc. receives no fees for its services to the Trust.
Distribution and Service Fees -The Trust has a distribution agreement with Brighthouse Securities, LLC (the “Distributor”) pursuant to which the Distributor serves as the general distributor of shares of each class (each a “Class”) of each Portfolio. The Distributor is an affiliate of the Trust. The Trust has adopted a Distribution and Services Plan (the “Plan”) relating to Class B and Class E shares of each Portfolio, under Rule 12b-1 under the 1940 Act, pursuant to which the Trust may pay the Distributor a fee (the “Service Fee”) at an annual rate not to exceed 0.25% of each such Portfolio’s average daily net assets attributable to the Class B and Class E shares of the Trust. Each Portfolio may not offer shares of each Class. The Plan also authorizes the Trust, on behalf of each of its Portfolios, may pay the Distributor a distribution Fee (the “Distribution Fee” and together with the Service Fee, the “Fees”) at an annual rate of up to 0.25% of each Portfolio’s average daily net assets attributable to the Class B and Class E shares in consideration of the services rendered in connection with the sale of such shares by the Distributor. Under the Distribution Agreement with respect to the Trust, Fees are currently paid at an annual rate of 0.25% of average daily net assets in the case of Class B shares and 0.15% of average daily net assets in the case of Class E shares. The Plan is known as a “compensation plan” because the Trust makes payments to the Distributor for services rendered regardless of the actual level of expenditures by the Distributor. Amounts incurred by the Portfolio for the year ended December 31, 2018 are shown as Distribution and service fees in the Statement of Operations.
Deferred Trustee Compensation- Each Trustee who is not currently an employee of the Adviser or any of its affiliates receives compensation from the Trust for his or her service to the Trust. A deferred compensation plan (the “Plan”) is available to the Trustees on a voluntary basis. Deferred amounts remain in the Trust until distributed in accordance with the provisions of the Plan. The value of a participating Trustee’s deferral account is based on theoretical investments of deferred amounts on the normal payment dates in certain portfolios of the Trust or Brighthouse Funds Trust I, an affiliate of the Trust, as designated by the participating Trustee. Changes in the value of participants’ deferral accounts are reflected as Trustees’ fees and expenses in the Statement of Operations. The portion of the accrued obligations allocated to the Portfolio under the Plan is reflected as Deferred trustees’ fees in the Statement of Assets and Liabilities.
6. Contractual Obligations
Under the Trust’s organizational documents, its officers and Trustees may be indemnified against certain liabilities and expenses arising out of the performance of their duties to the Trust. Additionally, the Trust has a variety of indemnification obligations under contracts with its service providers. The Trust’s maximum exposure under these arrangements is unknown, as this would involve future claims that may be made against the Trust that have not yet occurred.
7. Income Tax Information
The cost basis of investments for federal income tax purposes at December 31, 2018 was as follows:
| | | | |
Cost basis of investments | | $ | 1,430,496,991 | |
Gross unrealized appreciation | | | 351,051,847 | |
Gross unrealized depreciation | | | (45,541,217 | ) |
| | | | |
Net unrealized appreciation (depreciation) | | $ | 305,510,630 | |
| | | | |
BHFTII-17
Brighthouse Funds Trust II
BlackRock Capital Appreciation Portfolio
Notes to Financial Statements—December 31, 2018—(Continued)
The tax character of distributions paid for the years ended December 31, 2018 and 2017 were as follows:
| | | | | | | | | | | | | | | | | | | | |
Ordinary Income | | | Long-Term Capital Gain | | | Total | |
2018 | | 2017 | | | 2018 | | | 2017 | | | 2018 | | | 2017 | |
| $60,299,781 | | $ | 1,710,196 | | | $ | 178,918,797 | | | $ | 42,903,729 | | | $ | 239,218,578 | | | $ | 44,613,925 | |
As of December 31, 2018, the components of distributable earnings (accumulated losses) on a federal income tax basis were as follows:
| | | | | | | | | | | | | | | | |
Undistributed
Ordinary
Income | | Undistributed
Long-Term
Capital Gain | | | Net
Unrealized
Appreciation | | | Accumulated
Capital Losses | | | Total | |
| $4,424,289 | | $ | 279,731,996 | | | $ | 305,510,630 | | | $ | — | | | $ | 589,666,915 | |
The Portfolio utilizes the provisions of the federal income tax laws that provide for the carryforward of capital losses for prior years, offsetting such losses against any future realized capital gains. Under the Regulated Investment Company Modernization Act of 2010 (the “Act”), net capital losses recognized after December 22, 2010 may be carried forward indefinitely and their character is retained as short-term and/or long-term losses.
As of December 31, 2018, the Portfolio had no accumulated capital losses.
8. Recent Accounting Pronouncements and SEC Update
In August 2018, the FASB issued Accounting Standards Update2018-13, Fair Value Measurement (Topic 820)—Disclosure Framework—Changes to the Disclosure Requirements for Fair Value Measurement (“ASU2018-13”) which introduces new fair value disclosure requirements as well as eliminates and modifies certain existing fair value disclosure requirements. ASU2018-13 is effective for fiscal years beginning after December 15, 2019, and interim periods within those fiscal years. Early adoption is permitted and, as such, management has elected to early adopt ASU2018-13 effective with the current reporting period. The impact of the Portfolio’s adoption was limited to changes in the Portfolio’s financial statement disclosures regarding fair value, primarily those disclosures related to transfers between levels of the fair value hierarchy.
In August 2018, the Securities and Exchange Commission released its Final Rule on Disclosure Update and Simplification (the “Final Rule”) which is intended to simplify an issuer’s disclosure compliance efforts by removing redundant or outdated disclosures requirements without significantly altering the mix of information provided to investors. Effective with the current reporting period, the Portfolio adopted the Final Rule with the most notable impacts being that the Portfolio is no longer required to present the components of distributable earnings on the Statement of Assets and Liabilities or the sources of distributions to shareholders and the amounts of undistributed net investment income on the Statements of Changes in Net Assets.
BHFTII-18
Brighthouse Funds Trust II
BlackRock Capital Appreciation Portfolio
Report of Independent Registered Public Accounting Firm
To the Shareholders of BlackRock Capital Appreciation Portfolio and the Board of Trustees of Brighthouse Funds Trust II:
Opinion on the Financial Statements and Financial Highlights
We have audited the accompanying statement of assets and liabilities, including the schedule of investments, of the BlackRock Capital Appreciation Portfolio (the “Portfolio”), one of the portfolios constituting the Brighthouse Funds Trust II, as of December 31, 2018, the related statement of operations for the year then ended, the statements of changes in net assets for each of the two years in the period then ended, the financial highlights for each of the five years in the period then ended, and the related notes. In our opinion, the financial statements and financial highlights present fairly, in all material respects, the financial position of the BlackRock Capital Appreciation Portfolio of the Brighthouse Funds Trust II as of December 31, 2018, the results of its operations for the year then ended, the changes in its net assets for each of the two years in the period then ended, and the financial highlights for each of the five years in the period then ended, in conformity with accounting principles generally accepted in the United States of America.
Basis for Opinion
These financial statements and financial highlights are the responsibility of the Portfolio’s management. Our responsibility is to express an opinion on the Portfolio’s financial statements and financial highlights based on our audits. We are a public accounting firm registered with the Public Company Accounting Oversight Board (United States) (PCAOB) and are required to be independent with respect to the Portfolio in accordance with the U.S. federal securities laws and the applicable rules and regulations of the Securities and Exchange Commission and the PCAOB.
We conducted our audits in accordance with the standards of the PCAOB. Those standards require that we plan and perform the audit to obtain reasonable assurance about whether the financial statements and financial highlights are free of material misstatement, whether due to error or fraud. The Portfolio is not required to have, nor were we engaged to perform, an audit of its internal control over financial reporting. As part of our audits we are required to obtain an understanding of internal control over financial reporting but not for the purpose of expressing an opinion on the effectiveness of the Portfolio’s internal control over financial reporting. Accordingly, we express no such opinion.
Our audits included performing procedures to assess the risks of material misstatement of the financial statements and financial highlights, whether due to error or fraud, and performing procedures that respond to those risks. Such procedures included examining, on a test basis, evidence regarding the amounts and disclosures in the financial statements and financial highlights. Our audits also included evaluating the accounting principles used and significant estimates made by management, as well as evaluating the overall presentation of the financial statements and financial highlights. Our procedures included confirmation of securities owned as of December 31, 2018, by correspondence with the custodian and brokers; when replies were not received from brokers, we performed other auditing procedures. We believe that our audits provide a reasonable basis for our opinion.
/s/ Deloitte & Touche LLP
Boston, Massachusetts
February 25, 2019
We have served as the auditor of one or more of the Brighthouse investment companies since 1983.
BHFTII-19
Brighthouse Funds Trust II
Trustees and Officers
MANAGEMENT OF THE TRUSTS
The Boards of Trustees (the “Board”) of Brighthouse Funds Trust I and Brighthouse Funds Trust II (“BHF I” and “BHF II”, respectively, and collectively the “Trusts”) supervise the Trusts and are responsible for representing the interests of shareholders. The Trustees, the Chairman of the Board and the Chairmen of each subcommittee are the same for both Trusts. The Trustees of each Trust meet periodically throughout the year to oversee the Portfolios’ activities, reviewing, among other things, each Portfolio’s performance and its contractual arrangements with various service providers. The Trustees of each Trust elect the officers of the Trust, who are responsible for administering the Trust’sday-to-day operations.
Trustees and Officers
The Trustees and executive officers of the Trusts, as well as their principal occupations during the past five years, are set forth below. Unless otherwise indicated, the business address of each is c/o Brighthouse Funds, One Financial Center, Boston, Massachusetts 02111. Each Trustee who is deemed an “interested person,” as such term is defined in the 1940 Act, is referred to as an “Interested Trustee.” Those Trustees who are not “interested persons,” as such term is defined in the 1940 Act, are referred to as “Independent Trustees.” There is no limit to the term a Trustee may serve. Trustees serve until their death, resignation or removal in accordance with the BHF I Trust’s and BHF II Trust’s respective organizational documents and policies adopted by the Boards of the respective Trusts from time to time. Officers hold office at the pleasure of each Board and serve until their removal or resignation in accordance with the Trusts’ respective organizational documents and policies adopted by the Board of each Trust from time to time.
| | | | | | | | | | |
Name and Year of Birth | | Current
Position(s)
Held with
Registrant | | Term of Office
and Length of
Time Served | | Principal Occupation(s) During the Past
5 Years(1) | | Number of
Portfolios
in Brighthouse
Funds
Complex(2)
Overseen
by Trustee | | Other Directorships Held
by Trustee During the
Past 5 Years(1) |
| Interested Trustee |
John Rosenthal* (1960) | | Trustee | | Indefinite; From
May 2016
(Trust I and
Trust II) to present | | Chief Investment Officer, Brighthouse Financial, Inc. (2017 to present); until 2017, Senior Managing Director and Head of Global Portfolio Management, MetLife, Inc. | | 72 | | None |
|
| Independent Trustees |
Dawn M. Vroegop (1966) | | Trustee and Chairman of the Board | | Indefinite; From
December 2000
(Trust I)/May
2009 (Trust II) to
present as
Trustee; From
May 2016 (Trust
I and Trust II)
until present as
Chairman | | Private Investor. | | 72 | | Trustee, Driehaus Mutual Funds.** |
| | | | | |
Stephen M. Alderman (1959) | | Trustee | | Indefinite; From
December 2000
(Trust I)/April
2012 (Trust II) to
present | | Shareholder in the law firm of Garfield and Merel, Ltd. | | 72 | | None |
| | | | | |
Robert J. Boulware (1956) | | Trustee | | Indefinite; From
March 2008
(Trust I)/April
2012 (Trust II) to
present | | Managing Director, Pilgrim Funds, LLC (private equity fund). | | 72 | | Trustee, Vertical Capital Income Fund(closed-end fund);** Director, Gainsco, Inc. (auto insurance);** Trustee, SharesPost 100 Fund(closed-end fund).** |
| | | | | |
Susan C. Gause (1952) | | Trustee | | Indefinite; From
March 2008
(Trust I)/April
2012 (Trust II) to
present | | Private Investor. | | 72 | | Trustee, HSBC Funds.** |
BHFTII-20
Brighthouse Funds Trust II
Trustees and Officers—(Continued)
| | | | | | | | | | |
Name and Year of Birth | | Current
Position(s)
Held with
Registrant | | Term of Office
and Length of
Time Served | | Principal Occupation(s) During the Past
5 Years(1) | | Number of
Portfolios
in Brighthouse
Funds
Complex(2)
Overseen
by Trustee | | Other Directorships Held
by Trustee During the
Past 5 Years(1) |
Nancy Hawthorne (1951) | | Trustee | | Indefinite; From
May 2003
(Trust II)/April
2012 (Trust I)
to present | | Partner, Hawthorne Financial Advisors, LLC (registered investment advisor); until 2014, Chief Executive Officer, Clerestory LLC (corporate advisor). | | 72 | | Director and Chairman of the Board of Directors, THL Credit, Inc.;** Director and Chairman of the Board, Avid Technology, Inc.;** Director, CRA International, Inc.** |
| | | | | |
Barbara A. Nugent (1956) | | Trustee | | Indefinite; From
January 2014
(Trust I and
Trust II) to
present | | President, True North Board Governance, LLC (consulting); until December 2013, partner in the law firm of Stradley Ronon Stevens & Young, LLP. | | 72 | | Independent Lead Trustee, BMT Investment Funds** |
| | | | | |
Christopher J. Towle (1957) | | Trustee | | Indefinite; From
April 2018
(Trust I and
Trust II) to
present | | Retired; until 2014, Partner, Portfolio Manager, Director of High Yield and Convertible Strategies, Lord Abbett & Co. | | 72 | | Trustee, Driehaus Mutual Funds** |
Officers
| | | | | | |
Name and Year of Birth | | Position(s)
Held with
Registrant | | Length of
Time Served | | Principal Occupation(s)
During the Past 5 Years(1) |
| Executive Officers | | | | | | |
Kristi Slavin (1973) | | President and Chief Executive Officer, of Trust I and Trust II | | From May
2016
(Trust I and
Trust II) to
present | | President, Brighthouse Investment Advisers, LLC (2016-present); formerly, Senior Vice President, MetLife Advisers, LLC; Vice President, MetLife, Inc.; Vice President, Trust I and Trust II(2015-2016). |
| | | |
Alan R. Otis (1971) | | Chief Financial Officer and Treasurer, of Trust I and Trust II | | From
November
2017
(Trust I and
Trust II) to
present | | Senior Vice President, Brighthouse Investment Advisers, LLC (2017-present); formerly, Vice President, Brighthouse Investment Advisers, LLC (2012-2017); Assistant Treasurer, Trust I and Trust II (2012-2017). |
| | | |
Andrew L. Gangolf (1954) | | Secretary, of Trust I and Trust II | | From May
2011
(Trust I and
Trust II) to
present | | Executive Vice President, Brighthouse Investment Advisers, LLC (2017-present); formerly, Senior Vice President, MetLife Advisers, LLC (2011-2017); until 2011, Senior Vice President & Assistant General Counsel, AllianceBernstein Investments, Inc. |
| | | |
Steven E. Hartstein (1963) | | Chief Compliance Officer (“CCO”), of Trust I and Trust II | | From
February
2014
(Trust I and
Trust II) to
present | | Senior Vice President and CCO, Brighthouse Investment Advisers, LLC (2017-present); Head of Investments Compliance, Vice President, Brighthouse Financial, Inc. (2017-present); formerly, Vice President, MetLife, Inc. (2013-2017); Senior Vice President and CCO, MetLife Advisers, LLC (2013-2017.) |
| | | |
Victor Soto (1978) | | Vice President of Trust I and Trust II | | From May
2018
(Trust I and
Trust II) to
present | | Executive Vice President, Brighthouse Investment Advisers, LLC (2016-present); Assistant Vice President, MetLife Inc. (2015-2017); Portfolio Manager, 1st Global (2013-2015). |
| * | Mr. Rosenthal is an “interested person” of the Trusts because of his position with Brighthouse Financial, Inc., the current parent company of Brighthouse Investment Advisers, LLC. |
| ** | Indicates a directorship with a registered investment company or a company subject to the reporting requirements of the Securities Exchange Act of 1934, as amended. |
| (1) | Previous positions during the past five years with the Trusts, Brighthouse Financial, Inc., MetLife, Inc. or the Manager are omitted if not materially different. |
| (2) | The Fund Complex includes 43 BHF I Portfolios and 29 BHF II Portfolios. |
BHFTII-21
Brighthouse Funds Trust II
BlackRock Capital Appreciation Portfolio
Board of Trustees’ Consideration of Advisory and Sub-Advisory Agreements
At anin-person meeting held on November6-8, 2018 (the “November Meeting”), the Boards of Trustees (the “Board”) of Brighthouse Funds Trust I and Brighthouse Funds Trust II (“BFT I” and “BFT II,” respectively, and collectively, the “Trusts”), including a majority of the Trustees who are not “interested persons” of the Trusts (the “Independent Trustees”) under the Investment Company Act of 1940 (the “1940 Act”), approved the continuation of the Trusts’ advisory agreements (each, an “Advisory Agreement”) with Brighthouse Investment Advisers, LLC (the “Adviser”) and the applicablesub-advisory agreements (each a “Sub-Advisory Agreement,” and collectively with the Advisory Agreement, the “Agreements”) between the Adviser and the investmentsub-advisers (each a “Sub-Adviser,” and collectively, the “Sub-Advisers”) for the series of the Trusts (each a “Portfolio,” and collectively, the “Portfolios”).
In making those approvals, the Board reviewed a variety of materials that were provided for the specific purpose of the annual contract renewal process. In addition, various materials provided to and discussed with the Board throughout the year informed the Board’s decision to renew the Agreements. In particular, the information for each Portfolio included, but was not limited to, investment performance reports, and reports on expenses, legal and compliance matters, asset pricing, brokerage commissions and trade execution.
The Board met in person with personnel of the Adviser on October 17, 2018 for the specific purpose of giving preliminary consideration to the proposed continuation of the Agreements (the “October Meeting”). At that meeting, the Adviser reviewed with the Board the performance and fees experienced by each Portfolio, as well as other information. During and after the October Meeting, the Independent Trustees communicatedfollow-up matters for management to address at the November Meeting. The Independent Trustees were advised by independent legal counsel throughout the contract renewal process, and met with independent legal counsel in several executive sessions outside of the presence of management.
Information furnished and reviewed specifically in connection with the renewal process included, but was not limited to, a report for each Portfolio that was prepared by Broadridge (“Broadridge”), an independent organization. In addition, the Independent Trustees reviewed a report that was prepared by JDL Consultants, LLC (“JDL”), an independent consultant to the Independent Trustees (“JDL Report”), which examined the comparative fees, expenses and performance of each Portfolio, based upon the Broadridge reports. Also, the Board reviewed the responses to wide-ranging questions from the Independent Trustees relating to the business, operations and performance of the Adviser and theSub-Advisers that the Adviser andSub-Advisers had prepared specifically for the renewal process, and reviewed aPortfolio-by-Portfolio analysis of the profitability to the Adviser of each Advisory Agreement, which was prepared by the Adviser for the renewal process.
At the November Meeting, the Board, including a majority of the Independent Trustees, concluded that the nature, extent and quality of services provided by the Adviser and eachSub-Adviser supported the renewal of the Agreements. The Board also concluded that the investment performance of each Portfolio was such that each Agreement should continue, and that the fees paid by each Portfolio to the Adviser appeared to be reasonable in light of the nature, extent and quality of the services provided by the Adviser andSub-Adviser. Further, the Board concluded that the Adviser’s profitability in providing services under the Advisory Agreements did not appear unreasonable in light of the nature, extent and quality of the services provided by the Adviser. Finally, the Board reviewed the extent to which the investment advisory fees paid by the Portfolios shared economies of scale with investors or entailed the potential to share economies of scale with investors and concluded that those considerations generally supported the renewal of each Agreement. In approving the renewal of each of the Agreements, the Board, including the Independent Trustees, gave attention to all of the information that was furnished and each Trustee placed varying degrees of importance on the various pieces of information that were provided to them. The Board evaluated the information available to it on aPortfolio-by-Portfolio basis, and its decision was made separately with respect to each Portfolio. The following paragraphs provide more information about some of the primary factors that were relevant to the Board’s decision. The Board did not identify any single factor as determinative, and the Trustees generally attributed different weights to various factors for the various Portfolios.
Nature, extent and quality of services. The Board evaluated the nature, extent and quality of the services that the Adviser and theSub-Advisers, as relevant, have provided to the Portfolios. The Board considered the Adviser’s services as investment manager to the Portfolios, including its services relating to the hiring and oversight of theSub-Advisers, trading practices and oversight of transition management (as applicable), compliance programs and personnel, and risk management, among other things. The Adviser’s services in coordinating and overseeing the activities of the Trusts’ other service providers were also considered. The Board considered information received from the Trusts’ Chief Compliance Officer (“CCO”) regarding the Portfolios’ compliance policies and procedures that were established pursuant to Rule38a-l under the 1940 Act. The Board also noted that the Adviser’s investment, compliance and legal staff conduct regular and periodic telephonic andin-person meetings with theSub-Advisers to review and assess the services that are provided to the Portfolios, and that personnel of the Adviser prepare and present reports to the Independent Trustees regarding those meetings. In addition, throughout the year, the Board considered the expertise, experience and performance of the personnel of the Adviser who performed the various services that are mentioned above.
BHFTII-22
Brighthouse Funds Trust II
BlackRock Capital Appreciation Portfolio
Board of Trustees’ Consideration of Advisory and Sub-Advisory Agreements—(Continued)
With respect to the services provided by each of theSub-Advisers, the Board considered a variety of information that the Adviser and eachSub-Adviser prepared for the Board’s review. The Board considered eachSub-Adviser’s investment process and philosophy, and the investment performance experienced by the Portfolio (as described in more detail below). The Board took into account that eachSub-Adviser’s responsibilities include the development and maintenance of an investment program for the applicable Portfolio that is consistent with the Portfolio’s investment objectives, the selection of investment securities and the placement of orders for the purchase and sale of such securities, as well as the implementation of compliance controls related to performance of these services. In particular, the Board considered, among other things, theSub-Adviser’s current level of staffing as well as its compensation program and its overall resources. The Board reviewed eachSub-Adviser’s history and investment experience, as well as information provided regarding the qualifications, background and responsibilities of theSub-Adviser’s investment and compliance personnel who provide services to the Portfolios. The Board also considered, among other things, eachSub-Adviser’s compliance program and regulatory and disciplinary history. In its review, the Board also took into account information regarding any services and/or payments provided to the Adviser by theSub-Advisers in connection with marketing activities and considered representations from the Adviser that those payments were not considered in the Adviser’s recommendation to renew any of theSub-Advisory Agreements.
Performance. The Board placed emphasis on the performance of each Portfolio in light of, among other things, its importance to investors. The Board considered the Adviser’s quarterly reviews with the Board of detailed information about each Portfolio’s investment strategies and performance results and composition, including discussions regarding the relevant effect of current market conditions. The Board reviewed and considered the reports prepared by Broadridge, which provided a statistical analysis comparing the Portfolios’ investment performance to that of comparable funds underlying variable insurance products (the “Performance Universe”). The Independent Trustees also met separately with representatives of JDL during the October Meeting to review the JDL Report. The Board also compared the performance records of the Portfolios to those of comparable funds and other accounts that were managed by the relevantSub-Adviser, to the extent such information was available. The Board considered each Portfolio’s performance for periods subsequent to the performance period covered by the Broadridge reports, and the Adviser’s discussion of the same, including the effect of current market conditions on each Portfolio’s more recent performance. The Board also noted that while it found the data provided by Broadridge generally useful, it recognized the limitations of such data, including, in particular, that notable differences may exist between a Portfolio and those of the other funds in a Broadridge category (for example, the investment objectives(s) and investment strategies) and that the results of the performance comparisons may vary depending on (i) the end dates for the performance periods that were selected and (ii) the selection of the peer groups.
The Board focused particular attention on Portfolios with less favorable performance records. The Board noted the Adviser’s focus on eachSub-Adviser’s performance and that the Adviser has been active in monitoring and responding to any performance issues with respect to the Portfolios.
Fees and Expenses. The Board gave consideration to the level and method of computing the fees payable under the Agreements. The Board considered the Broadridge report for each of the Portfolios, which included comparisons for each Portfolio of its contractual management andsub-adviser fees (at current and various asset levels), and total expenses, with those of its peers, including as those peers were divided into a broad group of peer funds (“Expense Universe”), a narrower group of peer funds (“Expense Group”), a broad group of peersub-advised funds (“Sub-advised Expense Universe”), and a narrower group of peersub-advised funds (“Sub-advised Expense Group”). Broadridge selected the peer funds which were similarly situated funds underlying variable insurance products deemed to be comparable to the Portfolios. The Independent Trustees, with the assistance of JDL, also examined the JDL Report. The Board compared the fee payable to aSub-Adviser by the Adviser with respect to the Portfolio to the fee payable to theSub-Adviser by other comparable funds and other accounts, to the extent such information was available.
The Board noted that thesub-advisory fees for the Portfolios are paid by the Adviser out of the advisory fees, and that the Adviser negotiates the fees at arm’s length. The Board also considered that the Adviser had entered into expense limitation or management fee waiver agreements with certain of the Portfolios pursuant to which the Adviser had agreed to waive a portion of its advisory fee and/or reimburse certain expenses as a means of limiting a Portfolio’s total annual operating expenses.
Profitability. The Board examined the profitability to the Adviser of each Advisory Agreement, on aPortfolio-by-Portfolio basis. The Board also considered that an affiliate of the Adviser, Brighthouse Securities, LLC, serves as distributor for the Trusts, and, as such, receives Rule12b-1 payments to support the distribution of the Portfolios. The Board considered the profitability to theSub-Advisers and their affiliates as a result of their relationships with the Portfolios, to the extent available, and the Board considered the ability of the Adviser to negotiate with aSub-Adviser at arm’s length. In reviewing the profitability analyses, the Board recognized that expense allocation methodologies are inherently subjective and various expense allocation methodologies may be reasonable while producing different results.
BHFTII-23
Brighthouse Funds Trust II
BlackRock Capital Appreciation Portfolio
Board of Trustees’ Consideration of Advisory and Sub-Advisory Agreements—(Continued)
Economies of scale. The Board also considered each Portfolio’s fees in light of its size. The Board noted the fee schedules for the Portfolios that contain breakpoints that reduce the fee rate above specified asset levels. The Board noted those Portfolios that did not have breakpoints in their advisory fee and took into account management’s discussion of the same. The Board noted that those Portfolios with Advisory Agreements containing breakpoints generally have breakpoints in the correspondingSub-Advisory Agreement. The Board considered the effective fees under the Advisory Agreement andSub-Advisory Agreement for each Portfolio as a percentage of assets at different asset levels and possible economies of scale that may be realized if the assets of the Portfolio grow. The Board examined, among other data, the effect of a Portfolio’s growth in size, and reduction in size, on various fee schedules and the Board reviewed the Broadridge and JDL Reports, which compared fees among peers. The Board also generally noted that if a Portfolio’s assets increase over time, the Portfolio may realize other economies of scale if assets increase proportionally more than certain other fixed expenses.
Other factors. The Board considered other benefits that may be realized by the Adviser and its affiliates from their relationship with the Trusts. Among them, the Board recognized that Brighthouse Securities, LLC, as the distributor for the Trusts, receives payments pursuant to Rule12b-1 from the Portfolios to compensate for the provision of shareholder services and distribution activities, which could lead to growth in the Trusts’ assets and corresponding benefits from such growth, including economies of scale. The Board considered other benefits that may be realized by eachSub-Adviser and its affiliates from their relationship with the Trusts, including the opportunity to provide advisory services to additional portfolios of the Trusts and reputational benefits. In conjunction with these considerations, the Board noted the ongoing commitment of the Adviser to the Portfolios.
The Board requested, received, and considered information from the Adviser regarding possible conflicts of interest in the form of material benefits to the Adviser resulting from the Adviser’s affiliations and business relationships, as relevant. The Board considered the services that are provided to the Trusts by its service providers, and the manner in which any conflicts were mitigated.
* * *
BlackRock Capital Appreciation Portfolio. The Board also considered the following information in relation to the Agreements with the Adviser and BlackRock Advisors, LLC regarding the Portfolio:
Among other data relating specifically to the Portfolio’s performance, the Board considered that the Portfolio outperformed the median of its Performance Universe and the average of its Morningstar Category for theone-, three- and five-year periods ended June 30, 2018. The Board further considered that the Portfolio outperformed its benchmark, the Russell 1000 Growth Index, for theone-year period ended September 30, 2018, and underperformed its benchmark for the three-year and five-year periods ended September 30, 2018.
The Board also considered that the Portfolio’s actual management fees and total expenses (exclusive of12b-1 fees) were below the Expense Group median, the Expense Universe median and theSub-advised Expense Universe median. The Board noted that the Portfolio’s contractual management fees were above the asset-weighted average of comparable funds selected by Broadridge at the Portfolio’s current size. The Board also noted that the Portfolio’s contractualsub-advisory fees were below the averages of theSub-advised Expense Group and theSub-advised Expense Universe at the Portfolio’s current size.
BHFTII-24
Brighthouse Funds Trust II
BlackRock Ultra-Short Term Bond Portfolio
Managed by BlackRock Advisors, LLC
Portfolio Manager Commentary*
PERFORMANCE
For the 12 months ended December 31, 2018, the Class A, B, and E shares of the BlackRock Ultra-Short Term Bond Portfolio returned 1.81%, 1.55%, and 1.66%, respectively. The Portfolio’s benchmark, the Bank of America/Merrill Lynch3-monthT-Bill Index1, returned 1.87%.
PORTFOLIO REVIEW /PERIOD-END POSITIONING
Portfolio positioning over the course of 2018 was reflective of our evolving expectations regarding the path that the Federal Open Market Committee (the “FOMC”) will follow towards removal of monetary accommodation, short term funding issuance and net U.S. Treasury bill supply. Throughout the year, the FOMC continued to communicate the intent to gradually raise its target range. This factored into our strategy of maintaining a relatively short weighted average maturity (“WAM”) for the Portfolio. The U.S. Treasury increased net bill supply by $330 billion during February and March, and the short credit market felt pressures stemming from repatriation of offshore U.S. dollar assets. As we moved through the first quarter, these factors pressured yields, credit premiums and spreads higher. Beginning in early February, we saw offered levels on fixed rate securities move higher and spreads available on floating rate paper move wider. This widening persisted through the March FOMC meeting and into the end of the quarter, negatively impacting asset valuations. As we moved through the second quarter, higher than anticipated tax receipts during this year’s tax season lead to a $130 billion reduction in U.S. Treasury bill supply.Non-traditional buyers, drawn to the front end by high relative yields, provided significant demand for short-term credit assets. This increased demand for investment in short-term credit and the decrease in Treasury bill supply exerted downward pressure on credit premiums and spreads, leading these spreads and premiums to decline from their highs reached in early May. This tightening continued through June and factored into asset price increases. Throughout much of the third quarter, demand for short term credit investments fromnon-traditional buyers and inflows into prime money funds outpaced issuance supply causing3-month London Interbank Offered Rate (“LIBOR”) to remain range bound over the quarter despite the approaching September FOMC rate hike. Many issuers found success borrowing at levels lower than LIBOR for much of the 3rd quarter. This tightening was generally positive for asset valuations over the quarter but proved a source of reinvestment risk for the Portfolio. It was not until the fourth quarter that demand for short term credit investments fromnon-traditional buyers ebbed, easing the imbalances that had left3-month LIBOR range bound between 2.30% and 2.39% since March. This, coupled withyear-end funding initiatives by the banks, pressured spreads and offered yields higher. Beginning in early October, we saw3-month LIBOR move higher, ending December at 2.81%.
During the fourth quarter, the Portfolio added floating rate certificates of deposit and commercial paper with final maturities of4-months to13-months at spreads of 16 basis points to 42 basis points over1-month LIBOR and 8 basis points to 32 basis points over3-month LIBOR. Fixed rate investments were added as yields of to 2.41% to 2.92% with final maturities of3-months to7-months, 0.23% to 0.54% above respective overnight levels at the time of their purchase. The Portfolio opportunistically added exposure to U.S. Treasury bills maturingmid-January 2019. The longer-term fixed rate certificates of deposit and commercial paper were subject to asset price volatility, particularly during periods of heavy U.S. Treasury bill issuance-induced spread widening. Floating rate positions experienced higher coupon resets during the period.
On December 31, 2018, the Portfolio’s WAM was 27 days and weighted average life was 73 days. Approximately 36% of the Portfolio was comprised of floating rate securities indexed off of1-month LIBOR (20%) and3-month LIBOR (16%). These contributed 0.96% to gross yield while fixed rate investments contributed the balance. U.S. Treasury bills represented 7% of assets.
Rich Mejzak
Eric Hiatt
Edward Ingold
Portfolio Managers
BlackRock Advisors, LLC
* This commentary may include statements that constitute “forward-looking statements” under the U.S. securities laws. Forward-looking statements include, among other things, projections, estimates, and information about possible or future results related to the Portfolio, market or regulatory developments. The views expressed above are not guarantees of future performance or economic results and involve certain risks, uncertainties and assumptions that could cause actual outcomes and results to differ materially from the views expressed herein. The views expressed above are subject to change at any time based upon economic, market, or other conditions and the subadvisory firm undertakes no obligation to update the views expressed herein. Any discussions of specific securities should not be considered a recommendation to buy or sell those securities. The views expressed above (including any forward-looking statement) may not be relied upon as investment advice or as an indication of the Portfolio’s trading intent. Information about the Portfolio’s holdings, asset allocation or country diversification is historical and is not an indication of future Portfolio composition, which may vary. Direct investment in any index is not possible. The performance of any index mentioned in this commentary has not been adjusted for ongoing management, distribution and operating expenses, and sales charges applicable to mutual fund investments. In addition, the returns do not reflect additional fees charged by separate accounts or variable insurance contracts that an investor in the Portfolio may pay. If these additional fees were reflected, performance would have been lower.
BHFTII-1
Brighthouse Funds Trust II
BlackRock Ultra-Short Term Bond Portfolio
A $10,000 INVESTMENT COMPARED TO THE BANK OF AMERICA/MERRILL LYNCH 3-MONTH T-BILL INDEX
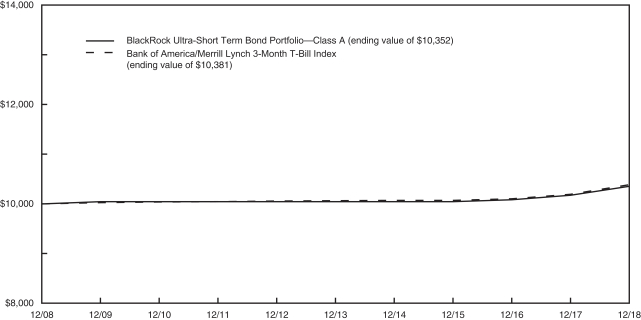
AVERAGE ANNUAL RETURNS (%) (FOR THE YEAR ENDED DECEMBER 31, 2018)
| | | | | | | | | | | | |
| | | | |
| | | 1 Year | | | 5 Year | | | 10 Year | |
| BlackRock Ultra-Short Term Bond Portfolio | | | | | | | | | | | | |
Class A | | | 1.81 | | | | 0.61 | | | | 0.35 | |
Class B | | | 1.55 | | | | 0.46 | | | | 0.25 | |
Class E | | | 1.66 | | | | 0.52 | | | | 0.29 | |
| Bank of America/Merrill Lynch3-MonthT-Bill Index | | | 1.87 | | | | 0.63 | | | | 0.38 | |
1 The Bank of America/Merrill Lynch 3-Month T-Bill Index is composed of a single 90-day Treasury Bill issue, or potentially a seasoned 6-month or 1-year Treasury Bill issue, that is replaced on a monthly basis.
Portfolio performance is calculated including reinvestment of all income and capital gain distributions. Performance numbers are net of all Portfolio expenses but do not include any insurance, sales, separate account or administrative charges of variable annuity or life insurance contracts or any additional expenses that participants may bear relating to the operations of their plans. If these charges were included, the returns would be lower. The performance of any index referenced above has not been adjusted for ongoing management, distribution and operating expenses, and sales charges applicable to mutual fund investments. Direct investment in any index is not possible. The performance of Class A shares, as set forth in the line graph above, will differ from that of other classes because of the difference in expenses paid by policyholders investing in the different share classes.
This information represents past performance and is not indicative of future results. Investment return and principal value may fluctuate so that shares, upon redemption, may be worth more or less than the original cost.
PORTFOLIO COMPOSITION AS OF DECEMBER 31, 2018
Top Issuers
| | | | |
| | | % of
Net Assets | |
| JPMorgan Chase Bank N.A. | | | 12.2 | |
| UBS AG | | | 3.8 | |
| Atlantic Asset Securitization LLC | | | 3.7 | |
| BNP Paribas S.A. (NY) | | | 3.2 | |
| Export Development Corp. | | | 3.1 | |
| Antalis S.A. | | | 3.0 | |
| Sumitomo Mitsui Trust Bank, Ltd. (NY) | | | 2.9 | |
| United Overseas Bank, Ltd. | | | 2.9 | |
| Chariot Funding LLC | | | 2.9 | |
| Sumitomo Mitsui Banking Corp. (NY) | | | 2.7 | |
BHFTII-2
Brighthouse Funds Trust II
BlackRock Ultra-Short Term Bond Portfolio
Understanding Your Portfolio’s Expenses
Shareholder Expense Example
As a shareholder of the Portfolio, you incur ongoing costs, including management fees; distribution and service(12b-1) fees; and other Portfolio expenses. This example is intended to help you understand your ongoing costs (in dollars) (referred to as “expenses”) of investing in the Portfolio and compare these costs with the ongoing costs of investing in other mutual funds. The example is based on an investment of $1,000 invested at the beginning of the period and held for the entire period, July 1, 2018 through December 31, 2018.
Actual Expenses
The first line for each share class of the Portfolio in the table below provides information about actual account values and actual expenses. You may use the information in this line, together with the amount you invested in the particular share class of the Portfolio, to estimate the expenses that you paid over the period. Simply divide your account value by $1,000 (for example, an $8,600 account value divided by $1,000 = 8.6), then multiply the result by the number in the first line under the heading entitled “Expenses Paid During Period” to estimate the expenses you paid on your account during this period.
Hypothetical Example for Comparison Purposes
The second line for each share class of the Portfolio in the table below provides information about hypothetical account values and hypothetical expenses based on the Portfolio’s actual expense ratio and an assumed rate of return of 5% per year before expenses, which is not the Portfolio’s actual return. The hypothetical account values and expenses may not be used to estimate the actual ending account balance or expenses you paid for the period. You may use this information to compare the ongoing costs of investing in the Portfolio and other funds. To do so, compare this 5% hypothetical example with the 5% hypothetical examples that appear in the shareholder reports of the other funds.
Please note that the expenses shown in the table are meant to highlight your ongoing costs only and do not reflect any fees or charges of your variable insurance product or any additional expenses that participants in certain eligible qualified plans may bear relating to the operations of their plan. Therefore, the second line for each share class in the table is useful in comparing ongoing costs only, and will not help you determine the relative total costs of owning different funds. In addition, if these other costs were included, your costs would have been higher.
| | | | | | | | | | | | | | | | | | |
BlackRock Ultra-Short Term Bond Portfolio
| | | | Annualized
Expense
Ratio | | | Beginning
Account Value
July 1,
2018 | | | Ending
Account Value
December 31,
2018 | | | Expenses Paid
During Period**
July 1, 2018
to
December 31,
2018 | |
Class A (a) | | Actual | | | 0.36 | % | | $ | 1,000.00 | | | $ | 1,010.10 | | | $ | 1.82 | |
| | Hypothetical* | | | 0.36 | % | | $ | 1,000.00 | | | $ | 1,023.39 | | | $ | 1.84 | |
| | | | | |
Class B (a) | | Actual | | | 0.61 | % | | $ | 1,000.00 | | | $ | 1,008.70 | | | $ | 3.09 | |
| | Hypothetical* | | | 0.61 | % | | $ | 1,000.00 | | | $ | 1,022.13 | | | $ | 3.11 | |
| | | | | |
Class E (a) | | Actual | | | 0.51 | % | | $ | 1,000.00 | | | $ | 1,009.30 | | | $ | 2.58 | |
| | Hypothetical* | | | 0.51 | % | | $ | 1,000.00 | | | $ | 1,022.64 | | | $ | 2.60 | |
| * | Hypothetical assumes a rate of return of 5% per year before expenses. |
| ** | Expenses paid are equal to the Portfolio’s annualized expense ratio for the most recent six month period, as shown above, multiplied by the average account value over the period, multiplied by the number of days (184 days) in the most recent fiscal half-year, divided by 365 (to reflect theone-half year period). |
| (a) | The annualized expense ratio shown reflects the impact of the management fee waiver as described in Note 4 of the Notes to Financial Statements. |
BHFTII-3
Brighthouse Funds Trust II
BlackRock Ultra-Short Term Bond Portfolio
Schedule of Investments as of December 31, 2018
Short-Term Investments—99.9% of Net Assets
| | | | | | | | |
| Security Description | | Principal
Amount* | | | Value | |
|
| Certificate of Deposit—24.8% | |
Bank of Montreal (Chicago)
2.430%, 01/23/19 | | | 8,000,000 | | | $ | 7,999,383 | |
2.571%, 1M LIBOR + 0.150%, 03/12/19 (a) | | | 7,000,000 | | | | 7,000,455 | |
2.890%, 1M LIBOR + 0.420%, 01/17/20 (a) | | | 3,500,000 | | | | 3,499,492 | |
Bank of Nova Scotia (Houston)
2.913%, 3M LIBOR + 0.200%, 09/20/19 (a) | | | 8,000,000 | | | | 7,991,205 | |
BNP Paribas S.A. (NY)
2.488%, 3M LIBOR + 0.080%, 04/04/19 (a) | | | 7,000,000 | | | | 6,999,295 | |
2.595%, 3M LIBOR + 0.150%, 04/18/19 (a) | | | 7,000,000 | | | | 6,995,992 | |
2.658%, 3M LIBOR + 0.250%, 04/08/19 (a) | | | 7,000,000 | | | | 7,002,194 | |
3.012%, 3M LIBOR + 0.190%, 09/27/19 (a) | | | 5,000,000 | | | | 5,000,000 | |
Canadian Imperial Bank of Commerce (NY)
2.547%, 1M LIBOR + 0.160%, 04/10/19 (a) | | | 7,000,000 | | | | 6,998,870 | |
2.765%, 1M LIBOR + 0.310%, 07/16/19 (a) | | | 7,000,000 | | | | 6,999,713 | |
2.806%, 1M LIBOR + 0.300%, 07/25/19 (a) | | | 6,000,000 | | | | 5,999,997 | |
Citibank N.A. (NY)
2.430%, 01/03/19 | | | 4,000,000 | | | | 3,999,978 | |
Mizuho Bank, Ltd. (NY)
2.595%, 3M LIBOR + 0.150%, 04/18/19 (a) | | | 5,000,000 | | | | 4,999,835 | |
Nordea Bank AB
2.400%, 01/28/19 | | | 14,240,000 | | | | 14,238,482 | |
Oversea-Chinese Banking Corp., Ltd.
2.595%, 1M LIBOR + 0.140%, 01/18/19 (a) | | | 8,000,000 | | | | 8,000,528 | |
Royal Bank of Canada (NY)
2.765%, 1M LIBOR + 0.310%, 08/16/19 (a) | | | 8,000,000 | | | | 7,999,152 | |
2.795%, 3M LIBOR + 0.150%, 05/20/19 (a) | | | 6,500,000 | | | | 6,500,940 | |
Skandinaviska Enskilda Banken AB
2.815%, 3M LIBOR + 0.120%, 06/14/19 (a) | | | 8,000,000 | | | | 7,999,853 | |
Standard Chartered Bank
2.922%, 3M LIBOR + 0.100%, 03/25/19 (a) | | | 7,000,000 | | | | 6,999,192 | |
Sumitomo Mitsui Banking Corp. (NY)
2.510%, 03/01/19 | | | 10,000,000 | | | | 9,998,109 | |
2.546%, 3M LIBOR + 0.110%, 04/15/19 (a) | | | 12,000,000 | | | | 11,999,624 | |
Sumitomo Mitsui Trust Bank, Ltd. (NY)
2.420%, 01/02/19 | | | 10,000,000 | | | | 9,999,984 | |
2.746%, 1M LIBOR + 0.240%, 02/26/19 (a) | | | 10,000,000 | | | | 9,996,687 | |
2.829%, 3M LIBOR + 0.200%, 08/16/19 (a) | | | 4,000,000 | | | | 3,999,967 | |
Svenska Handelsbanken AB
2.633%, 1M LIBOR + 0.250%, 05/07/19 (a) | | | 9,000,000 | | | | 8,999,997 | |
Swedbank AB
2.739%, 1M LIBOR + 0.260%, 05/21/19 (a) | | | 15,000,000 | | | | 14,988,168 | |
| | | | | | | | |
| | | | | | | 203,207,092 | |
| | | | | | | | |
|
| Commercial Paper—55.8% | |
Albion Capital Corp.
1.273%, 01/02/19 (b) | | | 14,387,000 | | | | 14,385,120 | |
Antalis S.A.
1.917%, 01/04/19 (b) | | | 14,773,000 | | | | 14,768,947 | |
2.550%, 01/24/19 (b) | | | 10,000,000 | | | | 9,983,067 | |
ASB Finance, Ltd.
2.765%, 3M LIBOR + 0.150%, 05/10/19 (a) | | | 11,750,000 | | | | 11,751,573 | |
Atlantic Asset Securitization LLC
2.306%, 01/11/19 (b) | | | 30,000,000 | | | | 29,977,129 | |
Bayeriche Landesbank (NY)
1.318%, 01/02/19 (b) | | | 7,000,000 | | | | 6,999,071 | |
2.750%, 01/03/19 (b) | | | 14,000,000 | | | | 14,000,320 | |
|
| Commercial Paper—(Continued) | |
Bedford Row Funding Corp.
2.670%, 1M LIBOR + 0.270%, 02/11/19 (a) | | | 8,000,000 | | | | 8,002,040 | |
2.689%, 1M LIBOR + 0.340%, 08/02/19 (a) | | | 5,000,000 | | | | 5,000,595 | |
Chariot Funding LLC
2.862%, 04/30/19 (b) | | | 14,000,000 | | | | 13,862,333 | |
3.043%, 06/11/19 (b) | | | 10,000,000 | | | | 9,866,170 | |
Credit Industriel et Commercial (NY)
2.498%, 03/01/19 (b) | | | 10,000,000 | | | | 9,958,840 | |
Crown Point Capital LLC
2.520%, 01/18/19 (b) | | | 7,000,000 | | | | 6,999,953 | |
2.720%, 02/06/19 (b) | | | 9,000,000 | | | | 9,001,130 | |
Erste Abwicklungsanstalt
2.720%, 03/08/19 (b) | | | 9,000,000 | | | | 8,954,105 | |
Export Development Corp.
1.267%, 01/02/19 (b) | | | 25,000,000 | | | | 24,996,803 | |
Federation des Caisses Desjardins du Quebec
2.652%, 1M LIBOR + 0.220%, 08/13/19 (a) | | | 5,300,000 | | | | 5,296,502 | |
2.770%, 1M LIBOR + 0.370%, 12/10/19 (a) | | | 7,000,000 | | | | 6,999,902 | |
HSBC Bank plc
2.637%, 3M LIBOR + 0.150%, 04/24/19 (a) | | | 8,000,000 | | | | 7,999,959 | |
3.062%, 3M LIBOR + 0.240%, 03/27/19 (a) | | | 5,000,000 | | | | 5,001,813 | |
ING U.S. Funding LLC
2.525%, 3M LIBOR + 0.100%, 04/12/19 (a) | | | 8,000,000 | | | | 7,999,980 | |
2.570%, 3M LIBOR + 0.160%, 01/07/19 (a) | | | 5,000,000 | | | | 5,000,055 | |
2.789%, 1M LIBOR + 0.310%, 05/21/19 (a) | | | 8,000,000 | | | | 8,000,104 | |
JP Morgan Securities LLC
2.468%, 01/28/19 (b) | | | 5,000,000 | | | | 4,990,029 | |
KBC Bank NV
2.553%, 02/05/19 (b) | | | 5,000,000 | | | | 4,986,785 | |
Landesbank Baden-Wuettertemberg
2.474%, 01/16/19 (b) | | | 5,000,000 | | | | 4,994,500 | |
Lloyds Bank plc
2.569%, 1M LIBOR + 0.220%, 01/02/19 (a) | | | 7,000,000 | | | | 7,000,056 | |
Macquarie Bank, Ltd., London
2.702%, 02/12/19 (b) | | | 8,000,000 | | | | 7,974,372 | |
Matchpoint Finance plc
1.227%, 01/02/19 (b) | | | 9,000,000 | | | | 8,998,729 | |
Mizuho Bank, Ltd. (NY)
2.401%, 01/30/19 (b) | | | 10,000,000 | | | | 9,979,000 | |
National Australia Bank, Ltd.
2.599%, 1M LIBOR + 0.250%, 04/02/19 (a) | | | 8,000,000 | | | | 8,001,752 | |
National Securities Clearing Corp.
2.329%, 01/11/19 (b) | | | 12,135,000 | | | | 12,126,101 | |
2.520%, 03/27/19 (b) | | | 7,000,000 | | | | 6,954,281 | |
NRW Bank
2.672%, 02/12/19 (b) | | | 7,000,000 | | | | 6,978,111 | |
2.716%, 02/22/19 (b) | | | 10,000,000 | | | | 9,960,927 | |
Old Line Funding LLC
2.840%, 04/26/19 (b) | | | 8,500,000 | | | | 8,420,381 | |
OMERS Finance Trust
2.164%, 01/09/19 (b) | | | 7,386,000 | | | | 7,381,559 | |
Oversea-Chinese Banking Corp., Ltd.
2.550%, 1M LIBOR + 0.160%, 04/08/19 (a) | | | 7,000,000 | | | | 6,999,503 | |
Sumitomo Mitsui Trust Bank, Ltd.
2.733%, 02/28/19 (b) | | | 10,000,000 | | | | 9,956,782 | |
See accompanying notes to financial statements.
BHFTII-4
Brighthouse Funds Trust II
BlackRock Ultra-Short Term Bond Portfolio
Schedule of Investments as of December 31, 2018
Short-Term Investments—(Continued)
| | | | | | | | |
| Security Description | | Principal
Amount* | | | Value | |
|
| Commercial Paper—(Continued) | |
Suncorp Group, Ltd.
2.263%, 01/09/19 (b) | | | 10,000,000 | | | $ | 9,993,632 | |
Toronto-Dominion Bank
2.687%, 1M LIBOR + 0.300%, 06/09/19 (a) | | | 5,000,000 | | | | 4,996,590 | |
2.730%, 05/10/19 (b) | | | 3,125,000 | | | | 3,123,237 | |
| UBS AG | | | | | | |
2.721%, 3M LIBOR + 0.180%, 08/01/19 (144A) (a) | | | 5,000,000 | | | | 4,999,397 | |
2.738%, 3M LIBOR + 0.330%, 04/04/19 (a) | | | 5,000,000 | | | | 5,002,633 | |
2.749%, 1M LIBOR + 0.400%, 07/02/19 (144A) (a) | | | 5,000,000 | | | | 5,001,130 | |
2.765%, 1M LIBOR + 0.420%, 05/31/19 (a) | | | 7,000,000 | | | | 7,004,459 | |
2.766%, 1M LIBOR + 0.260%, 08/28/19 (a) | | | 5,500,000 | | | | 5,497,569 | |
3.314%, 3M LIBOR + 0.320%, 12/19/19 (a) | | | 4,000,000 | | | | 3,999,994 | |
United Overseas Bank, Ltd. | |
2.302%, 01/17/19 (b) | | | 7,000,000 | | | | 6,991,858 | |
2.881%, 04/05/19 (b) | | | 7,000,000 | | | | 6,946,061 | |
2.931%, 05/17/19 (b) | | | 10,000,000 | | | | 9,890,172 | |
Westpac Banking Corp. | |
2.707%, 1M LIBOR + 0.320%, 11/08/19 (a) | | | 7,000,000 | | | | 6,997,998 | |
2.771%, 3M LIBOR + 0.180%, 11/01/19 (a) | | | 6,000,000 | | | | 5,999,970 | |
| | | | | | | | |
| | | | | | | 456,953,079 | |
| | | | | | | | |
|
| Repurchase Agreements—12.6% | |
Bank of America Securities, Inc.
Repurchase Agreement dated 12/31/18 at 2.950%, due on 01/02/19 with a maturity value of $2,750,451; collateralized by U.S. Treasury Note at 2.000%, maturing 09/30/20, with a market value of $2,792,707 | | | 2,750,000 | | | | 2,750,000 | |
JPMorgan Securities, Inc.
Repurchase Agreement dated 12/31/18 at 2.950%, due on 01/02/19 with a maturity value of $100,016,389; collateralized by U.S. Treasury Note at 1.875%, maturing 09/30/22, with a market value of $101,536,616 | | | 100,000,000 | | | | 100,000,000 | |
| | | | | | | | |
| | | | | | | 102,750,000 | |
| | | | | | | | |
| | | | | | | | |
| Security Description | | Principal
Amount* | | | Value | |
|
| U.S. Treasury—6.7% | |
U.S. Treasury Bill | |
2.185%, 01/15/19 (b) | | | 25,000,000 | | | $ | 24,979,171 | |
2.248%, 01/22/19 (b) | | | 30,000,000 | | | | 29,961,085 | |
| | | | | | | | |
| | | | | | | 54,940,256 | |
| | | | | | | | |
Total Short-Term Investments
(Cost $817,909,630) | | | | | | | 817,850,427 | |
| | | | | | | | |
Total Investments—99.9%
(Cost $817,909,630) | | | | | | | 817,850,427 | |
Other assets and liabilities (net)—0.1% | | | | | | | 1,053,808 | |
| | | | | | | | |
| Net Assets—100.0% | | | | | | $ | 818,904,235 | |
| | | | | | | | |
| | | | |
| * | | Principal amount stated in U.S. dollars unless otherwise noted. |
| (a) | | Variable or floating rate security. The stated rate represents the rate at December 31, 2018. Maturity date shown for callable securities reflects the earliest possible call date. For securities based on a published reference index and spread, the index and spread are indicated in the description above. For certain variable rate securities, the coupon rate is determined by the issuer/agent based on current market conditions. For certain asset- and mortgage-backed securities, the coupon rate may fluctuate based on changes of the underlying collateral or prepayments of principal. These securities do not indicate a reference index and spread in their description above. |
| (b) | | The rate shown represents current yield to maturity. |
| (144A)— | | Securities exempt from registration under Rule 144A of the Securities Act of 1933. These securities may be resold in transactions exempt from registration, normally to qualified institutional buyers. As of December 31, 2018, the market value of 144A securities was $10,000,527, which is 1.2% of net assets. |
| (LIBOR)— | | London Interbank Offered Rate |
See accompanying notes to financial statements.
BHFTII-5
Brighthouse Funds Trust II
BlackRock Ultra-Short Term Bond Portfolio
Schedule of Investments as of December 31, 2018
Fair Value Hierarchy
Accounting principles generally accepted in the United States of America (“GAAP”) define fair market value as the price that the Portfolio would receive to sell an asset or pay to transfer a liability in an orderly transaction between market participants at the measurement date. It establishes a fair value hierarchy that prioritizes inputs to valuation methods and requires disclosure of the fair value hierarchy, separately for each major category of assets and liabilities, that segregates fair value measurements into three levels. Levels 1, 2 and 3 of the fair value hierarchy are defined as follows:
Level 1 - unadjusted quoted prices in active markets for identical investments
Level 2 - other significant observable inputs (including, but not limited to, quoted prices for similar assets or liabilities in markets that are either active or inactive; inputs other than quoted prices that are observable such as interest rates, yield curves, volatilities, prepayment speeds, loss severities, credit risks, default rates, or other market corroborated inputs)
Level 3 - significant unobservable inputs based on the best information available in the circumstances, to the extent observable inputs are unavailable (including the Portfolio’s own assumptions used in determining the fair value of investments and derivative financial instruments)
The inputs or methodologies used for valuing investments are not necessarily an indication of the risk associated with investing in them. Changes to the inputs or methodologies used may result in transfers between levels. A reconciliation of Level 3 securities, if any, will be disclosed following the fair value hierarchy table. For more information about the Portfolio’s policy regarding the valuation of investments, please refer to the Notes to Financial Statements.
The following table summarizes the fair value hierarchy of the Portfolio’s investments as of December 31, 2018:
| | | | | | | | | | | | | | | | |
| Description | | Level 1 | | | Level 2 | | | Level 3 | | | Total | |
Total Short-Term Investments* | | $ | — | | | $ | 817,850,427 | | | $ | — | | | $ | 817,850,427 | |
Total Investments | | $ | — | | | $ | 817,850,427 | | | $ | — | | | $ | 817,850,427 | |
| | | | | | | | | | | | | | | | | |
| | | | |
| | * See Schedule of Investments for additional detailed categorizations. |
See accompanying notes to financial statements.
BHFTII-6
Brighthouse Funds Trust II
BlackRock Ultra-Short Term Bond Portfolio
Statement of Assets and Liabilities
December 31, 2018
| | | | |
Assets | |
Investments at value (a) | | $ | 715,100,427 | |
Repurchase Agreements at value which equals cost | | | 102,750,000 | |
Cash | | | 23,300 | |
Receivable for: | | | | |
Fund shares sold | | | 902,920 | |
Interest | | | 1,302,459 | |
Prepaid expenses | | | 2,092 | |
| | | | |
Total Assets | | | 820,081,198 | |
Liabilities | |
Payables for: | |
Fund shares redeemed | | | 595,381 | |
Accrued Expenses: | |
Management fees | | | 254,664 | |
Distribution and service fees | | | 98,562 | |
Deferred trustees’ fees | | | 111,631 | |
Other expenses | | | 116,725 | |
| | | | |
Total Liabilities | | | 1,176,963 | |
| | | | |
Net Assets | | $ | 818,904,235 | |
| | | | |
Net Assets Consist of: | |
Paid in surplus | | $ | 805,869,815 | |
Distributable earnings (Accumulated losses) | | | 13,034,420 | |
| | | | |
Net Assets | | $ | 818,904,235 | |
| | | | |
Net Assets | |
Class A | | $ | 307,936,890 | |
Class B | | | 412,450,705 | |
Class E | | | 98,516,640 | |
Capital Shares Outstanding* | |
Class A | | | 3,031,564 | |
Class B | | | 4,065,008 | |
Class E | | | 970,352 | |
Net Asset Value, Offering Price and Redemption Price Per Share | |
Class A | | $ | 101.58 | |
Class B | | | 101.46 | |
Class E | | | 101.53 | |
| | | | |
| * | | The Portfolio is authorized to issue an unlimited number of shares. |
| (a) | | Identified cost of investments, excluding repurchase agreements, was $715,159,630. |
Statement of Operations
Year Ended December 31, 2018
| | | | |
Investment Income | |
Interest | | $ | 17,431,707 | |
| | | | |
Total investment income | | | 17,431,707 | |
Expenses | |
Management fees | | | 2,844,625 | |
Administration fees | | | 33,661 | |
Custodian and accounting fees | | | 62,346 | |
Distribution and service fees—Class B | | | 993,914 | |
Distribution and service fees—Class E | | | 159,943 | |
Audit and tax services | | | 32,428 | |
Legal | | | 45,317 | |
Trustees’ fees and expenses | | | 33,734 | |
Shareholder reporting | | | 78,105 | |
Insurance | | | 5,424 | |
Miscellaneous | | | 14,914 | |
| | | | |
Total expenses | | | 4,304,411 | |
Less management fee waiver | | | (203,187 | ) |
| | | | |
Net expenses | | | 4,101,224 | |
| | | | |
Net Investment Income | | | 13,330,483 | |
| | | | |
Net Realized and Unrealized Gain (Loss) | |
Net realized gain on investments | | | 4,146 | |
| | | | |
Net change in unrealized depreciation on investments | | | (14,880 | ) |
| | | | |
Net realized and unrealized loss | | | (10,734 | ) |
| | | | |
Net Increase in Net Assets From Operations | | $ | 13,319,749 | |
| | | | |
See accompanying notes to financial statements.
BHFTII-7
Brighthouse Funds Trust II
BlackRock Ultra-Short Term Bond Portfolio
Statements of Changes in Net Assets
| | | | | | | | |
| | | Year Ended
December 31,
2018 | | | Year Ended
December 31,
2017 | |
Increase (Decrease) in Net Assets: | |
From Operations | |
Net investment income | | $ | 13,330,483 | | | $ | 6,961,274 | |
Net realized gain | | | 4,146 | | | | 38,219 | |
Net change in unrealized depreciation | | | (14,880 | ) | | | (321,313 | ) |
| | | | | | | | |
Increase in net assets from operations | | | 13,319,749 | | | | 6,678,180 | |
| | | | | | | | |
From Distributions to Shareholders (a) | |
Class A | | | (3,163,167 | ) | | | (1,179,689 | ) |
Class B | | | (2,959,848 | ) | | | (338,609 | ) |
Class E | | | (916,931 | ) | | | (217,292 | ) |
| | | | | | | | |
Total distributions | | | (7,039,946 | ) | | | (1,735,590 | ) |
| | | | | | | | |
Decrease in net assets from capital share transactions | | | (31,264,205 | ) | | | (133,229,625 | ) |
| | | | | | | | |
Total decrease in net assets | | | (24,984,402 | ) | | | (128,287,035 | ) |
|
Net Assets | |
Beginning of period | | | 843,888,637 | | | | 972,175,672 | |
| | | | | | | | |
End of period | | $ | 818,904,235 | | | $ | 843,888,637 | (b) |
| | | | | | | | |
Other Information:
Capital Shares
Transactions in capital shares were as follows:
| | | | | | | | | | | | | | | | |
| | | Year Ended
December 31, 2018 | | | Year Ended
December 31, 2017 | |
| | | Shares | | | Value | | | Shares | | | Value | |
Class A | |
Sales | | | 1,271,421 | | | $ | 128,523,646 | | | | 1,151,677 | | | $ | 115,741,452 | |
Reinvestments | | | 31,481 | | | | 3,163,167 | | | | 11,762 | | | | 1,179,689 | |
Redemptions | | | (1,332,136 | ) | | | (134,694,295 | ) | | | (1,644,910 | ) | | | (165,301,654 | ) |
| | | | | | | | | | | | | | | | |
Net decrease | | | (29,234 | ) | | $ | (3,007,482 | ) | | | (481,471 | ) | | $ | (48,380,513 | ) |
| | | | | | | | | | | | | | | | |
Class B | |
Sales | | | 1,727,443 | | | $ | 174,497,711 | | | | 1,165,911 | | | $ | 117,009,779 | |
Reinvestments | | | 29,448 | | | | 2,959,848 | | | | 3,376 | | | | 338,609 | |
Redemptions | | | (1,841,534 | ) | | | (185,896,483 | ) | | | (1,809,709 | ) | | | (181,623,509 | ) |
| | | | | | | | | | | | | | | | |
Net decrease | | | (84,643 | ) | | $ | (8,438,924 | ) | | | (640,422 | ) | | $ | (64,275,121 | ) |
| | | | | | | | | | | | | | | | |
Class E | |
Sales | | | 172,508 | | | $ | 17,426,393 | | | | 167,051 | | | $ | 16,780,356 | |
Reinvestments | | | 9,123 | | | | 916,931 | | | | 2,166 | | | | 217,292 | |
Redemptions | | | (377,825 | ) | | | (38,161,123 | ) | | | (374,119 | ) | | | (37,571,639 | ) |
| | | | | | | | | | | | | | | | |
Net decrease | | | (196,194 | ) | | $ | (19,817,799 | ) | | | (204,902 | ) | | $ | (20,573,991 | ) |
| | | | | | | | | | | | | | | | |
Decrease derived from capital shares transactions | | | | | | $ | (31,264,205 | ) | | | | | | $ | (133,229,625 | ) |
| | | | | | | | | | | | | | | | |
| | | | |
| (a) | | Distributions from net investment income and realized gains are no longer required to be separately disclosed. The presentation for the year ended December 31, 2018 has been adjusted for this change (See Note 7). At December 31, 2017 the distributions were as follows. |
| | | | | | | | |
| | | Distributions from net
investment income: | | | Distributions from realized
capital gains: | |
Class A | | $ | (1,172,909 | ) | | $ | (6,780 | ) |
Class B | | | (329,579 | ) | | | (9,030 | ) |
Class E | | | (214,780 | ) | | | (2,512 | ) |
| | | | |
| (b) | | As part of the update in (a), it is also no longer required to disclose the Undistributed net investment income (Accumulated losses) which was $6,775,731 as of December 31, 2017. |
See accompanying notes to financial statements.
BHFTII-8
Brighthouse Funds Trust II
BlackRock Ultra-Short Term Bond Portfolio
Financial Highlights
| | | | | | | | | | | | | | | | | | | | |
| Selected per share data | |
| | | Class A | |
| | | Year Ended December 31, | |
| | | 2018 | | | 2017 | | | 2016 | | | 2015 | | | 2014 | |
Net Asset Value, Beginning of Period | | $ | 100.82 | | | $ | 100.28 | | | $ | 100.00 | | | $ | 100.00 | | | $ | 100.00 | |
| | | | | | | | | | | | | | | | | | | | |
Income (Loss) from Investment Operations | |
Net investment income (a) | | | 1.81 | | | | 0.92 | | | | 0.32 | (b) | | | 0.00 | (c) | | | 0.00 | |
Net realized and unrealized gain (loss) | | | 0.00 | (d) | | | (0.03 | ) | | | 0.03 | | | | 0.00 | | | | 0.00 | |
| | | | | | | | | | | | | | | | | | | | |
Total income (loss) from investment operations | | | 1.81 | | | | 0.89 | | | | 0.35 | | | | 0.00 | (c) | | | 0.00 | |
| | | | | | | | | | | | | | | | | | | | |
Less Distributions | |
Distributions from net investment income | | | (1.04 | ) | | | (0.35 | ) | | | (0.07 | ) | | | (0.00 | )(e) | | | 0.00 | |
Distributions from net realized capital gains | | | (0.01 | ) | | | (0.00 | )(f) | | | (0.00 | )(f) | | | 0.00 | | | | 0.00 | |
| | | | | | | | | | | | | | | | | | | | |
Total distributions | | | (1.05 | ) | | | (0.35 | ) | | | (0.07 | ) | | | (0.00 | )(e) | | | 0.00 | |
| | | | | | | | | | | | | | | | | | | | |
Net Asset Value, End of Period | | $ | 101.58 | | | $ | 100.82 | | | $ | 100.28 | | | $ | 100.00 | | | $ | 100.00 | |
| | | | | | | | | | | | | | | | | | | | |
Total Return (%) (g) | | | 1.81 | | | | 0.89 | | | | 0.35 | | | | 0.00 | | | | 0.00 | |
|
Ratios/Supplemental Data | |
Gross ratio of expenses to average net assets (%) | | | 0.39 | | | | 0.39 | | | | 0.38 | | | | 0.37 | | | | 0.37 | |
Net ratio of expenses to average net assets (%) (h) | | | 0.36 | | | | 0.36 | | | | 0.35 | | | | 0.25 | | | | 0.20 | |
Ratio of net investment income to average net assets (%) | | | 1.79 | | | | 0.91 | | | | 0.32 | (b) | | | 0.00 | (i) | | | 0.00 | |
Portfolio turnover rate (%) | | | 0 | (j) | | | 0 | (j) | | | 0 | (j) | | | N/A | | | | N/A | |
Net assets, end of period (in millions) | | $ | 307.9 | | | $ | 308.6 | | | $ | 355.2 | | | $ | 406.8 | | | $ | 483.7 | |
| |
| | | Class B | |
| | | Year Ended December 31, | |
| | | 2018 | | | 2017 | | | 2016 | | | 2015 | | | 2014 | |
Net Asset Value, Beginning of Period | | $ | 100.68 | | | $ | 100.11 | | | $ | 100.00 | | | $ | 100.00 | | | $ | 100.00 | |
| | | | | | | | | | | | | | | | | | | | |
Income (Loss) from Investment Operations | |
Net investment income (a) | | | 1.55 | | | | 0.66 | | | | 0.08 | (b) | | | 0.00 | | | | 0.00 | |
Net realized and unrealized gain (loss) | | | 0.00 | (d) | | | (0.02 | ) | | | 0.03 | | | | 0.00 | | | | 0.00 | |
| | | | | | | | | | | | | | | | | | | | |
Total income (loss) from investment operations | | | 1.55 | | | | 0.64 | | | | 0.11 | | | | 0.00 | | | | 0.00 | |
| | | | | | | | | | | | | | | | | | | | |
Less Distributions | |
Distributions from net investment income | | | (0.76 | ) | | | (0.07 | ) | | | (0.00 | )(e) | | | 0.00 | | | | 0.00 | |
Distributions from net realized capital gains | | | (0.01 | ) | | | (0.00 | )(f) | | | (0.00 | )(f) | | | 0.00 | | | | 0.00 | |
| | | | | | | | | | | | | | | | | | | | |
Total distributions | | | (0.77 | ) | | | (0.07 | ) | | | (0.00 | ) | | | 0.00 | | | | 0.00 | |
| | | | | | | | | | | | | | | | | | | | |
Net Asset Value, End of Period | | $ | 101.46 | | | $ | 100.68 | | | $ | 100.11 | | | $ | 100.00 | | | $ | 100.00 | |
| | | | | | | | | | | | | | | | | | | | |
Total Return (%) (g) | | | 1.55 | | | | 0.63 | | | | 0.11 | | | | 0.00 | | | | 0.00 | |
|
Ratios/Supplemental Data | |
Gross ratio of expenses to average net assets (%) | | | 0.64 | | | | 0.64 | | | | 0.63 | | | | 0.62 | | | | 0.62 | |
Net ratio of expenses to average net assets (%) (h) | | | 0.61 | | | | 0.61 | | | | 0.59 | | | | 0.25 | | | | 0.20 | |
Ratio of net investment income to average net assets (%) | | | 1.53 | | | | 0.66 | | | | 0.08 | (b) | | | 0.00 | | | | 0.00 | |
Portfolio turnover rate (%) | | | 0 | (j) | | | 0 | (j) | | | 0 | (j) | | | N/A | | | | N/A | |
Net assets, end of period (in millions) | | $ | 412.5 | | | $ | 417.8 | | | $ | 479.6 | | | $ | 547.0 | | | $ | 554.2 | |
Please see following page for Financial Highlights footnote legend.
See accompanying notes to financial statements.
BHFTII-9
Brighthouse Funds Trust II
BlackRock Ultra-Short Term Bond Portfolio
Financial Highlights
| | | | | | | | | | | | | | | | | | | | |
| Selected per share data | |
| | | Class E | |
| | | Year Ended December 31, | |
| | | 2018 | | | 2017 | | | 2016 | | | 2015 | | | 2014 | |
Net Asset Value, Beginning of Period | | $ | 100.74 | | | $ | 100.18 | | | $ | 100.00 | | | $ | 100.00 | | | $ | 100.00 | |
| | | | | | | | | | | | | | | | | | | | |
Income (Loss) from Investment Operations | |
Net investment income (a) | | | 1.64 | | | | 0.76 | | | | 0.17 | (b) | | | 0.00 | | | | 0.00 | |
Net realized and unrealized gain (loss) | | | 0.02 | | | | (0.03 | ) | | | 0.03 | | | | 0.00 | | | | 0.00 | |
| | | | | | | | | | | | | | | | | | | | |
Total income (loss) from investment operations | | | 1.66 | | | | 0.73 | | | | 0.20 | | | | 0.00 | | | | 0.00 | |
| | | | | | | | | | | | | | | | | | | | |
Less Distributions | |
Distributions from net investment income | | | (0.86 | ) | | | (0.17 | ) | | | (0.02 | ) | | | 0.00 | | | | 0.00 | |
Distributions from net realized capital gains | | | (0.01 | ) | | | (0.00 | )(f) | | | (0.00 | )(f) | | | 0.00 | | | | 0.00 | |
| | | | | | | | | | | | | | | | | | | | |
Total income (loss) distributions | | | (0.87 | ) | | | (0.17 | ) | | | (0.02 | ) | | | 0.00 | | | | 0.00 | |
| | | | | | | | | | | | | | | | | | | | |
Net Asset Value, End of Period | | $ | 101.53 | | | $ | 100.74 | | | $ | 100.18 | | | $ | 100.00 | | | $ | 100.00 | |
| | | | | | | | | | | | | | | | | | | | |
Total Return (%) (g) | | | 1.66 | | | | 0.73 | | | | 0.20 | | | | 0.00 | | | | 0.00 | |
|
Ratios/Supplemental Data | |
Gross ratio of expenses to average net assets (%) | | | 0.54 | | | | 0.54 | | | | 0.53 | | | | 0.52 | | | | 0.52 | |
Net ratio of expenses to average net assets (%) (h) | | | 0.51 | | | | 0.51 | | | | 0.50 | | | | 0.25 | | | | 0.20 | |
Ratio of net investment income to average net assets (%) | | | 1.62 | | | | 0.76 | | | | 0.17 | (b) | | | 0.00 | | | | 0.00 | |
Portfolio turnover rate (%) | | | 0 | (j) | | | 0 | (j) | | | 0 | (j) | | | N/A | | | | N/A | |
Net assets, end of period (in millions) | | $ | 98.5 | | | $ | 117.5 | | | $ | 137.4 | | | $ | 154.2 | | | $ | 175.5 | |
| | | | |
| (a) | | Per share amounts based on average shares outstanding during the period. |
| (b) | | Net investment income per share and the ratio of net investment income to average net assets include anon-recurring refund for overbilling of prior years’ custodianout-of-pocket fees which amounted to $0.01 per share and 0.01% of average net assets, respectively. |
| (c) | | Net investment income (loss) was less than $0.01. |
| (d) | | Net realized and unrealized gain (loss) on investments was less than $0.01. |
| (e) | | Distributions from net investment income were less than $0.01. |
| (f) | | Distributions from net realized capital gains were less than $0.01. |
| (g) | | Total return does not reflect any insurance, sales, separate account or administrative charges of variable annuity or life insurance contracts or any additional expenses that contract owners may bear under their variable contracts. If these charges were included, the returns would be lower. |
| (h) | | Includes the effects of the management fee waivers and voluntary distribution & service fee waiver (see Note 4 of the Notes to Financial Statements). |
| (i) | | Ratio of net investment income (loss) to average net assets was less than 0.01%. |
| (j) | | There were no long term transactions during the years ended December 31, 2018, 2017 and 2016. |
See accompanying notes to financial statements.
BHFTII-10
Brighthouse Funds Trust II
BlackRock Ultra-Short Term Bond Portfolio
Notes to Financial Statements—December 31, 2018
1. Organization
Brighthouse Funds Trust II (the “Trust”) is organized as a Delaware statutory trust and registered under the Investment Company Act of 1940, as amended (the “1940 Act”), as anopen-end management investment company. The Trust, which is managed by Brighthouse Investment Advisers, LLC (“Brighthouse Investment Advisers” or the “Adviser”), currently offers twenty-nine series, each of which operates as a distinct investment vehicle of the Trust. The series included in this report is BlackRock Ultra-Short Term Bond Portfolio (the “Portfolio”), which is diversified. Shares in the Portfolio are not offered directly to the general public and are currently available only to separate accounts established by life insurance companies affiliated with the Adviser and Metropolitan Life Insurance Company (the “Insurance Companies”).
The Portfolio has registered and offers three classes of shares: Class A, B and E shares. Shares of each Class of the Portfolio represent an equal pro rata interest in the Portfolio and generally give the shareholder the same voting, dividend, liquidation, and other rights. Investment income, realized and unrealized capital gains and losses, the common expenses of the Portfolio, and certain Portfolio-level expense reductions, if any, are allocated on a pro rata basis to each Class based on the relative net assets of each Class to the net assets of the Portfolio. Each Class of shares differs in its respective distribution plan and such distribution expenses are allocated to the corresponding Class of shares.
2. Significant Accounting Policies
The preparation of financial statements in conformity with accounting principles generally accepted in the United States of America (“GAAP”) requires management to make estimates and assumptions that affect the reported amounts of assets and liabilities and disclosure of contingent assets and liabilities as of the date of the financial statements and the reported amounts of income and expenses during the reporting period. Actual results could differ from those estimates. In the preparation of these financial statements, management has evaluated events and transactions subsequent to December 31, 2018 through the date the financial statements were issued.
The Portfolio is an investment company and follows the accounting and reporting guidance of the Financial Accounting Standards Board (“FASB”) Accounting Standards Codification Topic 946—Financial Services—Investment Companies. The following is a summary of significant accounting policies consistently followed by the Portfolio in the preparation of its financial statements.
Investment Valuation and Fair Value Measurements -The Portfolio values its portfolio investments for purposes of calculating its net asset value (“NAV”) using procedures approved by the Board of Trustees of the Trust (the “Board” or “Trustees”). Those procedures allow for a variety of methodologies to be used to value the Portfolio’s investments. The specific methodologies used for a particular investment may vary based on the market data available for a specific investment at the time the Portfolio calculates its NAV or based on other considerations. The procedures also permit a level of judgment to be used in the valuation process. The Portfolio follows the accounting and reporting guidance of FASB Accounting Standards Codification Topic 820—Fair Value Measurement.
Debt securities, including corporate, convertible and municipal bonds and notes; obligations of the U.S. Treasury and U.S. government agencies; foreign sovereign issues; andnon-U.S. bonds, are generally valued on the basis of evaluated or composite bid quotations obtained from independent pricing services and/or brokers and dealers selected by the Adviser (each as “pricing services”), pursuant to the authorization of and subject to general oversight by the Board. Such pricing services may use matrix pricing, which considers observable inputs including, among other things, issuer details, maturity dates, interest rates, yield curves, rates of prepayment, credit risks/spreads, default rates, reported trades, broker-dealer quotes and quoted prices for similar assets. Short-term obligations with a remaining maturity of sixty days or less may be valued at amortized cost in the absence of market quotes, so long as the amortized cost value of such short-term debt instrument is approximately the same as the fair value of the instrument as determined without the use of amortized cost valuation. Floating rate loans are generally valued on the basis of an evaluated or composite average of aggregate bid and ask quotations supplied by brokers or dealers, as obtained from the pricing service. Securities that use similar valuation techniques and inputs as described above are generally categorized as Level 2 within the fair value hierarchy.
If no current market value quotation or other observable inputs are readily available or market value quotations are deemed to be unreliable for an investment, the fair value of the investment will be determined in accordance with procedures approved by, and under the general supervision of, the Board. In such a circumstance, the Board will be assisted in its responsibility to determine the fair value of an investment by the Valuation Committee (“Committee”) of Brighthouse Investment Advisers. The Committee provides general pricing oversight and fair value pricing determinations related to portfolio securities and meets on a regular basis to review reports relating to the valuation of the securities in the Portfolio. The Board has delegated to State Street Bank and Trust Company, the Trust’s custodian (“Custodian”), the responsibility for calculating the NAVs of the Trust’s Portfolios. The Committee is responsible for overseeing the calculation of the NAVs of the Portfolios by the custodian. The Committee also periodically reviews pricing services, including the pricing services providing fair value pricing for the Portfolio’s foreign securities, and is responsible for overseeing the correction of pricing errors and addressing other pricing issues that arise in the ordinary course of business, such as making real-time fair value determinations, as necessary.
BHFTII-11
Brighthouse Funds Trust II
BlackRock Ultra-Short Term Bond Portfolio
Notes to Financial Statements—December 31, 2018—(Continued)
No single standard for determining the fair value of an investment can be set forth because fair value depends upon the facts and circumstances with respect to each investment. Information relating to any relevant factors may be obtained by the Committee from any appropriate source, including the subadviser of the Portfolio, the custodian, a pricing service, market maker and/or broker for such security or the issuer. Appropriate methodologies for determining fair value under particular circumstances may include: matrix pricing, a discounted cash flow analysis, comparisons of securities with comparable characteristics, value based on multiples of earnings, discount from market price of similar marketable securities, or a combination of these and other methods.
Investment Transactions and Related Investment Income - Portfolio security transactions are recorded on the trade date. Dividend income is recorded on theex-dividend date or, for certain foreign securities, when notified. Interest income, which includes amortization of premium and accretion of discount on debt securities, is recorded on the accrual basis. Realized gains and losses on investments are determined on the identified cost basis, which is the same basis used for federal income tax purposes. Foreign income and foreign capital gains on some foreign securities may be subject to foreign taxes, which are accrued as applicable. These foreign taxes have been provided for in accordance with the Portfolio’s understanding of the applicable countries’ tax rules and rates.
Dividends and Distributions to Shareholders -The Portfolio records dividends and distributions on theex-dividend date. Net realized gains from securities transactions (if any) are generally distributed annually to shareholders. The timing and characterization of certain income and capital gains distributions are determined in accordance with federal tax regulations that may differ from GAAP. Permanent book and tax basis differences relating to shareholder distributions will result in reclassification between distributable earnings (accumulated losses) andpaid-in surplus. These adjustments have no impact on net assets or the results of operations.
Income Taxes -It is the Portfolio’s policy to comply with the requirements of the Internal Revenue Code of 1986, as amended, and regulations thereunder, applicable to regulated investment companies, and to distribute, with respect to each taxable year, all of its taxable income to shareholders. Therefore, no federal income tax provision is required. The Portfolio files U.S. federal tax returns. No income tax returns are currently under examination. The Portfolio’s federal tax returns for the prior three fiscal years remain subject to examination by the Internal Revenue Service. As of December 31, 2018, the Portfolio had no uncertain tax positions that would require financial statement recognition, or derecognition or disclosure.
Repurchase Agreements -The Portfolio may enter into repurchase agreements, under the terms of a Master Repurchase Agreement (“MRA”), with selected commercial banks and broker-dealers, under which the Portfolio acquires securities as collateral and agrees to resell the securities at an agreed-upon time and at an agreed-upon price. The Portfolio, through the Custodian or a subcustodian, under atri-party repurchase agreement, receives delivery of the underlying securities collateralizing any repurchase agreements. It is the Portfolio’s policy that the market value of the collateral be equal to at least 100% of the repurchase price in the case of a repurchase agreement ofone-day duration and equal to at least 102% of the repurchase price in the case of all other repurchase agreements. In the event of default or failure by a party to perform an obligation in connection with any repurchase transaction, the MRA gives thenon-defaulting party the right toset-off claims and to apply property held by it in connection with any repurchase transaction against obligations owed to it.
At December 31, 2018, the Portfolio had investments in repurchase agreements with a gross value of $102,750,000, which is reflected as repurchase agreement on the Statement of Assets and Liabilities. The value of the related collateral exceeded the value of the repurchase agreements at December 31, 2018.
3. Certain Risks
In the normal course of business, the Portfolio invests in securities and enters into transactions where risks exist. Those risks include:
Market Risk:The value of securities held by the Portfolio may decline in response to certain events, including those directly involving the issuers whose securities are owned by the Portfolio; conditions affecting the general economy; overall market changes; local, regional or global political, social or economic instability; and currency, interest rate, and price fluctuations.
Credit and Counterparty Risk: The Portfolio may be exposed to counterparty risk, or the risk that an entity with which the Portfolio has unsettled or open transactions may default. The potential loss could exceed the value of the financial assets and liabilities recorded in the financial statements. Financial assets that potentially expose the Portfolio to credit and counterparty risk consist principally of cash due from counterparties and investments. The Portfolio manages counterparty risk by entering into agreements only with counterparties that it believes have the financial resources to honor their obligations and by monitoring the financial stability of those counterparties. The Adviser attempts to mitigate counterparty risk by (i) periodically assessing the creditworthiness of its trading partners, (ii) monitoring and/or limiting the amount of its net exposure to each individual counterparty based on its assessment, and (iii) requiring collateral from the counterparty for certain transactions. In order to preserve certain safeguards fornon-standard settlement trades, the Portfolio restricts its exposure to credit and counterparty losses by entering into master netting agreements (“Master Agreements”) with counterparties (approved brokers) with whom it undertakes a significant volume of transactions. Master Agreements govern the terms of certain transactions, and reduce the counterparty risk associated with relevant
BHFTII-12
Brighthouse Funds Trust II
BlackRock Ultra-Short Term Bond Portfolio
Notes to Financial Statements—December 31, 2018—(Continued)
transactions by specifying credit protection mechanisms and providing standardization that improves legal certainty. Master Agreements can also help limit counterparty risk by specifying collateral posting arrangements atpre-arranged exposure levels.
Repurchase and reverse repurchase agreements are primarily executed under Global Master Repurchase Agreements (“GMRAs”) or Master Repurchase Agreements (“MRAs”), which provide the rights toset-off. Each repurchase and reverse repurchase agreement is initially collateralized at the transaction level. In the event of default, the total market value exposure will be offset against collateral exchanged to date, which would result in a net receivable/(payable) that would be due from/to the counterparty.
Additional risks associated with each type of investment are described above within the respective security type notes. The Portfolio’s prospectus includes a discussion of the principal risks of investing in the Portfolio.
4. Investment Management Fees and Other Transactions with Affiliates
Investment Management Agreement -Brighthouse Investment Advisers is the investment adviser to the Portfolio. The Trust has entered into an investment management agreement with Brighthouse Investment Advisers with respect to the Portfolio. For providing investment management services to the Portfolio, Brighthouse Investment Advisers receives monthly compensation at the following annual rates:
| | | | | | |
Management
Fees earned by
Brighthouse
Investment Advisers
for the year ended
December 31, 2018 | | % per annum | | | Average Daily Net Assets |
| $2,844,625 | | | 0.350 | % | | Of the first $1 billion |
| | | 0.300 | % | | Of amount in excess of $1 billion |
Brighthouse Investment Advisers has entered into an investment subadvisory agreement with respect to managing the Portfolio. BlackRock Advisors, LLC (the “Subadviser”) is compensated by Brighthouse Investment Advisers to provide subadvisory services for the Portfolio.
Management Fee Waivers- Pursuant to an expense agreement, Brighthouse Investment Advisers has agreed, for the period April 30, 2018 to April 30, 2019, to reduce its advisory fees set out above under “Investment Management Agreement” as follows:
| | | | |
% per annum | | Average Daily Net Assets | |
| 0.025% | | | Of the first $1 billion | |
For the period May 1, 2017 to April 30, 2018, an identical expense agreement was in place. Amounts waived for the year ended December 31, 2018 are shown as management fee waivers in the Statement of Operations.
Certain officers and trustees of the Trust may also be officers of Brighthouse Investment Advisers; however, such officers and trustees receive no compensation from the Trust.
Transfer Agency Agreement -Brighthouse Financial, Inc. serves as the transfer agent for the Trust. Brighthouse Financial, Inc. receives no fees for its services to the Trust.
Distribution and Service Fees - The Trust has a distribution agreement with Brighthouse Securities, LLC (the “Distributor”) pursuant to which the Distributor serves as the general distributor of shares of each class (each a “Class”) of each Portfolio. The Distributor is an affiliate of the Trust. The Trust has adopted a Distribution and Services Plan (the “Plan”) relating to Class B and Class E shares of each Portfolio, under Rule 12b-1 under the 1940 Act, pursuant to which the Trust may pay the Distributor a fee (the “Service Fee”) at an annual rate not to exceed 0.25% of each such Portfolio’s average daily net assets attributable to the Class B and Class E shares of the Trust. Each Portfolio may not offer shares of each Class. The Plan also authorizes the Trust, on behalf of each of its Portfolios, may pay the Distributor a distribution Fee (the “Distribution Fee” and together with the Service Fee, the “Fees”) at an annual rate of up to 0.25% of each Portfolio’s average daily net assets attributable to the Class B and Class E shares in consideration of the services rendered in connection with the sale of such shares by the Distributor. Under the Distribution Agreement with respect to the Trust, Fees are currently paid at an annual rate of 0.25% of average daily net assets in the case of Class B shares and 0.15% of average daily net assets in the case of Class E shares. The Plan is known as a “compensation plan” because the Trust makes payments to the Distributor for services rendered regardless of the average daily net assets attributable to the Class B, Class D, Class E and Class G shares of the Trust. Each Portfolio may not offer shares of each Class. The Plan also authorizes the Trust, on behalf of each of its Portfolios, may pay the Distributor a Distribution Fee at an annual rate of up to 0.25% of each Portfolio’s average daily net assets attributable to the Class B, Class D, Class E and Class G shares in consideration of the services rendered in connection with the sale of such shares by the Distributor. Under the Distribution Agreement with respect to the Trust, Fees are currently paid at an annual rate of 0.25% of average daily net assets in the case of Class B shares, 0.10% of average daily net assets in the case of Class D shares, 0.15%
BHFTII-13
Brighthouse Funds Trust II
BlackRock Ultra-Short Term Bond Portfolio
Notes to Financial Statements—December 31, 2018—(Continued)
of average daily net assets in the case of Class E shares and 0.30% of average daily net assets in the case of Class G shares. The Plan is known as a “compensation plan” because the Trust makes payments to the Distributor for services rendered regardless of the actual level of expenditures by the Distributor. Amounts incurred by the Portfolio for the year ended December 31, 2018 are shown as Distribution and service fees in the Statement of Operations.
Deferred Trustee Compensation -Each Trustee who is not currently an employee of the Adviser or any of its affiliates receives compensation from the Trust for his or her service to the Trust. A deferred compensation plan (the “Plan”) is available to the Trustees on a voluntary basis. Deferred amounts remain in the Trust until distributed in accordance with the provisions of the Plan. The value of a participating Trustee’s deferral account is based on theoretical investments of deferred amounts on the normal payment dates in certain portfolios of the Trust or Brighthouse Funds Trust I, an affiliate of the Trust, as designated by the participating Trustee. Changes in the value of participants’ deferral accounts are reflected as Trustees’ fees and expenses in the Statement of Operations. The portion of the accrued obligations allocated to the Portfolio under the Plan is reflected as Deferred trustees’ fees in the Statement of Assets and Liabilities.
5. Contractual Obligations
Under the Trust’s organizational documents, its officers and Trustees may be indemnified against certain liabilities and expenses arising out of the performance of their duties to the Trust. Additionally, the Trust has a variety of indemnification obligations under contracts with its service providers. The Trust’s maximum exposure under these arrangements is unknown, as this would involve future claims that may be made against the Trust that have not yet occurred.
6. Income Tax Information
The cost basis of investments for federal income tax purposes at December 31, 2018 was as follows:
| | | | |
Cost basis of investments | | $ | 817,909,631 | |
Gross unrealized appreciation | | | 24,456 | |
Gross unrealized depreciation | | | (83,660 | ) |
| | | | |
Net unrealized appreciation (depreciation) | | $ | (59,204 | ) |
| | | | |
The tax character of distributions paid for the years ended December 31, 2018 and 2017 were as follows:
| | | | | | | | | | | | | | | | | | | | |
Ordinary Income | | | Long-Term Capital Gain | | | Total | |
2018 | | 2017 | | | 2018 | | | 2017 | | | 2018 | | | 2017 | |
| $7,039,946 | | $ | 1,735,590 | | | $ | — | | | $ | — | | | $ | 7,039,946 | | | $ | 1,735,590 | |
As of December 31, 2018, the components of distributable earnings (accumulated losses) on a federal income tax basis were as follows:
| | | | | | | | | | | | | | | | |
Undistributed
Ordinary
Income | | Undistributed
Long-Term
Capital Gain | | | Net
Unrealized
Depreciation | | | Accumulated
Capital Losses | | | Total | |
| $13,214,833 | | $ | — | | | $ | (59,204 | ) | | $ | — | | | $ | 13,155,629 | |
The Portfolio utilizes the provisions of the federal income tax laws that provide for the carryforward of capital losses for prior years, offsetting such losses against any future realized capital gains. Under the Regulated Investment Company Modernization Act of 2010, net capital losses recognized after December 22, 2010 may be carried forward indefinitely and their character is retained as short-term and/or long-term losses.
As of December 31, 2018, the Portfolio had no accumulated capital losses.
7. Recent Accounting Pronouncements and SEC Update
In March 2017, FASB issued Accounting Standards UpdateNo. 2017-08, Receivables—Nonrefundable Fees and Other Costs (Subtopic310-20)—Premium Amortization on Purchased Callable Debt Securities (“ASU2017-08”) which amends the amortization period for certain purchased callable debt securities. Under the standards update, the premium amortization of purchased callable debt securities that have explicit,non-contingent call features and are callable at fixed prices will be amortized to the earliest call date. The guidance will be applied on a modified retrospective basis and is effective for fiscal years, and their interim periods, beginning after December 15, 2018. Management is currently assessing the impact of ASU 2017-08, but does not believe the adoption will have a material impact on the Portfolios’ financial statements.
In August 2018, the FASB issued Accounting Standards Update2018-13, Fair Value Measurement (Topic 820)—Disclosure Framework—Changes to the Disclosure Requirements for Fair Value Measurement (“ASU2018-13”) which introduces new fair value disclosure requirements as well as eliminates and modifies certain existing fair value disclosure requirements. ASU2018-13 is effective
BHFTII-14
Brighthouse Funds Trust II
BlackRock Ultra-Short Term Bond Portfolio
Notes to Financial Statements—December 31, 2018—(Continued)
for fiscal years beginning after December 15, 2019, and interim periods within those fiscal years. Early adoption is permitted and, as such, management has elected to early adopt ASU2018-13 effective with the current reporting period. The impact of the Portfolio’s adoption was limited to changes in the Portfolio’s financial statement disclosures regarding fair value, primarily those disclosures related to transfers between levels of the fair value hierarchy.
In August 2018, the Securities and Exchange Commission released its Final Rule on Disclosure Update and Simplification (the “Final Rule”) which is intended to simplify an issuer’s disclosure compliance efforts by removing redundant or outdated disclosures requirements without significantly altering the mix of information provided to investors. Effective with the current reporting period, the Portfolio adopted the Final Rule with the most notable impacts being that the Portfolio is no longer required to present the components of distributable earnings on the Statement of Assets and Liabilities or the sources of distributions to shareholders and the amounts of undistributed net investment income on the Statements of Changes in Net Assets.
BHFTII-15
Brighthouse Funds Trust II
BlackRock Ultra-Short Term Bond Portfolio
Report of Independent Registered Public Accounting Firm
To the Shareholders of BlackRock Ultra-Short Term Bond Portfolio and the Board of Trustees of Brighthouse Funds Trust II:
Opinion on the Financial Statements and Financial Highlights
We have audited the accompanying statement of assets and liabilities, including the schedule of investments, of the BlackRock Ultra-Short Term Portfolio (the “Portfolio”), one of the portfolios constituting the Brighthouse Funds Trust II, as of December 31, 2018, the related statement of operations for the year then ended, the statements of changes in net assets for each of the two years in the period then ended, the financial highlights for each of the five years in the period then ended, and the related notes. In our opinion, the financial statements and financial highlights present fairly, in all material respects, the financial position of the BlackRock Ultra-Short Term Portfolio of the Brighthouse Funds Trust II as of December 31, 2018, the results of its operations for the year then ended, the changes in its net assets for each of the two years in the period then ended, and the financial highlights for each of the five years in the period then ended, in conformity with accounting principles generally accepted in the United States of America.
Basis for Opinion
These financial statements and financial highlights are the responsibility of the Portfolio’s management. Our responsibility is to express an opinion on the Portfolio’s financial statements and financial highlights based on our audits. We are a public accounting firm registered with the Public Company Accounting Oversight Board (United States) (PCAOB) and are required to be independent with respect to the Portfolio in accordance with the U.S. federal securities laws and the applicable rules and regulations of the Securities and Exchange Commission and the PCAOB.
We conducted our audits in accordance with the standards of the PCAOB. Those standards require that we plan and perform the audit to obtain reasonable assurance about whether the financial statements and financial highlights are free of material misstatement, whether due to error or fraud. The Portfolio is not required to have, nor were we engaged to perform, an audit of its internal control over financial reporting. As part of our audits we are required to obtain an understanding of internal control over financial reporting but not for the purpose of expressing an opinion on the effectiveness of the Portfolio’s internal control over financial reporting. Accordingly, we express no such opinion.
Our audits included performing procedures to assess the risks of material misstatement of the financial statements and financial highlights, whether due to error or fraud, and performing procedures that respond to those risks. Such procedures included examining, on a test basis, evidence regarding the amounts and disclosures in the financial statements and financial highlights. Our audits also included evaluating the accounting principles used and significant estimates made by management, as well as evaluating the overall presentation of the financial statements and financial highlights. Our procedures included confirmation of securities owned as of December 31, 2018, by correspondence with the custodian and brokers; when replies were not received from brokers, we performed other auditing procedures. We believe that our audits provide a reasonable basis for our opinion.
/s/ Deloitte & Touche LLP
Boston, Massachusetts
February 25, 2019
We have served as the auditor of one or more of the Brighthouse investment companies since 1983.
BHFTII-16
Brighthouse Funds Trust II
Trustees and Officers
MANAGEMENT OF THE TRUSTS
The Boards of Trustees (the “Board”) of Brighthouse Funds Trust I and Brighthouse Funds Trust II (“BHF I” and “BHF II”, respectively, and collectively the “Trusts”) supervise the Trusts and are responsible for representing the interests of shareholders. The Trustees, the Chairman of the Board and the Chairmen of each subcommittee are the same for both Trusts. The Trustees of each Trust meet periodically throughout the year to oversee the Portfolios’ activities, reviewing, among other things, each Portfolio’s performance and its contractual arrangements with various service providers. The Trustees of each Trust elect the officers of the Trust, who are responsible for administering the Trust’sday-to-day operations.
Trustees and Officers
The Trustees and executive officers of the Trusts, as well as their principal occupations during the past five years, are set forth below. Unless otherwise indicated, the business address of each is c/o Brighthouse Funds, One Financial Center, Boston, Massachusetts 02111. Each Trustee who is deemed an “interested person,” as such term is defined in the 1940 Act, is referred to as an “Interested Trustee.” Those Trustees who are not “interested persons,” as such term is defined in the 1940 Act, are referred to as “Independent Trustees.” There is no limit to the term a Trustee may serve. Trustees serve until their death, resignation or removal in accordance with the BHF I Trust’s and BHF II Trust’s respective organizational documents and policies adopted by the Boards of the respective Trusts from time to time. Officers hold office at the pleasure of each Board and serve until their removal or resignation in accordance with the Trusts’ respective organizational documents and policies adopted by the Board of each Trust from time to time.
| | | | | | | | | | |
Name and Year of Birth | | Current
Position(s)
Held with
Registrant | | Term of Office
and Length of
Time Served | | Principal Occupation(s) During the Past
5 Years(1) | | Number of
Portfolios
in Brighthouse
Funds
Complex(2)
Overseen
by Trustee | | Other Directorships Held
by Trustee During the
Past 5 Years(1) |
| Interested Trustee |
John Rosenthal* (1960) | | Trustee | | Indefinite; From
May 2016
(Trust I and
Trust II) to present | | Chief Investment Officer, Brighthouse Financial, Inc. (2017 to present); until 2017, Senior Managing Director and Head of Global Portfolio Management, MetLife, Inc. | | 72 | | None |
|
| Independent Trustees |
Dawn M. Vroegop (1966) | | Trustee and Chairman of the Board | | Indefinite; From
December 2000
(Trust I)/May
2009 (Trust II) to
present as
Trustee; From
May 2016 (Trust
I and Trust II)
until present as
Chairman | | Private Investor. | | 72 | | Trustee, Driehaus Mutual Funds.** |
| | | | | |
Stephen M. Alderman (1959) | | Trustee | | Indefinite; From
December 2000
(Trust I)/April
2012 (Trust II) to
present | | Shareholder in the law firm of Garfield and Merel, Ltd. | | 72 | | None |
| | | | | |
Robert J. Boulware (1956) | | Trustee | | Indefinite; From
March 2008
(Trust I)/April
2012 (Trust II) to
present | | Managing Director, Pilgrim Funds, LLC (private equity fund). | | 72 | | Trustee, Vertical Capital Income Fund(closed-end fund);** Director, Gainsco, Inc. (auto insurance);** Trustee, SharesPost 100 Fund(closed-end fund).** |
| | | | | |
Susan C. Gause (1952) | | Trustee | | Indefinite; From
March 2008
(Trust I)/April
2012 (Trust II) to
present | | Private Investor. | | 72 | | Trustee, HSBC Funds.** |
BHFTII-17
Brighthouse Funds Trust II
Trustees and Officers—(Continued)
| | | | | | | | | | |
Name and Year of Birth | | Current
Position(s)
Held with
Registrant | | Term of Office
and Length of
Time Served | | Principal Occupation(s) During the Past
5 Years(1) | | Number of
Portfolios
in Brighthouse
Funds
Complex(2)
Overseen
by Trustee | | Other Directorships Held
by Trustee During the
Past 5 Years(1) |
Nancy Hawthorne (1951) | | Trustee | | Indefinite; From
May 2003
(Trust II)/April
2012 (Trust I)
to present | | Partner, Hawthorne Financial Advisors, LLC (registered investment advisor); until 2014, Chief Executive Officer, Clerestory LLC (corporate advisor). | | 72 | | Director and Chairman of the Board of Directors, THL Credit, Inc.;** Director and Chairman of the Board, Avid Technology, Inc.;** Director, CRA International, Inc.** |
| | | | | |
Barbara A. Nugent (1956) | | Trustee | | Indefinite; From
January 2014
(Trust I and
Trust II) to
present | | President, True North Board Governance, LLC (consulting); until December 2013, partner in the law firm of Stradley Ronon Stevens & Young, LLP. | | 72 | | Independent Lead Trustee, BMT Investment Funds** |
| | | | | |
Christopher J. Towle (1957) | | Trustee | | Indefinite; From
April 2018
(Trust I and
Trust II) to
present | | Retired; until 2014, Partner, Portfolio Manager, Director of High Yield and Convertible Strategies, Lord Abbett & Co. | | 72 | | Trustee, Driehaus Mutual Funds** |
Officers
| | | | | | |
Name and Year of Birth | | Position(s)
Held with
Registrant | | Length of
Time Served | | Principal Occupation(s)
During the Past 5 Years(1) |
| Executive Officers | | | | | | |
Kristi Slavin (1973) | | President and Chief Executive Officer, of Trust I and Trust II | | From May
2016
(Trust I and
Trust II) to
present | | President, Brighthouse Investment Advisers, LLC (2016-present); formerly, Senior Vice President, MetLife Advisers, LLC; Vice President, MetLife, Inc.; Vice President, Trust I and Trust II(2015-2016). |
| | | |
Alan R. Otis (1971) | | Chief Financial Officer and Treasurer, of Trust I and Trust II | | From
November
2017
(Trust I and
Trust II) to
present | | Senior Vice President, Brighthouse Investment Advisers, LLC (2017-present); formerly, Vice President, Brighthouse Investment Advisers, LLC (2012-2017); Assistant Treasurer, Trust I and Trust II (2012-2017). |
| | | |
Andrew L. Gangolf (1954) | | Secretary, of Trust I and Trust II | | From May
2011
(Trust I and
Trust II) to
present | | Executive Vice President, Brighthouse Investment Advisers, LLC (2017-present); formerly, Senior Vice President, MetLife Advisers, LLC (2011-2017); until 2011, Senior Vice President & Assistant General Counsel, AllianceBernstein Investments, Inc. |
| | | |
Steven E. Hartstein (1963) | | Chief Compliance Officer (“CCO”), of Trust I and Trust II | | From
February
2014
(Trust I and
Trust II) to
present | | Senior Vice President and CCO, Brighthouse Investment Advisers, LLC (2017-present); Head of Investments Compliance, Vice President, Brighthouse Financial, Inc. (2017-present); formerly, Vice President, MetLife, Inc. (2013-2017); Senior Vice President and CCO, MetLife Advisers, LLC (2013-2017.) |
| | | |
Victor Soto (1978) | | Vice President of Trust I and Trust II | | From May
2018
(Trust I and
Trust II) to
present | | Executive Vice President, Brighthouse Investment Advisers, LLC (2016-present); Assistant Vice President, MetLife Inc. (2015-2017); Portfolio Manager, 1st Global (2013-2015). |
| * | Mr. Rosenthal is an “interested person” of the Trusts because of his position with Brighthouse Financial, Inc., the current parent company of Brighthouse Investment Advisers, LLC. |
| ** | Indicates a directorship with a registered investment company or a company subject to the reporting requirements of the Securities Exchange Act of 1934, as amended. |
| (1) | Previous positions during the past five years with the Trusts, Brighthouse Financial, Inc., MetLife, Inc. or the Manager are omitted if not materially different. |
| (2) | The Fund Complex includes 43 BHF I Portfolios and 29 BHF II Portfolios. |
BHFTII-18
Brighthouse Funds Trust II
BlackRock Ultra-Short Term Bond Portfolio
Board of Trustees’ Consideration of Advisory and Sub-Advisory Agreements
At anin-person meeting held on November6-8, 2018 (the “November Meeting”), the Boards of Trustees (the “Board”) of Brighthouse Funds Trust I and Brighthouse Funds Trust II (“BFT I” and “BFT II,” respectively, and collectively, the “Trusts”), including a majority of the Trustees who are not “interested persons” of the Trusts (the “Independent Trustees”) under the Investment Company Act of 1940 (the “1940 Act”), approved the continuation of the Trusts’ advisory agreements (each, an “Advisory Agreement”) with Brighthouse Investment Advisers, LLC (the “Adviser”) and the applicablesub-advisory agreements (each a “Sub-Advisory Agreement,” and collectively with the Advisory Agreement, the “Agreements”) between the Adviser and the investmentsub-advisers (each a “Sub-Adviser,” and collectively, the “Sub-Advisers”) for the series of the Trusts (each a “Portfolio,” and collectively, the “Portfolios”).
In making those approvals, the Board reviewed a variety of materials that were provided for the specific purpose of the annual contract renewal process. In addition, various materials provided to and discussed with the Board throughout the year informed the Board’s decision to renew the Agreements. In particular, the information for each Portfolio included, but was not limited to, investment performance reports, and reports on expenses, legal and compliance matters, asset pricing, brokerage commissions and trade execution.
The Board met in person with personnel of the Adviser on October 17, 2018 for the specific purpose of giving preliminary consideration to the proposed continuation of the Agreements (the “October Meeting”). At that meeting, the Adviser reviewed with the Board the performance and fees experienced by each Portfolio, as well as other information. During and after the October Meeting, the Independent Trustees communicatedfollow-up matters for management to address at the November Meeting. The Independent Trustees were advised by independent legal counsel throughout the contract renewal process, and met with independent legal counsel in several executive sessions outside of the presence of management.
Information furnished and reviewed specifically in connection with the renewal process included, but was not limited to, a report for each Portfolio that was prepared by Broadridge (“Broadridge”), an independent organization. In addition, the Independent Trustees reviewed a report that was prepared by JDL Consultants, LLC (“JDL”), an independent consultant to the Independent Trustees (“JDL Report”), which examined the comparative fees, expenses and performance of each Portfolio, based upon the Broadridge reports. Also, the Board reviewed the responses to wide-ranging questions from the Independent Trustees relating to the business, operations and performance of the Adviser and theSub-Advisers that the Adviser andSub-Advisers had prepared specifically for the renewal process, and reviewed aPortfolio-by-Portfolio analysis of the profitability to the Adviser of each Advisory Agreement, which was prepared by the Adviser for the renewal process.
At the November Meeting, the Board, including a majority of the Independent Trustees, concluded that the nature, extent and quality of services provided by the Adviser and eachSub-Adviser supported the renewal of the Agreements. The Board also concluded that the investment performance of each Portfolio was such that each Agreement should continue, and that the fees paid by each Portfolio to the Adviser appeared to be reasonable in light of the nature, extent and quality of the services provided by the Adviser andSub-Adviser. Further, the Board concluded that the Adviser’s profitability in providing services under the Advisory Agreements did not appear unreasonable in light of the nature, extent and quality of the services provided by the Adviser. Finally, the Board reviewed the extent to which the investment advisory fees paid by the Portfolios shared economies of scale with investors or entailed the potential to share economies of scale with investors and concluded that those considerations generally supported the renewal of each Agreement. In approving the renewal of each of the Agreements, the Board, including the Independent Trustees, gave attention to all of the information that was furnished and each Trustee placed varying degrees of importance on the various pieces of information that were provided to them. The Board evaluated the information available to it on aPortfolio-by-Portfolio basis, and its decision was made separately with respect to each Portfolio. The following paragraphs provide more information about some of the primary factors that were relevant to the Board’s decision. The Board did not identify any single factor as determinative, and the Trustees generally attributed different weights to various factors for the various Portfolios.
Nature, extent and quality of services. The Board evaluated the nature, extent and quality of the services that the Adviser and theSub-Advisers, as relevant, have provided to the Portfolios. The Board considered the Adviser’s services as investment manager to the Portfolios, including its services relating to the hiring and oversight of theSub-Advisers, trading practices and oversight of transition management (as applicable), compliance programs and personnel, and risk management, among other things. The Adviser’s services in coordinating and overseeing the activities of the Trusts’ other service providers were also considered. The Board considered information received from the Trusts’ Chief Compliance Officer (“CCO”) regarding the Portfolios’ compliance policies and procedures that were established pursuant to Rule38a-l under the 1940 Act. The Board also noted that the Adviser’s investment, compliance and legal staff conduct regular and periodic telephonic andin-person meetings with theSub-Advisers to review and assess the services that are provided to the Portfolios, and that personnel of the Adviser prepare and present reports to the Independent Trustees regarding those meetings. In addition, throughout the year, the Board considered the expertise, experience and performance of the personnel of the Adviser who performed the various services that are mentioned above.
BHFTII-19
Brighthouse Funds Trust II
BlackRock Ultra-Short Term Bond Portfolio
Board of Trustees’ Consideration of Advisory and Sub-Advisory Agreements—(Continued)
With respect to the services provided by each of theSub-Advisers, the Board considered a variety of information that the Adviser and eachSub-Adviser prepared for the Board’s review. The Board considered eachSub-Adviser’s investment process and philosophy, and the investment performance experienced by the Portfolio (as described in more detail below). The Board took into account that eachSub-Adviser’s responsibilities include the development and maintenance of an investment program for the applicable Portfolio that is consistent with the Portfolio’s investment objectives, the selection of investment securities and the placement of orders for the purchase and sale of such securities, as well as the implementation of compliance controls related to performance of these services. In particular, the Board considered, among other things, theSub-Adviser’s current level of staffing as well as its compensation program and its overall resources. The Board reviewed eachSub-Adviser’s history and investment experience, as well as information provided regarding the qualifications, background and responsibilities of theSub-Adviser’s investment and compliance personnel who provide services to the Portfolios. The Board also considered, among other things, eachSub-Adviser’s compliance program and regulatory and disciplinary history. In its review, the Board also took into account information regarding any services and/or payments provided to the Adviser by theSub-Advisers in connection with marketing activities and considered representations from the Adviser that those payments were not considered in the Adviser’s recommendation to renew any of theSub-Advisory Agreements.
Performance. The Board placed emphasis on the performance of each Portfolio in light of, among other things, its importance to investors. The Board considered the Adviser’s quarterly reviews with the Board of detailed information about each Portfolio’s investment strategies and performance results and composition, including discussions regarding the relevant effect of current market conditions. The Board reviewed and considered the reports prepared by Broadridge, which provided a statistical analysis comparing the Portfolios’ investment performance to that of comparable funds underlying variable insurance products (the “Performance Universe”). The Independent Trustees also met separately with representatives of JDL during the October Meeting to review the JDL Report. The Board also compared the performance records of the Portfolios to those of comparable funds and other accounts that were managed by the relevantSub-Adviser, to the extent such information was available. The Board considered each Portfolio’s performance for periods subsequent to the performance period covered by the Broadridge reports, and the Adviser’s discussion of the same, including the effect of current market conditions on each Portfolio’s more recent performance. The Board also noted that while it found the data provided by Broadridge generally useful, it recognized the limitations of such data, including, in particular, that notable differences may exist between a Portfolio and those of the other funds in a Broadridge category (for example, the investment objectives(s) and investment strategies) and that the results of the performance comparisons may vary depending on (i) the end dates for the performance periods that were selected and (ii) the selection of the peer groups.
The Board focused particular attention on Portfolios with less favorable performance records. The Board noted the Adviser’s focus on eachSub-Adviser’s performance and that the Adviser has been active in monitoring and responding to any performance issues with respect to the Portfolios.
Fees and Expenses. The Board gave consideration to the level and method of computing the fees payable under the Agreements. The Board considered the Broadridge report for each of the Portfolios, which included comparisons for each Portfolio of its contractual management andsub-adviser fees (at current and various asset levels), and total expenses, with those of its peers, including as those peers were divided into a broad group of peer funds (“Expense Universe”), a narrower group of peer funds (“Expense Group”), a broad group of peersub-advised funds (“Sub-advised Expense Universe”), and a narrower group of peersub-advised funds (“Sub-advised Expense Group”). Broadridge selected the peer funds which were similarly situated funds underlying variable insurance products deemed to be comparable to the Portfolios. The Independent Trustees, with the assistance of JDL, also examined the JDL Report. The Board compared the fee payable to aSub-Adviser by the Adviser with respect to the Portfolio to the fee payable to theSub-Adviser by other comparable funds and other accounts, to the extent such information was available.
The Board noted that thesub-advisory fees for the Portfolios are paid by the Adviser out of the advisory fees, and that the Adviser negotiates the fees at arm’s length. The Board also considered that the Adviser had entered into expense limitation or management fee waiver agreements with certain of the Portfolios pursuant to which the Adviser had agreed to waive a portion of its advisory fee and/or reimburse certain expenses as a means of limiting a Portfolio’s total annual operating expenses.
Profitability. The Board examined the profitability to the Adviser of each Advisory Agreement, on aPortfolio-by-Portfolio basis. The Board also considered that an affiliate of the Adviser, Brighthouse Securities, LLC, serves as distributor for the Trusts, and, as such, receives Rule12b-1 payments to support the distribution of the Portfolios. The Board considered the profitability to theSub-Advisers and their affiliates as a result of their relationships with the Portfolios, to the extent available, and the Board considered the ability of the Adviser to negotiate with aSub-Adviser at arm’s length. In reviewing the profitability analyses, the Board recognized that expense allocation methodologies are inherently subjective and various expense allocation methodologies may be reasonable while producing different results.
BHFTII-20
Brighthouse Funds Trust II
BlackRock Ultra-Short Term Bond Portfolio
Board of Trustees’ Consideration of Advisory and Sub-Advisory Agreements—(Continued)
Economies of scale. The Board also considered each Portfolio’s fees in light of its size. The Board noted the fee schedules for the Portfolios that contain breakpoints that reduce the fee rate above specified asset levels. The Board noted those Portfolios that did not have breakpoints in their advisory fee and took into account management’s discussion of the same. The Board noted that those Portfolios with Advisory Agreements containing breakpoints generally have breakpoints in the correspondingSub-Advisory Agreement. The Board considered the effective fees under the Advisory Agreement andSub-Advisory Agreement for each Portfolio as a percentage of assets at different asset levels and possible economies of scale that may be realized if the assets of the Portfolio grow. The Board examined, among other data, the effect of a Portfolio’s growth in size, and reduction in size, on various fee schedules and the Board reviewed the Broadridge and JDL Reports, which compared fees among peers. The Board also generally noted that if a Portfolio’s assets increase over time, the Portfolio may realize other economies of scale if assets increase proportionally more than certain other fixed expenses.
Other factors. The Board considered other benefits that may be realized by the Adviser and its affiliates from their relationship with the Trusts. Among them, the Board recognized that Brighthouse Securities, LLC, as the distributor for the Trusts, receives payments pursuant to Rule12b-1 from the Portfolios to compensate for the provision of shareholder services and distribution activities, which could lead to growth in the Trusts’ assets and corresponding benefits from such growth, including economies of scale. The Board considered other benefits that may be realized by eachSub-Adviser and its affiliates from their relationship with the Trusts, including the opportunity to provide advisory services to additional portfolios of the Trusts and reputational benefits. In conjunction with these considerations, the Board noted the ongoing commitment of the Adviser to the Portfolios.
The Board requested, received, and considered information from the Adviser regarding possible conflicts of interest in the form of material benefits to the Adviser resulting from the Adviser’s affiliations and business relationships, as relevant. The Board considered the services that are provided to the Trusts by its service providers, and the manner in which any conflicts were mitigated.
* * *
BlackRock Ultra-Short Term Bond Portfolio. The Board also considered the following information in relation to the Agreements with the Adviser and BlackRock Advisors, LLC regarding the Portfolio:
Among other data relating specifically to the Portfolio’s performance, the Board considered that the Portfolio outperformed the median of its Performance Universe and the average of its Morningstar Category for theone-year period ended June 30, 2018, and underperformed its Performance Universe and the average of its Morningstar Category for the three- and five-year periods ended June 30, 2018. The Board further considered that the Portfolio underperformed its benchmark, the Bank of America / Merrill Lynch3-Month Treasury Bill Index, for theone-, three-, and five-year periods ended September 30, 2018. The Board took into account management’s discussion of the Portfolio’s performance, including prevailing market conditions. The Board further noted that, prior to May 1, 2016, the Portfolio operated as a money market fund subject to the requirements set forth in Rule2a-7 under the Investment Company Act of 1940 and noted that the Adviser and its affiliates had provided significant subsidizations to the Portfolio by voluntarily waiving a portion of the Adviser’s investment advisory fee and all of the Portfolio’s Rule12b-1 fees in order to maintain a stable net asset value per share, which contributed positively to the Portfolio’s performance.
The Board also considered that the Portfolio’s actual management fees and total expenses (exclusive of12b-1 fees) were below the Expense Group median, the Expense Universe median, and theSub-advised Expense Universe median, and were the lowest in the Expense Group, Expense Universe and theSub-advised Expense Universe. The Board further noted that the Portfolio’s contractual management fees were below the asset-weighted average of comparable funds selected by Broadridge at the Portfolio’s current size. The Board also noted that the Portfolio’s contractualsub-advisory fees were below the averages of theSub-advised Expense Group and theSub-advised Expense Universe at the Portfolio’s current size.
BHFTII-21
Brighthouse Funds Trust II
Brighthouse/Artisan Mid Cap Value Portfolio
Managed by Artisan Partners Limited Partnership
Portfolio Manager Commentary*
PERFORMANCE
For the 12 months ended December 31, 2018, the Class A, B, and E shares of the Brighthouse/Artisan Mid Cap Value Portfolio returned-13.20%,-13.42%, and-13.33%, respectively. The Portfolio’s benchmark, the Russell Midcap Value Index1, returned-12.29%.
MARKET ENVIRONMENT / CONDITIONS
Investors faced a rocky year amid persistent heightened volatility in financial markets, punctuated by major price declines in February, October, and December. The dominant concerns were largely consistent throughout the year—namely, ratcheting trade tensions, particularly between the U.S. and China; tightening monetary policy; and the potential for slower economic growth, especially in China and Europe.
The U.S. economy strengthened during the year as a substantial fiscal stimulus in the form of tax cuts contributed to stronger economic growth and corporate profits. Tighter U.S. monetary policy was a prevalent theme this year. Citing strong economic fundamentals, the Federal Reserve continued to normalize policy—hiking its benchmark rate four times in 2018 and continuing to unwind its balance sheet. Even so, conflicting signals about the underlying health of economic conditions and financial markets’ weakness contributed to investors’ questioning whether the Federal Reserve was being too aggressive in its approach.
Most major indices closed in negative territory for both the fourth quarter and the year. After a rockier start, emerging markets held up better than their developed-world counterparts in the fourth quarter, but still trailed for the year. The U.S. was among the bottom-performers in the fourth quarter, but led most major indices for 2018—despite notching the S&P 500’s worst calendar year since the global financial crisis’ conclusion.
For the Russell Midcap Value Index, the Energy sector was the big loser on the year as oil prices collapsed. The Consumer Discretionary and Materials sectors suffered notably. Utilities concluded the year in the black as investors shunned more cyclically oriented names throughout the year. Led by the likes of Twitter and TripAdvisor, the Communications Services sector also finished the year with a positive return. Value stocks generally trailed growth stocks for the year. From a size perspective, larger companies tended to hold up better for the year overall as volatility likely swayed investors’ preference toward the liquidity of largermarket-cap stocks.
PORTFOLIO REVIEW /PERIOD-END POSITIONING
Over the12-months ending December 31, 2018, the Portfolio trailed the Russell Midcap Value Index. In the index, defensive and interest-rate sensitive sectors—Utilities and Real Estate, for example, where we hadlittle-to-no exposure—performed relatively better, contributing to the drag on relative returns.
Judging by headlines alone, it was a tough year for car manufacturers. Trump’s trade war complicated export markets and raised steel prices, squeezing manufacturers on both sides of their ledgers. Palace intrigue embroiled former Nissan (Japan) and Renault (France) chairman Carlos Ghosn. GM announced layoffs and plant closures as it halted production on a handful of brands. While the Portfolio does not hold those particular names, the impacts have been widespread, and it’s of little surprise the largest detractor in the Portfolio over the reporting period was Delphi Technologies (United Kingdom), an automotive parts supplier to manufacturers. In addition to the sector’s woes, the market continues to have what we consider a misunderstanding of Delphi’s long-term prospects. We were initially attracted to the business due to an undemanding valuation. The business fell further out of favor after the initial purchase as investors fretted the combination of a slowing auto market, the potential impact of emission regulations in Europe and declining expectations for Chinese auto sales in the second half of the year. At year end, we continued to believe Delphi was executing well against a challenging backdrop and it remained poised to benefit from the trend of cars being more fuel efficient and producing less emissions.
Weakness in airline stocks and the outlook for consumer spending bled into the aircraft lessors, and Air Lease Corp. was among the largest detractors over the year. However, leasing companies should generally be less affected by carrier profitability given the contractual (and asset-backed) nature of the business. Overall, it’s demand for air travel, which may wane during cyclical downturns but should trend higher over time, that should preoccupy leasing firms. At year end Air Lease remained priced at a discount to book value, and we added to the position in the fourth quarter on the weakness as we continued to believe management had positioned the company as the industry leader.
However, overall stock selection was additive to performance, particularly in Communication Services, Financials, and Consumer Staples names. The Portfolio’s limited exposure to Real Estate was also positive astriple-net lease real estate investment trust operator Store Capital was a top contributor.
A historic equity market selloff in December rocked the Energy sector, where the Portfolio underperformed, amid sinking oil prices. Cimarex Energy, an exploration and production firm, was among the top detractors. But even with crude oil prices off a staggering $30 per barrel during the fourth quarter, and Energy among the worst performing sectors in the index, firms like Andeavor (now a part of Marathon Petroleum) and Hess remained among top contributors, based largely on strength earlier in the year, when rising crude oil prices gave us an opportunity to trim positions on commodity strength. Hess had also benefited from more good news in their Liza development off Guyana.
BHFTII-1
Brighthouse Funds Trust II
Brighthouse/Artisan Mid Cap Value Portfolio
Managed by Artisan Partners Limited Partnership
Portfolio Manager Commentary*—(Continued)
The top individual contributor was InterActiveCorp (“IAC”). Shares of IAC, a diversified media and internet company, continued to be a standout (the company operates sites such as HomeAdvisor, Match, and Tinder). Its businesses are executing well—the merger of Angie’s List and HomeAdvisor is complete, and Match Group continues to grow and improve monetization. IAC meets the team’s margin of safety criteria, and we like that it’s led by Barry Diller, who has a strong record as a prudent capital allocator.
Another top contributor was TripAdvisor, a leading online travel research company. Their efforts to trim marketing expenses weighed on revenues, but improved margins. It remains an industry-leading platform that generates free-cash flow and maintains a sound balance sheet while still growing its unique travel review content and operating the world’s second-largest restaurant reservation system.
Financials was a top contributing sector in 2018 and weakness in the Financials sector over the year provided more attractive prices for existing and new positions. We added to the existing holdings of M&T Bank Corp., Fifth Third Bancorp, and Pinnacle Financial Partners. Given the backdrop, we also initiated positions in SunTrust Banks and BOK Financial Corp. during the reporting period.
The team’s decisions are always made from thebottom-up, without regard to index construction. Atperiod-end, the Portfolio had above-benchmark exposure to the Communications Services, Financials, Consumer Discretionary, Industrials, Materials, and Energy sectors. Conversely, the Portfolio had below-benchmark exposure to the Consumer Staples, Health Care, Information Technology, Real Estate, and Utilities sectors.
James C. Kieffer
Thomas A. Reynolds IV
Daniel L. Kane
Portfolio Managers
Artisan Partners Limited Partnership
* This commentary may include statements that constitute “forward-looking statements” under the U.S. securities laws. Forward-looking statements include, among other things, projections, estimates, and information about possible or future results related to the Portfolio, market or regulatory developments. The views expressed above are not guarantees of future performance or economic results and involve certain risks, uncertainties and assumptions that could cause actual outcomes and results to differ materially from the views expressed herein. The views expressed above are subject to change at any time based upon economic, market, or other conditions and the subadvisory firm undertakes no obligation to update the views expressed herein. Any discussions of specific securities should not be considered a recommendation to buy or sell those securities. The views expressed above (including any forward-looking statement) may not be relied upon as investment advice or as an indication of the Portfolio’s trading intent. Information about the Portfolio’s holdings, asset allocation or country diversification is historical and is not an indication of future Portfolio composition, which may vary. Direct investment in any index is not possible. The performance of any index mentioned in this commentary has not been adjusted for ongoing management, distribution and operating expenses, and sales charges applicable to mutual fund investments. In addition, the returns do not reflect additional fees charged by separate accounts or variable insurance contracts that an investor in the Portfolio may pay. If these additional fees were reflected, performance would have been lower.
BHFTII-2
Brighthouse Funds Trust II
Brighthouse/Artisan Mid Cap Value Portfolio
A $10,000 INVESTMENT COMPARED TO THE RUSSELL MIDCAP VALUE INDEX
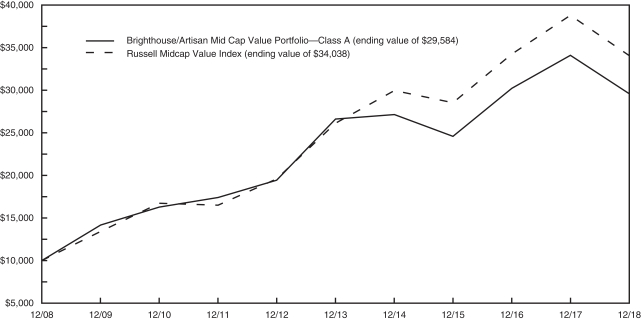
AVERAGE ANNUAL RETURNS (%) (FOR THE YEAR ENDED DECEMBER 31, 2018)
| | | | | | | | | | | | |
| | | | |
| | | 1 Year | | | 5 Year | | | 10 Year | |
| Brighthouse/Artisan Mid Cap Value Portfolio | | | | | | | | | | | | |
Class A | | | -13.20 | | | | 2.14 | | | | 11.46 | |
Class B | | | -13.42 | | | | 1.88 | | | | 11.18 | |
Class E | | | -13.33 | | | | 1.98 | | | | 11.29 | |
| Russell Midcap Value Index | | | -12.29 | | | | 5.44 | | | | 13.03 | |
1 The Russell Midcap Value Index is an unmanaged measure of performance of those Russell Midcap companies (the 800 smallest companies in the Russell 1000 Index) with lower price-to-book ratios and forecasted growth values.
Portfolio performance is calculated including reinvestment of all income and capital gain distributions. Performance numbers are net of all Portfolio expenses but do not include any insurance, sales, separate account or administrative charges of variable annuity or life insurance contracts or any additional expenses that participants may bear relating to the operations of their plans. If these charges were included, the returns would be lower. The performance of any index referenced above has not been adjusted for ongoing management, distribution and operating expenses, and sales charges applicable to mutual fund investments. Direct investment in any index is not possible. The performance of Class A shares, as set forth in the line graph above, will differ from that of other classes because of the difference in expenses paid by policyholders investing in the different share classes.
This information represents past performance and is not indicative of future results. Investment return and principal value may fluctuate so that shares, upon redemption, may be worth more or less than the original cost.
PORTFOLIO COMPOSITION AS OF DECEMBER 31, 2018
Top Holdings
| | | | |
| | | % of
Net Assets | |
| IAC/InterActiveCorp | | | 3.6 | |
| Celanese Corp. | | | 3.4 | |
| Kroger Co. (The) | | | 3.4 | |
| AutoNation, Inc. | | | 2.8 | |
| Torchmark Corp. | | | 2.8 | |
| M&T Bank Corp. | | | 2.8 | |
| AMERCO | | | 2.7 | |
| Air Lease Corp. | | | 2.7 | |
| Fifth Third Bancorp | | | 2.7 | |
| Qurate Retail, Inc. | | | 2.6 | |
Top Sectors
| | | | |
| | | % of
Net Assets | |
| Financials | | | 25.3 | |
| Consumer Discretionary | | | 14.1 | |
| Communication Services | | | 13.5 | |
| Industrials | | | 13.3 | |
| Materials | | | 7.4 | |
| Energy | | | 6.9 | |
| Information Technology | | | 4.9 | |
| Health Care | | | 3.7 | |
| Consumer Staples | | | 3.4 | |
| Real Estate | | | 3.1 | |
BHFTII-3
Brighthouse Funds Trust II
Brighthouse/Artisan Mid Cap Value Portfolio
Understanding Your Portfolio’s Expenses
Shareholder Expense Example
As a shareholder of the Portfolio, you incur ongoing costs, including management fees; distribution and service(12b-1) fees; and other Portfolio expenses. This example is intended to help you understand your ongoing costs (in dollars) (referred to as “expenses”) of investing in the Portfolio and compare these costs with the ongoing costs of investing in other mutual funds. The example is based on an investment of $1,000 invested at the beginning of the period and held for the entire period, July 1, 2018 through December 31, 2018.
Actual Expenses
The first line for each share class of the Portfolio in the table below provides information about actual account values and actual expenses. You may use the information in this line, together with the amount you invested in the particular share class of the Portfolio, to estimate the expenses that you paid over the period. Simply divide your account value by $1,000 (for example, an $8,600 account value divided by $1,000 = 8.6), then multiply the result by the number in the first line under the heading entitled “Expenses Paid During Period” to estimate the expenses you paid on your account during this period.
Hypothetical Example for Comparison Purposes
The second line for each share class of the Portfolio in the table below provides information about hypothetical account values and hypothetical expenses based on the Portfolio’s actual expense ratio and an assumed rate of return of 5% per year before expenses, which is not the Portfolio’s actual return. The hypothetical account values and expenses may not be used to estimate the actual ending account balance or expenses you paid for the period. You may use this information to compare the ongoing costs of investing in the Portfolio and other funds. To do so, compare this 5% hypothetical example with the 5% hypothetical examples that appear in the shareholder reports of the other funds.
Please note that the expenses shown in the table are meant to highlight your ongoing costs only and do not reflect any fees or charges of your variable insurance product or any additional expenses that participants in certain eligible qualified plans may bear relating to the operations of their plan. Therefore, the second line for each share class in the table is useful in comparing ongoing costs only, and will not help you determine the relative total costs of owning different funds. In addition, if these other costs were included, your costs would have been higher.
| | | | | | | | | | | | | | | | | | |
Brighthouse/Artisan Mid Cap Value Portfolio
| | | | Annualized
Expense
Ratio | | | Beginning
Account Value
July 1,
2018 | | | Ending
Account Value
December 31,
2018 | | | Expenses Paid
During Period**
July 1, 2018
to
December 31,
2018 | |
Class A (a) | | Actual | | | 0.81 | % | | $ | 1,000.00 | | | $ | 856.80 | | | $ | 3.79 | |
| | Hypothetical* | | | 0.81 | % | | $ | 1,000.00 | | | $ | 1,021.12 | | | $ | 4.13 | |
| | | | | |
Class B (a) | | Actual | | | 1.06 | % | | $ | 1,000.00 | | | $ | 855.70 | | | $ | 4.96 | |
| | Hypothetical* | | | 1.06 | % | | $ | 1,000.00 | | | $ | 1,019.86 | | | $ | 5.40 | |
| | | | | |
Class E (a) | | Actual | | | 0.96 | % | | $ | 1,000.00 | | | $ | 856.10 | | | $ | 4.49 | |
| | Hypothetical* | | | 0.96 | % | | $ | 1,000.00 | | | $ | 1,020.37 | | | $ | 4.89 | |
| * | Hypothetical assumes a rate of return of 5% per year before expenses. |
| ** | Expenses paid are equal to the Portfolio’s annualized expense ratio for the most recent six month period, as shown above, multiplied by the average account value over the period, multiplied by the number of days (184 days) in the most recent fiscal half-year, divided by 365 (to reflect theone-half year period). |
| (a) | The annualized expense ratio shown reflects the impact of the management fee waiver as described in Note 5 of the Notes to Financial Statements. |
BHFTII-4
Brighthouse Funds Trust II
Brighthouse/Artisan Mid Cap Value Portfolio
Schedule of Investments as of December 31, 2018
Common Stocks—95.6% of Net Assets
| | | | | | | | |
| Security Description | | Shares | | | Value | |
|
| Auto Components—3.8% | |
Delphi Technologies plc (a) | | | 721,833 | | | $ | 10,336,648 | |
Gentex Corp. (a) | | | 1,035,122 | | | | 20,919,816 | |
| | | | | | | | |
| | | | | | | 31,256,464 | |
| | | | | | | | |
|
| Banks—9.1% | |
BOK Financial Corp. | | | 159,648 | | | | 11,706,988 | |
Fifth Third Bancorp | | | 942,122 | | | | 22,168,131 | |
M&T Bank Corp. | | | 159,730 | | | | 22,862,155 | |
Pinnacle Financial Partners, Inc. (a) | | | 260,648 | | | | 12,015,873 | |
SunTrust Banks, Inc. | | | 132,228 | | | | 6,669,580 | |
| | | | | | | | |
| | | | | | | 75,422,727 | |
| | | | | | | | |
|
| Capital Markets—1.9% | |
Intercontinental Exchange, Inc. | | | 207,035 | | | | 15,595,947 | |
| | | | | | | | |
|
| Chemicals—7.4% | |
Axalta Coating Systems, Ltd. (b) | | | 716,303 | | | | 16,775,816 | |
Celanese Corp. (a) | | | 318,164 | | | | 28,625,215 | |
Nutrien, Ltd. (a) | | | 343,362 | | | | 16,138,014 | |
| | | | | | | | |
| | | | | | | 61,539,045 | |
| | | | | | | | |
|
| Construction & Engineering—3.5% | |
Fluor Corp. | | | 375,976 | | | | 12,106,427 | |
Jacobs Engineering Group, Inc. | | | 289,382 | | | | 16,917,272 | |
| | | | | | | | |
| | | | | | | 29,023,699 | |
| | | | | | | | |
|
| Consumer Finance—1.9% | |
Synchrony Financial | | | 670,000 | | | | 15,718,200 | |
| | | | | | | | |
|
| Diversified Consumer Services—2.4% | |
H&R Block, Inc. (a) | | | 798,695 | | | | 20,262,892 | |
| | | | | | | | |
|
| Electronic Equipment, Instruments & Components—2.3% | |
Arrow Electronics, Inc. (b) | | | 278,276 | | | | 19,187,130 | |
| | | | | | | | |
|
| Equity Real Estate Investment Trusts—3.1% | |
Equity Commonwealth | | | 605,047 | | | | 18,157,460 | |
STORE Capital Corp. | | | 279,831 | | | | 7,922,016 | |
| | | | | | | | |
| | | | | | | 26,079,476 | |
| | | | | | | | |
|
| Food & Staples Retailing—3.4% | |
Kroger Co. (The) (a) | | | 1,017,885 | | | | 27,991,838 | |
| | | | | | | | |
|
| Health Care Equipment & Supplies—2.2% | |
DENTSPLY SIRONA, Inc. | | | 487,254 | | | | 18,130,721 | |
| | | | | | | | |
|
| Health Care Providers & Services—1.6% | |
AmerisourceBergen Corp. (a) | | | 175,436 | | | | 13,052,438 | |
| | | | | | | | |
|
| Insurance—12.4% | |
Alleghany Corp. | | | 19,464 | | | | 12,132,301 | |
Aon plc | | | 120,079 | | | | 17,454,683 | |
Arch Capital Group, Ltd. (b) | | | 724,003 | | | | 19,345,360 | |
|
| Insurance—(Continued) | |
Fairfax Financial Holdings, Ltd. | | | 10,044 | | | | 4,420,164 | |
Loews Corp. (a) | | | 294,050 | | | | 13,385,156 | |
Progressive Corp. (The) | | | 227,494 | | | | 13,724,713 | |
Torchmark Corp. | | | 307,093 | | | | 22,887,641 | |
| | | | | | | | |
| | | | | | | 103,350,018 | |
| | | | | | | | |
|
| Interactive Media & Services—5.0% | |
IAC/InterActiveCorp (b) | | | 164,322 | | | | 30,077,499 | |
TripAdvisor, Inc. (b) | | | 211,731 | | | | 11,420,770 | |
| | | | | | | | |
| | | | | | | 41,498,269 | |
| | | | | | | | |
|
| Internet & Direct Marketing Retail—5.1% | |
Expedia Group, Inc. | | | 91,125 | | | | 10,265,231 | |
Liberty Expedia Holdings, Inc. - Class A (b) | | | 260,724 | | | | 10,196,916 | |
Qurate Retail, Inc. (b) | | | 1,127,272 | | | | 22,004,349 | |
| | | | | | | | |
| | | | | | | 42,466,496 | |
| | | | | | | | |
|
| Marine—2.4% | |
Kirby Corp. (a) (b) | | | 291,804 | | | | 19,655,917 | |
| | | | | | | | |
|
| Media—8.5% | |
CBS Corp. - Class B | | | 412,743 | | | | 18,045,124 | |
GCI Liberty, Inc. - Class A (a) (b) | | | 410,783 | | | | 16,907,828 | |
News Corp. - Class A | | | 1,277,829 | | | | 14,503,359 | |
Omnicom Group, Inc. (a) | | | 289,818 | | | | 21,226,271 | |
| | | | | | | | |
| | | | | | | 70,682,582 | |
| | | | | | | | |
|
| Oil, Gas & Consumable Fuels—6.9% | |
Apache Corp. (a) | | | 303,009 | | | | 7,953,986 | |
Cimarex Energy Co. (a) | | | 230,957 | | | | 14,238,499 | |
Devon Energy Corp. | | | 520,715 | | | | 11,736,916 | |
Hess Corp. | | | 278,967 | | | | 11,298,163 | |
Marathon Petroleum Corp. | | | 203,853 | | | | 12,029,366 | |
| | | | | | | | |
| | | | | | | 57,256,930 | |
| | | | | | | | |
|
| Road & Rail—4.7% | |
AMERCO (a) | | | 68,932 | | | | 22,617,278 | |
Ryder System, Inc. | | | 351,737 | | | | 16,936,137 | |
| | | | | | | | |
| | | | | | | 39,553,415 | |
| | | | | | | | |
|
| Semiconductors & Semiconductor Equipment—2.6% | |
Analog Devices, Inc. (a) | | | 254,856 | | | | 21,874,291 | |
| | | | | | | | |
|
| Specialty Retail—2.7% | |
AutoNation, Inc. (a) (b) | | | 641,521 | | | | 22,902,300 | |
| | | | | | | | |
|
| Trading Companies & Distributors—2.7% | |
Air Lease Corp. (a) | | | 733,943 | | | | 22,172,418 | |
| | | | | | | | |
Total Common Stocks
(Cost $701,138,165) | | | | | | | 794,673,213 | |
| | | | | | | | |
See accompanying notes to financial statements.
BHFTII-5
Brighthouse Funds Trust II
Brighthouse/Artisan Mid Cap Value Portfolio
Schedule of Investments as of December 31, 2018
Short-Term Investment—4.8%
| | | | | | | | |
| Security Description | | Principal
Amount* | | | Value | |
|
| Repurchase Agreement—4.8% | |
Fixed Income Clearing Corp.
Repurchase Agreement dated 12/31/18 at 1.200%, due on 01/02/19 with a maturity value of $39,451,911; collateralized by U.S. Treasury Note at 2.875%, maturing 09/30/23, with a market value of $40,242,774. | | | 39,449,281 | | | $ | 39,449,281 | |
| | | | | | | | |
Total Short-Term Investments
(Cost $39,449,281) | | | | | | | 39,449,281 | |
| | | | | | | | |
|
| Securities Lending Reinvestments (c)—18.7% | |
|
| Certificates of Deposit—11.9% | |
Banco Del Estado De Chile New York
2.720%, 1M LIBOR + 0.250%, 03/20/19 (d) | | | 5,000,000 | | | | 4,999,570 | |
Bank of Montreal (Chicago)
2.710%, 1M LIBOR + 0.330%, 08/06/19 (d) | | | 2,000,000 | | | | 1,999,950 | |
Bank of Nova Scotia
3.072%, 3M LIBOR + 0.280%, 03/20/19 (d) | | | 4,000,000 | | | | 4,001,596 | |
Barclays Bank plc
2.547%, 1M LIBOR + 0.200%, 02/04/19 (d) | | | 4,000,000 | | | | 3,999,620 | |
Canadian Imperial Bank of Commerce
2.556%, 3M LIBOR + 0.120%, 01/14/19 (d) | | | 4,000,000 | | | | 3,999,488 | |
2.740%, 1M LIBOR + 0.270%, 07/19/19 (d) | | | 1,000,000 | | | | 999,594 | |
China Construction Bank Corp.
2.550%, 01/07/19 | | | 2,000,000 | | | | 2,000,000 | |
Citibank N.A.
2.490%, 02/04/19 | | | 4,000,000 | | | | 3,999,444 | |
Commonwealth Bank of Australia
2.617%, 3M LIBOR + 0.140%, 04/23/19 (d) | | | 1,500,000 | | | | 1,500,004 | |
2.642%, 1M LIBOR + 0.210%, 09/13/19 (d) | | | 1,500,000 | | | | 1,500,000 | |
Cooperative Rabobank UA
2.608%, 3M LIBOR + 0.200%, 04/05/19 (d) | | | 2,000,000 | | | | 2,000,628 | |
Credit Agricole S.A.
2.500%, 02/12/19 | | | 2,000,000 | | | | 1,999,660 | |
2.799%, 1M LIBOR + 0.320%, 05/21/19 (d) | | | 3,000,000 | | | | 3,000,189 | |
Credit Industriel et Commercial
Zero Coupon, 01/25/19 | | | 4,442,527 | | | | 4,492,350 | |
Industrial & Commercial Bank of China, Ltd.
2.850%, 02/15/19 | | | 5,000,000 | | | | 4,999,630 | |
Mitsubishi UFJ Trust and Banking Corp.
Zero Coupon, 01/15/19 | | | 2,977,462 | | | | 2,996,940 | |
Natixis New York
2.705%, 3M LIBOR + 0.090%, 05/10/19 (d) | | | 1,000,000 | | | | 999,370 | |
2.810%, 1M LIBOR + 0.370%, 02/14/19 (d) | | | 4,000,000 | | | | 4,000,748 | |
Royal Bank of Canada New York
2.665%, 1M LIBOR + 0.210%, 09/17/19 (d) | | | 3,000,000 | | | | 2,996,931 | |
Skandinaviska Enskilda Banken
2.645%, 1M LIBOR + 0.190%, 04/17/19 (d) | | | 6,000,000 | | | | 5,999,508 | |
Societe Generale
2.719%, 3M LIBOR + 0.160%, 05/07/19 (d) | | | 1,000,000 | | | | 999,556 | |
Standard Chartered plc
2.686%, 1M LIBOR + 0.180%, 02/25/19 (d) | | | 4,000,000 | | | | 3,999,884 | |
State Street Bank and Trust
2.725%, 1M LIBOR + 0.270%, 05/15/19 (d) | | | 5,000,000 | | | | 4,999,900 | |
|
| Certificates of Deposit—(Continued) | |
Sumitomo Mitsui Banking Corp.
2.590%, 1M LIBOR + 0.190%, 04/11/19 (d) | | | 2,000,000 | | | | 1,999,266 | |
2.700%, 02/25/19 | | | 2,000,000 | | | | 2,000,184 | |
Sumitomo Mitsui Banking Corp., New York
2.665%, 1M LIBOR + 0.210%, 05/17/19 (d) | | | 3,000,000 | | | | 2,998,740 | |
Svenska Handelsbanken AB
2.620%, 3M LIBOR + 0.100%, 04/30/19 (d) | | | 4,000,000 | | | | 3,999,820 | |
2.767%, 1M LIBOR + 0.380%, 12/10/19 (d) | | | 2,000,000 | | | | 1,999,934 | |
Toronto-Dominion Bank
2.665%, 1M LIBOR + 0.210%, 09/17/19 (d) | | | 2,000,000 | | | | 1,998,096 | |
U.S. Bank N.A.
2.764%, 1M LIBOR + 0.260%, 07/23/19 (d) | | | 1,000,000 | | | | 1,000,000 | |
Wells Fargo Bank N.A.
2.560%, 3M LIBOR + 0.140%, 07/11/19 (d) | | | 7,000,000 | | | | 7,006,072 | |
Westpac Banking Corp.
2.850%, FEDEFF PRV + 0.450%, 02/15/19 (d) | | | 3,000,000 | | | | 2,999,981 | |
| | | | | | | | |
| | | | | | | 98,486,653 | |
| | | | | | | | |
|
| Commercial Paper—3.0% | |
Alpine Securities Ltd.
2.529%, 1M LIBOR + 0.180%, 04/03/19 (d) | | | 3,000,000 | | | | 2,999,169 | |
Banco Santander S.A.
2.740%, 02/07/19 | | | 2,978,993 | | | | 2,991,264 | |
Bank of China, Ltd.
2.690%, 01/17/19 | | | 3,973,100 | | | | 3,995,304 | |
HSBC Bank plc
2.842%, 1M LIBOR + 0.320%, 07/30/19 (d) | | | 4,000,000 | | | | 4,000,000 | |
Matchpoint Finance plc
2.890%, 05/08/19 | | | 1,970,939 | | | | 1,978,506 | |
UBS AG
2.779%, 1M LIBOR + 0.430%, 02/01/19 (d) | | | 5,000,000 | | | | 5,001,225 | |
Westpac Banking Corp.
2.784%, 1M LIBOR + 0.280%, 05/24/19 (d) | | | 4,000,000 | | | | 3,999,840 | |
| | | | | | | | |
| | | | | | | 24,965,308 | |
| | | | | | | | |
|
| Repurchase Agreements—3.8% | |
Citadel Clearing LLC
Repurchase Agreement dated 12/31/18 at 3.000%, due on 04/02/19 with a maturity value of $2,015,333; collateralized by various Common Stock with an aggregate market value of $2,200,367. | | | 2,000,000 | | | | 2,000,000 | |
Citigroup Global Markets, Inc.
Repurchase Agreement dated 12/31/18 at 2.790%, due on 02/04/19 with a maturity value of $2,005,425; collateralized by U.S. Treasury Obligations at 0.000%, maturing 02/12/19, and various Common Stock with an aggregate market value of $2,176,637. | | | 2,000,000 | | | | 2,000,000 | |
Repurchase Agreement dated 12/31/18 at 2.940%, due on 04/02/19 with a maturity value of $1,007,513; collateralized by U.S. Treasury Obligations with rates ranging from 1.125% - 2.750%, maturity dates ranging from 01/31/19 - 08/15/24, and an aggregate market value of $1,020,000. | | | 1,000,000 | | | | 1,000,000 | |
See accompanying notes to financial statements.
BHFTII-6
Brighthouse Funds Trust II
Brighthouse/Artisan Mid Cap Value Portfolio
Schedule of Investments as of December 31, 2018
Securities Lending Reinvestments (c)—(Continued)
| | | | | | | | |
| Security Description | | Principal
Amount* | | | Value | |
|
| Repurchase Agreements—(Continued) | |
Citigroup Global Markets, Ltd.
Repurchase Agreement dated 12/31/18 at 2.490%, due on 01/02/19 with a maturity value of $900,125; collateralized by U.S. Treasury Obligations with rates ranging from 0.375% - 1.875%, maturity dates ranging from 12/15/20 - 01/15/27, and an aggregate market value of $918,001. | | | 900,000 | | | $ | 900,000 | |
Deutsche Bank AG, London
Repurchase Agreement dated 12/31/18 at 2.750%, due on 01/02/19 with a maturity value of $700,107; collateralized by U.S. Treasury and Foreign Obligations with rates ranging from 1.000% - 2.590%, maturity dates ranging from 03/31/19 - 12/29/26, and an aggregate market value of $714,000. | | | 700,000 | | | | 700,000 | |
Deutsche Bank Securities, Inc.
Repurchase Agreement dated 12/31/18 at 3.200%, due on 01/02/19 with a maturity value of $3,517,858; collateralized by U.S. Treasury Obligations at 0.000%, maturity dates ranging from 08/15/30 - 08/15/39, and an aggregate market value of $3,587,577. | | | 3,517,233 | | | | 3,517,233 | |
Merrill Lynch, Pierce, Fenner & Smith, Inc.
Repurchase Agreement dated 12/31/18 at 2.940%, due on 04/02/19 with a maturity value of $8,563,863; collateralized by various Common Stock with an aggregate market value of $9,350,000. | | | 8,500,000 | | | | 8,500,000 | |
NBC Global Finance, Ltd.
Repurchase Agreement dated 12/31/18 at 2.560%, due on 01/02/19 with a maturity value of $10,001,422; collateralized by various Common Stock with an aggregate market value of $11,132,123. | | | 10,000,000 | | | | 10,000,000 | |
Repurchase Agreement dated 12/31/18 at 2.560%, due on 01/02/19 with a maturity value of $3,000,427; collateralized by various Common Stock with an aggregate market value of $3,339,637. | | | 3,000,000 | | | | 3,000,000 | |
| | | | | | | | |
| | | | | | | 31,617,233 | |
| | | | | | | | |
Total Securities Lending Reinvestments
(Cost $155,074,389) | | | | | | | 155,069,194 | |
| | | | | | | | |
Total Investments—119.1%
(Cost $895,661,835) | | | | | | | 989,191,688 | |
Other assets and liabilities (net)—(19.1)% | | | | | | | (158,317,608 | ) |
| | | | | | | | |
| Net Assets—100.0% | | | | | | $ | 830,874,080 | |
| | | | | | | | |
| | | | |
| * | | Principal amount stated in U.S. dollars unless otherwise noted. |
| (a) | | All or a portion of the security was held on loan. As of December 31, 2018, the market value of securities loaned was $152,453,105 and the collateral received consisted of cash in the amount of $154,960,254. The cash collateral investments are disclosed in the Schedule of Investments and categorized as Securities Lending Reinvestments. |
| (b) | | Non-income producing security. |
| (c) | | Represents investment of cash collateral received from securities on loan as of December 31, 2018. |
| (d) | | Variable or floating rate security. The stated rate represents the rate at December 31, 2018. Maturity date shown for callable securities reflects the earliest possible call date. For securities based on a published reference index and spread, the index and spread are indicated in the description above. For certain variable rate securities, the coupon rate is determined by the issuer/agent based on current market conditions. For certain asset- and mortgage-backed securities, the coupon rate may fluctuate based on changes of the underlying collateral or prepayments of principal. These securities do not indicate a reference index and spread in their description above. |
| (FEDEFF PRV)— | | Effective Federal Funds Rate |
| (LIBOR)— | | London Interbank Offered Rate |
See accompanying notes to financial statements.
BHFTII-7
Brighthouse Funds Trust II
Brighthouse/Artisan Mid Cap Value Portfolio
Schedule of Investments as of December 31, 2018
Fair value hierarchy
Accounting principles generally accepted in the United States of America (“GAAP”) define fair market value as the price that the Portfolio would receive to sell an asset or pay to transfer a liability in an orderly transaction between market participants at the measurement date. It establishes a fair value hierarchy that prioritizes inputs to valuation methods and requires disclosure of the fair value hierarchy, separately for each major category of assets and liabilities, that segregates fair value measurements into three levels. Levels 1, 2 and 3 of the fair value hierarchy are defined as follows:
Level 1 - unadjusted quoted prices in active markets for identical investments
Level 2 - other significant observable inputs (including, but not limited to, quoted prices for similar assets or liabilities in markets that are either active or inactive; inputs other than quoted prices that are observable such as interest rates, yield curves, volatilities, prepayment speeds, loss severities, credit risks, default rates, or other market corroborated inputs)
Level 3 - significant unobservable inputs based on the best information available in the circumstances, to the extent observable inputs are unavailable (including the Portfolio’s own assumptions used in determining the fair value of investments and derivative financial instruments)
The inputs or methodologies used for valuing investments are not necessarily an indication of the risk associated with investing in them. Changes to the inputs or methodologies used may result in transfers between levels. A reconciliation of Level 3 securities, if any, will be disclosed following the fair value hierarchy table. For more information about the Portfolio’s policy regarding the valuation of investments, please refer to the Notes to Financial Statements.
The following table summarizes the fair value hierarchy of the Portfolio’s investments as of December 31, 2018:
| | | | | | | | | | | | | | | | |
| Description | | Level 1 | | | Level 2 | | | Level 3 | | | Total | |
Total Common Stocks* | | $ | 794,673,213 | | | $ | — | | | $ | — | | | $ | 794,673,213 | |
Total Short-Term Investment* | | | — | | | | 39,449,281 | | | | — | | | | 39,449,281 | |
Total Securities Lending Reinvestments* | | | — | | | | 155,069,194 | | | | — | | | | 155,069,194 | |
Total Investments | | $ | 794,673,213 | | | $ | 194,518,475 | | | $ | — | | | $ | 989,191,688 | |
| | | | | | | | | | | | | | | | | |
Collateral for Securities Loaned (Liability) | | $ | — | | | $ | (154,960,254 | ) | | $ | — | | | $ | (154,960,254 | ) |
| | | | |
| * | | See Schedule of Investments for additional detailed categorizations. |
See accompanying notes to financial statements.
BHFTII-8
Brighthouse Funds Trust II
Brighthouse/Artisan Mid Cap Value Portfolio
Statement of Assets and Liabilities
December 31, 2018
| | | | |
Assets | |
Investments at value (a) (b) | | $ | 989,191,688 | |
Receivable for: | |
Fund shares sold | | | 1,303,828 | |
Dividends and interest | | | 1,007,753 | |
Prepaid expenses | | | 2,638 | |
| | | | |
Total Assets | | | 991,505,907 | |
Liabilities | |
Collateral for securities loaned | | | 154,960,254 | |
Payables for: | |
Investments purchased | | | 4,527,642 | |
Fund shares redeemed | | | 248,350 | |
Accrued Expenses: | |
Management fees | | | 565,379 | |
Distribution and service fees | | | 72,416 | |
Deferred trustees’ fees | | | 111,694 | |
Other expenses | | | 146,092 | |
| | | | |
Total Liabilities | | | 160,631,827 | |
| | | | |
Net Assets | | $ | 830,874,080 | |
| | | | |
Net Assets Consist of: | |
Paid in surplus | | $ | 624,496,290 | |
Distributable earnings (Accumulated losses) | | | 206,377,790 | |
| | | | |
Net Assets | | $ | 830,874,080 | |
| | | | |
Net Assets | |
Class A | | $ | 476,296,887 | |
Class B | | | 293,032,970 | |
Class E | | | 61,544,223 | |
Capital Shares Outstanding* | |
Class A | | | 2,248,197 | |
Class B | | | 1,435,198 | |
Class E | | | 296,039 | |
Net Asset Value, Offering Price and Redemption Price Per Share | |
Class A | | $ | 211.86 | |
Class B | | | 204.18 | |
Class E | | | 207.89 | |
| | | | |
| * | | The Portfolio is authorized to issue an unlimited number of shares. |
| (a) | | Identified cost of investments was $895,661,835. |
| (b) | | Includes securities loaned at value of $152,453,105. |
Statement of Operations
Year Ended December 31, 2018
| | | | |
Investment Income | |
Dividends (a) | | $ | 14,309,615 | |
Interest | | | 494,999 | |
Securities lending income | | | 744,946 | |
| | | | |
Total investment income | | | 15,549,560 | |
Expenses | |
Management fees | | | 8,448,304 | |
Administration fees | | | 40,660 | |
Custodian and accounting fees | | | 64,349 | |
Distribution and service fees—Class B | | | 903,801 | |
Distribution and service fees—Class E | | | 112,452 | |
Audit and tax services | | | 44,663 | |
Legal | | | 45,317 | |
Trustees’ fees and expenses | | | 33,734 | |
Shareholder reporting | | | 123,015 | |
Insurance | | | 6,828 | |
Miscellaneous | | | 19,005 | |
| | | | |
Total expenses | | | 9,842,128 | |
Less management fee waiver | | | (471,918 | ) |
Less broker commission recapture | | | (14,671 | ) |
| | | | |
Net expenses | | | 9,355,539 | |
| | | | |
Net Investment Income | | | 6,194,021 | |
| | | | |
Net Realized and Unrealized Gain (Loss) | |
Net realized gain on investments | | | 107,093,791 | |
| | | | |
Net change in unrealized depreciation on investments | | | (239,582,018 | ) |
| | | | |
Net realized and unrealized loss | | | (132,488,227 | ) |
| | | | |
Net Decrease in Net Assets From Operations | | $ | (126,294,206 | ) |
| | | | |
| | | | |
| (a) | | Net of foreign withholding taxes of $123,956. |
See accompanying notes to financial statements.
BHFTII-9
Brighthouse Funds Trust II
Brighthouse/Artisan Mid Cap Value Portfolio
Statements of Changes in Net Assets
| | | | | | | | |
| | | Year Ended
December 31,
2018 | | | Year Ended
December 31,
2017 | |
Increase (Decrease) in Net Assets: | |
From Operations | |
Net investment income | | $ | 6,194,021 | | | $ | 6,094,958 | |
Net realized gain | | | 107,093,791 | | | | 73,406,636 | |
Net change in unrealized appreciation (depreciation) | | | (239,582,018 | ) | | | 56,060,091 | |
| | | | | | | | |
Increase (decrease) in net assets from operations | | | (126,294,206 | ) | | | 135,561,685 | |
| | | | | | | | |
From Distributions to Shareholders (a) | |
Class A | | | (33,856,446 | ) | | | (4,618,720 | ) |
Class B | | | (21,308,286 | ) | | | (1,950,478 | ) |
Class E | | | (4,423,964 | ) | | | (461,275 | ) |
| | | | | | | | |
Total distributions | | | (59,588,696 | ) | | | (7,030,473 | ) |
| | | | | | | | |
Decrease in net assets from capital share transactions | | | (130,302,350 | ) | | | (120,097,285 | ) |
| | | | | | | | |
Total increase (decrease) in net assets | | | (316,185,252 | ) | | | 8,433,927 | |
|
Net Assets | |
Beginning of period | | | 1,147,059,332 | | | | 1,138,625,405 | |
| | | | | | | | |
End of period | | $ | 830,874,080 | | | $ | 1,147,059,332 | (b) |
| | | | | | | | |
Other Information:
Capital Shares
Transactions in capital shares were as follows:
| | | | | | | | | | | | | | | | |
| | | Year Ended
December 31, 2018 | | | Year Ended
December 31, 2017 | |
| | | Shares | | | Value | | | Shares | | | Value | |
Class A | |
Sales | | | 32,409 | | | $ | 7,937,023 | | | | 51,236 | | | $ | 12,312,536 | |
Reinvestments | | | 135,751 | | | | 33,856,446 | | | | 19,370 | | | | 4,618,720 | |
Redemptions | | | (529,905 | ) | | | (135,797,046 | ) | | | (279,672 | ) | | | (67,675,485 | ) |
| | | | | | | | | | | | | | | | |
Net decrease | | | (361,745 | ) | | $ | (94,003,577 | ) | | | (209,066 | ) | | $ | (50,744,229 | ) |
| | | | | | | | | | | | | | | | |
Class B | |
Sales | | | 37,916 | | | $ | 8,956,383 | | | | 67,106 | | | $ | 15,605,735 | |
Reinvestments | | | 88,530 | | | | 21,308,286 | | | | 8,460 | | | | 1,950,478 | |
Redemptions | | | (252,369 | ) | | | (61,489,870 | ) | | | (324,130 | ) | | | (75,831,622 | ) |
| | | | | | | | | | | | | | | | |
Net decrease | | | (125,923 | ) | | $ | (31,225,201 | ) | | | (248,564 | ) | | $ | (58,275,409 | ) |
| | | | | | | | | | | | | | | | |
Class E | |
Sales | | | 9,182 | | | $ | 2,128,318 | | | | 7,456 | | | $ | 1,758,107 | |
Reinvestments | | | 18,061 | | | | 4,423,964 | | | | 1,968 | | | | 461,275 | |
Redemptions | | | (46,968 | ) | | | (11,625,854 | ) | | | (56,110 | ) | | | (13,297,029 | ) |
| | | | | | | | | | | | | | | | |
Net decrease | | | (19,725 | ) | | $ | (5,073,572 | ) | | | (46,686 | ) | | $ | (11,077,647 | ) |
| | | | | | | | | | | | | | | | |
Decrease derived from capital shares transactions | | | | | | $ | (130,302,350 | ) | | | | | | $ | (120,097,285 | ) |
| | | | | | | | | | | | | | | | |
| | | | |
| (a) | | Distributions from net investment income and realized gains are no longer required to be separately disclosed. The presentation for the year ended December 31, 2018 has been adjusted for this change (See Note 8). At December 31, 2017 the distributions were from net investment income. |
| (b) | | As part of the update in (a), it is also no longer required to disclose the Undistributed net investment income (Accumulated losses) which was $5,592,206 as of December 31, 2017. |
See accompanying notes to financial statements.
BHFTII-10
Brighthouse Funds Trust II
Brighthouse/Artisan Mid Cap Value Portfolio
Financial Highlights
| | | | | | | | | | | | | | | | | | | | |
| Selected per share data | |
| | | Class A | |
| | | Year Ended December 31, | |
| | | 2018 | | | 2017 | | | 2016 | | | 2015 | | | 2014 | |
Net Asset Value, Beginning of Period | | $ | 259.07 | | | $ | 231.28 | | | $ | 213.79 | | | $ | 271.79 | | | $ | 268.60 | |
| | | | | | | | | | | | | | | | | | | | |
Income (Loss) from Investment Operations | |
Net investment income (a) | | | 1.75 | | | | 1.54 | | | | 1.74 | (b) | | | 2.26 | | | | 2.89 | |
Net realized and unrealized gain (loss) | | | (33.63 | ) | | | 27.96 | | | | 43.82 | | | | (23.66 | ) | | | 2.25 | |
| | | | | | | | | | | | | | | | | | | | |
Total income (loss) from investment operations | | | (31.88 | ) | | | 29.50 | | | | 45.56 | | | | (21.40 | ) | | | 5.14 | |
| | | | | | | | | | | | | | | | | | | | |
Less Distributions | |
Distributions from net investment income | | | (1.62 | ) | | | (1.71 | ) | | | (2.56 | ) | | | (3.17 | ) | | | (1.95 | ) |
Distributions from net realized capital gains | | | (13.71 | ) | | | 0.00 | | | | (25.51 | ) | | | (33.43 | ) | | | 0.00 | |
| | | | | | | | | | | | | | | | | | | | |
Total distributions | | | (15.33 | ) | | | (1.71 | ) | | | (28.07 | ) | | | (36.60 | ) | | | (1.95 | ) |
| | | | | | | | | | | | | | | | | | | | |
Net Asset Value, End of Period | | $ | 211.86 | | | $ | 259.07 | | | $ | 231.28 | | | $ | 213.79 | | | $ | 271.79 | |
| | | | | | | | | | | | | | | | | | | | |
Total Return (%) (c) | | | (13.20 | ) | | | 12.82 | | | | 22.96 | | | | (9.44 | ) | | | 1.93 | |
|
Ratios/Supplemental Data | |
Gross ratio of expenses to average net assets (%) | | | 0.85 | | | | 0.85 | | | | 0.85 | | | | 0.84 | | | | 0.84 | |
Net ratio of expenses to average net assets (%) (d) | | | 0.81 | | | | 0.85 | | | | 0.85 | | | | 0.84 | | | | 0.84 | |
Ratio of net investment income to average net assets (%) | | | 0.70 | | | | 0.64 | | | | 0.80 | (b) | | | 0.91 | | | | 1.07 | |
Portfolio turnover rate (%) | | | 23 | | | | 21 | | | | 31 | | | | 31 | | | | 25 | |
Net assets, end of period (in millions) | | $ | 476.3 | | | $ | 676.2 | | | $ | 652.0 | | | $ | 739.1 | | | $ | 853.7 | |
| |
| | | Class B | |
| | | Year Ended December 31, | |
| | | 2018 | | | 2017 | | | 2016 | | | 2015 | | | 2014 | |
Net Asset Value, Beginning of Period | | $ | 250.17 | | | $ | 223.41 | | | $ | 207.30 | | | $ | 264.50 | | | $ | 261.50 | |
| | | | | | | | | | | | | | | | | | | | |
Income (Loss) from Investment Operations | |
Net investment income (a) | | | 1.09 | | | | 0.90 | | | | 1.16 | (b) | | | 1.59 | | | | 2.15 | |
Net realized and unrealized gain (loss) | | | (32.43 | ) | | | 27.01 | | | | 42.40 | | | | (22.95 | ) | | | 2.21 | |
| | | | | | | | | | | | | | | | | | | | |
Total income (loss) from investment operations | | | (31.34 | ) | | | 27.91 | | | | 43.56 | | | | (21.36 | ) | | | 4.36 | |
| | | | | | | | | | | | | | | | | | | | |
Less Distributions | |
Distributions from net investment income | | | (0.94 | ) | | | (1.15 | ) | | | (1.94 | ) | | | (2.41 | ) | | | (1.36 | ) |
Distributions from net realized capital gains | | | (13.71 | ) | | | 0.00 | | | | (25.51 | ) | | | (33.43 | ) | | | 0.00 | |
| | | | | | | | | | | | | | | | | | | | |
Total distributions | | | (14.65 | ) | | | (1.15 | ) | | | (27.45 | ) | | | (35.84 | ) | | | (1.36 | ) |
| | | | | | | | | | | | | | | | | | | | |
Net Asset Value, End of Period | | $ | 204.18 | | | $ | 250.17 | | | $ | 223.41 | | | $ | 207.30 | | | $ | 264.50 | |
| | | | | | | | | | | | | | | | | | | | |
Total Return (%) (c) | | | (13.42 | ) | | | 12.54 | | | | 22.65 | | | | (9.66 | ) | | | 1.67 | |
|
Ratios/Supplemental Data | |
Gross ratio of expenses to average net assets (%) | | | 1.10 | | | | 1.10 | | | | 1.10 | | | | 1.09 | | | | 1.09 | |
Net ratio of expenses to average net assets (%) (d) | | | 1.06 | | | | 1.10 | | | | 1.10 | | | | 1.09 | | | | 1.09 | |
Ratio of net investment income to average net assets (%) | | | 0.45 | | | | 0.39 | | | | 0.55 | (b) | | | 0.66 | | | | 0.82 | |
Portfolio turnover rate (%) | | | 23 | | | | 21 | | | | 31 | | | | 31 | | | | 25 | |
Net assets, end of period (in millions) | | $ | 293.0 | | | $ | 390.5 | | | $ | 404.3 | | | $ | 358.7 | | | $ | 446.3 | |
Please see following page for Financial Highlights footnote legend.
See accompanying notes to financial statements.
BHFTII-11
Brighthouse Funds Trust II
Brighthouse/Artisan Mid Cap Value Portfolio
Financial Highlights
| | | | | | | | | | | | | | | | | | | | |
| Selected per share data | |
| | | Class E | |
| | | Year Ended December 31, | |
| | | 2018 | | | 2017 | | | 2016 | | | 2015 | | | 2014 | |
Net Asset Value, Beginning of Period | | $ | 254.48 | | | $ | 227.21 | | | $ | 210.43 | | | $ | 267.99 | | | $ | 264.86 | |
| | | | | | | | | | | | | | | | | | | | |
Income (Loss) from Investment Operations | |
Net investment income (a) | | | 1.36 | | | | 1.15 | | | | 1.40 | (b) | | | 1.85 | | | | 2.43 | |
Net realized and unrealized gain (loss) | | | (33.02 | ) | | | 27.48 | | | | 43.07 | | | | (23.28 | ) | | | 2.25 | |
| | | | | | | | | | | | | | | | | | | | |
Total income (loss) from investment operations | | | (31.66 | ) | | | 28.63 | | | | 44.47 | | | | (21.43 | ) | | | 4.68 | |
| | | | | | | | | | | | | | | | | | | | |
Less Distributions | |
Distributions from net investment income | | | (1.22 | ) | | | (1.36 | ) | | | (2.18 | ) | | | (2.70 | ) | | | (1.55 | ) |
Distributions from net realized capital gains | | | (13.71 | ) | | | 0.00 | | | | (25.51 | ) | | | (33.43 | ) | | | 0.00 | |
| | | | | | | | | | | | | | | | | | | | |
Total distributions | | | (14.93 | ) | | | (1.36 | ) | | | (27.69 | ) | | | (36.13 | ) | | | (1.55 | ) |
| | | | | | | | | | | | | | | | | | | | |
Net Asset Value, End of Period | | $ | 207.89 | | | $ | 254.48 | | | $ | 227.21 | | | $ | 210.43 | | | $ | 267.99 | |
| | | | | | | | | | | | | | | | | | | | |
Total Return (%) (c) | | | (13.33 | ) | | | 12.65 | | | | 22.78 | | | | (9.58 | ) | | | 1.78 | |
|
Ratios/Supplemental Data | |
Gross ratio of expenses to average net assets (%) | | | 1.00 | | | | 1.00 | | | | 1.00 | | | | 0.99 | | | | 0.99 | |
Net ratio of expenses to average net assets (%) (d) | | | 0.96 | | | | 1.00 | | | | 1.00 | | | | 0.99 | | | | 0.99 | |
Ratio of net investment income to average net assets (%) | | | 0.55 | | | | 0.49 | | | | 0.65 | (b) | | | 0.76 | | | | 0.91 | |
Portfolio turnover rate (%) | | | 23 | | | | 21 | | | | 31 | | | | 31 | | | | 25 | |
Net assets, end of period (in millions) | | $ | 61.5 | | | $ | 80.4 | | | $ | 82.4 | | | $ | 75.8 | | | $ | 95.1 | |
| | | | |
| (a) | | Per share amounts based on average shares outstanding during the period. |
| (b) | | Net investment income per share and the ratio of net investment income to average net assets include anon-recurring refund for overbilling of prior years’ custodianout-of-pocket fees which amounted to $0.01 per share and less than 0.01% of average net assets, respectively. |
| (c) | | Total return does not reflect any insurance, sales, separate account or administrative charges of variable annuity or life insurance contracts or any additional expenses that contract owners may bear under their variable contracts. If these charges were included, the returns would be lower. |
| (d) | | Includes the effects of management fee waivers (see Note 5 of the Notes to Financial Statements). |
See accompanying notes to financial statements.
BHFTII-12
Brighthouse Funds Trust II
Brighthouse/Artisan Mid Cap Value Portfolio
Notes to Financial Statements—December 31, 2018
1. Organization
Brighthouse Funds Trust II (the “Trust”) is organized as a Delaware statutory trust and registered under the Investment Company Act of 1940, as amended (the “1940 Act”), as anopen-end management investment company. The Trust, which is managed by Brighthouse Investment Advisers, LLC (“Brighthouse Investment Advisers” or the “Adviser”), currently offers twenty-nine series, each of which operates as a distinct investment vehicle of the Trust. The series included in this report is Brighthouse/Artisan Mid Cap Value Portfolio (the “Portfolio”), which is diversified. Shares in the Portfolio are not offered directly to the general public and are currently available only to separate accounts established by life insurance companies affiliated with the Adviser and Metropolitan Life Insurance Company (the “Insurance Companies”).
The Portfolio has registered and offers three classes of shares: Class A, B and E shares. Shares of each Class of the Portfolio represent an equal pro rata interest in the Portfolio and generally give the shareholder the same voting, dividend, liquidation, and other rights. Investment income, realized and unrealized capital gains and losses, the common expenses of the Portfolio, and certain Portfolio-level expense reductions, if any, are allocated on a pro rata basis to each Class based on the relative net assets of each Class to the net assets of the Portfolio. Each Class of shares differs in its respective distribution plan and such distribution expenses are allocated to the corresponding Class of shares.
2. Significant Accounting Policies
The preparation of financial statements in conformity with accounting principles generally accepted in the United States of America (“GAAP”) requires management to make estimates and assumptions that affect the reported amounts of assets and liabilities and disclosure of contingent assets and liabilities as of the date of the financial statements and the reported amounts of income and expenses during the reporting period. Actual results could differ from those estimates. In the preparation of these financial statements, management has evaluated events and transactions subsequent to December 31, 2018 through the date the financial statements were issued.
The Portfolio is an investment company and follows the accounting and reporting guidance of the Financial Accounting Standards Board (“FASB”) Accounting Standards Codification Topic 946—Financial Services—Investment Companies. The following is a summary of significant accounting policies consistently followed by the Portfolio in the preparation of its financial statements.
Investment Valuation and Fair Value Measurements - The Portfolio values its portfolio investments for purposes of calculating its net asset value (“NAV”) using procedures approved by the Board of Trustees of the Trust (the “Board” or “Trustees”). Those procedures allow for a variety of methodologies to be used to value the Portfolio’s investments. The specific methodologies used for a particular investment may vary based on the market data available for a specific investment at the time the Portfolio calculates its NAV or based on other considerations. The procedures also permit a level of judgment to be used in the valuation process. The Portfolio follows the accounting and reporting guidance of FASB Accounting Standards Codification Topic 820—Fair Value Measurement.
Domestic and foreign equity securities, such as common stock, exchange-traded funds, rights, warrants, and preferred stock, that are traded on a securities exchange on a valuation date are generally valued at their last quoted sale price or official closing price on the primary exchange for such security, or, if no sales occurred on that day, at the last reported bid price. Equity securities tradedover-the-counter (“OTC”) are generally valued at the last reported bid price. In the event of a major exchange closing during the trading day, the Adviser may use other market information obtained from quotation reporting systems, established market makers, or pricing services in valuing the securities. Valuation adjustments may be applied to certain foreign equity securities that are traded solely on foreign exchanges that close before the time as of which the Portfolio determines its NAV to account for the market movement between the close of the foreign exchanges and the time as of which the Portfolio determines its NAV. The Portfolio may use a systematic fair valuation model provided by a pricing service to value securities principally traded in these foreign markets in order to adjust for possible market movements or other changes that may occur between the close of the foreign exchanges and the time as of which the Portfolio determines its NAV. Foreign equity securities valued using these valuation adjustments are generally categorized as Level 2 within the fair value hierarchy. Equity securities that are actively traded, and have no valuation adjustments applied, are categorized as Level 1 within the fair value hierarchy. Other equity securities traded on inactive markets, or valued in reference to similar instruments traded on active markets, are generally categorized as Level 2 within the fair value hierarchy.
Investments in registeredopen-end management investment companies are valued at reported NAV per share on the valuation date and are categorized as Level 1 within the fair value hierarchy.
Debt securities, including corporate, convertible and municipal bonds and notes; obligations of the U.S. Treasury and U.S. government agencies; foreign sovereign issues; andnon-U.S. bonds, are generally valued on the basis of evaluated or composite bid quotations obtained from independent pricing services and/or brokers and dealers selected by the Adviser (each a “pricing service”), pursuant to the authorization of and subject to general oversight by the Board. Such pricing services may use matrix pricing, which considers observable inputs including, among other things, issuer details, maturity dates, interest rates, yield curves, rates of prepayment, credit risks/spreads, default rates, reported trades, broker-dealer quotes and quoted prices for similar assets. Short-term obligations with a
BHFTII-13
Brighthouse Funds Trust II
Brighthouse/Artisan Mid Cap Value Portfolio
Notes to Financial Statements—December 31, 2018—(Continued)
remaining maturity of sixty days or less may be valued at amortized cost in the absence of market quotes, so long as the amortized cost value of such short-term debt instrument is approximately the same as the fair value of the instrument as determined without the use of amortized cost valuation. Floating rate loans are generally valued on the basis of an evaluated or composite average of aggregate bid and ask quotations supplied by brokers or dealers, as obtained from the pricing service. Securities that use similar valuation techniques and inputs as described above are generally categorized as Level 2 within the fair value hierarchy.
Options, whether on securities, indices, futures contracts, or otherwise, traded on exchanges are valued at the last sale price available as of the close of business on a valuation day or, if there is no such price available, at the last reported bid price. These types of options are categorized as Level 1 within the fair value hierarchy. Futures contracts that are traded on commodity exchanges are valued at their settlement prices established by the exchanges on which they are traded as of the close of such exchanges and are categorized as Level 1 within the fair value hierarchy.
If no current market value quotation or other observable inputs are readily available or market value quotations are deemed to be unreliable for an investment, the fair value of the investment will be determined in accordance with procedures approved by, and under the general supervision of, the Board. In such a circumstance, the Board will be assisted in its responsibility to determine the fair value of an investment by the Valuation Committee (“Committee”) of Brighthouse Investment Advisers. The Committee provides general pricing oversight and fair value pricing determinations related to portfolio securities and meets on a regular basis to review reports relating to the valuation of the securities in the Portfolio. The Board has delegated to State Street Bank and Trust Company, the Trust’s custodian (“Custodian”), the responsibility for calculating the NAVs of the Trust’s Portfolios. The Committee is responsible for overseeing the calculation of the NAVs of the Portfolios by the custodian. The Committee also periodically reviews pricing services, including the pricing services providing fair value pricing for the Portfolio’s foreign securities, and is responsible for overseeing the correction of pricing errors and addressing other pricing issues that arise in the ordinary course of business, such as making real-time fair value determinations, as necessary.
No single standard for determining the fair value of an investment can be set forth because fair value depends upon the facts and circumstances with respect to each investment. Information relating to any relevant factors may be obtained by the Committee from any appropriate source, including the subadviser of the Portfolio, the custodian, a pricing service, market maker and/or broker for such security or the issuer. Appropriate methodologies for determining fair value under particular circumstances may include: matrix pricing, a discounted cash flow analysis, comparisons of securities with comparable characteristics, value based on multiples of earnings, discount from market price of similar marketable securities, or a combination of these and other methods.
Investment Transactions and Related Investment Income - Portfolio security transactions are recorded on the trade date. Dividend income is recorded on theex-dividend date or, for certain foreign securities, when notified. Interest income, which includes amortization of premium and accretion of discount on debt securities, is recorded on the accrual basis. Realized gains and losses on investments are determined on the identified cost basis, which is the same basis used for federal income tax purposes. Foreign income and foreign capital gains on some foreign securities may be subject to foreign taxes, which are accrued as applicable. These foreign taxes have been provided for in accordance with the Portfolio’s understanding of the applicable countries’ tax rules and rates.
Foreign Currency Translation -The books and records of the Portfolio are maintained in U.S. dollars. The values of securities, currencies, and other assets and liabilities denominated in currencies other than the U.S. dollar are translated into U.S. dollars based upon foreign exchange rates prevailing at the end of the period. Purchases and sales of investment securities, income, and expenses are translated on the respective dates of such transactions. Because the values of investment securities are translated at the foreign exchange rates prevailing at the end of the period, that portion of the results of operations arising from changes in exchange rates and that portion of the results of operations reflecting fluctuations arising from changes in market prices of the investment securities are not separated. Such fluctuations are included in the net realized and unrealized gain or loss on investments.
Net realized foreign exchange gains or losses arise from activity in forward foreign currency exchange contracts, sales of foreign currency, currency gains or losses realized between the trade and settlement dates on securities transactions, and the difference between the amounts of dividends, interest, and foreign withholding taxes recorded by the Portfolio and the U.S. dollar-equivalent of the amounts actually received or paid by the Portfolio. Net unrealized foreign exchange gains and losses arise from changes in the value of assets and liabilities, other than investment securities, resulting from changes in foreign exchange rates.
Dividends and Distributions to Shareholders -The Portfolio records dividends and distributions on theex-dividend date. Net realized gains from securities transactions (if any) are generally distributed annually to shareholders. The timing and characterization of certain income and capital gains distributions are determined in accordance with federal tax regulations that may differ from GAAP. Permanent book and tax basis differences relating to shareholder distributions will result in reclassification between distributable earnings (accumulated losses) andpaid-in surplus. These adjustments have no impact on net assets or the results of operations.
Income Taxes -It is the Portfolio’s policy to comply with the requirements of the Internal Revenue Code of 1986, as amended, and regulations thereunder, applicable to regulated investment companies, and to distribute, with respect to each taxable year, all of its taxable income to shareholders. Therefore, no federal income tax provision is required. The Portfolio files U.S. federal tax returns. No
BHFTII-14
Brighthouse Funds Trust II
Brighthouse/Artisan Mid Cap Value Portfolio
Notes to Financial Statements—December 31, 2018—(Continued)
income tax returns are currently under examination. The Portfolio’s federal tax returns for the prior three fiscal years remain subject to examination by the Internal Revenue Service. As of December 31, 2018, the Portfolio had no uncertain tax positions that would require financial statement recognition, or derecognition or disclosure.
Directed Brokerage Agreement -The Trust has entered into a directed brokerage arrangement with Capital Institutional Services, Inc. (“CAPIS”). Under this arrangement, the Portfolio directs certain trades to CAPIS in return for a recapture credit. CAPIS issues a cash rebate to the Portfolio. Amounts paid to the Portfolio are shown separately as broker commission recapture on the Statement of Operations of the Portfolio. Additionally, these amounts have been excluded from the calculation of the net ratio of expenses to average net assets presented in the Financial Highlights for each share class.
Repurchase Agreements -The Portfolio may enter into repurchase agreements, under the terms of a Master Repurchase Agreement (“MRA”), with selected commercial banks and broker-dealers, under which the Portfolio acquires securities as collateral and agrees to resell the securities at an agreed-upon time and at an agreed-upon price. The Portfolio, through the Custodian or a subcustodian, under atri-party repurchase agreement, receives delivery of the underlying securities collateralizing any repurchase agreements. It is the Portfolio’s policy that the market value of the collateral be equal to at least 100% of the repurchase price in the case of a repurchase agreement ofone-day duration and equal to at least 102% of the repurchase price in the case of all other repurchase agreements. In the event of default or failure by a party to perform an obligation in connection with any repurchase transaction, the MRA gives thenon-defaulting party the right toset-off claims and to apply property held by it in connection with any repurchase transaction against obligations owed to it.
At December 31, 2018, the Portfolio had direct investments in repurchase agreements with a gross value of $39,449,281. Additionally, the Portfolio invested cash collateral for loans of portfolio securities in repurchase agreements with a gross value of $31,617,233. The combined value of all repurchase agreements is included as part of investments at value on the Statement of Assets and Liabilities. The value of the related collateral exceeded the value of the repurchase agreements at December 31, 2018.
Securities Lending - The Portfolio may lend its portfolio securities to certain qualified brokers who borrow securities in order to complete certain securities transactions. By lending its portfolio securities, the Portfolio attempts to increase its net investment income through the receipt of income on collateral held from securities on loan. Any gain or loss in the market price of the loaned securities that might occur and any interest earned or dividends declared during the term of the loan would accrue to the account of the Portfolio.
The Trust has entered into aNon-Custodial Securities Lending Agreement with JPMorgan Chase Bank, N.A. (the “Lending Agent”). Under the agreement, the Lending Agent is authorized to loan portfolio securities on the Portfolio’s behalf. In exchange, the Portfolio receives either cash or U.S. government securities as collateral against the loaned securities. The Portfolio receives collateral equal to at least 102% of the market value for loans secured by government securities or cash in the same currency as the loaned shares and 105% for all other loaned securities at each loan’s inception. Collateral representing at least 100% of the market value of the loaned securities is maintained for the duration of the loan. Any cash collateral received by the Portfolio is generally invested by the Lending Agent in short-term investments, which may include certificates of deposit, commercial paper, repurchase agreements, time deposits, master demand notes and money market funds. The market value of investments made with cash collateral received are disclosed in the Schedule of Investments and the valuation techniques are described in Note 2. If the market value of the collateral at the close of trading on a business day is less than 100% of the market value of the loaned securities at the close of trading on that day, the borrower is required to deliver, by the close of business on the following business day, an additional amount of collateral, so that the total amount of posted collateral is equal to at least 100% of the market value of all the loaned securities as of such preceding day. A portion of the income earned on the collateral is rebated to the borrower of the securities and the remainder is split between the Lending Agent and the Portfolio. On loans collateralized by U.S. government securities, a fee is received from the borrower and is allocated between the Portfolio and the Lending Agent.
Income received by the Portfolio in securities lending transactions during the year ended December 31, 2018 is reflected as securities lending income on the Statement of Operations. The values of any securities loaned by the Portfolio and the related collateral at December 31, 2018 are disclosed in the footnotes to the Schedule of Investments. The value of the related collateral received by the Portfolio exceeded the value of the securities out on loan at December 31, 2018.
The risks associated with lending portfolio securities include, but are not limited to, possible delays in receiving additional collateral or in the recovery of the loaned securities, possible loss of rights in the collateral should the borrower fail financially, as well as risk of loss in the value of the collateral or the value of the investments made with the collateral. The Lending Agent shall indemnify the Portfolio in the case of default of any securities borrower, subject to the terms of theNon-Custodial Securities Lending Agreement.
All securities on loan are classified as Common Stocks in the Portfolio’s Schedule of Investments as of December 31, 2018, with a contractual maturity of overnight and continuous.
BHFTII-15
Brighthouse Funds Trust II
Brighthouse/Artisan Mid Cap Value Portfolio
Notes to Financial Statements—December 31, 2018—(Continued)
3. Certain Risks
In the normal course of business, the Portfolio invests in securities and enters into transactions where risks exist. Those risks include:
Market Risk:The value of securities held by the Portfolio may decline in response to certain events, including those directly involving the issuers whose securities are owned by the Portfolio; conditions affecting the general economy; overall market changes; local, regional or global political, social or economic instability; and currency, interest rate, and price fluctuations.
Credit and Counterparty Risk: The Portfolio may be exposed to counterparty risk, or the risk that an entity with which the Portfolio has unsettled or open transactions may default. The potential loss could exceed the value of the financial assets and liabilities recorded in the financial statements. Financial assets that potentially expose the Portfolio to credit and counterparty risk consist principally of cash due from counterparties and investments. The Portfolio manages counterparty risk by entering into agreements only with counterparties that it believes have the financial resources to honor their obligations and by monitoring the financial stability of those counterparties. The Adviser attempts to mitigate counterparty risk by (i) periodically assessing the creditworthiness of its trading partners, (ii) monitoring and/or limiting the amount of its net exposure to each individual counterparty based on its assessment, and (iii) requiring collateral from the counterparty for certain transactions. In order to preserve certain safeguards fornon-standard settlement trades, the Portfolio restricts its exposure to credit and counterparty losses by entering into master netting agreements (“Master Agreements”) with counterparties (approved brokers) with whom it undertakes a significant volume of transactions. Master Agreements govern the terms of certain transactions, and reduce the counterparty risk associated with relevant transactions by specifying credit protection mechanisms and providing standardization that improves legal certainty. Master Agreements can also help limit counterparty risk by specifying collateral posting arrangements atpre-arranged exposure levels.
Repurchase and reverse repurchase agreements are primarily executed under Global Master Repurchase Agreements (“GMRAs”) or Master Repurchase Agreements (“MRAs”), which provide the rights toset-off. Each repurchase and reverse repurchase agreement is initially collateralized at the transaction level. In the event of default, the total market value exposure will be offset against collateral exchanged to date, which would result in a net receivable/(payable) that would be due from/to the counterparty.
Additional risks associated with each type of investment are described above within the respective security type notes. The Portfolio’s prospectus includes a discussion of the principal risks of investing in the Portfolio.
4. Investment Transactions
Aggregate cost of purchases and proceeds of sales of investment securities, excluding short-term securities, for the year ended December 31, 2018 were as follows:
| | | | | | | | | | | | |
Purchases | | | Sales | |
U.S. Government | | Non-U.S. Government | | | U.S. Government | | | Non-U.S. Government | |
| $0 | | $ | 217,283,328 | | | $ | 0 | | | $ | 349,908,663 | |
During the year ended December 31, 2018, the Portfolio engaged in security transactions with other affiliated portfolios. These amounted to $4,312,774 in sales of investments, which are included above, and resulted in realized gains of $598,792.
5. Investment Management Fees and Other Transactions with Affiliates
Investment Management Agreement - Brighthouse Investment Advisers is the investment adviser to the Portfolio. The Trust has entered into an investment management agreement with Brighthouse Investment Advisers with respect to the Portfolio. For providing investment management services to the Portfolio, Brighthouse Investment Advisers receives monthly compensation at the following annual rates:
| | | | | | |
Management
Fees earned by
Brighthouse
Investment Advisers
for the year ended
December 31, 2018 | | % per annum | | | Average Daily Net Assets |
| $8,448,304 | | | 0.820 | % | | Of the first $1 billion |
| | | 0.780 | % | | On amounts in excess of $1 billion |
Brighthouse Investment Advisers has entered into an investment subadvisory agreement with respect to managing the Portfolio. Artisan Partners Limited Partnership (the “Subadviser”) is compensated by Brighthouse Investment Advisers to provide subadvisory services for the Portfolio.
BHFTII-16
Brighthouse Funds Trust II
Brighthouse/Artisan Mid Cap Value Portfolio
Notes to Financial Statements—December 31, 2018—(Continued)
Management Fee Waiver - Pursuant to a management fee waiver agreement, the Adviser has agreed, for the period April 30, 2018 to April 30, 2019, to reduce its advisory fees set out above under “Investment Management Agreement” for each class of the Portfolio as follows:
| | |
% per annum reduction | | Average Daily Net Assets |
| 0.040% | | On the first $500 million |
| 0.050% | | On the next $500 million |
| 0.060% | | On amounts in excess of $1 billion |
An identical agreement was in place for the period January 1, 2018 through April 30, 2018. Amounts waived for the year ended December 31, 2018 are shown as a management fee waiver in the Statement of Operations.
Certain officers and trustees of the Trust may also be officers of Brighthouse Investment Advisers; however, such officers and trustees receive no compensation from the Trust.
Transfer Agency Agreement - Brighthouse Financial, Inc. serves as the transfer agent for the Trust. Brighthouse Financial, Inc. receives no fees for its services to the Trust.
Distribution and Service Fees - The Trust has a distribution agreement with Brighthouse Securities, LLC (the “Distributor”) pursuant to which the Distributor serves as the general distributor of shares of each class (each a “Class”) of each Portfolio. The Distributor is an affiliate of the Trust. The Trust has adopted a Distribution and Services Plan (the “Plan”) relating to Class B and Class E shares of each Portfolio, under Rule 12b-1 under the 1940 Act, pursuant to which the Trust may pay the Distributor a fee (the “Service Fee”) at an annual rate not to exceed 0.25% of each such Portfolio’s average daily net assets attributable to the Class B and Class E shares of the Trust. Each Portfolio may not offer shares of each Class. The Plan also authorizes the Trust, on behalf of each of its Portfolios, may pay the Distributor a distribution Fee (the “Distribution Fee” and together with the Service Fee, the “Fees”) at an annual rate of up to 0.25% of each Portfolio’s average daily net assets attributable to the Class B and Class E shares in consideration of the services rendered in connection with the sale of such shares by the Distributor. Under the Distribution Agreement with respect to the Trust, Fees are currently paid at an annual rate of 0.25% of average daily net assets in the case of Class B shares and 0.15% of average daily net assets in the case of Class E shares. The Plan is known as a “compensation plan” because the Trust makes payments to the Distributor for services rendered regardless of the actual level of expenditures by the Distributor. Amounts incurred by the Portfolio for the year ended December 31, 2018 are shown as Distribution and service fees in the Statement of Operations.
Deferred Trustee Compensation - Each Trustee who is not currently an employee of the Adviser or any of its affiliates receives compensation from the Trust for his or her service to the Trust. A deferred compensation plan (the “Plan”) is available to the Trustees on a voluntary basis. Deferred amounts remain in the Trust until distributed in accordance with the provisions of the Plan. The value of a participating Trustee’s deferral account is based on theoretical investments of deferred amounts on the normal payment dates in certain portfolios of the Trust or Brighthouse Funds Trust I, an affiliate of the Trust, as designated by the participating Trustee. Changes in the value of participants’ deferral accounts are reflected as Trustees’ fees and expenses in the Statement of Operations. The portion of the accrued obligations allocated to the Portfolio under the Plan is reflected as Deferred trustees’ fees in the Statement of Assets and Liabilities.
6. Contractual Obligations
Under the Trust’s organizational documents, its officers and Trustees may be indemnified against certain liabilities and expenses arising out of the performance of their duties to the Trust. Additionally, the Trust has a variety of indemnification obligations under contracts with its service providers. The Trust’s maximum exposure under these arrangements is unknown, as this would involve future claims that may be made against the Trust that have not yet occurred.
7. Income Tax Information
The cost basis of investments for federal income tax purposes at December 31, 2018 was as follows:
| | | | |
Cost basis of investments | | $ | 896,728,473 | |
Gross unrealized appreciation | | | 166,873,584 | |
Gross unrealized depreciation | | | (74,410,369 | ) |
| | | | |
Net unrealized appreciation (depreciation) | | $ | 92,463,215 | |
| | | | |
BHFTII-17
Brighthouse Funds Trust II
Brighthouse/Artisan Mid Cap Value Portfolio
Notes to Financial Statements—December 31, 2018—(Continued)
The tax character of distributions paid for the years ended December 31, 2018 and 2017 were as follows:
| | | | | | | | | | | | | | | | | | | | |
Ordinary Income | | | Long-Term Capital Gain | | | Total | |
2018 | | 2017 | | | 2018 | | | 2017 | | | 2018 | | | 2017 | |
| $5,318,818 | | $ | 7,030,473 | | | $ | 54,269,878 | | | $ | — | | | $ | 59,588,696 | | | $ | 7,030,473 | |
As of December 31, 2018, the components of distributable earnings (accumulated losses) on a federal income tax basis were as follows:
| | | | | | | | | | | | | | | | |
Undistributed
Ordinary
Income | | Undistributed
Long-Term
Capital Gain | | | Net
Unrealized
Appreciation | | | Accumulated
Capital Losses | | | Total | |
| $9,892,574 | | $ | 104,133,695 | | | $ | 92,463,215 | | | $ | — | | | $ | 206,489,484 | |
The Portfolio utilizes the provisions of the federal income tax laws that provide for the carryforward of capital losses for prior years, offsetting such losses against any future realized capital gains. Under the Regulated Investment Company Modernization Act of 2010 (the “Act”), net capital losses recognized after December 22, 2010 may be carried forward indefinitely and their character is retained as short-term and/or long-term losses.
As of December 31, 2018, the Portfolio had no accumulated capital losses.
8. Recent Accounting Pronouncements and SEC Update
In August 2018, the FASB issued Accounting Standards Update2018-13, Fair Value Measurement (Topic 820)—Disclosure Framework—Changes to the Disclosure Requirements for Fair Value Measurement (“ASU2018-13”) which introduces new fair value disclosure requirements as well as eliminates and modifies certain existing fair value disclosure requirements. ASU2018-13 is effective for fiscal years beginning after December 15, 2019, and interim periods within those fiscal years. Early adoption is permitted and, as such, management has elected to early adopt ASU2018-13 effective with the current reporting period. The impact of the Portfolio’s adoption was limited to changes in the Portfolio’s financial statement disclosures regarding fair value, primarily those disclosures related to transfers between levels of the fair value hierarchy.
In August 2018, the Securities and Exchange Commission released its Final Rule on Disclosure Update and Simplification (the “Final Rule”) which is intended to simplify an issuer’s disclosure compliance efforts by removing redundant or outdated disclosures requirements without significantly altering the mix of information provided to investors. Effective with the current reporting period, the Portfolio adopted the Final Rule with the most notable impacts being that the Portfolio is no longer required to present the components of distributable earnings on the Statement of Assets and Liabilities or the sources of distributions to shareholders and the amounts of undistributed net investment income on the Statements of Changes in Net Assets.
BHFTII-18
Brighthouse Funds Trust II
Brighthouse/Artisan Mid Cap Value Portfolio
Report of Independent Registered Public Accounting Firm
To the Shareholders of Brighthouse/Artisan Mid Cap Value Portfolio and the Board of Trustees of Brighthouse Funds Trust II:
Opinion on the Financial Statements and Financial Highlights
We have audited the accompanying statement of assets and liabilities, including the schedule of investments, of the Brighthouse/Artisan Mid Cap Value Portfolio (the “Portfolio”), one of the portfolios constituting the Brighthouse Funds Trust II, as of December 31, 2018, the related statement of operations for the year then ended, the statements of changes in net assets for each of the two years in the period then ended, the financial highlights for each of the five years in the period then ended, and the related notes. In our opinion, the financial statements and financial highlights present fairly, in all material respects, the financial position of the Brighthouse/Artisan Mid Cap Value of the Brighthouse Funds Trust II Portfolio as of December 31, 2018, the results of its operations for the year then ended, the changes in its net assets for each of the two years in the period then ended, and the financial highlights for each of the five years in the period then ended, in conformity with accounting principles generally accepted in the United States of America.
Basis for Opinion
These financial statements and financial highlights are the responsibility of the Portfolio’s management. Our responsibility is to express an opinion on the Portfolio’s financial statements and financial highlights based on our audits. We are a public accounting firm registered with the Public Company Accounting Oversight Board (United States) (PCAOB) and are required to be independent with respect to the Portfolio in accordance with the U.S. federal securities laws and the applicable rules and regulations of the Securities and Exchange Commission and the PCAOB.
We conducted our audits in accordance with the standards of the PCAOB. Those standards require that we plan and perform the audit to obtain reasonable assurance about whether the financial statements and financial highlights are free of material misstatement, whether due to error or fraud. The Portfolio is not required to have, nor were we engaged to perform, an audit of its internal control over financial reporting. As part of our audits we are required to obtain an understanding of internal control over financial reporting but not for the purpose of expressing an opinion on the effectiveness of the Portfolio’s internal control over financial reporting. Accordingly, we express no such opinion.
Our audits included performing procedures to assess the risks of material misstatement of the financial statements and financial highlights, whether due to error or fraud, and performing procedures that respond to those risks. Such procedures included examining, on a test basis, evidence regarding the amounts and disclosures in the financial statements and financial highlights. Our audits also included evaluating the accounting principles used and significant estimates made by management, as well as evaluating the overall presentation of the financial statements and financial highlights. Our procedures included confirmation of securities owned as of December 31, 2018, by correspondence with the custodian and brokers; when replies were not received from brokers, we performed other auditing procedures. We believe that our audits provide a reasonable basis for our opinion.
/s/ Deloitte & Touche LLP
Boston, Massachusetts
February 25, 2019
We have served as the auditor of one or more of the Brighthouse investment companies since 1983.
BHFTII-19
Brighthouse Funds Trust II
Trustees and Officers
MANAGEMENT OF THE TRUSTS
The Boards of Trustees (the “Board”) of Brighthouse Funds Trust I and Brighthouse Funds Trust II (“BHF I” and “BHF II”, respectively, and collectively the “Trusts”) supervise the Trusts and are responsible for representing the interests of shareholders. The Trustees, the Chairman of the Board and the Chairmen of each subcommittee are the same for both Trusts. The Trustees of each Trust meet periodically throughout the year to oversee the Portfolios’ activities, reviewing, among other things, each Portfolio’s performance and its contractual arrangements with various service providers. The Trustees of each Trust elect the officers of the Trust, who are responsible for administering the Trust’sday-to-day operations.
Trustees and Officers
The Trustees and executive officers of the Trusts, as well as their principal occupations during the past five years, are set forth below. Unless otherwise indicated, the business address of each is c/o Brighthouse Funds, One Financial Center, Boston, Massachusetts 02111. Each Trustee who is deemed an “interested person,” as such term is defined in the 1940 Act, is referred to as an “Interested Trustee.” Those Trustees who are not “interested persons,” as such term is defined in the 1940 Act, are referred to as “Independent Trustees.” There is no limit to the term a Trustee may serve. Trustees serve until their death, resignation or removal in accordance with the BHF I Trust’s and BHF II Trust’s respective organizational documents and policies adopted by the Boards of the respective Trusts from time to time. Officers hold office at the pleasure of each Board and serve until their removal or resignation in accordance with the Trusts’ respective organizational documents and policies adopted by the Board of each Trust from time to time.
| | | | | | | | | | |
Name and Year of Birth | | Current
Position(s)
Held with
Registrant | | Term of Office
and Length of
Time Served | | Principal Occupation(s) During the Past
5 Years(1) | | Number of
Portfolios
in Brighthouse
Funds
Complex(2)
Overseen
by Trustee | | Other Directorships Held
by Trustee During the
Past 5 Years(1) |
| Interested Trustee |
John Rosenthal* (1960) | | Trustee | | Indefinite; From
May 2016
(Trust I and
Trust II) to present | | Chief Investment Officer, Brighthouse Financial, Inc. (2017 to present); until 2017, Senior Managing Director and Head of Global Portfolio Management, MetLife, Inc. | | 72 | | None |
|
| Independent Trustees |
Dawn M. Vroegop (1966) | | Trustee and Chairman of the Board | | Indefinite; From
December 2000
(Trust I)/May
2009 (Trust II) to
present as
Trustee; From
May 2016 (Trust
I and Trust II)
until present as
Chairman | | Private Investor. | | 72 | | Trustee, Driehaus Mutual Funds.** |
| | | | | |
Stephen M. Alderman (1959) | | Trustee | | Indefinite; From
December 2000
(Trust I)/April
2012 (Trust II) to
present | | Shareholder in the law firm of Garfield and Merel, Ltd. | | 72 | | None |
| | | | | |
Robert J. Boulware (1956) | | Trustee | | Indefinite; From
March 2008
(Trust I)/April
2012 (Trust II) to
present | | Managing Director, Pilgrim Funds, LLC (private equity fund). | | 72 | | Trustee, Vertical Capital Income Fund(closed-end fund);** Director, Gainsco, Inc. (auto insurance);** Trustee, SharesPost 100 Fund(closed-end fund).** |
| | | | | |
Susan C. Gause (1952) | | Trustee | | Indefinite; From
March 2008
(Trust I)/April
2012 (Trust II) to
present | | Private Investor. | | 72 | | Trustee, HSBC Funds.** |
BHFTII-20
Brighthouse Funds Trust II
Trustees and Officers—(Continued)
| | | | | | | | | | |
Name and Year of Birth | | Current
Position(s)
Held with
Registrant | | Term of Office
and Length of
Time Served | | Principal Occupation(s) During the Past
5 Years(1) | | Number of
Portfolios
in Brighthouse
Funds
Complex(2)
Overseen
by Trustee | | Other Directorships Held
by Trustee During the
Past 5 Years(1) |
Nancy Hawthorne (1951) | | Trustee | | Indefinite; From
May 2003
(Trust II)/April
2012 (Trust I)
to present | | Partner, Hawthorne Financial Advisors, LLC (registered investment advisor); until 2014, Chief Executive Officer, Clerestory LLC (corporate advisor). | | 72 | | Director and Chairman of the Board of Directors, THL Credit, Inc.;** Director and Chairman of the Board, Avid Technology, Inc.;** Director, CRA International, Inc.** |
| | | | | |
Barbara A. Nugent (1956) | | Trustee | | Indefinite; From
January 2014
(Trust I and
Trust II) to
present | | President, True North Board Governance, LLC (consulting); until December 2013, partner in the law firm of Stradley Ronon Stevens & Young, LLP. | | 72 | | Independent Lead Trustee, BMT Investment Funds** |
| | | | | |
Christopher J. Towle (1957) | | Trustee | | Indefinite; From
April 2018
(Trust I and
Trust II) to
present | | Retired; until 2014, Partner, Portfolio Manager, Director of High Yield and Convertible Strategies, Lord Abbett & Co. | | 72 | | Trustee, Driehaus Mutual Funds** |
Officers
| | | | | | |
Name and Year of Birth | | Position(s)
Held with
Registrant | | Length of
Time Served | | Principal Occupation(s)
During the Past 5 Years(1) |
| Executive Officers | | | | | | |
Kristi Slavin (1973) | | President and Chief Executive Officer, of Trust I and Trust II | | From May
2016
(Trust I and
Trust II) to
present | | President, Brighthouse Investment Advisers, LLC (2016-present); formerly, Senior Vice President, MetLife Advisers, LLC; Vice President, MetLife, Inc.; Vice President, Trust I and Trust II(2015-2016). |
| | | |
Alan R. Otis (1971) | | Chief Financial Officer and Treasurer, of Trust I and Trust II | | From
November
2017
(Trust I and
Trust II) to
present | | Senior Vice President, Brighthouse Investment Advisers, LLC (2017-present); formerly, Vice President, Brighthouse Investment Advisers, LLC (2012-2017); Assistant Treasurer, Trust I and Trust II (2012-2017). |
| | | |
Andrew L. Gangolf (1954) | | Secretary, of Trust I and Trust II | | From May
2011
(Trust I and
Trust II) to
present | | Executive Vice President, Brighthouse Investment Advisers, LLC (2017-present); formerly, Senior Vice President, MetLife Advisers, LLC (2011-2017); until 2011, Senior Vice President & Assistant General Counsel, AllianceBernstein Investments, Inc. |
| | | |
Steven E. Hartstein (1963) | | Chief Compliance Officer (“CCO”), of Trust I and Trust II | | From
February
2014
(Trust I and
Trust II) to
present | | Senior Vice President and CCO, Brighthouse Investment Advisers, LLC (2017-present); Head of Investments Compliance, Vice President, Brighthouse Financial, Inc. (2017-present); formerly, Vice President, MetLife, Inc. (2013-2017); Senior Vice President and CCO, MetLife Advisers, LLC (2013-2017.) |
| | | |
Victor Soto (1978) | | Vice President of Trust I and Trust II | | From May
2018
(Trust I and
Trust II) to
present | | Executive Vice President, Brighthouse Investment Advisers, LLC (2016-present); Assistant Vice President, MetLife Inc. (2015-2017); Portfolio Manager, 1st Global (2013-2015). |
| * | Mr. Rosenthal is an “interested person” of the Trusts because of his position with Brighthouse Financial, Inc., the current parent company of Brighthouse Investment Advisers, LLC. |
| ** | Indicates a directorship with a registered investment company or a company subject to the reporting requirements of the Securities Exchange Act of 1934, as amended. |
| (1) | Previous positions during the past five years with the Trusts, Brighthouse Financial, Inc., MetLife, Inc. or the Manager are omitted if not materially different. |
| (2) | The Fund Complex includes 43 BHF I Portfolios and 29 BHF II Portfolios. |
BHFTII-21
Brighthouse Funds Trust II
Brighthouse/Artisan Mid Cap Value Portfolio
Board of Trustees’ Consideration of Advisory and Sub-Advisory Agreements
At anin-person meeting held on November6-8, 2018 (the “November Meeting”), the Boards of Trustees (the “Board”) of Brighthouse Funds Trust I and Brighthouse Funds Trust II (“BFT I” and “BFT II,” respectively, and collectively, the “Trusts”), including a majority of the Trustees who are not “interested persons” of the Trusts (the “Independent Trustees”) under the Investment Company Act of 1940 (the “1940 Act”), approved the continuation of the Trusts’ advisory agreements (each, an “Advisory Agreement”) with Brighthouse Investment Advisers, LLC (the “Adviser”) and the applicablesub-advisory agreements (each a “Sub-Advisory Agreement,” and collectively with the Advisory Agreement, the “Agreements”) between the Adviser and the investmentsub-advisers (each a “Sub-Adviser,” and collectively, the “Sub-Advisers”) for the series of the Trusts (each a “Portfolio,” and collectively, the “Portfolios”).
In making those approvals, the Board reviewed a variety of materials that were provided for the specific purpose of the annual contract renewal process. In addition, various materials provided to and discussed with the Board throughout the year informed the Board’s decision to renew the Agreements. In particular, the information for each Portfolio included, but was not limited to, investment performance reports, and reports on expenses, legal and compliance matters, asset pricing, brokerage commissions and trade execution.
The Board met in person with personnel of the Adviser on October 17, 2018 for the specific purpose of giving preliminary consideration to the proposed continuation of the Agreements (the “October Meeting”). At that meeting, the Adviser reviewed with the Board the performance and fees experienced by each Portfolio, as well as other information. During and after the October Meeting, the Independent Trustees communicatedfollow-up matters for management to address at the November Meeting. The Independent Trustees were advised by independent legal counsel throughout the contract renewal process, and met with independent legal counsel in several executive sessions outside of the presence of management.
Information furnished and reviewed specifically in connection with the renewal process included, but was not limited to, a report for each Portfolio that was prepared by Broadridge (“Broadridge”), an independent organization. In addition, the Independent Trustees reviewed a report that was prepared by JDL Consultants, LLC (“JDL”), an independent consultant to the Independent Trustees (“JDL Report”), which examined the comparative fees, expenses and performance of each Portfolio, based upon the Broadridge reports. Also, the Board reviewed the responses to wide-ranging questions from the Independent Trustees relating to the business, operations and performance of the Adviser and theSub-Advisers that the Adviser andSub-Advisers had prepared specifically for the renewal process, and reviewed aPortfolio-by-Portfolio analysis of the profitability to the Adviser of each Advisory Agreement, which was prepared by the Adviser for the renewal process.
At the November Meeting, the Board, including a majority of the Independent Trustees, concluded that the nature, extent and quality of services provided by the Adviser and eachSub-Adviser supported the renewal of the Agreements. The Board also concluded that the investment performance of each Portfolio was such that each Agreement should continue, and that the fees paid by each Portfolio to the Adviser appeared to be reasonable in light of the nature, extent and quality of the services provided by the Adviser andSub-Adviser. Further, the Board concluded that the Adviser’s profitability in providing services under the Advisory Agreements did not appear unreasonable in light of the nature, extent and quality of the services provided by the Adviser. Finally, the Board reviewed the extent to which the investment advisory fees paid by the Portfolios shared economies of scale with investors or entailed the potential to share economies of scale with investors and concluded that those considerations generally supported the renewal of each Agreement. In approving the renewal of each of the Agreements, the Board, including the Independent Trustees, gave attention to all of the information that was furnished and each Trustee placed varying degrees of importance on the various pieces of information that were provided to them. The Board evaluated the information available to it on aPortfolio-by-Portfolio basis, and its decision was made separately with respect to each Portfolio. The following paragraphs provide more information about some of the primary factors that were relevant to the Board’s decision. The Board did not identify any single factor as determinative, and the Trustees generally attributed different weights to various factors for the various Portfolios.
Nature, extent and quality of services. The Board evaluated the nature, extent and quality of the services that the Adviser and theSub-Advisers, as relevant, have provided to the Portfolios. The Board considered the Adviser’s services as investment manager to the Portfolios, including its services relating to the hiring and oversight of theSub-Advisers, trading practices and oversight of transition management (as applicable), compliance programs and personnel, and risk management, among other things. The Adviser’s services in coordinating and overseeing the activities of the Trusts’ other service providers were also considered. The Board considered information received from the Trusts’ Chief Compliance Officer (“CCO”) regarding the Portfolios’ compliance policies and procedures that were established pursuant to Rule38a-l under the 1940 Act. The Board also noted that the Adviser’s investment, compliance and legal staff conduct regular and periodic telephonic andin-person meetings with theSub-Advisers to review and assess the services that are provided to the Portfolios, and that personnel of the Adviser prepare and present reports to the Independent Trustees regarding those meetings. In addition, throughout the year, the Board considered the expertise, experience and performance of the personnel of the Adviser who performed the various services that are mentioned above.
BHFTII-22
Brighthouse Funds Trust II
Brighthouse/Artisan Mid Cap Value Portfolio
Board of Trustees’ Consideration of Advisory and Sub-Advisory Agreements—(Continued)
With respect to the services provided by each of theSub-Advisers, the Board considered a variety of information that the Adviser and eachSub-Adviser prepared for the Board’s review. The Board considered eachSub-Adviser’s investment process and philosophy, and the investment performance experienced by the Portfolio (as described in more detail below). The Board took into account that eachSub-Adviser’s responsibilities include the development and maintenance of an investment program for the applicable Portfolio that is consistent with the Portfolio’s investment objectives, the selection of investment securities and the placement of orders for the purchase and sale of such securities, as well as the implementation of compliance controls related to performance of these services. In particular, the Board considered, among other things, theSub-Adviser’s current level of staffing as well as its compensation program and its overall resources. The Board reviewed eachSub-Adviser’s history and investment experience, as well as information provided regarding the qualifications, background and responsibilities of theSub-Adviser’s investment and compliance personnel who provide services to the Portfolios. The Board also considered, among other things, eachSub-Adviser’s compliance program and regulatory and disciplinary history. In its review, the Board also took into account information regarding any services and/or payments provided to the Adviser by theSub-Advisers in connection with marketing activities and considered representations from the Adviser that those payments were not considered in the Adviser’s recommendation to renew any of theSub-Advisory Agreements.
Performance. The Board placed emphasis on the performance of each Portfolio in light of, among other things, its importance to investors. The Board considered the Adviser’s quarterly reviews with the Board of detailed information about each Portfolio’s investment strategies and performance results and composition, including discussions regarding the relevant effect of current market conditions. The Board reviewed and considered the reports prepared by Broadridge, which provided a statistical analysis comparing the Portfolios’ investment performance to that of comparable funds underlying variable insurance products (the “Performance Universe”). The Independent Trustees also met separately with representatives of JDL during the October Meeting to review the JDL Report. The Board also compared the performance records of the Portfolios to those of comparable funds and other accounts that were managed by the relevantSub-Adviser, to the extent such information was available. The Board considered each Portfolio’s performance for periods subsequent to the performance period covered by the Broadridge reports, and the Adviser’s discussion of the same, including the effect of current market conditions on each Portfolio’s more recent performance. The Board also noted that while it found the data provided by Broadridge generally useful, it recognized the limitations of such data, including, in particular, that notable differences may exist between a Portfolio and those of the other funds in a Broadridge category (for example, the investment objectives(s) and investment strategies) and that the results of the performance comparisons may vary depending on (i) the end dates for the performance periods that were selected and (ii) the selection of the peer groups.
The Board focused particular attention on Portfolios with less favorable performance records. The Board noted the Adviser’s focus on eachSub-Adviser’s performance and that the Adviser has been active in monitoring and responding to any performance issues with respect to the Portfolios.
Fees and Expenses. The Board gave consideration to the level and method of computing the fees payable under the Agreements. The Board considered the Broadridge report for each of the Portfolios, which included comparisons for each Portfolio of its contractual management andsub-adviser fees (at current and various asset levels), and total expenses, with those of its peers, including as those peers were divided into a broad group of peer funds (“Expense Universe”), a narrower group of peer funds (“Expense Group”), a broad group of peersub-advised funds (“Sub-advised Expense Universe”), and a narrower group of peersub-advised funds (“Sub-advised Expense Group”). Broadridge selected the peer funds which were similarly situated funds underlying variable insurance products deemed to be comparable to the Portfolios. The Independent Trustees, with the assistance of JDL, also examined the JDL Report. The Board compared the fee payable to aSub-Adviser by the Adviser with respect to the Portfolio to the fee payable to theSub-Adviser by other comparable funds and other accounts, to the extent such information was available.
The Board noted that thesub-advisory fees for the Portfolios are paid by the Adviser out of the advisory fees, and that the Adviser negotiates the fees at arm’s length. The Board also considered that the Adviser had entered into expense limitation or management fee waiver agreements with certain of the Portfolios pursuant to which the Adviser had agreed to waive a portion of its advisory fee and/or reimburse certain expenses as a means of limiting a Portfolio’s total annual operating expenses.
Profitability. The Board examined the profitability to the Adviser of each Advisory Agreement, on aPortfolio-by-Portfolio basis. The Board also considered that an affiliate of the Adviser, Brighthouse Securities, LLC, serves as distributor for the Trusts, and, as such, receives Rule12b-1 payments to support the distribution of the Portfolios. The Board considered the profitability to theSub-Advisers and their affiliates as a result of their relationships with the Portfolios, to the extent available, and the Board considered the ability of the Adviser to negotiate with aSub-Adviser at arm’s length. In reviewing the profitability analyses, the Board recognized that expense allocation methodologies are inherently subjective and various expense allocation methodologies may be reasonable while producing different results.
BHFTII-23
Brighthouse Funds Trust II
Brighthouse/Artisan Mid Cap Value Portfolio
Board of Trustees’ Consideration of Advisory and Sub-Advisory Agreements—(Continued)
Economies of scale. The Board also considered each Portfolio’s fees in light of its size. The Board noted the fee schedules for the Portfolios that contain breakpoints that reduce the fee rate above specified asset levels. The Board noted those Portfolios that did not have breakpoints in their advisory fee and took into account management’s discussion of the same. The Board noted that those Portfolios with Advisory Agreements containing breakpoints generally have breakpoints in the correspondingSub-Advisory Agreement. The Board considered the effective fees under the Advisory Agreement andSub-Advisory Agreement for each Portfolio as a percentage of assets at different asset levels and possible economies of scale that may be realized if the assets of the Portfolio grow. The Board examined, among other data, the effect of a Portfolio’s growth in size, and reduction in size, on various fee schedules and the Board reviewed the Broadridge and JDL Reports, which compared fees among peers. The Board also generally noted that if a Portfolio’s assets increase over time, the Portfolio may realize other economies of scale if assets increase proportionally more than certain other fixed expenses.
Other factors. The Board considered other benefits that may be realized by the Adviser and its affiliates from their relationship with the Trusts. Among them, the Board recognized that Brighthouse Securities, LLC, as the distributor for the Trusts, receives payments pursuant to Rule12b-1 from the Portfolios to compensate for the provision of shareholder services and distribution activities, which could lead to growth in the Trusts’ assets and corresponding benefits from such growth, including economies of scale. The Board considered other benefits that may be realized by eachSub-Adviser and its affiliates from their relationship with the Trusts, including the opportunity to provide advisory services to additional portfolios of the Trusts and reputational benefits. In conjunction with these considerations, the Board noted the ongoing commitment of the Adviser to the Portfolios.
The Board requested, received, and considered information from the Adviser regarding possible conflicts of interest in the form of material benefits to the Adviser resulting from the Adviser’s affiliations and business relationships, as relevant. The Board considered the services that are provided to the Trusts by its service providers, and the manner in which any conflicts were mitigated.
* * *
Brighthouse/Artisan Mid Cap Value Portfolio. The Board also considered the following information in relation to the Agreements with the Adviser and Artisan Partners Limited Partnership regarding the Portfolio:
Among other data relating specifically to the Portfolio’s performance, the Board considered that the Portfolio outperformed the median of its Performance Universe and the average of its Morningstar Category for theone-year and three-year periods ended June 30, 2018, and underperformed the median of its Performance Universe and the average of its Morningstar Category for the five-year periods ended June 30, 2018. In addition, the Board considered that the Portfolio outperformed its benchmark, the Russell Midcap Value Index, for theone-year period ended September 30, 2018, and underperformed its benchmark for the three-year and five-year periods ended September 30, 2018. The Board took into account management’s discussion of the Portfolio’s performance, including prevailing market conditions.
The Board also considered that the Portfolio’s actual management fees and total expenses (exclusive of12b-1 fees) were above the Expense Group median, the Expense Universe median, and theSub-advised Expense Universe median. The Board further noted that the Portfolio’s contractual management fees were above the asset-weighted average of comparable funds selected by Broadridge at the Portfolio’s current size. The Board also considered that the Portfolio’s contractualsub-advisory fees were above the averages of theSub-advised Expense Group and theSub-advised Expense Universe at the Portfolio’s current size.
BHFTII-24
Brighthouse Funds Trust II
Brighthouse/Dimensional International Small Company Portfolio
Managed by Dimensional Fund Advisors LP
Portfolio Manager Commentary*
PERFORMANCE
For the 12 months ended December 31, 2018, the Class A and B shares of the Brighthouse/Dimensional International Small Company Portfolio returned-20.37% and-20.56%, respectively. The Portfolio’s benchmark, the MSCI Worldex-U.S. Small Cap Index1, returned-18.07%.
MARKET ENVIRONMENT / CONDITIONS
In U.S. dollar terms, developedex-U.S. markets had negative performance for the year, trailing the U.S. market but outperforming emerging markets. The MSCI Worldex-USA IMI (net dividends) returned-14.7%, as compared to-5.2% for the Russell 3000 Index and-15.1% for the MSCI Emerging Markets IMI (net dividends). Most developedex-U.S. market currencies, particularly the Australian dollar and the Canadian dollar, depreciated relative to the U.S. dollar. Overall, currency movements had a negative impact on the U.S. dollar-denominated returns of the developedex-U.S. market.
Theoretical and empirical research suggests that investors can systematically pursue higher expected returns by targeting the size, relative price, and profitability dimensions in equity markets. Dimensional integrates these dimensions to emphasize stocks with smaller market capitalizations, lower relative prices, and higher profitability.
Along the market capitalization dimension, large caps (MSCI Worldex-U.S. Index, net dividends) outperformed small caps (MSCI Worldex-U.S. Small Cap Index, net dividends) by 4.0% for the year. Similarly, midcaps (MSCI Worldex-U.S. Mid Cap Index, net dividends), a subset of the MSCI Worldex-U.S. Index universe, outperformed small caps by 1.3%. Along the relative price dimension, large cap value stocks (MSCI Worldex-U.S. Value Index, net dividends) underperformed large cap growth stocks (MSCI Worldex-U.S. Growth Index, net dividends) by 1.9%, and small cap value stocks (MSCI Worldex-U.S. Small Cap Value Index, net dividends) underperformed small cap growth stocks (MSCI Worldex-U.S. Small Cap Growth Index, net dividends) by 0.6%.
It is important to consider the interactions between size, value, and profitability when reviewing the performance of the dimensions. Considering all three dimensions simultaneously, stocks with lower relative prices and higher profitability outperformed stocks with higher relative prices and lower profitability among both large and small caps. Performance of the premiums may vary depending on the particular segment of the market under analysis.
PORTFOLIO REVIEW / PERIOD END POSITIONING
For the year ended December 31, 2018, the Portfolio underperformed its benchmark by 229 basis points. The Portfolio’s general exclusion of Real Estate Investment Trusts (“REITs”) was the primary driver of underperformance, as REITs outperformed all other sectors for the year. With micro caps underperforming small caps with larger market capitalizations for the year, the Portfolio’s greater allocation to micro caps also detracted from relative performance. Conversely, the Portfolio’s exclusion of stocks with the lowest profitability and highest relative price contributed positively to relative performance.
The Portfolio held more than 3,800 securities as of December 31, 2018 and was diversified across countries and sectors.
Joseph Chi
Jed Fogdall
Arun Keswani
Bhanu Singh
Portfolio Managers
Dimensional Fund Advisors LP
* This commentary may include statements that constitute “forward-looking statements” under the U.S. securities laws. Forward-looking statements include, among other things, projections, estimates, and information about possible or future results related to the Portfolio, market or regulatory developments. The views expressed above are not guarantees of future performance or economic results and involve certain risks, uncertainties and assumptions that could cause actual outcomes and results to differ materially from the views expressed herein. The views expressed above are subject to change at any time based upon economic, market, or other conditions and the subadvisory firm undertakes no obligation to update the views expressed herein. Any discussions of specific securities should not be considered a recommendation to buy or sell those securities. The views expressed above (including any forward-looking statement) may not be relied upon as investment advice or as an indication of the Portfolio’s trading intent. Information about the Portfolio’s holdings, asset allocation or country diversification is historical and is not an indication of future Portfolio composition, which may vary. Direct investment in any index is not possible. The performance of any index mentioned in this commentary has not been adjusted for ongoing management, distribution and operating expenses, and sales charges applicable to mutual fund investments. In addition, the returns do not reflect additional fees charged by separate accounts or variable insurance contracts that an investor in the Portfolio may pay. If these additional fees were reflected, performance would have been lower.
BHFTII-1
Brighthouse Funds Trust II
Brighthouse/Dimensional International Small Company Portfolio
A $10,000 INVESTMENT COMPARED TO THE MSCI WORLD EX-U.S. SMALL CAP INDEX
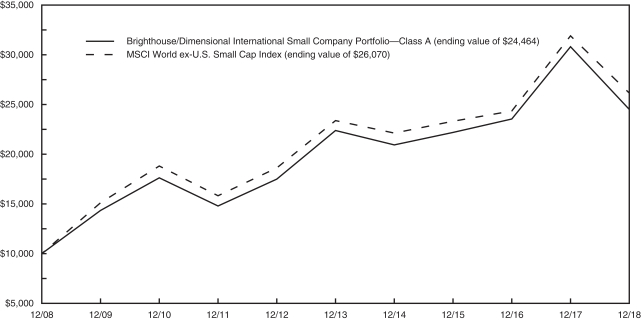
AVERAGE ANNUAL RETURNS (%) (FOR THE YEAR ENDED DECEMBER 31, 2018)
| | | | | | | | | | | | |
| | | | |
| | | 1 Year | | | 5 Year | | | 10 Year | |
| Brighthouse/Dimensional International Small Company Portfolio | | | | | | | | | | | | |
Class A | | | -20.37 | | | | 1.84 | | | | 9.36 | |
Class B | | | -20.56 | | | | 1.59 | | | | 9.08 | |
| MSCI Worldex-U.S. Small Cap Index | | | -18.07 | | | | 2.25 | | | | 10.06 | |
1 The MSCI World ex-U.S. Small Cap Index is an unmanaged index that measures the performance of stocks with market capitalizations between US $200 million and $800 million across 23 developed markets, excluding the United States. The index returns shown above were calculated with net dividends: they reflect the reinvestment of dividends after the deduction of the maximum possible withholding taxes.
Portfolio performance is calculated including reinvestment of all income and capital gain distributions. Performance numbers are net of all Portfolio expenses but do not include any insurance, sales, separate account or administrative charges of variable annuity or life insurance contracts or any additional expenses that participants may bear relating to the operations of their plans. If these charges were included, the returns would be lower. The performance of any index referenced above has not been adjusted for ongoing management, distribution and operating expenses, and sales charges applicable to mutual fund investments. Direct investment in any index is not possible. The performance of Class A shares, as set forth in the line graph above, will differ from that of other classes because of the difference in expenses paid by policyholders investing in the different share classes.
This information represents past performance and is not indicative of future results. Investment return and principal value may fluctuate so that shares, upon redemption, may be worth more or less than the original cost.
PORTFOLIO COMPOSITION AS OF DECEMBER 31, 2018
Top Holdings
| | | | |
| | | % of
Net Assets | |
| Amer Sports Oyj | | | 0.4 | |
| Auto Trader Group plc | | | 0.3 | |
| GN Store Nord A/S | | | 0.3 | |
| Galapagos NV | | | 0.3 | |
| Hiscox, Ltd. | | | 0.3 | |
| Rightmove plc | | | 0.2 | |
| Rubis SCA | | | 0.2 | |
| Enagas S.A. | | | 0.2 | |
| Helvetia Holding AG | | | 0.2 | |
| Bellway plc | | | 0.2 | |
Top Countries
| | | | |
| | | % of
Net Assets | |
| Japan | | | 24.3 | |
| United Kingdom | | | 15.6 | |
| Canada | | | 8.1 | |
| Australia | | | 6.7 | |
| Germany | | | 6.3 | |
| Switzerland | | | 5.1 | |
| Italy | | | 4.0 | |
| France | | | 3.9 | |
| Sweden | | | 3.0 | |
| Hong Kong | | | 2.9 | |
BHFTII-2
Brighthouse Funds Trust II
Brighthouse/Dimensional International Small Company Portfolio
Understanding Your Portfolio’s Expenses
Shareholder Expense Example
As a shareholder of the Portfolio, you incur ongoing costs, including management fees; distribution and service(12b-1) fees; and other Portfolio expenses. This example is intended to help you understand your ongoing costs (in dollars) (referred to as “expenses”) of investing in the Portfolio and compare these costs with the ongoing costs of investing in other mutual funds. The example is based on an investment of $1,000 invested at the beginning of the period and held for the entire period, July 1, 2018 through December 31, 2018.
Actual Expenses
The first line for each share class of the Portfolio in the table below provides information about actual account values and actual expenses. You may use the information in this line, together with the amount you invested in the particular share class of the Portfolio, to estimate the expenses that you paid over the period. Simply divide your account value by $1,000 (for example, an $8,600 account value divided by $1,000 = 8.6), then multiply the result by the number in the first line under the heading entitled “Expenses Paid During Period” to estimate the expenses you paid on your account during this period.
Hypothetical Example for Comparison Purposes
The second line for each share class of the Portfolio in the table below provides information about hypothetical account values and hypothetical expenses based on the Portfolio’s actual expense ratio and an assumed rate of return of 5% per year before expenses, which is not the Portfolio’s actual return. The hypothetical account values and expenses may not be used to estimate the actual ending account balance or expenses you paid for the period. You may use this information to compare the ongoing costs of investing in the Portfolio and other funds. To do so, compare this 5% hypothetical example with the 5% hypothetical examples that appear in the shareholder reports of the other funds.
Please note that the expenses shown in the table are meant to highlight your ongoing costs only and do not reflect any fees or charges of your variable insurance product or any additional expenses that participants in certain eligible qualified plans may bear relating to the operations of their plan. Therefore, the second line for each share class in the table is useful in comparing ongoing costs only, and will not help you determine the relative total costs of owning different funds. In addition, if these other costs were included, your costs would have been higher.
| | | | | | | | | | | | | | | | | | |
Brighthouse/Dimensional International Small Company Portfolio | | | | Annualized
Expense
Ratio | | | Beginning
Account Value
July 1,
2018 | | | Ending
Account Value
December 31,
2018 | | | Expenses Paid
During Period**
July 1, 2018
to
December 31,
2018 | |
Class A (a) | | Actual | | | 0.92 | % | | $ | 1,000.00 | | | $ | 820.00 | | | $ | 4.22 | |
| | Hypothetical* | | | 0.92 | % | | $ | 1,000.00 | | | $ | 1,020.57 | | | $ | 4.69 | |
| | | | | |
Class B (a) | | Actual | | | 1.17 | % | | $ | 1,000.00 | | | $ | 818.90 | | | $ | 5.36 | |
| | Hypothetical* | | | 1.17 | % | | $ | 1,000.00 | | | $ | 1,019.31 | | | $ | 5.96 | |
| * | Hypothetical assumes a rate of return of 5% per year before expenses. |
| ** | Expenses paid are equal to the Portfolio’s annualized expense ratio for the most recent six month period, as shown above, multiplied by the average account value over the period, multiplied by the number of days (184 days) in the most recent fiscal half-year, divided by 365 (to reflect theone-half year period). |
| (a) | The annualized expense ratio shown reflects the impact of the management fee waiver as described in Note 5 of the Notes to Financial Statements. |
BHFTII-3
Brighthouse Funds Trust II
Brighthouse/Dimensional International Small Company Portfolio
Schedule of Investments as of December 31, 2018
Common Stocks—99.4% of Net Assets
| | | | | | | | |
| Security Description | | Shares | | | Value | |
|
| Australia—6.7% | |
A2B Australia, Ltd. | | | 55,813 | | | $ | 86,228 | |
Accent Group, Ltd. | | | 90,942 | | | | 76,861 | |
Adairs, Ltd. | | | 12,167 | | | | 16,118 | |
Adelaide Brighton, Ltd. | | | 118,950 | | | | 357,722 | |
AED Oil, Ltd. (a) (b) (c) | | | 93,946 | | | | 0 | |
Ainsworth Game Technology, Ltd. | | | 51,616 | | | | 28,904 | |
Alkane Resources, Ltd. (a) | | | 120,355 | | | | 16,531 | |
ALS, Ltd. | | | 82,785 | | | | 395,300 | |
Altium, Ltd. | | | 31,832 | | | | 485,296 | |
AMA Group, Ltd. | | | 111,029 | | | | 67,701 | |
Amaysim Australia, Ltd. (a) | | | 21,060 | | | | 14,642 | |
Ansell, Ltd. | | | 36,143 | | | | 561,040 | |
AP Eagers, Ltd. | | | 9,996 | | | | 42,243 | |
Appen, Ltd. | | | 19,037 | | | | 172,605 | |
ARB Corp., Ltd. | | | 28,061 | | | | 295,488 | |
Ardent Leisure Group, Ltd. | | | 88,453 | | | | 92,207 | |
ARQ Group, Ltd. | | | 41,278 | | | | 56,890 | |
Asaleo Care, Ltd. | | | 51,178 | | | | 32,988 | |
Atlas Arteria, Ltd. | | | 108,901 | | | | 480,142 | |
AUB Group, Ltd. | | | 29,816 | | | | 261,028 | |
Aurelia Metals, Ltd. (a) | | | 110,317 | | | | 52,834 | |
Ausdrill, Ltd. | | | 186,432 | | | | 155,292 | |
Austal, Ltd. | | | 81,889 | | | | 112,179 | |
Australian Agricultural Co., Ltd. (a) | | | 192,359 | | | | 148,565 | |
Australian Finance Group, Ltd. | | | 11,568 | | | | 10,561 | |
Australian Pharmaceutical Industries, Ltd. | | | 174,311 | | | | 169,541 | |
Auswide Bank, Ltd. | | | 9,275 | | | | 34,578 | |
Automotive Holdings Group, Ltd. | | | 101,744 | | | | 111,785 | |
Aveo Group | | | 113,281 | | | | 127,657 | |
AVJennings, Ltd. | | | 10,332 | | | | 3,783 | |
Baby Bunting Group, Ltd. | | | 5,851 | | | | 8,946 | |
Bank of Queensland, Ltd. | | | 17,806 | | | | 121,193 | |
Bapcor, Ltd. | | | 48,412 | | | | 200,821 | |
Beach Energy, Ltd. | | | 606,009 | | | | 572,213 | |
Beadell Resources, Ltd. (a) | | | 102,327 | | | | 3,694 | |
Bega Cheese, Ltd. | | | 77,553 | | | | 269,553 | |
Bellamy’s Australia, Ltd. (a) | | | 19,257 | | | | 99,135 | |
Bingo Industries, Ltd. | | | 51,085 | | | | 66,455 | |
Blackmores, Ltd. | | | 4,893 | | | | 420,421 | |
Blue Sky Alternative Investments, Ltd. (a) | | | 6,725 | | | | 3,755 | |
Bravura Solutions, Ltd. | | | 40,862 | | | | 106,623 | |
Breville Group, Ltd. | | | 34,410 | | | | 258,347 | |
Brickworks, Ltd. | | | 5,923 | | | | 69,374 | |
Bubs Australia, Ltd. (a) | | | 5,279 | | | | 1,704 | |
Buru Energy, Ltd. (a) | | | 72,570 | | | | 10,483 | |
BWX, Ltd. | | | 2,270 | | | | 2,526 | |
Capitol Health, Ltd. | | | 150,763 | | | | 28,694 | |
Capral, Ltd. | | | 136,176 | | | | 11,510 | |
Cardno, Ltd. (a) (b) | | | 69,333 | | | | 48,892 | |
Carnarvon Petroleum, Ltd. (a) | | | 282,013 | | | | 64,136 | |
carsales.com, Ltd. | | | 79,391 | | | | 615,827 | |
Cash Converters International, Ltd. (a) | | | 152,939 | | | | 25,315 | |
Cedar Woods Properties, Ltd. | | | 27,273 | | | | 97,419 | |
Centuria Capital Group | | | 14,370 | | | | 12,914 | |
Citadel Group, Ltd. (The) | | | 4,283 | | | | 21,944 | |
Cleanaway Waste Management, Ltd. | | | 670,809 | | | | 787,387 | |
Clinuvel Pharmaceuticals, Ltd. | | | 5,706 | | | | 73,257 | |
|
| Australia—(Continued) | |
Clover Corp., Ltd. | | | 34,945 | | | | 33,719 | |
Codan, Ltd. | | | 17,036 | | | | 34,804 | |
Collection House, Ltd. | | | 19,217 | | | | 18,409 | |
Collins Foods, Ltd. | | | 20,592 | | | | 89,688 | |
Cooper Energy, Ltd. (a) | | | 552,999 | | | | 173,503 | |
Corporate Travel Management, Ltd. | | | 22,148 | | | | 334,915 | |
Costa Group Holdings, Ltd. | | | 62,749 | | | | 327,925 | |
Credit Corp. Group, Ltd. | | | 13,415 | | | | 177,254 | |
CSG, Ltd. (a) | | | 85,825 | | | | 9,711 | |
CSR, Ltd. | | | 239,936 | | | | 474,830 | |
Cudeco, Ltd. (a) (b) (d) | | | 51,210 | | | | 3,178 | |
Data #3, Ltd. | | | 55,471 | | | | 58,636 | |
Decmil Group, Ltd. (a) | | | 78,588 | | | | 38,193 | |
Dicker Data, Ltd. | | | 5,634 | | | | 11,190 | |
Domain Holdings Australia, Ltd. | | | 96,746 | | | | 151,949 | |
Domino’s Pizza Enterprises, Ltd. | | | 5,908 | | | | 169,144 | |
Doray Minerals, Ltd. (a) | | | 44,069 | | | | 11,397 | |
Downer EDI, Ltd. | | | 156,144 | | | | 743,407 | |
DuluxGroup, Ltd. | | | 144,897 | | | | 669,473 | |
DWS, Ltd. | | | 36,847 | | | | 30,884 | |
Eclipx Group, Ltd. | | | 26,542 | | | | 45,507 | |
Elders, Ltd. | | | 32,731 | | | | 162,979 | |
Emeco Holdings, Ltd. (a) | | | 65,024 | | | | 93,115 | |
EML Payments, Ltd. (a) | | | 21,460 | | | | 22,517 | |
Energy Resources of Australia, Ltd. (a) | | | 51,910 | | | | 8,957 | |
Energy World Corp., Ltd. (a) | | | 325,379 | | | | 31,888 | |
EQT Holdings, Ltd. | | | 3,062 | | | | 51,683 | |
ERM Power, Ltd. | | | 49,991 | | | | 54,894 | |
Estia Health, Ltd. | | | 29,371 | | | | 47,371 | |
Euroz, Ltd. | | | 23,559 | | | | 18,420 | |
Event Hospitality and Entertainment, Ltd. | | | 38,556 | | | | 369,572 | |
FAR, Ltd. (a) | | | 653,097 | | | | 30,687 | |
Finbar Group, Ltd. | | | 6,909 | | | | 3,687 | |
Fleetwood Corp., Ltd. | | | 35,042 | | | | 48,834 | |
FlexiGroup, Ltd. | | | 60,577 | | | | 57,861 | |
G8 Education, Ltd. | | | 158,694 | | | | 316,301 | |
Galaxy Resources, Ltd. (a) | | | 98,235 | | | | 150,129 | |
Galilee Energy, Ltd. (a) | | | 43,169 | | | | 18,899 | |
Genworth Mortgage Insurance Australia, Ltd. | | | 42,575 | | | | 65,418 | |
Gold Road Resources, Ltd. (a) | | | 132,712 | | | | 60,755 | |
GrainCorp, Ltd. - Class A | | | 83,590 | | | | 539,881 | |
Grange Resources, Ltd. | | | 120,000 | | | | 16,931 | |
Greencross, Ltd. | | | 22,048 | | | | 84,477 | |
Greenland Minerals Ltd. (a) | | | 349,524 | | | | 17,173 | |
GUD Holdings, Ltd. | | | 39,734 | | | | 314,549 | |
GWA Group, Ltd. | | | 92,856 | | | | 181,806 | |
Hansen Technologies, Ltd. | | | 50,238 | | | | 122,757 | |
Harvey Norman Holdings, Ltd. | | | 59,103 | | | | 131,659 | |
Healius, Ltd. | | | 291,166 | | | | 457,308 | |
Healthscope, Ltd. | | | 115,676 | | | | 181,692 | |
Hills, Ltd. (a) | | | 80,453 | | | | 9,342 | |
Horizon Oil, Ltd. (a) | | | 652,736 | | | | 45,597 | |
HT&E, Ltd. | | | 109,386 | | | | 121,807 | |
HUB24, Ltd. | | | 12,427 | | | | 103,971 | |
Huon Aquaculture Group, Ltd. | | | 2,742 | | | | 9,077 | |
IDM International, Ltd. (a) (b) (c) (d) | | | 1,969 | | | | 0 | |
IDP Education, Ltd. | | | 9,981 | | | | 69,383 | |
See accompanying notes to financial statements.
BHFTII-4
Brighthouse Funds Trust II
Brighthouse/Dimensional International Small Company Portfolio
Schedule of Investments as of December 31, 2018
Common Stocks—(Continued)
| | | | | | | | |
| Security Description | | Shares | | | Value | |
|
| Australia—(Continued) | |
Iluka Resources, Ltd. | | | 67,683 | | | $ | 363,234 | |
Imdex, Ltd. (a) | | | 100,165 | | | | 75,485 | |
IMF Bentham, Ltd. | | | 56,545 | | | | 125,164 | |
Independence Group NL | | | 112,057 | | | | 301,463 | |
Infigen Energy, Ltd. (a) | | | 343,467 | | | | 112,488 | |
Infomedia, Ltd. | | | 131,353 | | | | 109,308 | |
Inghams Group, Ltd. | | | 61,587 | | | | 179,149 | |
Integral Diagnostics, Ltd. | | | 6,767 | | | | 13,202 | |
Integrated Research, Ltd. | | | 28,972 | | | | 35,824 | |
International Ferro Metals, Ltd. (a) (b) (c) (d) | | | 82,765 | | | | 0 | |
Invocare, Ltd. | | | 39,057 | | | | 283,471 | |
IOOF Holdings, Ltd. | | | 118,246 | | | | 431,015 | |
IPH, Ltd. | | | 43,902 | | | | 167,281 | |
Iress, Ltd. | | | 54,057 | | | | 423,362 | |
iSelect, Ltd. | | | 46,213 | | | | 24,737 | |
iSentia Group, Ltd. | | | 28,120 | | | | 5,545 | |
IVE Group, Ltd. | | | 19,754 | | | | 29,218 | |
Japara Healthcare, Ltd. | | | 32,040 | | | | 25,289 | |
JBHi-Fi, Ltd. | | | 46,350 | | | | 722,750 | |
Jumbo Interactive, Ltd. | | | 12,118 | | | | 60,905 | |
Jupiter Mines, Ltd. | | | 53,689 | | | | 9,441 | |
K&S Corp., Ltd. | | | 1,802 | | | | 1,777 | |
Karoon Energy, Ltd. (a) | | | 75,600 | | | | 44,774 | |
Kingsgate Consolidated, Ltd. (a) | | | 121,238 | | | | 13,672 | |
Kogan.com, Ltd. | | | 8,313 | | | | 19,933 | |
Lifestyle Communities, Ltd. | | | 7,615 | | | | 28,255 | |
Link Administration Holdings, Ltd. | | | 96,883 | | | | 461,944 | |
Lovisa Holdings, Ltd. | | | 11,216 | | | | 49,054 | |
Lynas Corp., Ltd. (a) | | | 58,609 | | | | 65,086 | |
MACA, Ltd. | | | 56,351 | | | | 37,006 | |
Macmahon Holdings, Ltd. (a) | | | 380,170 | | | | 57,376 | |
MaxiTRANS Industries, Ltd. | | | 59,013 | | | | 22,042 | |
Mayne Pharma Group, Ltd. (a) | | | 452,144 | | | | 246,780 | |
McMillan Shakespeare, Ltd. | | | 29,453 | | | | 288,552 | |
McPherson’s, Ltd. | | | 34,460 | | | | 30,338 | |
Medusa Mining, Ltd. (a) | | | 60,972 | | | | 17,393 | |
Metals X, Ltd. (a) | | | 84,827 | | | | 25,390 | |
Metcash, Ltd. | | | 385,184 | | | | 664,661 | |
Millennium Minerals, Ltd. (a) | | | 63,242 | | | | 8,060 | |
Mincor Resources NL (a) | | | 105,687 | | | | 25,681 | |
Mineral Resources, Ltd. | | | 41,091 | | | | 447,697 | |
MMA Offshore, Ltd. (a) | | | 200,470 | | | | 21,884 | |
Moelis Australia, Ltd. | | | 4,454 | | | | 14,341 | |
Monadelphous Group, Ltd. | | | 40,177 | | | | 389,647 | |
Monash IVF Group, Ltd. | | | 21,931 | | | | 15,343 | |
Money3 Corp., Ltd. | | | 25,929 | | | | 30,160 | |
Morning Star Gold NL (a) (b) (c) | | | 33,455 | | | | 0 | |
Mortgage Choice, Ltd. | | | 48,689 | | | | 33,798 | |
Mount Gibson Iron, Ltd. | | | 406,465 | | | | 153,158 | |
Myer Holdings, Ltd. (a) | | | 355,143 | | | | 103,805 | |
MYOB Group, Ltd. | | | 110,434 | | | | 260,232 | |
MyState, Ltd. | | | 3,899 | | | | 12,496 | |
Navigator Global Investments, Ltd. | | | 45,623 | | | | 134,949 | |
Navitas, Ltd. | | | 85,117 | | | | 303,338 | |
NetComm Wireless, Ltd. (a) | | | 18,166 | | | | 9,695 | |
New Hope Corp., Ltd. | | | 32,928 | | | | 79,082 | |
NEXTDC, Ltd. (a) | | | 68,796 | | | | 296,536 | |
|
| Australia—(Continued) | |
nib holdings, Ltd. | | | 171,993 | | | | 629,896 | |
Nick Scali, Ltd. | | | 16,348 | | | | 60,795 | |
Nine Entertainment Co. Holdings, Ltd. | | | 529,025 | | | | 514,180 | |
NRW Holdings, Ltd. | | | 78,732 | | | | 89,551 | |
Nufarm, Ltd. | | | 112,275 | | | | 471,729 | |
OceanaGold Corp. | | | 166,811 | | | | 608,496 | |
OFX Group, Ltd. | | | 99,303 | | | | 122,397 | |
OM Holdings, Ltd. | | | 11,090 | | | | 9,607 | |
Onevue Holdings, Ltd. (a) | | | 33,268 | | | | 13,941 | |
oOh!media, Ltd. | | | 44,310 | | | | 106,730 | |
Orora, Ltd. | | | 238,165 | | | | 514,938 | |
OZ Minerals, Ltd. | | | 134,369 | | | | 832,786 | |
Pacific Current Group, Ltd. | | | 5,535 | | | | 21,024 | |
Pacific Niugini, Ltd. (a) | | | 61,527 | | | | 8,660 | |
Pacific Smiles Group, Ltd. | | | 13,431 | | | | 12,127 | |
Pact Group Holdings, Ltd. | | | 9,541 | | | | 23,331 | |
Panoramic Resources, Ltd. (a) | | | 167,563 | | | | 44,160 | |
Paragon Care, Ltd. | | | 45,405 | | | | 20,415 | |
Peet, Ltd. | | | 88,199 | | | | 60,320 | |
Pendal Group, Ltd. | | | 39,801 | | | | 222,234 | |
Perpetual, Ltd. | | | 17,753 | | | | 406,511 | |
Perseus Mining, Ltd. (a) | | | 231,401 | | | | 68,988 | |
Platinum Asset Management, Ltd. | | | 57,876 | | | | 198,157 | |
Pluton Resources, Ltd. (a) (b) (c) | | | 48,332 | | | | 0 | |
PMP, Ltd. (a) | | | 158,703 | | | | 20,680 | |
Praemium, Ltd. (a) | | | 98,955 | | | | 44,678 | |
Premier Investments, Ltd. | | | 44,992 | | | | 466,139 | |
Prime Media Group, Ltd. (a) | | | 93,371 | | | | 14,188 | |
Pro Medicus, Ltd. | | | 13,002 | | | | 98,960 | |
PWR Holdings, Ltd. | | | 5,725 | | | | 13,346 | |
Qube Holdings, Ltd. | | | 219,677 | | | | 392,986 | |
Quintis, Ltd. (a) (b) (c) (d) | | | 106,522 | | | | 0 | |
RCR Tomlinson, Ltd. (b) (c) (d) | | | 113,813 | | | | 69,743 | |
Reckon, Ltd. | | | 36,898 | | | | 17,412 | |
Regis Healthcare, Ltd. | | | 29,394 | | | | 54,784 | |
Regis Resources, Ltd. | | | 180,703 | | | | 617,057 | |
Reject Shop, Ltd. (The) | | | 12,421 | | | | 23,952 | |
Resolute Mining, Ltd. | | | 277,334 | | | | 227,145 | |
Retail Food Group, Ltd. (a) | | | 64,643 | | | | 13,691 | |
Rhipe, Ltd. | | | 12,338 | | | | 10,827 | |
Ridley Corp., Ltd. | | | 123,003 | | | | 111,863 | |
RPMGlobal Holdings, Ltd. (a) | | | 4,190 | | | | 1,830 | |
Ruralco Holdings, Ltd. | | | 9,291 | | | | 19,960 | |
Salmat, Ltd. | | | 45,807 | | | | 18,875 | |
Sandfire Resources NL | | | 40,717 | | | | 191,561 | |
Saracen Mineral Holdings, Ltd. (a) | | | 349,701 | | | | 726,325 | |
SeaLink Travel Group, Ltd. | | | 7,812 | | | | 23,400 | |
Select Harvests, Ltd. | | | 35,131 | | | | 150,933 | |
Senex Energy, Ltd. (a) | | | 311,194 | | | | 60,271 | |
Servcorp, Ltd. | | | 21,215 | | | | 45,424 | |
Service Stream, Ltd. | | | 62,705 | | | | 77,815 | |
Seven Group Holdings, Ltd. | | | 7,838 | | | | 78,407 | |
Seven West Media, Ltd. (a) | | | 408,410 | | | | 158,198 | |
SG Fleet Group, Ltd. | | | 24,267 | | | | 52,339 | |
Sigma Healthcare, Ltd. | | | 560,969 | | | | 224,279 | |
Silver Chef, Ltd. | | | 8,928 | | | | 15,453 | |
Silver Lake Resources, Ltd. (a) | | | 112,092 | | | | 44,226 | |
See accompanying notes to financial statements.
BHFTII-5
Brighthouse Funds Trust II
Brighthouse/Dimensional International Small Company Portfolio
Schedule of Investments as of December 31, 2018
Common Stocks—(Continued)
| | | | | | | | |
| Security Description | | Shares | | | Value | |
|
| Australia—(Continued) | |
SmartGroup Corp., Ltd. | | | 22,008 | | | $ | 137,640 | |
Southern Cross Media Group, Ltd. | | | 229,061 | | | | 162,136 | |
Spark Infrastructure Group | | | 417,824 | | | | 650,622 | |
SpeedCast International, Ltd. | | | 60,891 | | | | 124,978 | |
SRG Global, Ltd. (d) | | | 9,380 | | | | 3,306 | |
St. Barbara, Ltd. | | | 201,372 | | | | 667,103 | |
Stanmore Coal, Ltd. | | | 19,719 | | | | 13,893 | |
Steadfast Group, Ltd. | | | 198,774 | | | | 383,723 | |
Strike Energy, Ltd. (a) | | | 228,018 | | | | 12,677 | |
Sundance Energy Australia, Ltd. (a) | | | 204,616 | | | | 51,631 | |
Sunland Group, Ltd. | | | 40,150 | | | | 37,898 | |
Super Retail Group, Ltd. | | | 65,652 | | | | 325,269 | |
Superloop, Ltd. (a) | | | 10,345 | | | | 11,075 | |
Syrah Resources, Ltd. (a) | | | 53,924 | | | | 57,274 | |
Tassal Group, Ltd. | | | 80,622 | | | | 250,981 | |
Technology One, Ltd. | | | 85,252 | | | | 369,873 | |
Thorn Group, Ltd. | | | 62,916 | | | | 25,146 | |
Tiger Resources, Ltd. (a) (b) (d) | | | 591,241 | | | | 0 | |
Troy Resources, Ltd. (a) (b) | | | 106,145 | | | | 8,298 | |
Villa World, Ltd. | | | 27,402 | | | | 33,887 | |
Village Roadshow, Ltd. (a) | | | 38,999 | | | | 74,467 | |
Virgin Australia Holdings, Ltd. (a) | | | 442,369 | | | | 57,634 | |
Virgin Australia International Holding, Ltd. (a) (b) (c) | | | 968,773 | | | | 1 | |
Virtus Health, Ltd. | | | 37,091 | | | | 115,298 | |
Vista Group International, Ltd. | | | 24,156 | | | | 60,812 | |
Vita Group, Ltd. | | | 18,112 | | | | 13,464 | |
Vocus Group, Ltd. (a) | | | 98,354 | | | | 221,662 | |
Webjet, Ltd. | | | 33,524 | | | | 259,244 | |
Western Areas, Ltd. | | | 118,029 | | | | 164,711 | |
Westgold Resources, Ltd. (a) | | | 37,679 | | | | 23,322 | |
WorleyParsons, Ltd. | | | 68,301 | | | | 549,320 | |
WPP AUNZ, Ltd. | | | 131,382 | | | | 52,784 | |
| | | | | | | | |
| | | | | | | 38,078,455 | |
| | | | | | | | |
|
| Austria—1.3% | |
A-TEC Industries AG (b) (c) | | | 1 | | | | 0 | |
Agrana Beteiligungs AG | | | 5,812 | | | | 106,954 | |
ams AG (a) (e) | | | 12,258 | | | | 295,581 | |
Andritz AG | | | 13,228 | | | | 608,494 | |
Austria Technologie & Systemtechnik AG | | | 14,133 | | | | 249,999 | |
CA Immobilien Anlagen AG | | | 20,949 | | | | 661,896 | |
DO & Co. AG | | | 2,199 | | | | 204,144 | |
EVN AG | | | 12,657 | | | | 182,189 | |
FACC AG (e) | | | 3,854 | | | | 58,693 | |
Flughafen Wien AG | | | 267 | | | | 10,555 | |
IMMOFINANZ AG (a) | | | 19,641 | | | | 470,361 | |
Kapsch TrafficCom AG | | | 1,870 | | | | 71,265 | |
Lenzing AG | | | 3,209 | | | | 292,502 | |
Mayr Melnhof Karton AG | | | 3,211 | | | | 404,326 | |
Oberbank AG | | | 198 | | | | 20,373 | |
Oesterreichische Post AG | | | 10,088 | | | | 346,651 | |
Palfinger AG | | | 5,204 | | | | 132,537 | |
POLYTEC Holding AG | | | 8,428 | | | | 80,735 | |
Porr AG | | | 2,048 | | | | 40,834 | |
Rosenbauer International AG | | | 1,615 | | | | 61,643 | |
S IMMO AG | | | 23,207 | | | | 386,979 | |
|
| Austria—(Continued) | |
S&T AG (a) | | | 16,139 | | | | 292,719 | |
Schoeller-Bleckmann Oilfield Equipment AG | | | 3,509 | | | | 230,943 | |
Semperit AG Holding (a) (e) | | | 5,443 | | | | 62,117 | |
Strabag SE | | | 6,827 | | | | 200,657 | |
Telekom Austria AG (a) | | | 34,047 | | | | 259,040 | |
UBM Development AG | | | 655 | | | | 25,067 | |
UNIQA Insurance Group AG | | | 36,921 | | | | 331,961 | |
Vienna Insurance Group AG Wiener Versicherung Gruppe | | | 4,893 | | | | 113,562 | |
Wienerberger AG | | | 39,101 | | | | 805,042 | |
Zumtobel Group AG (a) | | | 13,016 | | | | 105,986 | |
| | | | | | | | |
| | | | | | | 7,113,805 | |
| | | | | | | | |
|
| Belgium—1.7% | |
Ackermans & van Haaren NV | | | 7,373 | | | | 1,110,061 | |
AGFA-Gevaert NV (a) | | | 67,517 | | | | 257,953 | |
Atenor | | | 1,089 | | | | 63,590 | |
Banque Nationale de Belgique | | | 88 | | | | 242,803 | |
Barco NV | | | 4,866 | | | | 549,760 | |
Bekaert S.A. | | | 11,685 | | | | 280,712 | |
Biocartis NV (a) (e) | | | 5,445 | | | | 62,133 | |
bpost S.A. (e) | | | 18,928 | | | | 173,098 | |
Cie d’Entreprises CFE | | | 3,200 | | | | 316,957 | |
Cie Immobiliere de Belgique S.A. | | | 1,276 | | | | 73,652 | |
D’ieteren S.A. | | | 8,787 | | | | 330,704 | |
Deceuninck NV | | | 27,313 | | | | 60,350 | |
Econocom Group S.A. | | | 39,556 | | | | 131,125 | |
Elia System Operator S.A. | | | 10,586 | | | | 706,851 | |
Euronav NV (e) | | | 30,049 | | | | 212,971 | |
EVS Broadcast Equipment S.A. | | | 4,761 | | | | 126,446 | |
Exmar NV (a) | | | 10,339 | | | | 70,595 | |
Fagron | | | 12,062 | | | | 196,684 | |
Galapagos NV (a) | | | 16,401 | | | | 1,513,838 | |
GIMV NV | | | 1,836 | | | | 98,658 | |
Ion Beam Applications (a) (e) | | | 6,507 | | | | 95,272 | |
Jensen-Group NV | | | 738 | | | | 28,758 | |
Kinepolis Group NV | | | 5,586 | | | | 311,531 | |
Lotus Bakeries NV | | | 96 | | | | 236,387 | |
MDxHealth (a) (e) | | | 8,434 | | | | 17,885 | |
Melexis NV (e) | | | 5,431 | | | | 315,419 | |
Nyrstar NV (a) (e) | | | 26,926 | | | | 17,629 | |
Ontex Group NV (e) | | | 15,902 | | | | 325,310 | |
Orange Belgium S.A. | | | 13,209 | | | | 260,447 | |
Oxurion NV (a) | | | 12,685 | | | | 52,602 | |
Picanol | | | 1,096 | | | | 86,241 | |
Radisson Hospitality AB (a) | | | 2,932 | | | | 13,545 | |
Recticel S.A. | | | 18,423 | | | | 134,612 | |
Resilux NV | | | 229 | | | | 31,644 | |
Roularta Media Group NV | | | 1,629 | | | | 27,338 | |
Sioen Industries NV | | | 3,002 | | | | 77,827 | |
Sipef S.A. (e) | | | 3,358 | | | | 187,612 | |
Telenet Group Holding NV | | | 4,403 | | | | 204,399 | |
TER Beke S.A. | | | 141 | | | | 19,511 | |
Tessenderlo Group S.A. (a) | | | 13,457 | | | | 448,702 | |
Van de Velde NV | | | 1,970 | | | | 57,699 | |
See accompanying notes to financial statements.
BHFTII-6
Brighthouse Funds Trust II
Brighthouse/Dimensional International Small Company Portfolio
Schedule of Investments as of December 31, 2018
Common Stocks—(Continued)
| | | | | | | | |
| Security Description | | Shares | | | Value | |
|
| Belgium—(Continued) | |
Viohalco S.A. (a) | | | 45,397 | | | $ | 138,093 | |
| | | | | | | | |
| | | | | | | 9,667,404 | |
| | | | | | | | |
|
| Canada—8.1% | |
5N Plus, Inc. (a) | | | 33,732 | | | | 76,596 | |
Absolute Software Corp. | | | 18,754 | | | | 106,326 | |
Acadian Timber Corp. | | | 3,800 | | | | 42,114 | |
Advantage Oil & Gas, Ltd. (a) (e) | | | 91,030 | | | | 132,024 | |
Aecon Group, Inc. | | | 30,622 | | | | 395,000 | |
AG Growth International, Inc. | | | 5,820 | | | | 199,514 | |
AGF Management, Ltd. - Class B | | | 32,280 | | | | 113,968 | |
AGT Food & Ingredients, Inc. (e) | | | 7,901 | | | | 96,303 | |
Aimia, Inc. (a) | | | 48,671 | | | | 131,553 | |
AirBoss of America Corp. | | | 3,761 | | | | 23,637 | |
AKITA Drilling, Ltd. - Class A | | | 3,414 | | | | 10,178 | |
Alamos Gold, Inc. - Class A | | | 124,119 | | | | 446,399 | |
Alaris Royalty Corp. | | | 16,654 | | | | 207,260 | |
Alcanna, Inc. (a) | | | 12,660 | | | | 39,041 | |
Alexco Resource Corp. (a) | | | 22,734 | | | | 21,149 | |
Algoma Central Corp. | | | 4,410 | | | | 40,960 | |
Alio Gold, Inc. (a) | | | 5,966 | | | | 5,026 | |
Altius Minerals Corp. (e) | | | 12,660 | | | | 100,245 | |
Altus Group, Ltd. | | | 14,488 | | | | 251,195 | |
Americas Silver Corp. (a) | | | 4,400 | | | | 7,187 | |
Amerigo Resources, Ltd. (a) | | | 35,000 | | | | 22,817 | |
Andrew Peller, Ltd. - Class A | | | 11,417 | | | | 114,488 | |
ARC Resources, Ltd. | | | 51,089 | | | | 303,121 | |
Aritzia, Inc. (a) | | | 11,500 | | | | 138,148 | |
Asanko Gold, Inc. (a) | | | 23,027 | | | | 14,674 | |
Athabasca Oil Corp. (a) | | | 144,824 | | | | 105,022 | |
ATS Automation Tooling Systems, Inc. (a) | | | 36,533 | | | | 385,079 | |
AutoCanada, Inc. | | | 8,428 | | | | 70,069 | |
B2Gold Corp. (a) | | | 251,245 | | | | 734,301 | |
Badger Daylighting, Ltd. (e) | | | 12,862 | | | | 303,838 | |
Baytex Energy Corp. (a) (e) | | | 166,118 | | | | 293,250 | |
Bellatrix Exploration, Ltd. (a) (e) | | | 12,053 | | | | 5,562 | |
Birchcliff Energy, Ltd. | | | 71,640 | | | | 159,527 | |
Bird Construction, Inc. | | | 18,612 | | | | 83,299 | |
Black Diamond Group, Ltd. (a) | | | 19,812 | | | | 30,330 | |
BMTC Group, Inc. | | | 5,387 | | | | 51,258 | |
BNK Petroleum, Inc. (a) | | | 17,500 | | | | 4,166 | |
Bonavista Energy Corp. | | | 75,351 | | | | 66,233 | |
Bonterra Energy Corp. (e) | | | 12,499 | | | | 59,144 | |
Boralex, Inc. - Class A | | | 18,354 | | | | 226,400 | |
Brookfield Real Estate Services, Inc. | | | 3,500 | | | | 37,353 | |
BSM Technologies, Inc. (a) | | | 15,600 | | | | 9,142 | |
Calfrac Well Services, Ltd. (a) (e) | | | 35,593 | | | | 63,615 | |
Calian Group, Ltd. | | | 2,846 | | | | 61,289 | |
Canaccord Genuity Group, Inc. | | | 54,653 | | | | 230,990 | |
Canacol Energy, Ltd. (a) (e) | | | 37,461 | | | | 110,857 | |
Canadian Western Bank | | | 32,028 | | | | 610,906 | |
Canfor Corp. (a) | | | 17,141 | | | | 207,545 | |
Canfor Pulp Products, Inc. | | | 15,297 | | | | 181,632 | |
CanWel Building Materials Group, Ltd. | | | 19,304 | | | | 64,479 | |
Capital Power Corp. | | | 41,208 | | | | 802,608 | |
Capstone Mining Corp. (a) | | | 117,839 | | | | 52,653 | |
|
| Canada—(Continued) | |
Cardinal Energy, Ltd. (e) | | | 32,459 | | | | 52,783 | |
Cargojet, Inc. (d) | | | 1,200 | | | | 62,224 | |
Cascades, Inc. | | | 35,836 | | | | 268,534 | |
Celestica, Inc. (a) | | | 38,585 | | | | 338,029 | |
Celestica, Inc. (U.S. Listed Shares) (a) | | | 223 | | | | 1,956 | |
Centerra Gold, Inc. (a) | | | 62,285 | | | | 267,353 | |
Cervus Equipment Corp. | | | 2,998 | | | | 27,999 | |
CES Energy Solutions Corp. | | | 68,937 | | | | 159,062 | |
Chesswood Group, Ltd. | | | 2,000 | | | | 15,221 | |
Cineplex, Inc. | | | 19,436 | | | | 362,183 | |
Clairvest Group, Inc. | | | 200 | | | | 6,592 | |
Clearwater Seafoods, Inc. | | | 10,644 | | | | 44,831 | |
Cogeco Communications, Inc. | | | 5,772 | | | | 278,115 | |
Cogeco, Inc. | | | 2,309 | | | | 98,503 | |
Colliers International Group, Inc. | | | 9,980 | | | | 550,391 | |
Computer Modelling Group, Ltd. | | | 28,920 | | | | 129,009 | |
Conifex Timber, Inc. (a) (e) | | | 3,500 | | | | 4,384 | |
Continental Gold, Inc. (a) (e) | | | 46,900 | | | | 77,296 | |
Copper Mountain Mining Corp. (a) (e) | | | 63,622 | | | | 33,554 | |
Corby Spirit and Wine, Ltd. | | | 3,957 | | | | 53,767 | |
Corridor Resources, Inc. (a) | | | 21,385 | | | | 12,531 | |
Corus Entertainment, Inc. - B Shares | | | 31,990 | | | | 111,539 | |
Cott Corp. | | | 44,379 | | | | 617,964 | |
Cott Corp. (U.S. Listed Shares) | | | 2,000 | | | | 27,880 | |
Crew Energy, Inc. (a) | | | 69,029 | | | | 43,484 | |
CRH Medical Corp. (a) | | | 27,305 | | | | 83,603 | |
Delphi Energy Corp. (a) (e) | | | 95,850 | | | | 26,680 | |
Denison Mines Corp. (a) (e) | | | 247,548 | | | | 114,236 | |
Descartes Systems Group, Inc. (The) (a) | | | 20,090 | | | | 530,210 | |
Detour Gold Corp. (a) | | | 34,636 | | | | 292,523 | |
DHX Media, Ltd. (a) (e) | | | 41,896 | | | | 68,742 | |
DIRTT Environmental Solutions (a) | | | 14,110 | | | | 63,150 | |
Dorel Industries, Inc. - Class B | | | 12,134 | | | | 156,786 | |
DREAM Unlimited Corp. - Class A (a) | | | 7,822 | | | | 39,190 | |
Dundee Precious Metals, Inc. (a) | | | 45,872 | | | | 120,963 | |
E-L Financial Corp., Ltd. | | | 177 | | | | 95,423 | |
Echelon Financial Holdings, Inc. (a) | | | 900 | | | | 9,229 | |
ECN Capital Corp. | | | 87,631 | | | | 221,452 | |
EcoSynthetix, Inc. (a) | | | 800 | | | | 1,137 | |
Eldorado Gold Corp. (a) | | | 27,658 | | | | 81,038 | |
Element Fleet Management Corp. | | | 40,030 | | | | 202,613 | |
Endeavour Silver Corp. (a) (e) | | | 41,698 | | | | 89,798 | |
Enerflex, Ltd. | | | 29,289 | | | | 342,835 | |
Enerplus Corp. | | | 53,164 | | | | 413,567 | |
Enghouse Systems, Ltd. | | | 7,089 | | | | 344,844 | |
Ensign Energy Services, Inc. | | | 51,526 | | | | 180,786 | |
Entertainment One, Ltd. | | | 84,242 | | | | 381,375 | |
Epsilon Energy, Ltd. (a) | | | 10,928 | | | | 47,948 | |
Equitable Group, Inc. | | | 4,209 | | | | 182,271 | |
Essential Energy Services Trust (a) (e) | | | 53,526 | | | | 11,762 | |
Evertz Technologies, Ltd. | | | 10,149 | | | | 120,358 | |
Exchange Income Corp. | | | 2,651 | | | | 54,876 | |
Exco Technologies, Ltd. | | | 13,332 | | | | 88,183 | |
EXFO, Inc. (a) | | | 85 | | | | 244 | |
Extendicare, Inc. | | | 34,956 | | | | 162,592 | |
Fiera Capital Corp. | | | 16,619 | | | | 137,437 | |
Firm Capital Mortgage Investment Corp. | | | 9,574 | | | | 92,220 | |
See accompanying notes to financial statements.
BHFTII-7
Brighthouse Funds Trust II
Brighthouse/Dimensional International Small Company Portfolio
Schedule of Investments as of December 31, 2018
Common Stocks—(Continued)
| | | | | | | | |
| Security Description | | Shares | | | Value | |
|
| Canada—(Continued) | |
First Majestic Silver Corp. (a) | | | 42,360 | | | $ | 248,848 | |
First Mining Gold Corp. (a) | | | 50,000 | | | | 8,973 | |
First National Financial Corp. (e) | | | 4,907 | | | | 98,701 | |
FirstService Corp. | | | 10,880 | | | | 746,665 | |
Fission Uranium Corp. (a) (e) | | | 114,725 | | | | 45,379 | |
Fortuna Silver Mines, Inc. (a) | | | 60,121 | | | | 220,191 | |
Freehold Royalties, Ltd. | | | 35,012 | | | | 212,093 | |
Gamehost, Inc. | | | 4,952 | | | | 33,806 | |
GDI Integrated Facility Services, Inc. (a) | | | 1,400 | | | | 18,951 | |
Gear Energy, Ltd. (a) | | | 34,663 | | | | 14,473 | |
Genesis Land Development Corp. | | | 14,348 | | | | 33,211 | |
Genworth MI Canada, Inc. | | | 15,602 | | | | 459,420 | |
Gibson Energy, Inc. | | | 29,744 | | | | 406,986 | |
Glacier Media, Inc. (a) | | | 9,600 | | | | 4,219 | |
Gluskin Sheff & Associates, Inc. | | | 12,233 | | | | 93,459 | |
GMP Capital, Inc. | | | 28,336 | | | | 39,021 | |
Goeasy, Ltd. | | | 3,895 | | | | 102,054 | |
GoldMoney, Inc. (a) | | | 5,500 | | | | 6,929 | |
Gran Tierra Energy, Inc. (a) | | | 112,213 | | | | 244,942 | |
Granite Oil Corp. (e) | | | 2,519 | | | | 1,015 | |
Great Canadian Gaming Corp. (a) | | | 19,208 | | | | 673,518 | |
Great Panther Silver, Ltd. (a) | | | 67,206 | | | | 47,751 | |
Guardian Capital Group, Ltd. - Class A | | | 1,500 | | | | 24,238 | |
Guyana Goldfields, Inc. (a) | | | 57,547 | | | | 67,444 | |
Hanfeng Evergreen, Inc. (a) (b) (c) (d) | | | 12,100 | | | | 0 | |
Heroux-Devtek, Inc. (a) | | | 14,606 | | | | 138,335 | |
High Arctic Energy Services, Inc. | | | 3,900 | | | | 9,056 | |
High Liner Foods, Inc. (e) | | | 8,307 | | | | 46,610 | |
Home Capital Group, Inc. (a) | | | 22,002 | | | | 232,075 | |
Horizon North Logistics, Inc. (e) | | | 54,212 | | | | 71,478 | |
HudBay Minerals, Inc. | | | 103,103 | | | | 487,874 | |
Hudson’s Bay Co. (e) | | | 35,831 | | | | 191,333 | |
IAMGOLD Corp. (a) | | | 152,782 | | | | 560,678 | |
IBI Group, Inc. (a) | | | 5,900 | | | | 18,843 | |
Imperial Metals Corp. (a) (e) | | | 18,151 | | | | 20,608 | |
Indigo Books & Music, Inc. (a) | | | 1,986 | | | | 16,409 | |
Information Services Corp. | | | 800 | | | | 8,966 | |
Innergex Renewable Energy, Inc. | | | 40,708 | | | | 373,922 | |
InPlay Oil Corp. (a) | | | 7,800 | | | | 5,599 | |
Interfor Corp. (a) | | | 31,992 | | | | 337,917 | |
International Petroleum Corp. (a) | | | 25,920 | | | | 82,589 | |
International Tower Hill Mines, Ltd. (a) | | | 21,604 | | | | 11,236 | |
Intertain Group, Ltd. (The) (a) | | | 800 | | | | 6,317 | |
Intertape Polymer Group, Inc. (e) | | | 20,313 | | | | 251,755 | |
Invesque, Inc. | | | 9,800 | | | | 69,874 | |
Jamieson Wellness, Inc. | | | 11,072 | | | | 172,990 | |
Just Energy Group, Inc. (e) | | | 50,690 | | | | 167,457 | |
K-Bro Linen, Inc. (e) | | | 2,719 | | | | 66,601 | |
Kelt Exploration, Ltd. (a) | | | 58,951 | | | | 200,361 | |
Kinaxis, Inc. (a) | | | 7,097 | | | | 342,582 | |
Kingsway Financial Services, Inc. (a) (b) (c) | | | 8,765 | | | | 25,156 | |
Knight Therapeutics, Inc. (a) | | | 40,310 | | | | 227,061 | |
KP Tissue, Inc. | | | 1,400 | | | | 8,276 | |
Labrador Iron Ore Royalty Corp. | | | 21,800 | | | | 387,073 | |
Largo Resources, Ltd. (a) (e) | | | 83,173 | | | | 172,414 | |
Lassonde Industries, Inc. - Class A | | | 500 | | | | 72,964 | |
Laurentian Bank of Canada | | | 13,206 | | | | 368,263 | |
|
| Canada—(Continued) | |
Leagold Mining Corp. (a) (e) | | | 9,400 | | | | 11,912 | |
Leon’s Furniture, Ltd. | | | 9,639 | | | | 106,119 | |
Lightstream Resources, Ltd. (a) (b) (c) | | | 108,373 | | | | 0 | |
Linamar Corp. | | | 9,144 | | | | 303,416 | |
Lucara Diamond Corp. (e) | | | 110,136 | | | | 119,397 | |
Lundin Gold, Inc. (a) | | | 11,400 | | | | 41,669 | |
Magellan Aerospace Corp. | | | 5,794 | | | | 63,576 | |
Mainstreet Equity Corp. (a) | | | 2,561 | | | | 78,057 | |
Major Drilling Group International, Inc. (a) | | | 36,670 | | | | 123,558 | |
Mandalay Resources Corp. (a) | | | 87,627 | | | | 4,814 | |
Manitok Energy, Inc. (a) (b) (d) | | | 122 | | | | 0 | |
Maple Leaf Foods, Inc. | | | 14,680 | | | | 293,880 | |
Martinrea International, Inc. | | | 32,289 | | | | 256,855 | |
Maxar Technologies, Ltd. (e) | | | 5,602 | | | | 66,927 | |
Maxim Power Corp. (a) | | | 2,800 | | | | 4,451 | |
Mediagrif Interactive Technologies, Inc. | | | 4,176 | | | | 29,243 | |
Medical Facilities Corp. | | | 12,861 | | | | 141,686 | |
MEG Energy Corp. (a) | | | 66,854 | | | | 377,560 | |
Melcor Developments, Ltd. | | | 3,120 | | | | 28,087 | |
MENE, Inc. (a) | | | 284 | | | | 125 | |
Morguard Corp. | | | 1,400 | | | | 180,497 | |
Morneau Shepell, Inc. | | | 18,485 | | | | 339,045 | |
Mountain Province Diamonds, Inc. | | | 1,600 | | | | 2,285 | |
MTY Food Group, Inc. | | | 6,320 | | | | 280,724 | |
Mullen Group, Ltd. (e) | | | 37,792 | | | | 338,002 | |
Nevsun Resources, Ltd. (a) | | | 96,711 | | | | 424,333 | |
New Gold, Inc. (a) | | | 118,248 | | | | 90,947 | |
NFI Group, Inc. | | | 13,236 | | | | 330,027 | |
Norbord, Inc. | | | 7,425 | | | | 197,427 | |
North American Construction Group, Ltd. | | | 14,743 | | | | 131,210 | |
North West Co., Inc. (The) | | | 16,971 | | | | 390,587 | |
Northland Power, Inc. | | | 30,227 | | | | 480,461 | |
NuVista Energy, Ltd. (a) (e) | | | 59,117 | | | | 176,675 | |
Obsidian Energy, Ltd. (a) (e) | | | 163,188 | | | | 60,962 | |
Osisko Gold Royalties, Ltd. (e) | | | 30,681 | | | | 269,009 | |
Osisko Mining, Inc. (a) | | | 12,300 | | | | 27,660 | |
Painted Pony Energy, Ltd. (a) (e) | | | 38,738 | | | | 42,279 | |
Pan American Silver Corp. | | | 49,527 | | | | 723,025 | |
Paramount Resources, Ltd. - Class A (a) (e) | | | 19,290 | | | | 101,452 | |
Parex Resources, Inc. (a) | | | 55,359 | | | | 662,994 | |
Park Lawn Corp. | | | 1,633 | | | | 27,583 | |
Parkland Fuel Corp. | | | 25,863 | | | | 669,498 | |
Pason Systems, Inc. | | | 22,516 | | | | 301,654 | |
Pengrowth Energy Corp. (a) (e) | | | 183,295 | | | | 80,557 | |
Peyto Exploration & Development Corp. | | | 19,828 | | | | 102,829 | |
Photon Control, Inc. (a) | | | 20,200 | | | | 16,128 | |
PHX Energy Services Corp. (a) | | | 12,350 | | | | 21,349 | |
Pivot Technology Solutions, Inc. | | | 4,800 | | | | 3,516 | |
Pizza Pizza Royalty Corp. | | | 6,998 | | | | 45,878 | |
Points International, Ltd. (a) | | | 5,320 | | | | 53,075 | |
Polaris Infrastructure, Inc. | | | 2,500 | | | | 18,862 | |
Pollard Banknote, Ltd. | | | 1,400 | | | | 21,074 | |
Polymet Mining Corp. (a) | | | 38,355 | | | | 31,185 | |
Precision Drilling Corp. (a) | | | 103,898 | | | | 180,368 | |
Premium Brands Holdings Corp. | | | 7,825 | | | | 429,080 | |
Pretium Resources, Inc. (a) | | | 29,937 | | | | 253,715 | |
Pulse Seismic, Inc. (a) (e) | | | 15,720 | | | | 17,157 | |
See accompanying notes to financial statements.
BHFTII-8
Brighthouse Funds Trust II
Brighthouse/Dimensional International Small Company Portfolio
Schedule of Investments as of December 31, 2018
Common Stocks—(Continued)
| | | | | | | | |
| Security Description | | Shares | | | Value | |
|
| Canada—(Continued) | |
Quarterhill, Inc. | | | 58,061 | | | $ | 56,564 | |
Questerre Energy Corp. - Class A (a) (e) | | | 83,569 | | | | 16,528 | |
Recipe Unlimited Corp. | | | 4,150 | | | | 79,553 | |
Reitmans Canada, Ltd. - Class A | | | 20,566 | | | | 59,203 | |
Richelieu Hardware, Ltd. | | | 18,490 | | | | 307,309 | |
Rocky Mountain Dealerships, Inc. | | | 3,738 | | | | 24,150 | |
Rogers Sugar, Inc. (e) | | | 35,106 | | | | 139,889 | |
Roxgold, Inc. (a) | | | 42,400 | | | | 25,157 | |
Russel Metals, Inc. | | | 24,422 | | | | 381,571 | |
Sabina Gold & Silver Corp. (a) (e) | | | 57,206 | | | | 51,541 | |
Sandstorm Gold, Ltd. (a) | | | 58,462 | | | | 270,642 | |
Savaria Corp. | | | 10,600 | | | | 101,403 | |
Secure Energy Services, Inc. | | | 55,376 | | | | 284,344 | |
SEMAFO, Inc. (a) | | | 123,983 | | | | 267,909 | |
Seven Generations Energy, Ltd. - Class A (a) | | | 17,835 | | | | 145,533 | |
ShawCor, Ltd. | | | 20,891 | | | | 253,716 | |
Sienna Senior Living, Inc. (e) | | | 14,276 | | | | 164,594 | |
Sierra Wireless, Inc. (a) (e) | | | 16,910 | | | | 227,044 | |
Sleep Country Canada Holdings, Inc. | | | 12,404 | | | | 181,444 | |
Solium Capital, Inc. (a) | | | 3,317 | | | | 28,646 | |
Sprott Resource Holdings, Inc. (a) | | | 5,636 | | | | 4,624 | |
Sprott, Inc. (e) | | | 60,427 | | | | 113,754 | |
SSR Mining, Inc. (a) | | | 37,551 | | | | 453,847 | |
Stantec, Inc. (e) | | | 23,513 | | | | 515,143 | |
Stella-Jones, Inc. | | | 10,990 | | | | 318,865 | |
STEP Energy Services, Ltd. (a) | | | 6,800 | | | | 9,663 | |
Storm Resources, Ltd. (a) | | | 11,300 | | | | 14,402 | |
Stornoway Diamond Corp. (a) | | | 70,074 | | | | 10,009 | |
Strad Energy Services, Ltd. (a) | | | 10,641 | | | | 9,821 | |
Street Capital Group, Inc. (a) | | | 5,900 | | | | 2,593 | |
Stuart Olson, Inc. | | | 11,157 | | | | 40,699 | |
SunOpta, Inc. (a) | | | 26,392 | | | | 102,073 | |
Superior Plus Corp. | | | 44,558 | | | | 315,940 | |
Surge Energy, Inc. (e) | | | 85,275 | | | | 91,821 | |
Tamarack Valley Energy, Ltd. (a) | | | 69,684 | | | | 120,462 | |
Taseko Mines, Ltd. (a) | | | 108,786 | | | | 51,795 | |
TeraGo, Inc. (a) | | | 4,100 | | | | 32,074 | |
Teranga Gold Corp. (a) | | | 24,518 | | | | 72,376 | |
Tervita Corp. (a) (e) | | | 3,508 | | | | 16,137 | |
TFI International, Inc. | | | 25,364 | | | | 655,837 | |
Theratechnologies, Inc. (a) (e) | | | 2,200 | | | | 13,408 | |
Tidewater Midstream and Infrastructure, Ltd. (e) | | | 11,900 | | | | 11,332 | |
Timbercreek Financial Corp. | | | 9,049 | | | | 57,998 | |
TMX Group, Ltd. | | | 7,227 | | | | 374,426 | |
TORC Oil & Gas, Ltd. | | | 47,624 | | | | 152,444 | |
Torex Gold Resources, Inc. (a) | | | 18,090 | | | | 172,128 | |
Torstar Corp. - Class B | | | 21,453 | | | | 12,414 | |
Total Energy Services, Inc. | | | 17,786 | | | | 127,285 | |
TransAlta Corp. | | | 91,004 | | | | 372,628 | |
TransAlta Renewables, Inc. | | | 28,608 | | | | 217,305 | |
Transcontinental, Inc. - Class A | | | 26,130 | | | | 369,403 | |
TransGlobe Energy Corp. | | | 36,372 | | | | 67,671 | |
Trevali Mining Corp. (a) (e) | | | 90,600 | | | | 27,541 | |
Trican Well Service, Ltd. (a) | | | 101,707 | | | | 88,655 | |
Tricon Capital Group, Inc. | | | 46,139 | | | | 327,488 | |
Trisura Group, Ltd. (a) | | | 700 | | | | 13,383 | |
Uni-Select, Inc. | | | 13,271 | | | | 188,683 | |
|
| Canada—(Continued) | |
Valener, Inc. | | | 16,303 | | | | 230,955 | |
Vecima Networks, Inc. | | | 2,500 | | | | 14,925 | |
Wajax Corp. | | | 7,885 | | | | 95,761 | |
Wesdome Gold Mines, Ltd. (a) | | | 51,707 | | | | 167,786 | |
Western Energy Services Corp. (a) | | | 27,573 | | | | 9,089 | |
Western Forest Products, Inc. (e) | | | 145,247 | | | | 201,082 | |
WestJet Airlines, Ltd. | | | 861 | | | | 11,352 | |
Westshore Terminals Investment Corp. | | | 18,288 | | | | 275,686 | |
Whitecap Resources, Inc. | | | 95,350 | | | | 303,818 | |
Winpak, Ltd. | | | 8,852 | | | | 309,613 | |
Yamana Gold, Inc. | | | 227,016 | | | | 533,784 | |
Yangarra Resources, Ltd. (a) | | | 24,087 | | | | 46,226 | |
Yellow Pages, Ltd. (a) (e) | | | 6,975 | | | | 31,115 | |
ZCL Composites, Inc. | | | 9,681 | | | | 44,604 | |
Zenith Capital Corp. (a) (b) (c) | | | 12,830 | | | | 761 | |
| | | | | | | | |
| | | | | | | 45,921,549 | |
| | | | | | | | |
|
| China—0.2% | |
APT Satellite Holdings, Ltd. | | | 164,250 | | | | 65,203 | |
Asia Satellite Telecommunications Holdings, Ltd. | | | 58,500 | | | | 39,250 | |
BeijingWest Industries International, Ltd. (a) | | | 41,200 | | | | 4,081 | |
BOE Varitronix, Ltd. | | | 137,000 | | | | 39,446 | |
Bund Center Investment, Ltd. | | | 138,000 | | | | 58,219 | |
CGN Mining Co., Ltd. | | | 145,000 | | | | 4,398 | |
China Chuanglian Education Financial Group, Ltd. (a) | | | 336,000 | | | | 2,978 | |
China Display Optoelectronics Technology Holdings, Ltd. | | | 136,000 | | | | 8,641 | |
China Everbright Greentech, Ltd. | | | 45,000 | | | | 32,073 | |
China Gold International Resources Corp., Ltd. (a) (e) | | | 79,013 | | | | 91,445 | |
China Ludao Technology Co., Ltd. (a) | | | 56,000 | | | | 9,905 | |
China New Higher Education Group, Ltd. | | | 37,000 | | | | 16,017 | |
China Sunsine Chemical Holdings, Ltd. | | | 35,000 | | | | 32,081 | |
Chong Hing Bank, Ltd. | | | 16,000 | | | | 26,993 | |
CITIC Telecom International Holdings, Ltd. | | | 467,000 | | | | 163,712 | |
FIH Mobile, Ltd. (a) (e) | | | 799,000 | | | | 83,158 | |
First Sponsor Group, Ltd. | | | 9,490 | | | | 8,843 | |
Fountain SET Holdings, Ltd. | | | 422,000 | | | | 66,109 | |
Goodbaby International Holdings, Ltd. | | | 193,000 | | | | 60,447 | |
Guangnan Holdings, Ltd. | | | 264,000 | | | | 29,014 | |
Guotai Junan International Holdings, Ltd. | | | 617,600 | | | | 98,602 | |
Mega Expo Holdings, Ltd. | | | 5,000 | | | | 2,268 | |
Microport Scientific Corp. | | | 56,000 | | | | 54,729 | |
Morris Holdings, Ltd. | | | 56,000 | | | | 4,207 | |
Nanfang Communication Holdings, Ltd. | | | 48,000 | | | | 33,960 | |
Neo-Neon Holdings, Ltd. (a) | | | 322,500 | | | | 26,762 | |
New Sports Group, Ltd. (a) | | | 221,500 | | | | 13,497 | |
Shenwan Hongyuan HK, Ltd. | | | 172,500 | | | | 36,376 | |
Sino Grandness Food Industry Group, Ltd. (a) | | | 199,272 | | | | 17,974 | |
SITC International Holdings Co., Ltd. | | | 223,000 | | | | 208,945 | |
| | | | | | | | |
| | | | | | | 1,339,333 | |
| | | | | | | | |
|
| Colombia—0.0% | |
Frontera Energy Corp. (a) | | | 3,075 | | | | 30,137 | |
| | | | | | | | |
|
| Denmark—2.3% | |
ALK-Abello A/S (a) | | | 1,831 | | | | 271,030 | |
Alm Brand A/S | | | 28,684 | | | | 219,410 | |
See accompanying notes to financial statements.
BHFTII-9
Brighthouse Funds Trust II
Brighthouse/Dimensional International Small Company Portfolio
Schedule of Investments as of December 31, 2018
Common Stocks—(Continued)
| | | | | | | | |
| Security Description | | Shares | | | Value | |
|
| Denmark—(Continued) | |
Ambu A/S - Class B (e) | | | 41,724 | | | $ | 1,004,893 | |
Bang & Olufsen A/S (a) | | | 10,209 | | | | 139,187 | |
Bavarian Nordic A/S (a) (e) | | | 10,666 | | | | 208,976 | |
Brodrene Hartmann A/S | | | 663 | | | | 25,756 | |
Columbus A/S | | | 20,865 | | | | 40,653 | |
D/S Norden A/S (a) | | | 6,460 | | | | 91,430 | |
DFDS A/S | | | 11,185 | | | | 450,515 | |
FLSmidth & Co. A/S (e) | | | 15,133 | | | | 679,920 | |
GN Store Nord A/S (e) | | | 43,379 | | | | 1,621,517 | |
H+H International A/S - Class B (a) | | | 4,578 | | | | 66,844 | |
Harboes Bryggeri A/S - Class B | | | 1,454 | | | | 16,734 | |
IC Group A/S | | | 3,209 | | | | 17,990 | |
ISS A/S | | | 27,399 | | | | 764,795 | |
Jeudan A/S | | | 410 | | | | 59,585 | |
Jyske Bank A/S | | | 17,351 | | | | 627,156 | |
Matas A/S | | | 7,249 | | | | 64,632 | |
Nilfisk Holding A/S (a) | | | 8,471 | | | | 300,094 | |
NKT A/S (a) | | | 6,820 | | | | 92,971 | |
NNIT A/S | | | 2,656 | | | | 74,763 | |
Parken Sport & Entertainment A/S | | | 2,351 | | | | 28,699 | |
PER Aarsleff Holding A/S | | | 8,472 | | | | 258,698 | |
Ringkjoebing Landbobank A/S | | | 9,911 | | | | 517,847 | |
Rockwool International A/S - B Shares | | | 2,187 | | | | 571,256 | |
Royal Unibrew A/S | | | 15,546 | | | | 1,070,405 | |
RTX A/S | | | 3,387 | | | | 84,178 | |
Scandinavian Tobacco Group A/S | | | 7,203 | | | | 86,782 | |
Schouw & Co. A/S | | | 5,566 | | | | 414,406 | |
SimCorp A/S | | | 12,900 | | | | 884,311 | |
Solar A/S - B Shares | | | 2,435 | | | | 105,680 | |
Spar Nord Bank A/S | | | 32,428 | | | | 260,235 | |
Sydbank A/S | | | 26,018 | | | | 619,534 | |
TK Development A/S (a) | | | 37,491 | | | | 30,662 | |
Topdanmark A/S | | | 22,026 | | | | 1,026,222 | |
Tryg A/S | | | 732 | | | | 18,426 | |
United International Enterprises | | | 850 | | | | 173,338 | |
Veloxis Pharmaceuticals A/S (a) (e) | | | 115,226 | | | | 38,648 | |
Vestjysk Bank A/S (a) | | | 3,300 | | | | 992 | |
Zealand Pharma A/S (a) | | | 7,520 | | | | 95,699 | |
| | | | | | | | |
| | | | | | | 13,124,869 | |
| | | | | | | | |
|
| Finland—2.8% | |
Aktia Bank Oyj | | | 9,111 | | | | 94,032 | |
Alma Media Oyj | | | 22,695 | | | | 144,166 | |
Amer Sports Oyj (a) | | | 47,651 | | | | 2,097,090 | |
Apetit Oyj | | | 1,205 | | | | 12,409 | |
Asiakastieto Group Oyj (a) | | | 1,161 | | | | 32,726 | |
Aspo Oyj | | | 8,414 | | | | 76,683 | |
Atria Oyj | | | 2,604 | | | | 19,663 | |
BasWare Oyj (a) (e) | | | 3,525 | | | | 159,689 | |
Bittium Oyj (e) | | | 8,034 | | | | 70,216 | |
Cargotec Oyj - B Shares | | | 12,591 | | | | 384,550 | |
Caverion Oyj (a) | | | 36,589 | | | | 212,989 | |
Citycon Oyj | | | 146,997 | | | | 271,812 | |
Cramo Oyj | | | 9,503 | | | | 162,091 | |
Digia Oyj | | | 3,254 | | | | 10,631 | |
Elisa Oyj | | | 12,910 | | | | 534,612 | |
|
| Finland—(Continued) | |
F-Secure Oyj | | | 35,820 | | | | 94,747 | |
Ferratum Oyj | | | 2,093 | | | | 19,178 | |
Finnair Oyj | | | 24,728 | | | | 200,507 | |
Fiskars Oyj Abp | | | 17,515 | | | | 302,084 | |
HKScan Oyj - A Shares | | | 6,704 | | | | 10,934 | |
Huhtamaki Oyj | | | 34,101 | | | | 1,059,278 | |
Ilkka-Yhtyma Oyj | | | 2,976 | | | | 11,942 | |
Kemira Oyj | | | 41,153 | | | | 465,720 | |
Kesko Oyj - A Shares | | | 1,323 | | | | 66,054 | |
Kesko Oyj - B Shares | | | 21,481 | | | | 1,158,130 | |
Konecranes Oyj | | | 16,662 | | | | 503,025 | |
Lassila & Tikanoja Oyj | | | 12,398 | | | | 212,516 | |
Metsa Board Oyj | | | 86,501 | | | | 509,948 | |
Metso Oyj | | | 28,987 | | | | 764,545 | |
Nokian Renkaat Oyj | | | 38,871 | | | | 1,197,830 | |
Olvi Oyj - A Shares | | | 6,303 | | | | 227,608 | |
Oriola-KD Oyj - B Shares | | | 53,692 | | | | 122,074 | |
Orion Oyj - Class A | | | 8,256 | | | | 287,043 | |
Orion Oyj - Class B | | | 23,446 | | | | 814,475 | |
Outokumpu Oyj | | | 102,277 | | | | 373,122 | |
Outotec Oyj (a) | | | 52,402 | | | | 183,876 | |
Ponsse Oyj | | | 3,208 | | | | 90,851 | |
Poyry Oyj | | | 14,295 | | | | 170,391 | |
Raisio Oyj - V Shares | | | 55,399 | | | | 148,778 | |
Ramirent Oyj | | | 31,090 | | | | 194,065 | |
Rapala VMC Oyj | | | 8,902 | | | | 31,131 | |
Raute Oyj - A Shares | | | 72 | | | | 1,754 | |
Revenio Group Oyj | | | 3,966 | | | | 57,114 | |
Sanoma Oyj | | | 31,912 | | | | 310,507 | |
Stockmann Oyj Abp - B Shares (a) | | | 11,956 | | | | 26,255 | |
Teleste Oyj | | | 2,149 | | | | 12,942 | |
Tieto Oyj | | | 21,736 | | | | 588,093 | |
Tikkurila Oyj | | | 12,873 | | | | 177,371 | |
Tokmanni Group Corp. | | | 7,656 | | | | 62,949 | |
Uponor Oyj | | | 19,661 | | | | 194,775 | |
Vaisala Oyj - A Shares | | | 6,772 | | | | 127,989 | |
Valmet Oyj | | | 28,977 | | | | 595,105 | |
YIT Oyj | | | 51,511 | | | | 300,696 | |
| | | | | | | | |
| | | | | | | 15,958,761 | |
| | | | | | | | |
|
| France—3.9% | |
ABC Arbitrage | | | 7,886 | | | | 54,938 | |
Actia Group | | | 4,338 | | | | 16,816 | |
AirFrance-KLM (a) | | | 48,793 | | | | 527,545 | |
Akka Technologies S.A. | | | 3,906 | | | | 196,431 | |
AKWEL | | | 3,301 | | | | 60,903 | |
Albioma S.A. | | | 13,155 | | | | 285,304 | |
Altamir Amboise | | | 9,152 | | | | 132,544 | |
Alten S.A. | | | 8,205 | | | | 681,217 | |
Altran Technologies S.A. (e) | | | 66,322 | | | | 532,870 | |
Amplitude Surgical SAS (a) | | | 2,894 | | | | 9,094 | |
APRIL S.A. | | | 8,341 | | | | 190,445 | |
Assystem (d) | | | 4,398 | | | | 135,997 | |
Aubay | | | 2,116 | | | | 68,102 | |
Axway Software S.A. | | | 2,132 | | | | 30,365 | |
Baikowski SAS (a) | | | 234 | | | | 3,700 | |
See accompanying notes to financial statements.
BHFTII-10
Brighthouse Funds Trust II
Brighthouse/Dimensional International Small Company Portfolio
Schedule of Investments as of December 31, 2018
Common Stocks—(Continued)
| | | | | | | | |
| Security Description | | Shares | | | Value | |
|
| France—(Continued) | |
Bastide le Confort Medical | | | 1,050 | | | $ | 31,259 | |
Beneteau S.A. | | | 15,076 | | | | 196,503 | |
Bigben Interactive | | | 4,507 | | | | 41,388 | |
Boiron S.A. | | | 2,586 | | | | 144,739 | |
Bonduelle SCA | | | 6,799 | | | | 220,942 | |
Bourbon S.A. (a) (e) | | | 1,528 | | | | 6,005 | |
Burelle S.A. | | | 117 | | | | 106,729 | |
Casino Guichard Perrachon S.A. (e) | | | 6,523 | | | | 270,788 | |
Catering International Services | | | 541 | | | | 5,674 | |
Cegedim S.A. (a) | | | 2,643 | | | | 59,850 | |
CGG S.A. (a) | | | 61,816 | | | | 81,108 | |
Chargeurs S.A. | | | 7,605 | | | | 145,165 | |
Cie des Alpes | | | 3,241 | | | | 91,574 | |
Cie Plastic Omnium S.A. | | | 12,573 | | | | 288,218 | |
Coface S.A. (a) | | | 23,469 | | | | 213,211 | |
Derichebourg S.A. | | | 31,305 | | | | 142,442 | |
Devoteam S.A. | | | 1,818 | | | | 171,557 | |
Electricite de Strasbourg S.A. | | | 245 | | | | 27,444 | |
Elior Group S.A. | | | 25,421 | | | | 379,094 | |
Elis S.A. | | | 22,830 | | | | 378,577 | |
Eramet | | | 3,022 | | | | 208,996 | |
Esso S.A. Francaise | | | 1,341 | | | | 49,502 | |
Etablissements Maurel et Prom (a) (d) | | | 5,328 | | | | 19,560 | |
Europcar Groupe S.A. | | | 21,442 | | | | 192,646 | |
Eutelsat Communications S.A. | | | 43,896 | | | | 868,080 | |
Exel Industries - A Shares | | | 618 | | | | 48,115 | |
Fleury Michon S.A. | | | 461 | | | | 20,384 | |
Fnac Darty S.A. (a) | | | 6,777 | | | | 441,919 | |
Gaztransport Et Technigaz S.A. | | | 5,461 | | | | 420,477 | |
GEA | | | 165 | | | | 16,215 | |
GL Events | | | 4,878 | | | | 96,104 | |
Groupe Crit | | | 1,062 | | | | 64,414 | |
Groupe Gorge | | | 2,544 | | | | 24,384 | |
Groupe Open | | | 1,736 | | | | 39,283 | |
Guerbet | | | 2,188 | | | | 131,322 | |
Haulotte Group S.A. | | | 5,337 | | | | 53,973 | |
HERIGE SADCS | | | 235 | | | | 6,324 | |
HiPay Group S.A. (a) | | | 1,527 | | | | 13,947 | |
ID Logistics Group (a) | | | 776 | | | | 102,239 | |
Imerys S.A. | | | 6,375 | | | | 305,005 | |
Ingenico Group S.A. | | | 16,077 | | | | 909,301 | |
Interparfums S.A. | | | 918 | | | | 35,512 | |
IPSOS | | | 12,134 | | | | 285,715 | |
Jacquet Metal Service | | | 7,099 | | | | 125,158 | |
Kaufman & Broad S.A. | | | 6,070 | | | | 231,774 | |
Korian S.A. | | | 21,040 | | | | 747,451 | |
Lagardere SCA | | | 36,064 | | | | 906,757 | |
Lanson-BCC | | | 15 | | | | 512 | |
Latecoere SACA (a) (e) | | | 26,469 | | | | 84,453 | |
Laurent-Perrier | | | 1,367 | | | | 148,762 | |
Le Belier | | | 299 | | | | 10,367 | |
Lectra | | | 8,150 | | | | 169,711 | |
Linedata Services | | | 1,090 | | | | 39,339 | |
LISI | | | 8,732 | | | | 204,919 | |
LNA Sante S.A. | | | 1,488 | | | | 74,126 | |
Maisons du Monde S.A. | | | 6,434 | | | | 123,261 | |
Maisons France Confort S.A. | | | 1,526 | | | | 55,977 | |
|
| France—(Continued) | |
Manitou BF S.A. | | | 3,893 | | | | 99,692 | |
Manutan International | | | 589 | | | | 42,508 | |
Mersen S.A. | | | 8,483 | | | | 226,854 | |
METabolic EXplorer S.A. (a) | | | 6,035 | | | | 11,097 | |
Metropole Television S.A. | | | 8,342 | | | | 133,913 | |
Mr. Bricolage | | | 601 | | | | 5,147 | |
Neopost S.A. | | | 12,528 | | | | 342,096 | |
Nexans S.A. (e) | | | 10,974 | | | | 303,844 | |
Nexity S.A. | | | 12,502 | | | | 564,313 | |
Nicox (a) (e) | | | 1,834 | | | | 10,553 | |
NRJ Group | | | 9,690 | | | | 82,443 | |
Oeneo S.A. | | | 7,998 | | | | 79,913 | |
Onxeo S.A. (a) | | | 8,671 | | | | 8,670 | |
Onxeo S.A. (a) | | | 4,566 | | | | 4,494 | |
Parrot S.A. (a) | | | 2,647 | | | | 9,678 | |
Pierre & Vacances S.A. (a) | | | 2,596 | | | | 47,382 | |
Plastivaloire | | | 1,576 | | | | 15,941 | |
PSB Industries S.A. | | | 234 | | | | 8,150 | |
Rallye S.A. (e) | | | 9,791 | | | | 100,866 | |
Recylex S.A. (a) (e) | | | 3,335 | | | | 21,317 | |
Rexel S.A. | | | 88,036 | | | | 938,697 | |
Robertet S.A. | | | 66 | | | | 39,775 | |
Rothschild & Co. | | | 2,555 | | | | 90,112 | |
Rubis SCA | | | 25,894 | | | | 1,384,770 | |
Samse S.A. | | | 107 | | | | 16,058 | |
Savencia S.A. | | | 2,303 | | | | 147,166 | |
Seche Environnement S.A. | | | 1,555 | | | | 47,375 | |
SES-imagotag S.A. (a) | | | 1,019 | | | | 21,222 | |
Societe BIC S.A. | | | 8,476 | | | | 863,491 | |
Societe des Bains de Mer et du Cercle des Etrangers a Monaco (a) | | | 16 | | | | 805 | |
Societe Marseillaise du Tunnel Prado-Carenage S.A. | | | 293 | | | | 5,867 | |
Societe pour l’Informatique Industrielle | | | 1,546 | | | | 36,524 | |
Societe Television Francaise 1 | | | 21,284 | | | | 171,732 | |
Soitec (a) (e) | | | 5,935 | | | | 342,843 | |
Solocal Group (a) (e) | | | 161,345 | | | | 92,581 | |
Somfy S.A. | | | 2,325 | | | | 167,836 | |
Sopra Steria Group | | | 5,161 | | | | 473,784 | |
SPIE S.A. | | | 28,473 | | | | 375,566 | |
STEF S.A. | | | 1,145 | | | | 101,033 | |
Sword Group | | | 2,775 | | | | 92,129 | |
Synergie S.A. | | | 3,366 | | | | 94,357 | |
Tarkett S.A. | | | 6,546 | | | | 130,820 | |
Technicolor S.A. (a) (e) | | | 88,305 | | | | 95,876 | |
Tessi S.A. (a) (e) | | | 678 | | | | 89,945 | |
TFF Group | | | 620 | | | | 24,823 | |
Thermador Groupe | | | 2,162 | | | | 109,958 | |
Total Gabon | | | 324 | | | | 46,370 | |
Touax S.A. (a) | | | 1,706 | | | | 9,544 | |
Trigano S.A. | | | 3,132 | | | | 287,690 | |
Union Financiere de France BQE S.A. | | | 1,257 | | | | 29,437 | |
Vallourec S.A. (a) (e) | | | 67,733 | | | | 125,259 | |
Valneva SE (a) | | | 5,612 | | | | 20,396 | |
Vetoquinol S.A. | | | 1,341 | | | | 77,922 | |
Vicat S.A. | | | 5,373 | | | | 255,244 | |
VIEL & Cie S.A. | | | 4,205 | | | | 20,201 | |
Vilmorin & Cie S.A. | | | 2,414 | | | | 156,307 | |
Virbac S.A. (a) | | | 500 | | | | 65,226 | |
See accompanying notes to financial statements.
BHFTII-11
Brighthouse Funds Trust II
Brighthouse/Dimensional International Small Company Portfolio
Schedule of Investments as of December 31, 2018
Common Stocks—(Continued)
| | | | | | | | |
| Security Description | | Shares | | | Value | |
|
| France—(Continued) | |
Vranken-Pommery Monopole S.A. | | | 958 | | | $ | 26,013 | |
| | | | | | | | |
| | | | | | | 22,398,147 | |
| | | | | | | | |
|
| Georgia—0.0% | |
Bank of Georgia Group plc | | | 8,425 | | | | 147,416 | |
| | | | | | | | |
|
| Germany—6.1% | |
7C Solarparken AG | | | 7,180 | | | | 20,902 | |
Aareal Bank AG | | | 26,928 | | | | 832,262 | |
Adler Modemaerkte AG | | | 2,828 | | | | 10,305 | |
ADLER Real Estate AG | | | 11,254 | | | | 168,185 | |
ADO Properties S.A. | | | 6,083 | | | | 318,052 | |
ADVA Optical Networking SE (a) | | | 13,833 | | | | 99,658 | |
AIXTRON SE (a) | | | 21,680 | | | | 208,261 | |
All for One Steeb AG | | | 498 | | | | 27,484 | |
Allgeier SE | | | 2,942 | | | | 85,200 | |
Amadeus Fire AG | | | 1,986 | | | | 185,182 | |
Atoss Software AG | | | 298 | | | | 26,833 | |
Aurubis AG | | | 14,317 | | | | 708,961 | |
Basler AG | | | 420 | | | | 59,735 | |
Bauer AG | | | 4,696 | | | | 65,479 | |
BayWa AG | | | 5,731 | | | | 135,099 | |
BayWa AG | | | 305 | | | | 9,368 | |
Bechtle AG | | | 10,952 | | | | 851,446 | |
Bertrandt AG | | | 1,677 | | | | 131,562 | |
bet-at-home.com AG | | | 1,045 | | | | 54,727 | |
Bijou Brigitte AG | | | 1,603 | | | | 61,456 | |
Bilfinger SE | | | 10,033 | | | | 292,463 | |
Borussia Dortmund GmbH & Co. KGaA (Xetra Exchange) | | | 26,420 | | | | 240,702 | |
CANCOM SE | | | 13,574 | | | | 445,716 | |
Carl Zeiss Meditec AG | | | 7,610 | | | | 595,501 | |
CECONOMY AG | | | 18,151 | | | | 65,313 | |
CENIT AG | | | 3,413 | | | | 52,032 | |
CENTROTEC Sustainable AG | | | 1,930 | | | | 25,314 | |
Cewe Stiftung & Co. KGaA | | | 2,303 | | | | 163,690 | |
Comdirect Bank AG | | | 13,399 | | | | 157,261 | |
CompuGroup Medical SE | | | 7,545 | | | | 349,289 | |
Corestate Capital Holding S.A. | | | 2,276 | | | | 79,043 | |
CropEnergies AG | | | 9,235 | | | | 47,884 | |
CTS Eventim AG & Co. KGaA | | | 18,055 | | | | 673,792 | |
Data Modul AG | | | 138 | | | | 8,801 | |
DEAG Deutsche Entertainment AG (a) | | | 3,066 | | | | 10,932 | |
Delticom AG | | | 1,562 | | | | 12,823 | |
Deutsche Beteiligungs AG | | | 3,778 | | | | 145,354 | |
Deutsche Euroshop AG | | | 11,450 | | | | 332,733 | |
Deutsche Pfandbriefbank AG | | | 35,103 | | | | 351,492 | |
Deutz AG | | | 35,346 | | | | 208,232 | |
DIC Asset AG | | | 16,078 | | | | 167,071 | |
Diebold Nixdorf, Inc. | | | 575 | | | | 37,768 | |
DMG Mori AG | | | 8,384 | | | | 414,084 | |
Dr. Hoenle AG | | | 2,084 | | | | 103,415 | |
Draegerwerk AG & Co. KGaA | | | 1,062 | | | | 50,106 | |
Duerr AG | | | 15,350 | | | | 536,705 | |
Eckert & Ziegler AG | | | 1,547 | | | | 109,045 | |
Elmos Semiconductor AG | | | 5,394 | | | | 119,304 | |
ElringKlinger AG | | | 11,206 | | | | 87,326 | |
|
| Germany—(Continued) | |
Energiekontor AG | | | 2,559 | | | | 39,236 | |
Euromicron AG (a) | | | 2,048 | | | | 6,146 | |
Evotec AG (a) | | | 12,499 | | | | 248,683 | |
Fielmann AG | | | 7,053 | | | | 435,841 | |
First Sensor AG | | | 2,173 | | | | 52,928 | |
FORTEC Elektronik AG | | | 253 | | | | 5,533 | |
Francotyp-Postalia Holding AG | | | 3,300 | | | | 11,345 | |
Freenet AG | | | 49,368 | | | | 957,472 | |
FUCHS Petrolub SE | | | 843 | | | | 33,916 | |
GEA Group AG | | | 21,769 | | | | 561,361 | |
Gerresheimer AG | | | 9,821 | | | | 644,261 | |
Gerry Weber International AG (a) | | | 9,842 | | | | 25,880 | |
Gesco AG | | | 4,563 | | | | 113,720 | |
GFT Technologies SE | | | 5,932 | | | | 45,469 | |
Grand City Properties S.A. | | | 24,894 | | | | 539,866 | |
GRENKE AG | | | 3,342 | | | | 283,809 | |
H&R GmbH & Co. KGaA | | | 4,195 | | | | 29,270 | |
Hamburger Hafen und Logistik AG | | | 8,624 | | | | 171,093 | |
Hawesko Holding AG | | | 223 | | | | 10,507 | |
Heidelberger Druckmaschinen AG (a) | | | 100,140 | | | | 182,199 | |
Hella GmbH & Co. KGaA | | | 7,065 | | | | 281,515 | |
HolidayCheck Group AG (a) | | | 7,854 | | | | 23,851 | |
Hornbach Baumarkt AG | | | 2,209 | | | | 43,100 | |
Hornbach Holding AG & Co. KGaA | | | 1,005 | | | | 47,438 | |
Hugo Boss AG | | | 19,362 | | | | 1,194,134 | |
Indus Holding AG | | | 9,327 | | | | 416,349 | |
Isra Vision AG | | | 7,065 | | | | 196,580 | |
IVU Traffic Technologies AG | | | 2,608 | | | | 15,166 | |
Jenoptik AG | | | 15,954 | | | | 416,435 | |
K&S AG | | | 59,335 | | | | 1,068,689 | |
Kloeckner & Co. SE | | | 34,891 | | | | 242,156 | |
Koenig & Bauer AG | | | 4,373 | | | | 182,873 | |
Krones AG | | | 5,091 | | | | 393,321 | |
KSB SE & Co. KGaA | | | 82 | | | | 26,081 | |
KWS Saat SE | | | 745 | | | | 221,922 | |
LANXESS AG | | | 18,190 | | | | 837,826 | |
Leifheit AG | | | 2,365 | | | | 48,052 | |
Leoni AG | | | 12,471 | | | | 432,218 | |
LPKF Laser & Electronics AG (a) | | | 4,316 | | | | 27,374 | |
Manz AG (a) | | | 1,272 | | | | 30,206 | |
Medigene AG (a) | | | 2,446 | | | | 20,676 | |
METRO AG | | | 3,955 | | | | 60,810 | |
MLP SE | | | 20,985 | | | | 106,120 | |
Nemetschek SE | | | 6,355 | | | | 697,552 | |
Nexus AG | | | 4,977 | | | | 140,134 | |
Nordex SE (a) | | | 23,261 | | | | 202,090 | |
Norma Group SE | | | 10,781 | | | | 533,119 | |
OHB SE | | | 2,315 | | | | 81,847 | |
OSRAM Licht AG | | | 14,845 | | | | 644,515 | |
Paragon GmbH & Co. KGaA | | | 357 | | | | 7,216 | |
Patrizia Immobilien AG | | | 19,307 | | | | 368,858 | |
Pfeiffer Vacuum Technology AG | | | 2,551 | | | | 317,510 | |
PNE Wind AG | | | 24,548 | | | | 68,381 | |
Progress-Werk Oberkirch AG | | | 822 | | | | 23,142 | |
ProSiebenSat.1 Media SE | | | 37,061 | | | | 659,160 | |
PSI Software AG | | | 3,465 | | | | 62,232 | |
QSC AG | | | 26,632 | | | | 38,600 | |
See accompanying notes to financial statements.
BHFTII-12
Brighthouse Funds Trust II
Brighthouse/Dimensional International Small Company Portfolio
Schedule of Investments as of December 31, 2018
Common Stocks—(Continued)
| | | | | | | | |
| Security Description | | Shares | | | Value | |
|
| Germany—(Continued) | |
R Stahl AG (a) | | | 1,594 | | | $ | 39,078 | |
Rational AG | | | 390 | | | | 221,549 | |
Rheinmetall AG | | | 12,940 | | | | 1,142,636 | |
Rhoen Klinikum AG | | | 15,358 | | | | 387,180 | |
RIB Software SE | | | 8,127 | | | | 110,041 | |
Rocket Internet SE (a) | | | 19,109 | | | | 441,175 | |
SAF-Holland S.A. | | | 22,056 | | | | 283,204 | |
Salzgitter AG | | | 12,083 | | | | 353,982 | |
Schaltbau Holding AG (a) | | | 2,019 | | | | 46,797 | |
Scout24 AG | | | 24,700 | | | | 1,136,821 | |
Secunet Security Networks AG | | | 391 | | | | 39,554 | |
SGL Carbon SE (a) | | | 8,945 | | | | 62,418 | |
SHW AG | | | 2,013 | | | | 45,688 | |
Siltronic AG | | | 5,196 | | | | 429,752 | |
Sixt SE | | | 4,968 | | | | 393,314 | |
SMA Solar Technology AG | | | 3,992 | | | | 75,845 | |
SMT Scharf AG (a) | | | 831 | | | | 11,227 | |
Softing AG | | | 1,971 | | | | 14,670 | |
Software AG | | | 18,372 | | | | 664,858 | |
Stabilus S.A. | | | 6,982 | | | | 438,275 | |
STRATEC SE | | | 1,395 | | | | 80,672 | |
Stroeer SE & Co. KGaA | | | 8,897 | | | | 430,394 | |
Suedzucker AG | | | 26,310 | | | | 340,971 | |
Surteco SE | | | 2,209 | | | | 56,363 | |
Suss Microtec AG (a) | | | 6,216 | | | | 62,026 | |
TAG Immobilien AG | | | 39,448 | | | | 900,489 | |
Takkt AG | | | 11,656 | | | | 181,484 | |
Technotrans AG | | | 2,427 | | | | 68,094 | |
Tele Columbus AG (a) | | | 1,323 | | | | 4,393 | |
TLG Immobilien AG | | | 20,277 | | | | 563,107 | |
Tom Tailor Holding SE (a) | | | 8,518 | | | | 21,538 | |
Traffic Systems SE | | | 1,794 | | | | 29,191 | |
VERBIO Vereinigte BioEnergie AG | | | 6,369 | | | | 48,586 | |
Vossloh AG | | | 4,712 | | | | 229,063 | |
Wacker Chemie AG | | | 2,569 | | | | 232,818 | |
Wacker Neuson SE | | | 10,071 | | | | 190,299 | |
Washtec AG | | | 4,180 | | | | 288,956 | |
Wuestenrot & Wuerttembergische AG | | | 2,323 | | | | 42,507 | |
XING SE | | | 988 | | | | 270,618 | |
Zeal Network SE | | | 1,934 | | | | 46,210 | |
| | | | | | | | |
| | | | | | | 34,944,974 | |
| | | | | | | | |
|
| Ghana—0.2% | |
Tullow Oil plc (a) | | | 457,293 | | | | 1,040,565 | |
| | | | | | | | |
|
| Greenland—0.0% | |
Gronlandsbanken A/S | | | 17 | | | | 1,425 | |
| | | | | | | | |
|
| Guernsey, Channel Islands—0.0% | |
Raven Russia, Ltd. (a) | | | 95,022 | | | | 60,422 | |
| | | | | | | | |
|
| Hong Kong—2.9% | |
Aeon Credit Service Asia Co., Ltd. | | | 14,000 | | | | 12,424 | |
Agritrade Resources, Ltd. | | | 630,000 | | | | 108,743 | |
Alco Holdings, Ltd. | | | 136,000 | | | | 15,805 | |
Allied Group, Ltd. | | | 22,000 | | | | 124,883 | |
|
| Hong Kong—(Continued) | |
Allied Properties HK, Ltd. | | | 944,024 | | | | 203,170 | |
APAC Resources, Ltd. | | | 47,217 | | | | 6,288 | |
Applied Development Holdings, Ltd. (a) | | | 390,000 | | | | 24,723 | |
Arts Optical International Holdings, Ltd. | | | 16,000 | | | | 3,576 | |
Asia Financial Holdings, Ltd. | | | 254,000 | | | | 136,143 | |
Asia Standard International Group, Ltd. | | | 296,000 | | | | 51,294 | |
Associated International Hotels, Ltd. | | | 14,000 | | | | 38,976 | |
Auto Italia Holdings (a) | | | 175,000 | | | | 1,252 | |
Ban Loong Holdings, Ltd. (a) | | | 438,000 | | | | 10,012 | |
Bel Global Resources Holdings, Ltd. (a) (b) (c) | | | 520,000 | | | | 0 | |
Best Food Holding Co., Ltd. | | | 112,000 | | | | 16,860 | |
Bison Finance Group, Ltd. (a) | | | 74,000 | | | | 10,846 | |
Bonjour Holdings, Ltd. (a) | | | 615,000 | | | | 16,074 | |
Bossini International Holdings, Ltd. | | | 302,000 | | | | 10,579 | |
Bright Smart Securities & Commodities Group, Ltd. | | | 176,000 | | | | 33,857 | |
Brightoil Petroleum Holdings, Ltd. (a) (b) (d) | | | 591,000 | | | | 113,211 | |
Brockman Mining, Ltd. (a) | | | 2,516,770 | | | | 48,532 | |
Burwill Holdings, Ltd. (a) | | | 1,566,000 | | | | 28,150 | |
Cafe de Coral Holdings, Ltd. | | | 116,000 | | | | 280,675 | |
Camsing International Holding, Ltd. | | | 124,000 | | | | 141,200 | |
Cash Financial Services Group, Ltd. (a) | | | 288,000 | | | | 2,010 | |
Century City International Holdings, Ltd. | | | 616,000 | | | | 55,921 | |
Chen Hsong Holdings | | | 150,000 | | | | 48,608 | |
Cheuk Nang Holdings, Ltd. | | | 95,574 | | | | 52,483 | |
Chevalier International Holdings, Ltd. | | | 75,139 | | | | 105,677 | |
China Baoli Technologies Holdings, Ltd. (a) | | | 285,000 | | | | 8,906 | |
China Energy Development Holdings, Ltd. (a) | | | 3,670,000 | | | | 43,690 | |
China Flavors & Fragrances Co., Ltd. | | | 71,446 | | | | 24,270 | |
China Goldjoy Group, Ltd. | | | 1,368,000 | | | | 83,439 | |
China LNG Group, Ltd. (a) | | | 184,000 | | | | 27,918 | |
China Medical & HealthCare Group, Ltd. (a) | | | 400,000 | | | | 10,089 | |
China Motor Bus Co., Ltd. | | | 1,200 | | | | 14,571 | |
China Soft Power Technology Holdings, Ltd. (a) | | | 48,435 | | | | 265 | |
China Solar Energy Holdings, Ltd. (a) (b) (c) | | | 162,000 | | | | 698 | |
China Star Entertainment, Ltd. (a) | | | 378,000 | | | | 41,328 | |
China Strategic Holdings, Ltd. (a) | | | 3,402,500 | | | | 22,087 | |
China Ting Group Holdings, Ltd. (a) | | | 318,550 | | | | 14,659 | |
China Tonghai International Financial, Ltd. (a) | | | 180,000 | | | | 15,136 | |
Chinese Estates Holdings, Ltd. | | | 68,000 | | | | 73,504 | |
Chinney Investment, Ltd. | | | 8,000 | | | | 2,605 | |
Chow Sang Sang Holdings International, Ltd. | | | 119,000 | | | | 175,653 | |
Chuang’s China Investments, Ltd. | | | 511,500 | | | | 31,624 | |
Chuang’s Consortium International, Ltd. | | | 382,357 | | | | 75,467 | |
CK Life Sciences International Holdings, Inc. | | | 1,594,000 | | | | 74,040 | |
CNT Group, Ltd. | | | 246,000 | | | | 8,482 | |
Common Splendor International Health Industry Group, Ltd. (a) | | | 518,000 | | | | 42,365 | |
Continental Holdings, Ltd. | | | 220,000 | | | | 2,781 | |
Convoy Global Holdings, Ltd. (a) (b) (c) (d) | | | 1,314,000 | | | | 5,252 | |
Cosmopolitan International Holdings, Ltd. (a) | | | 194,000 | | | | 37,640 | |
Cowell e Holdings, Inc. | | | 120,000 | | | | 13,982 | |
CP Lotus Corp. (a) | | | 1,750,000 | | | | 15,644 | |
Crocodile Garments | | | 216,000 | | | | 18,728 | |
Cross-Harbour Holdings, Ltd. (The) | | | 127,063 | | | | 188,842 | |
CSI Properties, Ltd. | | | 2,574,023 | | | | 102,047 | |
CST Group, Ltd. (a) | | | 8,984,000 | | | | 26,342 | |
Dah Sing Banking Group, Ltd. | | | 172,671 | | | | 304,915 | |
Dah Sing Financial Holdings, Ltd. | | | 66,260 | | | | 326,588 | |
See accompanying notes to financial statements.
BHFTII-13
Brighthouse Funds Trust II
Brighthouse/Dimensional International Small Company Portfolio
Schedule of Investments as of December 31, 2018
Common Stocks—(Continued)
| | | | | | | | |
| Security Description | | Shares | | | Value | |
|
| Hong Kong—(Continued) | |
Dan Form Holdings Co., Ltd. | | | 88,000 | | | $ | 38,599 | |
Dickson Concepts International, Ltd. | | | 131,000 | | | | 63,897 | |
Digital Domain Holdings, Ltd. (a) | | | 2,520,000 | | | | 33,179 | |
Dingyi Group Investment, Ltd. (a) | | | 185,000 | | | | 13,679 | |
DMX Technologies Group, Ltd. (a) (b) (c) | | | 186,000 | | | | 0 | |
Dynamic Holdings, Ltd. | | | 20,000 | | | | 19,219 | |
Eagle Nice International Holdings, Ltd. | | | 120,000 | | | | 42,796 | |
EcoGreen International Group, Ltd. | | | 118,800 | | | | 23,857 | |
eForce Holdings, Ltd. (a) | | | 128,000 | | | | 1,755 | |
Elegance Optical International Holdings, Ltd. (a) | | | 96,000 | | | | 4,653 | |
Emperor Capital Group, Ltd. | | | 726,000 | | | | 32,821 | |
Emperor Entertainment Hotel, Ltd. | | | 235,000 | | | | 44,304 | |
Emperor International Holdings, Ltd. | | | 529,250 | | | | 124,788 | |
Emperor Watch & Jewellery, Ltd. | | | 1,520,000 | | | | 44,590 | |
Enerchina Holdings, Ltd. | | | 1,068,000 | | | | 66,934 | |
ENM Holdings, Ltd. (a) | | | 556,000 | | | | 49,997 | |
Esprit Holdings, Ltd. (a) | | | 833,950 | | | | 165,567 | |
Fairwood Holdings, Ltd. | | | 26,500 | | | | 88,711 | |
Far East Consortium International, Ltd. | | | 535,269 | | | | 235,987 | |
Far East Holdings International, Ltd. (a) | | | 150,000 | | | | 7,455 | |
First Pacific Co., Ltd. | | | 288,000 | | | | 111,142 | |
Freeman FinTech Corp., Ltd. (a) | | | 180,000 | | | | 8,440 | |
Future Bright Holdings, Ltd. | | | 156,000 | | | | 16,228 | |
Future World Financial Holdings, Ltd. (a) | | | 12,575 | | | | 83 | |
G-Resources Group, Ltd. (a) | | | 10,474,800 | | | | 65,112 | |
Get Nice Holdings, Ltd. | | | 2,574,000 | | | | 82,192 | |
Giordano International, Ltd. | | | 482,000 | | | | 227,889 | |
Global Brands Group Holding, Ltd. (a) (e) | | | 1,260,000 | | | | 56,804 | |
Glorious Sun Enterprises, Ltd. | | | 393,000 | | | | 43,615 | |
Gold Peak Industries Holdings, Ltd. | | | 277,714 | | | | 26,954 | |
Gold-Finance Holdings, Ltd. (a) (b) | | | 214,000 | | | | 11,779 | |
Golden Resources Development International, Ltd. | | | 370,000 | | | | 23,664 | |
Good Resources Holdings, Ltd. (a) | | | 420,000 | | | | 10,460 | |
GR Properties, Ltd. (a) | | | 150,000 | | | | 16,642 | |
Great Eagle Holdings, Ltd. | | | 39,571 | | | | 169,055 | |
Greentech Technology International, Ltd. (a) | | | 360,000 | | | | 3,589 | |
Guoan International, Ltd. (a) | | | 674,000 | | | | 14,990 | |
Haitong International Securities Group, Ltd. | | | 513,562 | | | | 161,730 | |
Hang Lung Group, Ltd. | | | 36,000 | | | | 91,462 | |
Hanison Construction Holdings, Ltd. | | | 148,009 | | | | 26,401 | |
Hao Tian Development Group, Ltd. (a) | | | 1,001,000 | | | | 26,456 | |
Harbour Centre Development, Ltd. | | | 88,000 | | | | 159,356 | |
HKBN, Ltd. | | | 203,500 | | | | 308,063 | |
HKR International, Ltd. | | | 366,080 | | | | 171,898 | |
Hon Kwok Land Investment Co., Ltd. | | | 140,000 | | | | 64,779 | |
Hong Kong Ferry Holdings Co., Ltd. | | | 22,000 | | | | 22,637 | |
Hong Kong Finance Investment Holding Group, Ltd. (c) | | | 262,000 | | | | 32,121 | |
Hong Kong International Construction Investment Management Group Co., Ltd. | | | 98,000 | | | | 30,194 | |
Hong Kong Television Network, Ltd. (a) | | | 165,000 | | | | 58,868 | |
Hongkong & Shanghai Hotels (The) | | | 109,500 | | | | 154,927 | |
Hongkong Chinese, Ltd. | | | 866,000 | | | | 99,360 | |
Hopewell Holdings, Ltd. (b) | | | 81,500 | | | | 358,317 | |
Hsin Chong Group Holdings, Ltd. (a) (b) (d) | | | 918,000 | | | | 7,691 | |
Huarong Investment Stock Corp., Ltd. (a) | | | 175,000 | | | | 8,282 | |
Hung Hing Printing Group, Ltd. | | | 252,000 | | | | 36,049 | |
Hutchison Telecommunications Hong Kong Holdings, Ltd. | | | 526,000 | | | | 195,772 | |
|
| Hong Kong—(Continued) | |
Imagi International Holdings, Ltd. (a) | | | 90,112 | | | | 18,331 | |
International Housewares Retail Co., Ltd. | | | 57,000 | | | | 13,366 | |
IPE Group, Ltd. (d) | | | 285,000 | | | | 36,760 | |
IRC, Ltd. (a) | | | 760,000 | | | | 4,541 | |
IT, Ltd. | | | 220,000 | | | | 115,484 | |
ITC Properties Group, Ltd. | | | 172,615 | | | | 47,099 | |
Jacobson Pharma Corp., Ltd. | | | 44,000 | | | | 9,639 | |
Johnson Electric Holdings, Ltd. | | | 106,875 | | | | 217,108 | |
Kader Holdings Co., Ltd. | | | 224,000 | | | | 23,743 | |
Kam Hing International Holdings, Ltd. | | | 196,000 | | | | 15,268 | |
Karrie International Holdings, Ltd. | | | 140,000 | | | | 18,787 | |
Keck Seng Investments | | | 72,000 | | | | 45,297 | |
Kerry Logistics Network, Ltd. | | | 107,000 | | | | 158,352 | |
Kin Yat Holdings, Ltd. | | | 46,000 | | | | 7,565 | |
Kingmaker Footwear Holdings, Ltd. | | | 102,000 | | | | 21,440 | |
Kingston Financial Group, Ltd. | | | 162,000 | | | | 38,326 | |
Kowloon Development Co., Ltd. | | | 159,000 | | | | 166,997 | |
Kwan On Holdings, Ltd. (a) | | | 50,000 | | | | 3,173 | |
Lai Sun Development Co., Ltd. | | | 109,413 | | | | 177,742 | |
Lai Sun Garment International, Ltd. | | | 99,760 | | | | 141,826 | |
Lam Soon Hong Kong, Ltd. | | | 15,000 | | | | 26,818 | |
Landing International Development, Ltd. (a) | | | 200,400 | | | | 62,819 | |
Landsea Green Group Co., Ltd. (a) | | | 268,000 | | | | 32,327 | |
Langham Hospitality Investments and Langham Hospitality Investments, Ltd. | | | 60,500 | | | | 22,366 | |
Li & Fung, Ltd. | | | 906,000 | | | | 142,636 | |
Lifestyle International Holdings, Ltd. | | | 181,500 | | | | 273,688 | |
Lippo China Resources, Ltd. | | | 2,106,000 | | | | 42,620 | |
Lippo, Ltd. | | | 122,000 | | | | 40,820 | |
Liu Chong Hing Investment, Ltd. | | | 86,000 | | | | 133,313 | |
LT Commercial Real Estate, Ltd. (a) | | | 18,000 | | | | 14,096 | |
Luk Fook Holdings International, Ltd. | | | 135,000 | | | | 385,436 | |
Luks Group Vietnam Holdings Co., Ltd. | | | 68,000 | | | | 16,960 | |
Lung Kee Bermuda Holdings | | | 90,000 | | | | 39,470 | |
Magnificent Hotel Investment, Ltd. | | | 1,310,000 | | | | 28,942 | |
Man Wah Holdings, Ltd. | | | 382,400 | | | | 153,186 | |
Mandarin Oriental International, Ltd. | | | 40,000 | | | | 81,300 | |
Mason Group Holdings, Ltd. (a) | | | 5,445,000 | | | | 88,669 | |
Matrix Holdings, Ltd. (d) | | | 36,000 | | | | 11,999 | |
Meilleure Health International Industry Group, Ltd. (a) | | | 288,000 | | | | 13,924 | |
Melco International Development, Ltd. | | | 121,000 | | | | 243,946 | |
Midland Holdings, Ltd. | | | 246,000 | | | | 46,906 | |
Ming Fai International Holdings, Ltd. | | | 145,000 | | | | 18,119 | |
Miramar Hotel & Investment | | | 19,000 | | | | 36,929 | |
Mongolian Mining Corp. (a) | | | 661,000 | | | | 13,310 | |
Nameson Holdings, Ltd. | | | 130,000 | | | | 10,587 | |
National Electronic Holdings, Ltd. | | | 182,600 | | | | 25,850 | |
New Century Group Hong Kong, Ltd. (a) | | | 912,000 | | | | 14,338 | |
New Times Energy Corp., Ltd. (a) | | | 459,450 | | | | 6,347 | |
Newocean Energy Holdings, Ltd. (a) | | | 398,000 | | | | 128,804 | |
Noble Century Investment Holdings, Ltd. (a) | | | 384,000 | | | | 34,416 | |
OP Financial, Ltd. | | | 240,000 | | | | 89,732 | |
Orange Sky Golden Harvest Entertainment Holdings, Ltd. | | | 375,882 | | | | 14,223 | |
Oriental Watch Holdings | | | 215,600 | | | | 55,935 | |
Pacific Andes International Holdings, Ltd. (a) (b) (d) | | | 1,819,984 | | | | 6,368 | |
Pacific Basin Shipping, Ltd. | | | 1,138,000 | | | | 217,003 | |
Pacific Textiles Holdings, Ltd. | | | 240,000 | | | | 213,121 | |
See accompanying notes to financial statements.
BHFTII-14
Brighthouse Funds Trust II
Brighthouse/Dimensional International Small Company Portfolio
Schedule of Investments as of December 31, 2018
Common Stocks—(Continued)
| | | | | | | | |
| Security Description | | Shares | | | Value | |
|
| Hong Kong—(Continued) | |
Paliburg Holdings, Ltd. | | | 208,000 | | | $ | 81,132 | |
Paradise Entertainment, Ltd. (a) | | | 168,000 | | | | 19,095 | |
PC Partner Group, Ltd. | | | 54,000 | | | | 12,027 | |
Perfect Shape Medical, Ltd. | | | 108,000 | | | | 29,134 | |
Pico Far East Holdings, Ltd. | | | 318,000 | | | | 114,691 | |
Playmates Holdings, Ltd. | | | 460,000 | | | | 59,929 | |
Playmates Toys, Ltd. | | | 236,000 | | | | 22,311 | |
Polytec Asset Holdings, Ltd. | | | 580,900 | | | | 50,247 | |
Public Financial Holdings, Ltd. | | | 166,000 | | | | 68,195 | |
PYI Corp., Ltd. (a) | | | 2,140,366 | | | | 31,098 | |
Rare Earth Magnesium Technology Group Holdings, Ltd. (a) | | | 500,000 | | | | 19,842 | |
Realord Group Holdings, Ltd. (a) | | | 116,000 | | | | 74,513 | |
Regal Hotels International Holdings, Ltd. | | | 126,000 | | | | 84,051 | |
Regina Miracle International Holdings, Ltd. | | | 25,000 | | | | 19,775 | |
Sa Sa International Holdings, Ltd. | | | 271,844 | | | | 101,956 | |
Samson Holding, Ltd. | | | 146,000 | | | | 10,059 | |
SAS Dragon Holdings, Ltd. | | | 140,000 | | | | 42,309 | |
SEA Holdings, Ltd. | | | 103,896 | | | | 116,581 | |
Shun Ho Property Investments, Ltd. | | | 21,615 | | | | 7,205 | |
Shun Tak Holdings, Ltd. | | | 659,500 | | | | 206,307 | |
Silver Base Group Holdings, Ltd. (a) | | | 474,000 | | | | 27,818 | |
Sincere Watch Hong Kong, Ltd. (a) | | | 250,000 | | | | 2,429 | |
Sing Tao News Corp., Ltd. | | | 276,000 | | | | 31,279 | |
Singamas Container Holdings, Ltd. | | | 724,000 | | | | 96,892 | |
SIS International Holdings | | | 16,000 | | | | 8,275 | |
Sitoy Group Holdings, Ltd. | | | 111,000 | | | | 25,638 | |
SmarTone Telecommunications Holdings, Ltd. | | | 142,388 | | | | 157,869 | |
SOCAM Development, Ltd. (a) | | | 41,987 | | | | 10,176 | |
Solartech International Holdings, Ltd. (a) | | | 660,000 | | | | 6,723 | |
Solomon Systech International, Ltd. (a) | | | 920,000 | | | | 23,424 | |
Soundwill Holdings, Ltd. | | | 41,500 | | | | 56,948 | |
South China Holdings Co., Ltd. (a) | | | 1,240,000 | | | | 30,404 | |
Stella International Holdings, Ltd. | | | 161,500 | | | | 191,936 | |
Success Universe Group, Ltd. (a) | | | 240,000 | | | | 7,540 | |
Summit Ascent Holdings, Ltd. (a) | | | 126,000 | | | | 15,937 | |
Sun Hing Vision Group Holdings, Ltd. | | | 42,000 | | | | 14,053 | |
Sun Hung Kai & Co., Ltd. | | | 270,440 | | | | 127,414 | |
SUNeVision Holdings, Ltd. | | | 24,000 | | | | 14,238 | |
Synergy Group Holdings International, Ltd. (a) | | | 112,000 | | | | 16,833 | |
TAI Cheung Holdings, Ltd. | | | 206,000 | | | | 201,125 | |
Tai United Holdings, Ltd. (e) | | | 200,000 | | | | 7,232 | |
Talent Property Group, Ltd. (a) | | | 420,000 | | | | 3,218 | |
Tan Chong International, Ltd. | | | 63,000 | | | | 18,907 | |
Tao Heung Holdings, Ltd. | | | 204,000 | | | | 34,076 | |
Television Broadcasts, Ltd. | | | 123,500 | | | | 232,901 | |
Texwinca Holdings, Ltd. | | | 300,000 | | | | 97,881 | |
TK Group Holdings, Ltd. | | | 62,000 | | | | 31,991 | |
Tom Group, Ltd. (a) | | | 118,000 | | | | 28,731 | |
Town Health International Medical Group, Ltd. (a) (b) (c) (d) | | | 230,000 | | | | 20,267 | |
Tradelink Electronic Commerce, Ltd. | | | 256,000 | | | | 37,872 | |
Transport International Holdings, Ltd. | | | 99,764 | | | | 274,831 | |
Trinity, Ltd. (a) | | | 466,000 | | | | 20,096 | |
TSC Group Holdings, Ltd. (a) | | | 216,000 | | | | 13,132 | |
Tsui Wah Holdings, Ltd. | | | 136,000 | | | | 12,630 | |
Union Medical Healthcare, Ltd. | | | 32,000 | | | | 20,476 | |
United Laboratories International Holdings, Ltd. (The) | | | 241,000 | | | | 128,256 | |
Universal Technologies Holdings, Ltd. (a) | | | 120,000 | | | | 3,984 | |
|
| Hong Kong—(Continued) | |
Up Energy Development Group, Ltd. (a) (b) (c) (d) | | | 92,000 | | | | 284 | |
Upbest Group, Ltd. | | | 16,000 | | | | 2,086 | |
Value Convergence Holdings, Ltd. (a) | | | 204,000 | | | | 12,980 | |
Value Partners Group, Ltd. | | | 206,000 | | | | 141,514 | |
Valuetronics Holdings, Ltd. | | | 89,790 | | | | 43,154 | |
Vedan International Holdings, Ltd. | | | 296,000 | | | | 26,461 | |
Victory City International Holdings, Ltd. | | | 839,449 | | | | 10,996 | |
Vitasoy International Holdings, Ltd. | | | 178,000 | | | | 675,264 | |
VPower Group International Holdings, Ltd. | | | 78,000 | | | | 32,269 | |
VSTECS Holdings, Ltd. | | | 307,200 | | | | 148,161 | |
VTech Holdings, Ltd. | | | 30,800 | | | | 254,606 | |
Wai Kee Holdings, Ltd. | | | 54,000 | | | | 27,160 | |
Wan Kei Group Holdings, Ltd. (a) | | | 75,000 | | | | 7,244 | |
Wang On Group, Ltd. | | | 1,200,000 | | | | 14,525 | |
We Solutions, Ltd. (a) (b) | | | 348,000 | | | | 22,056 | |
Win Hanverky Holdings, Ltd. | | | 332,000 | | | | 32,629 | |
Winfull Group Holdings, Ltd. | | | 528,000 | | | | 7,270 | |
Wing On Co. International, Ltd. | | | 46,000 | | | | 148,487 | |
Wing Tai Properties, Ltd. | | | 232,000 | | | | 159,561 | |
Wonderful Sky Financial Group Holdings, Ltd. (a) | | | 44,000 | | | | 5,607 | |
Yat Sing Holdings, Ltd. (a) | | | 410,000 | | | | 11,472 | |
Yeebo International Holdings, Ltd. | | | 158,000 | | | | 20,929 | |
YGM Trading, Ltd. | | | 46,000 | | | | 41,154 | |
YT Realty Group, Ltd. | | | 43,002 | | | | 13,729 | |
YTO Express Holdings, Ltd. | | | 18,000 | | | | 7,701 | |
Yugang International, Ltd. | | | 1,466,000 | | | | 29,301 | |
Yunfeng Financial Group, Ltd. (a) | | | 82,000 | | | | 48,646 | |
| | | | | | | | |
| | | | | | | 16,778,620 | |
| | | | | | | | |
|
| Ireland—0.4% | |
C&C Group plc | | | 95,793 | | | | 299,066 | |
Datalex plc | | | 4,783 | | | | 13,045 | |
FBD Holdings plc | | | 10,350 | | | | 97,691 | |
Glanbia plc | | | 33,226 | | | | 622,596 | |
Greencore Group plc (e) | | | 314,156 | | | | 712,672 | |
Hostelworld Group plc | | | 2,650 | | | | 6,782 | |
IFG Group plc (a) | | | 44,002 | | | | 72,701 | |
Independent News & Media plc (a) | | | 35,056 | | | | 2,395 | |
Irish Continental Group plc | | | 22,664 | | | | 109,652 | |
Kingspan Group plc | | | 3,636 | | | | 155,732 | |
Permanent TSB Group Holdings plc (a) | | | 6,751 | | | | 11,703 | |
Smurfit Kappa Group plc | | | 6,811 | | | | 180,875 | |
Tarsus Group plc | | | 6,437 | | | | 22,159 | |
UDG Healthcare plc | | | 22,358 | | | | 169,570 | |
| | | | | | | | |
| | | | | | | 2,476,639 | |
| | | | | | | | |
|
| Isle of Man—0.0% | |
Hansard Global plc | | | 2,566 | | | | 1,505 | |
Strix Group plc | | | 20,405 | | | | 36,626 | |
| | | | | | | | |
| | | | | | | 38,131 | |
| | | | | | | | |
|
| Israel—1.1% | |
Adgar Investment and Development, Ltd. | | | 7,358 | | | | 10,246 | |
ADO Group, Ltd. (a) | | | 3,904 | | | | 74,175 | |
Afcon Holdings, Ltd. | | | 699 | | | | 32,759 | |
See accompanying notes to financial statements.
BHFTII-15
Brighthouse Funds Trust II
Brighthouse/Dimensional International Small Company Portfolio
Schedule of Investments as of December 31, 2018
Common Stocks—(Continued)
| | | | | | | | |
| Security Description | | Shares | | | Value | |
|
| Israel—(Continued) | |
Africa Israel Properties, Ltd. (a) | | | 4,653 | | | $ | 104,454 | |
Africa Israel Residences, Ltd. | | | 880 | | | | 12,597 | |
Airport City, Ltd. (a) | | | 30,492 | | | | 374,660 | |
Allot Communications, Ltd. (a) | | | 10,216 | | | | 61,398 | |
Alony Hetz Properties & Investments, Ltd. | | | 8,335 | | | | 77,826 | |
Alrov Properties and Lodgings, Ltd. | | | 3,141 | | | | 95,188 | |
Amot Investments, Ltd. | | | 25,066 | | | | 121,659 | |
Arad, Ltd. | | | 1,152 | | | | 12,188 | |
Arko Holdings, Ltd. (a) | | | 99,131 | | | | 46,755 | |
Ashtrom Group, Ltd. | | | 3,487 | | | | 15,936 | |
Ashtrom Properties, Ltd. | | | 8,909 | | | | 36,771 | |
AudioCodes, Ltd. | | | 6,872 | | | | 68,229 | |
Avgol Industries 1953, Ltd. | | | 18,498 | | | | 18,719 | |
Azorim-Investment Development & Construction Co., Ltd. (a) | | | 23,712 | | | | 20,774 | |
Bayside Land Corp. | | | 205 | | | | 87,072 | |
Bet Shemesh Engines Holdings, Ltd. | | | 1,262 | | | | 29,000 | |
Big Shopping Centers, Ltd. | | | 1,031 | | | | 57,848 | |
BioLine RX, Ltd. (a) | | | 16,296 | | | | 7,233 | |
Blue Square Real Estate, Ltd. | | | 1,222 | | | | 38,447 | |
Brainsway, Ltd. (a) | | | 2,193 | | | | 12,608 | |
Camtek, Ltd. | | | 3,606 | | | | 24,219 | |
Cellcom Israel, Ltd. (a) | | | 13,058 | | | | 77,308 | |
Ceragon Networks, Ltd. (a) | | | 14,799 | | | | 55,940 | |
Clal Biotechnology Industries, Ltd. (a) | | | 17,579 | | | | 12,811 | |
Clal Insurance Enterprises Holdings, Ltd. (a) | | | 7,114 | | | | 100,422 | |
Cohen Development & Industrial Buildings, Ltd. | | | 305 | | | | 7,064 | |
Compugen, Ltd. (a) | | | 14,846 | | | | 33,726 | |
Danel Adir Yeoshua, Ltd. | | | 1,023 | | | | 49,802 | |
Delek Automotive Systems, Ltd. | | | 10,535 | | | | 41,498 | |
Delta-Galil Industries, Ltd. | | | 4,030 | | | | 99,760 | |
Dexia Israel Bank, Ltd. | | | 150 | | | | 27,223 | |
Direct Insurance Financial Investments, Ltd. | | | 4,805 | | | | 54,070 | |
Dor Alon Energy in Israel, Ltd. | | | 766 | | | | 10,615 | |
El Al Israel Airlines (a) | | | 77,291 | | | | 24,504 | |
Electra Consumer Products 1970, Ltd. | | | 1,236 | | | | 13,974 | |
Electra Real Estate, Ltd. (a) | | | 4,280 | | | | 12,424 | |
Electra, Ltd. | | | 652 | | | | 156,753 | |
Elron Electronic Industries, Ltd. (a) | | | 7,585 | | | | 16,880 | |
Energix-Renewable Energies, Ltd. (a) | | | 36,656 | | | | 46,808 | |
Enlight Renewable Energy, Ltd. (a) | | | 95,911 | | | | 45,243 | |
Evogene, Ltd. (a) | | | 5,090 | | | | 10,588 | |
First International Bank of Israel, Ltd. | | | 8,385 | | | | 175,703 | |
FMS Enterprises Migun, Ltd. | | | 910 | | | | 24,098 | |
Formula Systems 1985, Ltd. | | | 2,591 | | | | 96,527 | |
Fox Wizel, Ltd. | | | 2,272 | | | | 51,607 | |
Gilat Satellite Networks, Ltd. (a) | | | 7,707 | | | | 71,435 | |
Hadera Paper, Ltd. | | | 1,104 | | | | 77,705 | |
Hamlet Israel-Canada, Ltd. | | | 1,610 | | | | 28,465 | |
Harel Insurance Investments & Financial Services, Ltd. | | | 43,597 | | | | 285,601 | |
Hilan, Ltd. | | | 3,869 | | | | 90,906 | |
IDI Insurance Co., Ltd. | | | 1,637 | | | | 84,012 | |
Industrial Buildings Corp., Ltd. (a) | | | 39,465 | | | | 55,000 | |
Inrom Construction Industries, Ltd. | | | 12,422 | | | | 36,174 | |
Israel Canada T.R., Ltd. | | | 12,271 | | | | 8,281 | |
Israel Land Development Co., Ltd. (The) (a) | | | 3,950 | | | | 27,223 | |
Isras Investment Co., Ltd. | | | 310 | | | | 33,057 | |
Issta Lines, Ltd. | | | 550 | | | | 7,833 | |
|
| Israel—(Continued) | |
Jerusalem Oil Exploration (a) | | | 4,199 | | | | 237,128 | |
Kamada, Ltd. (a) | | | 11,729 | | | | 58,479 | |
Kerur Holdings, Ltd. (a) | | | 1,544 | | | | 37,922 | |
Klil Industries, Ltd. | | | 175 | | | | 10,890 | |
Maabarot Products, Ltd. | | | 3,435 | | | | 38,935 | |
Magic Software Enterprises, Ltd. | | | 9,462 | | | | 72,312 | |
Matrix IT, Ltd. | | | 10,787 | | | | 119,674 | |
Maytronics, Ltd. | | | 12,073 | | | | 69,064 | |
Mediterranean Towers, Ltd. | | | 731 | | | | 1,239 | |
Mega Or Holdings, Ltd. | | | 4,941 | | | | 51,761 | |
Meitav Dash Investments, Ltd. | | | 5,193 | | | | 13,901 | |
Melisron, Ltd. | | | 4,351 | | | | 181,604 | |
Menora Mivtachim Holdings, Ltd. | | | 11,310 | | | | 120,451 | |
Migdal Insurance & Financial Holding, Ltd. | | | 55,471 | | | | 47,106 | |
Mivtach Shamir Holdings, Ltd. | | | 1,401 | | | | 21,261 | |
Naphtha Israel Petroleum Corp., Ltd. (a) | | | 14,775 | | | | 94,429 | |
Nawi Brothers, Ltd. | | | 4,888 | | | | 24,779 | |
Neto ME Holdings, Ltd. (a) | | | 788 | | | | 65,179 | |
Nova Measuring Instruments, Ltd. (a) (d) | | | 8,789 | | | | 199,012 | |
NR Spuntech Industries, Ltd. | | | 3,848 | | | | 11,119 | |
Oil Refineries, Ltd. | | | 418,554 | | | | 199,771 | |
One Software Technologies, Ltd. | | | 555 | | | | 18,545 | |
OPC Energy, Ltd. | | | 3,627 | | | | 18,534 | |
Partner Communications Co., Ltd. (a) | | | 24,190 | | | | 118,499 | |
Paz Oil Co., Ltd. | | | 1,481 | | | | 223,524 | |
Perion Network, Ltd. (a) | | | 1,082 | | | | 2,737 | |
Phoenix Holdings, Ltd. (The) | | | 20,176 | | | | 102,230 | |
Plasson Industries, Ltd. | | | 1,729 | | | | 75,661 | |
Rami Levi Chain Stores Hashikma Marketing, Ltd. | | | 1,803 | | | | 92,639 | |
Redhill Biopharma, Ltd. (a) | | | 52,754 | | | | 29,017 | |
Scope Metals Group, Ltd. | | | 1,419 | | | | 34,850 | |
Shapir Engineering & Industry, Ltd. | | | 15,962 | | | | 49,220 | |
Shikun & Binui, Ltd. (a) | | | 73,332 | | | | 124,661 | |
Shufersal, Ltd. | | | 28,920 | | | | 189,445 | |
Summit Real Estate Holdings, Ltd. | | | 4,127 | | | | 34,030 | |
Suny Cellular Communication, Ltd. (a) | | | 16,495 | | | | 7,721 | |
Tadiran Holdings, Ltd. | | | 568 | | | | 12,123 | |
Union Bank of Israel (a) | | | 7,545 | | | | 30,258 | |
YH Dimri Construction & Development, Ltd. | | | 663 | | | | 8,898 | |
| | | | | | | | |
| | | | | | | 6,340,409 | |
| | | | | | | | |
|
| Italy—4.0% | |
A/S Roma S.p.A. (a) | | | 31,585 | | | | 17,800 | |
A2A S.p.A. | | | 481,411 | | | | 865,964 | |
ACEA S.p.A. | | | 23,394 | | | | 322,134 | |
Aeffe S.p.A. (a) | | | 11,359 | | | | 30,534 | |
Amplifon S.p.A. | | | 30,504 | | | | 493,982 | |
Anima Holding S.p.A. | | | 58,335 | | | | 215,385 | |
Ansaldo STS S.p.A. (a) | | | 17,665 | | | | 256,939 | |
Aquafil S.p.A. | | | 3,537 | | | | 36,401 | |
Arnoldo Mondadori Editore S.p.A. (a) | | | 63,913 | | | | 125,099 | |
Ascopiave S.p.A. | | | 28,294 | | | | 100,871 | |
Astaldi S.p.A. (a) (e) | | | 20,559 | | | | 12,208 | |
Autogrill S.p.A. | | | 41,121 | | | | 346,320 | |
Avio S.p.A. | | | 2,974 | | | | 37,999 | |
Azimut Holding S.p.A. (e) | | | 39,680 | | | | 434,799 | |
See accompanying notes to financial statements.
BHFTII-16
Brighthouse Funds Trust II
Brighthouse/Dimensional International Small Company Portfolio
Schedule of Investments as of December 31, 2018
Common Stocks—(Continued)
| | | | | | | | |
| Security Description | | Shares | | | Value | |
|
| Italy—(Continued) | |
B&C Speakers S.p.A. | | | 1,431 | | | $ | 17,383 | |
Banca Carige S.p.A. (a) | | | 156,432 | | | | 269 | |
Banca Farmafactoring S.p.A. | | | 23,945 | | | | 124,377 | |
Banca Finnat Euramerica S.p.A. | | | 50,851 | | | | 18,532 | |
Banca Generali S.p.A. | | | 18,858 | | | | 390,914 | |
Banca IFIS S.p.A. | | | 7,714 | | | | 135,998 | |
Banca Mediolanum S.p.A. | | | 51,915 | | | | 302,930 | |
Banca Popolare dell’Emilia Romagna SC (e) | | | 202,667 | | | | 781,569 | |
Banca Popolare di Sondrio Scarl | | | 173,614 | | | | 522,783 | |
Banca Profilo S.p.A. | | | 117,883 | | | | 24,025 | |
Banca Sistema S.p.A. | | | 9,271 | | | | 15,255 | |
Banco BPM S.p.A. (a) (e) | | | 390,373 | | | | 880,924 | |
Banco di Desio e della Brianza S.p.A. | | | 20,306 | | | | 40,195 | |
BasicNet S.p.A. | | | 7,658 | | | | 38,878 | |
BE | | | 29,207 | | | | 29,460 | |
Biesse S.p.A. | | | 6,021 | | | | 118,498 | |
Brembo S.p.A. | | | 45,165 | | | | 459,238 | |
Brunello Cucinelli S.p.A. | | | 8,151 | | | | 280,138 | |
Buzzi Unicem S.p.A. | | | 27,815 | | | | 479,035 | |
Cairo Communication S.p.A. | | | 24,474 | | | | 96,072 | |
Cementir Holding S.p.A. | | | 21,979 | | | | 129,473 | |
Cerved Group S.p.A. | | | 48,374 | | | | 396,674 | |
CIR-Compagnie Industriali Riunite S.p.A. | | | 157,057 | | | | 166,910 | |
Credito Emiliano S.p.A. | | | 35,381 | | | | 204,001 | |
Credito Valtellinese S.p.A. (a) | | | 2,927,424 | | | | 246,667 | |
d’Amico International Shipping S.A. (a) | | | 60,320 | | | | 8,500 | |
Danieli & C Officine Meccaniche S.p.A. | | | 4,846 | | | | 84,828 | |
Datalogic S.p.A. | | | 8,028 | | | | 188,017 | |
De’Longhi S.p.A. | | | 16,896 | | | | 427,902 | |
DeA Capital S.p.A. | | | 18,071 | | | | 25,876 | |
DiaSorin S.p.A. | | | 6,863 | | | | 556,068 | |
Digital Bros S.p.A. | | | 1,166 | | | | 5,623 | |
Emak S.p.A. | | | 16,360 | | | | 23,430 | |
Enav S.p.A. | | | 45,852 | | | | 222,879 | |
ERG S.p.A. | | | 21,603 | | | | 407,543 | |
Esprinet S.p.A. | | | 14,507 | | | | 58,744 | |
Eurotech S.p.A. (a) | | | 13,076 | | | | 48,433 | |
Falck Renewables S.p.A. | | | 34,815 | | | | 93,362 | |
Fila S.p.A. (e) | | | 4,557 | | | | 70,482 | |
Fincantieri S.p.A. (a) | | | 93,136 | | | | 98,121 | |
FinecoBank Banca Fineco S.p.A. | | | 46,546 | | | | 468,396 | |
FNM S.p.A. | | | 55,327 | | | | 31,448 | |
Geox S.p.A. (e) | | | 34,378 | | | | 46,163 | |
Gruppo Editoriale L’Espresso S.p.A. (a) (e) | | | 52,528 | | | | 20,849 | |
Gruppo MutuiOnline S.p.A. | | | 6,461 | | | | 117,228 | |
Hera S.p.A. | | | 231,619 | | | | 705,483 | |
IMMSI S.p.A. (a) | | | 100,436 | | | | 46,547 | |
Industria Macchine Automatiche S.p.A. | | | 5,461 | | | | 341,485 | |
Infrastrutture Wireless Italiane S.p.A. | | | 21,062 | | | | 143,982 | |
Intek Group S.p.A. (a) | | | 80,757 | | | | 28,696 | |
Interpump Group S.p.A. | | | 22,700 | | | | 674,945 | |
Iren S.p.A. | | | 231,134 | | | | 554,598 | |
Italgas S.p.A. | | | 119,302 | | | | 681,945 | |
Italmobiliare S.p.A. | | | 3,185 | | | | 66,954 | |
IVS Group S.A. | | | 1,749 | | | | 22,164 | |
Juventus Football Club S.p.A. (a) (e) | | | 147,435 | | | | 178,809 | |
La Doria S.p.A. | | | 3,877 | | | | 35,154 | |
|
| Italy—(Continued) | |
Leonardo S.p.A. | | | 39,767 | | | | 350,035 | |
Maire Tecnimont S.p.A. | | | 35,567 | | | | 131,402 | |
MARR S.p.A. | | | 13,428 | | | | 316,997 | |
Massimo Zanetti Beverage Group S.p.A. | | | 1,925 | | | | 12,673 | |
Mediaset S.p.A. (a) (e) | | | 192,042 | | | | 606,016 | |
Nice S.p.A. | | | 9,890 | | | | 39,555 | |
Openjobmetis S.p.A. agenzia per il lavoro (a) | | | 1,209 | | | | 11,076 | |
OVS S.p.A. (a) (e) | | | 23,352 | | | | 29,386 | |
Parmalat S.p.A. | | | 13,351 | | | | 43,599 | |
Piaggio & C S.p.A. | | | 71,430 | | | | 149,617 | |
Prima Industrie S.p.A. | | | 1,853 | | | | 36,532 | |
Prysmian S.p.A. | | | 4,104 | | | | 79,576 | |
RAI Way S.p.A. | | | 12,094 | | | | 60,024 | |
Reno de Medici S.p.A. | | | 46,743 | | | | 33,103 | |
Reply S.p.A. | | | 6,572 | | | | 332,483 | |
Retelit S.p.A. | | | 36,769 | | | | 57,417 | |
Rizzoli Corriere Della Sera Mediagroup S.p.A. (a) | | | 31,972 | | | | 42,223 | |
Sabaf S.p.A. | | | 3,059 | | | | 52,121 | |
SAES Getters S.p.A. | | | 1,416 | | | | 29,456 | |
Safilo Group S.p.A. (a) | | | 12,212 | | | | 9,797 | |
Saipem S.p.A. (a) | | | 186,651 | | | | 695,991 | |
Salini Impregilo S.p.A. (e) | | | 70,140 | | | | 113,831 | |
Salvatore Ferragamo S.p.A. | | | 16,352 | | | | 331,879 | |
Saras S.p.A. | | | 134,526 | | | | 260,168 | |
Servizi Italia S.p.A. | | | 1,701 | | | | 6,117 | |
Sesa S.p.A. | | | 1,672 | | | | 44,458 | |
Societa Cattolica di Assicurazioni SC | | | 61,974 | | | | 503,614 | |
Societa Iniziative Autostradali e Servizi S.p.A. | | | 25,981 | | | | 358,307 | |
Sogefi S.p.A. (a) | | | 24,822 | | | | 40,719 | |
SOL S.p.A. | | | 11,001 | | | | 137,070 | |
Tamburi Investment Partners S.p.A. | | | 25,760 | | | | 169,176 | |
Technogym S.p.A. | | | 15,679 | | | | 167,835 | |
Tiscali S.p.A. (a) (e) | | | 802,477 | | | | 12,936 | |
Tod’s S.p.A. | | | 3,954 | | | | 186,766 | |
Trevi Finanziaria Industriale S.p.A. (a) | | | 31,414 | | | | 10,836 | |
TXTe-solutions S.p.A. | | | 980 | | | | 9,197 | |
Uni Land S.p.A. (a) (b) (c) (d) | | | 4,937 | | | | 0 | |
Unieuro S.p.A. (a) | | | 902 | | | | 9,972 | |
Unione di Banche Italiane S.p.A. | | | 325,151 | | | | 941,308 | |
Unipol Gruppo Finanziario S.p.A. | | | 126,457 | | | | 509,950 | |
UnipolSai Assicurazioni S.p.A. | | | 127,672 | | | | 288,691 | |
Zignago Vetro S.p.A. | | | 11,476 | | | | 111,672 | |
| | | | | | | | |
| | | | | | | 23,014,868 | |
| | | | | | | | |
|
| Japan—24.3% | |
77 Bank, Ltd. (The) | | | 12,800 | | | | 220,643 | |
A&A Material Corp. | | | 1,200 | | | | 9,726 | |
A&D Co., Ltd. | | | 3,000 | | | | 17,665 | |
A/S One Corp. | | | 2,300 | | | | 158,378 | |
Abist Co., Ltd. | | | 600 | | | | 16,762 | |
Achilles Corp. | | | 6,500 | | | | 109,733 | |
Ad-sol Nissin Corp. | | | 900 | | | | 13,657 | |
Adastria Co., Ltd. | | | 9,240 | | | | 156,799 | |
ADEKA Corp. | | | 34,600 | | | | 500,052 | |
Adtec Plasma Technology Co., Ltd. | | | 600 | | | | 4,321 | |
Advan Co., Ltd. | | | 6,700 | | | | 55,698 | |
See accompanying notes to financial statements.
BHFTII-17
Brighthouse Funds Trust II
Brighthouse/Dimensional International Small Company Portfolio
Schedule of Investments as of December 31, 2018
Common Stocks—(Continued)
| | | | | | | | |
| Security Description | | Shares | | | Value | |
|
| Japan—(Continued) | |
Advance Create Co., Ltd. | | | 800 | | | $ | 12,470 | |
Advanex, Inc. | | | 900 | | | | 9,907 | |
Advantage Risk Management Co., Ltd. | | | 1,300 | | | | 10,437 | |
Adventure, Inc. | | | 600 | | | | 35,966 | |
Aeon Delight Co., Ltd. | | | 4,300 | | | | 142,940 | |
Aeon Fantasy Co., Ltd. | | | 2,400 | | | | 58,488 | |
Aeon Hokkaido Corp. | | | 2,600 | | | | 18,502 | |
Aeria, Inc. | | | 2,200 | | | | 9,411 | |
Agro-Kanesho Co., Ltd. | | | 1,600 | | | | 32,537 | |
Ahresty Corp. | | | 9,200 | | | | 52,416 | |
Ai Holdings Corp. (e) | | | 12,200 | | | | 214,042 | |
Aichi Bank, Ltd. (The) | | | 2,600 | | | | 88,960 | |
Aichi Corp. | | | 10,800 | | | | 57,240 | |
Aichi Steel Corp. | | | 4,300 | | | | 135,286 | |
Aichi Tokei Denki Co., Ltd. | | | 1,900 | | | | 66,499 | |
Aida Engineering, Ltd. | | | 20,700 | | | | 134,476 | |
Aiful Corp. (a) | | | 68,800 | | | | 163,853 | |
Aiphone Co., Ltd. | | | 4,600 | | | | 70,564 | |
Airport Facilities Co., Ltd. | | | 7,500 | | | | 35,090 | |
Aisan Industry Co., Ltd. | | | 10,400 | | | | 70,943 | |
AIT Corp. | | | 900 | | | | 7,514 | |
Aizawa Securities Co., Ltd. | | | 13,800 | | | | 83,982 | |
Akatsuki, Inc. | | | 500 | | | | 22,836 | |
Akebono Brake Industry Co., Ltd. (a) (e) | | | 32,600 | | | | 54,704 | |
Akita Bank, Ltd. (The) | | | 6,200 | | | | 122,921 | |
Albis Co., Ltd. | | | 800 | | | | 17,623 | |
Alconix Corp. | | | 6,400 | | | | 62,487 | |
Alinco, Inc. | | | 5,800 | | | | 50,304 | |
Allied Telesis Holdings KK (a) | | | 13,900 | | | | 10,865 | |
Alpen Co., Ltd. (e) | | | 7,000 | | | | 107,163 | |
Alpha Corp. | | | 2,200 | | | | 23,215 | |
Alpha Systems, Inc. | | | 3,140 | | | | 71,961 | |
Alpine Electronics, Inc. (a) (d) (e) | | | 16,600 | | | | 219,879 | |
Alps Logistics Co., Ltd. | | | 6,000 | | | | 45,959 | |
Altech Corp. | | | 5,200 | | | | 78,387 | |
Amano Corp. | | | 19,600 | | | | 376,155 | |
Amiyaki Tei Co., Ltd. | | | 1,100 | | | | 36,883 | |
Amuse, Inc. | | | 3,600 | | | | 77,155 | |
Anabuki Kosan, Inc. | | | 400 | | | | 10,021 | |
Anest Iwata Corp. | | | 10,400 | | | | 93,805 | |
Anicom Holdings, Inc. | | | 3,400 | | | | 112,601 | |
AOI Electronics Co., Ltd. | | | 1,100 | | | | 24,941 | |
AOI TYO Holdings, Inc. | | | 6,428 | | | | 45,928 | |
AOKI Holdings, Inc. | | | 15,900 | | | | 188,185 | |
Aomori Bank, Ltd. (The) | | | 6,900 | | | | 174,248 | |
Aoyama Trading Co., Ltd. | | | 14,500 | | | | 346,223 | |
Aoyama Zaisan Networks Co., Ltd. | | | 1,400 | | | | 15,968 | |
Apaman Co., Ltd. | | | 2,100 | | | | 13,415 | |
Arakawa Chemical Industries, Ltd. | | | 6,600 | | | | 78,583 | |
Arata Corp. | | | 4,200 | | | | 166,037 | |
Araya Industrial Co., Ltd. | | | 2,600 | | | | 35,798 | |
Arcland Sakamoto Co., Ltd. | | | 10,600 | | | | 129,354 | |
Arcland Service Holdings Co., Ltd. | | | 2,800 | | | | 55,230 | |
Arcs Co., Ltd. | | | 13,364 | | | | 299,493 | |
Ardepro Co., Ltd. (a) | | | 18,900 | | | | 7,331 | |
Arealink Co., Ltd. | | | 1,400 | | | | 14,731 | |
Argo Graphics, Inc. | | | 2,800 | | | | 96,630 | |
|
| Japan—(Continued) | |
Arisawa Manufacturing Co., Ltd. | | | 14,300 | | | | 94,980 | |
Arrk Corp. (a) | | | 22,600 | | | | 15,505 | |
Artnature, Inc. | | | 5,000 | | | | 29,118 | |
Asahi Broadcasting Corp. | | | 2,400 | | | | 15,763 | |
Asahi Co., Ltd. | | | 4,500 | | | | 56,632 | |
Asahi Diamond Industrial Co., Ltd. | | | 21,200 | | | | 116,989 | |
Asahi Holdings, Inc. | | | 9,000 | | | | 183,989 | |
Asahi Kogyosha Co., Ltd. | | | 1,700 | | | | 50,976 | |
Asahi Net, Inc. | | | 5,000 | | | | 22,234 | |
Asahi Printing Co., Ltd. | | | 400 | | | | 3,719 | |
ASAHI YUKIZAI Corp. | | | 5,000 | | | | 65,867 | |
Asahipen Corp. | | | 400 | | | | 6,409 | |
Asanuma Corp. | | | 2,400 | | | | 59,531 | |
Asax Co., Ltd. | | | 5,400 | | | | 27,058 | |
Ashimori Industry Co., Ltd. | | | 1,600 | | | | 19,716 | |
ASKA Pharmaceutical Co., Ltd. | | | 7,500 | | | | 75,248 | |
Asukanet Co., Ltd. | | | 1,300 | | | | 15,130 | |
Asunaro Aoki Construction Co., Ltd. | | | 5,800 | | | | 49,671 | |
Ateam, Inc. | | | 1,300 | | | | 17,321 | |
Atom Corp. | | | 14,300 | | | | 123,666 | |
Atrae, Inc. (a) | | | 700 | | | | 15,063 | |
Atsugi Co., Ltd. | | | 6,100 | | | | 52,990 | |
Aucnet, Inc. | | | 700 | | | | 6,259 | |
Autobacs Seven Co., Ltd. | | | 22,700 | | | | 377,724 | |
Avex, Inc. | | | 12,000 | | | | 153,519 | |
Awa Bank, Ltd. (The) | | | 14,600 | | | | 379,892 | |
Axell Corp. | | | 3,800 | | | | 15,578 | |
Axial Retailing, Inc. | | | 5,100 | | | | 170,522 | |
Azia Co., Ltd. | | | 1,500 | | | | 14,791 | |
Bando Chemical Industries, Ltd. | | | 15,400 | | | | 144,985 | |
Bank of Iwate, Ltd. (The) | | | 6,000 | | | | 193,985 | |
Bank of Kochi, Ltd. (The) | | | 1,600 | | | | 11,076 | |
Bank of Nagoya, Ltd. (The) | | | 5,400 | | | | 161,917 | |
Bank of Okinawa, Ltd. (The) | | | 9,160 | | | | 263,658 | |
Bank of Saga, Ltd. (The) | | | 6,100 | | | | 97,911 | |
Bank of the Ryukyus, Ltd. | | | 15,800 | | | | 162,636 | |
Baroque Japan, Ltd. | | | 1,100 | | | | 9,276 | |
BayCurrent Consulting, Inc. | | | 2,900 | | | | 60,097 | |
Beenos, Inc. | | | 1,400 | | | | 15,599 | |
Belc Co., Ltd. | | | 2,800 | | | | 131,245 | |
Bell System24 Holdings, Inc. | | | 6,100 | | | | 71,006 | |
Belluna Co., Ltd. | | | 13,800 | | | | 124,314 | |
Bengo4.com, Inc. (a) | | | 1,200 | | | | 34,686 | |
Billing System Corp. | | | 500 | | | | 18,415 | |
Biofermin Pharmaceutical Co., Ltd. | | | 500 | | | | 11,487 | |
BML, Inc. | | | 7,600 | | | | 194,052 | |
Bookoff Group Holdings, Ltd. | | | 4,700 | | | | 32,237 | |
Bourbon Corp. | | | 600 | | | | 10,395 | |
BP Castrol KK | | | 2,600 | | | | 28,754 | |
Br Holdings Corp. | | | 4,000 | | | | 11,541 | |
BrainPad, Inc. (a) | | | 1,100 | | | | 53,945 | |
Broadleaf Co., Ltd. (e) | | | 20,400 | | | | 98,485 | |
BRONCO BILLY Co., Ltd. | | | 2,400 | | | | 59,424 | |
Bull-Dog Sauce Co., Ltd. | | | 600 | | | | 11,015 | |
Bunka Shutter Co., Ltd. | | | 19,000 | | | | 123,334 | |
C Uyemura & Co., Ltd. | | | 2,800 | | | | 159,181 | |
C.I. Takiron Corp. | | | 18,000 | | | | 95,365 | |
See accompanying notes to financial statements.
BHFTII-18
Brighthouse Funds Trust II
Brighthouse/Dimensional International Small Company Portfolio
Schedule of Investments as of December 31, 2018
Common Stocks—(Continued)
| | | | | | | | |
| Security Description | | Shares | | | Value | |
|
| Japan—(Continued) | |
CAC Holdings Corp. | | | 6,200 | | | $ | 52,903 | |
Can Do Co., Ltd. | | | 3,500 | | | | 51,255 | |
Canare Electric Co., Ltd. | | | 800 | | | | 12,349 | |
Canon Electronics, Inc. | | | 7,400 | | | | 128,940 | |
Capital Asset Planning, Inc. | | | 400 | | | | 8,460 | |
Career Design Center Co., Ltd. | | | 1,600 | | | | 15,587 | |
CareerIndex, Inc. | | | 1,600 | | | | 21,660 | |
Carlit Holdings Co., Ltd. | | | 7,300 | | | | 48,163 | |
Cawachi, Ltd. | | | 5,700 | | | | 93,735 | |
Central Automotive Products, Ltd. | | | 800 | | | | 10,641 | |
Central Glass Co., Ltd. | | | 15,000 | | | | 299,416 | |
Central Security Patrols Co., Ltd. | | | 1,600 | | | | 71,483 | |
Central Sports Co., Ltd. | | | 1,600 | | | | 50,648 | |
Ceres, Inc. | | | 1,100 | | | | 16,790 | |
Charm Care Corp. | | | 1,600 | | | | 17,299 | |
Chiba Kogyo Bank, Ltd. (The) | | | 16,000 | | | | 52,539 | |
Chikaranomoto Holdings Co., Ltd. | | | 1,000 | | | | 6,534 | |
Chilled & Frozen Logistics Holdings Co., Ltd. | | | 2,800 | | | | 30,911 | |
CHIMNEY Co., Ltd. | | | 1,400 | | | | 31,084 | |
Chino Corp. | | | 2,700 | | | | 30,231 | |
Chiyoda Co., Ltd. | | | 5,800 | | | | 93,132 | |
Chiyoda Corp. | | | 6,000 | | | | 16,795 | |
Chiyoda Integre Co., Ltd. | | | 4,600 | | | | 82,423 | |
Chofu Seisakusho Co., Ltd. | | | 5,700 | | | | 107,807 | |
Chori Co., Ltd. | | | 5,000 | | | | 75,738 | |
Chubu Shiryo Co., Ltd. | | | 7,900 | | | | 87,366 | |
Chudenko Corp. | | | 8,600 | | | | 182,663 | |
Chuetsu Pulp & Paper Co., Ltd. | | | 3,500 | | | | 44,128 | |
Chugai Mining Co., Ltd. (a) | | | 68,200 | | | | 9,382 | |
Chugai Ro Co., Ltd. | | | 2,900 | | | | 53,934 | |
Chugoku Bank, Ltd. (The) | | | 2,200 | | | | 18,479 | |
Chugoku Marine Paints, Ltd. | | | 22,000 | | | | 180,081 | |
Chukyo Bank, Ltd. (The) | | | 3,900 | | | | 75,740 | |
Chuo Gyorui Co., Ltd. | | | 200 | | | | 5,063 | |
Chuo Spring Co., Ltd. | | | 1,400 | | | | 42,349 | |
Ci:z Holdings Co., Ltd. | | | 4,600 | | | | 247,022 | |
Citizen Watch Co., Ltd. | | | 47,700 | | | | 236,674 | |
CKD Corp. | | | 17,300 | | | | 144,915 | |
Clarion Co., Ltd. | | | 6,800 | | | | 154,709 | |
Cleanup Corp. | | | 7,300 | | | | 42,357 | |
CMIC Holdings Co., Ltd. | | | 3,900 | | | | 60,774 | |
CMK Corp. | | | 18,200 | | | | 100,665 | |
Cocokara fine, Inc. | | | 5,700 | | | | 277,337 | |
COLOPL, Inc. | | | 11,000 | | | | 75,944 | |
Colowide Co., Ltd. | | | 14,200 | | | | 298,673 | |
Computer Engineering & Consulting, Ltd. | | | 9,600 | | | | 158,503 | |
Computer Institute of Japan, Ltd. | | | 2,000 | | | | 13,010 | |
Comture Corp. | | | 1,900 | | | | 41,438 | |
CONEXIO Corp. | | | 4,600 | | | | 57,159 | |
COOKPAD, Inc. (a) | | | 6,300 | | | | 17,210 | |
Corona Corp. | | | 5,600 | | | | 54,612 | |
Cosel Co., Ltd. | | | 9,900 | | | | 84,334 | |
Cosmo Energy Holdings Co., Ltd. | | | 3,200 | | | | 65,137 | |
Cosmos Initia Co., Ltd. | | | 3,500 | | | | 17,980 | |
Cota Co., Ltd. | | | 1,600 | | | | 21,134 | |
Create Medic Co., Ltd. | | | 1,800 | | | | 16,466 | |
Create Restaurants Holdings, Inc. | | | 9,500 | | | | 100,978 | |
|
| Japan—(Continued) | |
Create SD Holdings Co., Ltd. | | | 6,000 | | | | 142,907 | |
Creek & River Co., Ltd. | | | 1,300 | | | | 11,146 | |
Cresco, Ltd. | | | 2,000 | | | | 52,575 | |
CTI Engineering Co., Ltd. | | | 4,800 | | | | 68,247 | |
CTS Co., Ltd. | | | 2,800 | | | | 16,513 | |
Cube System, Inc. | | | 1,700 | | | | 9,293 | |
Cyberstep, Inc. (a) | | | 1,200 | | | | 10,848 | |
Cybozu, Inc. | | | 6,400 | | | | 38,865 | |
Dai Nippon Toryo Co., Ltd. | | | 9,400 | | | | 83,221 | |
Dai-Dan Co., Ltd. | | | 6,000 | | | | 130,001 | |
Dai-ichi Seiko Co., Ltd. | | | 3,100 | | | | 31,703 | |
Daibiru Corp. | | | 19,800 | | | | 194,529 | |
Daido Kogyo Co., Ltd. | | | 2,000 | | | | 15,816 | |
Daido Metal Co., Ltd. | | | 11,200 | | | | 79,676 | |
Daido Steel Co., Ltd. | | | 2,100 | | | | 81,887 | |
Daidoh, Ltd. | | | 10,800 | | | | 29,878 | |
Daihatsu Diesel Manufacturing Co., Ltd. | | | 9,000 | | | | 58,729 | |
Daihen Corp. | | | 7,200 | | | | 143,498 | |
Daiho Corp. | | | 5,000 | | | | 160,650 | |
Daiichi Jitsugyo Co., Ltd. | | | 2,800 | | | | 89,501 | |
Daiichi Kigenso Kagaku-Kogyo Co., Ltd. | | | 5,000 | | | | 36,255 | |
Daiken Corp. | | | 4,800 | | | | 87,405 | |
Daiken Medical Co., Ltd. | | | 4,400 | | | | 24,325 | |
Daiki Aluminium Industry Co., Ltd. | | | 9,000 | | | | 46,167 | |
Daiko Denshi Tsushin, Ltd. | | | 1,300 | | | | 6,304 | |
Daikoku Denki Co., Ltd. | | | 2,700 | | | | 36,623 | |
Daikokutenbussan Co., Ltd. | | | 1,900 | | | | 70,949 | |
Daikyonishikawa Corp. | | | 5,200 | | | | 50,607 | |
Dainichi Co., Ltd. | | | 4,100 | | | | 24,188 | |
Dainichiseika Color & Chemicals Manufacturing Co., Ltd. | | | 5,000 | | | | 125,114 | |
Daio Paper Corp. | | | 15,800 | | | | 181,633 | |
Daiseki Co., Ltd. | | | 10,700 | | | | 220,066 | |
Daiseki Eco. Solution Co., Ltd. | | | 2,400 | | | | 12,602 | |
Daishi Hokuetsu Financial Group, Inc. | | | 15,100 | | | | 420,387 | |
Daishinku Corp. | | | 2,600 | | | | 20,469 | |
Daisue Construction Co., Ltd. | | | 2,300 | | | | 20,390 | |
Daisyo Corp. | | | 2,200 | | | | 30,769 | |
Daito Bank, Ltd. (The) | | | 5,200 | | | | 29,171 | |
Daito Pharmaceutical Co., Ltd. | | | 3,960 | | | | 107,528 | |
Daitron Co., Ltd. | | | 800 | | | | 8,904 | |
Daiwa Industries, Ltd. | | | 11,000 | | | | 112,075 | |
Daiwabo Holdings Co., Ltd. | | | 6,100 | | | | 285,426 | |
Daiyu Lic Holdings Co., Ltd. | | | 1,300 | | | | 10,554 | |
DCM Holdings Co., Ltd. | | | 37,900 | | | | 397,644 | |
DD Holdings Co., Ltd. | | | 600 | | | | 11,022 | |
Dear Life Co., Ltd. | | | 4,700 | | | | 18,089 | |
Denki Kogyo Co., Ltd. | | | 4,200 | | | | 91,606 | |
Densan System Co., Ltd. | | | 1,000 | | | | 20,855 | |
Denyo Co., Ltd. | | | 4,800 | | | | 58,400 | |
Descente, Ltd. | | | 13,700 | | | | 223,031 | |
Dexerials Corp. | | | 7,800 | | | | 57,799 | |
Digital Arts, Inc. | | | 2,600 | | | | 143,313 | |
Digital Information Technologies Corp. | | | 1,300 | | | | 15,230 | |
Dip Corp. | | | 6,900 | | | | 114,103 | |
DKS Co., Ltd. | | | 3,600 | | | | 90,518 | |
DMG Mori Co., Ltd. (e) | | | 17,900 | | | | 199,782 | |
DMW Corp. | | | 700 | | | | 13,585 | |
See accompanying notes to financial statements.
BHFTII-19
Brighthouse Funds Trust II
Brighthouse/Dimensional International Small Company Portfolio
Schedule of Investments as of December 31, 2018
Common Stocks—(Continued)
| | | | | | | | |
| Security Description | | Shares | | | Value | |
|
| Japan—(Continued) | |
Doshisha Co., Ltd. | | | 8,200 | | | $ | 131,238 | |
Doutor Nichires Holdings Co., Ltd. | | | 11,500 | | | | 211,251 | |
Dowa Holdings Co., Ltd. | | | 5,900 | | | | 176,094 | |
Dream Incubator, Inc. | | | 600 | | | | 6,631 | |
DSB Co., Ltd. | | | 5,300 | | | | 18,645 | |
DTS Corp. | | | 6,600 | | | | 209,448 | |
Duskin Co., Ltd. | | | 13,700 | | | | 299,404 | |
DyDo Group Holdings, Inc. | | | 2,700 | | | | 141,990 | |
Dynic Corp. | | | 3,200 | | | | 20,959 | |
E-Guardian, Inc. | | | 2,400 | | | | 45,216 | |
Eagle Industry Co., Ltd. | | | 7,800 | | | | 91,351 | |
Earth Corp. | | | 300 | | | | 13,726 | |
EAT&Co, Ltd. | | | 1,400 | | | | 19,223 | |
Ebara Jitsugyo Co., Ltd. | | | 2,500 | | | | 41,292 | |
Eco’s Co., Ltd. | | | 800 | | | | 14,757 | |
EDION Corp. | | | 28,900 | | | | 283,971 | |
EF-ON, Inc. | | | 1,200 | | | | 9,222 | |
eGuarantee, Inc. | | | 4,800 | | | | 42,667 | |
Ehime Bank, Ltd. (The) | | | 11,400 | | | | 112,250 | |
Eidai Co., Ltd. | | | 10,000 | | | | 38,450 | |
Eighteenth Bank, Ltd. (The) | | | 7,000 | | | | 156,839 | |
Eiken Chemical Co., Ltd. | | | 9,200 | | | | 202,748 | |
Eizo Corp. | | | 6,300 | | | | 232,411 | |
Elan Corp. | | | 1,200 | | | | 14,857 | |
Elecom Co., Ltd. | | | 5,100 | | | | 129,465 | |
Elematec Corp. | | | 4,000 | | | | 70,344 | |
EM Systems Co., Ltd. | | | 3,600 | | | | 33,184 | |
Endo Lighting Corp. | | | 2,600 | | | | 16,847 | |
Enigmo, Inc. (a) | | | 1,300 | | | | 24,213 | |
Enplas Corp. | | | 3,400 | | | | 83,924 | |
Enshu, Ltd. (a) | | | 2,300 | | | | 20,490 | |
EPS Holdings, Inc. | | | 7,900 | | | | 119,280 | |
eRex Co., Ltd. | | | 6,100 | | | | 31,449 | |
ES-Con Japan, Ltd. | | | 4,900 | | | | 28,644 | |
Escrow Agent Japan, Inc. | | | 5,100 | | | | 16,155 | |
ESPEC Corp. | | | 7,100 | | | | 122,300 | |
Excel Co., Ltd. | | | 2,500 | | | | 45,158 | |
Exedy Corp. | | | 11,600 | | | | 283,324 | |
Extreme Co., Ltd. | | | 700 | | | | 19,952 | |
F-Tech, Inc. | | | 3,600 | | | | 30,241 | |
F@N Communications, Inc. | | | 9,600 | | | | 47,195 | |
Faith, Inc. | | | 2,680 | | | | 20,387 | |
FALCO HOLDINGS Co., Ltd. | | | 3,100 | | | | 41,888 | |
FCC Co., Ltd. | | | 12,600 | | | | 297,761 | |
FDK Corp. (a) (e) | | | 2,500 | | | | 20,757 | |
Feed One Co., Ltd. | | | 41,380 | | | | 67,520 | |
Ferrotec Holdings Corp. | | | 10,400 | | | | 75,181 | |
FFRI, Inc. (a) | | | 1,000 | | | | 24,718 | |
FIDEA Holdings Co., Ltd. | | | 62,510 | | | | 76,577 | |
Fields Corp. | | | 6,000 | | | | 41,956 | |
Financial Products Group Co., Ltd. | | | 20,000 | | | | 206,792 | |
FINDEX, Inc. | | | 3,900 | | | | 18,936 | |
First Brothers Co., Ltd. | | | 900 | | | | 10,095 | |
First Juken Co., Ltd. | | | 3,400 | | | | 36,915 | |
First-corp, Inc. | | | 1,600 | | | | 10,401 | |
Fixstars Corp. | | | 2,700 | | | | 24,428 | |
Foster Electric Co., Ltd. | | | 8,800 | | | | 100,917 | |
|
| Japan—(Continued) | |
France Bed Holdings Co., Ltd. | | | 9,300 | | | | 75,967 | |
Freebit Co., Ltd. | | | 2,100 | | | | 14,189 | |
Freund Corp. | | | 2,400 | | | | 17,851 | |
Fronteo, Inc. (a) | | | 3,100 | | | | 18,699 | |
FTGroup Co., Ltd. | | | 1,500 | | | | 19,207 | |
Fudo Tetra Corp. | | | 6,030 | | | | 93,684 | |
Fuji Co., Ltd. | | | 6,700 | | | | 113,915 | |
Fuji Corp. | | | 12,100 | | | | 141,357 | |
Fuji Corp., Ltd. | | | 8,600 | | | | 64,311 | |
Fuji Kyuko Co., Ltd. | | | 6,500 | | | | 190,183 | |
Fuji Oil Co., Ltd. | | | 21,100 | | | | 56,940 | |
Fuji Pharma Co., Ltd. | | | 4,600 | | | | 74,574 | |
Fuji Seal International, Inc. | | | 6,400 | | | | 224,081 | |
Fuji Soft, Inc. | | | 7,300 | | | | 274,512 | |
Fujibo Holdings, Inc. | | | 3,700 | | | | 82,714 | |
Fujicco Co., Ltd. | | | 7,100 | | | | 153,982 | |
Fujikura Kasei Co., Ltd. | | | 9,500 | | | | 51,323 | |
Fujikura Rubber, Ltd. | | | 5,800 | | | | 23,749 | |
Fujikura, Ltd. | | | 69,700 | | | | 275,884 | |
Fujimi, Inc. | | | 3,700 | | | | 70,669 | |
Fujimori Kogyo Co., Ltd. | | | 4,800 | | | | 128,565 | |
Fujio Food System Co., Ltd. | | | 600 | | | | 10,149 | |
Fujisash Co., Ltd. | | | 24,500 | | | | 17,049 | |
Fujishoji Co., Ltd. | | | 1,300 | | | | 11,143 | |
Fujita Kanko, Inc. | | | 800 | | | | 20,129 | |
Fujitec Co., Ltd. | | | 19,500 | | | | 207,657 | |
Fujitsu Frontech, Ltd. | | | 4,500 | | | | 43,379 | |
Fujitsu General, Ltd. | | | 11,500 | | | | 148,479 | |
Fujiya Co., Ltd. | | | 1,200 | | | | 25,073 | |
FuKoKu Co., Ltd. | | | 5,100 | | | | 40,286 | |
Fukuda Corp. | | | 1,600 | | | | 58,979 | |
Fukui Bank, Ltd. (The) | | | 9,200 | | | | 132,952 | |
Fukui Computer Holdings, Inc. | | | 1,300 | | | | 16,232 | |
Fukushima Bank, Ltd. (The) (a) | | | 11,200 | | | | 40,696 | |
Fukushima Industries Corp. | | | 4,200 | | | | 135,376 | |
Fukuyama Transporting Co., Ltd. | | | 7,700 | | | | 295,797 | |
FULLCAST Holdings Co., Ltd. | | | 4,300 | | | | 70,836 | |
Fumakilla, Ltd. | | | 2,500 | | | | 26,080 | |
Funai Electric Co., Ltd. (a) (e) | | | 7,900 | | | | 38,226 | |
Funai Soken Holdings, Inc. | | | 10,770 | | | | 162,549 | |
Furukawa Battery Co., Ltd. (The) | | | 5,000 | | | | 30,169 | |
Furukawa Co., Ltd. | | | 10,500 | | | | 119,100 | |
Furukawa Electric Co., Ltd. | | | 2,000 | | | | 49,766 | |
Furuno Electric Co., Ltd. | | | 10,500 | | | | 112,398 | |
Furusato Industries, Ltd. | | | 3,700 | | | | 54,832 | |
Furuya Metal Co., Ltd. | | | 400 | | | | 18,078 | |
Fuso Chemical Co., Ltd. | | | 4,000 | | | | 71,233 | |
Fuso Pharmaceutical Industries, Ltd. | | | 2,600 | | | | 60,810 | |
Futaba Corp. | | | 10,200 | | | | 146,048 | |
Futaba Industrial Co., Ltd. | | | 19,600 | | | | 97,815 | |
Future Corp. | | | 8,400 | | | | 114,733 | |
Fuyo General Lease Co., Ltd. | | | 5,600 | | | | 282,944 | |
G-7 Holdings, Inc. | | | 500 | | | | 10,149 | |
G-Tekt Corp. | | | 7,700 | | | | 101,455 | |
Gakken Holdings Co., Ltd. | | | 1,600 | | | | 62,475 | |
Gakkyusha Co., Ltd. | | | 700 | | | | 9,409 | |
Gakujo Co., Ltd. | | | 1,700 | | | | 18,720 | |
See accompanying notes to financial statements.
BHFTII-20
Brighthouse Funds Trust II
Brighthouse/Dimensional International Small Company Portfolio
Schedule of Investments as of December 31, 2018
Common Stocks—(Continued)
| | | | | | | | |
| Security Description | | Shares | | | Value | |
|
| Japan—(Continued) | |
Gecoss Corp. | | | 4,600 | | | $ | 42,744 | |
Genki Sushi Co., Ltd. | | | 1,600 | | | | 64,750 | |
Genky DrugStores Co., Ltd. | | | 2,400 | | | | 64,334 | |
Geo Holdings Corp. | | | 12,300 | | | | 185,864 | |
Giken, Ltd. | | | 2,800 | | | | 89,017 | |
GLOBERIDE, Inc. | | | 3,500 | | | | 83,060 | |
Glory, Ltd. | | | 7,900 | | | | 177,011 | |
GMO Click Holdings, Inc. | | | 1,800 | | | | 9,223 | |
GMO Cloud K.K. | | | 700 | | | | 19,448 | |
GMO internet, Inc. | | | 16,700 | | | | 220,186 | |
Godo Steel, Ltd. | | | 4,100 | | | | 59,298 | |
Goldcrest Co., Ltd. | | | 7,230 | | | | 103,873 | |
Golf Digest Online, Inc. | | | 900 | | | | 5,739 | |
Grace Technology, Inc. | | | 900 | | | | 14,174 | |
Grandy House Corp. | | | 3,600 | | | | 12,634 | |
Gree, Inc. | | | 26,400 | | | | 104,116 | |
GS Yuasa Corp. | | | 12,400 | | | | 252,001 | |
GSI Creos Corp. | | | 2,800 | | | | 30,990 | |
Gumi, Inc. (a) | | | 2,900 | | | | 14,383 | |
Gun-Ei Chemical Industry Co., Ltd. | | | 1,800 | | | | 41,637 | |
GungHo Online Entertainment, Inc. (a) (e) | | | 41,700 | | | | 76,409 | |
Gunosy, Inc. (a) | | | 2,000 | | | | 50,608 | |
Gunze, Ltd. | | | 6,900 | | | | 260,413 | |
Gurunavi, Inc. | | | 8,500 | | | | 52,251 | |
H-One Co., Ltd. | | | 6,000 | | | | 53,406 | |
H2O Retailing Corp. | | | 7,600 | | | | 107,186 | |
HABA Laboratories, Inc. | | | 500 | | | | 32,446 | |
Hagihara Industries, Inc. | | | 4,000 | | | | 55,344 | |
Hakudo Co., Ltd. | | | 500 | | | | 7,215 | |
Hakuto Co., Ltd. | | | 5,900 | | | | 60,207 | |
Hakuyosha Co., Ltd. | | | 800 | | | | 20,490 | |
Hamakyorex Co., Ltd. | | | 5,600 | | | | 192,160 | |
Hamee Corp. | | | 1,800 | | | | 16,501 | |
Hanwa Co., Ltd. | | | 12,800 | | | | 332,176 | |
Happinet Corp. | | | 5,000 | | | | 63,552 | |
Hard Off Corp. Co., Ltd. | | | 3,700 | | | | 27,625 | |
Harima Chemicals Group, Inc. | | | 7,100 | | | | 59,640 | |
Haruyama Holdings, Inc. | | | 5,400 | | | | 40,500 | |
Hazama Ando Corp. | | | 54,490 | | | | 362,400 | |
Hearts United Group Co., Ltd. | | | 2,600 | | | | 32,937 | |
Heiwa Real Estate Co., Ltd. | | | 14,400 | | | | 227,597 | |
Heiwado Co., Ltd. | | | 11,200 | | | | 256,554 | |
Helios Techno Holding Co., Ltd. | | | 1,900 | | | | 10,566 | |
HI-LEX Corp. | | | 7,700 | | | | 152,324 | |
Hibiya Engineering, Ltd. | | | 7,800 | | | | 130,918 | |
Hiday Hidaka Corp. | | | 5,815 | | | | 116,186 | |
Himaraya Co., Ltd. | | | 2,600 | | | | 21,699 | |
Hinokiya Group Co., Ltd. | | | 700 | | | | 13,663 | |
Hioki EE Corp. | | | 2,300 | | | | 74,230 | |
Hiramatsu, Inc. | | | 8,300 | | | | 25,325 | |
Hirano Tecseed Co., Ltd. | | | 500 | | | | 6,123 | |
Hirata Corp. | | | 1,700 | | | | 76,650 | |
Hirose Tusyo, Inc. | | | 300 | | | | 4,785 | |
Hiroshima Gas Co., Ltd. | | | 3,600 | | | | 11,170 | |
Hisaka Works, Ltd. | | | 9,600 | | | | 71,230 | |
Hitachi Maxell, Ltd. | | | 8,200 | | | | 108,589 | |
Hitachi Zosen Corp. | | | 61,600 | | | | 185,988 | |
|
| Japan—(Continued) | |
Hito Communications, Inc. | | | 1,700 | | | | 21,311 | |
Hochiki Corp. | | | 4,600 | | | | 47,779 | |
Hodogaya Chemical Co., Ltd. | | | 1,800 | | | | 33,167 | |
Hogy Medical Co., Ltd. | | | 7,100 | | | | 202,706 | |
Hokkaido Electric Power Co., Inc. | | | 40,100 | | | | 278,694 | |
Hokkaido Gas Co., Ltd. | | | 5,400 | | | | 74,788 | |
Hokkan Holdings, Ltd. | | | 5,000 | | | | 79,803 | |
Hokko Chemical Industry Co., Ltd. | | | 8,000 | | | | 32,010 | |
Hokkoku Bank, Ltd. (The) | | | 10,100 | | | | 323,440 | |
Hokuetsu Corp. | | | 47,900 | | | | 216,503 | |
Hokuetsu Industries Co., Ltd. | | | 7,000 | | | | 66,545 | |
Hokuhoku Financial Group, Inc. | | | 23,700 | | | | 265,536 | |
Hokuriku Electric Industry Co., Ltd. | | | 2,800 | | | | 23,843 | |
Hokuriku Electric Power Co. (a) | | | 28,000 | | | | 244,203 | |
Hokuriku Electrical Construction Co., Ltd. | | | 3,000 | | | | 25,233 | |
Hokuriku Gas Co., Ltd. | | | 1,000 | | | | 27,822 | |
Hokuto Corp. | | | 7,100 | | | | 124,975 | |
Honda Tsushin Kogyo Co., Ltd. | | | 1,200 | | | | 5,278 | |
Honeys Holdings Co., Ltd. | | | 6,930 | | | | 48,791 | |
Honma Golf, Ltd. | | | 27,000 | | | | 31,047 | |
Hoosiers Holdings Co., Ltd. | | | 8,000 | | | | 45,427 | |
Horiba, Ltd. | | | 3,100 | | | | 125,391 | |
Hosiden Corp. | | | 20,000 | | | | 132,476 | |
Hosokawa Micron Corp. | | | 2,200 | | | | 83,044 | |
Hotland Co., Ltd. | | | 900 | | | | 10,237 | |
House Do Co., Ltd. | | | 600 | | | | 5,476 | |
Howa Machinery, Ltd. | | | 5,700 | | | | 37,045 | |
Hyakugo Bank, Ltd. (The) | | | 88,000 | | | | 312,380 | |
Hyakujushi Bank, Ltd. (The) | | | 9,800 | | | | 231,200 | |
I’rom Group Co., Ltd. | | | 1,100 | | | | 15,131 | |
I-Net Corp. | | | 3,520 | | | | 43,799 | |
I.K Co., Ltd. | | | 900 | | | | 4,705 | |
Ibiden Co., Ltd. | | | 27,300 | | | | 381,569 | |
IBJ Leasing Co., Ltd. | | | 7,200 | | | | 157,222 | |
IBJ, Inc. (a) | | | 3,500 | | | | 22,180 | |
Ichibanya Co., Ltd. | | | 2,100 | | | | 79,444 | |
Ichigo, Inc. | | | 56,600 | | | | 162,898 | |
Ichiken Co., Ltd. | | | 2,400 | | | | 45,114 | |
Ichikoh Industries, Ltd. | | | 9,000 | | | | 44,759 | |
ICHINEN HOLDINGS Co., Ltd. | | | 7,400 | | | | 78,033 | |
Ichiyoshi Securities Co., Ltd. | | | 12,600 | | | | 91,745 | |
Icom, Inc. | | | 3,800 | | | | 68,309 | |
Idec Corp. | | | 7,500 | | | | 129,884 | |
IDOM, Inc. | | | 20,400 | | | | 67,293 | |
Ihara Science Corp. | | | 900 | | | | 13,213 | |
Iino Kaiun Kaisha, Ltd. | | | 32,200 | | | | 117,021 | |
IJT Technology Holdings Co., Ltd. | | | 9,000 | | | | 49,306 | |
Ikegami Tsushinki Co., Ltd. | | | 2,600 | | | | 26,790 | |
Imagica Group, Inc. | | | 4,500 | | | | 20,525 | |
Imasen Electric Industrial | | | 7,200 | | | | 63,937 | |
Imuraya Group Co., Ltd. | | | 1,200 | | | | 26,261 | |
Inaba Denki Sangyo Co., Ltd. | | | 8,100 | | | | 304,417 | |
Inaba Seisakusho Co., Ltd. | | | 2,100 | | | | 24,014 | |
Inabata & Co., Ltd. | | | 17,700 | | | | 223,755 | |
Inageya Co., Ltd. | | | 9,700 | | | | 125,526 | |
Ines Corp. | | | 9,500 | | | | 97,901 | |
Infocom Corp. | | | 4,000 | | | | 143,969 | |
See accompanying notes to financial statements.
BHFTII-21
Brighthouse Funds Trust II
Brighthouse/Dimensional International Small Company Portfolio
Schedule of Investments as of December 31, 2018
Common Stocks—(Continued)
| | | | | | | | |
| Security Description | | Shares | | | Value | |
|
| Japan—(Continued) | |
Infomart Corp. | | | 15,400 | | | $ | 142,169 | |
Information Development Co. | | | 1,200 | | | | 13,656 | |
Information Services International-Dentsu, Ltd. | | | 4,300 | | | | 108,404 | |
Innotech Corp. | | | 8,200 | | | | 69,306 | |
Insource Co., Ltd. | | | 500 | | | | 8,257 | |
Intage Holdings, Inc. | | | 11,600 | | | | 94,775 | |
Intelligent Wave, Inc. | | | 3,400 | | | | 19,850 | |
Inter Action Corp. | | | 1,700 | | | | 28,668 | |
Internet Initiative Japan, Inc. | | | 9,800 | | | | 220,323 | |
Inui Global Logistics Co., Ltd. | | | 5,355 | | | | 38,747 | |
IR Japan Holdings, Ltd. | | | 1,400 | | | | 15,413 | |
Iriso Electronics Co., Ltd. | | | 5,000 | | | | 182,921 | |
Ise Chemicals Corp. | | | 1,000 | | | | 26,290 | |
Iseki & Co., Ltd. | | | 7,400 | | | | 105,189 | |
Ishihara Sangyo Kaisha, Ltd. (a) | | | 12,200 | | | | 118,603 | |
Ishii Iron Works Co., Ltd. | | | 900 | | | | 14,061 | |
Ishizuka Glass Co., Ltd. | | | 500 | | | | 8,766 | |
Isolite Insulating Products Co., Ltd. | | | 2,900 | | | | 12,113 | |
Istyle, Inc. | | | 9,800 | | | | 72,080 | |
ITbook Holdings Co., Ltd. (a) | | | 3,900 | | | | 12,024 | |
Itfor, Inc. | | | 5,200 | | | | 31,898 | |
Itochu Enex Co., Ltd. | | | 19,400 | | | | 170,918 | |
Itochu-Shokuhin Co., Ltd. | | | 2,400 | | | | 103,943 | |
Itoki Corp. | | | 15,600 | | | | 84,480 | |
Itokuro, Inc. (a) | | | 800 | | | | 22,616 | |
IwaiCosmo Holdings, Inc. | | | 7,900 | | | | 84,533 | |
Iwaki & Co., Ltd. | | | 9,000 | | | | 34,469 | |
Iwasaki Electric Co., Ltd. | | | 2,500 | | | | 29,638 | |
Iwatani Corp. | | | 11,600 | | | | 386,512 | |
Iwatsuka Confectionery Co., Ltd. | | | 500 | | | | 17,085 | |
Iyo Bank, Ltd. (The) | | | 16,000 | | | | 83,941 | |
J Trust Co., Ltd. | | | 6,000 | | | | 22,433 | |
J-Oil Mills, Inc. | | | 4,000 | | | | 139,605 | |
JAC Recruitment Co., Ltd. | | | 1,600 | | | | 27,467 | |
Jaccs Co., Ltd. | | | 1,500 | | | | 24,465 | |
Jafco Co., Ltd. | | | 6,400 | | | | 202,560 | |
Jalux, Inc. | | | 2,400 | | | | 55,265 | |
Jamco Corp. | | | 3,400 | | | | 79,487 | |
Janome Sewing Machine Co., Ltd. | | | 7,099 | | | | 30,035 | |
Japan Asia Investment Co., Ltd. (a) | | | 4,900 | | | | 8,108 | |
Japan Asset Marketing Co., Ltd. (a) | | | 29,300 | | | | 26,034 | |
Japan Aviation Electronics Industry, Ltd. | | | 8,000 | | | | 91,784 | |
Japan Best Rescue System Co., Ltd. | | | 2,900 | | | | 33,040 | |
Japan Display, Inc. (a) (e) | | | 81,900 | | | | 54,180 | |
Japan Elevator Service Holdings Co., Ltd. | | | 2,400 | | | | 36,502 | |
Japan Foundation Engineering Co., Ltd. | | | 10,200 | | | | 29,040 | |
Japan Investment Adviser Co., Ltd. | | | 800 | | | | 22,720 | |
Japan Lifeline Co., Ltd. | | | 12,700 | | | | 161,394 | |
Japan Material Co., Ltd. | | | 11,900 | | | | 117,101 | |
Japan Meat Co., Ltd. | | | 1,300 | | | | 20,006 | |
Japan Medical Dynamic Marketing, Inc. | | | 3,000 | | | | 30,193 | |
Japan Oil Transportation Co., Ltd. | | | 700 | | | | 18,185 | |
Japan Petroleum Exploration Co., Ltd. | | | 8,200 | | | | 147,401 | |
Japan Property Management Center Co., Ltd. | | | 2,000 | | | | 15,437 | |
Japan Pulp & Paper Co., Ltd. | | | 3,700 | | | | 141,125 | |
Japan Securities Finance Co., Ltd. | | | 5,400 | | | | 26,969 | |
Japan Steel Works, Ltd. (The) | | | 13,000 | | | | 207,454 | |
|
| Japan—(Continued) | |
Japan Transcity Corp. | | | 12,000 | | | | 47,597 | |
Japan Wool Textile Co., Ltd. (The) | | | 19,700 | | | | 149,356 | |
Jastec Co., Ltd. | | | 5,100 | | | | 41,506 | |
JBCC Holdings, Inc. | | | 7,000 | | | | 100,118 | |
JCU Corp. | | | 6,400 | | | | 81,925 | |
Jeol, Ltd. | | | 11,000 | | | | 165,048 | |
JIG-SAW, Inc. (a) | | | 900 | | | | 18,111 | |
Jimoto Holdings, Inc. | | | 67,900 | | | | 77,725 | |
JINS, Inc. | | | 4,200 | | | | 220,717 | |
JK Holdings Co., Ltd. | | | 5,600 | | | | 29,196 | |
JMS Co., Ltd. | | | 7,500 | | | | 37,872 | |
Joban Kosan Co., Ltd. | | | 1,700 | | | | 24,788 | |
Joshin Denki Co., Ltd. | | | 7,000 | | | | 152,926 | |
Joyful Honda Co., Ltd. | | | 1,200 | | | | 15,034 | |
JP-Holdings, Inc. | | | 17,900 | | | | 41,752 | |
JSP Corp. | | | 5,100 | | | | 99,308 | |
Juki Corp. | | | 11,200 | | | | 114,495 | |
Juroku Bank, Ltd. (The) | | | 12,200 | | | | 253,480 | |
Justsystems Corp. | | | 9,700 | | | | 185,947 | |
JVC Kenwood Corp. | | | 53,300 | | | | 115,186 | |
K&O Energy Group, Inc. | | | 5,400 | | | | 73,287 | |
kabu.com Securities Co., Ltd. | | | 47,800 | | | | 163,410 | |
Kadokawa Dwango (a) | | | 12,508 | | | | 132,178 | |
Kaga Electronics Co., Ltd. | | | 7,200 | | | | 130,873 | |
Kakiyasu Honten Co., Ltd. | | | 3,800 | | | | 80,166 | |
Kamakura Shinsho, Ltd. | | | 2,400 | | | | 31,069 | |
Kameda Seika Co., Ltd. | | | 4,100 | | | | 185,779 | |
Kamei Corp. | | | 8,700 | | | | 99,046 | |
Kanaden Corp. | | | 7,200 | | | | 75,858 | |
Kanagawa Chuo Kotsu Co., Ltd. | | | 2,400 | | | | 83,011 | |
Kanamic Network Co., Ltd. | | | 800 | | | | 12,686 | |
Kanamoto Co., Ltd. | | | 8,800 | | | | 233,626 | |
Kandenko Co., Ltd. | | | 300 | | | | 2,893 | |
Kanematsu Corp. | | | 29,800 | | | | 360,577 | |
Kanematsu Electronics, Ltd. | | | 3,900 | | | | 116,506 | |
Kanemi Co., Ltd. | | | 100 | | | | 2,715 | |
Kansai Mirai Financial Group, Inc. (a) | | | 23,031 | | | | 164,313 | |
Kanto Denka Kogyo Co., Ltd. | | | 15,000 | | | | 107,562 | |
Kappa Create Co., Ltd. | | | 4,400 | | | | 55,568 | |
Kasai Kogyo Co., Ltd. | | | 8,600 | | | | 64,737 | |
Katakura &Co-op Agri Corp. | | | 1,600 | | | | 15,547 | |
Katakura Industries Co., Ltd. | | | 9,500 | | | | 96,194 | |
Kato Sangyo Co., Ltd. | | | 7,100 | | | | 195,945 | |
Kato Works Co., Ltd. | | | 3,800 | | | | 88,471 | |
Kawada Technologies, Inc. | | | 1,500 | | | | 96,318 | |
Kawai Musical Instruments Manufacturing Co., Ltd. | | | 2,600 | | | | 70,944 | |
Kawasaki Kinkai Kisen Kaisha, Ltd. | | | 700 | | | | 19,837 | |
Kawasaki Kisen Kaisha, Ltd. (a) (e) | | | 12,200 | | | | 149,982 | |
Kawasumi Laboratories, Inc. | | | 4,900 | | | | 28,466 | |
Keihanshin Building Co., Ltd. | | | 14,500 | | | | 108,238 | |
Keihin Co.,Ltd./Minato-Ku Tokyo Japan | | | 2,300 | | | | 26,465 | |
Keihin Corp. | | | 15,600 | | | | 259,539 | |
Keiyo Bank, Ltd. (The) | | | 44,500 | | | | 287,450 | |
Keiyo Co., Ltd. (e) | | | 14,400 | | | | 68,826 | |
Kenedix, Inc. | | | 41,200 | | | | 177,903 | |
Kenko Mayonnaise Co., Ltd. | | | 3,200 | | | | 56,262 | |
KEY Coffee, Inc. | | | 6,700 | | | | 127,666 | |
See accompanying notes to financial statements.
BHFTII-22
Brighthouse Funds Trust II
Brighthouse/Dimensional International Small Company Portfolio
Schedule of Investments as of December 31, 2018
Common Stocks—(Continued)
| | | | | | | | |
| Security Description | | Shares | | | Value | |
|
| Japan—(Continued) | |
KFC Holdings Japan, Ltd. | | | 4,000 | | | $ | 71,726 | |
KH Neochem Co., Ltd. | | | 3,300 | | | | 68,367 | |
Ki-Star Real Estate Co., Ltd. | | | 600 | | | | 8,915 | |
Kimoto Co., Ltd. | | | 14,900 | | | | 24,502 | |
Kimura Chemical Plants Co., Ltd. | | | 3,300 | | | | 10,476 | |
King Jim Co., Ltd. | | | 5,800 | | | | 44,448 | |
Kinki Sharyo Co., Ltd. (The) (a) | | | 1,200 | | | | 21,699 | |
Kintetsu Department Store Co., Ltd. (a) | | | 1,900 | | | | 59,901 | |
Kintetsu World Express, Inc. | | | 10,800 | | | | 157,915 | |
Kirindo Holdings Co., Ltd. | | | 800 | | | | 9,122 | |
Kissei Pharmaceutical Co., Ltd. | | | 8,100 | | | | 206,153 | |
Kita-Nippon Bank, Ltd. (The) | | | 2,900 | | | | 59,215 | |
Kitagawa Iron Works Co., Ltd. | | | 3,100 | | | | 63,628 | |
Kitano Construction Corp. | | | 1,400 | | | | 42,131 | |
Kitanotatsujin Corp. | | | 7,600 | | | | 26,054 | |
Kito Corp. | | | 5,900 | | | | 79,845 | |
Kitz Corp. | | | 31,200 | | | | 241,343 | |
Kiyo Bank, Ltd. (The) | | | 25,000 | | | | 354,164 | |
KLab, Inc. (a) | | | 10,600 | | | | 80,948 | |
KNT-CT Holdings Co., Ltd. (a) | | | 3,300 | | | | 33,360 | |
Koa Corp. | | | 10,200 | | | | 118,598 | |
Koatsu Gas Kogyo Co., Ltd. | | | 11,100 | | | | 87,084 | |
Kobe Bussan Co., Ltd. | | | 4,800 | | | | 141,358 | |
Kobe Electric Railway Co., Ltd. (a) | | | 500 | | | | 17,960 | |
KobelcoEco-Solutions Co., Ltd. | | | 1,200 | | | | 16,335 | |
Kohnan Shoji Co., Ltd. | | | 10,400 | | | | 254,013 | |
Kohsoku Corp. | | | 4,000 | | | | 36,267 | |
Koike Sanso Kogyo Co., Ltd. | | | 700 | | | | 13,209 | |
Kojima Co., Ltd. (a) | | | 12,000 | | | | 51,850 | |
Kokusai Co., Ltd. | | | 3,400 | | | | 23,665 | |
Kokuyo Co., Ltd. | | | 18,900 | | | | 275,515 | |
KOMAIHALTEC, Inc. | | | 1,800 | | | | 29,923 | |
Komatsu Seiren Co., Ltd. | | | 10,200 | | | | 71,136 | |
Komatsu Wall Industry Co., Ltd. | | | 2,700 | | | | 47,224 | |
KOMEDA Holdings Co., Ltd. | | | 11,100 | | | | 218,307 | |
Komeri Co., Ltd. | | | 12,300 | | | | 263,476 | |
Komori Corp. | | | 18,900 | | | | 188,670 | |
Konaka Co., Ltd. | | | 7,300 | | | | 29,173 | |
Kondotec, Inc. | | | 7,900 | | | | 71,110 | |
Konishi Co., Ltd. | | | 9,900 | | | | 149,458 | |
Konoike Transport Co., Ltd. | | | 3,200 | | | | 46,371 | |
Kosaido Co., Ltd. | | | 3,700 | | | | 12,971 | |
Koshidaka Holdings Co., Ltd. | | | 10,000 | | | | 119,267 | |
Kotobuki Spirits Co., Ltd. | | | 6,000 | | | | 229,101 | |
Kourakuen Holdings Corp. (a) | | | 2,900 | | | | 69,502 | |
Kozo Keikaku Engineering, Inc. | | | 700 | | | | 12,840 | |
Krosaki Harima Corp. | | | 1,900 | | | | 113,972 | |
KRS Corp. | | | 2,200 | | | | 41,347 | |
KU Holdings Co., Ltd. | | | 8,000 | | | | 58,492 | |
Kumagai Gumi Co., Ltd. | | | 9,100 | | | | 271,928 | |
Kumiai Chemical Industry Co., Ltd. | | | 21,195 | | | | 124,551 | |
Kura Corp. | | | 3,300 | | | | 162,910 | |
Kurabo Industries, Ltd. | | | 7,600 | | | | 172,801 | |
Kureha Corp. | | | 5,200 | | | | 285,864 | |
Kurimoto, Ltd. | | | 3,500 | | | | 43,980 | |
KYB Corp. | | | 7,400 | | | | 178,537 | |
Kyodo Printing Co., Ltd. | | | 3,000 | | | | 66,498 | |
|
| Japan—(Continued) | |
Kyoei Steel, Ltd. | | | 6,100 | | | | 91,399 | |
Kyokuto Boeki Kaisha, Ltd. | | | 1,800 | | | | 24,345 | |
Kyokuto Kaihatsu Kogyo Co., Ltd. | | | 11,400 | | | | 145,391 | |
Kyokuto Securities Co., Ltd. | | | 7,600 | | | | 80,779 | |
Kyokuyo Co., Ltd. | | | 3,500 | | | | 92,400 | |
KYORIN Holdings, Inc. | | | 15,500 | | | | 341,468 | |
Kyoritsu Maintenance Co., Ltd. | | | 6,018 | | | | 262,136 | |
Kyoritsu Printing Co., Ltd. | | | 6,800 | | | | 11,905 | |
Kyosan Electric Manufacturing Co., Ltd. | | | 16,000 | | | | 60,848 | |
Kyowa Electronic Instruments Co., Ltd. | | | 8,000 | | | | 26,534 | |
Kyowa Leather Cloth Co., Ltd. | | | 3,300 | | | | 23,489 | |
Kyushu Financial Group, Inc. | | | 4,000 | | | | 15,097 | |
LAC Co., Ltd. | | | 5,900 | | | | 72,905 | |
Lacto Japan Co., Ltd. | | | 700 | | | | 44,005 | |
Lasertec Corp. | | | 12,200 | | | | 306,133 | |
LEC, Inc. | | | 8,800 | | | | 129,315 | |
Leopalace21 Corp. | | | 82,400 | | | | 324,183 | |
Life Corp. | | | 4,400 | | | | 90,834 | |
LIFULL Co., Ltd. | | | 17,000 | | | | 114,156 | |
Like Co., Ltd. | | | 2,100 | | | | 23,712 | |
Linical Co., Ltd. | | | 1,700 | | | | 19,675 | |
Link And Motivation, Inc. | | | 8,900 | | | | 67,288 | |
Lintec Corp. | | | 10,300 | | | | 221,070 | |
Litalico, Inc. (a) | | | 900 | | | | 13,212 | |
Look Holdings, Inc. | | | 2,200 | | | | 19,363 | |
M&A Capital Partners Co., Ltd. (a) | | | 1,200 | | | | 40,842 | |
m-up, Inc. | | | 700 | | | | 10,616 | |
Macnica Fuji Electronics Holdings, Inc. | | | 14,550 | | | | 180,056 | |
Macromill, Inc. | | | 6,400 | | | | 82,525 | |
Maeda Kosen Co., Ltd. | | | 5,700 | | | | 138,234 | |
Maeda Road Construction Co., Ltd. | | | 16,000 | | | | 329,656 | |
Maezawa Kasei Industries Co., Ltd. | | | 5,700 | | | | 56,378 | |
Maezawa Kyuso Industries Co., Ltd. | | | 3,900 | | | | 65,758 | |
Makino Milling Machine Co., Ltd. | | | 8,000 | | | | 281,191 | |
Mamezou Holdings Co., Ltd. | | | 4,800 | | | | 41,016 | |
Mamiya-Op Co., Ltd. | | | 1,900 | | | | 15,204 | |
Mandom Corp. | | | 6,900 | | | | 188,406 | |
Mani, Inc. | | | 5,700 | | | | 214,536 | |
MarkLines Co., Ltd. | | | 1,600 | | | | 17,663 | |
Mars Engineering Corp. | | | 3,600 | | | | 72,021 | |
Marubun Corp. | | | 8,200 | | | | 50,246 | |
Marudai Food Co., Ltd. | | | 7,600 | | | | 119,326 | |
Marufuji Sheet Piling Co., Ltd. | | | 1,300 | | | | 25,230 | |
Maruha Nichiro Corp. | | | 8,700 | | | | 294,036 | |
Maruka Machinery Co., Ltd. | | | 900 | | | | 15,353 | |
Marumae Co., Ltd. | | | 1,000 | | | | 5,898 | |
Marusan Securities Co., Ltd. | | | 11,300 | | | | 78,468 | |
Maruwa Co., Ltd. | | | 3,700 | | | | 186,584 | |
Maruwa Unyu Kikan Co., Ltd. | | | 1,100 | | | | 27,310 | |
Maruyama Manufacturing Co., Inc. | | | 1,500 | | | | 17,278 | |
Maruzen CHI Holdings Co., Ltd. (a) | | | 11,900 | | | | 34,785 | |
Maruzen Showa Unyu Co., Ltd. | | | 4,600 | | | | 114,493 | |
Marvelous, Inc. | | | 9,500 | | | | 67,393 | |
Matching Service Japan Co., Ltd. | | | 1,200 | | | | 14,629 | |
Matsuda Sangyo Co., Ltd. | | | 5,900 | | | | 78,620 | |
Matsui Construction Co., Ltd. | | | 7,800 | | | | 52,195 | |
Matsuya Foods Co., Ltd. | | | 2,500 | | | | 82,630 | |
See accompanying notes to financial statements.
BHFTII-23
Brighthouse Funds Trust II
Brighthouse/Dimensional International Small Company Portfolio
Schedule of Investments as of December 31, 2018
Common Stocks—(Continued)
| | | | | | | | |
| Security Description | | Shares | | | Value | |
|
| Japan—(Continued) | |
Max Co., Ltd. | | | 11,000 | | | $ | 137,330 | |
Maxvalu Nishinihon Co., Ltd. | | | 2,400 | | | | 39,001 | |
Maxvalu Tokai Co., Ltd. | | | 3,500 | | | | 74,469 | |
MCJ Co., Ltd. | | | 14,000 | | | | 85,189 | |
MEC Co., Ltd. | | | 5,800 | | | | 55,833 | |
Media Do Holdings Co., Ltd. | | | 1,000 | | | | 19,445 | |
Medical Data Vision Co., Ltd. (a) (e) | | | 3,800 | | | | 31,277 | |
Medical System Network Co., Ltd. | | | 5,300 | | | | 18,021 | |
Megachips Corp. | | | 3,800 | | | | 79,592 | |
Megmilk Snow Brand Co., Ltd. | | | 8,000 | | | | 207,200 | |
Meidensha Corp. | | | 11,600 | | | | 147,202 | |
Meiji Shipping Co., Ltd. | | | 8,500 | | | | 25,331 | |
Meiko Electronics Co., Ltd. | | | 7,500 | | | | 122,031 | |
Meiko Network Japan Co., Ltd. | | | 7,200 | | | | 59,040 | |
Meisei Industrial Co., Ltd. | | | 13,500 | | | | 88,020 | |
Meitec Corp. | | | 7,700 | | | | 310,511 | |
Meito Sangyo Co., Ltd. | | | 3,000 | | | | 35,523 | |
Meiwa Corp. | | | 8,100 | | | | 28,432 | |
Meiwa Estate Co., Ltd. | | | 5,200 | | | | 26,631 | |
Menicon Co., Ltd. | | | 4,100 | | | | 103,997 | |
Mercuria Investment Co., Ltd. | | | 2,100 | | | | 13,074 | |
METAWATER Co., Ltd. | | | 1,300 | | | | 34,967 | |
Michinoku Bank, Ltd. (The) | | | 5,700 | | | | 88,998 | |
Micronics Japan Co., Ltd. | | | 1,400 | | | | 8,923 | |
Mie Kotsu Group Holdings, Inc. | | | 4,000 | | | | 21,733 | |
Mikuni Corp. | | | 3,000 | | | | 13,978 | |
Milbon Co., Ltd. | | | 7,320 | | | | 299,702 | |
MIMAKI ENGINEERING Co., Ltd. | | | 1,900 | | | | 14,345 | |
Mimasu Semiconductor Industry Co., Ltd. | | | 6,800 | | | | 81,542 | |
Ministop Co., Ltd. | | | 5,400 | | | | 101,368 | |
Miraca Holdings, Inc. | | | 10,200 | | | | 229,904 | |
Miraial Co., Ltd. | | | 2,900 | | | | 23,603 | |
Mirait Holdings Corp. | | | 24,080 | | | | 352,308 | |
Miroku Jyoho Service Co., Ltd. | | | 5,900 | | | | 132,234 | |
Misawa Homes Co., Ltd. | | | 6,700 | | | | 45,355 | |
Mitani Corp. | | | 6,900 | | | | 347,231 | |
Mitani Sekisan Co., Ltd. | | | 4,100 | | | | 96,266 | |
Mito Securities Co., Ltd. | | | 24,000 | | | | 55,990 | |
Mitsuba Corp. | | | 12,300 | | | | 69,686 | |
Mitsubishi Logisnext Co., Ltd. | | | 8,000 | | | | 76,905 | |
Mitsubishi Paper Mills, Ltd. | | | 12,000 | | | | 57,872 | |
Mitsubishi Pencil Co., Ltd. | | | 6,400 | | | | 125,769 | |
Mitsubishi Research Institute, Inc. | | | 2,000 | | | | 57,288 | |
Mitsubishi Shokuhin Co., Ltd. | | | 4,800 | | | | 122,197 | |
Mitsubishi Steel Manufacturing Co., Ltd. | | | 5,900 | | | | 85,771 | |
Mitsuboshi Belting, Ltd. | | | 8,500 | | | | 163,838 | |
Mitsui Engineering & Shipbuilding Co., Ltd. (a) | | | 30,000 | | | | 279,723 | |
MitsuiHigh-Tec, Inc. | | | 9,500 | | | | 73,208 | |
Mitsui Matsushima Co., Ltd. | | | 5,200 | | | | 63,963 | |
Mitsui Mining & Smelting Co., Ltd. | | | 11,600 | | | | 237,655 | |
Mitsui Sugar Co., Ltd. | | | 6,100 | | | | 154,431 | |
Mitsui-Soko Holdings Co., Ltd. (a) | | | 7,400 | | | | 126,851 | |
Mitsumura Printing Co., Ltd. | | | 500 | | | | 8,061 | |
Mitsuuroko Group Holdings Co., Ltd. | | | 12,900 | | | | 83,778 | |
Mixi, Inc. | | | 5,000 | | | | 105,542 | |
Miyaji Engineering Group, Inc. | | | 1,800 | | | | 31,102 | |
Miyazaki Bank, Ltd. (The) | | | 6,000 | | | | 157,438 | |
|
| Japan—(Continued) | |
Miyoshi Oil & Fat Co., Ltd. | | | 2,800 | | | | 26,575 | |
Mizuno Corp. | | | 6,600 | | | | 139,718 | |
Mochida Pharmaceutical Co., Ltd. | | | 3,200 | | | | 264,008 | |
Modec, Inc. | | | 3,000 | | | | 61,775 | |
Monex Group, Inc. | | | 65,600 | | | | 219,078 | |
Money Partners Group Co., Ltd. | | | 7,100 | | | | 17,621 | |
Monogatari Corp. (The) | | | 1,700 | | | | 136,218 | |
MORESCO Corp. | | | 2,500 | | | | 33,462 | |
Morinaga Milk Industry Co., Ltd. | | | 10,400 | | | | 293,087 | |
Morita Holdings Corp. | | | 11,200 | | | | 184,331 | |
Morozoff, Ltd. | | | 900 | | | | 40,974 | |
Mory Industries, Inc. | | | 2,800 | | | | 61,042 | |
Mr. Max Holdings, Ltd. | | | 10,500 | | | | 44,874 | |
MTI, Ltd. | | | 9,200 | | | | 52,422 | |
Mugen Estate Co., Ltd. | | | 400 | | | | 1,893 | |
Murakami Corp. | | | 3,000 | | | | 62,181 | |
Musashi Seimitsu Industry Co., Ltd. | | | 15,800 | | | | 222,483 | |
Musashino Bank, Ltd. (The) | | | 11,200 | | | | 258,649 | |
Mutoh Holdings Co., Ltd. | | | 900 | | | | 14,531 | |
Mynet, Inc. (a) | | | 1,000 | | | | 15,953 | |
N Field Co., Ltd. | | | 1,300 | | | | 11,347 | |
NAC Co., Ltd. | | | 3,600 | | | | 33,748 | |
Nachi-Fujikoshi Corp. (e) | | | 6,000 | | | | 206,732 | |
Nafco Co., Ltd. | | | 1,400 | | | | 19,659 | |
Nagaileben Co., Ltd. | | | 4,600 | | | | 98,069 | |
Nagano Bank, Ltd. (The) | | | 3,500 | | | | 53,004 | |
Nagano Keiki Co., Ltd. | | | 4,200 | | | | 28,881 | |
Nagase & Co., Ltd. | | | 10,300 | | | | 141,352 | |
Nagatanien Holdings Co., Ltd. | | | 4,000 | | | | 86,585 | |
Nagawa Co., Ltd. | | | 2,800 | | | | 140,439 | |
Nakabayashi Co., Ltd. | | | 5,500 | | | | 28,144 | |
Nakamuraya Co., Ltd. | | | 1,600 | | | | 61,186 | |
Nakanishi, Inc. | | | 8,000 | | | | 135,805 | |
Nakano Corp. | | | 4,000 | | | | 18,276 | |
Nakayama Steel Works, Ltd. | | | 6,300 | | | | 27,265 | |
Nakayamafuku Co., Ltd. | | | 2,000 | | | | 8,932 | |
Namura Shipbuilding Co., Ltd. | | | 18,956 | | | | 81,901 | |
Nanto Bank, Ltd. (The) | | | 9,200 | | | | 179,193 | |
Narasaki Sangyo Co., Ltd. | | | 800 | | | | 11,897 | |
Natori Co., Ltd. | | | 2,600 | | | | 39,463 | |
NEC Capital Solutions, Ltd. | | | 3,800 | | | | 53,242 | |
NEC Networks & System Integration Corp. | | | 7,800 | | | | 174,316 | |
NET One Systems Co., Ltd. | | | 17,300 | | | | 307,776 | |
Neturen Co., Ltd. | | | 9,800 | | | | 74,554 | |
New Japan Chemical Co., Ltd. (a) | | | 9,900 | | | | 13,345 | |
Nextage Co., Ltd. | | | 5,900 | | | | 58,783 | |
Nexyz Group Corp. | | | 1,300 | | | | 21,617 | |
Nice Holdings, Inc. | | | 3,100 | | | | 24,880 | |
Nichi-iko Pharmaceutical Co., Ltd. | | | 13,200 | | | | 194,746 | |
Nichia Steel Works, Ltd. | | | 13,000 | | | | 31,631 | |
Nichias Corp. | | | 16,500 | | | | 285,045 | |
Nichiban Co., Ltd. | | | 4,000 | | | | 69,228 | |
Nichicon Corp. | | | 20,100 | | | | 144,917 | |
Nichiden Corp. | | | 5,200 | | | | 75,398 | |
Nichiha Corp. | | | 9,000 | | | | 227,901 | |
NichiiGakkan Co., Ltd. | | | 11,800 | | | | 110,219 | |
Nichimo Co., Ltd. | | | 1,600 | | | | 23,807 | |
See accompanying notes to financial statements.
BHFTII-24
Brighthouse Funds Trust II
Brighthouse/Dimensional International Small Company Portfolio
Schedule of Investments as of December 31, 2018
Common Stocks—(Continued)
| | | | | | | | |
| Security Description | | Shares | | | Value | |
|
| Japan—(Continued) | |
Nichireki Co., Ltd. | | | 9,000 | | | $ | 86,021 | |
Nihon Chouzai Co., Ltd. | | | 1,660 | | | | 48,270 | |
Nihon Dempa Kogyo Co., Ltd. (a) | | | 7,600 | | | | 26,317 | |
Nihon Eslead Corp. | | | 2,700 | | | | 35,819 | |
Nihon Flush Co., Ltd. | | | 800 | | | | 12,709 | |
Nihon House Holdings Co., Ltd. | | | 15,000 | | | | 56,827 | |
Nihon Kagaku Sangyo Co., Ltd. | | | 3,000 | | | | 27,377 | |
Nihon Nohyaku Co., Ltd. (e) | | | 14,000 | | | | 64,500 | |
Nihon Parkerizing Co., Ltd. | | | 24,800 | | | | 286,362 | |
Nihon Plast Co., Ltd. | | | 2,500 | | | | 16,391 | |
Nihon Tokushu Toryo Co., Ltd. | | | 2,200 | | | | 26,144 | |
Nihon Yamamura Glass Co., Ltd. | | | 3,800 | | | | 53,916 | |
Nikkato Corp. | | | 300 | | | | 2,374 | |
Nikkiso Co., Ltd. | | | 18,600 | | | | 154,570 | |
Nikko Co., Ltd. | | | 1,800 | | | | 38,407 | |
Nikkon Holdings Co., Ltd. | | | 17,400 | | | | 415,052 | |
Nippon Air Conditioning Services Co., Ltd. | | | 9,600 | | | | 63,303 | |
Nippon Beet Sugar Manufacturing Co., Ltd. | | | 4,500 | | | | 73,863 | |
Nippon Carbide Industries Co., Inc. | | | 2,300 | | | | 36,774 | |
Nippon Carbon Co., Ltd. (e) | | | 1,700 | | | | 61,541 | |
Nippon Ceramic Co., Ltd. | | | 4,600 | | | | 97,534 | |
NipponChemi-Con Corp. | | | 5,900 | | | | 102,335 | |
Nippon Chemical Industrial Co., Ltd. | | | 3,000 | | | | 59,623 | |
Nippon Chemiphar Co., Ltd. | | | 800 | | | | 21,170 | |
Nippon Coke & Engineering Co., Ltd. | | | 71,000 | | | | 59,084 | |
Nippon Commercial Development Co., Ltd. | | | 2,500 | | | | 32,473 | |
Nippon Computer Dynamics Co., Ltd. | | | 1,700 | | | | 15,732 | |
Nippon Concrete Industries Co., Ltd. | | | 14,000 | | | | 32,432 | |
Nippon Denko Co., Ltd. | | | 43,865 | | | | 86,099 | |
Nippon Densetsu Kogyo Co., Ltd. | | | 12,500 | | | | 247,080 | |
Nippon Felt Co., Ltd. | | | 8,600 | | | | 35,442 | |
Nippon Filcon Co., Ltd. | | | 5,200 | | | | 22,616 | |
Nippon Fine Chemical Co., Ltd. | | | 4,300 | | | | 40,147 | |
Nippon Flour Mills Co., Ltd. | | | 22,500 | | | | 375,568 | |
Nippon Gas Co., Ltd. | | | 8,400 | | | | 307,020 | |
Nippon Hume Corp. | | | 8,200 | | | | 60,447 | |
Nippon Kanzai Co., Ltd. | | | 4,800 | | | | 83,301 | |
Nippon Kinzoku Co., Ltd. | | | 1,900 | | | | 19,051 | |
Nippon Kodoshi Corp. | | | 1,600 | | | | 23,925 | |
Nippon Koei Co., Ltd. | | | 5,000 | | | | 111,769 | |
Nippon Koshuha Steel Co., Ltd. | | | 3,100 | | | | 14,961 | |
Nippon Light Metal Holdings Co., Ltd. | | | 198,000 | | | | 399,122 | |
Nippon Paper Industries Co., Ltd. | | | 18,500 | | | | 330,334 | |
Nippon Parking Development Co., Ltd. | | | 65,100 | | | | 84,757 | |
Nippon Pillar Packing Co., Ltd. | | | 6,500 | | | | 71,965 | |
Nippon Piston Ring Co., Ltd. | | | 3,200 | | | | 54,586 | |
Nippon Rietec Co., Ltd. | | | 5,800 | | | | 77,739 | |
Nippon Road Co., Ltd. (The) | | | 2,700 | | | | 141,954 | |
Nippon Seiki Co., Ltd. | | | 15,000 | | | | 256,824 | |
Nippon Seisen Co., Ltd. | | | 1,200 | | | | 36,358 | |
Nippon Sharyo, Ltd. (a) | | | 2,600 | | | | 52,391 | |
Nippon Sheet Glass Co., Ltd. | | | 33,000 | | | | 248,725 | |
Nippon Signal Co., Ltd. | | | 18,700 | | | | 151,306 | |
Nippon Soda Co., Ltd. | | | 9,200 | | | | 223,077 | |
Nippon Steel & Sumikin Bussan Corp. | | | 5,196 | | | | 215,876 | |
Nippon Suisan Kaisha, Ltd. | | | 55,500 | | | | 309,348 | |
Nippon Systemware Co., Ltd. | | | 1,300 | | | | 21,512 | |
|
| Japan—(Continued) | |
Nippon Thompson Co., Ltd. | | | 23,200 | | | | 102,600 | |
Nippon Valqua Industries, Ltd. | | | 6,000 | | | | 122,031 | |
Nippon Yakin Kogyo Co., Ltd. | | | 54,000 | | | | 115,202 | |
Nipro Corp. | | | 17,400 | | | | 212,450 | |
Nishi-Nippon Financial Holdings, Inc. | | | 25,200 | | | | 221,206 | |
Nishi-Nippon Railroad Co., Ltd. | | | 12,200 | | | | 305,497 | |
Nishikawa Rubber Co., Ltd. | | | 1,200 | | | | 20,786 | |
Nishimatsu Construction Co., Ltd. | | | 19,400 | | | | 437,833 | |
Nishimatsuya Chain Co., Ltd. | | | 8,800 | | | | 71,718 | |
Nishio Rent All Co., Ltd. | | | 4,400 | | | | 131,398 | |
Nissan Shatai Co., Ltd. | | | 1,300 | | | | 11,456 | |
Nissan Tokyo Sales Holdings Co., Ltd. | | | 11,000 | | | | 30,889 | |
Nissei ASB Machine Co., Ltd. | | | 2,100 | | | | 67,595 | |
Nissei Corp. | | | 3,700 | | | | 39,330 | |
Nissei Plastic Industrial Co., Ltd. | | | 6,000 | | | | 49,693 | |
Nissha Co., Ltd. | | | 7,200 | | | | 85,009 | |
Nisshin Fudosan Co. | | | 12,300 | | | | 50,590 | |
Nisshin Oillio Group, Ltd. (The) | | | 10,200 | | | | 290,285 | |
Nisshin Steel Co., Ltd. (a) (d) | | | 6,196 | | | | 75,958 | |
Nisshinbo Holdings, Inc. | | | 41,320 | | | | 314,731 | |
Nissin Corp. | | | 6,000 | | | | 98,189 | |
Nissin Electric Co., Ltd. | | | 14,800 | | | | 107,798 | |
Nissin Kogyo Co., Ltd. | | | 15,200 | | | | 194,630 | |
Nissui Pharmaceutical Co., Ltd. | | | 5,100 | | | | 53,332 | |
Nitta Corp. | | | 6,800 | | | | 200,045 | |
Nitta Gelatin, Inc. | | | 4,500 | | | | 26,888 | |
Nittan Valve Co., Ltd. | | | 6,300 | | | | 16,899 | |
Nittetsu Mining Co., Ltd. | | | 2,200 | | | | 93,560 | |
Nitto Boseki Co., Ltd. | | | 9,800 | | | | 161,493 | |
Nitto FC Co., Ltd. | | | 4,500 | | | | 30,145 | |
Nitto Fuji Flour Milling Co., Ltd. | | | 400 | | | | 20,383 | |
Nitto Kogyo Corp. | | | 9,000 | | | | 142,876 | |
Nitto Kohki Co., Ltd. | | | 4,100 | | | | 79,438 | |
Nitto Seiko Co., Ltd. | | | 12,500 | | | | 60,440 | |
Nittoc Construction Co., Ltd. (e) | | | 11,050 | | | | 65,278 | |
Nittoku Engineering Co., Ltd. | | | 5,200 | | | | 94,793 | |
NJS Co., Ltd. | | | 3,300 | | | | 47,914 | |
Noevir Holdings Co., Ltd. | | | 3,600 | | | | 155,681 | |
Nohmi Bosai, Ltd. | | | 7,000 | | | | 116,394 | |
Nojima Corp. | | | 5,000 | | | �� | 100,132 | |
Nomura Co., Ltd. | | | 12,000 | | | | 274,673 | |
Noritake Co., Ltd. | | | 4,200 | | | | 171,979 | |
Noritsu Koki Co., Ltd. | | | 4,000 | | | | 54,078 | |
Noritz Corp. | | | 11,400 | | | | 162,740 | |
North Pacific Bank, Ltd. | | | 122,400 | | | | 325,851 | |
NS Tool Co., Ltd. | | | 1,300 | | | | 26,738 | |
NS United Kaiun Kaisha, Ltd. | | | 4,100 | | | | 111,214 | |
NSD Co., Ltd. | | | 10,670 | | | | 207,149 | |
Nuflare Technology, Inc. | | | 800 | | | | 36,021 | |
OAK Capital Corp. | | | 15,500 | | | | 17,909 | |
Oat Agrio Co., Ltd. | | | 200 | | | | 3,465 | |
Obara Group, Inc. | | | 3,500 | | | | 124,017 | |
Odelic Co., Ltd. | | | 1,000 | | | | 34,161 | |
Oenon Holdings, Inc. | | | 21,000 | | | | 66,179 | |
Ogaki Kyoritsu Bank, Ltd. (The) | | | 12,500 | | | | 249,349 | |
Ohashi Technica, Inc. | | | 4,600 | | | | 48,875 | |
Ohsho Food Service Corp. | | | 3,600 | | | | 236,604 | |
See accompanying notes to financial statements.
BHFTII-25
Brighthouse Funds Trust II
Brighthouse/Dimensional International Small Company Portfolio
Schedule of Investments as of December 31, 2018
Common Stocks—(Continued)
| | | | | | | | |
| Security Description | | Shares | | | Value | |
|
| Japan—(Continued) | |
Oiles Corp. | | | 8,000 | | | $ | 129,204 | |
Oita Bank, Ltd. (The) | | | 5,700 | | | | 173,819 | |
Okabe Co., Ltd. | | | 14,000 | | | | 111,231 | |
Okada Aiyon Corp. | | | 1,900 | | | | 24,367 | |
Okamoto Industries, Inc. | | | 3,200 | | | | 167,718 | |
Okamoto Machine Tool Works, Ltd. | | | 1,400 | | | | 28,420 | |
Okamura Corp. | | | 21,800 | | | | 278,549 | |
Okasan Securities Group, Inc. | | | 29,000 | | | | 127,747 | |
Okaya Electric Industries Co., Ltd. | | | 5,800 | | | | 18,404 | |
Oki Electric Industry Co., Ltd. | | | 22,700 | | | | 267,230 | |
Okinawa Cellular Telephone Co. | | | 4,400 | | | | 144,066 | |
Okinawa Electric Power Co., Inc. (The) | | | 16,883 | | | | 327,712 | |
OKK Corp. | | | 3,100 | | | | 21,635 | |
OKUMA Corp. | | | 6,600 | | | | 313,621 | |
Okumura Corp. | | | 11,400 | | | | 330,247 | |
Okura Industrial Co., Ltd. | | | 3,000 | | | | 50,304 | |
Okuwa Co., Ltd. | | | 10,000 | | | | 101,296 | |
Olympic Group Corp. | | | 4,900 | | | | 27,600 | |
ONO Sokki Co., Ltd. | | | 4,200 | | | | 21,208 | |
Onoken Co., Ltd. | | | 6,500 | | | | 95,244 | |
Onward Holdings Co., Ltd. | | | 49,000 | | | | 262,021 | |
Ootoya Holdings Co., Ltd. | | | 600 | | | | 11,913 | |
Open Door, Inc. (a) | | | 1,300 | | | | 30,176 | |
Optex Group Co., Ltd. | | | 9,400 | | | | 147,007 | |
Organo Corp. | | | 2,800 | | | | 66,177 | |
Origin Electric Co., Ltd. | | | 3,400 | | | | 51,295 | |
Oro Co., Ltd. | | | 100 | | | | 3,777 | |
Osaka Organic Chemical Industry, Ltd. | | | 5,900 | | | | 58,630 | |
Osaka Soda Co., Ltd. | | | 5,000 | | | | 111,625 | |
Osaka Steel Co., Ltd. | | | 5,900 | | | | 98,264 | |
OSAKA Titanium Technologies Co., Ltd. (e) | | | 4,100 | | | | 61,811 | |
Osaki Electric Co., Ltd. | | | 11,000 | | | | 66,882 | |
OSG Corp. | | | 13,300 | | | | 261,257 | |
OSJB Holdings Corp. | | | 11,600 | | | | 30,378 | |
Otsuka Kagu, Ltd. (a) (e) | | | 5,500 | | | | 15,458 | |
OUG Holdings, Inc. | | | 700 | | | | 15,408 | |
Outsourcing, Inc. (e) | | | 15,500 | | | | 150,752 | |
Oyo Corp. | | | 7,400 | | | | 74,543 | |
Pacific Industrial Co., Ltd. | | | 16,700 | | | | 221,222 | |
Pacific Metals Co., Ltd. (e) | | | 6,100 | | | | 149,133 | |
Pack Corp. (The) | | | 4,600 | | | | 127,048 | |
Pal Group Holdings Co., Ltd. | | | 3,800 | | | | 93,460 | |
Paramount Bed Holdings Co., Ltd. | | | 6,000 | | | | 248,293 | |
Parco Co., Ltd. | | | 8,100 | | | | 82,023 | |
Paris Miki Holdings, Inc. | | | 10,600 | | | | 40,834 | |
Pasco Corp. (a) | | | 1,200 | | | | 7,759 | |
Pasona Group, Inc. | | | 6,200 | | | | 64,110 | |
PC Depot Corp. | | | 1,900 | | | | 7,540 | |
PCI Holdings, Inc. | | | 900 | | | | 15,855 | |
Penta-Ocean Construction Co., Ltd. | | | 64,600 | | | | 354,977 | |
Pepper Food Service Co., Ltd. (e) | | | 2,700 | | | | 70,442 | |
Phil Co., Inc. (a) | | | 500 | | | | 16,465 | |
PIA Corp. | | | 700 | | | | 24,106 | |
Pilot Corp. | | | 1,900 | | | | 91,568 | |
Piolax, Inc. | | | 10,500 | | | | 208,648 | |
Pioneer Corp. (a) (e) | | | 117,700 | | | | 68,459 | |
Plenus Co., Ltd. | | | 7,800 | | | | 134,757 | |
|
| Japan—(Continued) | |
Poletowin Pitcrew Holdings, Inc. | | | 5,800 | | | | 49,265 | |
Press Kogyo Co., Ltd. | | | 37,000 | | | | 181,243 | |
Pressance Corp. | | | 10,400 | | | | 123,051 | |
Prestige International, Inc. | | | 13,400 | | | | 145,958 | |
Prima Meat Packers, Ltd. | | | 9,600 | | | | 172,612 | |
Pro-Ship, Inc. | | | 700 | | | | 14,562 | |
Pronexus, Inc. | | | 6,700 | | | | 62,613 | |
Proto Corp. | | | 4,400 | | | | 56,158 | |
PS Mitsubishi Construction Co., Ltd. | | | 8,800 | | | | 47,632 | |
Punch Industry Co., Ltd. | | | 2,700 | | | | 11,952 | |
Qol Co., Ltd. | | | 3,400 | | | | 51,286 | |
Quick Co., Ltd. | | | 1,600 | | | | 18,433 | |
Raccoon Co., Ltd. | | | 2,300 | | | | 14,591 | |
Raito Kogyo Co., Ltd. | | | 16,900 | | | | 226,640 | |
Rakus Co., Ltd. | | | 2,900 | | | | 45,348 | |
Rasa Industries, Ltd. | | | 2,600 | | | | 30,414 | |
Raysum Co., Ltd. | | | 3,000 | | | | 26,221 | |
RECOMM Co., Ltd. | | | 14,500 | | | | 22,829 | |
Relia, Inc. | | | 6,600 | | | | 53,954 | |
Remixpoint, Inc. | | | 6,300 | | | | 23,212 | |
Renaissance, Inc. | | | 2,800 | | | | 52,270 | |
RENOVA, Inc. (a) | | | 4,800 | | | | 34,545 | |
Renown, Inc. (a) | | | 29,200 | | | | 24,874 | |
Resort Solution Co., Ltd. | | | 400 | | | | 13,969 | |
Resorttrust, Inc. | | | 14,500 | | | | 214,067 | |
Retail Partners Co., Ltd. | | | 1,300 | | | | 13,196 | |
Rheon Automatic Machinery Co., Ltd. | | | 5,000 | | | | 62,000 | |
Rhythm Watch Co., Ltd. | | | 2,500 | | | | 43,205 | |
Riberesute Corp. | | | 4,300 | | | | 30,675 | |
Ricoh Leasing Co., Ltd. | | | 5,600 | | | | 167,918 | |
Ride On Express Holdings Co., Ltd. | | | 600 | | | | 7,637 | |
Right On Co., Ltd. | | | 5,900 | | | | 45,715 | |
Riken Corp. | | | 3,500 | | | | 160,731 | |
Riken Keiki Co., Ltd. | | | 6,000 | | | | 111,211 | |
Riken Technos Corp. | | | 15,000 | | | | 61,904 | |
Riken Vitamin Co., Ltd. | | | 2,700 | | | | 87,084 | |
Ringer Hut Co., Ltd. | | | 4,900 | | | | 101,993 | |
Rion Co., Ltd. | | | 2,200 | | | | 34,727 | |
Riso Kagaku Corp. | | | 9,458 | | | | 145,110 | |
Riso Kyoiku Co., Ltd. | | | 34,770 | | | | 145,577 | |
Rock Field Co., Ltd. | | | 6,600 | | | | 99,142 | |
Rokko Butter Co., Ltd. | | | 3,600 | | | | 69,542 | |
Roland DG Corp. | | | 3,000 | | | | 57,895 | |
Rorze Corp. | | | 1,900 | | | | 23,863 | |
Round One Corp. | | | 22,000 | | | | 227,409 | |
Royal Holdings Co., Ltd. | | | 8,300 | | | | 191,420 | |
Rozetta Corp. (a) | | | 200 | | | | 3,156 | |
RS Technologies Co., Ltd. | | | 700 | | | | 17,940 | |
Ryobi, Ltd. | | | 9,400 | | | | 227,341 | |
Ryoden Corp. | | | 4,500 | | | | 57,759 | |
Ryosan Co., Ltd. | | | 10,800 | | | | 286,136 | |
Ryoyo Electro Corp. | | | 7,800 | | | | 109,213 | |
S Foods, Inc. | | | 4,100 | | | | 153,622 | |
S&B Foods, Inc. | | | 1,200 | | | | 45,247 | |
S-Pool, Inc. | | | 700 | | | | 9,580 | |
Sac’s Bar Holdings, Inc. | | | 6,850 | | | | 69,531 | |
Sagami Rubber Industries Co., Ltd. | | | 1,000 | | | | 18,072 | |
See accompanying notes to financial statements.
BHFTII-26
Brighthouse Funds Trust II
Brighthouse/Dimensional International Small Company Portfolio
Schedule of Investments as of December 31, 2018
Common Stocks—(Continued)
| | | | | | | | |
| Security Description | | Shares | | | Value | |
|
| Japan—(Continued) | |
Saibu Gas Co., Ltd. | | | 12,200 | | | $ | 283,073 | |
Saizeriya Co., Ltd. | | | 9,200 | | | | 158,028 | |
Sakai Chemical Industry Co., Ltd. | | | 6,000 | | | | 124,328 | |
Sakai Heavy Industries, Ltd. | | | 1,400 | | | | 29,118 | |
Sakai Moving Service Co., Ltd. | | | 2,600 | | | | 141,701 | |
Sakai Ovex Co., Ltd. | | | 1,600 | | | | 26,759 | |
Sakata INX Corp. | | | 11,800 | | | | 129,849 | |
Sakura Internet, Inc. | | | 4,400 | | | | 16,973 | |
Sala Corp. | | | 12,900 | | | | 69,872 | |
SAMTY Co., Ltd. | | | 2,600 | | | | 29,792 | |
San Holdings, Inc. | | | 1,400 | | | | 28,645 | |
San ju San Financial Group, Inc. | | | 7,870 | | | | 122,501 | |
San-A Co., Ltd. | | | 5,700 | | | | 216,553 | |
San-Ai Oil Co., Ltd. | | | 20,000 | | | | 198,502 | |
San-In Godo Bank, Ltd. (The) | | | 59,000 | | | | 410,278 | |
Sanden Holdings Corp. (a) | | | 8,400 | | | | 57,313 | |
Sanei Architecture Planning Co., Ltd. | | | 3,500 | | | | 43,426 | |
Sangetsu Corp. | | | 17,200 | | | | 310,285 | |
Sanix, Inc. (a) | | | 7,800 | | | | 13,240 | |
Sanken Electric Co., Ltd. | | | 7,400 | | | | 137,172 | |
Sanki Engineering Co., Ltd. | | | 17,900 | | | | 184,354 | |
Sanko Metal Industrial Co., Ltd. | | | 1,000 | | | | 24,873 | |
Sankyo Frontier Co., Ltd. | | | 1,000 | | | | 33,048 | |
Sankyo Seiko Co., Ltd. | | | 13,400 | | | | 50,380 | |
Sankyo Tateyama, Inc. | | | 9,600 | | | | 102,073 | |
Sanoh Industrial Co., Ltd. | | | 10,100 | | | | 50,248 | |
Sanshin Electronics Co., Ltd. | | | 8,500 | | | | 152,463 | |
Sanyo Chemical Industries, Ltd. | | | 4,200 | | | | 195,084 | |
Sanyo Denki Co., Ltd. | | | 1,800 | | | | 58,927 | |
Sanyo Electric Railway Co., Ltd. | | | 4,000 | | | | 82,507 | |
Sanyo Housing Nagoya Co., Ltd. | | | 3,000 | | | | 25,713 | |
Sanyo Industries, Ltd. | | | 1,300 | | | | 22,216 | |
Sanyo Shokai, Ltd. | | | 5,100 | | | | 83,897 | |
Sanyo Special Steel Co., Ltd. | | | 8,600 | | | | 180,753 | |
Sapporo Holdings, Ltd. | | | 13,200 | | | | 274,024 | |
Sata Construction Co., Ltd. | | | 2,600 | | | | 9,175 | |
Sato Holdings Corp. | | | 6,900 | | | | 162,976 | |
Sato Shoji Corp. | | | 6,500 | | | | 52,367 | |
Satori Electric Co., Ltd. | | | 5,500 | | | | 43,403 | |
Sawada Holdings Co., Ltd. | | | 10,300 | | | | 86,483 | |
Sawai Pharmaceutical Co., Ltd. | | | 2,000 | | | | 94,792 | |
Saxa Holdings, Inc. | | | 2,400 | | | | 37,524 | |
SBS Holdings, Inc. | | | 6,900 | | | | 88,952 | |
Scala, Inc. | | | 2,300 | | | | 15,685 | |
Scroll Corp. | | | 13,100 | | | | 46,403 | |
Secom Joshinetsu Co., Ltd. | | | 900 | | | | 26,231 | |
Seed Co., Ltd. | | | 1,700 | | | | 19,846 | |
Seika Corp. | | | 4,200 | | | | 58,403 | |
Seikagaku Corp. | | | 700 | | | | 7,898 | |
Seikitokyu Kogyo Co., Ltd. (a) | | | 12,500 | | | | 68,692 | |
Seiko Holdings Corp. | | | 8,800 | | | | 168,041 | |
Seiren Co., Ltd. | | | 19,100 | | | | 313,799 | |
Sekisui Jushi Corp. | | | 10,200 | | | | 178,225 | |
Sekisui Plastics Co., Ltd. | | | 10,300 | | | | 87,248 | |
Senko Group Holdings Co., Ltd. | | | 31,000 | | | | 233,976 | |
Senshu Electric Co., Ltd. | | | 2,400 | | | | 60,594 | |
Senshu Ikeda Holdings, Inc. | | | 84,000 | | | | 230,526 | |
|
| Japan—(Continued) | |
Senshukai Co., Ltd. (a) | | | 11,000 | | | | 26,206 | |
SFP Holdings Co., Ltd. | | | 700 | | | | 9,936 | |
Shibaura Electronics Co., Ltd. | | | 2,800 | | | | 88,826 | |
Shibaura Mechatronics Corp. | | | 900 | | | | 27,970 | |
Shibusawa Warehouse Co., Ltd. (The) | | | 4,200 | | | | 61,614 | |
Shibuya Corp. | | | 4,800 | | | | 155,243 | |
Shidax Corp. | | | 9,600 | | | | 26,301 | |
SHIFT, Inc. (a) | | | 1,300 | | | | 42,925 | |
Shiga Bank, Ltd. (The) | | | 17,800 | | | | 415,352 | |
Shikibo, Ltd. | | | 4,700 | | | | 42,507 | |
Shikoku Bank, Ltd. (The) | | | 14,000 | | | | 150,228 | |
Shikoku Chemicals Corp. | | | 13,000 | | | | 121,666 | |
Shima Seiki Manufacturing, Ltd. | | | 4,600 | | | | 132,153 | |
Shimachu Co., Ltd. | | | 19,600 | | | | 530,624 | |
Shimane Bank, Ltd. (The) | | | 2,500 | | | | 15,428 | |
Shimizu Bank, Ltd. (The) | | | 3,400 | | | | 50,158 | |
Shimojima Co., Ltd. | | | 6,300 | | | | 56,738 | |
Shin Nippon Air Technologies Co., Ltd. | | | 4,600 | | | | 74,667 | |
Shin Nippon Biomedical Laboratories, Ltd. (a) | | | 2,500 | | | | 15,152 | |
Shin-Etsu Polymer Co., Ltd. | | | 16,900 | | | | 104,257 | |
Shin-Keisei Electric Railway Co., Ltd. | | | 2,900 | | | | 55,185 | |
Shinagawa Refractories Co., Ltd. | | | 2,000 | | | | 68,969 | |
Shindengen Electric Manufacturing Co., Ltd. | | | 2,800 | | | | 96,317 | |
Shinkawa, Ltd. (a) | | | 5,300 | | | | 18,495 | |
Shinko Electric Industries Co., Ltd. | | | 27,600 | | | | 174,056 | |
Shinko Plantech Co., Ltd. | | | 16,100 | | | | 169,736 | |
Shinko Shoji Co., Ltd. | | | 7,700 | | | | 123,725 | |
Shinko Wire Co., Ltd. | | | 1,200 | | | | 10,314 | |
Shinmaywa Industries, Ltd. | | | 34,000 | | | | 417,150 | |
Shinnihon Corp. | | | 10,200 | | | | 96,479 | |
Shinoken Group Co., Ltd. (e) | | | 7,100 | | | | 43,561 | |
Shinsho Corp. | | | 1,400 | | | | 30,936 | |
Shinwa Co., Ltd. | | | 3,900 | | | | 73,992 | |
Ship Healthcare Holdings, Inc. | | | 9,000 | | | | 334,095 | |
Shizuki Electric Co., Inc. | | | 8,000 | | | | 45,863 | |
Shizuoka Gas Co., Ltd. | | | 21,300 | | | | 164,944 | |
Shobunsha Publications, Inc. | | | 4,800 | | | | 18,635 | |
Shoei Co., Ltd. | | | 2,600 | | | | 87,762 | |
Shoei Foods Corp. | | | 3,400 | | | | 83,081 | |
Shofu, Inc. | | | 3,900 | | | | 38,432 | |
Shoko Co., Ltd. (a) | | | 1,900 | | | | 10,779 | |
Showa Aircraft Industry Co., Ltd. | | | 4,000 | | | | 46,116 | |
Showa Corp. | | | 17,600 | | | | 206,387 | |
Showa Sangyo Co., Ltd. | | | 6,600 | | | | 179,597 | |
SIGMAXYZ, Inc. | | | 1,200 | | | | 8,446 | |
Siix Corp. (e) | | | 9,600 | | | | 123,703 | |
Sinanen Holdings Co., Ltd. | | | 2,900 | | | | 63,395 | |
Sinfonia Technology Co., Ltd. | | | 8,400 | | | | 102,814 | |
Sinko Industries, Ltd. | | | 6,400 | | | | 86,077 | |
Sintokogio, Ltd. | | | 16,800 | | | | 136,715 | |
SKY Perfect JSAT Holdings, Inc. | | | 29,800 | | | | 126,719 | |
SMK Corp. | | | 2,300 | | | | 45,377 | |
SMS Co., Ltd. | | | 16,100 | | | | 255,728 | |
Snow Peak, Inc. | | | 900 | | | | 10,098 | |
SNT Corp. | | | 15,600 | | | | 49,384 | |
Soda Nikka Co., Ltd. | | | 7,000 | | | | 32,643 | |
Sodick Co., Ltd. | | | 16,800 | | | | 106,261 | |
See accompanying notes to financial statements.
BHFTII-27
Brighthouse Funds Trust II
Brighthouse/Dimensional International Small Company Portfolio
Schedule of Investments as of December 31, 2018
Common Stocks—(Continued)
| | | | | | | | |
| Security Description | | Shares | | | Value | |
|
| Japan—(Continued) | |
Soft99 Corp. | | | 5,100 | | | $ | 42,489 | |
Softbank Technology Corp. | | | 3,200 | | | | 51,619 | |
Softbrain Co., Ltd. | | | 3,500 | | | | 13,866 | |
Softcreate Holdings Corp. | | | 700 | | | | 8,384 | |
Software Service, Inc. | | | 1,200 | | | | 88,000 | |
Sogo Medical Holdings Co., Ltd. | | | 4,800 | | | | 90,614 | |
Solasto Corp. | | | 8,400 | | | | 84,721 | |
Soliton Systems KK | | | 600 | | | | 3,846 | |
Sotoh Co., Ltd. | | | 3,100 | | | | 26,539 | |
Sourcenext Corp. (e) | | | 11,800 | | | | 59,047 | |
Space Co., Ltd. | | | 5,060 | | | | 55,636 | |
Space Value Holdings Co., Ltd. | | | 9,000 | | | | 77,394 | |
Sparx Group Co., Ltd. | | | 35,900 | | | | 61,007 | |
SPK Corp. | | | 1,700 | | | | 35,175 | |
SRA Holdings | | | 3,100 | | | | 73,457 | |
Srg Takamiya Co., Ltd. | | | 5,200 | | | | 36,073 | |
SRS Holdings Co., Ltd. | | | 2,700 | | | | 24,346 | |
St. Marc Holdings Co., Ltd. | | | 5,100 | | | | 113,212 | |
Star Mica Co., Ltd. | | | 2,400 | | | | 33,333 | |
Star Micronics Co., Ltd. | | | 4,400 | | | | 59,196 | |
Starts Corp., Inc. | | | 6,300 | | | | 139,305 | |
Starzen Co., Ltd. | | | 2,500 | | | | 85,881 | |
Stella Chemifa Corp. | | | 3,600 | | | | 83,368 | |
Step Co., Ltd. | | | 4,100 | | | | 48,414 | |
Strike Co., Ltd. | | | 1,300 | | | | 19,053 | |
Studio Alice Co., Ltd. | | | 2,900 | | | | 60,928 | |
Subaru Enterprise Co., Ltd. | | | 100 | | | | 4,864 | |
Sugimoto & Co., Ltd. | | | 3,800 | | | | 60,676 | |
Sumida Corp. | | | 6,300 | | | | 71,566 | |
Suminoe Textile Co., Ltd. | | | 2,300 | | | | 50,389 | |
Sumitomo Densetsu Co., Ltd. | | | 5,400 | | | | 88,965 | |
Sumitomo Mitsui Construction Co., Ltd. | | | 52,060 | | | | 315,546 | |
Sumitomo Osaka Cement Co., Ltd. | | | 12,500 | | | | 512,419 | |
Sumitomo Precision Products Co., Ltd. | | | 1,200 | | | | 32,364 | |
Sumitomo Riko Co., Ltd. | | | 15,300 | | | | 126,492 | |
Sumitomo Seika Chemicals Co., Ltd. | | | 3,200 | | | | 123,714 | |
Sumitomo Warehouse Co., Ltd. (The) | | | 26,500 | | | | 324,380 | |
Sun Frontier Fudousan Co., Ltd. | | | 7,600 | | | | 74,262 | |
Sun-Wa Technos Corp. | | | 3,900 | | | | 36,367 | |
Suncall Corp. | | | 8,300 | | | | 43,634 | |
Sushiro Global Holdings, Ltd. | | | 2,900 | | | | 157,806 | |
SWCC Showa Holdings Co., Ltd. | | | 7,600 | | | | 42,094 | |
Systena Corp. | | | 20,000 | | | | 230,427 | |
Syuppin Co., Ltd. | | | 2,600 | | | | 16,947 | |
T Hasegawa Co., Ltd. (e) | | | 8,400 | | | | 118,849 | |
T RAD Co., Ltd. | | | 2,900 | | | | 60,655 | |
T&K Toka Co., Ltd. | | | 8,600 | | | | 79,278 | |
T-Gaia Corp. | | | 6,500 | | | | 122,418 | |
Tachi-S Co., Ltd. | | | 10,300 | | | | 134,237 | |
Tachibana Eletech Co., Ltd. | | | 5,640 | | | | 79,375 | |
Tadano, Ltd. | | | 22,800 | | | | 204,507 | |
Taihei Dengyo Kaisha, Ltd. | | | 6,000 | | | | 134,605 | |
Taiheiyo Kouhatsu, Inc. | | | 2,100 | | | | 14,450 | |
Taiho Kogyo Co., Ltd. | | | 6,400 | | | | 56,082 | |
Taikisha, Ltd. | | | 9,100 | | | | 240,158 | |
Taiko Bank, Ltd. (The) | | | 3,100 | | | | 51,026 | |
Taisei Lamick Co., Ltd. | | | 2,200 | | | | 58,375 | |
|
| Japan—(Continued) | |
Taiyo Holdings Co., Ltd. | | | 5,300 | | | | 148,607 | |
Takachiho Koheki Co., Ltd. | | | 400 | | | | 3,499 | |
Takamatsu Construction Group Co., Ltd. | | | 5,400 | | | | 136,306 | |
Takano Co., Ltd. | | | 4,600 | | | | 34,239 | |
Takaoka Toko Co., Ltd. | | | 4,365 | | | | 54,458 | |
Takara Leben Co., Ltd. | | | 28,600 | | | | 78,179 | |
Takara Printing Co., Ltd. | | | 1,300 | | | | 19,495 | |
Takara Standard Co., Ltd. | | | 14,400 | | | | 217,180 | |
Takasago International Corp. | | | 5,400 | | | | 166,636 | |
Takasago Thermal Engineering Co., Ltd. | | | 16,800 | | | | 271,705 | |
Takashima & Co., Ltd. | | | 2,500 | | | | 39,141 | |
Take And Give Needs Co., Ltd. | | | 4,010 | | | | 62,245 | |
Takeei Corp. | | | 8,200 | | | | 47,517 | |
Takeuchi Manufacturing Co., Ltd. | | | 10,000 | | | | 152,536 | |
Takihyo Co., Ltd. | | | 2,000 | | | | 30,933 | |
Takisawa Machine Tool Co., Ltd. | | | 2,200 | | | | 27,210 | |
Takuma Co., Ltd. | | | 25,000 | | | | 311,463 | |
Tama Home Co., Ltd. | | | 5,900 | | | | 54,479 | |
Tamron Co., Ltd. | | | 6,000 | | | | 85,468 | |
Tamura Corp. | | | 26,000 | | | | 124,917 | |
Tanseisha Co., Ltd. | | | 11,750 | | | | 117,216 | |
Tateru, Inc. (e) | | | 3,600 | | | | 9,782 | |
Tatsuta Electric Wire and Cable Co., Ltd. | | | 17,000 | | | | 74,879 | |
Tayca Corp. | | | 6,000 | | | | 89,158 | |
Tazmo Co., Ltd. | | | 900 | | | | 5,414 | |
TBK Co., Ltd. | | | 8,000 | | | | 29,426 | |
TDC Soft, Inc. | | | 2,400 | | | | 17,717 | |
Teac Corp. (a) | | | 4,000 | | | | 6,768 | |
TechMatrix Corp. | | | 2,900 | | | | 43,999 | |
TECHNO ASSOCIE Co., Ltd. | | | 300 | | | | 3,141 | |
Techno Medica Co., Ltd. | | | 2,400 | | | | 45,647 | |
Techno Ryowa, Ltd. | | | 4,800 | | | | 37,365 | |
TechnoPro Holdings, Inc. | | | 3,400 | | | | 138,881 | |
Tecnos Japan, Inc. | | | 2,000 | | | | 12,454 | |
Teikoku Electric Manufacturing Co., Ltd. | | | 6,800 | | | | 80,367 | |
TeikokuSen-I Co., Ltd. | | | 6,900 | | | | 135,103 | |
Teikoku Tsushin Kogyo Co., Ltd. | | | 3,000 | | | | 31,705 | |
Tenma Corp. | | | 6,200 | | | | 103,394 | |
Tenpos Holdings Co., Ltd. | | | 700 | | | | 12,387 | |
Teraoka Seisakusho Co., Ltd. | | | 200 | | | | 927 | |
Terilogy Co., Ltd. (a) | | | 1,600 | | | | 15,585 | |
Tigers Polymer Corp. | | | 2,200 | | | | 12,263 | |
TKC Corp. | | | 6,700 | | | | 236,510 | |
Toa Corp. | | | 9,600 | | | | 86,653 | |
Toa Corp. | | | 5,800 | | | | 69,008 | |
Toa Oil Co., Ltd. | | | 3,200 | | | | 44,785 | |
TOA ROAD Corp. | | | 1,800 | | | | 50,743 | |
Toabo Corp. (a) | | | 3,400 | | | | 14,289 | |
Toagosei Co., Ltd. | | | 37,000 | | | | 411,059 | |
Tobishima Corp. | | | 5,560 | | | | 70,991 | |
TOC Co., Ltd. | | | 15,800 | | | | 104,846 | |
Tocalo Co., Ltd. | | | 19,200 | | | | 147,191 | |
Tochigi Bank, Ltd. (The) | | | 38,200 | | | | 86,751 | |
Toda Kogyo Corp. | | | 1,100 | | | | 22,118 | |
Toei Animation Co., Ltd. | | | 4,300 | | | | 159,226 | |
Toei Co., Ltd. | | | 2,500 | | | | 295,469 | |
Toell Co., Ltd. | | | 1,400 | | | | 8,435 | |
See accompanying notes to financial statements.
BHFTII-28
Brighthouse Funds Trust II
Brighthouse/Dimensional International Small Company Portfolio
Schedule of Investments as of December 31, 2018
Common Stocks—(Continued)
| | | | | | | | |
| Security Description | | Shares | | | Value | |
|
| Japan—(Continued) | |
Toenec Corp. | | | 3,200 | | | $ | 83,884 | |
Toho Bank, Ltd. (The) | | | 83,000 | | | | 235,461 | |
Toho Co., Ltd. | | | 2,700 | | | | 53,495 | |
Toho Holdings Co., Ltd. | | | 12,600 | | | | 306,769 | |
Toho Titanium Co., Ltd. | | | 4,500 | | | | 41,701 | |
Toho Zinc Co., Ltd. | | | 5,000 | | | | 151,817 | |
Tohoku Bank, Ltd. (The) | | | 4,700 | | | | 48,074 | |
Tohokushinsha Film Corp. | | | 4,800 | | | | 25,588 | |
Tohto Suisan Co., Ltd. | | | 1,400 | | | | 25,521 | |
Tokai Corp. | | | 7,800 | | | | 200,000 | |
TOKAI Holdings Corp. | | | 23,700 | | | | 189,117 | |
Tokai Lease Co., Ltd. | | | 1,600 | | | | 25,121 | |
Tokai Rika Co., Ltd. | | | 8,800 | | | | 144,877 | |
Tokai Tokyo Financial Holdings, Inc. | | | 45,600 | | | | 196,558 | |
Token Corp. | | | 2,460 | | | | 144,871 | |
Tokushu Tokai Paper Co., Ltd. | | | 3,300 | | | | 123,155 | |
Tokuyama Corp. | | | 12,600 | | | | 276,189 | |
Tokyo Base Co., Ltd. (a) | | | 2,200 | | | | 10,749 | |
Tokyo Dome Corp. | | | 31,000 | | | | 262,812 | |
Tokyo Electron Device, Ltd. | | | 2,400 | | | | 37,398 | |
Tokyo Energy & Systems, Inc. | | | 8,000 | | | | 70,661 | |
Tokyo Individualized Educational Institute, Inc. | | | 1,400 | | | | 13,075 | |
Tokyo Keiki, Inc. | | | 4,200 | | | | 35,371 | |
Tokyo Ohka Kogyo Co., Ltd. | | | 13,100 | | | | 348,274 | |
Tokyo Rakutenchi Co., Ltd. | | | 1,300 | | | | 56,624 | |
Tokyo Rope Manufacturing Co., Ltd. | | | 4,600 | | | | 39,201 | |
Tokyo Sangyo Co., Ltd. | | | 12,000 | | | | 54,342 | |
Tokyo Seimitsu Co., Ltd. | | | 13,800 | | | | 351,578 | |
Tokyo Steel Manufacturing Co., Ltd. | | | 36,800 | | | | 297,058 | |
Tokyo Tekko Co., Ltd. | | | 3,400 | | | | 34,683 | |
Tokyo Theatres Co., Inc. | | | 2,900 | | | | 32,147 | |
Tokyo TY Financial Group, Inc. | | | 9,724 | | | | 151,242 | |
Tokyotokeiba Co., Ltd. (e) | | | 3,100 | | | | 76,484 | |
Tokyu Construction Co., Ltd. | | | 2,900 | | | | 26,245 | |
Tokyu Recreation Co., Ltd. | | | 1,200 | | | | 51,233 | |
Toli Corp. | | | 20,000 | | | | 45,572 | |
Tomato Bank, Ltd. | | | 4,200 | | | | 41,893 | |
Tomen Devices Corp. | | | 1,500 | | | | 31,083 | |
Tomoe Corp. | | | 12,500 | | | | 39,262 | |
Tomoe Engineering Co., Ltd. | | | 2,100 | | | | 46,255 | |
Tomoegawa Co., Ltd. | | | 2,400 | | | | 21,468 | |
Tomoku Co., Ltd. | | | 5,400 | | | | 82,837 | |
TOMONY Holdings, Inc. | | | 56,900 | | | | 209,830 | |
Tomy Co., Ltd. | | | 22,400 | | | | 222,637 | |
Tonami Holdings Co., Ltd. | | | 2,200 | | | | 112,825 | |
Topcon Corp. | | | 19,200 | | | | 251,910 | |
Toppan Forms Co., Ltd. | | | 19,800 | | | | 154,848 | |
Topre Corp. | | | 11,900 | | | | 235,256 | |
Topy Industries, Ltd. | | | 6,800 | | | | 138,829 | |
Toridolll Holdings Corp. (e) | | | 6,900 | | | | 114,416 | |
Torigoe Co., Ltd. (The) | | | 7,100 | | | | 51,682 | |
Torii Pharmaceutical Co., Ltd. | | | 3,600 | | | | 79,695 | |
Torikizoku Co., Ltd. | | | 900 | | | | 14,759 | |
Torishima Pump Manufacturing Co., Ltd. | | | 7,700 | | | | 64,763 | |
Tosei Corp. | | | 13,200 | | | | 99,669 | |
Toshiba Machine Co., Ltd. (e) | | | 8,400 | | | | 149,391 | |
Toshiba Plant Systems & Services Corp. | | | 9,300 | | | | 172,142 | |
|
| Japan—(Continued) | |
Toshiba TEC Corp. | | | 3,600 | | | | 83,679 | |
Tosho Co., Ltd. | | | 4,800 | | | | 148,819 | |
Tosho Printing Co., Ltd. | | | 7,000 | | | | 43,002 | |
Totetsu Kogyo Co., Ltd. | | | 8,400 | | | | 230,829 | |
Tottori Bank, Ltd. (The) | | | 3,700 | | | | 47,671 | |
Toukei Computer Co., Ltd. | | | 1,400 | | | | 39,440 | |
Tow Co., Ltd. | | | 3,600 | | | | 23,254 | |
Towa Bank, Ltd. (The) | | | 11,500 | | | | 77,600 | |
Towa Corp. | | | 8,000 | | | | 42,106 | |
Towa Pharmaceutical Co., Ltd. | | | 2,800 | | | | 197,138 | |
Toyo Construction Co., Ltd. | | | 25,499 | | | | 87,227 | |
Toyo Corp. | | | 9,600 | | | | 70,977 | |
Toyo Denki Seizo KK | | | 3,200 | | | | 35,297 | |
Toyo Engineering Corp. (a) (e) | | | 7,600 | | | | 43,840 | |
Toyo Ink SC Holdings Co., Ltd. (e) | | | 15,200 | | | | 336,816 | |
Toyo Kanetsu KK | | | 3,800 | | | | 77,418 | |
Toyo Machinery & Metal Co., Ltd. | | | 6,000 | | | | 29,288 | |
Toyo Securities Co., Ltd. | | | 23,000 | | | | 35,881 | |
Toyo Sugar Refining Co., Ltd. | | | 900 | | | | 8,484 | |
Toyo Tanso Co., Ltd. (e) | | | 4,600 | | | | 90,601 | |
Toyo Tire & Rubber Co., Ltd. | | | 12,100 | | | | 150,501 | |
Toyo Wharf & Warehouse Co., Ltd. | | | 2,500 | | | | 32,513 | |
Toyobo Co., Ltd. | | | 33,200 | | | | 455,530 | |
TPR Co., Ltd. | | | 7,300 | | | | 147,363 | |
Trancom Co., Ltd. | | | 2,300 | | | | 118,839 | |
Transaction Co., Ltd. | | | 1,400 | | | | 8,125 | |
Tri Chemical Laboratories, Inc. | | | 1,000 | | | | 35,372 | |
Trusco Nakayama Corp. | | | 10,900 | | | | 285,716 | |
Trust Tech, Inc. | | | 3,000 | | | | 74,762 | |
TSI Holdings Co., Ltd. | | | 28,205 | | | | 182,478 | |
Tsubaki Nakashima Co., Ltd. | | | 3,700 | | | | 54,053 | |
Tsubakimoto Chain Co. | | | 9,000 | | | | 293,722 | |
Tsubakimoto Kogyo Co., Ltd. | | | 1,600 | | | | 44,814 | |
Tsudakoma Corp. | | | 1,600 | | | | 24,942 | |
Tsugami Corp. | | | 17,000 | | | | 98,361 | |
Tsukada Global Holdings, Inc. | | | 7,200 | | | | 38,015 | |
Tsukamoto Corp. Co., Ltd. | | | 2,100 | | | | 19,107 | |
Tsukishima Kikai Co., Ltd. | | | 8,600 | | | | 99,693 | |
Tsukuba Bank, Ltd. | | | 34,500 | | | | 68,035 | |
Tsukui Corp. | | | 18,800 | | | | 141,876 | |
Tsurumi Manufacturing Co., Ltd. | | | 6,100 | | | | 106,744 | |
Tsutsumi Jewelry Co., Ltd. | | | 3,200 | | | | 53,803 | |
TV Asahi Holdings Corp. | | | 600 | | | | 10,701 | |
TV Tokyo Holdings Corp. | | | 3,700 | | | | 78,866 | |
TYK Corp. | | | 6,000 | | | | 20,066 | |
U-Shin, Ltd. (a) | | | 8,400 | | | | 74,397 | |
UACJ Corp. | | | 10,685 | | | | 207,861 | |
Uchida Yoko Co., Ltd. | | | 4,200 | | | | 100,538 | |
Ueki Corp. | | | 1,100 | | | | 22,776 | |
UKC Holdings Corp. | | | 5,000 | | | | 83,075 | |
Ulvac, Inc. | | | 8,700 | | | | 250,058 | |
UMC Electronics Co., Ltd. | | | 700 | | | | 11,228 | |
Umenohana Co., Ltd. | | | 600 | | | | 13,061 | |
Uniden Holdings Corp. | | | 2,500 | | | | 44,677 | |
Union Tool Co. | | | 3,400 | | | | 90,162 | |
Unipres Corp. | | | 13,900 | | | | 234,582 | |
United Arrows, Ltd. | | | 6,000 | | | | 191,691 | |
See accompanying notes to financial statements.
BHFTII-29
Brighthouse Funds Trust II
Brighthouse/Dimensional International Small Company Portfolio
Schedule of Investments as of December 31, 2018
Common Stocks—(Continued)
| | | | | | | | |
| Security Description | | Shares | | | Value | |
|
| Japan—(Continued) | |
United Super Markets Holdings, Inc. | | | 20,700 | | | $ | 226,061 | |
UNITED, Inc. | | | 2,200 | | | | 29,176 | |
Unitika, Ltd. (a) | | | 15,600 | | | | 65,544 | |
Unizo Holdings Co., Ltd. | | | 6,000 | | | | 112,201 | |
Usen-Next Holdings Co., Ltd. (a) | | | 2,700 | | | | 22,605 | |
Ushio, Inc. | | | 39,000 | | | | 412,438 | |
UT Group Co., Ltd. (a) | | | 7,600 | | | | 131,540 | |
Utoc Corp. | | | 5,100 | | | | 22,045 | |
Uzabase, Inc. (a) | | | 1,200 | | | | 17,966 | |
V Technology Co., Ltd. | | | 1,000 | | | | 114,405 | |
V-Cube, Inc. (a) | | | 2,100 | | | | 7,053 | |
Valor Holdings Co., Ltd. | | | 11,800 | | | | 285,795 | |
ValueCommerce Co., Ltd. | | | 3,200 | | | | 35,278 | |
Vector, Inc. | | | 4,800 | | | | 63,234 | |
VeriServe Corp. | | | 500 | | | | 21,227 | |
VIA Holdings, Inc. (a) | | | 1,600 | | | | 9,723 | |
Village Vanguard Co., Ltd. | | | 2,300 | | | | 19,495 | |
VINX Corp. | | | 1,000 | | | | 11,910 | |
Vision, Inc. (a) | | | 1,400 | | | | 47,890 | |
Vital KSK Holdings, Inc. | | | 14,200 | | | | 145,459 | |
Vitec Holdings Co., Ltd. | | | 3,700 | | | | 60,769 | |
Voyage Group, Inc. | | | 1,500 | | | | 14,368 | |
VT Holdings Co., Ltd. | | | 24,300 | | | | 91,162 | |
Wacoal Holdings Corp. | | | 13,400 | | | | 346,011 | |
Wacom Co., Ltd. | | | 23,300 | | | | 97,504 | |
Wakachiku Construction Co., Ltd. | | | 4,600 | | | | 64,985 | |
Wakamoto Pharmaceutical Co., Ltd. | | | 9,000 | | | | 23,283 | |
Wakita & Co., Ltd. | | | 15,300 | | �� | | 154,751 | |
Warabeya Nichiyo Holdings Co., Ltd. | | | 5,000 | | | | 88,026 | |
Waseda Academy Co., Ltd. | | | 700 | | | | 12,425 | |
Watahan & Co., Ltd. | | | 1,600 | | | | 32,705 | |
WATAMI Co., Ltd. | | | 7,600 | | | | 90,507 | |
WDB Holdings Co., Ltd. | | | 1,700 | | | | 36,520 | |
Weathernews, Inc. | | | 2,100 | | | | 54,020 | |
West Holdings Corp. | | | 7,200 | | | | 82,641 | |
Will Group, Inc. | | | 2,200 | | | | 16,828 | |
WIN-Partners Co., Ltd. | | | 2,500 | | | | 21,738 | |
WirelessGate, Inc. | | | 1,000 | | | | 3,627 | |
Wood One Co., Ltd. | | | 2,600 | | | | 24,600 | |
World Holdings Co., Ltd. | | | 1,200 | | | | 23,234 | |
Wowow, Inc. | | | 2,200 | | | | 60,413 | |
Xebio Holdings Co., Ltd. | | | 8,700 | | | | 99,740 | |
Y.A.C. Holdings Co., Ltd. | | | 3,900 | | | | 20,836 | |
YA-MAN, Ltd. | | | 4,400 | | | | 55,712 | |
Yachiyo Industry Co., Ltd. | | | 3,900 | | | | 23,581 | |
Yahagi Construction Co., Ltd. | | | 10,900 | | | | 69,499 | |
Yaizu Suisankagaku Industry Co., Ltd. | | | 4,400 | | | | 40,539 | |
Yakuodo Co., Ltd. | | | 1,600 | | | | 37,742 | |
YAMABIKO Corp. | | | 12,800 | | | | 117,992 | |
YAMADA Consulting Group Co., Ltd. | | | 1,600 | | | | 24,353 | |
Yamagata Bank, Ltd. (The) | | | 10,400 | | | | 198,935 | |
Yamaichi Electronics Co., Ltd. | | | 8,200 | | | | 86,804 | |
Yamanashi Chuo Bank, Ltd. (The) | | | 11,800 | | | | 151,041 | |
Yamatane Corp. | | | 3,400 | | | | 51,857 | |
Yamato Corp. | | | 6,600 | | | | 29,341 | |
Yamato International, Inc. | | | 6,700 | | | | 24,748 | |
Yamato Kogyo Co., Ltd. | | | 10,500 | | | | 244,717 | |
|
| Japan—(Continued) | |
Yamaya Corp. | | | 1,150 | | | | 23,135 | |
Yamazawa Co., Ltd. | | | 1,000 | | | | 15,891 | |
Yamazen Corp. | | | 19,500 | | | | 181,539 | |
Yaoko Co., Ltd. | | | 3,700 | | | | 203,228 | |
Yashima Denki Co., Ltd. | | | 7,500 | | | | 50,203 | |
Yasuda Logistics Corp. | | | 7,400 | | | | 52,869 | |
Yasunaga Corp. | | | 1,700 | | | | 20,633 | |
Yellow Hat, Ltd. | | | 5,800 | | | | 139,247 | |
Yodogawa Steel Works, Ltd. | | | 7,600 | | | | 151,882 | |
Yokogawa Bridge Holdings Corp. | | | 12,800 | | | | 192,251 | |
Yokohama Reito Co., Ltd. | | | 16,800 | | | | 139,322 | |
Yokowo Co., Ltd. | | | 5,200 | | | | 67,281 | |
Yomeishu Seizo Co., Ltd. | | | 3,000 | | | | 61,104 | |
Yomiuri Land Co., Ltd. | | | 1,300 | | | | 44,908 | |
Yondenko Corp. | | | 1,600 | | | | 37,830 | |
Yondoshi Holdings, Inc. | | | 4,600 | | | | 91,443 | |
Yorozu Corp. | | | 7,900 | | | | 98,711 | |
Yoshinoya Holdings Co., Ltd. | | | 4,900 | | | | 81,025 | |
Yossix Co., Ltd. | | | 400 | | | | 10,211 | |
Yuasa Funashoku Co., Ltd. | | | 1,300 | | | | 41,939 | |
Yuasa Trading Co., Ltd. | | | 5,800 | | | | 165,469 | |
Yuken Kogyo Co., Ltd. | | | 1,700 | | | | 28,869 | |
Yuki Gosei Kogyo Co., Ltd. | | | 6,000 | | | | 10,519 | |
Yume No. Machi Souzou Iinkai Co., Ltd. | | | 3,500 | | | | 41,252 | |
Yumeshin Holdings Co., Ltd. | | | 10,100 | | | | 72,389 | |
Yurtec Corp. | | | 12,000 | | | | 92,765 | |
Yushiro Chemical Industry Co., Ltd. | | | 3,700 | | | | 40,009 | |
Yutaka Giken Co., Ltd. | | | 600 | | | | 9,774 | |
Zappallas, Inc. (a) | | | 4,900 | | | | 16,096 | |
Zenrin Co., Ltd. | | | 10,950 | | | | 230,905 | |
ZIGExN Co., Ltd. (a) | | | 8,400 | | | | 39,194 | |
Zojirushi Corp. | | | 9,800 | | | | 86,642 | |
Zuiko Corp. | | | 1,000 | | | | 23,564 | |
Zuken, Inc. | | | 5,400 | | | | 73,944 | |
| | | | | | | | |
| | | | | | | 138,564,896 | |
| | | | | | | | |
|
| Jersey, Channel Islands—0.1% | |
Centamin plc | | | 342,133 | | | | 476,928 | |
| | | | | | | | |
|
| Jordan—0.1% | |
Hikma Pharmaceuticals plc | | | 21,469 | | | | 466,759 | |
| | | | | | | | |
|
| Kazakhstan—0.1% | |
KAZ Minerals plc | | | 42,164 | | | | 285,960 | |
| | | | | | | | |
|
| Liechtenstein—0.1% | |
Liechtensteinische Landesbank AG | | | 2,973 | | | | 194,017 | |
VP Bank AG | | | 803 | | | | 115,492 | |
| | | | | | | | |
| | | | | | | 309,509 | |
| | | | | | | | |
|
| Luxembourg—0.1% | |
APERAM S.A. | | | 21,182 | | | | 556,155 | |
L’Occitane International S.A. | | | 68,750 | | | | 124,985 | |
| | | | | | | | |
| | | | | | | 681,140 | |
| | | | | | | | |
See accompanying notes to financial statements.
BHFTII-30
Brighthouse Funds Trust II
Brighthouse/Dimensional International Small Company Portfolio
Schedule of Investments as of December 31, 2018
Common Stocks—(Continued)
| | | | | | | | |
| Security Description | | Shares | | | Value | |
|
| Macau—0.0% | |
Macau Legend Development, Ltd. | | | 359,000 | | | $ | 62,166 | |
| | | | | | | | |
|
| Malaysia—0.0% | |
Nam Cheong, Ltd. (a) | | | 321,000 | | | | 1,412 | |
| | | | | | | | |
|
| Malta—0.1% | |
Kindred Group plc | | | 49,604 | | | | 457,928 | |
| | | | | | | | |
|
| Monaco—0.1% | |
Endeavour Mining Corp. (a) (e) | | | 16,215 | | | | 265,341 | |
| | | | | | | | |
|
| Netherlands—2.9% | |
Aalberts Industries NV | | | 34,547 | | | | 1,143,800 | |
Accell Group | | | 11,127 | | | | 240,219 | |
Altice Europe NV - Class A (a) (e) | | | 57,865 | | | | 111,718 | |
AMG Advanced Metallurgical Group NV | | | 11,371 | | | | 363,833 | |
Amsterdam Commodities NV | | | 6,535 | | | | 130,320 | |
Arcadis NV (e) | | | 35,066 | | | | 426,283 | |
Argenx SE (a) | | | 4,113 | | | | 397,780 | |
ASM International NV | | | 19,662 | | | | 809,246 | |
Atrium European Real Estate, Ltd. (a) | | | 66,764 | | | | 246,846 | |
Basic-Fit NV (a) | | | 6,680 | | | | 198,039 | |
BE Semiconductor Industries NV (e) | | | 37,120 | | | | 779,257 | |
Beter Bed Holding NV | | | 5,373 | | | | 22,068 | |
BinckBank NV | | | 28,201 | | | | 196,757 | |
Boskalis Westminster | | | 23,702 | | | | 586,699 | |
Brack Capital Properties NV (a) | | | 716 | | | | 68,374 | |
Brunel International NV | | | 9,034 | | | | 112,420 | |
Corbion NV | | | 20,382 | | | | 570,108 | |
Euronext NV | | | 16,910 | | | | 971,157 | |
Flow Traders | | | 9,083 | | | | 290,119 | |
ForFarmers NV | | | 4,418 | | | | 40,638 | |
Fugro NV (a) (e) | | | 22,630 | | | | 194,312 | |
Funcom NV (a) | | | 17,843 | | | | 24,723 | |
Gemalto NV (a) | | | 19,133 | | | | 1,110,351 | |
GrandVision NV | | | 5,364 | | | | 117,614 | |
Heijmans NV (a) | | | 11,179 | | | | 101,951 | |
Hunter Douglas NV | | | 2,423 | | | | 161,112 | |
IMCD Group NV | | | 10,589 | | | | 676,238 | |
Intertrust NV | | | 14,607 | | | | 245,268 | |
KAS Bank NV | | | 6,580 | | | | 44,418 | |
Kendrion NV | | | 4,048 | | | | 96,747 | |
Koninklijke BAM Groep NV (e) | | | 112,237 | | | | 321,005 | |
Koninklijke Vopak NV | | | 13,904 | | | | 629,857 | |
Lucas Bols B.V. (a) (d) | | | 1,325 | | | | 23,214 | |
Nederland Apparatenfabriek | | | 2,241 | | | | 105,758 | |
New World Resources plc - A Shares (a) (b) | | | 11,898 | | | | 7 | |
OCI NV (a) (e) | | | 16,061 | | | | 326,004 | |
Ordina NV | | | 44,115 | | | | 71,402 | |
PostNL NV | | | 180,576 | | | | 411,241 | |
Rhi Magnesita NV (d) (e) | | | 6,294 | | | | 311,126 | |
SBM Offshore NV | | | 72,035 | | | | 1,066,453 | |
Shop Apotheke Europe NV (a) | | | 2,106 | | | | 91,073 | |
SIF Holding NV (e) | | | 1,259 | | | | 16,742 | |
Signify NV | | | 23,840 | | | | 559,588 | |
Sligro Food Group NV | | | 10,629 | | | | 423,374 | |
SNS REAAL NV (a) (b) (c) | | | 105,329 | | | | 0 | |
|
| Netherlands—(Continued) | |
Takeaway.com NV (a) | | | 2,305 | | | | 154,916 | |
TKH Group NV | | | 13,932 | | | | 650,047 | |
TomTom NV (a) | | | 51,405 | | | | 462,865 | |
Van Lanschot Kempen NV | | | 2,558 | | | | 57,905 | |
Wessanen (e) | | | 31,675 | | | | 288,950 | |
| | | | | | | | |
| | | | | | | 16,449,942 | |
| | | | | | | | |
|
| New Zealand—0.8% | |
Abano Healthcare Group, Ltd. | | | 880 | | | | 3,818 | |
Air New Zealand, Ltd. | | | 109,511 | | | | 228,058 | |
Briscoe Group, Ltd. | | | 13,123 | | | | 29,770 | |
Chorus, Ltd. | | | 129,598 | | | | 421,368 | |
Ebos Group, Ltd. | | | 22,764 | | | | 306,974 | |
Eroad, Ltd. (a) | | | 4,808 | | | | 8,113 | |
Freightways, Ltd. | | | 38,693 | | | | 191,032 | |
Genesis Energy, Ltd. | | | 71,444 | | | | 124,885 | |
Gentrack Group, Ltd. | | | 7,810 | | | | 26,379 | |
Hallenstein Glasson Holdings, Ltd. | | | 19,012 | | | | 53,361 | |
Heartland Group Holdings, Ltd. | | | 72,313 | | | | 66,980 | |
Infratil, Ltd. | | | 173,171 | | | | 423,811 | |
Investore Property, Ltd. | | | 15,456 | | | | 15,856 | |
Kathmandu Holdings, Ltd. | | | 24,348 | | | | 44,649 | |
Mainfreight, Ltd. | | | 18,914 | | | | 390,284 | |
Methven, Ltd. | | | 19,898 | | | | 20,572 | |
Metlifecare, Ltd. | | | 34,148 | | | | 123,186 | |
Metro Performance Glass, Ltd. | | | 8,816 | | | | 3,308 | |
Michael Hill International, Ltd. | | | 82,929 | | | | 36,111 | |
New Zealand Refining Co., Ltd. (The) | | | 27,432 | | | | 43,307 | |
NZME, Ltd. | | | 71,247 | | | | 23,327 | |
NZX, Ltd. | | | 83,876 | | | | 56,817 | |
Pacific Edge, Ltd. (a) | | | 17,353 | | | | 3,941 | |
PGG Wrightson, Ltd. | | | 58,545 | | | | 20,037 | |
Port of Tauranga, Ltd. | | | 40,648 | | | | 136,508 | |
Pushpay Holdings, Ltd. (a) | | | 3,934 | | | | 8,332 | |
Restaurant Brands New Zealand, Ltd. | | | 33,397 | | | | 186,565 | |
Rubicon, Ltd. (a) | | | 9,922 | | | | 1,395 | |
Sanford, Ltd. | | | 314 | | | | 1,390 | |
Scales Corp., Ltd. | | | 16,784 | | | | 50,629 | |
Skellerup Holdings, Ltd. | | | 39,167 | | | | 53,164 | |
SKY Network Television, Ltd. | | | 114,579 | | | | 142,031 | |
SKYCITY Entertainment Group, Ltd. | | | 173,489 | | | | 412,747 | |
Summerset Group Holdings, Ltd. | | | 32,970 | | | | 141,133 | |
Synlait Milk, Ltd. (a) | | | 8,918 | | | | 53,517 | |
Tourism Holdings, Ltd. | | | 21,653 | | | | 74,913 | |
TOWER, Ltd. (a) | | | 59,836 | | | | 29,922 | |
Trade Me Group, Ltd. | | | 106,241 | | | | 453,819 | |
Trustpower, Ltd. | | | 13,980 | | | | 57,677 | |
Vector, Ltd. | | | 15,347 | | | | 34,320 | |
Warehouse Group, Ltd. (The) | | | 39,693 | | | | 54,618 | |
Z Energy, Ltd. | | | 25,432 | | | | 93,489 | |
| | | | | | | | |
| | | | | | | 4,652,113 | |
| | | | | | | | |
|
| Norway—0.9% | |
ABG Sundal Collier Holding ASA | | | 134,443 | | | | 70,740 | |
AF Gruppen ASA | | | 1,628 | | | | 24,907 | |
Akastor ASA (a) | | | 47,184 | | | | 70,947 | |
See accompanying notes to financial statements.
BHFTII-31
Brighthouse Funds Trust II
Brighthouse/Dimensional International Small Company Portfolio
Schedule of Investments as of December 31, 2018
Common Stocks—(Continued)
| | | | | | | | |
| Security Description | | Shares | | | Value | |
|
| Norway—(Continued) | |
Aker Solutions ASA (a) | | | 37,475 | | | $ | 172,452 | |
American Shipping Co. ASA (a) | | | 19,821 | | | | 76,179 | |
Archer, Ltd. (a) | | | 19,287 | | | | 9,616 | |
Atea ASA (a) | | | 19,449 | | | | 250,185 | |
Austevoll Seafood ASA | | | 22,546 | | | | 278,189 | |
Avance Gas Holding, Ltd. (a) | | | 14,826 | | | | 21,377 | |
Axactor SE (a) | | | 33,599 | | | | 72,912 | |
B2Holding ASA | | | 20,790 | | | | 29,354 | |
Bionor Pharma ASA | | | 3,359 | | | | 14,931 | |
Bonheur ASA | | | 10,311 | | | | 111,766 | |
Borregaard ASA | | | 26,596 | | | | 230,271 | |
BW Offshore, Ltd. (a) | | | 33,722 | | | | 124,726 | |
Data Respons ASA | | | 8,529 | | | | 22,130 | |
DNO ASA | | | 152,532 | | | | 222,436 | |
DOF ASA (a) | | | 47,311 | | | | 17,559 | |
Europris ASA (a) | | | 8,613 | | | | 22,945 | |
Frontline, Ltd. (a) | | | 24,306 | | | | 137,181 | |
Grieg Seafood ASA | | | 11,731 | | | | 137,926 | |
Hexagon Composites ASA | | | 28,187 | | | | 79,453 | |
Hoegh LNG Holdings, Ltd. | | | 13,626 | | | | 60,046 | |
IDEX Corp. (a) (e) | | | 53,185 | | | | 18,801 | |
Itera ASA | | | 17,553 | | | | 17,033 | |
Kongsberg Automotive ASA (a) | | | 176,177 | | | | 155,348 | |
Kongsberg Gruppen ASA | | | 8,787 | | | | 119,403 | |
Kvaerner ASA (a) | | | 60,872 | | | | 84,456 | |
Magnora ASA | | | 16,466 | | | | 12,346 | |
NEL ASA (a) | | | 221,285 | | | | 117,791 | |
Next Biometrics Group (a) | | | 1,748 | | | | 5,636 | |
Nordic Nanovector ASA (a) | | | 11,170 | | | | 65,227 | |
Nordic Semiconductor ASA (a) (e) | | | 36,041 | | | | 120,265 | |
Norway Royal Salmon ASA | | | 3,880 | | | | 80,280 | |
Norwegian Air Shuttle ASA (a) | | | 8,756 | | | | 174,221 | |
Norwegian Finans Holding ASA (a) | | | 19,332 | | | | 150,558 | |
Norwegian Property ASA | | | 46,727 | | | | 57,244 | |
Ocean Yield ASA | | | 12,183 | | | | 83,185 | |
Odfjell Drilling, Ltd. (a) | | | 15,318 | | | | 36,838 | |
Odfjell SE - A Shares | | | 1,949 | | | | 6,644 | |
Olav Thon Eiendomsselskap ASA | | | 1,135 | | | | 18,394 | |
Otello Corp. ASA (a) | | | 21,316 | | | | 32,613 | |
Panoro Energy ASA (a) (e) | | | 16,444 | | | | 22,750 | |
PetroleumGeo-Services ASA (a) | | | 73,446 | | | | 100,803 | |
PhotoCure ASA (a) (e) | | | 5,477 | | | | 30,373 | |
ProSafe SE (a) | | | 16,437 | | | | 25,344 | |
Protector Forsikring ASA (a) | | | 13,480 | | | | 74,717 | |
Q-Free ASA (a) | | | 24,256 | | | | 21,560 | |
Sbanken ASA | | | 17,156 | | | | 148,735 | |
Scatec Solar ASA | | | 26,893 | | | | 228,384 | |
Selvaag Bolig ASA | | | 7,900 | | | | 36,932 | |
Solstad Offshore ASA (a) (e) | | | 53,910 | | | | 10,814 | |
Spectrum ASA | | | 10,674 | | | | 45,239 | |
Stolt-Nielsen, Ltd. | | | 7,397 | | | | 87,334 | |
Treasure ASA | | | 21,003 | | | | 28,131 | |
Veidekke ASA | | | 28,524 | | | | 320,341 | |
Wilh Wilhelmsen Holding ASA - Class A | | | 4,777 | | | | 88,992 | |
XXL ASA | | | 17,225 | | | | 52,321 | |
| | | | | | | | |
| | | | | | | 4,937,281 | |
| | | | | | | | |
|
| Peru—0.0% | |
Hochschild Mining plc | | | 74,658 | | | | 148,006 | |
| | | | | | | | |
|
| Philippines—0.0% | |
Del Monte Pacific, Ltd. (a) | | | 77,636 | | | | 7,113 | |
| | | | | | | | |
|
| Portugal—0.4% | |
Altri SGPS S.A. | | | 27,747 | | | | 183,836 | |
Banco Comercial Portugues S.A. - Class R (a) | | | 2,143,248 | | | | 561,508 | |
Banco Espirito Santo S.A. (a) (b) (c) | | | 89,078 | | | | 0 | |
CTT-Correios de Portugal S.A. | | | 34,069 | | | | 114,756 | |
Mota-Engil SGPS S.A. (a) (e) | | | 40,942 | | | | 75,130 | |
Navigator Co. S.A. (The) | | | 71,289 | | | | 294,051 | |
NOS SGPS S.A. | | | 73,113 | | | | 442,516 | |
Novabase SGPS S.A. | | | 7,827 | | | | 18,128 | |
REN - Redes Energeticas Nacionais SGPS S.A. | | | 122,322 | | | | 340,933 | |
Semapa-Sociedade de Investimento e Gestao | | | 4,163 | | | | 62,521 | |
Sonae SGPS S.A. | | | 280,308 | | | | 259,803 | |
Teixeira Duarte S.A. (a) | | | 59,382 | | | | 9,175 | |
| | | | | | | | |
| | | | | | | 2,362,357 | |
| | | | | | | | |
|
| Russia—0.0% | |
Evraz plc | | | 13,430 | | | | 82,262 | |
Petropavlovsk plc (a) | | | 192,556 | | | | 15,506 | |
| | | | | | | | |
| | | | | | | 97,768 | |
| | | | | | | | |
|
| Singapore—1.1% | |
Abterra, Ltd. (a) (b) (d) | | | 51,720 | | | | 1,112 | |
Accordia Golf Trust | | | 74,500 | | | | 27,612 | |
AEM Holdings, Ltd. | | | 46,900 | | | | 28,073 | |
Ascendas India Trust | | | 171,500 | | | | 135,941 | |
ASL Marine Holdings, Ltd. (a) | | | 52,500 | | | | 2,273 | |
Avarga, Ltd. | | | 46,000 | | | | 6,513 | |
Baker Technology, Ltd. (a) | | | 33,200 | | | | 10,360 | |
Banyan Tree Holdings, Ltd. | | | 97,700 | | | | 40,926 | |
Best World International, Ltd. | | | 80,000 | | | | 154,525 | |
Bonvests Holdings, Ltd. | | | 18,000 | | | | 16,508 | |
Boustead Projects, Ltd. | | | 24,607 | | | | 14,789 | |
Boustead Singapore, Ltd. | | | 82,025 | | | | 48,105 | |
BreadTalk Group, Ltd. | | | 54,200 | | | | 32,609 | |
Bukit Sembawang Estates, Ltd. | | | 69,100 | | | | 286,443 | |
BW LPG, Ltd. (a) | | | 25,142 | | | | 75,710 | |
Centurion Corp., Ltd. | | | 38,000 | | | | 11,547 | |
China Aviation Oil Singapore Corp., Ltd. | | | 94,800 | | | | 73,796 | |
Chip Eng Seng Corp., Ltd. | | | 157,000 | | | | 75,706 | |
Chuan Hup Holdings, Ltd. | | | 125,000 | | | | 25,221 | |
CITIC Envirotech, Ltd. | | | 207,500 | | | | 57,904 | |
CNQC International Holdings, Ltd. | | | 82,500 | | | | 18,234 | |
COSCO Shipping International Singapore Co., Ltd. (a) | | | 272,500 | | | | 65,560 | |
Creative Technology, Ltd. (a) | | | 16,300 | | | | 45,406 | |
CSE Global, Ltd. | | | 197,000 | | | | 54,631 | |
CW Group Holdings, Ltd. (b) (c) (d) | | | 106,000 | | | | 2,346 | |
Delfi, Ltd. | | | 66,000 | | | | 63,417 | |
Dyna-Mac Holdings, Ltd. (a) | | | 98,000 | | | | 8,148 | |
Elec & Eltek International Co., Ltd. | | | 23,000 | | | | 29,900 | |
Ezion Holdings, Ltd. (a) | | | 753,729 | | | | 25,489 | |
Ezra Holdings, Ltd. (a) (b) (c) (d) | | | 1,000,703 | | | | 7,599 | |
See accompanying notes to financial statements.
BHFTII-32
Brighthouse Funds Trust II
Brighthouse/Dimensional International Small Company Portfolio
Schedule of Investments as of December 31, 2018
Common Stocks—(Continued)
| | | | | | | | |
| Security Description | | Shares | | | Value | |
|
| Singapore—(Continued) | |
Far East Orchard, Ltd. | | | 74,044 | | | $ | 65,188 | |
First Resources, Ltd. | | | 86,700 | | | | 97,719 | |
Food Empire Holdings, Ltd. | | | 54,000 | | | | 20,301 | |
Fragrance Group, Ltd. | | | 752,800 | | | | 74,880 | |
Gallant Venture, Ltd. (a) | | | 126,000 | | | | 12,283 | |
Geo Energy Resources, Ltd. | | | 155,000 | | | | 19,050 | |
GK Goh Holdings, Ltd. | | | 12,000 | | | | 7,968 | |
GL, Ltd. | | | 188,000 | | | | 101,415 | |
Golden Agri-Resources, Ltd. | | | 988,100 | | | | 177,119 | |
Golden Energy & Resources, Ltd. | | | 69,000 | | | | 11,134 | |
GuocoLand, Ltd. | | | 35,500 | | | | 46,747 | |
Halcyon Agri Corp., Ltd. | | | 188,713 | | | | 53,946 | |
Hanwell Holdings, Ltd. | | | 19,000 | | | | 2,411 | |
Haw Par Corp., Ltd. | | | 19,600 | | | | 172,691 | |
Hi-P International, Ltd. | | | 50,200 | | | | 32,293 | |
Hiap Hoe, Ltd. | | | 58,000 | | | | 37,023 | |
Ho Bee Land, Ltd. | | | 67,200 | | | | 116,842 | |
Hong Fok Corp., Ltd. | | | 146,740 | | | | 73,095 | |
Hong Leong Asia, Ltd. (a) | | | 82,000 | | | | 29,366 | |
Hong Leong Finance, Ltd. | | | 13,300 | | | | 24,754 | |
Hotel Grand Central, Ltd. | | | 25,900 | | | | 23,734 | |
Hour Glass, Ltd. (The) | | | 129,000 | | | | 59,076 | |
Hwa Hong Corp., Ltd. | | | 138,000 | | | | 29,363 | |
Hyflux, Ltd. (a) (b) (c) (d) | | | 179,500 | | | | 3,051 | |
iFAST Corp., Ltd. | | | 25,500 | | | | 20,016 | |
IGG, Inc. | | | 287,000 | | | | 389,626 | |
Indofood Agri Resources, Ltd. | | | 152,000 | | | | 21,226 | |
Japfa, Ltd. | | | 89,700 | | | | 47,837 | |
k1 Ventures, Ltd. (b) (c) | | | 80,800 | | | | 368 | |
Kenon Holdings, Ltd. | | | 2,312 | | | | 34,713 | |
Keppel Infrastructure Trust | | | 549,659 | | | | 195,139 | |
Keppel Telecommunications & Transportation, Ltd. | | | 44,000 | | | | 60,047 | |
Koh Brothers Group, Ltd. | | | 97,000 | | | | 15,301 | |
KSH Holdings, Ltd. | | | 25,700 | | | | 9,442 | |
Lian Beng Group, Ltd. | | | 116,900 | | | | 39,718 | |
Low Keng Huat Singapore, Ltd. | | | 122,600 | | | | 42,277 | |
Lum Chang Holdings, Ltd. | | | 115,000 | | | | 27,818 | |
M1, Ltd. | | | 89,500 | | | | 137,143 | |
Metro Holdings, Ltd. | | | 141,600 | | | | 104,848 | |
Mewah International, Inc. | | | 110,000 | | | | 17,756 | |
Midas Holdings, Ltd. (a) (b) (c) (d) | | | 452,000 | | | | 11,939 | |
mm2 Asia, Ltd. (a) | | | 76,600 | | | | 17,731 | |
NSL, Ltd. | | | 15,000 | | | | 12,326 | |
Overseas Union Enterprise, Ltd. | | | 119,200 | | | | 124,950 | |
Oxley Holdings, Ltd. | | | 142,164 | | | | 30,267 | |
Pan-United Corp., Ltd. | | | 53,750 | | | | 9,460 | |
Penguin International, Ltd. | | | 64,333 | | | | 14,130 | |
Q&M Dental Group Singapore, Ltd. | | | 41,800 | | | | 15,332 | |
QAF, Ltd. | | | 74,167 | | | | 31,797 | |
Raffles Education Corp., Ltd. (a) | | | 500,206 | | | | 41,624 | |
Raffles Medical Group, Ltd. | | | 151,385 | | | | 121,815 | |
RHT Health Trust | | | 84,400 | | | | 45,214 | |
Rickmers Maritime (a) (b) (c) | | | 110,000 | | | | 0 | |
Riverstone Holdings, Ltd. | | | 59,300 | | | | 49,552 | |
Roxy-Pacific Holdings, Ltd. | | | 94,325 | | | | 26,910 | |
SBS Transit, Ltd. | | | 40,500 | | | | 79,629 | |
Sembcorp Marine, Ltd. | | | 77,300 | | | | 86,882 | |
|
| Singapore—(Continued) | |
Sheng Siong Group, Ltd. | | | 133,900 | | | | 104,168 | |
SHS Holdings, Ltd. | | | 47,000 | | | | 6,483 | |
SIA Engineering Co., Ltd. | | | 51,000 | | | | 84,975 | |
SIIC Environment Holdings, Ltd. | | | 167,400 | | | | 33,771 | |
Sinarmas Land, Ltd. | | | 618,500 | | | | 113,410 | |
Sing Holdings, Ltd. | | | 82,000 | | | | 23,056 | |
Singapore Post, Ltd. | | | 314,800 | | | | 210,790 | |
Singapore Reinsurance Corp., Ltd. | | | 1,000 | | | | 209 | |
Stamford Land Corp., Ltd. | | | 278,000 | | | | 99,887 | |
StarHub, Ltd. | | | 107,000 | | | | 137,001 | |
Sunningdale Tech, Ltd. | | | 41,100 | | | | 43,165 | |
Swiber Holdings, Ltd. (a) (b) (c) (d) | | | 117,749 | | | | 1,762 | |
Tuan Sing Holdings, Ltd. | | | 169,000 | | | | 44,435 | |
UMS Holdings, Ltd. | | | 116,250 | | | | 48,156 | |
United Engineers, Ltd. | | | 138,000 | | | | 256,201 | |
United Industrial Corp., Ltd. | | | 13,600 | | | | 27,249 | |
United Overseas Insurance, Ltd. | | | 4,000 | | | | 19,516 | |
UOB-Kay Hian Holdings, Ltd. | | | 136,495 | | | | 116,951 | |
Vibrant Group, Ltd. (a) | | | 47,600 | | | | 4,994 | |
Vicom, Ltd. | | | 2,000 | | | | 8,805 | |
Wee Hur Holdings, Ltd. | | | 85,000 | | | | 13,037 | |
Wheelock Properties Singapore, Ltd. (b) (d) | | | 66,800 | | | | 102,924 | |
Wing Tai Holdings, Ltd. | | | 159,621 | | | | 225,685 | |
XP Power, Ltd. | | | 4,116 | | | | 110,386 | |
Yeo Hiap Seng, Ltd. | | | 19,712 | | | | 12,627 | |
Yongnam Holdings, Ltd. (a) | | | 241,875 | | | | 33,566 | |
| | | | | | | | |
| | | | | | | 6,503,894 | |
| | | | | | | | |
|
| South Africa—0.0% | |
Caledonia Mining Corp. plc | | | 1,300 | | | | 6,704 | |
Petra Diamonds, Ltd. (a) | | | 279,686 | | | | 133,666 | |
| | | | | | | | |
| | | | | | | 140,370 | |
| | | | | | | | |
|
| Spain—2.6% | |
Acciona S.A. | | | 7,805 | | | | 659,057 | |
Acerinox S.A. | | | 70,013 | | | | 694,893 | |
Alantra Partners S.A. | | | 4,852 | | | | 77,020 | |
Almirall S.A. | | | 20,705 | | | | 315,342 | |
Amper S.A. (a) (e) | | | 224,339 | | | | 60,866 | |
Applus Services S.A. | | | 33,014 | | | | 365,310 | |
Atresmedia Corp. de Medios de Comunicacion S.A. | | | 21,362 | | | | 106,176 | |
Azkoyen S.A. | | | 1,608 | | | | 12,037 | |
Baron de Ley (a) | | | 1,039 | | | | 129,743 | |
Bolsas y Mercados Espanoles SHMSF S.A. | | | 27,936 | | | | 777,004 | |
Caja de Ahorros del Mediterraneo (a) (b) (c) (d) | | | 14,621 | | | | 0 | |
Cellnex Telecom S.A. (a) | | | 33,924 | | | | 866,593 | |
Cia de Distribucion Integral Logista Holdings S.A. | | | 9,084 | | | | 227,054 | |
Cie Automotive S.A. | | | 17,266 | | | | 424,350 | |
Construcciones y Auxiliar de Ferrocarriles S.A. | | | 5,880 | | | | 242,989 | |
Distribuidora Internacional de Alimentacion S.A. (e) | | | 184,598 | | | | 96,959 | |
Duro Felguera S.A. (a) (e) | | | 925,200 | | | | 12,122 | |
Ebro Foods S.A. | | | 25,801 | | | | 514,471 | |
eDreams ODIGEO S.A. (a) | | | 14,588 | | | | 39,703 | |
Elecnor S.A. | | | 11,262 | | | | 169,986 | |
Enagas S.A. | | | 50,570 | | | | 1,365,521 | |
Ence Energia y Celulosa S.A | | | 61,968 | | | | 389,299 | |
See accompanying notes to financial statements.
BHFTII-33
Brighthouse Funds Trust II
Brighthouse/Dimensional International Small Company Portfolio
Schedule of Investments as of December 31, 2018
Common Stocks—(Continued)
| | | | | | | | |
| Security Description | | Shares | | | Value | |
|
| Spain—(Continued) | |
Ercros S.A. (e) | | | 60,314 | | | $ | 213,486 | |
Euskaltel S.A. | | | 9,150 | | | | 73,299 | |
Faes Farma S.A. | | | 131,897 | | | | 446,810 | |
Fluidra S.A. (a) | | | 16,366 | | | | 183,607 | |
Fomento de Construcciones y Contratas S.A. (a) | | | 4,419 | | | | 59,156 | |
Global Dominion Access S.A. (a) | | | 22,896 | | | | 112,494 | |
Grupo Catalana Occidente S.A. | | | 20,412 | | | | 761,540 | |
Grupo Empresarial San Jose S.A. (a) | | | 8,320 | | | | 43,744 | |
Grupo Ezentis S.A. (a) (e) | | | 78,251 | | | | 42,371 | |
Iberpapel Gestion S.A. | | | 1,128 | | | | 43,272 | |
Indra Sistemas S.A. (a) | | | 42,149 | | | | 397,294 | |
Laboratorios Farmaceuticos Rovi S.A. | | | 3,511 | | | | 70,115 | |
Liberbank S.A. (a) | | | 273,963 | | | | 136,675 | |
Masmovil Ibercom S.A. (a) | | | 2,894 | | | | 64,449 | |
Mediaset Espana Comunicacion S.A. | | | 49,361 | | | | 311,395 | |
Melia Hotels International S.A. | | | 24,250 | | | | 228,166 | |
Miquel y Costas & Miquel S.A. | | | 11,154 | | | | 215,907 | |
Obrascon Huarte Lain S.A. (e) | | | 35,775 | | | | 26,777 | |
Papeles y Cartones de Europa S.A. | | | 22,293 | | | | 428,583 | |
Parques Reunidos Servicios Centrales S.A. Unipersonal | | | 153 | | | | 1,888 | |
Pharma Mar S.A. (a) | | | 72,263 | | | | 89,896 | |
Prim S.A. | | | 3,013 | | | | 36,108 | |
Promotora de Informaciones S.A. - Class A (a) | | | 87,762 | | | | 175,924 | |
Prosegur Cia de Seguridad S.A. | | | 54,905 | | | | 278,208 | |
Quabit Inmobiliaria S.A. (a) | | | 21,835 | | | | 32,362 | |
Realia Business S.A. (a) | | | 143,011 | | | | 148,989 | |
Sacyr S.A. (e) | | | 115,740 | | | | 229,032 | |
Solaria Energia y Medio Ambiente S.A. (a) | | | 19,439 | | | | 87,374 | |
Talgo S.A. (a) | | | 15,339 | | | | 93,822 | |
Tecnicas Reunidas S.A. (e) | | | 11,115 | | | | 271,170 | |
Telepizza Group S.A. | | | 5,237 | | | | 35,322 | |
Tubacex S.A. (a) | | | 28,250 | | | | 80,885 | |
Tubos Reunidos S.A. (a) | | | 21,752 | | | | 3,534 | |
Vidrala S.A. | | | 7,634 | | | | 644,728 | |
Viscofan S.A. | | | 14,797 | | | | 815,675 | |
Vocento S.A. (a) | | | 18,128 | | | | 22,723 | |
Zardoya Otis S.A. | | | 32,950 | | | | 234,628 | |
| | | | | | | | |
| | | | | | | 14,687,903 | |
| | | | | | | | |
|
| Sweden—3.0% | |
Acando AB | | | 32,705 | | | | 107,830 | |
AddLife AB | | | 8,064 | | | | 186,061 | |
AddNode Group AB | | | 7,307 | | | | 85,182 | |
AddTech AB - B Shares | | | 21,786 | | | | 388,494 | |
AF AB - B Shares | | | 19,518 | | | | 354,122 | |
Ahlsell AB | | | 11,855 | | | | 69,594 | |
Ahlstrom-Munksjo Oyj (e) | | | 17,418 | | | | 241,738 | |
Alimak Group AB | | | 8,296 | | | | 103,091 | |
Arise AB (a) | | | 4,852 | | | | 9,309 | |
Arjo AB - B Shares | | | 32,933 | | | | 105,758 | |
Atrium Ljungberg AB - B Shares | | | 6,009 | | | | 103,178 | |
Attendo AB | | | 20,278 | | | | 180,397 | |
Avanza Bank Holding AB | | | 7,660 | | | | 366,971 | |
BE Group AB (a) | | | 1,962 | | | | 8,003 | |
Beijer Alma AB | | | 15,250 | | | | 223,564 | |
Beijer Electronics Group AB (a) | | | 7,843 | | | | 32,019 | |
|
| Sweden—(Continued) | |
Beijer Ref AB | | | 20,376 | | | | 334,680 | |
Bergman & Beving AB - B Shares | | | 12,796 | | | | 122,182 | |
Besqab AB | | | 1,061 | | | | 11,753 | |
Betsson AB (a) | | | 30,653 | | | | 252,980 | |
Bilia AB - A Shares | | | 34,008 | | | | 318,372 | |
BillerudKorsnas AB | | | 11,161 | | | | 133,181 | |
BioGaia AB - B Shares | | | 6,083 | | | | 217,687 | |
Biotage AB | | | 18,332 | | | | 226,364 | |
Bjorn Borg AB (a) | | | 9,936 | | | | 21,769 | |
Bonava AB | | | 928 | | | | 11,396 | |
Bonava AB - B Shares | | | 15,671 | | | | 202,253 | |
Bravida Holding AB | | | 36,168 | | | | 249,864 | |
Bufab AB | | | 7,973 | | | | 77,347 | |
Bulten AB | | | 3,161 | | | | 31,509 | |
Bure Equity AB | | | 17,448 | | | | 214,074 | |
Byggmax Group AB | | | 18,326 | | | | 66,075 | |
Catena AB | | | 5,959 | | | | 148,456 | |
Clas Ohlson AB - B Shares | | | 13,900 | | | | 121,157 | |
Cloetta AB - B Shares | | | 92,493 | | | | 254,249 | |
Coor Service Management Holding AB | | | 4,997 | | | | 39,757 | |
Corem Property Group AB - B Shares | | | 12,248 | | | | 14,777 | |
Dios Fastigheter AB | | | 35,250 | | | | 224,354 | |
Dometic Group AB | | | 22,651 | | | | 141,028 | |
Doro AB (a) | | | 3,391 | | | | 13,049 | |
Duni AB | | | 14,094 | | | | 156,334 | |
Dustin Group AB | | | 18,741 | | | | 155,323 | |
Eastnine AB | | | 7,088 | | | | 74,405 | |
Elanders AB - B Shares | | | 1,453 | | | | 14,276 | |
Enea AB (a) | | | 4,082 | | | | 46,873 | |
eWork Group AB | | | 2,864 | | | | 26,733 | |
Fabege AB | | | 5,274 | | | | 70,212 | |
Fagerhult AB (e) | | | 13,852 | | | | 119,234 | |
FastPartner AB | | | 5,698 | | | | 38,738 | |
Fingerprint Cards AB - Class B (a) | | | 28,890 | | | | 33,084 | |
Getinge AB - B Shares | | | 10,655 | | | | 96,640 | |
Granges AB | | | 19,836 | | | | 180,675 | |
Gunnebo AB | | | 12,816 | | | | 32,459 | |
Haldex AB | | | 16,480 | | | | 128,658 | |
Heba Fastighets AB | | | 944 | | | | 13,576 | |
Hembla AB (a) | | | 1,637 | | | | 27,385 | |
Hemfosa Fastigheter AB | | | 35,677 | | | | 281,874 | |
HIQ International AB (a) | | | 11,690 | | | | 62,558 | |
HMS Networks AB | | | 6,144 | | | | 85,370 | |
Hoist Finance AB | | | 3,999 | | | | 19,546 | |
Holmen AB - B Shares | | | 22,293 | | | | 441,317 | |
Humana AB | | | 5,221 | | | | 35,341 | |
Indutrade AB | | | 10,177 | | | | 236,631 | |
Inwido AB | | | 5,704 | | | | 35,746 | |
ITAB Shop Concept AB - Class B | | | 1,944 | | | | 3,300 | |
JM AB (e) | | | 23,748 | | | | 462,711 | |
KappAhl AB | | | 29,980 | | | | 58,697 | |
Klovern AB - B Shares | | | 158,702 | | | | 184,200 | |
Know It AB | | | 9,489 | | | | 164,239 | |
Kungsleden AB | | | 56,456 | | | | 400,992 | |
Lagercrantz Group AB - B Shares | | | 19,997 | | | | 194,642 | |
Lindab International AB | | | 21,316 | | | | 153,128 | |
Loomis AB - Class B | | | 18,371 | | | | 594,441 | |
See accompanying notes to financial statements.
BHFTII-34
Brighthouse Funds Trust II
Brighthouse/Dimensional International Small Company Portfolio
Schedule of Investments as of December 31, 2018
Common Stocks—(Continued)
| | | | | | | | |
| Security Description | | Shares | | | Value | |
|
| Sweden—(Continued) | |
Medivir AB - B Shares (a) | | | 10,470 | | | $ | 28,246 | |
Mekonomen AB | | | 9,225 | | | | 95,132 | |
Momentum Group AB - Class B | | | 12,796 | | | | 117,154 | |
MQ Holding AB | | | 9,112 | | | | 10,362 | |
Mycronic AB | | | 25,742 | | | | 344,661 | |
NCC AB - B Shares | | | 1,433 | | | | 22,351 | |
Nederman Holding AB | | | 4,695 | | | | 47,794 | |
Net Insight AB - Class B (a) | | | 74,697 | | | | 22,609 | |
NetEnt AB (a) | | | 45,991 | | | | 189,449 | |
New Wave Group AB - B Shares | | | 15,773 | | | | 84,304 | |
Nobia AB | | | 40,224 | | | | 223,187 | |
Nobina AB | | | 28,840 | | | | 195,170 | |
Nolato AB - B Shares | | | 9,452 | | | | 392,486 | |
Nordic Waterproofing Holding | | | 1,577 | | | | 12,684 | |
NP3 Fastigheter AB | | | 9,288 | | | | 64,024 | |
Nyfosa AB (a) | | | 35,677 | | | | 172,106 | |
OEM International AB - B Shares | | | 2,810 | | | | 60,386 | |
Opus Group AB (e) | | | 92,554 | | | | 50,052 | |
Orexo AB (a) | | | 3,585 | | | | 23,768 | |
Pandox AB | | | 2,349 | | | | 39,038 | |
Peab AB | | | 52,083 | | | | 426,729 | |
Platzer Fastigheter Holding AB - Class B | | | 8,865 | | | | 59,815 | |
Pricer AB - B Shares | | | 32,212 | | | | 33,825 | |
Proact IT Group AB | | | 2,832 | | | | 52,139 | |
Qliro Group AB (a) | | | 24,348 | | | | 25,264 | |
Ratos AB - B Shares | | | 45,770 | | | | 120,570 | |
RaySearch Laboratories AB (a) | | | 8,231 | | | | 89,774 | |
Recipharm AB - B Shares (a) | | | 10,924 | | | | 139,946 | |
Rottneros AB | | | 26,936 | | | | 25,169 | |
Sagax AB - Class B | | | 14,540 | | | | 212,458 | |
SAS AB (a) | | | 71,824 | | | | 169,070 | |
Scandi Standard AB | | | 15,006 | | | | 104,897 | |
Scandic Hotels Group AB | | | 14,577 | | | | 128,686 | |
Sectra AB - B Shares (a) | | | 5,545 | | | | 118,130 | |
Semcon AB | | | 5,540 | | | | 29,642 | |
Sensys Gatso Group AB (a) | | | 269,456 | | | | 55,654 | |
SkiStar AB | | | 9,076 | | | | 211,800 | |
Sweco AB - B Shares | | | 14,540 | | | | 323,687 | |
Systemair AB | | | 5,455 | | | | 59,575 | |
Thule Group AB | | | 29,592 | | | | 542,895 | |
Troax Group AB | | | 3,823 | | | | 110,199 | |
VBG Group AB - B Shares | | | 746 | | | | 10,704 | |
Victoria Park AB - B Shares | | | 5,633 | | | | 22,994 | |
Vitrolife AB | | | 14,622 | | | | 242,252 | |
Wallenstam AB - B Shares | | | 36,614 | | | | 339,351 | |
Wihlborgs Fastigheter AB | | | 53,876 | | | | 624,249 | |
| | | | | | | | |
| | | | | | | 17,117,399 | |
| | | | | | | | |
|
| Switzerland—5.1% | |
Allreal Holding AG (a) | | | 3,866 | | | | 601,881 | |
Alpiq Holding AG (a) | | | 156 | | | | 12,151 | |
ALSO Holding AG (a) | | | 1,366 | | | | 154,546 | |
APG SGA S.A. | | | 468 | | | | 157,327 | |
Arbonia AG (a) (e) | | | 10,560 | | | | 115,832 | |
Aryzta AG (a) (e) | | | 188,450 | | | | 209,292 | |
Ascom Holding AG (e) | | | 12,379 | | | | 171,456 | |
|
| Switzerland—(Continued) | |
Autoneum Holding AG | | | 1,187 | | | | 178,251 | |
Bachem Holding AG - Class B | | | 176 | | | | 20,400 | |
Banque Cantonale de Geneve | | | 750 | | | | 146,522 | |
Banque Cantonale Vaudoise | | | 443 | | | | 334,395 | |
Belimo Holding AG | | | 131 | | | | 525,823 | |
Bell Food Group AG | | | 880 | | | | 273,213 | |
Bellevue Group AG (a) | | | 3,322 | | | | 67,082 | |
Berner Kantonalbank AG | | | 1,950 | | | | 386,313 | |
BFW Liegenschaften AG (a) | | | 528 | | | | 22,889 | |
BKW AG | | | 4,798 | | | | 335,762 | |
Bobst Group S.A. | | | 3,743 | | | | 259,467 | |
Bossard Holding AG - Class A (e) | | | 2,139 | | | | 306,113 | |
Bucher Industries AG | | | 2,604 | | | | 702,521 | |
Burckhardt Compression Holding AG | | | 769 | | | | 180,760 | |
Burkhalter Holding AG | | | 1,291 | | | | 102,661 | |
Calida Holding AG (a) | | | 2,002 | | | | 61,796 | |
Carlo Gavazzi Holding AG | | | 48 | | | | 11,949 | |
Cembra Money Bank AG | | | 7,813 | | | | 620,169 | |
Cham Group AG (a) | | | 113 | | | | 47,591 | |
Cicor Technologies, Ltd. (a) | | | 644 | | | | 25,851 | |
Cie Financiere Tradition S.A. | | | 579 | | | | 60,198 | |
Coltene Holding AG | | | 1,308 | | | | 112,126 | |
Conzzeta AG | | | 325 | | | | 253,799 | |
Daetwyler Holding AG | | | 2,353 | | | | 299,488 | |
DKSH Holding AG | | | 6,626 | | | | 458,088 | |
dormakaba Holding AG (a) | | | 840 | | | | 506,069 | |
Dufry AG (a) (e) | | | 5,836 | | | | 554,266 | |
EDAG Engineering Group AG (a) | | | 2,461 | | | | 44,716 | |
EFG International AG (a) | | | 20,307 | | | | 119,165 | |
Emmi AG | | | 773 | | | | 536,638 | |
Energiedienst Holding AG | | | 3,530 | | | | 105,951 | |
Evolva Holding S.A. (a) | | | 36,339 | | | | 8,489 | |
Feintool International Holding AG (a) | | | 588 | | | | 44,970 | |
Fenix Outdoor International AG | | | 1,091 | | | | 105,670 | |
Ferrexpo plc | | | 89,833 | | | | 222,005 | |
Flughafen Zurich AG | | | 4,540 | | | | 749,801 | |
Forbo Holding AG | | | 313 | | | | 439,189 | |
GAM Holding AG (a) | | | 68,723 | | | | 271,611 | |
Georg Fischer AG | | | 1,225 | | | | 977,274 | |
Gurit Holding AG | | | 164 | | | | 144,965 | |
Helvetia Holding AG | | | 2,220 | | | | 1,299,456 | |
Hiag Immobilien Holding AG (a) | | | 1,150 | | | | 136,419 | |
Highlight Communications AG (a) | | | 7,829 | | | | 45,392 | |
HOCHDORF Holding AG (a) | | | 174 | | | | 18,038 | |
Huber & Suhner AG | | | 5,559 | | | | 372,229 | |
Implenia AG | | | 6,413 | | | | 215,657 | |
Inficon Holding AG (a) | | | 600 | | | | 304,438 | |
Interroll Holding AG | | | 226 | | | | 333,479 | |
Intershop Holding AG | | | 416 | | | | 206,609 | |
IWG plc | | | 206,169 | | | | 548,037 | |
Jungfraubahn Holding AG | | | 85 | | | | 10,848 | |
Kardex AG (a) | | | 2,247 | | | | 258,592 | |
Komax Holding AG | | | 1,292 | | | | 301,692 | |
Kudelski S.A. (a) (e) | | | 13,221 | | | | 76,047 | |
LEM Holding S.A. | | | 246 | | | | 262,423 | |
Logitech International S.A. | | | 27,277 | | | | 861,858 | |
Luzerner Kantonalbank AG | | | 1,452 | | | | 680,313 | |
See accompanying notes to financial statements.
BHFTII-35
Brighthouse Funds Trust II
Brighthouse/Dimensional International Small Company Portfolio
Schedule of Investments as of December 31, 2018
Common Stocks—(Continued)
| | | | | | | | |
| Security Description | | Shares | | | Value | |
|
| Switzerland—(Continued) | |
MCH Group AG (a) | | | 831 | | | $ | 16,869 | |
Meier Tobler Group AG (e) | | | 872 | | | | 13,306 | |
Metall Zug AG - B Shares | | | 66 | | | | 167,753 | |
Mikron Holding AG (a) | | | 474 | | | | 3,259 | |
Mobilezone Holding AG | | | 11,899 | | | | 132,640 | |
Mobimo Holding AG | | | 2,761 | | | | 656,824 | |
OC Oerlikon Corp. AG (a) | | | 57,156 | | | | 643,770 | |
Orascom Development Holding AG (a) | | | 5,250 | | | | 79,551 | |
Orell Fuessli Holding AG | | | 428 | | | | 38,687 | |
Oriflame Holding AG | | | 4,601 | | | | 103,213 | |
Orior AG | | | 2,240 | | | | 181,870 | |
Panalpina Welttransport Holding AG | | | 2,930 | | | | 389,913 | |
Phoenix Mecano AG | | | 274 | | | | 140,175 | |
Plazza AG - Class A | | | 292 | | | | 66,241 | |
PSP Swiss Property AG | | | 10,638 | | | | 1,047,403 | |
Resurs Holding AB | | | 20,779 | | | | 128,035 | |
Rieter Holding AG | | | 1,344 | | | | 176,331 | |
Romande Energie Holding S.A. | | | 111 | | | | 133,306 | |
Schaffner Holding AG (a) | | | 238 | | | | 62,588 | |
Schmolz & Bickenbach AG (a) | | | 161,565 | | | | 88,639 | |
Schweiter Technologies AG | | | 381 | | | | 337,580 | |
SFS Group AG (a) (e) | | | 3,820 | | | | 297,761 | |
Siegfried Holding AG (a) | | | 1,571 | | | | 536,422 | |
St. Galler Kantonalbank AG | | | 1,123 | | | | 515,377 | |
Sulzer AG | | | 4,412 | | | | 349,332 | |
Sunrise Communications Group AG (a) | | | 9,217 | | | | 811,635 | |
Swiss Prime Site AG (a) | | | 1,578 | | | | 127,849 | |
Swissquote Group Holding S.A. | | | 3,968 | | | | 183,919 | |
Tamedia AG | | | 904 | | | | 97,147 | |
Tecan Group AG | | | 470 | | | | 91,096 | |
U-Blox Holding AG (a) (e) | | | 2,262 | | | | 182,270 | |
Valiant Holding AG | | | 5,102 | | | | 561,642 | |
Valora Holding AG (a) | | | 1,467 | | | | 321,707 | |
VAT Group AG (a) | | | 5,378 | | | | 473,575 | |
Vaudoise Assurances Holding S.A. | | | 423 | | | | 208,554 | |
Vetropack Holding AG | | | 88 | | | | 179,822 | |
Von Roll Holding AG (a) | | | 7,038 | | | | 9,452 | |
Vontobel Holding AG | | | 9,780 | | | | 502,971 | |
VZ Holding AG | | | 691 | | | | 186,201 | |
Walliser Kantonalbank | | | 1,160 | | | | 133,395 | |
Warteck Invest AG (a) | | | 25 | | | | 48,556 | |
Ypsomed Holding AG (a) | | | 1,361 | | | | 160,934 | |
Zehnder Group AG | | | 3,984 | | | | 136,136 | |
Zug Estates Holding AG - B Shares | | | 83 | | | | 141,512 | |
Zuger Kantonalbank AG | | | 59 | | | | 341,948 | |
| | | | | | | | |
| | | | | | | 29,185,184 | |
| | | | | | | | |
|
| Turkey—0.0% | |
Global Ports Holding plc | | | 994 | | | | 5,019 | |
| | | | | | | | |
|
| United Arab Emirates—0.0% | |
Lamprell plc (a) | | | 100,553 | | | | 77,467 | |
| | | | | | | | |
|
| United Kingdom—15.6% | |
4imprint Group plc | | | 7,338 | | | | 173,664 | |
888 Holdings plc | | | 86,183 | | | | 191,615 | |
A.G. Barr plc | | | 37,633 | | | | 378,326 | |
|
| United Kingdom—(Continued) | |
AA plc | | | 196,019 | | | | 187,136 | |
Acacia Mining plc (a) (e) | | | 56,954 | | | | 133,010 | |
Advanced Medical Solutions Group plc | | | 3,307 | | | | 11,534 | |
Afren plc (a) (b) (c) (d) | | | 251,096 | | | | 0 | |
Aggreko plc | | | 57,711 | | | | 539,343 | |
Air Partner plc | | | 4,960 | | | | 5,422 | |
Anglo Pacific Group plc | | | 35,633 | | | | 67,308 | |
Anglo-Eastern Plantations plc | | | 4,252 | | | | 30,681 | |
Arrow Global Group plc | | | 32,174 | | | | 72,136 | |
Ascential plc | | | 3,642 | | | | 17,460 | |
Ashmore Group plc | | | 106,400 | | | | 493,297 | |
ASOS plc (a) | | | 2,250 | | | | 64,934 | |
Auto Trader Group plc | | | 283,026 | | | | 1,633,475 | |
AVEVA Group plc | | | 14,847 | | | | 456,270 | |
Avon Rubber plc | | | 11,857 | | | | 188,699 | |
B&M European Value Retail S.A. | | | 254,558 | | | | 913,403 | |
Babcock International Group plc (e) | | | 50,927 | | | | 317,638 | |
Balfour Beatty plc | | | 232,244 | | | | 734,923 | |
BBA Aviation plc | | | 400,738 | | | | 1,111,366 | |
Beazley plc | | | 163,368 | | | | 1,043,797 | |
Bellway plc | | | 40,651 | | | | 1,298,197 | |
Berkeley Group Holdings plc | | | 2,138 | | | | 94,831 | |
Bloomsbury Publishing plc | | | 25,349 | | | | 65,125 | |
Bodycote plc | | | 84,979 | | | | 787,721 | |
boohoo Group plc (a) | | | 77,276 | | | | 158,300 | |
Bovis Homes Group plc | | | 60,601 | | | | 665,910 | |
Braemar Shipping Services plc | | | 7,120 | | | | 18,344 | |
Brewin Dolphin Holdings plc | | | 101,304 | | | | 414,305 | |
Britvic plc | | | 83,065 | | | | 843,398 | |
BTG plc (a) | | | 65,897 | | | | 696,992 | |
Cairn Energy plc (a) | | | 234,247 | | | | 447,014 | |
Capita plc (a) | | | 25,195 | | | | 35,805 | |
Capital & Counties Properties plc | | | 195,683 | | | | 574,266 | |
Carclo plc (a) | | | 16,990 | | | | 17,277 | |
Card Factory plc | | | 94,418 | | | | 208,056 | |
CareTech Holdings plc | | | 6,777 | | | | 29,533 | |
Carr’s Group plc | | | 15,540 | | | | 29,757 | |
Castings plc | | | 2,870 | | | | 13,884 | |
Centaur Media plc | | | 92,526 | | | | 52,669 | |
Charles Taylor plc | | | 8,688 | | | | 24,117 | |
Chemring Group plc | | | 123,138 | | | | 252,753 | |
Chesnara plc | | | 58,648 | | | | 258,246 | |
Cineworld Group plc | | | 352,995 | | | | 1,181,386 | |
City of London Investment Group plc | | | 4,786 | | | | 23,131 | |
Clarkson plc | | | 6,420 | | | | 155,224 | |
Close Brothers Group plc | | | 58,401 | | | | 1,068,181 | |
CLS Holdings plc | | | 51,405 | | | | 137,557 | |
CMC Markets plc | | | 42,124 | | | | 56,487 | |
Cobham plc (a) | | | 641,178 | | | | 795,945 | |
Computacenter plc | | | 29,696 | | | | 379,766 | |
Concentric AB | | | 16,079 | | | | 217,122 | |
Connect Group plc | | | 113,763 | | | | 62,043 | |
Consort Medical plc | | | 22,450 | | | | 268,468 | |
ConvaTec Group plc | | | 76,101 | | | | 134,419 | |
Costain Group plc | | | 28,320 | | | | 113,835 | |
Countryside Properties plc | | | 63,705 | | | | 246,188 | |
Countrywide plc (a) | | | 6,402 | | | | 698 | |
See accompanying notes to financial statements.
BHFTII-36
Brighthouse Funds Trust II
Brighthouse/Dimensional International Small Company Portfolio
Schedule of Investments as of December 31, 2018
Common Stocks—(Continued)
| | | | | | | | |
| Security Description | | Shares | | | Value | |
|
| United Kingdom—(Continued) | |
Cranswick plc | | | 19,204 | | | $ | 642,204 | |
Crest Nicholson Holdings plc | | | 50,272 | | | | 209,591 | |
CYBG plc | | | 50,512 | | | | 115,876 | |
Daejan Holdings plc | | | 2,053 | | | | 146,883 | |
Daily Mail & General Trust plc - Class A | | | 91,328 | | | | 667,983 | |
Dairy Crest Group plc | | | 54,853 | | | | 294,735 | |
Dart Group plc | | | 1,819 | | | | 17,900 | |
De La Rue plc | | | 32,774 | | | | 175,836 | |
Debenhams plc (e) | | | 426,182 | | | | 27,973 | |
Devro plc | | | 61,396 | | | | 125,022 | |
DFS Furniture plc | | | 21,089 | | | | 48,757 | |
Dialight plc (a) | | | 5,140 | | | | 26,082 | |
Dialog Semiconductor plc (a) | | | 22,851 | | | | 594,037 | |
Dignity plc | | | 19,579 | | | | 173,769 | |
Diploma plc | | | 39,240 | | | | 602,752 | |
DiscoverIE Group plc | | | 17,866 | | | | 82,624 | |
Dixons Carphone plc (e) | | | 114,662 | | | | 175,057 | |
Domino’s Pizza Group plc | | | 156,562 | | | | 463,659 | |
Drax Group plc | | | 137,597 | | | | 626,789 | |
Dunelm Group plc (e) | | | 31,911 | | | | 219,564 | |
EI Group plc (a) | | | 245,184 | | | | 565,405 | |
EKF Diagnostics Holdings plc (a) | | | 33,004 | | | | 11,505 | |
Eland Oil & Gas plc (a) | | | 7,992 | | | | 10,779 | |
Electrocomponents plc | | | 145,293 | | | | 934,396 | |
Elementis plc | | | 202,330 | | | | 467,411 | |
EMIS Group plc | | | 5,569 | | | | 64,781 | |
EnQuest plc (a) | | | 832,061 | | | | 230,954 | |
Equiniti Group plc | | | 32,382 | | | | 88,979 | |
Essentra plc (e) | | | 78,989 | | | | 344,731 | |
Euromoney Institutional Investor plc | | | 14,736 | | | | 216,127 | |
Faroe Petroleum plc (a) | | | 11,296 | | | | 21,129 | |
FDM Group Holdings plc | | | 8,510 | | | | 80,409 | |
Fevertree Drinks plc | | | 5,284 | | | | 147,076 | |
Findel plc (a) | | | 17,439 | | | | 47,414 | |
Firstgroup plc (a) | | | 412,049 | | | | 437,375 | |
FLEX LNG, Ltd. (a) | | | 21,214 | | | | 30,219 | |
Forterra plc | | | 15,356 | | | | 43,712 | |
Foxtons Group plc | | | 60,218 | | | | 40,836 | |
Fuller Smith & Turner plc - Class A | | | 7,667 | | | | 86,894 | |
FW Thorpe plc | | | 6,310 | | | | 20,495 | |
G4S plc | | | 23,040 | | | | 57,661 | |
Galliford Try plc | | | 49,848 | | | | 394,622 | |
Games Workshop Group plc | | | 11,160 | | | | 430,745 | |
Gamma Communications plc | | | 1,155 | | | | 10,748 | |
Gem Diamonds, Ltd. (a) | | | 35,552 | | | | 50,194 | |
Genel Energy plc (a) | | | 6,470 | | | | 14,609 | |
Genus plc (e) | | | 5,966 | | | | 163,076 | |
Georgia Capital plc (a) | | | 7,105 | | | | 92,468 | |
Go-Ahead Group plc | | | 15,177 | | | | 295,087 | |
Gocompare.Com Group plc | | | 86,389 | | | | 75,179 | |
Gooch & Housego plc | | | 2,212 | | | | 33,546 | |
Goodwin plc | | | 188 | | | | 6,032 | |
Grafton Group plc | | | 88,160 | | | | 720,350 | |
Grainger plc | | | 148,363 | | | | 396,667 | |
Greene King plc | | | 121,167 | | | | 815,474 | |
Greggs plc | | | 34,690 | | | | 559,810 | |
|
| United Kingdom—(Continued) | |
Gulf Keystone Petroleum, Ltd. (a) | | | 51,724 | | | | 119,002 | |
Gym Group plc (The) | | | 41,701 | | | | 145,279 | |
Halfords Group plc | | | 89,687 | | | | 291,230 | |
Hastings Group Holdings plc | | | 8,134 | | | | 19,300 | |
Hays plc | | | 461,035 | | | | 817,898 | |
Headlam Group plc | | | 43,642 | | | | 227,911 | |
Helical plc (e) | | | 47,664 | | | | 193,654 | |
Henry Boot plc | | | 8,542 | | | | 26,110 | |
Hill & Smith Holdings plc (e) | | | 29,060 | | | | 443,590 | |
Hilton Food Group plc (e) | | | 6,141 | | | | 70,610 | |
Hiscox, Ltd. | | | 72,988 | | | | 1,503,565 | |
Hollywood Bowl Group plc | | | 18,722 | | | | 55,487 | |
HomeServe plc | | | 84,090 | | | | 923,793 | |
Horizon Discovery Group plc (a) | | | 4,675 | | | | 10,400 | |
Howden Joinery Group plc | | | 199,363 | | | | 1,102,595 | |
Hunting plc | | | 52,837 | | | | 320,715 | |
Huntsworth plc | | | 78,751 | | | | 108,113 | |
Hurricane Energy plc (a) | | | 42,947 | | | | 24,102 | |
Ibstock plc | | | 75,741 | | | | 191,243 | |
IDOX plc | | | 30,485 | | | | 10,665 | |
IG Group Holdings plc | | | 127,101 | | | | 921,573 | |
IGas Energy plc (a) | | | 9,108 | | | | 11,137 | |
IMI plc | | | 81,384 | | | | 976,239 | |
Inchcape plc | | | 161,511 | | | | 1,130,351 | |
Indivior plc (a) | | | 173,858 | | | | 247,372 | |
Inmarsat plc | | | 94,184 | | | | 452,900 | |
Intermediate Capital Group plc (e) | | | 77,325 | | | | 917,416 | |
International Personal Finance plc | | | 79,366 | | | | 207,214 | |
Interserve plc (a) | | | 69,361 | | | | 9,417 | |
iomart Group plc | | | 2,899 | | | | 12,152 | |
IP Group plc (a) | | | 139,902 | | | | 192,559 | |
ITE Group plc (e) | | | 227,697 | | | | 183,622 | |
J.D. Wetherspoon plc | | | 28,929 | | | | 410,411 | |
Jackpotjoy plc (a) | | | 21,152 | | | | 171,767 | |
James Fisher & Sons plc | | | 20,005 | | | | 440,810 | |
Jardine Lloyd Thompson Group plc | | | 42,639 | | | | 1,027,894 | |
JD Sports Fashion plc | | | 118,756 | | | | 526,182 | |
John Laing Group plc | | | 21,966 | | | | 92,649 | |
John Menzies plc | | | 26,664 | | | | 173,859 | |
John Wood Group plc | | | 141,076 | | | | 903,271 | |
Johnson Service Group plc | | | 14,270 | | | | 21,226 | |
Jupiter Fund Management plc | | | 117,655 | | | | 442,608 | |
Just Group plc | | | 10,076 | | | | 11,724 | |
Kainos Group plc | | | 13,053 | | | | 66,555 | |
Kcom Group plc | | | 172,562 | | | | 160,407 | |
Keller Group plc | | | 25,571 | | | | 159,552 | |
Kier Group plc (e) | | | 50,507 | | | | 262,693 | |
Lancashire Holdings, Ltd. | | | 67,933 | | | | 522,116 | |
Liontrust Asset Management plc | | | 1,332 | | | | 9,857 | |
Lonmin plc (a) | | | 12,029 | | | | 6,915 | |
Lookers plc | | | 131,372 | | | | 154,281 | |
Low & Bonar plc | | | 37,972 | | | | 6,755 | |
LSL Property Services plc | | | 24,253 | | | | 67,747 | |
M&C Saatchi plc | | | 3,407 | | | | 12,621 | |
Majestic Wine plc | | | 6,853 | | | | 21,535 | |
Man Group plc | | | 598,620 | | | | 1,009,782 | |
Marshalls plc | | | 65,853 | | | | 389,183 | |
See accompanying notes to financial statements.
BHFTII-37
Brighthouse Funds Trust II
Brighthouse/Dimensional International Small Company Portfolio
Schedule of Investments as of December 31, 2018
Common Stocks—(Continued)
| | | | | | | | |
| Security Description | | Shares | | | Value | |
|
| United Kingdom—(Continued) | |
Marston’s plc (e) | | | 258,409 | | | $ | 309,092 | |
McBride plc (a) | | | 63,975 | | | | 101,684 | |
McColl’s Retail Group plc | | | 12,767 | | | | 9,023 | |
Mears Group plc | | | 41,542 | | | | 172,613 | |
Meggitt plc | | | 199,705 | | | | 1,194,677 | |
Merlin Entertainments plc | | | 178,163 | | | | 721,055 | |
Metro Bank plc (a) | | | 2,816 | | | | 60,755 | |
Millennium & Copthorne Hotels plc | | | 54,328 | | | | 323,491 | |
Mitchells & Butlers plc (a) | | | 70,418 | | | | 230,681 | |
Mitie Group plc | | | 119,662 | | | | 168,928 | |
MJ Gleeson plc | | | 12,062 | | | | 98,838 | |
Moneysupermarket.com Group plc | | | 163,514 | | | | 572,525 | |
Morgan Advanced Materials plc | | | 105,477 | | | | 353,569 | |
Morgan Sindall Group plc | | | 17,569 | | | | 235,889 | |
Morses Club plc | | | 6,380 | | | | 12,809 | |
Mothercare plc (a) (e) | | | 102,238 | | | | 20,840 | |
Motorpoint group plc | | | 14,323 | | | | 36,762 | |
N Brown Group plc | | | 73,957 | | | | 88,433 | |
National Express Group plc | | | 203,273 | | | | 967,238 | |
NCC Group plc | | | 76,130 | | | | 169,818 | |
Non-Standard Finance plc | | | 18,000 | | | | 15,103 | |
Norcros plc | | | 4,097 | | | | 9,896 | |
Northgate plc | | | 48,315 | | | | 233,862 | |
Ocado Group plc (a) | | | 96,504 | | | | 967,456 | |
On the Beach Group plc | | | 36,264 | | | | 155,336 | |
OneSavings Bank plc | | | 34,833 | | | | 154,912 | |
Ophir Energy plc (a) | | | 165,965 | | | | 75,340 | |
Oxford Instruments plc | | | 15,893 | | | | 184,098 | |
Pagegroup plc | | | 105,272 | | | | 602,268 | |
Pan African Resources plc (a) | | | 108,313 | | | | 11,946 | |
Paragon Banking Group plc | | | 72,439 | | | | 355,204 | |
PayPoint plc | | | 23,440 | | | | 241,151 | |
Pendragon plc | | | 345,188 | | | | 98,993 | |
Pennon Group plc | | | 139,688 | | | | 1,231,792 | |
Petrofac, Ltd. | | | 76,214 | | | | 462,328 | |
Pets at Home Group plc | | | 57,751 | | | | 84,996 | |
Phoenix Group Holdings plc | | | 140,310 | | | | 1,007,579 | |
Photo-Me International plc | | | 89,030 | | | | 100,988 | |
Playtech plc | | | 58,243 | | | | 284,656 | |
Polypipe Group plc | | | 62,496 | | | | 260,055 | |
Porvair plc | | | 8,570 | | | | 45,151 | |
Premier Asset Management Group plc | | | 4,232 | | | | 9,666 | |
Premier Foods plc (a) (e) | | | 334,879 | | | | 140,234 | |
Premier Oil plc (a) (e) | | | 245,706 | | | | 208,459 | |
Provident Financial plc (a) | | | 19,528 | | | | 143,132 | |
PZ Cussons plc | | | 102,110 | | | | 276,060 | |
QinetiQ Group plc | | | 183,469 | | | | 670,699 | |
Quilter plc (e) | | | 106,008 | | | | 159,052 | |
Rank Group plc | | | 35,576 | | | | 62,485 | |
Rathbone Brothers plc | | | 14,708 | | | | 437,271 | |
REA Holdings plc (a) | | | 1,120 | | | | 3,483 | |
Redde plc | | | 10,004 | | | | 21,618 | |
Redrow plc | | | 98,104 | | | | 612,451 | |
Renew Holdings plc | | | 3,253 | | | | 14,027 | |
Renewi plc | | | 221,260 | | | | 92,773 | |
Renishaw plc | | | 12,189 | | | | 658,804 | |
Renold plc (a) | | | 64,766 | | | | 23,966 | |
|
| United Kingdom—(Continued) | |
Restaurant Group plc (The) | | | 166,434 | | | | 302,516 | |
Revolution Bars Group plc | | | 5,460 | | | | 6,896 | |
Ricardo plc | | | 13,452 | | | | 106,972 | |
Rightmove plc | | | 253,202 | | | | 1,391,326 | |
River & Mercantile Group plc | | | 112 | | | | 324 | |
RM plc | | | 43,283 | | | | 111,601 | |
Robert Walters plc | | | 16,356 | | | | 114,706 | |
Rotork plc | | | 262,065 | | | | 828,553 | |
RPC Group plc | | | 140,988 | | | | 1,167,493 | |
RPS Group plc | | | 100,537 | | | | 173,797 | |
S&U plc | | | 343 | | | | 9,291 | |
Saga plc | | | 127,724 | | | | 168,165 | |
Savills plc | | | 62,765 | | | | 563,981 | |
Scapa Group plc | | | 11,870 | | | | 46,311 | |
SDL plc | | | 33,826 | | | | 205,884 | |
Secure Trust Bank plc | | | 458 | | | | 6,940 | |
Senior plc | | | 166,890 | | | | 401,808 | |
Severfield plc | | | 100,890 | | | | 90,330 | |
SIG plc | | | 252,797 | | | | 351,883 | |
Sirius Minerals plc (a) | | | 241,946 | | | | 63,831 | |
Soco International plc | | | 50,968 | | | | 44,178 | |
Softcat plc | | | 34,705 | | | | 259,110 | |
Spectris plc | | | 34,553 | | | | 1,000,353 | |
Speedy Hire plc | | | 205,988 | | | | 156,315 | |
Spirax-Sarco Engineering plc | | | 4,014 | | | | 319,596 | |
Spire Healthcare Group plc | | | 6,876 | | | | 9,511 | |
Spirent Communications plc | | | 217,958 | | | | 328,203 | |
Sportech plc (a) | | | 20,264 | | | | 10,275 | |
Sports Direct International plc (a) | | | 32,908 | | | | 99,302 | |
SSP Group plc | | | 135,930 | | | | 1,119,758 | |
St. Ives plc | | | 58,134 | | | | 71,408 | |
St. Modwen Properties plc | | | 86,555 | | | | 436,164 | |
Stagecoach Group plc | | | 163,409 | | | | 275,532 | |
Stallergenes Greer plc (a) | | | 569 | | | | 18,430 | |
SThree plc | | | 37,574 | | | | 137,047 | |
Stobart Group, Ltd. (e) | | | 80,421 | | | | 147,581 | |
Stock Spirits Group plc | | | 23,736 | | | | 62,832 | |
STV Group plc | | | 2,636 | | | | 11,898 | |
Superdry plc | | | 18,185 | | | | 108,437 | |
Synthomer plc | | | 88,503 | | | | 401,685 | |
TalkTalk Telecom Group plc | | | 151,305 | | | | 219,517 | |
Tate & Lyle plc | | | 153,810 | | | | 1,291,299 | |
Ted Baker plc | | | 8,726 | | | | 171,771 | |
Telecom Plus plc | | | 20,692 | | | | 377,697 | |
Telit Communications plc (a) | | | 33,381 | | | | 55,423 | |
Thomas Cook Group plc | | | 438,591 | | | | 170,607 | |
Topps Tiles plc | | | 61,961 | | | | 49,471 | |
TP ICAP plc (e) | | | 203,445 | | | | 778,118 | |
Travis Perkins plc | | | 67,481 | | | | 915,632 | |
Trifast plc | | | 15,629 | | | | 37,399 | |
Trinity Mirror plc | | | 157,693 | | | | 132,544 | |
TT electronics plc | | | 79,682 | | | | 199,007 | |
U & I Group plc | | | 54,856 | | | | 145,589 | |
Ultra Electronics Holdings plc (e) | | | 27,882 | | | | 460,428 | |
Urban & Civic plc | | | 5,854 | | | | 19,503 | |
Vectura Group plc (a) | | | 245,376 | | | | 218,536 | |
Vertu Motors plc | | | 35,216 | | | | 15,828 | |
See accompanying notes to financial statements.
BHFTII-38
Brighthouse Funds Trust II
Brighthouse/Dimensional International Small Company Portfolio
Schedule of Investments as of December 31, 2018
Common Stocks—(Continued)
| | | | | | | | |
| Security Description | | Shares | | | Value | |
|
| United Kingdom—(Continued) | |
Vesuvius plc | | | 95,731 | | | $ | 615,213 | |
Victrex plc | | | 29,970 | | | | 874,118 | |
Vitec Group plc (The) | | | 10,351 | | | | 157,271 | |
Volex plc (a) (e) | | | 20,438 | | | | 22,776 | |
Volution Group plc | | | 17,979 | | | | 32,823 | |
Vp plc | | | 4,147 | | | | 52,038 | |
Watkin Jones plc | | | 4,237 | | | | 11,077 | |
Weir Group plc (The) | | | 247 | | | | 4,061 | |
WH Smith plc | | | 35,182 | | | | 768,498 | |
William Hill plc | | | 315,264 | | | | 620,828 | |
Wincanton plc | | | 44,811 | | | | 138,792 | |
Xaar plc | | | 18,088 | | | | 33,378 | |
| | | | | | | | |
| | | | | | | 88,661,464 | |
| | | | | | | | |
|
| United States—0.3% | |
Alacer Gold Corp. (a) | | | 102,778 | | | | 189,716 | |
Argonaut Gold, Inc. (a) | | | 57,325 | | | | 65,505 | |
Burford Capital, Ltd. | | | 7,120 | | | | 149,546 | |
Energy Fuels, Inc. (a) (e) | | | 19,715 | | | | 55,887 | |
Golden Star Resources, Ltd. (a) (e) | | | 28,192 | | | | 89,623 | |
HJ Capital International Holdings Co., Ltd. (a) | | | 520,000 | | | | 6,113 | |
PureTech Health plc (a) | | | 20,489 | | | | 44,717 | |
REC Silicon ASA (a) | | | 643,607 | | | | 44,294 | |
Reliance Worldwide Corp., Ltd. | | | 87,245 | | | | 273,824 | |
Sims Metal Management, Ltd. | | | 81,887 | | | | 579,030 | |
Tahoe Resources, Inc. (a) | | | 78,950 | | | | 287,417 | |
| | | | | | | | |
| | | | | | | 1,785,672 | |
| | | | | | | | |
Total Common Stocks
(Cost $567,943,254) | | | | | | | 566,866,920 | |
| | | | | | | | |
|
| Preferred Stocks—0.2% | |
|
| Germany—0.2% | |
Biotest AG | | | 3,990 | | | | 107,456 | |
Draegerwerk AG & Co. KGaA | | | 2,309 | | | | 123,195 | |
FUCHS Petrolub SE | | | 912 | | | | 37,595 | |
Jungheinrich AG | | | 13,710 | | | | 357,766 | |
Sixt SE | | | 4,402 | | | | 241,897 | |
Sto SE & Co. KGaA | | | 190 | | | | 17,882 | |
Villeroy & Boch AG | | | 505 | | | | 7,473 | |
| | | | | | | | |
Total Preferred Stocks
(Cost $975,587) | | | | | | | 893,264 | |
| | | | | | | | |
|
| Rights—0.0% | |
|
| Australia—0.0% | |
Centrebet International, Ltd. (Litigation Units) | | | 9,600 | | | | 0 | |
| | | | | | | | |
|
| Austria—0.0% | |
Intercell AG, Expires 05/16/13 (a) (b) (c) | | | 24,163 | | | | 0 | |
| | | | | | | | |
|
| Hong Kong—0.0% | |
Fortune Oil CVR | | | 575,627 | | | | 0 | |
| | | | | | | | |
|
| Spain—0.0% | |
Faes Farma S.A., Expires 12/28/18 (a) | | | 131,897 | | | | 15,474 | |
| | | | | | | | |
|
| United Kingdom—0.0% | |
Ladbrokes Coral Group | | | 312,983 | | | | 43,204 | |
| | | | | | | | |
Total Rights
(Cost $15,138) | | | | | | | 58,678 | |
| | | | | | | | |
|
| Warrant—0.0% | |
|
| Canada—0.0% | |
Tervita Corp., Expires 07/19/20 (a) (e) | | | 733 | | | | 121 | |
| | | | | | | | |
|
| Singapore—0.0% | |
Ezion Holdings, Ltd., Expires 04/16/23 (a) | | | 309,737 | | | | 0 | |
| | | | | | | | |
Total Warrants
(Cost $1) | | | | | | | 121 | |
| | | | | | | | |
|
| Short-Term Investment—0.4% | |
|
| Repurchase Agreement—0.4% | |
Fixed Income Clearing Corp.
Repurchase Agreement dated 12/31/18 at 1.200%, due on 01/02/19 with a maturity value of $2,127,077; collateralized by U.S. Treasury Note at 2.125%, maturing 11/30/23, with a market value of $2,172,784. | | | 2,126,935 | | | | 2,126,935 | |
| | | | | | | | |
Total Short-Term Investments
(Cost $2,126,935) | | | | | | | 2,126,935 | |
| | | | | | | | |
|
| Securities Lending Reinvestments (f)—4.1% | |
|
| Certificates of Deposit—0.3% | |
Bank of Nova Scotia
3.072%, 3M LIBOR + 0.280%, 03/20/19 (g) | | | 500,000 | | | | 500,199 | |
Barclays Bank plc
2.547%, 1M LIBOR + 0.200%, 02/04/19 (g) | | | 500,000 | | | | 499,953 | |
Wells Fargo Bank N.A.
2.730%, 3M LIBOR + 0.210%, 10/25/19 (g) | | | 500,000 | | | | 500,000 | |
Westpac Banking Corp.
2.850%, FEDEFF PRV + 0.450%, 02/15/19 (g) | | | 500,000 | | | | 499,997 | |
| | | | | | | | |
| | | | | | | 2,000,149 | |
| | | | | | | | |
|
| Repurchase Agreements—3.6% | |
Citigroup Global Markets, Inc.
Repurchase Agreement dated 12/31/18 at 2.660%, due on 01/07/19 with a maturity value of $1,000,517; collateralized by U.S. Treasury Obligations with rates ranging from 0.625% - 3.125%, maturity dates ranging from 02/15/42 - 02/15/46, and various Common Stock with an aggregate market value of $1,054,286. | | | 1,000,000 | | | | 1,000,000 | |
See accompanying notes to financial statements.
BHFTII-39
Brighthouse Funds Trust II
Brighthouse/Dimensional International Small Company Portfolio
Schedule of Investments as of December 31, 2018
Securities Lending Reinvestments (f)—(Continued)
| | | | | | | | |
| Security Description | | Principal
Amount* | | | Value | |
|
| Repurchase Agreements—(Continued) | |
| Citigroup Global Markets, Ltd. | |
Repurchase Agreement dated 12/31/18 at 2.490%, due on 01/02/19 with a maturity value of $500,069; collateralized by U.S. Treasury Obligations with rates ranging from 0.375% - 1.875%, maturity dates ranging from 12/15/20 - 01/15/27, and an aggregate market value of $510,000. | | | 500,000 | | | $ | 500,000 | |
Repurchase Agreement dated 12/31/18 at 2.490%, due on 01/02/19 with a maturity value of $700,097; collateralized by U.S. Treasury Obligations with rates ranging from 1.625% - 2.875%, maturity dates ranging from 06/30/20 - 11/15/46, and an aggregate market value of $714,000. | | | 700,000 | | | | 700,000 | |
Deutsche Bank AG, London
Repurchase Agreement dated 12/31/18 at 2.750%, due on 01/02/19 with a maturity value of $400,061; collateralized by U.S. Treasury and Foreign Obligations with rates ranging from 1.000% - 2.590%, maturity dates ranging from 03/31/19 - 12/29/26, and an aggregate market value of $408,000. | | | 400,000 | | | | 400,000 | |
Deutsche Bank Securities, Inc.
Repurchase Agreement dated 12/31/18 at 3.200%, due on 01/02/19 with a maturity value of $4,746,575; collateralized by U.S. Treasury Obligations at 0.000%, maturity dates ranging from 08/15/30 - 08/15/39, and an aggregate market value of $4,840,646. | | | 4,745,731 | | | | 4,745,731 | |
| Merrill Lynch, Pierce, Fenner & Smith, Inc. | |
Repurchase Agreement dated 12/31/18 at 2.940%, due on 04/02/19 with a maturity value of $302,254; collateralized by various Common Stock with an aggregate market value of $330,000. | | | 300,000 | | | | 300,000 | |
Repurchase Agreement dated 12/31/18 at 2.940%, due on 04/02/19 with a maturity value of $1,007,513; collateralized by various Common Stock with an aggregate market value of $1,100,000. | | | 1,000,000 | | | | 1,000,000 | |
| NBC Global Finance, Ltd. | |
Repurchase Agreement dated 12/31/18 at 2.560%, due on 01/02/19 with a maturity value of $1,400,199; collateralized by various Common Stock with an aggregate market value of $1,558,497. | | | 1,400,000 | | | | 1,400,000 | |
Repurchase Agreement dated 12/31/18 at 2.560%, due on 01/02/19 with a maturity value of $1,000,142; collateralized by various Common Stock with an aggregate market value of $1,113,212. | | | 1,000,000 | | | | 1,000,000 | |
Repurchase Agreement dated 12/31/18 at 2.560%, due on 01/02/19 with a maturity value of $2,000,284; collateralized by various Common Stock with an aggregate market value of $2,226,425. | | | 2,000,000 | | | | 2,000,000 | |
Repurchase Agreement dated 12/31/18 at 2.590%, due on 01/07/19 with a maturity value of $500,252; collateralized by various Common Stock with an aggregate market value of $556,661. | | | 500,000 | | | | 500,000 | |
Nomura Securities International, Inc.
Repurchase Agreement dated 12/31/18 at 2.950%, due on 01/02/19 with a maturity value of $2,000,328; collateralized by U.S. Treasury Obligations with rates ranging from 0.000% - 6.500%, maturity dates ranging from 02/15/19 - 08/15/48, and an aggregate market value of $2,040,000. | | | 2,000,000 | | | | 2,000,000 | |
|
| Repurchase Agreements—(Continued) | |
| Societe Generale | |
Repurchase Agreement dated 12/31/18 at 2.530%, due on 01/02/19 with a maturity value of $950,134; collateralized by U.S. Treasury Obligations with rates ranging from 0.750% - 8.000%, maturity dates ranging from 09/30/19 - 08/15/46, and various Common Stock with an aggregate market value of $1,040,702. | | | 950,000 | | | | 950,000 | |
Repurchase Agreement dated 12/31/18 at 2.530%, due on 01/02/19 with a maturity value of $900,127; collateralized by U.S. Treasury Obligations with rates ranging from 0.750% - 8.000%, maturity dates ranging from 09/30/19 - 08/15/46, and various Common Stock with an aggregate market value of $985,928. | | | 900,000 | | | | 900,000 | |
Repurchase Agreement dated 12/31/18 at 2.530%, due on 01/02/19 with a maturity value of $2,000,281; collateralized by U.S. Treasury Obligations with rates ranging from 0.750% - 8.000%, maturity dates ranging from 09/30/19 - 08/15/46, and various Common Stock with an aggregate market value of $2,190,952. | | | 2,000,000 | | | | 2,000,000 | |
Repurchase Agreement dated 12/31/18 at 2.560%, due on 01/07/19 with a maturity value of $600,299; collateralized by U.S. Treasury Obligations with rates ranging from 0.750% - 8.000%, maturity dates ranging from 09/30/19 - 08/15/46, and various Common Stock with an aggregate market value of $657,286. | | | 600,000 | | | | 600,000 | |
Repurchase Agreement dated 12/31/18 at 2.560%, due on 01/07/19 with a maturity value of $225,112; collateralized by U.S. Treasury Obligations with rates ranging from 0.750% - 8.000%, maturity dates ranging from 09/30/19 - 08/15/46, and various Common Stock with an aggregate market value of $246,482. | | | 225,000 | | | | 225,000 | |
Repurchase Agreement dated 12/31/18 at 2.560%, due on 01/07/19 with a maturity value of $300,149; collateralized by U.S. Treasury Obligations with rates ranging from 0.750% - 8.000%, maturity dates ranging from 09/30/19 - 08/15/46, and various Common Stock with an aggregate market value of $328,643. | | | 300,000 | | | | 300,000 | |
| | | | | | | | |
| | | | | | | 20,520,731 | |
| | | | | | | | |
|
| Time Deposit—0.2% | |
Royal Bank of Canada
2.420%, 01/02/19 | | | 1,000,000 | | | | 1,000,000 | |
| | | | | | | | |
Total Securities Lending Reinvestments
(Cost $23,520,731) | | | | | | | 23,520,880 | |
| | | | | | | | |
Total Investments—104.1%
(Cost $594,581,646) | | | | | | | 593,466,798 | |
Other assets and liabilities (net)—(4.1)% | | | | | | | (23,116,910 | ) |
| | | | | | | | |
| Net Assets—100.0% | | | | | | $ | 570,349,888 | |
| | | | | | | | |
| | | | |
| * | | Principal amount stated in U.S. dollars unless otherwise noted. |
| (a) | | Non-income producing security. |
| (b) | | Security was valued in good faith under procedures approved by the Board of Trustees. As of December 31, 2018, these securities represent 0.1% of net assets. |
See accompanying notes to financial statements.
BHFTII-40
Brighthouse Funds Trust II
Brighthouse/Dimensional International Small Company Portfolio
Schedule of Investments as of December 31, 2018
| | | | |
| (c) | | Significant unobservable inputs were used in the valuation of this portfolio security; i.e. Level 3. |
| (d) | | Illiquid security. As of December 31, 2018, these securities represent 0.2% of net assets. |
| (e) | | All or a portion of the security was held on loan. As of December 31, 2018, the market value of securities loaned was $24,454,716 and the collateral received consisted of cash in the amount of $23,520,731 andnon-cash collateral with a value of $3,150,420. The cash collateral investments are disclosed in the Schedule of Investments and categorized as Securities Lending Reinvestments. Thenon-cash collateral received consists of U.S. government securities that are held in safe-keeping by the lending agent, or a third- party custodian, and cannot be sold or repledged by the Portfolio. As such, this non-cash collateral is excluded from the Statement of Assets and Liabilities. |
| (f) | | Represents investment of cash collateral received from securities on loan as of December 31, 2018. |
| (g) | | Variable or floating rate security. The stated rate represents the rate at December 31, 2018. Maturity date shown for callable securities reflects the earliest possible call date. For securities based on a published reference index and spread, the index and spread are indicated in the description above. For certain variable rate securities, the coupon rate is determined by the issuer/agent based on current market conditions. For certain asset- and mortgage-backed securities, the coupon rate may fluctuate based on changes of the underlying collateral or prepayments of principal. These securities do not indicate a reference index and spread in their description above. |
| | | | |
Ten Largest Industries as of
December 31, 2018 (Unaudited) | | % of
Net Assets | |
Machinery | | | 6.3 | |
Real Estate Management & Development | | | 4.8 | |
Metals & Mining | | | 4.7 | |
Banks | | | 4.1 | |
Hotels, Restaurants & Leisure | | | 3.6 | |
Food Products | | | 3.6 | |
Capital Markets | | | 3.4 | |
Construction & Engineering | | | 3.1 | |
Chemicals | | | 3.1 | |
Electronic Equipment, Instruments & Components | | | 3.0 | |
Glossary of Abbreviations
Other Abbreviations
| | | | |
|
| (FEDEFF PRV)— | | Effective Federal Funds Rate |
| (LIBOR)— | | London Interbank Offered Rate |
Fair Value Hierarchy
Accounting principles generally accepted in the United States of America (“GAAP”) define fair market value as the price that the Portfolio would receive to sell an asset or pay to transfer a liability in an orderly transaction between market participants at the measurement date. It establishes a fair value hierarchy that prioritizes inputs to valuation methods and requires disclosure of the fair value hierarchy, separately for each major category of assets and liabilities, that segregates fair value measurements into three levels. Levels 1, 2 and 3 of the fair value hierarchy are defined as follows:
Level 1 - unadjusted quoted prices in active markets for identical investments
Level 2 - other significant observable inputs (including, but not limited to, quoted prices for similar assets or liabilities in markets that are either active or inactive; inputs other than quoted prices that are observable such as interest rates, yield curves, volatilities, prepayment speeds, loss severities, credit risks, default rates, or other market corroborated inputs)
Level 3 - significant unobservable inputs based on the best information available in the circumstances, to the extent observable inputs are unavailable (including the Portfolio’s own assumptions used in determining the fair value of investments and derivative financial instruments)
The inputs or methodologies used for valuing investments are not necessarily an indication of the risk associated with investing in them. Changes to the inputs or methodologies used may result in transfers between levels. A reconciliation of Level 3 securities, if any, will be disclosed following the fair value hierarchy table. For more information about the Portfolio’s policy regarding the valuation of investments, please refer to the Notes to Financial Statements.
The following table summarizes the fair value hierarchy of the Portfolio’s investments as of December 31, 2018:
| | | | | | | | | | | | | | | | |
| Description | | Level 1 | | | Level 2 | | | Level 3 | | | Total | |
| Common Stocks | |
Australia | | $ | 943,589 | | | $ | 37,065,122 | | | $ | 69,744 | | | $ | 38,078,455 | |
Austria | | | — | | | | 7,113,805 | | | | 0 | | | | 7,113,805 | |
Belgium | | | 1,513,838 | | | | 8,153,566 | | | | — | | | | 9,667,404 | |
Canada | | | 45,452,033 | | | | 443,599 | | | | 25,917 | | | | 45,921,549 | |
China | | | 158,507 | | | | 1,180,826 | | | | — | | | | 1,339,333 | |
Colombia | | | 30,137 | | | | — | | | | — | | | | 30,137 | |
Denmark | | | — | | | | 13,124,869 | | | | — | | | | 13,124,869 | |
Finland | | | — | | | | 15,958,761 | | | | — | | | | 15,958,761 | |
France | | | 3,700 | | | | 22,394,447 | | | | — | | | | 22,398,147 | |
Georgia | | | — | | | | 147,416 | | | | — | | | | 147,416 | |
Germany | | | — | | | | 34,944,974 | | | | — | | | | 34,944,974 | |
Ghana | | | — | | | | 1,040,565 | | | | — | | | | 1,040,565 | |
Greenland | | | — | | | | 1,425 | | | | — | | | | 1,425 | |
Guernsey, Channel Islands | | | — | | | | 60,422 | | | | — | | | | 60,422 | |
Hong Kong | | | 816,237 | | | | 15,903,761 | | | | 58,622 | | | | 16,778,620 | |
Ireland | | | — | | | | 2,476,639 | | | | — | | | | 2,476,639 | |
Isle of Man | | | — | | | | 38,131 | | | | — | | | | 38,131 | |
See accompanying notes to financial statements.
BHFTII-41
Brighthouse Funds Trust II
Brighthouse/Dimensional International Small Company Portfolio
Schedule of Investments as of December 31, 2018
Fair Value Hierarchy—(Continued)
| | | | | | | | | | | | | | | | |
| Description | | Level 1 | | | Level 2 | | | Level 3 | | | Total | |
Israel | | $ | — | | | $ | 6,340,409 | | | $ | — | | | $ | 6,340,409 | |
Italy | | | — | | | | 23,014,868 | | | | 0 | | | | 23,014,868 | |
Japan | | | — | | | | 138,564,896 | | | | — | | | | 138,564,896 | |
Jersey, Channel Islands | | | — | | | | 476,928 | | | | — | | | | 476,928 | |
Jordan | | | — | | | | 466,759 | | | | — | | | | 466,759 | |
Kazakhstan | | | — | | | | 285,960 | | | | — | | | | 285,960 | |
Liechtenstein | | | — | | | | 309,509 | | | | — | | | | 309,509 | |
Luxembourg | | | — | | | | 681,140 | | | | — | | | | 681,140 | |
Macau | | | — | | | | 62,166 | | | | — | | | | 62,166 | |
Malaysia | | | — | | | | 1,412 | | | | — | | | | 1,412 | |
Malta | | | — | | | | 457,928 | | | | — | | | | 457,928 | |
Monaco | | | 265,341 | | | | — | | | | — | | | | 265,341 | |
Netherlands | | | — | | | | 16,449,942 | | | | 0 | | | | 16,449,942 | |
New Zealand | | | 66,980 | | | | 4,585,133 | | | | — | | | | 4,652,113 | |
Norway | | | 137,181 | | | | 4,800,100 | | | | — | | | | 4,937,281 | |
Peru | | | — | | | | 148,006 | | | | — | | | | 148,006 | |
Philippines | | | — | | | | 7,113 | | | | — | | | | 7,113 | |
Portugal | | | — | | | | 2,362,357 | | | | 0 | | | | 2,362,357 | |
Russia | | | — | | | | 97,768 | | | | — | | | | 97,768 | |
Singapore | | | 230,420 | | | | 6,246,409 | | | | 27,065 | | | | 6,503,894 | |
South Africa | | | 6,704 | | | | 133,666 | | | | — | | | | 140,370 | |
Spain | | | — | | | | 14,687,903 | | | | 0 | | | | 14,687,903 | |
Sweden | | | 172,106 | | | | 16,945,293 | | | | — | | | | 17,117,399 | |
Switzerland | | | — | | | | 29,185,184 | | | | — | | | | 29,185,184 | |
Turkey | | | — | | | | 5,019 | | | | — | | | | 5,019 | |
United Arab Emirates | | | — | | | | 77,467 | | | | — | | | | 77,467 | |
United Kingdom | | | 1,011,062 | | | | 87,650,402 | | | | 0 | | | | 88,661,464 | |
United States | | | 688,148 | | | | 1,097,524 | | | | — | | | | 1,785,672 | |
Total Common Stocks | | | 51,495,983 | | | | 515,189,589 | | | | 181,348 | | | | 566,866,920 | |
Total Preferred Stocks* | | | — | | | | 893,264 | | | | — | | | | 893,264 | |
| Rights | |
Australia | | | — | | | | 0 | | | | — | | | | 0 | |
Austria | | | — | | | | — | | | | 0 | | | | 0 | |
Hong Kong | | | — | | | | — | | | | 0 | | | | 0 | |
Spain | | | 15,474 | | | | — | | | | — | | | | 15,474 | |
United Kingdom | | | — | | | | 43,204 | | | | — | | | | 43,204 | |
Total Rights | | | 15,474 | | | | 43,204 | | | | 0 | | | | 58,678 | |
| Warrant | |
Canada | | | 121 | | | | — | | | | — | | | | 121 | |
Singapore | | | — | | | | 0 | | | | — | | | | 0 | |
Total Warrants | | | 121 | | | | 0 | | | | — | | | | 121 | |
Total Short-Term Investment* | | | — | | | | 2,126,935 | | | | — | | | | 2,126,935 | |
Total Securities Lending Reinvestments* | | | — | | | | 23,520,880 | | | | — | | | | 23,520,880 | |
Total Investments | | $ | 51,511,578 | | | $ | 541,773,872 | | | $ | 181,348 | | | $ | 593,466,798 | |
| | | | | | | | | | | | | | | | | |
Collateral for Securities Loaned (Liability) | | $ | — | | | $ | (23,520,731 | ) | | $ | — | | | $ | (23,520,731 | ) |
| | | | |
| * | | See Schedule of Investments for additional detailed categorizations. |
Level 3 investments at the beginning and/or end of the period in relation to net assets were not significant and accordingly, a reconciliation of Level 3 assets for the year ended December 31, 2018 is not presented.
Transfers from Level 3 to Level 2 in the amount of $385,181 were due to the resumption of trading activity which resulted in the availability of significant observable inputs. Transfers from Level 1 and Level 2 to Level 3 in the amount of $369,977 were due to trading halts on the securities’ respective exchanges which resulted in the lack of observable inputs.
See accompanying notes to financial statements.
BHFTII-42
Brighthouse Funds Trust II
Brighthouse/Dimensional International Small Company Portfolio
Statement of Assets and Liabilities
December 31, 2018
| | | | |
Assets | |
Investments at value (a) (b) | | $ | 593,466,798 | |
Cash denominated in foreign currencies (c) | | | 859,917 | |
Receivable for: | |
Investments sold | | | 395,166 | |
Fund shares sold | | | 694 | |
Dividends and interest | | | 1,500,368 | |
Prepaid expenses | | | 1,845 | |
| | | | |
Total Assets | | | 596,224,788 | |
Liabilities | |
Collateral for securities loaned | | | 23,520,731 | |
Payables for: | |
Investments purchased | | | 1,282,579 | |
Fund shares redeemed | | | 52,991 | |
Accrued Expenses: | |
Management fees | | | 392,793 | |
Distribution and service fees | | | 16,026 | |
Deferred trustees’ fees | | | 111,916 | |
Other expenses | | | 497,864 | |
| | | | |
Total Liabilities | | | 25,874,900 | |
| | | | |
Net Assets | | $ | 570,349,888 | |
| | | | |
Net Assets Consist of: | |
Paid in surplus | | $ | 515,735,725 | |
Distributable earnings (Accumulated losses) | | | 54,614,163 | |
| | | | |
Net Assets | | $ | 570,349,888 | |
| | | | |
Net Assets | |
Class A | | $ | 495,660,570 | |
Class B | | | 74,689,318 | |
Capital Shares Outstanding* | |
Class A | | | 44,759,437 | |
Class B | | | 6,794,135 | |
Net Asset Value, Offering Price and Redemption Price Per Share | |
Class A | | $ | 11.07 | |
Class B | | | 10.99 | |
| | | | |
| * | | The Portfolio is authorized to issue an unlimited number of shares. |
| (a) | | Identified cost of investments was $594,581,646. |
| (b) | | Includes securities loaned at value of $24,454,716. |
| (c) | | Identified cost of cash denominated in foreign currencies was $856,704. |
Statement of Operations
Year Ended December 31, 2018
| | | | |
Investment Income | |
Dividends (a) | | $ | 16,878,636 | |
Interest | | | 11,531 | |
Securities lending income | | | 564,748 | |
| | | | |
Total investment income | | | 17,454,915 | |
Expenses | |
Management fees | | | 5,510,899 | |
Administration fees | | | 29,492 | |
Custodian and accounting fees | | | 420,127 | |
Distribution and service fees—Class B | | | 220,923 | |
Audit and tax services | | | 71,100 | |
Legal | | | 45,317 | |
Trustees’ fees and expenses | | | 33,734 | |
Shareholder reporting | | | 32,354 | |
Insurance | | | 4,554 | |
Miscellaneous | | | 174,031 | |
| | | | |
Total expenses | | | 6,542,531 | |
Less management fee waiver | | | (50,000 | ) |
| | | | |
Net expenses | | | 6,492,531 | |
| | | | |
Net Investment Income | | | 10,962,384 | |
| | | | |
Net Realized and Unrealized Gain (Loss) | |
| Net realized gain (loss) on: | |
Investments | | | 58,586,966 | |
Foreign currency transactions | | | (183,982 | ) |
| | | | |
Net realized gain | | | 58,402,984 | |
| | | | |
| Net change in unrealized depreciation on: | |
Investments | | | (213,525,563 | ) |
Foreign currency transactions | | | (32,476 | ) |
| | | | |
Net change in unrealized depreciation | | | (213,558,039 | ) |
| | | | |
Net realized and unrealized loss | | | (155,155,055 | ) |
| | | | |
Net Decrease in Net Assets From Operations | | $ | (144,192,671 | ) |
| | | | |
| | | | |
| (a) | | Net of foreign withholding taxes of $1,567,002. |
See accompanying notes to financial statements.
BHFTII-43
Brighthouse Funds Trust II
Brighthouse/Dimensional International Small Company Portfolio
Statements of Changes in Net Assets
| | | | | | | | |
| | | Year Ended
December 31,
2018 | | | Year Ended
December 31,
2017 | |
Increase (Decrease) in Net Assets: | |
From Operations | |
Net investment income | | $ | 10,962,384 | | | $ | 10,892,070 | |
Net realized gain | | | 58,402,984 | | | | 49,275,275 | |
Net change in unrealized appreciation (depreciation) | | | (213,558,039 | ) | | | 129,906,303 | |
| | | | | | | | |
Increase (decrease) in net assets from operations | | | (144,192,671 | ) | | | 190,073,648 | |
| | | | | | | | |
From Distributions to Shareholders (a) | |
Class A | | | (57,475,651 | ) | | | (42,951,170 | ) |
Class B | | | (8,473,897 | ) | | | (5,508,775 | ) |
| | | | | | | | |
Total distributions | | | (65,949,548 | ) | | | (48,459,945 | ) |
| | | | | | | | |
Increase (decrease) in net assets from capital share transactions | | | 39,417,154 | | | | (62,478,294 | ) |
| | | | | | | | |
Total increase (decrease) in net assets | | | (170,725,065 | ) | | | 79,135,409 | |
|
Net Assets | |
Beginning of period | | | 741,074,953 | | | | 661,939,544 | |
| | | | | | | | |
End of period | | $ | 570,349,888 | | | $ | 741,074,953 | (b) |
| | | | | | | | |
Other Information:
Capital Shares
Transactions in capital shares were as follows:
| | | | | | | | | | | | | | | | |
| | | Year Ended
December 31, 2018 | | | Year Ended
December 31, 2017 | |
| | | Shares | | | Value | | | Shares | | | Value | |
Class A | |
Sales | | | 1,060,226 | | | $ | 14,397,420 | | | | 4,079 | | | $ | 54,040 | |
Reinvestments | | | 4,087,884 | | | | 57,475,651 | | | | 3,181,569 | | | | 42,951,170 | |
Redemptions | | | (2,666,574 | ) | | | (41,240,441 | ) | | | (7,480,223 | ) | | | (105,916,766 | ) |
| | | | | | | | | | | | | | | | |
Net increase (decrease) | | | 2,481,536 | | | $ | 30,632,630 | | | | (4,294,575 | ) | | $ | (62,911,556 | ) |
| | | | | | | | | | | | | | | | |
Class B | |
Sales | | | 1,316,690 | | | $ | 18,323,356 | | | | 948,526 | | | $ | 13,377,371 | |
Reinvestments | | | 606,145 | | | | 8,473,897 | | | | 410,184 | | | | 5,508,775 | |
Redemptions | | | (1,271,511 | ) | | | (18,012,729 | ) | | | (1,322,091 | ) | | | (18,452,884 | ) |
| | | | | | | | | | | | | | | | |
Net increase | | | 651,324 | | | $ | 8,784,524 | | | | 36,619 | | | $ | 433,262 | |
| | | | | | | | | | | | | | | | |
Increase (decrease) derived from capital shares transactions | | | | | | $ | 39,417,154 | | | | | | | $ | (62,478,294 | ) |
| | | | | | | | | | | | | | | | |
| | | | |
| (a) | | Distributions from net investment income and realized gains are no longer required to be separately disclosed. The presentation for the year ended December 31, 2018 has been adjusted for this change (See Note 8). At December 31, 2017 the distributions were as follows. |
| | | | | | | | |
| | | Distributions from net
investment income: | | | Distributions from realized
capital gains: | |
Class A | | $ | (13,999,221 | ) | | $ | (28,951,949 | ) |
Class B | | | (1,667,583 | ) | | | (3,841,192 | ) |
| | | | |
| (b) | | As part of the update in (a), it is also no longer required to disclose the Undistributed net investment income (Accumulated losses) which was $5,119,950 as of December 31, 2017. |
See accompanying notes to financial statements.
BHFTII-44
Brighthouse Funds Trust II
Brighthouse/Dimensional International Small Company Portfolio
Financial Highlights
| | | | | | | | | | | | | | | | | | | | |
| Selected per share data | |
| | | Class A | |
| | | Year Ended December 31, | |
| | | 2018 | | | 2017 | | | 2016 | | | 2015 | | | 2014 | |
Net Asset Value, Beginning of Period | | $ | 15.32 | | | $ | 12.57 | | | $ | 12.97 | | | $ | 14.84 | | | $ | 16.83 | |
| | | | | | | | | | | | | | | | | | | | |
Income (Loss) from Investment Operations | |
Net investment income (a) | | | 0.23 | | | | 0.22 | | | | 0.28 | (b) | | | 0.25 | | | | 0.26 | |
Net realized and unrealized gain (loss) | | | (3.05 | ) | | | 3.52 | | | | 0.44 | | | | 0.78 | | | | (1.28 | ) |
| | | | | | | | | | | | | | | | | | | | |
Total income (loss) from investment operations | | | (2.82 | ) | | | 3.74 | | | | 0.72 | | | | 1.03 | | | | (1.02 | ) |
| | | | | | | | | | | | | | | | | | | | |
Less Distributions | |
Distributions from net investment income | | | (0.40 | ) | | | (0.32 | ) | | | (0.29 | ) | | | (0.31 | ) | | | (0.38 | ) |
Distributions from net realized capital gains | | | (1.03 | ) | | | (0.67 | ) | | | (0.83 | ) | | | (2.59 | ) | | | (0.59 | ) |
| | | | | | | | | | | | | | | | | | | | |
Total distributions | | | (1.43 | ) | | | (0.99 | ) | | | (1.12 | ) | | | (2.90 | ) | | | (0.97 | ) |
| | | | | | | | | | | | | | | | | | | | |
Net Asset Value, End of Period | | $ | 11.07 | | | $ | 15.32 | | | $ | 12.57 | | | $ | 12.97 | | | $ | 14.84 | |
| | | | | | | | | | | | | | | | | | | | |
Total Return (%) (c) | | | (20.37 | ) | | | 30.82 | | | | 6.00 | (d) | | | 6.08 | | | | (6.50 | ) |
|
Ratios/Supplemental Data | |
Gross ratio of expenses to average net assets (%) | | | 0.93 | | | | 0.92 | | | | 0.93 | | | | 0.95 | | | | 0.98 | |
Net ratio of expenses to average net assets (%) (e) | | | 0.92 | | | | 0.91 | | | | 0.92 | | | | 0.94 | | | | 0.97 | |
Ratio of net investment income to average net assets (%) | | | 1.64 | | | | 1.56 | | | | 2.26 | (b) | | | 1.78 | | | | 1.58 | |
Portfolio turnover rate (%) | | | 16 | | | | 5 | | | | 8 | | | | 12 | | | | 10 | |
Net assets, end of period (in millions) | | $ | 495.7 | | | $ | 647.6 | | | $ | 585.6 | | | $ | 604.2 | | | $ | 606.4 | |
| |
| | | Class B | |
| | | Year Ended December 31, | |
| | | 2018 | | | 2017 | | | 2016 | | | 2015 | | | 2014 | |
Net Asset Value, Beginning of Period | | $ | 15.22 | | | $ | 12.50 | | | $ | 12.89 | | | $ | 14.77 | | | $ | 16.75 | |
| | | | | | | | | | | | | | | | | | | | |
Income (Loss) from Investment Operations | |
Net investment income (a) | | | 0.19 | | | | 0.18 | | | | 0.25 | (b) | | | 0.21 | | | | 0.21 | |
Net realized and unrealized gain (loss) | | | (3.02 | ) | | | 3.50 | | | | 0.44 | | | | 0.77 | | | | (1.26 | ) |
| | | | | | | | | | | | | | | | | | | | |
Total income (loss) from investment operations | | | (2.83 | ) | | | 3.68 | | | | 0.69 | | | | 0.98 | | | | (1.05 | ) |
| | | | | | | | | | | | | | | | | | | | |
Less Distributions | |
Distributions from net investment income | | | (0.37 | ) | | | (0.29 | ) | | | (0.25 | ) | | | (0.27 | ) | | | (0.34 | ) |
Distributions from net realized capital gains | | | (1.03 | ) | | | (0.67 | ) | | | (0.83 | ) | | | (2.59 | ) | | | (0.59 | ) |
| | | | | | | | | | | | | | | | | | | | |
Total distributions | | | (1.40 | ) | | | (0.96 | ) | | | (1.08 | ) | | | (2.86 | ) | | | (0.93 | ) |
| | | | | | | | | | | | | | | | | | | | |
Net Asset Value, End of Period | | $ | 10.99 | | | $ | 15.22 | | | $ | 12.50 | | | $ | 12.89 | | | $ | 14.77 | |
| | | | | | | | | | | | | | | | | | | | |
Total Return (%) (c) | | | (20.56 | ) | | | 30.45 | | | | 5.83 | (d) | | | 5.76 | | | | (6.69 | ) |
|
Ratios/Supplemental Data | |
Gross ratio of expenses to average net assets (%) | | | 1.18 | | | | 1.17 | | | | 1.18 | | | | 1.20 | | | | 1.23 | |
Net ratio of expenses to average net assets (%) (e) | | | 1.17 | | | | 1.16 | | | | 1.17 | | | | 1.19 | | | | 1.22 | |
Ratio of net investment income to average net assets (%) | | | 1.39 | | | | 1.29 | | | | 2.01 | (b) | | | 1.50 | | | | 1.32 | |
Portfolio turnover rate (%) | | | 16 | | | | 5 | | | | 8 | | | | 12 | | | | 10 | |
Net assets, end of period (in millions) | | $ | 74.7 | | | $ | 93.5 | | | $ | 76.3 | | | $ | 81.2 | | | $ | 74.5 | |
| | | | |
| (a) | | Per share amounts based on average shares outstanding during the period. |
| (b) | | Net investment income per share and the ratio of net investment income to average net assets include anon-recurring refund for overbilling of prior years’ custodianout-of-pocket fees which amounted to $0.02 per share and 0.14% of average net assets, respectively. |
| (c) | | Total return does not reflect any insurance, sales, separate account or administrative charges of variable annuity or life insurance contracts or any additional expenses that contract owners may bear under their variable contracts. If these charges were included, the returns would be lower. |
| (d) | | Includes the impact of thenon-recurring refund for overbilling of prior years’ custodianout-of-pocket fees which enhanced the performance of the Portfolio. Excluding this item, total return would have been 5.91% for Class A and 5.66% for Class B. |
| (e) | | Includes the effects of management fee waivers (see Note 5 of the Notes to Financial Statements). |
See accompanying notes to financial statements.
BHFTII-45
Brighthouse Funds Trust II
Brighthouse/Dimensional International Small Company Portfolio
Notes to Financial Statements—December 31, 2018
1. Organization
Brighthouse Funds Trust II (the “Trust”) is organized as a Delaware statutory trust and registered under the Investment Company Act of 1940, as amended (the “1940 Act”), as anopen-end management investment company. The Trust, which is managed by Brighthouse Investment Advisers, LLC (“Brighthouse Investment Advisers” or the “Adviser”), currently offers twenty-nine series, each of which operates as a distinct investment vehicle of the Trust. The series included in this report is Brighthouse/Dimensional International Small Company Portfolio (the “Portfolio”), which is diversified. Shares of the Portfolio are not offered directly to the general public and are currently available only to separate accounts of insurance companies, including insurance companies affiliated with the Adviser (together, the “Insurance Companies”).
The Portfolio has registered and offers two classes of shares: Class A and B shares. Shares of each Class of the Portfolio represent an equal pro rata interest in the Portfolio and generally give the shareholder the same voting, dividend, liquidation, and other rights. Investment income, realized and unrealized capital gains and losses, the common expenses of the Portfolio, and certain Portfolio-level expense reductions, if any, are allocated on a pro rata basis to each Class based on the relative net assets of each Class to the net assets of the Portfolio. Each Class of shares differs in its respective distribution plan and such distribution expenses are allocated to the corresponding Class of shares.
2. Significant Accounting Policies
The preparation of financial statements in conformity with accounting principles generally accepted in the United States of America (“GAAP”) requires management to make estimates and assumptions that affect the reported amounts of assets and liabilities and disclosure of contingent assets and liabilities as of the date of the financial statements and the reported amounts of income and expenses during the reporting period. Actual results could differ from those estimates. In the preparation of these financial statements, management has evaluated events and transactions subsequent to December 31, 2018 through the date the financial statements were issued.
The Portfolio is an investment company and follows the accounting and reporting guidance of the Financial Accounting Standards Board (“FASB”) Accounting Standards Codification Topic946- Financial Services- Investment Companies. The following is a summary of significant accounting policies consistently followed by the Portfolio in the preparation of its financial statements.
Investment Valuation and Fair Value Measurements - The Portfolio values its portfolio investments for purposes of calculating its net asset value (“NAV”) using procedures approved by the Board of Trustees of the Trust (the “Board” or “Trustees”). Those procedures allow for a variety of methodologies to be used to value the Portfolio’s investments. The specific methodologies used for a particular investment may vary based on the market data available for a specific investment at the time the Portfolio calculates its NAV or based on other considerations. The procedures also permit a level of judgment to be used in the valuation process. The Portfolio follows the accounting and reporting guidance of FASB Accounting Standards Codification Topic820- Fair Value Measurement.
Domestic and foreign equity securities, such as common stock, exchange-traded funds, rights, warrants, and preferred stock, that are traded on a securities exchange on a valuation date are generally valued at their last quoted sale price or official closing price on the primary exchange for such security, or, if no sales occurred on that day, at the last reported bid price. Equity securities tradedover-the-counter (“OTC”) are generally valued at the last reported bid price. In the event of a major exchange closing during the trading day, the Adviser may use other market information obtained from quotation reporting systems, established market makers, or pricing services in valuing the securities. Valuation adjustments may be applied to certain foreign equity securities that are traded solely on foreign exchanges that close before the time as of which the Portfolio determines its NAV to account for the market movement between the close of the foreign exchanges and the time as of which the Portfolio determines its NAV. The Portfolio may use a systematic fair valuation model provided by a pricing service to value securities principally traded in these foreign markets in order to adjust for possible market movements or other changes that may occur between the close of the foreign exchanges and the time as of which the Portfolio determines its NAV. Foreign equity securities valued using these valuation adjustments are generally categorized as Level 2 within the fair value hierarchy. Equity securities that are actively traded, and have no valuation adjustments applied, are categorized as Level 1 within the fair value hierarchy. Other equity securities traded on inactive markets, or valued in reference to similar instruments traded on active markets, are generally categorized as Level 2 within the fair value hierarchy.
Investments in registeredopen-end management investment companies are valued at reported NAV per share on the valuation date and are categorized as Level 1 within the fair value hierarchy.
Debt securities, including corporate, convertible and municipal bonds and notes; obligations of the U.S. Treasury and U.S. government agencies; foreign sovereign issues; andnon-U.S. bonds, are generally valued on the basis of evaluated or composite bid quotations obtained from independent pricing services and/or brokers and dealers selected by the Adviser (each a “pricing service”), pursuant to the authorization of and subject to general oversight by the Board. Such pricing services may use matrix pricing, which considers observable inputs including, among other things, issuer details, maturity dates, interest rates, yield curves, rates of prepayment, credit risks/spreads, default rates, reported trades, broker-dealer quotes and quoted prices for similar assets. Short-term obligations with a
BHFTII-46
Brighthouse Funds Trust II
Brighthouse/Dimensional International Small Company Portfolio
Notes to Financial Statements—December 31, 2018—(Continued)
remaining maturity of sixty days or less may be valued at amortized cost in the absence of market quotes, so long as the amortized cost value of such short-term debt instrument is approximately the same as the fair value of the instrument as determined without the use of amortized cost valuation. Floating rate loans are generally valued on the basis of an evaluated or composite average of aggregate bid and ask quotations supplied by brokers or dealers, as obtained from the pricing service. Securities that use similar valuation techniques and inputs as described above are generally categorized as Level 2 within the fair value hierarchy.
Options, whether on securities, indices, futures contracts, or otherwise, traded on exchanges are valued at the last sale price available as of the close of business on a valuation day or, if there is no such price available, at the last reported bid price. These types of options are categorized as Level 1 within the fair value hierarchy. Futures contracts that are traded on commodity exchanges are valued at their settlement prices established by the exchanges on which they are traded as of the close of such exchanges and are categorized as Level 1 within the fair value hierarchy.
If no current market value quotation or other observable inputs are readily available or market value quotations are deemed to be unreliable for an investment, the fair value of the investment will be determined in accordance with procedures approved by, and under the general supervision of, the Board. In such a circumstance, the Board will be assisted in its responsibility to determine the fair value of an investment by the Valuation Committee (“Committee”) of Brighthouse Investment Advisers. The Committee provides general pricing oversight and fair value pricing determinations related to portfolio securities and meets on a regular basis to review reports relating to the valuation of the securities in the Portfolio. The Board has delegated to State Street Bank and Trust Company, the Trust’s custodian (“Custodian”), the responsibility for calculating the NAVs of the Trust’s Portfolios. The Committee is responsible for overseeing the calculation of the NAVs of the Portfolios by the custodian. The Committee also periodically reviews pricing services, including the pricing services providing fair value pricing for the Portfolio’s foreign securities, and is responsible for overseeing the correction of pricing errors and addressing other pricing issues that arise in the ordinary course of business, such as making real-time fair value determinations, as necessary.
No single standard for determining the fair value of an investment can be set forth because fair value depends upon the facts and circumstances with respect to each investment. Information relating to any relevant factors may be obtained by the Committee from any appropriate source, including the subadviser of the Portfolio, the custodian, a pricing service, market maker and/or broker for such security or the issuer. Appropriate methodologies for determining fair value under particular circumstances may include: matrix pricing, a discounted cash flow analysis, comparisons of securities with comparable characteristics, value based on multiples of earnings, discount from market price of similar marketable securities, or a combination of these and other methods.
Investment Transactions and Related Investment Income - Portfolio security transactions are recorded on the trade date. Dividend income is recorded on theex-dividend date or, for certain foreign securities, when notified. Interest income, which includes amortization of premium and accretion of discount on debt securities, is recorded on the accrual basis. Realized gains and losses on investments are determined on the identified cost basis, which is the same basis used for federal income tax purposes. Foreign income and foreign capital gains on some foreign securities may be subject to foreign taxes, which are accrued as applicable. These foreign taxes have been provided for in accordance with the Portfolio’s understanding of the applicable countries’ tax rules and rates.
Foreign Currency Translation -The books and records of the Portfolio are maintained in U.S. dollars. The values of securities, currencies, and other assets and liabilities denominated in currencies other than the U.S. dollar are translated into U.S. dollars based upon foreign exchange rates prevailing at the end of the period. Purchases and sales of investment securities, income, and expenses are translated on the respective dates of such transactions. Because the values of investment securities are translated at the foreign exchange rates prevailing at the end of the period, that portion of the results of operations arising from changes in exchange rates and that portion of the results of operations reflecting fluctuations arising from changes in market prices of the investment securities are not separated. Such fluctuations are included in the net realized and unrealized gain or loss on investments.
Net realized foreign exchange gains or losses arise from activity in forward foreign currency exchange contracts, sales of foreign currency, currency gains or losses realized between the trade and settlement dates on securities transactions, and the difference between the amounts of dividends, interest, and foreign withholding taxes recorded by the Portfolio and the U.S. dollar-equivalent of the amounts actually received or paid by the Portfolio. Net unrealized foreign exchange gains and losses arise from changes in the value of assets and liabilities, other than investment securities, resulting from changes in foreign exchange rates.
Dividends and Distributions to Shareholders -The Portfolio records dividends and distributions on theex-dividend date. Net realized gains from securities transactions (if any) are generally distributed annually to shareholders. The timing and characterization of certain income and capital gains distributions are determined in accordance with federal tax regulations that may differ from GAAP. Permanent book and tax basis differences relating to shareholder distributions will result in reclassification between distributable earnings (accumulated losses) andpaid-in surplus. These adjustments have no impact on net assets or the results of operations.
Income Taxes -It is the Portfolio’s policy to comply with the requirements of the Internal Revenue Code of 1986, as amended, and regulations thereunder, applicable to regulated investment companies, and to distribute, with respect to each taxable year, all of its
BHFTII-47
Brighthouse Funds Trust II
Brighthouse/Dimensional International Small Company Portfolio
Notes to Financial Statements—December 31, 2018—(Continued)
taxable income to shareholders. Therefore, no federal income tax provision is required. The Portfolio files U.S. federal tax returns. No income tax returns are currently under examination. The Portfolio’s federal tax returns for the prior three fiscal years remain subject to examination by the Internal Revenue Service. As of December 31, 2018, the Portfolio had no uncertain tax positions that would require financial statement recognition, or derecognition or disclosure.
Repurchase Agreements -The Portfolio may enter into repurchase agreements, under the terms of a Master Repurchase Agreement (“MRA”), with selected commercial banks and broker-dealers, under which the Portfolio acquires securities as collateral and agrees to resell the securities at an agreed-upon time and at an agreed-upon price. The Portfolio, through the Custodian or a subcustodian, under atri-party repurchase agreement, receives delivery of the underlying securities collateralizing any repurchase agreements. It is the Portfolio’s policy that the market value of the collateral be equal to at least 100% of the repurchase price in the case of a repurchase agreement ofone-day duration and equal to at least 102% of the repurchase price in the case of all other repurchase agreements. In the event of default or failure by a party to perform an obligation in connection with any repurchase transaction, the MRA gives thenon-defaulting party the right toset-off claims and to apply property held by it in connection with any repurchase transaction against obligations owed to it.
At December 31, 2018, the Portfolio had direct investments in repurchase agreements with a gross value of $2,126,935. Additionally, the Portfolio invested cash collateral for loans of portfolio securities in repurchase agreements with a gross value of $20,520,731. The combined value of all repurchase agreements is included as part of investments at value on the Statement of Assets and Liabilities. The value of the related collateral exceeded the value of the repurchase agreements at December 31, 2018.
Securities Lending - The Portfolio may lend its portfolio securities to certain qualified brokers who borrow securities in order to complete certain securities transactions. By lending its portfolio securities, the Portfolio attempts to increase its net investment income through the receipt of income on collateral held from securities on loan. Any gain or loss in the market price of the loaned securities that might occur and any interest earned or dividends declared during the term of the loan would accrue to the account of the Portfolio.
The Trust has entered into aNon-Custodial Securities Lending Agreement with JPMorgan Chase Bank, N.A. (the “Lending Agent”). Under the agreement, the Lending Agent is authorized to loan portfolio securities on the Portfolio’s behalf. In exchange, the Portfolio receives either cash or U.S. government securities as collateral against the loaned securities. The Portfolio receives collateral equal to at least 102% of the market value for loans secured by government securities or cash in the same currency as the loaned shares and 105% for all other loaned securities at each loan’s inception. Collateral representing at least 100% of the market value of the loaned securities is maintained for the duration of the loan. Any cash collateral received by the Portfolio is generally invested by the Lending Agent in short-term investments, which may include certificates of deposit, commercial paper, repurchase agreements, time deposits, master demand notes and money market funds. The market value of investments made with cash collateral received are disclosed in the Schedule of Investments and the valuation techniques are described in Note 2. If the market value of the collateral at the close of trading on a business day is less than 100% of the market value of the loaned securities at the close of trading on that day, the borrower is required to deliver, by the close of business on the following business day, an additional amount of collateral, so that the total amount of posted collateral is equal to at least 100% of the market value of all the loaned securities as of such preceding day. A portion of the income earned on the collateral is rebated to the borrower of the securities and the remainder is split between the Lending Agent and the Portfolio. On loans collateralized by U.S. government securities, a fee is received from the borrower and is allocated between the Portfolio and the Lending Agent.
Income received by the Portfolio in securities lending transactions during the year ended December 31, 2018 is reflected as securities lending income on the Statement of Operations. The values of any securities loaned by the Portfolio and the related collateral at December 31, 2018 are disclosed in the footnotes to the Schedule of Investments. The value of the related collateral received by the Portfolio exceeded the value of the securities out on loan at December 31, 2018.
The risks associated with lending portfolio securities include, but are not limited to, possible delays in receiving additional collateral or in the recovery of the loaned securities, possible loss of rights in the collateral should the borrower fail financially, as well as risk of loss in the value of the collateral or the value of the investments made with the collateral. The Lending Agent shall indemnify the Portfolio in the case of default of any securities borrower, subject to the terms of theNon-Custodial Securities Lending Agreement.
All securities on loan are classified as Common Stocks in the Portfolio’s Schedule of Investments as of December 31, 2018, with a contractual maturity of overnight and continuous.
3. Certain Risks
In the normal course of business, the Portfolio invests in securities and enters into transactions where risks exist. Those risks include:
Market Risk: The value of securities held by the Portfolio may decline in response to certain events, including those directly involving the issuers whose securities are owned by the Portfolio; conditions affecting the general economy; overall market changes; local, regional or global political, social or economic instability; and currency, interest rate, and price fluctuations.
BHFTII-48
Brighthouse Funds Trust II
Brighthouse/Dimensional International Small Company Portfolio
Notes to Financial Statements—December 31, 2018—(Continued)
Credit and Counterparty Risk: The Portfolio may be exposed to counterparty risk, or the risk that an entity with which the Portfolio has unsettled or open transactions may default. The potential loss could exceed the value of the financial assets and liabilities recorded in the financial statements. Financial assets that potentially expose the Portfolio to credit and counterparty risk consist principally of cash due from counterparties and investments. The Portfolio manages counterparty risk by entering into agreements only with counterparties that it believes have the financial resources to honor their obligations and by monitoring the financial stability of those counterparties. The Adviser attempts to mitigate counterparty risk by (i) periodically assessing the creditworthiness of its trading partners, (ii) monitoring and/or limiting the amount of its net exposure to each individual counterparty based on its assessment, and (iii) requiring collateral from the counterparty for certain transactions. In order to preserve certain safeguards fornon-standard settlement trades, the Portfolio restricts its exposure to credit and counterparty losses by entering into master netting agreements (“Master Agreements”) with counterparties (approved brokers) with whom it undertakes a significant volume of transactions. Master Agreements govern the terms of certain transactions, and reduce the counterparty risk associated with relevant transactions by specifying credit protection mechanisms and providing standardization that improves legal certainty. Master Agreements can also help limit counterparty risk by specifying collateral posting arrangements atpre-arranged exposure levels.
Repurchase and reverse repurchase agreements are primarily executed under Global Master Repurchase Agreements (“GMRAs”) or Master Repurchase Agreements (“MRAs”), which provide the rights toset-off. Each repurchase and reverse repurchase agreement is initially collateralized at the transaction level. In the event of default, the total market value exposure will be offset against collateral exchanged to date, which would result in a net receivable/(payable) that would be due from/to the counterparty.
Foreign Investment Risk:The investments by the Portfolio in foreign securities may involve risks not present in domestic investments. Because securities may be denominated in foreign currencies, may require settlement in foreign currencies and may pay interest or dividends in foreign currencies, changes in the relationship of these foreign currencies to the U.S. dollar can significantly affect the value of the investments and earnings of the Portfolio. Foreign investments may also subject the Portfolio to foreign government exchange restrictions, expropriation, taxation or other political, social or economic developments, all of which could affect the market and/or credit risk of the investments. In addition to the risks described above, risks may arise from forward foreign currency contracts with respect to the potential inability of counterparties to meet the terms of their contracts.
Additional risks associated with each type of investment are described above within the respective security type notes. The Portfolio’s prospectus includes a discussion of the principal risks of investing in the Portfolio.
4. Investment Transactions
Aggregate cost of purchases and proceeds of sales of investment securities, excluding short-term securities, for the year ended December 31, 2018 were as follows:
| | | | | | | | | | | | |
Purchases | | | Sales | |
U.S. Government | | Non-U.S. Government | | | U.S. Government | | | Non-U.S. Government | |
| $ 0 | | $ | 109,226,065 | | | $ | 0 | | | $ | 125,669,110 | |
5. Investment Management Fees and Other Transactions with Affiliates
Investment Management Agreement -Brighthouse Investment Advisers is the investment adviser to the Portfolio. The Trust has entered into an investment management agreement with Brighthouse Investment Advisers with respect to the Portfolio. For providing investment management services to the Portfolio, Brighthouse Investment Advisers receives monthly compensation at the following annual rates:
| | | | | | |
Management
Fees earned by
Brighthouse
Investment Advisers
for the year ended
December 31, 2018 | | % per annum | | | Average Daily Net Assets |
| $5,510,899 | | | 0.850 | % | | Of the first $100 million |
| | | 0.800 | % | | On amounts in excess of $100 million |
Brighthouse Investment Advisers has entered into an investment subadvisory agreement with respect to managing the Portfolio. Dimensional Fund Advisors LP (the “Subadviser”) is compensated by Brighthouse Investment Advisers to provide subadvisory services for the Portfolio.
BHFTII-49
Brighthouse Funds Trust II
Brighthouse/Dimensional International Small Company Portfolio
Notes to Financial Statements—December 31, 2018—(Continued)
Management Fee Waivers - Pursuant to an expense agreement, Brighthouse Investment Advisers has agreed, for the period April 30, 2018 to April 30, 2019, to reduce its advisory fees set out above under “Investment Management Agreement” for each class of the Portfolio as follows:
| | | | |
% per annum | | Average Daily Net Assets | |
| 0.050% | | | Of the first $100 million | |
An identical expense agreement was in place for the period May 1, 2017 to April 30, 2018. Amounts waived for the year ended December 31, 2018 are shown as management fee waivers in the Statement of Operations.
Certain officers and trustees of the Trust may also be officers of Brighthouse Investment Advisers; however, such officers and trustees receive no compensation from the Trust.
Transfer Agency Agreement -Brighthouse Financial, Inc. serves as the transfer agent for the Trust. Brighthouse Financial, Inc. receives no fees for its services to the Trust.
Distribution and Service Fees - The Trust has a distribution agreement with Brighthouse Securities, LLC (the “Distributor”) pursuant to which the Distributor serves as the general distributor of shares of each class (each a “Class”) of each Portfolio. The Distributor is an affiliate of the Trust. The Trust has adopted a Distribution and Services Plan (the “Plan”) relating to Class B shares of each Portfolio, under Rule 12b-1 under the 1940 Act, pursuant to which the Trust may pay the Distributor a fee (the “Service Fee”) at an annual rate not to exceed 0.25% of each such Portfolio’s average daily net assets attributable to the Class B shares of the Trust. Each Portfolio may not offer shares of each Class. The Plan also authorizes the Trust, on behalf of each of its Portfolios, may pay the Distributor a distribution Fee (the “Distribution Fee” and together with the Service Fee, the “Fees”) at an annual rate of up to 0.25% of each Portfolio’s average daily net assets attributable to the Class B in consideration of the services rendered in connection with the sale of such shares by the Distributor. Under the Distribution Agreement with respect to the Trust, Fees are currently paid at an annual rate of 0.25% of average daily net assets in the case of Class B shares. The Plan is known as a “compensation plan” because the Trust makes payments to the Distributor for services rendered regardless of the actual level of expenditures by the Distributor. Amounts incurred by the Portfolio for the year ended December 31, 2018 are shown as Distribution and service fees in the Statement of Operations.
Deferred Trustee Compensation -Each Trustee who is not currently an employee of the Adviser or any of its affiliates receives compensation from the Trust for his or her service to the Trust. A deferred compensation plan (the “Plan”) is available to the Trustees on a voluntary basis. Deferred amounts remain in the Trust until distributed in accordance with the provisions of the Plan. The value of a participating Trustee’s deferral account is based on theoretical investments of deferred amounts on the normal payment dates in certain portfolios of the Trust or Brighthouse Funds Trust I, an affiliate of the Trust, as designated by the participating Trustee. Changes in the value of participants’ deferral accounts are reflected as Trustees’ fees and expenses in the Statement of Operations. The portion of the accrued obligations allocated to the Portfolio under the Plan is reflected as Deferred trustees’ fees in the Statement of Assets and Liabilities.
6. Contractual Obligations
Under the Trust’s organizational documents, its officers and Trustees may be indemnified against certain liabilities and expenses arising out of the performance of their duties to the Trust. Additionally, the Trust has a variety of indemnification obligations under contracts with its service providers. The Trust’s maximum exposure under these arrangements is unknown, as this would involve future claims that may be made against the Trust that have not yet occurred.
7. Income Tax Information
The cost basis of investments for federal income tax purposes at December 31, 2018 was as follows:
| | | | |
Cost basis of investments | | $ | 603,738,257 | |
| | | | |
Gross unrealized appreciation | | | 133,542,746 | |
Gross unrealized depreciation | | | (143,814,205 | ) |
| | | | |
Net unrealized appreciation (depreciation) | | $ | (10,271,459 | ) |
| | | | |
The tax character of distributions paid for the years ended December 31, 2018 and 2017 were as follows:
| | | | | | | | | | | | | | | | | | | | |
Ordinary Income | | | Long-Term Capital Gain | | | Total | |
2018 | | 2017 | | | 2018 | | | 2017 | | | 2018 | | | 2017 | |
| $19,890,152 | | $ | 18,121,381 | | | $ | 46,059,396 | | | $ | 30,338,564 | | | $ | 65,949,548 | | | $ | 48,459,945 | |
BHFTII-50
Brighthouse Funds Trust II
Brighthouse/Dimensional International Small Company Portfolio
Notes to Financial Statements—December 31, 2018—(Continued)
As of December 31, 2018, the components of distributable earnings (accumulated losses) on a federal income tax basis were as follows:
| | | | | | | | | | | | | | | | |
Undistributed
Ordinary
Income | | Undistributed
Long-Term
Capital Gain | | | Net
Unrealized
Depreciation | | | Accumulated
Capital Losses | | | Total | |
| $8,253,264 | | $ | 56,747,079 | | | $ | (10,274,264 | ) | | $ | — | | | $ | 54,726,079 | |
The Portfolio utilizes the provisions of the federal income tax laws that provide for the carryforward of capital losses for prior years, offsetting such losses against any future realized capital gains. Under the Regulated Investment Company Modernization Act of 2010, net capital losses recognized after December 22, 2010 may be carried forward indefinitely and their character is retained as short-term and/or long-term losses.
As of December 31, 2018, the Portfolio had no accumulated capital losses.
8. Recent Accounting Pronouncements and SEC Update
In August 2018, the FASB issued Accounting Standards Update 2018-13, Fair Value Measurement (Topic 820)—Disclosure Framework—Changes to the Disclosure Requirements for Fair Value Measurement (“ASU 2018-13”) which introduces new fair value disclosure requirements as well as eliminates and modifies certain existing fair value disclosure requirements. ASU 2018-13 is effective for fiscal years beginning after December 15, 2019, and interim periods within those fiscal years. Early adoption is permitted and, as such, management has elected to early adopt ASU 2018-13 effective with the current reporting period. The impact of the Portfolio’s adoption was limited to changes in the Portfolio’s financial statement disclosures regarding fair value, primarily those disclosures related to transfers between levels of the fair value hierarchy.
In August 2018, the Securities and Exchange Commission released its Final Rule on Disclosure Update and Simplification (the “Final Rule”) which is intended to simplify an issuer’s disclosure compliance efforts by removing redundant or outdated disclosures requirements without significantly altering the mix of information provided to investors. Effective with the current reporting period, the Portfolio adopted the Final Rule with the most notable impacts being that the Portfolio is no longer required to present the components of distributable earnings on the Statement of Assets and Liabilities or the sources of distributions to shareholders and the amounts of undistributed net investment income on the Statements of Changes in Net Assets.
BHFTII-51
Brighthouse Funds Trust II
Brighthouse/Dimensional International Small Company Portfolio
Report of Independent Registered Public Accounting Firm
To the Shareholders of Brighthouse/Dimensional International Small Company Portfolio and the Board of Trustees of Brighthouse Funds Trust II:
Opinion on the Financial Statements and Financial Highlights
We have audited the accompanying statement of assets and liabilities, including the schedule of investments, of the Brighthouse/Dimensional International Small Company Portfolio (the “Portfolio”), one of the portfolios constituting the Brighthouse Funds Trust II, as of December 31, 2018, the related statement of operations for the year then ended, the statements of changes in net assets for each of the two years in the period then ended, the financial highlights for each of the five years in the period then ended, and the related notes. In our opinion, the financial statements and financial highlights present fairly, in all material respects, the financial position of the Brighthouse/Dimensional International Small Company Portfolio of the Brighthouse Funds Trust II as of December 31, 2018, the results of its operations for the year then ended, the changes in its net assets for each of the two years in the period then ended, and the financial highlights for each of the five years in the period then ended, in conformity with accounting principles generally accepted in the United States of America.
Basis for Opinion
These financial statements and financial highlights are the responsibility of the Portfolio’s management. Our responsibility is to express an opinion on the Portfolio’s financial statements and financial highlights based on our audits. We are a public accounting firm registered with the Public Company Accounting Oversight Board (United States) (PCAOB) and are required to be independent with respect to the Portfolio in accordance with the U.S. federal securities laws and the applicable rules and regulations of the Securities and Exchange Commission and the PCAOB.
We conducted our audits in accordance with the standards of the PCAOB. Those standards require that we plan and perform the audit to obtain reasonable assurance about whether the financial statements and financial highlights are free of material misstatement, whether due to error or fraud. The Portfolio is not required to have, nor were we engaged to perform, an audit of its internal control over financial reporting. As part of our audits we are required to obtain an understanding of internal control over financial reporting but not for the purpose of expressing an opinion on the effectiveness of the Portfolio’s internal control over financial reporting. Accordingly, we express no such opinion.
Our audits included performing procedures to assess the risks of material misstatement of the financial statements and financial highlights, whether due to error or fraud, and performing procedures that respond to those risks. Such procedures included examining, on a test basis, evidence regarding the amounts and disclosures in the financial statements and financial highlights. Our audits also included evaluating the accounting principles used and significant estimates made by management, as well as evaluating the overall presentation of the financial statements and financial highlights. Our procedures included confirmation of securities owned as of December 31, 2018, by correspondence with the custodian and brokers; when replies were not received from brokers, we performed other auditing procedures. We believe that our audits provide a reasonable basis for our opinion.
/s/ Deloitte & Touche LLP
Boston, Massachusetts
February 25, 2019
We have served as the auditor of one or more of the Brighthouse investment companies since 1983.
BHFTII-52
Brighthouse Funds Trust II
Trustees and Officers
MANAGEMENT OF THE TRUSTS
The Boards of Trustees (the “Board”) of Brighthouse Funds Trust I and Brighthouse Funds Trust II (“BHF I” and “BHF II”, respectively, and collectively the “Trusts”) supervise the Trusts and are responsible for representing the interests of shareholders. The Trustees, the Chairman of the Board and the Chairmen of each subcommittee are the same for both Trusts. The Trustees of each Trust meet periodically throughout the year to oversee the Portfolios’ activities, reviewing, among other things, each Portfolio’s performance and its contractual arrangements with various service providers. The Trustees of each Trust elect the officers of the Trust, who are responsible for administering the Trust’sday-to-day operations.
Trustees and Officers
The Trustees and executive officers of the Trusts, as well as their principal occupations during the past five years, are set forth below. Unless otherwise indicated, the business address of each is c/o Brighthouse Funds, One Financial Center, Boston, Massachusetts 02111. Each Trustee who is deemed an “interested person,” as such term is defined in the 1940 Act, is referred to as an “Interested Trustee.” Those Trustees who are not “interested persons,” as such term is defined in the 1940 Act, are referred to as “Independent Trustees.” There is no limit to the term a Trustee may serve. Trustees serve until their death, resignation or removal in accordance with the BHF I Trust’s and BHF II Trust’s respective organizational documents and policies adopted by the Boards of the respective Trusts from time to time. Officers hold office at the pleasure of each Board and serve until their removal or resignation in accordance with the Trusts’ respective organizational documents and policies adopted by the Board of each Trust from time to time.
| | | | | | | | | | |
Name and Year of Birth | | Current
Position(s)
Held with
Registrant | | Term of Office
and Length of
Time Served | | Principal Occupation(s) During the Past 5 Years(1) | | Number of
Portfolios in
Brighthouse Funds
Complex(2)
Overseen
by Trustee | | Other Directorships Held
by Trustee During
the Past 5 Years(1) |
| Interested Trustee |
John Rosenthal* (1960) | | Trustee | | Indefinite;
From
May
2016
(Trust I
and
Trust II) to
present | | Chief Investment Officer, Brighthouse Financial, Inc. (2017 to present); until 2017, Senior Managing Director and Head of Global Portfolio Management, MetLife, Inc. | | 72 | | None |
|
| Independent Trustees |
Dawn M. Vroegop (1966) | | Trustee and Chairman of the Board | | Indefinite;
From
December
2000
(Trust I)/
May
2009
(Trust II)
to present
as
Trustee;
From
May
2016
(Trust I
and
Trust II)
until
present as
Chairman | | Private Investor. | | 72 | | Trustee, Driehaus Mutual Funds.** |
BHFTII-53
Brighthouse Funds Trust II
Trustees and Officers—(Continued)
| | | | | | | | | | |
Name and Year of Birth | | Current
Position(s)
Held with
Registrant | | Term of Office
and Length of
Time Served | | Principal Occupation(s) During the Past 5 Years(1) | | Number of
Portfolios in
Brighthouse Funds
Complex(2)
Overseen
by Trustee | | Other Directorships Held
by Trustee During
the Past 5 Years(1) |
Stephen M. Alderman (1959) | | Trustee | | Indefinite;
From
December
2000
(Trust I)/
April
2012
(Trust II)
to present | | Shareholder in the law firm of Garfield and Merel, Ltd. | | 72 | | None |
| | | | | |
Robert J. Boulware (1956) | | Trustee | | Indefinite;
From
March
2008
(Trust I)/
April
2012
(Trust II)
to present | | Managing Director, Pilgrim Funds, LLC (private equity fund). | | 72 | | Trustee, Vertical Capital Income Fund(closed-end fund);** Director, Gainsco, Inc. (auto insurance);** Trustee, SharesPost 100 Fund(closed-end fund).** |
| | | | | |
Susan C. Gause (1952) | | Trustee | | Indefinite;
From
March
2008
(Trust I)/
April
2012
(Trust II)
to present | | Private Investor. | | 72 | | Trustee, HSBC Funds.** |
| | | | | |
Nancy Hawthorne (1951) | | Trustee | | Indefinite;
From
May
2003
(Trust II)/
April
2012
(Trust I) to
present | | Partner, Hawthorne Financial Advisors, LLC (registered investment advisor); until 2014, Chief Executive Officer, Clerestory LLC (corporate advisor). | | 72 | | Director and Chairman of the Board of Directors, THL Credit, Inc.;** Director and Chairman of the Board, Avid Technology, Inc.;** Director, CRA International, Inc.** |
| | | | | |
Barbara A. Nugent (1956) | | Trustee | | Indefinite;
From
January
2014
(Trust I
and
Trust II) to
present | | President, True North Board Governance, LLC (consulting); until December 2013, partner in the law firm of Stradley Ronon Stevens & Young, LLP. | | 72 | | Independent Lead Trustee, BMT Investment Funds** |
| | | | | |
Christopher J. Towle (1957) | | Trustee | | Indefinite;
From
April
2018
(Trust I
and
Trust II) to
present | | Retired; until 2014, Partner, Portfolio Manager, Director of High Yield and Convertible Strategies, Lord Abbett & Co. | | 72 | | Trustee, Driehaus Mutual Funds** |
BHFTII-54
Brighthouse Funds Trust II
Trustees and Officers—(Continued)
Officers
| | | | | | |
Name and Year of Birth | | Position(s)
Held with
Registrant | | Length of
Time Served | | Principal Occupation(s)
During the Past 5 Years(1) |
| Executive Officers | | | | | | |
Kristi Slavin (1973) | | President and Chief Executive Officer, of Trust I and Trust II | | From May
2016
(Trust I
and
Trust II) to
present | | President, Brighthouse Investment Advisers, LLC (2016-present); formerly, Senior Vice President, MetLife Advisers, LLC; Vice President, MetLife, Inc.; Vice President, Trust I and Trust II(2015-2016). |
| | | |
Alan R. Otis (1971) | | Chief Financial Officer and Treasurer, of Trust I and Trust II | | From
November
2017
(Trust I
and
Trust II) to
present | | Senior Vice President, Brighthouse Investment Advisers, LLC (2017-present); formerly, Vice President, Brighthouse Investment Advisers, LLC (2012-2017); Assistant Treasurer, Trust I and Trust II(2012-2017). |
| | | |
Andrew L. Gangolf (1954) | | Secretary, of Trust I and Trust II | | From May
2011
(Trust I
and
Trust II) to
present | | Executive Vice President, Brighthouse Investment Advisers, LLC (2017-present); formerly, Senior Vice President, MetLife Advisers, LLC (2011-2017); until 2011, Senior Vice President & Assistant General Counsel, AllianceBernstein Investments, Inc. |
| | | |
Steven E. Hartstein (1963) | | Chief Compliance Officer (“CCO”), of Trust I and Trust II | | From
February
2014
(Trust I
and
Trust II) to
present | | Senior Vice President and CCO, Brighthouse Investment Advisers, LLC (2017-present); Head of Investments Compliance, Vice President, Brighthouse Financial, Inc. (2017-present); formerly, Vice President, MetLife, Inc. (2013-2017); Senior Vice President and CCO, MetLife Advisers, LLC (2013-2017.) |
| | | |
Victor Soto (1978) | | Vice President of Trust I and Trust II | | From May
2018
(Trust I
and
Trust II) to
present | | Executive Vice President, Brighthouse Investment Advisers, LLC (2016-present); Assistant Vice President, MetLife Inc. (2015-2017); Portfolio Manager, 1st Global (2013-2015). |
| * | Mr. Rosenthal is an “interested person” of the Trusts because of his position with Brighthouse Financial, Inc., the current parent company of Brighthouse Investment Advisers, LLC. |
| ** | Indicates a directorship with a registered investment company or a company subject to the reporting requirements of the Securities Exchange Act of 1934, as amended. |
| (1) | Previous positions during the past five years with the Trusts, Brighthouse Financial, Inc., MetLife, Inc. or the Manager are omitted if not materially different. |
| (2) | The Fund Complex includes 43 BHF I Portfolios and 29 BHF II Portfolios. |
BHFTII-55
Brighthouse Funds Trust II
Brighthouse/Dimensional International Small Company Portfolio
Board of Trustees’ Consideration of Advisory and Sub-Advisory Agreements
At anin-person meeting held on November6-8, 2018 (the “November Meeting”), the Boards of Trustees (the “Board”) of Brighthouse Funds Trust I and Brighthouse Funds Trust II (“BFT I” and “BFT II,” respectively, and collectively, the “Trusts”), including a majority of the Trustees who are not “interested persons” of the Trusts (the “Independent Trustees”) under the Investment Company Act of 1940 (the “1940 Act”), approved the continuation of the Trusts’ advisory agreements (each, an “Advisory Agreement”) with Brighthouse Investment Advisers, LLC (the “Adviser”) and the applicablesub-advisory agreements (each a “Sub-Advisory Agreement,” and collectively with the Advisory Agreement, the “Agreements”) between the Adviser and the investmentsub-advisers (each a “Sub-Adviser,” and collectively, the “Sub-Advisers”) for the series of the Trusts (each a “Portfolio,” and collectively, the “Portfolios”).
In making those approvals, the Board reviewed a variety of materials that were provided for the specific purpose of the annual contract renewal process. In addition, various materials provided to and discussed with the Board throughout the year informed the Board’s decision to renew the Agreements. In particular, the information for each Portfolio included, but was not limited to, investment performance reports, and reports on expenses, legal and compliance matters, asset pricing, brokerage commissions and trade execution.
The Board met in person with personnel of the Adviser on October 17, 2018 for the specific purpose of giving preliminary consideration to the proposed continuation of the Agreements (the “October Meeting”). At that meeting, the Adviser reviewed with the Board the performance and fees experienced by each Portfolio, as well as other information. During and after the October Meeting, the Independent Trustees communicatedfollow-up matters for management to address at the November Meeting. The Independent Trustees were advised by independent legal counsel throughout the contract renewal process, and met with independent legal counsel in several executive sessions outside of the presence of management.
Information furnished and reviewed specifically in connection with the renewal process included, but was not limited to, a report for each Portfolio that was prepared by Broadridge (“Broadridge”), an independent organization. In addition, the Independent Trustees reviewed a report that was prepared by JDL Consultants, LLC (“JDL”), an independent consultant to the Independent Trustees (“JDL Report”), which examined the comparative fees, expenses and performance of each Portfolio, based upon the Broadridge reports. Also, the Board reviewed the responses to wide-ranging questions from the Independent Trustees relating to the business, operations and performance of the Adviser and theSub-Advisers that the Adviser andSub-Advisers had prepared specifically for the renewal process, and reviewed aPortfolio-by-Portfolio analysis of the profitability to the Adviser of each Advisory Agreement, which was prepared by the Adviser for the renewal process.
At the November Meeting, the Board, including a majority of the Independent Trustees, concluded that the nature, extent and quality of services provided by the Adviser and eachSub-Adviser supported the renewal of the Agreements. The Board also concluded that the investment performance of each Portfolio was such that each Agreement should continue, and that the fees paid by each Portfolio to the Adviser appeared to be reasonable in light of the nature, extent and quality of the services provided by the Adviser andSub-Adviser. Further, the Board concluded that the Adviser’s profitability in providing services under the Advisory Agreements did not appear unreasonable in light of the nature, extent and quality of the services provided by the Adviser. Finally, the Board reviewed the extent to which the investment advisory fees paid by the Portfolios shared economies of scale with investors or entailed the potential to share economies of scale with investors and concluded that those considerations generally supported the renewal of each Agreement. In approving the renewal of each of the Agreements, the Board, including the Independent Trustees, gave attention to all of the information that was furnished and each Trustee placed varying degrees of importance on the various pieces of information that were provided to them. The Board evaluated the information available to it on aPortfolio-by-Portfolio basis, and its decision was made separately with respect to each Portfolio. The following paragraphs provide more information about some of the primary factors that were relevant to the Board’s decision. The Board did not identify any single factor as determinative, and the Trustees generally attributed different weights to various factors for the various Portfolios.
Nature, extent and quality of services. The Board evaluated the nature, extent and quality of the services that the Adviser and theSub-Advisers, as relevant, have provided to the Portfolios. The Board considered the Adviser’s services as investment manager to the Portfolios, including its services relating to the hiring and oversight of theSub-Advisers, trading practices and oversight of transition management (as applicable), compliance programs and personnel, and risk management, among other things. The Adviser’s services in coordinating and overseeing the activities of the Trusts’ other service providers were also considered. The Board considered information received from the Trusts’ Chief Compliance Officer (“CCO”) regarding the Portfolios’ compliance policies and procedures that were established pursuant to Rule38a-l under the 1940 Act. The Board also noted that the Adviser’s investment, compliance and legal staff conduct regular and periodic telephonic andin-person meetings with theSub-Advisers to review and assess the services that are provided to the Portfolios, and that personnel of the Adviser prepare and present reports to the Independent Trustees regarding those meetings. In addition, throughout the year, the Board considered the expertise, experience and performance of the personnel of the Adviser who performed the various services that are mentioned above.
BHFTII-56
Brighthouse Funds Trust II
Brighthouse/Dimensional International Small Company Portfolio
Board of Trustees’ Consideration of Advisory and Sub-Advisory Agreements—(Continued)
With respect to the services provided by each of theSub-Advisers, the Board considered a variety of information that the Adviser and eachSub-Adviser prepared for the Board’s review. The Board considered eachSub-Adviser’s investment process and philosophy, and the investment performance experienced by the Portfolio (as described in more detail below). The Board took into account that eachSub-Adviser’s responsibilities include the development and maintenance of an investment program for the applicable Portfolio that is consistent with the Portfolio’s investment objectives, the selection of investment securities and the placement of orders for the purchase and sale of such securities, as well as the implementation of compliance controls related to performance of these services. In particular, the Board considered, among other things, theSub-Adviser’s current level of staffing as well as its compensation program and its overall resources. The Board reviewed eachSub-Adviser’s history and investment experience, as well as information provided regarding the qualifications, background and responsibilities of theSub-Adviser’s investment and compliance personnel who provide services to the Portfolios. The Board also considered, among other things, eachSub-Adviser’s compliance program and regulatory and disciplinary history. In its review, the Board also took into account information regarding any services and/or payments provided to the Adviser by theSub-Advisers in connection with marketing activities and considered representations from the Adviser that those payments were not considered in the Adviser’s recommendation to renew any of theSub-Advisory Agreements.
Performance. The Board placed emphasis on the performance of each Portfolio in light of, among other things, its importance to investors. The Board considered the Adviser’s quarterly reviews with the Board of detailed information about each Portfolio’s investment strategies and performance results and composition, including discussions regarding the relevant effect of current market conditions. The Board reviewed and considered the reports prepared by Broadridge, which provided a statistical analysis comparing the Portfolios’ investment performance to that of comparable funds underlying variable insurance products (the “Performance Universe”). The Independent Trustees also met separately with representatives of JDL during the October Meeting to review the JDL Report. The Board also compared the performance records of the Portfolios to those of comparable funds and other accounts that were managed by the relevantSub-Adviser, to the extent such information was available. The Board considered each Portfolio’s performance for periods subsequent to the performance period covered by the Broadridge reports, and the Adviser’s discussion of the same, including the effect of current market conditions on each Portfolio’s more recent performance. The Board also noted that while it found the data provided by Broadridge generally useful, it recognized the limitations of such data, including, in particular, that notable differences may exist between a Portfolio and those of the other funds in a Broadridge category (for example, the investment objectives(s) and investment strategies) and that the results of the performance comparisons may vary depending on (i) the end dates for the performance periods that were selected and (ii) the selection of the peer groups.
The Board focused particular attention on Portfolios with less favorable performance records. The Board noted the Adviser’s focus on eachSub-Adviser’s performance and that the Adviser has been active in monitoring and responding to any performance issues with respect to the Portfolios.
Fees and Expenses. The Board gave consideration to the level and method of computing the fees payable under the Agreements. The Board considered the Broadridge report for each of the Portfolios, which included comparisons for each Portfolio of its contractual management andsub-adviser fees (at current and various asset levels), and total expenses, with those of its peers, including as those peers were divided into a broad group of peer funds (“Expense Universe”), a narrower group of peer funds (“Expense Group”), a broad group of peersub-advised funds (“Sub-advised Expense Universe”), and a narrower group of peersub-advised funds (“Sub-advised Expense Group”). Broadridge selected the peer funds which were similarly situated funds underlying variable insurance products deemed to be comparable to the Portfolios. The Independent Trustees, with the assistance of JDL, also examined the JDL Report. The Board compared the fee payable to aSub-Adviser by the Adviser with respect to the Portfolio to the fee payable to theSub-Adviser by other comparable funds and other accounts, to the extent such information was available.
The Board noted that thesub-advisory fees for the Portfolios are paid by the Adviser out of the advisory fees, and that the Adviser negotiates the fees at arm’s length. The Board also considered that the Adviser had entered into expense limitation or management fee waiver agreements with certain of the Portfolios pursuant to which the Adviser had agreed to waive a portion of its advisory fee and/or reimburse certain expenses as a means of limiting a Portfolio’s total annual operating expenses.
Profitability. The Board examined the profitability to the Adviser of each Advisory Agreement, on aPortfolio-by-Portfolio basis. The Board also considered that an affiliate of the Adviser, Brighthouse Securities, LLC, serves as distributor for the Trusts, and, as such, receives Rule12b-1 payments to support the distribution of the Portfolios. The Board considered the profitability to theSub-Advisers and their affiliates as a result of their relationships with the Portfolios, to the extent available, and the Board considered the ability of the Adviser to negotiate with aSub-Adviser at arm’s length. In reviewing the profitability analyses, the Board recognized that expense allocation methodologies are inherently subjective and various expense allocation methodologies may be reasonable while producing different results.
BHFTII-57
Brighthouse Funds Trust II
Brighthouse/Dimensional International Small Company Portfolio
Board of Trustees’ Consideration of Advisory and Sub-Advisory Agreements—(Continued)
Economies of scale. The Board also considered each Portfolio’s fees in light of its size. The Board noted the fee schedules for the Portfolios that contain breakpoints that reduce the fee rate above specified asset levels. The Board noted those Portfolios that did not have breakpoints in their advisory fee and took into account management’s discussion of the same. The Board noted that those Portfolios with Advisory Agreements containing breakpoints generally have breakpoints in the correspondingSub-Advisory Agreement. The Board considered the effective fees under the Advisory Agreement andSub-Advisory Agreement for each Portfolio as a percentage of assets at different asset levels and possible economies of scale that may be realized if the assets of the Portfolio grow. The Board examined, among other data, the effect of a Portfolio’s growth in size, and reduction in size, on various fee schedules and the Board reviewed the Broadridge and JDL Reports, which compared fees among peers. The Board also generally noted that if a Portfolio’s assets increase over time, the Portfolio may realize other economies of scale if assets increase proportionally more than certain other fixed expenses.
Other factors. The Board considered other benefits that may be realized by the Adviser and its affiliates from their relationship with the Trusts. Among them, the Board recognized that Brighthouse Securities, LLC, as the distributor for the Trusts, receives payments pursuant to Rule12b-1 from the Portfolios to compensate for the provision of shareholder services and distribution activities, which could lead to growth in the Trusts’ assets and corresponding benefits from such growth, including economies of scale. The Board considered other benefits that may be realized by eachSub-Adviser and its affiliates from their relationship with the Trusts, including the opportunity to provide advisory services to additional portfolios of the Trusts and reputational benefits. In conjunction with these considerations, the Board noted the ongoing commitment of the Adviser to the Portfolios.
The Board requested, received, and considered information from the Adviser regarding possible conflicts of interest in the form of material benefits to the Adviser resulting from the Adviser’s affiliations and business relationships, as relevant. The Board considered the services that are provided to the Trusts by its service providers, and the manner in which any conflicts were mitigated.
* * *
Brighthouse/Dimensional International Small Company Portfolio. The Board also considered the following information in relation to the Agreements with the Adviser and Dimensional Fund Advisors LP regarding the Portfolio:
Among other data relating specifically to the Portfolio’s performance, the Board considered that the Portfolio outperformed the median of its Performance Universe and the average of its Morningstar Category for theone-, three-, and five-year periods ended June 30, 2018. The Board also took into account that the Portfolio underperformed its benchmark, the MSCI Worldex-U.S. Small Cap Index, for theone-, three-, and five-year periods ended September 30, 2018.
The Board also considered that the Portfolio’s actual management fees and total expenses (exclusive of12b-1 fees) were below the Expense Group median, Expense Universe median,Sub-advised Expense Universe median. The Board also noted that the Portfolio’s contractual management fees were below the asset-weighted average of comparable funds selected by Broadridge at the Portfolio’s current size. The Board also considered that the Portfolio’s contractualsub-advisory fees were above the averages of theSub-advised Expense Group and theSub-advised Expense Universe at the Portfolio’s current size.
BHFTII-58
Brighthouse Funds Trust II
Brighthouse/Wellington Balanced Portfolio
Managed by Wellington Management Company LLP
Portfolio Manager Commentary*
PERFORMANCE
For the 12 months ended December 31, 2018, the Class A, B, and E shares of the Brighthouse/Wellington Balanced Portfolio returned-3.76%,-4.01%, and-3.88%, respectively. The Portfolio’s benchmarks, the Standard & Poor’s (“S&P”) 500 Index1 and the Bloomberg Barclays U.S. Aggregate Bond Index2, returned-4.38% and 0.01%, respectively. The Blended Index3, a blend of the S&P 500 Index (60%) and the Bloomberg Barclays U.S. Aggregate Bond Index (40%) returned-2.35%.
MARKET ENVIRONMENT / CONDITIONS
U.S. equities posted negative results over the trailing twelve-month period ended December 31, 2018. The Federal Reserve (the “Fed”) raised its benchmark interest rate by 25 basis points four times during the year, in line with expectations and potentially signaling a more dovish path heading into 2019. Bullish sentiment was exceptionally strong to start the year, as better-than-expected corporate profits helped drive U.S. equities higher. Signs of inflation entered the market in February and led to heightened levels of volatility, a theme that continued for the remainder of the period. By the summer of 2018, talk of tariffs and trade wars had progressed to implementation and raised concerns in an otherwise strong economy. Nonetheless, positive sentiment persisted, fueled by robust earnings growth, fiscal stimulus, the announcement of a preliminary trade deal between the U.S. and Mexico, and expectations for stronger U.S. economic growth relative to other regions of the world. This changed in the final months of 2018, when concerns surrounding slowing global growth, rich valuations, rising central bank benchmark interest rates, and capricious U.S. and China trade tensions were at the forefront of investors’ minds. Equity returns in October and December were sharply negative, with the latter representing the largest U.S. equity market monthly decline seen this decade, culminating the first year of negative U.S. equity returns since 2008.
Returns varied by market capitalization. During the period,large-cap stocks, as measured by the S&P 500 Index, outperformedmid- andsmall-cap stocks, as measured by the S&P MidCap 400 Index and Russell 2000 Index.
Global fixed income markets were not immune to the downturn and generated negative total returns during the year, driven by higher U.S. and select emerging markets government bond yields and corporate spread widening. Sharp currency declines in Turkey and Argentina over the summer sparked emerging markets contagion fears before policymakers intervened with various stabilization measures. The U.S. dollar and other safe-haven currencies such as the Japanese yen rallied versus most currencies as elevated U.S.-China trade uncertainty and global equity market weakness led to safe-haven flows. The prospect of fewer Fed rate hikes in 2019 amid a deteriorating global economic outlook contributed to a decline in U.S. yields late in the period, but they still finished higher for the year.
Absolute returns were positive for most securitized sectors but negative for corporate sectors during the year. On an excess return basis, most major spread sectors posted negative returns over the period, with greater underperformance across lower-rated sectors.
PORTFOLIO REVIEW /PERIOD-END POSITIONING
The Portfolio underperformed its custom benchmark, consisting of 60% S&P 500 Index / 40% Bloomberg Barclays U.S. Aggregate Bond Index, for the period ended December 31, 2018.
The equity portion of the Portfolio underperformed its benchmark, the S&P 500 Index, for the twelve-month period ended December 31, 2018. Weak stock selection within the Health Care, Consumer Staples and Energy sectors detracted most from relative performance and was partially offset by stronger stock selection within the Communication Services, Industrials and Information Technology (“IT”) sectors.
Among the equity Portfolio’s largest individual relative detractors were positions innon-benchmark held British-American Tobacco (Consumer Staples), an overweight to Coty (Consumer Staples), and anout-of-benchmark position in Flex (IT).
The Portfolio’s top relative equity contributors over the period included overweight positions in Advanced Micro Devices (IT), Boston Scientific (Health Care), and NRG Energy (Utilities).
The fixed income portion of the Portfolio underperformed its benchmark, the Bloomberg Barclays U.S. Aggregate Bond Index, for the 2018 calendar year. Allocations to High Yield and Bank Loans detracted from relative performance over the period. The Portfolio implemented a short duration posture late in the period, which had a negative impact on relative results as rates fell amid a globalflight-to-quality during the fourth quarter. Additionally, the Portfolio was positioned for rising inflation expectations (i.e. long U.S. Treasury Inflation-Protected Securities (“TIPS”) vs. nominal Treasuries) which detracted as TIPS underperformed duration-equivalent nominal U.S. Treasuries during the period.
The Portfolio’s sector allocation contributed positively to relative performance. Allocations to structured finance sectors, including Commercial Mortgage-Backed Securities (“CMBS”),Non-Agency Residential Mortgage-Backed Securities (“RMBS”), and positioning within Agency Mortgage-Backed Securities (“MBS”) all contributed positively to returns. Investment Grade Credit positioning was within Industrials.
During the period, the fixed income portion of the Portfolio used Treasury futures, swaps, and options to manage duration and yield curve positioning. The Portfolio also used currency forwards, futures, and options to implementnon-U.S. rate and currency positions. Credit Default Swaps (“CDS”) were used to manage credit exposure and Investment Grade and High Yield CDS index positions were
BHFTII-1
Brighthouse Funds Trust II
Brighthouse/Wellington Balanced Portfolio
Managed by Wellington Management Company LLP
Portfolio Manager Commentary*—(Continued)
used as a source of liquidity and to manage overall portfolio risk. These positions performed as expected during the period. The High Yield sector underperformed many other fixed income sectors during the period. However, the Portfolio’s short positions implemented through credit derivatives were additive to relative performance while the Investment Grade CDS positions also had a small positive impact on relative performance.
As a reminder, the equity portion of the Portfolio was managed in an industry-neutral structure relative to the benchmark, which ensured stock selection was the primary driver of performance. On an absolute basis, the Portfolio ended the period with the most exposure to the IT, Health Care, and Financials sectors.
At period end, the Global Industry Analysts remained focused on fundamental stock research. In the IT sector, the team focused on companies exposed to 5G infrastructure as potential areas for growth and avoided the smartphone supply chain generally and the iPhone chain specifically and expressed their view through an underweight to Apple. Within the Consumer Discretionary and Consumer Staples sectors, our analysts evaluated and prepared for the impact of tariffs, which we believed could have wide-ranging impacts within the retail industry. The best ideas of our analysts resided in severalsub-industries, includingoff-price retailers (TJX Companies), strong global brands (Nike & Coca-Cola), and franchised restaurants (McDonald’s), which happen to be the more defensive areas of the universe and were a prudent place to invest given the challenges of predicting the probability of future tariffs (size and scope). Within Industrials, our analysts were focused on companies with low volatility, low beta, and minimal exposure to China and foreign exchange markets. High quality aerospace and defense companies Boeing and Lockheed Martin exemplified this approach and continued to be our largest active weights in the sector.
At the end of the year, the fixed income portion of the Portfolio had a short duration posture. The Portfolio remained positioned for an increase in inflation expectations as inflation expectations have declined meaningfully in the period and breakeven rates were attractive. The Portfolio was underweight Investment Grade Credit and favored Structured Finance, which included an overweight to CMBS and an allocation toNon-Agency MBS and Collateralized Loan Obligations. Further, the Portfolio was overweight to Agency MBS Pass-Throughs and continued to maintain allocations to Bank Loans,BB-rated High Yield, and emerging market debt.
At the end of the period, the Portfolio’s asset allocation breakdown was approximately a 61% allocation to equity and a 39% allocation to fixed income and remained unchanged from the beginning of the period.
Mary Pryshlak
Jonathan White
Mark Mandel
Joseph F. Marvan
Robert D. Burn
Campe Goodman
Portfolio Managers
Wellington Management Company LLP
* This commentary may include statements that constitute “forward-looking statements” under the U.S. securities laws. Forward-looking statements include, among other things, projections, estimates, and information about possible or future results related to the Portfolio, market or regulatory developments. The views expressed above are not guarantees of future performance or economic results and involve certain risks, uncertainties and assumptions that could cause actual outcomes and results to differ materially from the views expressed herein. The views expressed above are subject to change at any time based upon economic, market, or other conditions and the subadvisory firm undertakes no obligation to update the views expressed herein. Any discussions of specific securities should not be considered a recommendation to buy or sell those securities. The views expressed above (including any forward-looking statement) may not be relied upon as investment advice or as an indication of the Portfolio’s trading intent. Information about the Portfolio’s holdings, asset allocation or country diversification is historical and is not an indication of future Portfolio composition, which may vary. Direct investment in any index is not possible. The performance of any index mentioned in this commentary has not been adjusted for ongoing management, distribution and operating expenses, and sales charges applicable to mutual fund investments. In addition, the returns do not reflect additional fees charged by separate accounts or variable insurance contracts that an investor in the Portfolio may pay. If these additional fees were reflected, performance would have been lower.
BHFTII-2
Brighthouse Funds Trust II
Brighthouse/Wellington Balanced Portfolio
A $10,000 INVESTMENT COMPARED TO THE S&P 500 INDEX, THE BLOOMBERG BARCLAYS U.S. AGGREGATE BOND INDEX AND THE BLENDED INDEX
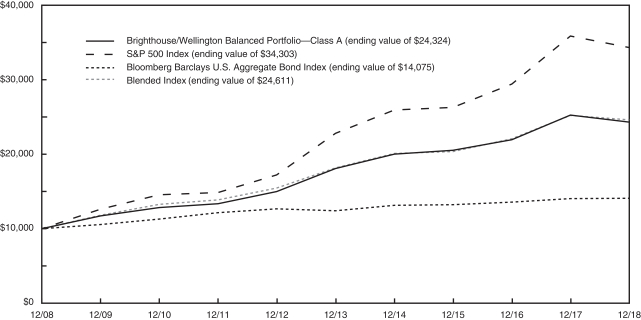
AVERAGE ANNUAL RETURNS (%) (FOR THE YEAR ENDED DECEMBER 31, 2018)
| | | | | | | | | | | | |
| | | | |
| | | 1 Year | | | 5 Year | | | 10 Year | |
| Brighthouse/Wellington Balanced Portfolio | | | | | | | | | | | | |
Class A | | | -3.76 | | | | 6.10 | | | | 9.30 | |
Class B | | | -4.01 | | | | 5.83 | | | | 9.02 | |
Class E | | | -3.88 | | | | 5.94 | | | | 9.13 | |
| S&P 500 Index | | | -4.38 | | | | 8.50 | | | | 13.12 | |
| Bloomberg Barclays U.S. Aggregate Bond Index | | | 0.01 | | | | 2.52 | | | | 3.48 | |
| Blended Index | | | -2.35 | | | | 6.24 | | | | 9.43 | |
1 The Standard & Poor’s (S&P) 500 Index is an unmanaged index consisting of 500 stocks chosen for market size, liquidity, and industry group representation. It is a market-weighted index (stock price times number of shares outstanding) with each stock’s weight in the Index proportionate to its market value.
2 The Bloomberg Barclays U.S. Aggregate Bond Index is a broad based benchmark that measures the investment grade, U.S. dollar-denominated, fixed-rate taxable bond market, including Treasuries, government-related and corporate securities, mortgage-backed securities, asset-backed securities, and commercial mortgage-backed securities.
3 The Blended Index is a composite index consisting of 60% S&P 500 Index and 40% Bloomberg Barclays U.S. Aggregate Bond Index.
Portfolio performance is calculated including reinvestment of all income and capital gain distributions. Performance numbers are net of all Portfolio expenses but do not include any insurance, sales, separate account or administrative charges of variable annuity or life insurance contracts or any additional expenses that participants may bear relating to the operations of their plans. If these charges were included, the returns would be lower. The performance of any index referenced above has not been adjusted for ongoing management, distribution and operating expenses, and sales charges applicable to mutual fund investments. Direct investment in any index is not possible. The performance of Class A shares, as set forth in the line graph above, will differ from that of other classes because of the difference in expenses paid by policyholders investing in the different share classes.
This information represents past performance and is not indicative of future results. Investment return and principal value may fluctuate so that shares, upon redemption, may be worth more or less than the original cost.
PORTFOLIO COMPOSITION AS OF DECEMBER 31, 2018
Top Equity Sectors
| | | | |
| | | % of
Net Assets | |
| Information Technology | | | 9.9 | |
| Health Care | | | 8.8 | |
| Financials | | | 7.0 | |
| Consumer Discretionary | | | 6.6 | |
| Industrials | | | 5.9 | |
Top Fixed Income Sectors
| | | | |
| | | % of
Net Assets | |
| U.S. Treasury & Government Agencies | | | 26.3 | |
| Corporate Bonds & Notes | | | 12.0 | |
| Asset-Backed Securities | | | 8.7 | |
| Mortgage-Backed Securities | | | 4.6 | |
| Floating Rate Loans | | | 0.9 | |
Top Equity Holdings
| | | | |
| | | % of
Net Assets | |
| Amazon.com, Inc. | | | 2.3 | |
| Microsoft Corp. | | | 2.0 | |
| Alphabet, Inc. | | | 1.8 | |
| Bank of America Corp. | | | 1.7 | |
| UnitedHealth Group, Inc. | | | 1.4 | |
Top Fixed Income Issuers
| | | | |
| | | % of
Net Assets | |
| Fannie Mae 30 Yr. Pool | | | 11.8 | |
| Ginnie Mae II 30 Yr. Pool | | | 3.1 | |
| Freddie Mac 30 Yr. Gold Pool | | | 2.6 | |
| U.S. Treasury Bonds | | | 1.6 | |
| Fannie Mae 15 Yr. Pool | | | 1.2 | |
BHFTII-3
Brighthouse Funds Trust II
Brighthouse/Wellington Balanced Portfolio
Understanding Your Portfolio’s Expenses
Shareholder Expense Example
As a shareholder of the Portfolio, you incur ongoing costs, including management fees; distribution and service(12b-1) fees; and other Portfolio expenses. This example is intended to help you understand your ongoing costs (in dollars) (referred to as “expenses”) of investing in the Portfolio and compare these costs with the ongoing costs of investing in other mutual funds. The example is based on an investment of $1,000 invested at the beginning of the period and held for the entire period, July 1, 2018 through December 31, 2018.
Actual Expenses
The first line for each share class of the Portfolio in the table below provides information about actual account values and actual expenses. You may use the information in this line, together with the amount you invested in the particular share class of the Portfolio, to estimate the expenses that you paid over the period. Simply divide your account value by $1,000 (for example, an $8,600 account value divided by $1,000 = 8.6), then multiply the result by the number in the first line under the heading entitled “Expenses Paid During Period” to estimate the expenses you paid on your account during this period.
Hypothetical Example for Comparison Purposes
The second line for each share class of the Portfolio in the table below provides information about hypothetical account values and hypothetical expenses based on the Portfolio’s actual expense ratio and an assumed rate of return of 5% per year before expenses, which is not the Portfolio’s actual return. The hypothetical account values and expenses may not be used to estimate the actual ending account balance or expenses you paid for the period. You may use this information to compare the ongoing costs of investing in the Portfolio and other funds. To do so, compare this 5% hypothetical example with the 5% hypothetical examples that appear in the shareholder reports of the other funds.
Please note that the expenses shown in the table are meant to highlight your ongoing costs only and do not reflect any fees or charges of your variable insurance product or any additional expenses that participants in certain eligible qualified plans may bear relating to the operations of their plan. Therefore, the second line for each share class in the table is useful in comparing ongoing costs only, and will not help you determine the relative total costs of owning different funds. In addition, if these other costs were included, your costs would have been higher.
| | | | | | | | | | | | | | | | | | |
Brighthouse/Wellington Balanced Portfolio
| | | | Annualized
Expense
Ratio | | | Beginning
Account Value
July 1,
2018 | | | Ending
Account Value
December 31,
2018 | | | Expenses Paid
During Period**
July 1, 2018
to
December 31,
2018 | |
Class A (a) | | Actual | | | 0.50 | % | | $ | 1,000.00 | | | $ | 948.40 | | | $ | 2.46 | |
| | Hypothetical* | | | 0.50 | % | | $ | 1,000.00 | | | $ | 1,022.69 | | | $ | 2.55 | |
| | | | | |
Class B (a) | | Actual | | | 0.75 | % | | $ | 1,000.00 | | | $ | 947.00 | | | $ | 3.68 | |
| | Hypothetical* | | | 0.75 | % | | $ | 1,000.00 | | | $ | 1,021.43 | | | $ | 3.82 | |
| | | | | |
Class E (a) | | Actual | | | 0.65 | % | | $ | 1,000.00 | | | $ | 947.70 | | | $ | 3.19 | |
| | Hypothetical* | | | 0.65 | % | | $ | 1,000.00 | | | $ | 1,021.93 | | | $ | 3.31 | |
| * | Hypothetical assumes a rate of return of 5% per year before expenses. |
| ** | Expenses paid are equal to the Portfolio’s annualized expense ratio for the most recent six month period, as shown above, multiplied by the average account value over the period, multiplied by the number of days (184 days) in the most recent fiscal half-year, divided by 365 (to reflect theone-half year period). |
| (a) | The annualized expense ratio shown reflects the impact of the management fee waiver as described in Note 6 of the Notes to Financial Statements. |
BHFTII-4
Brighthouse Funds Trust II
Brighthouse/Wellington Balanced Portfolio
Schedule of Investments as of December 31, 2018
Common Stocks—57.8% of Net Assets
| | | | | | | | |
| Security Description | | Shares | | | Value | |
|
| Aerospace & Defense—2.3% | |
Boeing Co. (The) | | | 32,164 | | | $ | 10,372,890 | |
General Dynamics Corp. | | | 26,735 | | | | 4,203,009 | |
Harris Corp. | | | 26,458 | | | | 3,562,570 | |
Lockheed Martin Corp. | | | 25,067 | | | | 6,563,543 | |
Moog, Inc. - Class A | | | 22,396 | | | | 1,735,242 | |
| | | | | | | | |
| | | | | | | 26,437,254 | |
| | | | | | | | |
|
| Air Freight & Logistics—0.0% | |
FedEx Corp. | | | 2,375 | | | | 383,159 | |
| | | | | | | | |
|
| Airlines—0.2% | |
JetBlue Airways Corp. (a) | | | 127,281 | | | | 2,044,133 | |
| | | | | | | | |
|
| Banks—2.0% | |
Bank of America Corp. | | | 762,489 | | | | 18,787,729 | |
SVB Financial Group (a) | | | 8,937 | | | | 1,697,315 | |
Zions Bancorp N.A. | | | 46,117 | | | | 1,878,807 | |
| | | | | | | | |
| | | | | | | 22,363,851 | |
| | | | | | | | |
|
| Beverages—1.2% | |
Coca-Cola Co. (The) | | | 224,641 | | | | 10,636,751 | |
Monster Beverage Corp. (a) | | | 58,352 | | | | 2,872,086 | |
| | | | | | | | |
| | | | | | | 13,508,837 | |
| | | | | | | | |
|
| Biotechnology—0.9% | |
Aduro Biotech, Inc. (a) | | | 26,606 | | | | 70,240 | |
Alnylam Pharmaceuticals, Inc. (a) (b) | | | 3,611 | | | | 263,278 | |
Aptinyx, Inc. (a) | | | 7,196 | | | | 119,022 | |
Arcus Biosciences, Inc. (a) | | | 11,888 | | | | 128,034 | |
Audentes Therapeutics, Inc. (a) | | | 9,048 | | | | 192,903 | |
Biogen, Inc. (a) | | | 2,841 | | | | 854,914 | |
Biohaven Pharmaceutical Holding Co., Ltd. (a) | | | 29,543 | | | | 1,092,500 | |
Bluebird Bio, Inc. (a) (b) | | | 6,215 | | | | 616,528 | |
Calithera Biosciences, Inc. (a) | | | 14,741 | | | | 59,111 | |
Celgene Corp. (a) | | | 2,831 | | | | 181,439 | |
Coherus Biosciences, Inc. (a) (b) | | | 38,405 | | | | 347,565 | |
CytomX Therapeutics, Inc. (a) | | | 12,500 | | | | 188,750 | |
Forty Seven, Inc. (a) (b) | | | 25,145 | | | | 395,279 | |
G1 Therapeutics, Inc. (a) | | | 9,009 | | | | 172,522 | |
Global Blood Therapeutics, Inc. (a) (b) | | | 9,639 | | | | 395,681 | |
GlycoMimetics, Inc. (a) (b) | | | 40,306 | | | | 381,698 | |
Heron Therapeutics, Inc. (a) (b) | | | 7,966 | | | | 206,638 | |
Incyte Corp. (a) | | | 6,954 | | | | 442,205 | |
Ironwood Pharmaceuticals, Inc. (a) | | | 35,699 | | | | 369,842 | |
Jounce Therapeutics, Inc. (a) | | | 8,043 | | | | 27,105 | |
Karyopharm Therapeutics, Inc. (a) (b) | | | 29,147 | | | | 273,107 | |
Loxo Oncology, Inc. (a) | | | 5,079 | | | | 711,416 | |
Momenta Pharmaceuticals, Inc. (a) | | | 17,000 | | | | 187,680 | |
Neon Therapeutics, Inc. (a) (b) | | | 6,879 | | | | 34,601 | |
Ra Pharmaceuticals, Inc. (a) | | | 20,912 | | | | 380,598 | |
Radius Health, Inc. (a) (b) | | | 12,031 | | | | 198,391 | |
Regeneron Pharmaceuticals, Inc. (a) | | | 893 | | | | 333,536 | |
Rigel Pharmaceuticals, Inc. (a) | | | 41,463 | | | | 95,365 | |
Seattle Genetics, Inc. (a) | | | 16,178 | | | | 916,646 | |
Spark Therapeutics, Inc. (a) (b) | | | 4,000 | | | | 156,560 | |
|
| Biotechnology—(Continued) | |
Syndax Pharmaceuticals, Inc. (a) (b) | | | 26,685 | | | | 118,748 | |
TESARO, Inc. (a) (b) | | | 3,793 | | | | 281,630 | |
Trevena, Inc. (a) (b) | | | 63,243 | | | | 27,195 | |
| | | | | | | | |
| | | | | | | 10,220,727 | |
| | | | | | | | |
|
| Capital Markets—1.7% | |
Blucora, Inc. (a) | | | 112,761 | | | | 3,003,953 | |
FactSet Research Systems, Inc. | | | 16,504 | | | | 3,302,946 | |
Hamilton Lane, Inc. - Class A | | | 45,374 | | | | 1,678,838 | |
Northern Trust Corp. | | | 27,717 | | | | 2,316,864 | |
Raymond James Financial, Inc. | | | 26,501 | | | | 1,971,939 | |
TD Ameritrade Holding Corp. | | | 137,420 | | | | 6,728,083 | |
| | | | | | | | |
| | | | | | | 19,002,623 | |
| | | | | | | | |
|
| Chemicals—1.2% | |
Cabot Corp. | | | 37,575 | | | | 1,613,470 | |
Celanese Corp. | | | 19,278 | | | | 1,734,442 | |
DowDuPont, Inc. | | | 49,128 | | | | 2,627,365 | |
FMC Corp. (b) | | | 24,222 | | | | 1,791,459 | |
Linde plc | | | 17,692 | | | | 2,760,660 | |
PPG Industries, Inc. | | | 33,903 | | | | 3,465,904 | |
| | | | | | | | |
| | | | | | | 13,993,300 | |
| | | | | | | | |
|
| Commercial Services & Supplies—0.4% | |
Waste Management, Inc. | | | 51,813 | | | | 4,610,839 | |
| | | | | | | | |
|
| Construction & Engineering—0.1% | |
Granite Construction, Inc. (b) | | | 16,259 | | | | 654,912 | |
| | | | | | | | |
|
| Construction Materials—0.1% | |
Martin Marietta Materials, Inc. (b) | | | 828 | | | | 142,309 | |
Vulcan Materials Co. | | | 5,584 | | | | 551,699 | |
| | | | | | | | |
| | | | | | | 694,008 | |
| | | | | | | | |
|
| Consumer Finance—0.5% | |
American Express Co. | | | 38,986 | | | | 3,716,145 | |
OneMain Holdings, Inc. (a) | | | 70,300 | | | | 1,707,587 | |
| | | | | | | | |
| | | | | | | 5,423,732 | |
| | | | | | | | |
|
| Containers & Packaging—0.6% | |
Ardagh Group S.A. | | | 46,000 | | | | 509,680 | |
Ball Corp. | | | 83,602 | | | | 3,844,020 | |
International Paper Co. | | | 52,334 | | | | 2,112,200 | |
| | | | | | | | |
| | | | | | | 6,465,900 | |
| | | | | | | | |
|
| Diversified Consumer Services—0.0% | |
Houghton Mifflin Harcourt Co. (a) | | | 46,900 | | | | 415,534 | |
| | | | | | | | |
|
| Diversified Financial Services—0.4% | |
AXA Equitable Holdings, Inc. | | | 95,700 | | | | 1,591,491 | |
Voya Financial, Inc. | | | 65,214 | | | | 2,617,690 | |
| | | | | | | | |
| | | | | | | 4,209,181 | |
| | | | | | | | |
See accompanying notes to financial statements.
BHFTII-5
Brighthouse Funds Trust II
Brighthouse/Wellington Balanced Portfolio
Schedule of Investments as of December 31, 2018
Common Stocks—(Continued)
| | | | | | | | |
| Security Description | | Shares | | | Value | |
|
| Diversified Telecommunication Services—1.2% | |
Verizon Communications, Inc. | | | 234,446 | | | $ | 13,180,554 | |
| | | | | | | | |
|
| Electric Utilities—1.5% | |
Avangrid, Inc. (b) | | | 56,587 | | | | 2,834,443 | |
Edison International | | | 70,339 | | | | 3,993,145 | |
Exelon Corp. | | | 93,499 | | | | 4,216,805 | |
NextEra Energy, Inc. | | | 31,514 | | | | 5,477,763 | |
PG&E Corp. (a) | | | 14,854 | | | | 352,783 | |
| | | | | | | | |
| | | | | | | 16,874,939 | |
| | | | | | | | |
|
| Electrical Equipment—0.3% | |
AMETEK, Inc. | | | 20,710 | | | | 1,402,067 | |
Eaton Corp. plc | | | 29,596 | | | | 2,032,061 | |
| | | | | | | | |
| | | | | | | 3,434,128 | |
| | | | | | | | |
|
| Electronic Equipment, Instruments & Components—0.2% | |
Flex, Ltd. (a) | | | 374,866 | | | | 2,852,730 | |
| | | | | | | | |
|
| Energy Equipment & Services—0.4% | |
Baker Hughes a GE Co. | | | 89,106 | | | | 1,915,779 | |
Halliburton Co. | | | 84,964 | | | | 2,258,343 | |
| | | | | | | | |
| | | | | | | 4,174,122 | |
| | | | | | | | |
|
| Entertainment—0.7% | |
Cinemark Holdings, Inc. (b) | | | 21,080 | | | | 754,664 | |
Liberty Media Corp.-Liberty Formula One - Class C (a) | | | 42,980 | | | | 1,319,486 | |
Netflix, Inc. (a) (b) | | | 7,174 | | | | 1,920,193 | |
Spotify Technology S.A. (a) | | | 4,603 | | | | 522,441 | |
Twenty-First Century Fox, Inc. - Class A | | | 19,178 | | | | 922,845 | |
Viacom, Inc. - Class B | | | 40,160 | | | | 1,032,112 | |
Walt Disney Co. (The) (b) | | | 12,591 | | | | 1,380,603 | |
| | | | | | | | |
| | | | | | | 7,852,344 | |
| | | | | | | | |
|
| Equity Real Estate Investment Trusts—1.9% | |
Alexandria Real Estate Equities, Inc. | | | 22,007 | | | | 2,536,087 | |
American Tower Corp. | | | 57,910 | | | | 9,160,783 | |
Camden Property Trust | | | 32,997 | | | | 2,905,386 | |
Equinix, Inc. | | | 6,643 | | | | 2,342,056 | |
Public Storage | | | 9,163 | | | | 1,854,683 | |
Simon Property Group, Inc. | | | 18,152 | | | | 3,049,354 | |
| | | | | | | | |
| | | | | | | 21,848,349 | |
| | | | | | | | |
|
| Food & Staples Retailing—0.3% | |
Performance Food Group Co. (a) | | | 31,066 | | | | 1,002,500 | |
U.S. Foods Holding Corp. (a) | | | 66,831 | | | | 2,114,533 | |
| | | | | | | | |
| | | | | | | 3,117,033 | |
| | | | | | | | |
|
| Food Products—1.1% | |
Archer-Daniels-Midland Co. | | | 41,290 | | | | 1,691,651 | |
Freshpet, Inc. (a) | | | 31,918 | | | | 1,026,483 | |
Hormel Foods Corp. | | | 28,216 | | | | 1,204,259 | |
Hostess Brands, Inc. (a) | | | 145,846 | | | | 1,595,555 | |
McCormick & Co., Inc. | | | 15,658 | | | | 2,180,220 | |
|
| Food Products—(Continued) | |
Post Holdings, Inc. (a) (b) | | | 56,464 | | | | 5,032,636 | |
| | | | | | | | |
| | | | | | | 12,730,804 | |
| | | | | | | | |
|
| Health Care Equipment & Supplies—2.7% | |
Abbott Laboratories | | | 85,821 | | | | 6,207,433 | |
Baxter International, Inc. | | | 41,477 | | | | 2,730,016 | |
Boston Scientific Corp. (a) | | | 227,042 | | | | 8,023,664 | |
Danaher Corp. | | | 41,869 | | | | 4,317,531 | |
Medtronic plc | | | 105,554 | | | | 9,601,192 | |
| | | | | | | | |
| | | | | | | 30,879,836 | |
| | | | | | | | |
|
| Health Care Providers & Services—1.7% | |
HCA Healthcare, Inc. | | | 27,470 | | | | 3,418,642 | |
UnitedHealth Group, Inc. | | | 64,911 | | | | 16,170,628 | |
| | | | | | | | |
| | | | | | | 19,589,270 | |
| | | | | | | | |
|
| Hotels, Restaurants & Leisure—1.1% | |
Aramark | | | 22,270 | | | | 645,162 | |
Hyatt Hotels Corp. - Class A | | | 43,998 | | | | 2,974,265 | |
McDonald’s Corp. | | | 44,739 | | | | 7,944,304 | |
MGM Resorts International | | | 45,959 | | | | 1,114,965 | |
| | | | | | | | |
| | | | | | | 12,678,696 | |
| | | | | | | | |
|
| Household Durables—0.2% | |
Installed Building Products, Inc. (a) | | | 43,936 | | | | 1,480,204 | |
iRobot Corp. (a) (b) | | | 10,816 | | | | 905,732 | |
| | | | | | | | |
| | | | | | | 2,385,936 | |
| | | | | | | | |
|
| Independent Power and Renewable Electricity Producers—0.4% | |
NRG Energy, Inc. | | | 111,012 | | | | 4,396,075 | |
| | | | | | | | |
|
| Industrial Conglomerates—0.5% | |
3M Co. | | | 18,091 | | | | 3,447,059 | |
General Electric Co. | | | 264,913 | | | | 2,005,392 | |
| | | | | | | | |
| | | | | | | 5,452,451 | |
| | | | | | | | |
|
| Insurance—2.4% | |
Allstate Corp. (The) | | | 9,894 | | | | 817,541 | |
American International Group, Inc. | | | 115,794 | | | | 4,563,441 | |
Assurant, Inc. | | | 29,741 | | | | 2,660,035 | |
Assured Guaranty, Ltd. | | | 109,945 | | | | 4,208,695 | |
Athene Holding, Ltd. - Class A (a) | | | 78,713 | | | | 3,135,139 | |
Hartford Financial Services Group, Inc. (The) | | | 80,726 | | | | 3,588,271 | |
Marsh & McLennan Cos., Inc. | | | 61,352 | | | | 4,892,822 | |
Prudential Financial, Inc. | | | 33,080 | | | | 2,697,674 | |
Trupanion, Inc. (a) (b) | | | 46,748 | | | | 1,190,204 | |
| | | | | | | | |
| | | | | | | 27,753,822 | |
| | | | | | | | |
|
| Interactive Media & Services—2.6% | |
Alphabet, Inc. - Class A (a) | | | 19,920 | | | | 20,815,603 | |
Facebook, Inc. - Class A (a) | | | 65,688 | | | | 8,611,040 | |
| | | | | | | | |
| | | | | | | 29,426,643 | |
| | | | | | | | |
See accompanying notes to financial statements.
BHFTII-6
Brighthouse Funds Trust II
Brighthouse/Wellington Balanced Portfolio
Schedule of Investments as of December 31, 2018
Common Stocks—(Continued)
| | | | | | | | |
| Security Description | | Shares | | | Value | |
|
| Internet & Direct Marketing Retail—3.3% | |
Amazon.com, Inc. (a) | | | 17,685 | | | $ | 26,562,340 | |
Booking Holdings, Inc. (a) | | | 1,890 | | | | 3,255,374 | |
Etsy, Inc. (a) (b) | | | 7,892 | | | | 375,422 | |
Expedia Group, Inc. | | | 39,396 | | | | 4,437,959 | |
Wayfair, Inc. - Class A (a) | | | 35,902 | | | | 3,234,052 | |
| | | | | | | | |
| | | | | | | 37,865,147 | |
| | | | | | | | |
|
| IT Services—2.7% | |
FleetCor Technologies, Inc. (a) | | | 16,202 | | | | 3,009,035 | |
Genpact, Ltd. | | | 62,449 | | | | 1,685,499 | |
Global Payments, Inc. | | | 43,731 | | | | 4,509,978 | |
GoDaddy, Inc. - Class A (a) | | | 57,489 | | | | 3,772,428 | |
PayPal Holdings, Inc. (a) | | | 46,404 | | | | 3,902,112 | |
Total System Services, Inc. | | | 11,643 | | | | 946,460 | |
VeriSign, Inc. (a) | | | 20,842 | | | | 3,090,660 | |
Visa, Inc. - Class A | | | 65,437 | | | | 8,633,758 | |
WEX, Inc. (a) | | | 11,099 | | | | 1,554,526 | |
| | | | | | | | |
| | | | | | | 31,104,456 | |
| | | | | | | | |
|
| Life Sciences Tools & Services—0.6% | |
Thermo Fisher Scientific, Inc. | | | 30,093 | | | | 6,734,512 | |
| | | | | | | | |
|
| Machinery—0.9% | |
AGCO Corp. | | | 6,104 | | | | 339,810 | |
Caterpillar, Inc. | | | 17,015 | | | | 2,162,096 | |
Deere & Co. | | | 14,708 | | | | 2,193,992 | |
Fortive Corp. | | | 25,572 | | | | 1,730,202 | |
Greenbrier Cos., Inc. (The) | | | 19,126 | | | | 756,242 | |
Illinois Tool Works, Inc. (b) | | | 14,493 | | | | 1,836,118 | |
Pentair plc | | | 33,571 | | | | 1,268,312 | |
| | | | | | | | |
| | | | | | | 10,286,772 | |
| | | | | | | | |
|
| Marine—0.1% | |
Kirby Corp. (a) (b) | | | 13,035 | | | | 878,038 | |
| | | | | | | | |
|
| Media—1.4% | |
Charter Communications, Inc. - Class A (a) | | | 14,635 | | | | 4,170,536 | |
Comcast Corp. - Class A | | | 305,138 | | | | 10,389,949 | |
Interpublic Group of Cos., Inc. (The) | | | 55,723 | | | | 1,149,565 | |
New York Times Co. (The) - Class A | | | 25,771 | | | | 574,436 | |
| | | | | | | | |
| | | | | | | 16,284,486 | |
| | | | | | | | |
|
| Metals & Mining—0.1% | |
Alcoa Corp. (a) | | | 18,634 | | | | 495,292 | |
Carpenter Technology Corp. | | | 4,796 | | | | 170,785 | |
Freeport-McMoRan, Inc. | | | 22,659 | | | | 233,614 | |
Southern Copper Corp. | | | 5,391 | | | | 165,881 | |
Steel Dynamics, Inc. | | | 14,222 | | | | 427,229 | |
| | | | | | | | |
| | | | | | | 1,492,801 | |
| | | | | | | | |
|
| Multi-Utilities—0.5% | |
Sempra Energy (b) | | | 53,552 | | | | 5,793,791 | |
| | | | | | | | |
|
| Oil, Gas & Consumable Fuels—2.8% | |
Chevron Corp. | | | 49,852 | | | | 5,423,399 | |
Concho Resources, Inc. (a) | | | 13,966 | | | | 1,435,565 | |
Diamondback Energy, Inc. | | | 8,541 | | | | 791,751 | |
Encana Corp. | | | 202,346 | | | | 1,169,560 | |
Exxon Mobil Corp. | | | 189,255 | | | | 12,905,299 | |
Kosmos Energy, Ltd. (a) | | | 128,705 | | | | 523,829 | |
Marathon Petroleum Corp. | | | 61,830 | | | | 3,648,588 | |
Noble Energy, Inc. (b) | | | 30,838 | | | | 578,521 | |
ONEOK, Inc. | | | 26,518 | | | | 1,430,646 | |
Paragon Offshore Finance Co. - Class A (a) (c) | | | 162 | | | | 172 | |
Paragon Offshore Finance Co. - Class B (a) (c) | | | 81 | | | | 2,835 | |
Templar Energy LLC (a) (c) (d) (e) | | | 2,426 | | | | 0 | |
TransCanada Corp. (b) | | | 100,636 | | | | 3,592,705 | |
| | | | | | | | |
| | | | | | | 31,502,870 | |
| | | | | | | | |
|
| Personal Products—0.5% | |
Coty, Inc. - Class A (a) (b) | | | 221,310 | | | | 1,451,794 | |
Unilever NV | | | 69,005 | | | | 3,712,469 | |
| | | | | | | | |
| | | | | | | 5,164,263 | |
| | | | | | | | |
|
| Pharmaceuticals—2.8% | |
Aerie Pharmaceuticals, Inc. (a) | | | 13,052 | | | | 471,177 | |
Allergan plc | | | 51,040 | | | | 6,822,007 | |
Amneal Pharmaceuticals, Inc. (a) (b) | | | 66,842 | | | | 904,372 | |
Assembly Biosciences, Inc. (a) | | | 7,799 | | | | 176,413 | |
AstraZeneca plc (ADR) (b) | | | 152,132 | | | | 5,777,973 | |
Bristol-Myers Squibb Co. | | | 158,844 | | | | 8,256,711 | |
Clearside Biomedical, Inc. (a) (b) | | | 10,600 | | | | 11,342 | |
Dermira, Inc. (a) | | | 60,417 | | | | 434,398 | |
Elanco Animal Health, Inc. (a) (b) | | | 14,500 | | | | 457,185 | |
Kala Pharmaceuticals, Inc. (a) | | | 17,700 | | | | 86,553 | |
Medicines Co. (The) (a) (b) | | | 6,600 | | | | 126,324 | |
Mylan NV (a) | | | 105,149 | | | | 2,881,083 | |
MyoKardia, Inc. (a) | | | 13,634 | | | | 666,157 | |
Nektar Therapeutics (a) | | | 32,680 | | | | 1,074,192 | |
Otonomy, Inc. (a) | | | 28,096 | | | | 51,978 | |
Revance Therapeutics, Inc. (a) (b) | | | 20,027 | | | | 403,144 | |
Teva Pharmaceutical Industries, Ltd. (ADR) | | | 189,403 | | | | 2,920,594 | |
Tricida, Inc. (a) | | | 16,500 | | | | 389,070 | |
| | | | | | | | |
| | | | | | | 31,910,673 | |
| | | | | | | | |
|
| Professional Services—0.6% | |
Equifax, Inc. | | | 9,139 | | | | 851,115 | |
IHS Markit, Ltd. (a) | | | 72,509 | | | | 3,478,257 | |
TransUnion | | | 19,163 | | | | 1,088,458 | |
TriNet Group, Inc. (a) | | | 30,226 | | | | 1,267,981 | |
| | | | | | | | |
| | | | | | | 6,685,811 | |
| | | | | | | | |
|
| Road & Rail—0.4% | |
Norfolk Southern Corp. | | | 17,636 | | | | 2,637,287 | |
Union Pacific Corp. | | | 16,650 | | | | 2,301,530 | |
| | | | | | | | |
| | | | | | | 4,938,817 | |
| | | | | | | | |
|
| Semiconductors & Semiconductor Equipment—1.8% | |
Advanced Micro Devices, Inc. (a) | | | 156,796 | | | | 2,894,454 | |
Broadcom, Inc. | | | 2,657 | | | | 675,622 | |
Intel Corp. | | | 96,680 | | | | 4,537,192 | |
See accompanying notes to financial statements.
BHFTII-7
Brighthouse Funds Trust II
Brighthouse/Wellington Balanced Portfolio
Schedule of Investments as of December 31, 2018
Common Stocks—(Continued)
| | | | | | | | |
| Security Description | | Shares | | | Value | |
|
| Semiconductors & Semiconductor Equipment—(Continued) | |
KLA-Tencor Corp. | | | 12,751 | | | $ | 1,141,087 | |
Marvell Technology Group, Ltd. | | | 55,762 | | | | 902,787 | |
Micron Technology, Inc. (a) | | | 60,170 | | | | 1,909,194 | |
NVIDIA Corp. | | | 9,832 | | | | 1,312,572 | |
Teradyne, Inc. | | | 61,654 | | | | 1,934,703 | |
Texas Instruments, Inc. | | | 37,033 | | | | 3,499,618 | |
Xilinx, Inc. | | | 23,558 | | | | 2,006,435 | |
| | | | | | | | |
| | | | | | | 20,813,664 | |
| | | | | | | | |
|
| Software—3.8% | |
Adobe, Inc. (a) | | | 9,329 | | | | 2,110,593 | |
Atlassian Corp. plc - Class A (a) | | | 2,044 | | | | 181,875 | |
Autodesk, Inc. (a) | | | 7,506 | | | | 965,347 | |
Ceridian HCM Holding, Inc. (a) (b) | | | 12,604 | | | | 434,712 | |
Guidewire Software, Inc. (a) (b) | | | 13,976 | | | | 1,121,294 | |
Microsoft Corp. | | | 228,922 | | | | 23,251,608 | |
PTC, Inc. (a) (b) | | | 7,544 | | | | 625,398 | |
Salesforce.com, Inc. (a) (b) | | | 32,560 | | | | 4,459,743 | |
ServiceNow, Inc. (a) | | | 6,344 | | | | 1,129,549 | |
Splunk, Inc. (a) | | | 5,893 | | | | 617,881 | |
SS&C Technologies Holdings, Inc. | | | 130,541 | | | | 5,888,704 | |
Workday, Inc. - Class A (a) | | | 13,467 | | | | 2,150,411 | |
| | | | | | | | |
| | | | | | | 42,937,115 | |
| | | | | | | | |
|
| Specialty Retail—1.2% | |
Lowe’s Cos., Inc. | | | 43,185 | | | | 3,988,567 | |
National Vision Holdings, Inc. (a) | | | 111,077 | | | | 3,129,039 | |
Ross Stores, Inc. | | | 15,986 | | | | 1,330,035 | |
TJX Cos., Inc. (The) | | | 107,258 | | | | 4,798,723 | |
| | | | | | | | |
| | | | | | | 13,246,364 | |
| | | | | | | | |
|
| Technology Hardware, Storage & Peripherals—1.3% | |
Apple, Inc. | | | 90,706 | | | | 14,307,964 | |
| | | | | | | | |
|
| Textiles, Apparel & Luxury Goods—0.8% | |
NIKE, Inc. - Class B | | | 59,630 | | | | 4,420,968 | |
Tapestry, Inc. | | | 41,742 | | | | 1,408,793 | |
Under Armour, Inc. - Class A (a) (b) | | | 78,779 | | | | 1,392,025 | |
Under Armour, Inc. - Class C (a) | | | 101,461 | | | | 1,640,624 | |
| | | | | | | | |
| | | | | | | 8,862,410 | |
| | | | | | | | |
|
| Thrifts & Mortgage Finance—0.1% | |
MGIC Investment Corp. (a) | | | 114,804 | | | | 1,200,850 | |
| | | | | | | | |
|
| Tobacco—1.2% | |
Altria Group, Inc. | | | 154,773 | | | | 7,644,239 | |
British American Tobacco plc (ADR) | | | 188,877 | | | | 6,017,621 | |
| | | | | | | | |
| | | | | | | 13,661,860 | |
| | | | | | | | |
|
| Trading Companies & Distributors—0.1% | |
Air Lease Corp. | | | 14,100 | | | | 425,961 | |
Triton International, Ltd. (b) | | | 36,323 | | | | 1,128,556 | |
| | | | | | | | |
| | | | | | | 1,554,517 | |
| | | | | | | | |
Total Common Stocks
(Cost $646,587,790) | | | | | | | 656,282,903 | |
| | | | | | | | |
| U.S. Treasury & Government Agencies—26.3% | |
| Security Description | | Principal
Amount* | | | Value | |
|
| Agency Sponsored Mortgage - Backed—23.6% | |
Fannie Mae 15 Yr. Pool
3.000%, 07/01/28 | | | 1,420,700 | | | | 1,422,108 | |
3.000%, 02/01/31 | | | 178,351 | | | | 178,089 | |
3.500%, 07/01/28 | | | 212,906 | | | | 215,971 | |
3.500%, TBA (f) | | | 9,515,000 | | | | 9,631,059 | |
4.000%, 04/01/26 | | | 35,879 | | | | 36,753 | |
4.000%, 02/01/29 | | | 846,889 | | | | 866,946 | |
4.500%, 06/01/24 | | | 183,996 | | | | 189,507 | |
4.500%, 02/01/25 | | | 43,304 | | | | 44,519 | |
4.500%, 04/01/25 | | | 7,212 | | | | 7,424 | |
4.500%, 07/01/25 | | | 36,621 | | | | 37,662 | |
4.500%, 06/01/26 | | | 789,522 | | | | 812,679 | |
5.000%, TBA (f) | | | 500,000 | | | | 507,897 | |
Fannie Mae 20 Yr. Pool
3.000%, 03/01/37 | | | 857,906 | | | | 849,618 | |
Fannie Mae 30 Yr. Pool
3.000%, 02/01/43 | | | 720,431 | | | | 709,434 | |
3.000%, 03/01/43 | | | 935,119 | | | | 920,384 | |
3.000%, 04/01/43 | | | 859,575 | | | | 845,952 | |
3.000%, 05/01/43 | | | 2,349,586 | | | | 2,312,813 | |
3.000%, 06/01/43 | | | 277,830 | | | | 273,372 | |
3.000%, 04/01/47 | | | 8,479,661 | | | | 8,279,297 | |
3.500%, 03/01/43 | | | 48,045 | | | | 48,435 | |
3.500%, 05/01/43 | | | 86,945 | | | | 87,476 | |
3.500%, 07/01/43 | | | 216,592 | | | | 218,221 | |
3.500%, 08/01/43 | | | 408,186 | | | | 411,279 | |
3.500%, 10/01/44 | | | 373,963 | | | | 375,840 | |
3.500%, 02/01/45 | | | 457,798 | | | | 459,672 | |
3.500%, 09/01/46 | | | 872,762 | | | | 875,298 | |
3.500%, 10/01/46 | | | 382,245 | | | | 383,356 | |
3.500%, 11/01/46 | | | 254,729 | | | | 255,666 | |
3.500%, 09/01/47 | | | 346,658 | | | | 346,961 | |
3.500%, 12/01/47 | | | 190,121 | | | | 190,306 | |
3.500%, 01/01/48 | | | 1,338,993 | | | | 1,339,438 | |
3.500%, 02/01/48 | | | 281,101 | | | | 281,705 | |
3.500%, TBA (f) | | | 50,462,000 | | | | 50,469,010 | |
4.000%, 10/01/40 | | | 785,485 | | | | 807,894 | |
4.000%, 11/01/40 | | | 363,179 | | | | 373,559 | |
4.000%, 12/01/40 | | | 259,244 | | | | 266,653 | |
4.000%, 02/01/41 | | | 125,126 | | | | 128,781 | |
4.000%, 03/01/41 | | | 293,753 | | | | 302,151 | |
4.000%, 08/01/42 | | | 162,399 | | | | 167,041 | |
4.000%, 09/01/42 | | | 253,153 | | | | 260,388 | |
4.000%, 03/01/45 | | | 44,465 | | | | 45,417 | |
4.000%, 07/01/45 | | | 229,392 | | | | 235,683 | |
4.000%, 05/01/46 | | | 127,054 | | | | 129,650 | |
4.000%, 06/01/46 | | | 302,880 | | | | 309,117 | |
4.000%, 04/01/47 | | | 318,063 | | | | 326,261 | |
4.000%, 09/01/48 | | | 977,695 | | | | 997,172 | |
4.000%, TBA (f) | | | 45,160,000 | | | | 46,050,014 | |
4.500%, 10/01/40 | | | 712,390 | | | | 746,534 | |
4.500%, 09/01/41 | | | 85,975 | | | | 89,898 | |
4.500%, 10/01/41 | | | 308,079 | | | | 322,829 | |
4.500%, 08/01/42 | | | 107,582 | | | | 112,141 | |
4.500%, 09/01/43 | | | 1,737,643 | | | | 1,811,843 | |
4.500%, 10/01/43 | | | 213,815 | | | | 222,339 | |
See accompanying notes to financial statements.
BHFTII-8
Brighthouse Funds Trust II
Brighthouse/Wellington Balanced Portfolio
Schedule of Investments as of December 31, 2018
U.S. Treasury & Government Agencies—(Continued)
| | | | | | | | |
| Security Description | | Principal
Amount* | | | Value | |
|
| Agency Sponsored Mortgage - Backed—(Continued) | |
Fannie Mae 30 Yr. Pool
4.500%, 12/01/43 | | | 187,411 | | | $ | 195,239 | |
4.500%, 01/01/44 | | | 550,858 | | | | 576,298 | |
5.000%, 04/01/33 | | | 3,086 | | | | 3,279 | |
5.000%, 07/01/33 | | | 9,412 | | | | 9,989 | |
5.000%, 09/01/33 | | | 155,499 | | | | 165,161 | |
5.000%, 11/01/33 | | | 40,270 | | | | 42,905 | |
5.000%, 12/01/33 | | | 16,168 | | | | 17,173 | |
5.000%, 02/01/34 | | | 7,263 | | | | 7,715 | |
5.000%, 03/01/34 | | | 3,436 | | | | 3,650 | |
5.000%, 04/01/34 | | | 3,269 | | | | 3,472 | |
5.000%, 06/01/34 | | | 3,507 | | | | 3,724 | |
5.000%, 07/01/34 | | | 47,235 | | | | 50,167 | |
5.000%, 10/01/34 | | | 117,981 | | | | 125,309 | |
5.000%, 07/01/35 | | | 82,402 | | | | 87,523 | |
5.000%, 10/01/35 | | | 90,450 | | | | 96,075 | |
5.000%, 12/01/35 | | | 71,818 | | | | 76,275 | |
5.000%, 08/01/36 | | | 66,362 | | | | 70,483 | |
5.000%, 07/01/37 | | | 36,129 | | | | 38,377 | |
5.000%, 07/01/41 | | | 63,502 | | | | 67,187 | |
5.000%, 08/01/41 | | | 33,316 | | | | 35,249 | |
5.000%, 06/01/47 | | | 715,196 | | | | 749,832 | |
5.000%, TBA (f) | | | 4,730,000 | | | | 4,956,031 | |
5.500%, 08/01/28 | | | 24,543 | | | | 25,985 | |
5.500%, 04/01/33 | | | 43,474 | | | | 46,682 | |
5.500%, 08/01/37 | | | 254,295 | | | | 274,035 | |
5.500%, 04/01/41 | | | 21,320 | | | | 22,756 | |
6.000%, 03/01/28 | | | 2,017 | | | | 2,165 | |
6.000%, 05/01/28 | | | 3,219 | | | | 3,455 | |
6.000%, 02/01/34 | | | 175,724 | | | | 191,662 | |
6.000%, 08/01/34 | | | 93,207 | | | | 101,675 | |
6.000%, 04/01/35 | | | 793,611 | | | | 865,632 | |
6.000%, 02/01/38 | | | 64,270 | | | | 70,030 | |
6.000%, 03/01/38 | | | 19,423 | | | | 21,214 | |
6.000%, 05/01/38 | | | 62,901 | | | | 68,881 | |
6.000%, 10/01/38 | | | 18,761 | | | | 20,474 | |
6.000%, 12/01/38 | | | 23,191 | | | | 25,310 | |
6.000%, TBA (f) | | | 1,000,000 | | | | 1,074,170 | |
6.500%, 05/01/40 | | | 449,553 | | | | 508,004 | |
Fannie Mae ARM Pool
3.725%, 12M LIBOR + 1.750%, 03/01/41 (g) | | | 53,090 | | | | 55,279 | |
3.840%, 12M LIBOR + 1.820%, 03/01/41 (g) | | | 22,110 | | | | 23,249 | |
4.102%, 12M LIBOR + 1.776%, 06/01/41 (g) | | | 154,910 | | | | 161,618 | |
4.450%, 12M LIBOR + 1.802%, 12/01/40 (g) | | | 65,201 | | | | 67,767 | |
4.487%, 12M LIBOR + 1.825%, 09/01/41 (g) | | | 75,654 | | | | 78,855 | |
Fannie Mae Connecticut Avenue Securities (CMO)
3.226%, 1M LIBOR + 0.720%, 01/25/31 (g) | | | 787,787 | | | | 785,919 | |
6.056%, 1M LIBOR + 3.550%, 07/25/29 (g) | | | 390,000 | | | | 413,320 | |
6.856%, 1M LIBOR + 4.350%, 05/25/29 (g) | | | 780,142 | | | | 844,852 | |
7.406%, 1M LIBOR + 4.900%, 11/25/24 (g) | | | 275,347 | | | | 307,326 | |
8.206%, 1M LIBOR + 5.700%, 04/25/28 (g) | | | 150,773 | | | | 170,212 | |
8.506%, 1M LIBOR + 6.000%, 09/25/28 (g) | | | 129,000 | | | | 148,073 | |
Fannie Mae Interest Strip (CMO)
2.000%, 09/25/39 | | | 414,444 | | | | 388,837 | |
4.000%, 05/25/27 (h) | | | 309,341 | | | | 27,554 | |
|
| Agency Sponsored Mortgage - Backed—(Continued) | |
Fannie Mae Pool
2.390%, 09/01/28 | | | 125,000 | | | | 116,726 | |
3.025%, 11/01/29 | | | 400,000 | | | | 384,025 | |
3.140%, 11/01/27 | | | 663,453 | | | | 655,520 | |
3.170%, 11/01/29 | | | 300,000 | | | | 291,695 | |
3.170%, 02/01/30 | | | 1,300,000 | | | | 1,258,283 | |
3.175%, 01/01/30 | | | 1,400,000 | | | | 1,362,530 | |
3.180%, 12/01/29 | | | 1,000,000 | | | | 969,421 | |
3.240%, 12/01/26 | | | 81,123 | | | | 82,150 | |
3.410%, 08/01/27 | | | 475,753 | | | | 479,108 | |
3.500%, 09/01/57 | | | 2,168,293 | | | | 2,159,028 | |
3.660%, 07/01/30 | | | 500,000 | | | | 506,030 | |
3.705%, 09/01/28 | | | 698,985 | | | | 717,950 | |
3.800%, 02/01/29 | | | 1,330,000 | | | | 1,356,860 | |
3.890%, 05/01/30 | | | 99,932 | | | | 103,533 | |
3.960%, 05/01/34 | | | 42,007 | | | | 43,484 | |
4.500%, 01/01/51 | | | 1,301,035 | | | | 1,352,415 | |
Fannie Mae REMICS (CMO)
Zero Coupon, 03/25/36 (i) | | | 28,176 | | | | 23,251 | |
Zero Coupon, 06/25/36 (c) (i) | | | 232,834 | | | | 198,444 | |
1.340%, 08/25/44 (c) (g) (h) | | | 685,057 | | | | 34,448 | |
1.539%, 05/25/46 (c) (g) (h) | | | 731,650 | | | | 34,222 | |
1.555%, 04/25/55 (g) (h) | | | 721,718 | | | | 35,452 | |
1.649%, 06/25/55 (c) (g) (h) | | | 580,556 | | | | 31,022 | |
1.750%, 12/25/42 | | | 548,860 | | | | 522,972 | |
2.000%, 08/25/43 | | | 264,147 | | | | 246,974 | |
2.500%, 06/25/28 (c) (h) | | | 176,548 | | | | 13,023 | |
3.000%, 02/25/27 (c) (h) | | | 454,711 | | | | 32,356 | |
3.000%, 09/25/27 (c) (h) | | | 159,822 | | | | 13,516 | |
3.000%, 01/25/28 (c) (h) | | | 1,073,721 | | | | 86,704 | |
3.000%, 05/25/47 | | | 442,441 | | | | 438,580 | |
3.000%, 09/25/47 | | | 1,404,259 | | | | 1,400,807 | |
3.000%, 06/25/48 | | | 1,309,319 | | | | 1,284,300 | |
3.000%, 10/25/48 | | | 1,066,501 | | | | 1,047,151 | |
3.500%, 05/25/27 (c) (h) | | | 455,944 | | | | 44,025 | |
3.500%, 10/25/27 (c) (h) | | | 279,720 | | | | 25,991 | |
3.500%, 05/25/30 (c) (h) | | | 293,836 | | | | 34,106 | |
3.500%, 08/25/30 (c) (h) | | | 93,086 | | | | 9,156 | |
3.500%, 02/25/31 (c) (h) | | | 219,755 | | | | 18,671 | |
3.500%, 09/25/35 (c) (h) | | | 189,594 | | | | 28,140 | |
3.500%, 04/25/46 | | | 144,365 | | | | 140,926 | |
3.500%, 10/25/46 (c) (h) | | | 165,654 | | | | 38,083 | |
3.500%, 11/25/47 | | | 1,193,017 | | | | 1,214,073 | |
3.500%, 02/25/48 | | | 355,948 | | | | 360,145 | |
3.500%, 04/25/48 | | | 758,711 | | | | 784,234 | |
3.500%, 12/25/58 | | | 1,393,050 | | | | 1,402,310 | |
4.000%, 03/25/42 (c) (h) | | | 129,035 | | | | 19,390 | |
4.000%, 05/25/42 (c) (h) | | | 799,820 | | | | 105,549 | |
4.000%, 11/25/42 (c) (h) | | | 72,612 | | | | 10,985 | |
4.500%, 07/25/27 (c) (h) | | | 144,347 | | | | 14,200 | |
5.465%, 05/25/42 (g) (h) | | | 75,872 | | | | 8,322 | |
5.500%, 04/25/35 (c) | | | 323,977 | | | | 360,039 | |
5.500%, 04/25/37 | | | 125,474 | | | | 137,452 | |
5.500%, 09/25/44 (c) (h) | | | 570,621 | | | | 130,445 | |
5.500%, 06/25/48 (c) (h) | | | 609,250 | | | | 132,274 | |
6.000%, 01/25/42 (c) (h) | | | 589,609 | | | | 106,283 | |
6.000%, 09/25/47 (c) (h) | | | 384,099 | | | | 90,943 | |
See accompanying notes to financial statements.
BHFTII-9
Brighthouse Funds Trust II
Brighthouse/Wellington Balanced Portfolio
Schedule of Investments as of December 31, 2018
U.S. Treasury & Government Agencies—(Continued)
| | | | | | | | |
| Security Description | | Principal
Amount* | | | Value | |
|
| Agency Sponsored Mortgage - Backed—(Continued) | |
FannieMae-ACES (CMO)
2.177%, 01/25/22 (g) (h) | | | 1,157,741 | | | $ | 35,159 | |
3.090%, 02/25/30 (g) | | | 635,000 | | | | 609,616 | |
3.329%, 10/25/23 (g) | | | 490,887 | | | | 502,926 | |
Freddie Mac 15 Yr. Gold Pool
3.000%, 07/01/28 | | | 571,920 | | | | 572,950 | |
3.000%, 08/01/29 | | | 355,743 | | | | 356,077 | |
3.000%, 04/01/33 | | | 3,734,995 | | | | 3,721,648 | |
3.500%, TBA (f) | | | 700,000 | | | | 708,473 | |
Freddie Mac 20 Yr. Gold Pool
3.000%, 11/01/36 | | | 1,183,999 | | | | 1,167,940 | |
3.000%, 01/01/37 | | | 860,789 | | | | 849,115 | |
3.500%, 08/01/34 | | | 768,595 | | | | 782,413 | |
5.000%, 03/01/27 | | | 71,002 | | | | 74,319 | |
5.000%, 02/01/28 | | | 189,656 | | | | 198,506 | |
5.000%, 03/01/28 | | | 97,208 | | | | 101,744 | |
5.000%, 05/01/28 | | | 359,211 | | | | 375,972 | |
5.000%, 05/01/30 | | | 359,639 | | | | 377,375 | |
Freddie Mac 30 Yr. Gold Pool
3.000%, 12/01/44 | | | 18,034 | | | | 17,682 | |
3.000%, 08/01/46 | | | 1,689,083 | | | | 1,648,601 | |
3.000%, 10/01/46 | | | 1,711,526 | | | | 1,670,507 | |
3.000%, 11/01/46 | | | 2,600,924 | | | | 2,538,772 | |
3.000%, 12/01/46 | | | 818,125 | | | | 798,971 | |
3.000%, 01/01/47 | | | 930,526 | | | | 907,414 | |
3.500%, 08/01/42 | | | 118,460 | | | | 119,552 | |
3.500%, 11/01/42 | | | 174,815 | | | | 176,157 | |
3.500%, 06/01/46 | | | 271,850 | | | | 272,674 | |
3.500%, 10/01/47 | | | 1,306,121 | | | | 1,306,239 | |
3.500%, 03/01/48 | | | 663,197 | | | | 665,211 | |
3.500%, TBA (f) | | | 7,765,000 | | | | 7,762,556 | |
4.000%, 05/01/42 | | | 782,567 | | | | 805,196 | |
4.000%, 08/01/42 | | | 205,044 | | | | 210,976 | |
4.000%, 09/01/42 | | | 286,989 | | | | 294,776 | |
4.000%, 07/01/44 | | | 72,175 | | | | 74,174 | |
4.000%, 02/01/46 | | | 301,367 | | | | 307,662 | |
4.000%, 09/01/48 | | | 194,431 | | | | 198,263 | |
4.000%, TBA (f) | | | 5,765,000 | | | | 5,877,010 | |
4.500%, 09/01/43 | | | 117,734 | | | | 122,312 | |
4.500%, 11/01/43 | | | 976,271 | | | | 1,013,144 | |
4.500%, TBA (f) | | | 1,405,000 | | | | 1,454,749 | |
5.000%, 03/01/38 | | | 67,083 | | | | 71,137 | |
5.000%, 05/01/39 | | | 7,247 | | | | 7,687 | |
5.000%, 06/01/41 | | | 391,451 | | | | 413,502 | |
5.000%, TBA (f) | | | 580,000 | | | | 607,149 | |
5.500%, 07/01/33 | | | 114,849 | | | | 122,418 | |
5.500%, 04/01/39 | | | 46,023 | | | | 49,406 | |
5.500%, 06/01/41 | | | 172,882 | | | | 186,121 | |
Freddie Mac ARMNon-Gold Pool
3.894%, 12M LIBOR + 1.900%, 02/01/41 (g) | | | 90,054 | | | | 94,209 | |
Freddie Mac Multifamily Structured Pass-Through Certificates (CMO) 0.608%, 03/25/27 (g) (h) | | | 4,369,947 | | | | 183,799 | |
1.444%, 06/25/22 (g) (h) | | | 1,786,914 | | | | 74,950 | |
1.627%, 03/25/22 (g) (h) | | | 1,304,944 | | | | 57,361 | |
1.734%, 05/25/19 (g) (h) | | | 2,078,742 | | | | 5,049 | |
4.050%, 09/25/28 (g) | | | 450,000 | | | | 474,822 | |
|
| Agency Sponsored Mortgage - Backed—(Continued) | |
Freddie Mac REMICS (CMO)
Zero Coupon, 11/15/36 (i) | | | 26,003 | | | | 23,792 | |
1.750%, 10/15/42 | | | 489,174 | | | | 463,530 | |
2.500%, 05/15/28 (h) | | | 187,629 | | | | 14,338 | |
3.000%, 03/15/28 (c) (h) | | | 535,268 | | | | 40,266 | |
3.000%, 05/15/32 (h) | | | 241,053 | | | | 16,583 | |
3.000%, 03/15/33 (c) (h) | | | 179,980 | | | | 21,562 | |
3.000%, 08/15/43 | | | 1,056,000 | | | | 1,023,890 | |
3.000%, 05/15/46 | | | 553,766 | | | | 547,567 | |
3.000%, 02/15/48 | | | 1,009,848 | | | | 1,012,808 | |
3.250%, 11/15/41 | | | 286,009 | | | | 285,499 | |
3.500%, 06/15/26 (c) (h) | | | 275,106 | | | | 16,705 | |
3.500%, 09/15/26 (h) | | | 96,931 | | | | 8,428 | |
3.500%, 03/15/27 (h) | | | 163,675 | | | | 13,715 | |
3.500%, 03/15/41 (c) (h) | | | 66,545 | | | | 7,908 | |
4.000%, 07/15/27 (c) (h) | | | 627,196 | | | | 55,634 | |
4.000%, 03/15/28 (h) | | | 298,790 | | | | 26,418 | |
4.000%, 06/15/28 (h) | | | 161,323 | | | | 14,670 | |
4.000%, 07/15/30 (h) | | | 429,175 | | | | 45,261 | |
4.750%, 07/15/39 | | | 490,591 | | | | 525,943 | |
5.000%, 09/15/33 (h) | | | 235,040 | | | | 44,374 | |
5.500%, 08/15/33 | | | 60,466 | | | | 65,737 | |
5.500%, 07/15/36 | | | 133,794 | | | | 145,736 | |
5.500%, 06/15/46 | | | 175,067 | | | | 192,369 | |
6.500%, 07/15/36 | | | 177,743 | | | | 196,583 | |
FREMF Mortgage Trust (CMO)
3.045%, 10/25/47 (144A) (g) | | | 770,000 | | | | 766,781 | |
4.293%, 11/25/51 (144A) (g) | | | 168,000 | | | | 149,789 | |
5.278%, 09/25/43 (144A) (g) | | | 855,000 | | | | 877,960 | |
Ginnie Mae I 30 Yr. Pool
3.000%, 12/15/44 | | | 24,593 | | | | 24,265 | |
3.000%, 02/15/45 | | | 70,790 | | | | 69,766 | |
3.000%, 04/15/45 | | | 922,289 | | | | 908,953 | |
3.000%, 05/15/45 | | | 1,176,855 | | | | 1,159,838 | |
3.000%, 07/15/45 | | | 30,997 | | | | 30,549 | |
4.000%, 09/15/42 | | | 813,570 | | | | 838,550 | |
4.500%, 04/15/41 | | | 574,936 | | | | 600,574 | |
4.500%, 02/15/42 | | | 1,249,055 | | | | 1,304,500 | |
5.000%, 12/15/38 | | | 43,348 | | | | 45,960 | |
5.000%, 04/15/39 | | | 828,599 | | | | 878,709 | |
5.000%, 07/15/39 | | | 79,549 | | | | 84,335 | |
5.000%, 12/15/40 | | | 117,774 | | | | 124,866 | |
5.500%, 12/15/40 | | | 430,360 | | | | 464,856 | |
Ginnie Mae II 30 Yr. Pool
3.000%, TBA (f) | | | 7,585,000 | | | | 7,462,946 | |
3.500%, 08/20/47 | | | 358,946 | | | | 361,561 | |
3.500%, TBA (f) | | | 13,968,000 | | | | 14,063,257 | |
4.000%, 11/20/47 | | | 284,277 | | | | 292,702 | |
4.000%, 03/20/48 | | | 1,065,278 | | | | 1,093,913 | |
4.000%, TBA (f) | | | 6,137,000 | | | | 6,284,705 | |
4.500%, 01/20/46 | | | 128,694 | | | | 134,955 | |
4.500%, 08/20/48 | | | 2,282,012 | | | | 2,363,078 | |
4.500%, 09/20/48 | | | 2,117,655 | | | | 2,192,868 | |
4.500%, TBA (f) | | | 800,000 | | | | 827,820 | |
5.000%, 10/20/39 | | | 19,530 | | | | 20,779 | |
5.000%, TBA (f) | | | 270,000 | | | | 280,890 | |
See accompanying notes to financial statements.
BHFTII-10
Brighthouse Funds Trust II
Brighthouse/Wellington Balanced Portfolio
Schedule of Investments as of December 31, 2018
U.S. Treasury & Government Agencies—(Continued)
| | | | | | | | |
| Security Description | | Principal
Amount* | | | Value | |
|
| Agency Sponsored Mortgage - Backed—(Continued) | |
Government National Mortgage Association (CMO)
0.779%, 02/16/53 (g) (h) | | | 1,996,408 | | | $ | 96,563 | |
1.750%, 09/20/43 | | | 89,754 | | | | 86,198 | |
2.000%, 01/20/42 | | | 449,126 | | | | 428,740 | |
2.500%, 12/16/39 | | | 394,433 | | | | 387,320 | |
2.500%, 07/20/41 | | | 651,528 | | | | 635,920 | |
3.000%, 09/20/28 (h) | | | 203,511 | | | | 17,030 | |
3.000%, 02/16/43 (h) | | | 128,943 | | | | 20,115 | |
3.000%, 03/20/47 | | | 159,512 | | | | 142,287 | |
3.500%, 02/16/27 (h) | | | 86,016 | | | | 7,507 | |
3.500%, 03/20/27 (h) | | | 213,090 | | | | 20,312 | |
3.500%, 10/20/29 (h) | | | 1,146,073 | | | | 129,081 | |
3.500%, 07/20/40 (h) | | | 210,436 | | | | 21,955 | |
3.500%, 02/20/41 (h) | | | 299,152 | | | | 33,553 | |
3.500%, 04/20/42 (h) | | | 518,854 | | | | 60,469 | |
3.500%, 10/20/42 (h) | | | 777,700 | | | | 140,206 | |
3.500%, 05/20/43 (c) (h) | | | 110,036 | | | | 18,526 | |
3.500%, 07/20/43 (c) (h) | | | 419,436 | | | | 62,308 | |
3.500%, 01/20/46 | | | 508,000 | | | | 504,715 | |
4.000%, 12/16/26 (h) | | | 58,980 | | | | 5,302 | |
4.000%, 05/20/29 (h) | | | 885,309 | | | | 86,884 | |
4.000%, 05/16/42 (c) (h) | | | 91,411 | | | | 13,705 | |
4.000%, 03/20/43 (h) | | | 146,327 | | | | 30,930 | |
4.000%, 01/20/44 (c) (h) | | | 66,528 | | | | 14,989 | |
4.000%, 11/20/44 (c) (h) | | | 1,101,317 | | | | 187,650 | |
4.000%, 03/20/47 (h) | | | 534,600 | | | | 94,173 | |
4.000%, 07/20/47 (h) | | | 808,892 | | | | 141,434 | |
4.500%, 04/20/45 (c) (h) | | | 234,961 | | | | 56,483 | |
5.000%, 02/16/40 (h) | | | 620,014 | | | | 145,529 | |
5.000%, 10/16/41 (c) (h) | | | 344,865 | | | | 52,693 | |
5.000%, 01/16/47 (h) | | | 155,248 | | | | 34,134 | |
5.500%, 03/20/39 (c) (h) | | | 439,960 | | | | 98,338 | |
5.500%, 02/16/47 (h) | | | 425,925 | | | | 95,644 | |
5.500%, 02/20/47 (h) | | | 261,154 | | | | 56,991 | |
6.000%, 09/20/40 (h) | | | 469,518 | | | | 111,885 | |
6.000%, 02/20/46 (h) | | | 403,925 | | | | 92,896 | |
| | | | | | | | |
| | | | | | | 267,939,285 | |
| | | | | | | | |
|
| U.S. Treasury—2.7% | |
U.S. Treasury Bonds
2.250%, 08/15/46 | | | 915,000 | | | | 783,489 | |
2.875%, 11/15/46 (j) | | | 1,600,000 | | | | 1,558,495 | |
3.000%, 11/15/45 (j) (k) | | | 1,980,000 | | | | 1,979,476 | |
3.000%, 02/15/47 (k) | | | 1,500,000 | | | | 1,498,449 | |
3.000%, 02/15/48 (k) | | | 2,840,000 | | | | 2,829,740 | |
3.750%, 11/15/43 (k) | | | 7,910,000 | | | | 8,949,021 | |
U.S. Treasury Inflation Indexed Notes
0.250%, 01/15/25 (k) (l) (m) | | | 8,565,515 | | | | 8,202,868 | |
0.750%, 07/15/28 (m) | | | 2,811,625 | | | | 2,752,317 | |
U.S. Treasury Notes
1.625%, 11/15/22 (j) (k) | | | 2,200,000 | | | | 2,129,865 | |
| | | | | | | | |
| | | | | | | 30,683,720 | |
| | | | | | | | |
Total U.S. Treasury & Government Agencies
(Cost $299,211,230) | | | | | | | 298,623,005 | |
| | | | | | | | |
| Corporate Bonds & Notes—12.0% | |
| Security Description | | Principal
Amount* | | | Value | |
|
| Aerospace/Defense—0.2% | |
Lockheed Martin Corp.
4.090%, 09/15/52 | | | 905,000 | | | | 848,745 | |
| United Technologies Corp. | |
2.800%, 05/04/24 | | | 25,000 | | | | 23,563 | |
3.650%, 08/16/23 | | | 1,195,000 | | | | 1,190,242 | |
3.950%, 08/16/25 | | | 345,000 | | | | 342,483 | |
4.625%, 11/16/48 | | | 90,000 | | | | 87,034 | |
| | | | | | | | |
| | | | | | | 2,492,067 | |
| | | | | | | | |
|
| Agriculture—0.3% | |
Altria Group, Inc.
2.850%, 08/09/22 | | | 1,150,000 | | | | 1,103,917 | |
3.875%, 09/16/46 | | | 530,000 | | | | 404,252 | |
BAT Capital Corp.
2.297%, 08/14/20 | | | 545,000 | | | | 532,013 | |
3.222%, 08/15/24 | | | 380,000 | | | | 349,965 | |
4.390%, 08/15/37 | | | 665,000 | | | | 544,853 | |
Imperial Brands Finance plc
3.750%, 07/21/22 (144A) | | | 310,000 | | | | 307,489 | |
| | | | | | | | |
| | | | | | | 3,242,489 | |
| | | | | | | | |
|
| Airlines—0.0% | |
Delta Air Lines, Inc.
3.625%, 03/15/22 | | | 185,000 | | | | 181,031 | |
3.800%, 04/19/23 | | | 280,000 | | | | 275,505 | |
| | | | | | | | |
| | | | | | | 456,536 | |
| | | | | | | | |
|
| Auto Manufacturers—0.3% | |
Daimler Canada Finance, Inc.
2.908%, 3M CDOR + 0.830%, 07/08/19 (CAD) (c) (g) | | | 635,000 | | | | 463,459 | |
Ford Credit Canada Co.
2.939%, 02/19/19 (CAD) | | | 270,000 | | | | 197,769 | |
Ford Motor Co.
4.750%, 01/15/43 | | | 130,000 | | | | 100,634 | |
5.291%, 12/08/46 | | | 140,000 | | | | 115,071 | |
Ford Motor Credit Co. LLC
3.815%, 11/02/27 (b) | | | 200,000 | | | | 168,837 | |
General Motors Co.
5.400%, 04/01/48 | | | 460,000 | | | | 392,225 | |
5.950%, 04/01/49 | | | 205,000 | | | | 185,067 | |
6.250%, 10/02/43 | | | 195,000 | | | | 182,978 | |
6.750%, 04/01/46 | | | 250,000 | | | | 242,279 | |
General Motors Financial Co., Inc.
3.678%, 3M LIBOR + 1.270%, 10/04/19 (g) | | | 100,000 | | | | 100,406 | |
3.700%, 05/09/23 | | | 300,000 | | | | 285,411 | |
3.950%, 04/13/24 | | | 165,000 | | | | 156,691 | |
3.996%, 3M LIBOR + 1.560%, 01/15/20 (b) (g) | | | 200,000 | | | | 200,936 | |
Toyota Motor Credit Corp.
2.754%, 3M LIBOR + 0.140%, 11/14/19 (g) | | | 100,000 | | | | 99,849 | |
Volkswagen Group of America Finance LLC
3.875%, 11/13/20 (144A) | | | 705,000 | | | | 708,302 | |
Volkswagen International Finance NV
3.250%, 01/21/19 (EUR) | | | 175,000 | | | | 200,831 | |
| | | | | | | | |
| | | | | | | 3,800,745 | |
| | | | | | | | |
See accompanying notes to financial statements.
BHFTII-11
Brighthouse Funds Trust II
Brighthouse/Wellington Balanced Portfolio
Schedule of Investments as of December 31, 2018
Corporate Bonds & Notes—(Continued)
| | | | | | | | |
| Security Description | | Principal
Amount* | | | Value | |
|
| Auto Parts & Equipment—0.0% | |
Goodyear Tire & Rubber Co. (The)
5.000%, 05/31/26 | | | 60,000 | | | $ | 54,000 | |
| | | | | | | | |
|
| Banks—3.5% | |
Banco Bilbao Vizcaya Argentaria S.A.
6.125%, 5Y USD Swap + 3.870%, 11/16/27 (b) (g) | | | 1,200,000 | | | | 1,005,000 | |
8.875%,-1 x 5Y EUR Swap + 9.177%, 04/14/21 (EUR) (g) | | | 200,000 | | | | 248,192 | |
Banco de Sabadell S.A.
6.125%, 5Y EUR Swap + 6.051%, 11/23/22 (EUR) (g) | | | 200,000 | | | | 206,521 | |
6.500%, 5Y EUR Swap + 6.414%, 05/18/22 (EUR) (g) | | | 600,000 | | | | 635,047 | |
Banco Santander S.A.
3.800%, 02/23/28 | | | 600,000 | | | | 533,997 | |
Bank of America Corp.
3.124%, 3M LIBOR + 1.160%, 01/20/23 (g) | | | 805,000 | | | | 791,418 | |
3.366%, 3M LIBOR + 0.810%, 01/23/26 (g) | | | 1,255,000 | | | | 1,200,402 | |
3.419%, 3M LIBOR + 1.040%, 12/20/28 (g) | | | 118,000 | | | | 110,295 | |
3.705%, 3M LIBOR + 1.512%, 04/24/28 (g) | | | 1,045,000 | | | | 1,002,989 | |
4.000%, 04/01/24 | | | 133,000 | | | | 133,728 | |
4.000%, 01/22/25 | | | 595,000 | | | | 579,858 | |
4.125%, 01/22/24 | | | 265,000 | | | | 268,593 | |
7.750%, 05/14/38 | | | 630,000 | | | | 815,570 | |
Bank of Nova Scotia (The)
3.371%, 3M LIBOR + 0.620%, 12/05/19 (g) | | | 175,000 | | | | 175,034 | |
Barclays Bank plc
2.650%, 01/11/21 | | | 200,000 | | | | 195,819 | |
Barclays plc
8.000%, 5Y EUR Swap + 6.750%, 12/15/20 (EUR) (g) | | | 325,000 | | | | 394,264 | |
BNP Paribas S.A.
2.950%, 05/23/22 (144A) | | | 220,000 | | | | 212,009 | |
3.375%, 01/09/25 (144A) | | | 615,000 | | | | 579,005 | |
4.400%, 08/14/28 (144A) | | | 405,000 | | | | 395,536 | |
5.125%, 5Y USD Swap + 2.838%, 11/15/27 (144A) (g) | | | 325,000 | | | | 281,125 | |
7.625%, 5Y USD Swap + 6.314%, 03/30/21 (144A) (g) | | | 390,000 | | | | 397,313 | |
BPCE S.A.
2.750%, 01/11/23 (144A) | | | 270,000 | | | | 258,987 | |
3.000%, 05/22/22 (144A) | | | 255,000 | | | | 246,315 | |
CaixaBank S.A.
6.750%, 5Y EUR Swap + 6.498%, 06/13/24 (EUR) (g) | | | 200,000 | | | | 231,250 | |
Citigroup, Inc.
2.700%, 10/27/22 | | | 265,000 | | | | 255,433 | |
3.200%, 10/21/26 | | | 660,000 | | | | 609,510 | |
3.204%, 3M LIBOR + 0.790%, 01/10/20 (g) | | | 200,000 | | | | 200,266 | |
3.520%, 3M LIBOR + 1.151%, 10/27/28 (g) | | | 230,000 | | | | 214,621 | |
3.740%, 3M LIBOR + 1.100%, 05/17/24 (g) | | | 680,000 | | | | 663,415 | |
4.075%, 3M LIBOR + 1.192%, 04/23/29 (g) | | | 165,000 | | | | 161,030 | |
4.450%, 09/29/27 | | | 510,000 | | | | 491,764 | |
4.650%, 07/30/45 | | | 9,000 | | | | 8,778 | |
4.750%, 05/18/46 | | | 238,000 | | | | 219,770 | |
Credit Agricole S.A.
4.000%, 5Y USD Swap + 1.644%, 01/10/33 (144A) (g) | | | 380,000 | | | | 348,184 | |
8.125%, 5Y USD Swap + 6.185%, 12/23/25 (144A) (g) | | | 725,000 | | | | 744,937 | |
Credit Suisse Group AG
6.250%, 5Y USD Swap + 3.455%, 12/18/24 (144A) (g) | | | 1,320,000 | | | | 1,246,819 | |
7.500%, 5Y USD Swap + 4.600%, 07/17/23 (144A) (g) | | | 200,000 | | | | 195,000 | |
Danske Bank A/S
5.875%, 5Y EUR Swap + 5.471%, 04/06/22 (EUR) (g) | | | 200,000 | | | | 229,337 | |
|
| Banks—(Continued) | |
Goldman Sachs Group, Inc. (The)
2.876%, 3M LIBOR + 0.821%, 10/31/22 (g) | | | 255,000 | | | | 247,647 | |
2.905%, 3M LIBOR + 0.990%, 07/24/23 (g) | | | 1,085,000 | | | | 1,033,343 | |
3.579%, 3M LIBOR + 0.800%, 12/13/19 (g) | | | 100,000 | | | | 100,019 | |
3.814%, 3M LIBOR + 1.158%, 04/23/29 (g) | | | 735,000 | | | | 686,627 | |
4.017%, 3M LIBOR + 1.373%, 10/31/38 (g) | | | 820,000 | | | | 721,345 | |
4.223%, 3M LIBOR + 1.301%, 05/01/29 (g) | | | 45,000 | | | | 43,333 | |
6.250%, 02/01/41 | | | 430,000 | | | | 490,986 | |
6.750%, 10/01/37 | | | 410,000 | | | | 463,461 | |
HSBC Holdings plc
2.950%, 05/25/21 | | | 255,000 | | | | 251,404 | |
3.400%, 03/08/21 | | | 765,000 | | | | 762,735 | |
3.600%, 05/25/23 (b) | | | 255,000 | | | | 253,529 | |
4.583%, 3M LIBOR + 1.535%, 06/19/29 (g) | | | 260,000 | | | | 257,875 | |
6.000%, 5Y USD ICE Swap + 3.746%, 05/22/27 (g) | | | 575,000 | | | | 517,776 | |
6.250%, 5Y USD ICE Swap + 3.453%, 03/23/23 (g) | | | 450,000 | | | | 421,875 | |
ING Bank NV
3.954%, 3M LIBOR + 1.130%, 03/22/19 (g) | | | 500,000 | | | | 500,866 | |
Intesa Sanpaolo S.p.A.
3.375%, 01/12/23 (144A) | | | 215,000 | | | | 199,155 | |
3.875%, 01/12/28 (144A) | | | 295,000 | | | | 252,086 | |
7.700%, 5Y USD Swap + 5.462%, 09/17/25 (144A) (b) (g) | | | 650,000 | | | | 581,750 | |
7.750%, 5Y EUR Swap + 7.192%, 01/11/27 (EUR) (g) | | | 400,000 | | | | 479,356 | |
JPMorgan Chase & Co.
3.220%, 3M LIBOR + 1.155%, 03/01/25 (g) | | | 550,000 | | | | 531,253 | |
3.509%, 3M LIBOR + 0.945%, 01/23/29 (g) | | | 525,000 | | | | 497,247 | |
3.717%, 3M LIBOR + 1.230%, 10/24/23 (g) | | | 325,000 | | | | 324,918 | |
3.797%, 3M LIBOR + 0.890%, 07/23/24 (g) | | | 435,000 | | | | 435,758 | |
4.005%, 3M LIBOR + 1.120%, 04/23/29 (g) | | | 410,000 | | | | 403,233 | |
5.600%, 07/15/41 | | | 30,000 | | | | 33,952 | |
Landsbanki Islands
Zero Coupon, 08/25/20 (c) (d) (e) (n) | | | 320,000 | | | | 0 | |
Morgan Stanley
2.500%, 04/21/21 | | | 680,000 | | | | 666,321 | |
2.750%, 05/19/22 | | | 645,000 | | | | 627,478 | |
3.125%, 07/27/26 | | | 180,000 | | | | 166,137 | |
3.217%, 3M LIBOR + 0.740%, 07/23/19 (g) | | | 100,000 | | | | 99,993 | |
3.337%, 3M LIBOR + 0.850%, 01/24/19 (g) | | | 260,000 | | | | 260,071 | |
3.591%, 3M LIBOR + 1.340%, 07/22/28 (g) | | | 1,250,000 | | | | 1,181,428 | |
3.625%, 01/20/27 | | | 685,000 | | | | 651,373 | |
3.649%, 3M LIBOR + 1.140%, 01/27/20 (g) | | | 50,000 | | | | 50,205 | |
4.000%, 07/23/25 | | | 280,000 | | | | 276,357 | |
4.350%, 09/08/26 | | | 95,000 | | | | 92,368 | |
5.000%, 11/24/25 | | | 322,000 | | | | 328,482 | |
Santander Holdings USA, Inc.
3.700%, 03/28/22 | | | 365,000 | | | | 358,449 | |
Societe Generale S.A.
7.375%, 5Y USD Swap + 6.238%, 09/13/21 (144A) (g) | | | 650,000 | | | | 632,938 | |
7.875%, 5Y USD Swap + 4.979%, 12/18/23 (144A) (g) | | | 200,000 | | | | 197,750 | |
Standard Chartered plc
7.500%, 5Y USD Swap + 6.301%, 04/02/22 (g) | | | 400,000 | | | | 401,000 | |
UBS AG
2.450%, 12/01/20 (144A) | | | 465,000 | | | | 456,311 | |
UBS Group AG
5.750%, 5Y EUR Swap + 5.287%, 02/19/22 (EUR) (g) | | | 250,000 | | | | 303,517 | |
6.875%, 5Y USD ICE Swap + 5.497%, 03/22/21 (g) | | | 450,000 | | | | 450,000 | |
See accompanying notes to financial statements.
BHFTII-12
Brighthouse Funds Trust II
Brighthouse/Wellington Balanced Portfolio
Schedule of Investments as of December 31, 2018
Corporate Bonds & Notes—(Continued)
| | | | | | | | |
| Security Description | | Principal
Amount* | | | Value | |
|
| Banks—(Continued) | |
UBS Group AG
7.000%, 5Y USD Swap + 4.866%, 02/19/25 (g) | | | 200,000 | | | $ | 203,500 | |
7.125%, 5Y USD Swap + 5.464%, 02/19/20 (g) | | | 270,000 | | | | 270,675 | |
UBS Group Funding Switzerland AG
2.650%, 02/01/22 (144A) | | | 420,000 | | | | 406,490 | |
UniCredit S.p.A.
5.375%, 3M LIBOR + 0.750%, 06/03/25 (EUR) (g) | | | 200,000 | | | | 192,180 | |
6.625%, 5Y EUR Swap + 6.387%, 06/03/23 (EUR) (g) | | | 575,000 | | | | 618,747 | |
Wells Fargo & Co.
2.625%, 07/22/22 | | | 595,000 | | | | 573,706 | |
3.000%, 04/22/26 | | | 310,000 | | | | 289,016 | |
3.000%, 10/23/26 | | | 200,000 | | | | 185,244 | |
3.069%, 01/24/23 | | | 960,000 | | | | 934,993 | |
3.584%, 3M LIBOR + 1.310%, 05/22/28 (g) | | | 705,000 | | | | 677,232 | |
4.400%, 06/14/46 | | | 290,000 | | | | 268,221 | |
4.900%, 11/17/45 | | | 290,000 | | | | 282,867 | |
| | | | | | | | |
| | | | | | | 39,081,709 | |
| | | | | | | | |
|
| Beverages—0.4% | |
Anheuser-Busch Cos. LLC / Anheuser-Busch InBev Worldwide, Inc. 3.650%, 02/01/26 (144A) | | | 680,000 | | | | 642,763 | |
4.700%, 02/01/36 (144A) | | | 50,000 | | | | 46,560 | |
Anheuser-Busch InBev Finance, Inc.
3.300%, 02/01/23 | | | 870,000 | | | | 847,087 | |
Anheuser-Busch InBev Worldwide, Inc.
3.500%, 01/12/24 | | | 585,000 | | | | 571,540 | |
3.750%, 07/15/42 | | | 426,000 | | | | 336,460 | |
4.600%, 04/15/48 | | | 265,000 | | | | 237,895 | |
4.750%, 04/15/58 | | | 440,000 | | | | 383,590 | |
Constellation Brands, Inc.
2.650%, 11/07/22 | | | 475,000 | | | | 454,803 | |
2.700%, 05/09/22 | | | 80,000 | | | | 77,267 | |
3.600%, 02/15/28 | | | 320,000 | | | | 294,875 | |
4.400%, 11/15/25 | | | 300,000 | | | | 300,729 | |
4.500%, 05/09/47 | | | 50,000 | | | | 45,698 | |
4.750%, 12/01/25 | | | 433,000 | | | | 442,417 | |
| | | | | | | | |
| | | | | | | 4,681,684 | |
| | | | | | | | |
|
| Biotechnology—0.1% | |
Amgen, Inc.
2.650%, 05/11/22 | | | 295,000 | | | | 288,225 | |
Baxalta, Inc.
3.600%, 06/23/22 | | | 17,000 | | | | 16,870 | |
Celgene Corp.
4.625%, 05/15/44 | | | 20,000 | | | | 17,591 | |
Gilead Sciences, Inc.
3.250%, 09/01/22 | | | 135,000 | | | | 134,676 | |
4.150%, 03/01/47 | | | 1,110,000 | | | | 1,023,915 | |
| | | | | | | | |
| | | | | | | 1,481,277 | |
| | | | | | | | |
|
| Building Materials—0.0% | |
Standard Industries, Inc.
5.000%, 02/15/27 (144A) | | | 10,000 | | | | 8,750 | |
6.000%, 10/15/25 (144A) | | | 220,000 | | | | 211,002 | |
| | | | | | | | |
| | | | | | | 219,752 | |
| | | | | | | | |
|
| Chemicals—0.4% | |
CF Industries, Inc.
4.950%, 06/01/43 | | | 95,000 | | | | 73,625 | |
Chemours Co. (The)
5.375%, 05/15/27 | | | 60,000 | | | | 54,000 | |
DowDuPont, Inc.
4.205%, 11/15/23 | | | 785,000 | | | | 802,653 | |
4.725%, 11/15/28 (b) | | | 785,000 | | | | 814,138 | |
LyondellBasell Industries NV
4.625%, 02/26/55 | | | 230,000 | | | | 193,983 | |
Methanex Corp.
4.250%, 12/01/24 | | | 325,000 | | | | 315,413 | |
5.650%, 12/01/44 | | | 120,000 | | | | 107,769 | |
Olin Corp.
5.125%, 09/15/27 | | | 60,000 | | | | 55,200 | |
SABIC Capital II B.V.
4.000%, 10/10/23 (144A) | | | 560,000 | | | | 557,200 | |
Sherwin-Williams Co. (The)
3.450%, 06/01/27 | | | 395,000 | | | | 368,413 | |
Syngenta Finance NV
4.892%, 04/24/25 (144A) | | | 385,000 | | | | 364,188 | |
5.182%, 04/24/28 (144A) | | | 725,000 | | | | 672,707 | |
Versum Materials, Inc.
5.500%, 09/30/24 (144A) | | | 60,000 | | | | 59,400 | |
| | | | | | | | |
| | | | | | | 4,438,689 | |
| | | | | | | | |
|
| Commercial Services—0.2% | |
Acwa Power Management & Investments One, Ltd.
5.950%, 12/15/39 (144A) | | | 1,269,000 | | | | 1,191,997 | |
IHS Markit, Ltd.
4.125%, 08/01/23 | | | 1,225,000 | | | | 1,212,505 | |
United Rentals North America, Inc.
4.875%, 01/15/28 | | | 65,000 | | | | 57,038 | |
5.500%, 07/15/25 | | | 110,000 | | | | 103,675 | |
| | | | | | | | |
| | | | | | | 2,565,215 | |
| | | | | | | | |
|
| Computers—0.1% | |
Apple, Inc.
3.450%, 02/09/45 | | | 215,000 | | | | 190,654 | |
Hewlett Packard Enterprise Co.
6.350%, 10/15/45 | | | 215,000 | | | | 200,908 | |
IBM Credit LLC
3.177%, 3M LIBOR + 0.470%, 11/30/20 (g) | | | 515,000 | | | | 513,822 | |
Western Digital Corp.
4.750%, 02/15/26 | | | 790,000 | | | | 685,325 | |
| | | | | | | | |
| | | | | | | 1,590,709 | |
| | | | | | | | |
|
| Distribution/Wholesale—0.0% | |
HD Supply, Inc.
5.375%, 10/15/26 (144A) | | | 50,000 | | | | 48,430 | |
| | | | | | | | |
|
| Diversified Financial Services—0.2% | |
American Express Co.
3.400%, 02/27/23 | | | 500,000 | | | | 495,319 | |
GTP Acquisition Partners I LLC
3.482%, 06/16/50 (144A) | | | 1,355,000 | | | | 1,337,712 | |
See accompanying notes to financial statements.
BHFTII-13
Brighthouse Funds Trust II
Brighthouse/Wellington Balanced Portfolio
Schedule of Investments as of December 31, 2018
Corporate Bonds & Notes—(Continued)
| | | | | | | | |
| Security Description | | Principal
Amount* | | | Value | |
|
| Diversified Financial Services—(Continued) | |
Navient Corp.
5.875%, 03/25/21 | | | 20,000 | | | $ | 19,150 | |
| | | | | | | | |
| | | | | | | 1,852,181 | |
| | | | | | | | |
|
| Electric—0.7% | |
AES Corp.
4.000%, 03/15/21 | | | 75,000 | | | | 73,688 | |
4.500%, 03/15/23 | | | 45,000 | | | | 43,875 | |
4.875%, 05/15/23 | | | 20,000 | | | | 19,550 | |
5.125%, 09/01/27 | | | 10,000 | | | | 9,600 | |
Berkshire Hathaway Energy Co.
3.250%, 04/15/28 | | | 245,000 | | | | 233,206 | |
DTE Energy Co.
1.500%, 10/01/19 | | | 315,000 | | | | 310,334 | |
Duke Energy Carolinas LLC
4.250%, 12/15/41 | | | 275,000 | | | | 276,058 | |
Duke Energy Florida LLC
3.400%, 10/01/46 | | | 370,000 | | | | 319,279 | |
Duke Energy Progress LLC
4.375%, 03/30/44 | | | 320,000 | | | | 326,310 | |
Exelon Corp.
2.450%, 04/15/21 | | | 80,000 | | | | 78,240 | |
2.850%, 06/15/20 | | | 530,000 | | | | 525,720 | |
Fortis, Inc.
2.100%, 10/04/21 | | | 135,000 | | | | 129,779 | |
Georgia Power Co.
2.000%, 09/08/20 | | | 1,043,000 | | | | 1,019,127 | |
IPALCO Enterprises, Inc.
3.700%, 09/01/24 | | | 335,000 | | | | 326,097 | |
Oncor Electric Delivery Co. LLC
5.750%, 03/15/29 (144A) | | | 110,000 | | | | 128,462 | |
Pacific Gas & Electric Co.
2.950%, 03/01/26 | | | 165,000 | | | | 135,727 | |
3.300%, 12/01/27 | | | 965,000 | | | | 787,945 | |
3.400%, 08/15/24 | | | 444,000 | | | | 385,020 | |
3.500%, 06/15/25 | | | 145,000 | | | | 124,326 | |
3.750%, 02/15/24 | | | 139,000 | | | | 123,296 | |
5.125%, 11/15/43 | | | 30,000 | | | | 25,889 | |
5.400%, 01/15/40 | | | 5,000 | | | | 4,439 | |
6.050%, 03/01/34 | | | 560,000 | | | | 519,467 | |
Sempra Energy
2.400%, 02/01/20 | | | 340,000 | | | | 335,390 | |
South Carolina Electric & Gas Co.
3.500%, 08/15/21 | | | 125,000 | | | | 125,346 | |
4.250%, 08/15/28 | | | 140,000 | | | | 145,068 | |
4.500%, 06/01/64 | | | 475,000 | | | | 439,773 | |
Southern California Edison Co.
3.700%, 08/01/25 | | | 95,000 | | | | 94,806 | |
4.125%, 03/01/48 | | | 55,000 | | | | 52,147 | |
Southern Co. (The)
2.950%, 07/01/23 | | | 130,000 | | | | 125,596 | |
3.250%, 07/01/26 | | | 335,000 | | | | 313,973 | |
Vistra Operations Co. LLC
5.500%, 09/01/26 (144A) | | | 475,000 | | | | 457,187 | |
| | | | | | | | |
| | | | | | | 8,014,720 | |
| | | | | | | | �� |
|
| Electronics—0.0% | |
Fortive Corp.
2.350%, 06/15/21 | | | 275,000 | | | | 268,132 | |
Sensata Technologies B.V.
5.000%, 10/01/25 (144A) | | | 120,000 | | | | 112,800 | |
| | | | | | | | |
| | | | | | | 380,932 | |
| | | | | | | | |
|
| Engineering & Construction—0.2% | |
Fluor Corp.
4.250%, 09/15/28 | | | 545,000 | | | | 531,247 | |
Mexico City Airport Trust
| |
3.875%, 04/30/28 (144A) | | | 200,000 | | | | 175,700 | |
SBA Tower Trust
3.168%, 04/11/47 (144A) | | | 995,000 | | | | 977,927 | |
| | | | | | | | |
| | | | | | | 1,684,874 | |
| | | | | | | | |
|
| Entertainment—0.0% | |
| WMG Acquisition Corp. | |
4.875%, 11/01/24 (144A) | | | 120,000 | | | | 113,700 | |
5.000%, 08/01/23 (144A) | | | 40,000 | | | | 38,900 | |
| | | | | | | | |
| | | | | | | 152,600 | |
| | | | | | | | |
|
| Food—0.2% | |
| Conagra Brands, Inc. | |
3.219%, 3M LIBOR + 0.750%, 10/22/20 (g) | | | 155,000 | | | | 154,564 | |
3.800%, 10/22/21 | | | 100,000 | | | | 100,031 | |
4.600%, 11/01/25 | | | 55,000 | | | | 55,199 | |
5.300%, 11/01/38 | | | 85,000 | | | | 80,405 | |
| Kraft Heinz Foods Co. | |
4.375%, 06/01/46 | | | 320,000 | | | | 263,966 | |
4.625%, 01/30/29 | | | 925,000 | | | | 915,135 | |
Sysco Corp.
2.500%, 07/15/21 | | | 405,000 | | | | 396,795 | |
TreeHouse Foods, Inc.
6.000%, 02/15/24 (144A) (b) | | | 60,000 | | | | 59,400 | |
| | | | | | | | |
| | | | | | | 2,025,495 | |
| | | | | | | | |
|
| Food Service—0.0% | |
| Aramark Services, Inc. | |
4.750%, 06/01/26 | | | 15,000 | | | | 14,100 | |
5.000%, 02/01/28 (144A) | | | 125,000 | | | | 116,562 | |
| | | | | | | | |
| | | | | | | 130,662 | |
| | | | | | | | |
|
| Forest Products & Paper—0.0% | |
Suzano Austria GmbH
6.000%, 01/15/29 (144A) | | | 200,000 | | | | 204,100 | |
| | | | | | | | |
|
| Gas—0.0% | |
AmeriGas Partners L.P. / AmeriGas Finance Corp.
5.875%, 08/20/26 | | | 95,000 | | | | 86,688 | |
| | | | | | | | |
|
| Healthcare-Products—0.2% | |
| Becton Dickinson & Co. | |
3.363%, 06/06/24 | | | 925,000 | | | | 888,376 | |
3.700%, 06/06/27 | | | 550,000 | | | | 519,958 | |
See accompanying notes to financial statements.
BHFTII-14
Brighthouse Funds Trust II
Brighthouse/Wellington Balanced Portfolio
Schedule of Investments as of December 31, 2018
Corporate Bonds & Notes—(Continued)
| | | | | | | | |
| Security Description | | Principal
Amount* | | | Value | |
|
| Healthcare-Products—(Continued) | |
Boston Scientific Corp.
4.000%, 03/01/28 | | | 505,000 | | | $ | 490,460 | |
Thermo Fisher Scientific, Inc.
3.000%, 04/15/23 | | | 180,000 | | | | 175,109 | |
| | | | | | | | |
| | | | | | | 2,073,903 | |
| | | | | | | | |
|
| Healthcare-Services—0.3% | |
Aetna, Inc.
2.800%, 06/15/23 | | | 175,000 | | | | 166,416 | |
| Anthem, Inc. | |
3.500%, 08/15/24 | | | 695,000 | | | | 681,655 | |
3.650%, 12/01/27 | | | 525,000 | | | | 501,893 | |
4.625%, 05/15/42 | | | 170,000 | | | | 164,067 | |
| CHS/Community Health Systems, Inc. | |
5.125%, 08/01/21 (b) | | | 110,000 | | | | 102,025 | |
6.250%, 03/31/23 | | | 30,000 | | | | 27,264 | |
Halfmoon Parent, Inc.
3.138%, 3M LIBOR + 0.350%, 03/17/20 (144A) (g) | | | 200,000 | | | | 198,717 | |
HCA, Inc.
4.750%, 05/01/23 | | | 20,000 | | | | 19,700 | |
Tenet Healthcare Corp.
6.000%, 10/01/20 | | | 75,000 | | | | 75,938 | |
| UnitedHealth Group, Inc. | |
3.500%, 06/15/23 | | | 280,000 | | | | 282,397 | |
3.700%, 12/15/25 | | | 200,000 | | | | 202,092 | |
3.750%, 07/15/25 | | | 240,000 | | | | 243,053 | |
4.250%, 04/15/47 | | | 110,000 | | | | 109,200 | |
4.250%, 06/15/48 | | | 160,000 | | | | 160,146 | |
4.750%, 07/15/45 | | | 130,000 | | | | 137,727 | |
| | | | | | | | |
| | | | | | | 3,072,290 | |
| | | | | | | | |
|
| Home Builders—0.0% | |
Lennar Corp.
4.750%, 11/29/27 | | | 125,000 | | | | 112,812 | |
PulteGroup, Inc.
5.500%, 03/01/26 | | | 60,000 | | | | 57,750 | |
Toll Brothers Finance Corp.
4.875%, 11/15/25 | | | 130,000 | | | | 121,550 | |
| | | | | | | | |
| | | | | | | 292,112 | |
| | | | | | | | |
|
| Insurance—0.1% | |
CNO Financial Group, Inc.
5.250%, 05/30/25 | | | 175,000 | | | | 166,687 | |
Genworth Holdings, Inc.
4.900%, 08/15/23 | | | 90,000 | | | | 74,475 | |
Massachusetts Mutual Life Insurance Co.
8.875%, 06/01/39 (144A) | | | 52,000 | | | | 78,023 | |
MGIC Investment Corp.
5.750%, 08/15/23 | | | 90,000 | | | | 89,550 | |
Willis North America, Inc.
3.600%, 05/15/24 | | | 210,000 | | | | 205,021 | |
| | | | | | | | |
| | | | | | | 613,756 | |
| | | | | | | | |
|
| Internet—0.2% | |
| Alibaba Group Holding, Ltd. | |
3.400%, 12/06/27 | | | 810,000 | | | | 749,416 | |
4.200%, 12/06/47 | | | 200,000 | | | | 177,580 | |
| Amazon.com, Inc. | |
2.800%, 08/22/24 | | | 155,000 | | | | 150,642 | |
3.875%, 08/22/37 | | | 600,000 | | | | 583,252 | |
| Tencent Holdings, Ltd. | |
2.985%, 01/19/23 (144A) | | | 530,000 | | | | 515,047 | |
3.595%, 01/19/28 (144A) | | | 250,000 | | | | 235,030 | |
| | | | | | | | |
| | | | | | | 2,410,967 | |
| | | | | | | | |
|
| Iron/Steel—0.1% | |
ArcelorMittal
| |
6.125%, 06/01/25 (b) | | | 110,000 | | | | 115,176 | |
Commercial Metals Co.
5.375%, 07/15/27 | | | 60,000 | | | | 53,700 | |
| Steel Dynamics, Inc. | |
4.125%, 09/15/25 (b) | | | 165,000 | | | | 151,594 | |
5.500%, 10/01/24 | | | 65,000 | | | | 64,350 | |
| Vale Overseas, Ltd. | |
6.250%, 08/10/26 | | | 880,000 | | | | 950,400 | |
6.875%, 11/10/39 | | | 75,000 | | | | 86,625 | |
| | | | | | | | |
| | | | | | | 1,421,845 | |
| | | | | | | | |
|
| Leisure Time—0.0% | |
VOC Escrow, Ltd.
5.000%, 02/15/28 (144A) | | | 30,000 | | | | 27,675 | |
| | | | | | | | |
|
| Lodging—0.0% | |
Wynn Las Vegas LLC / Wynn Las Vegas Capital Corp.
5.500%, 03/01/25 (144A) | | | 5,000 | | | | 4,663 | |
| | | | | | | | |
|
| Machinery-Construction & Mining—0.0% | |
BWX Technologies, Inc.
5.375%, 07/15/26 (144A) | | | 30,000 | | | | 28,866 | |
Oshkosh Corp.
5.375%, 03/01/25 | | | 75,000 | | | | 74,812 | |
| | | | | | | | |
| | | | | | | 103,678 | |
| | | | | | | | |
|
| Machinery-Diversified—0.0% | |
John Deere Canada Funding, Inc.
1.750%, 01/28/19 (CAD) | | | 75,000 | | | | 54,929 | |
| | | | | | | | |
|
| Media—0.8% | |
CCO Holdings LLC / CCO Holdings Capital Corp.
5.125%, 05/01/27 (144A) | | | 15,000 | | | | 13,971 | |
| Charter Communications Operating LLC / Charter Communications Operating Capital Corp. | |
4.464%, 07/23/22 | | | 655,000 | | | | 661,261 | |
4.908%, 07/23/25 | | | 145,000 | | | | 144,116 | |
5.750%, 04/01/48 | | | 480,000 | | | | 450,022 | |
6.484%, 10/23/45 | | | 1,245,000 | | | | 1,284,956 | |
| Comcast Corp. | |
2.350%, 01/15/27 | | | 65,000 | | | | 58,174 | |
3.150%, 03/01/26 | | | 405,000 | | | | 387,702 | |
See accompanying notes to financial statements.
BHFTII-15
Brighthouse Funds Trust II
Brighthouse/Wellington Balanced Portfolio
Schedule of Investments as of December 31, 2018
Corporate Bonds & Notes—(Continued)
| | | | | | | | |
| Security Description | | Principal
Amount* | | | Value | |
|
| Media—(Continued) | |
| Comcast Corp. | |
3.200%, 07/15/36 | | | 100,000 | | | $ | 86,119 | |
3.950%, 10/15/25 | | | 210,000 | | | | 212,582 | |
4.049%, 11/01/52 | | | 395,000 | | | | 355,058 | |
4.150%, 10/15/28 | | | 190,000 | | | | 193,050 | |
4.250%, 10/15/30 | | | 210,000 | | | | 212,525 | |
4.600%, 10/15/38 | | | 240,000 | | | | 242,620 | |
4.950%, 10/15/58 | | | 195,000 | | | | 198,553 | |
| COX Communications, Inc. | |
2.950%, 06/30/23 (144A) | | | 115,000 | | | | 110,650 | |
3.150%, 08/15/24 (144A) | | | 868,000 | | | | 834,955 | |
4.800%, 02/01/35 (144A) | | | 25,000 | | | | 22,815 | |
| Discovery Communications LLC | |
3.800%, 03/13/24 | | | 364,000 | | | | 355,069 | |
3.950%, 06/15/25 (144A) | | | 217,000 | | | | 208,536 | |
4.900%, 03/11/26 (b) | | | 190,000 | | | | 191,488 | |
DISH DBS Corp.
5.875%, 11/15/24 (b) | | | 130,000 | | | | 104,650 | |
Liberty Interactive LLC
| |
8.250%, 02/01/30 (b) | | | 130,000 | | | | 126,750 | |
TEGNA, Inc.
6.375%, 10/15/23 | | | 5,000 | | | | 5,013 | |
| Time Warner Cable LLC | |
4.500%, 09/15/42 | | | 400,000 | | | | 321,940 | |
7.300%, 07/01/38 | | | 45,000 | | | | 48,829 | |
8.250%, 04/01/19 | | | 231,000 | | | | 233,593 | |
Time Warner, Inc.
3.875%, 01/15/26 | | | 70,000 | | | | 66,889 | |
| Viacom, Inc. | |
4.250%, 09/01/23 | | | 1,190,000 | | | | 1,185,281 | |
4.375%, 03/15/43 | | | 203,000 | | | | 161,124 | |
5.875%, 3M LIBOR + 3.895%, 02/28/57 (g) | | | 10,000 | | | | 9,085 | |
6.250%, 3M LIBOR + 3.899%, 02/28/57 (g) | | | 15,000 | | | | 13,998 | |
Videotron, Ltd.
5.375%, 06/15/24 (144A) | | | 145,000 | | | | 143,550 | |
| Warner Media LLC | |
2.950%, 07/15/26 | | | 70,000 | | | | 62,615 | |
3.800%, 02/15/27 | | | 520,000 | | | | 488,180 | |
| | | | | | | | |
| | | | | | | 9,195,719 | |
| | | | | | | | |
|
| Mining—0.1% | |
| Anglo American Capital plc | |
4.750%, 04/10/27 (144A) | | | 200,000 | | | | 191,646 | |
4.875%, 05/14/25 (144A) | | | 520,000 | | | | 509,419 | |
FMG Resources August 2006 Pty, Ltd.
5.125%, 05/15/24 (144A) (b) | | | 60,000 | | | | 55,200 | |
Glencore Finance Europe, Ltd.
6.500%, 02/27/19 (GBP) | | | 150,000 | | | | 192,520 | |
| Glencore Funding LLC | |
2.500%, 01/15/19 | | | 105,000 | | | | 104,956 | |
3.796%, 3M LIBOR + 1.360%, 01/15/19 (g) | | | 240,000 | | | | 240,038 | |
Kaiser Aluminum Corp.
5.875%, 05/15/24 | | | 140,000 | | | | 136,850 | |
| | | | | | | | |
| | | | | | | 1,430,629 | |
| | | | | | | | |
|
| Miscellaneous Manufacturing—0.0% | |
Ingersoll-Rand Global Holding Co., Ltd.
2.900%, 02/21/21 | | | 225,000 | | | | 222,868 | |
| | | | | | | | |
|
| Office/Business Equipment—0.0% | |
Pitney Bowes, Inc.
4.700%, 04/01/23 | | | 195,000 | | | | 172,087 | |
| | | | | | | | |
|
| Oil & Gas—0.4% | |
Anadarko Petroleum Corp.
4.500%, 07/15/44 | | | 5,000 | | | | 4,242 | |
Antero Resources Corp.
5.625%, 06/01/23 | | | 60,000 | | | | 57,000 | |
Canadian Natural Resources, Ltd.
3.850%, 06/01/27 | | | 715,000 | | | | 674,847 | |
| Continental Resources, Inc. | |
4.900%, 06/01/44 | | | 10,000 | | | | 8,849 | |
5.000%, 09/15/22 | | | 44,000 | | | | 43,686 | |
Encana Corp.
3.900%, 11/15/21 | | | 300,000 | | | | 300,241 | |
| Hess Corp. | |
4.300%, 04/01/27 | | | 790,000 | | | | 723,532 | |
6.000%, 01/15/40 | | | 10,000 | | | | 9,175 | |
Kerr-McGee Corp.
| |
6.950%, 07/01/24 | | | 400,000 | | | | 445,913 | |
Marathon Oil Corp.
3.850%, 06/01/25 | | | 130,000 | | | | 122,008 | |
Marathon Petroleum Corp.
3.800%, 04/01/28 (144A) | | | 190,000 | | | | 178,410 | |
MEG Energy Corp.
6.500%, 01/15/25 (144A) | | | 65,000 | | | | 65,975 | |
Petroleos Mexicanos
2.500%, 04/10/19 (CHF) | | | 100,000 | | | | 102,313 | |
3.750%, 03/15/19 (EUR) | | | 100,000 | | | | 115,259 | |
6.500%, 01/23/29 | | | 65,000 | | | | 60,612 | |
6.750%, 09/21/47 | | | 351,000 | | | | 290,238 | |
8.000%, 05/03/19 | | | 150,000 | | | | 151,650 | |
Phillips 66
3.900%, 03/15/28 | | | 230,000 | | | | 222,310 | |
QEP Resources, Inc.
5.250%, 05/01/23 | | | 80,000 | | | | 70,800 | |
SM Energy Co.
6.125%, 11/15/22 | | | 55,000 | | | | 51,975 | |
6.750%, 09/15/26 (b) | | | 15,000 | | | | 13,425 | |
Sunoco LP / Sunoco Finance Corp.
5.500%, 02/15/26 | | | 60,000 | | | | 56,850 | |
Tullow Oil plc
7.000%, 03/01/25 (144A) | | | 500,000 | | | | 463,750 | |
Valero Energy Corp.
3.400%, 09/15/26 | | | 350,000 | | | | 320,728 | |
WPX Energy, Inc.
5.250%, 09/15/24 | | | 125,000 | | | | 113,125 | |
YPF S.A.
16.500%, 05/09/22 (144A) (ARS) (o) | | | 19,392,845 | | | | 334,720 | |
| | | | | | | | |
| | | | | | | 5,001,633 | |
| | | | | | | | |
See accompanying notes to financial statements.
BHFTII-16
Brighthouse Funds Trust II
Brighthouse/Wellington Balanced Portfolio
Schedule of Investments as of December 31, 2018
Corporate Bonds & Notes—(Continued)
| | | | | | | | |
| Security Description | | Principal
Amount* | | | Value | |
|
| Packaging & Containers—0.1% | |
Owens-Brockway Glass Container, Inc.
5.875%, 08/15/23 (144A) | | | 150,000 | | | $ | 150,375 | |
Reynolds Group Issuer, Inc. / Reynolds Group Issuer LLC
5.125%, 07/15/23 (144A) | | | 75,000 | | | | 71,438 | |
Westrock Co.
4.650%, 03/15/26 (144A) | | | 540,000 | | | | 548,507 | |
| | | | | | | | |
| | | | | | | 770,320 | |
| | | | | | | | |
|
| Pharmaceuticals—0.8% | |
Allergan Funding SCS
3.450%, 03/15/22 | | | 245,000 | | | | 241,241 | |
Bausch Health Cos., Inc.
7.000%, 03/15/24 (144A) | | | 30,000 | | | | 30,300 | |
Bayer U.S. Finance LLC
4.250%, 12/15/25 (144A) | | | 850,000 | | | | 827,656 | |
Cardinal Health, Inc.
2.616%, 06/15/22 | | | 440,000 | | | | 423,847 | |
Cigna Corp.
4.125%, 11/15/25 (144A) | | | 340,000 | | | | 339,679 | |
4.375%, 10/15/28 (144A) | | | 1,810,000 | | | | 1,821,204 | |
CVS Health Corp.
3.125%, 03/09/20 | | | 470,000 | | | | 469,010 | |
3.875%, 07/20/25 | | | 324,000 | | | | 315,879 | |
4.100%, 03/25/25 | | | 815,000 | | | | 807,847 | |
5.050%, 03/25/48 | | | 345,000 | | | | 335,996 | |
5.125%, 07/20/45 | | | 315,000 | | | | 307,011 | |
Elanco Animal Health, Inc.
3.912%, 08/27/21 (144A) | | | 311,000 | | | | 312,922 | |
4.272%, 08/28/23 (144A) | | | 310,000 | | | | 309,718 | |
GlaxoSmithKline Capital, Inc.
3.625%, 05/15/25 | | | 620,000 | | | | 624,230 | |
Mylan NV
3.150%, 06/15/21 | | | 220,000 | | | | 215,437 | |
3.750%, 12/15/20 | | | 325,000 | | | | 324,783 | |
3.950%, 06/15/26 | | | 213,000 | | | | 194,227 | |
Mylan, Inc.
4.550%, 04/15/28 (144A) | | | 240,000 | | | | 223,816 | |
5.200%, 04/15/48 (144A) | | | 125,000 | | | | 103,192 | |
Shire Acquisitions Investments Ireland DAC
2.400%, 09/23/21 | | | 355,000 | | | | 343,264 | |
Teva Pharmaceutical Finance Netherlands III B.V.
2.800%, 07/21/23 | | | 175,000 | | | | 150,709 | |
Valeant Pharmaceuticals International, Inc.
6.500%, 03/15/22 (144A) | | | 65,000 | | | | 65,428 | |
| | | | | | | | |
| | | | | | | 8,787,396 | |
| | | | | | | | |
|
| Pipelines—0.4% | |
Andeavor Logistics L.P. / Tesoro Logistics Finance Corp.
4.250%, 12/01/27 | | | 415,000 | | | | 391,985 | |
6.250%, 10/15/22 | | | 41,000 | | | | 41,820 | |
DCP Midstream Operating L.P.
3.875%, 03/15/23 | | | 20,000 | | | | 18,750 | |
4.950%, 04/01/22 | | | 26,000 | | | | 25,740 | |
5.600%, 04/01/44 | | | 50,000 | | | | 43,250 | |
|
| Pipelines—(Continued) | |
Energy Transfer L.P.
5.500%, 06/01/27 | | | 120,000 | | | | 117,000 | |
Energy Transfer Operating L.P.
4.200%, 09/15/23 | | | 70,000 | | | | 68,984 | |
Energy Transfer Partners L.P.
5.950%, 10/01/43 | | | 20,000 | | | | 19,036 | |
EQT Midstream Partners L.P.
4.750%, 07/15/23 | | | 215,000 | | | | 213,993 | |
5.500%, 07/15/28 | | | 270,000 | | | | 264,589 | |
MPLX L.P.
4.000%, 03/15/28 | | | 180,000 | | | | 168,805 | |
4.125%, 03/01/27 | | | 340,000 | | | | 323,891 | |
4.700%, 04/15/48 | | | 105,000 | | | | 91,098 | |
5.200%, 03/01/47 | | | 65,000 | | | | 59,907 | |
Sabine Pass Liquefaction LLC
4.200%, 03/15/28 | | | 50,000 | | | | 47,854 | |
Sunoco Logistics Partners Operations L.P.
5.300%, 04/01/44 | | | 35,000 | | | | 30,940 | |
5.350%, 05/15/45 | | | 35,000 | | | | 31,015 | |
Texas Eastern Transmission L.P.
2.800%, 10/15/22 (144A) | | | 420,000 | | | | 403,870 | |
3.500%, 01/15/28 (144A) | | | 100,000 | | | | 94,469 | |
TransCanada PipeLines, Ltd.
4.750%, 05/15/38 | | | 140,000 | | | | 135,087 | |
6.100%, 06/01/40 | | | 40,000 | | | | 44,392 | |
Transcontinental Gas Pipe Line Co. LLC
4.000%, 03/15/28 | | | 105,000 | | | | 102,734 | |
Valero Energy Partners L.P.
4.500%, 03/15/28 | | | 455,000 | | | | 445,778 | |
Western Gas Partners L.P.
4.500%, 03/01/28 | | | 485,000 | | | | 453,602 | |
4.750%, 08/15/28 | | | 290,000 | | | | 276,219 | |
5.500%, 08/15/48 | | | 25,000 | | | | 22,283 | |
Williams Partners L.P.
4.300%, 03/04/24 | | | 105,000 | | | | 104,627 | |
| | | | | | | | |
| | | | | | | 4,041,718 | |
| | | | | | | | |
|
| Real Estate Investment Trusts—0.1% | |
Crown Castle International Corp.
3.150%, 07/15/23 | | | 315,000 | | | | 302,786 | |
3.200%, 09/01/24 | | | 110,000 | | | | 104,109 | |
Equinix, Inc.
5.875%, 01/15/26 | | | 135,000 | | | | 136,012 | |
GLP Capital L.P. / GLP Financing II, Inc.
5.300%, 01/15/29 | | | 290,000 | | | | 283,629 | |
5.375%, 04/15/26 | | | 60,000 | | | | 59,341 | |
| | | | | | | | |
| | | | | | | 885,877 | |
| | | | | | | | |
|
| Retail—0.2% | |
Dollar Tree, Inc.
3.149%, 3M LIBOR + 0.700%, 04/17/20 (g) | | | 90,000 | | | | 89,426 | |
Home Depot, Inc. (The)
3.500%, 09/15/56 | | | 220,000 | | | | 185,299 | |
Lowe’s Cos., Inc.
3.700%, 04/15/46 | | | 60,000 | | | | 49,001 | |
See accompanying notes to financial statements.
BHFTII-17
Brighthouse Funds Trust II
Brighthouse/Wellington Balanced Portfolio
Schedule of Investments as of December 31, 2018
Corporate Bonds & Notes—(Continued)
| | | | | | | | |
| Security Description | | Principal
Amount* | | | Value | |
|
| Retail—(Continued) | |
McDonald’s Corp.
3.350%, 04/01/23 | | | 380,000 | | | $ | 378,056 | |
Starbucks Corp.
3.800%, 08/15/25 | | | 265,000 | | | | 262,182 | |
4.000%, 11/15/28 | | | 160,000 | | | | 158,130 | |
Suburban Propane Partners L.P. / Suburban Energy Finance Corp.
5.875%, 03/01/27 | | | 75,000 | | | | 66,375 | |
Walmart, Inc.
3.400%, 06/26/23 | | | 925,000 | | | | 934,475 | |
| | | | | | | | |
| | | | | | | 2,122,944 | |
| | | | | | | | |
|
| Semiconductors—0.4% | |
Broadcom Corp. / Broadcom Cayman Finance, Ltd.
2.375%, 01/15/20 | | | 500,000 | | | | 493,701 | |
3.125%, 01/15/25 | | | 155,000 | | | | 139,987 | |
3.625%, 01/15/24 | | | 1,285,000 | | | | 1,215,657 | |
3.875%, 01/15/27 | | | 450,000 | | | | 403,963 | |
Entegris, Inc.
4.625%, 02/10/26 (144A) | | | 25,000 | | | | 23,000 | |
Intel Corp.
4.100%, 05/19/46 | | | 185,000 | | | | 181,409 | |
Microchip Technology, Inc.
4.333%, 06/01/23 (144A) | | | 380,000 | | | | 370,636 | |
NXP B.V. / NXP Funding LLC
4.875%, 03/01/24 (144A) | | | 1,175,000 | | | | 1,180,158 | |
| | | | | | | | |
| | | | | | | 4,008,511 | |
| | | | | | | | |
|
| Software—0.2% | |
CDK Global, Inc.
5.875%, 06/15/26 | | | 5,000 | | | | 5,020 | |
Fidelity National Information Services, Inc.
4.250%, 05/15/28 | | | 195,000 | | | | 193,832 | |
First Data Corp.
5.000%, 01/15/24 (144A) | | | 40,000 | | | | 38,500 | |
5.375%, 08/15/23 (144A) | | | 90,000 | | | | 88,425 | |
Microsoft Corp.
3.700%, 08/08/46 | | | 330,000 | | | | 317,686 | |
3.950%, 08/08/56 | | | 400,000 | | | | 390,937 | |
MSCI, Inc.
5.250%, 11/15/24 (144A) | | | 75,000 | | | | 74,625 | |
5.750%, 08/15/25 (144A) | | | 65,000 | | | | 65,488 | |
Open Text Corp.
5.875%, 06/01/26 (144A) | | | 15,000 | | | | 14,700 | |
Oracle Corp.
4.000%, 11/15/47 | | | 195,000 | | | | 181,727 | |
Quintiles IMS, Inc.
4.875%, 05/15/23 (144A) | | | 95,000 | | | | 93,100 | |
salesforce.com, Inc.
3.250%, 04/11/23 | | | 250,000 | | | | 251,270 | |
3.700%, 04/11/28 | | | 170,000 | | | | 171,000 | |
| | | | | | | | |
| | | | | | | 1,886,310 | |
| | | | | | | | |
|
| Telecommunications—0.7% | |
AT&T, Inc.
3.086%, 3M LIBOR + 0.650%, 01/15/20 (g) | | | 155,000 | | | | 154,730 | |
4.100%, 02/15/28 | | | 260,000 | | | | 250,108 | |
4.250%, 03/01/27 (b) | | | 150,000 | | | | 146,920 | |
4.300%, 02/15/30 | | | 711,000 | | | | 672,341 | |
4.750%, 05/15/46 | | | 390,000 | | | | 347,108 | |
5.150%, 03/15/42 | | | 164,000 | | | | 153,372 | |
Nokia Oyj
4.375%, 06/12/27 | | | 260,000 | | | | 241,800 | |
6.625%, 05/15/39 | | | 110,000 | | | | 111,650 | |
Sprint Communications, Inc.
7.000%, 03/01/20 (144A) | | | 90,000 | | | | 92,250 | |
Sprint Corp.
7.125%, 06/15/24 | | | 100,000 | | | | 99,106 | |
Sprint Spectrum Co. LLC / Sprint Spectrum Co. II LLC / Sprint Spectrum Co. III LLC
5.152%, 03/20/28 (144A) | | | 530,000 | | | | 520,725 | |
Telecom Italia Capital S.A.
6.000%, 09/30/34 | | | 45,000 | | | | 38,925 | |
7.721%, 06/04/38 | | | 50,000 | | | | 49,656 | |
Telecom Italia S.p.A.
5.303%, 05/30/24 (144A) | | | 925,000 | | | | 878,750 | |
Telefonica Emisiones S.A.U.
4.665%, 03/06/38 | | | 150,000 | | | | 135,835 | |
4.895%, 03/06/48 | | | 335,000 | | | | 296,058 | |
5.213%, 03/08/47 | | | 150,000 | | | | 137,481 | |
Verizon Communications, Inc.
3.203%, 3M LIBOR + 0.550%, 05/22/20 (g) | | | 155,000 | | | | 154,662 | |
4.400%, 11/01/34 | | | 535,000 | | | | 516,140 | |
4.500%, 08/10/33 | | | 775,000 | | | | 765,626 | |
4.522%, 09/15/48 | | | 365,000 | | | | 342,422 | |
4.862%, 08/21/46 | | | 90,000 | | | | 88,567 | |
5.012%, 08/21/54 | | | 213,000 | | | | 206,113 | |
5.250%, 03/16/37 | | | 425,000 | | | | 443,171 | |
Vodafone Group plc
4.375%, 05/30/28 (b) | | | 815,000 | | | | 791,076 | |
| | | | | | | | |
| | | | | | | 7,634,592 | |
| | | | | | | | |
|
| Transportation—0.1% | |
CSX Corp.
3.250%, 06/01/27 | | | 620,000 | | | | 583,537 | |
FedEx Corp.
4.550%, 04/01/46 | | | 30,000 | | | | 27,302 | |
4.750%, 11/15/45 | | | 125,000 | | | | 118,008 | |
Union Pacific Corp.
4.375%, 09/10/38 | | | 700,000 | | | | 692,772 | |
| | | | | | | | |
| | | | | | | 1,421,619 | |
| | | | | | | | |
|
| Trucking & Leasing—0.0% | |
DAE Funding LLC
4.500%, 08/01/22 (144A) | | | 15,000 | | | | 14,400 | |
5.000%, 08/01/24 (144A) | | | 15,000 | | | | 14,513 | |
| | | | | | | | |
| | | | | | | 28,913 | |
| | | | | | | | |
Total Corporate Bonds & Notes
(Cost $143,209,307) | | | | | | | 136,372,508 | |
| | | | | | | | |
See accompanying notes to financial statements.
BHFTII-18
Brighthouse Funds Trust II
Brighthouse/Wellington Balanced Portfolio
Schedule of Investments as of December 31, 2018
Asset-Backed Securities—8.7%
| | | | | | | | |
| Security Description | | Principal
Amount* | | | Value | |
|
| Asset-Backed - Automobile—0.2% | |
CIG Auto Receivables Trust
2.710%, 05/15/23 (144A) | | | 156,815 | | | $ | 155,863 | |
Credit Acceptance Auto Loan Trust
2.650%, 06/15/26 (144A) | | | 545,000 | | | | 539,981 | |
Skopos Auto Receivables Trust
3.190%, 09/15/21 (144A) (o) | | | 516,415 | | | | 515,986 | |
Westlake Automobile Receivables Trust
3.280%, 12/15/22 (144A) | | | 1,015,000 | | | | 1,002,176 | |
| | | | | | | | |
| | | | | | | 2,214,006 | |
| | | | | | | | |
|
| Asset-Backed - Home Equity—0.2% | |
GSAA Home Equity Trust
2.556%, 1M LIBOR + 0.050%, 12/25/46 (c) (g) | | | 87,006 | | | | 58,294 | |
2.606%, 1M LIBOR + 0.100%, 03/25/37 (c) (g) | | | 911,989 | | | | 435,135 | |
2.746%, 1M LIBOR + 0.240%, 11/25/36 (c) (g) | | | 264,060 | | | | 148,197 | |
2.806%, 1M LIBOR + 0.300%, 03/25/36 (c) (g) | | | 951,667 | | | | 680,481 | |
5.985%, 06/25/36 (c) (g) | | | 552,682 | | | | 253,553 | |
Morgan Stanley ABS Capital I, Inc. Trust
2.656%, 1M LIBOR + 0.150%, 06/25/36 (c) (g) | | | 14,139 | | | | 11,769 | |
Renaissance Home Equity Loan Trust
6.120%, 11/25/36 (c) (p) | | | 250,014 | | | | 146,357 | |
Soundview Home Loan Trust
2.756%, 1M LIBOR + 0.250%, 11/25/36 (c) (g) | | | 485,000 | | | | 442,389 | |
| | | | | | | | |
| | | | | | | 2,176,175 | |
| | | | | | | | |
|
| Asset-Backed - Other—8.3% | |
AMMC CLO, Ltd.
3.740%, 3M LIBOR + 1.250%, 07/25/29 (144A) (g) | | | 1,340,000 | | | | 1,336,102 | |
Anchorage Capital CLO, Ltd.
3.946%, 3M LIBOR + 1.510%, 01/15/29 (144A) (g) | | | 760,744 | | | | 760,733 | |
Apex Credit CLO, Ltd.
3.957%, 3M LIBOR + 1.470%, 04/24/29 (144A) (g) | | | 1,315,000 | | | | 1,314,537 | |
Apidos CLO
3.430%, 3M LIBOR + 0.980%, 01/19/25 (144A) (g) | | | 334,534 | | | | 334,362 | |
Atlas Senior Loan Fund, Ltd.
3.339%, 3M LIBOR + 0.870%, 04/20/28 (144A) (g) | | | 1,375,000 | | | | 1,352,358 | |
3.526%, 3M LIBOR + 1.090%, 01/15/31 (144A) (g) | | | 705,000 | | | | 693,965 | |
Avant Loans Funding Trust
3.420%, 01/18/22 (144A) (o) | | | 1,182,108 | | | | 1,180,395 | |
Avery Point CLO, Ltd.
3.565%, 3M LIBOR + 1.120%, 01/18/25 (144A) (g) | | | 553,660 | | | | 552,927 | |
3.590%, 3M LIBOR + 1.100%, 04/25/26 (144A) (g) | | | 1,012,861 | | | | 1,011,177 | |
Babson CLO, Ltd.
3.619%, 3M LIBOR + 1.150%, 07/20/25 (144A) (g) | | | 254,851 | | | | 254,288 | |
Bain Capital Credit CLO, Ltd.
3.719%, 3M LIBOR + 1.250%, 07/20/30 (144A) (g) | | | 815,000 | | | | 814,412 | |
Bayview Opportunity Master Fund Trust
3.352%, 11/28/32 (144A) (p) | | | 219,590 | | | | 218,640 | |
3.500%, 01/28/55 (144A) (g) | | | 597,214 | | | | 591,871 | |
3.500%, 06/28/57 (144A) (g) | | | 705,181 | | | | 698,763 | |
3.500%, 07/28/57 (144A) (g) | | | 1,359,211 | | | | 1,347,042 | |
3.500%, 10/28/57 (144A) (g) | | | 1,306,177 | | | | 1,294,892 | |
3.500%, 01/28/58 (144A) (g) | | | 922,805 | | | | 913,423 | |
3.598%, 02/25/33 (144A) (p) | | | 270,523 | | | | 268,432 | |
4.000%, 11/28/53 (144A) (g) | | | 529,794 | | | | 531,501 | |
4.000%, 10/28/64 (144A) (g) | | | 1,010,980 | | | | 1,013,984 | |
|
| Asset-Backed - Other—(Continued) | |
Benefit Street Partners CLO, Ltd.
3.245%, 3M LIBOR + 0.800%, 10/18/29 (144A) (g) | | | 125,000 | | | | 124,937 | |
3.686%, 3M LIBOR + 1.250%, 07/15/29 (144A) (g) | | | 320,000 | | | | 318,034 | |
Carlyle Global Market Strategies CLO, Ltd.
3.289%, 3M LIBOR + 0.780%, 04/27/27 (144A) (g) | | | 1,425,000 | | | | 1,417,061 | |
3.436%, 3M LIBOR + 1.000%, 01/15/31 (144A) (g) | | | 1,395,000 | | | | 1,373,610 | |
CBAM, Ltd.
3.679%, 3M LIBOR + 1.230%, 10/17/29 (144A) (g) | | | 1,665,000 | | | | 1,658,109 | |
Cent CLO, Ltd.
3.659%, 3M LIBOR + 1.150%, 07/27/30 (144A) (g) | | | 930,000 | | | | 919,006 | |
CIFC Funding, Ltd.
3.286%, 3M LIBOR + 0.850%, 07/16/30 (144A) (g) | | | 220,293 | | | | 220,461 | |
3.537%, 3M LIBOR + 1.050%, 04/24/30 (144A) (g) | | | 1,580,000 | | | | 1,555,210 | |
Cirrus Funding, Ltd.
4.800%, 01/25/37 (144A) | | | 940,000 | | | | 955,772 | |
CLUB Credit Trust
2.610%, 01/15/24 (144A) (o) | | | 468,076 | | | | 465,308 | |
Covenant Credit Partners CLO, Ltd.
4.286%, 3M LIBOR + 1.850%, 10/15/29 (144A) (g) | | | 445,000 | | | | 439,049 | |
Domino’s Pizza Master Issuer LLC
4.116%, 07/25/48 (144A) (o) | | | 696,500 | | | | 687,146 | |
Dryden Senior Loan Fund
3.236%, 3M LIBOR + 0.800%, 07/15/30 (144A) (g) | | | 479,500 | | | | 479,260 | |
3.336%, 3M LIBOR + 0.900%, 04/15/29 (144A) (g) | | | 1,470,000 | | | | 1,451,660 | |
3.434%, 11/15/28 (144A) (g) | | | 745,000 | | | | 733,773 | |
3.659%, 3M LIBOR + 1.210%, 07/18/30 (144A) (g) | | | 1,280,000 | | | | 1,274,095 | |
3.866%, 3M LIBOR + 1.430%, 10/15/28 (144A) (g) | | | 1,604,000 | | | | 1,603,998 | |
Finance America Mortgage Loan Trust
3.556%, 1M LIBOR + 1.050%, 09/25/33 (c) (g) | | | 70,053 | | | | 68,375 | |
Flatiron CLO, Ltd.
3.866%, 3M LIBOR + 1.250%, 05/15/30 (144A) (g) | | | 810,000 | | | | 804,588 | |
Fremont Home Loan Trust
3.556%, 1M LIBOR + 1.050%, 12/25/33 (c) (g) | | | 66,807 | | | | 65,462 | |
GMACM Home Equity Loan Trust
3.006%, 1M LIBOR + 0.500%, 10/25/34 (144A) (g) | | | 38,835 | | | | 38,644 | |
Highbridge Loan Management, Ltd.
3.582%, 3M LIBOR + 1.000%, 02/05/31 (144A) (g) | | | 415,000 | | | | 406,778 | |
KKR CLO, Ltd.
3.776%, 3M LIBOR + 1.340%, 04/15/29 (144A) (g) | | | 1,260,000 | | | | 1,254,955 | |
KKR Financial CLO, Ltd.
3.726%, 3M LIBOR + 1.290%, 04/15/29 (144A) (g) | | | 565,000 | | | | 560,762 | |
Knollwood CDO, Ltd.
4.355%, 3M LIBOR + 3.200%, 01/10/39 (144A) (d) (e) (g) | | | 660,004 | | | | 0 | |
LCM, Ltd.
3.379%, 3M LIBOR + 0.870%, 10/20/27 (144A) (g) | | | 1,075,000 | | | | 1,066,066 | |
Legacy Mortgage Asset Trust
4.000%, 03/25/58 (144A) (p) | | | 1,625,559 | | | | 1,620,068 | |
Lendmark Funding Trust
2.830%, 12/22/25 (144A) (o) | | | 680,000 | | | | 670,933 | |
Madison Park Funding, Ltd. | | | | | | | | |
3.637%, 3M LIBOR + 1.040%, 07/23/29 (144A) (g) | | | 1,341,000 | | | | 1,334,688 | |
3.729%, 3M LIBOR + 1.260%, 07/20/26 (144A) (g) | | | 1,267,554 | | | | 1,266,762 | |
Magnetite XVIII, Ltd.
3.696%, 3M LIBOR + 1.080%, 11/15/28 (144A) (g) | | | 1,323,000 | | | | 1,317,140 | |
See accompanying notes to financial statements.
BHFTII-19
Brighthouse Funds Trust II
Brighthouse/Wellington Balanced Portfolio
Schedule of Investments as of December 31, 2018
Asset-Backed Securities—(Continued)
| | | | | | | | |
| Security Description | | Principal
Amount* | | | Value | |
|
| Asset-Backed - Other—(Continued) | |
Magnetite, Ltd.
3.416%, 04/15/31 (144A) (g) | | | 795,000 | | | $ | 784,226 | |
3.490%, 3M LIBOR + 1.000%, 07/25/26 (144A) (g) | | | 1,156,409 | | | | 1,155,301 | |
3.990%, 3M LIBOR + 1.500%, 07/25/26 (144A) (g) | | | 995,000 | | | | 988,869 | |
Marlette Funding Trust
2.360%, 12/15/24 (144A) (o) | | | 192,458 | | | | 191,882 | |
MFRA Trust
3.352%, 11/25/47 (144A) (p) | | | 1,491,791 | | | | 1,486,050 | |
Mill City Mortgage Loan Trust
3.500%, 08/25/58 (144A) (g) | | | 1,019,617 | | | | 1,011,138 | |
Nationstar HECM Loan Trust
2.038%, 09/25/27 (144A) (g) | | | 169,085 | | | | 168,557 | |
Neuberger Berman CLO, Ltd.
3.236%, 3M LIBOR + 0.800%, 01/15/28 (144A) (g) | | | 1,480,000 | | | | 1,462,061 | |
New Residential Advance Receivables Trust
2.575%, 10/15/49 (144A) | | | 624,500 | | | | 620,616 | |
3.214%, 02/15/51 (144A) | | | 1,065,000 | | | | 1,062,784 | |
New Residential Mortgage LLC
3.790%, 07/25/54 (144A) | | | 1,477,364 | | | | 1,489,471 | |
NRZ Advance Receivables Trust
3.107%, 12/15/50 (144A) | | | 1,195,000 | | | | 1,186,385 | |
NRZ Excess Spread-Collateralized Notes
3.193%, 01/25/23 (144A) | | | 956,669 | | | | 950,468 | |
3.265%, 02/25/23 (144A) | | | 595,254 | | | | 594,258 | |
Oak Hill Advisors Residential Loan Trust
3.000%, 06/25/57 (144A) (p) | | | 425,177 | | | | 416,584 | |
OCP CLO, Ltd.
3.299%, 3M LIBOR + 0.850%, 04/17/27 (144A) (g) | | | 1,230,000 | | | | 1,217,653 | |
Octagon Investment Partners, Ltd.
3.546%, 3M LIBOR + 0.900%, 05/21/27 (144A) (g) | | | 489,000 | | | | 485,568 | |
3.789%, 3M LIBOR + 1.320%, 03/17/30 (144A) (g) | | | 725,000 | | | | 725,266 | |
OHA Loan Funding, Ltd.
3.717%, 3M LIBOR + 1.040%, 05/23/31 (144A) (g) | | | 695,000 | | | | 680,300 | |
OneMain Financial Issuance Trust
2.370%, 09/14/32 (144A) | | | 1,648,000 | | | | 1,622,491 | |
4.100%, 03/20/28 (144A) | | | 472,806 | | | | 473,918 | |
OZLM Funding, Ltd.
3.369%, 3M LIBOR + 0.900%, 07/22/29 (144A) (g) | | | 93,750 | | | | 93,791 | |
3.719%, 3M LIBOR + 1.250%, 10/22/30 (144A) (g) | | | 1,205,000 | | | | 1,195,956 | |
OZLM, Ltd.
3.459%, 3M LIBOR + 1.010%, 07/17/29 (144A) (g) | | | 335,000 | | | | 329,887 | |
3.570%, 3M LIBOR + 1.050%, 04/30/27 (144A) (g) | | | 1,360,000 | | | | 1,348,885 | |
Palmer Square Loan Funding, Ltd.
3.700%, 3M LIBOR + 1.450%, 11/15/26 (144A) (g) | | | 735,000 | | | | 730,043 | |
Pretium Mortgage Credit Partners LLC
3.327%, 12/30/32 (144A) (g) | | | 166,944 | | | | 164,939 | |
3.375%, 01/27/33 (144A) (p) | | | 240,113 | | | | 237,904 | |
Prosper Marketplace Issuance Trust
2.360%, 11/15/23 (144A) | | | 148,788 | | | | 148,388 | |
PRPM LLC
4.000%, 08/25/23 (144A) (g) | | | 984,012 | | | | 979,303 | |
Regional Management Issuance Trust
3.830%, 07/15/27 (144A) (o) | | | 950,000 | | | | 953,568 | |
SBA Tower Trust
2.898%, 10/15/44 (144A) (p) | | | 845,000 | | | | 840,033 | |
|
| Asset-Backed - Other—(Continued) | |
Seneca Park CLO, Ltd.
3.569%, 3M LIBOR + 1.120%, 07/17/26 (144A) (g) | | | 962,280 | | | | 961,821 | |
Shackleton CLO, Ltd.
3.356%, 3M LIBOR + 1.020%, 07/17/28 (144A) (g) | | | 1,100,000 | | | | 1,087,036 | |
SoFi Consumer Loan Program LLC
2.500%, 05/26/26 (144A) | | | 289,780 | | | | 286,430 | |
2.770%, 05/25/26 (144A) | | | 147,981 | | | | 146,667 | |
3.090%, 10/27/25 (144A) (o) | | | 256,235 | | | | 255,700 | |
3.280%, 01/26/26 (144A) (o) | | | 238,394 | | | | 238,276 | |
Sound Point CLO, Ltd.
3.359%, 3M LIBOR + 1.890%, 01/20/28 (144A) (g) | | | 1,440,000 | | | | 1,422,596 | |
3.436%, 3M LIBOR + 1.000%, 04/15/31 (144A) (g) | | | 1,435,000 | | | | 1,404,806 | |
3.595%, 3M LIBOR + 1.150%, 04/18/31 (144A) (g) | | | 1,125,000 | | | | 1,107,618 | |
3.867%, 3M LIBOR + 1.390%, 01/23/29 (144A) (g) | | | 505,000 | | | | 504,554 | |
Springleaf Funding Trust
2.680%, 07/15/30 (144A) | | | 1,705,000 | | | | 1,675,648 | |
2.900%, 11/15/29 (144A) | | | 1,196,485 | | | | 1,189,541 | |
SPS Servicer Advance Receivables Trust
2.750%, 11/15/49 (144A) | | | 1,020,000 | | | | 1,018,119 | |
3.620%, 10/17/50 (144A) | | | 315,000 | | | | 316,295 | |
Symphony CLO, Ltd.
3.716%, 3M LIBOR + 1.280%, 07/14/26 (144A) (g) | | | 1,258,168 | | | | 1,258,915 | |
Towd Point Mortgage Trust
2.750%, 02/25/55 (144A) (g) | | | 157,302 | | | | 155,131 | |
2.750%, 08/25/55 (144A) (g) | | | 594,998 | | | | 582,962 | |
2.750%, 04/25/57 (144A) (g) | | | 431,427 | | | | 421,894 | |
2.750%, 06/25/57 (144A) (g) | | | 1,186,203 | | | | 1,153,845 | |
2.915%, 3M LIBOR + 0.600%, 02/25/57 (144A) (g) | | | 1,110,466 | | | | 1,104,403 | |
3.000%, 03/25/54 (144A) (g) | | | 36,894 | | | | 36,500 | |
Treman Park CLO, Ltd.
3.535%, 3M LIBOR + 1.070%, 10/20/28 (144A) (g) | | | 1,300,000 | | | | 1,295,284 | |
Vericrest Opportunity Loan Trust LLC
3.125%, 09/25/47 (144A) (p) | | | 267,296 | | | | 264,831 | |
3.250%, 06/25/47 (144A) (o) (p) | | | 256,362 | | | | 255,118 | |
3.375%, 10/25/47 (144A) (p) | | | 1,119,719 | | | | 1,108,310 | |
4.115%, 09/25/48 (144A) (p) | | | 788,862 | | | | 787,840 | |
4.336%, 05/25/48 (144A) (p) | | | 696,653 | | | | 695,895 | |
Vibrant CLO, Ltd.
4.032%, 3M LIBOR + 1.240%, 06/20/29 (144A) (g) | | | 1,515,000 | | | | 1,504,657 | |
VOLT LXXI LLC
3.967%, 09/25/48 (144A) (p) | | | 573,162 | | | | 570,044 | |
Voya CLO, Ltd.
3.345%, 3M LIBOR + 1.090%, 01/18/29 (144A) (g) | | | 1,610,000 | | | | 1,589,191 | |
3.695%, 3M LIBOR + 1.250%, 01/18/29 (144A) (g) | | | 440,000 | | | | 421,578 | |
Wendys Funding LLC
3.884%, 03/15/48 (144A) (o) | | | 430,650 | | | | 405,780 | |
Wingstop Funding LLC
4.970%, 12/05/48 (144A) (o) | | | 405,000 | | | | 414,173 | |
| | | | | | | | |
| | | | | | | 94,073,515 | |
| | | | | | | | |
Total Asset-Backed Securities
(Cost $100,068,625) | | | | | | | 98,463,696 | |
| | | | | | | | |
See accompanying notes to financial statements.
BHFTII-20
Brighthouse Funds Trust II
Brighthouse/Wellington Balanced Portfolio
Schedule of Investments as of December 31, 2018
Mortgage-Backed Securities—4.6%
| | | | | | | | |
| Security Description | | Principal
Amount* | | | Value | |
|
| Collateralized Mortgage Obligations—2.7% | |
Adjustable Rate Mortgage Trust
3.006%, 1M LIBOR + 0.500%, 01/25/36 (g) | | | 163,586 | | | $ | 155,143 | |
3.046%, 1M LIBOR + 0.540%, 11/25/35 (g) | | | 163,202 | | | | 160,845 | |
| Angel Oak Mortgage Trust LLC | | | | | | |
2.478%, 07/25/47 (144A) (g) | | | 394,583 | | | | 388,607 | |
2.708%, 11/25/47 (144A) (g) | | | 317,083 | | | | 314,527 | |
2.810%, 01/25/47 (144A) (g) | | | 76,008 | | | | 75,552 | |
Bear Stearns Adjustable Rate Mortgage Trust
4.035%, 07/25/36 (g) | | | 351,300 | | | | 316,140 | |
Bear StearnsALT-A Trust
2.986%, 1M LIBOR + 0.480%, 02/25/36 (g) | | | 662,201 | | | | 624,111 | |
Bear Stearns Mortgage Funding Trust
2.686%, 1M LIBOR + 0.180%, 10/25/36 (g) | | | 194,155 | | | | 177,772 | |
2.706%, 1M LIBOR + 0.200%, 02/25/37 (g) | | | 607,538 | | | | 623,062 | |
CIM Trust
3.000%, 04/25/57 (144A) (g) | | | 1,288,078 | | | | 1,277,875 | |
Civic Mortgage LLC
3.892%, 06/25/22 (144A) (p) | | | 282,416 | | | | 282,040 | |
COLT Mortgage Loan Trust
2.415%, 10/25/47 (144A) (g) | | | 748,721 | | | | 743,882 | |
2.614%, 05/27/47 (144A) (g) | | | 291,590 | | | | 289,760 | |
2.800%, 12/26/46 (144A) (g) | | | 145,365 | | | | 144,187 | |
2.930%, 02/25/48 (144A) (g) | | | 402,587 | | | | 397,948 | |
Countrywide Alternative Loan Trust
2.956%, 1M LIBOR + 0.450%, 04/25/35 (g) | | | 248,755 | | | | 232,972 | |
3.046%, 1M LIBOR + 0.540%, 01/25/36 (g) | | | 130,539 | | | | 123,791 | |
3.306%, 1M LIBOR + 0.800%, 12/25/35 (g) | | | 171,551 | | | | 148,494 | |
3.507%, 12M MTA + 1.350%, 08/25/35 (g) | | | 310,598 | | | | 285,538 | |
5.500%, 11/25/35 | | | 658,778 | | | | 557,497 | |
Countrywide Home Loan Mortgage Pass-Through Trust
2.706%, 1M LIBOR + 0.200%, 04/25/46 (g) | | | 309,484 | | | | 263,930 | |
3.186%, 1M LIBOR + 0.680%, 02/25/35 (g) | | | 131,209 | | | | 128,523 | |
3.790%, 06/20/35 (g) | | | 18,232 | | | | 18,284 | |
4.058%, 09/25/47 (g) | | | 438,996 | | | | 407,189 | |
Credit Suisse Mortgage Capital Certificates Trust
3.250%, 04/25/47 (144A) (g) | | | 536,723 | | | | 523,809 | |
Deephaven Residential Mortgage Trust
2.453%, 06/25/47 (144A) (g) | | | 290,613 | | | | 285,820 | |
2.577%, 10/25/47 (144A) (g) | | | 334,783 | | | | 330,511 | |
2.725%, 12/26/46 (144A) (g) | | | 147,867 | | | | 146,404 | |
3.789%, 08/25/58 (144A) (g) | | | 1,447,634 | | | | 1,450,443 | |
DeutscheALT-A Securities Mortgage Loan Trust
2.656%, 1M LIBOR + 0.150%, 12/25/36 (g) | | | 374,903 | | | | 335,508 | |
Galton Funding Mortgage Trust
3.500%, 11/25/57 (144A) (g) | | | 407,559 | | | | 406,249 | |
GreenPoint Mortgage Funding Trust
3.557%, 12M MTA + 1.400%, 10/25/45 (g) | | | 231,307 | | | | 198,489 | |
| GSR Mortgage Loan Trust | | | | | | |
2.806%, 1M LIBOR + 0.300%, 01/25/37 (g) | | | 735,527 | | | | 408,214 | |
4.354%, 01/25/36 (g) | | | 480,738 | | | | 476,643 | |
6.000%, 07/25/37 | | | 264,645 | | | | 232,350 | |
Home Re, Ltd.
4.106%, 3M LIBOR + 1.600%, 10/25/28 (144A) (g) | | | 690,000 | | | | 690,841 | |
IndyMac INDX Mortgage Loan Trust
4.077%, 10/25/35 (g) | | | 41,807 | | | | 39,530 | |
JPMorgan Mortgage Trust
3.789%, 05/25/36 (g) | | | 33,309 | | | | 32,118 | |
|
| Collateralized Mortgage Obligations—(Continued) | |
| LSTAR Securities Investment, Ltd. | | | | | | |
3.849%, 1M LIBOR + 1.550%, 04/01/21 (144A) (g) | | | 240,007 | | | | 234,925 | |
3.999%, 1M LIBOR + 1.650%, 11/01/22 (144A) (g) | | | 330,209 | | | | 330,781 | |
4.099%, 1M LIBOR + 1.750%, 09/01/22 (144A) (g) | | | 285,391 | | | | 285,302 | |
4.099%, 1M LIBOR + 1.750%, 10/01/22 (144A) (g) | | | 457,431 | | | | 455,770 | |
MASTR Adjustable Rate Mortgages Trust
3.897%, 09/25/33 (g) | | | 85,634 | | | | 84,420 | |
4.438%, 11/21/34 (g) | | | 108,069 | | | | 110,621 | |
Metlife Securitization Trust
3.750%, 03/25/57 (144A) (g) | | | 867,929 | | | | 875,500 | |
MFA Trust
2.588%, 02/25/57 (144A) (g) | | | 311,658 | | | | 306,497 | |
Morgan Stanley Mortgage Loan Trust
4.001%, 05/25/36 (g) | | | 214,854 | | | | 159,869 | |
New Residential Mortgage Loan Trust
3.256%, 1M LIBOR + 0.750%, 01/25/48 (144A) (g) | | | 1,568,104 | | | | 1,559,852 | |
3.750%, 11/26/35 (144A) (g) | | | 889,330 | | | | 889,736 | |
4.000%, 02/25/57 (144A) (g) | | | 1,562,124 | | | | 1,571,268 | |
4.000%, 03/25/57 (144A) (g) | | | 1,590,648 | | | | 1,604,668 | |
4.000%, 04/25/57 (144A) (g) | | | 1,301,588 | | | | 1,308,980 | |
4.000%, 05/25/57 (144A) (g) | | | 1,050,688 | | | | 1,059,626 | |
Residential Accredit Loans, Inc. Trust
2.806%, 1M LIBOR + 0.300%, 04/25/36 (g) | | | 573,965 | | | | 524,337 | |
6.000%, 12/25/35 | | | 256,770 | | | | 244,897 | |
RFMSI Trust
4.133%, 08/25/35 (g) | | | 96,990 | | | | 72,992 | |
Seasoned Credit Risk Transfer Trust
3.500%, 11/25/57 | | | 1,375,652 | | | | 1,359,908 | |
Structured Adjustable Rate Mortgage Loan Trust
0.490%, 1M LIBOR, 09/25/34 (g) | | | 60,125 | | | | 55,533 | |
Verus Securitization Trust
3.677%, 06/01/58 (144A) (g) | | | 1,123,708 | | | | 1,121,731 | |
WaMu Mortgage Pass-Through Certificates Trust
3.037%, 12M MTA + 0.880%, 10/25/46 (g) | | | 246,291 | | | | 229,276 | |
3.591%, 06/25/37 (g) | | | 148,145 | | | | 137,368 | |
Washington Mutual Mortgage Pass-Through Certificates
3.106%, 1M LIBOR + 0.600%, 07/25/36 (g) | | | 111,013 | | | | 75,463 | |
Wells Fargo Mortgage-Backed Securities Trust
4.501%, 10/25/35 (g) | | | 1,541,000 | | | | 1,558,571 | |
4.603%, 09/25/36 (g) | | | 164,765 | | | | 164,571 | |
4.701%, 10/25/36 (g) | | | 170,779 | | | | 167,789 | |
| | | | | | | | |
| | | | | | | 30,244,849 | |
| | | | | | | | |
|
| Commercial Mortgage-Backed Securities—1.9% | |
BANK
0.749%, 11/15/50 (g) (h) | | | 8,293,189 | | | | 435,974 | |
0.820%, 11/15/54 (g) (h) | | | 994,524 | | | | 55,586 | |
Benchmark Mortgage Trust
0.528%, 01/15/51 (g) (h) | | | 2,489,830 | | | | 91,805 | |
0.544%, 07/15/51 (g) (h) | | | 4,467,299 | | | | 165,923 | |
Citigroup Commercial Mortgage Trust
1.016%, 07/10/47 (g) (h) | | 4,075,942 | | | 175,089 | |
1.107%, 04/10/48 (g) (h) | | | 4,854,479 | | | | 237,838 | |
3.458%, 08/15/50 | | | 675,000 | | | | 662,519 | |
See accompanying notes to financial statements.
BHFTII-21
Brighthouse Funds Trust II
Brighthouse/Wellington Balanced Portfolio
Schedule of Investments as of December 31, 2018
Mortgage-Backed Securities—(Continued)
| | | | | | | | |
| Security Description | | Principal
Amount* | | | Value | |
|
| Commercial Mortgage-Backed Securities—(Continued) | |
Commercial Mortgage Pass-Through Certificates Mortgage Trust
0.653%, 02/10/47 (g) (h) | | | 2,887,988 | | | $ | 75,778 | |
0.684%, 08/10/46 (g) (h) | | | 898,646 | | | | 24,546 | |
1.785%, 10/15/45 (g) (h) | | | 394,806 | | | | 19,605 | |
2.540%, 12/10/45 | | | 250,000 | | | | 244,120 | |
2.853%, 10/15/45 | | | 180,000 | | | | 176,813 | |
3.101%, 03/10/46 | | | 145,000 | | | | 144,121 | |
3.213%, 03/10/46 | | | 263,809 | | | | 263,413 | |
3.424%, 03/10/31 (144A) | | | 1,065,000 | | | | 1,081,822 | |
3.612%, 06/10/46 (g) | | | 260,000 | | | | 263,260 | |
3.620%, 07/10/50 | | | 130,000 | | | | 130,752 | |
3.694%, 08/10/47 | | | 395,000 | | | | 400,584 | |
3.796%, 08/10/47 | | | 225,000 | | | | 229,487 | |
3.961%, 03/10/47 | | | 235,125 | | | | 241,053 | |
4.074%, 02/10/47 (g) | | | 115,000 | | | | 118,750 | |
4.205%, 08/10/46 | | | 100,035 | | | | 103,934 | |
4.210%, 08/10/46 (g) | | | 175,000 | | | | 181,756 | |
4.236%, 02/10/47 (g) | | | 190,000 | | | | 197,752 | |
4.573%, 10/15/45 (144A) (g) (o) | | | 210,000 | | | | 47,611 | |
4.750%, 10/15/45 (144A) (g) (o) | | | 355,000 | | | | 180,872 | |
Credit Suisse First Boston Mortgage Securities Corp.
4.877%, 04/15/37 | | | 16,377 | | | | 16,096 | |
CSAIL Commercial Mortgage Trust
0.802%, 06/15/57 (g) (h) | | | 12,785,416 | | | | 492,644 | |
1.022%, 11/15/48 (g) (h) | | | 1,136,446 | | | | 52,035 | |
1.795%, 01/15/49 (g) (h) | | | 2,387,939 | | | | 212,258 | |
3.446%, 08/15/48 | | | 80,000 | | | | 79,680 | |
3.544%, 11/15/48 | | | 280,000 | | | | 279,779 | |
GS Mortgage Securities Corp. Trust
2.954%, 11/05/34 (144A) | | | 1,200,000 | | | | 1,188,690 | |
3.633%, 06/05/31 (144A) | | | 130,000 | | | | 129,881 | |
GS Mortgage Securities Trust
0.086%, 07/10/46 (g) (h) | | | 11,200,858 | | | | 42,879 | |
1.338%, 08/10/44 (144A) (g) (h) | | | 995,389 | | | | 26,949 | |
3.629%, 11/10/47 | | | 230,000 | | | | 233,436 | |
3.674%, 04/10/47 (144A) (o) | | | 235,000 | | | | 68,923 | |
4.965%, 04/10/47 (144A) (g) | | | 465,000 | | | | 386,796 | |
JPMBB Commercial Mortgage Securities Trust
0.751%, 09/15/47 (g) (h) | | | 3,932,312 | | | | 108,076 | |
3.363%, 07/15/45 | | | 468,669 | | | | 469,028 | |
JPMorgan Chase Commercial Mortgage Securities Trust
2.733%, 10/15/45 (144A) (g) (o) | | | 400,000 | | | | 228,990 | |
4.370%, 12/15/47 (144A) (g) (o) | | | 130,000 | | | | 106,728 | |
Morgan Stanley Bank of America Merrill Lynch Trust
1.037%, 10/15/48 (g) (h) | | | 870,546 | | | | 46,914 | |
1.101%, 12/15/47 (g) (h) | | | 2,866,928 | | | | 106,043 | |
2.918%, 02/15/46 | | | 130,000 | | | | 128,108 | |
3.134%, 12/15/48 | | | 480,000 | | | | 476,781 | |
3.176%, 08/15/45 | | | 245,000 | | | | 243,830 | |
Morgan Stanley Bank of America Merrill Lynch Trust
3.766%, 11/15/46 | | | 180,000 | | | | 183,186 | |
4.259%, 10/15/46 (g) | | | 115,000 | | | | 119,424 | |
Morgan Stanley Capital Trust
1.449%, 06/15/50 (g) (h) | | | 1,711,718 | | | | 139,622 | |
5.154%, 07/15/49 (144A) (g) (o) | | | 265,000 | | | | 238,705 | |
5.241%, 10/12/52 (144A) (g) | | | 80,000 | | | | 9,668 | |
5.241%, 10/12/52 (144A) (g) (o) | | | 55,000 | | | | 5,147 | |
|
| Commercial Mortgage-Backed Securities—(Continued) | |
SFAVE Commercial Mortgage Securities Trust
3.872%, 01/05/43 (144A) (g) | | | 150,000 | | | | 138,887 | |
UBS Commercial Mortgage Trust
1.149%, 08/15/50 (g) (h) | | | 1,039,156 | | | | 73,594 | |
3.426%, 08/15/50 | | | 225,000 | | | | 220,650 | |
UBS-Barclays Commercial Mortgage Trust
1.513%, 02/15/50 (g) (h) | | | 5,692,422 | | | | 517,925 | |
2.850%, 12/10/45 | | | 325,000 | | | | 321,182 | |
3.091%, 08/10/49 | | | 645,000 | | | | 643,327 | |
3.185%, 03/10/46 | | | 240,000 | | | | 239,832 | |
3.244%, 04/10/46 | | | 300,119 | | | | 300,611 | |
3.305%, 1M LIBOR + 0.850%, 08/15/36 (144A) (g) | | | 1,802,000 | | | | 1,799,318 | |
VNDO Mortgage Trust
2.996%, 11/15/30 (144A) | | | 1,105,000 | | | | 1,094,896 | |
Wells Fargo Commercial Mortgage Trust
1.149%, 09/15/57 (g) (h) | | | 8,296,765 | | | | 377,514 | |
1.155%, 05/15/48 (g) (h) | | | 3,835,355 | | | | 181,480 | |
2.918%, 10/15/45 | | | 317,557 | | | | 314,045 | |
2.942%, 10/15/49 | | | 70,000 | | | | 66,774 | |
3.290%, 05/15/48 | | | 230,000 | | | | 227,361 | |
3.789%, 09/15/48 | | | 315,000 | | | | 318,874 | |
3.839%, 09/15/58 | | | 225,000 | | | | 229,235 | |
4.100%, 05/15/48 (g) | | | 80,000 | | | | 70,352 | |
WF-RBS Commercial Mortgage Trust
1.299%, 03/15/47 (g) (h) | | | 1,918,575 | | | | 89,227 | |
2.870%, 11/15/45 | | | 397,749 | | | | 394,406 | |
2.875%, 12/15/45 | | | 175,000 | | | | 172,219 | |
3.016%, 11/15/47 (144A) (o) | | | 550,000 | | | | 276,207 | |
3.071%, 03/15/45 | | | 185,000 | | | | 183,533 | |
3.345%, 05/15/45 | | | 100,000 | | | | 99,110 | |
3.607%, 11/15/47 | | | 225,000 | | | | 226,804 | |
3.723%, 05/15/47 | | | 190,000 | | | | 192,995 | |
3.995%, 05/15/47 | | | 160,281 | | | | 164,957 | |
4.045%, 03/15/47 | | | 40,000 | | | | 41,261 | |
4.101%, 03/15/47 | | | 335,000 | | | | 346,353 | |
5.000%, 06/15/44 (144A) (g) (o) | | | 105,000 | | | | 77,628 | |
5.582%, 04/15/45 (144A) (g) | | | 255,000 | | | | 255,352 | |
| | | | | | | | |
| | | | | | | 21,426,968 | |
| | | | | | | | |
Total Mortgage-Backed Securities
(Cost $53,582,968) | | | | | | | 51,671,817 | |
| | | | | | | | |
|
| Floating Rate Loans (q)—0.9% | |
|
| Aerospace/Defense—0.0% | |
TransDigm, Inc.
Term Loan E, 5.022%, 1M LIBOR + 2.500%, 05/30/25 | | | 149,874 | | | | 141,818 | |
| | | | | | | | |
|
| Auto Manufacturers—0.0% | |
Navistar International Corp.
1st Lien Term Loan B, 5.890%, 1M LIBOR + 3.500%, 11/06/24 | | | 99,250 | | | | 95,528 | |
| | | | | | | | |
See accompanying notes to financial statements.
BHFTII-22
Brighthouse Funds Trust II
Brighthouse/Wellington Balanced Portfolio
Schedule of Investments as of December 31, 2018
Floating Rate Loans (q)—(Continued)
| | | | | | | | |
| Security Description | | Principal
Amount* | | | Value | |
|
| Building Materials—0.0% | |
NCI Building Systems, Inc.
Term Loan, 6.175%, 3M LIBOR + 3.750%, 04/12/25 | | | 99,500 | | | $ | 91,042 | |
Quikrete Holdings, Inc.
1st Lien Term Loan, 5.272%, 1M LIBOR + 2.750%, 11/15/23 | | | 125,000 | | | | 119,297 | |
| | | | | | | | |
| | | | | | | 210,339 | |
| | | | | | | | |
|
| Chemicals—0.0% | |
HB Fuller Co.
Term Loan B, 4.470%, 1M LIBOR + 2.000%, 10/20/24 | | | 91,360 | | | | 86,107 | |
Univar, Inc.
Term Loan B, 4.772%, 1M LIBOR + 2.250%, 07/01/24 | | | 91,159 | | | | 87,354 | |
| | | | | | | | |
| | | | | | | 173,461 | |
| | | | | | | | |
|
| Commercial Services—0.1% | |
Acosta Holdco, Inc.
Term Loan, 5.772%, 1M LIBOR + 3.250%, 09/26/21 | | | 152,886 | | | | 93,706 | |
APX Group, Inc.
Term Loan B, 7.497%, 2M LIBOR + 4.000%, 04/01/24 | | | 99,750 | | | | 96,882 | |
BlitzF18-675 GmbH
Term Loan B2, 3.750%, EURIBOR + 3.750%, 07/31/25 (EUR) | | | 100,000 | | | | 114,353 | |
BrightView Landscapes LLC
1st Lien Term Loan B, 5.029%, 1M LIBOR + 2.500%, 08/15/25 | | | 216,864 | | | | 207,648 | |
Financial & Risk US Holdings, Inc.
Term Loan, 6.272%, 1M LIBOR + 3.750%, 10/01/25 | | | 105,000 | | | | 98,490 | |
Jaguar Holding Co. II
Term Loan, 5.022%, 1M LIBOR + 2.500%, 08/18/22 | | | 129,994 | | | | 123,801 | |
Nets Holding A/S
Term Loan B1E, 3.000%, EURIBOR + 3.000%, 02/06/25 (EUR) | | | 88,194 | | | | 99,984 | |
PSAV Holdings LLC
| |
1st Lien Term Loan, 5.894%, 1M LIBOR + 3.250%, 03/01/25 | | | 173,874 | | | | 164,746 | |
WEX, Inc.
Term Loan B2, 4.772%, 1M LIBOR + 2.250%, 06/30/23 | | | 409,500 | | | | 395,372 | |
| | | | | | | | |
| | | | | | | 1,394,982 | |
| | | | | | | | |
|
| Computers—0.0% | |
Tempo Acquisition LLC
Term Loan, 5.522%, 1M LIBOR + 3.000%, 05/01/24 | | | 206,850 | | | | 198,576 | |
| | | | | | | | |
|
| Cosmetics/Personal Care—0.0% | |
Coty, Inc.
Term Loan B, 4.633%, 1M LIBOR + 2.250%, 04/07/25 | | | 188,826 | | | | 174,900 | |
Revlon Consumer Products Corp.
Term Loan B, 6.207%, 3M LIBOR + 2.500%, 09/07/23 | | | 239,488 | | | | 171,084 | |
| | | | | | | | |
| | | | | | | 345,984 | |
| | | | | | | | |
|
| Diversified Financial Services—0.0% | |
AlixPartners LLP
Term Loan B, 5.272%, 1M LIBOR + 2.750%, 04/04/24 | | | 176,850 | | | | 170,307 | |
| | | | | | | | |
|
| Energy Equipment & Services—0.0% | |
Seadrill Partners Finco LLC
Term Loan B, 8.803%, 3M LIBOR + 6.000%, 02/21/21 | | | 103,814 | | | | 81,365 | |
| | | | | | | | |
|
| Entertainment—0.0% | |
Golden Entertainment, Inc.
1st Lien Term Loan, 5.530%, 1M LIBOR + 3.000%, 10/21/24 | | | 168,300 | | | | 161,147 | |
| | | | | | | | |
|
| Food—0.0% | |
Post Holdings, Inc.
Incremental Term Loan, 4.510%, 1M LIBOR + 2.000%, 05/24/24 | | | 98,213 | | | | 95,143 | |
| | | | | | | | |
|
| Food Products—0.0% | |
Hostess Brands LLC
Term Loan, 4.775%, 1M LIBOR + 2.250%, 08/03/22 | | | 107,809 | | | | 102,823 | |
| | | | | | | | |
|
| Healthcare-Products—0.0% | |
Lifescan Global Corporation
1st Lien Term Loan, 8.396%, 3M LIBOR + 6.000%, 09/27/24 | | | 100,000 | | | | 94,500 | |
| | | | | | | | |
|
| Healthcare-Services—0.1% | |
Envision Healthcare Corp.
1st Lien Term Loan, 6.272%, 1M LIBOR + 3.750%, 10/10/25 | | | 115,000 | | | | 107,685 | |
MPH Acquisition Holdings LLC
Term Loan B, 5.553%, 3M LIBOR + 2.750%, 06/07/23 | | | 145,764 | | | | 137,856 | |
U.S. Renal Care, Inc.
Term Loan B, 7.053%, 3M LIBOR + 4.250%, 12/30/22 | | | 252,200 | | | | 240,977 | |
| | | | | | | | |
| | | | | | | 486,518 | |
| | | | | | | | |
|
| Insurance—0.1% | |
Asurion LLC
Term Loan B4, 5.522%, 1M LIBOR + 3.000%, 08/04/22 | | | 283,056 | | | | 272,724 | |
Camelot UK Holdco, Ltd.
Term Loan, 5.772%, 1M LIBOR + 3.250%, 10/03/23 | | | 105,316 | | | | 100,840 | |
Hub International, Ltd.
Term Loan B, 5.240%, 3M LIBOR + 2.750%, 04/25/25 | | | 119,400 | | | | 113,032 | |
Sedgwick Claims Management Services, Inc.
| |
Term Loan B, 11/06/25 (r) | | | 100,000 | | | | 95,917 | |
USI, Inc.
Term Loan, 5.803%, 3M LIBOR + 3.000%, 05/16/24 | | | 103,688 | | | | 98,192 | |
| | | | | | | | |
| | | | | | | 680,705 | |
| | | | | | | | |
|
| Internet—0.0% | |
Zayo Group LLC
Incremental Term Loan, 4.772%, 1M LIBOR + 2.250%, 01/19/24 | | | 75,071 | | | | 72,193 | |
| | | | | | | | |
|
| Internet & Direct Marketing Retail—0.0% | |
Lands’ End, Inc.
Term Loan B, 5.772%, 1M LIBOR + 3.250%, 04/04/21 (c) | | | 155,370 | | | | 147,472 | |
| | | | | | | | |
See accompanying notes to financial statements.
BHFTII-23
Brighthouse Funds Trust II
Brighthouse/Wellington Balanced Portfolio
Schedule of Investments as of December 31, 2018
Floating Rate Loans (q)—(Continued)
| | | | | | | | |
| Security Description | | Principal
Amount* | | | Value | |
|
| IT Services—0.0% | |
Blackhawk Network Holdings, Inc.
1st Lien Term Loan, 5.522%, 1M LIBOR + 3.000%, 06/15/25 | | | 99,500 | | | $ | 94,981 | |
| | | | | | | | |
|
| Leisure Time—0.0% | |
Aristocrat Technologies, Inc.
1st Lien Term Loan, 4.219%, 3M LIBOR + 1.750%, 10/19/24 | | | 92,636 | | | | 88,814 | |
Delta 2 (LUX) S.a.r.l.
Term Loan, 5.022%, 1M LIBOR + 2.500%, 02/01/24 | | | 241,686 | | | | 228,696 | |
| | | | | | | | |
| | | | | | | 317,510 | |
| | | | | | | | |
|
| Life Sciences Tools & Services—0.0% | |
Syneos Health, Inc.
Term Loan B, 4.522%, 1M LIBOR + 2.000%, 08/01/24 | | | 76,313 | | | | 73,832 | |
| | | | | | | | |
|
| Lodging—0.0% | |
Boyd Gaming Corp.
Term Loan B3, 4.666%, 1W LIBOR + 2.250%, 09/15/23 | | | 118,504 | | | | 113,468 | |
Caesars Entertainment Operating Co.
Term Loan, 4.522%, 1M LIBOR + 2.000%, 10/06/24 | | | 158,400 | | | | 151,035 | |
Caesars Resort Collection LLC
1st Lien Term Loan B, 5.272%, 1M LIBOR + 2.750%, 12/22/24 | | | 110,177 | | | | 105,770 | |
Crown Finance U.S., Inc.
Term Loan, 5.022%, 1M LIBOR + 2.500%, 02/28/25 | | | 99,250 | | | | 94,436 | |
| | | | | | | | |
| | | | | | | 464,709 | |
| | | | | | | | |
|
| Machinery—0.0% | |
Circor International, Inc.
1st Lien Term Loan, 5.921%, 1M LIBOR + 3.500%, 12/11/24 | | | 103,950 | | | | 99,012 | |
| | | | | | | | |
|
| Machinery-Construction & Mining—0.0% | |
Brookfield WEC Holdings, Inc.
1st Lien Term Loan, 6.272%, 1M LIBOR + 3.750%, 08/01/25 | | | 100,000 | | | | 97,075 | |
| | | | | | | | |
|
| Machinery-Diversified—0.0% | |
Gardner Denver, Inc.
Term Loan B, 5.272%, 1M LIBOR + 2.750%, 07/30/24 | | | 179,620 | | | | 174,119 | |
| | | | | | | | |
|
| Media—0.0% | |
Gray Television, Inc.
Term Loan C, 11/02/25 (r) | | | 100,000 | | | | 96,839 | |
Numericable Group S.A.
| |
Term Loan B12, 6.143%, 1M LIBOR + 3.687%, 01/31/26 | | | 99,000 | | | | 91,977 | |
Univision Communications, Inc.
Term Loan C5, 5.272%, 1M LIBOR + 2.750%, 03/15/24 | | | 146,782 | | | | 133,425 | |
| | | | | | | | |
| | | | | | | 322,241 | |
| | | | | | | | |
|
| Miscellaneous Manufacturing—0.0% | |
CTC AcquiCo GmbH
Term Loan B1, 2.750%, EURIBOR + 2.750%, 03/07/25 (EUR) | | | 97,570 | | | | 109,555 | |
| | | | | | | | |
|
| Office/Business Equipment—0.0% | |
Brand Energy & Infrastructure Services, Inc.
Term Loan, 6.732%, 6M LIBOR + 4.250%, 06/21/24 | | | 147,750 | | | | 140,436 | |
| | | | | | | | |
|
| Oil & Gas—0.1% | |
California Resources Corp.
Second Out Term Loan, 12.897%, 1M LIBOR + 10.375%, 12/31/21 (c) | | | 130,000 | | | | 128,700 | |
Fieldwood Energy LLC
1st Lien TL, 7.772%, 1M LIBOR + 5.250%, 04/11/22 | | | 249,780 | | | | 234,794 | |
Foresight Energy LLC
1st Lien Term Loan, 8.277%, 3M LIBOR + 5.750%, 03/28/22 | | | 189,117 | | | | 186,123 | |
Paragon Offshore Finance Co.
Term Loan B, 07/18/21 (c) (d) (e) | | | 706 | | | | 0 | |
| | | | | | | | |
| | | | | | | 549,617 | |
| | | | | | | | |
|
| Packaging & Containers—0.1% | |
Berry Global, Inc.
Term Loan S, 4.137%, 1M LIBOR + 1.750%, 02/08/20 | | | 151,134 | | | | 149,118 | |
Flex Acquisition Co., Inc.
1st Lien Term Loan, 5.349%, 1M LIBOR + 3.000%, 12/29/23 | | | 98,500 | | | | 93,021 | |
Reynolds Group Holdings, Inc.
Term Loan, 5.272%, 1M LIBOR + 2.750%, 02/05/23 | | | 253,057 | | | | 242,302 | |
| | | | | | | | |
| | | | | | | 484,441 | |
| | | | | | | | |
|
| Pharmaceuticals—0.1% | |
Change Healthcare Holdings LLC
Term Loan B, 5.272%, 1M LIBOR + 2.750%, 03/01/24 | | | 168,438 | | | | 160,472 | |
Endo Luxembourg Finance Co. I S.a.r.l.
Term Loan B, 6.813%, 1M LIBOR + 4.250%, 04/29/24 | | | 167,450 | | | | 158,240 | |
Valeant Pharmaceuticals International, Inc.
Term Loan B, 5.379%, 1M LIBOR + 3.000%, 06/02/25 | | | 165,195 | | | | 158,587 | |
| | | | | | | | |
| | | | | | | 477,299 | |
| | | | | | | | |
|
| Pipelines—0.0% | |
Energy Transfer Equity L.P.
Term Loan B, 4.522%, 1M LIBOR + 2.000%, 02/02/24 | | | 277,617 | | | | 271,414 | |
| | | | | | | | |
|
| Real Estate Investment Trusts—0.0% | |
VICI Properties 1 LLC
Term Loan B, 4.504%, 1M LIBOR + 2.000%, 12/20/24 | | | 95,455 | | | | 91,708 | |
| | | | | | | | |
|
| Retail—0.1% | |
Bass Pro Group LLC
Term Loan B, 7.522%, 1M LIBOR + 5.000%, 09/25/24 | | | 148,125 | | | | 142,293 | |
Harbor Freight Tools USA, Inc.
Term Loan B, 5.022%, 1M LIBOR + 2.500%, 08/18/23 | | | 115,739 | | | | 109,615 | |
See accompanying notes to financial statements.
BHFTII-24
Brighthouse Funds Trust II
Brighthouse/Wellington Balanced Portfolio
Schedule of Investments as of December 31, 2018
Floating Rate Loans (q)—(Continued)
| | | | | | | | |
| Security Description | | Principal
Amount* | | | Value | |
|
| Retail—(Continued) | |
J. Crew Group, Inc.
| |
Term Loan B, 5.750%, 1M LIBOR + 3.000%, 03/05/21 (d) (e) | | | 306,326 | | | $ | 219,422 | |
Neiman Marcus Group, Ltd. LLC
Term Loan, 5.630%, 1M LIBOR + 3.250%, 10/25/20 | | | 222,084 | | | | 189,326 | |
Staples, Inc.
Term Loan B, 6.541%, 3M LIBOR + 4.000%, 09/12/24 | | | 128,700 | | | | 123,632 | |
| | | | | | | | |
| | | | | | | 784,288 | |
| | | | | | | | |
|
| Semiconductors & Semiconductor Equipment—0.0% | |
Microchip Technology, Inc.
Term Loan B, 4.530%, 1M LIBOR + 2.000%, 05/29/25 | | | 90,433 | | | | 86,025 | |
| | | | | | | | |
|
| Software—0.1% | |
Almonde, Inc.
1st Lien Term Loan, 6.303%, 3M LIBOR + 3.500%, 06/13/24 | | | 117,318 | | | | 109,751 | |
First Data Corp.
Term Loan, 4.504%, 1M LIBOR + 2.000%, 07/08/22 | | | 337,680 | | | | 324,736 | |
Infor (U.S.), Inc.
Term Loan B6, 5.272%, 1M LIBOR + 2.750%, 02/01/22 | | | 241,753 | | | | 232,230 | |
SS&C Technologies, Inc.
Term Loan B5, 4.772%, 1M LIBOR + 2.250%, 04/16/25 | | | 99,749 | | | | 94,606 | |
| | | | | | | | |
| | | | | | | 761,323 | |
| | | | | | | | |
|
| Telecommunications—0.1% | |
CSC Holdings LLC
1st Lien Term Loan, 4.705%, 1M LIBOR + 2.250%, 07/17/25 | | | 106,657 | | | | 100,791 | |
Sprint Communications, Inc.
1st Lien Term Loan B, 5.063%, 1M LIBOR + 2.500%, 02/02/24 | | | 334,050 | | | | 319,853 | |
Telenet Financing USD LLC
Term Loan AN, 4.705%, 1M LIBOR + 2.250%, 08/15/26 | | | 100,000 | | | | 95,400 | |
| | | | | | | | |
| | | | | | | 516,044 | |
| | | | | | | | |
|
| Transportation—0.0% | |
Savage Enterprises LLC
1st Lien Term Loan B, 6.880%, 1M LIBOR + 4.500%, 08/01/25 | | | 96,023 | | | | 94,582 | |
| | | | | | | | |
Total Floating Rate Loans
(Cost $11,362,578) | | | | | | | 10,663,072 | |
| | | | | | | | |
|
| Foreign Government—0.5% | |
|
| Banks—0.1% | |
Banque Centrale de Tunisie International Bond
6.750%, 10/31/23 (144A) (EUR) | | | 535,000 | | | | 588,622 | |
| | | | | | | | |
|
| Regional Government—0.0% | |
Province of Alberta Canada
2.120%, 3M CDOR + 0.000%, 01/17/19 (CAD) (g) | | | 540,000 | | | | 395,353 | |
| | | | | | | | |
|
| Sovereign—0.4% | |
Abu Dhabi Government International Bond
4.125%, 10/11/47 (144A) | | | 1,110,000 | | | | 1,062,825 | |
Argentine Republic Government International Bond
5.250%, 01/15/28 (EUR) | | | 370,000 | | | | 302,557 | |
Egypt Government International Bond
8.500%, 01/31/47 | | | 200,000 | | | | 180,261 | |
Export-Import Bank of Korea
2.929%, 3M LIBOR + 0.460%, 10/21/19 (g) | | | 200,000 | | | | 199,766 | |
Ghana Government International Bond
8.627%, 06/16/49 (144A) | | | 400,000 | | | | 348,224 | |
Hungary Government International Bond
| |
6.375%, 03/29/21 | | | 160,000 | | | | 168,854 | |
Japan Bank for International Cooperation
3.218%, 3M LIBOR + 0.480%, 06/01/20 (g) | | | 200,000 | | | | 201,010 | |
Panama Government International Bonds
4.300%, 04/29/53 | | | 532,000 | | | | 493,967 | |
4.500%, 04/16/50 | | | 400,000 | | | | 383,000 | |
Romanian Government International Bond
6.125%, 01/22/44 | | | 842,000 | | | | 933,034 | |
Spain Government Bond
0.250%, 01/31/19 (EUR) | | | 750,000 | | | | 859,612 | |
| | | | | | | | |
| | | | | | | 5,133,110 | |
| | | | | | | | |
Total Foreign Government
(Cost $6,437,293) | | | | | | | 6,117,085 | |
| | | | | | | | |
|
| Municipals—0.3% | |
Chicago Board of Education, General Obligation Unlimited, Build America Bonds 6.138%, 12/01/39 | | | 155,000 | | | | 147,281 | |
6.319%, 11/01/29 | | | 345,000 | | | | 339,898 | |
Chicago Transit Authority Transfer Tax Receipts Revenue
6.899%, 12/01/40 | | | 490,000 | | | | 625,970 | |
City of Chicago IL, General Obligation Unlimited
7.045%, 01/01/29 | | | 190,000 | | | | 204,472 | |
7.375%, 01/01/33 | | | 775,000 | | | | 852,151 | |
State of Illinois
4.950%, 06/01/23 | | | 375,000 | | | | 380,753 | |
State of Illinois, General Obligation Unlimited
5.363%, 02/01/19 | | | 35,000 | | | | 35,059 | |
5.877%, 03/01/19 | | | 655,000 | | | | 657,895 | |
| | | | | | | | |
Total Municipals
(Cost $3,280,831) | | | | | | | 3,243,479 | |
| | | | | | | | |
|
| Short-Term Investments—2.3% | |
|
| Certificate of Deposit—0.1% | |
Bank of Nova Scotia
2.034%, 01/30/19 (CAD) | | | 100,000 | | | | 73,119 | |
2.099%, 02/07/19 (CAD) | | | 555,000 | | | | 405,615 | |
Credit Agricole Corporate and Investment Bank
3.224%, 3M LIBOR + 0.400%, 09/24/20 (g) | | | 125,000 | | | | 124,979 | |
Dexia Credit Local S.A
2.740%, 3M LIBOR + 0.100%, 05/17/19 (g) | | | 105,000 | | | | 104,988 | |
| | | | | | | | |
| | | | | | | 708,701 | |
| | | | | | | | |
See accompanying notes to financial statements.
BHFTII-25
Brighthouse Funds Trust II
Brighthouse/Wellington Balanced Portfolio
Schedule of Investments as of December 31, 2018
Short-Term Investments—(Continued)
| | | | | | | | |
| Security Description | | Principal
Amount* | | | Value | |
|
| Commercial Paper—0.2% | |
AT&T, Inc.
2.955%, 05/28/19 | | | 250,000 | | | $ | 246,754 | |
C.I.B.C.
1.995%, 01/25/19 | | | 680,000 | | | | 497,448 | |
Enbridge Pipelines, Inc.
1.626%, 01/04/19 | | | 500,000 | | | | 366,182 | |
Royal Bank of Canada New York
1.366%, 01/03/19 (CAD) | | | 410,000 | | | | 300,268 | |
1.938%, 01/16/19 (CAD) | | | 420,000 | | | | 307,355 | |
1.966%, 01/21/19 (CAD) | | | 270,000 | | | | 197,526 | |
VW CR INC
3.023%, 03/20/19 | | | 500,000 | | | | 496,591 | |
| | | | | | | | |
| | | | | | | 2,412,124 | |
| | | | | | | | |
|
| Repurchase Agreement—1.0% | |
Fixed Income Clearing Corp.
Repurchase Agreement dated 12/31/18 at 1.200%, due on 01/02/19 with a maturity value of $11,101,288; collateralized by U.S. Treasury Note at 2.125%, maturing 03/31/24, with a market value of $11,326,574. | | | 11,100,548 | | | | 11,100,548 | |
| | | | | | | | |
|
| Foreign Government—1.0% | |
Egypt Treasury Bills
15.058%, 03/05/19 (EGP) (s) | | | 3,950,000 | | | | 213,916 | |
18.907%, 10/15/19 (EGP) (s) | | | 11,450,000 | | | | 553,334 | |
Hungary Treasury Bill
Zero Coupon, 02/06/19 (s) | | | 59,930,000 | | | | 213,870 | |
| Japan Treasury Bills | | | | | | |
Zero Coupon, 01/15/19 (JPY) (s) | | | 74,850,000 | | | | 682,934 | |
Zero Coupon, 01/28/19 (JPY) (s) | | | 210,950,000 | | | | 1,924,842 | |
Zero Coupon, 02/04/19 (JPY) (s) | | | 157,200,000 | | | | 1,434,442 | |
Zero Coupon, 02/12/19 (JPY) (s) | | | 175,000,000 | | | | 1,596,922 | |
Zero Coupon, 02/18/19 (JPY) (s) | | | 177,000,000 | | | | 1,615,216 | |
Zero Coupon, 02/25/19 (JPY) (s) | | | 175,000,000 | | | | 1,597,013 | |
Zero Coupon, 03/11/19 (JPY) (s) | | | 56,700,000 | | | | 517,464 | |
Zero Coupon, 03/25/19 (JPY) (s) | | | 154,150,000 | | | | 1,406,913 | |
Total Foreign Government
(Cost $11,397,072) | | | | | | | 11,756,866 | |
| | | | | | | | |
Total Short-Term Investments
(Cost $25,677,290) | | | | | | | 25,978,239 | |
| | | | | | | | |
|
| Securities Lending Reinvestments (t)—4.2% | |
|
| Certificates of Deposit—2.2% | |
Banco Del Estado De Chile New York
2.820%, 1M LIBOR + 0.350%, 05/20/19 (g) | | | 1,000,000 | | | | 999,979 | |
Bank of Nova Scotia
3.072%, 3M LIBOR + 0.280%, 03/20/19 (g) | | | 500,000 | | | | 500,200 | |
Barclays Bank plc
2.547%, 1M LIBOR + 0.200%, 02/04/19 (g) | | | 500,000 | | | | 499,953 | |
BNP Paribas S.A. New York
2.647%, 1M LIBOR + 0.300%, 06/04/19 (g) | | | 2,000,000 | | | | 1,999,196 | |
Commonwealth Bank of Australia
2.617%, 3M LIBOR + 0.140%, 04/23/19 (g) | | | 250,000 | | | | 250,001 | |
|
| Certificates of Deposit—(Continued) | |
Credit Agricole S.A.
2.799%, 1M LIBOR + 0.320%, 05/21/19 (g) | | | 1,000,000 | | | | 1,000,063 | |
Industrial & Commercial Bank of China, Ltd.
2.850%, 02/15/19 | | | 1,500,000 | | | | 1,499,889 | |
Mizuho Bank, Ltd., New York
2.649%, 1M LIBOR + 0.300%, 05/01/19 (g) | | | 2,000,000 | | | | 2,000,012 | |
Natixis S.A. New York
2.810%, 1M LIBOR + 0.370%, 02/14/19 (g) | | | 1,500,000 | | | | 1,500,280 | |
Royal Bank of Canada New York
| |
2.650%, 1M LIBOR + 0.250%, 01/11/19 (g) | | | 500,000 | | | | 500,004 | |
Standard Chartered plc
2.686%, 1M LIBOR + 0.180%, 02/25/19 (g) | | | 1,500,000 | | | | 1,499,956 | |
2.717%, 3M LIBOR + 0.230%, 04/24/19 (g) | | | 1,500,000 | | | | 1,499,673 | |
State Street Bank and Trust
2.725%, 1M LIBOR + 0.270%, 05/15/19 (g) | | | 4,000,000 | | | | 3,999,920 | |
Sumitomo Mitsui Banking Corp.
2.590%, 1M LIBOR + 0.190%, 04/11/19 (g) | | | 1,500,000 | | | | 1,499,449 | |
Sumitomo Mitsui Banking Corp.
2.700%, 02/25/19 | | | 1,000,000 | | | | 1,000,092 | |
Sumitomo Mitsui Trust Bank, Ltd.
Zero Coupon, 03/12/19 | | | 992,778 | | | | 994,570 | |
Svenska Handelsbanken AB
2.767%, 1M LIBOR + 0.380%, 12/10/19 (g) | | | 1,000,000 | | | | 999,967 | |
U.S. Bank N.A.
2.764%, 1M LIBOR + 0.260%, 07/23/19 (g) | | | 2,000,000 | | | | 2,000,000 | |
Wells Fargo Bank N.A.
2.730%, 3M LIBOR + 0.210%, 10/25/19 (g) | | | 500,000 | | | | 500,000 | |
Westpac Banking Corp.
2.850%, FEDEFF PRV + 0.450%, 02/15/19 (g) | | | 500,000 | | | | 499,997 | |
| | | | | | | | |
| | | | | | | 25,243,201 | |
| | | | | | | | |
|
| Commercial Paper—0.6% | |
Banco Santander S.A.
2.740%, 02/07/19 | | | 992,998 | | | | 997,088 | |
HSBC Bank plc
2.842%, 1M LIBOR + 0.320%, 07/30/19 (g) | | | 1,000,000 | | | | 1,000,000 | |
ING Funding LLC
2.707%, 1M LIBOR + 0.320%, 02/08/19 (g) | | | 2,500,000 | | | | 2,500,232 | |
Toronto-Dominion Bank
2.729%, 1M LIBOR + 0.350%, 11/05/19 (g) | | | 1,000,000 | | | | 999,890 | |
Westpac Banking Corp.
2.784%, 1M LIBOR + 0.280%, 05/24/19 (g) | | | 1,000,000 | | | | 999,960 | |
| | | | | | | | |
| | | | | | | 6,497,170 | |
| | | | | | | | |
|
| Repurchase Agreements—1.3% | |
Citadel Clearing LLC
Repurchase Agreement dated 12/31/18 at 3.000%, due on 04/02/19 with a maturity value of $1,007,667; collateralized by various Common Stock with an aggregate market value of $1,100,183. | | | 1,000,000 | | | | 1,000,000 | |
Citigroup Global Markets, Inc.
Repurchase Agreement dated 12/31/18 at 2.940%, due on 04/02/19 with a maturity value of $352,630; collateralized by U.S. Treasury Obligations with rates ranging from 1.125% - 2.750%, maturity dates ranging from 01/31/19 - 08/15/24, and an aggregate market value of $357,000. | | | 350,000 | | | | 350,000 | |
See accompanying notes to financial statements.
BHFTII-26
Brighthouse Funds Trust II
Brighthouse/Wellington Balanced Portfolio
Schedule of Investments as of December 31, 2018
Securities Lending Reinvestments(t)—(Continued)
| | | | | | | | |
| Security Description | | Principal
Amount* | | | Value | |
|
| Repurchase Agreements—(Continued) | |
Citigroup Global Markets, Ltd.
Repurchase Agreement dated 12/31/18 at 2.490%, due on 01/02/19 with a maturity value of $300,042; collateralized by U.S. Treasury Obligations with rates ranging from 0.375% - 1.875%, maturity dates ranging from 12/15/20 - 01/15/27, and an aggregate market value of $306,000. | | | 300,000 | | | $ | 300,000 | |
Repurchase Agreement dated 12/31/18 at 2.490%, due on 01/02/19 with a maturity value of $500,069; collateralized by U.S. Treasury Obligations with rates ranging from 1.625% - 2.875%, maturity dates ranging from 06/30/20 - 11/15/46, and an aggregate market value of $510,000. | | | 500,000 | | | | 500,000 | |
Deutsche Bank AG, London
Repurchase Agreement dated 12/31/18 at 2.750%, due on 01/02/19 with a maturity value of $200,031; collateralized by U.S. Treasury and Foreign Obligations with rates ranging from 1.000% - 2.590%, maturity dates ranging from 03/31/19 - 12/29/26, and an aggregate market value of $204,000. | | | 200,000 | | | | 200,000 | |
Deutsche Bank Securities, Inc.
Repurchase Agreement dated 12/31/18 at 3.200%, due on 01/02/19 with a maturity value of $5,276,113; collateralized by U.S. Treasury Bills with, maturity dates ranging from 08/15/30 - 08/15/39, and an aggregate market value of $5,380,679. | | | 5,275,176 | | | | 5,275,176 | |
Merrill Lynch, Pierce, Fenner & Smith, Inc.
Repurchase Agreement dated 12/31/18 at 2.940%, due on 04/02/19 with a maturity value of $1,410,519; collateralized by various Common Stock with an aggregate market value of $1,540,000. | | | 1,400,000 | | | | 1,400,000 | |
NBC Global Finance, Ltd.
Repurchase Agreement dated 12/31/18 at 2.560%, due on 01/02/19 with a maturity value of $300,043; collateralized by various Common Stock with an aggregate market value of $333,964. | | | 300,000 | | | | 300,000 | |
Repurchase Agreement dated 12/31/18 at 2.560%, due on 01/02/19 with a maturity value of $1,000,142; collateralized by various Common Stock with an aggregate market value of $1,113,212. | | | 1,000,000 | | | | 1,000,000 | |
Repurchase Agreement dated 12/31/18 at 2.560%, due on 01/02/19 with a maturity value of $800,114; collateralized by various Common Stock with an aggregate market value of $890,570. | | | 800,000 | | | | 800,000 | |
Societe Generale
Repurchase Agreement dated 12/31/18 at 2.560%, due on 01/07/19 with a maturity value of $2,901,444; collateralized by U.S. Treasury Obligations with rates ranging from 0.750% - 8.000%, maturity dates ranging from 09/30/19 - 08/15/46, and various Common Stock with an aggregate market value of $3,176,880. | | | 2,900,000 | | | | 2,900,000 | |
Repurchase Agreement dated 12/31/18 at 2.560%, due on 01/07/19 with a maturity value of $800,398; collateralized by U.S. Treasury Obligations with rates ranging from 0.750% - 8.000%, maturity dates ranging from 09/30/19 - 08/15/46, and various Common Stock with an aggregate market value of $876,381. | | | 800,000 | | | | 800,000 | |
| | | | | | | | |
| | | | | | | 14,825,176 | |
| | | | | | | | |
|
| Time Deposit—0.1% | |
Royal Bank of Canada
2.420%, 01/02/19 | | | 1,000,000 | | | | 1,000,000 | |
| | | | | | | | |
Total Securities Lending Reinvestments
(Cost $47,566,899) | | | | | | | 47,565,547 | |
| | | | | | | | |
Total Purchased Options—0.1% (u)
(Cost $1,163,353) | | | | | | | 981,777 | |
| | | | | | | | |
Total Investments—117.7%
(Cost $1,338,148,163) | | | | | | | 1,335,963,128 | |
Other assets and liabilities (net)—(17.7)% | | | | | | | (200,738,167 | ) |
| | | | | | | | |
| Net Assets—100.0% | | | | | | $ | 1,135,224,961 | |
| | | | | | | | |
| | | | |
| * | | Principal and notional amounts stated in U.S. dollars unless otherwise noted. |
| (a) | | Non-income producing security. |
| (b) | | All or a portion of the security was held on loan. As of December 31, 2018, the market value of securities loaned was $47,643,999 and the collateral received consisted of cash in the amount of $47,560,951 andnon-cash collateral with a value of $1,225,185. The cash collateral investments are disclosed in the Schedule of Investments and categorized as Securities Lending Reinvestments. Thenon-cash collateral received consists of U.S. government securities that are held in safe-keeping by the lending agent, or a third- party custodian, and cannot be sold or repledged by the Portfolio. As such, this non-cash collateral is excluded from the Statement of Assets and Liabilities. |
| (c) | | Illiquid security. As of December 31, 2018, these securities represent 0.5% of net assets. |
| (d) | | Significant unobservable inputs were used in the valuation of this portfolio security; i.e. Level 3. |
| (e) | | Security was valued in good faith under procedures approved by the Board of Trustees. As of December 31, 2018, these securities represent less than 0.05% of net assets. |
| (f) | | TBA (To Be Announced) Securities are purchased on a forward commitment basis with an approximate principal amount and no defined maturity date. The actual principal and maturity date will be determined upon settlement date. |
| (g) | | Variable or floating rate security. The stated rate represents the rate at December 31, 2018. Maturity date shown for callable securities reflects the earliest possible call date. For securities based on a published reference index and spread, the index and spread are indicated in the description above. For certain variable rate securities, the coupon rate is determined by the issuer/agent based on current market conditions. For certain asset- and mortgage-backed securities, the coupon rate may fluctuate based on changes of the underlying collateral or prepayments of principal. These securities do not indicate a reference index and spread in their description above. |
| (h) | | Interest only security. |
| (i) | | Principal only security. |
| (j) | | All or a portion of the security was pledged as collateral against open centrally cleared swap contracts. As of December 31, 2018, the market value of securities pledged was $4,179,340. |
| (k) | | All or a portion of the security was pledged as collateral against open OTC swap and option contracts. As of December 31, 2018, the market value of securities pledged was $2,794,799. |
| (l) | | All or a portion of the security was pledged as collateral against open futures contracts. As of December 31, 2018, the market value of securities pledged was $1,226,903. |
| (m) | | Principal amount of security is adjusted for inflation. |
| (n) | | Non-income producing; security is in default and/or issuer is in bankruptcy. |
| (o) | | Restricted securities are not registered under the Securities Act of 1933 and are subject to legal restrictions on resale. These securities generally may be resold in transactions exempt from registration or to the public if the securities are subsequently registered. Disposal of these securities may involve time-consuming negotiations and prompt sale at an acceptable price may be difficult. As of December 31, 2018, the market value of restricted securities was $7,799,796, which is 0.7% of net assets. See details shown in the Restricted Securities table that follows. |
See accompanying notes to financial statements.
BHFTII-27
Brighthouse Funds Trust II
Brighthouse/Wellington Balanced Portfolio
Schedule of Investments as of December 31, 2018
| | | | |
| (p) | | Security is a“step-up” bond where coupon increases or steps up at a predetermined date. Rate shown is current coupon rate. |
| (q) | | Floating rate loans ("Senior Loans") often require prepayments from excess cash flows or permit the borrowers to repay at their election. The degree to which borrowers repay, whether as a contractual requirement or at their election, cannot be predicted with accuracy. As a result, the actual remaining maturity may be substantially less than the stated maturities shown. However, Senior Loans will have an expected average life of approximately two to four years. The stated interest rate represents the weighted average interest rate of all contracts within the senior loan facility and includes commitment fees on unfunded loan commitments, if any. Senior Loans typically have rates of interest which are determined either daily, monthly, quarterly or semi-annually by reference to a base lending rate, plus a premium. These base rates are primarily the London Interbank Offered Rate (“LIBOR”) and secondarily, the prime rate offered by one or more major United States banks (the “Prime Rate”) and the certificate of deposit (“CD”) rate or other base lending rates used by commercial lenders. |
| (r) | | This loan will settle after December 31, 2018, at which time the interest rate will be determined. |
| (s) | | The rate shown represents current yield to maturity. |
| (t) | | Represents investment of cash collateral received from securities on loan as of December 31, 2018. |
| (u) | | For a breakout of open positions, see details shown in the Purchased Options table that follows. |
| (144A)— | | Securities exempt from registration under Rule 144A of the Securities Act of 1933. These securities may be resold in transactions exempt from registration, normally to qualified institutional buyers. As of December 31, 2018, the market value of 144A securities was $155,810,457, which is 13.7% of net assets. |
| | | | | | | | | | | | | | | | |
Restricted Securities | | Acquisition
Date | | | Principal
Amount | | | Cost | | | Value | |
Avant Loans Funding Trust, 3.420%, 01/18/22 | | | 10/10/18 | | | $ | 1,182,108 | | | $ | 1,182,058 | | | $ | 1,180,395 | |
CLUB Credit Trust, 2.610%, 01/15/24 | | | 11/29/17 | | | | 468,076 | | | | 468,064 | | | | 465,308 | |
Commercial Mortgage Pass-Through Certificates Mortgage Trust, 4.750%, 10/15/45 | | | 02/18/15 - 02/16/17 | | | | 355,000 | | | | 256,041 | | | | 180,872 | |
Commercial Mortgage Pass-Through Certificates Mortgage Trust, 4.573%, 10/15/45 | | | 12/05/14 - 03/29/17 | | | | 210,000 | | | | 149,074 | | | | 47,611 | |
Domino’s Pizza Master Issuer LLC, 4.116%, 07/25/48 | | | 04/18/18 | | | | 696,500 | | | | 696,500 | | | | 687,146 | |
GS Mortgage Securities Trust, 3.674%, 04/10/47 | | | 04/03/14 | | | | 235,000 | | | | 147,173 | | | | 68,923 | |
JPMorgan Chase Commercial Mortgage Securities Trust, 2.733%, 10/15/45 | | | 05/19/15 | | | | 400,000 | | | | 269,984 | | | | 228,990 | |
JPMorgan Chase Commercial Mortgage Securities Trust, 4.370%, 12/15/47 | | | 03/17/14 | | | | 130,000 | | | | 105,300 | | | | 106,728 | |
Lendmark Funding Trust, 2.830%, 12/22/25 | | | 06/22/17 | | | | 680,000 | | | | 679,861 | | | | 670,933 | |
Marlette Funding Trust, 2.360%, 12/15/24 | | | 10/17/17 | | | | 192,458 | | | | 192,448 | | | | 191,882 | |
Morgan Stanley Capital Trust, 5.154%, 07/15/49 | | | 03/13/15 | | | | 265,000 | | | | 242,868 | | | | 238,705 | |
Morgan Stanley Capital Trust, 5.241%, 10/12/52 | | | 05/02/14 | | | | 55,000 | | | | 55,106 | | | | 5,147 | |
Regional Management Issuance Trust, 3.830%, 07/15/27 | | | 06/20/18 | | | | 950,000 | | | | 949,804 | | | | 953,568 | |
Skopos Auto Receivables Trust, 3.190%, 09/15/21 | | | 03/14/18 | | | | 516,415 | | | | 516,412 | | | | 515,986 | |
SoFi Consumer Loan Program LLC, 3.090%, 10/27/25 | | | 07/26/16 | | | | 256,235 | | | | 256,195 | | | | 255,700 | |
SoFi Consumer Loan Program LLC, 3.280%, 01/26/26 | | | 01/20/17 | | | | 238,394 | | | | 238,374 | | | | 238,276 | |
Vericrest Opportunity Loan Trust LLC, 3.250%, 06/25/47 | | | 06/09/17 | | | | 256,362 | | | | 256,362 | | | | 255,118 | |
WF-RBS Commercial Mortgage Trust, 5.000%, 06/15/44 | | | 03/27/14 | | | | 105,000 | | | | 94,365 | | | | 77,628 | |
WF-RBS Commercial Mortgage Trust, 3.016%, 11/15/47 | | | 11/05/14 | | | | 550,000 | | | | 362,270 | | | | 276,207 | |
Wendys Funding LLC, 3.884%, 03/15/48 | | | 12/06/17 | | | | 430,650 | | | | 430,650 | | | | 405,780 | |
Wingstop Funding LLC, 4.970%, 12/05/48 | | | 11/06/18 | | | | 405,000 | | | | 405,000 | | | | 414,173 | |
YPF S.A., 16.500%, 05/09/22 | | | 05/04/17 | | | | 19,392,845 | | | | 1,264,168 | | | | 334,720 | |
| | | | | | | | | | | | | | | | |
| | | | | | | | | | | | | | $ | 7,799,796 | |
| | | | | | | | | | | | | | | | |
TBA Forward Sale Commitments
| | | | | | | | | | | | | | | | | | | | |
Security Description | | Interest Rate | | | Maturity | | | Face
Amount | | | Cost | | | Value | |
Fannie Mae 15 Yr. Pool | | | 2.500 | % | | | TBA | | | $ | (6,341,000 | ) | | $ | (6,142,950 | ) | | $ | (6,192,823 | ) |
Fannie Mae 15 Yr. Pool | | | 3.000 | % | | | TBA | | | | (5,022,000 | ) | | | (4,979,627 | ) | | | (5,011,220 | ) |
Fannie Mae 15 Yr. Pool | | | 4.500 | % | | | TBA | | | | (1,300,000 | ) | | | (1,320,059 | ) | | | (1,322,810 | ) |
Fannie Mae 30 Yr. Pool | | | 3.000 | % | | | TBA | | | | (20,064,000 | ) | | | (19,324,937 | ) | | | (19,578,726 | ) |
Fannie Mae 30 Yr. Pool | | | 4.500 | % | | | TBA | | | | (665,000 | ) | | | (686,535 | ) | | | (688,934 | ) |
Freddie Mac 15 Yr. Gold Pool | | | 3.000 | % | | | TBA | | | | (2,625,000 | ) | | | (2,595,674 | ) | | | (2,615,083 | ) |
Freddie Mac 30 Yr. Gold Pool | | | 3.000 | % | | | TBA | | | | (275,000 | ) | | | (264,623 | ) | | | (268,035 | ) |
Freddie Mac 30 Yr. Gold Pool | | | 5.500 | % | | | TBA | | | | (200,000 | ) | | | (211,344 | ) | | | (211,662 | ) |
| | | | | | | | | | | | | | | | | | | | |
Totals | | | $ | (35,525,749 | ) | | $ | (35,889,293 | ) |
| | | | | | | | | | | | | |
| |
See accompanying notes to financial statements.
BHFTII-28
Brighthouse Funds Trust II
Brighthouse/Wellington Balanced Portfolio
Schedule of Investments as of December 31, 2018
Forward Foreign Currency Exchange Contracts
| | | | | | | | | | | | | | | | | | | | | | |
Contracts to Deliver | | | Counterparty | | Settlement
Date | | | In Exchange
for | | | Unrealized
Appreciation/
(Depreciation) | |
| CAD | | | 410,000 | | | BNP | | | 01/03/19 | | | | USD | | | | 308,580 | | | $ | 8,250 | |
| CAD | | | 500,000 | | | SSBT | | | 01/04/19 | | | | USD | | | | 376,340 | | | | 10,073 | |
| CAD | | | 300,000 | | | BOA | | | 01/15/19 | | | | USD | | | | 226,189 | | | | 6,365 | |
| CAD | | | 335,000 | | | SSBT | | | 01/15/19 | | | | USD | | | | 256,240 | | | | 10,770 | |
| CAD | | | 420,000 | | | MSIP | | | 01/16/19 | | | | USD | | | | 318,194 | | | | 10,433 | |
| CAD | | | 540,000 | | | HSBCU | | | 01/17/19 | | | | USD | | | | 407,304 | | | | 11,601 | |
| CAD | | | 270,000 | | | HSBCU | | | 01/22/19 | | | | USD | | | | 203,670 | | | | 5,795 | |
| CAD | | | 680,000 | | | HSBCU | | | 01/25/19 | | | | USD | | | | 509,930 | | | | 11,540 | |
| CAD | | | 75,000 | | | NAB | | | 01/28/19 | | | | USD | | | | 55,834 | | | | 860 | |
| CAD | | | 100,000 | | | DBAG | | | 01/30/19 | | | | USD | | | | 75,415 | | | | 2,113 | |
| CAD | | | 555,000 | | | SSBT | | | 02/07/19 | | | | USD | | | | 416,092 | | | | 9,191 | |
| CAD | | | 270,000 | | | SSBT | | | 02/19/19 | | | | USD | | | | 207,053 | | | | 9,048 | |
| CHF | | | 100,000 | | | HSBCU | | | 04/10/19 | | | | USD | | | | 101,495 | | | | (1,191 | ) |
| EUR | | | 175,000 | | | BOA | | | 01/22/19 | | | | USD | | | | 200,148 | | | | (675 | ) |
| EUR | | | 3,356,032 | | | BOA | | | 01/31/19 | | | | USD | | | | 3,866,132 | | | | 11,981 | |
| EUR | | | 90,000 | | | JPMC | | | 01/31/19 | | | | USD | | | | 104,505 | | | | 1,147 | |
| EUR | | | 360,000 | | | RBC | | | 01/31/19 | | | | USD | | | | 418,931 | | | | 5,498 | |
| EUR | | | 300,000 | | | SSBT | | | 01/31/19 | | | | USD | | | | 341,581 | | | | (2,946 | ) |
| EUR | | | 58,000 | | | SSBT | | | 01/31/19 | | | | USD | | | | 66,677 | | | | 69 | |
| EUR | | | 100,000 | | | HSBCU | | | 03/15/19 | | | | USD | | | | 114,470 | | | | (793 | ) |
| EUR | | | 899,000 | | | BOA | | | 03/20/19 | | | | USD | | | | 1,027,593 | | | | (9,085 | ) |
| GBP | | | 100,000 | | | SSBT | | | 02/27/19 | | | | USD | | | | 128,529 | | | | 725 | |
| GBP | | | 50,000 | | | SSBT | | | 02/27/19 | | | | USD | | | | 66,511 | | | | 2,609 | |
| HUF | | | 59,930,000 | | | GSI | | | 02/06/19 | | | | USD | | | | 211,096 | | | | (3,274 | ) |
| JPY | | | 500,000,000 | | | SSBT | | | 01/07/19 | | | | USD | | | | 4,456,141 | | | | (105,694 | ) |
| JPY | | | 74,850,000 | | | CBNA | | | 01/15/19 | | | | USD | | | | 662,483 | | | | (20,864 | ) |
| JPY | | | 210,950,000 | | | JPMC | | | 01/28/19 | | | | USD | | | | 1,892,998 | | | | (34,861 | ) |
| JPY | | | 125,000,000 | | | BOA | | | 02/04/19 | | | | USD | | | | 1,108,251 | | | | (34,748 | ) |
| JPY | | | 32,200,000 | | | JPMC | | | 02/04/19 | | | | USD | | | | 289,561 | | | | (4,876 | ) |
| JPY | | | 175,000,000 | | | BOA | | | 02/12/19 | | | | USD | | | | 1,552,518 | | | | (48,685 | ) |
| JPY | | | 75,000,000 | | | BOA | | | 02/19/19 | | | | USD | | | | 665,730 | | | | (20,875 | ) |
| JPY | | | 102,000,000 | | | JPMC | | | 02/19/19 | | | | USD | | | | 903,351 | | | | (30,432 | ) |
| JPY | | | 175,000,000 | | | BOA | | | 02/25/19 | | | | USD | | | | 1,554,102 | | | | (48,726 | ) |
| JPY | | | 56,700,000 | | | JPMC | | | 03/11/19 | | | | USD | | | | 504,251 | | | | (15,657 | ) |
| JPY | | | 154,150,000 | | | JPMC | | | 03/25/19 | | | | USD | | | | 1,370,010 | | | | (45,232 | ) |
| | | | | |
Net Unrealized Depreciation | | | $ | (310,546 | ) |
| | | | | |
| |
Futures Contracts
| | | | | | | | | | | | | | | | | | | | |
Futures Contracts—Long | | Expiration
Date | | | Number of
Contracts | | | Notional
Value | | | Value/
Unrealized
Appreciation/
(Depreciation) | |
90 Day Eurodollar Futures | | | 12/16/19 | | | | 189 | | | | USD | | | | 45,997,875 | | | $ | 120,538 | |
S&P 500 IndexE-Mini Futures | | | 03/15/19 | | | | 49 | | | | USD | | | | 6,137,740 | | | | 46,018 | |
U.S. Treasury Long Bond Futures | | | 03/20/19 | | | | 42 | | | | USD | | | | 6,132,000 | | | | 286,390 | |
U.S. Treasury Note 5 Year Futures | | | 03/29/19 | | | | 318 | | | | USD | | | | 36,470,625 | | | | 505,253 | |
U.S. Treasury Note Ultra 10 Year Futures | | | 03/20/19 | | | | 17 | | | | USD | | | | 2,211,328 | | | | 69,031 | |
U.S. Treasury Ultra Long Bond Futures | | | 03/20/19 | | | | 122 | | | | USD | | | | 19,600,063 | | | | 1,035,632 | |
|
Futures Contracts—Short | |
90 Day Eurodollar Futures | | | 12/14/20 | | | | (189 | ) | | | USD | | | | (46,082,925 | ) | | | (153,800 | ) |
U.S. Treasury Note 10 Year Futures | | | 03/20/19 | | | | (33 | ) | | | USD | | | | (4,026,516 | ) | | �� | (43,045 | ) |
U.S. Treasury Note 2 Year Futures | | | 03/29/19 | | | | (220 | ) | | | USD | | | | (46,708,750 | ) | | | (316,062 | ) |
| | | | | | | | | | | | | | | | | | | | |
Net Unrealized Appreciation | | | $ | 1,549,955 | |
| | | | | | | | | | | | | | | | | |
See accompanying notes to financial statements.
BHFTII-29
Brighthouse Funds Trust II
Brighthouse/Wellington Balanced Portfolio
Schedule of Investments as of December 31, 2018
Purchased Options
| | | | | | | | | | | | | | | | | | | | | | | | | | | | | | | | | | | | |
Interest Rate Swaptions | | Strike
Rate | | Counterparty | | Floating Rate
Index | | Pay/
Receive
Floating
Rate | | Expiration
Date | | | Number of
Contracts | | | Notional
Amount | | | Premiums
Paid | | | Market
Value | | | Unrealized
Appreciation/
(Depreciation) | |
Call - OTC - 30 Year IRS | | 2.450% | | BBP | | 3M LIBOR | | Pay | | | 08/02/27 | | | | 1,450,000 | | | | USD | | | | 1,450,000 | | | $ | 209,074 | | | $ | 150,770 | | | $ | (58,304 | ) |
Call - OTC - 30 Year IRS | | 2.450% | | BOA | | 3M LIBOR | | Pay | | | 08/02/27 | | | | 1,260,000 | | | | USD | | | | 1,260,000 | | | | 108,360 | | | | 131,014 | | | | 22,654 | |
Put - OTC - 10 Year IRS | | 3.200% | | DBAG | | 3M LIBOR | | Receive | | | 05/30/19 | | | | 12,605,000 | | | | USD | | | | 12,605,000 | | | | 187,814 | | | | 36,364 | | | | (151,450 | ) |
Put - OTC - 10 Year IRS | | 3.200% | | BOA | | 3M LIBOR | | Receive | | | 05/30/19 | | | | 8,825,000 | | | | USD | | | | 8,825,000 | | | | 73,318 | | | | 25,459 | | | | (47,859 | ) |
Put - OTC - 10 Year IRS | | 3.200% | | BOA | | 3M LIBOR | | Receive | | | 12/09/19 | | | | 13,000,000 | | | | USD | | | | 13,000,000 | | | | 178,100 | | | | 116,420 | | | | (61,680 | ) |
Put - OTC - 30 Year IRS | | 2.450% | | BBP | | 3M LIBOR | | Receive | | | 08/02/27 | | | | 1,450,000 | | | | USD | | | | 1,450,000 | | | | 118,147 | | | | 279,165 | | | | 161,018 | |
Put - OTC - 30 Year IRS | | 2.450% | | BOA | | 3M LIBOR | | Receive | | | 08/02/27 | | | | 1,260,000 | | | | USD | | | | 1,260,000 | | | | 288,540 | | | | 242,585 | | | | (45,955 | ) |
| | | | | | | | | | | | | | | | | | | | | | | | | | | | | | | | | | | | |
Totals | | | $ | 1,163,353 | | | $ | 981,777 | | | $ | (181,576 | ) |
| | | | | | | | | | | | | | | | | | | | | | | | | | | | | | | | | | | | |
Written Options
| | | | | | | | | | | | | | | | | | | | | | | | | | | | | | | | | | | | | | |
Credit Default Swaptions | | Strike
Spread | | Counterparty | | Reference Obligation | | Buy/Sell
Protection | | | Expiration
Date | | | Number of
Contracts | | | Notional Amount | | | Premiums
Received | | | Market
Value | | | Unrealized
Appreciation/
(Depreciation) | |
Call - OTC -5-Year CDS | | 0.775% | | GSI | | CDX.NA.IG.31 | | | Buy | | | | 01/16/19 | | | | (35,536,000 | ) | | | USD | | | | (35,536,000 | ) | | $ | (43,532 | ) | | $ | (7,224 | ) | | $ | 36,308 | |
Put - OTC -5-Year CDS | | 0.775% | | GSI | | CDX.NA.IG.31 | | | Sell | | | | 01/16/19 | | | | (35,536,000 | ) | | | USD | | | | (35,536,000 | ) | | | (104,831 | ) | | | (186,735 | ) | | | (81,904 | ) |
| | | | | | | | | | | | | | | | | | | | | | | | | | | | | | | | | | | | | | |
Totals | | | $ | (148,363 | ) | | $ | (193,959 | ) | | $ | (45,596 | ) |
| | | | | | | | | | | | | | | | | |
Swap Agreements
OTC Interest Rate Swaps
| | | | | | | | | | | | | | | | | | | | | | | | | | | | | | | | | | | | |
Pay/Receive
Floating Rate | | Floating
Rate Index | | Payment
Frequency | | | Fixed
Rate | | Payment
Frequency | | Maturity
Date | | | Counterparty | | Notional
Amount | | | Market
Value | | | Upfront
Premium
Paid | | | Unrealized
Appreciation/
(Depreciation) | |
Receive | | 12M CPI | | | Maturity | | | 2.004% | | Maturity | | | 01/15/23 | | | DBAG | | | USD | | | | 7,825,000 | | | $ | (75,227 | ) | | $ | 3,081 | | | $ | (78,308 | ) |
Receive | | CPI-U | | | Annually | | | 1.810% | | Annually | | | 09/04/25 | | | BOA | | | USD | | | | 3,803,000 | | | | 12,549 | | | | — | | | | 12,549 | |
| | | | | | | | | | | | | | | | | | | | | | | | | | | | | | | | | | | | |
Totals | | | $ | (62,678 | ) | | $ | 3,081 | | | $ | (65,759 | ) |
| | | | | | | | | | | | | | | | | | | | | | | | | | | | | | | | | | | | |
Centrally Cleared Interest Rate Swaps
| | | | | | | | | | | | | | | | | | | | | | | | | | | | | | | | | | | | | | |
Pay/Receive Floating Rate | | Floating
Rate Index | | | Payment
Frequency | | Fixed
Rate | | | Payment
Frequency | | | Maturity
Date | | | Notional
Amount | | | Market
Value | | | Upfront
Premiums
Paid/(Received) | | | Unrealized
Appreciation/
(Depreciation) | |
Receive | | | 12M FEDRC | | | Annually | | | 1.625 | % | | | Annually | | | | 11/14/26 | | | | USD | | | | 2,610,000 | | | $ | 140,084 | | | $ | — | | | $ | 140,084 | |
Receive | | | 3M LIBOR | | | Semi-Annually | | | 2.000 | % | | | Quarterly | | | | 03/21/23 | | | | USD | | | | 2,825,000 | | | | 63,793 | | | | 14,481 | | | | 49,312 | |
Receive | | | 3M LIBOR | | | Semi-Annually | | | 2.250 | % | | | Quarterly | | | | 06/20/28 | | | | USD | | | | 22,048,000 | | | | 828,987 | | | | 1,228,985 | | | | (399,998 | ) |
Receive | | | 3M LIBOR | | | Semi-Annually | | | 2.750 | % | | | Quarterly | | | | 12/20/47 | | | | USD | | | | 3,955,000 | | | | 71,472 | | | | (89,207 | ) | | | 160,679 | |
Receive | | | 3M LIBOR | | | Semi-Annually | | | 2.791 | % | | | Quarterly | | | | 09/30/25 | | | | USD | | | | 6,500,000 | | | | (71,266 | ) | | | — | | | | (71,266 | ) |
Receive | | | 3M LIBOR | | | Semi-Annually | | | 2.831 | % | | | Quarterly | | | | 12/21/28 | | | | USD | | | | 3,363,000 | | | | (35,770 | ) | | | — | | | | (35,770 | ) |
Receive | | | 3M LIBOR | | | Semi-Annually | | | 2.884 | % | | | Quarterly | | | | 12/31/48 | | | | USD | | | | 300,000 | | | | (3,075 | ) | | | — | | | | (3,075 | ) |
Receive | | | 3M LIBOR | | | Semi-Annually | | | 3.000 | % | | | Quarterly | | | | 04/30/25 | | | | USD | | | | 5,155,000 | | | | (121,874 | ) | | | 25,493 | | | | (147,367 | ) |
Receive | | | 3M LIBOR | | | Semi-Annually | | | 3.002 | % | | | Quarterly | | | | 06/18/28 | | | | USD | | | | 2,679,000 | | | | (69,280 | ) | | | — | | | | (69,280 | ) |
| | | | | | | | | | | | | | | | | | | | | | | | | | | | | | | | | | | | | | |
Totals | | | $ | 803,071 | | | $ | 1,179,752 | | | $ | (376,681 | ) |
| | | | | | | | | | | | | | | | | |
See accompanying notes to financial statements.
BHFTII-30
Brighthouse Funds Trust II
Brighthouse/Wellington Balanced Portfolio
Schedule of Investments as of December 31, 2018
Centrally Cleared Credit Default Swaps on Credit Indices—Sell Protection (d)
| | | | | | | | | | | | | | | | | | | | | | | | | | | | | | | | | | | | |
Reference Obligation | | Fixed Deal
Receive Rate | | | Payment
Frequency | | | Maturity
Date | | | Implied Credit
Spread at
December 31,
2018(b) | | | Notional
Amount(c) | | | Market Value | | | Upfront
Premiums
Paid/(Received) | | | Unrealized
Appreciation/
(Depreciation) | |
CDX.EM.30.V1 | | | 1.000 | % | | | Quarterly | | | | 12/20/23 | | | | 0.000 | % | | | USD | | | | 7,715,000 | | | $ | (362,027 | ) | | $ | (365,814 | ) | | $ | 3,787 | |
CDX.NA.HY.31.V1 | | | 5.000 | % | | | Quarterly | | | | 12/20/23 | | | | 0.000 | % | | | USD | | | | 4,360,000 | | | | 86,908 | | | | 160,492 | | | | (73,584 | ) |
CDX.NA.IG.31.V1 | | | 1.000 | % | | | Quarterly | | | | 12/20/23 | | | | 0.000 | % | | | USD | | | | 6,175,000 | | | | 34,277 | | | | 64,438 | | | | (30,161 | ) |
ITRAXX.EUR.30.V1 | | | 1.000 | % | | | Quarterly | | | | 12/20/23 | | | | 0.000 | % | | | EUR | | | | 5,120,000 | | | | 33,801 | | | | 93,853 | | | | (60,052 | ) |
| | | | | | | | | | | | | | | | | | | | | | | | | | | | | | | | | | | | |
Totals | | | $ | (207,041 | ) | | $ | (47,031 | ) | | $ | (160,010 | ) |
| | | | | | | | | | | | | | | | | | | | | | | | | | | | | |
OTC Credit Default Swaps on Sovereign Issues—Sell Protection (d)
| | | | | | | | | | | | | | | | | | | | | | | | | | | | | | | | | | | | | | |
Reference Obligation | | Fixed Deal
Receive Rate | | | Payment
Frequency | | | Maturity
Date | | | Counterparty | | Implied Credit
Spread at
December 31,
2018(b) | | | Notional
Amount(c) | | | Market
Value | | | Upfront
Premium
(Received) | | | Unrealized
Appreciation/
(Depreciation) | |
Brazilian Government International Bond
4.250%, due 01/07/25 | | | 1.000 | % | | | Quarterly | | | | 12/20/23 | | | DBAG | | | 0.000 | % | | | USD | | | | 650,000 | | | $ | (30,578 | ) | | $ | (26,869 | ) | | $ | (3,709 | ) |
Turkey Government International Bond
11.875%, due 01/15/30 | | | 1.000 | % | | | Quarterly | | | | 12/20/23 | | | MSIP | | | 0.000 | % | | | USD | | | | 350,000 | | | | (38,568 | ) | | | (42,933 | ) | | | 4,365 | |
Turkey Government International Bond
11.875%, due 01/15/30 | | | 1.000 | % | | | Quarterly | | | | 12/20/23 | | | GSI | | | 0.000 | % | | | USD | | | | 350,000 | | | | (38,568 | ) | | | (42,671 | ) | | | 4,103 | |
| | | | | | | | | | | | | | | | | | | | | | | | | | | | | | | | | | | | | | |
Totals | | | $ | (107,714 | ) | | $ | (112,473 | ) | | $ | 4,759 | |
| | | | | | | | | | | | | | | | | | | | | | | | | | | | | | | | | | | | | | |
OTC Credit Default Swaps on Credit Indices—Buy Protection (a)
| | | | | | | | | | | | | | | | | | | | | | | | | | | | | | | | | | | | | | | | |
Reference Obligation | | Fixed Deal
(Pay) Rate | | | Payment
Frequency | | | Maturity
Date | | | Counterparty | | | Implied
Credit Spread
at
December 31,
2018(b) | | | Notional
Amount(c) | | | Market
Value | | | Upfront
Premium
Paid/(Received) | | | Unrealized
Appreciation/
(Depreciation) | |
ABX.HE.PEN.AAA.06-2 (e) | | | (0.110 | %) | | | Monthly | | | | 05/25/46 | | | | JPMC | | | | 16.689 | % | | | USD | | | | 173,752 | | | $ | (18,124 | ) | | $ | 24,051 | | | $ | (42,175 | ) |
PRIMEX.ARM.2 | | | (4.580 | %) | | | Monthly | | | | 12/25/37 | | | | MSIP | | | | 0.000 | % | | | USD | | | | 318,260 | | | | — | | | | (688 | ) | | | 688 | |
| | | | | | | | | | | | | | | | | | | | | | | | | | | | | | | | | | | | | | | | |
Totals | | | $ | (18,124 | ) | | $ | 23,363 | | | $ | (41,487 | ) |
| | | | | | | | | | | | | | | | | | | | | | | | | | | | | | | | | | | | | | | | |
OTC Credit Default Swaps on Credit Indices—Sell Protection (d)
| | | | | | | | | | | | | | | | | | | | | | | | | | | | | | | | | | | | |
Reference Obligation | | Fixed Deal
Receive
Rate | | | Payment
Frequency | | | Maturity
Date | | Counterparty | | Implied Credit
Spread at
December 31,
2018(b) | | | Notional
Amount(c) | | | Market
Value | | | Upfront
Premium
Paid/
(Received) | | | Unrealized
Appreciation/
(Depreciation) | |
ABX.HE.PEN.AAA.06-2 (e) | | | 0.110% | | | | Monthly | | | 05/25/46 | | BBP | | | 16.689% | | | | USD | | | | 173,752 | | | $ | (9,339) | | | $ | (4,720) | | | $ | (4,619) | |
CMBX.NA.BB.6 | | | 5.000% | | | | Monthly | | | 05/11/63 | | CSI | | | 15.409% | | | | USD | | | | 91,000 | | | | (25,582) | | | | (15,473) | | | | (10,109) | |
CMBX.NA.BB.6 | | | 5.000% | | | | Monthly | | | 05/11/63 | | CSI | | | 15.409% | | | | USD | | | | 265,000 | | | | (74,498) | | | | (39,508) | | | | (34,990) | |
CMBX.NA.BB.6 | | | 5.000% | | | | Monthly | | | 05/11/63 | | CSI | | | 15.409% | | | | USD | | | | 270,000 | | | | (75,904) | | | | (53,314) | | | | (22,590) | |
CMBX.NA.BB.6 | | | 5.000% | | | | Monthly | | | 05/11/63 | | CSI | | | 15.409% | | | | USD | | | | 460,000 | | | | (129,318) | | | | (85,670) | | | | (43,648) | |
CMBX.NA.BB.6 | | | 5.000% | | | | Monthly | | | 05/11/63 | | CSI | | | 15.409% | | | | USD | | | | 465,000 | | | | (130,723) | | | | (86,601) | | | | (44,122) | |
CMBX.NA.BB.6 | | | 5.000% | | | | Monthly | | | 05/11/63 | | CSI | | | 15.409% | | | | USD | | | | 465,000 | | | | (130,723) | | | | (86,601) | | | | (44,122) | |
CMBX.NA.BB.6 | | | 5.000% | | | | Monthly | | | 05/11/63 | | CSI | | | 15.409% | | | | USD | | | | 465,000 | | | | (130,723) | | | | (86,601) | | | | (44,122) | |
CMBX.NA.BB.6 | | | 5.000% | | | | Monthly | | | 05/11/63 | | CSI | | | 15.409% | | | | USD | | | | 645,000 | | | | (181,326) | | | | (135,820) | | | | (45,506) | |
CMBX.NA.BB.6 | | | 5.000% | | | | Monthly | | | 05/11/63 | | GSI | | | 15.409% | | | | USD | | | | 304,000 | | | | (85,462) | | | | (50,355) | | | | (35,107) | |
CMBX.NA.BB.6 | | | 5.000% | | | | Monthly | | | 05/11/63 | | GSI | | | 15.409% | | | | USD | | | | 530,000 | | | | (148,996) | | | | (58,813) | | | | (90,183) | |
CMBX.NA.BB.6 | | | 5.000% | | | | Monthly | | | 05/11/63 | | MSIP | | | 15.409% | | | | USD | | | | 190,000 | | | | (53,414) | | | | (35,385) | | | | (18,029) | |
CMBX.NA.BB.8 | | | 5.000% | | | | Monthly | | | 10/17/57 | | CSI | | | 10.226% | | | | USD | | | | 550,000 | | | | (118,395) | | | | (156,166) | | | | 37,771 | |
CMBX.NA.BB.8 | | | 5.000% | | | | Monthly | | | 10/17/57 | | GSI | | | 10.226% | | | | USD | | | | 241,000 | | | | (51,879) | | | | (59,417) | | | | 7,538 | |
CMBX.NA.BB.8 | | | 5.000% | | | | Monthly | | | 10/17/57 | | GSI | | | 10.226% | | | | USD | | | | 580,000 | | | | (124,853) | | | | (181,510) | | | | 56,657 | |
CMBX.NA.BB.8 | | | 5.000% | | | | Monthly | | | 10/17/57 | | MSIP | | | 10.226% | | | | USD | | | | 1,289,000 | | | | (277,475) | | | | (365,997) | | | | 88,522 | |
See accompanying notes to financial statements.
BHFTII-31
Brighthouse Funds Trust II
Brighthouse/Wellington Balanced Portfolio
Schedule of Investments as of December 31, 2018
OTC Credit Default Swaps on Credit Indices—Sell Protection (d)—(Continued)
| | | | | | | | | | | | | | | | | | | | | | | | | | | | | | | | | | | | |
Reference Obligation | | Fixed Deal
Receive
Rate | | | Payment
Frequency | | | Maturity
Date | | Counterparty | | Implied Credit
Spread at
December 31,
2018(b) | | | Notional
Amount(c) | | | Market
Value | | | Upfront
Premium
Paid/
(Received) | | | Unrealized
Appreciation/
(Depreciation) | |
CMBX.NA.BBB-.6 | | | 3.000% | | | | Monthly | | | 05/11/63 | | CSI | | | 8.287% | | | | USD | | | | 185,000 | | | $ | (29,833) | | | $ | (26,509) | | | $ | (3,324) | |
CMBX.NA.BBB-.6 | | | 3.000% | | | | Monthly | | | 05/11/63 | | DBAG | | | 8.287% | | | | USD | | | | 170,000 | | | | (27,414) | | | | (25,789) | | | | (1,625) | |
CMBX.NA.BBB-.6 | | | 3.000% | | | | Monthly | | | 05/11/63 | | GSI | | | 8.287% | | | | USD | | | | 660,000 | | | | (106,431) | | | | (74,951) | | | | (31,480) | |
CMBX.NA.BBB-.6 | | | 3.000% | | | | Monthly | | | 05/11/63 | | MSIP | | | 8.287% | | | | USD | | | | 90,000 | | | | (14,513) | | | | (8,031) | | | | (6,482) | |
CMBX.NA.BBB-.6 | | | 3.000% | | | | Monthly | | | 05/11/63 | | MSIP | | | 8.287% | | | | USD | | | | 830,000 | | | | (133,845) | | | | (124,759) | | | | (9,086) | |
PRIMEX.ARM.2 | | | 4.580% | | | | Monthly | | | 12/25/37 | | JPMC | | | 0.000% | | | | USD | | | | 318,260 | | | | — | | | | 9,557 | | | | (9,557) | |
| | | | | | | | | | | | | | | | | | | | | | | | | | | | | | | | | | | | |
Totals | | | $ | (2,060,646) | | | $ | (1,752,433) | | | $ | (308,213) | |
| | | | | | | | | | | | | | | | | | | | | | | | | | | | | | | | | | | | |
| | | | |
| (a) | | If the Portfolio is a buyer of protection and a credit event occurs, as defined under the terms of that particular swap agreement, the Portfolio will either (i) receive from the seller of protection an amount equal to the notional amount of the swap and deliver the referenced obligation or underlying securities comprising the referenced index or (ii) receive a net settlement amount in the form of cash or securities equal to the notional amount of the swap less the recovery value of the referenced obligation or underlying securities comprising the referenced index. |
| (b) | | Implied credit spreads, represented in absolute terms, utilized in determining the market value of credit default swap agreements on corporate issues or indices as of period end serve as an indicator of the current status of the payment/performance risk and represent the likelihood or risk of default for the credit derivative. The implied credit spread of a particular referenced entity reflects the cost of buying/selling protection and may include upfront payments required to be made to enter into the agreement. Wider credit spreads represent a deterioration of the referenced entity’s credit soundness and a greater likelihood or risk of default or other credit event occurring as defined under the terms of the agreement. A credit spread identified as “Defaulted” indicates a credit event has occurred for the referenced entity or obligation. |
| (c) | | The maximum potential amount of future undiscounted payments that the Portfolio could be required to make under a credit default swap contract would be the notional amount of the contract. These potential amounts would be partially offset by any recovery values of the referenced debt obligation or net amounts received from the settlement of purchased protection credit default swap contracts entered into by the Portfolio for the same referenced debt obligation. |
| (d) | | If the Portfolio is a seller of protection and a credit event occurs, as defined under the terms of that particular swap agreement, the Portfolio will either (i) pay to the buyer of protection an amount equal to the notional amount of the swap and take delivery of the referenced obligation or underlying securities comprising the referenced index or (ii) pay a net settlement amount in the form of cash or securities equal to the notional amount of the swap less the recovery value of the referenced obligation or underlying securities comprising the referenced index. |
| (e) | | Significant unobservable inputs were used in the valuation of this position; i.e. Level 3. |
Glossary of Abbreviations
Counterparties
| | | | |
| (BBP)— | | Barclays Bank plc |
| (BNP)— | | BNP Paribas S.A. |
| (BOA)— | | Bank of America N.A. |
| (CBNA)— | | Citibank N.A. |
| (CSI)— | | Credit Suisse International |
| (DBAG)— | | Deutsche Bank AG |
| (GSI)— | | Goldman Sachs International |
| (HSBC)— | | HSBC Bank USA |
| (JPMC)— | | JPMorgan Chase Bank N.A. |
| (MSIP)— | | Morgan Stanley & Co. International plc |
| (NAB)— | | National Australia Bank Ltd. |
| (RBC)— | | Royal Bank of Canada |
| (SSBT)— | | State Street Bank and Trust |
Currencies
| | | | |
| (ARS)— | | Argentine Peso |
| (EGP)— | | Egyptian Pound |
| (CAD)— | | Canadian Dollar |
| (CHF)— | | Swiss Franc |
| (EUR)— | | Euro |
| (GBP)— | | British Pound |
| (HUF)— | | Hungarian Forint |
| (JPY)— | | Japanese Yen |
| (USD)— | | United States Dollar |
Index Abbreviations
| | | | |
| (ABX.HE.PEN.AAA)— | | Markit Asset-Backed Home Equity Penultimate AAA Rated Index |
| (CDOR)— | | Canadian Dollar Offered Rate |
| (CDX.EM)— | | Markit Emerging Market CDS Index |
| (CDX.NA.HY)— | | Markit North America High Yield CDS Index |
| (CDX.NA.IG)— | | Markit North America Investment Grade CDS Index |
| (CMBX)— | | Commercial Mortgage-Backed Index |
| (CMBX.NA.BB)— | | Markit North America BB Rated CMBS Index |
| (CMBX.NA.BBB-)— | | Markit North AmericaBBB- Rated CMBS Index |
| (CPI-U)— | | U.S. Consumer Price Index for All Urban Consumers |
| (EURIBOR)— | | Euro Interbank Offered Rate |
| (CPI)— | | U.S. Consumer Price Index |
| (FEDRC)— | | U.S. Federal Funds Rate Compounded |
| (FEDEFF PRV)— | | Effective Federal Funds Rate |
| (ICE)— | | Intercontinental Exchange, Inc. |
| (ITRAXX.EUR)— | | Markit iTraxx Europe Index |
| (LIBOR)— | | London Interbank Offered Rate |
| (MTA)— | | Monthly Treasury Average Index |
| (PRIMEX.ARM)— | | Markit PrimeX Adjustable RateMortgage Index |
See accompanying notes to financial statements.
BHFTII-32
Brighthouse Funds Trust II
Brighthouse/Wellington Balanced Portfolio
Schedule of Investments as of December 31, 2018
Glossary of Abbreviations—(Continued)
Other Abbreviations
| | | | |
| (ARM)— | | Adjustable-Rate Mortgage |
| (ACES)— | | Alternative Credit Enhancement Securities |
| (ADR)— | | American Depositary Receipt |
| (CDO)— | | Collateralized Debt Obligation |
| (CDS)— | | Credit Default Swap |
| (CLO)— | | Collateralized Loan Obligation |
| (CMO)— | | Collateralized Mortgage Obligation |
| (IRS)— | | Interest Rate Swap |
| (REMIC)— | | Real Estate Mortgage Investment Conduit |
Fair Value Hierarchy
Accounting principles generally accepted in the United States of America (“GAAP”) define fair market value as the price that the Portfolio would receive to sell an asset or pay to transfer a liability in an orderly transaction between market participants at the measurement date. It establishes a fair value hierarchy that prioritizes inputs to valuation methods and requires disclosure of the fair value hierarchy, separately for each major category of assets and liabilities, that segregates fair value measurements into three levels. Levels 1, 2 and 3 of the fair value hierarchy are defined as follows:
Level 1 - unadjusted quoted prices in active markets for identical investments
Level 2 - other significant observable inputs (including, but not limited to, quoted prices for similar assets or liabilities in markets that are either active or inactive; inputs other than quoted prices that are observable such as interest rates, yield curves, volatilities, prepayment speeds, loss severities, credit risks, default rates, or other market corroborated inputs)
Level 3 - significant unobservable inputs based on the best information available in the circumstances, to the extent observable inputs are unavailable (including the Portfolio’s own assumptions used in determining the fair value of investments and derivative financial instruments)
The inputs or methodologies used for valuing investments are not necessarily an indication of the risk associated with investing in them. Changes to the inputs or methodologies used may result in transfers between levels. A reconciliation of Level 3 securities, if any, will be disclosed following the fair value hierarchy table. For more information about the Portfolio’s policy regarding the valuation of investments, please refer to the Notes to Financial Statements.
The following table summarizes the fair value hierarchy of the Portfolio’s investments as of December 31, 2018:
| | | | | | | | | | | | | | | | |
| Description | | Level 1 | | | Level 2 | | | Level 3 | | | Total | |
| Common Stocks | |
Aerospace & Defense | | $ | 26,437,254 | | | $ | — | | | $ | — | | | $ | 26,437,254 | |
Air Freight & Logistics | | | 383,159 | | | | — | | | | — | | | | 383,159 | |
Airlines | | | 2,044,133 | | | | — | | | | — | | | | 2,044,133 | |
Banks | | | 22,363,851 | | | | — | | | | — | | | | 22,363,851 | |
Beverages | | | 13,508,837 | | | | — | | | | — | | | | 13,508,837 | |
Biotechnology | | | 10,220,727 | | | | — | | | | — | | | | 10,220,727 | |
Capital Markets | | | 19,002,623 | | | | — | | | | — | | | | 19,002,623 | |
Chemicals | | | 13,993,300 | | | | — | | | | — | | | | 13,993,300 | |
Commercial Services & Supplies | | | 4,610,839 | | | | — | | | | — | | | | 4,610,839 | |
Construction & Engineering | | | 654,912 | | | | — | | | | — | | | | 654,912 | |
Construction Materials | | | 694,008 | | | | — | | | | — | | | | 694,008 | |
Consumer Finance | | | 5,423,732 | | | | — | | | | — | | | | 5,423,732 | |
Containers & Packaging | | | 6,465,900 | | | | — | | | | — | | | | 6,465,900 | |
Diversified Consumer Services | | | 415,534 | | | | — | | | | — | | | | 415,534 | |
Diversified Financial Services | | | 4,209,181 | | | | — | | | | — | | | | 4,209,181 | |
Diversified Telecommunication Services | | | 13,180,554 | | | | — | | | | — | | | | 13,180,554 | |
Electric Utilities | | | 16,874,939 | | | | — | | | | — | | | | 16,874,939 | |
Electrical Equipment | | | 3,434,128 | | | | — | | | | — | | | | 3,434,128 | |
Electronic Equipment, Instruments & Components | | | 2,852,730 | | | | — | | | | — | | | | 2,852,730 | |
Energy Equipment & Services | | | 4,174,122 | | | | — | | | | — | | | | 4,174,122 | |
Entertainment | | | 7,852,344 | | | | — | | | | — | | | | 7,852,344 | |
Equity Real Estate Investment Trusts | | | 21,848,349 | | | | — | | | | — | | | | 21,848,349 | |
Food & Staples Retailing | | | 3,117,033 | | | | — | | | | — | | | | 3,117,033 | |
Food Products | | | 12,730,804 | | | | — | | | | — | | | | 12,730,804 | |
Health Care Equipment & Supplies | | | 30,879,836 | | | | — | | | | — | | | | 30,879,836 | |
Health Care Providers & Services | | | 19,589,270 | | | | — | | | | — | | | | 19,589,270 | |
Hotels, Restaurants & Leisure | | | 12,678,696 | | | | — | | | | — | | | | 12,678,696 | |
Household Durables | | | 2,385,936 | | | | — | | | | — | | | | 2,385,936 | |
Independent Power and Renewable Electricity Producers | | | 4,396,075 | | | | — | | | | — | | | | 4,396,075 | |
Industrial Conglomerates | | | 5,452,451 | | | | — | | | | — | | | | 5,452,451 | |
Insurance | | | 27,753,822 | | | | — | | | | — | | | | 27,753,822 | |
Interactive Media & Services | | | 29,426,643 | | | | — | | | | — | | | | 29,426,643 | |
Internet & Direct Marketing Retail | | | 37,865,147 | | | | — | | | | — | | | | 37,865,147 | |
IT Services | | | 31,104,456 | | | | — | | | | — | | | | 31,104,456 | |
See accompanying notes to financial statements.
BHFTII-33
Brighthouse Funds Trust II
Brighthouse/Wellington Balanced Portfolio
Schedule of Investments as of December 31, 2018
Fair Value Hierarchy—(Continued)
| | | | | | | | | | | | | | | | |
| Description | | Level 1 | | | Level 2 | | | Level 3 | | | Total | |
Life Sciences Tools & Services | | $ | 6,734,512 | | | $ | — | | | $ | — | | | $ | 6,734,512 | |
Machinery | | | 10,286,772 | | | | — | | | | — | | | | 10,286,772 | |
Marine | | | 878,038 | | | | — | | | | — | | | | 878,038 | |
Media | | | 16,284,486 | | | | — | | | | — | | | | 16,284,486 | |
Metals & Mining | | | 1,492,801 | | | | — | | | | — | | | | 1,492,801 | |
Multi-Utilities | | | 5,793,791 | | | | — | | | | — | | | | 5,793,791 | |
Oil, Gas & Consumable Fuels | | | 31,499,863 | | | | 3,007 | | | | 0 | | | | 31,502,870 | |
Personal Products | | | 5,164,263 | | | | — | | | | — | | | | 5,164,263 | |
Pharmaceuticals | | | 31,910,673 | | | | — | | | | — | | | | 31,910,673 | |
Professional Services | | | 6,685,811 | | | | — | | | | — | | | | 6,685,811 | |
Road & Rail | | | 4,938,817 | | | | — | | | | — | | | | 4,938,817 | |
Semiconductors & Semiconductor Equipment | | | 20,813,664 | | | | — | | | | — | | | | 20,813,664 | |
Software | | | 42,937,115 | | | | — | | | | — | | | | 42,937,115 | |
Specialty Retail | | | 13,246,364 | | | | — | | | | — | | | | 13,246,364 | |
Technology Hardware, Storage & Peripherals | | | 14,307,964 | | | | — | | | | — | | | | 14,307,964 | |
Textiles, Apparel & Luxury Goods | | | 8,862,410 | | | | — | | | | — | | | | 8,862,410 | |
Thrifts & Mortgage Finance | | | 1,200,850 | | | | — | | | | — | | | | 1,200,850 | |
Tobacco | | | 13,661,860 | | | | — | | | | — | | | | 13,661,860 | |
Trading Companies & Distributors | | | 1,554,517 | | | | — | | | | — | | | | 1,554,517 | |
Total Common Stocks | | | 656,279,896 | | | | 3,007 | | | | 0 | | | | 656,282,903 | |
Total U.S. Treasury & Government Agencies* | | | — | | | | 298,623,005 | | | | — | | | | 298,623,005 | |
| Corporate Bonds & Notes | |
Aerospace/Defense | | | — | | | | 2,492,067 | | | | — | | | | 2,492,067 | |
Agriculture | | | — | | | | 3,242,489 | | | | — | | | | 3,242,489 | |
Airlines | | | — | | | | 456,536 | | | | — | | | | 456,536 | |
Auto Manufacturers | | | — | | | | 3,800,745 | | | | — | | | | 3,800,745 | |
Auto Parts & Equipment | | | — | | | | 54,000 | | | | — | | | | 54,000 | |
Banks | | | — | | | | 39,081,709 | | | | 0 | | | | 39,081,709 | |
Beverages | | | — | | | | 4,681,684 | | | | — | | | | 4,681,684 | |
Biotechnology | | | — | | | | 1,481,277 | | | | — | | | | 1,481,277 | |
Building Materials | | | — | | | | 219,752 | | | | — | | | | 219,752 | |
Chemicals | | | — | | | | 4,438,689 | | | | — | | | | 4,438,689 | |
Commercial Services | | | — | | | | 2,565,215 | | | | — | | | | 2,565,215 | |
Computers | | | — | | | | 1,590,709 | | | | — | | | | 1,590,709 | |
Distribution/Wholesale | | | — | | | | 48,430 | | | | — | | | | 48,430 | |
Diversified Financial Services | | | — | | | | 1,852,181 | | | | — | | | | 1,852,181 | |
Electric | | | — | | | | 8,014,720 | | | | — | | | | 8,014,720 | |
Electronics | | | — | | | | 380,932 | | | | — | | | | 380,932 | |
Engineering & Construction | | | — | | | | 1,684,874 | | | | — | | | | 1,684,874 | |
Entertainment | | | — | | | | 152,600 | | | | — | | | | 152,600 | |
Food | | | — | | | | 2,025,495 | | | | — | | | | 2,025,495 | |
Food Service | | | — | | | | 130,662 | | | | — | | | | 130,662 | |
Forest Products & Paper | | | — | | | | 204,100 | | | | — | | | | 204,100 | |
Gas | | | — | | | | 86,688 | | | | — | | | | 86,688 | |
Healthcare-Products | | | — | | | | 2,073,903 | | | | — | | | | 2,073,903 | |
Healthcare-Services | | | — | | | | 3,072,290 | | | | — | | | | 3,072,290 | |
Home Builders | | | — | | | | 292,112 | | | | — | | | | 292,112 | |
Insurance | | | — | | | | 613,756 | | | | — | | | | 613,756 | |
Internet | | | — | | | | 2,410,967 | | | | — | | | | 2,410,967 | |
Iron/Steel | | | — | | | | 1,421,845 | | | | — | | | | 1,421,845 | |
Leisure Time | | | — | | | | 27,675 | | | | — | | | | 27,675 | |
Lodging | | | — | | | | 4,663 | | | | — | | | | 4,663 | |
Machinery-Construction & Mining | | | — | | | | 103,678 | | | | — | | | | 103,678 | |
Machinery-Diversified | | | — | | | | 54,929 | | | | — | | | | 54,929 | |
Media | | | — | | | | 9,195,719 | | | | — | | | | 9,195,719 | |
Mining | | | — | | | | 1,430,629 | | | | — | | | | 1,430,629 | |
Miscellaneous Manufacturing | | | — | | | | 222,868 | | | | — | | | | 222,868 | |
See accompanying notes to financial statements.
BHFTII-34
Brighthouse Funds Trust II
Brighthouse/Wellington Balanced Portfolio
Schedule of Investments as of December 31, 2018
Fair Value Hierarchy—(Continued)
| | | | | | | | | | | | | | | | |
| Description | | Level 1 | | | Level 2 | | | Level 3 | | | Total | |
Office/Business Equipment | | $ | — | | | $ | 172,087 | | | $ | — | | | $ | 172,087 | |
Oil & Gas | | | — | | | | 5,001,633 | | | | — | | | | 5,001,633 | |
Packaging & Containers | | | — | | | | 770,320 | | | | — | | | | 770,320 | |
Pharmaceuticals | | | — | | | | 8,787,396 | | | | — | | | | 8,787,396 | |
Pipelines | | | — | | | | 4,041,718 | | | | — | | | | 4,041,718 | |
Real Estate Investment Trusts | | | — | | | | 885,877 | | | | — | | | | 885,877 | |
Retail | | | — | | | | 2,122,944 | | | | — | | | | 2,122,944 | |
Semiconductors | | | — | | | | 4,008,511 | | | | — | | | | 4,008,511 | |
Software | | | — | | | | 1,886,310 | | | | — | | | | 1,886,310 | |
Telecommunications | | | — | | | | 7,634,592 | | | | — | | | | 7,634,592 | |
Transportation | | | — | | | | 1,421,619 | | | | — | | | | 1,421,619 | |
Trucking & Leasing | | | — | | | | 28,913 | | | | — | | | | 28,913 | |
Total Corporate Bonds & Notes | | | — | | | | 136,372,508 | | | | 0 | | | | 136,372,508 | |
| Asset-Backed Securities | |
Asset-Backed - Automobile | | | — | | | | 2,214,006 | | | | — | | | | 2,214,006 | |
Asset-Backed - Home Equity | | | — | | | | 2,176,175 | | | | — | | | | 2,176,175 | |
Asset-Backed - Other | | | — | | | | 94,073,515 | | | | 0 | | | | 94,073,515 | |
Total Asset-Backed Securities | | | — | | | | 98,463,696 | | | | 0 | | | | 98,463,696 | |
Total Mortgage-Backed Securities* | | | — | | | | 51,671,817 | | | | — | | | | 51,671,817 | |
| Floating Rate Loans | |
Aerospace/Defense | | | — | | | | 141,818 | | | | — | | | | 141,818 | |
Auto Manufacturers | | | — | | | | 95,528 | | | | — | | | | 95,528 | |
Building Materials | | | — | | | | 210,339 | | | | — | | | | 210,339 | |
Chemicals | | | — | | | | 173,461 | | | | — | | | | 173,461 | |
Commercial Services | | | — | | | | 1,394,982 | | | | — | | | | 1,394,982 | |
Computers | | | — | | | | 198,576 | | | | �� | | | | 198,576 | |
Cosmetics/Personal Care | | | — | | | | 345,984 | | | | — | | | | 345,984 | |
Diversified Financial Services | | | — | | | | 170,307 | | | | — | | | | 170,307 | |
Energy Equipment & Services | | | — | | | | 81,365 | | | | — | | | | 81,365 | |
Entertainment | | | — | | | | 161,147 | | | | — | | | | 161,147 | |
Food | | | — | | | | 95,143 | | | | — | | | | 95,143 | |
Food Products | | | — | | | | 102,823 | | | | — | | | | 102,823 | |
Healthcare-Products | | | — | | | | 94,500 | | | | — | | | | 94,500 | |
Healthcare-Services | | | — | | | | 486,518 | | | | — | | | | 486,518 | |
Insurance | | | — | | | | 680,705 | | | | — | | | | 680,705 | |
Internet | | | — | | | | 72,193 | | | | — | | | | 72,193 | |
Internet & Direct Marketing Retail | | | — | | | | 147,472 | | | | — | | | | 147,472 | |
IT Services | | | — | | | | 94,981 | | | | — | | | | 94,981 | |
Leisure Time | | | — | | | | 317,510 | | | | — | | | | 317,510 | |
Life Sciences Tools & Services | | | — | | | | 73,832 | | | | — | | | | 73,832 | |
Lodging | | | — | | | | 464,709 | | | | — | | | | 464,709 | |
Machinery | | | — | | | | 99,012 | | | | — | | | | 99,012 | |
Machinery-Construction & Mining | | | — | | | | 97,075 | | | | — | | | | 97,075 | |
Machinery-Diversified | | | — | | | | 174,119 | | | | — | | | | 174,119 | |
Media | | | — | | | | 322,241 | | | | — | | | | 322,241 | |
Miscellaneous Manufacturing | | | — | | | | 109,555 | | | | — | | | | 109,555 | |
Office/Business Equipment | | | — | | | | 140,436 | | | | — | | | | 140,436 | |
Oil & Gas | | | — | | | | 549,617 | | | | 0 | | | | 549,617 | |
Packaging & Containers | | | — | | | | 484,441 | | | | — | | | | 484,441 | |
Pharmaceuticals | | | — | | | | 477,299 | | | | — | | | | 477,299 | |
Pipelines | | | — | | | | 271,414 | | | | — | | | | 271,414 | |
Real Estate Investment Trusts | | | — | | | | 91,708 | | | | — | | | | 91,708 | |
Retail | | | — | | | | 564,866 | | | | 219,422 | | | | 784,288 | |
Semiconductors & Semiconductor Equipment | | | — | | | | 86,025 | | | | — | | | | 86,025 | |
Software | | | — | | | | 761,323 | | | | — | | | | 761,323 | |
Telecommunications | | | — | | | | 516,044 | | | | — | | | | 516,044 | |
See accompanying notes to financial statements.
BHFTII-35
Brighthouse Funds Trust II
Brighthouse/Wellington Balanced Portfolio
Schedule of Investments as of December 31, 2018
Fair Value Hierarchy— (Continued)
| | | | | | | | | | | | | | | | |
| Description | | Level 1 | | | Level 2 | | | Level 3 | | | Total | |
Transportation | | $ | — | | | $ | 94,582 | | | $ | — | | | $ | 94,582 | |
Total Floating Rate Loans | | | — | | | | 10,443,650 | | | | 219,422 | | | | 10,663,072 | |
Total Foreign Government* | | | — | | | | 6,117,085 | | | | — | | | | 6,117,085 | |
Total Municipals | | | — | | | | 3,243,479 | | | | — | | | | 3,243,479 | |
Total Short-Term Investments* | | | — | | | | 25,978,239 | | | | — | | | | 25,978,239 | |
Total Securities Lending Reinvestments* | | | — | | | | 47,565,547 | | | | — | | | | 47,565,547 | |
Purchased Options at Value | | $ | — | | | $ | 981,777 | | | $ | — | | | $ | 981,777 | |
Total Investments | | $ | 656,279,896 | | | $ | 679,463,810 | | | $ | 219,422 | | | $ | 1,335,963,128 | |
| | | | | | | | | | | | | | | | | |
Collateral for Securities Loaned (Liability) | | $ | — | | | $ | (47,560,951 | ) | | $ | — | | | $ | (47,560,951 | ) |
TBA Forward Sales Commitments | | $ | — | | | $ | (35,889,293 | ) | | $ | — | | | $ | (35,889,293 | ) |
| Forward Contracts | |
Forward Foreign Currency Exchange Contracts (Unrealized Appreciation) | | $ | — | | | $ | 118,068 | | | $ | — | | | $ | 118,068 | |
Forward Foreign Currency Exchange Contracts (Unrealized Depreciation) | | | — | | | | (428,614 | ) | | | — | | | | (428,614 | ) |
Total Forward Contracts | | $ | — | | | $ | (310,546 | ) | | $ | — | | | $ | (310,546 | ) |
| Futures Contracts | |
Futures Contracts (Unrealized Appreciation) | | $ | 2,062,862 | | | $ | — | | | $ | — | | | $ | 2,062,862 | |
Futures Contracts (Unrealized Depreciation) | | | (512,907 | ) | | | — | | | | — | | | | (512,907 | ) |
Total Futures Contracts | | $ | 1,549,955 | | | $ | — | | | $ | — | | | $ | 1,549,955 | |
Written Options at Value | | $ | — | | | $ | (193,959 | ) | | $ | — | | | $ | (193,959 | ) |
| Centrally Cleared Swap Contracts | |
Centrally Cleared Swap Contracts (Unrealized Appreciation) | | $ | — | | | $ | 353,862 | | | $ | — | | | $ | 353,862 | |
Centrally Cleared Swap Contracts (Unrealized Depreciation) | | | — | | | | (890,553 | ) | | | — | | | | (890,553 | ) |
Total Centrally Cleared Swap Contracts | | $ | — | | | $ | (536,691 | ) | | $ | — | | | $ | (536,691 | ) |
| OTC Swap Contracts | |
OTC Swap Contracts at Value (Assets) | | $ | — | | | $ | 12,549 | | | $ | — | | | $ | 12,549 | |
OTC Swap Contracts at Value (Liabilities) | | | — | | | | (2,234,248 | ) | | | (27,463 | ) | | | (2,261,711 | ) |
Total OTC Swap Contracts | | $ | — | | | $ | (2,221,699 | ) | | $ | (27,463 | ) | | $ | (2,249,162 | ) |
| | | | |
| * | | See Schedule of Investments for additional detailed categorizations. |
Level 3 investments at the beginning and/or end of the period in relation to net assets were not significant and accordingly, a reconciliation of Level 3 assets for the period ended December 31, 2018 is not presented.
See accompanying notes to financial statements.
BHFTII-36
Brighthouse Funds Trust II
Brighthouse/Wellington Balanced Portfolio
Statement of Assets and Liabilities
December 31, 2018
| | | | |
Assets | |
Investments at value (a) (b) | | $ | 1,335,963,128 | |
Cash | | | 557,071 | |
Cash denominated in foreign currencies (c) | | | 4,667,315 | |
Cash collateral for futures contracts | | | 323,400 | |
OTC swap contracts at market value (d) | | | 12,549 | |
Unrealized appreciation on forward foreign currency exchange contracts | | | 118,068 | |
Receivable for: | |
Investments sold | | | 1,808,550 | |
TBA securities sold (e) | | | 93,627,063 | |
Fund shares sold | | | 16,293 | |
Principal paydowns | | | 453 | |
Dividends and interest | | | 3,703,801 | |
Variation margin on futures contracts | | | 164,692 | |
Interest on OTC swap contracts | | | 9,376 | |
Prepaid expenses | | | 3,342 | |
| | | | |
Total Assets | | | 1,440,975,101 | |
Liabilities | |
Written options at value (f) | | | 193,959 | |
TBA forward sales commitments, at value | | | 35,889,293 | |
OTC swap contracts at market value (g) | | | 2,261,711 | |
Unrealized depreciation on forward foreign currency exchange contracts | | | 428,614 | |
Collateral for securities loaned | | | 47,560,951 | |
Payables for: | |
Investments purchased | | | 1,843,557 | |
TBA securities purchased (e) | | | 214,208,038 | |
Fund shares redeemed | | | 681,120 | |
Variation margin on centrally cleared swap contracts | | | 190,392 | |
Premium on purchased options | | | 1,394,638 | |
Interest on OTC swap contracts | | | 920 | |
Accrued Expenses: | |
Management fees | | | 428,652 | |
Distribution and service fees | | | 15,950 | |
Deferred trustees’ fees | | | 113,116 | |
Other expenses | | | 539,229 | |
| | | | |
Total Liabilities | | | 305,750,140 | |
| | | | |
Net Assets | | $ | 1,135,224,961 | |
| | | | |
Net Assets Consist of: | |
Paid in surplus | | $ | 1,040,251,040 | |
Distributable earnings (Accumulated losses) | | | 94,973,921 | |
| | | | |
Net Assets | | $ | 1,135,224,961 | |
| | | | |
Net Assets | |
Class A | | $ | 1,050,483,019 | |
Class B | | | 57,223,535 | |
Class E | | | 27,518,407 | |
Capital Shares Outstanding* | |
Class A | | | 58,964,198 | |
Class B | | | 3,235,036 | |
Class E | | | 1,548,984 | |
Net Asset Value, Offering Price and Redemption Price Per Share | |
Class A | | $ | 17.82 | |
Class B | | | 17.69 | |
Class E | | | 17.77 | |
| | | | |
| * | | The Portfolio is authorized to issue an unlimited number of shares. |
| (a) | | Identified cost of investments was $1,338,148,163. |
| (b) | | Includes securities loaned at value of $47,643,999. |
| (c) | | Identified cost of cash denominated in foreign currencies was $4,516,615. |
| (d) | | Net premium paid on OTC swap contracts was $8,869. |
| (e) | | Included within TBA securities sold is $61,238,178 related to TBA forward sale commitments and included within TBA securities purchased is $25,687,926 related to TBA forward sale commitments. |
| (f) | | Premiums received on written options were $148,363. |
| (g) | | Net premium received on OTC swap contracts was $1,847,331. |
Statement of Operations
Year Ended December 31, 2018
| | | | |
Investment Income | |
Dividends (a) | | $ | 12,094,078 | |
Interest | | | 17,883,331 | |
Securities lending income | | | 208,236 | |
| | | | |
Total investment income | | | 30,185,645 | |
Expenses | |
Management fees | | | 5,793,112 | |
Administration fees | | | 51,280 | |
Custodian and accounting fees | | | 421,155 | |
Distribution and service fees—Class B | | | 161,303 | |
Distribution and service fees—Class E | | | 46,381 | |
Audit and tax services | | | 110,757 | |
Legal | | | 45,317 | |
Trustees’ fees and expenses | | | 33,734 | |
Shareholder reporting | | | 230,731 | |
Insurance | | | 8,148 | |
Miscellaneous | | | 26,649 | |
| | | | |
Total expenses | | | 6,928,567 | |
Less management fee waiver | | | (389,598 | ) |
Less broker commission recapture | | | (5,937 | ) |
| | | | |
Net expenses | | | 6,533,032 | |
| | | | |
Net Investment Income | | | 23,652,613 | |
| | | | |
Net Realized and Unrealized Gain (Loss) | |
| Net realized gain (loss) on: | |
Investments (b) | | | 79,489,343 | |
Purchased options | | | (78,534 | ) |
Futures contracts | | | (5,258,040 | ) |
Written options | | | 276,219 | |
Swap contracts | | | 591,478 | |
Foreign currency transactions | | | 441,715 | |
Forward foreign currency transactions | | | 95,988 | |
| | | | |
Net realized gain | | | 75,558,169 | |
| | | | |
| Net change in unrealized appreciation (depreciation) on: | |
Investments | | | (143,261,421 | ) |
Purchased options | | | (2,552 | ) |
Futures contracts | | | 1,955,243 | |
Written options | | | (45,596 | ) |
Swap contracts | | | (868,990 | ) |
Foreign currency transactions | | | 156,217 | |
Forward foreign currency transactions | | | (252,031 | ) |
| | | | |
Net change in unrealized depreciation | | | (142,319,130 | ) |
| | | | |
Net realized and unrealized loss | | | (66,760,961 | ) |
| | | | |
Net Decrease in Net Assets From Operations | | $ | (43,108,348 | ) |
| | | | |
| | | | |
| (a) | | Net of foreign withholding taxes of $59,526. |
| (b) | | Net of foreign capital gains tax of $17,262. |
See accompanying notes to financial statements.
BHFTII-37
Brighthouse Funds Trust II
Brighthouse/Wellington Balanced Portfolio
Statements of Changes in Net Assets
| | | | | | | | |
| | | Year Ended
December 31,
2018 | | | Year Ended
December 31,
2017 | |
Increase (Decrease) in Net Assets: | |
From Operations | |
Net investment income | | $ | 23,652,613 | | | $ | 22,513,631 | |
Net realized gain | | | 75,558,169 | | | | 95,158,203 | |
Net change in unrealized appreciation (depreciation) | | | (142,319,130 | ) | | | 61,754,743 | |
| | | | | | | | |
Increase (decrease) in net assets from operations | | | (43,108,348 | ) | | | 179,426,577 | |
| | | | | | | | |
From Distributions to Shareholders (a) | |
Class A | | | (108,001,794 | ) | | | (50,732,601 | ) |
Class B | | | (5,815,748 | ) | | | (2,837,549 | ) |
Class E | | | (2,808,549 | ) | | | (1,344,407 | ) |
| | | | | | | | |
Total distributions | | | (116,626,091 | ) | | | (54,914,557 | ) |
| | | | | | | | |
Decrease in net assets from capital share transactions | | | (2,290,481 | ) | | | (60,192,162 | ) |
| | | | | | | | |
Total increase (decrease) in net assets | | | (162,024,920 | ) | | | 64,319,858 | |
|
Net Assets | |
Beginning of period | | | 1,297,249,881 | | | | 1,232,930,023 | |
| | | | | | | | |
End of period | | $ | 1,135,224,961 | | | $ | 1,297,249,881 | (b) |
| | | | | | | | |
Other Information:
Capital Shares
Transactions in capital shares were as follows:
| | | | | | | | | | | | | | | | |
| | | Year Ended
December 31, 2018 | | | Year Ended
December 31, 2017 | |
| | | Shares | | | Value | | | Shares | | | Value | |
Class A | |
Sales | | | 816,982 | | | $ | 16,360,943 | | | | 647,009 | | | $ | 12,618,917 | |
Reinvestments | | | 5,693,294 | | | | 108,001,794 | | | | 2,635,460 | | | | 50,732,601 | |
Redemptions | | | (6,222,593 | ) | | | (121,906,443 | ) | | | (6,017,988 | ) | | | (117,837,726 | ) |
| | | | | | | | | | | | | | | | |
Net increase (decrease) | | | 287,683 | | | $ | 2,456,294 | | | | (2,735,519 | ) | | $ | (54,486,208 | ) |
| | | | | | | | | | | | | | | | |
Class B | |
Sales | | | 166,988 | | | $ | 3,267,332 | | | | 217,028 | | | $ | 4,181,628 | |
Reinvestments | | | 308,364 | | | | 5,815,748 | | | | 148,175 | | | | 2,837,549 | |
Redemptions | | | (640,333 | ) | | | (12,596,842 | ) | | | (580,492 | ) | | | (11,297,437 | ) |
| | | | | | | | | | | | | | | | |
Net decrease | | | (164,981 | ) | | $ | (3,513,762 | ) | | | (215,289 | ) | | $ | (4,278,260 | ) |
| | | | | | | | | | | | | | | | |
Class E | |
Sales | | | 27,556 | | | $ | 537,191 | | | | 57,637 | | | $ | 1,115,254 | |
Reinvestments | | | 148,365 | | | | 2,808,549 | | | | 69,948 | | | | 1,344,407 | |
Redemptions | | | (233,060 | ) | | | (4,578,753 | ) | | | (199,319 | ) | | | (3,887,355 | ) |
| | | | | | | | | | | | | | | | |
Net decrease | | | (57,139 | ) | | $ | (1,233,013 | ) | | | (71,734 | ) | | $ | (1,427,694 | ) |
| | | | | | | | | | | | | | | | |
Decrease derived from capital shares transactions | | | | | | $ | (2,290,481 | ) | | | | | | $ | (60,192,162 | ) |
| | | | | | | | | | | | | | | | |
| | | | |
| (a) | | Distributions from net investment income and realized gains are no longer required to be separately disclosed. The presentation for the year ended December 31, 2018 has been adjusted for this change (See Note 9). At December 31, 2017 the distributions were as follows. |
| | | | | | | | |
| | | Distributions from net
investment income: | | | Distributions from realized
capital gains: | |
Class A | | $ | (22,501,887 | ) | | $ | (28,230,714 | ) |
Class B | | | (1,167,169 | ) | | | (1,670,380 | ) |
Class E | | | (570,158 | ) | | | (774,249 | ) |
| | | | |
| (b) | | As part of the update in (a), it is also no longer required to disclose the Undistributed net investment income (Accumulated losses) which was $22,368,067 as of December 31, 2017. |
See accompanying notes to financial statements.
BHFTII-38
Brighthouse Funds Trust II
Brighthouse/Wellington Balanced Portfolio
Financial Highlights
| | | | | | | | | | | | | | | | | | | | |
| Selected per share data | |
| | | Class A | |
| | | Year Ended December 31, | |
| | | 2018 | | | 2017 | | | 2016 | | | 2015 | | | 2014 | |
Net Asset Value, Beginning of Period | | $ | 20.38 | | | $ | 18.49 | | | $ | 18.66 | | | $ | 22.29 | | | $ | 20.59 | |
| | | | | | | | | | | | | | | | | | | | |
Income (Loss) from Investment Operations | |
Net investment income (a) | | | 0.37 | | | | 0.35 | | | | 0.37 | (b) | | | 0.38 | | | | 0.39 | |
Net realized and unrealized gain (loss) | | | (1.02 | ) | | | 2.40 | | | | 0.88 | | | | 0.24 | | | | 1.73 | |
| | | | | | | | | | | | | | | | | | | | |
Total income (loss) from investment operations | | | (0.65 | ) | | | 2.75 | | | | 1.25 | | | | 0.62 | | | | 2.12 | |
| | | | | | | | | | | | | | | | | | | | |
Less Distributions | |
Distributions from net investment income | | | (0.36 | ) | | | (0.38 | ) | | | (0.53 | ) | | | (0.45 | ) | | | (0.42 | ) |
Distributions from net realized capital gains | | | (1.55 | ) | | | (0.48 | ) | | | (0.89 | ) | | | (3.80 | ) | | | 0.00 | |
| | | | | | | | | | | | | | | | | | | | |
Total distributions | | | (1.91 | ) | | | (0.86 | ) | | | (1.42 | ) | | | (4.25 | ) | | | (0.42 | ) |
| | | | | | | | | | | | | | | | | | | | |
Net Asset Value, End of Period | | $ | 17.82 | | | $ | 20.38 | | | $ | 18.49 | | | $ | 18.66 | | | $ | 22.29 | |
| | | | | | | | | | | | | | | | | | | | |
Total Return (%) (c) | | | (3.76 | ) | | | 15.14 | | | | 6.99 | | | | 2.58 | | | | 10.55 | |
|
Ratios/Supplemental Data | |
Gross ratio of expenses to average net assets (%) | | | 0.53 | | | | 0.54 | | | | 0.55 | | | | 0.54 | | | | 0.53 | |
Gross ratio of expenses to average net assets excluding interest expense (%) | | | 0.53 | | | | 0.54 | | | | 0.55 | | | | 0.54 | | | | 0.53 | |
Net ratio of expenses to average net assets (%) (d)(e) | | | 0.50 | | | | 0.51 | | | | 0.52 | | | | 0.51 | | | | 0.50 | |
Net ratio of expenses to average net assets excluding interest expense (%) (d)(e) | | | 0.50 | | | | 0.51 | | | | 0.52 | | | | 0.51 | | | | 0.50 | |
Ratio of net investment income to average net assets (%) | | | 1.89 | | | | 1.78 | | | | 2.02 | (b) | | | 1.87 | | | | 1.81 | |
Portfolio turnover rate (%) | | | 341 | (f) | | | 342 | (f) | | | 405 | (f) | | | 299 | (f) | | | 413 | (f) |
Net assets, end of period (in millions) | | $ | 1,050.5 | | | $ | 1,195.7 | | | $ | 1,135.6 | | | $ | 1,168.2 | | | $ | 1,250.6 | |
| |
| | | Class B | |
| | | Year Ended December 31, | |
| | | 2018 | | | 2017 | | | 2016 | | | 2015 | | | 2014 | |
Net Asset Value, Beginning of Period | | $ | 20.24 | | | $ | 18.37 | | | $ | 18.54 | | | $ | 22.17 | | | $ | 20.48 | |
| | | | | | | | | | | | | | | | | | | | |
Income (Loss) from Investment Operations | |
Net investment income (a) | | | 0.32 | | | | 0.30 | | | | 0.32 | (b) | | | 0.33 | | | | 0.33 | |
Net realized and unrealized gain (loss) | | | (1.01 | ) | | | 2.38 | | | | 0.88 | | | | 0.23 | | | | 1.73 | |
| | | | | | | | | | | | | | | | | | | | |
Total income (loss) from investment operations | | | (0.69 | ) | | | 2.68 | | | | 1.20 | | | | 0.56 | | | | 2.06 | |
| | | | | | | | | | | | | | | | | | | | |
Less Distributions | |
Distributions from net investment income | | | (0.31 | ) | | | (0.33 | ) | | | (0.48 | ) | | | (0.39 | ) | | | (0.37 | ) |
Distributions from net realized capital gains | | | (1.55 | ) | | | (0.48 | ) | | | (0.89 | ) | | | (3.80 | ) | | | 0.00 | |
| | | | | | | | | | | | | | | | | | | | |
Total distributions | | | (1.86 | ) | | | (0.81 | ) | | | (1.37 | ) | | | (4.19 | ) | | | (0.37 | ) |
| | | | | | | | | | | | | | | | | | | | |
Net Asset Value, End of Period | | $ | 17.69 | | | $ | 20.24 | | | $ | 18.37 | | | $ | 18.54 | | | $ | 22.17 | |
| | | | | | | | | | | | | | | | | | | | |
Total Return (%) (c) | | | (4.01 | ) | | | 14.85 | | | | 6.74 | | | | 2.29 | | | | 10.28 | |
|
Ratios/Supplemental Data | |
Gross ratio of expenses to average net assets (%) | | | 0.78 | | | | 0.79 | | | | 0.80 | | | | 0.79 | | | | 0.78 | |
Gross ratio of expenses to average net assets excluding interest expense (%) | | | 0.78 | | | | 0.79 | | | | 0.80 | | | | 0.79 | | | | 0.78 | |
Net ratio of expenses to average net assets (%) (d)(e) | | | 0.75 | | | | 0.76 | | | | 0.77 | | | | 0.76 | | | | 0.75 | |
Net ratio of expenses to average net assets excluding interest expense (%) (d)(e) | | | 0.75 | | | | 0.76 | | | | 0.77 | | | | 0.76 | | | | 0.75 | |
Ratio of net investment income to average net assets (%) | | | 1.64 | | | | 1.53 | | | | 1.77 | (b) | | | 1.62 | | | | 1.56 | |
Portfolio turnover rate (%) | | | 341 | (f) | | | 342 | (f) | | | 405 | (f) | | | 299 | (f) | | | 413 | (f) |
Net assets, end of period (in millions) | | $ | 57.2 | | | $ | 68.8 | | | $ | 66.4 | | | $ | 66.6 | | | $ | 71.6 | |
Please see following page for Financial Highlights footnote legend.
See accompanying notes to financial statements.
BHFTII-39
Brighthouse Funds Trust II
Brighthouse/Wellington Balanced Portfolio
Financial Highlights
| | | | | | | | | | | | | | | | | | | | |
| Selected per share data | |
| | | Class E | |
| | | Year Ended December 31, | |
| | | 2018 | | | 2017 | | | 2016 | | | 2015 | | | 2014 | |
Net Asset Value, Beginning of Period | | $ | 20.33 | | | $ | 18.44 | | | $ | 18.61 | | | $ | 22.24 | | | $ | 20.54 | |
| | | | | | | | | | | | | | | | | | | | |
Income (Loss) from Investment Operations | |
Net investment income (a) | | | 0.34 | | | | 0.32 | | | | 0.34 | (b) | | | 0.35 | | | | 0.35 | |
Net realized and unrealized gain (loss) | | | (1.02 | ) | | | 2.40 | | | | 0.87 | | | | 0.23 | | | | 1.74 | |
| | | | | | | | | | | | | | | | | | | | |
Total income (loss) from investment operations | | | (0.68 | ) | | | 2.72 | | | | 1.21 | | | | 0.58 | | | | 2.09 | |
| | | | | | | | | | | | | | | | | | | | |
Less Distributions | |
Distributions from net investment income | | | (0.33 | ) | | | (0.35 | ) | | | (0.49 | ) | | | (0.41 | ) | | | (0.39 | ) |
Distributions from net realized capital gains | | | (1.55 | ) | | | (0.48 | ) | | | (0.89 | ) | | | (3.80 | ) | | | 0.00 | |
| | | | | | | | | | | | | | | | | | | | |
Total distributions | | | (1.88 | ) | | | (0.83 | ) | | | (1.38 | ) | | | (4.21 | ) | | | (0.39 | ) |
| | | | | | | | | | | | | | | | | | | | |
Net Asset Value, End of Period | | $ | 17.77 | | | $ | 20.33 | | | $ | 18.44 | | | $ | 18.61 | | | $ | 22.24 | |
| | | | | | | | | | | | | | | | | | | | |
Total Return (%) (c) | | | (3.88 | ) | | | 14.95 | | | | 6.83 | | | | 2.41 | | | | 10.41 | |
|
Ratios/Supplemental Data | |
Gross ratio of expenses to average net assets (%) | | | 0.68 | | | | 0.69 | | | | 0.70 | | | | 0.69 | | | | 0.68 | |
Gross ratio of expenses to average net assets excluding interest expense (%) | | | 0.68 | | | | 0.69 | | | | 0.70 | | | | 0.69 | | | | 0.68 | |
Net ratio of expenses to average net assets (%) (d)(e) | | | 0.65 | | | | 0.66 | | | | 0.67 | | | | 0.66 | | | | 0.65 | |
Net ratio of expenses to average net assets excluding interest expense (%) (d)(e) | | | 0.65 | | | | 0.66 | | | | 0.67 | | | | 0.66 | | | | 0.65 | |
Ratio of net investment income to average net assets (%) | | | 1.74 | | | | 1.63 | | | | 1.87 | (b) | | | 1.72 | | | | 1.66 | |
Portfolio turnover rate (%) | | | 341 | (f) | | | 342 | (f) | | | 405 | (f) | | | 299 | (f) | | | 413 | (f) |
Net assets, end of period (in millions) | | $ | 27.5 | | | $ | 32.6 | | | $ | 30.9 | | | $ | 32.4 | | | $ | 36.1 | |
| | | | |
| (a) | | Per share amounts based on average shares outstanding during the period. |
| (b) | | Net investment income per share and the ratio of net investment income to average net assets include anon-recurring refund for overbilling of prior years’ custodianout-of-pocket fees which amounted to less than $0.01 per share and 0.04% of average net assets, respectively. |
| (c) | | Total return does not reflect any insurance, sales, separate account or administrative charges of variable annuity or life insurance contracts or any additional expenses that contract owners may bear under their variable contracts. If these charges were included, the returns would be lower. |
| (d) | | Includes the effects of management fee waivers (see Note 6 of the Notes to Financial Statements). |
| (e) | | The effect of the voluntary portion of the waivers on the net ratio of expenses to average net assets was 0.03% for the years ended December 31, 2018 through 2014. (see Note 6 of the Notes to Financial Statements). |
| (f) | | Includes mortgage dollar roll and TBA transactions; excluding these transactions the portfolio turnover rates would have been 62%, 74%, 58%, 71% and 163% for the years ended December 31, 2018, 2017, 2016, 2015 and 2014, respectively. |
See accompanying notes to financial statements.
BHFTII-40
Brighthouse Funds Trust II
Brighthouse/Wellington Balanced Portfolio
Notes to Financial Statements—December 31, 2018
1. Organization
Brighthouse Funds Trust II (the “Trust”) is organized as a Delaware statutory trust and registered under the Investment Company Act of 1940, as amended (the “1940 Act”), as anopen-end management investment company. The Trust, which is managed by Brighthouse Investment Advisers, LLC (“Brighthouse Investment Advisers” or the “Adviser”), currently offers twenty-nine series, each of which operates as a distinct investment vehicle of the Trust. The series included in this report is Brighthouse/Wellington Balanced Portfolio (the “Portfolio”), which is diversified. Shares of the Portfolio are not offered directly to the general public and are currently available only to separate accounts of insurance companies, including insurance companies affiliated with the Adviser (together, the “Insurance Companies”).
The Portfolio has registered and offers three classes of shares: Class A, B and E shares. Shares of each Class of the Portfolio represent an equal pro rata interest in the Portfolio and generally give the shareholder the same voting, dividend, liquidation, and other rights. Investment income, realized and unrealized capital gains and losses, the common expenses of the Portfolio, and certain Portfolio-level expense reductions, if any, are allocated on a pro rata basis to each Class based on the relative net assets of each Class to the net assets of the Portfolio. Each Class of shares differs in its respective distribution plan and such distribution expenses are allocated to the corresponding Class of shares.
2. Significant Accounting Policies
The preparation of financial statements in conformity with accounting principles generally accepted in the United States of America (“GAAP”) requires management to make estimates and assumptions that affect the reported amounts of assets and liabilities and disclosure of contingent assets and liabilities as of the date of the financial statements and the reported amounts of income and expenses during the reporting period. Actual results could differ from those estimates. In the preparation of these financial statements, management has evaluated events and transactions subsequent to December 31, 2018 through the date the financial statements were issued.
The Portfolio is an investment company and follows the accounting and reporting guidance of the Financial Accounting Standards Board (“FASB”) Accounting Standards Codification Topic946- Financial Services- Investment Companies. The following is a summary of significant accounting policies consistently followed by the Portfolio in the preparation of its financial statements.
Investment Valuation and Fair Value Measurements - The Portfolio values its portfolio investments for purposes of calculating its net asset value (“NAV”) using procedures approved by the Board of Trustees of the Trust (the “Board” or “Trustees”). Those procedures allow for a variety of methodologies to be used to value the Portfolio’s investments. The specific methodologies used for a particular investment may vary based on the market data available for a specific investment at the time the Portfolio calculates its NAV or based on other considerations. The procedures also permit a level of judgment to be used in the valuation process. The Portfolio follows the accounting and reporting guidance of FASB Accounting Standards Codification Topic820- Fair Value Measurement.
Debt securities, including corporate, convertible and municipal bonds and notes; obligations of the U.S. Treasury and U.S. government agencies; foreign sovereign issues; andnon-U.S. bonds, are generally valued on the basis of evaluated or composite bid quotations obtained from independent pricing services and/or brokers and dealers selected by the Adviser (each a “pricing service”), pursuant to the authorization of and subject to general oversight by the Board. Such pricing services may use matrix pricing, which considers observable inputs including, among other things, issuer details, maturity dates, interest rates, yield curves, rates of prepayment, credit risks/spreads, default rates, reported trades, broker-dealer quotes and quoted prices for similar assets. Short-term obligations with a remaining maturity of sixty days or less may be valued at amortized cost in the absence of market quotes, so long as the amortized cost value of such short-term debt instrument is approximately the same as the fair value of the instrument as determined without the use of amortized cost valuation. Floating rate loans are generally valued on the basis of an evaluated or composite average of aggregate bid and ask quotations supplied by brokers or dealers, as obtained from the pricing service. Securities that use similar valuation techniques and inputs as described above are generally categorized as Level 2 within the fair value hierarchy.
Mortgage- and asset-backed securities are generally valued on the basis of evaluated or composite bid quotations obtained from pricing services selected by the Adviser pursuant to authorization of and subject to general oversight by the Board. These securities are usually issued as separate tranches, or classes, of securities within each deal. The pricing models for these securities usually consider tranche-level attributes, current market data, estimated cash flows and market-based yield spreads for each tranche and incorporate deal collateral performance, as available. Mortgage- and asset-backed securities that use similar valuation techniques and inputs as described above are generally categorized as Level 2 within the fair value hierarchy.
Domestic and foreign equity securities, such as common stock, exchange-traded funds, rights, warrants, and preferred stock, that are traded on a securities exchange on a valuation date are generally valued at their last quoted sale price or official closing price on the primary exchange for such security, or, if no sales occurred on that day, at the last reported bid price. Equity securities tradedover-the-counter (“OTC”) are generally valued at the last reported bid price. In the event of a major exchange closing during the trading day, the Adviser may use other market information obtained from quotation reporting systems, established market makers, or
BHFTII-41
Brighthouse Funds Trust II
Brighthouse/Wellington Balanced Portfolio
Notes to Financial Statements—December 31, 2018—(Continued)
pricing services in valuing the securities. Valuation adjustments may be applied to certain foreign equity securities that are traded solely on foreign exchanges that close before the time as of which the Portfolio determines its NAV to account for the market movement between the close of the foreign exchanges and the time as of which the Portfolio determines its NAV. The Portfolio may use a systematic fair valuation model provided by a pricing service to value securities principally traded in these foreign markets in order to adjust for possible market movements or other changes that may occur between the close of the foreign exchanges and the time as of which the Portfolio determines its NAV. Foreign equity securities valued using these valuation adjustments are generally categorized as Level 2 within the fair value hierarchy. Equity securities that are actively traded, and have no valuation adjustments applied, are categorized as Level 1 within the fair value hierarchy. Other equity securities traded on inactive markets, or valued in reference to similar instruments traded on active markets, are generally categorized as Level 2 within the fair value hierarchy.
Investments in registeredopen-end management investment companies are valued at reported NAV per share on the valuation date and are categorized as Level 1 within the fair value hierarchy.
Foreign currency forward contracts are valued through an independent pricing service by interpolating between forward and spot currency rates in the London foreign exchange markets as of a designated hour on a valuation day. These contracts are generally categorized as Level 2 within the fair value hierarchy.
Options, whether on securities, indices, futures contracts, or otherwise, traded on exchanges are valued at the last sale price available as of the close of business on a valuation day or, if there is no such price available, at the last reported bid price. These types of options are categorized as Level 1 within the fair value hierarchy. Futures contracts that are traded on commodity exchanges are valued at their settlement prices established by the exchanges on which they are traded as of the close of such exchanges and are categorized as Level 1 within the fair value hierarchy.
Options, including options on swaps (“swaptions”), currencies, and futures contracts that are traded OTC are generally valued on the basis of interdealer bid and ask prices or prices provided by pricing service providers who use a series of techniques, including simulation pricing models, to determine the value of the contracts. The pricing models use inputs that are observed from actively quoted markets such as issuer details, indices, spreads, interest rates, yield curves, credit curves, measures of volatility and exchange rates. These contracts are generally categorized as Level 2 within the fair value hierarchy.
Swap contracts (other than centrally cleared swaps) aremarked-to-market daily based on quotations and prices supplied by market makers, broker-dealers and other pricing services. Such quotations and prices are derived utilizing observable data, including the underlying reference securities or indices, credit spread quotations and expected default recovery rates determined by the pricing service. These contracts are generally categorized as Level 2 within the fair value hierarchy.
Centrally cleared swaps listed or traded on a multilateral or trade facility platform, such as a registered exchange, are valued at the daily settlement price determined by the respective exchange or a pricing service when the exchange price is not available. For centrally cleared credit default swaps, the clearing facility requires its members to provide actionable price levels across complete term structures. These levels along with external third-party prices are used to produce daily settlement prices. These securities are categorized as Level 2 within the fair value hierarchy. Centrally cleared interest rate swaps are valued using a pricing model that references the underlying rates, including the overnight index swap rate and London Interbank Offered Rate (“LIBOR”) forward rate to produce the daily settlement price. These securities are categorized as Level 2 within the fair value hierarchy.
If no current market value quotation or other observable inputs are readily available or market value quotations are deemed to be unreliable for an investment, the fair value of the investment will be determined in accordance with procedures approved by, and under the general supervision of, the Board. In such a circumstance, the Board will be assisted in its responsibility to determine the fair value of an investment by the Valuation Committee (“Committee”) of Brighthouse Investment Advisers. The Committee provides general pricing oversight and fair value pricing determinations related to portfolio securities and meets on a regular basis to review reports relating to the valuation of the securities in the Portfolio. The Board has delegated to State Street Bank and Trust Company, the Trust’s Custodian (“Custodian”), the responsibility for calculating the NAVs of the Trust’s Portfolios. The Committee is responsible for overseeing the calculation of the NAVs of the Portfolios by the Custodian. The Committee also periodically reviews pricing services, including the pricing services providing fair value pricing for the Portfolio’s foreign securities, and is responsible for overseeing the correction of pricing errors and addressing other pricing issues that arise in the ordinary course of business, such as making real-time fair value determinations, as necessary.
No single standard for determining the fair value of an investment can be set forth because fair value depends upon the facts and circumstances with respect to each investment. Information relating to any relevant factors may be obtained by the Committee from any appropriate source, including the subadviser of the Portfolio, the Custodian, a pricing service, market maker and/or broker for such security or the issuer. Appropriate methodologies for determining fair value under particular circumstances may include: matrix pricing, a discounted cash flow analysis, comparisons of securities with comparable characteristics, value based on multiples of earnings, discount from market price of similar marketable securities, or a combination of these and other methods.
BHFTII-42
Brighthouse Funds Trust II
Brighthouse/Wellington Balanced Portfolio
Notes to Financial Statements—December 31, 2018—(Continued)
Investment Transactions and Related Investment Income - Portfolio security transactions are recorded on the trade date. Dividend income is recorded on theex-dividend date or, for certain foreign securities, when notified. Interest income, which includes amortization of premium and accretion of discount on debt securities, is recorded on the accrual basis. Realized gains and losses on investments are determined on the identified cost basis, which is the same basis used for federal income tax purposes. Foreign income and foreign capital gains on some foreign securities may be subject to foreign taxes, which are accrued as applicable. These foreign taxes have been provided for in accordance with the Portfolio’s understanding of the applicable countries’ tax rules and rates.
Foreign Currency Translation -The books and records of the Portfolio are maintained in U.S. dollars. The values of securities, currencies, and other assets and liabilities denominated in currencies other than the U.S. dollar are translated into U.S. dollars based upon foreign exchange rates prevailing at the end of the period. Purchases and sales of investment securities, income, and expenses are translated on the respective dates of such transactions. Because the values of investment securities are translated at the foreign exchange rates prevailing at the end of the period, that portion of the results of operations arising from changes in exchange rates and that portion of the results of operations reflecting fluctuations arising from changes in market prices of the investment securities are not separated. Such fluctuations are included in the net realized and unrealized gain or loss on investments.
Net realized foreign exchange gains or losses arise from activity in forward foreign currency exchange contracts, sales of foreign currency, currency gains or losses realized between the trade and settlement dates on securities transactions, and the difference between the amounts of dividends, interest, and foreign withholding taxes recorded by the Portfolio and the U.S. dollar-equivalent of the amounts actually received or paid by the Portfolio. Net unrealized foreign exchange gains and losses arise from changes in the value of assets and liabilities, other than investment securities, resulting from changes in foreign exchange rates.
Dividends and Distributions to Shareholders -The Portfolio records dividends and distributions on theex-dividend date. Net realized gains from securities transactions (if any) are generally distributed annually to shareholders. The timing and characterization of certain income and capital gains distributions are determined in accordance with federal tax regulations that may differ from GAAP. Permanent book and tax basis differences relating to shareholder distributions will result in reclassification between distributable earnings (accumulated losses) andpaid-in surplus. These adjustments have no impact on net assets or the results of operations.
Income Taxes -It is the Portfolio’s policy to comply with the requirements of the Internal Revenue Code of 1986, as amended, and regulations thereunder, applicable to regulated investment companies, and to distribute, with respect to each taxable year, all of its taxable income to shareholders. Therefore, no federal income tax provision is required. The Portfolio files U.S. federal tax returns. No income tax returns are currently under examination. The Portfolio’s federal tax returns for the prior three fiscal years remain subject to examination by the Internal Revenue Service. As of December 31, 2018, the Portfolio had no uncertain tax positions that would require financial statement recognition, or derecognition or disclosure.
Mortgage Dollar Rolls -The Portfolio may enter into mortgage “dollar rolls” in which a Portfolio sellsto-be-announced (“TBA”) mortgage-backed securities for delivery in the current month and simultaneously contracts to repurchase substantially similar (same type, coupon, and maturity) securities on a specified future date. For the duration of the transaction, or roll period, the Portfolio foregoes principal (including prepayments of principal) and interest paid on the securities sold. Dollar rolls are accounted for as purchase and sale transactions; gain or loss is recognized at the commencement of the term of the dollar roll and each time the mortgage-backed security is rolled.
Mortgage dollar roll transactions involve the risk that the market value of the securities that the Portfolio is required to repurchase or reacquire may be less than the agreed-upon repurchase price of those securities and that the investment performance of securities purchased with proceeds from these transactions does not exceed the income, capital appreciation, and gain or loss that would have been realized on the securities transferred or sold, as applicable, as part of the treasury or mortgage dollar roll.
Mortgage-Related and Other Asset-Backed Securities - The Portfolio may invest in mortgage-related or other asset-backed securities. These securities may include mortgage pass-through securities, collateralized mortgage obligations (“CMOs”), commercial mortgage-backed securities, CMO residuals, stripped mortgage-backed securities (“SMBS”), and other securities that directly or indirectly represent a participation in, or are secured by or payable from, mortgage loans on real property or other receivables. The value of some mortgage- or asset-backed securities may be particularly sensitive to changes in prevailing interest rates. Early repayment of principal on some mortgage-related securities may expose the Portfolio to a lower rate of return upon reinvestment of principal. The value of these securities may fluctuate in response to the market’s perception of the creditworthiness of the issuers. Additionally, although mortgages and mortgage-related securities are generally supported by some form of government or private guarantee and/or insurance, there is no assurance that private guarantors or insurers will meet their obligations.
In one type of SMBS, one class receives all of the interest from the mortgage assets (the interest-only or “IO” class), while the other class will receive all of the principal (the principal-only or “PO” class). Because principal will not be received at the maturity of an IO, adjustments are made to the book value of the security until maturity. These adjustments are netted against payments received for the IOs and the net amount is included in interest income on the Statement of Operations of the Portfolio. Payments received for POs are treated as reductions to the cost and par value of the securities. Details of mortgage-related and other asset-backed securities held by the Portfolio are included in the Portfolio’s Schedule of Investments.
BHFTII-43
Brighthouse Funds Trust II
Brighthouse/Wellington Balanced Portfolio
Notes to Financial Statements—December 31, 2018—(Continued)
The Portfolio may invest a significant portion of its assets in securities of issuers that hold mortgage- and asset-backed securities and direct investments in securities backed by commercial and residential mortgage loans and other financial assets. The value and related income of these securities are sensitive to changes in economic conditions, including delinquencies and/or defaults, and may be negatively impacted by increased volatility of market prices and periods of illiquidity.
TBA Purchase and Forward Sale Commitments -The Portfolio may enter into TBA commitments to purchase or sell securities for a fixed price at a future date. TBA commitments are considered securities in themselves, and involve a risk of loss if the value of the security to be purchased or sold declines or increases prior to the settlement date, which is in addition to the risk of decline in the value of the Portfolio’s other assets. TBA forward sale commitments are valued at the current market value of the underlying securities, according to the procedures described under “Investment Valuation and Fair Value Measurements”.
When-Issued and Delayed-Delivery Securities- The Portfolio may purchase securities on a when-issued or delayed-delivery basis. Settlement of such transactions will occur beyond the customary settlement period. The Portfolio may purchase securities under such conditions only with the intention of actually acquiring them, but may enter into a separate agreement to sell the securities before the settlement date. Since the value of securities purchased may fluctuate prior to settlement, the Portfolio may be required to pay more at settlement than the security is worth. In addition, the Portfolio is not entitled to any of the interest earned prior to settlement.
Upon making a commitment to purchase a security on a when-issued or delayed-delivery basis, the Portfolio will hold liquid assets in a segregated account with the Portfolio’s Custodian, or set aside liquid assets in the Portfolio’s records, worth at least the equivalent of the amount due. The liquid assets will be monitored on a daily basis and adjusted as necessary to maintain the necessary value.
High-Yield Debt Securities - The Portfolio may invest in high-yield debt securities, or “junk bonds,” which are securities that are rated below “investment grade” or, if not rated, are of equivalent quality. A portfolio with high-yield debt securities generally will be exposed to greater market risk and credit risk than a portfolio that invests only in investment grade debt securities because issuers of high-yield debt securities are generally less secure financially, are more likely to default on their obligations, and their securities are more sensitive to interest rate changes and downturns in the economy. In addition, the secondary market for lower-rated debt securities may not be as liquid as that for more highly rated debt securities. As a result, the Portfolio’s subadviser may find it more difficult to value lower-rated debt securities or sell them and may have to sell them at prices significantly lower than the values assigned to them by the Portfolio.
Floating Rate Loans - The Portfolio may invest in loans arranged through private negotiation between one or more financial institutions. The Portfolio’s investment in any such loan may be in the form of a participation in or an assignment of the loan. In connection with purchasing participations, the Portfolio generally will have no right to enforce compliance by the borrower with the terms of the loan agreement relating to the loan, nor any rights ofset-off against the borrower. The Portfolio may not benefit directly from any collateral supporting the loan in which it has purchased the participation or assignment. The purchase of assignments will typically result in the Portfolio having a direct contractual relationship with the borrower, and the Portfolio may enforce compliance by the borrower with the terms of the loan agreement.
The Portfolio may invest in multiple series or tranches of a loan, which may have varying terms and carry different associated risks. When the Portfolio purchases assignments, it acquires direct rights against the borrower of the loan. These loans may include participations in bridge loans, which are loans taken out by borrowers for a short period (typically less than one year) pending arrangement of more permanent financing.
The Portfolio will assume the credit risk of both the borrower and the lender that is selling the participation. In the event of the insolvency of the lender selling the participation, the Portfolio may be treated as a general creditor of the lender and may not benefit from anyset-off between the lender and the borrower.
Unfunded Loan Commitments - The Portfolio may enter into certain credit agreements, all or a portion of which may be unfunded. The Portfolio is obligated to fund these commitments at the borrower’s discretion. These commitments, if any, are disclosed in the Schedule of Investments. As of December 31, 2018, the Portfolio did not have any unfunded loan commitments.
Directed Brokerage Agreement -The Trust has entered into a directed brokerage arrangement with Capital Institutional Services, Inc. (“CAPIS”). Under this arrangement, the Portfolio directs certain trades to CAPIS in return for a recapture credit. CAPIS issues a cash rebate to the Portfolio. Amounts paid to the Portfolio are shown separately as broker commission recapture on the Statement of Operations of the Portfolio. Additionally, these amounts have been excluded from the calculation of the net ratio of expenses to average net assets presented in the Financial Highlights for each share class.
Repurchase Agreements -The Portfolio may enter into repurchase agreements, under the terms of a Master Repurchase Agreement (“MRA”), with selected commercial banks and broker-dealers, under which the Portfolio acquires securities as collateral and agrees to resell the securities at an agreed-upon time and at an agreed-upon price. The Portfolio, through the Custodian or a subcustodian, under atri-party repurchase agreement, receives delivery of the underlying securities collateralizing any repurchase agreements. It is the Portfolio’s policy that the market value of the collateral be equal to at least 100% of the repurchase price in the case of a
BHFTII-44
Brighthouse Funds Trust II
Brighthouse/Wellington Balanced Portfolio
Notes to Financial Statements—December 31, 2018—(Continued)
repurchase agreement ofone-day duration and equal to at least 102% of the repurchase price in the case of all other repurchase agreements. In the event of default or failure by a party to perform an obligation in connection with any repurchase transaction, the MRA gives thenon-defaulting party the right toset-off claims and to apply property held by it in connection with any repurchase transaction against obligations owed to it.
At December 31, 2018, the Portfolio had direct investments in repurchase agreements with a gross value of $11,100,548. Additionally, the Portfolio invested cash collateral for loans of portfolio securities in repurchase agreements with a gross value of $14,825,176. The combined value of all repurchase agreements is included as part of investments at value on the Statement of Assets and Liabilities. The value of the related collateral exceeded the value of the repurchase agreements at December 31, 2018.
Securities Lending - The Portfolio may lend its portfolio securities to certain qualified brokers who borrow securities in order to complete certain securities transactions. By lending its portfolio securities, the Portfolio attempts to increase its net investment income through the receipt of income on collateral held from securities on loan. Any gain or loss in the market price of the loaned securities that might occur and any interest earned or dividends declared during the term of the loan would accrue to the account of the Portfolio.
The Trust has entered into aNon-Custodial Securities Lending Agreement with JPMorgan Chase Bank, N.A. (the “Lending Agent”). Under the agreement, the Lending Agent is authorized to loan portfolio securities on the Portfolio’s behalf. In exchange, the Portfolio receives either cash or U.S. government securities as collateral against the loaned securities. The Portfolio receives collateral equal to at least 102% of the market value for loans secured by government securities or cash in the same currency as the loaned shares and 105% for all other loaned securities at each loan’s inception. Collateral representing at least 100% of the market value of the loaned securities is maintained for the duration of the loan. Any cash collateral received by the Portfolio is generally invested by the Lending Agent in short-term investments, which may include certificates of deposit, commercial paper, repurchase agreements, time deposits, master demand notes and money market funds. The market value of investments made with cash collateral received are disclosed in the Schedule of Investments and the valuation techniques are described in Note 2. If the market value of the collateral at the close of trading on a business day is less than 100% of the market value of the loaned securities at the close of trading on that day, the borrower is required to deliver, by the close of business on the following business day, an additional amount of collateral, so that the total amount of posted collateral is equal to at least 100% of the market value of all the loaned securities as of such preceding day. A portion of the income earned on the collateral is rebated to the borrower of the securities and the remainder is split between the Lending Agent and the Portfolio. On loans collateralized by U.S. government securities, a fee is received from the borrower and is allocated between the Portfolio and the Lending Agent.
Income received by the Portfolio in securities lending transactions during the year ended December 31, 2018 is reflected as securities lending income on the Statement of Operations. The values of any securities loaned by the Portfolio and the related collateral at December 31, 2018 are disclosed in the footnotes to the Schedule of Investments. The value of the related collateral received by the Portfolio exceeded the value of the securities out on loan at December 31, 2018.
The risks associated with lending portfolio securities include, but are not limited to, possible delays in receiving additional collateral or in the recovery of the loaned securities, possible loss of rights in the collateral should the borrower fail financially, as well as risk of loss in the value of the collateral or the value of the investments made with the collateral. The Lending Agent shall indemnify the Portfolio in the case of default of any securities borrower, subject to the terms of theNon-Custodial Securities Lending Agreement.
The following table provides a breakdown of transactions accounted for as secured borrowings, the gross obligations by the type of collateral pledged, and the remaining contractual maturities of those transactions.
| | | | | | | | | | | | | | | | | | | | |
| | | Remaining Contractual Maturity of the Agreements
As of December 31, 2018 | |
| | | Overnight and
Continuous | | | Up to
30 Days | | | 31 - 90
Days | | | Greater than
90 days | | | Total | |
| Securities Lending Transactions | |
Common Stocks | | $ | (43,587,787 | ) | | $ | — | | | $ | — | | | $ | — | | | $ | (43,587,787 | ) |
Corporate Bonds & Notes | | | (3,973,164 | ) | | | — | | | | — | | | | — | | | | (3,973,164 | ) |
Total | | $ | (47,560,951 | ) | | $ | — | | | $ | — | | | $ | — | | | $ | (47,560,951 | ) |
Total Borrowings | | $ | (47,560,951 | ) | | $ | — | | | $ | — | | | $ | — | | | $ | (47,560,951 | ) |
Gross amount of recognized liabilities for securities lending transactions | | | $ | (47,560,951 | ) |
| | | | | | | | | | | | | | | | | | | | |
3. Investments in Derivative Instruments
Forward Foreign Currency Exchange Contracts - The Portfolio may enter into forward foreign currency exchange contracts to obtain investment exposure, enhance return or hedge or protect its portfolio holdings against the risk of future movements in certain foreign
BHFTII-45
Brighthouse Funds Trust II
Brighthouse/Wellington Balanced Portfolio
Notes to Financial Statements—December 31, 2018—(Continued)
currency exchange rates. When entering into these contracts, the Portfolio agrees to receive or deliver a fixed quantity of foreign currency for an agreed-upon price on an agreed-upon future date. These contracts are valued daily and the Portfolio’s net equity therein, representing unrealized gain or loss on the contracts as measured by the difference between the forward foreign exchange rates at the dates of entry into the contracts and the forward foreign exchange rates at the valuation date, is included in the Statement of Assets and Liabilities. When a contract is closed, the Portfolio recognizes a realized gain or loss equal to the difference between the value of the contract at the time it was opened and the value at the time it was closed.
Realized and unrealized gains and losses on forward foreign currency exchange contracts are included in the Statement of Operations. These contracts involve market and/or credit risk in excess of the amount recognized in the Statement of Assets and Liabilities. The use of forward foreign currency exchange contracts does not eliminate fluctuations in the underlying prices of the securities of the Portfolio, but it does establish a rate of exchange that can be achieved in the future. Although forward foreign currency exchange contracts may limit the risk of loss due to a decline in the value of the currency holdings, they also limit any potential gain that might result should the value of the currency increase. In addition, the Portfolio could be exposed to losses if the counterparties to the contracts are unable to meet the terms of the contracts. The Portfolio may also experience losses even when such contracts are used for hedging purposes. The Portfolio’s maximum potential loss from such contracts is the aggregate face value in U.S. dollars at the time the contract was opened.
Futures Contracts -The Portfolio may buy and sell futures contracts as a hedge, to maintain investment exposure to a target asset class or to enhance return. The Portfolio may be subject to fluctuations in equity prices, interest rates, commodity prices, and foreign currency exchange rates in the normal course of pursuing its investment objective. Futures contracts are standardized agreements to buy or sell a security, or deliver a final cash settlement price in connection with an index, interest rate, currency, or other asset. The Portfolio must deposit an amount (“initial margin”) equal to a certain percentage of the face value of the futures contract. The initial margin may be in the form of cash or securities, which is returned when the Portfolio’s obligations under the contract have been satisfied. If cash is deposited as the initial margin, it is shown as cash collateral on the Statement of Assets and Liabilities. Futures contracts aremarked-to-market daily and subsequent payments (“variation margin”) are made or received by the Portfolio depending on whether unrealized gains or losses are incurred. These amounts are reflected as receivables or payables on the Statement of Assets and Liabilities and as a component of net change in unrealized appreciation/depreciation on the Statement of Operations. When the contract is closed or expires, the Portfolio records a realized gain or loss equal to the difference between the value of the contract at the time it was opened and the value at the time it was closed. Risks of entering into futures contracts (and related options) include the possibility that the market for these instruments may be illiquid and that a change in the value of the contract or option may not correlate perfectly with changes in the value of the underlying instrument. If futures contracts areexchange-traded, the exchange’s clearinghouse, as counterparty to all exchange-traded futures, guarantees the futures contracts against default. For OTC futures, the Portfolio’s ability to terminate the positions may be more limited than in the case of exchange-traded positions and may also involve the risk that securities dealers participating in such transactions would fail to meet their obligations to the Portfolio.
Options Contracts -An option contract purchased by the Portfolio gives the Portfolio the right, but not the obligation, to buy (call) or sell (put) an underlying instrument at a fixed exercise price during a specified period. Call options written by the Portfolio give the holder the right to buy the underlying instrument from the Portfolio at a fixed exercise price; put options written by the Portfolio give the holder the right to sell the underlying instrument to the Portfolio at a fixed exercise price.
The Portfolio may use options to hedge against changes in values of securities the Portfolio owns or expects to purchase, to maintain investment exposure to a target asset class or to enhance return. Writing puts or buying calls tend to increase the Portfolio’s exposure to the underlying instrument and writing calls or buying puts tends to decrease the Portfolio’s exposure to the underlying instrument, and can be used to hedge other Portfolio investments. For options used to hedge the Portfolio’s investments, the potential risk to the Portfolio is that the change in value of options contracts may not correspond perfectly to the change in value of the hedged instruments. The Portfolio also bears the risk of an unfavorable change in the value of the underlying instrument or the risk that the Portfolio may not be able to enter into a closing transaction due to an illiquid market. The Portfolio’s maximum risk of loss from counterparty credit risk, as opposed to investment and other types of risk, in respect of purchased options is typically the premium initially paid for the option plus any unrealized gains.
The main risk associated with purchasing an option is that the option expires without being exercised. In this case, the option is worthless when it expires and the premium paid for the option is considered a realized loss. The risk associated with writing a call option is that the Portfolio may forgo the opportunity for a profit if the market value of the underlying instrument increases and the option is exercised, requiring the Portfolio to sell the underlying instrument at a price below its market value. When the Portfolio writes a call option on a security it does not own, its exposure on such an option is theoretically unlimited. The risk in writing a put option is that the Portfolio may incur a loss if the market value of the underlying instrument decreases and the option is exercised, requiring the Portfolio to purchase the underlying instrument at a price above its market value. In addition, the Portfolio risks not being able to enter into a closing transaction for the written option as the result of an illiquid market for the option.
BHFTII-46
Brighthouse Funds Trust II
Brighthouse/Wellington Balanced Portfolio
Notes to Financial Statements—December 31, 2018—(Continued)
Purchases of put and call options are recorded as investments, the value of which aremarked-to-market daily. When the Portfolio enters into a closing sale transaction, the Portfolio will realize a gain or loss depending on whether the sales proceeds from the closing sale transaction are greater or less than the premium initially paid for the option. When the Portfolio exercises a put option, it will realize a gain or loss from the sale of the underlying instrument and the proceeds from such sale will be decreased by the premium originally paid for the put option. When the Portfolio exercises a call option, the cost of the security which the Portfolio purchases upon exercise will be increased by the premium originally paid for the call option.
The premium received by the Portfolio for a written option is recorded as an asset and an equivalent liability. The liability is subsequentlymarked-to-market to reflect the current value of the option written. When a written option expires without being exercised or the Portfolio enters into a closing purchase transaction, the Portfolio realizes a gain (or loss if the cost of the closing purchase transaction exceeds the premium received when the option was sold) without regard to any unrealized gain or loss on the underlying instrument and the liability related to such option is eliminated. When a written call option is exercised, the Portfolio realizes a gain or loss, as adjusted for the premium received, from the sale of the underlying instrument. When a written put option is exercised, the premium received by the Portfolio is offset against the amount paid for the purchase of the underlying instrument.
The purpose of inflation-capped options is to protect the buyer from inflation, above a specified rate, eroding the value of investments in inflation-linked products with a given notional exposure. Inflation-capped options are used to give downside protection to investments in inflation-linked products by establishing a floor on the value of such products.
Swaptions are similar to options on securities except that instead of selling or purchasing the right to buy or sell a security, the writer or purchaser of the swaptions is granting or buying the right to enter into a previously agreed upon interest rate or credit default swap agreement at any time before the expiration of the option.
Swap Agreements - The Portfolio may enter into swap agreements in which the Portfolio and a counterparty agree to either make periodic net payments on a specified notional amount or net payment upon termination. Swap agreements are either privately negotiated in the OTC market (“OTC swaps”) or executed in a multilateral or other trade facility platform, such as a registered commodities exchange (“centrally cleared swaps”). The Portfolio may enter into swap agreements for the purposes of managing exposure to interest rate, credit or market risk, or for other purposes. In connection with these agreements, securities or cash may be paid or received, as applicable, by the Portfolio as collateral or margin in accordance with the terms of the respective swap agreements to provide assets of value and recourse in the event of default or bankruptcy/insolvency. Securities posted by the Portfolio as collateral for swap contracts are identified in the Schedule of Investments and restricted cash, if any, is reflected on the Statement of Assets and Liabilities.
Centrally Cleared Swaps:Clearinghouses currently offer clearing derivative transactions which include interest rate and credit derivatives. In a cleared derivative transaction, a Portfolio typically enters into the transaction with a financial institution counterparty, and performance of the transaction is effectively guaranteed by a central clearinghouse, thereby reducing or eliminating the Portfolio’s exposure to the credit risk of the original counterparty. The Portfolio typically will be required to post specified levels of margin with the clearinghouse or at the instruction of the clearinghouse; the margin required by a clearinghouse may be greater than the margin the Portfolio would be required to post in an uncleared derivative transaction.
Swap agreements aremarked-to-market daily. The fair value of an OTC swap is reflected on the Statement of Assets and Liabilities. The changes in value, if any, are reflected as a component of net change in unrealized appreciation/depreciation on the Statement of Operations. Daily changes in valuation of centrally cleared swaps, if any, are recorded as a receivable or payable for variation margin on the Statement of Assets and Liabilities and as a component of unrealized appreciation/depreciation on the Statement of Operations. Upfront payments paid or received upon entering into the swap agreement compensate for differences between the stated terms of the swap agreement and prevailing market conditions (such as credit spreads, currency exchange rates, interest rates, and other relevant factors). Upon termination or maturity of the swap, upfront premiums are recorded as realized gains or losses on the Statement of Operations. A liquidation payment received or made at the termination of the swap is recorded as realized gain or loss on the Statement of Operations. Net periodic payments received or paid by the Portfolio are included as part of realized gains or losses on the Statement of Operations.
Swap transactions involve, to varying degrees, elements of interest rate, credit, and market risk in excess of the amounts recognized in the Statement of Assets and Liabilities. Such risks involve the possibility that there will be no liquid market for these agreements, that the counterparty to the agreements may default on its obligation to perform, or that there may be unfavorable changes in market conditions or interest rates. In addition, entering into swap agreements involves documentation risk resulting from the possibility that the parties to a swap agreement may disagree as to the meaning of contractual terms in the agreement. The Portfolio may enter into swap transactions with counterparties in accordance with guidelines established by the Board. These guidelines provide for a minimum credit rating for each counterparty and various credit enhancement techniques (for example, collateralization of amounts due from counterparties) to limit exposure to counterparties that have lower credit ratings. A Portfolio’s maximum risk of loss from counterparty credit risk is the discounted value of the net cash flows to be received from the counterparty over the contract’s remaining life, to the extent that amount is positive, or the fair value of the contract. The risk may be mitigated by having a master
BHFTII-47
Brighthouse Funds Trust II
Brighthouse/Wellington Balanced Portfolio
Notes to Financial Statements—December 31, 2018—(Continued)
netting arrangement between the Portfolio and the counterparty and by the posting of collateral by the counterparty to cover the Portfolio’s exposure to the counterparty. Counterparty risk related to centrally cleared swaps is mitigated due to the protection against defaults provided by the exchange on which these contracts trade.
Credit Default Swaps: The Portfolio is subject to credit risk in the normal course of pursuing its investment objectives. The Portfolio may enter into credit default swaps to manage its exposure to the market or certain sectors of the market, to reduce its risk exposure to defaults of corporate and/or sovereign issuers, or to create exposure to corporate and/or sovereign issuers to which they are not otherwise exposed. Credit default swaps involve one party making a stream of payments (referred to as the buyer of protection) to another party (referred to as the seller of protection) in exchange for the right to receive a specified return if a credit event occurs for the referenced entity, obligation or index. A credit event is defined under the terms of each swap agreement and may include, but is not limited to, underlying entity default, bankruptcy, write-down, principal shortfall or interest shortfall. As the seller of protection, if an underlying credit event occurs, the Portfolio will either pay the buyer an amount equal to the notional amount of the swap and take delivery of the referenced obligation (or underlying securities comprising the referenced index), or pay a net settlement amount in the form of cash or securities equal to the notional amount of the swap less the recovery value of the referenced obligation (or underlying securities comprising the referenced index). In return, the Portfolio would receive from the counterparty an upfront or periodic stream of payments throughout the life of the credit default swap agreement provided that no credit event has occurred. As the seller of protection, the Portfolio will effectively add leverage to its portfolio because, in addition to its total net assets, the Portfolio would be subject to investment exposure on the notional amount of the credit default swap.
The Portfolio may also purchase credit default swap contracts in order to hedge against the risk of default of debt securities held in its portfolio. This would involve the risk that the investment may be worthless when it expires and would only generate income in the event of an actual default by the issuer of the underlying obligation (as opposed to a credit downgrade or other indication of financial instability). It would also involve credit risk, whereby the seller may fail to satisfy its payment obligations to the Portfolio in the event of a default. As the buyer of protection, if an underlying credit event occurs, the Portfolio will either receive from the seller of protection an amount equal to the notional amount of the swap and deliver the referenced obligation (or underlying securities comprising the referenced index), or receive a net settlement amount in the form of cash or securities equal to the notional amount of the swap less the recovery value of the referenced obligation (or underlying securities comprising the referenced index). If no credit event occurs and the Portfolio is a buyer of protection, the Portfolio will typically recover nothing under the credit default swap agreement, but it will have had to pay the required upfront payment or stream of continuing payments under the credit default swap agreement. Recovery values are at times established through the credit event auction process in which market participants are ensured that a transparent price has been set for the defaulted obligation.
Credit default swap agreements on credit indices involve one party making a stream of payments to another party in exchange for the right to receive a specified return in the event of a write-down, principal shortfall, interest shortfall or default of all or part of the referenced entities comprising the credit index. A credit index is a basket of credit instruments or exposures designed to be representative of some part of the credit market as a whole. An index credit default swap references all the names in the index, and if there is a credit event involving an entity in the index, the credit event is settled based on that entity’s weight in the index. A Portfolio may use credit default swaps on credit indices as a hedge for credit default swaps or bonds held in the portfolio, which is less expensive than it would be to buy many individual credit default swaps to achieve similar effect. Credit default swaps on indices are benchmarks for protecting investors owning bonds against default, and may be used to speculate on changes in credit quality.
Implied credit spreads, represented in absolute terms, utilized in determining the market value of credit default swap agreements on a credit index or corporate or sovereign issuer, serve as some indication of the status of the payment/performance risk and the likelihood or risk of default for the credit derivative. The implied credit spread of a particular referenced entity or index also reflects the cost of buying/selling protection and may reflect upfront payments required to be made to enter into the agreement. Wider credit spreads generally represent a deterioration of the referenced entity’s credit soundness and a greater likelihood or risk of default or other credit event occurring as defined under the terms of the particular swap agreement. When no implied credit spread is available for a credit default swap, the current unrealized appreciation/depreciation on the position may be used as an indicator of the current status of the payment/performance risk.
The maximum potential amount of future payments (undiscounted) that the Portfolio as a seller of protection could be required to make under a credit default swap agreement equals the notional amount of the agreement. Notional amounts of all credit default swap agreements outstanding as of December 31, 2018, for which the Portfolio is the seller of protection, are disclosed in the Schedule of Investments. These potential amounts would be partially offset by any recovery values of the respective referenced obligations, upfront payments received upon entering into the agreement or net amounts received from the settlement of buy protection credit default swap agreements entered into by the Portfolio for the same referenced entity or entities.
Interest Rate Swaps: The Portfolio may enter into interest rate swaps to manage its exposure to interest rates or to protect against currency fluctuations, to adjust its interest rate sensitivity (duration), to preserve a return or spread on a particular investment, or otherwise as a substitute for a direct investment in debt securities. The Portfolio is subject to interest rate risk exposure in the normal
BHFTII-48
Brighthouse Funds Trust II
Brighthouse/Wellington Balanced Portfolio
Notes to Financial Statements—December 31, 2018—(Continued)
course of pursuing its investment objectives. Because the Portfolio holds fixed rate bonds, the value of these bonds may decrease if interest rates rise. To help hedge against this risk and to maintain its ability to generate income at prevailing market rates, the Portfolio may enter into interest rate swap agreements. Interest rate swaps are agreements in which one party pays a stream of interest payments, either fixed or floating rate, for another party’s stream of interest payments, either fixed or floating, on the same notional amount for a specified period of time. Other forms of interest rate swap agreements may include: (1) interest rate caps, under which, in return for a premium, one party agrees to make payments to the other to the extent that interest rates exceed a specified rate, or “cap”; (2) interest rate floors, under which, in return for a premium, one party agrees to make payments to the other to the extent that interest rates fall below a specified rate, or “floor”; and (3) interest rate collars, under which a party sells a cap and purchases a floor or vice versa in an attempt to protect itself against interest rate movements exceeding given minimum or maximum levels; and (4) basis swaps, under which two parties can exchange variable interest rates based on different segments of money markets. The Portfolio’s maximum risk of loss from counterparty credit risk, as opposed to investment and other types of risk, in respect of interest rate swaps is typically the discounted net value of the cash flows to be received from the counterparty over the contract’s remaining life, to the extent that amount is positive.
Spreadlock Swap Contracts: The Portfolio may invest in spreadlock swap contracts. These contracts involve commitments to pay or receive a settlement amount calculated as the spread difference between two interest rate curves and a fixed spread at a specific forward date determined at the beginning of the contract. Settlement amounts paid or received are recorded as a realized gain or loss on the Statements of Operations at the determination date.
The following table summarizes the fair value of derivatives held by the Portfolio at December 31, 2018 by category of risk exposure:
| | | | | | | | | | | | |
| | | Asset Derivatives | | | Liability Derivatives | |
Risk Exposure | | Statement of Assets &
Liabilities Location | | Fair Value | | | Statement of Assets &
Liabilities Location | | Fair Value | |
Interest Rate | | Investments at market value (a) | | $ | 981,777 | | | | | | | |
| | OTC swap contracts at market value (b) | | | 12,549 | | | OTC swap contracts at market value (b) | | $ | 75,227 | |
| | Unrealized appreciation on centrally cleared swap contracts (c) (e) | | | 350,075 | | | Unrealized depreciation on centrally cleared swap contracts (c) (e) | | | 726,756 | |
| | Unrealized appreciation on futures contracts (d) (e) | | | 2,016,844 | | | Unrealized depreciation on futures contracts (d) (e) | | | 512,907 | |
Credit | | | | | | | | Written options at value | | | 193,959 | |
| | | | | | | | OTC swap contracts at market value (b) | | | 2,186,484 | |
| | Unrealized appreciation on centrally cleared swap contracts (c) (e) | | | 3,787 | | | Unrealized depreciation on centrally cleared swap contracts (c) (e) | | | 163,797 | |
Equity | | Unrealized appreciation on futures contracts (d) (e) | | | 46,018 | | | | | | | |
Foreign Exchange | | Unrealized appreciation on forward foreign currency exchange contracts | | | 118,068 | | | Unrealized depreciation on forward foreign currency exchange contracts | | | 428,614 | |
| | | | | | | | | | | | |
| Total | | | | $ | 3,529,118 | | | | | $ | 4,287,744 | |
| | | | | | | | | | | | |
| | | | |
| (a) | | Represents purchased options which are part of investments at value as shown in the Statement of Assets and Liabilities. |
| (b) | | Excludes OTC swap interest receivable of $9,376 and OTC swap interest payable of $920. |
| (c) | | Represents the unrealized appreciation/depreciation of centrally cleared swaps as reported in the Schedule of Investments. Only the variation margin is reported within the Statement of Assets and Liabilities. |
| (d) | | Includes cumulative appreciation/depreciation of futures contracts as reported in the Schedule of Investments. Only the current day’s variation margin is reported within the Statement of Assets and Liabilities. |
| (e) | | Financial instrument not subject to a master netting agreement. |
The Portfolio is required to disclose the impact of offsetting assets and liabilities represented in the Statement of Assets and Liabilities to enable users of the financial statements to evaluate the effect or potential effect of netting arrangements on its financial position for recognized assets and liabilities.
BHFTII-49
Brighthouse Funds Trust II
Brighthouse/Wellington Balanced Portfolio
Notes to Financial Statements—December 31, 2018—(Continued)
The following table presents the Portfolio’s derivative assets by counterparty net of amounts available for offset under a master netting agreement (“MNA”) (see Note 4), or similar agreement, and net of the related collateral received by the Portfolio as of December 31, 2018.
| | | | | | | | | | | | | | | | |
Counterparty | | Derivative Assets
subject to an MNA
by Counterparty | | | Financial
Instruments
available for offset | | | Collateral
Received† | | | Net
Amount* | |
Bank of America N.A. | | $ | 546,373 | | | $ | (162,794 | ) | | $ | — | | | $ | 383,579 | |
Barclays Bank plc | | | 429,935 | | | | (9,339 | ) | | | — | | | | 420,596 | |
BNP Paribas S.A. | | | 8,250 | | | | — | | | | — | | | | 8,250 | |
Deutsche Bank AG | | | 38,477 | | | | (38,477 | ) | | | — | | | | — | |
HSBC Bank USA | | | 28,936 | | | | (1,984 | ) | | | — | | | | 26,952 | |
JPMorgan Chase Bank N.A. | | | 1,147 | | | | (1,147 | ) | | | — | | | | — | |
Morgan Stanley & Co. International plc | | | 10,433 | | | | (10,433 | ) | | | — | | | | — | |
National Australia Bank Ltd. | | | 860 | | | | — | | | | — | | | | 860 | |
Royal Bank of Canada | | | 5,498 | | | | — | | | | — | | | | 5,498 | |
State Street Bank and Trust | | | 42,485 | | | | (42,485 | ) | | | — | | | | — | |
| | | | | | | | | | | | | | | | |
| | $ | 1,112,394 | | | $ | (266,659 | ) | | $ | — | | | $ | 845,735 | |
| | | | | | | | | | | | | | | | |
The following table presents the Portfolio’s derivative liabilities by counterparty net of amounts available for offset under an MNA, or similar agreement, and net of the related collateral pledged by the Portfolio as of December 31, 2018.
| | | | | | | | | | | | | | | | |
Counterparty | | Derivative Liabilities
subject to an MNA
by Counterparty | | | Financial
Instruments
available for offset | | | Collateral
Pledged† | | | Net
Amount** | |
Bank of America N.A. | | $ | 162,794 | | | $ | (162,794 | ) | | $ | — | | | $ | — | |
Barclays Bank plc | | | 9,339 | | | | (9,339 | ) | | | — | | | | — | |
Citibank N.A. | | | 20,864 | | | | — | | | | — | | | | 20,864 | |
Credit Suisse International | | | 1,027,025 | | | | — | | | | (994,117 | ) | | | 32,908 | |
Deutsche Bank AG | | | 133,219 | | | | (38,477 | ) | | | (94,742 | ) | | | — | |
Goldman Sachs International | | | 753,422 | | | | — | | | | (753,422 | ) | | | — | |
HSBC Bank USA | | | 1,984 | | | | (1,984 | ) | | | — | | | | — | |
JPMorgan Chase Bank N.A. | | | 149,182 | | | | (1,147 | ) | | | — | | | | 148,035 | |
Morgan Stanley & Co. International plc | | | 517,815 | | | | (10,433 | ) | | | (507,382 | ) | | | — | |
State Street Bank and Trust | | | 108,640 | | | | (42,485 | ) | | | — | | | | 66,155 | |
| | | | | | | | | | | | | | | | |
| | $ | 2,884,284 | | | $ | (266,659 | ) | | $ | (2,349,663 | ) | | $ | 267,962 | |
| | | | | | | | | | | | | | | | |
| | | | |
| * | | Net amount represents the net amount receivable from the counterparty in the event of default. |
| ** | | Net amount represents the net amount payable due to the counterparty in the event of default. |
| † | | In some instances, the actual collateral received and/or pledged may be more than the amount shown here due to overcollateralization. |
The following tables summarize the effect of derivative instruments on the Statement of Operations, classified by derivative type and category of risk exposure, for the year ended December 31, 2018:
| | | | | | | | | | | | | | | | | | | | |
Statement of Operations Location—Net
Realized Gain (Loss) | | Interest Rate | | | Credit | | | Equity | | | Foreign
Exchange | | | Total | |
Purchase options | | $ | (78,534 | ) | | $ | — | | | $ | — | | | $ | — | | | $ | (78,534 | ) |
Forward foreign currency transactions | | | — | | | | — | | | | — | | | | 95,988 | | | | 95,988 | |
Swap contracts | | | 751,130 | | | | (159,652 | ) | | | — | | | | — | | | | 591,478 | |
Futures contracts | | | (5,303,910 | ) | | | — | | | | 45,870 | | | | — | | | | (5,258,040 | ) |
Written options | | | (154,613 | ) | | | 430,832 | | | | — | | | | — | | | | 276,219 | |
| | | | | | | | | | | | | | | | | | | | |
| | $ | (4,785,927 | ) | | $ | 271,180 | | | $ | 45,870 | | | $ | 95,988 | | | $ | (4,372,889 | ) |
| | | | | | | | | | | | | | | | | | | | |
| | | | | |
Statement of Operations Location—Net
Change in Unrealized Appreciation (Depreciation) | | Interest Rate | | | Credit | | | Equity | | | Foreign
Exchange | | | Total | |
Purchase options | | $ | (2,552 | ) | | $ | — | | | $ | — | | | $ | — | | | $ | (2,552 | ) |
Forward foreign currency transactions | | | — | | | | — | | | | — | | | | (252,031 | ) | | | (252,031 | ) |
Futures contracts | | | 1,909,225 | | | | — | | | | 46,018 | | | | — | | | | 1,955,243 | |
Swap contracts | | | (623,802 | ) | | | (245,188 | ) | | | — | | | | — | | | | (868,990 | ) |
Written options | | | — | | | | (45,596 | ) | | | — | | | | — | | | | (45,596 | ) |
| | | | | | | | | | | | | | | | | | | | |
| | $ | 1,282,871 | | | $ | (290,784 | ) | | $ | 46,018 | | | $ | (252,031 | ) | | $ | 786,074 | |
| | | | | | | | | | | | | | | | | | | | |
BHFTII-50
Brighthouse Funds Trust II
Brighthouse/Wellington Balanced Portfolio
Notes to Financial Statements—December 31, 2018—(Continued)
For the year ended December 31, 2018, the average notional par or face amount outstanding for each derivative type was as follows:
| | | | |
Derivative Description | | Average
Notional Par or
Face Amount‡ | |
Forward foreign currency transactions | | $ | 21,230,652 | |
Futures contracts long | | | 107,856,139 | |
Futures contracts short | | | (48,833,783 | ) |
Purchased options | | | 36,798,500 | |
Swap contracts | | | 105,161,045 | |
Written options | | | (168,632,000 | ) |
| | | | |
| ‡ | | Averages are based on activity levels during the period for which the amounts are outstanding. |
4. Certain Risks
In the normal course of business, the Portfolio invests in securities and enters into transactions where risks exist. Those risks include:
Market Risk:The value of securities held by the Portfolio may decline in response to certain events, including those directly involving the issuers whose securities are owned by the Portfolio; conditions affecting the general economy; overall market changes; local, regional or global political, social or economic instability; and currency, interest rate, and price fluctuations.
Credit and Counterparty Risk: The Portfolio may be exposed to counterparty risk, or the risk that an entity with which the Portfolio has unsettled or open transactions may default. The potential loss could exceed the value of the financial assets and liabilities recorded in the financial statements. Financial assets that potentially expose the Portfolio to credit and counterparty risk consist principally of cash due from counterparties and investments. The Portfolio manages counterparty risk by entering into agreements only with counterparties that it believes have the financial resources to honor their obligations and by monitoring the financial stability of those counterparties. The Adviser attempts to mitigate counterparty risk by (i) periodically assessing the creditworthiness of its trading partners, (ii) monitoring and/or limiting the amount of its net exposure to each individual counterparty based on its assessment, and (iii) requiring collateral from the counterparty for certain transactions. In order to preserve certain safeguards fornon-standard settlement trades, the Portfolio restricts its exposure to credit and counterparty losses by entering into master netting agreements (“Master Agreements”) with counterparties (approved brokers) with whom it undertakes a significant volume of transactions. Master Agreements govern the terms of certain transactions, and reduce the counterparty risk associated with relevant transactions by specifying credit protection mechanisms and providing standardization that improves legal certainty. Master Agreements can also help limit counterparty risk by specifying collateral posting arrangements atpre-arranged exposure levels. Collateral requirements may differ by type of derivative or investment, as applicable. Collateral or margin requirements are set by the broker or exchange clearing house for exchange-traded derivatives (e.g., futures contracts and exchange-traded options), while collateral terms are contract specific for OTC traded derivatives (e.g., forward foreign currency exchange contracts, swap agreements and OTC options).
For derivatives traded under an International Swaps and Derivatives Association, Inc. Master Agreement (“ISDA Master Agreement”) or similar master agreement, the collateral requirements are netted across all transactions traded under such agreement and one amount is posted from one party to the other to collateralize such obligations. The ISDA Master Agreement gives each party to the agreement the right to terminate all transactions traded under such agreement if there is a certain deterioration in the credit quality of the other party. The ISDA Master Agreement gives the Portfolio the right, upon an event of default by the applicable counterparty or a termination of the agreement, to close out all transactions traded under such agreement and to net amounts owed under each transaction to one net amount payable by one party to the other. This right to close out and net payments across all transactions traded under the ISDA Master Agreement could result in a reduction of the Portfolio’s credit risk to such counterparty equal to any amounts payable by the Portfolio under the applicable transactions, if any. However, absent an event of default by the counterparty or a termination of the agreement, the ISDA Master Agreement does not result in an offset of reported amounts of assets and liabilities in the Statement of Assets and Liabilities across transactions between the Portfolio and the applicable counterparty. The enforceability of the right to offset may vary by jurisdiction. Cash collateral that has been pledged to cover obligations of the Portfolio under derivative contracts, if any, will be reported separately in the Statement of Assets and Liabilities. Securities pledged as collateral, if any, for the same purpose are noted in the Schedule of Investments.
Master Securities Forward Transaction Agreements (“MSFTA”) govern the considerations and factors surrounding the settlement of certain forward settling transactions, such as TBA securities and delayed-delivery or secured borrowings transactions by and between the Portfolio and select counterparties. The MSFTA maintain provisions for, among other things, initiation and confirmation, payment and transfer, events of default, termination, and maintenance of collateral.
Customer Account Agreements and related addenda govern cleared derivatives transactions such as futures, options on futures, and cleared OTC derivatives. Cleared derivative transactions require posting of initial margin as determined by each relevant clearing agency, which is segregated at a broker account registered with the Commodities Futures Trading Commission (“CFTC”), or the
BHFTII-51
Brighthouse Funds Trust II
Brighthouse/Wellington Balanced Portfolio
Notes to Financial Statements—December 31, 2018—(Continued)
applicable regulator. In the U.S., counterparty risk is significantly reduced as creditors of the futures broker do not have claim to portfolio assets in the segregated account. Additionally, portability of exposure in the event of default further reduces risk to the Portfolio. Variation margin, or changes in market value, are exchanged daily, but may not be netted between futures and cleared OTC derivatives.
Foreign Investment Risk:The investments by the Portfolio in foreign securities may involve risks not present in domestic investments. Because securities may be denominated in foreign currencies, may require settlement in foreign currencies and may pay interest or dividends in foreign currencies, changes in the relationship of these foreign currencies to the U.S. dollar can significantly affect the value of the investments and earnings of the Portfolio. Foreign investments may also subject the Portfolio to foreign government exchange restrictions, expropriation, taxation or other political, social or economic developments, all of which could affect the market and/or credit risk of the investments. In addition to the risks described above, risks may arise from forward foreign currency contracts with respect to the potential inability of counterparties to meet the terms of their contracts.
Additional risks associated with each type of investment are described above within the respective security type notes. The Portfolio’s prospectus includes a discussion of the principal risks of investing in the Portfolio.
5. Investment Transactions
Aggregate cost of purchases and proceeds of sales of investment securities, including mortgage dollar rolls and TBA transactions but excluding short-term securities, for the year ended December 31, 2018 were as follows:
| | | | | | | | | | | | |
Purchases | | | Sales | |
U.S. Government | | Non-U.S. Government | | | U.S. Government | | | Non-U.S. Government | |
$3,830,924,369 | | $ | 656,081,595 | | | $ | 3,741,998,883 | | | $ | 747,826,098 | |
The Portfolio engaged in security transactions with other accounts managed by Wellington Management Company LLP, the subadviser to the Portfolio, that amounted to $6,089,750 in purchases, which are included above.
Purchases and sales of mortgage dollar rolls and TBA transactions for the year ended December 31, 2018 were as follows:
| | | | |
Purchases | | Sales | |
$3,722,077,628 | | $ | 3,634,582,082 | |
6. Investment Management Fees and Other Transactions with Affiliates
Investment Management Agreement -Brighthouse Investment Advisers is the investment adviser to the Portfolio. The Trust has entered into an investment management agreement with Brighthouse Investment Advisers with respect to the Portfolio. For providing investment management services to the Portfolio, Brighthouse Investment Advisers receives monthly compensation at the following annual rates:
| | | | | | |
Management
Fees earned by
Brighthouse
Investment Advisers
for the year ended
December 31, 2018 | | % per annum | | | Average Daily Net Assets |
| $5,793,112 | | | 0.500 | % | | Of the first $500 million |
| | | 0.450 | % | | Of the next $500 million |
| | | 0.400 | % | | On amounts in excess of $1 billion |
Brighthouse Investment Advisers has entered into an investment subadvisory agreement with respect to managing the Portfolio. Wellington Management Company LLP (the “Subadviser”) is compensated by Brighthouse Investment Advisers to provide subadvisory services for the Portfolio.
Management Fee Waiver - Pursuant to a management fee waiver agreement, the Adviser has agreed, for the period April 30, 2018 to April 30, 2019, to reduce its advisory fees set out above under “Investment Management Agreement” for each class of the Portfolio as follows:
| | | | |
% per annum reduction | | Average Daily Net Assets | |
| 0.020% | | On the first $ | 500 million | |
Any reductions in total advisory fees paid by the Portfolio due to these waivers may be reduced or eliminated by changes in the advisory fee structure at higher asset levels. Brighthouse Investment Advisers will receive advisory fees equal to 0.480% of the
BHFTII-52
Brighthouse Funds Trust II
Brighthouse/Wellington Balanced Portfolio
Notes to Financial Statements—December 31, 2018—(Continued)
Portfolio’s average daily net assets for amounts over $500 million but less than $750 million (0.030% over the contractual advisory fee rate) and 0.460% for amounts over $750 million but less than $1 billion (0.010% over the contractual advisory fee rate). As a result, the dollar amount of the waiver will be reduced as assets grow beyond $500 million up to $1 billion, but the advisory fee net of waivers will never exceed the contractual dollar amount that would otherwise be payable under the advisory fee. An identical agreement was in place for the period May 1, 2017 to April 30, 2018. Amounts waived for the year ended December 31, 2018 are shown as a management fee waiver in the Statement of Operations.
The Subadviser has voluntarily agreed to waive a portion of its subadvisory fees payable by the Adviser to the Subadviser for managing the Portfolio. In addition to the above advisory fee agreement, the Adviser has agreed to reduce its advisory fee reflecting a portion of the amount waived by the Subadviser for managing the Portfolio pursuant to the voluntary subadvisory fee waiver. $389,598 was waived in the aggregate for the year ended December 31, 2018 and is reflected in the total amount shown as a management fee waiver in the Statement of Operations.
Certain officers and trustees of the Trust may also be officers of the Adviser; however, such officers and trustees receive no compensation from the Trust.
Transfer Agency Agreement -Brighthouse Financial, Inc. serves as the transfer agent for the Trust. Brighthouse Financial, Inc. receives no fees for its services to the Trust.
Distribution and Service Fees - The Trust has a distribution agreement with Brighthouse Securities, LLC (the “Distributor”) pursuant to which the Distributor serves as the general distributor of shares of each class (each a “Class”) of each Portfolio. The Distributor is an affiliate of the Trust. The Trust has adopted a Distribution and Services Plan (the “Plan”) relating to Class B and Class E shares of each Portfolio, under Rule 12b-1 under the 1940 Act, pursuant to which the Trust may pay the Distributor a fee (the “Service Fee”) at an annual rate not to exceed 0.25% of each such Portfolio’s average daily net assets attributable to the Class B and Class E shares of the Trust. Each Portfolio may not offer shares of each Class. The Plan also authorizes the Trust, on behalf of each of its Portfolios, may pay the Distributor a distribution Fee (the “Distribution Fee” and together with the Service Fee, the “Fees”) at an annual rate of up to 0.25% of each Portfolio’s average daily net assets attributable to the Class B and Class E shares in consideration of the services rendered in connection with the sale of such shares by the Distributor. Under the Distribution Agreement with respect to the Trust, Fees are currently paid at an annual rate of 0.25% of average daily net assets in the case of Class B shares and 0.15% of average daily net assets in the case of Class E shares. The Plan is known as a “compensation plan” because the Trust makes payments to the Distributor for services rendered regardless of the actual level of expenditures by the Distributor. Amounts incurred by the Portfolio for the year ended December 31, 2018 are shown as Distribution and service fees in the Statement of Operations.
Deferred Trustee Compensation -Each Trustee who is not currently an employee of the Adviser or any of its affiliates receives compensation from the Trust for his or her service to the Trust. A deferred compensation plan (the “Plan”) is available to the Trustees on a voluntary basis. Deferred amounts remain in the Trust until distributed in accordance with the provisions of the Plan. The value of a participating Trustee’s deferral account is based on theoretical investments of deferred amounts on the normal payment dates in certain portfolios of the Trust or Brighthouse Funds Trust I, an affiliate of the Trust, as designated by the participating Trustee. Changes in the value of participants’ deferral accounts are reflected as Trustees’ fees and expenses in the Statement of Operations. The portion of the accrued obligations allocated to the Portfolio under the Plan is reflected as Deferred trustees’ fees in the Statement of Assets and Liabilities.
7. Contractual Obligations
Under the Trust’s organizational documents, its officers and Trustees may be indemnified against certain liabilities and expenses arising out of the performance of their duties to the Trust. Additionally, the Trust has a variety of indemnification obligations under contracts with its service providers. The Trust’s maximum exposure under these arrangements is unknown, as this would involve future claims that may be made against the Trust that have not yet occurred.
8. Income Tax Information
The cost basis of investments for federal income tax purposes at December 31, 2018 was as follows:
| | | | |
Cost basis of investments | | $ | 1,304,013,399 | |
| | | | |
Gross unrealized appreciation | | | 88,062,692 | |
Gross unrealized depreciation | | | (93,347,268 | ) |
| | | | |
Net unrealized appreciation (depreciation) | | $ | (5,284,576 | ) |
| | | | |
BHFTII-53
Brighthouse Funds Trust II
Brighthouse/Wellington Balanced Portfolio
Notes to Financial Statements—December 31, 2018—(Continued)
The tax character of distributions paid for the years ended December 31, 2018 and 2017 were as follows:
| | | | | | | | | | | | | | | | | | | | |
Ordinary Income | | | Long-Term Capital Gain | | | Total | |
2018 | | 2017 | | | 2018 | | | 2017 | | | 2018 | | | 2017 | |
| $42,747,765 | | $ | 30,592,475 | | | $ | 73,878,326 | | | $ | 24,322,082 | | | $ | 116,626,091 | | | $ | 54,914,557 | |
As of December 31, 2018, the components of distributable earnings (accumulated losses) on a federal income tax basis were as follows:
| | | | | | | | | | | | | | | | |
Undistributed
Ordinary
Income | | Undistributed
Long-Term
Capital Gain | | | Net
Unrealized
Depreciation | | | Accumulated
Capital Losses | | | Total | |
| $28,095,055 | | $ | 72,125,746 | | | $ | (5,133,764 | ) | | $ | — | | | $ | 95,087,037 | |
The Portfolio utilizes the provisions of the federal income tax laws that provide for the carryforward of capital losses for prior years, offsetting such losses against any future realized capital gains. Under the Regulated Investment Company Modernization Act of 2010, net capital losses recognized after December 22, 2010 may be carried forward indefinitely and their character is retained as short-term and/or long-term losses.
As of December 31, 2018, the Portfolio had no accumulated capital losses.
9. Recent Accounting Pronouncements and SEC Update
In March 2017, FASB issued Accounting Standards Update No. 2017-08, Receivables—Nonrefundable Fees and Other Costs (Subtopic 310-20)—Premium Amortization on Purchased Callable Debt Securities (“ASU 2017-08”) which amends the amortization period for certain purchased callable debt securities. Under the standards update, the premium amortization of purchased callable debt securities that have explicit, non-contingent call features and are callable at fixed prices will be amortized to the earliest call date. The guidance will be applied on a modified retrospective basis and is effective for fiscal years, and their interim periods, beginning after December 15, 2018. Management is currently evaluating the impact of this standards update to the Portfolio.
In August 2018, the FASB issued Accounting Standards Update 2018-13, Fair Value Measurement (Topic 820)—Disclosure Framework—Changes to the Disclosure Requirements for Fair Value Measurement (“ASU 2018-13”) which introduces new fair value disclosure requirements as well as eliminates and modifies certain existing fair value disclosure requirements. ASU 2018-13 is effective for fiscal years beginning after December 15, 2019, and interim periods within those fiscal years. Early adoption is permitted and, as such, management has elected to early adopt ASU 2018-13 effective with the current reporting period. The impact of the Portfolio’s adoption was limited to changes in the Portfolio’s financial statement disclosures regarding fair value, primarily those disclosures related to transfers between levels of the fair value hierarchy.
In August 2018, the Securities and Exchange Commission released its Final Rule on Disclosure Update and Simplification (the “Final Rule”) which is intended to simplify an issuer’s disclosure compliance efforts by removing redundant or outdated disclosures requirements without significantly altering the mix of information provided to investors. Effective with the current reporting period, the Portfolio adopted the Final Rule with the most notable impacts being that the Portfolio is no longer required to present the components of distributable earnings on the Statement of Assets and Liabilities or the sources of distributions to shareholders and the amounts of undistributed net investment income on the Statements of Changes in Net Assets.
BHFTII-54
Brighthouse Funds Trust II
Brighthouse/Wellington Balanced Portfolio
Report of Independent Registered Public Accounting Firm
To the Shareholders of Brighthouse/Wellington Balanced Portfolio and the Board of Trustees of Brighthouse Funds Trust II:
Opinion on the Financial Statements and Financial Highlights
We have audited the accompanying statement of assets and liabilities, including the schedule of investments, of the Brighthouse/Wellington Balanced Portfolio (the “Portfolio”), one of the portfolios constituting the Brighthouse Funds Trust II, as of December 31, 2018, the related statement of operations for the year then ended, the statements of changes in net assets for each of the two years in the period then ended, the financial highlights for each of the five years in the period then ended, and the related notes. In our opinion, the financial statements and financial highlights present fairly, in all material respects, the financial position of the Brighthouse/Wellington Balanced Portfolio of the Brighthouse Funds Trust II as of December 31, 2018, the results of its operations for the year then ended, the changes in its net assets for each of the two years in the period then ended, and the financial highlights for each of the five years in the period then ended, in conformity with accounting principles generally accepted in the United States of America.
Basis for Opinion
These financial statements and financial highlights are the responsibility of the Portfolio’s management. Our responsibility is to express an opinion on the Portfolio’s financial statements and financial highlights based on our audits. We are a public accounting firm registered with the Public Company Accounting Oversight Board (United States) (PCAOB) and are required to be independent with respect to the Portfolio in accordance with the U.S. federal securities laws and the applicable rules and regulations of the Securities and Exchange Commission and the PCAOB.
We conducted our audits in accordance with the standards of the PCAOB. Those standards require that we plan and perform the audit to obtain reasonable assurance about whether the financial statements and financial highlights are free of material misstatement, whether due to error or fraud. The Portfolio is not required to have, nor were we engaged to perform, an audit of its internal control over financial reporting. As part of our audits we are required to obtain an understanding of internal control over financial reporting but not for the purpose of expressing an opinion on the effectiveness of the Portfolio’s internal control over financial reporting. Accordingly, we express no such opinion.
Our audits included performing procedures to assess the risks of material misstatement of the financial statements and financial highlights, whether due to error or fraud, and performing procedures that respond to those risks. Such procedures included examining, on a test basis, evidence regarding the amounts and disclosures in the financial statements and financial highlights. Our audits also included evaluating the accounting principles used and significant estimates made by management, as well as evaluating the overall presentation of the financial statements and financial highlights. Our procedures included confirmation of securities owned as of December 31, 2018, by correspondence with the custodian, brokers, and agent banks; when replies were not received from brokers or agent banks, we performed other auditing procedures. We believe that our audits provide a reasonable basis for our opinion.
/s/ Deloitte & Touche LLP
Boston, Massachusetts
February 25, 2019
We have served as the auditor of one or more of the Brighthouse investment companies since 1983.
BHFTII-55
Brighthouse Funds Trust II
Trustees and Officers
MANAGEMENT OF THE TRUSTS
The Boards of Trustees (the “Board”) of Brighthouse Funds Trust I and Brighthouse Funds Trust II (“BHF I” and “BHF II”, respectively, and collectively the “Trusts”) supervise the Trusts and are responsible for representing the interests of shareholders. The Trustees, the Chairman of the Board and the Chairmen of each subcommittee are the same for both Trusts. The Trustees of each Trust meet periodically throughout the year to oversee the Portfolios’ activities, reviewing, among other things, each Portfolio’s performance and its contractual arrangements with various service providers. The Trustees of each Trust elect the officers of the Trust, who are responsible for administering the Trust’sday-to-day operations.
Trustees and Officers
The Trustees and executive officers of the Trusts, as well as their principal occupations during the past five years, are set forth below. Unless otherwise indicated, the business address of each is c/o Brighthouse Funds, One Financial Center, Boston, Massachusetts 02111. Each Trustee who is deemed an “interested person,” as such term is defined in the 1940 Act, is referred to as an “Interested Trustee.” Those Trustees who are not “interested persons,” as such term is defined in the 1940 Act, are referred to as “Independent Trustees.” There is no limit to the term a Trustee may serve. Trustees serve until their death, resignation or removal in accordance with the BHF I Trust’s and BHF II Trust’s respective organizational documents and policies adopted by the Boards of the respective Trusts from time to time. Officers hold office at the pleasure of each Board and serve until their removal or resignation in accordance with the Trusts’ respective organizational documents and policies adopted by the Board of each Trust from time to time.
| | | | | | | | | | |
Name and Year of Birth | | Current
Position(s)
Held with
Registrant | | Term of Office
and Length of
Time Served | | Principal Occupation(s) During the Past 5 Years(1) | | Number of
Portfolios in
Brighthouse Funds
Complex(2)
Overseen
by Trustee | | Other Directorships Held
by Trustee During
the Past 5 Years(1) |
| Interested Trustee |
John Rosenthal* (1960) | | Trustee | | Indefinite;
From
May
2016
(Trust I
and
Trust II) to
present | | Chief Investment Officer, Brighthouse Financial, Inc. (2017 to present); until 2017, Senior Managing Director and Head of Global Portfolio Management, MetLife, Inc. | | 72 | | None |
|
| Independent Trustees |
Dawn M. Vroegop (1966) | | Trustee and Chairman of the Board | | Indefinite;
From
December
2000
(Trust I)/
May
2009
(Trust II)
to present
as
Trustee;
From
May
2016
(Trust I
and
Trust II)
until
present as
Chairman | | Private Investor. | | 72 | | Trustee, Driehaus Mutual Funds.** |
BHFTII-56
Brighthouse Funds Trust II
Trustees and Officers—(Continued)
| | | | | | | | | | |
Name and Year of Birth | | Current
Position(s)
Held with
Registrant | | Term of Office
and Length of
Time Served | | Principal Occupation(s) During the Past 5 Years(1) | | Number of
Portfolios in
Brighthouse Funds
Complex(2)
Overseen
by Trustee | | Other Directorships Held
by Trustee During
the Past 5 Years(1) |
Stephen M. Alderman (1959) | | Trustee | | Indefinite;
From
December
2000
(Trust I)/
April
2012
(Trust II)
to present | | Shareholder in the law firm of Garfield and Merel, Ltd. | | 72 | | None |
| | | | | |
Robert J. Boulware (1956) | | Trustee | | Indefinite;
From
March
2008
(Trust I)/
April
2012
(Trust II)
to present | | Managing Director, Pilgrim Funds, LLC (private equity fund). | | 72 | | Trustee, Vertical Capital Income Fund(closed-end fund);** Director, Gainsco, Inc. (auto insurance);** Trustee, SharesPost 100 Fund(closed-end fund).** |
| | | | | |
Susan C. Gause (1952) | | Trustee | | Indefinite;
From
March
2008
(Trust I)/
April
2012
(Trust II)
to present | | Private Investor. | | 72 | | Trustee, HSBC Funds.** |
| | | | | |
Nancy Hawthorne (1951) | | Trustee | | Indefinite;
From
May
2003
(Trust II)/
April
2012
(Trust I) to
present | | Partner, Hawthorne Financial Advisors, LLC (registered investment advisor); until 2014, Chief Executive Officer, Clerestory LLC (corporate advisor). | | 72 | | Director and Chairman of the Board of Directors, THL Credit, Inc.;** Director and Chairman of the Board, Avid Technology, Inc.;** Director, CRA International, Inc.** |
| | | | | |
Barbara A. Nugent (1956) | | Trustee | | Indefinite;
From
January
2014
(Trust I
and
Trust II) to
present | | President, True North Board Governance, LLC (consulting); until December 2013, partner in the law firm of Stradley Ronon Stevens & Young, LLP. | | 72 | | Independent Lead Trustee, BMT Investment Funds** |
| | | | | |
Christopher J. Towle (1957) | | Trustee | | Indefinite;
From
April
2018
(Trust I
and
Trust II) to
present | | Retired; until 2014, Partner, Portfolio Manager, Director of High Yield and Convertible Strategies, Lord Abbett & Co. | | 72 | | Trustee, Driehaus Mutual Funds** |
BHFTII-57
Brighthouse Funds Trust II
Trustees and Officers—(Continued)
Officers
| | | | | | |
Name and Year of Birth | | Position(s)
Held with
Registrant | | Length of
Time Served | | Principal Occupation(s)
During the Past 5 Years(1) |
| Executive Officers | | | | | | |
Kristi Slavin (1973) | | President and Chief Executive Officer, of Trust I and Trust II | | From May
2016
(Trust I
and
Trust II) to
present | | President, Brighthouse Investment Advisers, LLC (2016-present); formerly, Senior Vice President, MetLife Advisers, LLC; Vice President, MetLife, Inc.; Vice President, Trust I and Trust II(2015-2016). |
| | | |
Alan R. Otis (1971) | | Chief Financial Officer and Treasurer, of Trust I and Trust II | | From
November
2017
(Trust I
and
Trust II) to
present | | Senior Vice President, Brighthouse Investment Advisers, LLC (2017-present); formerly, Vice President, Brighthouse Investment Advisers, LLC (2012-2017); Assistant Treasurer, Trust I and Trust II(2012-2017). |
| | | |
Andrew L. Gangolf (1954) | | Secretary, of Trust I and Trust II | | From May
2011
(Trust I
and
Trust II) to
present | | Executive Vice President, Brighthouse Investment Advisers, LLC (2017-present); formerly, Senior Vice President, MetLife Advisers, LLC (2011-2017); until 2011, Senior Vice President & Assistant General Counsel, AllianceBernstein Investments, Inc. |
| | | |
Steven E. Hartstein (1963) | | Chief Compliance Officer (“CCO”), of Trust I and Trust II | | From
February
2014
(Trust I
and
Trust II) to
present | | Senior Vice President and CCO, Brighthouse Investment Advisers, LLC (2017-present); Head of Investments Compliance, Vice President, Brighthouse Financial, Inc. (2017-present); formerly, Vice President, MetLife, Inc. (2013-2017); Senior Vice President and CCO, MetLife Advisers, LLC (2013-2017.) |
| | | |
Victor Soto (1978) | | Vice President of Trust I and Trust II | | From May
2018
(Trust I
and
Trust II) to
present | | Executive Vice President, Brighthouse Investment Advisers, LLC (2016-present); Assistant Vice President, MetLife Inc. (2015-2017); Portfolio Manager, 1st Global (2013-2015). |
| * | Mr. Rosenthal is an “interested person” of the Trusts because of his position with Brighthouse Financial, Inc., the current parent company of Brighthouse Investment Advisers, LLC. |
| ** | Indicates a directorship with a registered investment company or a company subject to the reporting requirements of the Securities Exchange Act of 1934, as amended. |
| (1) | Previous positions during the past five years with the Trusts, Brighthouse Financial, Inc., MetLife, Inc. or the Manager are omitted if not materially different. |
| (2) | The Fund Complex includes 43 BHF I Portfolios and 29 BHF II Portfolios. |
BHFTII-58
Brighthouse Funds Trust II
Brighthouse/Wellington Balanced Portfolio
Board of Trustees’ Consideration of Advisory and Sub-Advisory Agreements
At anin-person meeting held on November6-8, 2018 (the “November Meeting”), the Boards of Trustees (the “Board”) of Brighthouse Funds Trust I and Brighthouse Funds Trust II (“BFT I” and “BFT II,” respectively, and collectively, the “Trusts”), including a majority of the Trustees who are not “interested persons” of the Trusts (the “Independent Trustees”) under the Investment Company Act of 1940 (the “1940 Act”), approved the continuation of the Trusts’ advisory agreements (each, an “Advisory Agreement”) with Brighthouse Investment Advisers, LLC (the “Adviser”) and the applicablesub-advisory agreements (each a “Sub-Advisory Agreement,” and collectively with the Advisory Agreement, the “Agreements”) between the Adviser and the investmentsub-advisers (each a “Sub-Adviser,” and collectively, the “Sub-Advisers”) for the series of the Trusts (each a “Portfolio,” and collectively, the “Portfolios”).
In making those approvals, the Board reviewed a variety of materials that were provided for the specific purpose of the annual contract renewal process. In addition, various materials provided to and discussed with the Board throughout the year informed the Board’s decision to renew the Agreements. In particular, the information for each Portfolio included, but was not limited to, investment performance reports, and reports on expenses, legal and compliance matters, asset pricing, brokerage commissions and trade execution.
The Board met in person with personnel of the Adviser on October 17, 2018 for the specific purpose of giving preliminary consideration to the proposed continuation of the Agreements (the “October Meeting”). At that meeting, the Adviser reviewed with the Board the performance and fees experienced by each Portfolio, as well as other information. During and after the October Meeting, the Independent Trustees communicatedfollow-up matters for management to address at the November Meeting. The Independent Trustees were advised by independent legal counsel throughout the contract renewal process, and met with independent legal counsel in several executive sessions outside of the presence of management.
Information furnished and reviewed specifically in connection with the renewal process included, but was not limited to, a report for each Portfolio that was prepared by Broadridge (“Broadridge”), an independent organization. In addition, the Independent Trustees reviewed a report that was prepared by JDL Consultants, LLC (“JDL”), an independent consultant to the Independent Trustees (“JDL Report”), which examined the comparative fees, expenses and performance of each Portfolio, based upon the Broadridge reports. Also, the Board reviewed the responses to wide-ranging questions from the Independent Trustees relating to the business, operations and performance of the Adviser and theSub-Advisers that the Adviser andSub-Advisers had prepared specifically for the renewal process, and reviewed aPortfolio-by-Portfolio analysis of the profitability to the Adviser of each Advisory Agreement, which was prepared by the Adviser for the renewal process.
At the November Meeting, the Board, including a majority of the Independent Trustees, concluded that the nature, extent and quality of services provided by the Adviser and eachSub-Adviser supported the renewal of the Agreements. The Board also concluded that the investment performance of each Portfolio was such that each Agreement should continue, and that the fees paid by each Portfolio to the Adviser appeared to be reasonable in light of the nature, extent and quality of the services provided by the Adviser andSub-Adviser. Further, the Board concluded that the Adviser’s profitability in providing services under the Advisory Agreements did not appear unreasonable in light of the nature, extent and quality of the services provided by the Adviser. Finally, the Board reviewed the extent to which the investment advisory fees paid by the Portfolios shared economies of scale with investors or entailed the potential to share economies of scale with investors and concluded that those considerations generally supported the renewal of each Agreement. In approving the renewal of each of the Agreements, the Board, including the Independent Trustees, gave attention to all of the information that was furnished and each Trustee placed varying degrees of importance on the various pieces of information that were provided to them. The Board evaluated the information available to it on aPortfolio-by-Portfolio basis, and its decision was made separately with respect to each Portfolio. The following paragraphs provide more information about some of the primary factors that were relevant to the Board’s decision. The Board did not identify any single factor as determinative, and the Trustees generally attributed different weights to various factors for the various Portfolios.
Nature, extent and quality of services. The Board evaluated the nature, extent and quality of the services that the Adviser and theSub-Advisers, as relevant, have provided to the Portfolios. The Board considered the Adviser’s services as investment manager to the Portfolios, including its services relating to the hiring and oversight of theSub-Advisers, trading practices and oversight of transition management (as applicable), compliance programs and personnel, and risk management, among other things. The Adviser’s services in coordinating and overseeing the activities of the Trusts’ other service providers were also considered. The Board considered information received from the Trusts’ Chief Compliance Officer (“CCO”) regarding the Portfolios’ compliance policies and procedures that were established pursuant to Rule38a-l under the 1940 Act. The Board also noted that the Adviser’s investment, compliance and legal staff conduct regular and periodic telephonic andin-person meetings with theSub-Advisers to review and assess the services that are provided to the Portfolios, and that personnel of the Adviser prepare and present reports to the Independent Trustees regarding those meetings. In addition, throughout the year, the Board considered the expertise, experience and performance of the personnel of the Adviser who performed the various services that are mentioned above.
BHFTII-59
Brighthouse Funds Trust II
Brighthouse/Wellington Balanced Portfolio
Board of Trustees’ Consideration of Advisory and Sub-Advisory Agreements—(Continued)
With respect to the services provided by each of theSub-Advisers, the Board considered a variety of information that the Adviser and eachSub-Adviser prepared for the Board’s review. The Board considered eachSub-Adviser’s investment process and philosophy, and the investment performance experienced by the Portfolio (as described in more detail below). The Board took into account that eachSub-Adviser’s responsibilities include the development and maintenance of an investment program for the applicable Portfolio that is consistent with the Portfolio’s investment objectives, the selection of investment securities and the placement of orders for the purchase and sale of such securities, as well as the implementation of compliance controls related to performance of these services. In particular, the Board considered, among other things, theSub-Adviser’s current level of staffing as well as its compensation program and its overall resources. The Board reviewed eachSub-Adviser’s history and investment experience, as well as information provided regarding the qualifications, background and responsibilities of theSub-Adviser’s investment and compliance personnel who provide services to the Portfolios. The Board also considered, among other things, eachSub-Adviser’s compliance program and regulatory and disciplinary history. In its review, the Board also took into account information regarding any services and/or payments provided to the Adviser by theSub-Advisers in connection with marketing activities and considered representations from the Adviser that those payments were not considered in the Adviser’s recommendation to renew any of theSub-Advisory Agreements.
Performance. The Board placed emphasis on the performance of each Portfolio in light of, among other things, its importance to investors. The Board considered the Adviser’s quarterly reviews with the Board of detailed information about each Portfolio’s investment strategies and performance results and composition, including discussions regarding the relevant effect of current market conditions. The Board reviewed and considered the reports prepared by Broadridge, which provided a statistical analysis comparing the Portfolios’ investment performance to that of comparable funds underlying variable insurance products (the “Performance Universe”). The Independent Trustees also met separately with representatives of JDL during the October Meeting to review the JDL Report. The Board also compared the performance records of the Portfolios to those of comparable funds and other accounts that were managed by the relevantSub-Adviser, to the extent such information was available. The Board considered each Portfolio’s performance for periods subsequent to the performance period covered by the Broadridge reports, and the Adviser’s discussion of the same, including the effect of current market conditions on each Portfolio’s more recent performance. The Board also noted that while it found the data provided by Broadridge generally useful, it recognized the limitations of such data, including, in particular, that notable differences may exist between a Portfolio and those of the other funds in a Broadridge category (for example, the investment objectives(s) and investment strategies) and that the results of the performance comparisons may vary depending on (i) the end dates for the performance periods that were selected and (ii) the selection of the peer groups.
The Board focused particular attention on Portfolios with less favorable performance records. The Board noted the Adviser’s focus on eachSub-Adviser’s performance and that the Adviser has been active in monitoring and responding to any performance issues with respect to the Portfolios.
Fees and Expenses. The Board gave consideration to the level and method of computing the fees payable under the Agreements. The Board considered the Broadridge report for each of the Portfolios, which included comparisons for each Portfolio of its contractual management andsub-adviser fees (at current and various asset levels), and total expenses, with those of its peers, including as those peers were divided into a broad group of peer funds (“Expense Universe”), a narrower group of peer funds (“Expense Group”), a broad group of peersub-advised funds (“Sub-advised Expense Universe”), and a narrower group of peersub-advised funds (“Sub-advised Expense Group”). Broadridge selected the peer funds which were similarly situated funds underlying variable insurance products deemed to be comparable to the Portfolios. The Independent Trustees, with the assistance of JDL, also examined the JDL Report. The Board compared the fee payable to aSub-Adviser by the Adviser with respect to the Portfolio to the fee payable to theSub-Adviser by other comparable funds and other accounts, to the extent such information was available.
The Board noted that thesub-advisory fees for the Portfolios are paid by the Adviser out of the advisory fees, and that the Adviser negotiates the fees at arm’s length. The Board also considered that the Adviser had entered into expense limitation or management fee waiver agreements with certain of the Portfolios pursuant to which the Adviser had agreed to waive a portion of its advisory fee and/or reimburse certain expenses as a means of limiting a Portfolio’s total annual operating expenses.
Profitability. The Board examined the profitability to the Adviser of each Advisory Agreement, on aPortfolio-by-Portfolio basis. The Board also considered that an affiliate of the Adviser, Brighthouse Securities, LLC, serves as distributor for the Trusts, and, as such, receives Rule12b-1 payments to support the distribution of the Portfolios. The Board considered the profitability to theSub-Advisers and their affiliates as a result of their relationships with the Portfolios, to the extent available, and the Board considered the ability of the Adviser to negotiate with aSub-Adviser at arm’s length. In reviewing the profitability analyses, the Board recognized that expense allocation methodologies are inherently subjective and various expense allocation methodologies may be reasonable while producing different results.
BHFTII-60
Brighthouse Funds Trust II
Brighthouse/Wellington Balanced Portfolio
Board of Trustees’ Consideration of Advisory and Sub-Advisory Agreements—(Continued)
Economies of scale. The Board also considered each Portfolio’s fees in light of its size. The Board noted the fee schedules for the Portfolios that contain breakpoints that reduce the fee rate above specified asset levels. The Board noted those Portfolios that did not have breakpoints in their advisory fee and took into account management’s discussion of the same. The Board noted that those Portfolios with Advisory Agreements containing breakpoints generally have breakpoints in the correspondingSub-Advisory Agreement. The Board considered the effective fees under the Advisory Agreement andSub-Advisory Agreement for each Portfolio as a percentage of assets at different asset levels and possible economies of scale that may be realized if the assets of the Portfolio grow. The Board examined, among other data, the effect of a Portfolio’s growth in size, and reduction in size, on various fee schedules and the Board reviewed the Broadridge and JDL Reports, which compared fees among peers. The Board also generally noted that if a Portfolio’s assets increase over time, the Portfolio may realize other economies of scale if assets increase proportionally more than certain other fixed expenses.
Other factors. The Board considered other benefits that may be realized by the Adviser and its affiliates from their relationship with the Trusts. Among them, the Board recognized that Brighthouse Securities, LLC, as the distributor for the Trusts, receives payments pursuant to Rule12b-1 from the Portfolios to compensate for the provision of shareholder services and distribution activities, which could lead to growth in the Trusts’ assets and corresponding benefits from such growth, including economies of scale. The Board considered other benefits that may be realized by eachSub-Adviser and its affiliates from their relationship with the Trusts, including the opportunity to provide advisory services to additional portfolios of the Trusts and reputational benefits. In conjunction with these considerations, the Board noted the ongoing commitment of the Adviser to the Portfolios.
The Board requested, received, and considered information from the Adviser regarding possible conflicts of interest in the form of material benefits to the Adviser resulting from the Adviser’s affiliations and business relationships, as relevant. The Board considered the services that are provided to the Trusts by its service providers, and the manner in which any conflicts were mitigated.
* * *
Brighthouse/Wellington Balanced Portfolio. The Board also considered the following information in relation to the Agreements with the Adviser and Wellington Management Company LLP regarding the Portfolio:
Among other data relating specifically to the Portfolio’s performance, the Board considered that the Portfolio outperformed the median of its Performance Universe and the average of its Morningstar Category for theone-, three-, and five-year periods ended June 30, 2018. The Board further considered that the Portfolio outperformed its blended benchmark, the S&P 500 Index (60%) & Bloomberg Barclays U.S. Aggregate Bond Index (40%), for theone-, three- and five-year periods ended September 30, 2018. In addition, the Board noted that theSub-Adviser did not manage the Portfolio for all of the periods referenced.
The Board also considered that the Portfolio’s actual management fee and total expenses (exclusive of12b-l fees) were below the Expense Group median, Expense Universe median, andSub-advised Expense Universe median. The Board noted that the Portfolio’s contractual management fees were below the asset-weighted average of comparable funds selected by Broadridge at the Portfolio’s current size. The Board also noted that the Portfolio’s contractualsub-advisory fees were below the averages of theSub-advised Expense Group and theSub-advised Expense Universe at the Portfolio’s current size.
BHFTII-61
Brighthouse Funds Trust II
Brighthouse/Wellington Core Equity Opportunities Portfolio
Managed by Wellington Management Company LLP
Portfolio Manager Commentary*
PERFORMANCE
For the 12 months ended December 31, 2018, the Class A, B, and E shares of the Brighthouse/Wellington Core Equity Opportunities Portfolio returned-0.09%,-0.35%, and-0.25%, respectively. The Portfolio’s benchmark, the Russell 1000 Index1, returned-4.78%.
MARKET ENVIRONMENT / CONDITIONS
U.S. equities posted negative results over the trailing twelve-month period ended December 31, 2018. The Federal Reserve raised its benchmark interest rate by 25 basis points four times during the year, in line with expectations, and potentially signaling a more dovish path heading into 2019. Bullish sentiment was exceptionally strong to start the year, as better-than-expected corporate profits helped drive U.S. equities higher. Signs of inflation entered the market in February and led to heightened levels of volatility, a theme that continued for the remainder of the period. By the summer of 2018, talk of tariffs and trade wars had progressed to implementation, and raised concerns in an otherwise strong economy. Nonetheless, positive sentiment persisted, fueled by robust earnings growth, fiscal stimulus, the announcement of a preliminary trade deal between the U.S. and Mexico, and expectations for stronger U.S. economic growth relative to other regions of the world. This changed in the final months of 2018, when concerns surrounding slowing global growth, rich valuations, rising central bank benchmark interest rates, and capricious U.S. and China trade tensions were at the forefront of investors’ minds. Returns in October and December were sharply negative, with the latter representing the largest U.S. equity market monthly decline seen this decade, culminating the first year of negative U.S. equity returns since 2008.
PORTFOLIO REVIEW /PERIOD-END POSITIONING
The Portfolio outperformed its benchmark, the Russell 1000 Index, for the period ended December 31, 2018. Positive stock selection within Consumer Discretionary, Consumer Staples, and Materials sectors was only partially offset by weaker selection within Energy and Health Care. Sector allocation, a result of thebottom-up stock selection process, detracted from performance due to the Portfolio’s underweight allocation to Information Technology (“IT”) and overweight allocation to Industrials.
The Portfolio’s positions in TJX Companies, Nike, and American Tower were among the top relative contributors during the period. Shares of TJX Companies, the largestglobal-off price apparel and home goods retailer, advanced during the period on strong adjusted earnings per share. Results were solid across the board as sales, gross profit, and operating profit all increased year-over-year. We believe TJX can achieve same-stores sales growth as it captures new customers with strong inventory management, targeted marketing, and excellent execution by atop-tier management team. In addition, the company we believe, was uniquely positioned among large caps as it has potential to outperform in both offensive and defensive macro environments. TJX was also less exposed to disaggregating by internet competitors due to the “treasure hunt” experience offered to customers who visited their stores. We viewed the company as a high quality, cash generative, dominant value creator and distributor.
Nike, a provider of athletic footwear, apparel and accessories, reported strong earnings during the period. The company announced its new innovation platforms were all working, sales were accelerating across all regions and channels (including the U.S.), gross margins were finally beating estimates, and inventory issues were improving. We continued to believe that Nike will successfully make the transformation to a more nimble, digitally-focused, customer-centric, global, and innovative company.
Shares of American Tower, a U.S.-based leading owner and operator of wireless communications, rose during the period. The company has three main flywheels driving growth forward (U.S. platform, international platform, and innovation platform), and management was extremely disciplined and has created a culture that rewarded risk taking and innovation.
The Portfolio’s position in Schlumberger and not holding benchmark constituent Amazon were among the top relative detractors during the period. Cardinal Health and McKesson, which we eliminated towards the end of the period, also negatively affected performance. Shares of U.S.-based energy services company Schlumberger fell as energy was the worst performing sector during the period as oil prices plunged. We were selling Schlumberger throughout the period as we had concerns about the company’s longer-term dividend growth capabilities and the potential for a dividend cut.
During the period we eliminated the Portfolio’s holdings in McKesson, a U.S.-based global drug distribution company. The stock faced several headwinds, which included ongoing generic price deflation and heightened competition in the individual pharmacy market. In addition, investors feared Amazon may enter the drug distribution industry. While the Amazon threat was a small part of the changing risk profile of the firm, there were other company and industry specific issues which have caused us to exit McKesson, most notably potential legal liability from the opioid crisis, continued struggles with price inflation, and heightened government/regulatory scrutiny. The company’s earnings werein-line with expectations, but management commentary about July’s brand price inflation (lower than expectations) and the government’s intensifying focus on addressing high drug prices by going after the current rebate system suggested that distributors continued to face tough headwinds and numbers were likely to come down further.
BHFTII-1
Brighthouse Funds Trust II
Brighthouse/Wellington Core Equity Opportunities Portfolio
Managed by Wellington Management Company LLP
Portfolio Manager Commentary*—(Continued)
At the end of the period, the Portfolio was most overweight the Consumer Staples and Industrial sectors and most underweight the IT and Communication Services sectors.
Donald J. Kilbride
Portfolio Manager
Wellington Management Company LLP
* This commentary may include statements that constitute “forward-looking statements” under the U.S. securities laws. Forward-looking statements include, among other things, projections, estimates, and information about possible or future results related to the Portfolio, market or regulatory developments. The views expressed above are not guarantees of future performance or economic results and involve certain risks, uncertainties and assumptions that could cause actual outcomes and results to differ materially from the views expressed herein. The views expressed above are subject to change at any time based upon economic, market, or other conditions and the subadvisory firm undertakes no obligation to update the views expressed herein. Any discussions of specific securities should not be considered a recommendation to buy or sell those securities. The views expressed above (including any forward-looking statement) may not be relied upon as investment advice or as an indication of the Portfolio’s trading intent. Information about the Portfolio’s holdings, asset allocation or country diversification is historical and is not an indication of future Portfolio composition, which may vary. Direct investment in any index is not possible. The performance of any index mentioned in this commentary has not been adjusted for ongoing management, distribution and operating expenses, and sales charges applicable to mutual fund investments. In addition, the returns do not reflect additional fees charged by separate accounts or variable insurance contracts that an investor in the Portfolio may pay. If these additional fees were reflected, performance would have been lower.
BHFTII-2
Brighthouse Funds Trust II
Brighthouse/Wellington Core Equity Opportunities Portfolio
A $10,000 INVESTMENT COMPARED TO THE RUSSELL 1000 INDEX
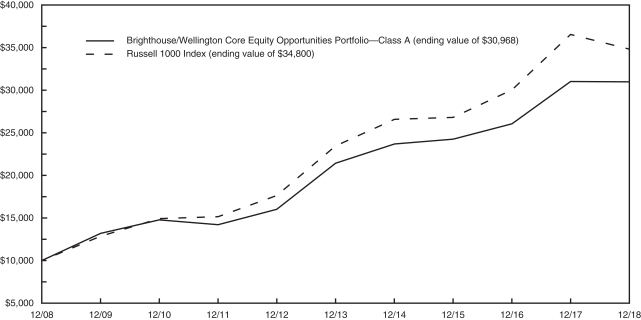
AVERAGE ANNUAL RETURNS (%) (FOR THE YEAR ENDED DECEMBER 31, 2018)
| | | | | | | | | | | | |
| | | | |
| | | 1 Year | | | 5 Year | | | 10 Year | |
| Brighthouse/Wellington Core Equity Opportunities Portfolio | | | | | | | | | | | | |
Class A | | | -0.09 | | | | 7.66 | | | | 11.97 | |
Class B | | | -0.35 | | | | 7.39 | | | | 11.69 | |
Class E | | | -0.25 | | | | 7.50 | | | | 11.80 | |
| Russell 1000 Index | | | -4.78 | | | | 8.21 | | | | 13.28 | |
1 The Russell 1000 Index is an unmanaged measure of the 1,000 largest companies in the Russell 3000 Index, which represents approximately 90% of the investable U.S. equity market.
Portfolio performance is calculated including reinvestment of all income and capital gain distributions. Performance numbers are net of all Portfolio expenses but do not include any insurance, sales, separate account or administrative charges of variable annuity or life insurance contracts or any additional expenses that participants may bear relating to the operations of their plans. If these charges were included, the returns would be lower. The performance of any index referenced above has not been adjusted for ongoing management, distribution and operating expenses, and sales charges applicable to mutual fund investments. Direct investment in any index is not possible. The performance of Class A shares, as set forth in the line graph above, will differ from that of other classes because of the difference in expenses paid by policyholders investing in the different share classes.
This information represents past performance and is not indicative of future results. Investment return and principal value may fluctuate so that shares, upon redemption, may be worth more or less than the original cost.
PORTFOLIO COMPOSITION AS OF DECEMBER 31, 2018
Top Holdings
| | | | |
| | | % of
Net Assets | |
| McDonald’s Corp. | | | 3.8 | |
| Coca-Cola Co. (The) | | | 3.6 | |
| American Tower Corp. | | | 3.5 | |
| PepsiCo, Inc. | | | 3.3 | |
| Chubb, Ltd. | | | 3.1 | |
| Johnson & Johnson | | | 3.1 | |
| Microsoft Corp. | | | 3.0 | |
| NIKE, Inc.- Class B | | | 2.8 | |
| Colgate-Palmolive Co. | | | 2.8 | |
| Medtronic plc | | | 2.8 | |
Top Sectors
| | | | |
| | | % of
Net Assets | |
| Industrials | | | 18.9 | |
| Health Care | | | 16.7 | |
| Consumer Staples | | | 16.6 | |
| Financials | | | 12.0 | |
| Consumer Discretionary | | | 11.3 | |
| Information Technology | | | 9.1 | |
| Real Estate | | | 6.2 | |
| Materials | | | 4.8 | |
| Energy | | | 1.8 | |
BHFTII-3
Brighthouse Funds Trust II
Brighthouse/Wellington Core Equity Opportunities Portfolio
Understanding Your Portfolio’s Expenses
Shareholder Expense Example
As a shareholder of the Portfolio, you incur ongoing costs, including management fees; distribution and service(12b-1) fees; and other Portfolio expenses. This example is intended to help you understand your ongoing costs (in dollars) (referred to as “expenses”) of investing in the Portfolio and compare these costs with the ongoing costs of investing in other mutual funds. The example is based on an investment of $1,000 invested at the beginning of the period and held for the entire period, July 1, 2018 through December 31, 2018.
Actual Expenses
The first line for each share class of the Portfolio in the table below provides information about actual account values and actual expenses. You may use the information in this line, together with the amount you invested in the particular share class of the Portfolio, to estimate the expenses that you paid over the period. Simply divide your account value by $1,000 (for example, an $8,600 account value divided by $1,000 = 8.6), then multiply the result by the number in the first line under the heading entitled “Expenses Paid During Period” to estimate the expenses you paid on your account during this period.
Hypothetical Example for Comparison Purposes
The second line for each share class of the Portfolio in the table below provides information about hypothetical account values and hypothetical expenses based on the Portfolio’s actual expense ratio and an assumed rate of return of 5% per year before expenses, which is not the Portfolio’s actual return. The hypothetical account values and expenses may not be used to estimate the actual ending account balance or expenses you paid for the period. You may use this information to compare the ongoing costs of investing in the Portfolio and other funds. To do so, compare this 5% hypothetical example with the 5% hypothetical examples that appear in the shareholder reports of the other funds.
Please note that the expenses shown in the table are meant to highlight your ongoing costs only and do not reflect any fees or charges of your variable insurance product or any additional expenses that participants in certain eligible qualified plans may bear relating to the operations of their plan. Therefore, the second line for each share class in the table is useful in comparing ongoing costs only, and will not help you determine the relative total costs of owning different funds. In addition, if these other costs were included, your costs would have been higher.
| | | | | | | | | | | | | | | | | | |
Brighthouse/Wellington Core Equity Opportunities Portfolio | | | | Annualized
Expense
Ratio | | | Beginning
Account Value
July 1,
2018 | | | Ending
Account Value
December 31,
2018 | | | Expenses Paid
During Period**
July 1, 2018
to
December 31,
2018 | |
Class A (a) | | Actual | | | 0.57 | % | | $ | 1,000.00 | | | $ | 982.30 | | | $ | 2.85 | |
| | Hypothetical* | | | 0.57 | % | | $ | 1,000.00 | | | $ | 1,022.33 | | | $ | 2.91 | |
| | | | | |
Class B (a) | | Actual | | | 0.82 | % | | $ | 1,000.00 | | | $ | 980.80 | | | $ | 4.09 | |
| | Hypothetical* | | | 0.82 | % | | $ | 1,000.00 | | | $ | 1,021.07 | | | $ | 4.18 | |
| | | | | |
Class E (a) | | Actual | | | 0.72 | % | | $ | 1,000.00 | | | $ | 981.50 | | | $ | 3.60 | |
| | Hypothetical* | | | 0.72 | % | | $ | 1,000.00 | | | $ | 1,021.58 | | | $ | 3.67 | |
| * | Hypothetical assumes a rate of return of 5% per year before expenses. |
| ** | Expenses paid are equal to the Portfolio’s annualized expense ratio for the most recent six month period, as shown above, multiplied by the average account value over the period, multiplied by the number of days (184 days) in the most recent fiscal half-year, divided by 365 (to reflect theone-half year period). |
| (a) | The annualized expense ratio shown reflects the impact of the management fee waiver as described in Note 5 of the Notes to Financial Statements. |
BHFTII-4
Brighthouse Funds Trust II
Brighthouse/Wellington Core Equity Opportunities Portfolio
Schedule of Investments as of December 31, 2018
Common Stocks—97.4% of Net Assets
| | | | | | | | |
| Security Description | | Shares | | | Value | |
|
| Aerospace & Defense—7.9% | |
General Dynamics Corp. | | | 529,622 | | | $ | 83,261,875 | |
Lockheed Martin Corp. | | | 278,078 | | | | 72,811,943 | |
Northrop Grumman Corp. | | | 270,350 | | | | 66,208,715 | |
United Technologies Corp. | | | 495,233 | | | | 52,732,410 | |
| | | | | | | | |
| | | | | | | 275,014,943 | |
| | | | | | | | |
|
| Air Freight & Logistics—2.0% | |
United Parcel Service, Inc. - Class B (a) | | | 718,194 | | | | 70,045,461 | |
| | | | | | | | |
|
| Banks—2.3% | |
PNC Financial Services Group, Inc. (The) (a) | | | 675,793 | | | | 79,006,960 | |
| | | | | | | | |
|
| Beverages—9.5% | |
Coca-Cola Co. (The) | | | 2,679,102 | | | | 126,855,480 | |
Diageo plc | | | 2,491,935 | | | | 88,572,135 | |
PepsiCo, Inc. | | | 1,047,557 | | | | 115,734,097 | |
| | | | | | | | |
| | | | | | | 331,161,712 | |
| | | | | | | | |
|
| Biotechnology—1.5% | |
Amgen, Inc. (a) | | | 277,993 | | | | 54,116,897 | |
| | | | | | | | |
|
| Capital Markets—1.8% | |
BlackRock, Inc. | | | 160,839 | | | | 63,180,776 | |
| | | | | | | | |
|
| Chemicals—4.8% | |
Ecolab, Inc. (a) | | | 631,427 | | | | 93,040,769 | |
Linde plc | | | 466,784 | | | | 72,836,975 | |
| | | | | | | | |
| | | | | | | 165,877,744 | |
| | | | | | | | |
|
| Consumer Finance—2.5% | |
American Express Co. (a) | | | 899,087 | | | | 85,700,973 | |
| | | | | | | | |
|
| Energy Equipment & Services—0.4% | |
Schlumberger, Ltd. | | | 418,406 | | | | 15,096,088 | |
| | | | | | | | |
|
| Equity Real Estate Investment Trusts—6.2% | |
American Tower Corp. (a) | | | 772,169 | | | | 122,149,414 | |
Public Storage (a) | | | 470,836 | | | | 95,301,915 | |
| | | | | | | | |
| | | | | | | 217,451,329 | |
| | | | | | | | |
|
| Food & Staples Retailing—2.4% | |
Costco Wholesale Corp. | | | 411,752 | | | | 83,878,000 | |
| | | | | | | | |
|
| Health Care Equipment & Supplies—7.8% | |
Baxter International, Inc. (a) | | | 1,279,274 | | | | 84,201,815 | |
Danaher Corp. | | | 892,409 | | | | 92,025,216 | |
Medtronic plc | | | 1,068,073 | | | | 97,151,920 | |
| | | | | | | | |
| | | | | | | 273,378,951 | |
| | | | | | | | |
|
| Health Care Providers & Services—2.5% | |
UnitedHealth Group, Inc. | | | 343,939 | | | | 85,682,084 | |
| | | | | | | | |
|
| Hotels, Restaurants & Leisure—4.9% | |
McDonald’s Corp. (a) | | | 742,804 | | | | 131,899,706 | |
| | | | | | | | |
| Security Description | | Shares | | | Value | |
|
| Hotels, Restaurants & Leisure—(Continued) | |
Starbucks Corp. | | | 577,473 | | | $ | 37,189,261 | |
| | | | | | | | |
| | | | | | | 169,088,967 | |
| | | | | | | | |
|
| Household Products—4.6% | |
Colgate-Palmolive Co. | | | 1,647,064 | | | | 98,033,249 | |
Procter & Gamble Co. (The) | | | 694,343 | | | | 63,824,009 | |
| | | | | | | | |
| | | | | | | 161,857,258 | |
| | | | | | | | |
|
| Industrial Conglomerates—4.0% | |
3M Co. | | | 370,671 | | | | 70,627,653 | |
Honeywell International, Inc. | | | 528,785 | | | | 69,863,074 | |
| | | | | | | | |
| | | | | | | 140,490,727 | |
| | | | | | | | |
|
| Insurance—5.5% | |
Chubb, Ltd. | | | 825,711 | | | | 106,665,347 | |
Marsh & McLennan Cos., Inc. | | | 1,050,332 | | | | 83,763,977 | |
| | | | | | | | |
| | | | | | | 190,429,324 | |
| | | | | | | | |
|
| IT Services—6.1% | |
Accenture plc - Class A | | | 581,561 | | | | 82,005,916 | |
Automatic Data Processing, Inc. (a) | | | 327,149 | | | | 42,895,777 | |
Visa, Inc. - Class A | | | 661,153 | | | | 87,232,527 | |
| | | | | | | | |
| | | | | | | 212,134,220 | |
| | | | | | | | |
|
| Oil, Gas & Consumable Fuels—1.4% | |
Exxon Mobil Corp. (a) | | | 692,718 | | | | 47,236,440 | |
| | | | | | | | |
|
| Pharmaceuticals—4.8% | |
Johnson & Johnson | | | 823,795 | | | | 106,310,745 | |
Merck & Co., Inc. (a) | | | 789,789 | | | | 60,347,777 | |
| | | | | | | | |
| | | | | | | 166,658,522 | |
| | | | | | | | |
|
| Road & Rail—5.0% | |
Canadian National Railway Co. | | | 1,083,053 | | | | 80,213,514 | |
Union Pacific Corp. | | | 673,345 | | | | 93,076,479 | |
| | | | | | | | |
| | | | | | | 173,289,993 | |
| | | | | | | | |
|
| Software—3.0% | |
Microsoft Corp. | | | 1,013,488 | | | | 102,939,976 | |
| | | | | | | | |
|
| Specialty Retail—2.4% | |
TJX Cos., Inc. (The) (a) | | | 1,837,375 | | | | 82,204,158 | |
| | | | | | | | |
|
| Textiles, Apparel & Luxury Goods—4.1% | |
NIKE, Inc. - Class B | | | 1,330,957 | | | | 98,677,152 | |
VF Corp. (a) | | | 627,424 | | | | 44,760,428 | |
| | | | | | | | |
| | | | | | | 143,437,580 | |
| | | | | | | | |
Total Common Stocks
(Cost $2,880,892,683) | | | | | | | 3,389,359,083 | |
| | | | | | | | |
See accompanying notes to financial statements.
BHFTII-5
Brighthouse Funds Trust II
Brighthouse/Wellington Core Equity Opportunities Portfolio
Schedule of Investments as of December 31, 2018
Escrow Shares—0.0%
| | | | | | | | |
| Security Description | | Shares/
Principal
Amount* | | | Value | |
|
| Forest Products & Paper—0.0% | |
Sino-Forest Corp.
(Cost $0) | | | 5,844,000 | | | $ | 0 | |
| | | | | | | | |
|
| Short-Term Investment—2.3% | |
|
| Repurchase Agreement—2.3% | |
Fixed Income Clearing Corp.
Repurchase Agreement dated 12/31/18 at 1.200%, due on 01/02/19 with a maturity value of $79,441,766; collateralized by U.S. Treasury Note at 2.125%, maturing 11/30/23, with a market value of $81,025,727. | | | 79,436,470 | | | | 79,436,470 | |
| | | | | | | | |
Total Short-Term Investments
(Cost $79,436,470) | | | | | | | 79,436,470 | |
| | | | | | | | |
|
| Securities Lending Reinvestments (b)—7.5% | |
|
| Certificates of Deposit—3.9% | |
Bank of Nova Scotia
2.890%, SOFR + 0.430%, 05/16/19 (c) | | | 4,000,000 | | | | 3,999,997 | |
3.072%, 3M LIBOR + 0.280%, 03/20/19 (c) | | | 6,000,000 | | | | 6,002,394 | |
China Construction Bank Corp.
2.550%, 01/07/19 | | | 2,050,000 | | | | 2,050,000 | |
Citibank N.A.
2.490%, 02/04/19 | | | 5,000,000 | | | | 4,999,305 | |
Commonwealth Bank of Australia
2.617%, 3M LIBOR + 0.140%, 04/23/19 (c) | | | 2,000,000 | | | | 2,000,006 | |
2.642%, 1M LIBOR + 0.210%, 09/13/19 (c) | | | 7,000,000 | | | | 7,000,000 | |
Cooperative Rabobank UA
2.608%, 3M LIBOR + 0.200%, 04/05/19 (c) | | | 2,000,000 | | | | 2,000,628 | |
Credit Agricole S.A.
2.500%, 02/12/19 | | | 9,000,000 | | | | 8,998,470 | |
Credit Industriel et Commercial
Zero Coupon, 01/25/19 | | | 4,936,141 | | | | 4,991,500 | |
Credit Suisse AG
2.620%, 04/01/19 | | | 5,000,000 | | | | 4,997,410 | |
2.890%, SOFR + 0.430%, 05/02/19 (c) | | | 4,000,000 | | | | 3,999,952 | |
Industrial & Commercial Bank of China, Ltd.
2.850%, 02/15/19 | | | 6,000,000 | | | | 5,999,556 | |
Mitsubishi UFJ Trust and Banking Corp.
Zero Coupon, 01/15/19 | | | 3,969,950 | | | | 3,995,920 | |
Mizuho Bank, Ltd., New York
2.649%, 1M LIBOR + 0.300%, 05/01/19 (c) | | | 10,000,000 | | | | 10,000,060 | |
MUFG Bank Ltd.
2.649%, 1M LIBOR + 0.300%, 05/01/19 (c) | | | 3,000,000 | | | | 3,000,018 | |
Natixis New York
2.705%, 3M LIBOR + 0.090%, 05/10/19 (c) | | | 2,500,000 | | | | 2,498,425 | |
Skandinaviska Enskilda Banken
2.645%, 1M LIBOR + 0.190%, 04/17/19 (c) | | | 8,000,000 | | | | 7,999,344 | |
Societe Generale
2.719%, 3M LIBOR + 0.160%, 05/07/19 (c) | | | 5,000,000 | | | | 4,997,780 | |
Standard Chartered plc
2.686%, 1M LIBOR + 0.180%, 02/25/19 (c) | | | 7,000,000 | | | | 6,999,797 | |
| | | | | | | | |
| Security Description | |
Principal
Amount* | | | Value | |
|
| Certificates of Deposit—(Continued) | |
State Street Bank and Trust
2.725%, 1M LIBOR + 0.270%, 05/15/19 (c) | | | 9,500,000 | | | $ | 9,499,810 | |
Sumitomo Mitsui Banking Corp.
2.700%, 02/25/19 | | | 4,000,000 | | | | 4,000,368 | |
Svenska Handelsbanken AB
2.620%, 3M LIBOR + 0.100%, 04/30/19 (c) | | | 3,500,000 | | | | 3,499,842 | |
2.799%, 1M LIBOR + 0.450%, 04/03/19 (c) | | | 5,000,000 | | | | 5,002,890 | |
2.822%, 1M LIBOR + 0.300%, 10/31/19 (c) | | | 3,500,000 | | | | 3,499,181 | |
U.S. Bank N.A.
2.764%, 1M LIBOR + 0.260%, 07/23/19 (c) | | | 1,000,000 | | | | 1,000,000 | |
Wells Fargo Bank N.A.
2.560%, 3M LIBOR + 0.140%, 07/11/19 (c) | | | 4,000,000 | | | | 4,003,470 | |
2.730%, 3M LIBOR + 0.210%, 10/25/19 (c) | | | 4,000,000 | | | | 4,000,000 | |
Westpac Banking Corp.
2.850%, FEDEFF PRV + 0.450%, 02/15/19 (c) | | | 4,000,000 | | | | 3,999,975 | |
| | | | | | | | |
| | | | | | | 135,036,098 | |
| | | | | | | | |
|
| Commercial Paper—1.9% | |
Alpine Securities Ltd.
2.529%, 1M LIBOR + 0.180%, 04/03/19 (c) | | | 5,000,000 | | | | 4,998,615 | |
Banco Santander S.A.
2.500%, 01/16/19 | | | 6,955,278 | | | | 6,991,572 | |
2.740%, 02/07/19 | | | 4,964,989 | | | | 4,985,440 | |
Bank of China, Ltd.
2.690%, 01/17/19 | | | 4,966,375 | | | | 4,994,130 | |
HSBC Bank plc
2.842%, 1M LIBOR + 0.320%, 07/30/19 (c) | | | 12,000,000 | | | | 12,000,000 | |
ING Funding LLC
2.707%, 1M LIBOR + 0.320%, 02/08/19 (c) | | | 12,000,000 | | | | 12,001,116 | |
Toronto-Dominion Bank
2.729%, 1M LIBOR + 0.350%, 11/05/19 (c) | | | 10,000,000 | | | | 9,998,900 | |
UBS AG
2.779%, 1M LIBOR + 0.430%, 02/01/19 (c) | | | 12,000,000 | | | | 12,002,940 | |
| | | | | | | | |
| | | | | | | 67,972,713 | |
| | | | | | | | |
|
| Repurchase Agreements—1.7% | |
Citadel Clearing LLC
Repurchase Agreement dated 12/31/18 at 3.000%, due on 04/02/19 with a maturity value of $10,076,667; collateralized by various Common Stock with an aggregate market value of $11,001,834. | | | 10,000,000 | | | | 10,000,000 | |
Citigroup Global Markets, Inc.
Repurchase Agreement dated 12/31/18 at 2.790%, due on 02/04/19 with a maturity value of $1,504,069; collateralized by U.S. Treasury Obligations at 0.000%, maturing 02/12/19, and various Common Stock with an aggregate market value of $1,632,478. | | | 1,500,000 | | | | 1,500,000 | |
Repurchase Agreement dated 12/31/18 at 2.940%, due on 04/02/19 with a maturity value of $654,884; collateralized by U.S. Treasury Obligations with rates ranging from 1.125% - 2.750%, maturity dates ranging from 01/31/19 - 08/15/24, and an aggregate market value of $663,000. | | | 650,000 | | | | 650,000 | |
See accompanying notes to financial statements.
BHFTII-6
Brighthouse Funds Trust II
Brighthouse/Wellington Core Equity Opportunities Portfolio
Schedule of Investments as of December 31, 2018
Securities Lending Reinvestments (b)—(Continued)
| | | | | | | | |
| Security Description | | Principal
Amount* | | | Value | |
|
| Repurchase Agreements—(Continued) | |
Deutsche Bank Securities, Inc.
Repurchase Agreement dated 12/31/18 at 3.200%, due on 01/02/19 with a maturity value of $6,000,505; collateralized by U.S. Treasury Obligations at 0.000%, maturity dates ranging from 08/15/30 - 08/15/39, and an aggregate market value of $6,119,427. | | | 5,999,439 | | | $ | 5,999,439 | |
Merrill Lynch, Pierce, Fenner & Smith, Inc.
Repurchase Agreement dated 12/31/18 at 2.940%, due on 04/02/19 with a maturity value of $7,556,350; collateralized by various Common Stock with an aggregate market value of $8,250,000. | | | 7,500,000 | | | | 7,500,000 | |
NBC Global Finance, Ltd.
Repurchase Agreement dated 12/31/18 at 2.560%, due on 01/02/19 with a maturity value of $15,002,133; collateralized by various Common Stock with an aggregate market value of $16,698,184. | | | 15,000,000 | | | | 15,000,000 | |
Repurchase Agreement dated 12/31/18 at 2.560%, due on 01/02/19 with a maturity value of $5,000,711; collateralized by various Common Stock with an aggregate market value of $5,566,061. | | | 5,000,000 | | | | 5,000,000 | |
Nomura Securities International, Inc.
Repurchase Agreement dated 12/31/18 at 2.950%, due on 01/02/19 with a maturity value of $5,000,819; collateralized by U.S. Treasury Obligations with rates ranging from 0.000% - 6.500%, maturity dates ranging from 02/15/19 - 08/15/48, and an aggregate market value of $5,100,000. | | | 5,000,000 | | | | 5,000,000 | |
Societe Generale
Repurchase Agreement dated 12/31/18 at 2.530%, due on 01/02/19 with a maturity value of $9,501,335; collateralized by U.S. Treasury Obligations with rates ranging from 0.750% - 8.000%, maturity dates ranging from 09/30/19 - 08/15/46, and various Common Stock with an aggregate market value of $10,407,021. | | | 9,500,000 | | | | 9,500,000 | |
| | | | | | | | |
| | | | | | | 60,149,439 | |
| | | | | | | | |
Total Securities Lending Reinvestments
(Cost $263,161,719) | | | | | | | 263,158,250 | |
| | | | | | | | |
Total Investments—107.2%
(Cost $3,223,490,872) | | | | | | | 3,731,953,803 | |
Other assets and liabilities (net)—(7.2)% | | | | | | | (251,999,189 | ) |
| | | | | | | | |
| Net Assets—100.0% | | | | | | $ | 3,479,954,614 | |
| | | | | | | | |
| | | | |
| * | | Principal amount stated in U.S. dollars unless otherwise noted. |
| (a) | | All or a portion of the security was held on loan. As of December 31, 2018, the market value of securities loaned was $260,570,335 and the collateral received consisted of cash in the amount of $262,992,171. The cash collateral investments are disclosed in the Schedule of Investments and categorized as Securities Lending Reinvestments. |
| (b) | | Represents investment of cash collateral received from securities on loan as of December 31, 2018. |
| (c) | | Variable or floating rate security. The stated rate represents the rate at December 31, 2018. Maturity date shown for callable securities reflects the earliest possible call date. For securities based on a published reference index and spread, the index and spread are indicated in the description above. For certain variable rate securities, the coupon rate is determined by the issuer/ agent based on current market conditions. For certain asset- and mortgage- backed securities, the coupon rate may fluctuate based on changes of the underlying collateral or prepayments of principal. These securities do not indicate a reference index and spread in their description above. |
| (FEDEFF PRV)— | | Effective Federal Funds Rate |
| (LIBOR)— | | London Interbank Offered Rate |
| (SOFR)— | | Secured Overnight Financing Rate |
See accompanying notes to financial statements.
BHFTII-7
Brighthouse Funds Trust II
Brighthouse/Wellington Core Equity Opportunities Portfolio
Schedule of Investments as of December 31, 2018
Fair Value Hierarchy
Accounting principles generally accepted in the United States of America (“GAAP”) define fair market value as the price that the Portfolio would receive to sell an asset or pay to transfer a liability in an orderly transaction between market participants at the measurement date. It establishes a fair value hierarchy that prioritizes inputs to valuation methods and requires disclosure of the fair value hierarchy, separately for each major category of assets and liabilities, that segregates fair value measurements into three levels. Levels 1, 2 and 3 of the fair value hierarchy are defined as follows:
Level 1 - unadjusted quoted prices in active markets for identical investments
Level 2 - other significant observable inputs (including, but not limited to, quoted prices for similar assets or liabilities in markets that are either active or inactive; inputs other than quoted prices that are observable such as interest rates, yield curves, volatilities, prepayment speeds, loss severities, credit risks, default rates, or other market corroborated inputs)
Level 3 - significant unobservable inputs based on the best information available in the circumstances, to the extent observable inputs are unavailable (including the Portfolio’s own assumptions used in determining the fair value of investments and derivative financial instruments)
The inputs or methodologies used for valuing investments are not necessarily an indication of the risk associated with investing in them. Changes to the inputs or methodologies used may result in transfers between levels. A reconciliation of Level 3 securities, if any, will be disclosed following the fair value hierarchy table. For more information about the Portfolio’s policy regarding the valuation of investments, please refer to the Notes to Financial Statements.
The following table summarizes the fair value hierarchy of the Portfolio’s investments as of December 31, 2018:
| | | | | | | | | | | | | | | | |
| Description | | Level 1 | | | Level 2 | | | Level 3 | | | Total | |
| Common Stocks | |
Aerospace & Defense | | $ | 275,014,943 | | | $ | — | | | $ | — | | | $ | 275,014,943 | |
Air Freight & Logistics | | | 70,045,461 | | | | — | | | | — | | | | 70,045,461 | |
Banks | | | 79,006,960 | | | | — | | | | — | | | | 79,006,960 | |
Beverages | | | 242,589,577 | | | | 88,572,135 | | | | — | | | | 331,161,712 | |
Biotechnology | | | 54,116,897 | | | | — | | | | — | | | | 54,116,897 | |
Capital Markets | | | 63,180,776 | | | | — | | | | — | | | | 63,180,776 | |
Chemicals | | | 165,877,744 | | | | — | | | | — | | | | 165,877,744 | |
Consumer Finance | | | 85,700,973 | | | | — | | | | — | | | | 85,700,973 | |
Energy Equipment & Services | | | 15,096,088 | | | | — | | | | — | | | | 15,096,088 | |
Equity Real Estate Investment Trusts | | | 217,451,329 | | | | — | | | | — | | | | 217,451,329 | |
Food & Staples Retailing | | | 83,878,000 | | | | — | | | | — | | | | 83,878,000 | |
Health Care Equipment & Supplies | | | 273,378,951 | | | | — | | | | — | | | | 273,378,951 | |
Health Care Providers & Services | | | 85,682,084 | | | | — | | | | — | | | | 85,682,084 | |
Hotels, Restaurants & Leisure | | | 169,088,967 | | | | — | | | | — | | | | 169,088,967 | |
Household Products | | | 161,857,258 | | | | — | | | | — | | | | 161,857,258 | |
Industrial Conglomerates | | | 140,490,727 | | | | — | | | | — | | | | 140,490,727 | |
Insurance | | | 190,429,324 | | | | — | | | | — | | | | 190,429,324 | |
IT Services | | | 212,134,220 | | | | — | | | | — | | | | 212,134,220 | |
Oil, Gas & Consumable Fuels | | | 47,236,440 | | | | — | | | | — | | | | 47,236,440 | |
Pharmaceuticals | | | 166,658,522 | | | | — | | | | — | | | | 166,658,522 | |
Road & Rail | | | 173,289,993 | | | | — | | | | — | | | | 173,289,993 | |
Software | | | 102,939,976 | | | | — | | | | — | | | | 102,939,976 | |
Specialty Retail | | | 82,204,158 | | | | — | | | | — | | | | 82,204,158 | |
Textiles, Apparel & Luxury Goods | | | 143,437,580 | | | | — | | | | — | | | | 143,437,580 | |
Total Common Stocks | | | 3,300,786,948 | | | | 88,572,135 | | | | — | | | | 3,389,359,083 | |
Total Escrow Shares* | | | — | | | | 0 | | | | — | | | | 0 | |
Total Short-Term Investment* | | | — | | | | 79,436,470 | | | | — | | | | 79,436,470 | |
Total Securities Lending Reinvestments* | | | — | | | | 263,158,250 | | | | — | | | | 263,158,250 | |
Total Investments | | $ | 3,300,786,948 | | | $ | 431,166,855 | | | $ | — | | | $ | 3,731,953,803 | |
| | | | | | | | | | | | | | | | | |
Collateral for Securities Loaned (Liability) | | $ | — | | | $ | (262,992,171 | ) | | $ | — | | | $ | (262,992,171 | ) |
| | | | |
| * | | See Schedule of Investments for additional detailed categorizations. |
See accompanying notes to financial statements.
BHFTII-8
Brighthouse Funds Trust II
Brighthouse/Wellington Core Equity Opportunities Portfolio
Statement of Assets and Liabilities
December 31, 2018
| | | | |
Assets | |
Investments at value (a) (b) | | $ | 3,731,953,803 | |
Receivable for: | |
Investments sold | | | 9,979,512 | |
Fund shares sold | | | 71,461 | |
Dividends and interest | | | 5,987,218 | |
Prepaid expenses | | | 10,509 | |
| | | | |
Total Assets | | | 3,748,002,503 | |
Liabilities | |
Collateral for securities loaned | | | 262,992,171 | |
Payables for: | |
Fund shares redeemed | | | 2,576,317 | |
Accrued Expenses: | |
Management fees | | | 1,702,739 | |
Distribution and service fees | | | 217,747 | |
Deferred trustees’ fees | | | 189,880 | |
Other expenses | | | 369,035 | |
| | | | |
Total Liabilities | | | 268,047,889 | |
| | | | |
Net Assets | | $ | 3,479,954,614 | |
| | | | |
Net Assets Consist of: | |
Paid in surplus | | $ | 2,613,833,950 | |
Distributable earnings (Accumulated losses) | | | 866,120,664 | |
| | | | |
Net Assets | | $ | 3,479,954,614 | |
| | | | |
Net Assets | |
Class A | | $ | 2,225,565,202 | |
Class B | | | 601,192,186 | |
Class E | | | 653,197,226 | |
Capital Shares Outstanding* | |
Class A | | | 74,158,936 | |
Class B | | | 20,308,640 | |
Class E | | | 21,985,279 | |
Net Asset Value, Offering Price and Redemption Price Per Share | |
Class A | | $ | 30.01 | |
Class B | | | 29.60 | |
Class E | | | 29.71 | |
| | | | |
| * | | The Portfolio is authorized to issue an unlimited number of shares. |
| (a) | | Includes securities loaned at value of $260,570,335. |
| (b) | | Identified cost of investments was $3,223,490,872. |
Statement of Operations
Year Ended December 31, 2018
| | | | |
Investment Income | |
Dividends (a) | | $ | 82,997,477 | |
Interest | | | 447,219 | |
Securities lending income | | | 887,597 | |
| | | | |
Total investment income | | | 84,332,293 | |
Expenses | |
Management fees | | | 27,881,280 | |
Administration fees | | | 134,788 | |
Custodian and accounting fees | | | 219,703 | |
Distribution and service fees—Class B | | | 1,722,127 | |
Distribution and service fees—Class E | | | 1,124,758 | |
Audit and tax services | | | 44,663 | |
Legal | | | 45,151 | |
Trustees’ fees and expenses | | | 33,733 | |
Shareholder reporting | | | 239,275 | |
Insurance | | | 25,980 | |
Miscellaneous | | | 40,785 | |
| | | | |
Total expenses | | | 31,512,243 | |
Less management fee waiver | | | (5,807,261 | ) |
Less broker commission recapture | | | (1,914 | ) |
| | | | |
Net expenses | | | 25,703,068 | |
| | | | |
Net Investment Income | | | 58,629,225 | |
| | | | |
Net Realized and Unrealized Gain (Loss) | |
| Net realized gain (loss) on: | |
Investments | | | 316,213,382 | |
Foreign currency transactions | | | (2,926 | ) |
| | | | |
Net realized gain | | | 316,210,456 | |
| | | | |
| Net change in unrealized depreciation on: | |
Investments | | | (350,565,168 | ) |
Foreign currency transactions | | | (10,524 | ) |
| | | | |
Net change in unrealized depreciation | | | (350,575,692 | ) |
| | | | |
Net realized and unrealized loss | | | (34,365,236 | ) |
| | | | |
Net Increase in Net Assets From Operations | | $ | 24,263,989 | |
| | | | |
| | | | |
| (a) | | Net of foreign withholding taxes of $443,396. |
See accompanying notes to financial statements.
BHFTII-9
Brighthouse Funds Trust II
Brighthouse/Wellington Core Equity Opportunities Portfolio
Statements of Changes in Net Assets
| | | | | | | | |
| | | Year Ended
December 31,
2018 | | | Year Ended
December 31,
2017 | |
Increase (Decrease) in Net Assets: | |
From Operations | |
Net investment income | | $ | 58,629,225 | | | $ | 67,661,079 | |
Net realized gain | | | 316,210,456 | | | | 214,532,706 | |
Net change in unrealized appreciation (depreciation) | | | (350,575,692 | ) | | | 433,409,235 | |
| | | | | | | | |
Increase in net assets from operations | | | 24,263,989 | | | | 715,603,020 | |
| | | | | | | | |
From Distributions to Shareholders (a) | |
Class A | | | (181,538,032 | ) | | | (137,009,010 | ) |
Class B | | | (47,981,086 | ) | | | (35,996,275 | ) |
Class E | | | (52,615,965 | ) | | | (40,467,486 | ) |
| | | | | | | | |
Total distributions | | | (282,135,083 | ) | | | (213,472,771 | ) |
| | | | | | | | |
Decrease in net assets from capital share transactions | | | (434,590,569 | ) | | | (335,525,943 | ) |
| | | | | | | | |
Total increase (decrease) in net assets | | | (692,461,663 | ) | | | 166,604,306 | |
|
Net Assets | |
Beginning of period | | | 4,172,416,277 | | | | 4,005,811,971 | |
| | | | | | | | |
End of period | | $ | 3,479,954,614 | | | $ | 4,172,416,277 | (b) |
| | | | | | | | |
Other Information:
Capital Shares
Transactions in capital shares were as follows:
| | | | | | | | | | | | | | | | |
| | | Year Ended
December 31, 2018 | | | Year Ended
December 31, 2017 | |
| | | Shares | | | Value | | | Shares | | | Value | |
Class A | |
Sales | | | 488,305 | | | $ | 15,651,864 | | | | 399,266 | | | $ | 12,080,551 | |
Reinvestments | | | 5,837,236 | | | | 181,538,032 | | | | 4,585,308 | | | | 137,009,010 | |
Redemptions | | | (14,304,208 | ) | | | (461,190,687 | ) | | | (11,570,564 | ) | | | (353,806,274 | ) |
| | | | | | | | | | | | | | | | |
Net decrease | | | (7,978,667 | ) | | $ | (264,000,791 | ) | | | (6,585,990 | ) | | $ | (204,716,713 | ) |
| | | | | | | | | | | | | | | | |
Class B | |
Sales | | | 637,417 | | | $ | 20,083,779 | | | | 781,128 | | | $ | 23,357,931 | |
Reinvestments | | | 1,561,885 | | | | 47,981,086 | | | | 1,218,560 | | | | 35,996,275 | |
Redemptions | | | (4,622,811 | ) | | | (146,895,703 | ) | | | (3,745,281 | ) | | | (112,544,024 | ) |
| | | | | | | | | | | | | | | | |
Net decrease | | | (2,423,509 | ) | | $ | (78,830,838 | ) | | | (1,745,593 | ) | | $ | (53,189,818 | ) |
| | | | | | | | | | | | | | | | |
Class E | |
Sales | | | 118,913 | | | $ | 3,787,893 | | | | 171,709 | | | $ | 5,133,476 | |
Reinvestments | | | 1,707,202 | | | | 52,615,965 | | | | 1,366,222 | | | | 40,467,486 | |
Redemptions | | | (4,652,051 | ) | | | (148,162,798 | ) | | | (4,090,639 | ) | | | (123,220,374 | ) |
| | | | | | | | | | | | | | | | |
Net decrease | | | (2,825,936 | ) | | $ | (91,758,940 | ) | | | (2,552,708 | ) | | $ | (77,619,412 | ) |
| | | | | | | | | | | | | | | | |
Decrease derived from capital shares transactions | | | | | | $ | (434,590,569 | ) | | | | | | $ | (335,525,943 | ) |
| | | | | | | | | | | | | | | | |
| | | | |
| (a) | | Distributions from net investment income and realized gains are no longer required to be separately disclosed. The presentation for the year ended December 31, 2018 has been adjusted for this change (See Note 8). At December 31, 2017 the distributions were as follows. |
| | | | | | | | |
| | | Distributions from net
investment income: | | | Distributions from realized
capital gains: | |
Class A | | $ | (40,775,492 | ) | | $ | (96,233,518 | ) |
Class B | | | (9,546,738 | ) | | | (26,449,537 | ) |
Class E | | | (11,201,278 | ) | | | (29,266,208 | ) |
| | | | |
| (b) | | As part of the update in (a), it is also no longer required to disclose the Undistributed net investment income (Accumulated losses) which was $67,333,496 as of December 31, 2017. |
See accompanying notes to financial statements.
BHFTII-10
Brighthouse Funds Trust II
Brighthouse/Wellington Core Equity Opportunities Portfolio
Financial Highlights
| | | | | | | | | | | | | | | | | | | | |
| Selected per share data | |
| | | Class A | |
| | | Year Ended December 31, | |
| | | 2018 | | | 2017 | | | 2016 | | | 2015 | | | 2014 | |
Net Asset Value, Beginning of Period | | $ | 32.30 | | | $ | 28.61 | | | $ | 28.38 | | | $ | 43.13 | | | $ | 42.97 | |
| | | | | | | | | | | | | | | | | | | | |
Income (Loss) from Investment Operations | |
Net investment income (a) | | | 0.50 | | | | 0.52 | | | | 0.48 | | | | 0.58 | | | | 0.72 | |
Net realized and unrealized gain (loss) | | | (0.45 | ) | | | 4.81 | | | | 1.53 | | | | 0.31 | | | | 3.41 | |
| | | | | | | | | | | | | | | | | | | | |
Total income (loss) from investment operations | | | 0.05 | | | | 5.33 | | | | 2.01 | | | | 0.89 | | | | 4.13 | |
| | | | | | | | | | | | | | | | | | | | |
Less Distributions | |
Distributions from net investment income | | | (0.58 | ) | | | (0.49 | ) | | | (0.48 | ) | | | (0.77 | ) | | | (0.31 | ) |
Distributions from net realized capital gains | | | (1.76 | ) | | | (1.15 | ) | | | (1.30 | ) | | | (14.87 | ) | | | (3.66 | ) |
| | | | | | | | | | | | | | | | | | | | |
Total distributions | | | (2.34 | ) | | | (1.64 | ) | | | (1.78 | ) | | | (15.64 | ) | | | (3.97 | ) |
| | | | | | | | | | | | | | | | | | | | |
Net Asset Value, End of Period | | $ | 30.01 | | | $ | 32.30 | | | $ | 28.61 | | | $ | 28.38 | | | $ | 43.13 | |
| | | | | | | | | | | | | | | | | | | | |
Total Return (%) (b) | | | (0.09 | ) | | | 19.07 | | | | 7.34 | | | | 2.40 | | | | 10.63 | |
|
Ratios/Supplemental Data | |
Gross ratio of expenses to average net assets (%) | | | 0.72 | | | | 0.72 | | | | 0.72 | | | | 0.72 | | | | 0.73 | |
Net ratio of expenses to average net assets (%) (c)(d) | | | 0.57 | | | | 0.57 | | | | 0.58 | | | | 0.58 | | | | 0.59 | |
Ratio of net investment income to average net assets (%) | | | 1.54 | | | | 1.72 | | | | 1.70 | | | | 1.72 | | | | 1.74 | |
Portfolio turnover rate (%) | | | 22 | | | | 13 | | | | 32 | | | | 25 | | | | 105 | |
Net assets, end of period (in millions) | | $ | 2,225.6 | | | $ | 2,653.5 | | | $ | 2,538.2 | | | $ | 2,113.5 | | | $ | 2,352.1 | |
| |
| | | Class B | |
| | | Year Ended December 31, | |
| | | 2018 | | | 2017 | | | 2016 | | | 2015 | | | 2014 | |
Net Asset Value, Beginning of Period | | $ | 31.89 | | | $ | 28.26 | | | $ | 28.06 | | | $ | 42.79 | | | $ | 42.66 | |
| | | | | | | | | | | | | | | | | | | | |
Income (Loss) from Investment Operations | |
Net investment income (a) | | | 0.41 | | | | 0.44 | | | | 0.41 | | | | 0.49 | | | | 0.61 | |
Net realized and unrealized gain (loss) | | | (0.44 | ) | | | 4.75 | | | | 1.50 | | | | 0.31 | | | | 3.38 | |
| | | | | | | | | | | | | | | | | | | | |
Total income (loss) from investment operations | | | (0.03 | ) | | | 5.19 | | | | 1.91 | | | | 0.80 | | | | 3.99 | |
| | | | | | | | | | | | | | | | | | | | |
Less Distributions | |
Distributions from net investment income | | | (0.50 | ) | | | (0.41 | ) | | | (0.41 | ) | | | (0.66 | ) | | | (0.20 | ) |
Distributions from net realized capital gains | | | (1.76 | ) | | | (1.15 | ) | | | (1.30 | ) | | | (14.87 | ) | | | (3.66 | ) |
| | | | | | | | | | | | | | | | | | | | |
Total distributions | | | (2.26 | ) | | | (1.56 | ) | | | (1.71 | ) | | | (15.53 | ) | | | (3.86 | ) |
| | | | | | | | | | | | | | | | | | | | |
Net Asset Value, End of Period | | $ | 29.60 | | | $ | 31.89 | | | $ | 28.26 | | | $ | 28.06 | | | $ | 42.79 | |
| | | | | | | | | | | | | | | | | | | | |
Total Return (%) (b) | | | (0.35 | ) | | | 18.81 | | | | 7.06 | | | | 2.14 | | | | 10.35 | |
|
Ratios/Supplemental Data | |
Gross ratio of expenses to average net assets (%) | | | 0.97 | | | | 0.97 | | | | 0.97 | | | | 0.97 | | | | 0.98 | |
Net ratio of expenses to average net assets (%) (c)(d) | | | 0.82 | | | | 0.82 | | | | 0.83 | | | | 0.83 | | | | 0.84 | |
Ratio of net investment income to average net assets (%) | | | 1.29 | | | | 1.47 | | | | 1.44 | | | | 1.47 | | | | 1.49 | |
Portfolio turnover rate (%) | | | 22 | | | | 13 | | | | 32 | | | | 25 | | | | 105 | |
Net assets, end of period (in millions) | | $ | 601.2 | | | $ | 725.0 | | | $ | 691.8 | | | $ | 611.0 | | | $ | 693.7 | |
Please see following page for Financial Highlights footnote legend.
See accompanying notes to financial statements.
BHFTII-11
Brighthouse Funds Trust II
Brighthouse/Wellington Core Equity Opportunities Portfolio
Financial Highlights
| | | | | | | | | | | | | | | | | | | | |
| Selected per share data | |
| | | Class E | |
| | | Year Ended December 31, | |
| | | 2018 | | | 2017 | | | 2016 | | | 2015 | | | 2014 | |
Net Asset Value, Beginning of Period | | $ | 32.00 | | | $ | 28.35 | | | $ | 28.13 | | | $ | 42.87 | | | $ | 42.74 | |
| | | | | | | | | | | | | | | | | | | | |
Income (Loss) from Investment Operations | |
Net investment income (a) | | | 0.44 | | | | 0.47 | | | | 0.43 | | | | 0.53 | | | | 0.65 | |
Net realized and unrealized gain (loss) | | | (0.44 | ) | | | 4.77 | | | | 1.52 | | | | 0.30 | | | | 3.38 | |
| | | | | | | | | | | | | | | | | | | | |
Total income (loss) from investment operations | | | 0.00 | | | | 5.24 | | | | 1.95 | | | | 0.83 | | | | 4.03 | |
| | | | | | | | | | | | | | | | | | | | |
Less Distributions | |
Distributions from net investment income | | | (0.53 | ) | | | (0.44 | ) | | | (0.43 | ) | | | (0.70 | ) | | | (0.24 | ) |
Distributions from net realized capital gains | | | (1.76 | ) | | | (1.15 | ) | | | (1.30 | ) | | | (14.87 | ) | | | (3.66 | ) |
| | | | | | | | | | | | | | | | | | | | |
Total distributions | | | (2.29 | ) | | | (1.59 | ) | | | (1.73 | ) | | | (15.57 | ) | | | (3.90 | ) |
| | | | | | | | | | | | | | | | | | | | |
Net Asset Value, End of Period | | $ | 29.71 | | | $ | 32.00 | | | $ | 28.35 | | | $ | 28.13 | | | $ | 42.87 | |
| | | | | | | | | | | | | | | | | | | | |
Total Return (%) (b) | | | (0.25 | ) | | | 18.92 | | | | 7.15 | | | | 2.27 | | | | 10.45 | |
|
Ratios/Supplemental Data | |
Gross ratio of expenses to average net assets (%) | | | 0.87 | | | | 0.87 | | | | 0.87 | | | | 0.87 | | | | 0.88 | |
Net ratio of expenses to average net assets (%) (c)(d) | | | 0.72 | | | | 0.72 | | | | 0.73 | | | | 0.73 | | | | 0.74 | |
Ratio of net investment income to average net assets (%) | | | 1.39 | | | | 1.57 | | | | 1.54 | | | | 1.57 | | | | 1.59 | |
Portfolio turnover rate (%) | | | 22 | | | | 13 | | | | 32 | | | | 25 | | | | 105 | |
Net assets, end of period (in millions) | | $ | 653.2 | | | $ | 794.0 | | | $ | 775.8 | | | $ | 829.2 | | | $ | 952.4 | |
| | | | |
| (a) | | Per share amounts based on average shares outstanding during the period. |
| (b) | | Total return does not reflect any insurance, sales, separate account or administrative charges of variable annuity or life insurance contracts or any additional expenses that contract owners may bear under their variable contracts. If these charges were included, the returns would be lower. |
| (c) | | The effect of the voluntary portion of the waivers on the net ratio of expenses to average net assets was 0.03% for the years ended December 31, 2018 through 2014. (see Note 5 of the Notes to Financial Statements). |
| (d) | | Includes the effects of management fee waivers (see Note 5 of the Notes to Financial Statements). |
See accompanying notes to financial statements.
BHFTII-12
Brighthouse Funds Trust II
Brighthouse/Wellington Core Equity Opportunities Portfolio
Notes to Financial Statements—December 31, 2018
1. Organization
Brighthouse Funds Trust II (the “Trust”) is organized as a Delaware statutory trust and registered under the Investment Company Act of 1940, as amended (the “1940 Act”), as anopen-end management investment company. The Trust, which is managed by Brighthouse Investment Advisers, LLC (“Brighthouse Investment Advisers” or the “Adviser”), currently offers twenty-nine series, each of which operates as a distinct investment vehicle of the Trust. The series included in this report is Brighthouse/Wellington Core Equity Opportunities Portfolio (the “Portfolio”), which is diversified. Shares in the Portfolio are not offered directly to the general public and are currently available only to separate accounts established by life insurance companies affiliated with the Adviser and Metropolitan Life Insurance Company (the “Insurance Companies”).
The Portfolio has registered and offers three classes of shares: Class A, B and E shares. Shares of each Class of the Portfolio represent an equal pro rata interest in the Portfolio and generally give the shareholder the same voting, dividend, liquidation, and other rights. Investment income, realized and unrealized capital gains and losses, the common expenses of the Portfolio, and certain Portfolio-level expense reductions, if any, are allocated on a pro rata basis to each Class based on the relative net assets of each Class to the net assets of the Portfolio. Each Class of shares differs in its respective distribution plan and such distribution expenses are allocated to the corresponding Class of shares.
2. Significant Accounting Policies
The preparation of financial statements in conformity with accounting principles generally accepted in the United States of America (“GAAP”) requires management to make estimates and assumptions that affect the reported amounts of assets and liabilities and disclosure of contingent assets and liabilities as of the date of the financial statements and the reported amounts of income and expenses during the reporting period. Actual results could differ from those estimates. In the preparation of these financial statements, management has evaluated events and transactions subsequent to December 31, 2018 through the date the financial statements were issued.
The Portfolio is an investment company and follows the accounting and reporting guidance of the Financial Accounting Standards Board (“FASB”) Accounting Standards Codification Topic 946—Financial Services—Investment Companies. The following is a summary of significant accounting policies consistently followed by the Portfolio in the preparation of its financial statements.
Investment Valuation and Fair Value Measurements - The Portfolio values its portfolio investments for purposes of calculating its net asset value (“NAV”) using procedures approved by the Board of Trustees of the Trust (the “Board” or “Trustees”). Those procedures allow for a variety of methodologies to be used to value the Portfolio’s investments. The specific methodologies used for a particular investment may vary based on the market data available for a specific investment at the time the Portfolio calculates its NAV or based on other considerations. The procedures also permit a level of judgment to be used in the valuation process. The Portfolio follows the accounting and reporting guidance of FASB Accounting Standards Codification Topic 820—Fair Value Measurement.
Domestic and foreign equity securities, such as common stock, exchange-traded funds, rights, warrants, and preferred stock, that are traded on a securities exchange on a valuation date are generally valued at their last quoted sale price or official closing price on the primary exchange for such security, or, if no sales occurred on that day, at the last reported bid price. Equity securities tradedover-the-counter (“OTC”) are generally valued at the last reported bid price. In the event of a major exchange closing during the trading day, the Adviser may use other market information obtained from quotation reporting systems, established market makers, or pricing services in valuing the securities. Valuation adjustments may be applied to certain foreign equity securities that are traded solely on foreign exchanges that close before the time as of which the Portfolio determines its NAV to account for the market movement between the close of the foreign exchanges and the time as of which the Portfolio determines its NAV. The Portfolio may use a systematic fair valuation model provided by a pricing service to value securities principally traded in these foreign markets in order to adjust for possible market movements or other changes that may occur between the close of the foreign exchanges and the time as of which the Portfolio determines its NAV. Foreign equity securities valued using these valuation adjustments are generally categorized as Level 2 within the fair value hierarchy. Equity securities that are actively traded, and have no valuation adjustments applied, are categorized as Level 1 within the fair value hierarchy. Other equity securities traded on inactive markets, or valued in reference to similar instruments traded on active markets, are generally categorized as Level 2 within the fair value hierarchy.
Investments in registeredopen-end management investment companies are valued at reported NAV per share on the valuation date and are categorized as Level 1 within the fair value hierarchy.
Debt securities, including corporate, convertible and municipal bonds and notes; obligations of the U.S. Treasury and U.S. government agencies; foreign sovereign issues; andnon-U.S. bonds, are generally valued on the basis of evaluated or composite bid quotations obtained from independent pricing services and/or brokers and dealers selected by the Adviser (each a “pricing service”), pursuant to the authorization of and subject to general oversight by the Board. Such pricing services may use matrix pricing, which considers observable inputs including, among other things, issuer details, maturity dates, interest rates, yield curves, rates of prepayment, credit risks/spreads, default rates, reported trades, broker-dealer quotes and quoted prices for similar assets. Short-term obligations with a
BHFTII-13
Brighthouse Funds Trust II
Brighthouse/Wellington Core Equity Opportunities Portfolio
Notes to Financial Statements—December 31, 2018—(Continued)
remaining maturity of sixty days or less may be valued at amortized cost in the absence of market quotes, so long as the amortized cost value of such short-term debt instrument is approximately the same as the fair value of the instrument as determined without the use of amortized cost valuation. Floating rate loans are generally valued on the basis of an evaluated or composite average of aggregate bid and ask quotations supplied by brokers or dealers, as obtained from the pricing service. Securities that use similar valuation techniques and inputs as described above are generally categorized as Level 2 within the fair value hierarchy.
Options, whether on securities, indices, futures contracts, or otherwise, traded on exchanges are valued at the last sale price available as of the close of business on a valuation day or, if there is no such price available, at the last reported bid price. These types of options are categorized as Level 1 within the fair value hierarchy. Futures contracts that are traded on commodity exchanges are valued at their settlement prices established by the exchanges on which they are traded as of the close of such exchanges and are categorized as Level 1 within the fair value hierarchy.
If no current market value quotation or other observable inputs are readily available or market value quotations are deemed to be unreliable for an investment, the fair value of the investment will be determined in accordance with procedures approved by, and under the general supervision of, the Board. In such a circumstance, the Board will be assisted in its responsibility to determine the fair value of an investment by the Valuation Committee (“Committee”) of Brighthouse Investment Advisers. The Committee provides general pricing oversight and fair value pricing determinations related to portfolio securities and meets on a regular basis to review reports relating to the valuation of the securities in the Portfolio. The Board has delegated to State Street Bank and Trust Company, the Trust’s custodian (“Custodian”), the responsibility for calculating the NAVs of the Trust’s Portfolios. The Committee is responsible for overseeing the calculation of the NAVs of the Portfolios by the custodian. The Committee also periodically reviews pricing services, including the pricing services providing fair value pricing for the Portfolio’s foreign securities, and is responsible for overseeing the correction of pricing errors and addressing other pricing issues that arise in the ordinary course of business, such as making real-time fair value determinations, as necessary.
No single standard for determining the fair value of an investment can be set forth because fair value depends upon the facts and circumstances with respect to each investment. Information relating to any relevant factors may be obtained by the Committee from any appropriate source, including the subadviser of the Portfolio, the custodian, a pricing service, market maker and/or broker for such security or the issuer. Appropriate methodologies for determining fair value under particular circumstances may include: matrix pricing, a discounted cash flow analysis, comparisons of securities with comparable characteristics, value based on multiples of earnings, discount from market price of similar marketable securities, or a combination of these and other methods.
Investment Transactions and Related Investment Income - Portfolio security transactions are recorded on the trade date. Dividend income is recorded on theex-dividend date or, for certain foreign securities, when notified. Interest income, which includes amortization of premium and accretion of discount on debt securities, is recorded on the accrual basis. Realized gains and losses on investments are determined on the identified cost basis, which is the same basis used for federal income tax purposes. Foreign income and foreign capital gains on some foreign securities may be subject to foreign taxes, which are accrued as applicable. These foreign taxes have been provided for in accordance with the Portfolio’s understanding of the applicable countries’ tax rules and rates.
Foreign Currency Translation - The books and records of the Portfolio are maintained in U.S. dollars. The values of securities, currencies, and other assets and liabilities denominated in currencies other than the U.S. dollar are translated into U.S. dollars based upon foreign exchange rates prevailing at the end of the period. Purchases and sales of investment securities, income, and expenses are translated on the respective dates of such transactions. Because the values of investment securities are translated at the foreign exchange rates prevailing at the end of the period, that portion of the results of operations arising from changes in exchange rates and that portion of the results of operations reflecting fluctuations arising from changes in market prices of the investment securities are not separated. Such fluctuations are included in the net realized and unrealized gain or loss on investments.
Net realized foreign exchange gains or losses arise from activity in forward foreign currency exchange contracts, sales of foreign currency, currency gains or losses realized between the trade and settlement dates on securities transactions, and the difference between the amounts of dividends, interest, and foreign withholding taxes recorded by the Portfolio and the U.S. dollar-equivalent of the amounts actually received or paid by the Portfolio. Net unrealized foreign exchange gains and losses arise from changes in the value of assets and liabilities, other than investment securities, resulting from changes in foreign exchange rates.
Dividends and Distributions to Shareholders - The Portfolio records dividends and distributions on theex-dividend date. Net realized gains from securities transactions (if any) are generally distributed annually to shareholders. The timing and characterization of certain income and capital gains distributions are determined in accordance with federal tax regulations that may differ from GAAP. Permanent book and tax basis differences relating to shareholder distributions will result in reclassification between distributable earnings (accumulated losses) andpaid-in surplus. These adjustments have no impact on net assets or the results of operations.
Income Taxes - It is the Portfolio’s policy to comply with the requirements of the Internal Revenue Code of 1986, as amended, and regulations thereunder, applicable to regulated investment companies, and to distribute, with respect to each taxable year, all of its taxable income to shareholders. Therefore, no federal income tax provision is required. The Portfolio files U.S. federal tax returns. No
BHFTII-14
Brighthouse Funds Trust II
Brighthouse/Wellington Core Equity Opportunities Portfolio
Notes to Financial Statements—December 31, 2018—(Continued)
income tax returns are currently under examination. The Portfolio’s federal tax returns for the prior three fiscal years remain subject to examination by the Internal Revenue Service. As of December 31, 2018, the Portfolio had no uncertain tax positions that would require financial statement recognition, or derecognition or disclosure.
Directed Brokerage Agreement - The Trust has entered into a directed brokerage arrangement with Capital Institutional Services, Inc. (“CAPIS”). Under this arrangement, the Portfolio directs certain trades to CAPIS in return for a recapture credit. CAPIS issues a cash rebate to the Portfolio. Amounts paid to the Portfolio are shown separately as broker commission recapture on the Statement of Operations of the Portfolio. Additionally, these amounts have been excluded from the calculation of the net ratio of expenses to average net assets presented in the Financial Highlights for each share class.
Repurchase Agreements - The Portfolio may enter into repurchase agreements, under the terms of a Master Repurchase Agreement (“MRA”), with selected commercial banks and broker-dealers, under which the Portfolio acquires securities as collateral and agrees to resell the securities at an agreed-upon time and at an agreed-upon price. The Portfolio, through the Custodian or a subcustodian, under atri-party repurchase agreement, receives delivery of the underlying securities collateralizing any repurchase agreements. It is the Portfolio’s policy that the market value of the collateral be equal to at least 100% of the repurchase price in the case of a repurchase agreement ofone-day duration and equal to at least 102% of the repurchase price in the case of all other repurchase agreements. In the event of default or failure by a party to perform an obligation in connection with any repurchase transaction, the MRA gives thenon-defaulting party the right toset-off claims and to apply property held by it in connection with any repurchase transaction against obligations owed to it.
At December 31, 2018, the Portfolio had direct investments in repurchase agreements with a gross value of $79,436,470. Additionally, the Portfolio invested cash collateral for loans of portfolio securities in repurchase agreements with a gross value of $60,149,439. The combined value of all repurchase agreements is included as part of investments at value on the Statement of Assets and Liabilities. The value of the related collateral exceeded the value of the repurchase agreements at December 31, 2018.
Securities Lending - The Portfolio may lend its portfolio securities to certain qualified brokers who borrow securities in order to complete certain securities transactions. By lending its portfolio securities, the Portfolio attempts to increase its net investment income through the receipt of income on collateral held from securities on loan. Any gain or loss in the market price of the loaned securities that might occur and any interest earned or dividends declared during the term of the loan would accrue to the account of the Portfolio.
The Trust has entered into aNon-Custodial Securities Lending Agreement with JPMorgan Chase Bank, N.A. (the “Lending Agent”). Under the agreement, the Lending Agent is authorized to loan portfolio securities on the Portfolio’s behalf. In exchange, the Portfolio receives either cash or U.S. government securities as collateral against the loaned securities. The Portfolio receives collateral equal to at least 102% of the market value for loans secured by government securities or cash in the same currency as the loaned shares and 105% for all other loaned securities at each loan’s inception. Collateral representing at least 100% of the market value of the loaned securities is maintained for the duration of the loan. Any cash collateral received by the Portfolio is generally invested by the Lending Agent in short-term investments, which may include certificates of deposit, commercial paper, repurchase agreements, time deposits, master demand notes and money market funds. The market value of investments made with cash collateral received are disclosed in the Schedule of Investments and the valuation techniques are described in Note 2. If the market value of the collateral at the close of trading on a business day is less than 100% of the market value of the loaned securities at the close of trading on that day, the borrower is required to deliver, by the close of business on the following business day, an additional amount of collateral, so that the total amount of posted collateral is equal to at least 100% of the market value of all the loaned securities as of such preceding day. A portion of the income earned on the collateral is rebated to the borrower of the securities and the remainder is split between the Lending Agent and the Portfolio. On loans collateralized by U.S. government securities, a fee is received from the borrower and is allocated between the Portfolio and the Lending Agent.
Income received by the Portfolio in securities lending transactions during the year ended December 31, 2018 is reflected as securities lending income on the Statement of Operations. The values of any securities loaned by the Portfolio and the related collateral at December 31, 2018 are disclosed in the footnotes to the Schedule of Investments. The value of the related collateral received by the Portfolio exceeded the value of the securities out on loan at December 31, 2018.
The risks associated with lending portfolio securities include, but are not limited to, possible delays in receiving additional collateral or in the recovery of the loaned securities, possible loss of rights in the collateral should the borrower fail financially, as well as risk of loss in the value of the collateral or the value of the investments made with the collateral. The Lending Agent shall indemnify the Portfolio in the case of default of any securities borrower, subject to the terms of theNon-Custodial Securities Lending Agreement.
All securities on loan are classified as Common Stocks in the Portfolio’s Schedule of Investments as of December 31, 2018, with a contractual maturity of overnight and continuous.
BHFTII-15
Brighthouse Funds Trust II
Brighthouse/Wellington Core Equity Opportunities Portfolio
Notes to Financial Statements—December 31, 2018—(Continued)
3. Certain Risks
In the normal course of business, the Portfolio invests in securities and enters into transactions where risks exist. Those risks include:
Market Risk:The value of securities held by the Portfolio may decline in response to certain events, including those directly involving the issuers whose securities are owned by the Portfolio; conditions affecting the general economy; overall market changes; local, regional or global political, social or economic instability; and currency, interest rate, and price fluctuations.
Credit and Counterparty Risk: The Portfolio may be exposed to counterparty risk, or the risk that an entity with which the Portfolio has unsettled or open transactions may default. The potential loss could exceed the value of the financial assets and liabilities recorded in the financial statements. Financial assets that potentially expose the Portfolio to credit and counterparty risk consist principally of cash due from counterparties and investments. The Portfolio manages counterparty risk by entering into agreements only with counterparties that it believes have the financial resources to honor their obligations and by monitoring the financial stability of those counterparties. The Adviser attempts to mitigate counterparty risk by (i) periodically assessing the creditworthiness of its trading partners, (ii) monitoring and/or limiting the amount of its net exposure to each individual counterparty based on its assessment, and (iii) requiring collateral from the counterparty for certain transactions. In order to preserve certain safeguards fornon-standard settlement trades, the Portfolio restricts its exposure to credit and counterparty losses by entering into master netting agreements (“Master Agreements”) with counterparties (approved brokers) with whom it undertakes a significant volume of transactions. Master Agreements govern the terms of certain transactions, and reduce the counterparty risk associated with relevant transactions by specifying credit protection mechanisms and providing standardization that improves legal certainty. Master Agreements can also help limit counterparty risk by specifying collateral posting arrangements atpre-arranged exposure levels.
Repurchase and reverse repurchase agreements are primarily executed under Global Master Repurchase Agreements (“GMRAs”) or Master Repurchase Agreements (“MRAs”), which provide the rights toset-off. Each repurchase and reverse repurchase agreement is initially collateralized at the transaction level. In the event of default, the total market value exposure will be offset against collateral exchanged to date, which would result in a net receivable/(payable) that would be due from/to the counterparty.
Additional risks associated with each type of investment are described above within the respective security type notes. The Portfolio’s prospectus includes a discussion of the principal risks of investing in the Portfolio.
4. Investment Transactions
Aggregate cost of purchases and proceeds of sales of investment securities, excluding short-term securities, for the year ended December 31, 2018 were as follows:
| | | | | | | | | | | | |
Purchases | | | Sales | |
U.S. Government | | Non-U.S. Government | | | U.S. Government | | | Non-U.S. Government | |
| $0 | | $ | 849,080,704 | | | $ | 0 | | | $ | 1,519,518,574 | |
The Portfolio engaged in security transactions with other accounts managed by Wellington Management Company LLP, the subadviser to the Portfolio, that amounted to $6,674,761 in purchases and $34,697,745 in sales of investments, which are included above, and resulted in realized gains of $6,226,319.
5. Investment Management Fees and Other Transactions with Affiliates
Investment Management Agreement -Brighthouse Investment Advisers is the investment adviser to the Portfolio. The Trust has entered into an investment management agreement with Brighthouse Investment Advisers with respect to the Portfolio. For providing investment management services to the Portfolio, Brighthouse Investment Advisers receives monthly compensation at the following annual rates:
| | | | | | |
Management
Fees earned by
Brighthouse
Investment Advisers
for the year ended
December 31, 2018 | | % per annum | | | Average Daily Net Assets |
| $27,881,280 | | | 0.750 | % | | Of the first $1 billion |
| | | 0.700 | % | | On the next $2 billion |
| | | 0.650 | % | | On amounts in excess of $3 billion |
Brighthouse Investment Advisers has entered into an investment subadvisory agreement with respect to managing the Portfolio. Wellington Management Company LLP (the “Subadviser”) is compensated by Brighthouse Investment Advisers to provide subadvisory services for the Portfolio.
BHFTII-16
Brighthouse Funds Trust II
Brighthouse/Wellington Core Equity Opportunities Portfolio
Notes to Financial Statements—December 31, 2018—(Continued)
Management Fee Waivers - Pursuant to an expense agreement, Brighthouse Investment Advisers has agreed, for the period April 30, 2018 to April 30, 2019, to reduce its advisory fees set out above under “Investment Management Agreement” for each class of the Portfolio as follows:
| | |
% per annum | | Average Daily Net Assets |
| 0.120% | | First $500 million |
| 0.145% | | $500 million to $1 billion |
| 0.120% | | $1 billion to $3 billion |
| 0.080% | | $3 billion to $4.5 billion |
| 0.105% | | Over $4.5 billion |
An identical agreement was in place for the period May 1, 2017 through April 30, 2018. Amounts waived for the year ended December 31, 2018 amounted to $4,510,389 and are included in the total amount shown as management fee waivers in the Statement of Operations.
The Subadviser has voluntarily agreed to waive a portion of its subadvisory fees payable by the Adviser to the Subadviser for managing the Portfolio. In addition to the above advisory fee waiver, the Adviser has agreed to reduce its advisory fee reflecting a portion of the amount waived by the Subadviser for managing the Portfolio pursuant to the voluntary subadvisory fee waiver. $1,296,872 was waived in the aggregate for the year ended December 31, 2018 and is reflected in the total amount shown as a management fee waiver in the Statement of Operations.
Certain officers and trustees of the Trust may also be officers of Brighthouse Investment Advisers; however, such officers and trustees receive no compensation from the Trust.
Transfer Agency Agreement -Brighthouse Financial, Inc. serves as the transfer agent for the Trust. Brighthouse Financial, Inc. receives no fees for its services to the Trust.
Distribution and Service Fees - The Trust has a distribution agreement with Brighthouse Securities, LLC (the “Distributor”) pursuant to which the Distributor serves as the general distributor of shares of each class (each a “Class”) of each Portfolio. The Distributor is an affiliate of the Trust. The Trust has adopted a Distribution and Services Plan (the “Plan”) relating to Class B and Class E shares of each Portfolio, under Rule 12b-1 under the 1940 Act, pursuant to which the Trust may pay the Distributor a fee (the “Service Fee”) at an annual rate not to exceed 0.25% of each such Portfolio’s average daily net assets attributable to the Class B and Class E shares of the Trust. Each Portfolio may not offer shares of each Class. The Plan also authorizes the Trust, on behalf of each of its Portfolios, may pay the Distributor a distribution Fee (the “Distribution Fee” and together with the Service Fee, the “Fees”) at an annual rate of up to 0.25% of each Portfolio’s average daily net assets attributable to the Class B and Class E shares in consideration of the services rendered in connection with the sale of such shares by the Distributor. Under the Distribution Agreement with respect to the Trust, Fees are currently paid at an annual rate of 0.25% of average daily net assets in the case of Class B shares and 0.15% of average daily net assets in the case of Class E shares. The Plan is known as a “compensation plan” because the Trust makes payments to the Distributor for services rendered regardless of the actual level of expenditures by the Distributor. Amounts incurred by the Portfolio for the year ended December 31, 2018 are shown as Distribution and service fees in the Statement of Operations.
Deferred Trustee Compensation -Each Trustee who is not currently an employee of the Adviser or any of its affiliates receives compensation from the Trust for his or her service to the Trust. A deferred compensation plan (the “Plan”) is available to the Trustees on a voluntary basis. Deferred amounts remain in the Trust until distributed in accordance with the provisions of the Plan. The value of a participating Trustee’s deferral account is based on theoretical investments of deferred amounts on the normal payment dates in certain portfolios of the Trust or Brighthouse Funds Trust I, an affiliate of the Trust, as designated by the participating Trustee. Changes in the value of participants’ deferral accounts are reflected as Trustees’ fees and expenses in the Statement of Operations. The portion of the accrued obligations allocated to the Portfolio under the Plan is reflected as Deferred trustees’ fees in the Statement of Assets and Liabilities.
6. Contractual Obligations
Under the Trust’s organizational documents, its officers and Trustees may be indemnified against certain liabilities and expenses arising out of the performance of their duties to the Trust. Additionally, the Trust has a variety of indemnification obligations under contracts with its service providers. The Trust’s maximum exposure under these arrangements is unknown, as this would involve future claims that may be made against the Trust that have not yet occurred.
BHFTII-17
Brighthouse Funds Trust II
Brighthouse/Wellington Core Equity Opportunities Portfolio
Notes to Financial Statements—December 31, 2018—(Continued)
7. Income Tax Information
The cost basis of investments for federal income tax purposes at December 31, 2018 was as follows:
| | | | |
Cost basis of investments | | $ | 3,232,837,950 | |
Gross unrealized appreciation | | | 563,988,521 | |
Gross unrealized depreciation | | | (64,872,668 | ) |
| | | | |
Net unrealized appreciation (depreciation) | | $ | 499,115,853 | |
| | | | |
The tax character of distributions paid for the years ended December 31, 2018 and 2017 were as follows:
| | | | | | | | | | | | | | | | | | | | |
Ordinary Income | | | Long-Term Capital Gain | | | Total | |
2018 | | 2017 | | | 2018 | | | 2017 | | | 2018 | | | 2017 | |
| $69,899,671 | | $ | 61,523,508 | | | $ | 212,235,412 | | | $ | 151,949,263 | | | $ | 282,135,083 | | | $ | 213,472,771 | |
As of December 31, 2018, the components of distributable earnings (accumulated losses) on a federal income tax basis were as follows:
| | | | | | | | | | | | | | | | |
Undistributed
Ordinary
Income | | Undistributed
Long-Term
Capital Gain | | | Net
Unrealized
Appreciation | | | Accumulated
Capital Losses | | | Total | |
| $58,337,078 | | $ | 308,854,376 | | | $ | 499,119,092 | | | $ | — | | | $ | 866,310,546 | |
The Portfolio utilizes the provisions of the federal income tax laws that provide for the carryforward of capital losses for prior years, offsetting such losses against any future realized capital gains. Under the Regulated Investment Company Modernization Act of 2010 (the “Act”), net capital losses recognized after December 22, 2010 may be carried forward indefinitely and their character is retained as short-term and/or long-term losses.
As of December 31, 2018, the Portfolio had no accumulated capital losses.
8. Recent Accounting Pronouncements and SEC Update
In August 2018, the FASB issued Accounting Standards Update2018-13, Fair Value Measurement (Topic 820)—Disclosure Framework—Changes to the Disclosure Requirements for Fair Value Measurement (“ASU2018-13”) which introduces new fair value disclosure requirements as well as eliminates and modifies certain existing fair value disclosure requirements. ASU2018-13 is effective for fiscal years beginning after December 15, 2019, and interim periods within those fiscal years. Early adoption is permitted and, as such, management has elected to early adopt ASU2018-13 effective with the current reporting period. The impact of the Portfolio’s adoption was limited to changes in the Portfolio’s financial statement disclosures regarding fair value, primarily those disclosures related to transfers between levels of the fair value hierarchy.
In August 2018, the Securities and Exchange Commission released its Final Rule on Disclosure Update and Simplification (the “Final Rule”) which is intended to simplify an issuer’s disclosure compliance efforts by removing redundant or outdated disclosures requirements without significantly altering the mix of information provided to investors. Effective with the current reporting period, the Portfolio adopted the Final Rule with the most notable impacts being that the Portfolio is no longer required to present the components of distributable earnings on the Statement of Assets and Liabilities or the sources of distributions to shareholders and the amounts of undistributed net investment income on the Statements of Changes in Net Assets.
BHFTII-18
Brighthouse Funds Trust II
Brighthouse/Wellington Core Equity Opportunities Portfolio
Report of Independent Registered Public Accounting Firm
To the Shareholders of Brighthouse/Wellington Core Equity Opportunities Portfolio and the Board of Trustees of Brighthouse Funds Trust II:
Opinion on the Financial Statements and Financial Highlights
We have audited the accompanying statement of assets and liabilities, including the schedule of investments, of the Brighthouse/Wellington Core Equity Opportunities Portfolio (the “Portfolio”), one of the portfolios constituting the Brighthouse Funds Trust II, as of December 31, 2018, the related statement of operations for the year then ended, the statements of changes in net assets for each of the two years in the period then ended, the financial highlights for each of the five years in the period then ended, and the related notes. In our opinion, the financial statements and financial highlights present fairly, in all material respects, the financial position of the Brighthouse/Wellington Core Equity Opportunities Portfolio of the Brighthouse Funds Trust II as of December 31, 2018, the results of its operations for the year then ended, the changes in its net assets for each of the two years in the period then ended, and the financial highlights for each of the five years in the period then ended, in conformity with accounting principles generally accepted in the United States of America.
Basis for Opinion
These financial statements and financial highlights are the responsibility of the Portfolio’s management. Our responsibility is to express an opinion on the Portfolio’s financial statements and financial highlights based on our audits. We are a public accounting firm registered with the Public Company Accounting Oversight Board (United States) (PCAOB) and are required to be independent with respect to the Portfolio in accordance with the U.S. federal securities laws and the applicable rules and regulations of the Securities and Exchange Commission and the PCAOB.
We conducted our audits in accordance with the standards of the PCAOB. Those standards require that we plan and perform the audit to obtain reasonable assurance about whether the financial statements and financial highlights are free of material misstatement, whether due to error or fraud. The Portfolio is not required to have, nor were we engaged to perform, an audit of its internal control over financial reporting. As part of our audits we are required to obtain an understanding of internal control over financial reporting but not for the purpose of expressing an opinion on the effectiveness of the Portfolio’s internal control over financial reporting. Accordingly, we express no such opinion.
Our audits included performing procedures to assess the risks of material misstatement of the financial statements and financial highlights, whether due to error or fraud, and performing procedures that respond to those risks. Such procedures included examining, on a test basis, evidence regarding the amounts and disclosures in the financial statements and financial highlights. Our audits also included evaluating the accounting principles used and significant estimates made by management, as well as evaluating the overall presentation of the financial statements and financial highlights. Our procedures included confirmation of securities owned as of December 31, 2018, by correspondence with the custodian and brokers; when replies were not received from brokers, we performed other auditing procedures. We believe that our audits provide a reasonable basis for our opinion.
/s/ Deloitte & Touche LLP
Boston, Massachusetts
February 25, 2019
We have served as the auditor of one or more of the Brighthouse investment companies since 1983.
BHFTII-19
Brighthouse Funds Trust II
Trustees and Officers
MANAGEMENT OF THE TRUSTS
The Boards of Trustees (the “Board”) of Brighthouse Funds Trust I and Brighthouse Funds Trust II (“BHF I” and “BHF II”, respectively, and collectively the “Trusts”) supervise the Trusts and are responsible for representing the interests of shareholders. The Trustees, the Chairman of the Board and the Chairmen of each subcommittee are the same for both Trusts. The Trustees of each Trust meet periodically throughout the year to oversee the Portfolios’ activities, reviewing, among other things, each Portfolio’s performance and its contractual arrangements with various service providers. The Trustees of each Trust elect the officers of the Trust, who are responsible for administering the Trust’sday-to-day operations.
Trustees and Officers
The Trustees and executive officers of the Trusts, as well as their principal occupations during the past five years, are set forth below. Unless otherwise indicated, the business address of each is c/o Brighthouse Funds, One Financial Center, Boston, Massachusetts 02111. Each Trustee who is deemed an “interested person,” as such term is defined in the 1940 Act, is referred to as an “Interested Trustee.” Those Trustees who are not “interested persons,” as such term is defined in the 1940 Act, are referred to as “Independent Trustees.” There is no limit to the term a Trustee may serve. Trustees serve until their death, resignation or removal in accordance with the BHF I Trust’s and BHF II Trust’s respective organizational documents and policies adopted by the Boards of the respective Trusts from time to time. Officers hold office at the pleasure of each Board and serve until their removal or resignation in accordance with the Trusts’ respective organizational documents and policies adopted by the Board of each Trust from time to time.
| | | | | | | | | | |
Name and Year of Birth | | Current
Position(s)
Held with
Registrant | | Term of Office
and Length of
Time Served | | Principal Occupation(s) During the Past
5 Years(1) | | Number of
Portfolios
in Brighthouse
Funds
Complex(2)
Overseen
by Trustee | | Other Directorships Held
by Trustee During the
Past 5 Years(1) |
| Interested Trustee |
John Rosenthal* (1960) | | Trustee | | Indefinite; From
May 2016
(Trust I and
Trust II) to present | | Chief Investment Officer, Brighthouse Financial, Inc. (2017 to present); until 2017, Senior Managing Director and Head of Global Portfolio Management, MetLife, Inc. | | 72 | | None |
|
| Independent Trustees |
Dawn M. Vroegop (1966) | | Trustee and Chairman of the Board | | Indefinite; From
December 2000
(Trust I)/May
2009 (Trust II) to
present as
Trustee; From
May 2016 (Trust
I and Trust II)
until present as
Chairman | | Private Investor. | | 72 | | Trustee, Driehaus Mutual Funds.** |
| | | | | |
Stephen M. Alderman (1959) | | Trustee | | Indefinite; From
December 2000
(Trust I)/April
2012 (Trust II) to
present | | Shareholder in the law firm of Garfield and Merel, Ltd. | | 72 | | None |
| | | | | |
Robert J. Boulware (1956) | | Trustee | | Indefinite; From
March 2008
(Trust I)/April
2012 (Trust II) to
present | | Managing Director, Pilgrim Funds, LLC (private equity fund). | | 72 | | Trustee, Vertical Capital Income Fund(closed-end fund);** Director, Gainsco, Inc. (auto insurance);** Trustee, SharesPost 100 Fund(closed-end fund).** |
| | | | | |
Susan C. Gause (1952) | | Trustee | | Indefinite; From
March 2008
(Trust I)/April
2012 (Trust II) to
present | | Private Investor. | | 72 | | Trustee, HSBC Funds.** |
BHFTII-20
Brighthouse Funds Trust II
Trustees and Officers—(Continued)
| | | | | | | | | | |
Name and Year of Birth | | Current
Position(s)
Held with
Registrant | | Term of Office
and Length of
Time Served | | Principal Occupation(s) During the Past
5 Years(1) | | Number of
Portfolios
in Brighthouse
Funds
Complex(2)
Overseen
by Trustee | | Other Directorships Held
by Trustee During the
Past 5 Years(1) |
Nancy Hawthorne (1951) | | Trustee | | Indefinite; From
May 2003
(Trust II)/April
2012 (Trust I)
to present | | Partner, Hawthorne Financial Advisors, LLC (registered investment advisor); until 2014, Chief Executive Officer, Clerestory LLC (corporate advisor). | | 72 | | Director and Chairman of the Board of Directors, THL Credit, Inc.;** Director and Chairman of the Board, Avid Technology, Inc.;** Director, CRA International, Inc.** |
| | | | | |
Barbara A. Nugent (1956) | | Trustee | | Indefinite; From
January 2014
(Trust I and
Trust II) to
present | | President, True North Board Governance, LLC (consulting); until December 2013, partner in the law firm of Stradley Ronon Stevens & Young, LLP. | | 72 | | Independent Lead Trustee, BMT Investment Funds** |
| | | | | |
Christopher J. Towle (1957) | | Trustee | | Indefinite; From
April 2018
(Trust I and
Trust II) to
present | | Retired; until 2014, Partner, Portfolio Manager, Director of High Yield and Convertible Strategies, Lord Abbett & Co. | | 72 | | Trustee, Driehaus Mutual Funds** |
Officers
| | | | | | |
Name and Year of Birth | | Position(s)
Held with
Registrant | | Length of
Time Served | | Principal Occupation(s)
During the Past 5 Years(1) |
| Executive Officers | | | | | | |
Kristi Slavin (1973) | | President and Chief Executive Officer, of Trust I and Trust II | | From May
2016
(Trust I and
Trust II) to
present | | President, Brighthouse Investment Advisers, LLC (2016-present); formerly, Senior Vice President, MetLife Advisers, LLC; Vice President, MetLife, Inc.; Vice President, Trust I and Trust II(2015-2016). |
| | | |
Alan R. Otis (1971) | | Chief Financial Officer and Treasurer, of Trust I and Trust II | | From
November
2017
(Trust I and
Trust II) to
present | | Senior Vice President, Brighthouse Investment Advisers, LLC (2017-present); formerly, Vice President, Brighthouse Investment Advisers, LLC (2012-2017); Assistant Treasurer, Trust I and Trust II (2012-2017). |
| | | |
Andrew L. Gangolf (1954) | | Secretary, of Trust I and Trust II | | From May
2011
(Trust I and
Trust II) to
present | | Executive Vice President, Brighthouse Investment Advisers, LLC (2017-present); formerly, Senior Vice President, MetLife Advisers, LLC (2011-2017); until 2011, Senior Vice President & Assistant General Counsel, AllianceBernstein Investments, Inc. |
| | | |
Steven E. Hartstein (1963) | | Chief Compliance Officer (“CCO”), of Trust I and Trust II | | From
February
2014
(Trust I and
Trust II) to
present | | Senior Vice President and CCO, Brighthouse Investment Advisers, LLC (2017-present); Head of Investments Compliance, Vice President, Brighthouse Financial, Inc. (2017-present); formerly, Vice President, MetLife, Inc. (2013-2017); Senior Vice President and CCO, MetLife Advisers, LLC (2013-2017.) |
| | | |
Victor Soto (1978) | | Vice President of Trust I and Trust II | | From May
2018
(Trust I and
Trust II) to
present | | Executive Vice President, Brighthouse Investment Advisers, LLC (2016-present); Assistant Vice President, MetLife Inc. (2015-2017); Portfolio Manager, 1st Global (2013-2015). |
| * | Mr. Rosenthal is an “interested person” of the Trusts because of his position with Brighthouse Financial, Inc., the current parent company of Brighthouse Investment Advisers, LLC. |
| ** | Indicates a directorship with a registered investment company or a company subject to the reporting requirements of the Securities Exchange Act of 1934, as amended. |
| (1) | Previous positions during the past five years with the Trusts, Brighthouse Financial, Inc., MetLife, Inc. or the Manager are omitted if not materially different. |
| (2) | The Fund Complex includes 43 BHF I Portfolios and 29 BHF II Portfolios. |
BHFTII-21
Brighthouse Funds Trust II
Brighthouse/Wellington Core Equity Opportunities Portfolio
Board of Trustees’ Consideration of Advisory and Sub-Advisory Agreements
At anin-person meeting held on November6-8, 2018 (the “November Meeting”), the Boards of Trustees (the “Board”) of Brighthouse Funds Trust I and Brighthouse Funds Trust II (“BFT I” and “BFT II,” respectively, and collectively, the “Trusts”), including a majority of the Trustees who are not “interested persons” of the Trusts (the “Independent Trustees”) under the Investment Company Act of 1940 (the “1940 Act”), approved the continuation of the Trusts’ advisory agreements (each, an “Advisory Agreement”) with Brighthouse Investment Advisers, LLC (the “Adviser”) and the applicablesub-advisory agreements (each a “Sub-Advisory Agreement,” and collectively with the Advisory Agreement, the “Agreements”) between the Adviser and the investmentsub-advisers (each a “Sub-Adviser,” and collectively, the “Sub-Advisers”) for the series of the Trusts (each a “Portfolio,” and collectively, the “Portfolios”).
In making those approvals, the Board reviewed a variety of materials that were provided for the specific purpose of the annual contract renewal process. In addition, various materials provided to and discussed with the Board throughout the year informed the Board’s decision to renew the Agreements. In particular, the information for each Portfolio included, but was not limited to, investment performance reports, and reports on expenses, legal and compliance matters, asset pricing, brokerage commissions and trade execution.
The Board met in person with personnel of the Adviser on October 17, 2018 for the specific purpose of giving preliminary consideration to the proposed continuation of the Agreements (the “October Meeting”). At that meeting, the Adviser reviewed with the Board the performance and fees experienced by each Portfolio, as well as other information. During and after the October Meeting, the Independent Trustees communicatedfollow-up matters for management to address at the November Meeting. The Independent Trustees were advised by independent legal counsel throughout the contract renewal process, and met with independent legal counsel in several executive sessions outside of the presence of management.
Information furnished and reviewed specifically in connection with the renewal process included, but was not limited to, a report for each Portfolio that was prepared by Broadridge (“Broadridge”), an independent organization. In addition, the Independent Trustees reviewed a report that was prepared by JDL Consultants, LLC (“JDL”), an independent consultant to the Independent Trustees (“JDL Report”), which examined the comparative fees, expenses and performance of each Portfolio, based upon the Broadridge reports. Also, the Board reviewed the responses to wide-ranging questions from the Independent Trustees relating to the business, operations and performance of the Adviser and theSub-Advisers that the Adviser andSub-Advisers had prepared specifically for the renewal process, and reviewed aPortfolio-by-Portfolio analysis of the profitability to the Adviser of each Advisory Agreement, which was prepared by the Adviser for the renewal process.
At the November Meeting, the Board, including a majority of the Independent Trustees, concluded that the nature, extent and quality of services provided by the Adviser and eachSub-Adviser supported the renewal of the Agreements. The Board also concluded that the investment performance of each Portfolio was such that each Agreement should continue, and that the fees paid by each Portfolio to the Adviser appeared to be reasonable in light of the nature, extent and quality of the services provided by the Adviser andSub-Adviser. Further, the Board concluded that the Adviser’s profitability in providing services under the Advisory Agreements did not appear unreasonable in light of the nature, extent and quality of the services provided by the Adviser. Finally, the Board reviewed the extent to which the investment advisory fees paid by the Portfolios shared economies of scale with investors or entailed the potential to share economies of scale with investors and concluded that those considerations generally supported the renewal of each Agreement. In approving the renewal of each of the Agreements, the Board, including the Independent Trustees, gave attention to all of the information that was furnished and each Trustee placed varying degrees of importance on the various pieces of information that were provided to them. The Board evaluated the information available to it on aPortfolio-by-Portfolio basis, and its decision was made separately with respect to each Portfolio. The following paragraphs provide more information about some of the primary factors that were relevant to the Board’s decision. The Board did not identify any single factor as determinative, and the Trustees generally attributed different weights to various factors for the various Portfolios.
Nature, extent and quality of services. The Board evaluated the nature, extent and quality of the services that the Adviser and theSub-Advisers, as relevant, have provided to the Portfolios. The Board considered the Adviser’s services as investment manager to the Portfolios, including its services relating to the hiring and oversight of theSub-Advisers, trading practices and oversight of transition management (as applicable), compliance programs and personnel, and risk management, among other things. The Adviser’s services in coordinating and overseeing the activities of the Trusts’ other service providers were also considered. The Board considered information received from the Trusts’ Chief Compliance Officer (“CCO”) regarding the Portfolios’ compliance policies and procedures that were established pursuant to Rule38a-l under the 1940 Act. The Board also noted that the Adviser’s investment, compliance and legal staff conduct regular and periodic telephonic andin-person meetings with theSub-Advisers to review and assess the services that are provided to the Portfolios, and that personnel of the Adviser prepare and present reports to the Independent Trustees regarding those meetings. In addition, throughout the year, the Board considered the expertise, experience and performance of the personnel of the Adviser who performed the various services that are mentioned above.
BHFTII-22
Brighthouse Funds Trust II
Brighthouse/Wellington Core Equity Opportunities Portfolio
Board of Trustees’ Consideration of Advisory and Sub-Advisory Agreements—(Continued)
With respect to the services provided by each of theSub-Advisers, the Board considered a variety of information that the Adviser and eachSub-Adviser prepared for the Board’s review. The Board considered eachSub-Adviser’s investment process and philosophy, and the investment performance experienced by the Portfolio (as described in more detail below). The Board took into account that eachSub-Adviser’s responsibilities include the development and maintenance of an investment program for the applicable Portfolio that is consistent with the Portfolio’s investment objectives, the selection of investment securities and the placement of orders for the purchase and sale of such securities, as well as the implementation of compliance controls related to performance of these services. In particular, the Board considered, among other things, theSub-Adviser’s current level of staffing as well as its compensation program and its overall resources. The Board reviewed eachSub-Adviser’s history and investment experience, as well as information provided regarding the qualifications, background and responsibilities of theSub-Adviser’s investment and compliance personnel who provide services to the Portfolios. The Board also considered, among other things, eachSub-Adviser’s compliance program and regulatory and disciplinary history. In its review, the Board also took into account information regarding any services and/or payments provided to the Adviser by theSub-Advisers in connection with marketing activities and considered representations from the Adviser that those payments were not considered in the Adviser’s recommendation to renew any of theSub-Advisory Agreements.
Performance. The Board placed emphasis on the performance of each Portfolio in light of, among other things, its importance to investors. The Board considered the Adviser’s quarterly reviews with the Board of detailed information about each Portfolio’s investment strategies and performance results and composition, including discussions regarding the relevant effect of current market conditions. The Board reviewed and considered the reports prepared by Broadridge, which provided a statistical analysis comparing the Portfolios’ investment performance to that of comparable funds underlying variable insurance products (the “Performance Universe”). The Independent Trustees also met separately with representatives of JDL during the October Meeting to review the JDL Report. The Board also compared the performance records of the Portfolios to those of comparable funds and other accounts that were managed by the relevantSub-Adviser, to the extent such information was available. The Board considered each Portfolio’s performance for periods subsequent to the performance period covered by the Broadridge reports, and the Adviser’s discussion of the same, including the effect of current market conditions on each Portfolio’s more recent performance. The Board also noted that while it found the data provided by Broadridge generally useful, it recognized the limitations of such data, including, in particular, that notable differences may exist between a Portfolio and those of the other funds in a Broadridge category (for example, the investment objectives(s) and investment strategies) and that the results of the performance comparisons may vary depending on (i) the end dates for the performance periods that were selected and (ii) the selection of the peer groups.
The Board focused particular attention on Portfolios with less favorable performance records. The Board noted the Adviser’s focus on eachSub-Adviser’s performance and that the Adviser has been active in monitoring and responding to any performance issues with respect to the Portfolios.
Fees and Expenses. The Board gave consideration to the level and method of computing the fees payable under the Agreements. The Board considered the Broadridge report for each of the Portfolios, which included comparisons for each Portfolio of its contractual management andsub-adviser fees (at current and various asset levels), and total expenses, with those of its peers, including as those peers were divided into a broad group of peer funds (“Expense Universe”), a narrower group of peer funds (“Expense Group”), a broad group of peersub-advised funds (“Sub-advised Expense Universe”), and a narrower group of peersub-advised funds (“Sub-advised Expense Group”). Broadridge selected the peer funds which were similarly situated funds underlying variable insurance products deemed to be comparable to the Portfolios. The Independent Trustees, with the assistance of JDL, also examined the JDL Report. The Board compared the fee payable to aSub-Adviser by the Adviser with respect to the Portfolio to the fee payable to theSub-Adviser by other comparable funds and other accounts, to the extent such information was available.
The Board noted that thesub-advisory fees for the Portfolios are paid by the Adviser out of the advisory fees, and that the Adviser negotiates the fees at arm’s length. The Board also considered that the Adviser had entered into expense limitation or management fee waiver agreements with certain of the Portfolios pursuant to which the Adviser had agreed to waive a portion of its advisory fee and/or reimburse certain expenses as a means of limiting a Portfolio’s total annual operating expenses.
Profitability. The Board examined the profitability to the Adviser of each Advisory Agreement, on aPortfolio-by-Portfolio basis. The Board also considered that an affiliate of the Adviser, Brighthouse Securities, LLC, serves as distributor for the Trusts, and, as such, receives Rule12b-1 payments to support the distribution of the Portfolios. The Board considered the profitability to theSub-Advisers and their affiliates as a result of their relationships with the Portfolios, to the extent available, and the Board considered the ability of the Adviser to negotiate with aSub-Adviser at arm’s length. In reviewing the profitability analyses, the Board recognized that expense allocation methodologies are inherently subjective and various expense allocation methodologies may be reasonable while producing different results.
BHFTII-23
Brighthouse Funds Trust II
Brighthouse/Wellington Core Equity Opportunities Portfolio
Board of Trustees’ Consideration of Advisory and Sub-Advisory Agreements—(Continued)
Economies of scale. The Board also considered each Portfolio’s fees in light of its size. The Board noted the fee schedules for the Portfolios that contain breakpoints that reduce the fee rate above specified asset levels. The Board noted those Portfolios that did not have breakpoints in their advisory fee and took into account management’s discussion of the same. The Board noted that those Portfolios with Advisory Agreements containing breakpoints generally have breakpoints in the correspondingSub-Advisory Agreement. The Board considered the effective fees under the Advisory Agreement andSub-Advisory Agreement for each Portfolio as a percentage of assets at different asset levels and possible economies of scale that may be realized if the assets of the Portfolio grow. The Board examined, among other data, the effect of a Portfolio’s growth in size, and reduction in size, on various fee schedules and the Board reviewed the Broadridge and JDL Reports, which compared fees among peers. The Board also generally noted that if a Portfolio’s assets increase over time, the Portfolio may realize other economies of scale if assets increase proportionally more than certain other fixed expenses.
Other factors. The Board considered other benefits that may be realized by the Adviser and its affiliates from their relationship with the Trusts. Among them, the Board recognized that Brighthouse Securities, LLC, as the distributor for the Trusts, receives payments pursuant to Rule12b-1 from the Portfolios to compensate for the provision of shareholder services and distribution activities, which could lead to growth in the Trusts’ assets and corresponding benefits from such growth, including economies of scale. The Board considered other benefits that may be realized by eachSub-Adviser and its affiliates from their relationship with the Trusts, including the opportunity to provide advisory services to additional portfolios of the Trusts and reputational benefits. In conjunction with these considerations, the Board noted the ongoing commitment of the Adviser to the Portfolios.
The Board requested, received, and considered information from the Adviser regarding possible conflicts of interest in the form of material benefits to the Adviser resulting from the Adviser’s affiliations and business relationships, as relevant. The Board considered the services that are provided to the Trusts by its service providers, and the manner in which any conflicts were mitigated.
* * *
Brighthouse/Wellington Core Equity Opportunities Portfolio.The Board also considered the following information in relation to the Agreements with the Adviser and Wellington Management Company LLP regarding the Portfolio:
Among other data relating specifically to the Portfolio’s performance, the Board considered that the Portfolio underperformed the median of its Performance Universe and the average of its Morningstar Category for theone-, three- and five-year periods ended June 30, 2018. The Board further considered that the Portfolio underperformed its benchmark, the Russell 1000 Index, for theone-, three-, and five-year periods ended September 30, 2018. The Board took into account management’s discussion of the Portfolio’s performance, including prevailing market conditions. In addition, the Board noted that theSub-Adviser did not manage the Portfolio for all of the periods referenced.
The Board also considered that the Portfolio’s actual management fees were below the Expense Universe median andSub-advised Expense Universe median, but slightly above the Expense Group median. The Board also considered that the Portfolio’s total expenses (exclusive of12b-1 fees) were equal to the Expense Group median and below the median of the Expense Universe and theSub-advised Expense Universe. The Board further noted that the Portfolio’s contractual management fees were above the asset-weighted average of comparable funds selected by Broadridge at the Portfolio’s current size. The Board also noted that the Portfolio’s contractualsub-advisory fees were slightly below the average of theSub-advised Expense Universe and above the average of theSub-advised Expense Group at the Portfolio’s current size.
BHFTII-24
Brighthouse Funds Trust II
Brighthouse Asset Allocation 20 Portfolio
Managed by Brighthouse Investment Advisers, LLC
Portfolio Manager Commentary*
PERFORMANCE
For theone-year period ended December 31, 2018, the Class A and B shares of the Brighthouse Asset Allocation 20 Portfolio returned-2.41% and-2.61%, respectively. The Portfolio’s benchmark, the Dow Jones Conservative Index1, returned-0.62%.
MARKET ENVIRONMENT/CONDITIONS
After a great 2017 withrecord-low volatility and the strongest January stock market since 1997, investors got shaken back to reality in February when equity markets took a dive following higher-than-expected wage growth. The concern was that this would lead to higher inflation followed by additional Federal Reserve (the “Fed”) interest rate hikes, leading to an unceremonious end to the second-longest economic expansion on record. However, inflation fears soon after fizzled (at least until the end of 2018) and the Fed stayed the course, despite the Tax Cuts and Jobs Act of 2017 providing a noteworthy lift to gross domestic product (“GDP”) growth. GDP growth, incidentally, is on track to reach the highest annual level since before the2008-09 recession. However, an escalating trade war between the U.S. and many of its major trading partners sent another wave of anxiety toward the market, which responded by pulling back sharply once again.
The beginning of the year turned out to be a microcosm of the remainder of 2018. This point in the economic cycle finds many market participants scrambling for indications that the expansion will end. As such, equity markets have become irrationally sensitive to individual data points, both positive and negative, with little regard to their historic predictive power on market results. The consequence was elevated market volatility in the second quarter, driven by positive economic growth and an accommodative Fed on one side, and on the other side by negative trade war and housing market news. In the third quarter, however, equity markets rebounded as corporate profits hit a newall-time high, GDP growth for second quarter came in at 4.2%, and unemployment dropped to 3.7%—the lowest number since 1969. The result in the third quarter was the best quarterly return for the S&P 500 Index since 2013.
As we got to the fourth quarter though, sentiment turned significantly worse, and the S&P 500 Index did an about-face, delivering its worst quarterly return since 2011. Gone was the sense of confidence that the strong economy could propel equity markets ever higher. Front and center were concerns about the continued trade war escalation,mid-term election uncertainty, a housing market dampened by rising interest rates and lofty prices, and a Fed that was now deemed too hawkish by projecting two additional rate hikes in 2019, despite having raised rates 4 times in 2018 (from a target range of1.25%-1.50% to a target range of2.25%-2.5%) and despite the market volatility.
News from overseas did little to attenuate concerns on the home front. Troubling to many is the ongoing Brexit (United Kingdom’s decision to withdraw from the European Union) situation, as leaders in the U.K. struggle to agree on a deal ensuring an orderly exit from the E.U.—an exit which is scheduled to occur on March 29, 2019. Highlighting the extent of disagreement are the two votes of confidence in Prime Minister Theresa May’s leadership, held in December 2018 and January 2019, both of which she won (in the U.K., a vote of confidence is a procedure used to remove a prime minister from office). Concerns about slowing growth in China have been receiving headlines as well. Leadership in China is in the middle of a long-term plan which is designed to transition the country from a manufacturing-driven economy to a service-driven economy. More worrisome to market participants is the fact that China is also in the process of dealing with an increasingly large debt burden as that plan unfolds. The outcome of both is unclear, which has led to some increased market volatility. However, it was confidence-inspiring that China had enough wherewithal to take the foot off the brake when it saw its economic growth rates declining faster than intended.
All in all, 2018 was a difficult year for investors. The economy is growing at a healthy pace, but the main question is for how long? The uncertainty caused all the major asset classes to be down for the year except for core bonds, which managed to creep in to positive territory, barely eking out a positive return with 0.01% for the year (as measured by the Bloomberg Barclays U.S. Aggregate Bond Index). International equities were generally the worst-performing asset classes with Emerging Markets equity and Foreign Developed equity down 14.6% and 13.8% respectively, as measured by the MSCI Emerging Markets Index and the MSCI EAFE Index. U.S. Large Cap equity did significantly better but was still down 4.4% for the year as measured by the S&P 500 Index, whereas Mid Cap equity lost 9.1% and Small Cap equity lost 11.0% for the year, as measured by the Russell Mid Cap and the Russell 2000 indices, in that order.
PORTFOLIO REVIEW /PERIOD-END POSITIONING
The Brighthouse Asset Allocation 20 Portfolio invests in underlying portfolios of the Brighthouse Funds Trust I and the Brighthouse Funds Trust II to maintain a broad asset allocation of approximately 20% to equities and 80% to fixed income. Over the twelve-month period, the Portfolio fell short of the Dow Jones Conservative Index. Strong performance within the Mid and Small Cap portfolios and a favorable overweight to Large Cap equity was insufficient to attenuate the combination of underperformance within Large Cap and International equities, an underweight to cash, and an overweight to overall equity—all detractors.
The contribution from the underlying fixed income portfolios to relative performance was slightly negative in 2018. The biggest contributor to performance by far was the Brighthouse/Templeton International Bond Portfolio, which outpaced its benchmark by 3.1%. The strategy’s relative outperformance during the period was primarily attributable to currency positions, notably, the portfolio’s underweights in the euro and the Australian dollar. Outside of currency exposure, short duration positioning in the U.S. helped returns as well. The Brighthouse/Eaton Vance Floating Rate Portfolio
BHFTII-1
Brighthouse Funds Trust II
Brighthouse Asset Allocation 20 Portfolio
Managed by Brighthouse Investment Advisers, LLC
Portfolio Manager Commentary*—(Continued)
outperformed its benchmark by 0.1%. The portfolio’s underweight to defaulted loans aided performance relative to its benchmark over the year, as did favorable security selection in Financial Services and Energy. At the other end of the spectrum was the Western Asset Management Strategic Bond Opportunities Portfolio, which lagged its benchmark by 3.8%. Portfolio performance was negatively impacted by its U.S. duration and yield curve positioning, as well as currency and emerging markets positions. During the year, corporate credit spreads widened and experienced heightened levels of volatility. As such, the portfolio’s investment grade corporate credit positions were also negative contributors to performance. Also detracting in fixed income was the Brighthouse/Franklin Low Duration Total Return Portfolio, which underperformed its benchmark by 0.9%, largely driven by Collateralized Loan Obligation positions.
Contribution from the underlying domestic equity portfolios to relative performance was negative, as strong performance by the Mid Cap and Small Cap equity portfolios was insufficient to make up for the underperformance within the Large Cap equity portfolios. Within Large Cap, the Brighthouse/Wellington Core Equity Opportunities Portfolio had a strong year, as it outperformed its benchmark by 4.7%. Strong security selection within Consumer Discretionary, Consumer Staples, and Materials sectors helped. Meanwhile, the Brighthouse/Wellington Large Cap Research Portfolio underperformed its benchmark by 1.8%, driven by suboptimal security selection within Health Care, Consumer Staples, and Energy. Another laggard for the period was the Invesco Comstock Portfolio, which underperformed its benchmark by 3.7% for the year. The result was primarily due to an overweight to Energy and unfavorable security selection within Financial Services, Healthcare, and Energy. Within Mid Cap equity, only the T. Rowe Price Mid Cap Growth Portfolio outperformed its benchmark. The portfolio outpaced its benchmark by 2.7% as positive results were driven by security selection within Communication Services, Financial Services, and Materials. The strongest performer within Small Cap equity was the Neuberger Berman Genesis Portfolio, which outperformed its benchmark by 6.2% in 2018 as the portfolio’s focus on higher-quality companies with higher return on equity paid off. Security selection in Healthcare, Consumer Staples, and Information Technology made the largest positive impact on relative results. The T. Rowe Price Small Cap Growth Portfolio beat its benchmark by 2.6% over the year, primarily due to beneficial security selection within Industrials, Materials, Consumer Discretionary, and Healthcare.
Non-U.S. equity was a headwind to relative performance in 2018. Most notably, the Harris Oakmark International Portfolio underperformed its benchmark by 9.9% during the year as security selection and country weightings caused returns to suffer. Performance compared to the benchmark was hurt by holdings in the U.K., Germany, and France as well as suboptimal security selection in Consumer Discretionary, Financial Services, and Industrials. The best performance in the category came from the Brighthouse/Artisan International Portfolio, which outperformed its benchmark by 3.5% in 2018. Much of the outperformance was a result of strong security selection within Technology, Materials, and Consumer Discretionary. In addition, the Brighthouse/Aberdeen Emerging Market Equity Portfolio was additive to relative results during the year, outperforming its benchmark by 0.7% as an underweight to China and positive security selection in Consumer Discretionary, Financial Services, and Technology supported returns.
Investment Committee
Brighthouse Investment Advisers, LLC
* This commentary may include statements that constitute “forward-looking statements” under the U.S. securities laws. Forward-looking statements include, among other things, projections, estimates, and information about possible or future results related to the Portfolio, market or regulatory developments. The views expressed above are not guarantees of future performance or economic results and involve certain risks, uncertainties and assumptions that could cause actual outcomes and results to differ materially from the views expressed herein. The views expressed above are subject to change at any time based upon economic, market, or other conditions and the subadvisory firm undertakes no obligation to update the views expressed herein. Any discussions of specific securities should not be considered a recommendation to buy or sell those securities. The views expressed above (including any forward-looking statement) may not be relied upon as investment advice or as an indication of the Portfolio’s trading intent. Information about the Portfolio’s holdings, asset allocation or country diversification is historical and is not an indication of future Portfolio composition, which may vary. Direct investment in any index is not possible. The performance of any index mentioned in this commentary has not been adjusted for ongoing management, distribution and operating expenses, and sales charges applicable to mutual fund investments. In addition, the returns do not reflect additional fees charged by separate accounts or variable insurance contracts that an investor in the Portfolio may pay. If these additional fees were reflected, performance would have been lower.
BHFTII-2
Brighthouse Funds Trust II
Brighthouse Asset Allocation 20 Portfolio
A $10,000 INVESTMENT COMPARED TO THE DOW JONES CONSERVATIVE INDEX
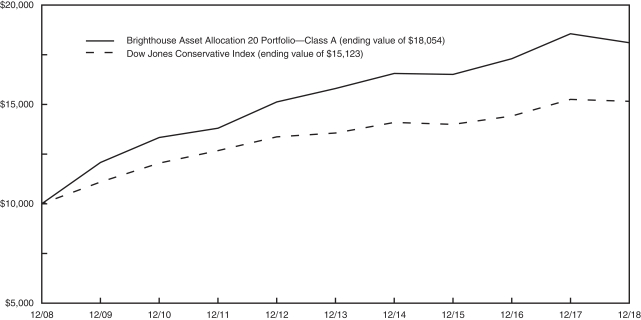
AVERAGE ANNUAL RETURNS (%) (FOR THE YEAR ENDED DECEMBER 31, 2018)
| | | | | | | | | | | | |
| | | | |
| | | 1 Year | | | 5 Year | | | 10 Year | |
| Brighthouse Asset Allocation 20 Portfolio | | | | | | | | | | | | |
Class A | | | -2.41 | | | | 2.74 | | | | 6.09 | |
Class B | | | -2.61 | | | | 2.49 | | | | 5.83 | |
| Dow Jones Conservative Index | | | -0.62 | | | | 2.24 | | | | 4.22 | |
1 The Dow Jones Conservative Index is a total return index designed to provide asset allocation strategists with a target risk benchmark. Each month, the Index adjusts its weighting of stocks, bonds, and cash indices (both domestic and foreign) such that the risk combination will have 20% of the risk of an all equity portfolio.
Portfolio performance is calculated including reinvestment of all income and capital gain distributions. Performance numbers are net of all Portfolio expenses but do not include any insurance, sales, separate account or administrative charges of variable annuity or life insurance contracts or any additional expenses that participants may bear relating to the operations of their plans. If these charges were included, the returns would be lower. The performance of any index referenced above has not been adjusted for ongoing management, distribution and operating expenses, and sales charges applicable to mutual fund investments. Direct investment in any index is not possible. The performance of Class A shares, as set forth in the line graph above, will differ from that of other classes because of the difference in expenses paid by policyholders investing in the different share classes.
This information represents past performance and is not indicative of future results. Investment return and principal value may fluctuate so that shares, upon redemption, may be worth more or less than the original cost.
PORTFOLIO COMPOSITION AS OF DECEMBER 31, 2018
Top Holdings
| | | | |
| | | % of
Net Assets | |
| Western Asset Management U.S. Government Portfolio (Class A) | | | 13.2 | |
| BlackRock Bond Income Portfolio (Class A) | | | 12.7 | |
| PIMCO Total Return Portfolio (Class A) | | | 12.2 | |
| TCW Core Fixed Income Portfolio (Class A) | | | 9.7 | |
| PIMCO Inflation Protected Bond Portfolio (Class A) | | | 9.1 | |
| JPMorgan Core Bond Portfolio (Class A) | | | 8.7 | |
| Brighthouse/Franklin Low Duration Total Return Portfolio (Class A) | | | 5.0 | |
| Western Asset Management Strategic Bond Opportunities Portfolio (Class A) | | | 5.0 | |
| Brighthouse/Templeton International Bond Portfolio (Class A) | | | 2.5 | |
| MFS Value Portfolio (Class A) | | | 2.1 | |
Asset Allocation
| | | | |
| | | % of
Net Assets | |
| Investment Grade Fixed Income | | | 70.7 | |
| U.S. Large Cap Equities | | | 10.1 | |
| High Yield Fixed Income | | | 7.5 | |
| International Developed Market Equities | | | 4.5 | |
| International Fixed Income | | | 2.5 | |
| U.S. Small Cap Equities | | | 2.2 | |
| Global Equities | | | 1.4 | |
| Real Estate Equities | | | 0.5 | |
| U.S. Mid Cap Equities | | | 0.4 | |
| Emerging Market Equities | | | 0.3 | |
BHFTII-3
Brighthouse Funds Trust II
Brighthouse Asset Allocation 20 Portfolio
Understanding Your Portfolio’s Expenses
Shareholder Expense Example
As a shareholder of the Portfolio, you incur ongoing costs, including management fees; distribution and service(12b-1) fees; and other Portfolio expenses. This example is intended to help you understand your ongoing costs (in dollars) (referred to as “expenses”) of investing in the Portfolio and compare these costs with the ongoing costs of investing in other mutual funds. The example is based on an investment of $1,000 invested at the beginning of the period and held for the entire period, July 1, 2018 through December 31, 2018.
Actual Expenses
The first line for each share class of the Portfolio in the table below provides information about actual account values and actual expenses. You may use the information in this line, together with the amount you invested in the particular share class of the Portfolio, to estimate the expenses that you paid over the period. Simply divide your account value by $1,000 (for example, an $8,600 account value divided by $1,000 = 8.6), then multiply the result by the number in the first line under the heading entitled “Expenses Paid During Period” to estimate the expenses you paid on your account during this period.
Hypothetical Example for Comparison Purposes
The second line for each share class of the Portfolio in the table below provides information about hypothetical account values and hypothetical expenses based on the Portfolio’s actual expense ratio and an assumed rate of return of 5% per year before expenses, which is not the Portfolio’s actual return. The hypothetical account values and expenses may not be used to estimate the actual ending account balance or expenses you paid for the period. You may use this information to compare the ongoing costs of investing in the Portfolio and other funds. To do so, compare this 5% hypothetical example with the 5% hypothetical examples that appear in the shareholder reports of the other funds.
Please note that the expenses shown in the table are meant to highlight your ongoing costs only and do not reflect any fees or charges of your variable insurance product or any additional expenses that participants in certain eligible qualified plans may bear relating to the operations of their plan. Therefore, the second line for each share class in the table is useful in comparing ongoing costs only, and will not help you determine the relative total costs of owning different funds. In addition, if these other costs were included, your costs would have been higher.
| | | | | | | | | | | | | | | | | | |
Brighthouse Asset Allocation 20 Portfolio
| | | | Annualized
Expense
Ratio | | | Beginning
Account Value
July 1,
2018 | | | Ending
Account Value
December 31,
2018 | | | Expenses Paid
During Period**
July 1, 2018
to
December 31,
2018 | |
Class A (a) (b) | | Actual | | | 0.62 | % | | $ | 1,000.00 | | | $ | 982.00 | | | $ | 3.10 | |
| | Hypothetical* | | | 0.62 | % | | $ | 1,000.00 | | | $ | 1,022.08 | | | $ | 3.16 | |
| | | | | |
Class B (a) (b) | | Actual | | | 0.87 | % | | $ | 1,000.00 | | | $ | 981.80 | | | $ | 4.35 | |
| | Hypothetical* | | | 0.87 | % | | $ | 1,000.00 | | | $ | 1,020.82 | | | $ | 4.43 | |
| * | Hypothetical assumes a rate of return of 5% per year before expenses. |
| ** | Expenses paid are equal to the Portfolio’s annualized expense ratio for the most recent six month period, as shown above, multiplied by the average account value over the period, multiplied by the number of days (184 days) in the most recent fiscal half-year, divided by 365 (to reflect theone-half year period). |
| (a) | The annualized expense ratio shown reflects an expense limitation agreement between Brighthouse Investment Advisers, LLC and the Portfolio as described in Note 5 of the Notes to Financial Statements. |
| (b) | The annualized expense ratio reflects the expenses of both the Portfolio and the Underlying Portfolios in which it invests. |
BHFTII-4
Brighthouse Funds Trust II
Brighthouse Asset Allocation 20 Portfolio
Schedule of Investments as of December 31, 2018
Mutual Funds—100.1% of Net Assets
| | | | | | | | |
| Security Description | | Shares | | | Value | |
|
Affiliated Investment Companies—100.1%
| |
Baillie Gifford International Stock Portfolio (Class A) (a) | | | 707,265 | | | $ | 7,794,061 | |
BlackRock Bond Income Portfolio (Class A) (a) | | | 668,274 | | | | 68,792,124 | |
BlackRock Capital Appreciation Portfolio (Class A) (a) | | | 99,389 | | | | 3,859,282 | |
BlackRock High Yield Portfolio (Class A) (b) | | | 368,308 | | | | 2,670,236 | |
Brighthouse Small Cap Value Portfolio (Class A) (b) | | | 186,871 | | | | 2,530,236 | |
Brighthouse/Aberdeen Emerging Markets Equity Portfolio (Class A) (b) | | | 140,632 | | | | 1,341,626 | |
Brighthouse/Artisan International Portfolio (Class A) (b) | | | 529,351 | | | | 5,240,577 | |
Brighthouse/Artisan Mid Cap Value Portfolio (Class A) (a) | | | 5,995 | | | | 1,269,972 | |
Brighthouse/Eaton Vance Floating Rate Portfolio (Class A) (b) | | | 1,064,498 | | | | 10,644,984 | |
Brighthouse/Franklin Low Duration Total Return Portfolio (Class A) (b) | | | 2,880,341 | | | | 27,334,441 | |
Brighthouse/Templeton International Bond Portfolio (Class A) (b) (c) | | | 1,334,332 | | | | 13,623,528 | |
Brighthouse/Wellington Core Equity Opportunities Portfolio (Class A) (a) | | | 301,493 | | | | 9,047,815 | |
Brighthouse/Wellington Large Cap Research Portfolio (Class A) (b) | | | 388,062 | | | | 5,118,534 | |
Clarion Global Real Estate Portfolio (Class A) (b) | | | 244,089 | | | | 2,616,631 | |
Harris Oakmark International Portfolio (Class A) (b) | | | 639,993 | | | | 7,782,316 | |
Invesco Comstock Portfolio (Class A) (b) | | | 763,391 | | | | 10,122,560 | |
Jennison Growth Portfolio (Class A) (a) | | | 266,728 | | | | 3,867,555 | |
JPMorgan Core Bond Portfolio (Class A) (b) | | | 4,674,952 | | | | 46,843,016 | |
JPMorgan Small Cap Value Portfolio (Class A) (b) | | | 177,025 | | | | 2,506,672 | |
MFS Research International Portfolio (Class A) (b) | | | 364,030 | | | | 3,927,887 | |
MFS Value Portfolio (Class A) (a) | | | 828,856 | | | | 11,446,498 | |
Neuberger Berman Genesis Portfolio (Class A) (a) | | | 136,478 | | | | 2,533,029 | |
Oppenheimer Global Equity Portfolio (Class A) (b) | | | 63,204 | | | | 1,292,524 | |
|
| Affiliated Investment Companies—(Continued) | |
PIMCO Inflation Protected Bond Portfolio (Class A) (b) | | | 5,154,378 | | | | 49,327,398 | |
PIMCO Total Return Portfolio (Class A) (b) | | | 5,796,439 | | | | 66,021,441 | |
T. Rowe Price Large Cap Growth Portfolio (Class A) (a) | | | 186,185 | | | | 3,855,885 | |
T. Rowe Price Large Cap Value Portfolio (Class A) (b) | | | 266,925 | | | | 7,644,734 | |
T. Rowe Price Mid Cap Growth Portfolio (Class A) (b) | | | 126,225 | | | | 1,286,232 | |
T. Rowe Price Small Cap Growth Portfolio (Class A) (a) | | | 178,578 | | | | 3,791,221 | |
TCW Core Fixed Income Portfolio (Class A) (b) | | | 5,246,750 | | | | 52,362,562 | |
Van Eck Global Natural Resources Portfolio (Class A) (a) | | | 819,515 | | | | 6,293,879 | |
Western Asset Management Strategic Bond Opportunities Portfolio (Class A) (a) | | | 2,152,848 | | | | 27,298,107 | |
Western Asset Management U.S. Government Portfolio (Class A) (a) | | | 6,224,310 | | | | 71,517,321 | |
| | | | | | | | |
Total Mutual Funds
(Cost $569,482,036) | | | | | | | 541,604,884 | |
| | | | | | | | |
Total Investments—100.1%
(Cost $569,482,036) | | | | | | | 541,604,884 | |
Other assets and liabilities (net)—(0.1)% | | | | | | | (319,614 | ) |
| | | | | | | | |
| Net Assets—100.0% | | | | | | $ | 541,285,270 | |
| | | | | | | | |
| | | | |
| (a) | | A Portfolio of Brighthouse Funds Trust II. (See Note 6 of the Notes to Financial Statements for a summary of transactions in the securities of affiliated issuers.) |
| (b) | | A Portfolio of Brighthouse Funds Trust I. (See Note 6 of the Notes to Financial Statements for a summary of transactions in the securities of affiliated issuers.) |
| (c) | | Non-income producing security. |
Fair Value Hierarchy
Accounting principles generally accepted in the United States of America (“GAAP”) define fair market value as the price that the Portfolio would receive to sell an asset or pay to transfer a liability in an orderly transaction between market participants at the measurement date. It establishes a fair value hierarchy that prioritizes inputs to valuation methods and requires disclosure of the fair value hierarchy, separately for each major category of assets and liabilities, that segregates fair value measurements into three levels. Levels 1, 2 and 3 of the fair value hierarchy are defined as follows:
Level 1 - unadjusted quoted prices in active markets for identical investments
Level 2 - other significant observable inputs (including, but not limited to, quoted prices for similar assets or liabilities in markets that are either active or inactive; inputs other than quoted prices that are observable such as interest rates, yield curves, volatilities, prepayment speeds, loss severities, credit risks, default rates, or other market corroborated inputs)
Level 3 - significant unobservable inputs based on the best information available in the circumstances, to the extent observable inputs are unavailable (including the Portfolio’s own assumptions used in determining the fair value of investments and derivative financial instruments)
The inputs or methodologies used for valuing investments are not necessarily an indication of the risk associated with investing in them. Changes to the inputs or methodologies used may result in transfers between levels. A reconciliation of Level 3 securities, if any, will be disclosed following the fair value hierarchy table. For more information about the Portfolio’s policy regarding the valuation of investments, please refer to the Notes to Financial Statements.
The following table summarizes the fair value hierarchy of the Portfolio’s investments as of December 31, 2018:
| | | | | | | | | | | | | | | | |
| Description | | Level 1 | | | Level 2 | | | Level 3 | | | Total | |
| Mutual Funds | | | | | | | | | | | | | | | | |
Affiliated Investment Companies | | $ | 541,604,884 | | | $ | — | | | $ | — | | | $ | 541,604,884 | |
Total Investments | | $ | 541,604,884 | | | $ | — | | | $ | — | | | $ | 541,604,884 | |
| | | | | | | | | | | | | | | | | |
See accompanying notes to financial statements.
BHFTII-5
Brighthouse Funds Trust II
Brighthouse Asset Allocation 20 Portfolio
Statement of Assets and Liabilities
December 31, 2018
| | | | |
Assets | |
Affiliated investments at value (a) | | $ | 541,604,884 | |
Receivable for: | |
Affiliated investments sold | | | 121,742 | |
Fund shares sold | | | 2,604 | |
Due from investment adviser | | | 4,549 | |
| | | | |
Total Assets | | | 541,733,779 | |
Liabilities | |
Payables for: | |
Fund shares redeemed | | | 124,346 | |
Accrued Expenses: | |
Management fees | | | 45,166 | |
Distribution and service fees | | | 108,018 | |
Deferred trustees’ fees | | | 111,916 | |
Other expenses | | | 59,063 | |
| | | | |
Total Liabilities | | | 448,509 | |
| | | | |
Net Assets | | $ | 541,285,270 | |
| | | | |
Net Assets Consist of: | |
Paid in surplus | | $ | 554,727,420 | |
Distributable earnings (Accumulated losses) | | | (13,442,150 | ) |
| | | | |
Net Assets | | $ | 541,285,270 | |
| | | | |
Net Assets | |
Class A | | $ | 33,602,207 | |
Class B | | | 507,683,063 | |
Capital Shares Outstanding* | |
Class A | | | 3,246,143 | |
Class B | | | 49,452,448 | |
Net Asset Value, Offering Price and Redemption Price Per Share | |
Class A | | $ | 10.35 | |
Class B | | | 10.27 | |
| | | | |
| * | | The Portfolio is authorized to issue an unlimited number of shares. |
| (a) | | Identified cost of affiliated investments was $569,482,036. |
Statement of Operations
Year Ended December 31, 2018
| | | | |
Investment Income | |
Dividends from affiliated investments | | $ | 13,673,373 | |
| | | | |
Total investment income | | | 13,673,373 | |
Expenses | |
Management fees | | | 562,116 | |
Administration fees | | | 26,349 | |
Custodian and accounting fees | | | 28,054 | |
Distribution and service fees—Class B | | | 1,365,677 | |
Audit and tax services | | | 32,222 | |
Legal | | | 45,317 | |
Trustees’ fees and expenses | | | 33,734 | |
Miscellaneous | | | 8,854 | |
| | | | |
Total expenses | | | 2,102,323 | |
Less expenses reimbursed by the Adviser | | | (153,825 | ) |
| | | | |
Net expenses | | | 1,948,498 | |
| | | | |
Net Investment Income | | | 11,724,875 | |
| | | | |
Net Realized and Unrealized Gain (Loss) | |
| Net realized gain on: | |
Affiliated investments | | | 2,425,237 | |
Capital gain distributions from affiliated investments | | | 7,799,655 | |
| | | | |
Net realized gain | | | 10,224,892 | |
| | | | |
Net change in unrealized depreciation on affiliated investments | | | (36,944,994 | ) |
| | | | |
Net realized and unrealized loss | | | (26,720,102 | ) |
| | | | |
Net Decrease in Net Assets From Operations | | $ | (14,995,227 | ) |
| | | | |
See accompanying notes to financial statements.
BHFTII-6
Brighthouse Funds Trust II
Brighthouse Asset Allocation 20 Portfolio
Statements of Changes in Net Assets
| | | | | | | | |
| | | Year Ended
December 31,
2018 | | | Year Ended
December 31,
2017 | |
Increase (Decrease) in Net Assets: | |
From Operations | |
Net investment income | | $ | 11,724,875 | | | $ | 12,124,716 | |
Net realized gain | | | 10,224,892 | | | | 6,825,212 | |
Net change in unrealized appreciation (depreciation) | | | (36,944,994 | ) | | | 24,219,748 | |
| | | | | | | | |
Increase (decrease) in net assets from operations | | | (14,995,227 | ) | | | 43,169,676 | |
| | | | | | | | |
From Distributions to Shareholders (a) | |
Class A | | | (1,362,443 | ) | | | (1,598,526 | ) |
Class B | | | (18,915,897 | ) | | | (22,047,887 | ) |
| | | | | | | | |
Total distributions | | | (20,278,340 | ) | | | (23,646,413 | ) |
| | | | | | | | |
Decrease in net assets from capital share transactions | | | (51,852,688 | ) | | | (56,585,690 | ) |
| | | | | | | | |
Total decrease in net assets | | | (87,126,255 | ) | | | (37,062,427 | ) |
|
Net Assets | |
Beginning of period | | | 628,411,525 | | | | 665,473,952 | |
| | | | | | | | |
End of period | | $ | 541,285,270 | | | $ | 628,411,525 | (b) |
| | | | | | | | |
Other Information:
Capital Shares
Transactions in capital shares were as follows:
| | | | | | | | | | | | | | | | |
| | | Year Ended
December 31, 2018 | | | Year Ended
December 31, 2017 | |
| | | Shares | | | Value | | | Shares | | | Value | |
Class A | |
Sales | | | 296,749 | | | $ | 3,178,060 | | | | 399,659 | | | $ | 4,354,795 | |
Reinvestments | | | 129,141 | | | | 1,362,443 | | | | 149,535 | | | | 1,598,526 | |
Redemptions | | | (766,471 | ) | | | (8,214,828 | ) | | | (819,017 | ) | | | (8,927,209 | ) |
| | | | | | | | | | | | | | | | |
Net decrease | | | (340,581 | ) | | $ | (3,674,325 | ) | | | (269,823 | ) | | $ | (2,973,888 | ) |
| | | | | | | | | | | | | | | | |
Class B | |
Sales | | | 6,089,194 | | | $ | 64,558,745 | | | | 5,752,405 | | | $ | 62,167,159 | |
Reinvestments | | | 1,806,676 | | | | 18,915,897 | | | | 2,078,029 | | | | 22,047,887 | |
Redemptions | | | (12,378,058 | ) | | | (131,653,005 | ) | | | (12,761,341 | ) | | | (137,826,848 | ) |
| | | | | | | | | | | | | | | | |
Net decrease | | | (4,482,188 | ) | | $ | (48,178,363 | ) | | | (4,930,907 | ) | | $ | (53,611,802 | ) |
| | | | | | | | | | | | | | | | |
Decrease derived from capital shares transactions | | | | | | $ | (51,852,688 | ) | | | | | | $ | (56,585,690 | ) |
| | | | | | | | | | | | | | | | |
| | | | | | |
| (a) | | Distributions from net investment income and realized gains are no longer required to be separately disclosed. The presentation for the year ended December 31, 2018 has been adjusted for this change (See Note 9). At December 31, 2017 the distributions were as follows. |
| | | | | | | | |
| | | Distributions from net
investment income: | | | Distributions from realized
capital gains: | |
Class A | | $ | (947,275 | ) | | $ | (651,251 | ) |
Class B | | | (12,419,033 | ) | | | (9,628,854 | ) |
| | | | | | |
| (b) | | As part of the update in (a), it is also no longer required to disclose the Undistributed net investment income (Accumulated losses) which was $12,526,450 as of December 31, 2017. |
See accompanying notes to financial statements.
BHFTII-7
Brighthouse Funds Trust II
Brighthouse Asset Allocation 20 Portfolio
Financial Highlights
| | | | | | | | | | | | | | | | | | | | |
| Selected per share data | |
| | | Class A | |
| | | Year Ended December 31, | |
| | | 2018 | | | 2017 | | | 2016 | | | 2015 | | | 2014 | |
Net Asset Value, Beginning of Period | | $ | 11.01 | | | $ | 10.69 | | | $ | 10.94 | | | $ | 11.59 | | | $ | 12.05 | |
| | | | | | | | | | | | | | | | | | | | |
Income (Loss) from Investment Operations | |
Net investment income (a) | | | 0.24 | | | | 0.23 | | | | 0.23 | | | | 0.36 | | | | 0.25 | |
Net realized and unrealized gain (loss) | | | (0.50 | ) | | | 0.53 | | | | 0.28 | | | | (0.38 | ) | | | 0.29 | |
| | | | | | | | | | | | | | | | | | | | |
Total income (loss) from investment operations | | | (0.26 | ) | | | 0.76 | | | | 0.51 | | | | (0.02 | ) | | | 0.54 | |
| | | | | | | | | | | | | | | | | | | | |
Less Distributions | |
Distributions from net investment income | | | (0.26 | ) | | | (0.26 | ) | | | (0.39 | ) | | | (0.27 | ) | | | (0.50 | ) |
Distributions from net realized capital gains | | | (0.14 | ) | | | (0.18 | ) | | | (0.37 | ) | | | (0.36 | ) | | | (0.50 | ) |
| | | | | | | | | | | | | | | | | | | | |
Total distributions | | | (0.40 | ) | | | (0.44 | ) | | | (0.76 | ) | | | (0.63 | ) | | | (1.00 | ) |
| | | | | | | | | | | | | | | | | | | | |
Net Asset Value, End of Period | | $ | 10.35 | | | $ | 11.01 | | | $ | 10.69 | | | $ | 10.94 | | | $ | 11.59 | |
| | | | | | | | | | | | | | | | | | | | |
Total Return (%) (b) | | | (2.41 | ) | | | 7.16 | | | | 4.76 | | | | (0.23 | ) | | | 4.73 | |
| | | | | |
Ratios/Supplemental Data | | | | | | | | | | | | | | | | | | | | |
Gross ratio of expenses to average net assets (%) (c) | | | 0.13 | | | | 0.12 | | | | 0.12 | | | | 0.11 | | | | 0.12 | |
Net ratio of expenses to average net assets (%) (c)(d) | | | 0.10 | | | | 0.10 | | | | 0.10 | | | | 0.10 | | | | 0.10 | |
Ratio of net investment income to average net assets (%) (e) | | | 2.26 | | | | 2.13 | | | | 2.15 | | | | 3.20 | | | | 2.17 | |
Portfolio turnover rate (%) | | | 11 | | | | 11 | | | | 14 | | | | 21 | | | | 16 | |
Net assets, end of period (in millions) | | $ | 33.6 | | | $ | 39.5 | | | $ | 41.2 | | | $ | 47.5 | | | $ | 50.1 | |
| |
| | | Class B | |
| | | Year Ended December 31, | |
| | | 2018 | | | 2017 | | | 2016 | | | 2015 | | | 2014 | |
Net Asset Value, Beginning of Period | | $ | 10.92 | | | $ | 10.60 | | | $ | 10.85 | | | $ | 11.51 | | | $ | 11.97 | |
| | | | | | | | | | | | | | | | | | | | |
Income (Loss) from Investment Operations | |
Net investment income (a) | | | 0.21 | | | | 0.20 | | | | 0.20 | | | | 0.33 | | | | 0.22 | |
Net realized and unrealized gain (loss) | | | (0.49 | ) | | | 0.53 | | | | 0.28 | | | | (0.39 | ) | | | 0.28 | |
| | | | | | | | | | | | | | | | | | | | |
Total income (loss) from investment operations | | | (0.28 | ) | | | 0.73 | | | | 0.48 | | | | (0.06 | ) | | | 0.50 | |
| | | | | | | | | | | | | | | | | | | | |
Less Distributions | |
Distributions from net investment income | | | (0.23 | ) | | | (0.23 | ) | | | (0.36 | ) | | | (0.24 | ) | | | (0.46 | ) |
Distributions from net realized capital gains | | | (0.14 | ) | | | (0.18 | ) | | | (0.37 | ) | | | (0.36 | ) | | | (0.50 | ) |
| | | | | | | | | | | | | | | | | | | | |
Total distributions | | | (0.37 | ) | | | (0.41 | ) | | | (0.73 | ) | | | (0.60 | ) | | | (0.96 | ) |
| | | | | | | | | | | | | | | | | | | | |
Net Asset Value, End of Period | | $ | 10.27 | | | $ | 10.92 | | | $ | 10.60 | | | $ | 10.85 | | | $ | 11.51 | |
| | | | | | | | | | | | | | | | | | | | |
Total Return (%) (b) | | | (2.61 | ) | | | 6.93 | | | | 4.53 | | | | (0.59 | ) | | | 4.47 | |
| | | | | |
Ratios/Supplemental Data | | | | | | | | | | | | | | | | | | | | |
Gross ratio of expenses to average net assets (%) (c) | | | 0.38 | | | | 0.37 | | | | 0.37 | | | | 0.36 | | | | 0.37 | |
Net ratio of expenses to average net assets (%) (c)(d) | | | 0.35 | | | | 0.35 | | | | 0.35 | | | | 0.35 | | | | 0.35 | |
Ratio of net investment income to average net assets (%) (e) | | | 2.00 | | | | 1.86 | | | | 1.83 | | | | 2.89 | | | | 1.89 | |
Portfolio turnover rate (%) | | | 11 | | | | 11 | | | | 14 | | | | 21 | | | | 16 | |
Net assets, end of period (in millions) | | $ | 507.7 | | | $ | 588.9 | | | $ | 624.2 | | | $ | 615.4 | | | $ | 653.6 | |
| | | | |
| (a) | | Per share amounts based on average shares outstanding during the period. |
| (b) | | Total return does not reflect any insurance, sales, separate account or administrative charges of variable annuity or life insurance contracts or any additional expenses that contract owners may bear under their variable contracts. If these charges were included, the returns would be lower. |
| (c) | | The ratio of operating expenses to average net assets does not include expenses of the Underlying Portfolios in which the Asset Allocation Portfolio invests. |
| (d) | | Includes the effects of expenses reimbursed by the Adviser (see Note 5 of the Notes to Financial Statements). |
| (e) | | Recognition of net investment income by the Asset Allocation Portfolio is affected by the timing of the declaration of dividends by the Underlying Portfolios in which it invests. |
See accompanying notes to financial statements.
BHFTII-8
Brighthouse Funds Trust II
Brighthouse Asset Allocation 20 Portfolio
Notes to Financial Statements—December 31, 2018
1. Organization
Brighthouse Funds Trust II (the “Trust”) is organized as a Delaware statutory trust and registered under the Investment Company Act of 1940, as amended (the “1940 Act”), as anopen-end management investment company. The Trust, which is managed by Brighthouse Investment Advisers, LLC (“Brighthouse Investment Advisers” or the “Adviser”), currently offers twenty-nine series, each of which operates as a distinct investment vehicle of the Trust. The series included in this report is Brighthouse Asset Allocation 20 Portfolio (the “Asset Allocation Portfolio”), which is diversified. The Asset Allocation Portfolio operates under a “fund of funds” structure, investing substantially all of its assets in other Portfolios advised by Brighthouse Investment Advisers (each, an “Underlying Portfolio,” and, collectively, the “Underlying Portfolios”). Shares of the Portfolio are not offered directly to the general public and are currently available only to separate accounts of insurance companies, including insurance companies affiliated with the Adviser (together, the “Insurance Companies”).
The Asset Allocation Portfolio has registered and offers two classes of shares: Class A and B shares. Shares of each Class of the Asset Allocation Portfolio represent an equal pro rata interest in the Asset Allocation Portfolio and generally give the shareholder the same voting, dividend, liquidation, and other rights. Investment income, realized and unrealized capital gains and losses, the common expenses of the Asset Allocation Portfolio, and certain Asset Allocation Portfolio-level expense reductions, if any, are allocated on a pro rata basis to each Class based on the relative net assets of each Class to the net assets of the Asset Allocation Portfolio. Each Class of shares differs in its respective distribution plan and such distribution expenses are allocated to the corresponding Class of shares.
2. Significant Accounting Policies
The preparation of financial statements in conformity with accounting principles generally accepted in the United States of America (“GAAP”) requires management to make estimates and assumptions that affect the reported amounts of assets and liabilities and disclosure of contingent assets and liabilities as of the date of the financial statements and the reported amounts of income and expenses during the reporting period. Actual results could differ from those estimates. In the preparation of these financial statements, management has evaluated events and transactions subsequent to December 31, 2018 through the date the financial statements were issued.
The Asset Allocation Portfolio is an investment company and follows the accounting and reporting guidance of the Financial Accounting Standards Board (“FASB”) Accounting Standards Codification Topic 946—Financial Services—Investment Companies. The following is a summary of significant accounting policies consistently followed by the Asset Allocation Portfolio in the preparation of its financial statements.
Investment Valuation and Fair Value Measurements - The Asset Allocation Portfolio values its portfolio investments for purposes of calculating its net asset value (“NAV”) using procedures approved by the Board of Trustees of the Trust (the “Board” or “Trustees”). Those procedures allow for a variety of methodologies to be used to value the Asset Allocation Portfolio’s investments. The specific methodologies used for a particular investment may vary based on the market data available for a specific investment at the time the Asset Allocation Portfolio calculates its NAV or based on other considerations. The procedures also permit a level of judgment to be used in the valuation process. The Asset Allocation Portfolio follows the accounting and reporting guidance of FASB Accounting Standards Codification Topic 820—Fair Value Measurement.
Investments in the Underlying Portfolios are valued at their closing daily NAV on the valuation date. Investments in the Underlying Portfolios are categorized as Level 1 within the fair value hierarchy. For information about the use of fair value pricing by the Underlying Portfolios, please refer to the prospectuses of the Underlying Portfolios.
Investment Transactions and Related Investment Income - The Asset Allocation Portfolio’s security transactions are recorded on the trade date. Dividend income is recorded on theex-dividend date. Interest income is recorded on the accrual basis. Realized gains and losses on investments and unrealized appreciation and depreciation are determined on the identified cost basis, which is the same basis used for federal income tax purposes. Capital gains distributions received from the Underlying Portfolios are recorded as net realized gain in the Statement of Operations.
Dividends and Distributions to Shareholders -The Asset Allocation Portfolio records dividends and distributions on theex-dividend date. Net realized gains from securities transactions (if any) are generally distributed annually to shareholders. The timing and characterization of certain income and capital gains distributions are determined in accordance with federal tax regulations that may differ from GAAP. Permanent book and tax basis differences relating to shareholder distributions will result in reclassification between distributable earnings (accumulated losses) andpaid-in surplus. These adjustments have no impact on net assets or the results of operations.
Income Taxes -It is the Asset Allocation Portfolio’s policy to comply with the requirements of the Internal Revenue Code of 1986, as amended, and regulations thereunder, applicable to regulated investment companies, and to distribute, with respect to each taxable
BHFTII-9
Brighthouse Funds Trust II
Brighthouse Asset Allocation 20 Portfolio
Notes to Financial Statements—December 31, 2018—(Continued)
year, all of its taxable income to shareholders. Therefore, no federal income tax provision is required. The Asset Allocation Portfolio files U.S. federal tax returns. No income tax returns are currently under examination. The Asset Allocation Portfolio’s federal tax returns for the prior three fiscal years remain subject to examination by the Internal Revenue Service. As of December 31, 2018, the Asset Allocation Portfolio had no uncertain tax positions that would require financial statement recognition, or derecognition or disclosure.
3. Certain Risks
In the normal course of business, the Underlying Portfolios invest in securities and enter into transactions where risks exist. Those risks include:
Market Risk:The value of securities held by the Underlying Portfolios may decline in response to certain events, including those directly involving the issuers whose securities are owned by the Underlying Portfolios; conditions affecting the general economy; overall market changes; local, regional or global political, social or economic instability; and currency, interest rate, and price fluctuations.
Credit and Counterparty Risk: The Underlying Portfolios may be exposed to counterparty risk, or the risk that an entity with which the Underlying Portfolios have unsettled or open transactions may default. The potential loss could exceed the value of the financial assets and liabilities recorded in the financial statements. Financial assets that potentially expose the Underlying Portfolios to credit and counterparty risk consist principally of cash due from counterparties and investments. The Underlying Portfolios manage counterparty risk by entering into agreements only with counterparties that they believe have the financial resources to honor their obligations and by monitoring the financial stability of those counterparties. The Adviser attempts to mitigate counterparty risk by (i) periodically assessing the creditworthiness of their trading partners, (ii) monitoring and/or limiting the amount of their net exposure to each individual counterparty based on the adviser’s assessment, and (iii) requiring collateral from the counterparty for certain transactions. In order to preserve certain safeguards fornon-standard settlement trades, the Underlying Portfolios restrict their exposure to credit and counterparty losses by entering into master netting agreements (“Master Agreements”) with counterparties (approved brokers) with whom the Underlying Portfolios undertake a significant volume of transactions. Master Agreements govern the terms of certain transactions, and reduce the counterparty risk associated with relevant transactions by specifying credit protection mechanisms and providing standardization that improves legal certainty. Master Agreements can also help limit counterparty risk by specifying collateral posting arrangements atpre-arranged exposure levels.
The Asset Allocation Portfolio’s prospectus includes a discussion of the principal risks of investing in the Asset Allocation Portfolio and in the Underlying Portfolios in which it invests.
4. Investment Transactions
Aggregate cost of purchases and proceeds of sales of shares of the Underlying Portfolios by the Asset Allocation Portfolio for the year ended December 31, 2018 were as follows:
| | | | | | | | | | | | |
Purchases | | | Sales | |
U.S. Government | | Non-U.S. Government | | | U.S. Government | | | Non-U.S. Government | |
| $ 0 | | $ | 63,528,017 | | | $ | 0 | | | $ | 116,136,921 | |
5. Investment Management Fees and Other Transactions with Affiliates
Investment Management Agreement - Brighthouse Investment Advisers is the investment adviser to the Asset Allocation Portfolio. The Trust has entered into an investment management agreement with Brighthouse Investment Advisers with respect to the Asset Allocation Portfolio. For providing investment management services to the Asset Allocation Portfolio, Brighthouse Investment Advisers receives monthly compensation at the following annual rates:
| | | | | | |
Management
Fees earned by
Brighthouse
Investment Advisers
for the year ended
December 31, 2018 | | % per annum | | | Average Daily Net Assets |
| $562,116 | | | 0.100 | % | | Of the first $500 million |
| | | 0.075 | % | | Of the next $500 million |
| | | 0.050 | % | | On amounts in excess of $1 billion |
In addition to the above management fee paid to Brighthouse Investment Advisers, the Asset Allocation Portfolio indirectly pays Brighthouse Investment Advisers an investment advisory fee through its investments in the Underlying Portfolios.
BHFTII-10
Brighthouse Funds Trust II
Brighthouse Asset Allocation 20 Portfolio
Notes to Financial Statements—December 31, 2018—(Continued)
Certain officers and trustees of the Trust may also be officers of Brighthouse Investment Advisers however, such officers and trustees receive no compensation from the Trust.
Expense Limitation Agreement - Pursuant to an expense agreement relating to each class of the Asset Allocation Portfolio, Brighthouse Investment Advisers has contractually agreed, from April 30, 2018 to April 30, 2019, to waive a portion of its advisory fees or pay a portion of the other operating expenses (not including acquired fund fees and expenses, brokerage costs, interest, taxes, or extraordinary expenses) to the extent total operating expenses exceed stated annual expense limits (based on the Asset Allocation Portfolio’s then-current fiscal year). For the Asset Allocation Portfolio, this subsidy, and identical subsidies in effect in earlier periods, are subject to the obligation of each class of the Asset Allocation Portfolio to repay Brighthouse Investment Advisers in future years, if any, when a class’ expenses fall below the stated expense limit pertaining to that class that was in effect at the time of the subsidy in question. Such deferred expenses may be charged to a class in a subsequent year to the extent that the charge does not cause the total expenses in such subsequent year to exceed the class’ stated expense limit that was in effect at the time of the subsidy in question; provided, however, that no class of the Asset Allocation Portfolio is obligated to repay any expense paid by Brighthouse Investment Advisers more than five years after the end of the fiscal year in which such expense was incurred. The expense limits (annual rates as a percentage of each class of the Asset Allocation Portfolio’s net average daily net assets) in effect from April 30, 2018 to April 30, 2019 are 0.10% and 0.35% for Class A and B, respectively.
As of December 31, 2018, the amount of expenses deferred in 2014 subject to repayment until December 31, 2019 was $111,213. The amount of expenses deferred in 2015 subject to repayment until December 31, 2020 was $99,092. The amount of expenses deferred in 2016 subject to repayment until December 31, 2021 was $120,106. The amount of expenses deferred in 2017 subject to repayment until December 31, 2022 was $143,509. The amount of expenses deferred in 2018 subject to repayment until December 31, 2023 was $153,825.
Transfer Agency Agreement - Brighthouse Financial, Inc. serves as the transfer agent for the Trust. Brighthouse Financial, Inc. receives no fees for its services to the Trust.
Distribution and Service Fees - The Trust has a distribution agreement with Brighthouse Securities, LLC (the “Distributor”) pursuant to which the Distributor serves as the general distributor of shares of each class (each a “Class”) of each Portfolio. The Distributor is an affiliate of the Trust. The Trust has adopted a Distribution and Services Plan (the “Plan”) relating to Class B shares of each Portfolio, under Rule 12b-1 under the 1940 Act, pursuant to which the Trust may pay the Distributor a fee (the “Service Fee”) at an annual rate not to exceed 0.25% of each such Portfolio’s average daily net assets attributable to the Class B shares of the Trust. Each Portfolio may not offer shares of each Class. The Plan also authorizes the Trust, on behalf of each of its Portfolios, may pay the Distributor a distribution Fee (the “Distribution Fee” and together with the Service Fee, the “Fees”) at an annual rate of up to 0.25% of each Portfolio’s average daily net assets attributable to the Class B in consideration of the services rendered in connection with the sale of such shares by the Distributor. Under the Distribution Agreement with respect to the Trust, Fees are currently paid at an annual rate of 0.25% of average daily net assets in the case of Class B shares. The Plan is known as a “compensation plan” because the Trust makes payments to the Distributor for services rendered regardless of the actual level of expenditures by the Distributor. Amounts incurred by the Portfolio for the year ended December 31, 2018 are shown as Distribution and service fees in the Statement of Operations.
Deferred Trustee Compensation - Each Trustee who is not currently an employee of the Adviser or any of its affiliates receives compensation from the Trust for his or her service to the Trust. A deferred compensation plan (the “Plan”) is available to the Trustees on a voluntary basis. Deferred amounts remain in the Trust until distributed in accordance with the provisions of the Plan. The value of a participating Trustee’s deferral account is based on theoretical investments of deferred amounts on the normal payment dates in certain portfolios of the Trust or Brighthouse Funds Trust I, an affiliate of the Trust, as designated by the participating Trustee. Changes in the value of participants’ deferral accounts are reflected as Trustees’ fees and expenses in the Statement of Operations. The portion of the accrued obligations allocated to the Portfolio under the Plan is reflected as Deferred trustees’ fees in the Statement of Assets and Liabilities.
6. Transactions in Securities of Affiliated Issuers
The Asset Allocation Portfolio does not invest in the Underlying Portfolios for the purpose of exercising control; however, investments by the Asset Allocation Portfolio within its principal investment strategies may represent a significant portion of the Underlying Portfolios’ net assets. Transactions in the Underlying Portfolios for the year ended December 31, 2018 were as follows:
| | | | | | | | | | | | | | | | | | | | | | | | |
Security Description | | Market Value
December 31, 2017 | | | Purchases | | | Sales | | | Realized
Gain/(Loss) | | | Change in
Unrealized
Appreciation/
(Depreciation) | | | Ending Value
as of
December 31, 2018 | |
Baillie Gifford International Stock Portfolio (Class A) | | $ | 6,313,986 | | | $ | 4,539,978 | | | $ | (1,496,091 | ) | | $ | 342,728 | | | $ | (1,906,540 | ) | | $ | 7,794,061 | |
BlackRock Bond Income Portfolio (Class A) | | | 78,650,584 | | | | 3,615,909 | | | | (10,589,492 | ) | | | (639,714 | ) | | | (2,245,163 | ) | | | 68,792,124 | |
BlackRock Capital Appreciation Portfolio (Class A) | | | 6,263,239 | | | | 1,437,242 | | | | (3,682,491 | ) | | | 856,841 | | | | (1,015,549 | ) | | | 3,859,282 | |
BHFTII-11
Brighthouse Funds Trust II
Brighthouse Asset Allocation 20 Portfolio
Notes to Financial Statements—December 31, 2018—(Continued)
| | | | | | | | | | | | | | | | | | | | | | | | |
Security Description | | Market Value
December 31, 2017 | | | Purchases | | | Sales | | | Realized
Gain/(Loss) | | | Change in
Unrealized
Appreciation/
(Depreciation) | | | Ending Value
as of
December 31, 2018 | |
BlackRock High Yield Portfolio (Class A) | | $ | 3,145,741 | | | $ | 216,806 | | | $ | (475,476 | ) | | $ | (37,115 | ) | | $ | (179,720 | ) | | $ | 2,670,236 | |
Brighthouse Small Cap Value Portfolio (Class A) | | | 3,125,660 | | | | 707,211 | | | | (712,099 | ) | | | 142,046 | | | | (732,582 | ) | | | 2,530,236 | |
Brighthouse/Aberdeen Emerging Markets Equity Portfolio (Class A) | | | 1,584,367 | | | | 395,805 | | | | (397,880 | ) | | | 48,911 | | | | (289,577 | ) | | | 1,341,626 | |
Brighthouse/Artisan International Portfolio (Class A) | | | 3,150,093 | | | | 3,711,486 | | | | (891,997 | ) | | | 173,281 | | | | (902,286 | ) | | | 5,240,577 | |
Brighthouse/Artisan Mid Cap Value Portfolio (Class A) | | | 1,563,770 | | | | 308,005 | | | | (340,502 | ) | | | 52,823 | | | | (314,124 | ) | | | 1,269,972 | |
Brighthouse/Eaton Vance Floating Rate Portfolio (Class A) | | | 12,570,129 | | | | 659,853 | | | | (2,238,286 | ) | | | 101,010 | | | | (447,722 | ) | | | 10,644,984 | |
Brighthouse/Franklin Low Duration Total Return Portfolio (Class A) | | | 31,425,249 | | | | 1,037,629 | | | | (4,727,013 | ) | | | (230,004 | ) | | | (171,420 | ) | | | 27,334,441 | |
Brighthouse/Templeton International Bond Portfolio (Class A) | | | 15,497,679 | | | | 553,625 | | | | (2,631,221 | ) | | | (265,894 | ) | | | 469,339 | | | | 13,623,528 | |
Brighthouse/Wellington Core Equity Opportunities Portfolio (Class A) | | | 12,549,930 | | | | 1,952,559 | | | | (4,854,758 | ) | | | 218,128 | | | | (818,044 | ) | | | 9,047,815 | |
Brighthouse/Wellington Large Cap Research Portfolio (Class A) | | | 6,261,927 | | | | 1,614,748 | | | | (1,790,571 | ) | | | 269,702 | | | | (1,237,272 | ) | | | 5,118,534 | |
Clarion Global Real Estate Portfolio (Class A) | | | 3,156,676 | | | | 496,576 | | | | (618,470 | ) | | | (9,609 | ) | | | (408,542 | ) | | | 2,616,631 | |
Harris Oakmark International Portfolio (Class A) | | | 7,874,391 | | | | 4,337,741 | | | | (1,787,001 | ) | | | 477,088 | | | | (3,119,903 | ) | | | 7,782,316 | |
Invesco Comstock Portfolio (Class A) | | | 15,655,828 | | | | 3,099,012 | | | | (6,484,056 | ) | | | 1,146,446 | | | | (3,294,670 | ) | | | 10,122,560 | |
Jennison Growth Portfolio (Class A) | | | 6,250,492 | | | | 1,632,111 | | | | (3,693,304 | ) | | | 832,570 | | | | (1,154,314 | ) | | | 3,867,555 | |
JPMorgan Core Bond Portfolio (Class A) | | | 53,452,067 | | | | 2,296,124 | | | | (7,438,480 | ) | | | (508,821 | ) | | | (957,874 | ) | | | 46,843,016 | |
JPMorgan Small Cap Value Portfolio (Class A) | | | 3,122,384 | | | | 723,885 | | | | (787,107 | ) | | | 90,040 | | | | (642,530 | ) | | | 2,506,672 | |
MFS Research International Portfolio (Class A) | | | 4,730,848 | | | | 835,285 | | | | (962,393 | ) | | | 91,662 | | | | (767,515 | ) | | | 3,927,887 | |
MFS Value Portfolio (Class A) | | | 14,126,846 | | | | 2,856,644 | | | | (4,800,708 | ) | | | (28,438 | ) | | | (707,846 | ) | | | 11,446,498 | |
MFS Value Portfolio II (Class A) | | | 1,569,487 | | | | 534,039 | | | | (146,635 | ) | | | 27,451 | | | | (1,984,342 | ) | | | — | |
Neuberger Berman Genesis Portfolio (Class A) | | | 3,135,419 | | | | 830,507 | | | | (939,917 | ) | | | 225,392 | | | | (718,372 | ) | | | 2,533,029 | |
Oppenheimer Global Equity Portfolio (Class A) | | | 1,566,573 | | | | 450,428 | | | | (407,130 | ) | | | 106,570 | | | | (423,917 | ) | | | 1,292,524 | |
PIMCO Inflation Protected Bond Portfolio (Class A) | | | 56,790,731 | | | | 1,902,213 | | | | (7,252,052 | ) | | | (1,027,283 | ) | | | (1,086,211 | ) | | | 49,327,398 | |
PIMCO Total Return Portfolio (Class A) | | | 75,557,422 | | | | 2,124,924 | | | | (10,437,386 | ) | | | (651,008 | ) | | | (572,511 | ) | | | 66,021,441 | |
T. Rowe Price Large Cap Growth Portfolio (Class A) | | | 6,250,221 | | | | 1,602,519 | | | | (3,413,302 | ) | | | 662,695 | | | | (1,246,248 | ) | | | 3,855,885 | |
T. Rowe Price Large Cap Value Portfolio (Class A) | | | 12,533,461 | | | | 2,296,564 | | | | (5,453,728 | ) | | | 204,585 | | | | (1,936,148 | ) | | | 7,644,734 | |
T. Rowe Price Mid Cap Growth Portfolio (Class A) | | | 1,565,947 | | | | 370,846 | | | | (461,820 | ) | | | 22,592 | | | | (211,333 | ) | | | 1,286,232 | |
T. Rowe Price Small Cap Growth Portfolio (Class A) | | | 3,135,170 | | | | 2,400,068 | | | | (1,151,656 | ) | | | 98,916 | | | | (691,277 | ) | | | 3,791,221 | |
TCW Core Fixed Income Portfolio (Class A) | | | 59,787,160 | | | | 2,297,222 | | | | (8,286,286 | ) | | | (79,265 | ) | | | (1,356,269 | ) | | | 52,362,562 | |
Van Eck Global Natural Resources Portfolio (Class A) | | | 3,148,730 | | | | 6,758,106 | | | | (1,328,991 | ) | | | 39,252 | | | | (2,323,218 | ) | | | 6,293,879 | |
Western Asset Management Strategic Bond Opportunities Portfolio (Class A) | | | 31,459,301 | | | | 2,105,368 | | | | (3,563,526 | ) | | | 102,923 | | | | (2,805,959 | ) | | | 27,298,107 | |
Western Asset Management U.S. Government Portfolio (Class A) | | | 81,762,037 | | | | 2,826,979 | | | | (11,895,096 | ) | | | (431,264 | ) | | | (745,335 | ) | | | 71,517,321 | |
| | | | | | | | | | | | | | | | | | | | | | | | |
| | $ | 628,733,545 | | | $ | 63,528,017 | | | $ | (116,136,921 | ) | | $ | 2,425,237 | | | $ | (36,944,994 | ) | | $ | 541,604,884 | |
| | | | | | | | | | | | | | | | | | | | | | | | |
| | | | | | | | | | | | |
Security Description | | Capital Gain
Distributions from
Affiliated Investments | | | Income earned
from affiliates
during the period | | | Number of
shares held at
December 31, 2018 | |
Baillie Gifford International Stock Portfolio (Class A) | | $ | — | | | $ | 98,535 | | | | 707,265 | |
BlackRock Bond Income Portfolio (Class A) | | | — | | | | 2,495,903 | | | | 668,274 | |
BlackRock Capital Appreciation Portfolio (Class A) | | | 559,183 | | | | 5,276 | | | | 99,389 | |
BlackRock High Yield Portfolio (Class A) | | | — | | | | 150,605 | | | | 368,308 | |
Brighthouse Small Cap Value Portfolio (Class A) | | | 152,055 | | | | 36,394 | | | | 186,871 | |
Brighthouse/Aberdeen Emerging Markets Equity Portfolio (Class A) | | | — | | | | 40,863 | | | | 140,632 | |
Brighthouse/Artisan International Portfolio (Class A) | | | — | | | | 84,542 | | | | 529,351 | |
Brighthouse/Artisan Mid Cap Value Portfolio (Class A) | | | 76,278 | | | | 9,033 | | | | 5,995 | |
Brighthouse/Eaton Vance Floating Rate Portfolio (Class A) | | | — | | | | 452,703 | | | | 1,064,498 | |
Brighthouse/Franklin Low Duration Total Return Portfolio (Class A) | | | — | | | | 601,771 | | | | 2,880,341 | |
Brighthouse/Templeton International Bond Portfolio (Class A) | | | — | | | | — | | | | 1,334,332 | |
Brighthouse/Wellington Core Equity Opportunities Portfolio (Class A) | | | 545,272 | | | | 179,695 | | | | 301,493 | |
Brighthouse/Wellington Large Cap Research Portfolio (Class A) | | | 665,567 | | | | 59,996 | | | | 388,062 | |
Clarion Global Real Estate Portfolio (Class A) | | | — | | | | 178,065 | | | | 244,089 | |
Harris Oakmark International Portfolio (Class A) | | | 332,523 | | | | 158,271 | | | | 639,993 | |
Invesco Comstock Portfolio (Class A) | | | 856,910 | | | | 101,061 | | | | 763,391 | |
Jennison Growth Portfolio (Class A) | | | 620,026 | | | | 14,621 | | | | 266,728 | |
JPMorgan Core Bond Portfolio (Class A) | | | — | | | | 1,499,742 | | | | 4,674,952 | |
JPMorgan Small Cap Value Portfolio (Class A) | | | 161,677 | | | | 36,915 | | | | 177,025 | |
MFS Research International Portfolio (Class A) | | | — | | | | 94,767 | | | | 364,030 | |
MFS Value Portfolio (Class A) | | | 824,241 | | | | 196,287 | | | | 828,856 | |
MFS Value Portfolio II (Class A) | | | 398,148 | | | | 47,887 | | | | — | |
BHFTII-12
Brighthouse Funds Trust II
Brighthouse Asset Allocation 20 Portfolio
Notes to Financial Statements—December 31, 2018—(Continued)
| | | | | | | | | | | | |
Security Description | | Capital Gain
Distributions from
Affiliated Investments | | | Income earned
from affiliates
during the period | | | Number of
shares held at
December 31, 2018 | |
Neuberger Berman Genesis Portfolio (Class A) | | $ | 351,513 | | | $ | 10,075 | | | | 136,478 | |
Oppenheimer Global Equity Portfolio (Class A) | | | 132,943 | | | | 17,603 | | | | 63,204 | |
PIMCO Inflation Protected Bond Portfolio (Class A) | | | — | | | | 971,032 | | | | 5,154,378 | |
PIMCO Total Return Portfolio (Class A) | | | — | | | | 1,123,251 | | | | 5,796,439 | |
T. Rowe Price Large Cap Growth Portfolio (Class A) | | | 760,725 | | | | 17,848 | | | | 186,185 | |
T. Rowe Price Large Cap Value Portfolio (Class A) | | | 824,038 | | | | 176,757 | | | | 266,925 | |
T. Rowe Price Mid Cap Growth Portfolio (Class A) | | | 189,101 | | | | — | | | | 126,225 | |
T. Rowe Price Small Cap Growth Portfolio (Class A) | | | 349,455 | | | | 5,081 | | | | 178,578 | |
TCW Core Fixed Income Portfolio (Class A) | | | — | | | | 1,443,176 | | | | 5,246,750 | |
Van Eck Global Natural Resources Portfolio (Class A) | | | — | | | | 11,804 | | | | 819,515 | |
Western Asset Management Strategic Bond Opportunities Portfolio (Class A) | | | — | | | | 1,574,312 | | | | 2,152,848 | |
Western Asset Management U.S. Government Portfolio (Class A) | | | — | | | | 1,779,502 | | | | 6,224,310 | |
| | | | | | | | | | | | |
| | $ | 7,799,655 | | | $ | 13,673,373 | | | | | |
| | | | | | | | | | | | |
7. Contractual Obligations
Under the Trust’s organizational documents, its officers and Trustees may be indemnified against certain liabilities and expenses arising out of the performance of their duties to the Trust. Additionally, the Trust has a variety of indemnification obligations under contracts with its service providers. The Trust’s maximum exposure under these arrangements is unknown, as this would involve future claims that may be made against the Trust that have not yet occurred.
8. Income Tax Information
The cost basis of investments for federal income tax purposes at December 31, 2018 was as follows:
| | | | |
Cost basis of investments | | $ | 577,308,451 | |
| | | | |
Gross unrealized appreciation | | | 787,556 | |
Gross unrealized depreciation | | | (36,491,124 | ) |
| | | | |
Net unrealized appreciation (depreciation) | | $ | (35,703,568 | ) |
| | | | |
The tax character of distributions paid for the years ended December 31, 2018 and 2017 were as follows:
| | | | | | | | | | | | | | | | | | | | |
Ordinary Income | | | Long-Term Capital Gain | | | Total | |
2018 | | 2017 | | | 2018 | | | 2017 | | | 2018 | | | 2017 | |
| $12,901,925 | | $ | 13,366,308 | | | $ | 7,376,415 | | | $ | 10,280,105 | | | $ | 20,278,340 | | | $ | 23,646,413 | |
As of December 31, 2018, the components of distributable earnings (accumulated losses) on a federal income tax basis were as follows:
| | | | | | | | | | | | | | | | |
Undistributed
Ordinary
Income | | Undistributed
Long-Term
Capital Gain | | | Net
Unrealized
Depreciation | | | Accumulated
Capital Losses | | | Total | |
| $12,048,267 | | $ | 10,325,067 | | | $ | (35,703,568 | ) | | $ | — | | | $ | (13,330,234 | ) |
The Asset Allocation Portfolio utilizes the provisions of the federal income tax laws that provide for the carryforward of capital losses for prior years, offsetting such losses against any future realized capital gains. Under the Regulated Investment Company Modernization Act of 2010, net capital losses recognized after December 22, 2010 may be carried forward indefinitely and their character is retained as short-term and/or long-term losses.
As of December 31, 2018, the Asset Allocation Portfolio had no accumulated capital losses.
9. Recent Accounting Pronouncements and SEC Update
In August 2018, the FASB issued Accounting Standards Update 2018-13, Fair Value Measurement (Topic 820)—Disclosure Framework—Changes to the Disclosure Requirements for Fair Value Measurement (“ASU 2018-13”) which introduces new fair value disclosure requirements as well as eliminates and modifies certain existing fair value disclosure requirements. ASU 2018-13 is effective for fiscal years beginning after December 15, 2019, and interim periods within those fiscal years. Early adoption is permitted and, as such, management has elected to early adopt ASU 2018-13 effective with the current reporting period. The impact of the Portfolio’s adoption was limited to changes in the Portfolio’s financial statement disclosures regarding fair value, primarily those disclosures related to transfers between levels of the fair value hierarchy.
BHFTII-13
Brighthouse Funds Trust II
Brighthouse Asset Allocation 20 Portfolio
Notes to Financial Statements—December 31, 2018—(Continued)
In August 2018, the Securities and Exchange Commission released its Final Rule on Disclosure Update and Simplification (the “Final Rule”) which is intended to simplify an issuer’s disclosure compliance efforts by removing redundant or outdated disclosures requirements without significantly altering the mix of information provided to investors. Effective with the current reporting period, the Portfolio adopted the Final Rule with the most notable impacts being that the Portfolio is no longer required to present the components of distributable earnings on the Statement of Assets and Liabilities or the sources of distributions to shareholders and the amounts of undistributed net investment income on the Statements of Changes in Net Assets.
BHFTII-14
Brighthouse Funds Trust II
Brighthouse Asset Allocation 20 Portfolio
Report of Independent Registered Public Accounting Firm
To the Shareholders of Brighthouse Asset Allocation 20 Portfolio and the Board of Trustees of Brighthouse Funds Trust II:
Opinion on the Financial Statements and Financial Highlights
We have audited the accompanying statement of assets and liabilities, including the schedule of investments, of the Brighthouse Asset Allocation 20 Portfolio (the “Portfolio”), one of the portfolios constituting the Brighthouse Funds Trust II, as of December 31, 2018, the related statement of operations for the year then ended, the statements of changes in net assets for each of the two years in the period then ended, the financial highlights for each of the five years in the period then ended, and the related notes. In our opinion, the financial statements and financial highlights present fairly, in all material respects, the financial position of the Brighthouse Asset Allocation 20 Portfolio of the Brighthouse Funds Trust II as of December 31, 2018, the results of its operations for the year then ended, the changes in its net assets for each of the two years in the period then ended, and the financial highlights for each of the five years in the period then ended, in conformity with accounting principles generally accepted in the United States of America.
Basis for Opinion
These financial statements and financial highlights are the responsibility of the Portfolio’s management. Our responsibility is to express an opinion on the Portfolio’s financial statements and financial highlights based on our audits. We are a public accounting firm registered with the Public Company Accounting Oversight Board (United States) (PCAOB) and are required to be independent with respect to the Portfolio in accordance with the U.S. federal securities laws and the applicable rules and regulations of the Securities and Exchange Commission and the PCAOB.
We conducted our audits in accordance with the standards of the PCAOB. Those standards require that we plan and perform the audit to obtain reasonable assurance about whether the financial statements and financial highlights are free of material misstatement, whether due to error or fraud. The Portfolio is not required to have, nor were we engaged to perform, an audit of its internal control over financial reporting. As part of our audits we are required to obtain an understanding of internal control over financial reporting but not for the purpose of expressing an opinion on the effectiveness of the Portfolio’s internal control over financial reporting. Accordingly, we express no such opinion.
Our audits included performing procedures to assess the risks of material misstatement of the financial statements and financial highlights, whether due to error or fraud, and performing procedures that respond to those risks. Such procedures included examining, on a test basis, evidence regarding the amounts and disclosures in the financial statements and financial highlights. Our audits also included evaluating the accounting principles used and significant estimates made by management, as well as evaluating the overall presentation of the financial statements and financial highlights. Our procedures included confirmation of securities owned as of December 31, 2018, by correspondence with the transfer agent. We believe that our audits provide a reasonable basis for our opinion.
/s/ Deloitte & Touche LLP
Boston, Massachusetts
February 25, 2019
We have served as the auditor of one or more of the Brighthouse investment companies since 1983.
BHFTII-15
Brighthouse Funds Trust II
Trustees and Officers
MANAGEMENT OF THE TRUSTS
The Boards of Trustees (the “Board”) of Brighthouse Funds Trust I and Brighthouse Funds Trust II (“BHF I” and “BHF II”, respectively, and collectively the “Trusts”) supervise the Trusts and are responsible for representing the interests of shareholders. The Trustees, the Chairman of the Board and the Chairmen of each subcommittee are the same for both Trusts. The Trustees of each Trust meet periodically throughout the year to oversee the Portfolios’ activities, reviewing, among other things, each Portfolio’s performance and its contractual arrangements with various service providers. The Trustees of each Trust elect the officers of the Trust, who are responsible for administering the Trust’sday-to-day operations.
Trustees and Officers
The Trustees and executive officers of the Trusts, as well as their principal occupations during the past five years, are set forth below. Unless otherwise indicated, the business address of each is c/o Brighthouse Funds, One Financial Center, Boston, Massachusetts 02111. Each Trustee who is deemed an “interested person,” as such term is defined in the 1940 Act, is referred to as an “Interested Trustee.” Those Trustees who are not “interested persons,” as such term is defined in the 1940 Act, are referred to as “Independent Trustees.” There is no limit to the term a Trustee may serve. Trustees serve until their death, resignation or removal in accordance with the BHF I Trust’s and BHF II Trust’s respective organizational documents and policies adopted by the Boards of the respective Trusts from time to time. Officers hold office at the pleasure of each Board and serve until their removal or resignation in accordance with the Trusts’ respective organizational documents and policies adopted by the Board of each Trust from time to time.
| | | | | | | | | | |
Name and Year of Birth | | Current
Position(s)
Held with
Registrant | | Term of Office
and Length of
Time Served | | Principal Occupation(s) During the Past 5 Years(1) | | Number of
Portfolios in
Brighthouse Funds
Complex(2)
Overseen
by Trustee | | Other Directorships Held
by Trustee During
the Past 5 Years(1) |
| Interested Trustee |
John Rosenthal* (1960) | | Trustee | | Indefinite;
From
May
2016
(Trust I
and
Trust II) to
present | | Chief Investment Officer, Brighthouse Financial, Inc. (2017 to present); until 2017, Senior Managing Director and Head of Global Portfolio Management, MetLife, Inc. | | 72 | | None |
|
| Independent Trustees |
Dawn M. Vroegop (1966) | | Trustee and Chairman of the Board | | Indefinite;
From
December
2000
(Trust I)/
May
2009
(Trust II)
to present
as
Trustee;
From
May
2016
(Trust I
and
Trust II)
until
present as
Chairman | | Private Investor. | | 72 | | Trustee, Driehaus Mutual Funds.** |
BHFTII-16
Brighthouse Funds Trust II
Trustees and Officers—(Continued)
| | | | | | | | | | |
Name and Year of Birth | | Current
Position(s)
Held with
Registrant | | Term of Office
and Length of
Time Served | | Principal Occupation(s) During the Past 5 Years(1) | | Number of
Portfolios in
Brighthouse Funds
Complex(2)
Overseen
by Trustee | | Other Directorships Held
by Trustee During
the Past 5 Years(1) |
Stephen M. Alderman (1959) | | Trustee | | Indefinite;
From
December
2000
(Trust I)/
April
2012
(Trust II)
to present | | Shareholder in the law firm of Garfield and Merel, Ltd. | | 72 | | None |
| | | | | |
Robert J. Boulware (1956) | | Trustee | | Indefinite;
From
March
2008
(Trust I)/
April
2012
(Trust II)
to present | | Managing Director, Pilgrim Funds, LLC (private equity fund). | | 72 | | Trustee, Vertical Capital Income Fund(closed-end fund);** Director, Gainsco, Inc. (auto insurance);** Trustee, SharesPost 100 Fund(closed-end fund).** |
| | | | | |
Susan C. Gause (1952) | | Trustee | | Indefinite;
From
March
2008
(Trust I)/
April
2012
(Trust II)
to present | | Private Investor. | | 72 | | Trustee, HSBC Funds.** |
| | | | | |
Nancy Hawthorne (1951) | | Trustee | | Indefinite;
From
May
2003
(Trust II)/
April
2012
(Trust I) to
present | | Partner, Hawthorne Financial Advisors, LLC (registered investment advisor); until 2014, Chief Executive Officer, Clerestory LLC (corporate advisor). | | 72 | | Director and Chairman of the Board of Directors, THL Credit, Inc.;** Director and Chairman of the Board, Avid Technology, Inc.;** Director, CRA International, Inc.** |
| | | | | |
Barbara A. Nugent (1956) | | Trustee | | Indefinite;
From
January
2014
(Trust I
and
Trust II) to
present | | President, True North Board Governance, LLC (consulting); until December 2013, partner in the law firm of Stradley Ronon Stevens & Young, LLP. | | 72 | | Independent Lead Trustee, BMT Investment Funds** |
| | | | | |
Christopher J. Towle (1957) | | Trustee | | Indefinite;
From
April
2018
(Trust I
and
Trust II) to
present | | Retired; until 2014, Partner, Portfolio Manager, Director of High Yield and Convertible Strategies, Lord Abbett & Co. | | 72 | | Trustee, Driehaus Mutual Funds** |
BHFTII-17
Brighthouse Funds Trust II
Trustees and Officers—(Continued)
Officers
| | | | | | |
Name and Year of Birth | | Position(s)
Held with
Registrant | | Length of
Time Served | | Principal Occupation(s)
During the Past 5 Years(1) |
| Executive Officers | | | | | | |
Kristi Slavin (1973) | | President and Chief Executive Officer, of Trust I and Trust II | | From May
2016
(Trust I
and
Trust II) to
present | | President, Brighthouse Investment Advisers, LLC (2016-present); formerly, Senior Vice President, MetLife Advisers, LLC; Vice President, MetLife, Inc.; Vice President, Trust I and Trust II(2015-2016). |
| | | |
Alan R. Otis (1971) | | Chief Financial Officer and Treasurer, of Trust I and Trust II | | From
November
2017
(Trust I
and
Trust II) to
present | | Senior Vice President, Brighthouse Investment Advisers, LLC (2017-present); formerly, Vice President, Brighthouse Investment Advisers, LLC (2012-2017); Assistant Treasurer, Trust I and Trust II(2012-2017). |
| | | |
Andrew L. Gangolf (1954) | | Secretary, of Trust I and Trust II | | From May
2011
(Trust I
and
Trust II) to
present | | Executive Vice President, Brighthouse Investment Advisers, LLC (2017-present); formerly, Senior Vice President, MetLife Advisers, LLC (2011-2017); until 2011, Senior Vice President & Assistant General Counsel, AllianceBernstein Investments, Inc. |
| | | |
Steven E. Hartstein (1963) | | Chief Compliance Officer (“CCO”), of Trust I and Trust II | | From
February
2014
(Trust I
and
Trust II) to
present | | Senior Vice President and CCO, Brighthouse Investment Advisers, LLC (2017-present); Head of Investments Compliance, Vice President, Brighthouse Financial, Inc. (2017-present); formerly, Vice President, MetLife, Inc. (2013-2017); Senior Vice President and CCO, MetLife Advisers, LLC (2013-2017.) |
| | | |
Victor Soto (1978) | | Vice President of Trust I and Trust II | | From May
2018
(Trust I
and
Trust II) to
present | | Executive Vice President, Brighthouse Investment Advisers, LLC (2016-present); Assistant Vice President, MetLife Inc. (2015-2017); Portfolio Manager, 1st Global (2013-2015). |
| * | Mr. Rosenthal is an “interested person” of the Trusts because of his position with Brighthouse Financial, Inc., the current parent company of Brighthouse Investment Advisers, LLC. |
| ** | Indicates a directorship with a registered investment company or a company subject to the reporting requirements of the Securities Exchange Act of 1934, as amended. |
| (1) | Previous positions during the past five years with the Trusts, Brighthouse Financial, Inc., MetLife, Inc. or the Manager are omitted if not materially different. |
| (2) | The Fund Complex includes 43 BHF I Portfolios and 29 BHF II Portfolios. |
BHFTII-18
Brighthouse Funds Trust II
Brighthouse Asset Allocation 20 Portfolio
Board of Trustees’ Consideration of Advisory Agreements
At anin-person meeting held on November6-8, 2018 (the “November Meeting”), the Boards of Trustees (the “Board”) of Brighthouse Funds Trust I and Brighthouse Funds Trust II (“BFT I” and “BFT II,” respectively, and collectively, the “Trusts”), including a majority of the Trustees who are not “interested persons” of the Trusts (the “Independent Trustees”) under the Investment Company Act of 1940 (the “1940 Act”), approved the continuation of the Trusts’ advisory agreements (the “Advisory Agreements” or “Agreements”) with Brighthouse Investment Advisers, LLC (the “Adviser”) for the series of the Trusts (each a “Portfolio,” and collectively, the “Portfolios”).
In making those approvals, the Board reviewed a variety of materials that were provided for the specific purpose of the annual contract renewal process. In addition, various materials provided to and discussed with the Board throughout the year informed the Board’s decision to renew the Agreements. In particular, the information for each Portfolio included, but was not limited to, investment performance reports, and reports on expenses, legal and compliance matters, asset pricing, brokerage commissions and trade execution.
The Board met in person with personnel of the Adviser on October 17, 2018 for the specific purpose of giving preliminary consideration to the proposed continuation of the Agreements (the “October Meeting”). At that meeting, the Adviser reviewed with the Board the performance and fees experienced by each Portfolio, as well as other information. During and after the October Meeting, the Independent Trustees communicatedfollow-up matters for management to address at the November Meeting. The Independent Trustees were advised by independent legal counsel throughout the contract renewal process, and met with independent legal counsel in several executive sessions outside of the presence of management.
Information furnished and reviewed specifically in connection with the renewal process included, but was not limited to, a report for each Portfolio that was prepared by Broadridge (“Broadridge”), an independent organization. In addition, the Independent Trustees reviewed a report that was prepared by JDL Consultants, LLC (“JDL”), an independent consultant to the Independent Trustees (“JDL Report”), which examined the comparative fees, expenses and performance of each Portfolio, based upon the Broadridge reports. Also, the Board reviewed the responses to wide-ranging questions from the Independent Trustees relating to the business, operations and performance of the Adviser, and aPortfolio-by-Portfolio analysis of the profitability to the Adviser of each Agreement, each of which was prepared by the Adviser specifically for the renewal process.
At the November Meeting, the Board, including a majority of the Independent Trustees, concluded that the nature, extent and quality of services provided by the Adviser supported the renewal of the Agreements. The Board also concluded that the investment performance of each Portfolio was such that each Agreement should continue, and that the fees paid by each Portfolio to the Adviser appeared to be reasonable in light of the nature, extent and quality of the services provided by the Adviser. Further, the Board concluded that the Adviser’s profitability in providing services under the Advisory Agreements did not appear unreasonable in light of the nature, extent and quality of the services provided by the Adviser. Finally, the Board reviewed the extent to which the investment advisory fees paid by the Portfolios shared economies of scale with investors and concluded that those considerations generally supported the renewal of each Agreement. In approving the renewal of each of the Agreements, the Board, including the Independent Trustees, gave attention to all of the information that was furnished and each Trustee placed varying degrees of importance on the various pieces of information that were provided to them. The Board evaluated the information on aPortfolio-by-Portfolio basis, and its decision was made separately with respect to each Portfolio. The following paragraphs provide more information about some of the primary factors that were relevant to the Board’s decision. The Board did not identify any single factor as determinative, and the Trustees generally attributed different weights to various factors for the various Portfolios.
Nature, extent and quality of services. The Board evaluated the nature, extent and quality of the services that the Adviser has provided to the Brighthouse Asset Allocation 20 Portfolio, Brighthouse Asset Allocation 40 Portfolio, Brighthouse Asset Allocation 60 Portfolio Brighthouse Asset Allocation 80 Portfolio and Brighthouse Asset Allocation 100 Portfolio (the “Asset Allocation Portfolios”) and the American Funds Balanced Allocation Portfolio, American Funds Growth Allocation Portfolio and American Funds Moderate Allocation Portfolio (the “American Funds of Funds”). The Board considered the Adviser’s services as investment manager to the Portfolios, including its trading practices and oversight of transition management (as applicable), compliance program and personnel, and risk management, among other things. The Adviser’s services in coordinating and overseeing the activities of the Trusts’ service providers were also considered. The Board considered information received from the Trusts’ Chief Compliance Officer (“CCO”) regarding the Portfolios’ compliance policies and procedures that were established pursuant to Rule38a-l under the 1940 Act. The Board also noted that the Adviser’s investment, compliance and legal staff regularly review and assess the services that are provided to the Portfolios, and that personnel of the Adviser prepare and present reports to the Independent Trustees regarding material information related to those reviews and assessments. In addition, throughout the year, the Board considered the expertise, experience and performance of the personnel of the Adviser who performed the various services that are mentioned above.
BHFTII-19
Brighthouse Funds Trust II
Brighthouse Asset Allocation 20 Portfolio
Board of Trustees’ Consideration of Advisory Agreements—(Continued)
With respect to the Asset Allocation Portfolios, the Board noted that the Adviser has hired at its own expense an independent consultant to provide research and consulting services with respect to the periodic asset allocation targets for each of the Asset Allocation Portfolios and investments in other Portfolios of the Trusts (the “Underlying Portfolios”). Additionally, the Board considered that a committee, consisting of investment professionals from the Adviser, meets regularly to review the asset allocations and discuss the performance of the Asset Allocation Portfolios and the American Funds of Funds.
The Board further considered and found that the advisory fee paid to the Adviser with respect to each Asset Allocation Portfolio and American Fund of Funds was based on services provided that were in addition to, rather than duplicative of, the services provided pursuant to the advisory agreements for the Underlying Portfolios in which the Portfolio invests.
Performance. The Board placed emphasis on the performance of each Portfolio in light of, among other things, its importance to investors. The Board considered the Adviser’s quarterly reviews with the Board of detailed information about each Portfolio’s investment strategies and performance results and composition, including discussions regarding the relevant effect of current market conditions. The Board reviewed and considered the reports prepared by Broadridge, which provided a statistical analysis comparing the Portfolios’ investment performance to that of comparable funds underlying variable insurance products (the “Performance Universe”). The Independent Trustees also met separately with representatives of JDL during the October Meeting to review the JDL Report. The Board considered each Portfolio’s performance for periods subsequent to the performance period covered by the Broadridge reports, and the Adviser’s discussion of the same, including the effect of current market conditions on each Portfolio’s more recent performance. The Board focused particular attention on Portfolios with less favorable performance records. The Board also noted that while it found the data provided by Broadridge generally useful, it recognized the limitations of such data, including, in particular, that notable differences may exist between a Portfolio and those of the other funds in a Broadridge category (for example, the investment objectives(s) and investment strategies) and that the results of the performance comparisons may vary depending on (i) the end dates for the performance periods that were selected and (ii) the selection of the peer groups.
Fees and Expenses. The Board gave consideration to the level and method of computing the fees payable under the Agreements. The Board considered the Broadridge report for each of the Portfolios, which included comparisons for each Portfolio of its contractual management fees (at current and various asset levels), and total expenses, with those of its peers, including as those peers were divided into a broad group of peer funds (“Expense Universe”) and a narrower group of peer funds (“Expense Group”). Broadridge selected the peer funds which were similarly situated funds underlying variable insurance products deemed to be comparable to the Portfolios. The Independent Trustees, with the assistance of JDL, also examined the JDL Report.
The Board also considered that the Adviser had entered into expense limitation or management fee waiver agreements with certain of the Portfolios pursuant to which the Adviser had agreed to waive a portion of its advisory fee and/or reimburse certain expenses as a means of limiting a Portfolio’s total annual operating expenses.
Profitability. The Board examined the profitability to the Adviser of each Agreement on aPortfolio-by-Portfolio basis. In the case of the Asset Allocation Portfolios, the Board also considered the Adviser’s analysis of its profitability that was attributable to its management of the Underlying Portfolios of the Trust in which the Asset Allocation Portfolios invest. The Board further considered that an affiliate of the Adviser, Brighthouse Securities, LLC, serves as distributor for the Portfolios, and, as such, receives Rule12b-1 payments to support the distribution of the Portfolios. In reviewing the profitability analyses, the Board recognized that expense allocation methodologies are inherently subjective and various expense allocation methodologies may be reasonable while producing different results.
Economies of scale. The Board also considered each Portfolio’s fees in light of its size. The Board noted the fee schedules for the Portfolios that contain breakpoints that reduce the fee rate above specified asset levels. The Board noted those Portfolios that did not contain breakpoints in the advisory fee and took into account management’s discussion of the same. The Board considered the effective fees under the Advisory Agreement for each Portfolio as a percentage of assets at different asset levels and possible economies of scale that may be realized if the assets of the Portfolio grow. The Board examined, among other data, the effect of a Portfolio’s growth in size on various fee schedules and reviewed the Broadridge and JDL Reports, which compared fees among peers. The Board also generally noted that if a Portfolio’s assets increase over time, the Portfolio may realize other economies of scale if assets increase proportionally more than fixed expenses.
Other factors. The Board considered other benefits that may be realized by the Adviser and its affiliates from their relationship with the Trusts. Among them, the Board recognized that Brighthouse Securities, LLC, as the distributor for the Trusts, receives payments pursuant to Rule12b-1 from the Portfolios to compensate for the provision of shareholder services and distribution activities, which could lead to growth in the Trusts’ assets and corresponding benefits from such growth, including economies of scale. In conjunction with these considerations, the Board noted the ongoing commitment of the Adviser to the Portfolios.
BHFTII-20
Brighthouse Funds Trust II
Brighthouse Asset Allocation 20 Portfolio
Board of Trustees’ Consideration of Advisory Agreements—(Continued)
The Board requested, received, and considered information from the Adviser regarding possible conflicts of interest in the form of material benefits to the Adviser resulting from the Adviser’s affiliations and business relationships, as relevant. The Board considered the services that are provided to the Trusts by its service providers, and the manner in which any conflicts were mitigated.
* * *
Brighthouse Asset Allocation 20 Portfolio.The Board also considered the following information in relation to the Agreement with the Adviser regarding the Portfolio:
Among other data relating specifically to the Portfolio’s performance, the Board considered that the Portfolio underperformed the median of its Performance Universe for theone-year and three-year periods ended June 30, 2018, and performed equally to the median of its Performance Universe for the five-year period ended June 30, 2018. The Board also considered that the Portfolio underperformed the average of its Morningstar category for theone-, three-, and five-year periods ended June 30, 2018. The Board further considered that the Portfolio underperformed the Brighthouse AA 20 Narrow Index for theone-, three- and five-year periods ended September 30, 2018. The Board also took into account that the Portfolio outperformed the Dow Jones Conservative Index for the three-year and five-year periods ended September 30, 2018, and underperformed for theone-year period ended September 30, 2018. The Board took into account management’s discussion of the Portfolio’s performance, including prevailing market conditions.
The Board considered that the Portfolio’s actual management fees were equal to the Expense Group median and the Expense Universe median. The Board considered that the Portfolio’s total expenses (exclusive of12b-l fees) were above the Expense Group median and the Expense Universe median. The Board noted that the Portfolio’s contractual management fees were below the asset-weighted average of comparable funds at the Portfolio’s current size.
BHFTII-21
Brighthouse Funds Trust II
Brighthouse Asset Allocation 40 Portfolio
Managed by Brighthouse Investment Advisers, LLC
Portfolio Manager Commentary*
PERFORMANCE
For theone-year period ended December 31, 2018, the Class A and B shares of the Brighthouse Asset Allocation 40 Portfolio returned-4.25% and-4.40%, respectively. The Portfolio’s benchmark, the Dow Jones Moderately Conservative Index1, returned-3.15%.
MARKET ENVIRONMENT/CONDITIONS
After a great 2017 withrecord-low volatility and the strongest January stock market since 1997, investors got shaken back to reality in February when equity markets took a dive following higher-than-expected wage growth. The concern was that this would lead to higher inflation followed by additional Federal Reserve (the “Fed”) interest rate hikes, leading to an unceremonious end to the second-longest economic expansion on record. However, inflation fears soon after fizzled (at least until the end of 2018) and the Fed stayed the course, despite the Tax Cuts and Jobs Act of 2017 providing a noteworthy lift to gross domestic product (“GDP”) growth. GDP growth, incidentally, is on track to reach the highest annual level since before the2008-09 recession. However, an escalating trade war between the U.S. and many of its major trading partners sent another wave of anxiety toward the market, which responded by pulling back sharply once again.
The beginning of the year turned out to be a microcosm of the remainder of 2018. This point in the economic cycle finds many market participants scrambling for indications that the expansion will end. As such, equity markets have become irrationally sensitive to individual data points, both positive and negative, with little regard to their historic predictive power on market results. The consequence was elevated market volatility in the second quarter, driven by positive economic growth and an accommodative Fed on one side, and on the other side by negative trade war and housing market news. In the third quarter, however, equity markets rebounded as corporate profits hit a newall-time high, GDP growth for second quarter came in at 4.2%, and unemployment dropped to 3.7%—the lowest number since 1969. The result in the third quarter was the best quarterly return for the S&P 500 Index since 2013.
As we got to the fourth quarter though, sentiment turned significantly worse, and the S&P 500 Index did an about-face, delivering its worst quarterly return since 2011. Gone was the sense of confidence that the strong economy could propel equity markets ever higher. Front and center were concerns about the continued trade war escalation,mid-term election uncertainty, a housing market dampened by rising interest rates and lofty prices, and a Fed that was now deemed too hawkish by projecting two additional rate hikes in 2019, despite having raised rates 4 times in 2018 (from a target range of1.25%-1.50% to a target range of2.25%-2.5%) and despite the market volatility.
News from overseas did little to attenuate concerns on the home front. Troubling to many is the ongoing Brexit (United Kingdom’s decision to withdraw from the European Union) situation, as leaders in the U.K. struggle to agree on a deal ensuring an orderly exit from the E.U.—an exit which is scheduled to occur on March 29, 2019. Highlighting the extent of disagreement are the two votes of confidence in Prime Minister Theresa May’s leadership, held in December 2018 and January 2019, both of which she won (in the U.K., a vote of confidence is a procedure used to remove a prime minister from office). Concerns about slowing growth in China have been receiving headlines as well. Leadership in China is in the middle of a long-term plan which is designed to transition the country from a manufacturing-driven economy to a service-driven economy. More worrisome to market participants is the fact that China is also in the process of dealing with an increasingly large debt burden as that plan unfolds. The outcome of both is unclear, which has led to some increased market volatility. However, it was confidence-inspiring that China had enough wherewithal to take the foot off the brake when it saw its economic growth rates declining faster than intended.
All in all, 2018 was a difficult year for investors. The economy is growing at a healthy pace, but the main question is for how long? The uncertainty caused all the major asset classes to be down for the year except for core bonds, which managed to creep in to positive territory, barely eking out a positive return with 0.01% for the year (as measured by the Bloomberg Barclays U.S. Aggregate Bond Index). International equities were generally the worst-performing asset classes with Emerging Markets equity and Foreign Developed equity down 14.6% and 13.8% respectively, as measured by the MSCI Emerging Markets Index and the MSCI EAFE Index. U.S. Large Cap equity did significantly better but was still down 4.4% for the year as measured by the S&P 500 Index, whereas Mid Cap equity lost 9.1% and Small Cap equity lost 11.0% for the year, as measured by the Russell Mid Cap and the Russell 2000 indices, in that order.
PORTFOLIO REVIEW /PERIOD-END POSITIONING
The Brighthouse Asset Allocation 40 Portfolio invests in underlying portfolios of the Brighthouse Funds Trust I and the Brighthouse Funds Trust II to maintain a broad asset allocation of approximately 40% to equities and 60% to fixed income. Over the twelve-month period, the Portfolio lagged the Dow Jones Moderately Conservative Index. Strong performance within the Mid and Small Cap portfolios and a favorable overweight to Large Cap equity was insufficient to attenuate the combination of underperformance within Large Cap and International equities, an underweight to cash, and an overweight to equities in general—all detractors.
The contribution from the underlying fixed income portfolios to relative performance was slightly negative in 2018. The biggest contributor by far to performance was the Brighthouse/Templeton International Bond Portfolio, which outpaced its benchmark by 3.1%. The strategy’s relative outperformance during the period was primarily attributable to currency positions, notably, the portfolio’s underweight positions in the euro and the Australian dollar. Outside of currency exposure, short duration positioning in the U.S. helped returns as well. The Brighthouse/Eaton Vance Floating Rate
BHFTII-1
Brighthouse Funds Trust II
Brighthouse Asset Allocation 40 Portfolio
Managed by Brighthouse Investment Advisers, LLC
Portfolio Manager Commentary*—(Continued)
Portfolio outperformed its benchmark by 0.1%. The portfolio’s underweight to defaulted loans aided performance relative to its benchmark over the year, as did favorable security selection in Financial Services and Energy. At the other end of the spectrum was the Western Asset Management Strategic Bond Opportunities Portfolio, which lagged its benchmark by 3.8%. Portfolio performance was negatively impacted by its U.S. duration and yield curve positioning, as well as currency and emerging markets positions. During the year, corporate credit spreads widened and experienced heightened levels of volatility. As such, the portfolio’s investment grade corporate credit positions were also negative contributors to performance. Also detracting in fixed income was the Brighthouse/Franklin Low Duration Total Return Portfolio, which underperformed its benchmark by 0.9%, largely driven by Collateralized Loan Obligation positions.
Contribution from the underlying domestic equity portfolios to relative performance was negative, as strong performance by the Mid Cap and Small Cap equity portfolios was insufficient to make up for the underperformance within the Large Cap equity portfolios. Within Large Cap, the Brighthouse/Wellington Core Equity Opportunities Portfolio had a strong year, as it outperformed its benchmark by 4.7%. Strong security selection within Consumer Discretionary, Consumer Staples, and Materials sectors helped. The ClearBridge Aggressive Growth Portfolio, on the other hand, experienced considerable underperformance in 2018, falling shy of its benchmark by 4.7% for the period. The underperformance was driven by an unfavorable overweight to Energy, in addition to suboptimal security selection within Information Technology, Consumer Discretionary, and Industrials. Another laggard for the period was the Invesco Comstock Portfolio, which underperformed its benchmark by 3.7% for the year. The result was primarily due to an overweight to Energy and unfavorable security selection within Financial Services, Healthcare, and Energy. Within Mid Cap equity, only the T. Rowe Price Mid Cap Growth Portfolio outperformed its benchmark. The portfolio outpaced its benchmark by 2.7% as positive results were driven by security selection within Communication Services, Financial Services, and Materials. Within Small Cap equity, most of the managers outperformed their respective benchmarks. The strongest performer within the Small Cap equity space was the Neuberger Berman Genesis Portfolio, which outperformed its benchmark by 6.2% in 2018 as the Portfolio’s focus on higher-quality companies with higher return on equity paid off. Security selection in Healthcare, Consumer Staples, and Information Technology made the largest positive impact on relative results. The T. Rowe Price Small Cap Growth Portfolio beat its benchmark by 2.6% over the year, primarily due to beneficial security selection within Industrials, Materials, Consumer Discretionary, and Healthcare.
Non-U.S. equity was a headwind to relative performance in 2018. Most notably, the Harris Oakmark International Portfolio underperformed its benchmark by 9.9% during the year as security selection and country weightings caused returns to suffer. Performance compared to the benchmark was hurt by holdings in the U.K., Germany, and France as well as suboptimal security selection in Consumer Discretionary, Financial Services, and Industrials. The best performance in the category came from the Brighthouse/Artisan International Portfolio, which outperformed its benchmark by 3.5% in 2018. Much of the outperformance was a result of strong security selection within Technology, Materials, and Consumer Discretionary. In addition, the Brighthouse/Aberdeen Emerging Market Equity Portfolio was additive to relative results during the year, outperforming its benchmark by 0.7% as an underweight to China and positive security selection in Consumer Discretionary, Financial Services, and Technology supported returns.
Investment Committee
Brighthouse Investment Advisers, LLC
* This commentary may include statements that constitute “forward-looking statements” under the U.S. securities laws. Forward-looking statements include, among other things, projections, estimates, and information about possible or future results related to the Portfolio, market or regulatory developments. The views expressed above are not guarantees of future performance or economic results and involve certain risks, uncertainties and assumptions that could cause actual outcomes and results to differ materially from the views expressed herein. The views expressed above are subject to change at any time based upon economic, market, or other conditions and the subadvisory firm undertakes no obligation to update the views expressed herein. Any discussions of specific securities should not be considered a recommendation to buy or sell those securities. The views expressed above (including any forward-looking statement) may not be relied upon as investment advice or as an indication of the Portfolio’s trading intent. Information about the Portfolio’s holdings, asset allocation or country diversification is historical and is not an indication of future Portfolio composition, which may vary. Direct investment in any index is not possible. The performance of any index mentioned in this commentary has not been adjusted for ongoing management, distribution and operating expenses, and sales charges applicable to mutual fund investments. In addition, the returns do not reflect additional fees charged by separate accounts or variable insurance contracts that an investor in the Portfolio may pay. If these additional fees were reflected, performance would have been lower.
BHFTII-2
Brighthouse Funds Trust II
Brighthouse Asset Allocation 40 Portfolio
A $10,000 INVESTMENT COMPARED TO THE DOW JONES MODERATELY CONSERVATIVE INDEX
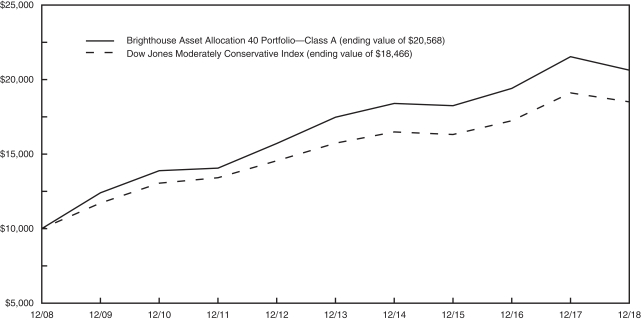
AVERAGE ANNUAL RETURNS (%) (FOR THE YEAR ENDED DECEMBER 31, 2018)
| | | | | | | | | | | | |
| | | | |
| | | 1 Year | | | 5 Year | | | 10 Year | |
| Brighthouse Asset Allocation 40 Portfolio | | | | | | | | | | | | |
Class A | | | -4.25 | | | | 3.35 | | | | 7.48 | |
Class B | | | -4.40 | | | | 3.10 | | | | 7.22 | |
| Dow Jones Moderately Conservative Index | | | -3.15 | | | | 3.30 | | | | 6.33 | |
1 The Dow Jones Moderately Conservative Index is a total return index designed to provide asset allocation strategists with a target risk benchmark. Each month, the Index adjusts its weighting of stocks, bonds, and cash indices (both domestic and foreign) such that the risk combination will have 40% of the risk of an all equity portfolio.
Portfolio performance is calculated including reinvestment of all income and capital gain distributions. Performance numbers are net of all Portfolio expenses but do not include any insurance, sales, separate account or administrative charges of variable annuity or life insurance contracts or any additional expenses that participants may bear relating to the operations of their plans. If these charges were included, the returns would be lower. The performance of any index referenced above has not been adjusted for ongoing management, distribution and operating expenses, and sales charges applicable to mutual fund investments. Direct investment in any index is not possible. The performance of Class A shares, as set forth in the line graph above, will differ from that of other classes because of the difference in expenses paid by policyholders investing in the different share classes.
This information represents past performance and is not indicative of future results. Investment return and principal value may fluctuate so that shares, upon redemption, may be worth more or less than the original cost.
PORTFOLIO COMPOSITION AS OF DECEMBER 31, 2018
Top Holdings
| | | | |
| | | % of
Net Assets | |
| BlackRock Bond Income Portfolio (Class A) | | | 10.0 | |
| PIMCO Total Return Portfolio (Class A) | | | 9.5 | |
| Western Asset Management U.S. Government Portfolio (Class A) | | | 8.4 | |
| TCW Core Fixed Income Portfolio (Class A) | | | 7.9 | |
| JPMorgan Core Bond Portfolio (Class A) | | | 6.9 | |
| PIMCO Inflation Protected Bond Portfolio (Class A) | | | 6.3 | |
| Western Asset Management Strategic Bond Opportunities Portfolio (Class A) | | | 4.2 | |
| MFS Value Portfolio (Class A) | | | 3.8 | |
| Brighthouse/Wellington Core Equity Opportunities Portfolio (Class A) | | | 3.6 | |
| T. Rowe Price Large Cap Value Portfolio (Class A) | | | 3.3 | |
Asset Allocation
| | | | |
| | | % of
Net Assets | |
| Investment Grade Fixed Income | | | 52.1 | |
| U.S. Large Cap Equities | | | 21.2 | |
| International Developed Market Equities | | | 8.6 | |
| High Yield Fixed Income | | | 6.7 | |
| U.S. Small Cap Equities | | | 3.2 | |
| International Fixed Income | | | 3.1 | |
| Global Equities | | | 2.5 | |
| Emerging Market Equities | | | 1.0 | |
| U.S. Mid Cap Equities | | | 0.9 | |
| Real Estate Equities | | | 0.7 | |
BHFTII-3
Brighthouse Funds Trust II
Brighthouse Asset Allocation 40 Portfolio
Understanding Your Portfolio’s Expenses
Shareholder Expense Example
As a shareholder of the Portfolio, you incur ongoing costs, including management fees; distribution and service(12b-1) fees; and other Portfolio expenses. This example is intended to help you understand your ongoing costs (in dollars) (referred to as “expenses”) of investing in the Portfolio and compare these costs with the ongoing costs of investing in other mutual funds. The example is based on an investment of $1,000 invested at the beginning of the period and held for the entire period, July 1, 2018 through December 31, 2018.
Actual Expenses
The first line for each share class of the Portfolio in the table below provides information about actual account values and actual expenses. You may use the information in this line, together with the amount you invested in the particular share class of the Portfolio, to estimate the expenses that you paid over the period. Simply divide your account value by $1,000 (for example, an $8,600 account value divided by $1,000 = 8.6), then multiply the result by the number in the first line under the heading entitled “Expenses Paid During Period” to estimate the expenses you paid on your account during this period.
Hypothetical Example for Comparison Purposes
The second line for each share class of the Portfolio in the table below provides information about hypothetical account values and hypothetical expenses based on the Portfolio’s actual expense ratio and an assumed rate of return of 5% per year before expenses, which is not the Portfolio’s actual return. The hypothetical account values and expenses may not be used to estimate the actual ending account balance or expenses you paid for the period. You may use this information to compare the ongoing costs of investing in the Portfolio and other funds. To do so, compare this 5% hypothetical example with the 5% hypothetical examples that appear in the shareholder reports of the other funds.
Please note that the expenses shown in the table are meant to highlight your ongoing costs only and do not reflect any fees or charges of your variable insurance product or any additional expenses that participants in certain eligible qualified plans may bear relating to the operations of their plan. Therefore, the second line for each share class in the table is useful in comparing ongoing costs only, and will not help you determine the relative total costs of owning different funds. In addition, if these other costs were included, your costs would have been higher.
| | | | | | | | | | | | | | | | | | |
Brighthouse Asset Allocation 40 Portfolio
| | | | Annualized
Expense
Ratio | | | Beginning
Account Value
July 1,
2018 | | | Ending
Account Value
December 31,
2018 | | | Expenses Paid
During Period**
July 1, 2018
to
December 31,
2018 | |
Class A (a) | | Actual | | | 0.60 | % | | $ | 1,000.00 | | | $ | 959.30 | | | $ | 2.96 | |
| | Hypothetical* | | | 0.60 | % | | $ | 1,000.00 | | | $ | 1,022.18 | | | $ | 3.06 | |
| | | | | |
Class B (a) | | Actual | | | 0.85 | % | | $ | 1,000.00 | | | $ | 958.90 | | | $ | 4.20 | |
| | Hypothetical* | | | 0.85 | % | | $ | 1,000.00 | | | $ | 1,020.92 | | | $ | 4.33 | |
| * | Hypothetical assumes a rate of return of 5% per year before expenses. |
| ** | Expenses paid are equal to the Portfolio’s annualized expense ratio for the most recent six month period, as shown above, multiplied by the average account value over the period, multiplied by the number of days (184 days) in the most recent fiscal half-year, divided by 365 (to reflect theone-half year period). |
| (a) | The annualized expense ratio reflects the expenses of both the Portfolio and the Underlying Portfolios in which it invests. |
BHFTII-4
Brighthouse Funds Trust II
Brighthouse Asset Allocation 40 Portfolio
Schedule of Investments as of December 31, 2018
Mutual Funds—100.0% of Net Assets
| | | | | | | | |
| Security Description | | Shares | | | Value | |
|
| Affiliated Investment Companies—100.0% | |
Baillie Gifford International Stock Portfolio (Class A) (a) | | | 12,636,754 | | | $ | 139,257,024 | |
BlackRock Bond Income Portfolio (Class A) (a) | | | 5,184,673 | | | | 533,710,269 | |
BlackRock Capital Appreciation Portfolio (Class A) (a) | | | 2,244,670 | | | | 87,160,546 | |
BlackRock High Yield Portfolio (Class A) (b) | | | 3,744,378 | | | | 27,146,742 | |
Brighthouse Small Cap Value Portfolio (Class A) (b) | | | 2,626,838 | | | | 35,567,385 | |
Brighthouse/Aberdeen Emerging Markets Equity Portfolio (Class A) (b) | | | 5,735,931 | | | | 54,720,784 | |
Brighthouse/Artisan International Portfolio (Class A) (b) | | | 10,297,149 | | | | 101,941,774 | |
Brighthouse/Artisan Mid Cap Value Portfolio (Class A) (a) | | | 57,859 | | | | 12,257,347 | |
Brighthouse/Eaton Vance Floating Rate Portfolio (Class A) (b) | | | 10,853,206 | | | | 108,532,056 | |
Brighthouse/Franklin Low Duration Total Return Portfolio (Class A) (b) | | | 17,563,811 | | | | 166,680,563 | |
Brighthouse/Templeton International Bond Portfolio (Class A) (b) (c) | | | 16,259,457 | | | | 166,009,059 | |
Brighthouse/Wellington Core Equity Opportunities Portfolio (Class A) (a) | | | 6,480,131 | | | | 194,468,723 | |
Brighthouse/Wellington Large Cap Research Portfolio (Class A) (b) | | | 8,511,904 | | | | 112,272,012 | |
Clarion Global Real Estate Portfolio (Class A) (b) | | | 3,715,884 | | | | 39,834,280 | |
ClearBridge Aggressive Growth Portfolio (Class A) (b) | | | 3,031,176 | | | | 49,286,917 | |
Harris Oakmark International Portfolio (Class A) (b) | | | 12,068,941 | | | | 146,758,327 | |
Invesco Comstock Portfolio (Class A) (b) | | | 11,929,458 | | | | 158,184,609 | |
Invesco Small Cap Growth Portfolio (Class A) (b) | | | 1,867,112 | | | | 23,376,242 | |
Jennison Growth Portfolio (Class A) (a) | | | 4,262,737 | | | | 61,809,689 | |
JPMorgan Core Bond Portfolio (Class A) (b) | | | 36,522,424 | | | | 365,954,687 | |
JPMorgan Small Cap Value Portfolio (Class A) (b) | | | 2,514,793 | | | | 35,609,472 | |
MFS Research International Portfolio (Class A) (b) | | | 7,044,809 | | | | 76,013,485 | |
MFS Value Portfolio (Class A) (a) | | | 14,634,475 | | | | 202,102,099 | |
Neuberger Berman Genesis Portfolio (Class A) (a) | | | 1,312,340 | | | | 24,357,032 | |
|
| Affiliated Investment Companies—(Continued) | |
Oppenheimer Global Equity Portfolio (Class A) (b) | | | 2,414,183 | | | | 49,370,040 | |
PIMCO Inflation Protected Bond Portfolio (Class A) (b) | | | 34,929,298 | | | | 334,273,380 | |
PIMCO Total Return Portfolio (Class A) (b) | | | 44,314,158 | | | | 504,738,262 | |
T. Rowe Price Large Cap Growth Portfolio (Class A) (a) | | | 4,278,186 | | | | 88,601,222 | |
T. Rowe Price Large Cap Value Portfolio (Class A) (b) | | | 6,195,953 | | | | 177,452,100 | |
T. Rowe Price Mid Cap Growth Portfolio (Class A) (b) | | | 2,503,071 | | | | 25,506,291 | |
T. Rowe Price Small Cap Growth Portfolio (Class A) (a) | | | 2,244,310 | | | | 47,646,700 | |
TCW Core Fixed Income Portfolio (Class A) (b) | | | 42,315,541 | | | | 422,309,103 | |
Van Eck Global Natural Resources Portfolio (Class A) (a) | | | 11,133,678 | | | | 85,506,644 | |
Wells Capital Management Mid Cap Value Portfolio (Class A) (b) | | | 1,260,351 | | | | 12,553,092 | |
Western Asset Management Strategic Bond Opportunities Portfolio (Class A) (a) | | | 17,501,800 | | | | 221,922,821 | |
Western Asset Management U.S. Government Portfolio (Class A) (a) | | | 39,067,470 | | | | 448,885,227 | |
| | | | | | | | |
Total Mutual Funds
(Cost $5,573,083,870) | | | | | | | 5,341,776,005 | |
| | | | | | | | |
Total Investments—100.0%
(Cost $5,573,083,870) | | | | | | | 5,341,776,005 | |
Other assets and liabilities (net)—0.0% | | | | | | | (1,649,831 | ) |
| | | | | | | | |
| Net Assets—100.0% | | | | | | $ | 5,340,126,174 | |
| | | | | | | | |
| | | | |
| (a) | | A Portfolio of Brighthouse Funds Trust II. (See Note 6 of the Notes to Financial Statements for a summary of transactions in the securities of affiliated issuers.) |
| (b) | | A Portfolio of Brighthouse Funds Trust I. (See Note 6 of the Notes to Financial Statements for a summary of transactions in the securities of affiliated issuers.) |
| (c) | | Non-income producing security. |
Fair Value Hierarchy
Accounting principles generally accepted in the United States of America (“GAAP”) define fair market value as the price that the Portfolio would receive to sell an asset or pay to transfer a liability in an orderly transaction between market participants at the measurement date. It establishes a fair value hierarchy that prioritizes inputs to valuation methods and requires disclosure of the fair value hierarchy, separately for each major category of assets and liabilities, that segregates fair value measurements into three levels. Levels 1, 2 and 3 of the fair value hierarchy are defined as follows:
Level 1 - unadjusted quoted prices in active markets for identical investments
Level 2 - other significant observable inputs (including, but not limited to, quoted prices for similar assets or liabilities in markets that are either active or inactive; inputs other than quoted prices that are observable such as interest rates, yield curves, volatilities, prepayment speeds, loss severities, credit risks, default rates, or other market corroborated inputs)
Level 3 - significant unobservable inputs based on the best information available in the circumstances, to the extent observable inputs are unavailable (including the Portfolio’s own assumptions used in determining the fair value of investments and derivative financial instruments)
The inputs or methodologies used for valuing investments are not necessarily an indication of the risk associated with investing in them. Changes to the inputs or methodologies used may result in transfers between levels. A reconciliation of Level 3 securities, if any, will be disclosed following the fair value hierarchy table. For more information about the Portfolio’s policy regarding the valuation of investments, please refer to the Notes to Financial Statements.
The following table summarizes the fair value hierarchy of the Portfolio’s investments as of December 31, 2018:
| | | | | | | | | | | | | | | | |
| Description | | Level 1 | | | Level 2 | | | Level 3 | | | Total | |
| Mutual Funds | |
Affiliated Investment Companies | | $ | 5,341,776,005 | | | $ | — | | | $ | — | | | $ | 5,341,776,005 | |
Total Investments | | $ | 5,341,776,005 | | | $ | — | | | $ | — | | | $ | 5,341,776,005 | |
| | | | | | | | | | | | | | | | | |
See accompanying notes to financial statements.
BHFTII-5
Brighthouse Funds Trust II
Brighthouse Asset Allocation 40 Portfolio
Statement of Assets and Liabilities
December 31, 2018
| | | | |
Assets | |
Affiliated investments at value (a) | | $ | 5,341,776,005 | |
Receivable for: | |
Affiliated investments sold | | | 1,898,849 | |
Fund shares sold | | | 110,124 | |
| | | | |
Total Assets | | | 5,343,784,978 | |
Liabilities | |
Payables for: | |
Fund shares redeemed | | | 2,008,974 | |
Accrued Expenses: | |
Management fees | | | 261,621 | |
Distribution and service fees | | | 1,133,226 | |
Deferred trustees’ fees | | | 195,795 | |
Other expenses | | | 59,188 | |
| | | | |
Total Liabilities | | | 3,658,804 | |
| | | | |
Net Assets | | $ | 5,340,126,174 | |
| | | | |
Net Assets Consist of: | |
Paid in surplus | | $ | 5,225,822,915 | |
Distributable earnings (Accumulated losses) | | | 114,303,259 | |
| | | | |
Net Assets | | $ | 5,340,126,174 | |
| | | | |
Net Assets | |
Class A | | $ | 71,896,145 | |
Class B | | | 5,268,230,029 | |
Capital Shares Outstanding* | |
Class A | | | 6,623,981 | |
Class B | | | 490,582,326 | |
Net Asset Value, Offering Price and Redemption Price Per Share | |
Class A | | $ | 10.85 | |
Class B | | | 10.74 | |
| | | | |
| * | | The Portfolio is authorized to issue an unlimited number of shares. |
| (a) | | Identified cost of affiliated investments was $5,573,083,870. |
Statement of Operations
Year Ended December 31, 2018
| | | | |
Investment Income | |
Dividends from affiliated investments | | $ | 126,419,085 | |
| | | | |
Total investment income | | | 126,419,085 | |
Expenses | |
Management fees | | | 3,388,804 | |
Administration fees | | | 26,349 | |
Custodian and accounting fees | | | 28,054 | |
Distribution and service fees—Class B | | | 14,867,467 | |
Audit and tax services | | | 32,224 | |
Legal | | | 45,317 | |
Trustees’ fees and expenses | | | 33,734 | |
Miscellaneous | | | 13,148 | |
| | | | |
Total expenses | | | 18,435,097 | |
| | | | |
Net Investment Income | | | 107,983,988 | |
| | | | |
Net Realized and Unrealized Gain (Loss) | |
| Net realized gain on: | |
Affiliated investments | | | 111,222,097 | |
Capital gain distributions from affiliated investments | | | 166,883,634 | |
| | | | |
Net realized gain | | | 278,105,731 | |
| | | | |
Net change in unrealized depreciation on affiliated investments | | | (637,581,474 | ) |
| | | | |
Net realized and unrealized loss | | | (359,475,743 | ) |
| | | | |
Net Decrease in Net Assets From Operations | | $ | (251,491,755 | ) |
| | | | |
See accompanying notes to financial statements.
BHFTII-6
Brighthouse Funds Trust II
Brighthouse Asset Allocation 40 Portfolio
Statements of Changes in Net Assets
| | | | | | | | |
| | | Year Ended
December 31,
2018 | | | Year Ended
December 31,
2017 | |
Increase (Decrease) in Net Assets: | |
From Operations | |
Net investment income | | $ | 107,983,988 | | | $ | 113,633,377 | |
Net realized gain | | | 278,105,731 | | | | 192,716,050 | |
Net change in unrealized appreciation (depreciation) | | | (637,581,474 | ) | | | 377,130,095 | |
| | | | | | | | |
Increase (decrease) in net assets from operations | | | (251,491,755 | ) | | | 683,479,522 | |
| | | | | | | | |
From Distributions to Shareholders(a) | |
Class A | | | (4,220,610 | ) | | | (4,512,999 | ) |
Class B | | | (298,083,813 | ) | | | (333,555,859 | ) |
| | | | | | | | |
Total distributions | | | (302,304,423 | ) | | | (338,068,858 | ) |
| | | | | | | | |
Decrease in net assets from capital share transactions | | | (639,583,107 | ) | | | (633,085,723 | ) |
| | | | | | | | |
Total decrease in net assets | | | (1,193,379,285 | ) | | | (287,675,059 | ) |
|
Net Assets | |
Beginning of period | | | 6,533,505,459 | | | | 6,821,180,518 | |
| | | | | | | | |
End of period | | $ | 5,340,126,174 | | | $ | 6,533,505,459 | (b) |
| | | | | | | | |
Other Information:
Capital Shares
Transactions in capital shares were as follows:
| | | | | | | | | | | | | | | | |
| | | Year Ended
December 31, 2018 | | | Year Ended
December 31, 2017 | |
| | | Shares | | | Value | | | Shares | | | Value | |
Class A | |
Sales | | | 428,778 | | | $ | 4,993,500 | | | | 599,667 | | | $ | 7,005,410 | |
Reinvestments | | | 370,554 | | | | 4,220,610 | | | | 396,921 | | | | 4,512,999 | |
Redemptions | | | (1,324,000 | ) | | | (15,273,783 | ) | | | (1,857,552 | ) | | | (21,746,447 | ) |
| | | | | | | | | | | | | | | | |
Net decrease | | | (524,668 | ) | | $ | (6,059,673 | ) | | | (860,964 | ) | | $ | (10,228,038 | ) |
| | | | | | | | | | | | | | | | |
Class B | |
Sales | | | 4,016,490 | | | $ | 46,082,631 | | | | 4,797,937 | | | $ | 55,532,011 | |
Reinvestments | | | 26,425,870 | | | | 298,083,813 | | | | 29,596,793 | | | | 333,555,859 | |
Redemptions | | | (85,161,873 | ) | | | (977,689,878 | ) | | | (87,555,984 | ) | | | (1,011,945,555 | ) |
| | | | | | | | | | | | | | | | |
Net decrease | | | (54,719,513 | ) | | $ | (633,523,434 | ) | | | (53,161,254 | ) | | $ | (622,857,685 | ) |
| | | | | | | | | | | | | | | | |
Decrease derived from capital shares transactions | | | | | | $ | (639,583,107 | ) | | | | | | $ | (633,085,723 | ) |
| | | | | | | | | | | | | | | | |
| | | | | | |
| (a) | | Distributions from net investment income and realized gains are no longer required to be separately disclosed. The presentation for the year ended December 31, 2018 has been adjusted for this change (See Note 9). At December 31, 2017 the distributions were as follows. |
| | | | | | | | |
| | | Distributions from net
investment income: | | | Distributions from realized
capital gains: | |
Class A | | $ | (1,894,168 | ) | | $ | (2,618,831 | ) |
Class B | | | (129,964,072 | ) | | | (203,591,787 | ) |
| | | | | | |
| (b) | | As part of the update in (a), it is also no longer required to disclose the Undistributed net investment income (Accumulated losses) which was $119,849,813 as of December 31, 2017. |
See accompanying notes to financial statements.
BHFTII-7
Brighthouse Funds Trust II
Brighthouse Asset Allocation 40 Portfolio
Financial Highlights
| | | | | | | | | | | | | | | | | | | | |
| Selected per share data | | | |
| | | Class A | |
| | | Year Ended December 31, | |
| | | 2018 | | | 2017 | | | 2016 | | | 2015 | | | 2014 | |
Net Asset Value, Beginning of Period | | $ | 11.95 | | | $ | 11.36 | | | $ | 11.90 | | | $ | 12.74 | | | $ | 12.99 | |
| | | | | | | | | | | | | | | | | | | | |
Income (Loss) from Investment Operations | |
Net investment income (a) | | | 0.24 | | | | 0.22 | | | | 0.23 | | | | 0.36 | | | | 0.24 | |
Net realized and unrealized gain (loss) | | | (0.72 | ) | | | 1.00 | | | | 0.48 | | | | (0.44 | ) | | | 0.40 | |
| | | | | | | | | | | | | | | | | | | | |
Total income (loss) from investment operations | | | (0.48 | ) | | | 1.22 | | | | 0.71 | | | | (0.08 | ) | | | 0.64 | |
| | | | | | | | | | | | | | | | | | | | |
Less Distributions | |
Distributions from net investment income | | | (0.27 | ) | | | (0.26 | ) | | | (0.46 | ) | | | (0.06 | ) | | | (0.41 | ) |
Distributions from net realized capital gains | | | (0.35 | ) | | | (0.37 | ) | | | (0.79 | ) | | | (0.70 | ) | | | (0.48 | ) |
| | | | | | | | | | | | | | | | | | | | |
Total distributions | | | (0.62 | ) | | | (0.63 | ) | | | (1.25 | ) | | | (0.76 | ) | | | (0.89 | ) |
| | | | | | | | | | | | | | | | | | | | |
Net Asset Value, End of Period | | $ | 10.85 | | | $ | 11.95 | | | $ | 11.36 | | | $ | 11.90 | | | $ | 12.74 | |
| | | | | | | | | | | | | | | | | | | | |
Total Return (%) (b) | | | (4.25 | ) | | | 11.01 | | | | 6.33 | | | | (0.78 | ) | | | 5.16 | |
| | | | | |
Ratios/Supplemental Data | | | | | | | | | | | | | | | | | | | | |
Ratio of expenses to average net assets (%) (c) | | | 0.06 | | | | 0.06 | | | | 0.06 | | | | 0.06 | | | | 0.06 | |
Ratio of net investment income to average net assets (%) (d) | | | 2.04 | | | | 1.91 | | | | 1.97 | | | | 2.85 | | | | 1.92 | |
Portfolio turnover rate (%) | | | 8 | | | | 6 | | | | 8 | | | | 16 | | | | 15 | |
Net assets, end of period (in millions) | | $ | 71.9 | | | $ | 85.4 | | | $ | 91.0 | | | $ | 102.6 | | | $ | 112.9 | |
| |
| | | Class B | |
| | | Year Ended December 31, | |
| | | 2018 | | | 2017 | | | 2016 | | | 2015 | | | 2014 | |
Net Asset Value, Beginning of Period | | $ | 11.82 | | | $ | 11.25 | | | $ | 11.79 | | | $ | 12.64 | | | $ | 12.89 | |
| | | | | | | | | | | | | | | | | | | | |
Income (Loss) from Investment Operations | |
Net investment income (a) | | | 0.21 | | | | 0.20 | | | | 0.19 | | | | 0.32 | | | | 0.03 | |
Net realized and unrealized gain (loss) | | | (0.71 | ) | | | 0.97 | | | | 0.49 | | | | (0.43 | ) | | | 0.57 | |
| | | | | | | | | | | | | | | | | | | | |
Total income (loss) from investment operations | | | (0.50 | ) | | | 1.17 | | | | 0.68 | | | | (0.11 | ) | | | 0.60 | |
| | | | | | | | | | | | | | | | | | | | |
Less Distributions | |
Distributions from net investment income | | | (0.23 | ) | | | (0.23 | ) | | | (0.43 | ) | | | (0.04 | ) | | | (0.37 | ) |
Distributions from net realized capital gains | | | (0.35 | ) | | | (0.37 | ) | | | (0.79 | ) | | | (0.70 | ) | | | (0.48 | ) |
| | | | | | | | | | | | | | | | | | | | |
Total distributions | | | (0.58 | ) | | | (0.60 | ) | | | (1.22 | ) | | | (0.74 | ) | | | (0.85 | ) |
| | | | | | | | | | | | | | | | | | | | |
Net Asset Value, End of Period | | $ | 10.74 | | | $ | 11.82 | | | $ | 11.25 | | | $ | 11.79 | | | $ | 12.64 | |
| | | | | | | | | | | | | | | | | | | | |
Total Return (%) (b) | | | (4.40 | ) | | | 10.64 | | | | 6.09 | | | | (1.07 | ) | | | 4.93 | |
| | | | | |
Ratios/Supplemental Data | | | | | | | | | | | | | | | | | | | | |
Ratio of expenses to average net assets (%) (c) | | | 0.31 | | | | 0.31 | | | | 0.31 | | | | 0.31 | | | | 0.31 | |
Ratio of net investment income to average net assets (%) (d) | | | 1.79 | | | | 1.70 | | | | 1.71 | | | | 2.62 | | | | 0.21 | |
Portfolio turnover rate (%) | | | 8 | | | | 6 | | | | 8 | | | | 16 | | | | 15 | |
Net assets, end of period (in millions) | | $ | 5,268.2 | | | $ | 6,448.1 | | | $ | 6,730.2 | | | $ | 7,152.6 | | | $ | 8,304.3 | |
| | | | |
| (a) | | Per share amounts based on average shares outstanding during the period. |
| (b) | | Total return does not reflect any insurance, sales, separate account or administrative charges of variable annuity or life insurance contracts or any additional expenses that contract owners may bear under their variable contracts. If these charges were included, the returns would be lower. |
| (c) | | The ratio of operating expenses to average net assets does not include expenses of the Underlying Portfolios in which the Asset Allocation Portfolio invests. |
| (d) | | Recognition of net investment income by the Asset Allocation Portfolio is affected by the timing of the declaration of dividends by the Underlying Portfolios in which it invests. |
See accompanying notes to financial statements.
BHFTII-8
Brighthouse Funds Trust II
Brighthouse Asset Allocation 40 Portfolio
Notes to Financial Statements—December 31, 2018
1. Organization
Brighthouse Funds Trust II (the “Trust”) is organized as a Delaware statutory trust and registered under the Investment Company Act of 1940, as amended (the “1940 Act”), as anopen-end management investment company. The Trust, which is managed by Brighthouse Investment Advisers, LLC (“Brighthouse Investment Advisers” or the “Adviser”), currently offers twenty-nine series, each of which operates as a distinct investment vehicle of the Trust. The series included in this report is Brighthouse Asset Allocation 40 Portfolio (the “Asset Allocation Portfolio”), which is diversified. The Asset Allocation Portfolio operates under a “fund of funds” structure, investing substantially all of its assets in other Portfolios advised by Brighthouse Investment Advisers (each, an “Underlying Portfolio,” and, collectively, the “Underlying Portfolios”). Shares of the Portfolio are not offered directly to the general public and are currently available only to separate accounts of insurance companies, including insurance companies affiliated with the Adviser (together, the “Insurance Companies”).
The Asset Allocation Portfolio has registered and offers two classes of shares: Class A and B shares. Shares of each Class of the Asset Allocation Portfolio represent an equal pro rata interest in the Asset Allocation Portfolio and generally give the shareholder the same voting, dividend, liquidation, and other rights. Investment income, realized and unrealized capital gains and losses, the common expenses of the Asset Allocation Portfolio, and certain Asset Allocation Portfolio-level expense reductions, if any, are allocated on a pro rata basis to each Class based on the relative net assets of each Class to the net assets of the Asset Allocation Portfolio. Each Class of shares differs in its respective distribution plan and such distribution expenses are allocated to the corresponding Class of shares.
2. Significant Accounting Policies
The preparation of financial statements in conformity with accounting principles generally accepted in the United States of America (“GAAP”) requires management to make estimates and assumptions that affect the reported amounts of assets and liabilities and disclosure of contingent assets and liabilities as of the date of the financial statements and the reported amounts of income and expenses during the reporting period. Actual results could differ from those estimates. In the preparation of these financial statements, management has evaluated events and transactions subsequent to December 31, 2018 through the date the financial statements were issued.
The Asset Allocation Portfolio is an investment company and follows the accounting and reporting guidance of the Financial Accounting Standards Board (“FASB”) Accounting Standards Codification Topic 946—Financial Services—Investment Companies. The following is a summary of significant accounting policies consistently followed by the Asset Allocation Portfolio in the preparation of its financial statements.
Investment Valuation and Fair Value Measurements - The Asset Allocation Portfolio values its portfolio investments for purposes of calculating its net asset value (“NAV”) using procedures approved by the Board of Trustees of the Trust (the “Board” or “Trustees”). Those procedures allow for a variety of methodologies to be used to value the Asset Allocation Portfolio’s investments. The specific methodologies used for a particular investment may vary based on the market data available for a specific investment at the time the Asset Allocation Portfolio calculates its NAV or based on other considerations. The procedures also permit a level of judgment to be used in the valuation process. The Asset Allocation Portfolio follows the accounting and reporting guidance of FASB Accounting Standards Codification Topic 820—Fair Value Measurement.
Investments in the Underlying Portfolios are valued at their closing daily NAV on the valuation date. Investments in the Underlying Portfolios are categorized as Level 1 within the fair value hierarchy. For information about the use of fair value pricing by the Underlying Portfolios, please refer to the prospectuses of the Underlying Portfolios.
Investment Transactions and Related Investment Income -The Asset Allocation Portfolio’s security transactions are recorded on the trade date. Dividend income is recorded on theex-dividend date. Interest income is recorded on the accrual basis. Realized gains and losses on investments and unrealized appreciation and depreciation are determined on the identified cost basis, which is the same basis used for federal income tax purposes. Capital gains distributions received from the Underlying Portfolios are recorded as net realized gain in the Statement of Operations.
Dividends and Distributions to Shareholders -The Asset Allocation Portfolio records dividends and distributions on theex-dividend date. Net realized gains from securities transactions (if any) are generally distributed annually to shareholders. The timing and characterization of certain income and capital gains distributions are determined in accordance with federal tax regulations that may differ from GAAP. Permanent book and tax basis differences relating to shareholder distributions will result in reclassification between distributable earnings (accumulated losses) andpaid-in surplus. These adjustments have no impact on net assets or the results of operations.
Income Taxes -It is the Asset Allocation Portfolio’s policy to comply with the requirements of the Internal Revenue Code of 1986, as amended, and regulations thereunder, applicable to regulated investment companies, and to distribute, with respect to each taxable year, all of its taxable income to shareholders. Therefore, no federal income tax provision is required. The Asset Allocation Portfolio
BHFTII-9
Brighthouse Funds Trust II
Brighthouse Asset Allocation 40 Portfolio
Notes to Financial Statements—December 31, 2018—(Continued)
files U.S. federal tax returns. No income tax returns are currently under examination. The Asset Allocation Portfolio’s federal tax returns for the prior three fiscal years remain subject to examination by the Internal Revenue Service. As of December 31, 2018, the Asset Allocation Portfolio had no uncertain tax positions that would require financial statement recognition, or derecognition or disclosure.
3. Certain Risks
In the normal course of business, the Underlying Portfolios invest in securities and enter into transactions where risks exist. Those risks include:
Market Risk:The value of securities held by the Underlying Portfolios may decline in response to certain events, including those directly involving the issuers whose securities are owned by the Underlying Portfolios; conditions affecting the general economy; overall market changes; local, regional or global political, social or economic instability; and currency, interest rate, and price fluctuations.
Credit and Counterparty Risk: The Underlying Portfolios may be exposed to counterparty risk, or the risk that an entity with which the Underlying Portfolios have unsettled or open transactions may default. The potential loss could exceed the value of the financial assets and liabilities recorded in the financial statements. Financial assets that potentially expose the Underlying Portfolios to credit and counterparty risk consist principally of cash due from counterparties and investments. The Underlying Portfolios manage counterparty risk by entering into agreements only with counterparties that they believe have the financial resources to honor their obligations and by monitoring the financial stability of those counterparties. The Adviser attempts to mitigate counterparty risk by (i) periodically assessing the creditworthiness of their trading partners, (ii) monitoring and/or limiting the amount of their net exposure to each individual counterparty based on the adviser’s assessment, and (iii) requiring collateral from the counterparty for certain transactions. In order to preserve certain safeguards fornon-standard settlement trades, the Underlying Portfolios restrict their exposure to credit and counterparty losses by entering into master netting agreements (“Master Agreements”) with counterparties (approved brokers) with whom the Underlying Portfolios undertake a significant volume of transactions. Master Agreements govern the terms of certain transactions, and reduce the counterparty risk associated with relevant transactions by specifying credit protection mechanisms and providing standardization that improves legal certainty. Master Agreements can also help limit counterparty risk by specifying collateral posting arrangements atpre-arranged exposure levels.
The Asset Allocation Portfolio’s prospectus includes a discussion of the principal risks of investing in the Asset Allocation Portfolio and in the Underlying Portfolios in which it invests.
4. Investment Transactions
Aggregate cost of purchases and proceeds of sales of shares of the Underlying Portfolios by the Asset Allocation Portfolio for the year ended December 31, 2018 were as follows:
| | | | | | | | | | | | |
Purchases | | | Sales | |
U.S. Government | | Non-U.S. Government | | | U.S. Government | | | Non-U.S. Government | |
| $0 | | $ | 475,473,762 | | | $ | 0 | | | $ | 1,142,782,555 | |
5. Investment Management Fees and Other Transactions with Affiliates
Investment Management Agreement - Brighthouse Investment Advisers is the investment adviser to the Asset Allocation Portfolio. The Trust has entered into an investment management agreement with Brighthouse Investment Advisers with respect to the Asset Allocation Portfolio. For providing investment management services to the Asset Allocation Portfolio, Brighthouse Investment Advisers receives monthly compensation at the following annual rates:
| | | | | | |
Management
Fees earned by
Brighthouse
Investment Advisers
for the year ended
December 31, 2018 | | % per annum | | | Average Daily Net Assets |
| $3,388,804 | | | 0.100 | % | | Of the first $500 million |
| | | 0.075 | % | | Of the next $500 million |
| | | 0.050 | % | | On amounts in excess of $1 billion |
In addition to the above management fee paid to Brighthouse Investment Advisers, the Asset Allocation Portfolio indirectly pays Brighthouse Investment Advisers an investment advisory fee through its investments in the Underlying Portfolios.
Certain officers and trustees of the Trust may also be officers of Brighthouse Investment Advisers however, such officers and trustees receive no compensation from the Trust.
BHFTII-10
Brighthouse Funds Trust II
Brighthouse Asset Allocation 40 Portfolio
Notes to Financial Statements—December 31, 2018—(Continued)
Transfer Agency Agreement -Brighthouse Financial, Inc. serves as the transfer agent for the Trust. Brighthouse Financial, Inc. receives no fees for its services to the Trust.
Distribution and Service Fees -The Trust has a distribution agreement with Brighthouse Securities, LLC (the “Distributor”) pursuant to which the Distributor serves as the general distributor of shares of each class (each a “Class”) of each Portfolio. The Distributor is an affiliate of the Trust. The Trust has adopted a Distribution and Services Plan (the “Plan”) relating to Class B shares of each Portfolio, under Rule 12b-1 under the 1940 Act, pursuant to which the Trust may pay the Distributor a fee (the “Service Fee”) at an annual rate not to exceed 0.25% of each such Portfolio’s average daily net assets attributable to the Class B shares of the Trust. Each Portfolio may not offer shares of each Class. The Plan also authorizes the Trust, on behalf of each of its Portfolios, may pay the Distributor a distribution Fee (the “Distribution Fee” and together with the Service Fee, the “Fees”) at an annual rate of up to 0.25% of each Portfolio’s average daily net assets attributable to the Class B in consideration of the services rendered in connection with the sale of such shares by the Distributor. Under the Distribution Agreement with respect to the Trust, Fees are currently paid at an annual rate of 0.25% of average daily net assets in the case of Class B shares. The Plan is known as a “compensation plan” because the Trust makes payments to the Distributor for services rendered regardless of the actual level of expenditures by the Distributor. Amounts incurred by the Portfolio for the year ended December 31, 2018 are shown as Distribution and service fees in the Statement of Operations.
Deferred Trustee Compensation -Each Trustee who is not currently an employee of the Adviser or any of its affiliates receives compensation from the Trust for his or her service to the Trust. A deferred compensation plan (the “Plan”) is available to the Trustees on a voluntary basis. Deferred amounts remain in the Trust until distributed in accordance with the provisions of the Plan. The value of a participating Trustee’s deferral account is based on theoretical investments of deferred amounts on the normal payment dates in certain portfolios of the Trust or Brighthouse Funds Trust I, an affiliate of the Trust, as designated by the participating Trustee. Changes in the value of participants’ deferral accounts are reflected as Trustees’ fees and expenses in the Statement of Operations. The portion of the accrued obligations allocated to the Portfolio under the Plan is reflected as Deferred trustees’ fees in the Statement of Assets and Liabilities.
6. Transactions in Securities of Affiliated Issuers
The Asset Allocation Portfolio does not invest in the Underlying Portfolios for the purpose of exercising control; however, investments by the Asset Allocation Portfolio within its principal investment strategies may represent a significant portion of the Underlying Portfolios’ net assets. Transactions in the Underlying Portfolios for the year ended December 31, 2018 were as follows:
| | | | | | | | | | | | | | | | | | | | | | | | |
Security Description | | Market Value
December 31, 2017 | | | Purchases | | | Sales | | | Realized
Gain/(Loss) | | | Change in Unrealized
Appreciation/
(Depreciation) | | | Ending Value as of
December 31, 2018 | |
Baillie Gifford International Stock Portfolio (Class A) | | $ | 131,609,609 | | | $ | 45,431,561 | | | $ | (8,604,063 | ) | | $ | 3,251,653 | | | $ | (32,431,736 | ) | | $ | 139,257,024 | |
BlackRock Bond Income Portfolio (Class A) | | | 621,892,284 | | | | 19,773,976 | | | | (84,984,013 | ) | | | (2,599,790 | ) | | | (20,372,188 | ) | | | 533,710,269 | |
BlackRock Capital Appreciation Portfolio (Class A) | | | 130,433,003 | | | | 13,803,945 | | | | (50,676,981 | ) | | | 22,777,646 | | | | (29,177,067 | ) | | | 87,160,546 | |
BlackRock High Yield Portfolio (Class A) | | | 32,740,089 | | | | 1,568,584 | | | | (4,913,603 | ) | | | (445,222 | ) | | | (1,803,106 | ) | | | 27,146,742 | |
Brighthouse Small Cap Value Portfolio (Class A) | | | 65,207,033 | | | | 2,969,930 | | | | (23,794,235 | ) | | | 2,278,631 | | | | (11,093,974 | ) | | | 35,567,385 | |
Brighthouse/Aberdeen Emerging Markets Equity Portfolio (Class A) | | | 65,893,282 | | | | 4,826,022 | | | | (6,040,969 | ) | | | 379,444 | | | | (10,336,995 | ) | | | 54,720,784 | |
Brighthouse/Artisan International Portfolio (Class A) | | | 81,939,899 | | | | 41,866,205 | | | | (7,294,612 | ) | | | 1,036,672 | | | | (15,606,390 | ) | | | 101,941,774 | |
Brighthouse/Artisan Mid Cap Value Portfolio (Class A) | | | 16,317,835 | | | | 893,184 | | | | (2,258,839 | ) | | | 651,964 | | | | (3,346,797 | ) | | | 12,257,347 | |
Brighthouse/Eaton Vance Floating Rate Portfolio (Class A) | | | 130,866,451 | | | | 4,724,746 | | | | (23,521,996 | ) | | | 849,667 | | | | (4,386,812 | ) | | | 108,532,056 | |
Brighthouse/Franklin Low Duration Total Return Portfolio (Class A) | | | 196,172,037 | | | | 3,770,914 | | | | (30,754,733 | ) | | | (1,526,862 | ) | | | (980,793 | ) | | | 166,680,563 | |
Brighthouse/Templeton International Bond Portfolio (Class A) | | | 188,929,044 | | | | 86,826 | | | | (25,507,519 | ) | | | (5,165,187 | ) | | | 7,665,895 | | | | 166,009,059 | |
Brighthouse/Wellington Core Equity Opportunities Portfolio (Class A) | | | 245,031,002 | | | | 16,194,281 | | | | (52,993,464 | ) | | | (10,967,890 | ) | | | (2,795,206 | ) | | | 194,468,723 | |
Brighthouse/Wellington Large Cap Research Portfolio (Class A) | | | 146,696,093 | | | | 17,061,393 | | | | (28,675,741 | ) | | | 5,414,110 | | | | (28,223,843 | ) | | | 112,272,012 | |
Clarion Global Real Estate Portfolio (Class A) | | | 49,199,143 | | | | 2,809,150 | | | | (5,621,910 | ) | | | 627,440 | | | | (7,179,543 | ) | | | 39,834,280 | |
ClearBridge Aggressive Growth Portfolio (Class A) | | | 97,831,193 | | | | 3,222,977 | | | | (46,298,908 | ) | | | 22,760,859 | | | | (28,229,204 | ) | | | 49,286,917 | |
Harris Oakmark International Portfolio (Class A) | | | 180,618,158 | | | | 31,544,882 | | | | (12,665,804 | ) | | | 3,278,582 | | | | (56,017,491 | ) | | | 146,758,327 | |
Invesco Comstock Portfolio (Class A) | | | 245,059,781 | | | | 16,284,863 | | | | (67,012,903 | ) | | | 26,387,415 | | | | (62,534,547 | ) | | | 158,184,609 | |
Invesco Small Cap Growth Portfolio (Class A) | | | 48,957,984 | | | | 3,759,563 | | | | (25,323,896 | ) | | | 674,803 | | | | (4,692,212 | ) | | | 23,376,242 | |
Jennison Growth Portfolio (Class A) | | | 97,596,570 | | | | 11,098,278 | | | | (39,967,804 | ) | | | 12,217,024 | | | | (19,134,379 | ) | | | 61,809,689 | |
JPMorgan Core Bond Portfolio (Class A) | | | 425,261,137 | | | | 11,975,966 | | | | (59,507,047 | ) | | | (4,209,754 | ) | | | (7,565,615 | ) | | | 365,954,687 | |
JPMorgan Small Cap Value Portfolio (Class A) | | | 48,815,179 | | | | 3,119,102 | | | | (7,889,628 | ) | | | 560,326 | | | | (8,995,507 | ) | | | 35,609,472 | |
MFS Research International Portfolio (Class A) | | | 98,597,136 | | | | 1,983,346 | | | | (10,595,624 | ) | | | 2,731,900 | | | | (16,703,273 | ) | | | 76,013,485 | |
MFS Value Portfolio (Class A) | | | 245,152,176 | | | | 18,940,274 | | | | (52,103,481 | ) | | | 11,852,761 | | | | (21,739,631 | ) | | | 202,102,099 | |
MFS Value Portfolio II (Class A) | | | 32,691,765 | | | | 9,302,474 | | | | (1,151,632 | ) | | | 45,004 | | | | (40,887,611 | ) | | | — | |
Neuberger Berman Genesis Portfolio (Class A) | | | 32,672,523 | | | | 3,775,630 | | | | (6,993,982 | ) | | | 3,586,347 | | | | (8,683,486 | ) | | | 24,357,032 | |
Oppenheimer Global Equity Portfolio (Class A) | | | 65,298,260 | | | | 6,312,938 | | | | (9,021,208 | ) | | | 2,281,028 | | | | (15,500,978 | ) | | | 49,370,040 | |
PIMCO Inflation Protected Bond Portfolio (Class A) | | | 393,850,367 | | | | 6,768,484 | | | | (51,638,860 | ) | | | (6,861,493 | ) | | | (7,845,118 | ) | | | 334,273,380 | |
PIMCO Total Return Portfolio (Class A) | | | 589,355,455 | | | | 8,819,559 | | | | (83,758,828 | ) | | | (8,371,556 | ) | | | (1,306,368 | ) | | | 504,738,262 | |
BHFTII-11
Brighthouse Funds Trust II
Brighthouse Asset Allocation 40 Portfolio
Notes to Financial Statements—December 31, 2018—(Continued)
| | | | | | | | | | | | | | | | | | | | | | | | |
Security Description | | Market Value
December 31, 2017 | | | Purchases | | | Sales | | | Realized
Gain/(Loss) | | | Change in Unrealized
Depreciation | | | Ending Value as of
December 31, 2018 | |
T. Rowe Price Large Cap Growth Portfolio (Class A) | | $ | 130,008,054 | | | $ | 19,010,961 | | | $ | (44,221,030 | ) | | $ | 8,371,574 | | | $ | (24,568,337 | ) | | $ | 88,601,222 | |
T. Rowe Price Large Cap Value Portfolio (Class A) | | | 260,984,299 | | | | 24,352,346 | | | | (66,352,033 | ) | | | 21,594,535 | | | | (63,127,047 | ) | | | 177,452,100 | |
T. Rowe Price Mid Cap Growth Portfolio (Class A) | | | 32,611,311 | | | | 3,952,931 | | | | (7,076,590 | ) | | | 1,616,860 | | | | (5,598,221 | ) | | | 25,506,291 | |
T. Rowe Price Small Cap Growth Portfolio (Class A) | | | 49,038,106 | | | | 17,842,324 | | | | (11,395,609 | ) | | | 1,047,231 | | | | (8,885,352 | ) | | | 47,646,700 | |
TCW Core Fixed Income Portfolio (Class A) | | | 490,979,261 | | | | 11,915,263 | | | | (68,663,956 | ) | | | (796,965 | ) | | | (11,124,500 | ) | | | 422,309,103 | |
Van Eck Global Natural Resources Portfolio (Class A) | | | 65,625,862 | | | | 59,719,196 | | | | (4,859,523 | ) | | | (985,873 | ) | | | (33,993,018 | ) | | | 85,506,644 | |
Wells Capital Management Mid Cap Value Portfolio (Class A) | | | 16,373,144 | | | | 1,505,009 | | | | (1,944,900 | ) | | | (414,554 | ) | | | (2,965,607 | ) | | | 12,553,092 | |
Western Asset Management Strategic Bond Opportunities Portfolio (Class A) | | | 261,771,526 | | | | 13,054,787 | | | | (30,423,978 | ) | | | 277,484 | | | | (22,756,998 | ) | | | 221,922,821 | |
Western Asset Management U.S. Government Portfolio (Class A) | | | 523,368,124 | | | | 11,431,892 | | | | (78,272,653 | ) | | | (2,983,717 | ) | | | (4,658,419 | ) | | | 448,885,227 | |
| | | | | | | | | | | | | | | | | | | | | | | | |
| | $ | 6,535,444,175 | | | $ | 475,473,762 | | | $ | (1,142,782,555 | ) | | $ | 111,222,097 | | | $ | (637,581,474 | ) | | $ | 5,341,776,005 | |
| | | | | | | | | | | | | | | | | | | | | | | | |
| | | | | | | | | | | | |
Security Description | | Capital Gain Distributions
from Affiliated Investments | | | Income earned from
affiliates during the period | | | Number of shares held at
December 31, 2018 | |
Baillie Gifford International Stock Portfolio (Class A) | | $ | — | | | $ | 1,823,142 | | | | 12,636,754 | |
BlackRock Bond Income Portfolio (Class A) | | | — | | | | 19,707,947 | | | | 5,184,673 | |
BlackRock Capital Appreciation Portfolio (Class A) | | | 13,634,724 | | | | 128,650 | | | | 2,244,670 | |
BlackRock High Yield Portfolio (Class A) | | | — | | | | 1,568,584 | | | | 3,744,378 | |
Brighthouse Small Cap Value Portfolio (Class A) | | | 2,376,367 | | | | 568,770 | | | | 2,626,838 | |
Brighthouse/Aberdeen Emerging Markets Equity Portfolio (Class A) | | | — | | | | 1,649,335 | | | | 5,735,931 | |
Brighthouse/Artisan International Portfolio (Class A) | | | — | | | | 1,705,032 | | | | 10,297,149 | |
Brighthouse/Artisan Mid Cap Value Portfolio (Class A) | | | 795,484 | | | | 94,204 | | | | 57,859 | |
Brighthouse/Eaton Vance Floating Rate Portfolio (Class A) | | | — | | | | 4,719,428 | | | | 10,853,206 | |
Brighthouse/Franklin Low Duration Total Return Portfolio (Class A) | | | — | | | | 3,761,096 | | | | 17,563,811 | |
Brighthouse/Templeton International Bond Portfolio (Class A) | | | — | | | | — | | | | 16,259,457 | |
Brighthouse/Wellington Core Equity Opportunities Portfolio (Class A) | | | 12,176,029 | | | | 4,012,633 | | | | 6,480,131 | |
Brighthouse/Wellington Large Cap Research Portfolio (Class A) | | | 15,621,371 | | | | 1,408,147 | | | | 8,511,904 | |
Clarion Global Real Estate Portfolio (Class A) | | | — | | | | 2,781,656 | | | | 3,715,884 | |
ClearBridge Aggressive Growth Portfolio (Class A) | | | 2,724,244 | | | | 483,132 | | | | 3,031,176 | |
Harris Oakmark International Portfolio (Class A) | | | 6,668,833 | | | | 3,174,158 | | | | 12,068,941 | |
Invesco Comstock Portfolio (Class A) | | | 14,513,915 | | | | 1,711,715 | | | | 11,929,458 | |
Invesco Small Cap Growth Portfolio (Class A) | | | 3,570,202 | | | | — | | | | 1,867,112 | |
Jennison Growth Portfolio (Class A) | | | 10,801,323 | | | | 254,711 | | | | 4,262,737 | |
JPMorgan Core Bond Portfolio (Class A) | | | — | | | | 11,911,795 | | | | 36,522,424 | |
JPMorgan Small Cap Value Portfolio (Class A) | | | 2,524,935 | | | | 576,503 | | | | 2,514,793 | |
MFS Research International Portfolio (Class A) | | | — | | | | 1,966,711 | | | | 7,044,809 | |
MFS Value Portfolio (Class A) | | | 15,265,227 | | | | 3,635,296 | | | | 14,634,475 | |
MFS Value Portfolio II (Class A) | | | 8,299,657 | | | | 998,229 | | | | — | |
Neuberger Berman Genesis Portfolio (Class A) | | | 3,663,647 | | | | 105,005 | | | | 1,312,340 | |
Oppenheimer Global Equity Portfolio (Class A) | | | 5,544,706 | | | | 734,189 | | | | 2,414,183 | |
PIMCO Inflation Protected Bond Portfolio (Class A) | | | — | | | | 6,724,909 | | | | 34,929,298 | |
PIMCO Total Return Portfolio (Class A) | | | — | | | | 8,755,954 | | | | 44,314,158 | |
T. Rowe Price Large Cap Growth Portfolio (Class A) | | | 18,537,272 | | | | 434,914 | | | | 4,278,186 | |
T. Rowe Price Large Cap Value Portfolio (Class A) | | | 20,031,096 | | | | 4,296,700 | | | | 6,195,953 | |
T. Rowe Price Mid Cap Growth Portfolio (Class A) | | | 3,950,626 | | | | — | | | | 2,503,071 | |
T. Rowe Price Small Cap Growth Portfolio (Class A) | | | 4,869,844 | | | | 70,809 | | | | 2,244,310 | |
TCW Core Fixed Income Portfolio (Class A) | | | — | | | | 11,838,678 | | | | 42,315,541 | |
Van Eck Global Natural Resources Portfolio (Class A) | | | — | | | | 192,693 | | | | 11,133,678 | |
Wells Capital Management Mid Cap Value Portfolio (Class A) | | | 1,314,132 | | | | 188,784 | | | | 1,260,351 | |
Western Asset Management Strategic Bond Opportunities Portfolio (Class A) | | | — | | | | 13,046,942 | | | | 17,501,800 | |
Western Asset Management U.S. Government Portfolio (Class A) | | | — | | | | 11,388,634 | | | | 39,067,470 | |
| | | | | | | | | | | | |
| | $ | 166,883,634 | | | $ | 126,419,085 | | | | | |
| | | | | | | | | | | | |
7. Contractual Obligations
Under the Trust’s organizational documents, its officers and Trustees may be indemnified against certain liabilities and expenses arising out of the performance of their duties to the Trust. Additionally, the Trust has a variety of indemnification obligations under contracts with its service providers. The Trust’s maximum exposure under these arrangements is unknown, as this would involve future claims that may be made against the Trust that have not yet occurred.
BHFTII-12
Brighthouse Funds Trust II
Brighthouse Asset Allocation 40 Portfolio
Notes to Financial Statements—December 31, 2018—(Continued)
8. Income Tax Information
The cost basis of investments for federal income tax purposes at December 31, 2018 was as follows:
| | | | |
Cost basis of investments | | $ | 5,614,813,097 | |
| | | | |
Gross unrealized appreciation | | | 45,670,350 | |
Gross unrealized depreciation | | | (318,707,442 | ) |
| | | | |
Net unrealized appreciation (depreciation) | | $ | (273,037,092 | ) |
| | | | |
The tax character of distributions paid for the years ended December 31, 2018 and 2017 were as follows:
| | | | | | | | | | | | | | | | | | | | |
Ordinary Income | | | Long-Term Capital Gain | | | Total | |
2018 | | 2017 | | | 2018 | | | 2017 | | | 2018 | | | 2017 | |
| $120,439,849 | | $ | 132,423,201 | | | $ | 181,864,574 | | | $ | 205,645,657 | | | $ | 302,304,423 | | | $ | 338,068,858 | |
As of December 31, 2018, the components of distributable earnings (accumulated losses) on a federal income tax basis were as follows:
| | | | | | | | | | | | | | | | |
Undistributed
Ordinary
Income | | Undistributed
Long-Term
Capital Gain | | | Net
Unrealized
Depreciation | | | Accumulated
Capital Losses | | | Total | |
| $118,029,169 | | $ | 269,506,978 | | | $ | (273,037,092 | ) | | $ | — | | | $ | 114,499,055 | |
The Asset Allocation Portfolio utilizes the provisions of the federal income tax laws that provide for the carryforward of capital losses for prior years, offsetting such losses against any future realized capital gains. Under the Regulated Investment Company Modernization Act of 2010, net capital losses recognized after December 22, 2010 may be carried forward indefinitely and their character is retained as short-term and/or long-term losses.
As of December 31, 2018, the Asset Allocation Portfolio had no accumulated capital losses.
9. Recent Accounting Pronouncements and SEC Update
In August 2018, the FASB issued Accounting Standards Update 2018-13, Fair Value Measurement (Topic 820)—Disclosure Framework—Changes to the Disclosure Requirements for Fair Value Measurement (“ASU 2018-13”) which introduces new fair value disclosure requirements as well as eliminates and modifies certain existing fair value disclosure requirements. ASU 2018-13 is effective for fiscal years beginning after December 15, 2019, and interim periods within those fiscal years. Early adoption is permitted and, as such, management has elected to early adopt ASU 2018-13 effective with the current reporting period. The impact of the Portfolio’s adoption was limited to changes in the Portfolio’s financial statement disclosures regarding fair value, primarily those disclosures related to transfers between levels of the fair value hierarchy.
In August 2018, the Securities and Exchange Commission released its Final Rule on Disclosure Update and Simplification (the “Final Rule”) which is intended to simplify an issuer’s disclosure compliance efforts by removing redundant or outdated disclosures requirements without significantly altering the mix of information provided to investors. Effective with the current reporting period, the Portfolio adopted the Final Rule with the most notable impacts being that the Portfolio is no longer required to present the components of distributable earnings on the Statement of Assets and Liabilities or the sources of distributions to shareholders and the amounts of undistributed net investment income on the Statements of Changes in Net Assets.
BHFTII-13
Brighthouse Funds Trust II
Brighthouse Asset Allocation 40 Portfolio
Report of Independent Registered Public Accounting Firm
To the Shareholders of Brighthouse Asset Allocation 40 Portfolio and the Board of Trustees of Brighthouse Funds Trust II:
Opinion on the Financial Statements and Financial Highlights
We have audited the accompanying statement of assets and liabilities, including the schedule of investments, of the Brighthouse Asset Allocation 40 Portfolio (the “Portfolio”), one of the portfolios constituting the Brighthouse Funds Trust II, as of December 31, 2018, the related statement of operations for the year then ended, the statements of changes in net assets for each of the two years in the period then ended, the financial highlights for each of the five years in the period then ended, and the related notes. In our opinion, the financial statements and financial highlights present fairly, in all material respects, the financial position of the Brighthouse Asset Allocation 40 Portfolio of the Brighthouse Funds Trust II as of December 31, 2018, the results of its operations for the year then ended, the changes in its net assets for each of the two years in the period then ended, and the financial highlights for each of the five years in the period then ended, in conformity with accounting principles generally accepted in the United States of America.
Basis for Opinion
These financial statements and financial highlights are the responsibility of the Portfolio’s management. Our responsibility is to express an opinion on the Portfolio’s financial statements and financial highlights based on our audits. We are a public accounting firm registered with the Public Company Accounting Oversight Board (United States) (PCAOB) and are required to be independent with respect to the Portfolio in accordance with the U.S. federal securities laws and the applicable rules and regulations of the Securities and Exchange Commission and the PCAOB.
We conducted our audits in accordance with the standards of the PCAOB. Those standards require that we plan and perform the audit to obtain reasonable assurance about whether the financial statements and financial highlights are free of material misstatement, whether due to error or fraud. The Portfolio is not required to have, nor were we engaged to perform, an audit of its internal control over financial reporting. As part of our audits we are required to obtain an understanding of internal control over financial reporting but not for the purpose of expressing an opinion on the effectiveness of the Portfolio’s internal control over financial reporting. Accordingly, we express no such opinion.
Our audits included performing procedures to assess the risks of material misstatement of the financial statements and financial highlights, whether due to error or fraud, and performing procedures that respond to those risks. Such procedures included examining, on a test basis, evidence regarding the amounts and disclosures in the financial statements and financial highlights. Our audits also included evaluating the accounting principles used and significant estimates made by management, as well as evaluating the overall presentation of the financial statements and financial highlights. Our procedures included confirmation of securities owned as of December 31, 2018, by correspondence with the transfer agent. We believe that our audits provide a reasonable basis for our opinion.
/s/ Deloitte & Touche LLP
Boston, Massachusetts
February 25, 2019
We have served as the auditor of one or more of the Brighthouse investment companies since 1983.
BHFTII-14
Brighthouse Funds Trust II
Trustees and Officers
MANAGEMENT OF THE TRUSTS
The Boards of Trustees (the “Board”) of Brighthouse Funds Trust I and Brighthouse Funds Trust II (“BHF I” and “BHF II”, respectively, and collectively the “Trusts”) supervise the Trusts and are responsible for representing the interests of shareholders. The Trustees, the Chairman of the Board and the Chairmen of each subcommittee are the same for both Trusts. The Trustees of each Trust meet periodically throughout the year to oversee the Portfolios’ activities, reviewing, among other things, each Portfolio’s performance and its contractual arrangements with various service providers. The Trustees of each Trust elect the officers of the Trust, who are responsible for administering the Trust’sday-to-day operations.
Trustees and Officers
The Trustees and executive officers of the Trusts, as well as their principal occupations during the past five years, are set forth below. Unless otherwise indicated, the business address of each is c/o Brighthouse Funds, One Financial Center, Boston, Massachusetts 02111. Each Trustee who is deemed an “interested person,” as such term is defined in the 1940 Act, is referred to as an “Interested Trustee.” Those Trustees who are not “interested persons,” as such term is defined in the 1940 Act, are referred to as “Independent Trustees.” There is no limit to the term a Trustee may serve. Trustees serve until their death, resignation or removal in accordance with the BHF I Trust’s and BHF II Trust’s respective organizational documents and policies adopted by the Boards of the respective Trusts from time to time. Officers hold office at the pleasure of each Board and serve until their removal or resignation in accordance with the Trusts’ respective organizational documents and policies adopted by the Board of each Trust from time to time.
| | | | | | | | | | |
Name and Year of Birth | | Current
Position(s)
Held with
Registrant | | Term of Office
and Length of
Time Served | | Principal Occupation(s) During the Past 5 Years(1) | | Number of
Portfolios in
Brighthouse Funds
Complex(2)
Overseen
by Trustee | | Other Directorships Held
by Trustee During
the Past 5 Years(1) |
| Interested Trustee |
John Rosenthal* (1960) | | Trustee | | Indefinite;
From
May
2016
(Trust I
and
Trust II) to
present | | Chief Investment Officer, Brighthouse Financial, Inc. (2017 to present); until 2017, Senior Managing Director and Head of Global Portfolio Management, MetLife, Inc. | | 72 | | None |
|
| Independent Trustees |
Dawn M. Vroegop (1966) | | Trustee and Chairman of the Board | | Indefinite;
From
December
2000
(Trust I)/
May
2009
(Trust II)
to present
as
Trustee;
From
May
2016
(Trust I
and
Trust II)
until
present as
Chairman | | Private Investor. | | 72 | | Trustee, Driehaus Mutual Funds.** |
BHFTII-15
Brighthouse Funds Trust II
Trustees and Officers—(Continued)
| | | | | | | | | | |
Name and Year of Birth | | Current
Position(s)
Held with
Registrant | | Term of Office
and Length of
Time Served | | Principal Occupation(s) During the Past 5 Years(1) | | Number of
Portfolios in
Brighthouse Funds
Complex(2)
Overseen
by Trustee | | Other Directorships Held
by Trustee During
the Past 5 Years(1) |
Stephen M. Alderman (1959) | | Trustee | | Indefinite;
From
December
2000
(Trust I)/
April
2012
(Trust II)
to present | | Shareholder in the law firm of Garfield and Merel, Ltd. | | 72 | | None |
| | | | | |
Robert J. Boulware (1956) | | Trustee | | Indefinite;
From
March
2008
(Trust I)/
April
2012
(Trust II)
to present | | Managing Director, Pilgrim Funds, LLC (private equity fund). | | 72 | | Trustee, Vertical Capital Income Fund(closed-end fund);** Director, Gainsco, Inc. (auto insurance);** Trustee, SharesPost 100 Fund(closed-end fund).** |
| | | | | |
Susan C. Gause (1952) | | Trustee | | Indefinite;
From
March
2008
(Trust I)/
April
2012
(Trust II)
to present | | Private Investor. | | 72 | | Trustee, HSBC Funds.** |
| | | | | |
Nancy Hawthorne (1951) | | Trustee | | Indefinite;
From
May
2003
(Trust II)/
April
2012
(Trust I) to
present | | Partner, Hawthorne Financial Advisors, LLC (registered investment advisor); until 2014, Chief Executive Officer, Clerestory LLC (corporate advisor). | | 72 | | Director and Chairman of the Board of Directors, THL Credit, Inc.;** Director and Chairman of the Board, Avid Technology, Inc.;** Director, CRA International, Inc.** |
| | | | | |
Barbara A. Nugent (1956) | | Trustee | | Indefinite;
From
January
2014
(Trust I
and
Trust II) to
present | | President, True North Board Governance, LLC (consulting); until December 2013, partner in the law firm of Stradley Ronon Stevens & Young, LLP. | | 72 | | Independent Lead Trustee, BMT Investment Funds** |
| | | | | |
Christopher J. Towle (1957) | | Trustee | | Indefinite;
From
April
2018
(Trust I
and
Trust II) to
present | | Retired; until 2014, Partner, Portfolio Manager, Director of High Yield and Convertible Strategies, Lord Abbett & Co. | | 72 | | Trustee, Driehaus Mutual Funds** |
BHFTII-16
Brighthouse Funds Trust II
Trustees and Officers—(Continued)
Officers
| | | | | | |
Name and Year of Birth | | Position(s)
Held with
Registrant | | Length of
Time Served | | Principal Occupation(s)
During the Past 5 Years(1) |
| Executive Officers | | | | | | |
Kristi Slavin (1973) | | President and Chief Executive Officer, of Trust I and Trust II | | From May
2016
(Trust I
and
Trust II) to
present | | President, Brighthouse Investment Advisers, LLC (2016-present); formerly, Senior Vice President, MetLife Advisers, LLC; Vice President, MetLife, Inc.; Vice President, Trust I and Trust II(2015-2016). |
| | | |
Alan R. Otis (1971) | | Chief Financial Officer and Treasurer, of Trust I and Trust II | | From
November
2017
(Trust I
and
Trust II) to
present | | Senior Vice President, Brighthouse Investment Advisers, LLC (2017-present); formerly, Vice President, Brighthouse Investment Advisers, LLC (2012-2017); Assistant Treasurer, Trust I and Trust II(2012-2017). |
| | | |
Andrew L. Gangolf (1954) | | Secretary, of Trust I and Trust II | | From May
2011
(Trust I
and
Trust II) to
present | | Executive Vice President, Brighthouse Investment Advisers, LLC (2017-present); formerly, Senior Vice President, MetLife Advisers, LLC (2011-2017); until 2011, Senior Vice President & Assistant General Counsel, AllianceBernstein Investments, Inc. |
| | | |
Steven E. Hartstein (1963) | | Chief Compliance Officer (“CCO”), of Trust I and Trust II | | From
February
2014
(Trust I
and
Trust II) to
present | | Senior Vice President and CCO, Brighthouse Investment Advisers, LLC (2017-present); Head of Investments Compliance, Vice President, Brighthouse Financial, Inc. (2017-present); formerly, Vice President, MetLife, Inc. (2013-2017); Senior Vice President and CCO, MetLife Advisers, LLC (2013-2017.) |
| | | |
Victor Soto (1978) | | Vice President of Trust I and Trust II | | From May
2018
(Trust I
and
Trust II) to
present | | Executive Vice President, Brighthouse Investment Advisers, LLC (2016-present); Assistant Vice President, MetLife Inc. (2015-2017); Portfolio Manager, 1st Global (2013-2015). |
| * | Mr. Rosenthal is an “interested person” of the Trusts because of his position with Brighthouse Financial, Inc., the current parent company of Brighthouse Investment Advisers, LLC. |
| ** | Indicates a directorship with a registered investment company or a company subject to the reporting requirements of the Securities Exchange Act of 1934, as amended. |
| (1) | Previous positions during the past five years with the Trusts, Brighthouse Financial, Inc., MetLife, Inc. or the Manager are omitted if not materially different. |
| (2) | The Fund Complex includes 43 BHF I Portfolios and 29 BHF II Portfolios. |
BHFTII-17
Brighthouse Funds Trust II
Brighthouse Asset Allocation 40 Portfolio
Board of Trustees’ Consideration of Advisory Agreements
At anin-person meeting held on November6-8, 2018 (the “November Meeting”), the Boards of Trustees (the “Board”) of Brighthouse Funds Trust I and Brighthouse Funds Trust II (“BFT I” and “BFT II,” respectively, and collectively, the “Trusts”), including a majority of the Trustees who are not “interested persons” of the Trusts (the “Independent Trustees”) under the Investment Company Act of 1940 (the “1940 Act”), approved the continuation of the Trusts’ advisory agreements (the “Advisory Agreements” or “Agreements”) with Brighthouse Investment Advisers, LLC (the “Adviser”) for the series of the Trusts (each a “Portfolio,” and collectively, the “Portfolios”).
In making those approvals, the Board reviewed a variety of materials that were provided for the specific purpose of the annual contract renewal process. In addition, various materials provided to and discussed with the Board throughout the year informed the Board’s decision to renew the Agreements. In particular, the information for each Portfolio included, but was not limited to, investment performance reports, and reports on expenses, legal and compliance matters, asset pricing, brokerage commissions and trade execution.
The Board met in person with personnel of the Adviser on October 17, 2018 for the specific purpose of giving preliminary consideration to the proposed continuation of the Agreements (the “October Meeting”). At that meeting, the Adviser reviewed with the Board the performance and fees experienced by each Portfolio, as well as other information. During and after the October Meeting, the Independent Trustees communicatedfollow-up matters for management to address at the November Meeting. The Independent Trustees were advised by independent legal counsel throughout the contract renewal process, and met with independent legal counsel in several executive sessions outside of the presence of management.
Information furnished and reviewed specifically in connection with the renewal process included, but was not limited to, a report for each Portfolio that was prepared by Broadridge (“Broadridge”), an independent organization. In addition, the Independent Trustees reviewed a report that was prepared by JDL Consultants, LLC (“JDL”), an independent consultant to the Independent Trustees (“JDL Report”), which examined the comparative fees, expenses and performance of each Portfolio, based upon the Broadridge reports. Also, the Board reviewed the responses to wide-ranging questions from the Independent Trustees relating to the business, operations and performance of the Adviser, and aPortfolio-by-Portfolio analysis of the profitability to the Adviser of each Agreement, each of which was prepared by the Adviser specifically for the renewal process.
At the November Meeting, the Board, including a majority of the Independent Trustees, concluded that the nature, extent and quality of services provided by the Adviser supported the renewal of the Agreements. The Board also concluded that the investment performance of each Portfolio was such that each Agreement should continue, and that the fees paid by each Portfolio to the Adviser appeared to be reasonable in light of the nature, extent and quality of the services provided by the Adviser. Further, the Board concluded that the Adviser’s profitability in providing services under the Advisory Agreements did not appear unreasonable in light of the nature, extent and quality of the services provided by the Adviser. Finally, the Board reviewed the extent to which the investment advisory fees paid by the Portfolios shared economies of scale with investors and concluded that those considerations generally supported the renewal of each Agreement. In approving the renewal of each of the Agreements, the Board, including the Independent Trustees, gave attention to all of the information that was furnished and each Trustee placed varying degrees of importance on the various pieces of information that were provided to them. The Board evaluated the information on aPortfolio-by-Portfolio basis, and its decision was made separately with respect to each Portfolio. The following paragraphs provide more information about some of the primary factors that were relevant to the Board’s decision. The Board did not identify any single factor as determinative, and the Trustees generally attributed different weights to various factors for the various Portfolios.
Nature, extent and quality of services. The Board evaluated the nature, extent and quality of the services that the Adviser has provided to the Brighthouse Asset Allocation 20 Portfolio, Brighthouse Asset Allocation 40 Portfolio, Brighthouse Asset Allocation 60 Portfolio Brighthouse Asset Allocation 80 Portfolio and Brighthouse Asset Allocation 100 Portfolio (the “Asset Allocation Portfolios”) and the American Funds Balanced Allocation Portfolio, American Funds Growth Allocation Portfolio and American Funds Moderate Allocation Portfolio (the “American Funds of Funds”). The Board considered the Adviser’s services as investment manager to the Portfolios, including its trading practices and oversight of transition management (as applicable), compliance program and personnel, and risk management, among other things. The Adviser’s services in coordinating and overseeing the activities of the Trusts’ service providers were also considered. The Board considered information received from the Trusts’ Chief Compliance Officer (“CCO”) regarding the Portfolios’ compliance policies and procedures that were established pursuant to Rule38a-l under the 1940 Act. The Board also noted that the Adviser’s investment, compliance and legal staff regularly review and assess the services that are provided to the Portfolios, and that personnel of the Adviser prepare and present reports to the Independent Trustees regarding material information related to those reviews and assessments. In addition, throughout the year, the Board considered the expertise, experience and performance of the personnel of the Adviser who performed the various services that are mentioned above.
BHFTII-18
Brighthouse Funds Trust II
Brighthouse Asset Allocation 40 Portfolio
Board of Trustees’ Consideration of Advisory Agreements—(Continued)
With respect to the Asset Allocation Portfolios, the Board noted that the Adviser has hired at its own expense an independent consultant to provide research and consulting services with respect to the periodic asset allocation targets for each of the Asset Allocation Portfolios and investments in other Portfolios of the Trusts (the “Underlying Portfolios”). Additionally, the Board considered that a committee, consisting of investment professionals from the Adviser, meets regularly to review the asset allocations and discuss the performance of the Asset Allocation Portfolios and the American Funds of Funds.
The Board further considered and found that the advisory fee paid to the Adviser with respect to each Asset Allocation Portfolio and American Fund of Funds was based on services provided that were in addition to, rather than duplicative of, the services provided pursuant to the advisory agreements for the Underlying Portfolios in which the Portfolio invests.
Performance. The Board placed emphasis on the performance of each Portfolio in light of, among other things, its importance to investors. The Board considered the Adviser’s quarterly reviews with the Board of detailed information about each Portfolio’s investment strategies and performance results and composition, including discussions regarding the relevant effect of current market conditions. The Board reviewed and considered the reports prepared by Broadridge, which provided a statistical analysis comparing the Portfolios’ investment performance to that of comparable funds underlying variable insurance products (the “Performance Universe”). The Independent Trustees also met separately with representatives of JDL during the October Meeting to review the JDL Report. The Board considered each Portfolio’s performance for periods subsequent to the performance period covered by the Broadridge reports, and the Adviser’s discussion of the same, including the effect of current market conditions on each Portfolio’s more recent performance. The Board focused particular attention on Portfolios with less favorable performance records. The Board also noted that while it found the data provided by Broadridge generally useful, it recognized the limitations of such data, including, in particular, that notable differences may exist between a Portfolio and those of the other funds in a Broadridge category (for example, the investment objectives(s) and investment strategies) and that the results of the performance comparisons may vary depending on (i) the end dates for the performance periods that were selected and (ii) the selection of the peer groups.
Fees and Expenses. The Board gave consideration to the level and method of computing the fees payable under the Agreements. The Board considered the Broadridge report for each of the Portfolios, which included comparisons for each Portfolio of its contractual management fees (at current and various asset levels), and total expenses, with those of its peers, including as those peers were divided into a broad group of peer funds (“Expense Universe”) and a narrower group of peer funds (“Expense Group”). Broadridge selected the peer funds which were similarly situated funds underlying variable insurance products deemed to be comparable to the Portfolios. The Independent Trustees, with the assistance of JDL, also examined the JDL Report.
The Board also considered that the Adviser had entered into expense limitation or management fee waiver agreements with certain of the Portfolios pursuant to which the Adviser had agreed to waive a portion of its advisory fee and/or reimburse certain expenses as a means of limiting a Portfolio’s total annual operating expenses.
Profitability. The Board examined the profitability to the Adviser of each Agreement on aPortfolio-by-Portfolio basis. In the case of the Asset Allocation Portfolios, the Board also considered the Adviser’s analysis of its profitability that was attributable to its management of the Underlying Portfolios of the Trust in which the Asset Allocation Portfolios invest. The Board further considered that an affiliate of the Adviser, Brighthouse Securities, LLC, serves as distributor for the Portfolios, and, as such, receives Rule12b-1 payments to support the distribution of the Portfolios. In reviewing the profitability analyses, the Board recognized that expense allocation methodologies are inherently subjective and various expense allocation methodologies may be reasonable while producing different results.
Economies of scale. The Board also considered each Portfolio’s fees in light of its size. The Board noted the fee schedules for the Portfolios that contain breakpoints that reduce the fee rate above specified asset levels. The Board noted those Portfolios that did not contain breakpoints in the advisory fee and took into account management’s discussion of the same. The Board considered the effective fees under the Advisory Agreement for each Portfolio as a percentage of assets at different asset levels and possible economies of scale that may be realized if the assets of the Portfolio grow. The Board examined, among other data, the effect of a Portfolio’s growth in size on various fee schedules and reviewed the Broadridge and JDL Reports, which compared fees among peers. The Board also generally noted that if a Portfolio’s assets increase over time, the Portfolio may realize other economies of scale if assets increase proportionally more than fixed expenses.
Other factors. The Board considered other benefits that may be realized by the Adviser and its affiliates from their relationship with the Trusts. Among them, the Board recognized that Brighthouse Securities, LLC, as the distributor for the Trusts, receives payments pursuant to Rule12b-1 from the Portfolios to compensate for the provision of shareholder services and distribution activities, which could lead to growth in the Trusts’ assets and corresponding benefits from such growth, including economies of scale. In conjunction with these considerations, the Board noted the ongoing commitment of the Adviser to the Portfolios.
BHFTII-19
Brighthouse Funds Trust II
Brighthouse Asset Allocation 40 Portfolio
Board of Trustees’ Consideration of Advisory Agreements—(Continued)
The Board requested, received, and considered information from the Adviser regarding possible conflicts of interest in the form of material benefits to the Adviser resulting from the Adviser’s affiliations and business relationships, as relevant. The Board considered the services that are provided to the Trusts by its service providers, and the manner in which any conflicts were mitigated.
* * *
Brighthouse Asset Allocation 40 Portfolio.The Board also considered the following information in relation to the Agreement with the Adviser regarding the Portfolio:
Among other data relating specifically to the Portfolio’s performance, the Board considered that the Portfolio outperformed the median of its Performance Universe for theone-, three-, and five-year periods ended June 30, 2018. The Board also considered that the Portfolio outperformed the average of its Morningstar category for the three-year and five-year periods ended June 30, 2018, and performed equally to the average of its Morningstar category for theone-year period ended June 30, 2018. The Board further considered that the Portfolio underperformed the Brighthouse AA 40 Narrow Index for theone-, three- and five-year periods ended September 30, 2018. In addition, the Board noted that the Portfolio outperformed the Dow Jones Moderately Conservative Index for the same periods.
The Board also considered that the Portfolio’s actual management fees were below the Expense Group median and above the Expense Universe median. The Board further considered that the Portfolio’s total expenses (exclusive of12b-l fees) were below the Expense Group median and the Expense Universe median. The Board noted that the Portfolio’s contractual management fees were below the asset-weighted average of comparable funds at the Portfolio’s current size.
BHFTII-20
Brighthouse Funds Trust II
Brighthouse Asset Allocation 60 Portfolio
Managed by Brighthouse Investment Advisers, LLC
Portfolio Manager Commentary*
PERFORMANCE
For theone-year period ended December 31, 2018, the Class A and B shares of the Brighthouse Asset Allocation 60 Portfolio returned-5.93% and-6.12%, respectively. The Portfolio’s benchmark, the Dow Jones Moderate Index1, returned-5.21%.
MARKET ENVIRONMENT/CONDITIONS
After a great 2017 withrecord-low volatility and the strongest January stock market since 1997, investors got shaken back to reality in February when equity markets took a dive following higher-than-expected wage growth. The concern was that this would lead to higher inflation followed by additional Federal Reserve (the “Fed”) interest rate hikes, leading to an unceremonious end to the second-longest economic expansion on record. However, inflation fears soon after fizzled (at least until the end of 2018) and the Fed stayed the course, despite the Tax Cuts and Jobs Act of 2017 providing a noteworthy lift to gross domestic product (“GDP”) growth. GDP growth, incidentally, is on track to reach the highest annual level since before the2008-09 recession. However, an escalating trade war between the U.S. and many of its major trading partners sent another wave of anxiety toward the market, which responded by pulling back sharply once again.
The beginning of the year turned out to be a microcosm of the remainder of 2018. This point in the economic cycle finds many market participants scrambling for indications that the expansion will end. As such, equity markets have become irrationally sensitive to individual data points, both positive and negative, with little regard to their historic predictive power on market results. The consequence was elevated market volatility in the second quarter, driven by positive economic growth and an accommodative Fed on one side, and on the other side by negative trade war and housing market news. In the third quarter, however, equity markets rebounded as corporate profits hit a newall-time high, GDP growth for second quarter came in at 4.2%, and unemployment dropped to 3.7%—the lowest number since 1969. The result in the third quarter was the best quarterly return for the S&P 500 Index since 2013.
As we got to the fourth quarter though, sentiment turned significantly worse, and the S&P 500 Index did an about-face, delivering its worst quarterly return since 2011. Gone was the sense of confidence that the strong economy could propel equity markets ever higher. Front and center were concerns about the continued trade war escalation,mid-term election uncertainty, a housing market dampened by rising interest rates and lofty prices, and a Fed that was now deemed too hawkish by projecting two additional rate hikes in 2019, despite having raised rates 4 times in 2018 (from a target range of1.25%-1.50% to a target range of2.25%-2.5%) and despite the market volatility.
News from overseas did little to attenuate concerns on the home front. Troubling to many is the ongoing Brexit (United Kingdom’s decision to withdraw from the European Union) situation, as leaders in the U.K. struggle to agree on a deal ensuring an orderly exit from the E.U.—an exit which is scheduled to occur on March 29, 2019. Highlighting the extent of disagreement are the two votes of confidence in Prime Minister Theresa May’s leadership, held in December 2018 and January 2019, both of which she won (in the U.K., a vote of confidence is a procedure used to remove a prime minister from office). Concerns about slowing growth in China have been receiving headlines as well. Leadership in China is in the middle of a long-term plan which is designed to transition the country from a manufacturing-driven economy to a service-driven economy. More worrisome to market participants is the fact that China is also in the process of dealing with an increasingly large debt burden as that plan unfolds. The outcome of both is unclear, which has led to some increased market volatility. However, it was confidence-inspiring that China had enough wherewithal to take the foot off the brake when it saw its economic growth rates declining faster than intended.
All in all, 2018 was a difficult year for investors. The economy is growing at a healthy pace, but the main question is for how long? The uncertainty caused all the major asset classes to be down for the year except for core bonds, which managed to creep in to positive territory, barely eking out a positive return with 0.01% for the year (as measured by the Bloomberg Barclays U.S. Aggregate Bond Index). International equities were generally the worst-performing asset classes with Emerging Markets equity and Foreign Developed equity down 14.6% and 13.8% respectively, as measured by the MSCI Emerging Markets Index and the MSCI EAFE Index. U.S. Large Cap equity did significantly better but was still down 4.4% for the year as measured by the S&P 500 Index, whereas Mid Cap equity lost 9.1% and Small Cap equity lost 11.0% for the year, as measured by the Russell Mid Cap and the Russell 2000 indices, in that order.
PORTFOLIO REVIEW /PERIOD-END POSITIONING
The Brighthouse Asset Allocation 60 Portfolio invests in underlying portfolios of the Brighthouse Funds Trust I and the Brighthouse Funds Trust II to maintain a broad asset allocation of approximately 60% to equities and 40% to fixed income. Over the twelve-month period, the Portfolio lagged the Dow Jones Moderate Index. Strong performance within the Mid and Small Cap portfolios and a favorable overweight to Large Cap equity was insufficient to attenuate the combination of underperformance within Large Cap and International equities, an underweight to cash, and an overweight to equities in general—all detractors.
The contribution from the underlying fixed income portfolios to relative performance was positive in 2018. The biggest contributor by far to performance was the Brighthouse/Templeton International Bond Portfolio, which outpaced its benchmark by 3.1%. The strategy’s relative outperformance during the period was primarily attributable to currency positions, notably, the portfolio’s underweight position in the euro and the Australian dollar. Outside of currency exposure, short duration positioning in the U.S. helped returns as well. The Brighthouse/Eaton Vance Floating Rate Portfolio outperformed its
BHFTII-1
Brighthouse Funds Trust II
Brighthouse Asset Allocation 60 Portfolio
Managed by Brighthouse Investment Advisers, LLC
Portfolio Manager Commentary*—(Continued)
benchmark by 0.1%. The portfolio’s underweight to defaulted loans aided performance relative to its benchmark over the year, as did favorable security selection in Financial Services and Energy. At the other end of the spectrum was the Western Asset Management Strategic Bond Opportunities Portfolio, which lagged its benchmark by 3.8%. Portfolio performance was negatively impacted by its U.S. duration and yield curve positioning, as well as currency and emerging markets positions. During the year, corporate credit spreads widened and experienced heightened levels of volatility. As such, the portfolio’s investment grade corporate credit positions were also negative contributors to performance. Also detracting in fixed income was the Brighthouse/Franklin Low Duration Total Return Portfolio, which underperformed its benchmark by 0.9%, largely driven by Collateralized Loan Obligation positions.
Contribution from the underlying domestic equity portfolios to relative performance was negative, as strong performance by the Mid Cap and Small Cap equity portfolios was insufficient to make up for the underperformance within the Large Cap equity portfolios. Within Large Cap, the Brighthouse/Wellington Core Equity Opportunities Portfolio had a strong year, as it outperformed its benchmark by 4.7%. Strong security selection within Consumer Discretionary, Consumer Staples, and Materials sectors helped. The ClearBridge Aggressive Growth Portfolio, on the other hand, experienced considerable underperformance in 2018, falling shy of its benchmark by 4.7% for the period. The underperformance was driven by an unfavorable overweight to Energy, in addition to suboptimal security selection within Information Technology, Consumer Discretionary, and Industrials. Another laggard for the period was the Invesco Comstock Portfolio, which underperformed its benchmark by 3.7% for the year. The result was primarily due to an overweight to Energy and unfavorable security selection within Financial Services, Healthcare, and Energy. Within Mid Cap equity, only the T. Rowe Price Mid Cap Growth Portfolio outperformed its benchmark. The portfolio outpaced its benchmark by 2.7% as positive results were driven by security selection within Communication Services, Financial Services, and Materials. Within Small Cap equity, four out of six managers outperformed their respective benchmarks. The strongest performer was the Loomis Sayles Small Cap Growth Portfolio, which outperformed its benchmark by 9.9% in 2018. The portfolio benefitted significantly from strong security selection within Healthcare, Technology, and Consumer Discretionary. In addition, the Neuberger Berman Genesis Portfolio outperformed its benchmark by 6.2% in 2018 as the portfolio’s focus on higher-quality companies with higher return on equity paid off. Security selection in Healthcare, Consumer Staples, and Information Technology made the largest positive impact on relative results.
Non-U.S. equity was a headwind to relative performance in 2018. Most notably, the Harris Oakmark International Portfolio underperformed its benchmark by 9.9% during the year as security selection and country weightings caused returns to suffer. Performance compared to the benchmark was hurt by holdings in the U.K., Germany, and France as well as suboptimal security selection in Consumer Discretionary, Financial Services, and Industrials. The best performance in the category came from the Brighthouse/Artisan International Portfolio, which outperformed its benchmark by 3.5% in 2018. Much of the outperformance was a result of strong security selection within Technology, Materials, and Consumer Discretionary. In addition, the Brighthouse/Aberdeen Emerging Market Equity Portfolio was additive to relative results during the year, outperforming its benchmark by 0.7% as an underweight to China and positive security selection in Consumer Discretionary, Financial Services, and Technology supported returns.
Investment Committee
Brighthouse Investment Advisers, LLC
* This commentary may include statements that constitute “forward-looking statements” under the U.S. securities laws. Forward-looking statements include, among other things, projections, estimates, and information about possible or future results related to the Portfolio, market or regulatory developments. The views expressed above are not guarantees of future performance or economic results and involve certain risks, uncertainties and assumptions that could cause actual outcomes and results to differ materially from the views expressed herein. The views expressed above are subject to change at any time based upon economic, market, or other conditions and the subadvisory firm undertakes no obligation to update the views expressed herein. Any discussions of specific securities should not be considered a recommendation to buy or sell those securities. The views expressed above (including any forward-looking statement) may not be relied upon as investment advice or as an indication of the Portfolio’s trading intent. Information about the Portfolio’s holdings, asset allocation or country diversification is historical and is not an indication of future Portfolio composition, which may vary. Direct investment in any index is not possible. The performance of any index mentioned in this commentary has not been adjusted for ongoing management, distribution and operating expenses, and sales charges applicable to mutual fund investments. In addition, the returns do not reflect additional fees charged by separate accounts or variable insurance contracts that an investor in the Portfolio may pay. If these additional fees were reflected, performance would have been lower.
BHFTII-2
Brighthouse Funds Trust II
Brighthouse Asset Allocation 60 Portfolio
A $10,000 INVESTMENT COMPARED TO THE DOW JONES MODERATE INDEX
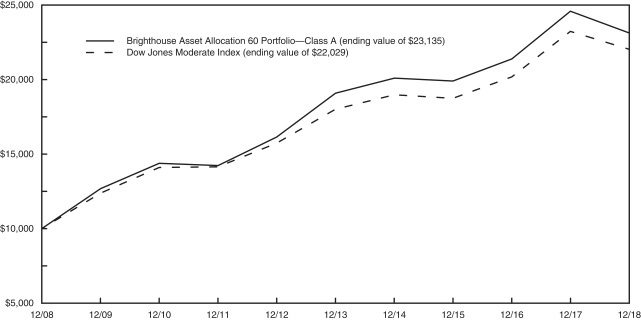
AVERAGE ANNUAL RETURNS (%) (FOR THE YEAR ENDED DECEMBER 31, 2018)
| | | | | | | | | | | | |
| | | | |
| | | 1 Year | | | 5 Year | | | 10 Year | |
| Brighthouse Asset Allocation 60 Portfolio | | | | | | | | | | | | |
Class A | | �� | -5.93 | | | | 3.91 | | | | 8.75 | |
Class B | | | -6.12 | | | | 3.65 | | | | 8.48 | |
| Dow Jones Moderate Index | | | -5.21 | | | | 4.11 | | | | 8.22 | |
1 The Dow Jones Moderate Index is a total return index designed to provide asset allocation strategists with a target risk benchmark. Each month, the Index adjusts its weighting of stocks, bonds, and cash indices (both domestic and foreign) such that the risk combination will have 60% of the risk of an all equity portfolio.
Portfolio performance is calculated including reinvestment of all income and capital gain distributions. Performance numbers are net of all Portfolio expenses but do not include any insurance, sales, separate account or administrative charges of variable annuity or life insurance contracts or any additional expenses that participants may bear relating to the operations of their plans. If these charges were included, the returns would be lower. The performance of any index referenced above has not been adjusted for ongoing management, distribution and operating expenses, and sales charges applicable to mutual fund investments. Direct investment in any index is not possible. The performance of Class A shares, as set forth in the line graph above, will differ from that of other classes because of the difference in expenses paid by policyholders investing in the different share classes.
This information represents past performance and is not indicative of future results. Investment return and principal value may fluctuate so that shares, upon redemption, may be worth more or less than the original cost.
PORTFOLIO COMPOSITION AS OF DECEMBER 31, 2018
Top Holdings
| | | | |
| | | % of
Net Assets | |
| BlackRock Bond Income Portfolio (Class A) | | | 7.0 | |
| PIMCO Total Return Portfolio (Class A) | | | 6.4 | |
| TCW Core Fixed Income Portfolio (Class A) | | | 5.8 | |
| MFS Value Portfolio (Class A) | | | 5.4 | |
| JPMorgan Core Bond Portfolio (Class A) | | | 4.8 | |
| Brighthouse/Wellington Core Equity Opportunities Portfolio (Class A) | | | 4.5 | |
| T. Rowe Price Large Cap Value Portfolio (Class A) | | | 4.4 | |
| Western Asset Management U.S. Government Portfolio (Class A) | | | 4.3 | |
| Invesco Comstock Portfolio (Class A) | | | 4.0 | |
| Harris Oakmark International Portfolio (Class A) | | | 3.5 | |
Asset Allocation
| | | | |
| | | % of
Net Assets | |
| Investment Grade Fixed Income | | | 33.6 | |
| U.S. Large Cap Equities | | | 32.3 | |
| International Developed Market Equities | | | 12.7 | |
| U.S. Small Cap Equities | | | 5.5 | |
| High Yield Fixed Income | | | 4.8 | |
| Global Equities | | | 3.4 | |
| International Fixed Income | | | 3.2 | |
| Emerging Market Equities | | | 1.8 | |
| Real Estate Equities | | | 1.5 | |
| U.S. Mid Cap Equities | | | 1.2 | |
BHFTII-3
Brighthouse Funds Trust II
Brighthouse Asset Allocation 60 Portfolio
Understanding Your Portfolio’s Expenses
Shareholder Expense Example
As a shareholder of the Portfolio, you incur ongoing costs, including management fees; distribution and service(12b-1) fees; and other Portfolio expenses. This example is intended to help you understand your ongoing costs (in dollars) (referred to as “expenses”) of investing in the Portfolio and compare these costs with the ongoing costs of investing in other mutual funds. The example is based on an investment of $1,000 invested at the beginning of the period and held for the entire period, July 1, 2018 through December 31, 2018.
Actual Expenses
The first line for each share class of the Portfolio in the table below provides information about actual account values and actual expenses. You may use the information in this line, together with the amount you invested in the particular share class of the Portfolio, to estimate the expenses that you paid over the period. Simply divide your account value by $1,000 (for example, an $8,600 account value divided by $1,000 = 8.6), then multiply the result by the number in the first line under the heading entitled “Expenses Paid During Period” to estimate the expenses you paid on your account during this period.
Hypothetical Example for Comparison Purposes
The second line for each share class of the Portfolio in the table below provides information about hypothetical account values and hypothetical expenses based on the Portfolio’s actual expense ratio and an assumed rate of return of 5% per year before expenses, which is not the Portfolio’s actual return. The hypothetical account values and expenses may not be used to estimate the actual ending account balance or expenses you paid for the period. You may use this information to compare the ongoing costs of investing in the Portfolio and other funds. To do so, compare this 5% hypothetical example with the 5% hypothetical examples that appear in the shareholder reports of the other funds.
Please note that the expenses shown in the table are meant to highlight your ongoing costs only and do not reflect any fees or charges of your variable insurance product or any additional expenses that participants in certain eligible qualified plans may bear relating to the operations of their plan. Therefore, the second line for each share class in the table is useful in comparing ongoing costs only, and will not help you determine the relative total costs of owning different funds. In addition, if these other costs were included, your costs would have been higher.
| | | | | | | | | | | | | | | | | | |
Brighthouse Asset Allocation 60 Portfolio
| | | |
Annualized
Expense
Ratio | | | Beginning
Account Value
July 1,
2018 | | | Ending
Account Value
December 31,
2018 | | | Expenses Paid
During Period**
July 1, 2018
to
December 31,
2018 | |
Class A (a) | | Actual | | | 0.63 | % | | $ | 1,000.00 | | | $ | 934.70 | | | $ | 3.07 | |
| | Hypothetical* | | | 0.63 | % | | $ | 1,000.00 | | | $ | 1,022.03 | | | $ | 3.21 | |
| | | | | |
Class B (a) | | Actual | | | 0.88 | % | | $ | 1,000.00 | | | $ | 934.30 | | | $ | 4.29 | |
| | Hypothetical* | | | 0.88 | % | | $ | 1,000.00 | | | $ | 1,020.77 | | | $ | 4.48 | |
| * | Hypothetical assumes a rate of return of 5% per year before expenses. |
| ** | Expenses paid are equal to the Portfolio’s annualized expense ratio for the most recent six month period, as shown above, multiplied by the average account value over the period, multiplied by the number of days (184 days) in the most recent fiscal half-year, divided by 365 (to reflect theone-half year period). |
| (a) | The annualized expense ratio reflects the expenses of both the Portfolio and the Underlying Portfolios in which it invests. |
BHFTII-4
Brighthouse Funds Trust II
Brighthouse Asset Allocation 60 Portfolio
Schedule of Investments as of December 31, 2018
Mutual Funds—100.0% of Net Assets
| | | | | | | | |
| Security Description | | Shares | | | Value | |
|
| Affiliated Investment Companies—100.0% | |
Baillie Gifford International Stock Portfolio (Class A) (a) | | | 36,558,227 | | | $ | 402,871,658 | |
BlackRock Bond Income Portfolio (Class A) (a) | | | 8,042,441 | | | | 827,888,891 | |
BlackRock Capital Appreciation Portfolio (Class A) (a) | | | 8,157,182 | | | | 316,743,365 | |
BlackRock High Yield Portfolio (Class A) (b) | | | 10,160,616 | | | | 73,664,465 | |
Brighthouse Small Cap Value Portfolio (Class A) (b) | | | 10,077,385 | | | | 136,447,791 | |
Brighthouse/Aberdeen Emerging Markets Equity Portfolio (Class A) (b) | | | 22,840,522 | | | | 217,898,576 | |
Brighthouse/Artisan International Portfolio (Class A) (b) | | | 35,226,670 | | | | 348,744,037 | |
Brighthouse/Artisan Mid Cap Value Portfolio (Class A) (a) | | | 133,503 | | | | 28,282,577 | |
Brighthouse/Dimensional International Small Company Portfolio (Class A) (a) | | | 9,926,977 | | | | 109,891,634 | |
Brighthouse/Eaton Vance Floating Rate Portfolio (Class A) (b) | | | 24,570,324 | | | | 245,703,237 | |
Brighthouse/Franklin Low Duration Total Return Portfolio (Class A) (b) | | | 26,524,713 | | | | 251,719,522 | |
Brighthouse/Templeton International Bond Portfolio (Class A) (b) (c) | | | 36,836,359 | | | | 376,099,228 | |
Brighthouse/Wellington Core Equity Opportunities Portfolio (Class A) (a) | | | 17,820,173 | | | | 534,783,394 | |
Brighthouse/Wellington Large Cap Research Portfolio (Class A) (b) | | | 26,170,908 | | | | 345,194,281 | |
Clarion Global Real Estate Portfolio (Class A) (b) | | | 16,911,822 | | | | 181,294,730 | |
ClearBridge Aggressive Growth Portfolio (Class A) (b) | | | 19,259,597 | | | | 313,161,040 | |
Harris Oakmark International Portfolio (Class A) (b) | | | 34,285,761 | | | | 416,914,858 | |
Invesco Comstock Portfolio (Class A) (b) | | | 36,055,979 | | | | 478,102,286 | |
Invesco Small Cap Growth Portfolio (Class A) (b) | | | 10,737,421 | | | | 134,432,508 | |
Jennison Growth Portfolio (Class A) (a) | | | 25,634,657 | | | | 371,702,530 | |
JPMorgan Core Bond Portfolio (Class A) (b) | | | 57,342,575 | | | | 574,572,601 | |
JPMorgan Small Cap Value Portfolio (Class A) (b) | | | 5,783,488 | | | | 81,894,192 | |
Loomis Sayles Small Cap Growth Portfolio (Class A) (a) | | | 4,160,073 | | | | 54,871,365 | |
MFS Research International Portfolio (Class A) (b) | | | 21,702,709 | | | | 234,172,234 | |
MFS Value Portfolio (Class A) (a) | | | 46,174,221 | | | | 637,665,993 | |
|
| Affiliated Investment Companies—(Continued) | |
Neuberger Berman Genesis Portfolio (Class A) (a) | | | 4,563,934 | | | | 84,706,611 | |
Oppenheimer Global Equity Portfolio (Class A) (b) | | | 5,571,250 | | | | 113,932,054 | |
PIMCO Inflation Protected Bond Portfolio (Class A) (b) | | | 39,557,945 | | | | 378,569,532 | |
PIMCO Total Return Portfolio (Class A) (b) | | | 66,950,653 | | | | 762,567,933 | |
T. Rowe Price Large Cap Growth Portfolio (Class A) (a) | | | 15,479,175 | | | | 320,573,717 | |
T. Rowe Price Large Cap Value Portfolio (Class A) (b) | | | 18,278,006 | | | | 523,482,105 | |
T. Rowe Price Mid Cap Growth Portfolio (Class A) (b) | | | 8,633,481 | | | | 87,975,168 | |
T. Rowe Price Small Cap Growth Portfolio (Class A) (a) | | | 7,789,260 | | | | 165,365,981 | |
TCW Core Fixed Income Portfolio (Class A) (b) | | | 69,103,821 | | | | 689,656,135 | |
Van Eck Global Natural Resources Portfolio (Class A) (a) | | | 37,935,992 | | | | 291,348,421 | |
Wells Capital Management Mid Cap Value Portfolio (Class A) (b) | | | 2,898,314 | | | | 28,867,206 | |
Western Asset Management Strategic Bond Opportunities Portfolio (Class A) (a) | | | 19,803,905 | | | | 251,113,515 | |
Western Asset Management U.S. Government Portfolio (Class A) (a) | | | 44,293,605 | | | | 508,933,522 | |
| | | | | | | | |
Total Mutual Funds
(Cost $12,406,314,547) | | | | | | | 11,901,808,893 | |
| | | | | | | | |
Total Investments—100.0%
(Cost $12,406,314,547) | | | | | | | 11,901,808,893 | |
Other assets and liabilities (net)—0.0% | | | | | | | (3,270,717 | ) |
| | | | | | | | |
| Net Assets—100.0% | | | | | | $ | 11,898,538,176 | |
| | | | | | | | |
| | | | |
| (a) | | A Portfolio of Brighthouse Funds Trust II. (See Note 6 of the Notes to Financial Statements for a summary of transactions in the securities of affiliated issuers.) |
| (b) | | A Portfolio of Brighthouse Funds Trust I. (See Note 6 of the Notes to Financial Statements for a summary of transactions in the securities of affiliated issuers.) |
| (c) | | Non-income producing security. |
Fair Value Hierarchy
Accounting principles generally accepted in the United States of America (“GAAP”) define fair market value as the price that the Portfolio would receive to sell an asset or pay to transfer a liability in an orderly transaction between market participants at the measurement date. It establishes a fair value hierarchy that prioritizes inputs to valuation methods and requires disclosure of the fair value hierarchy, separately for each major category of assets and liabilities, that segregates fair value measurements into three levels. Levels 1, 2 and 3 of the fair value hierarchy are defined as follows:
Level 1 - unadjusted quoted prices in active markets for identical investments
Level 2 - other significant observable inputs (including, but not limited to, quoted prices for similar assets or liabilities in markets that are either active or inactive; inputs other than quoted prices that are observable such as interest rates, yield curves, volatilities, prepayment speeds, loss severities, credit risks, default rates, or other market corroborated inputs)
Level 3 - significant unobservable inputs based on the best information available in the circumstances, to the extent observable inputs are unavailable (including the Portfolio’s own assumptions used in determining the fair value of investments and derivative financial instruments)
The inputs or methodologies used for valuing investments are not necessarily an indication of the risk associated with investing in them. Changes to the inputs or methodologies used may result in transfers between levels. A reconciliation of Level 3 securities, if any, will be disclosed following the fair value hierarchy table. For more information about the Portfolio’s policy regarding the valuation of investments, please refer to the Notes to Financial Statements.
The following table summarizes the fair value hierarchy of the Portfolio’s investments as of December 31, 2018:
| | | | | | | | | | | | | | | | |
| Description | | Level 1 | | | Level 2 | | | Level 3 | | | Total | |
| Mutual Funds | |
Affiliated Investment Companies | | $ | 11,901,808,893 | | | $ | — | | | $ | — | | | $ | 11,901,808,893 | |
Total Investments | | $ | 11,901,808,893 | | | $ | — | | | $ | — | | | $ | 11,901,808,893 | |
| | | | | | | | | | | | | | | | | |
See accompanying notes to financial statements.
BHFTII-5
Brighthouse Funds Trust II
Brighthouse Asset Allocation 60 Portfolio
Statement of Assets and Liabilities
December 31, 2018
| | | | |
Assets | |
Affiliated investments at value (a) | | $ | 11,901,808,893 | |
Receivable for: | |
Affiliated investments sold | | | 4,127,565 | |
Fund shares sold | | | 124,637 | |
| | | | |
Total Assets | | | 11,906,061,095 | |
Liabilities | |
Payables for: | |
Fund shares redeemed | | | 4,252,202 | |
Accrued Expenses: | |
Management fees | | | 546,770 | |
Distribution and service fees | | | 2,510,877 | |
Deferred trustees’ fees | | | 153,856 | |
Other expenses | | | 59,214 | |
| | | | |
Total Liabilities | | | 7,522,919 | |
| | | | |
Net Assets | | $ | 11,898,538,176 | |
| | | | |
Net Assets Consist of: | |
Paid in surplus | | $ | 11,235,662,856 | |
Distributable earnings (Accumulated losses) | | | 662,875,320 | |
| | | | |
Net Assets | | $ | 11,898,538,176 | |
| | | | |
Net Assets | |
Class A | | $ | 294,567,359 | |
Class B | | | 11,603,970,817 | |
Capital Shares Outstanding* | |
Class A | | | 26,058,809 | |
Class B | | | 1,032,636,685 | |
Net Asset Value, Offering Price and Redemption Price Per Share | |
Class A | | $ | 11.30 | |
Class B | | | 11.24 | |
| | | | |
| * | | The Portfolio is authorized to issue an unlimited number of shares. |
| (a) | | Identified cost of affiliated investments was $12,406,314,547. |
Statement of Operations
Year Ended December 31, 2018
| | | | |
Investment Income | |
Dividends from affiliated investments | | $ | 248,161,788 | |
| | | | |
Total investment income | | | 248,161,788 | |
Expenses | |
Management fees | | | 7,197,874 | |
Administration fees | | | 26,349 | |
Custodian and accounting fees | | | 28,054 | |
Distribution and service fees—Class B | | | 33,288,833 | |
Audit and tax services | | | 32,224 | |
Legal | | | 45,317 | |
Trustees’ fees and expenses | | | 33,734 | |
Miscellaneous | | | 18,642 | |
| | | | |
Total expenses | | | 40,671,027 | |
| | | | |
Net Investment Income | | | 207,490,761 | |
| | | | |
Net Realized and Unrealized Gain (Loss) | |
| Net realized gain on: | |
Affiliated investments | | | 426,938,179 | |
Capital gain distributions from affiliated investments | | | 597,468,006 | |
| | | | |
Net realized gain | | | 1,024,406,185 | |
| | | | |
Net change in unrealized depreciation on affiliated investments | | | (2,005,059,968 | ) |
| | | | |
Net realized and unrealized loss | | | (980,653,783 | ) |
| | | | |
Net Decrease in Net Assets From Operations | | $ | (773,163,022 | ) |
| | | | |
See accompanying notes to financial statements.
BHFTII-6
Brighthouse Funds Trust II
Brighthouse Asset Allocation 60 Portfolio
Statements of Changes in Net Assets
| | | | | | | | |
| | | Year Ended
December 31,
2018 | | | Year Ended
December 31,
2017 | |
Increase (Decrease) in Net Assets: | |
From Operations | |
Net investment income | | $ | 207,490,761 | | | $ | 207,880,140 | |
Net realized gain | | | 1,024,406,185 | | | | 577,797,244 | |
Net change in unrealized appreciation (depreciation) | | | (2,005,059,968 | ) | | | 1,198,485,030 | |
| | | | | | | | |
Increase (decrease) in net assets from operations | | | (773,163,022 | ) | | | 1,984,162,414 | |
| | | | | | | | |
From Distributions to Shareholders (a) | |
Class A | | | (18,769,198 | ) | | | (19,963,234 | ) |
Class B | | | (726,631,786 | ) | | | (802,669,110 | ) |
| | | | | | | | |
Total distributions | | | (745,400,984 | ) | | | (822,632,344 | ) |
| | | | | | | | |
Decrease in net assets from capital share transactions | | | (1,115,055,027 | ) | | | (864,851,554 | ) |
| | | | | | | | |
Total increase (decrease) in net assets | | | (2,633,619,033 | ) | | | 296,678,516 | |
|
Net Assets | |
Beginning of period | | | 14,532,157,209 | | | | 14,235,478,693 | |
| | | | | | | | |
End of period | | $ | 11,898,538,176 | | | $ | 14,532,157,209 | (b) |
| | | | | | | | |
Other Information:
Capital Shares
Transactions in capital shares were as follows:
| | | | | | | | | | | | | | | | |
| | | Year Ended
December 31, 2018 | | | Year Ended
December 31, 2017 | |
| | | Shares | | | Value | | | Shares | | | Value | |
Class A | |
Sales | | | 1,420,550 | | | $ | 17,773,311 | | | | 1,551,453 | | | $ | 19,031,190 | |
Reinvestments | | | 1,532,179 | | | | 18,769,198 | | | | 1,681,823 | | | | 19,963,234 | |
Redemptions | | | (3,848,173 | ) | | | (47,749,437 | ) | | | (4,448,039 | ) | | | (54,563,389 | ) |
| | | | | | | | | | | | | | | | |
Net decrease | | | (895,444 | ) | | $ | (11,206,928 | ) | | | (1,214,763 | ) | | $ | (15,568,965 | ) |
| | | | | | | | | | | | | | | | |
Class B | |
Sales | | | 7,906,396 | | | $ | 98,073,809 | | | | 8,139,195 | | | $ | 98,997,001 | |
Reinvestments | | | 59,608,842 | | | | 726,631,786 | | | | 67,907,708 | | | | 802,669,110 | |
Redemptions | | | (156,425,620 | ) | | | (1,928,553,694 | ) | | | (143,538,036 | ) | | | (1,750,948,700 | ) |
| | | | | | | | | | | | | | | | |
Net decrease | | | (88,910,382 | ) | | $ | (1,103,848,099 | ) | | | (67,491,133 | ) | | $ | (849,282,589 | ) |
| | | | | | | | | | | | | | | | |
Decrease derived from capital shares transactions | | | | | | $ | (1,115,055,027 | ) | | | | | | $ | (864,851,554 | ) |
| | | | | | | | | | | | | | | | |
| | | | |
| (a) | | Distributions from net investment income and realized gains are no longer required to be separately disclosed. The presentation for the year ended December 31, 2018 has been adjusted for this change (See Note 9). At December 31, 2017 the distributions were as follows. |
| | | | | | | | |
| | | Distributions from net
investment income: | | | Distributions from realized
capital gains: | |
Class A | | $ | (6,636,499 | ) | | $ | (13,326,735 | ) |
Class B | | | (243,506,359 | ) | | | (559,162,751 | ) |
| | | | |
| (b) | | As part of the update in (a), it is also no longer required to disclose the Undistributed net investment income (Accumulated losses) which was $223,273,994 as of December 31, 2017. |
See accompanying notes to financial statements.
BHFTII-7
Brighthouse Funds Trust II
Brighthouse Asset Allocation 60 Portfolio
Financial Highlights
| | | | | | | | | | | | | | | | | | | | |
| Selected per share data | |
| | | Class A | |
| | | Year Ended December 31, | |
| | | 2018 | | | 2017 | | | 2016 | | | 2015 | | | 2014 | |
Net Asset Value, Beginning of Period | | $ | 12.72 | | | $ | 11.76 | | | $ | 12.50 | | | $ | 13.57 | | | $ | 13.74 | |
| | | | | | | | | | | | | | | | | | | | |
Income (Loss) from Investment Operations | |
Net investment income (a) | | | 0.22 | | | | 0.21 | | | | 0.21 | | | | 0.32 | | | | 0.21 | |
Net realized and unrealized gain (loss) | | | (0.92 | ) | | | 1.50 | | | | 0.63 | | | | (0.41 | ) | | | 0.48 | |
| | | | | | | | | | | | | | | | | | | | |
Total income (loss) from investment operations | | | (0.70 | ) | | | 1.71 | | | | 0.84 | | | | (0.09 | ) | | | 0.69 | |
| | | | | | | | | | | | | | | | | | | | |
Less Distributions | |
Distributions from net investment income | | | (0.24 | ) | | | (0.25 | ) | | | (0.43 | ) | | | (0.10 | ) | | | (0.32 | ) |
Distributions from net realized capital gains | | | (0.48 | ) | | | (0.50 | ) | | | (1.15 | ) | | | (0.88 | ) | | | (0.54 | ) |
| | | | | | | | | | | | | | | | | | | | |
Total distributions | | | (0.72 | ) | | | (0.75 | ) | | | (1.58 | ) | | | (0.98 | ) | | | (0.86 | ) |
| | | | | | | | | | | | | | | | | | | | |
Net Asset Value, End of Period | | $ | 11.30 | | | $ | 12.72 | | | $ | 11.76 | | | $ | 12.50 | | | $ | 13.57 | |
| | | | | | | | | | | | | | | | | | | | |
Total Return (%) (b) | | | (5.93 | ) | | | 14.93 | | | | 7.47 | | | | (0.99 | ) | | | 5.29 | |
|
Ratios/Supplemental Data | |
Ratio of expenses to average net assets (%) (c) | | | 0.05 | | | | 0.05 | | | | 0.05 | | | | 0.05 | | | | 0.05 | |
Ratio of net investment income to average net assets (%) (d) | | | 1.76 | | | | 1.68 | | | | 1.74 | | | | 2.40 | | | | 1.58 | |
Portfolio turnover rate (%) | | | 10 | | | | 6 | | | | 10 | | | | 15 | | | | 16 | |
Net assets, end of period (in millions) | | $ | 294.6 | | | $ | 343.0 | | | $ | 331.2 | | | $ | 330.1 | | | $ | 353.0 | |
| |
| | | Class B | |
| | | Year Ended December 31, | |
| | | 2018 | | | 2017 | | | 2016 | | | 2015 | | | 2014 | |
Net Asset Value, Beginning of Period | | $ | 12.65 | | | $ | 11.69 | | | $ | 12.44 | | | $ | 13.52 | | | $ | 13.69 | |
| | | | | | | | | | | | | | | | | | | | |
Income (Loss) from Investment Operations | |
Net investment income (a) | | | 0.19 | | | | 0.17 | | | | 0.18 | | | | 0.28 | | | | 0.05 | |
Net realized and unrealized gain (loss) | | | (0.91 | ) | | | 1.51 | | | | 0.62 | | | | (0.41 | ) | | | 0.61 | |
| | | | | | | | | | | | | | | | | | | | |
Total income (loss) from investment operations | | | (0.72 | ) | | | 1.68 | | | | 0.80 | | | | (0.13 | ) | | | 0.66 | |
| | | | | | | | | | | | | | | | | | | | |
Less Distributions | |
Distributions from net investment income | | | (0.21 | ) | | | (0.22 | ) | | | (0.40 | ) | | | (0.07 | ) | | | (0.29 | ) |
Distributions from net realized capital gains | | | (0.48 | ) | | | (0.50 | ) | | | (1.15 | ) | | | (0.88 | ) | | | (0.54 | ) |
| | | | | | | | | | | | | | | | | | | | |
Total distributions | | | (0.69 | ) | | | (0.72 | ) | | | (1.55 | ) | | | (0.95 | ) | | | (0.83 | ) |
| | | | | | | | | | | | | | | | | | | | |
Net Asset Value, End of Period | | $ | 11.24 | | | $ | 12.65 | | | $ | 11.69 | | | $ | 12.44 | | | $ | 13.52 | |
| | | | | | | | | | | | | | | | | | | | |
Total Return (%) (b) | | | (6.12 | ) | | | 14.73 | | | | 7.11 | | | | (1.27 | ) | | | 5.05 | |
| | | | | |
Ratios/Supplemental Data | | | | | | | | | | | | | | | | | | | | |
Ratio of expenses to average net assets (%) (c) | | | 0.30 | | | | 0.30 | | | | 0.30 | | | | 0.30 | | | | 0.30 | |
Ratio of net investment income to average net assets (%) (d) | | | 1.51 | | | | 1.43 | | | | 1.52 | | | | 2.15 | | | | 0.39 | |
Portfolio turnover rate (%) | | | 10 | | | | 6 | | | | 10 | | | | 15 | | | | 16 | |
Net assets, end of period (in millions) | | $ | 11,604.0 | | | $ | 14,189.2 | | | $ | 13,904.3 | | | $ | 14,389.8 | | | $ | 16,127.1 | |
| | | | |
| (a) | | Per share amounts based on average shares outstanding during the period. |
| (b) | | Total return does not reflect any insurance, sales, separate account or administrative charges of variable annuity or life insurance contracts or any additional expenses that contract owners may bear under their variable contracts. If these charges were included, the returns would be lower. |
| (c) | | The ratio of operating expenses to average net assets does not include expenses of the Underlying Portfolios in which the Asset Allocation Portfolio invests. |
| (d) | | Recognition of net investment income by the Asset Allocation Portfolio is affected by the timing of the declaration of dividends by the Underlying Portfolios in which it invests. |
See accompanying notes to financial statements.
BHFTII-8
Brighthouse Funds Trust II
Brighthouse Asset Allocation 60 Portfolio
Notes to Financial Statements—December 31, 2018
1. Organization
Brighthouse Funds Trust II (the “Trust”) is organized as a Delaware statutory trust and registered under the Investment Company Act of 1940, as amended (the “1940 Act”), as anopen-end management investment company. The Trust, which is managed by Brighthouse Investment Advisers, LLC (“Brighthouse Investment Advisers” or the “Adviser”), currently offers twenty-nine series, each of which operates as a distinct investment vehicle of the Trust. The series included in this report is Brighthouse Asset Allocation 60 Portfolio (the “Asset Allocation Portfolio”), which is diversified. The Asset Allocation Portfolio operates under a “fund of funds” structure, investing substantially all of its assets in other Portfolios advised by Brighthouse Investment Advisers (each, an “Underlying Portfolio,” and, collectively, the “Underlying Portfolios”). Shares of the Portfolio are not offered directly to the general public and are currently available only to separate accounts of insurance companies, including insurance companies affiliated with the Adviser (together, the “Insurance Companies”).
The Asset Allocation Portfolio has registered and offers two classes of shares: Class A and B shares. Shares of each Class of the Asset Allocation Portfolio represent an equal pro rata interest in the Asset Allocation Portfolio and generally give the shareholder the same voting, dividend, liquidation, and other rights. Investment income, realized and unrealized capital gains and losses, the common expenses of the Asset Allocation Portfolio, and certain Asset Allocation Portfolio-level expense reductions, if any, are allocated on a pro rata basis to each Class based on the relative net assets of each Class to the net assets of the Asset Allocation Portfolio. Each Class of shares differs in its respective distribution plan and such distribution expenses are allocated to the corresponding Class of shares.
2. Significant Accounting Policies
The preparation of financial statements in conformity with accounting principles generally accepted in the United States of America (“GAAP”) requires management to make estimates and assumptions that affect the reported amounts of assets and liabilities and disclosure of contingent assets and liabilities as of the date of the financial statements and the reported amounts of income and expenses during the reporting period. Actual results could differ from those estimates. In the preparation of these financial statements, management has evaluated events and transactions subsequent to December 31, 2018 through the date the financial statements were issued.
The Asset Allocation Portfolio is an investment company and follows the accounting and reporting guidance of the Financial Accounting Standards Board (“FASB”) Accounting Standards Codification Topic946- Financial Services- Investment Companies. The following is a summary of significant accounting policies consistently followed by the Asset Allocation Portfolio in the preparation of its financial statements.
Investment Valuation and Fair Value Measurements -The Asset Allocation Portfolio values its portfolio investments for purposes of calculating its net asset value (“NAV”) using procedures approved by the Board of Trustees of the Trust (the “Board” or “Trustees”). Those procedures allow for a variety of methodologies to be used to value the Asset Allocation Portfolio’s investments. The specific methodologies used for a particular investment may vary based on the market data available for a specific investment at the time the Asset Allocation Portfolio calculates its NAV or based on other considerations. The procedures also permit a level of judgment to be used in the valuation process. The Asset Allocation Portfolio follows the accounting and reporting guidance of FASB Accounting Standards Codification Topic820- Fair Value Measurement.
Investments in the Underlying Portfolios are valued at their closing daily NAV on the valuation date. Investments in the Underlying Portfolios are categorized as Level 1 within the fair value hierarchy. For information about the use of fair value pricing by the Underlying Portfolios, please refer to the prospectuses of the Underlying Portfolios.
Investment Transactions and Related Investment Income -The Asset Allocation Portfolio’s security transactions are recorded on the trade date. Dividend income is recorded on theex-dividend date. Interest income is recorded on the accrual basis. Realized gains and losses on investments and unrealized appreciation and depreciation are determined on the identified cost basis, which is the same basis used for federal income tax purposes. Capital gains distributions received from the Underlying Portfolios are recorded as net realized gain in the Statement of Operations.
Dividends and Distributions to Shareholders - The Asset Allocation Portfolio records dividends and distributions on theex-dividend date. Net realized gains from securities transactions (if any) are generally distributed annually to shareholders. The timing and characterization of certain income and capital gains distributions are determined in accordance with federal tax regulations that may differ from GAAP. Permanent book and tax basis differences relating to shareholder distributions will result in reclassification between distributable earnings (accumulated losses) andpaid-in surplus. These adjustments have no impact on net assets or the results of operations.
Income Taxes - It is the Asset Allocation Portfolio’s policy to comply with the requirements of the Internal Revenue Code of 1986, as amended, and regulations thereunder, applicable to regulated investment companies, and to distribute, with respect to each taxable
BHFTII-9
Brighthouse Funds Trust II
Brighthouse Asset Allocation 60 Portfolio
Notes to Financial Statements—December 31, 2018—(Continued)
year, all of its taxable income to shareholders. Therefore, no federal income tax provision is required. The Asset Allocation Portfolio files U.S. federal tax returns. No income tax returns are currently under examination. The Asset Allocation Portfolio’s federal tax returns for the prior three fiscal years remain subject to examination by the Internal Revenue Service. As of December 31, 2018, the Asset Allocation Portfolio had no uncertain tax positions that would require financial statement recognition, or derecognition or disclosure.
3. Certain Risks
In the normal course of business, the Underlying Portfolios invest in securities and enter into transactions where risks exist. Those risks include:
Market Risk:The value of securities held by the Underlying Portfolios may decline in response to certain events, including those directly involving the issuers whose securities are owned by the Underlying Portfolios; conditions affecting the general economy; overall market changes; local, regional or global political, social or economic instability; and currency, interest rate, and price fluctuations.
Credit and Counterparty Risk: The Underlying Portfolios may be exposed to counterparty risk, or the risk that an entity with which the Underlying Portfolios have unsettled or open transactions may default. The potential loss could exceed the value of the financial assets and liabilities recorded in the financial statements. Financial assets that potentially expose the Underlying Portfolios to credit and counterparty risk consist principally of cash due from counterparties and investments. The Underlying Portfolios manage counterparty risk by entering into agreements only with counterparties that they believe have the financial resources to honor their obligations and by monitoring the financial stability of those counterparties. The Adviser attempts to mitigate counterparty risk by (i) periodically assessing the creditworthiness of their trading partners, (ii) monitoring and/or limiting the amount of their net exposure to each individual counterparty based on the adviser’s assessment, and (iii) requiring collateral from the counterparty for certain transactions. In order to preserve certain safeguards fornon-standard settlement trades, the Underlying Portfolios restrict their exposure to credit and counterparty losses by entering into master netting agreements (“Master Agreements”) with counterparties (approved brokers) with whom the Underlying Portfolios undertake a significant volume of transactions. Master Agreements govern the terms of certain transactions, and reduce the counterparty risk associated with relevant transactions by specifying credit protection mechanisms and providing standardization that improves legal certainty. Master Agreements can also help limit counterparty risk by specifying collateral posting arrangements atpre-arranged exposure levels.
The Asset Allocation Portfolio’s prospectus includes a discussion of the principal risks of investing in the Asset Allocation Portfolio and in the Underlying Portfolios in which it invests.
4. Investment Transactions
Aggregate cost of purchases and proceeds of sales of shares of the Underlying Portfolios by the Asset Allocation Portfolio for the year ended December 31, 2018 were as follows:
| | | | | | | | | | | | |
Purchases | | | Sales | |
U.S. Government | | Non-U.S. Government | | | U.S. Government | | | Non-U.S. Government | |
| $0 | | $ | 1,328,211,342 | | | $ | 0 | | | $ | 2,384,308,071 | |
5. Investment Management Fees and Other Transactions with Affiliates
Investment Management Agreement - Brighthouse Investment Advisers is the investment adviser to the Asset Allocation Portfolio. The Trust has entered into an investment management agreement with Brighthouse Investment Advisers with respect to the Asset Allocation Portfolio. For providing investment management services to the Asset Allocation Portfolio, Brighthouse Investment Advisers receives monthly compensation at the following annual rates:
| | | | | | |
Management Fees earned by
Brighthouse Investment Advisers for
the year ended December 31, 2018 | | % per annum | | | Average Daily Net Assets |
| $7,197,874 | | | 0.100 | % | | Of the first $500 million |
| | | 0.075 | % | | Of the next $500 million |
| | | 0.050 | % | | On amounts in excess of $1 billion |
In addition to the above management fee paid to Brighthouse Investment Advisers, the Asset Allocation Portfolio indirectly pays Brighthouse Investment Advisers an investment advisory fee through its investments in the Underlying Portfolios.
Certain officers and trustees of the Trust may also be officers of Brighthouse Investment Advisers however, such officers and trustees receive no compensation from the Trust.
BHFTII-10
Brighthouse Funds Trust II
Brighthouse Asset Allocation 60 Portfolio
Notes to Financial Statements—December 31, 2018—(Continued)
Transfer Agency Agreement -Brighthouse Financial, Inc. serves as the transfer agent for the Trust. Brighthouse Financial, Inc. receives no fees for its services to the Trust.
Distribution and Service Fees -The Trust has a distribution agreement with Brighthouse Securities, LLC (the “Distributor”) pursuant to which the Distributor serves as the general distributor of shares of each class (each a “Class”) of each Portfolio. The Distributor is an affiliate of the Trust. The Trust has adopted a Distribution and Services Plan (the “Plan”) relating to Class B shares of each Portfolio, under Rule 12b-1 under the 1940 Act, pursuant to which the Trust may pay the Distributor a fee (the “Service Fee”) at an annual rate not to exceed 0.25% of each such Portfolio’s average daily net assets attributable to the Class B shares of the Trust. Each Portfolio may not offer shares of each Class. The Plan also authorizes the Trust, on behalf of each of its Portfolios, may pay the Distributor a distribution Fee (the “Distribution Fee” and together with the Service Fee, the “Fees”) at an annual rate of up to 0.25% of each Portfolio’s average daily net assets attributable to the Class B in consideration of the services rendered in connection with the sale of such shares by the Distributor. Under the Distribution Agreement with respect to the Trust, Fees are currently paid at an annual rate of 0.25% of average daily net assets in the case of Class B shares. The Plan is known as a “compensation plan” because the Trust makes payments to the Distributor for services rendered regardless of the actual level of expenditures by the Distributor. Amounts incurred by the Portfolio for the year ended December 31, 2018 are shown as Distribution and service fees in the Statement of Operations.
Deferred Trustee Compensation -Each Trustee who is not currently an employee of the Adviser or any of its affiliates receives compensation from the Trust for his or her service to the Trust. A deferred compensation plan (the “Plan”) is available to the Trustees on a voluntary basis. Deferred amounts remain in the Trust until distributed in accordance with the provisions of the Plan. The value of a participating Trustee’s deferral account is based on theoretical investments of deferred amounts on the normal payment dates in certain portfolios of the Trust or Brighthouse Funds Trust I, an affiliate of the Trust, as designated by the participating Trustee. Changes in the value of participants’ deferral accounts are reflected as Trustees’ fees and expenses in the Statement of Operations. The portion of the accrued obligations allocated to the Portfolio under the Plan is reflected as Deferred trustees’ fees in the Statement of Assets and Liabilities.
6. Transactions in Securities of Affiliated Issuers
The Asset Allocation Portfolio does not invest in the Underlying Portfolios for the purpose of exercising control; however, investments by the Asset Allocation Portfolio within its principal investment strategies may represent a significant portion of the Underlying Portfolios’ net assets. Transactions in the Underlying Portfolios for the year ended December 31, 2018 were as follows:
| | | | | | | | | | | | | | | | | | | | | | | | |
Security Description | | Market Value
December 31, 2017 | | | Purchases | | | Sales | | | Realized
Gain/
(Loss) | | | Change in
Unrealized
Appreciation/
(Depreciation) | | | Ending Value
as of
December 31, 2018 | |
Baillie Gifford International Stock Portfolio (Class A) | | $ | 367,290,325 | | | $ | 138,673,785 | | | $ | (18,349,818 | ) | | $ | 6,888,095 | | | $ | (91,630,729 | ) | | $ | 402,871,658 | |
BlackRock Bond Income Portfolio (Class A) | | | 937,204,948 | | | | 30,639,223 | | | | (104,815,341 | ) | | | (3,773,869 | ) | | | (31,366,070 | ) | | | 827,888,891 | |
BlackRock Capital Appreciation Portfolio (Class A) | | | 438,752,454 | | | | 50,747,749 | | | | (144,918,060 | ) | | | 50,914,066 | | | | (78,752,844 | ) | | | 316,743,365 | |
BlackRock High Yield Portfolio (Class A) | | | 87,707,763 | | | | 4,260,313 | | | | (12,169,612 | ) | | | (2,015,671 | ) | | | (4,118,328 | ) | | | 73,664,465 | |
Brighthouse Small Cap Value Portfolio (Class A) | | | 146,222,771 | | | | 38,050,103 | | | | (12,902,077 | ) | | | 1,977,805 | | | | (36,900,811 | ) | | | 136,447,791 | |
Brighthouse/Aberdeen Emerging Markets Equity Portfolio (Class A) | | | 257,588,183 | | | | 19,186,404 | | | | (18,861,811 | ) | | | 947,111 | | | | (40,961,311 | ) | | | 217,898,576 | |
Brighthouse/Artisan International Portfolio (Class A) | | | 328,666,068 | | | | 91,894,807 | | | | (23,160,566 | ) | | | 3,229,151 | | | | (51,885,423 | ) | | | 348,744,037 | |
Brighthouse/Artisan Mid Cap Value Portfolio (Class A) | | | 73,169,341 | | | | 2,067,430 | | | | (40,435,745 | ) | | | 9,909,377 | | | | (16,427,826 | ) | | | 28,282,577 | |
Brighthouse/Dimensional International Small Company Portfolio (Class A) | | | 147,053,336 | | | | 12,980,709 | | | | (9,195,800 | ) | | | 445,478 | | | | (41,392,089 | ) | | | 109,891,634 | |
Brighthouse/Eaton Vance Floating Rate Portfolio (Class A) | | | 290,810,424 | | | | 10,669,386 | | | | (47,717,826 | ) | | | 1,692,504 | | | | (9,751,251 | ) | | | 245,703,237 | |
Brighthouse/Franklin Low Duration Total Return Portfolio (Class A) | | | 287,353,076 | | | | 5,685,681 | | | | (37,573,248 | ) | | | (1,912,307 | ) | | | (1,833,680 | ) | | | 251,719,522 | |
Brighthouse/Templeton International Bond Portfolio (Class A) | | | 422,397,317 | | | | 166,828 | | | | (52,035,429 | ) | | | 858,800 | | | | 4,711,712 | | | | 376,099,228 | |
Brighthouse/Wellington Core Equity Opportunities Portfolio (Class A) | | | 659,216,437 | | | | 44,837,872 | | | | (130,302,537 | ) | | | 6,264,099 | | | | (45,232,477 | ) | | | 534,783,394 | |
Brighthouse/Wellington Large Cap Research Portfolio (Class A) | | | 438,830,661 | | | | 52,651,796 | | | | (75,150,207 | ) | | | 13,311,704 | | | | (84,449,673 | ) | | | 345,194,281 | |
Clarion Global Real Estate Portfolio (Class A) | | | 220,223,742 | | | | 12,837,318 | | | | (21,790,646 | ) | | | 4,465,323 | | | | (34,441,007 | ) | | | 181,294,730 | |
ClearBridge Aggressive Growth Portfolio (Class A) | | | 475,383,613 | | | | 20,652,999 | | | | (145,364,842 | ) | | | 84,218,352 | | | | (121,729,082 | ) | | | 313,161,040 | |
Harris Oakmark International Portfolio (Class A) | | | 477,461,694 | | | | 116,490,002 | | | | (26,780,352 | ) | | | 4,381,399 | | | | (154,637,885 | ) | | | 416,914,858 | |
Invesco Comstock Portfolio (Class A) | | | 695,981,162 | | | | 49,099,138 | | | | (156,571,687 | ) | | | 57,481,771 | | | | (167,888,098 | ) | | | 478,102,286 | |
Invesco Small Cap Growth Portfolio (Class A) | | | 219,322,835 | | | | 20,922,448 | | | | (77,800,404 | ) | | | (3,253,002 | ) | | | (24,759,369 | ) | | | 134,432,508 | |
Jennison Growth Portfolio (Class A) | | | 508,798,991 | | | | 67,496,154 | | | | (154,410,888 | ) | | | 49,504,040 | | | | (99,685,767 | ) | | | 371,702,530 | |
JPMorgan Core Bond Portfolio (Class A) | | | 646,643,567 | | | | 18,810,923 | | | | (72,822,867 | ) | | | (5,482,030 | ) | | | (12,576,992 | ) | | | 574,572,601 | |
JPMorgan Small Cap Value Portfolio (Class A) | | | 109,342,013 | | | | 7,231,984 | | | | (15,044,585 | ) | | | 1,295,631 | | | | (20,930,851 | ) | | | 81,894,192 | |
Loomis Sayles Small Cap Growth Portfolio (Class A) | | | 73,002,014 | | | | 9,094,598 | | | | (20,933,433 | ) | | | 4,967,215 | | | | (11,259,029 | ) | | | 54,871,365 | |
MFS Research International Portfolio (Class A) | | | 293,941,976 | | | | 5,943,908 | | | | (22,521,773 | ) | | | 3,251,713 | | | | (46,443,590 | ) | | | 234,172,234 | |
MFS Value Portfolio (Class A) | | | 733,278,851 | | | | 60,066,385 | | | | (131,905,094 | ) | | | 29,659,596 | | | | (53,433,745 | ) | | | 637,665,993 | |
MFS Value Portfolio II (Class A) | | | 110,019,478 | | | | 31,673,871 | | | | (2,633,914 | ) | | | 83,148 | | | | (139,142,583 | ) | | | — | |
Neuberger Berman Genesis Portfolio (Class A) | | | 146,521,277 | | | | 13,212,927 | | | | (57,983,799 | ) | | | 25,446,193 | | | | (42,489,987 | ) | | | 84,706,611 | |
Oppenheimer Global Equity Portfolio (Class A) | | | 146,511,783 | | | | 14,484,019 | | | | (16,304,799 | ) | | | 4,027,074 | | | | (34,786,023 | ) | | | 113,932,054 | |
BHFTII-11
Brighthouse Funds Trust II
Brighthouse Asset Allocation 60 Portfolio
Notes to Financial Statements—December 31, 2018—(Continued)
| | | | | | | | | | | | | | | | | | | | | | | | |
Security Description | | Market Value
December 31, 2017 | | | Purchases | | | Sales | | | Realized
Gain/(Loss) | | | Change in
Unrealized
Appreciation /
(Depreciation) | | | Ending Value
as of
December 31, 2018 | |
PIMCO Inflation Protected Bond Portfolio (Class A) | | $ | 433,309,974 | | | $ | 7,634,271 | | | $ | (45,780,810 | ) | | $ | (5,875,982 | ) | | $ | (10,717,921 | ) | | $ | 378,569,532 | |
PIMCO Total Return Portfolio (Class A) | | | 863,802,717 | | | | 13,364,710 | | | | (100,482,239 | ) | | | (12,056,015 | ) | | | (2,061,240 | ) | | | 762,567,933 | |
T. Rowe Price Large Cap Growth Portfolio (Class A) | | | 435,972,718 | | | | 69,697,913 | | | | (122,664,783 | ) | | | 30,872,017 | | | | (93,304,148 | ) | | | 320,573,717 | |
T. Rowe Price Large Cap Value Portfolio (Class A) | | | 731,946,557 | | | | 72,326,891 | | | | (157,555,719 | ) | | | 49,316,740 | | | | (172,552,364 | ) | | | 523,482,105 | |
T. Rowe Price Mid Cap Growth Portfolio (Class A) | | | 146,107,849 | | | | 13,795,088 | | | | (59,303,878 | ) | | | 12,650,513 | | | | (25,274,404 | ) | | | 87,975,168 | |
T. Rowe Price Small Cap Growth Portfolio (Class A) | | | 219,757,542 | | | | 17,252,963 | | | | (46,411,594 | ) | | | 8,578,235 | | | | (33,811,165 | ) | | | 165,365,981 | |
TCW Core Fixed Income Portfolio (Class A) | | | 774,872,464 | | | | 19,509,630 | | | | (85,786,819 | ) | | | (1,349,020 | ) | | | (17,590,120 | ) | | | 689,656,135 | |
Van Eck Global Natural Resources Portfolio (Class A) | | | 293,994,295 | | | | 132,942,260 | | | | (17,509,681 | ) | | | (1,533,586 | ) | | | (116,544,867 | ) | | | 291,348,421 | |
Wells Capital Management Mid Cap Value Portfolio (Class A) | | | 36,703,020 | | | | 3,423,233 | | | | (3,501,414 | ) | | | (787,164 | ) | | | (6,970,469 | ) | | | 28,867,206 | |
Western Asset Management Strategic Bond Opportunities Portfolio (Class A) | | | 290,934,864 | | | | 14,732,282 | | | | (29,186,342 | ) | | | 994,290 | | | | (26,361,579 | ) | | | 251,113,515 | |
Western Asset Management U.S. Government Portfolio (Class A) | | | 569,929,311 | | | | 13,003,341 | | | | (65,667,632 | ) | | | (2,654,615 | ) | | | (5,676,883 | ) | | | 508,933,522 | |
| | | | | | | | | | | | | | | | | | | | | | | | |
| | $ | 14,536,027,411 | | | $ | 1,328,211,342 | | | $ | (2,384,308,071 | ) | | $ | 426,938,179 | | | $ | (2,005,059,968 | ) | | $ | 11,901,808,893 | |
| | | | | | | | | | | | | | | | | | | | | | | | |
| | | | | | | | | | | | |
Security Description | | Capital Gain
Distributions
from Affiliated
Investments | | | Income earned
from affiliates
during the period | | | Number of
shares held at
December 31, 2018 | |
Baillie Gifford International Stock Portfolio (Class A) | | $ | — | | | $ | 5,237,601 | | | | 36,558,227 | |
BlackRock Bond Income Portfolio (Class A) | | | — | | | | 30,453,659 | | | | 8,042,441 | |
BlackRock Capital Appreciation Portfolio (Class A) | | | 50,195,241 | | | | 473,614 | | | | 8,157,182 | |
BlackRock High Yield Portfolio (Class A) | | | — | | | | 4,259,400 | | | | 10,160,616 | |
Brighthouse Small Cap Value Portfolio (Class A) | | | 8,935,890 | | | | 2,138,754 | | | | 10,077,385 | |
Brighthouse/Aberdeen Emerging Markets Equity Portfolio (Class A) | | | — | | | | 6,561,657 | | | | 22,840,522 | |
Brighthouse/Artisan International Portfolio (Class A) | | | — | | | | 5,777,853 | | | | 35,226,670 | |
Brighthouse/Artisan Mid Cap Value Portfolio (Class A) | | | 1,841,520 | | | | 218,080 | | | | 133,503 | |
Brighthouse/Dimensional International Small Company Portfolio (Class A) | | | 9,312,604 | | | | 3,624,073 | | | | 9,926,977 | |
Brighthouse/Eaton Vance Floating Rate Portfolio (Class A) | | | — | | | | 10,661,066 | | | | 24,570,324 | |
Brighthouse/Franklin Low Duration Total Return Portfolio (Class A) | | | — | | | | 5,661,881 | | | | 26,524,713 | |
Brighthouse/Templeton International Bond Portfolio (Class A) | | | — | | | | — | | | | 36,836,359 | |
Brighthouse/Wellington Core Equity Opportunities Portfolio (Class A) | | | 33,703,002 | | | | 11,106,888 | | | | 17,820,173 | |
Brighthouse/Wellington Large Cap Research Portfolio (Class A) | | | 48,276,362 | | | | 4,351,744 | | | | 26,170,908 | |
Clarion Global Real Estate Portfolio (Class A) | | | — | | | | 12,741,786 | | | | 16,911,822 | |
ClearBridge Aggressive Growth Portfolio (Class A) | | | 17,529,082 | | | | 3,108,704 | | | | 19,259,597 | |
Harris Oakmark International Portfolio (Class A) | | | 18,813,925 | | | | 8,954,845 | | | | 34,285,761 | |
Invesco Comstock Portfolio (Class A) | | | 43,799,004 | | | | 5,165,484 | | | | 36,055,979 | |
Invesco Small Cap Growth Portfolio (Class A) | | | 20,900,828 | | | | — | | | | 10,737,421 | |
Jennison Growth Portfolio (Class A) | | | 65,783,511 | | | | 1,551,269 | | | | 25,634,657 | |
JPMorgan Core Bond Portfolio (Class A) | | | — | | | | 18,624,261 | | | | 57,342,575 | |
JPMorgan Small Cap Value Portfolio (Class A) | | | 5,876,866 | | | | 1,341,828 | | | | 5,783,488 | |
Loomis Sayles Small Cap Growth Portfolio (Class A) | | | 9,080,692 | | | | — | | | | 4,160,073 | |
MFS Research International Portfolio (Class A) | | | — | | | | 5,930,885 | | | | 21,702,709 | |
MFS Value Portfolio (Class A) | | | 48,338,464 | | | | 11,511,433 | | | | 46,174,221 | |
MFS Value Portfolio II (Class A) | | | 28,245,876 | | | | 3,397,231 | | | | — | |
Neuberger Berman Genesis Portfolio (Class A) | | | 12,835,283 | | | | 367,876 | | | | 4,563,934 | |
Oppenheimer Global Equity Portfolio (Class A) | | | 12,778,149 | | | | 1,691,989 | | | | 5,571,250 | |
PIMCO Inflation Protected Bond Portfolio (Class A) | | | — | | | | 7,591,507 | | | | 39,557,945 | |
PIMCO Total Return Portfolio (Class A) | | | — | | | | 13,171,140 | | | | 66,950,653 | |
T. Rowe Price Large Cap Growth Portfolio (Class A) | | | 68,012,467 | | | | 1,595,682 | | | | 15,479,175 | |
T. Rowe Price Large Cap Value Portfolio (Class A) | | | 59,430,562 | | | | 12,747,945 | | | | 18,278,006 | |
T. Rowe Price Mid Cap Growth Portfolio (Class A) | | | 13,793,432 | | | | — | | | | 8,633,481 | |
T. Rowe Price Small Cap Growth Portfolio (Class A) | | | 16,995,061 | | | | 247,114 | | | | 7,789,260 | |
TCW Core Fixed Income Portfolio (Class A) | | | — | | | | 19,254,308 | | | | 69,103,821 | |
Van Eck Global Natural Resources Portfolio (Class A) | | | — | | | | 654,635 | | | | 37,935,992 | |
Wells Capital Management Mid Cap Value Portfolio (Class A) | | | 2,990,185 | | | | 429,560 | | | | 2,898,314 | |
Western Asset Management Strategic Bond Opportunities Portfolio (Class A) | | | — | | | | 14,704,493 | | | | 19,803,905 | |
Western Asset Management U.S. Government Portfolio (Class A) | | | — | | | | 12,851,543 | | | | 44,293,605 | |
| | | | | | | | | | | | |
| | $ | 597,468,006 | | | $ | 248,161,788 | | | | | |
| | | | | | | | | | | | |
BHFTII-12
Brighthouse Funds Trust II
Brighthouse Asset Allocation 60 Portfolio
Notes to Financial Statements—December 31, 2018—(Continued)
7. Contractual Obligations
Under the Trust’s organizational documents, its officers and Trustees may be indemnified against certain liabilities and expenses arising out of the performance of their duties to the Trust. Additionally, the Trust has a variety of indemnification obligations under contracts with its service providers. The Trust’s maximum exposure under these arrangements is unknown, as this would involve future claims that may be made against the Trust that have not yet occurred.
8. Income Tax Information
The cost basis of investments for federal income tax purposes at December 31, 2018 was as follows:
| | | | |
Cost basis of investments | | $ | 12,470,061,426 | |
| | | | |
Gross unrealized appreciation | | | 153,594,368 | |
Gross unrealized depreciation | | | (721,846,902 | ) |
| | | | |
Net unrealized appreciation (depreciation) | | $ | (568,252,534 | ) |
| | | | |
The tax character of distributions paid for the years ended December 31, 2018 and 2017 were as follows:
| | | | | | | | | | | | | | | | | | | | |
Ordinary Income | | | Long-Term Capital Gain | | | Total | |
2018 | | 2017 | | | 2018 | | | 2017 | | | 2018 | | | 2017 | |
| $224,544,990 | | $ | 250,142,858 | | | $ | 520,855,994 | | | $ | 572,489,486 | | | $ | 745,400,984 | | | $ | 822,632,344 | |
As of December 31, 2018, the components of distributable earnings (accumulated losses) on a federal income tax basis were as follows:
| | | | | | | | | | | | | | | | |
Undistributed
Ordinary
Income | | Undistributed
Long-Term
Capital Gain | | | Net
Unrealized
Depreciation | | | Accumulated
Capital Losses | | | Total | |
| $240,895,972 | | $ | 990,385,737 | | | $ | (568,252,534 | ) | | $ | — | | | $ | 663,029,175 | |
The Asset Allocation Portfolio utilizes the provisions of the federal income tax laws that provide for the carryforward of capital losses for prior years, offsetting such losses against any future realized capital gains. Under the Regulated Investment Company Modernization Act of 2010, net capital losses recognized after December 22, 2010 may be carried forward indefinitely and their character is retained as short-term and/or long-term losses.
As of December 31, 2018, the Asset Allocation Portfolio had no accumulated capital losses.
9. Recent Accounting Pronouncements and SEC Update
In August 2018, the FASB issued Accounting Standards Update 2018-13, Fair Value Measurement (Topic 820)—Disclosure Framework—Changes to the Disclosure Requirements for Fair Value Measurement (“ASU 2018-13”) which introduces new fair value disclosure requirements as well as eliminates and modifies certain existing fair value disclosure requirements. ASU 2018-13 is effective for fiscal years beginning after December 15, 2019, and interim periods within those fiscal years. Early adoption is permitted and, as such, management has elected to early adopt ASU 2018-13 effective with the current reporting period. The impact of the Portfolio’s adoption was limited to changes in the Portfolio’s financial statement disclosures regarding fair value, primarily those disclosures related to transfers between levels of the fair value hierarchy.
In August 2018, the Securities and Exchange Commission released its Final Rule on Disclosure Update and Simplification (the “Final Rule”) which is intended to simplify an issuer’s disclosure compliance efforts by removing redundant or outdated disclosures requirements without significantly altering the mix of information provided to investors. Effective with the current reporting period, the Portfolio adopted the Final Rule with the most notable impacts being that the Portfolio is no longer required to present the components of distributable earnings on the Statement of Assets and Liabilities or the sources of distributions to shareholders and the amounts of undistributed net investment income on the Statements of Changes in Net Assets.
BHFTII-13
Brighthouse Funds Trust II
Brighthouse Asset Allocation 60 Portfolio
Report of Independent Registered Public Accounting Firm
To the Shareholders of Brighthouse Asset Allocation 60 Portfolio and the Board of Trustees of Brighthouse Funds Trust II:
Opinion on the Financial Statements and Financial Highlights
We have audited the accompanying statement of assets and liabilities, including the schedule of investments, of the Brighthouse Asset Allocation 60 Portfolio (the “Portfolio”), one of the portfolios constituting the Brighthouse Funds Trust II, as of December 31, 2018, the related statement of operations for the year then ended, the statements of changes in net assets for each of the two years in the period then ended, the financial highlights for each of the five years in the period then ended, and the related notes. In our opinion, the financial statements and financial highlights present fairly, in all material respects, the financial position of the Brighthouse Asset Allocation 60 Portfolio of the Brighthouse Funds Trust II as of December 31, 2018, the results of its operations for the year then ended, the changes in its net assets for each of the two years in the period then ended, and the financial highlights for each of the five years in the period then ended, in conformity with accounting principles generally accepted in the United States of America.
Basis for Opinion
These financial statements and financial highlights are the responsibility of the Portfolio’s management. Our responsibility is to express an opinion on the Portfolio’s financial statements and financial highlights based on our audits. We are a public accounting firm registered with the Public Company Accounting Oversight Board (United States) (PCAOB) and are required to be independent with respect to the Portfolio in accordance with the U.S. federal securities laws and the applicable rules and regulations of the Securities and Exchange Commission and the PCAOB.
We conducted our audits in accordance with the standards of the PCAOB. Those standards require that we plan and perform the audit to obtain reasonable assurance about whether the financial statements and financial highlights are free of material misstatement, whether due to error or fraud. The Portfolio is not required to have, nor were we engaged to perform, an audit of its internal control over financial reporting. As part of our audits we are required to obtain an understanding of internal control over financial reporting but not for the purpose of expressing an opinion on the effectiveness of the Portfolio’s internal control over financial reporting. Accordingly, we express no such opinion.
Our audits included performing procedures to assess the risks of material misstatement of the financial statements and financial highlights, whether due to error or fraud, and performing procedures that respond to those risks. Such procedures included examining, on a test basis, evidence regarding the amounts and disclosures in the financial statements and financial highlights. Our audits also included evaluating the accounting principles used and significant estimates made by management, as well as evaluating the overall presentation of the financial statements and financial highlights. Our procedures included confirmation of securities owned as of December 31, 2018, by correspondence with the transfer agent. We believe that our audits provide a reasonable basis for our opinion.
/s/ Deloitte & Touche LLP
Boston, Massachusetts
February 25, 2019
We have served as the auditor of one or more of the Brighthouse investment companies since 1983.
BHFTII-14
Brighthouse Funds Trust II
Trustees and Officers
MANAGEMENT OF THE TRUSTS
The Boards of Trustees (the “Board”) of Brighthouse Funds Trust I and Brighthouse Funds Trust II (“BHF I” and “BHF II”, respectively, and collectively the “Trusts”) supervise the Trusts and are responsible for representing the interests of shareholders. The Trustees, the Chairman of the Board and the Chairmen of each subcommittee are the same for both Trusts. The Trustees of each Trust meet periodically throughout the year to oversee the Portfolios’ activities, reviewing, among other things, each Portfolio’s performance and its contractual arrangements with various service providers. The Trustees of each Trust elect the officers of the Trust, who are responsible for administering the Trust’sday-to-day operations.
Trustees and Officers
The Trustees and executive officers of the Trusts, as well as their principal occupations during the past five years, are set forth below. Unless otherwise indicated, the business address of each is c/o Brighthouse Funds, One Financial Center, Boston, Massachusetts 02111. Each Trustee who is deemed an “interested person,” as such term is defined in the 1940 Act, is referred to as an “Interested Trustee.” Those Trustees who are not “interested persons,” as such term is defined in the 1940 Act, are referred to as “Independent Trustees.” There is no limit to the term a Trustee may serve. Trustees serve until their death, resignation or removal in accordance with the BHF I Trust’s and BHF II Trust’s respective organizational documents and policies adopted by the Boards of the respective Trusts from time to time. Officers hold office at the pleasure of each Board and serve until their removal or resignation in accordance with the Trusts’ respective organizational documents and policies adopted by the Board of each Trust from time to time.
| | | | | | | | | | |
Name and Year of Birth | | Current
Position(s)
Held with
Registrant | | Term of Office
and Length of
Time Served | | Principal Occupation(s) During the Past 5 Years(1) | | Number of
Portfolios in
Brighthouse Funds
Complex(2)
Overseen
by Trustee | | Other Directorships Held
by Trustee During
the Past 5 Years(1) |
| Interested Trustee |
John Rosenthal* (1960) | | Trustee | | Indefinite;
From
May
2016
(Trust I
and
Trust II) to
present | | Chief Investment Officer, Brighthouse Financial, Inc. (2017 to present); until 2017, Senior Managing Director and Head of Global Portfolio Management, MetLife, Inc. | | 72 | | None |
|
| Independent Trustees |
Dawn M. Vroegop (1966) | | Trustee and Chairman of the Board | | Indefinite;
From
December
2000
(Trust I)/
May
2009
(Trust II)
to present
as
Trustee;
From
May
2016
(Trust I
and
Trust II)
until
present as
Chairman | | Private Investor. | | 72 | | Trustee, Driehaus Mutual Funds.** |
BHFTII-15
Brighthouse Funds Trust II
Trustees and Officers—(Continued)
| | | | | | | | | | |
Name and Year of Birth | | Current
Position(s)
Held with
Registrant | | Term of Office
and Length of
Time Served | | Principal Occupation(s) During the Past 5 Years(1) | | Number of
Portfolios in
Brighthouse Funds
Complex(2)
Overseen
by Trustee | | Other Directorships Held
by Trustee During
the Past 5 Years(1) |
Stephen M. Alderman (1959) | | Trustee | | Indefinite;
From
December
2000
(Trust I)/
April
2012
(Trust II)
to present | | Shareholder in the law firm of Garfield and Merel, Ltd. | | 72 | | None |
| | | | | |
Robert J. Boulware (1956) | | Trustee | | Indefinite;
From
March
2008
(Trust I)/
April
2012
(Trust II)
to present | | Managing Director, Pilgrim Funds, LLC (private equity fund). | | 72 | | Trustee, Vertical Capital Income Fund(closed-end fund);** Director, Gainsco, Inc. (auto insurance);** Trustee, SharesPost 100 Fund(closed-end fund).** |
| | | | | |
Susan C. Gause (1952) | | Trustee | | Indefinite;
From
March
2008
(Trust I)/
April
2012
(Trust II)
to present | | Private Investor. | | 72 | | Trustee, HSBC Funds.** |
| | | | | |
Nancy Hawthorne (1951) | | Trustee | | Indefinite;
From
May
2003
(Trust II)/
April
2012
(Trust I) to
present | | Partner, Hawthorne Financial Advisors, LLC (registered investment advisor); until 2014, Chief Executive Officer, Clerestory LLC (corporate advisor). | | 72 | | Director and Chairman of the Board of Directors, THL Credit, Inc.;** Director and Chairman of the Board, Avid Technology, Inc.;** Director, CRA International, Inc.** |
| | | | | |
Barbara A. Nugent (1956) | | Trustee | | Indefinite;
From
January
2014
(Trust I
and
Trust II) to
present | | President, True North Board Governance, LLC (consulting); until December 2013, partner in the law firm of Stradley Ronon Stevens & Young, LLP. | | 72 | | Independent Lead Trustee, BMT Investment Funds** |
| | | | | |
Christopher J. Towle (1957) | | Trustee | | Indefinite;
From
April
2018
(Trust I
and
Trust II) to
present | | Retired; until 2014, Partner, Portfolio Manager, Director of High Yield and Convertible Strategies, Lord Abbett & Co. | | 72 | | Trustee, Driehaus Mutual Funds** |
BHFTII-16
Brighthouse Funds Trust II
Trustees and Officers—(Continued)
Officers
| | | | | | |
Name and Year of Birth | | Position(s)
Held with
Registrant | | Length of
Time Served | | Principal Occupation(s)
During the Past 5 Years(1) |
| Executive Officers | | | | | | |
Kristi Slavin (1973) | | President and Chief Executive Officer, of Trust I and Trust II | | From May
2016
(Trust I
and
Trust II) to
present | | President, Brighthouse Investment Advisers, LLC (2016-present); formerly, Senior Vice President, MetLife Advisers, LLC; Vice President, MetLife, Inc.; Vice President, Trust I and Trust II(2015-2016). |
| | | |
Alan R. Otis (1971) | | Chief Financial Officer and Treasurer, of Trust I and Trust II | | From
November
2017
(Trust I
and
Trust II) to
present | | Senior Vice President, Brighthouse Investment Advisers, LLC (2017-present); formerly, Vice President, Brighthouse Investment Advisers, LLC (2012-2017); Assistant Treasurer, Trust I and Trust II(2012-2017). |
| | | |
Andrew L. Gangolf (1954) | | Secretary, of Trust I and Trust II | | From May
2011
(Trust I
and
Trust II) to
present | | Executive Vice President, Brighthouse Investment Advisers, LLC (2017-present); formerly, Senior Vice President, MetLife Advisers, LLC (2011-2017); until 2011, Senior Vice President & Assistant General Counsel, AllianceBernstein Investments, Inc. |
| | | |
Steven E. Hartstein (1963) | | Chief Compliance Officer (“CCO”), of Trust I and Trust II | | From
February
2014
(Trust I
and
Trust II) to
present | | Senior Vice President and CCO, Brighthouse Investment Advisers, LLC (2017-present); Head of Investments Compliance, Vice President, Brighthouse Financial, Inc. (2017-present); formerly, Vice President, MetLife, Inc. (2013-2017); Senior Vice President and CCO, MetLife Advisers, LLC (2013-2017.) |
| | | |
Victor Soto (1978) | | Vice President of Trust I and Trust II | | From May
2018
(Trust I
and
Trust II) to
present | | Executive Vice President, Brighthouse Investment Advisers, LLC (2016-present); Assistant Vice President, MetLife Inc. (2015-2017); Portfolio Manager, 1st Global (2013-2015). |
| * | Mr. Rosenthal is an “interested person” of the Trusts because of his position with Brighthouse Financial, Inc., the current parent company of Brighthouse Investment Advisers, LLC. |
| ** | Indicates a directorship with a registered investment company or a company subject to the reporting requirements of the Securities Exchange Act of 1934, as amended. |
| (1) | Previous positions during the past five years with the Trusts, Brighthouse Financial, Inc., MetLife, Inc. or the Manager are omitted if not materially different. |
| (2) | The Fund Complex includes 43 BHF I Portfolios and 29 BHF II Portfolios. |
BHFTII-17
Brighthouse Funds Trust II
Brighthouse Asset Allocation 60 Portfolio
Board of Trustees’ Consideration of Advisory Agreements
At anin-person meeting held on November6-8, 2018 (the “November Meeting”), the Boards of Trustees (the “Board”) of Brighthouse Funds Trust I and Brighthouse Funds Trust II (“BFT I” and “BFT II,” respectively, and collectively, the “Trusts”), including a majority of the Trustees who are not “interested persons” of the Trusts (the “Independent Trustees”) under the Investment Company Act of 1940 (the “1940 Act”), approved the continuation of the Trusts’ advisory agreements (the “Advisory Agreements” or “Agreements”) with Brighthouse Investment Advisers, LLC (the “Adviser”) for the series of the Trusts (each a “Portfolio,” and collectively, the “Portfolios”).
In making those approvals, the Board reviewed a variety of materials that were provided for the specific purpose of the annual contract renewal process. In addition, various materials provided to and discussed with the Board throughout the year informed the Board’s decision to renew the Agreements. In particular, the information for each Portfolio included, but was not limited to, investment performance reports, and reports on expenses, legal and compliance matters, asset pricing, brokerage commissions and trade execution.
The Board met in person with personnel of the Adviser on October 17, 2018 for the specific purpose of giving preliminary consideration to the proposed continuation of the Agreements (the “October Meeting”). At that meeting, the Adviser reviewed with the Board the performance and fees experienced by each Portfolio, as well as other information. During and after the October Meeting, the Independent Trustees communicatedfollow-up matters for management to address at the November Meeting. The Independent Trustees were advised by independent legal counsel throughout the contract renewal process, and met with independent legal counsel in several executive sessions outside of the presence of management.
Information furnished and reviewed specifically in connection with the renewal process included, but was not limited to, a report for each Portfolio that was prepared by Broadridge (“Broadridge”), an independent organization. In addition, the Independent Trustees reviewed a report that was prepared by JDL Consultants, LLC (“JDL”), an independent consultant to the Independent Trustees (“JDL Report”), which examined the comparative fees, expenses and performance of each Portfolio, based upon the Broadridge reports. Also, the Board reviewed the responses to wide-ranging questions from the Independent Trustees relating to the business, operations and performance of the Adviser, and aPortfolio-by-Portfolio analysis of the profitability to the Adviser of each Agreement, each of which was prepared by the Adviser specifically for the renewal process.
At the November Meeting, the Board, including a majority of the Independent Trustees, concluded that the nature, extent and quality of services provided by the Adviser supported the renewal of the Agreements. The Board also concluded that the investment performance of each Portfolio was such that each Agreement should continue, and that the fees paid by each Portfolio to the Adviser appeared to be reasonable in light of the nature, extent and quality of the services provided by the Adviser. Further, the Board concluded that the Adviser’s profitability in providing services under the Advisory Agreements did not appear unreasonable in light of the nature, extent and quality of the services provided by the Adviser. Finally, the Board reviewed the extent to which the investment advisory fees paid by the Portfolios shared economies of scale with investors and concluded that those considerations generally supported the renewal of each Agreement. In approving the renewal of each of the Agreements, the Board, including the Independent Trustees, gave attention to all of the information that was furnished and each Trustee placed varying degrees of importance on the various pieces of information that were provided to them. The Board evaluated the information on aPortfolio-by-Portfolio basis, and its decision was made separately with respect to each Portfolio. The following paragraphs provide more information about some of the primary factors that were relevant to the Board’s decision. The Board did not identify any single factor as determinative, and the Trustees generally attributed different weights to various factors for the various Portfolios.
Nature, extent and quality of services. The Board evaluated the nature, extent and quality of the services that the Adviser has provided to the Brighthouse Asset Allocation 20 Portfolio, Brighthouse Asset Allocation 40 Portfolio, Brighthouse Asset Allocation 60 Portfolio Brighthouse Asset Allocation 80 Portfolio and Brighthouse Asset Allocation 100 Portfolio (the “Asset Allocation Portfolios”) and the American Funds Balanced Allocation Portfolio, American Funds Growth Allocation Portfolio and American Funds Moderate Allocation Portfolio (the “American Funds of Funds”). The Board considered the Adviser’s services as investment manager to the Portfolios, including its trading practices and oversight of transition management (as applicable), compliance program and personnel, and risk management, among other things. The Adviser’s services in coordinating and overseeing the activities of the Trusts’ service providers were also considered. The Board considered information received from the Trusts’ Chief Compliance Officer (“CCO”) regarding the Portfolios’ compliance policies and procedures that were established pursuant to Rule38a-l under the 1940 Act. The Board also noted that the Adviser’s investment, compliance and legal staff regularly review and assess the services that are provided to the Portfolios, and that personnel of the Adviser prepare and present reports to the Independent Trustees regarding material information related to those reviews and assessments. In addition, throughout the year, the Board considered the expertise, experience and performance of the personnel of the Adviser who performed the various services that are mentioned above.
BHFTII-18
Brighthouse Funds Trust II
Brighthouse Asset Allocation 60 Portfolio
Board of Trustees’ Consideration of Advisory Agreements—(Continued)
With respect to the Asset Allocation Portfolios, the Board noted that the Adviser has hired at its own expense an independent consultant to provide research and consulting services with respect to the periodic asset allocation targets for each of the Asset Allocation Portfolios and investments in other Portfolios of the Trusts (the “Underlying Portfolios”). Additionally, the Board considered that a committee, consisting of investment professionals from the Adviser, meets regularly to review the asset allocations and discuss the performance of the Asset Allocation Portfolios and the American Funds of Funds.
The Board further considered and found that the advisory fee paid to the Adviser with respect to each Asset Allocation Portfolio and American Fund of Funds was based on services provided that were in addition to, rather than duplicative of, the services provided pursuant to the advisory agreements for the Underlying Portfolios in which the Portfolio invests.
Performance. The Board placed emphasis on the performance of each Portfolio in light of, among other things, its importance to investors. The Board considered the Adviser’s quarterly reviews with the Board of detailed information about each Portfolio’s investment strategies and performance results and composition, including discussions regarding the relevant effect of current market conditions. The Board reviewed and considered the reports prepared by Broadridge, which provided a statistical analysis comparing the Portfolios’ investment performance to that of comparable funds underlying variable insurance products (the “Performance Universe”). The Independent Trustees also met separately with representatives of JDL during the October Meeting to review the JDL Report. The Board considered each Portfolio’s performance for periods subsequent to the performance period covered by the Broadridge reports, and the Adviser’s discussion of the same, including the effect of current market conditions on each Portfolio’s more recent performance. The Board focused particular attention on Portfolios with less favorable performance records. The Board also noted that while it found the data provided by Broadridge generally useful, it recognized the limitations of such data, including, in particular, that notable differences may exist between a Portfolio and those of the other funds in a Broadridge category (for example, the investment objectives(s) and investment strategies) and that the results of the performance comparisons may vary depending on (i) the end dates for the performance periods that were selected and (ii) the selection of the peer groups.
Fees and Expenses. The Board gave consideration to the level and method of computing the fees payable under the Agreements. The Board considered the Broadridge report for each of the Portfolios, which included comparisons for each Portfolio of its contractual management fees (at current and various asset levels), and total expenses, with those of its peers, including as those peers were divided into a broad group of peer funds (“Expense Universe”) and a narrower group of peer funds (“Expense Group”). Broadridge selected the peer funds which were similarly situated funds underlying variable insurance products deemed to be comparable to the Portfolios. The Independent Trustees, with the assistance of JDL, also examined the JDL Report.
The Board also considered that the Adviser had entered into expense limitation or management fee waiver agreements with certain of the Portfolios pursuant to which the Adviser had agreed to waive a portion of its advisory fee and/or reimburse certain expenses as a means of limiting a Portfolio’s total annual operating expenses.
Profitability. The Board examined the profitability to the Adviser of each Agreement on aPortfolio-by-Portfolio basis. In the case of the Asset Allocation Portfolios, the Board also considered the Adviser’s analysis of its profitability that was attributable to its management of the Underlying Portfolios of the Trust in which the Asset Allocation Portfolios invest. The Board further considered that an affiliate of the Adviser, Brighthouse Securities, LLC, serves as distributor for the Portfolios, and, as such, receives Rule12b-1 payments to support the distribution of the Portfolios. In reviewing the profitability analyses, the Board recognized that expense allocation methodologies are inherently subjective and various expense allocation methodologies may be reasonable while producing different results.
Economies of scale. The Board also considered each Portfolio’s fees in light of its size. The Board noted the fee schedules for the Portfolios that contain breakpoints that reduce the fee rate above specified asset levels. The Board noted those Portfolios that did not contain breakpoints in the advisory fee and took into account management’s discussion of the same. The Board considered the effective fees under the Advisory Agreement for each Portfolio as a percentage of assets at different asset levels and possible economies of scale that may be realized if the assets of the Portfolio grow. The Board examined, among other data, the effect of a Portfolio’s growth in size on various fee schedules and reviewed the Broadridge and JDL Reports, which compared fees among peers. The Board also generally noted that if a Portfolio’s assets increase over time, the Portfolio may realize other economies of scale if assets increase proportionally more than fixed expenses.
Other factors. The Board considered other benefits that may be realized by the Adviser and its affiliates from their relationship with the Trusts. Among them, the Board recognized that Brighthouse Securities, LLC, as the distributor for the Trusts, receives payments pursuant to Rule12b-1 from the Portfolios to compensate for the provision of shareholder services and distribution activities, which could lead to growth in the Trusts’ assets and corresponding benefits from such growth, including economies of scale. In conjunction with these considerations, the Board noted the ongoing commitment of the Adviser to the Portfolios.
BHFTII-19
Brighthouse Funds Trust II
Brighthouse Asset Allocation 60 Portfolio
Board of Trustees’ Consideration of Advisory Agreements—(Continued)
The Board requested, received, and considered information from the Adviser regarding possible conflicts of interest in the form of material benefits to the Adviser resulting from the Adviser’s affiliations and business relationships, as relevant. The Board considered the services that are provided to the Trusts by its service providers, and the manner in which any conflicts were mitigated.
* * *
Brighthouse Asset Allocation 60 Portfolio.The Board also considered the following information in relation to the Agreement with the Adviser regarding the Portfolio:
Among other data relating specifically to the Portfolio’s performance, the Board considered that the Portfolio outperformed the median of its Performance Universe for theone-, three-, and five-year periods ended June 30, 2018. The Board also considered that the Portfolio outperformed the average of its Morningstar category for theone-year period ended June 30, 2018, and underperformed the average of its Morningstar category for the three-year and five-year periods ended June 30, 2018. The Board further considered that the Portfolio underperformed the Brighthouse AA 60 Narrow Index for theone-, three- and five-year periods ended September 30, 2018. The Board also noted that the Portfolio outperformed the Dow Jones Moderate Index for the three-year and five-year periods ended September 30, 2018, but underperformed for theone-year period ended September 30, 2018.
The Board also considered that the Portfolio’s actual management fees were equal to the Expense Group median and below the Expense Universe median. The Board considered that the Portfolio’s total expenses (exclusive of12b-l fees) were below the Expense Group median and the Expense Universe median. The Board noted that the Portfolio’s contractual management fees were below the asset-weighted average of comparable funds at the Portfolio’s current size.
BHFTII-20
Brighthouse Funds Trust II
Brighthouse Asset Allocation 80 Portfolio
Managed by Brighthouse Investment Advisers, LLC
Portfolio Manager Commentary*
PERFORMANCE
For theone-year period ended December 31, 2018, the Class A and B shares of the Brighthouse Asset Allocation 80 Portfolio returned-7.91% and-8.11%, respectively. The Portfolio’s benchmark, the Dow Jones Moderately Aggressive Index1, returned-7.33%.
MARKET ENVIRONMENT/CONDITIONS
After a great 2017 withrecord-low volatility and the strongest January stock market since 1997, investors got shaken back to reality in February when equity markets took a dive following higher-than-expected wage growth. The concern was that this would lead to higher inflation followed by additional Federal Reserve (the “Fed”) interest rate hikes, leading to an unceremonious end to the second-longest economic expansion on record. However, inflation fears soon after fizzled (at least until the end of 2018) and the Fed stayed the course, despite the Tax Cuts and Jobs Act of 2017 providing a noteworthy lift to gross domestic product (“GDP”) growth. GDP growth, incidentally, is on track to reach the highest annual level since before the2008-09 recession. However, an escalating trade war between the U.S. and many of its major trading partners sent another wave of anxiety toward the market, which responded by pulling back sharply once again.
The beginning of the year turned out to be a microcosm of the remainder of 2018. This point in the economic cycle finds many market participants scrambling for indications that the expansion will end. As such, equity markets have become irrationally sensitive to individual data points, both positive and negative, with little regard to their historic predictive power on market results. The consequence was elevated market volatility in the second quarter, driven by positive economic growth and an accommodative Fed on one side, and on the other side by negative trade war and housing market news. In the third quarter, however, equity markets rebounded as corporate profits hit a newall-time high, GDP growth for second quarter came in at 4.2%, and unemployment dropped to 3.7%—the lowest number since 1969. The result in the third quarter was the best quarterly return for the S&P 500 Index since 2013.
As we got to the fourth quarter though, sentiment turned significantly worse, and the S&P 500 Index did an about-face, delivering its worst quarterly return since 2011. Gone was the sense of confidence that the strong economy could propel equity markets ever higher. Front and center were concerns about the continued trade war escalation,mid-term election uncertainty, a housing market dampened by rising interest rates and lofty prices, and a Fed that was now deemed too hawkish by projecting two additional rate hikes in 2019, despite having raised rates 4 times in 2018 (from a target range of1.25%-1.50% to a target range of2.25%-2.5%) and despite the market volatility.
News from overseas did little to attenuate concerns on the home front. Troubling to many is the ongoing Brexit (United Kingdom’s decision to withdraw from the European Union) situation, as leaders in the U.K. struggle to agree on a deal ensuring an orderly exit from the E.U.—an exit which is scheduled to occur on March 29, 2019. Highlighting the extent of disagreement are the two votes of confidence in Prime Minister Theresa May’s leadership, held in December 2018 and January 2019, both of which she won (in the U.K., a vote of confidence is a procedure used to remove a prime minister from office). Concerns about slowing growth in China have been receiving headlines as well. Leadership in China is in the middle of a long-term plan which is designed to transition the country from a manufacturing-driven economy to a service-driven economy. More worrisome to market participants is the fact that China is also in the process of dealing with an increasingly large debt burden as that plan unfolds. The outcome of both is unclear, which has led to some increased market volatility. However, it was confidence-inspiring that China had enough wherewithal to take the foot off the brake when it saw its economic growth rates declining faster than intended.
All in all, 2018 was a difficult year for investors. The economy is growing at a healthy pace, but the main question is for how long? The uncertainty caused all the major asset classes to be down for the year except for core bonds, which managed to creep in to positive territory, barely eking out a positive return with 0.01% for the year (as measured by the Bloomberg Barclays U.S. Aggregate Bond Index). International equities were generally the worst-performing asset classes with Emerging Markets equity and Foreign Developed equity down 14.6% and 13.8% respectively, as measured by the MSCI Emerging Markets Index and the MSCI EAFE Index. U.S. Large Cap equity did significantly better but was still down 4.4% for the year as measured by the S&P 500 Index, whereas Mid Cap equity lost 9.1% and Small Cap equity lost 11.0% for the year, as measured by the Russell Mid Cap and the Russell 2000 indices, in that order.
PORTFOLIO REVIEW / PERIOD END POSITIONING
The Brighthouse Asset Allocation 80 Portfolio invests in underlying portfolios of the Brighthouse Funds Trust I and the Brighthouse Funds Trust II to maintain a broad asset allocation of approximately 80% to equities and 20% to fixed income. Over the twelve-month period, the Portfolio fell short of the Dow Jones Moderately Aggressive Index. Strong performance within the Mid and Small Cap portfolios and a favorable overweight to Large Cap equity was insufficient to attenuate the combination of underperformance within Large Cap and International equity—both detractors.
The overall contribution from the underlying fixed income portfolios to relative performance was flat in 2018. The biggest contributor by far to performance was the Brighthouse/Templeton International Bond Portfolio, which outpaced its benchmark by 3.1%. The strategy’s relative outperformance during the period was primarily attributable to currency positions, notably, the portfolio’s underweight position in the euro and the Australian dollar. Outside of currency exposure, short duration positioning in the U.S. helped returns as well. The Brighthouse/Eaton Vance Floating Rate Portfolio outperformed its benchmark by 0.1%. The portfolio’s underweight to
BHFTII-1
Brighthouse Funds Trust II
Brighthouse Asset Allocation 80 Portfolio
Managed by Brighthouse Investment Advisers, LLC
Portfolio Manager Commentary*—(Continued)
defaulted loans aided performance relative to its benchmark over the year, as did favorable security selection in Financial Services and Energy. At the other end of the spectrum was the Western Asset Management Strategic Bond Opportunities Portfolio, which lagged its benchmark by 3.8%. Portfolio performance was negatively impacted by its U.S. duration and yield curve positioning, as well as currency and emerging markets positions. During the year, corporate credit spreads widened and experienced heightened levels of volatility. As such, the portfolio’s investment grade corporate credit positions were also negative contributors to performance. Also detracting in fixed income was the Brighthouse/Franklin Low Duration Total Return Portfolio, which underperformed its benchmark by 0.9%, largely driven by Collateralized Loan Obligation positions.
Contribution from the underlying domestic equity portfolios to relative performance was flat, as the Mid Cap and Small Cap equity portfolios made up for the underperformance by the Large Cap equity portfolios. Within Large Cap, the Brighthouse/Wellington Core Equity Opportunities Portfolio had a strong year, as it outperformed its benchmark by 4.7%. Strong security selection within Consumer Discretionary, Consumer Staples, and Materials sectors helped. The ClearBridge Aggressive Growth Portfolio, on the other hand, experienced considerable underperformance in 2018, falling shy of its benchmark by 4.7% for the period. The underperformance was driven by an unfavorable overweight to Energy, in addition to suboptimal security selection within Information Technology, Consumer Discretionary, and Industrials. Another laggard for the period was the Invesco Comstock Portfolio, which underperformed its benchmark by 3.7% for the year. The result was primarily due to an overweight to Energy and unfavorable security selection within Financial Services, Healthcare, and Energy. Within Mid Cap equity, the Morgan Stanley Mid Cap Growth Portfolio significantly outperformed its benchmark by 15.2%, largely due to favorable security selection and, to a lesser extent, sector allocations. Positive security selection in Health Care, Technology, and Communication Services drove a majority of the portfolio’s relative outperformance. Within Small Cap equity, four out of six managers outperformed their respective benchmarks. The strongest performer was the Loomis Sayles Small Cap Growth Portfolio, which outperformed its benchmark by 9.9% in 2018. The portfolio benefitted significantly from strong security selection within Healthcare, Technology, and Consumer Discretionary. In addition, the Neuberger Berman Genesis Portfolio outperformed its benchmark by 6.2% in 2018 as the portfolio’s focus on higher-quality companies with higher return on equity paid off. Security selection in Healthcare, Consumer Staples, and Information Technology made the largest positive impact on relative results.
Non-U.S. equity was a headwind to relative performance in 2018. Most notably, the Harris Oakmark International Portfolio underperformed its benchmark by 9.9% during the year as security selection and country weightings caused returns to suffer. Performance compared to the benchmark was hurt by holdings in the U.K., Germany, and France as well as suboptimal security selection in Consumer Discretionary, Financial Services, and Industrials. The Van Eck Global Natural Resources Portfolio underperformed its benchmark by 7.6% for the year. The underperformance was primarily driven by overweight positions and underperformance in the Oil & Gas Exploration and Oil & Gas Drillingsub-industries. The best performance in the category came from the Brighthouse/Artisan International Portfolio, which outperformed its benchmark by 3.5% in 2018. Much of the outperformance was a result of strong security selection within Technology, Materials, and Consumer Discretionary. In addition, the Brighthouse/Aberdeen Emerging Market Equity Portfolio was additive to relative results during the year, outperforming its benchmark by 0.7% as an underweight to China and positive security selection in Consumer Discretionary, Financial Services, and Technology supported returns.
Investment Committee
Brighthouse Investment Advisers, LLC
* This commentary may include statements that constitute “forward-looking statements” under the U.S. securities laws. Forward-looking statements include, among other things, projections, estimates, and information about possible or future results related to the Portfolio, market or regulatory developments. The views expressed above are not guarantees of future performance or economic results and involve certain risks, uncertainties and assumptions that could cause actual outcomes and results to differ materially from the views expressed herein. The views expressed above are subject to change at any time based upon economic, market, or other conditions and the subadvisory firm undertakes no obligation to update the views expressed herein. Any discussions of specific securities should not be considered a recommendation to buy or sell those securities. The views expressed above (including any forward-looking statement) may not be relied upon as investment advice or as an indication of the Portfolio’s trading intent. Information about the Portfolio’s holdings, asset allocation or country diversification is historical and is not an indication of future Portfolio composition, which may vary. Direct investment in any index is not possible. The performance of any index mentioned in this commentary has not been adjusted for ongoing management, distribution and operating expenses, and sales charges applicable to mutual fund investments. In addition, the returns do not reflect additional fees charged by separate accounts or variable insurance contracts that an investor in the Portfolio may pay. If these additional fees were reflected, performance would have been lower.
BHFTII-2
Brighthouse Funds Trust II
Brighthouse Asset Allocation 80 Portfolio
A $10,000 INVESTMENT COMPARED TO THE DOW JONES MODERATELY AGGRESSIVE INDEX
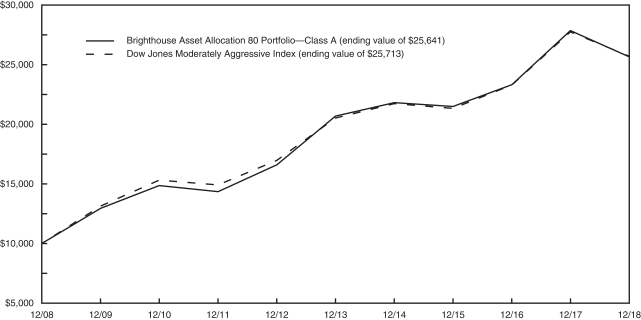
AVERAGE ANNUAL RETURNS (%) (FOR THE YEAR ENDED DECEMBER 31, 2018)
| | | | | | | | | | | | |
| | | | |
| | | 1 Year | | | 5 Year | | | 10 Year | |
| Brighthouse Asset Allocation 80 Portfolio | | | | | | | | | | | | |
Class A | | | -7.91 | | | | 4.39 | | | | 9.87 | |
Class B | | | -8.11 | | | | 4.14 | | | | 9.61 | |
| Dow Jones Moderately Aggressive Index | | | -7.33 | | | | 4.62 | | | | 9.91 | |
1 The Dow Jones Moderately Aggressive Index is a total return index designed to provide asset allocation strategists with a target risk benchmark. Each month, the Index adjusts its weighting of stocks, bonds, and cash indices (both domestic and foreign) such that the risk combination will have 80% of the risk of an all equity portfolio.
Portfolio performance is calculated including reinvestment of all income and capital gain distributions. Performance numbers are net of all Portfolio expenses but do not include any insurance, sales, separate account or administrative charges of variable annuity or life insurance contracts or any additional expenses that participants may bear relating to the operations of their plans. If these charges were included, the returns would be lower. The performance of any index referenced above has not been adjusted for ongoing management, distribution and operating expenses, and sales charges applicable to mutual fund investments. Direct investment in any index is not possible. The performance of Class A shares, as set forth in the line graph above, will differ from that of other classes because of the difference in expenses paid by policyholders investing in the different share classes.
This information represents past performance and is not indicative of future results. Investment return and principal value may fluctuate so that shares, upon redemption, may be worth more or less than the original cost.
PORTFOLIO COMPOSITION AS OF DECEMBER 31, 2018
Top Holdings
| | | | |
| | | % of
Net Assets | |
| MFS Value Portfolio (Class A) | | | 6.0 | |
| Invesco Comstock Portfolio (Class A) | | | 5.4 | |
| T. Rowe Price Large Cap Value Portfolio (Class A) | | | 5.2 | |
| Brighthouse/Wellington Core Equity Opportunities Portfolio (Class A) | | | 5.1 | |
| Jennison Growth Portfolio (Class A) | | | 5.0 | |
| Harris Oakmark International Portfolio (Class A) | | | 4.5 | |
| ClearBridge Aggressive Growth Portfolio (Class A) | | | 4.4 | |
| T. Rowe Price Large Cap Growth Portfolio (Class A) | | | 4.3 | |
| Baillie Gifford International Stock Portfolio (Class A) | | | 4.2 | |
| Brighthouse/Artisan International Portfolio (Class A) | | | 3.8 | |
Asset Allocation
| | | | |
| | | % of
Net Assets | |
| U.S. Large Cap Equities | | | 42.3 | |
| International Developed Market Equities | | | 17.4 | |
| Investment Grade Fixed Income | | | 12.9 | |
| U.S. Small Cap Equities | | | 8.0 | |
| Global Equities | | | 4.4 | |
| High Yield Fixed Income | | | 3.6 | |
| International Fixed Income | | | 3.2 | |
| U.S. Mid Cap Equities | | | 3.0 | |
| Emerging Market Equities | | | 2.6 | |
| Real Estate Equities | | | 2.6 | |
BHFTII-3
Brighthouse Funds Trust II
Brighthouse Asset Allocation 80 Portfolio
Understanding Your Portfolio’s Expenses
Shareholder Expense Example
As a shareholder of the Portfolio, you incur ongoing costs, including management fees; distribution and service(12b-1) fees; and other Portfolio expenses. This example is intended to help you understand your ongoing costs (in dollars) (referred to as “expenses”) of investing in the Portfolio and compare these costs with the ongoing costs of investing in other mutual funds. The example is based on an investment of $1,000 invested at the beginning of the period and held for the entire period, July 1, 2018 through December 31, 2018.
Actual Expenses
The first line for each share class of the Portfolio in the table below provides information about actual account values and actual expenses. You may use the information in this line, together with the amount you invested in the particular share class of the Portfolio, to estimate the expenses that you paid over the period. Simply divide your account value by $1,000 (for example, an $8,600 account value divided by $1,000 = 8.6), then multiply the result by the number in the first line under the heading entitled “Expenses Paid During Period” to estimate the expenses you paid on your account during this period.
Hypothetical Example for Comparison Purposes
The second line for each share class of the Portfolio in the table below provides information about hypothetical account values and hypothetical expenses based on the Portfolio’s actual expense ratio and an assumed rate of return of 5% per year before expenses, which is not the Portfolio’s actual return. The hypothetical account values and expenses may not be used to estimate the actual ending account balance or expenses you paid for the period. You may use this information to compare the ongoing costs of investing in the Portfolio and other funds. To do so, compare this 5% hypothetical example with the 5% hypothetical examples that appear in the shareholder reports of the other funds.
Please note that the expenses shown in the table are meant to highlight your ongoing costs only and do not reflect any fees or charges of your variable insurance product or any additional expenses that participants in certain eligible qualified plans may bear relating to the operations of their plan. Therefore, the second line for each share class in the table is useful in comparing ongoing costs only, and will not help you determine the relative total costs of owning different funds. In addition, if these other costs were included, your costs would have been higher.
| | | | | | | | | | | | | | | | | | |
Brighthouse Asset Allocation 80 Portfolio
| | | |
Annualized
Expense
Ratio | | | Beginning
Account Value
July 1,
2018 | | | Ending
Account Value
December 31,
2018 | | | Expenses Paid
During Period**
July 1, 2018
to
December 31,
2018 | |
Class A (a) | | Actual | | | 0.69 | % | | $ | 1,000.00 | | | $ | 908.20 | | | $ | 3.32 | |
| | Hypothetical* | | | 0.69 | % | | $ | 1,000.00 | | | $ | 1,021.73 | | | $ | 3.52 | |
| | | | | |
Class B (a) | | Actual | | | 0.94 | % | | $ | 1,000.00 | | | $ | 907.70 | | | $ | 4.52 | |
| | Hypothetical* | | | 0.94 | % | | $ | 1,000.00 | | | $ | 1,020.47 | | | $ | 4.79 | |
| * | Hypothetical assumes a rate of return of 5% per year before expenses. |
| ** | Expenses paid are equal to the Portfolio’s annualized expense ratio for the most recent six month period, as shown above, multiplied by the average account value over the period, multiplied by the number of days (184 days) in the most recent fiscal half-year, divided by 365 (to reflect theone-half year period). |
| (a) | The annualized expense ratio reflects the expenses of both the Portfolio and the Underlying Portfolios in which it invests. |
BHFTII-4
Brighthouse Funds Trust II
Brighthouse Asset Allocation 80 Portfolio
Schedule of Investments as of December 31, 2018
Mutual Funds—100.0% of Net Assets
| | | | | | | | |
| Security Description | | Shares | | | Value | |
| |
| Affiliated Investment Companies—100.0% | | | | |
Baillie Gifford International Stock Portfolio (Class A) (a) | | | 35,703,656 | | | $ | 393,454,288 | |
BlackRock Bond Income Portfolio (Class A) (a) | | | 2,951,469 | | | | 303,824,270 | |
BlackRock Capital Appreciation Portfolio (Class A) (a) | | | 7,884,701 | | | | 306,162,925 | |
BlackRock High Yield Portfolio (Class A) (b) | | | 6,749,921 | | | | 48,936,926 | |
Brighthouse Small Cap Value Portfolio (Class A) (b) | | | 11,509,766 | | | | 155,842,236 | |
Brighthouse/Aberdeen Emerging Markets Equity Portfolio (Class A) (b) | | | 26,022,453 | | | | 248,254,199 | |
Brighthouse/Artisan International Portfolio (Class A) (b) | | | 35,712,259 | | | | 353,551,365 | |
Brighthouse/Artisan Mid Cap Value Portfolio (Class A) (a) | | | 108,280 | | | | 22,939,023 | |
Brighthouse/Dimensional International Small Company Portfolio (Class A) (a) | | | 16,005,975 | | | | 177,186,144 | |
Brighthouse/Eaton Vance Floating Rate Portfolio (Class A) (b) | | | 9,795,366 | | | | 97,953,659 | |
Brighthouse/Templeton International Bond Portfolio (Class A) (b)(c) | | | 29,317,329 | | | | 299,329,928 | |
Brighthouse/Wellington Core Equity Opportunities Portfolio (Class A) (a) | | | 15,933,441 | | | | 478,162,554 | |
Brighthouse/Wellington Large Cap Research Portfolio (Class A) (b) | | | 24,820,708 | | | | 327,385,142 | |
Clarion Global Real Estate Portfolio (Class A) (b) | | | 22,539,219 | | | | 241,620,426 | |
ClearBridge Aggressive Growth Portfolio (Class A) (b) | | | 25,634,507 | | | | 416,817,092 | |
Frontier Mid Cap Growth Portfolio (Class A) (a) | | | 1,451,955 | | | | 47,115,951 | |
Harris Oakmark International Portfolio (Class A) (b) | | | 34,938,091 | | | | 424,847,183 | |
Invesco Comstock Portfolio (Class A) (b) | | | 38,104,207 | | | | 505,261,790 | |
Invesco Small Cap Growth Portfolio (Class A) (b) | | | 15,853,191 | | | | 198,481,951 | |
Jennison Growth Portfolio (Class A) (a) | | | 32,423,024 | | | | 470,133,848 | |
JPMorgan Core Bond Portfolio (Class A) (b) | | | 20,264,620 | | | | 203,051,494 | |
JPMorgan Small Cap Value Portfolio (Class A) (b) | | | 9,430,647 | | | | 133,537,968 | |
Loomis Sayles Small Cap Growth Portfolio (Class A) (a) | | | 8,545,252 | | | | 112,711,869 | |
MFS Research International Portfolio (Class A) (b) | | | 26,459,648 | | | | 285,499,601 | |
| |
| Affiliated Investment Companies—(Continued) | | | | |
MFS Value Portfolio (Class A) (a) | | | 40,686,461 | | | | 561,880,026 | |
Morgan Stanley Mid Cap Growth Portfolio (Class A) (b) | | | 1,240,626 | | | | 23,038,433 | |
Neuberger Berman Genesis Portfolio (Class A) (a) | | | 1,241,064 | | | | 23,034,144 | |
Oppenheimer Global Equity Portfolio (Class A) (b) | | | 6,821,623 | | | | 139,502,183 | |
PIMCO Inflation Protected Bond Portfolio (Class A) (b) | | | 15,731,285 | | | | 150,548,399 | |
PIMCO Total Return Portfolio (Class A) (b) | | | 26,626,485 | | | | 303,275,663 | |
T. Rowe Price Large Cap Growth Portfolio (Class A) (a) | | | 19,425,989 | | | | 402,312,232 | |
T. Rowe Price Large Cap Value Portfolio (Class A) (b) | | | 17,211,536 | | | | 492,938,379 | |
T. Rowe Price Mid Cap Growth Portfolio (Class A) (b) | | | 9,305,885 | | | | 94,826,970 | |
T. Rowe Price Small Cap Growth Portfolio (Class A) (a) | | | 6,387,864 | | | | 135,614,362 | |
TCW Core Fixed Income Portfolio (Class A) (b) | | | 25,437,339 | | | | 253,864,643 | |
Van Eck Global Natural Resources Portfolio (Class A) (a) | | | 35,632,729 | | | | 273,659,357 | |
Wells Capital Management Mid Cap Value Portfolio (Class A) (b) | | | 9,380,156 | | | | 93,426,350 | |
Western Asset Management Strategic Bond Opportunities Portfolio (Class A) (a) | | | 15,746,602 | | | | 199,666,910 | |
| | | | | | | | |
Total Mutual Funds
(Cost $9,738,074,084) | | | | | | | 9,399,649,883 | |
| | | | | | | | |
Total Investments—100.0%
(Cost $9,738,074,084) | | | | | | | 9,399,649,883 | |
Other assets and liabilities (net)—0.0% | | | | | | | (2,646,504 | ) |
| | | | | | | | |
| Net Assets — 100.0% | | | | | | $ | 9,397,003,379 | |
| | | | | | | | |
| | | | |
| (a) | | A Portfolio of Brighthouse Funds Trust II. (See Note 6 of the Notes to Financial Statements for a summary of transactions in the securities of affiliated issuers.) |
| (b) | | A Portfolio of Brighthouse Funds Trust I. (See Note 6 of the Notes to Financial Statements for a summary of transactions in the securities of affiliated issuers.) |
| (c) | | Non-income producing security. |
Fair Value Hierarchy
Accounting principles generally accepted in the United States of America (“GAAP”) define fair market value as the price that the Portfolio would receive to sell an asset or pay to transfer a liability in an orderly transaction between market participants at the measurement date. It establishes a fair value hierarchy that prioritizes inputs to valuation methods and requires disclosure of the fair value hierarchy, separately for each major category of assets and liabilities, that segregates fair value measurements into three levels. Levels 1, 2 and 3 of the fair value hierarchy are defined as follows:
Level 1 - unadjusted quoted prices in active markets for identical investments
Level 2 - other significant observable inputs (including, but not limited to, quoted prices for similar assets or liabilities in markets that are either active or inactive; inputs other than quoted prices that are observable such as interest rates, yield curves, volatilities, prepayment speeds, loss severities, credit risks, default rates, or other market corroborated inputs)
Level 3 - significant unobservable inputs based on the best information available in the circumstances, to the extent observable inputs are unavailable (including the Portfolio’s own assumptions used in determining the fair value of investments and derivative financial instruments)
The inputs or methodologies used for valuing investments are not necessarily an indication of the risk associated with investing in them. Changes to the inputs or methodologies used may result in transfers between levels. A reconciliation of Level 3 securities, if any, will be disclosed following the fair value hierarchy table. For more information about the Portfolio’s policy regarding the valuation of investments, please refer to the Notes to Financial Statements.
The following table summarizes the fair value hierarchy of the Portfolio’s investments as of December 31, 2018:
| | | | | | | | | | | | | | | | |
| Description | | Level 1 | | | Level 2 | | | Level 3 | | | Total | |
| Mutual Funds | |
Affiliated Investment Companies | | $ | 9,399,649,883 | | | $ | — | | | $ | — | | | $ | 9,399,649,883 | |
Total Investments | | $ | 9,399,649,883 | | | $ | — | | | $ | — | | | $ | 9,399,649,883 | |
| | | | | | | | | | | | | | | | | |
See accompanying notes to financial statements.
BHFTII-5
Brighthouse Funds Trust II
Brighthouse Asset Allocation 80 Portfolio
Statement of Assets and Liabilities
December 31, 2018
| | | | |
Assets | |
Affiliated investments at value (a) | | $ | 9,399,649,883 | |
Receivable for: | |
Affiliated investments sold | | | 3,383,790 | |
Fund shares sold | | | 275,535 | |
| | | | |
Total Assets | | | 9,403,309,208 | |
Liabilities | |
Payables for: | |
Fund shares redeemed | | | 3,659,325 | |
Accrued Expenses: | |
Management fees | | | 440,970 | |
Distribution and service fees | | | 1,963,600 | |
Deferred trustees’ fees | | | 182,726 | |
Other expenses | | | 59,208 | |
| | | | |
Total Liabilities | | | 6,305,829 | |
| | | | |
Net Assets | | $ | 9,397,003,379 | |
| | | | |
Net Assets Consist of: | |
Paid in surplus | | $ | 8,629,693,032 | |
Distributable earnings (Accumulated losses) | | | 767,310,347 | |
| | | | |
Net Assets | | $ | 9,397,003,379 | |
| | | | |
Net Assets | |
Class A | | $ | 378,178,302 | |
Class B | | | 9,018,825,077 | |
Capital Shares Outstanding* | |
Class A | | | 30,592,928 | |
Class B | | | 733,504,872 | |
Net Asset Value, Offering Price and Redemption Price Per Share | |
Class A | | $ | 12.36 | |
Class B | | | 12.30 | |
| | | | |
| * | | The Portfolio is authorized to issue an unlimited number of shares. |
| (a) | | Identified cost of affiliated investments was $9,738,074,084. |
Statement of Operations
Year Ended December 31, 2018
| | | | |
Investment Income | | | | |
Dividends from affiliated investments | | $ | 171,940,686 | |
| | | | |
Total investment income | | | 171,940,686 | |
Expenses | |
Management fees | | | 5,869,194 | |
Administration fees | | | 26,349 | |
Custodian and accounting fees | | | 28,054 | |
Distribution and service fees—Class B | | | 26,400,831 | |
Audit and tax services | | | 32,223 | |
Legal | | | 45,317 | |
Trustees’ fees and expenses | | | 33,734 | |
Miscellaneous | | | 16,348 | |
| | | | |
Total expenses | | | 32,452,050 | |
| | | | |
Net Investment Income | | | 139,488,636 | |
| | | | |
Net Realized and Unrealized Gain (Loss) | |
| Net realized gain on: | |
Affiliated investments | | | 412,768,168 | |
Capital gain distributions from affiliated investments | | | 659,739,787 | |
| | | | |
Net realized gain | | | 1,072,507,955 | |
| | | | |
Net change in unrealized depreciation on affiliated investments | | | (2,026,791,738 | ) |
| | | | |
Net realized and unrealized loss | | | (954,283,783 | ) |
| | | | |
Net Decrease in Net Assets From Operations | | $ | (814,795,147 | ) |
| | | | |
See accompanying notes to financial statements.
BHFTII-6
Brighthouse Funds Trust II
Brighthouse Asset Allocation 80 Portfolio
Statements of Changes in Net Assets
| | | | | | | | | | | | | | | | |
| | | | Year Ended
December 31,
2018 | | | Year Ended
December 31,
2017 | |
Increase (Decrease) in Net Assets: | |
From Operations | |
Net investment income | | | $ | 139,488,636 | | | $ | 133,191,348 | |
Net realized gain | | | | 1,072,507,955 | | | | 540,074,337 | |
Net change in unrealized appreciation (depreciation) | | | | (2,026,791,738 | ) | | | 1,300,448,131 | |
| | | | | | | | | |
Increase (decrease) in net assets from operations | | | | (814,795,147 | ) | | | 1,973,713,816 | |
| | | | | | | | | |
From Distributions to Shareholders (a) | |
Class A | | | | (25,505,012 | ) | | | (30,355,844 | ) |
Class B | | | | (608,846,005 | ) | | | (761,245,249 | ) |
| | | | | | | | | |
Total distributions | | | | (634,351,017 | ) | | | (791,601,093 | ) |
| | | | | | | | | |
Decrease in net assets from capital share transactions | | | | (709,937,897 | ) | | | (484,248,915 | ) |
| | | | | | | | | |
Total increase (decrease) in net assets | | | | (2,159,084,061 | ) | | | 697,863,808 | |
|
Net Assets | |
Beginning of period | | | | 11,556,087,440 | | | | 10,858,223,632 | |
| | | | | | | | | |
End of period | | | $ | 9,397,003,379 | | | $ | 11,556,087,440 | (b) |
| | | | | | | | | |
Other Information: Capital Shares Transactions in capital shares were as follows: | |
| | | Year Ended
December 31, 2018 | | | Year Ended
December 31, 2017 | |
| | | Shares | | | Value | | | Shares | | | Value | |
Class A | |
Sales | | | 1,097,538 | | | $ | 15,311,141 | | | | 1,308,539 | | | $ | 17,709,267 | |
Reinvestments | | | 1,837,537 | | | | 25,505,012 | | | | 2,331,478 | | | | 30,355,844 | |
Redemptions | | | (2,970,353 | ) | | | (41,468,195 | ) | | | (3,985,253 | ) | | | (53,924,034 | ) |
| | | | | | | | | | | | | | | | |
Net decrease | | | (35,278 | ) | | $ | (652,042 | ) | | | (345,236 | ) | | $ | (5,858,923 | ) |
| | | | | | | | | | | | | | | | |
Class B | |
Sales | | | 7,738,944 | | | $ | 107,874,422 | | | | 8,340,811 | | | $ | 112,523,526 | |
Reinvestments | | | 44,055,427 | | | | 608,846,005 | | | | 58,692,772 | | | | 761,245,249 | |
Redemptions | | | (102,741,883 | ) | | | (1,426,006,282 | ) | | | (100,029,010 | ) | | | (1,352,158,767 | ) |
| | | | | | | | | | | | | | | | |
Net decrease | | | (50,947,512 | ) | | $ | (709,285,855 | ) | | | (32,995,427 | ) | | $ | (478,389,992 | ) |
| | | | | | | | | | | | | | | | |
Decrease derived from capital shares transactions | | | | | | $ | (709,937,897 | ) | | | | | | $ | (484,248,915 | ) |
| | | | | | | | | | | | | | | | |
| | | | |
| (a) | | Distributions from net investment income and realized gains are no longer required to be separately disclosed. The presentation for the year ended December��31, 2018 has been adjusted for this change
(See Note 9). At December 31, 2017 the distributions were as follows. |
| | | | | | | | |
| | | Distributions from net
investment income: | | | Distributions from
realized capital
gains: | |
Class A | | $ | (7,454,246 | ) | | $ | (22,901,598 | ) |
Class B | | | (167,613,633 | ) | | | (593,631,616 | ) |
| | | | |
| (b) | | As part of the update in (a), it is also no longer required to disclose the Undistributed net investment income (Accumulated losses) which was $144,248,984 as of December 31, 2017. |
See accompanying notes to financial statements.
BHFTII-7
Brighthouse Funds Trust II
Brighthouse Asset Allocation 80 Portfolio
Financial Highlights
| | | | | | | | | | | | | | | | | | | | |
| Selected per share data | | | | | | | | | | | | | | | |
| | | Class A | |
| | | Year Ended December 31, | |
| | | 2018 | | | 2017 | | | 2016 | | | 2015 | | | 2014 | |
Net Asset Value, Beginning of Period | | $ | 14.25 | | | $ | 12.86 | | | $ | 13.98 | | | $ | 14.92 | | | $ | 14.41 | |
| | | | | | | | | | | | | | | | | | | | |
Income (Loss) from Investment Operations | |
Net investment income (a) | | | 0.21 | | | | 0.19 | | | | 0.20 | | | | 0.29 | | | | 0.18 | |
Net realized and unrealized gain (loss) | | | (1.25 | ) | | | 2.22 | | | | 0.82 | | | | (0.47 | ) | | | 0.60 | |
| | | | | | | | | | | | | | | | | | | | |
Total income (loss) from investment operations | | | (1.04 | ) | | | 2.41 | | | | 1.02 | | | | (0.18 | ) | | | 0.78 | |
| | | | | | | | | | | | | | | | | | | | |
Less Distributions | |
Distributions from net investment income | | | (0.22 | ) | | | (0.25 | ) | | | (0.46 | ) | | | (0.08 | ) | | | (0.27 | ) |
Distributions from net realized capital gains | | | (0.63 | ) | | | (0.77 | ) | | | (1.68 | ) | | | (0.68 | ) | | | 0.00 | |
| | | | | | | | | | | | | | | | | | | | |
Total distributions | | | (0.85 | ) | | | (1.02 | ) | | | (2.14 | ) | | | (0.76 | ) | | | (0.27 | ) |
| | | | | | | | | | | | | | | | | | | | |
Net Asset Value, End of Period | | $ | 12.36 | | | $ | 14.25 | | | $ | 12.86 | | | $ | 13.98 | | | $ | 14.92 | |
| | | | | | | | | | | | | | | | | | | | |
Total Return (%)(b) | | | (7.91 | ) | | | 19.44 | | | | 8.43 | | | | (1.50 | ) | | | 5.53 | |
| | | | | |
Ratios/Supplemental Data | | | | | | | | | | | | | | | | | | | | |
Ratio of expenses to average net assets (%) (c) | | | 0.06 | | | | 0.06 | | | | 0.06 | | | | 0.05 | | | | 0.06 | |
Ratio of net investment income to average net assets (%) (d) | | | 1.50 | | | | 1.42 | | | | 1.55 | | | | 1.96 | | | | 1.26 | |
Portfolio turnover rate (%) | | | 11 | | | | 7 | | | | 10 | | | | 13 | | | | 22 | |
Net assets, end of period (in millions) | | $ | 378.2 | | | $ | 436.4 | | | $ | 398.2 | | | $ | 386.4 | | | $ | 395.4 | |
| |
| | | Class B | |
| | | Year Ended December 31, | |
| | | 2018 | | | 2017 | | | 2016 | | | 2015 | | | 2014 | |
Net Asset Value, Beginning of Period | | $ | 14.18 | | | $ | 12.80 | | | $ | 13.92 | | | $ | 14.86 | | | $ | 14.36 | |
| | | | | | | | | | | | | | | | | | | | |
Income (Loss) from Investment Operations | |
Net investment income (a) | | | 0.17 | | | | 0.16 | | | | 0.17 | | | | 0.25 | | | | 0.02 | |
Net realized and unrealized gain (loss) | | | (1.23 | ) | | | 2.21 | | | | 0.81 | | | | (0.46 | ) | | | 0.72 | |
| | | | | | | | | | | | | | | | | | | | |
Total income (loss) from investment operations | | | (1.06 | ) | | | 2.37 | | | | 0.98 | | | | (0.21 | ) | | | 0.74 | |
| | | | | | | | | | | | | | | | | | | | |
Less Distributions | |
Distributions from net investment income | | | (0.19 | ) | | | (0.22 | ) | | | (0.42 | ) | | | (0.05 | ) | | | (0.24 | ) |
Distributions from net realized capital gains | | | (0.63 | ) | | | (0.77 | ) | | | (1.68 | ) | | | (0.68 | ) | | | 0.00 | |
| | | | | | | | | | | | | | | | | | | | |
Total distributions | | | (0.82 | ) | | | (0.99 | ) | | | (2.10 | ) | | | (0.73 | ) | | | (0.24 | ) |
| | | | | | | | | | | | | | | | | | | | |
Net Asset Value, End of Period | | $ | 12.30 | | | $ | 14.18 | | | $ | 12.80 | | | $ | 13.92 | | | $ | 14.86 | |
| | | | | | | | | | | | | | | | | | | | |
Total Return (%)(b) | | | (8.11 | ) | | | 19.16 | | | | 8.14 | | | | (1.70 | ) | | | 5.23 | |
| | | | | |
Ratios/Supplemental Data | | | | | | | | | | | | | | | | | | | | |
Ratio of expenses to average net assets (%) (c) | | | 0.31 | | | | 0.31 | | | | 0.31 | | | | 0.30 | | | | 0.31 | |
Ratio of net investment income to average net assets (%) (d) | | | 1.26 | | | | 1.17 | | | | 1.32 | | | | 1.73 | | | | 0.14 | |
Portfolio turnover rate (%) | | | 11 | | | | 7 | | | | 10 | | | | 13 | | | | 22 | |
Net assets, end of period (in millions) | | $ | 9,018.8 | | | $ | 11,119.7 | | | $ | 10,460.0 | | | $ | 10,742.1 | | | $ | 12,034.0 | |
| | | | |
| (a) | | Per share amounts based on average shares outstanding during the period. |
| (b) | | Total return does not reflect any insurance, sales, separate account or administrative charges of variable annuity or life insurance contracts or any additional expenses that contract owners may bear under their variable contracts. If these charges were included, the returns would be lower. |
| (c) | | The ratio of operating expenses to average net assets does not include expenses of the Underlying Portfolios in which the Asset Allocation Portfolio invests. |
| (d) | | Recognition of net investment income by the Asset Allocation Portfolio is affected by the timing of the declaration of dividends by the Underlying Portfolios in which it invests. |
See accompanying notes to financial statements.
BHFTII-8
Brighthouse Funds Trust II
Brighthouse Asset Allocation 80 Portfolio
Notes to Financial Statements—December 31, 2018
1. Organization
Brighthouse Funds Trust II (the “Trust”) is organized as a Delaware statutory trust and registered under the Investment Company Act of 1940, as amended (the “1940 Act”), as anopen-end management investment company. The Trust, which is managed by Brighthouse Investment Advisers, LLC (“Brighthouse Investment Advisers” or the “Adviser”), currently offers twenty-nine series, each of which operates as a distinct investment vehicle of the Trust. The series included in this report is Brighthouse Asset Allocation 80 Portfolio (the “Asset Allocation Portfolio”), which is diversified. The Asset Allocation Portfolio operates under a “fund of funds” structure, investing substantially all of its assets in other Portfolios advised by Brighthouse Investment Advisers (each, an “Underlying Portfolio,” and, collectively, the “Underlying Portfolios”). Shares of the Portfolio are not offered directly to the general public and are currently available only to separate accounts of insurance companies, including insurance companies affiliated with the Adviser (together, the “Insurance Companies”).
The Asset Allocation Portfolio has registered and offers two classes of shares: Class A and B shares. Shares of each Class of the Asset Allocation Portfolio represent an equal pro rata interest in the Asset Allocation Portfolio and generally give the shareholder the same voting, dividend, liquidation, and other rights. Investment income, realized and unrealized capital gains and losses, the common expenses of the Asset Allocation Portfolio, and certain Asset Allocation Portfolio-level expense reductions, if any, are allocated on a pro rata basis to each Class based on the relative net assets of each Class to the net assets of the Asset Allocation Portfolio. Each Class of shares differs in its respective distribution plan and such distribution expenses are allocated to the corresponding Class of shares.
2. Significant Accounting Policies
The preparation of financial statements in conformity with accounting principles generally accepted in the United States of America (“GAAP”) requires management to make estimates and assumptions that affect the reported amounts of assets and liabilities and disclosure of contingent assets and liabilities as of the date of the financial statements and the reported amounts of income and expenses during the reporting period. Actual results could differ from those estimates. In the preparation of these financial statements, management has evaluated events and transactions subsequent to December 31, 2018 through the date the financial statements were issued.
The Asset Allocation Portfolio is an investment company and follows the accounting and reporting guidance of the Financial Accounting Standards Board (“FASB”) Accounting Standards Codification Topic 946—Financial Services—Investment Companies. The following is a summary of significant accounting policies consistently followed by the Asset Allocation Portfolio in the preparation of its financial statements.
Investment Valuation and Fair Value Measurements -The Asset Allocation Portfolio values its portfolio investments for purposes of calculating its net asset value (“NAV”) using procedures approved by the Board of Trustees of the Trust (the “Board” or “Trustees”). Those procedures allow for a variety of methodologies to be used to value the Asset Allocation Portfolio’s investments. The specific methodologies used for a particular investment may vary based on the market data available for a specific investment at the time the Asset Allocation Portfolio calculates its NAV or based on other considerations. The procedures also permit a level of judgment to be used in the valuation process. The Asset Allocation Portfolio follows the accounting and reporting guidance of FASB Accounting Standards Codification Topic 820—Fair Value Measurement.
Investments in the Underlying Portfolios are valued at their closing daily NAV on the valuation date. Investments in the Underlying Portfolios are categorized as Level 1 within the fair value hierarchy. For information about the use of fair value pricing by the Underlying Portfolios, please refer to the prospectuses of the Underlying Portfolios.
Investment Transactions and Related Investment Income -The Asset Allocation Portfolio’s security transactions are recorded on the trade date. Dividend income is recorded on theex-dividend date. Interest income is recorded on the accrual basis. Realized gains and losses on investments and unrealized appreciation and depreciation are determined on the identified cost basis, which is the same basis used for federal income tax purposes. Capital gains distributions received from the Underlying Portfolios are recorded as net realized gain in the Statement of Operations.
Dividends and Distributions to Shareholders -The Asset Allocation Portfolio records dividends and distributions on theex-dividend date. Net realized gains from securities transactions (if any) are generally distributed annually to shareholders. The timing and characterization of certain income and capital gains distributions are determined in accordance with federal tax regulations that may differ from GAAP. Permanent book and tax basis differences relating to shareholder distributions will result in reclassification between distributable earnings (accumulated losses) andpaid-in surplus. These adjustments have no impact on net assets or the results of operations.
Income Taxes -It is the Asset Allocation Portfolio’s policy to comply with the requirements of the Internal Revenue Code of 1986, as amended, and regulations thereunder, applicable to regulated investment companies, and to distribute, with respect to each taxable year, all of its taxable income to shareholders. Therefore, no federal income tax provision is required. The Asset Allocation Portfolio files U.S. federal tax returns. No income tax returns are currently under examination. The Asset Allocation Portfolio’s federal tax returns for the
BHFTII-9
Brighthouse Funds Trust II
Brighthouse Asset Allocation 80 Portfolio
Notes to Financial Statements—December 31, 2018—(Continued)
prior three fiscal years remain subject to examination by the Internal Revenue Service. As of December 31, 2018, the Asset Allocation Portfolio had no uncertain tax positions that would require financial statement recognition, or derecognition or disclosure.
3. Certain Risks
In the normal course of business, the Underlying Portfolios invest in securities and enter into transactions where risks exist. Those risks include:
Market Risk:The value of securities held by the Underlying Portfolios may decline in response to certain events, including those directly involving the issuers whose securities are owned by the Underlying Portfolios; conditions affecting the general economy; overall market changes; local, regional or global political, social or economic instability; and currency, interest rate, and price fluctuations.
Credit and Counterparty Risk: The Underlying Portfolios may be exposed to counterparty risk, or the risk that an entity with which the Underlying Portfolios have unsettled or open transactions may default. The potential loss could exceed the value of the financial assets and liabilities recorded in the financial statements. Financial assets that potentially expose the Underlying Portfolios to credit and counterparty risk consist principally of cash due from counterparties and investments. The Underlying Portfolios manage counterparty risk by entering into agreements only with counterparties that they believe have the financial resources to honor their obligations and by monitoring the financial stability of those counterparties. The Adviser attempts to mitigate counterparty risk by (i) periodically assessing the creditworthiness of their trading partners, (ii) monitoring and/or limiting the amount of their net exposure to each individual counterparty based on the adviser’s assessment, and (iii) requiring collateral from the counterparty for certain transactions. In order to preserve certain safeguards fornon-standard settlement trades, the Underlying Portfolios restrict their exposure to credit and counterparty losses by entering into master netting agreements (“Master Agreements”) with counterparties (approved brokers) with whom the Underlying Portfolios undertake a significant volume of transactions. Master Agreements govern the terms of certain transactions, and reduce the counterparty risk associated with relevant transactions by specifying credit protection mechanisms and providing standardization that improves legal certainty. Master Agreements can also help limit counterparty risk by specifying collateral posting arrangements atpre-arranged exposure levels.
The Asset Allocation Portfolio’s prospectus includes a discussion of the principal risks of investing in the Asset Allocation Portfolio and in the Underlying Portfolios in which it invests.
4. Investment Transactions
Aggregate cost of purchases and proceeds of sales of shares of the Underlying Portfolios by the Asset Allocation Portfolio for the year ended December 31, 2018 were as follows:
| | | | | | | | | | | | |
Purchases | | | Sales | |
U.S. Government | | Non-U.S. Government | | | U.S. Government | | | Non-U.S. Government | |
| $0 | | $ | 1,174,207,328 | | | $ | 0 | | | $ | 1,719,739,281 | |
5. Investment Management Fees and Other Transactions with Affiliates
Investment Management Agreement - Brighthouse Investment Advisers is the investment adviser to the Asset Allocation Portfolio. The Trust has entered into an investment management agreement with Brighthouse Investment Advisers with respect to the Asset Allocation Portfolio. For providing investment management services to the Asset Allocation Portfolio, Brighthouse Investment Advisers receives monthly compensation at the following annual rates:
| | | | | | |
Management
Fees earned by
Brighthouse
Investment Advisers
for the year ended
December 31,
2018 | | % per annum | | | Average Daily Net Assets |
| $5,869,194 | | | 0.100 | % | | Of the first $500 million |
| | | 0.075 | % | | Of the next $500 million |
| | | 0.050 | % | | On amounts in excess of $1 billion |
In addition to the above management fee paid to Brighthouse Investment Advisers, the Asset Allocation Portfolio indirectly pays Brighthouse Investment Advisers an investment advisory fee through its investments in the Underlying Portfolios.
Certain officers and trustees of the Trust may also be officers of Brighthouse Investment Advisers however, such officers and trustees receive no compensation from the Trust.
BHFTII-10
Brighthouse Funds Trust II
Brighthouse Asset Allocation 80 Portfolio
Notes to Financial Statements—December 31, 2018—(Continued)
Transfer Agency Agreement -Brighthouse Financial, Inc. serves as the transfer agent for the Trust. Brighthouse Financial, Inc. receives no fees for its services to the Trust.
Distribution and Service Fees - The Trust has a distribution agreement with Brighthouse Securities, LLC (the “Distributor”) pursuant to which the Distributor serves as the general distributor of shares of each class (each a “Class”) of each Portfolio. The Distributor is an affiliate of the Trust. The Trust has adopted a Distribution and Services Plan (the “Plan”) relating to Class B shares of each Portfolio, under Rule 12b-1 under the 1940 Act, pursuant to which the Trust may pay the Distributor a fee (the “Service Fee”) at an annual rate not to exceed 0.25% of each such Portfolio’s average daily net assets attributable to the Class B shares of the Trust. Each Portfolio may not offer shares of each Class. The Plan also authorizes the Trust, on behalf of each of its Portfolios, may pay the Distributor a distribution Fee (the “Distribution Fee” and together with the Service Fee, the “Fees”) at an annual rate of up to 0.25% of each Portfolio’s average daily net assets attributable to the Class B in consideration of the services rendered in connection with the sale of such shares by the Distributor. Under the Distribution Agreement with respect to the Trust, Fees are currently paid at an annual rate of 0.25% of average daily net assets in the case of Class B shares. The Plan is known as a “compensation plan” because the Trust makes payments to the Distributor for services rendered regardless of the actual level of expenditures by the Distributor. Amounts incurred by the Portfolio for the year ended December 31, 2018 are shown as Distribution and service fees in the Statement of Operations.
Deferred Trustee Compensation -Each Trustee who is not currently an employee of the Adviser or any of its affiliates receives compensation from the Trust for his or her service to the Trust. A deferred compensation plan (the “Plan”) is available to the Trustees on a voluntary basis. Deferred amounts remain in the Trust until distributed in accordance with the provisions of the Plan. The value of a participating Trustee’s deferral account is based on theoretical investments of deferred amounts on the normal payment dates in certain portfolios of the Trust or Brighthouse Funds Trust I, an affiliate of the Trust, as designated by the participating Trustee. Changes in the value of participants’ deferral accounts are reflected as Trustees’ fees and expenses in the Statement of Operations. The portion of the accrued obligations allocated to the Portfolio under the Plan is reflected as Deferred trustees’ fees in the Statement of Assets and Liabilities.
6. Transactions in Securities of Affiliated Issuers
The Asset Allocation Portfolio does not invest in the Underlying Portfolios for the purpose of exercising control; however, investments by the Asset Allocation Portfolio within its principal investment strategies may represent a significant portion of the Underlying Portfolios’ net assets. Transactions in the Underlying Portfolios for the year ended December 31, 2018 were as follows:
| | | | | | | | | | | | | | | | | | | | | | | | |
Security Description | | Market Value
December 31, 2017 | | | Purchases | | | Sales | | | Realized
Gain/
(Loss) | | | Change in
Unrealized
Appreciation/
(Depreciation) | | | Ending Value
as of
December 31, 2018 | |
Baillie Gifford International Stock Portfolio (Class A) | | $ | 410,609,221 | | | $ | 84,689,257 | | | $ | (18,603,501 | ) | | $ | 6,980,195 | | | $ | (90,220,884 | ) | | $ | 393,454,288 | |
BlackRock Bond Income Portfolio (Class A) | | | 330,107,343 | | | | 23,486,484 | | | | (36,915,510 | ) | | | (1,477,192 | ) | | | (11,376,855 | ) | | | 303,824,270 | |
BlackRock Capital Appreciation Portfolio (Class A) | | | 407,888,711 | | | | 49,400,677 | | | | (122,267,326 | ) | | | 45,334,365 | | | | (74,193,502 | ) | | | 306,162,925 | |
BlackRock High Yield Portfolio (Class A) | | | 57,763,657 | | | | 2,871,105 | | | | (7,583,089 | ) | | | (623,262 | ) | | | (3,491,485 | ) | | | 48,936,926 | |
Brighthouse Small Cap Value Portfolio (Class A) | | | 174,761,477 | | | | 31,488,650 | | | | (10,590,828 | ) | | | 516,465 | | | | (40,333,528 | ) | | | 155,842,236 | |
Brighthouse/Aberdeen Emerging Markets Equity Portfolio (Class A) | | | 294,797,711 | | | | 23,764,306 | | | | (24,320,493 | ) | | | 859,725 | | | | (46,847,050 | ) | | | 248,254,199 | |
Brighthouse/Artisan International Portfolio (Class A) | | | 378,601,301 | | | | 46,068,318 | | | | (23,007,603 | ) | | | 3,198,180 | | | | (51,308,831 | ) | | | 353,551,365 | |
Brighthouse/Artisan Mid Cap Value Portfolio (Class A) | | | 58,431,188 | | | | 1,679,513 | | | | (31,874,010 | ) | | | 3,686,096 | | | | (8,983,764 | ) | | | 22,939,023 | |
Brighthouse/Dimensional International Small Company Portfolio (Class A) | | | 236,218,700 | | | | 21,094,018 | | | | (14,123,854 | ) | | | (592,120 | ) | | | (65,410,600 | ) | | | 177,186,144 | |
Brighthouse/Eaton Vance Floating Rate Portfolio (Class A) | | | 112,502,683 | | | | 4,738,341 | | | | (16,017,768 | ) | | | 33,054 | | | | (3,302,651 | ) | | | 97,953,659 | |
Brighthouse/Templeton International Bond Portfolio (Class A) | | | 326,689,528 | | | | 8,811,373 | | | | (40,490,462 | ) | | | 918,977 | | | | 3,400,512 | | | | 299,329,928 | |
Brighthouse/Wellington Core Equity Opportunities Portfolio (Class A) | | | 583,694,106 | | | | 40,327,101 | | | | (110,457,932 | ) | | | 35,737,989 | | | | (71,138,710 | ) | | | 478,162,554 | |
Brighthouse/Wellington Large Cap Research Portfolio (Class A) | | | 407,853,287 | | | | 49,962,980 | | | | (62,543,724 | ) | | | 10,600,727 | | | | (78,488,128 | ) | | | 327,385,142 | |
Clarion Global Real Estate Portfolio (Class A) | | | 290,264,070 | | | | 17,191,840 | | | | (25,677,035 | ) | | | 10,963,212 | | | | (51,121,661 | ) | | | 241,620,426 | |
ClearBridge Aggressive Growth Portfolio (Class A) | | | 554,033,443 | | | | 27,836,789 | | | | (113,855,757 | ) | | | 63,261,216 | | | | (114,458,599 | ) | | | 416,817,092 | |
Frontier Mid Cap Growth Portfolio (Class A) | | | 58,104,366 | | | | 6,151,552 | | | | (8,697,039 | ) | | | 1,827,060 | | | | (10,269,988 | ) | | | 47,115,951 | |
Harris Oakmark International Portfolio (Class A) | | | 496,293,756 | | | | 104,503,246 | | | | (22,589,150 | ) | | | 3,925,933 | | | | (157,286,602 | ) | | | 424,847,183 | |
Invesco Comstock Portfolio (Class A) | | | 672,572,984 | | | | 51,650,872 | | | | (101,657,159 | ) | | | 36,744,214 | | | | (154,049,121 | ) | | | 505,261,790 | |
Invesco Small Cap Growth Portfolio (Class A) | | | 291,587,838 | | | | 31,204,035 | | | | (80,461,717 | ) | | | (4,693,274 | ) | | | (39,154,931 | ) | | | 198,481,951 | |
Jennison Growth Portfolio (Class A) | | | 579,196,578 | | | | 84,369,517 | | | | (123,778,476 | ) | | | 42,297,737 | | | | (111,951,508 | ) | | | 470,133,848 | |
JPMorgan Core Bond Portfolio (Class A) | | | 218,544,630 | | | | 16,897,324 | | | | (26,070,905 | ) | | | (690,964 | ) | | | (5,628,591 | ) | | | 203,051,494 | |
JPMorgan Small Cap Value Portfolio (Class A) | | | 173,501,338 | | | | 11,875,816 | | | | (19,582,770 | ) | | | 2,262,923 | | | | (34,519,339 | ) | | | 133,537,968 | |
Loomis Sayles Small Cap Growth Portfolio (Class A) | | | 145,483,558 | | | | 18,757,005 | | | | (37,975,045 | ) | | | 11,600,506 | | | | (25,154,155 | ) | | | 112,711,869 | |
MFS Research International Portfolio (Class A) | | | 352,313,230 | | | | 7,186,292 | | | | (21,203,766 | ) | | | 6,112,378 | | | | (58,908,533 | ) | | | 285,499,601 | |
MFS Value Portfolio (Class A) | | | 642,347,528 | | | | 52,979,851 | | | | (103,721,330 | ) | | | 38,911,549 | | | | (68,637,572 | ) | | | 561,880,026 | |
MFS Value Portfolio II (Class A) | | | 87,604,656 | | | | 25,430,566 | | | | (1,268,510 | ) | | | 46,758 | | | | (111,813,470 | ) | | | — | |
Morgan Stanley Mid Cap Growth Portfolio (Class A) | | | 58,060,082 | | | | 5,406,092 | | | | (43,122,358 | ) | | | 18,684,135 | | | | (15,989,518 | ) | | | 23,038,433 | |
BHFTII-11
Brighthouse Funds Trust II
Brighthouse Asset Allocation 80 Portfolio
Notes to Financial Statements—December 31, 2018—(Continued)
| | | | | | | | | | | | | | | | | | | | | | | | |
Security Description | | Market Value
December 31, 2017 | | | Purchases | | | Sales | | | Realized
Gain/(Loss) | | | Change in
Unrealized
Appreciation/
(Depreciation) | | | Ending Value
as of
December 31, 2018 | |
Neuberger Berman Genesis Portfolio (Class A) | | $ | 58,398,260 | | | $ | 3,643,786 | | | $ | (34,814,464 | ) | | $ | 13,178,484 | | | $ | (17,371,922 | ) | | $ | 23,034,144 | |
Oppenheimer Global Equity Portfolio (Class A) | | | 175,049,998 | | | | 17,635,552 | | | | (15,466,335 | ) | | | 3,809,958 | | | | (41,526,990 | ) | | | 139,502,183 | |
PIMCO Inflation Protected Bond Portfolio (Class A) | | | 165,112,441 | | | | 9,094,091 | | | | (17,031,028 | ) | | | (2,850,379 | ) | | | (3,776,726 | ) | | | 150,548,399 | |
PIMCO Total Return Portfolio (Class A) | | | 331,926,225 | | | | 16,285,920 | | | | (39,414,975 | ) | | | (3,991,889 | ) | | | (1,529,618 | ) | | | 303,275,663 | |
T. Rowe Price Large Cap Growth Portfolio (Class A) | | | 520,862,703 | | | | 88,469,844 | | | | (125,583,605 | ) | | | 37,369,645 | | | | (118,806,355 | ) | | | 402,312,232 | |
T. Rowe Price Large Cap Value Portfolio (Class A) | | | 639,434,904 | | | | 68,620,373 | | | | (98,900,803 | ) | | | 29,270,973 | | | | (145,487,068 | ) | | | 492,938,379 | |
T. Rowe Price Mid Cap Growth Portfolio (Class A) | | | 116,420,330 | | | | 14,787,802 | | | | (21,067,387 | ) | | | 2,995,819 | | | | (18,309,594 | ) | | | 94,826,970 | |
T. Rowe Price Small Cap Growth Portfolio (Class A) | | | 175,319,282 | | | | 14,102,862 | | | | (32,834,956 | ) | | | 6,008,367 | | | | (26,981,193 | ) | | | 135,614,362 | |
TCW Core Fixed Income Portfolio (Class A) | | | 272,970,061 | | | | 20,207,645 | | | | (32,427,081 | ) | | | (496,333 | ) | | | (6,389,649 | ) | | | 253,864,643 | |
Van Eck Global Natural Resources Portfolio (Class A) | | | 357,886,888 | | | | 48,633,307 | | | | (23,282,124 | ) | | | (3,044,509 | ) | | | (106,534,205 | ) | | | 273,659,357 | |
Wells Capital Management Mid Cap Value Portfolio (Class A) | | | 117,041,723 | | | | 11,014,853 | | | | (9,508,020 | ) | | | (3,142,799 | ) | | | (21,979,407 | ) | | | 93,426,350 | |
Western Asset Management Strategic Bond Opportunities Portfolio (Class A) | | | 228,955,621 | | | | 11,888,373 | | | | (20,951,386 | ) | | | (2,765,751 | ) | | | (17,459,947 | ) | | | 199,666,910 | |
| | | | | | | | | | | | | | | | | | | | | | | | |
| | $ | 11,559,205,406 | | | $ | 1,174,207,328 | | | $ | (1,719,739,281 | ) | | $ | 412,768,168 | | | $ | (2,026,791,738 | ) | | $ | 9,399,649,883 | |
| | | | | | | | | | | | | | | | | | | | | | | | |
| | | | | | | | | | | | |
Security Description | | Capital Gain
Distributions | | | Income earned
from affiliates
during the period | | | Number of
shares held at
December 31, 2018 | |
Baillie Gifford International Stock Portfolio (Class A) | | $ | — | | | $ | 5,107,040 | | | | 35,703,656 | |
BlackRock Bond Income Portfolio (Class A) | | | — | | | | 11,208,671 | | | | 2,951,469 | |
BlackRock Capital Appreciation Portfolio (Class A) | | | 48,921,161 | | | | 461,593 | | | | 7,884,701 | |
BlackRock High Yield Portfolio (Class A) | | | — | | | | 2,850,753 | | | | 6,749,921 | |
Brighthouse Small Cap Value Portfolio (Class A) | | | 10,053,255 | | | | 2,406,189 | | | | 11,509,766 | |
Brighthouse/Aberdeen Emerging Markets Equity Portfolio (Class A) | | | — | | | | 7,492,278 | | | | 26,022,453 | |
Brighthouse/Artisan International Portfolio (Class A) | | | — | | | | 5,799,989 | | | | 35,712,259 | |
Brighthouse/Artisan Mid Cap Value Portfolio (Class A) | | | 1,500,487 | | | | 177,694 | | | | 108,280 | |
Brighthouse/Dimensional International Small Company Portfolio (Class A) | | | 14,995,384 | | | | 5,835,571 | | | | 16,005,975 | |
Brighthouse/Eaton Vance Floating Rate Portfolio (Class A) | | | — | | | | 4,278,931 | | | | 9,795,366 | |
Brighthouse/Templeton International Bond Portfolio (Class A) | | | — | | | | — | | | | 29,317,329 | |
Brighthouse/Wellington Core Equity Opportunities Portfolio (Class A) | | | 30,331,348 | | | | 9,995,753 | | | | 15,933,441 | |
Brighthouse/Wellington Large Cap Research Portfolio (Class A) | | | 45,825,433 | | | | 4,130,811 | | | | 24,820,708 | |
Clarion Global Real Estate Portfolio (Class A) | | | — | | | | 17,025,353 | | | | 22,539,219 | |
ClearBridge Aggressive Growth Portfolio (Class A) | | | 23,592,567 | | | | 4,184,036 | | | | 25,634,507 | |
Frontier Mid Cap Growth Portfolio (Class A) | | | 6,150,646 | | | | — | | | | 1,451,955 | |
Harris Oakmark International Portfolio (Class A) | | | 19,126,116 | | | | 9,103,438 | | | | 34,938,091 | |
Invesco Comstock Portfolio (Class A) | | | 46,179,286 | | | | 5,446,206 | | | | 38,104,207 | |
Invesco Small Cap Growth Portfolio (Class A) | | | 31,098,676 | | | | — | | | | 15,853,191 | |
Jennison Growth Portfolio (Class A) | | | 82,388,015 | | | | 1,942,827 | | | | 32,423,024 | |
JPMorgan Core Bond Portfolio (Class A) | | | — | | | | 6,601,198 | | | | 20,264,620 | |
JPMorgan Small Cap Value Portfolio (Class A) | | | 9,635,723 | | | | 2,200,064 | | | | 9,430,647 | |
Loomis Sayles Small Cap Growth Portfolio (Class A) | | | 18,741,441 | | | | — | | | | 8,545,252 | |
MFS Research International Portfolio (Class A) | | | — | | | | 7,156,917 | | | | 26,459,648 | |
MFS Value Portfolio (Class A) | | | 42,780,685 | | | | 10,187,890 | | | | 40,686,461 | |
MFS Value Portfolio II (Class A) | | | 22,698,981 | | | | 2,730,087 | | | | — | |
Morgan Stanley Mid Cap Growth Portfolio (Class A) | | | 5,399,803 | | | | — | | | | 1,240,626 | |
Neuberger Berman Genesis Portfolio (Class A) | | | 3,541,437 | | | | 101,502 | | | | 1,241,064 | |
Oppenheimer Global Equity Portfolio (Class A) | | | 15,556,508 | | | | 2,059,879 | | | | 6,821,623 | |
PIMCO Inflation Protected Bond Portfolio (Class A) | | | — | | | | 3,038,065 | | | | 15,731,285 | |
PIMCO Total Return Portfolio (Class A) | | | — | | | | 5,245,469 | | | | 26,626,485 | |
T. Rowe Price Large Cap Growth Portfolio (Class A) | | | 86,427,935 | | | | 2,027,739 | | | | 19,425,989 | |
T. Rowe Price Large Cap Value Portfolio (Class A) | | | 56,494,641 | | | | 12,118,186 | | | | 17,211,536 | |
T. Rowe Price Mid Cap Growth Portfolio (Class A) | | | 14,786,453 | | | | — | | | | 9,305,885 | |
T. Rowe Price Small Cap Growth Portfolio (Class A) | | | 13,884,648 | | | | 201,887 | | | | 6,387,864 | |
TCW Core Fixed Income Portfolio (Class A) | | | — | | | | 7,107,351 | | | | 25,437,339 | |
Van Eck Global Natural Resources Portfolio (Class A) | | | — | | | | 615,279 | | | | 35,632,729 | |
Wells Capital Management Mid Cap Value Portfolio (Class A) | | | 9,629,158 | | | | 1,383,293 | | | | 9,380,156 | |
Western Asset Management Strategic Bond Opportunities Portfolio (Class A) | | | — | | | | 11,718,747 | | | | 15,746,602 | |
| | | | | | | | | | | | |
| | $ | 659,739,787 | | | $ | 171,940,686 | | | | | |
| | | | | | | | | | | | |
BHFTII-12
Brighthouse Funds Trust II
Brighthouse Asset Allocation 80 Portfolio
Notes to Financial Statements—December 31, 2018—(Continued)
7. Contractual Obligations
Under the Trust’s organizational documents, its officers and Trustees may be indemnified against certain liabilities and expenses arising out of the performance of their duties to the Trust. Additionally, the Trust has a variety of indemnification obligations under contracts with its service providers. The Trust’s maximum exposure under these arrangements is unknown, as this would involve future claims that may be made against the Trust that have not yet occurred.
8. Income Tax Information
The cost basis of investments for federal income tax purposes at December 31, 2018 was as follows:
| | | | |
Cost basis of investments | | $ | 9,823,785,812 | |
| | | | |
Gross unrealized appreciation | | | 243,646,413 | |
Gross unrealized depreciation | | | (667,782,342 | ) |
| | | | |
Net unrealized appreciation (depreciation) | | $ | (424,135,929 | ) |
| | | | |
The tax character of distributions paid for the years ended December 31, 2018 and 2017 were as follows:
| | | | | | | | | | | | | | | | | | | | |
Ordinary Income | | | Long-Term Capital Gain | | | Total | |
2018 | | 2017 | | | 2018 | | | 2017 | | | 2018 | | | 2017 | |
| $144,740,754 | | $ | 175,067,879 | | | $ | 489,610,263 | | | $ | 616,533,214 | | | $ | 634,351,017 | | | $ | 791,601,093 | |
As of December 31, 2018, the components of distributable earnings (accumulated losses) on a federal income tax basis were as follows:
| | | | | | | | | | | | | | | | | | |
Undistributed
Ordinary
Income | | Undistributed
Long-Term
Capital Gain | | | Net
Unrealized
Depreciation | | | Accumulated
Capital Losses | | | Total | |
| $176,563,535 | | $ | 1,015,075,045 | | | $ | (424,135,929 | ) | | $ | — | | | $ | 767,502,651 | |
The Asset Allocation Portfolio utilizes the provisions of the federal income tax laws that provide for the carryforward of capital losses for prior years, offsetting such losses against any future realized capital gains. Under the Regulated Investment Company Modernization Act of 2010, net capital losses recognized after December 22, 2010 may be carried forward indefinitely and their character is retained as short-term and/or long-term losses.
As of December 31, 2018, the Asset Allocation Portfolio had no accumulated capital losses.
9. Recent Accounting Pronouncements and SEC Update
In August 2018, the FASB issued Accounting Standards Update 2018-13, Fair Value Measurement (Topic 820)—Disclosure Framework—Changes to the Disclosure Requirements for Fair Value Measurement (“ASU 2018-13”) which introduces new fair value disclosure requirements as well as eliminates and modifies certain existing fair value disclosure requirements. ASU 2018-13 is effective for fiscal years beginning after December 15, 2019, and interim periods within those fiscal years. Early adoption is permitted and, as such, management has elected to early adopt ASU 2018-13 effective with the current reporting period. The impact of the Portfolio’s adoption was limited to changes in the Portfolio’s financial statement disclosures regarding fair value, primarily those disclosures related to transfers between levels of the fair value hierarchy.
In August 2018, the Securities and Exchange Commission released its Final Rule on Disclosure Update and Simplification (the “Final Rule”) which is intended to simplify an issuer’s disclosure compliance efforts by removing redundant or outdated disclosures requirements without significantly altering the mix of information provided to investors. Effective with the current reporting period, the Portfolio adopted the Final Rule with the most notable impacts being that the Portfolio is no longer required to present the components of distributable earnings on the Statement of Assets and Liabilities or the sources of distributions to shareholders and the amounts of undistributed net investment income on the Statements of Changes in Net Assets.
BHFTII-13
Brighthouse Funds Trust II
Brighthouse Asset Allocation 80 Portfolio
Report of Independent Registered Public Accounting Firm
To the Shareholders of Brighthouse Asset Allocation 80 Portfolio and the Board of Trustees of Brighthouse Funds Trust II:
Opinion on the Financial Statements and Financial Highlights
We have audited the accompanying statement of assets and liabilities, including the schedule of investments, of the Brighthouse Asset Allocation 80 Portfolio (the “Portfolio”), one of the portfolios constituting the Brighthouse Funds Trust II, as of December 31, 2018, the related statement of operations for the year then ended, the statements of changes in net assets for each of the two years in the period then ended, the financial highlights for each of the five years in the period then ended, and the related notes. In our opinion, the financial statements and financial highlights present fairly, in all material respects, the financial position of the Brighthouse Asset Allocation 80 Portfolio of the Brighthouse Funds Trust II as of December 31, 2018, the results of its operations for the year then ended, the changes in its net assets for each of the two years in the period then ended, and the financial highlights for each of the five years in the period then ended, in conformity with accounting principles generally accepted in the United States of America.
Basis for Opinion
These financial statements and financial highlights are the responsibility of the Portfolio’s management. Our responsibility is to express an opinion on the Portfolio’s financial statements and financial highlights based on our audits. We are a public accounting firm registered with the Public Company Accounting Oversight Board (United States) (PCAOB) and are required to be independent with respect to the Portfolio in accordance with the U.S. federal securities laws and the applicable rules and regulations of the Securities and Exchange Commission and the PCAOB.
We conducted our audits in accordance with the standards of the PCAOB. Those standards require that we plan and perform the audit to obtain reasonable assurance about whether the financial statements and financial highlights are free of material misstatement, whether due to error or fraud. The Portfolio is not required to have, nor were we engaged to perform, an audit of its internal control over financial reporting. As part of our audits we are required to obtain an understanding of internal control over financial reporting but not for the purpose of expressing an opinion on the effectiveness of the Portfolio’s internal control over financial reporting. Accordingly, we express no such opinion.
Our audits included performing procedures to assess the risks of material misstatement of the financial statements and financial highlights, whether due to error or fraud, and performing procedures that respond to those risks. Such procedures included examining, on a test basis, evidence regarding the amounts and disclosures in the financial statements and financial highlights. Our audits also included evaluating the accounting principles used and significant estimates made by management, as well as evaluating the overall presentation of the financial statements and financial highlights. Our procedures included confirmation of securities owned as of December 31, 2018, by correspondence with the transfer agent. We believe that our audits provide a reasonable basis for our opinion.
/s/ Deloitte & Touche LLP
Boston, Massachusetts
February 25, 2019
We have served as the auditor of one or more of the Brighthouse investment companies since 1983.
BHFTII-14
Brighthouse Funds Trust II
Trustees and Officers
MANAGEMENT OF THE TRUSTS
The Boards of Trustees (the “Board”) of Brighthouse Funds Trust I and Brighthouse Funds Trust II (“BHF I” and “BHF II”, respectively, and collectively the “Trusts”) supervise the Trusts and are responsible for representing the interests of shareholders. The Trustees, the Chairman of the Board and the Chairmen of each subcommittee are the same for both Trusts. The Trustees of each Trust meet periodically throughout the year to oversee the Portfolios’ activities, reviewing, among other things, each Portfolio’s performance and its contractual arrangements with various service providers. The Trustees of each Trust elect the officers of the Trust, who are responsible for administering the Trust’sday-to-day operations.
Trustees and Officers
The Trustees and executive officers of the Trusts, as well as their principal occupations during the past five years, are set forth below. Unless otherwise indicated, the business address of each is c/o Brighthouse Funds, One Financial Center, Boston, Massachusetts 02111. Each Trustee who is deemed an “interested person,” as such term is defined in the 1940 Act, is referred to as an “Interested Trustee.” Those Trustees who are not “interested persons,” as such term is defined in the 1940 Act, are referred to as “Independent Trustees.” There is no limit to the term a Trustee may serve. Trustees serve until their death, resignation or removal in accordance with the BHF I Trust’s and BHF II Trust’s respective organizational documents and policies adopted by the Boards of the respective Trusts from time to time. Officers hold office at the pleasure of each Board and serve until their removal or resignation in accordance with the Trusts’ respective organizational documents and policies adopted by the Board of each Trust from time to time.
| | | | | | | | | | |
Name and Year of Birth | | Current
Position(s)
Held with
Registrant | | Term of Office
and Length of
Time Served | | Principal Occupation(s) During the Past 5 Years(1) | | Number of
Portfolios in
Brighthouse Funds
Complex(2)
Overseen
by Trustee | | Other Directorships Held
by Trustee During
the Past 5 Years(1) |
| Interested Trustee |
John Rosenthal* (1960) | | Trustee | | Indefinite;
From
May
2016
(Trust I
and
Trust II) to
present | | Chief Investment Officer, Brighthouse Financial, Inc. (2017 to present); until 2017, Senior Managing Director and Head of Global Portfolio Management, MetLife, Inc. | | 72 | | None |
|
| Independent Trustees |
Dawn M. Vroegop (1966) | | Trustee and Chairman of the Board | | Indefinite;
From
December
2000
(Trust I)/
May
2009
(Trust II)
to present
as
Trustee;
From
May
2016
(Trust I
and
Trust II)
until
present as
Chairman | | Private Investor. | | 72 | | Trustee, Driehaus Mutual Funds.** |
BHFTII-15
Brighthouse Funds Trust II
Trustees and Officers—(Continued)
| | | | | | | | | | |
Name and Year of Birth | | Current
Position(s)
Held with
Registrant | | Term of Office
and Length of
Time Served | | Principal Occupation(s) During the Past 5 Years(1) | | Number of
Portfolios in
Brighthouse Funds
Complex(2)
Overseen
by Trustee | | Other Directorships Held
by Trustee During
the Past 5 Years(1) |
Stephen M. Alderman (1959) | | Trustee | | Indefinite;
From
December
2000
(Trust I)/
April
2012
(Trust II)
to present | | Shareholder in the law firm of Garfield and Merel, Ltd. | | 72 | | None |
| | | | | |
Robert J. Boulware (1956) | | Trustee | | Indefinite;
From
March
2008
(Trust I)/
April
2012
(Trust II)
to present | | Managing Director, Pilgrim Funds, LLC (private equity fund). | | 72 | | Trustee, Vertical Capital Income Fund(closed-end fund);** Director, Gainsco, Inc. (auto insurance);** Trustee, SharesPost 100 Fund(closed-end fund).** |
| | | | | |
Susan C. Gause (1952) | | Trustee | | Indefinite;
From
March
2008
(Trust I)/
April
2012
(Trust II)
to present | | Private Investor. | | 72 | | Trustee, HSBC Funds.** |
| | | | | |
Nancy Hawthorne (1951) | | Trustee | | Indefinite;
From
May
2003
(Trust II)/
April
2012
(Trust I) to
present | | Partner, Hawthorne Financial Advisors, LLC (registered investment advisor); until 2014, Chief Executive Officer, Clerestory LLC (corporate advisor). | | 72 | | Director and Chairman of the Board of Directors, THL Credit, Inc.;** Director and Chairman of the Board, Avid Technology, Inc.;** Director, CRA International, Inc.** |
| | | | | |
Barbara A. Nugent (1956) | | Trustee | | Indefinite;
From
January
2014
(Trust I
and
Trust II) to
present | | President, True North Board Governance, LLC (consulting); until December 2013, partner in the law firm of Stradley Ronon Stevens & Young, LLP. | | 72 | | Independent Lead Trustee, BMT Investment Funds** |
| | | | | |
Christopher J. Towle (1957) | | Trustee | | Indefinite;
From
April
2018
(Trust I
and
Trust II) to
present | | Retired; until 2014, Partner, Portfolio Manager, Director of High Yield and Convertible Strategies, Lord Abbett & Co. | | 72 | | Trustee, Driehaus Mutual Funds** |
BHFTII-16
Brighthouse Funds Trust II
Trustees and Officers—(Continued)
Officers
| | | | | | |
Name and Year of Birth | | Position(s)
Held with
Registrant | | Length of
Time Served | | Principal Occupation(s)
During the Past 5 Years(1) |
| Executive Officers | | | | | | |
Kristi Slavin (1973) | | President and Chief Executive Officer, of Trust I and Trust II | | From May
2016
(Trust I
and
Trust II) to
present | | President, Brighthouse Investment Advisers, LLC (2016-present); formerly, Senior Vice President, MetLife Advisers, LLC; Vice President, MetLife, Inc.; Vice President, Trust I and Trust II(2015-2016). |
| | | |
Alan R. Otis (1971) | | Chief Financial Officer and Treasurer, of Trust I and Trust II | | From
November
2017
(Trust I
and
Trust II) to
present | | Senior Vice President, Brighthouse Investment Advisers, LLC (2017-present); formerly, Vice President, Brighthouse Investment Advisers, LLC (2012-2017); Assistant Treasurer, Trust I and Trust II(2012-2017). |
| | | |
Andrew L. Gangolf (1954) | | Secretary, of Trust I and Trust II | | From May
2011
(Trust I
and
Trust II) to
present | | Executive Vice President, Brighthouse Investment Advisers, LLC (2017-present); formerly, Senior Vice President, MetLife Advisers, LLC (2011-2017); until 2011, Senior Vice President & Assistant General Counsel, AllianceBernstein Investments, Inc. |
| | | |
Steven E. Hartstein (1963) | | Chief Compliance Officer (“CCO”), of Trust I and Trust II | | From
February
2014
(Trust I
and
Trust II) to
present | | Senior Vice President and CCO, Brighthouse Investment Advisers, LLC (2017-present); Head of Investments Compliance, Vice President, Brighthouse Financial, Inc. (2017-present); formerly, Vice President, MetLife, Inc. (2013-2017); Senior Vice President and CCO, MetLife Advisers, LLC (2013-2017.) |
| | | |
Victor Soto (1978) | | Vice President of Trust I and Trust II | | From May
2018
(Trust I
and
Trust II) to
present | | Executive Vice President, Brighthouse Investment Advisers, LLC (2016-present); Assistant Vice President, MetLife Inc. (2015-2017); Portfolio Manager, 1st Global (2013-2015). |
| * | Mr. Rosenthal is an “interested person” of the Trusts because of his position with Brighthouse Financial, Inc., the current parent company of Brighthouse Investment Advisers, LLC. |
| ** | Indicates a directorship with a registered investment company or a company subject to the reporting requirements of the Securities Exchange Act of 1934, as amended. |
| (1) | Previous positions during the past five years with the Trusts, Brighthouse Financial, Inc., MetLife, Inc. or the Manager are omitted if not materially different. |
| (2) | The Fund Complex includes 43 BHF I Portfolios and 29 BHF II Portfolios. |
BHFTII-17
Brighthouse Funds Trust II
Brighthouse Asset Allocation 80 Portfolio
Board of Trustees’ Consideration of Advisory Agreements
At anin-person meeting held on November6-8, 2018 (the “November Meeting”), the Boards of Trustees (the “Board”) of Brighthouse Funds Trust I and Brighthouse Funds Trust II (“BFT I” and “BFT II,” respectively, and collectively, the “Trusts”), including a majority of the Trustees who are not “interested persons” of the Trusts (the “Independent Trustees”) under the Investment Company Act of 1940 (the “1940 Act”), approved the continuation of the Trusts’ advisory agreements (the “Advisory Agreements” or “Agreements”) with Brighthouse Investment Advisers, LLC (the “Adviser”) for the series of the Trusts (each a “Portfolio,” and collectively, the “Portfolios”).
In making those approvals, the Board reviewed a variety of materials that were provided for the specific purpose of the annual contract renewal process. In addition, various materials provided to and discussed with the Board throughout the year informed the Board’s decision to renew the Agreements. In particular, the information for each Portfolio included, but was not limited to, investment performance reports, and reports on expenses, legal and compliance matters, asset pricing, brokerage commissions and trade execution.
The Board met in person with personnel of the Adviser on October 17, 2018 for the specific purpose of giving preliminary consideration to the proposed continuation of the Agreements (the “October Meeting”). At that meeting, the Adviser reviewed with the Board the performance and fees experienced by each Portfolio, as well as other information. During and after the October Meeting, the Independent Trustees communicatedfollow-up matters for management to address at the November Meeting. The Independent Trustees were advised by independent legal counsel throughout the contract renewal process, and met with independent legal counsel in several executive sessions outside of the presence of management.
Information furnished and reviewed specifically in connection with the renewal process included, but was not limited to, a report for each Portfolio that was prepared by Broadridge (“Broadridge”), an independent organization. In addition, the Independent Trustees reviewed a report that was prepared by JDL Consultants, LLC (“JDL”), an independent consultant to the Independent Trustees (“JDL Report”), which examined the comparative fees, expenses and performance of each Portfolio, based upon the Broadridge reports. Also, the Board reviewed the responses to wide-ranging questions from the Independent Trustees relating to the business, operations and performance of the Adviser, and aPortfolio-by-Portfolio analysis of the profitability to the Adviser of each Agreement, each of which was prepared by the Adviser specifically for the renewal process.
At the November Meeting, the Board, including a majority of the Independent Trustees, concluded that the nature, extent and quality of services provided by the Adviser supported the renewal of the Agreements. The Board also concluded that the investment performance of each Portfolio was such that each Agreement should continue, and that the fees paid by each Portfolio to the Adviser appeared to be reasonable in light of the nature, extent and quality of the services provided by the Adviser. Further, the Board concluded that the Adviser’s profitability in providing services under the Advisory Agreements did not appear unreasonable in light of the nature, extent and quality of the services provided by the Adviser. Finally, the Board reviewed the extent to which the investment advisory fees paid by the Portfolios shared economies of scale with investors and concluded that those considerations generally supported the renewal of each Agreement. In approving the renewal of each of the Agreements, the Board, including the Independent Trustees, gave attention to all of the information that was furnished and each Trustee placed varying degrees of importance on the various pieces of information that were provided to them. The Board evaluated the information on aPortfolio-by-Portfolio basis, and its decision was made separately with respect to each Portfolio. The following paragraphs provide more information about some of the primary factors that were relevant to the Board’s decision. The Board did not identify any single factor as determinative, and the Trustees generally attributed different weights to various factors for the various Portfolios.
Nature, extent and quality of services. The Board evaluated the nature, extent and quality of the services that the Adviser has provided to the Brighthouse Asset Allocation 20 Portfolio, Brighthouse Asset Allocation 40 Portfolio, Brighthouse Asset Allocation 60 Portfolio Brighthouse Asset Allocation 80 Portfolio and Brighthouse Asset Allocation 100 Portfolio (the “Asset Allocation Portfolios”) and the American Funds Balanced Allocation Portfolio, American Funds Growth Allocation Portfolio and American Funds Moderate Allocation Portfolio (the “American Funds of Funds”). The Board considered the Adviser’s services as investment manager to the Portfolios, including its trading practices and oversight of transition management (as applicable), compliance program and personnel, and risk management, among other things. The Adviser’s services in coordinating and overseeing the activities of the Trusts’ service providers were also considered. The Board considered information received from the Trusts’ Chief Compliance Officer (“CCO”) regarding the Portfolios’ compliance policies and procedures that were established pursuant to Rule38a-l under the 1940 Act. The Board also noted that the Adviser’s investment, compliance and legal staff regularly review and assess the services that are provided to the Portfolios, and that personnel of the Adviser prepare and present reports to the Independent Trustees regarding material information related to those reviews and assessments. In addition, throughout the year, the Board considered the expertise, experience and performance of the personnel of the Adviser who performed the various services that are mentioned above.
BHFTII-18
Brighthouse Funds Trust II
Brighthouse Asset Allocation 80 Portfolio
Board of Trustees’ Consideration of Advisory Agreements—(Continued)
With respect to the Asset Allocation Portfolios, the Board noted that the Adviser has hired at its own expense an independent consultant to provide research and consulting services with respect to the periodic asset allocation targets for each of the Asset Allocation Portfolios and investments in other Portfolios of the Trusts (the “Underlying Portfolios”). Additionally, the Board considered that a committee, consisting of investment professionals from the Adviser, meets regularly to review the asset allocations and discuss the performance of the Asset Allocation Portfolios and the American Funds of Funds.
The Board further considered and found that the advisory fee paid to the Adviser with respect to each Asset Allocation Portfolio and American Fund of Funds was based on services provided that were in addition to, rather than duplicative of, the services provided pursuant to the advisory agreements for the Underlying Portfolios in which the Portfolio invests.
Performance. The Board placed emphasis on the performance of each Portfolio in light of, among other things, its importance to investors. The Board considered the Adviser’s quarterly reviews with the Board of detailed information about each Portfolio’s investment strategies and performance results and composition, including discussions regarding the relevant effect of current market conditions. The Board reviewed and considered the reports prepared by Broadridge, which provided a statistical analysis comparing the Portfolios’ investment performance to that of comparable funds underlying variable insurance products (the “Performance Universe”). The Independent Trustees also met separately with representatives of JDL during the October Meeting to review the JDL Report. The Board considered each Portfolio’s performance for periods subsequent to the performance period covered by the Broadridge reports, and the Adviser’s discussion of the same, including the effect of current market conditions on each Portfolio’s more recent performance. The Board focused particular attention on Portfolios with less favorable performance records. The Board also noted that while it found the data provided by Broadridge generally useful, it recognized the limitations of such data, including, in particular, that notable differences may exist between a Portfolio and those of the other funds in a Broadridge category (for example, the investment objectives(s) and investment strategies) and that the results of the performance comparisons may vary depending on (i) the end dates for the performance periods that were selected and (ii) the selection of the peer groups.
Fees and Expenses. The Board gave consideration to the level and method of computing the fees payable under the Agreements. The Board considered the Broadridge report for each of the Portfolios, which included comparisons for each Portfolio of its contractual management fees (at current and various asset levels), and total expenses, with those of its peers, including as those peers were divided into a broad group of peer funds (“Expense Universe”) and a narrower group of peer funds (“Expense Group”). Broadridge selected the peer funds which were similarly situated funds underlying variable insurance products deemed to be comparable to the Portfolios. The Independent Trustees, with the assistance of JDL, also examined the JDL Report.
The Board also considered that the Adviser had entered into expense limitation or management fee waiver agreements with certain of the Portfolios pursuant to which the Adviser had agreed to waive a portion of its advisory fee and/or reimburse certain expenses as a means of limiting a Portfolio’s total annual operating expenses.
Profitability. The Board examined the profitability to the Adviser of each Agreement on aPortfolio-by-Portfolio basis. In the case of the Asset Allocation Portfolios, the Board also considered the Adviser’s analysis of its profitability that was attributable to its management of the Underlying Portfolios of the Trust in which the Asset Allocation Portfolios invest. The Board further considered that an affiliate of the Adviser, Brighthouse Securities, LLC, serves as distributor for the Portfolios, and, as such, receives Rule12b-1 payments to support the distribution of the Portfolios. In reviewing the profitability analyses, the Board recognized that expense allocation methodologies are inherently subjective and various expense allocation methodologies may be reasonable while producing different results.
Economies of scale. The Board also considered each Portfolio’s fees in light of its size. The Board noted the fee schedules for the Portfolios that contain breakpoints that reduce the fee rate above specified asset levels. The Board noted those Portfolios that did not contain breakpoints in the advisory fee and took into account management’s discussion of the same. The Board considered the effective fees under the Advisory Agreement for each Portfolio as a percentage of assets at different asset levels and possible economies of scale that may be realized if the assets of the Portfolio grow. The Board examined, among other data, the effect of a Portfolio’s growth in size on various fee schedules and reviewed the Broadridge and JDL Reports, which compared fees among peers. The Board also generally noted that if a Portfolio’s assets increase over time, the Portfolio may realize other economies of scale if assets increase proportionally more than fixed expenses.
Other factors. The Board considered other benefits that may be realized by the Adviser and its affiliates from their relationship with the Trusts. Among them, the Board recognized that Brighthouse Securities, LLC, as the distributor for the Trusts, receives payments pursuant to Rule12b-1 from the Portfolios to compensate for the provision of shareholder services and distribution activities, which could lead to growth in the Trusts’ assets and corresponding benefits from such growth, including economies of scale. In conjunction with these considerations, the Board noted the ongoing commitment of the Adviser to the Portfolios.
BHFTII-19
Brighthouse Funds Trust II
Brighthouse Asset Allocation 80 Portfolio
Board of Trustees’ Consideration of Advisory Agreements—(Continued)
The Board requested, received, and considered information from the Adviser regarding possible conflicts of interest in the form of material benefits to the Adviser resulting from the Adviser’s affiliations and business relationships, as relevant. The Board considered the services that are provided to the Trusts by its service providers, and the manner in which any conflicts were mitigated.
* * *
Brighthouse Asset Allocation 80 Portfolio.The Board also considered the following information in relation to the Agreement with the Adviser regarding the Portfolio:
Among other data relating specifically to the Portfolio’s performance, the Board considered that the Portfolio outperformed the median of its Performance Universe and the average of its Morningstar category for theone-, three-, and five-year periods ended June 30, 2018. The Board further considered that the Portfolio underperformed the Brighthouse AA 80 Narrow Index for theone-, three- and five-year periods ended September 30, 2018. The Board also took into account that the Portfolio outperformed the Dow Jones Moderately Aggressive Index for the three-year and five-year periods ended September 30, 2018, and underperformed for theone-year period ended September 30, 2018.
The Board also considered that the Portfolio’s actual management fees were equal to the Expense Group median and below the Expense Universe median. The Board also considered that the Portfolio’s total expenses (exclusive of12b-l fees) were below the Expense Group median and the Expense Universe median. The Board noted that the Portfolio’s contractual management fees were below the asset-weighted average of comparable funds at the Portfolio’s current size.
BHFTII-20
Brighthouse Funds Trust II
Frontier Mid Cap Growth Portfolio
Managed by Frontier Capital Management Company, LLC
Portfolio Manager Commentary*
PERFORMANCE
For the 12 months ended December 31, 2018, the Class A, B, D, and E shares of the Frontier Mid Cap Growth Portfolio returned-5.64%,-5.90%,-5.76%, and-5.79%, respectively. The Portfolio’s benchmark, the Russell Midcap Growth Index1, returned-4.75%.
MARKET ENVIRONMENT / CONDITIONS
2018 was a tale of two markets with divergent trends. During the first three quarters of the year, gains in the market were driven by robust corporate earnings, elevated mergers & acquisition activity and increased capital returns in the form of buybacks. However, beneath the surface of higher index levels, performance was less uniform. Growth significantly outperformed value as concern about the impact of higher interest rates and the prospect of economic growth peaking led investors to crowd into a narrow group of rapidly growing companies perceived to be immune from economic weakness. Increased trade tensions further exacerbated this trend as investors continued to favor domestic high growth companies that were already trading at historically high valuations, regardless of whether these companies were profitable.
After three positive quarters, the year concluded with equities experiencing the most substantial quarterly decline since the global financial crisis in 2008. The Russell MidcapGrowth Index fell 16% as multiples collapsed in the fourth quarter by the largest amount since 2002. All this occurred despite 2018 S&P 500 Index earnings rising over an estimated 20%. Indeed, the year will be remembered as one where booming earnings growth was offset by a busting of P/E multiples. The sharp correction in valuations reflected concerns the economic cycle was approaching a recession based on headline risks including slowing global growth, tightening monetary policy, swelling fiscal deficits, declining earnings momentum and ongoing political disruption to trade.
PORTFOLIO REVIEW /PERIOD-END POSITIONING
During the one-year period, the Portfolio underperformed the Russell Midcap Growth Index. Relative underperformance was the result of negative sector allocation, which more than offset positive stock selection over the period. The Portfolio’s overweight positions within the Materials and Financials sectors, as well as an underweight in the Consumer Staples sector hindered relative results.
The Portfolio’s largest contributors to stock selection occurred in Health Care and Consumer Discretionary, while the largest detractors occurred in Information Technology (“IT”) and Industrials.
In Materials, short term inflationary pressures were a burden to our aggregates companies Vulcan Materials, Martin Marietta Materials, and Eagle Materials. We exited Eagle Materials over the period given concerns we uncovered in their frac sanding business. In addition, specialty agriculture company FMC Corp. came under pressure as trade tensions with China escalated and questions arose over potential oversupply conditions in its lithium business.
In Financials, concern of a flattening yield curve was a headwind to financial services firm Raymond James, bank holding company Webster Financial, and investment banking and advisory firm Evercore. Finally, in Consumer Staples our long-standing investment in energy drink company Monster Beverage Corp. performed poorly as category growth slowed and potential new entrants emerged. The change in the competitive dynamics led us to sell our position during the period.
Within Health Care, the Portfolio’s overweight position and strong stock selection benefited results. The largest contributor was the Portfolio’s investment in the oncology focused biotech company Tesaro, which was acquired for a substantial premium by GlaxoSmithKline late in the year. The Portfolio’s investment in veterinary medicine company Zoetis prospered as it delivered strong and consistent top and bottom line results. Finally, contact specialty company Cooper Companies delivered solid results that continued to surprise the market. In Consumer Discretionary, stock selection was additive to relative performance. Our focus on category retail leaders with limited exposure to Amazon was rewarded as both O’Reilly Automotive and Advanced Auto Parts performed well. Additionally, Yum! Brands was rewarded for its growing recurring franchise fees driven by the global expansion of Kentucky Fried Chicken, Pizza Hut, and Taco Bell.
Negative stock selection in IT was the largest headwind to the Portfolio’s performance during the year. Not owning software company Red Hat was a major drag on performance as it was purchased by IBM for a 60% premium. A position in IT consulting company DXC Technology declined on reported weaker sales in their September quarter, which led to a meaningful pullback for the year. While we believed the decline in its stock price was warranted given its sales miss, we think the magnitude of the decline was excessive for a company with largely recurring revenue streams. Additionally, the Portfolio’s overweight exposure to more economically sensitive semiconductor names such as Marvell Technologies, Qorvo, and Universal Display lagged faster growing, more domestic centric software companies which we were underweight based on valuations. Within Industrials, the Portfolio’s underweight positioning and unfavorable stock selection detracted despite solid performance in uniform rental company Cintas Corp. and waste services company Waste Connections, which helped to offset some of the weak performance in transportation holdings Knight-Swift Transportation and JetBlue Airways, both of which the Portfolio still owned at period end.
We continued to focus on companies that we believed had strong secular appeal, were positioned to gain share in growth markets, and had management led initiatives to support shareholder returns. At period end, the Portfolio’s largest overweights were in the Materials, Health Care, and Financials sectors. Regarding Health Care, we continued to see attractive innovation in medical & dental technology, pharmaceutical, and biotechnology areas. In Financials, we continued to like financial technology companies and investment
BHFTII-1
Brighthouse Funds Trust II
Frontier Mid Cap Growth Portfolio
Managed by Frontier Capital Management Company, LLC
Portfolio Manager Commentary*—(Continued)
advisory businesses. We remained guarded about valuations for cyclical areas such as Industrials and growth challenged areas such as Consumer Staples, both sectors we remained underweight.
Stephen M. Knightly
Christopher J. Scarpa
Portfolio Managers
Frontier Capital Management Company, LLC
* This commentary may include statements that constitute “forward-looking statements” under the U.S. securities laws. Forward-looking statements include, among other things, projections, estimates, and information about possible or future results related to the Portfolio, market or regulatory developments. The views expressed above are not guarantees of future performance or economic results and involve certain risks, uncertainties and assumptions that could cause actual outcomes and results to differ materially from the views expressed herein. The views expressed above are subject to change at any time based upon economic, market, or other conditions and the subadvisory firm undertakes no obligation to update the views expressed herein. Any discussions of specific securities should not be considered a recommendation to buy or sell those securities. The views expressed above (including any forward-looking statement) may not be relied upon as investment advice or as an indication of the Portfolio’s trading intent. Information about the Portfolio’s holdings, asset allocation or country diversification is historical and is not an indication of future Portfolio composition, which may vary. Direct investment in any index is not possible. The performance of any index mentioned in this commentary has not been adjusted for ongoing management, distribution and operating expenses, and sales charges applicable to mutual fund investments. In addition, the returns do not reflect additional fees charged by separate accounts or variable insurance contracts that an investor in the Portfolio may pay. If these additional fees were reflected, performance would have been lower.
BHFTII-2
Brighthouse Funds Trust II
Frontier Mid Cap Growth Portfolio
A $10,000 INVESTMENT COMPARED TO THE RUSSELL MIDCAP GROWTH INDEX
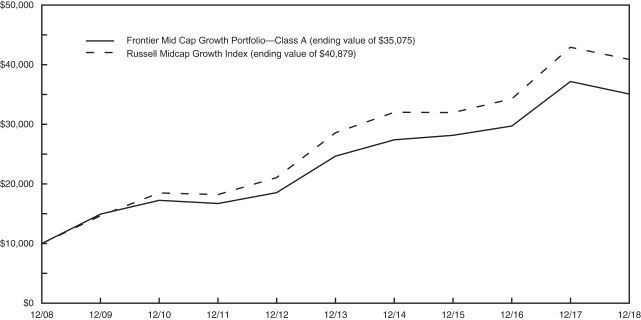
AVERAGE ANNUAL RETURNS (%) (FOR THE YEAR ENDED DECEMBER 31, 2018)
| | | | | | | | | | | | |
| | | | |
| | | 1 Year | | | 5 Year | | | 10 Year | |
| Frontier Mid Cap Growth Portfolio | | | | | | | | | | | | |
Class A | | | -5.64 | | | | 7.33 | | | | 13.37 | |
Class B | | | -5.90 | | | | 7.06 | | | | 13.08 | |
Class D | | | -5.76 | | | | 7.22 | | | | 13.25 | |
Class E | | | -5.79 | | | | 7.17 | | | | 13.20 | |
| Russell Midcap Growth Index | | | -4.75 | | | | 7.42 | | | | 15.12 | |
1 The Russell Midcap Growth Index is an unmanaged measure of performance of those Russell Midcap companies (the 800 smallest companies in the Russell 1000 Index) with higher price-to-book ratios and forecasted growth values.
Portfolio performance is calculated including reinvestment of all income and capital gain distributions. Performance numbers are net of all Portfolio expenses but do not include any insurance, sales, separate account or administrative charges of variable annuity or life insurance contracts or any additional expenses that participants may bear relating to the operations of their plans. If these charges were included, the returns would be lower. The performance of any index referenced above has not been adjusted for ongoing management, distribution and operating expenses, and sales charges applicable to mutual fund investments. Direct investment in any index is not possible. The performance of Class A shares, as set forth in the line graph above, will differ from that of other classes because of the difference in expenses paid by policyholders investing in the different share classes.
This information represents past performance and is not indicative of future results. Investment return and principal value may fluctuate so that shares, upon redemption, may be worth more or less than the original cost.
PORTFOLIO COMPOSITION AS OF DECEMBER 31, 2018
Top Holdings
| | | | |
| | | % of
Net Assets | |
| Global Payments, Inc. | | | 3.0 | |
| O’Reilly Automotive, Inc. | | | 2.8 | |
| SS&C Technologies Holdings, Inc. | | | 2.6 | |
| Waste Connections, Inc. | | | 2.5 | |
| Dollar General Corp. | | | 2.4 | |
| Ball Corp. | | | 2.3 | |
| Worldpay, Inc. - Class A | | | 2.2 | |
| Cooper Cos., Inc. (The) | | | 2.1 | |
| Aon plc | | | 2.1 | |
| Yum! Brands, Inc. | | | 2.1 | |
Top Sectors
| | | | |
| | | % of
Net Assets | |
| Information Technology | | | 30.5 | |
| Consumer Discretionary | | | 19.0 | |
| Health Care | | | 17.8 | |
| Industrials | | | 10.8 | |
| Financials | | | 9.0 | |
| Materials | | | 8.7 | |
| Energy | | | 1.0 | |
| Communication Services | | | 1.0 | |
| Real Estate | | | 1.0 | |
BHFTII-3
Brighthouse Funds Trust II
Frontier Mid Cap Growth Portfolio
Understanding Your Portfolio’s Expenses
Shareholder Expense Example
As a shareholder of the Portfolio, you incur ongoing costs, including management fees; distribution and service(12b-1) fees; and other Portfolio expenses. This example is intended to help you understand your ongoing costs (in dollars) (referred to as “expenses”) of investing in the Portfolio and compare these costs with the ongoing costs of investing in other mutual funds. The example is based on an investment of $1,000 invested at the beginning of the period and held for the entire period, July 1, 2018 through December 31, 2018.
Actual Expenses
The first line for each share class of the Portfolio in the table below provides information about actual account values and actual expenses. You may use the information in this line, together with the amount you invested in the particular share class of the Portfolio, to estimate the expenses that you paid over the period. Simply divide your account value by $1,000 (for example, an $8,600 account value divided by $1,000 = 8.6), then multiply the result by the number in the first line under the heading entitled “Expenses Paid During Period” to estimate the expenses you paid on your account during this period.
Hypothetical Example for Comparison Purposes
The second line for each share class of the Portfolio in the table below provides information about hypothetical account values and hypothetical expenses based on the Portfolio’s actual expense ratio and an assumed rate of return of 5% per year before expenses, which is not the Portfolio’s actual return. The hypothetical account values and expenses may not be used to estimate the actual ending account balance or expenses you paid for the period. You may use this information to compare the ongoing costs of investing in the Portfolio and other funds. To do so, compare this 5% hypothetical example with the 5% hypothetical examples that appear in the shareholder reports of the other funds.
Please note that the expenses shown in the table are meant to highlight your ongoing costs only and do not reflect any fees or charges of your variable insurance product or any additional expenses that participants in certain eligible qualified plans may bear relating to the operations of their plan. Therefore, the second line for each share class in the table is useful in comparing ongoing costs only, and will not help you determine the relative total costs of owning different funds. In addition, if these other costs were included, your costs would have been higher.
| | | | | | | | | | | | | | | | | | |
Frontier Mid Cap Growth Portfolio | | | | Annualized
Expense
Ratio | | | Beginning
Account Value
July 1,
2018 | | | Ending
Account Value
December 31,
2018 | | | Expenses Paid
During Period**
July 1, 2018
to
December 31,
2018 | |
Class A (a) | | Actual | | | 0.72 | % | | $ | 1,000.00 | | | $ | 908.50 | | | $ | 3.46 | |
| | Hypothetical* | | | 0.72 | % | | $ | 1,000.00 | | | $ | 1,021.58 | | | $ | 3.67 | |
| | | | | |
Class B (a) | | Actual | | | 0.97 | % | | $ | 1,000.00 | | | $ | 907.30 | | | $ | 4.66 | |
| | Hypothetical* | | | 0.97 | % | | $ | 1,000.00 | | | $ | 1,020.32 | | | $ | 4.94 | |
| | | | | |
Class D (a) | | Actual | | | 0.82 | % | | $ | 1,000.00 | | | $ | 907.80 | | | $ | 3.94 | |
| | Hypothetical* | | | 0.82 | % | | $ | 1,000.00 | | | $ | 1,021.07 | | | $ | 4.18 | |
| | | | | |
Class E (a) | | Actual | | | 0.87 | % | | $ | 1,000.00 | | | $ | 907.80 | | | $ | 4.18 | |
| | Hypothetical* | | | 0.87 | % | | $ | 1,000.00 | | | $ | 1,020.82 | | | $ | 4.43 | |
| * | Hypothetical assumes a rate of return of 5% per year before expenses. |
| ** | Expenses paid are equal to the Portfolio’s annualized expense ratio for the most recent six month period, as shown above, multiplied by the average account value over the period, multiplied by the number of days (184 days) in the most recent fiscal half-year, divided by 365 (to reflect theone-half year period). |
| (a) | The annualized expense ratio shown reflects the impact of the management fee waiver as described in Note 5 of the Notes to Financial Statements. |
BHFTII-4
Brighthouse Funds Trust II
Frontier Mid Cap Growth Portfolio
Schedule of Investments as of December 31, 2018
Common Stocks—98.8% of Net Assets
| | | | | | | | |
| Security Description | | Shares | | | Value | |
|
| Aerospace & Defense—0.6% | |
BWX Technologies, Inc. (a) | | | 146,405 | | | $ | 5,597,063 | |
| | | | | | | | |
|
| Airlines—0.9% | |
JetBlue Airways Corp. (b) | | | 549,666 | | | | 8,827,636 | |
| | | | | | | | |
|
| Banks—1.1% | |
Webster Financial Corp. (a) | | | 236,153 | | | | 11,639,981 | |
| | | | | | | | |
|
| Biotechnology—4.3% | |
BioMarin Pharmaceutical, Inc. (b) | | | 197,860 | | | | 16,847,779 | |
Exact Sciences Corp. (a) (b) | | | 124,682 | | | | 7,867,434 | |
Incyte Corp. (b) | | | 85,789 | | | | 5,455,322 | |
Neurocrine Biosciences, Inc. (a) (b) | | | 65,090 | | | | 4,648,077 | |
Seattle Genetics, Inc. (a) (b) | | | 166,245 | | | | 9,419,442 | |
| | | | | | | | |
| | | | | | | 44,238,054 | |
| | | | | | | | |
|
| Building Products—0.5% | |
A.O. Smith Corp. | | | 125,566 | | | | 5,361,668 | |
| | | | | | | | |
|
| Capital Markets—5.8% | |
Evercore, Inc. - Class A | | | 137,901 | | | | 9,868,196 | |
LPL Financial Holdings, Inc. (a) | | | 257,089 | | | | 15,702,996 | |
Moody’s Corp. (a) | | | 53,147 | | | | 7,442,706 | |
Nasdaq, Inc. | | | 163,163 | | | | 13,309,206 | |
Raymond James Financial, Inc. | | | 180,303 | | | | 13,416,346 | |
| | | | | | | | |
| | | | | | | 59,739,450 | |
| | | | | | | | |
|
| Chemicals—3.6% | |
FMC Corp. | | | 274,006 | | | | 20,265,484 | |
Sherwin-Williams Co. (The) | | | 42,027 | | | | 16,535,943 | |
| | | | | | | | |
| | | | | | | 36,801,427 | |
| | | | | | | | |
|
| Commercial Services & Supplies—4.9% | |
Cintas Corp. (a) | | | 110,916 | | | | 18,632,779 | |
KAR Auction Services, Inc. (a) | | | 136,640 | | | | 6,520,461 | |
Waste Connections, Inc. | | | 344,159 | | | | 25,553,805 | |
| | | | | | | | |
| | | | | | | 50,707,045 | |
| | | | | | | | |
|
| Construction & Engineering—1.0% | |
KBR, Inc. (a) | | | 664,022 | | | | 10,079,854 | |
| | | | | | | | |
|
| Construction Materials—1.7% | |
Martin Marietta Materials, Inc. (a) | | | 47,871 | | | | 8,227,589 | |
Vulcan Materials Co. (a) | | | 96,854 | | | | 9,569,175 | |
| | | | | | | | |
| | | | | | | 17,796,764 | |
| | | | | | | | |
|
| Containers & Packaging—2.3% | |
Ball Corp. (a) | | | 511,289 | | | | 23,509,068 | |
| | | | | | | | |
|
| Distributors—1.2% | |
LKQ Corp. (b) | | | 511,205 | | | | 12,130,895 | |
| | | | | | | | |
|
| Diversified Consumer Services—1.8% | |
Bright Horizons Family Solutions, Inc. (b) | | | 100,278 | | | | 11,175,983 | |
| | | | | | | | |
| Security Description | | Shares | | | Value | |
|
| Diversified Consumer Services—(Continued) | |
ServiceMaster Global Holdings, Inc. (b) | | | 184,686 | | | $ | 6,785,364 | |
| | | | | | | | |
| | | | | | | 17,961,347 | |
| | | | | | | | |
|
| Electrical Equipment—0.7% | |
Rockwell Automation, Inc. | | | 50,254 | | | | 7,562,222 | |
| | | | | | | | |
|
| Electronic Equipment, Instruments & Components—1.3% | |
Amphenol Corp. - Class A | | | 168,115 | | | | 13,620,677 | |
| | | | | | | | |
|
| Entertainment—1.0% | |
Activision Blizzard, Inc. | | | 89,265 | | | | 4,157,071 | |
Electronic Arts, Inc. (b) | | | 78,971 | | | | 6,231,602 | |
| | | | | | | | |
| | | | | | | 10,388,673 | |
| | | | | | | | |
|
| Equity Real Estate Investment Trusts—1.0% | |
SBA Communications Corp. (b) | | | 63,457 | | | | 10,273,054 | |
| | | | | | | | |
|
| Health Care Equipment & Supplies—9.0% | |
ABIOMED, Inc. (b) | | | 29,878 | | | | 9,711,545 | |
Align Technology, Inc. (a) (b) | | | 17,840 | | | | 3,736,231 | |
Cooper Cos., Inc. (The) | | | 86,245 | | | | 21,949,352 | |
Edwards Lifesciences Corp. (a) (b) | | | 94,222 | | | | 14,431,984 | |
Insulet Corp. (a) (b) | | | 63,633 | | | | 5,047,370 | |
Merit Medical Systems, Inc. (b) | | | 103,141 | | | | 5,756,299 | |
STERIS plc (a) | | | 158,584 | | | | 16,944,700 | |
Teleflex, Inc. | | | 57,474 | | | | 14,855,880 | |
| | | | | | | | |
| | | | | | | 92,433,361 | |
| | | | | | | | |
|
| Hotels, Restaurants & Leisure—5.0% | |
Aramark (a) | | | 202,990 | | | | 5,880,620 | |
Eldorado Resorts, Inc. (a) (b) | | | 517,836 | | | | 18,750,842 | |
Texas Roadhouse, Inc. (a) | | | 89,786 | | | | 5,360,224 | |
Yum! Brands, Inc. | | | 228,905 | | | | 21,040,948 | |
| | | | | | | | |
| | | | | | | 51,032,634 | |
| | | | | | | | |
|
| Insurance—2.1% | |
Aon plc | | | 145,655 | | | | 21,172,411 | |
| | | | | | | | |
|
| IT Services—10.6% | |
DXC Technology Co. | | | 264,513 | | | | 14,064,156 | |
Gartner, Inc. (a) (b) | | | 52,200 | | | | 6,673,248 | |
Global Payments, Inc. | | | 301,117 | | | | 31,054,196 | |
InterXion Holding NV (b) | | | 229,519 | | | | 12,430,749 | |
Jack Henry & Associates, Inc. | | | 40,234 | | | | 5,090,406 | |
WEX, Inc. (b) | | | 124,014 | | | | 17,369,401 | |
Worldpay, Inc. - Class A (a) (b) | | | 294,635 | | | | 22,518,953 | |
| | | | | | | | |
| | | | | | | 109,201,109 | |
| | | | | | | | |
|
| Life Sciences Tools & Services—4.2% | |
Illumina, Inc. (a) (b) | | | 18,438 | | | | 5,530,109 | |
PRA Health Sciences, Inc. (a) (b) | | | 145,256 | | | | 13,357,742 | |
QIAGEN NV (b) | | | 375,495 | | | | 12,935,803 | |
Waters Corp. (b) | | | 60,588 | | | | 11,429,926 | |
| | | | | | | | |
| | | | | | | 43,253,580 | |
| | | | | | | | |
See accompanying notes to financial statements.
BHFTII-5
Brighthouse Funds Trust II
Frontier Mid Cap Growth Portfolio
Schedule of Investments as of December 31, 2018
Common Stocks—(Continued)
| | | | | | | | |
| Security Description | |
Shares | | | Value | |
|
| Metals & Mining—1.1% | |
Allegheny Technologies, Inc. (a) (b) | | | 525,664 | | | $ | 11,443,705 | |
| | | | | | | | |
|
| Multiline Retail—2.4% | |
Dollar General Corp. (a) | | | 225,448 | | | | 24,366,420 | |
| | | | | | | | |
|
| Oil, Gas & Consumable Fuels—1.0% | |
Carrizo Oil & Gas, Inc. (a) (b) | | | 383,467 | | | | 4,329,342 | |
Concho Resources, Inc. (b) | | | 59,183 | | | | 6,083,421 | |
| | | | | | | | |
| | | | | | | 10,412,763 | |
| | | | | | | | |
|
| Pharmaceuticals—0.2% | |
Nektar Therapeutics (a) (b) | | | 70,769 | | | | 2,326,177 | |
| | | | | | | | |
|
| Road & Rail—0.8% | |
Knight-Swift Transportation Holdings, Inc. (a) | | | 304,588 | | | | 7,636,021 | |
| | | | | | | | |
|
| Semiconductors & Semiconductor Equipment—8.2% | |
Lam Research Corp. | | | 67,380 | | | | 9,175,135 | |
Marvell Technology Group, Ltd. (a) | | | 813,437 | | | | 13,169,545 | |
Monolithic Power Systems, Inc. (a) | | | 51,288 | | | | 5,962,230 | |
Qorvo, Inc. (a) (b) | | | 272,214 | | | | 16,531,556 | |
Semtech Corp. (b) | | | 341,565 | | | | 15,667,587 | |
Universal Display Corp. (a) | | | 89,384 | | | | 8,363,661 | |
Xilinx, Inc. | | | 173,890 | | | | 14,810,211 | |
| | | | | | | | |
| | | | | | | 83,679,925 | |
| | | | | | | | |
|
| Software—10.3% | |
2U, Inc. (a) (b) | | | 101,354 | | | | 5,039,321 | |
Guidewire Software, Inc. (a) (b) | | | 129,509 | | | | 10,390,507 | |
Nutanix, Inc. - Class A (a) (b) | | | 290,992 | | | | 12,102,357 | |
Palo Alto Networks, Inc. (b) | | | 28,809 | | | | 5,426,175 | |
ServiceNow, Inc. (a) (b) | | | 88,611 | | | | 15,777,189 | |
Splunk, Inc. (a) (b) | | | 143,993 | | | | 15,097,666 | |
SS&C Technologies Holdings, Inc. | | | 600,612 | | | | 27,093,607 | |
Workday, Inc. - Class A (b) | | | 94,658 | | | | 15,114,990 | |
| | | | | | | | |
| | | | | | | 106,041,812 | |
| | | | | | | | |
|
| Specialty Retail—8.3% | |
Advance Auto Parts, Inc. | | | 95,158 | | | | 14,983,579 | |
Burlington Stores, Inc. (b) | | | 58,001 | | | | 9,435,023 | |
Carvana Co. (a) (b) | | | 131,736 | | | | 4,309,084 | |
O’Reilly Automotive, Inc. (b) | | | 84,604 | | | | 29,131,695 | |
Ross Stores, Inc. (a) | | | 165,449 | | | | 13,765,357 | |
Ulta Salon Cosmetics & Fragrance, Inc. (a) (b) | | | 55,139 | | | | 13,500,233 | |
| | | | | | | | |
| | | | | | | 85,124,971 | |
| | | | | | | | |
|
| Textiles, Apparel & Luxury Goods—0.4% | |
Under Armour, Inc. - Class A (a) (b) | | | 243,203 | | | | 4,297,397 | |
| | | | | | | | |
|
| Trading Companies & Distributors—1.5% | |
Beacon Roofing Supply, Inc. (a) (b) | | | 209,994 | | | | 6,661,010 | |
HD Supply Holdings, Inc. (b) | | | 223,126 | | | | 8,371,687 | |
| | | | | | | | |
| | | | | | | 15,032,697 | |
| | | | | | | | |
Total Common Stocks
(Cost $925,257,899) | | | | | | | 1,013,689,861 | |
| | | | | | | | |
| | | | | | | | |
|
| Short-Term Investment—1.2% | |
| Security Description | | Principal
Amount* | | | Value | |
|
| Repurchase Agreement—1.2% | |
Fixed Income Clearing Corp.
Repurchase Agreement dated 12/31/18 at 1.200%, due on 01/02/19 with a maturity value of $12,362,526; collateralized by U.S. Treasury Note at 2.750%, maturing 02/15/24, with a market value of $12,610,296. | | | 12,361,702 | | | $ | 12,361,702 | |
| | | | | | | | |
Total Short-Term Investments
(Cost $12,361,702) | | | | | | | 12,361,702 | |
| | | | | | | | |
|
| Securities Lending Reinvestments (c)—18.2% | |
|
| Certificates of Deposit—11.2% | |
Banco Del Estado De Chile New York
2.720%, 1M LIBOR + 0.250%, 03/20/19 (d) | | | 4,000,000 | | | | 3,999,656 | |
Bank of Montreal (Chicago)
2.710%, 1M LIBOR + 0.330%, 08/06/19 (d) | | | 4,000,000 | | | | 3,999,900 | |
Bank of Nova Scotia
3.072%, 3M LIBOR + 0.280%, 03/20/19 (d) | | | 4,750,000 | | | | 4,751,895 | |
Barclays Bank plc
2.500%, 02/01/19 | | | 2,000,000 | | | | 1,999,742 | |
2.547%, 1M LIBOR + 0.200%, 02/04/19 (d) | | | 3,000,000 | | | | 2,999,715 | |
BNP Paribas S.A. New York
2.647%, 1M LIBOR + 0.300%, 06/04/19 (d) | | | 4,000,000 | | | | 3,998,392 | |
Canadian Imperial Bank of Commerce
2.556%, 3M LIBOR + 0.120%, 01/14/19 (d) | | | 4,000,000 | | | | 3,999,488 | |
Commonwealth Bank of Australia
2.617%, 3M LIBOR + 0.140%, 04/23/19 (d) | | | 1,000,000 | | | | 1,000,003 | |
2.642%, 1M LIBOR + 0.210%, 09/13/19 (d) | | | 4,000,000 | | | | 4,000,000 | |
Cooperative Rabobank UA
2.608%, 3M LIBOR + 0.200%, 04/05/19 (d) | | | 3,000,000 | | | | 3,000,942 | |
Credit Industriel et Commercial
Zero Coupon, 01/25/19 | | | 2,961,684 | | | | 2,994,900 | |
Credit Industriel et Commercial (NY)
2.629%, 1M LIBOR + 0.250%, 02/05/19 (d) | | | 3,500,000 | | | | 3,500,088 | |
Credit Suisse AG
2.620%, 04/01/19 | | | 6,000,000 | | | | 5,996,892 | |
Mitsubishi UFJ Trust and Banking Corp.
Zero Coupon, 01/15/19 | | | 3,969,950 | | | | 3,995,920 | |
Natixis New York
2.705%, 3M LIBOR + 0.090%, 05/10/19 (d) | | | 1,000,000 | | | | 999,370 | |
2.810%, 1M LIBOR + 0.370%, 02/14/19 (d) | | | 2,000,000 | | | | 2,000,374 | |
Nordea Bank New York
2.608%, 3M LIBOR + 0.200%, 04/05/19 (d) | | | 5,000,000 | | | | 5,004,809 | |
Royal Bank of Canada New York
2.665%, 1M LIBOR + 0.210%, 09/17/19 (d) | | | 7,000,000 | | | | 6,992,839 | |
Skandinaviska Enskilda Banken
2.645%, 1M LIBOR + 0.190%, 04/17/19 (d) | | | 6,000,000 | | | | 5,999,508 | |
Societe Generale
2.719%, 3M LIBOR + 0.160%, 05/07/19 (d) | | | 2,000,000 | | | | 1,999,112 | |
Standard Chartered plc
2.686%, 1M LIBOR + 0.180%, 02/25/19 (d) | | | 6,000,000 | | | | 5,999,826 | |
Sumitomo Mitsui Banking Corp.
2.590%, 1M LIBOR + 0.190%, 04/11/19 (d) | | | 8,000,000 | | | | 7,997,064 | |
Sumitomo Mitsui Banking Corp., New York
2.559%, 1M LIBOR + 0.180%, 03/05/19 (d) | | | 3,000,000 | | | | 2,999,289 | |
See accompanying notes to financial statements.
BHFTII-6
Brighthouse Funds Trust II
Frontier Mid Cap Growth Portfolio
Schedule of Investments as of December 31, 2018
Securities Lending Reinvestments (c)—(Continued)
| | | | | | | | |
| Security Description | | Principal
Amount* | | | Value | |
|
| Certificates of Deposit—(Continued) | |
Svenska Handelsbanken AB
2.620%, 3M LIBOR + 0.100%, 04/30/19 (d) | | | 5,000,000 | | | $ | 4,999,775 | |
2.767%, 1M LIBOR + 0.380%, 12/10/19 (d) | | | 2,000,000 | | | | 1,999,934 | |
2.799%, 1M LIBOR + 0.450%, 04/03/19 (d) | | | 2,000,000 | | | | 2,001,156 | |
Toronto-Dominion Bank
2.665%, 1M LIBOR + 0.210%, 09/17/19 (d) | | | 5,000,000 | | | | 4,995,240 | |
U.S. Bank N.A.
2.764%, 1M LIBOR + 0.260%, 07/23/19 (d) | | | 1,000,000 | | | | 1,000,000 | |
Wells Fargo Bank N.A.
2.560%, 3M LIBOR + 0.140%, 07/11/19 (d) | | | 7,000,000 | | | | 7,006,072 | |
Westpac Banking Corp.
2.850%, FEDEFF PRV + 0.450%, 02/15/19 (d) | | | 3,000,000 | | | | 2,999,981 | |
| | | | | | | | |
| | | | | | | 115,231,882 | |
| | | | | | | | |
|
| Commercial Paper—3.6% | |
Alpine Securities Ltd.
2.529%, 1M LIBOR + 0.180%, 04/03/19 (d) | | | 5,000,000 | | | | 4,998,615 | |
HSBC Bank plc
2.842%, 1M LIBOR + 0.320%, 07/30/19 (d) | | | 7,000,000 | | | | 7,000,000 | |
ING Funding LLC
2.707%, 1M LIBOR + 0.320%, 02/08/19 (d) | | | 7,000,000 | | | | 7,000,651 | |
Matchpoint Finance plc
2.890%, 05/08/19 | | | 3,941,879 | | | | 3,957,012 | |
Sheffield Receivables Co.
2.930%, SOFR + 0.470%, 05/30/19 (d) | | | 4,000,000 | | | | 3,999,936 | |
UBS AG
2.779%, 1M LIBOR + 0.430%, 02/01/19 (d) | | | 10,000,000 | | | | 10,002,450 | |
| | | | | | | | |
| | | | | | | 36,958,664 | |
| | | | | | | | |
|
| Repurchase Agreements—3.3% | |
Citadel Clearing LLC
Repurchase Agreement dated 12/31/18 at 3.000%, due on 04/02/19 with a maturity value of $12,595,833; collateralized by various Common Stock with an aggregate market value of $13,752,292. | | | 12,500,000 | | | | 12,500,000 | |
Citigroup Global Markets, Inc.
Repurchase Agreement dated 12/31/18 at 2.790%, due on 02/04/19 with a maturity value of $4,010,850; collateralized by U.S. Treasury Obligations at 0.000%, maturing 02/12/19, and various Common Stock with an aggregate market value of $4,353,275. | | | 4,000,000 | | | | 4,000,000 | |
Repurchase Agreement dated 12/31/18 at 2.940%, due on 04/02/19 with a maturity value of $755,635; collateralized by U.S. Treasury Obligations with rates ranging from 1.125% - 2.750%, maturity dates ranging from 01/31/19 - 08/15/24, and an aggregate market value of $765,000. | | | 750,000 | | | | 750,000 | |
Citigroup Global Markets, Ltd.
Repurchase Agreement dated 12/31/18 at 2.490%, due on 01/02/19 with a maturity value of $200,028; collateralized by U.S. Treasury Obligations with rates ranging from 0.375% - 1.875%, maturity dates ranging from 12/15/20 - 01/15/27, and an aggregate market value of $204,000. | | | 200,000 | | | | 200,000 | |
| | | | | | | | |
| Security Description | | Principal
Amount* | | | Value | |
|
| Repurchase Agreements—(Continued) | |
| Citigroup Global Markets, Ltd. | | �� | | | | |
Repurchase Agreement dated 12/31/18 at 2.490%, due on 01/02/19 with a maturity value of $400,055; collateralized by U.S. Treasury Obligations with rates ranging from 1.625% - 2.875%, maturity dates ranging from 06/30/20 - 11/15/46, and an aggregate market value of $408,000. | | | 400,000 | | | $ | 400,000 | |
Deutsche Bank AG, London
Repurchase Agreement dated 12/31/18 at 2.750%, due on 01/02/19 with a maturity value of $200,031; collateralized by U.S. Treasury and Foreign Obligations with rates ranging from 1.000% - 2.590%, maturity dates ranging from 03/31/19 - 12/29/26, and an aggregate market value of $204,000. | | | 200,000 | | | | 200,000 | |
Deutsche Bank Securities, Inc.
Repurchase Agreement dated 12/31/18 at 3.200%, due on 01/02/19 with a maturity value of $9,245,041; collateralized by U.S. Treasury Obligations at 0.000%, maturity dates ranging from 08/15/30 - 08/15/39, and an aggregate market value of $9,428,266. | | | 9,243,398 | | | | 9,243,398 | |
Merrill Lynch, Pierce, Fenner & Smith, Inc.
Repurchase Agreement dated 12/31/18 at 2.940%, due on 04/02/19 with a maturity value of $1,511,270; collateralized by various Common Stock with an aggregate market value of $1,650,000. | | | 1,500,000 | | | | 1,500,000 | |
Repurchase Agreement dated 12/31/18 at 2.940%, due on 04/02/19 with a maturity value of $1,511,270; collateralized by various Common Stock with an aggregate market value of $1,650,000. | | | 1,500,000 | | | | 1,500,000 | |
NBC Global Finance, Ltd.
Repurchase Agreement dated 12/31/18 at 2.560%, due on 01/02/19 with a maturity value of $3,000,427; collateralized by various Common Stock with an aggregate market value of $3,339,637. | | | 3,000,000 | | | | 3,000,000 | |
Repurchase Agreement dated 12/31/18 at 2.560%, due on 01/02/19 with a maturity value of $600,085; collateralized by various Common Stock with an aggregate market value of $667,927. | | | 600,000 | | | | 600,000 | |
Societe Generale
Repurchase Agreement dated 12/31/18 at 2.530%, due on 01/02/19 with a maturity value of $400,056; collateralized by U.S. Treasury Obligations with rates ranging from 0.750% - 8.000%, maturity dates ranging from 09/30/19 - 08/15/46, and various Common Stock with an aggregate market value of $438,190. | | | 400,000 | | | | 400,000 | |
| | | | | | | | |
| | | | | | | 34,293,398 | |
| | | | | | | | |
|
| Time Deposit—0.1% | |
Royal Bank of Canada
2.420%, 01/02/19 | | | 1,000,000 | | | | 1,000,000 | |
| | | | | | | | |
Total Securities Lending Reinvestments
(Cost $187,494,538) | | | | | | | 187,483,944 | |
| | | | | | | | |
Total Investments—118.2%
(Cost $1,125,114,139) | | | | | | | 1,213,535,507 | |
Other assets and liabilities (net)—(18.2)% | | | | | | | (187,130,303 | ) |
| | | | | | | | |
| Net Assets—100.0% | | | | | | $ | 1,026,405,204 | |
| | | | | | | | |
See accompanying notes to financial statements.
BHFTII-7
Brighthouse Funds Trust II
Frontier Mid Cap Growth Portfolio
Schedule of Investments as of December 31, 2018
| | | | |
| * | | Principal amount stated in U.S. dollars unless otherwise noted. |
| (a) | | All or a portion of the security was held on loan. As of December 31, 2018, the market value of securities loaned was $193,425,580 and the collateral received consisted of cash in the amount of $187,416,911 andnon-cash collateral with a value of $11,752,592. The cash collateral investments are disclosed in the Schedule of Investments and categorized as Securities Lending Reinvestments. Thenon-cash collateral received consists of U.S. government securities that are held in safe-keeping by the lending agent, or a third-party custodian, cannot be sold or repledged by the Portfolio. As such, this collateral is excluded from the Statement of Assets and Liabilities. |
| (b) | | Non-income producing security. |
| (c) | | Represents investment of cash collateral received from securities on loan as of December 31, 2018. |
| (d) | | Variable or floating rate security. The stated rate represents the rate at December 31, 2018. Maturity date shown for callable securities reflects the earliest possible call date. For securities based on a published reference index and spread, the index and spread are indicated in the description above. For certain variable rate securities, the coupon rate is determined by the issuer/agent based on current market conditions. For certain asset- and mortgage-backed securities, the coupon rate may fluctuate based on changes of the underlying collateral or prepayments of principal. These securities do not indicate a reference index and spread in their description above. |
| (FEDEFF PRV)— | | Effective Federal Funds Rate |
| (LIBOR)— | | London Interbank Offered Rate |
| (SOFR)— | | Secured Overnight Financing Rate |
Fair Value Hierarchy
Accounting principles generally accepted in the United States of America (“GAAP”) define fair market value as the price that the Portfolio would receive to sell an asset or pay to transfer a liability in an orderly transaction between market participants at the measurement date. It establishes a fair value hierarchy that prioritizes inputs to valuation methods and requires disclosure of the fair value hierarchy, separately for each major category of assets and liabilities, that segregates fair value measurements into three levels. Levels 1, 2 and 3 of the fair value hierarchy are defined as follows:
Level 1 - unadjusted quoted prices in active markets for identical investments
Level 2 - other significant observable inputs (including, but not limited to, quoted prices for similar assets or liabilities in markets that are either active or inactive; inputs other than quoted prices that are observable such as interest rates, yield curves, volatilities, prepayment speeds, loss severities, credit risks, default rates, or other market corroborated inputs)
Level 3 - significant unobservable inputs based on the best information available in the circumstances, to the extent observable inputs are unavailable (including the Portfolio’s own assumptions used in determining the fair value of investments and derivative financial instruments)
The inputs or methodologies used for valuing investments are not necessarily an indication of the risk associated with investing in them. Changes to the inputs or methodologies used may result in transfers between levels. A reconciliation of Level 3 securities, if any, will be disclosed following the fair value hierarchy table. For more information about the Portfolio’s policy regarding the valuation of investments, please refer to the Notes to Financial Statements.
The following table summarizes the fair value hierarchy of the Portfolio’s investments as of December 31, 2018:
| | | | | | | | | | | | | | | | |
| Description | | Level 1 | | | Level 2 | | | Level 3 | | | Total | |
Total Common Stocks* | | $ | 1,013,689,861 | | | $ | — | | | $ | — | | | $ | 1,013,689,861 | |
Total Short - Term Investment* | | | — | | | | 12,361,702 | | | | — | | | | 12,361,702 | |
Total Securities Lending Reinvestments* | | | — | | | | 187,483,944 | | | | — | | | | 187,483,944 | |
Total Investments | | $ | 1,013,689,861 | | | $ | 199,845,646 | | | $ | — | | | $ | 1,213,535,507 | |
| | | | | | | | | | | | | | | | | |
Collateral for Securities Loaned (Liability) | | $ | — | | | $ | (187,416,911 | ) | | $ | — | | | $ | (187,416,911 | ) |
| | | | |
| * | | See Schedule of Investments for additional detailed categorizations. |
See accompanying notes to financial statements.
BHFTII-8
Brighthouse Funds Trust II
Frontier Mid Cap Growth Portfolio
Statement of Assets and Liabilities
December 31, 2018
| | | | |
Assets | |
Investments at value (a) (b) | | $ | 1,213,535,507 | |
Receivable for: | |
Investments sold | | | 3,771,277 | |
Fund shares sold | | | 94,369 | |
Dividends and interest | | | 292,159 | |
Prepaid expenses | | | 3,194 | |
| | | | |
Total Assets | | | 1,217,696,506 | |
Liabilities | |
Collateral for securities loaned | | | 187,416,911 | |
Payables for: | |
Investments purchased | | | 2,586,824 | |
Fund shares redeemed | | | 328,039 | |
Accrued Expenses: | |
Management fees | | | 619,481 | |
Distribution and service fees | | | 39,062 | |
Deferred trustees’ fees | | | 138,370 | |
Other expenses | | | 162,615 | |
| | | | |
Total Liabilities | | | 191,291,302 | |
| | | | |
Net Assets | | $ | 1,026,405,204 | |
| | | | |
Net Assets Consist of: | |
Paid in surplus | | $ | 785,289,966 | |
Distributable earnings (Accumulated losses) | | | 241,115,238 | |
| | | | |
Net Assets | | $ | 1,026,405,204 | |
| | | | |
Net Assets | |
Class A | | $ | 799,017,066 | |
Class B | | | 144,894,434 | |
Class D | | | 74,242,410 | |
Class E | | | 8,251,294 | |
Capital Shares Outstanding* | |
Class A | | | 24,625,594 | |
Class B | | | 5,000,774 | |
Class D | | | 2,341,158 | |
Class E | | | 261,812 | |
Net Asset Value, Offering Price and Redemption Price Per Share | |
Class A | | $ | 32.45 | |
Class B | | | 28.97 | |
Class D | | | 31.71 | |
Class E | | | 31.52 | |
| | | | |
| * | | The Portfolio is authorized to issue an unlimited number of shares. |
| (a) | | Identified cost of investments was $1,125,114,139. |
| (b) | | Includes securities loaned at value of $193,425,580. |
Statement of Operations
Year Ended December 31, 2018
| | | | |
Investment Income | |
Dividends (a) | | $ | 6,704,476 | |
Interest | | | 72,605 | |
Securities lending income | | | 907,382 | |
| | | | |
Total investment income | | | 7,684,463 | |
Expenses | |
Management fees | | | 8,526,259 | |
Administration fees | | | 45,895 | |
Custodian and accounting fees | | | 75,427 | |
Distribution and service fees—Class B | | | 430,936 | |
Distribution and service fees—Class D | | | 87,227 | |
Distribution and service fees—Class E | | | 14,897 | |
Audit and tax services | | | 44,663 | |
Legal | | | 45,317 | |
Trustees’ fees and expenses | | | 33,734 | |
Shareholder reporting | | | 149,110 | |
Insurance | | | 7,754 | |
Miscellaneous | | | 19,341 | |
| | | | |
Total expenses | | | 9,480,560 | |
Less management fee waiver | | | (253,342 | ) |
Less broker commission recapture | | | (93,703 | ) |
| | | | |
Net expenses | | | 9,133,515 | |
| | | | |
Net Investment Loss | | | (1,449,052 | ) |
| | | | |
Net Realized and Unrealized Gain (Loss) | |
| Net realized gain on: | |
Investments | | | 154,601,162 | |
Foreign currency transactions | | | 1,596 | |
| | | | |
Net realized gain | | | 154,602,758 | |
| | | | |
Net change in unrealized depreciation on investments | | | (208,699,364 | ) |
| | | | |
Net realized and unrealized loss | | | (54,096,606 | ) |
| | | | |
Net Decrease in Net Assets From Operations | | $ | (55,545,658 | ) |
| | | | |
| | | | |
| (a) | | Net of foreign withholding taxes of $30,194. |
See accompanying notes to financial statements.
BHFTII-9
Brighthouse Funds Trust II
Frontier Mid Cap Growth Portfolio
Statements of Changes in Net Assets
| | | | | | | | |
| | | Year Ended
December 31,
2018 | | | Year Ended
December 31,
2017 | |
Increase (Decrease) in Net Assets: | |
From Operations | |
Net investment loss | | $ | (1,449,052 | ) | | $ | (1,255,813 | ) |
Net realized gain | | | 154,602,758 | | | | 133,869,343 | |
Net change in unrealized appreciation (depreciation) | | | (208,699,364 | ) | | | 134,667,169 | |
| | | | | | | | |
Increase (decrease) in net assets from operations | | | (55,545,658 | ) | | | 267,280,699 | |
| | | | | | | | |
From Distributions to Shareholders (a) | |
Class A | | | (100,990,172 | ) | | | (21,562,735 | ) |
Class B | | | (20,876,824 | ) | | | (4,569,749 | ) |
Class D | | | (9,718,488 | ) | | | (2,121,753 | ) |
Class E | | | (1,120,838 | ) | | | (246,731 | ) |
| | | | | | | | |
Total distributions | | | (132,706,322 | ) | | | (28,500,968 | ) |
| | | | | | | | |
Decrease in net assets from capital share transactions | | | (16,894,825 | ) | | | (130,157,854 | ) |
| | | | | | | | |
Total increase (decrease) in net assets | | | (205,146,805 | ) | | | 108,621,877 | |
|
Net Assets | |
Beginning of period | | | 1,231,552,009 | | | | 1,122,930,132 | |
| | | | | | | | |
End of period | | $ | 1,026,405,204 | | | $ | 1,231,552,009 | (b) |
| | | | | | | | |
Other Information:
Capital Shares
Transactions in capital shares were as follows:
| | | | | | | | | | | | | | | | |
| | | Year Ended
December 31, 2018 | | | Year Ended
December 31, 2017 | |
| | | Shares | | | Value | | | Shares | | | Value | |
Class A | |
Sales | | | 129,276 | | | $ | 4,707,976 | | | | 134,407 | | | $ | 4,684,834 | |
Reinvestments | | | 2,724,310 | | | | 100,990,172 | | | | 609,634 | | | | 21,562,735 | |
Redemptions | | | (2,939,192 | ) | | | (112,278,708 | ) | | | (3,521,078 | ) | | | (124,641,890 | ) |
| | | | | | | | | | | | | | | | |
Net decrease | | | (85,606 | ) | | $ | (6,580,560 | ) | | | (2,777,037 | ) | | $ | (98,394,321 | ) |
| | | | | | | | | | | | | | | | |
Class B | |
Sales | | | 211,910 | | | $ | 6,928,761 | | | | 280,204 | | | $ | 9,045,272 | |
Reinvestments | | | 629,768 | | | | 20,876,824 | | | | 142,360 | | | | 4,569,749 | |
Redemptions | | | (1,061,625 | ) | | | (36,085,641 | ) | | | (1,062,128 | ) | | | (34,090,788 | ) |
| | | | | | | | | | | | | | | | |
Net decrease | | | (219,947 | ) | | $ | (8,280,056 | ) | | | (639,564 | ) | | $ | (20,475,767 | ) |
| | | | | | | | | | | | | | | | |
Class D | |
Sales | | | 93,499 | | | $ | 3,486,570 | | | | 85,955 | | | $ | 2,955,608 | |
Reinvestments | | | 268,096 | | | | 9,718,488 | | | | 61,128 | | | | 2,121,753 | |
Redemptions | | | (396,539 | ) | | | (14,656,325 | ) | | | (440,176 | ) | | | (15,365,624 | ) |
| | | | | | | | | | | | | | | | |
Net decrease | | | (34,944 | ) | | $ | (1,451,267 | ) | | | (293,093 | ) | | $ | (10,288,263 | ) |
| | | | | | | | | | | | | | | | |
Class E | |
Sales | | | 5,863 | | | $ | 209,812 | | | | 11,517 | | | $ | 396,536 | |
Reinvestments | | | 31,100 | | | | 1,120,838 | | | | 7,143 | | | | 246,731 | |
Redemptions | | | (52,135 | ) | | | (1,913,592 | ) | | | (46,753 | ) | | | (1,642,770 | ) |
| | | | | | | | | | | | | | | | |
Net decrease | | | (15,172 | ) | | $ | (582,942 | ) | | | (28,093 | ) | | $ | (999,503 | ) |
| | | | | | | | | | | | | | | | |
Decrease derived from capital shares transactions | | | | | | $ | (16,894,825 | ) | | | | | | $ | (130,157,854 | ) |
| | | | | | | | | | | | | | | | |
| | | | |
| (a) | | Distributions from net investment income and realized gains are no longer required to be separately disclosed. The presentation for the year ended December 31, 2018 has been adjusted for this change (See Note 8). At December 31, 2017 the distributions were from net realized capital gains. |
| (b) | | As part of the update in (a), it is also no longer required to disclose the Undistributed net investment income (Accumulated losses) which was $(145,572) as of December 31, 2017. |
See accompanying notes to financial statements.
BHFTII-10
Brighthouse Funds Trust II
Frontier Mid Cap Growth Portfolio
Financial Highlights
| | | | | | | | | | | | | | | | | | | | |
| Selected per share data | |
| | | Class A | |
| | | Year Ended December 31, | |
| | | 2018 | | | 2017 | | | 2016 | | | 2015 | | | 2014 | |
Net Asset Value, Beginning of Period | | $ | 38.43 | | | $ | 31.41 | | | $ | 33.70 | | | $ | 37.28 | | | $ | 36.90 | |
| | | | | | | | | | | | | | | | | | | | |
Income (Loss) from Investment Operations | |
Net investment loss (a) | | | (0.03 | ) | | | (0.02 | ) | | | (0.00 | )(b)(c) | | | (0.03 | ) | | | (0.05 | ) |
Net realized and unrealized gain (loss) | | | (1.60 | ) | | | 7.88 | | | | 1.63 | | | | 1.51 | | | | 3.78 | |
| | | | | | | | | | | | | | | | | | | | |
Total income (loss) from investment operations | | | (1.63 | ) | | | 7.86 | | | | 1.63 | | | | 1.48 | | | | 3.73 | |
| | | | | | | | | | | | | | | | | | | | |
Less Distributions | |
Distributions from net realized capital gains | | | (4.35 | ) | | | (0.84 | ) | | | (3.92 | ) | | | (5.06 | ) | | | (3.35 | ) |
| | | | | | | | | | | | | | | | | | | | |
Total distributions | | | (4.35 | ) | | | (0.84 | )�� | | | (3.92 | ) | | | (5.06 | ) | | | (3.35 | ) |
| | | | | | | | | | | | | | | | | | | | |
Net Asset Value, End of Period | | $ | 32.45 | | | $ | 38.43 | | | $ | 31.41 | | | $ | 33.70 | | | $ | 37.28 | |
| | | | | | | | | | | | | | | | | | | | |
Total Return (%) (d) | | | (5.64 | ) | | | 25.26 | | | | 5.40 | | | | 2.88 | | | | 11.14 | |
|
Ratios/Supplemental Data | |
Gross ratio of expenses to average net assets (%) | | | 0.75 | | | | 0.75 | | | | 0.75 | | | | 0.74 | | | | 0.76 | |
Net ratio of expenses to average net assets (%) (e) | | | 0.73 | | | | 0.73 | | | | 0.73 | | | | 0.73 | | | | 0.75 | |
Ratio of net investment loss to average net assets (%) | | | (0.08 | ) | | | (0.06 | ) | | | (0.00 | )(b)(f) | | | (0.09 | ) | | | (0.13 | ) |
Portfolio turnover rate (%) | | | 44 | | | | 31 | | | | 40 | | | | 60 | | | | 48 | |
Net assets, end of period (in millions) | | $ | 799.0 | | | $ | 949.7 | | | $ | 863.5 | | | $ | 878.5 | | | $ | 831.2 | |
| |
| | | Class B | |
| | | Year Ended December 31, | |
| | | 2018 | | | 2017 | | | 2016 | | | 2015 | | | 2014 | |
Net Asset Value, Beginning of Period | | $ | 34.83 | | | $ | 28.61 | | | $ | 31.11 | | | $ | 34.85 | | | $ | 34.79 | |
| | | | | | | | | | | | | | | | | | | | |
Income (Loss) from Investment Operations | |
Net investment loss (a) | | | (0.11 | ) | | | (0.10 | ) | | | (0.07 | )(b) | | | (0.12 | ) | | | (0.13 | ) |
Net realized and unrealized gain (loss) | | | (1.40 | ) | | | 7.16 | | | | 1.49 | | | | 1.44 | | | | 3.54 | |
| | | | | | | | | | | | | | | | | | | | |
Total income (loss) from investment operations | | | (1.51 | ) | | | 7.06 | | | | 1.42 | | | | 1.32 | | | | 3.41 | |
| | | | | | | | | | | | | | | | | | | | |
Less Distributions | |
Distributions from net realized capital gains | | | (4.35 | ) | | | (0.84 | ) | | | (3.92 | ) | | | (5.06 | ) | | | (3.35 | ) |
| | | | | | | | | | | | | | | | | | | | |
Total distributions | | | (4.35 | ) | | | (0.84 | ) | | | (3.92 | ) | | | (5.06 | ) | | | (3.35 | ) |
| | | | | | | | | | | | | | | | | | | | |
Net Asset Value, End of Period | | $ | 28.97 | | | $ | 34.83 | | | $ | 28.61 | | | $ | 31.11 | | | $ | 34.85 | |
| | | | | | | | | | | | | | | | | | | | |
Total Return (%) (d) | | | (5.90 | ) | | | 24.93 | | | | 5.16 | | | | 2.60 | | | | 10.88 | |
|
Ratios/Supplemental Data | |
Gross ratio of expenses to average net assets (%) | | | 1.00 | | | | 1.00 | | | | 1.00 | | | | 0.99 | | | | 1.01 | |
Net ratio of expenses to average net assets (%) (e) | | | 0.98 | | | | 0.98 | | | | 0.98 | | | | 0.98 | | | | 1.00 | |
Ratio of net investment loss to average net assets (%) | | | (0.33 | ) | | | (0.31 | ) | | | (0.25 | )(b) | | | (0.35 | ) | | | (0.37 | ) |
Portfolio turnover rate (%) | | | 44 | | | | 31 | | | | 40 | | | | 60 | | | | 48 | |
Net assets, end of period (in millions) | | $ | 144.9 | | | $ | 181.9 | | | $ | 167.7 | | | $ | 181.7 | | | $ | 198.6 | |
Please see following page for Financial Highlights footnote legend.
See accompanying notes to financial statements.
BHFTII-11
Brighthouse Funds Trust II
Frontier Mid Cap Growth Portfolio
Financial Highlights
| | | | | | | | | | | | | | | | | | | | |
| Selected per share data | |
| | | Class D | |
| | | Year Ended December 31, | |
| | | 2018 | | | 2017 | | | 2016 | | | 2015 | | | 2014 | |
Net Asset Value, Beginning of Period | | $ | 37.69 | | | $ | 30.85 | | | $ | 33.20 | | | $ | 36.83 | | | $ | 36.52 | |
| | | | | | | | | | | | | | | | | | | | |
Income (Loss) from Investment Operations | |
Net investment loss (a) | | | (0.06 | ) | | | (0.06 | ) | | | (0.03 | )(b) | | | (0.07 | ) | | | (0.08 | ) |
Net realized and unrealized gain (loss) | | | (1.57 | ) | | | 7.74 | | | | 1.60 | | | | 1.50 | | | | 3.74 | |
| | | | | | | | | | | | | | | | | | | | |
Total income (loss) from investment operations | | | (1.63 | ) | | | 7.68 | | | | 1.57 | | | | 1.43 | | | | 3.66 | |
| | | | | | | | | | | | | | | | | | | | |
Less Distributions | |
Distributions from net realized capital gains | | | (4.35 | ) | | | (0.84 | ) | | | (3.92 | ) | | | (5.06 | ) | | | (3.35 | ) |
| | | | | | | | | | | | | | | | | | | | |
Total distributions | | | (4.35 | ) | | | (0.84 | ) | | | (3.92 | ) | | | (5.06 | ) | | | (3.35 | ) |
| | | | | | | | | | | | | | | | | | | | |
Net Asset Value, End of Period | | $ | 31.71 | | | $ | 37.69 | | | $ | 30.85 | | | $ | 33.20 | | | $ | 36.83 | |
| | | | | | | | | | | | | | | | | | | | |
Total Return (%) (d) | | | (5.76 | ) | | | 25.14 | | | | 5.29 | | | | 2.78 | | | | 11.06 | |
|
Ratios/Supplemental Data | |
Gross ratio of expenses to average net assets (%) | | | 0.85 | | | | 0.85 | | | | 0.85 | | | | 0.84 | | | | 0.86 | |
Net ratio of expenses to average net assets (%) (e) | | | 0.83 | | | | 0.83 | | | | 0.83 | | | | 0.83 | | | | 0.85 | |
Ratio of net investment loss to average net assets (%) | | | (0.18 | ) | | | (0.16 | ) | | | (0.10 | )(b) | | | (0.20 | ) | | | (0.22 | ) |
Portfolio turnover rate (%) | | | 44 | | | | 31 | | | | 40 | | | | 60 | | | | 48 | |
Net assets, end of period (in millions) | | $ | 74.2 | | | $ | 89.6 | | | $ | 82.3 | | | $ | 89.8 | | | $ | 101.3 | |
| |
| | | Class E | |
| | | Year Ended December 31, | |
| | | 2018 | | | 2017 | | | 2016 | | | 2015 | | | 2014 | |
Net Asset Value, Beginning of Period | | $ | 37.50 | | | $ | 30.71 | | | $ | 33.08 | | | $ | 36.73 | | | $ | 36.46 | |
| | | | | | | | | | | | | | | | | | | | |
Income (Loss) from Investment Operations | |
Net investment loss (a) | | | (0.08 | ) | | | (0.07 | ) | | | (0.05 | )(b) | | | (0.09 | ) | | | (0.10 | ) |
Net realized and unrealized gain (loss) | | | (1.55 | ) | | | 7.70 | | | | 1.60 | | | | 1.50 | | | | 3.72 | |
| | | | | | | | | | | | | | | | | | | | |
Total income (loss) from investment operations | | | (1.63 | ) | | | 7.63 | | | | 1.55 | | | | 1.41 | | | | 3.62 | |
| | | | | | | | | | | | | | | | | | | | |
Less Distributions | |
Distributions from net realized capital gains | | | (4.35 | ) | | | (0.84 | ) | | | (3.92 | ) | | | (5.06 | ) | | | (3.35 | ) |
| | | | | | | | | | | | | | | | | | | | |
Total distributions | | | (4.35 | ) | | | (0.84 | ) | | | (3.92 | ) | | | (5.06 | ) | | | (3.35 | ) |
| | | | | | | | | | | | | | | | | | | | |
Net Asset Value, End of Period | | $ | 31.52 | | | $ | 37.50 | | | $ | 30.71 | | | $ | 33.08 | | | $ | 36.73 | |
| | | | | | | | | | | | | | | | | | | | |
Total Return (%) (d) | | | (5.79 | ) | | | 25.09 | | | | 5.25 | | | | 2.72 | | | | 10.96 | |
|
Ratios/Supplemental Data | |
Gross ratio of expenses to average net assets (%) | | | 0.90 | | | | 0.90 | | | | 0.90 | | | | 0.89 | | | | 0.91 | |
Net ratio of expenses to average net assets (%) (e) | | | 0.88 | | | | 0.88 | | | | 0.88 | | | | 0.88 | | | | 0.90 | |
Ratio of net investment loss to average net assets (%) | | | (0.23 | ) | | | (0.21 | ) | | | (0.15 | )(b) | | | (0.25 | ) | | | (0.28 | ) |
Portfolio turnover rate (%) | | | 44 | | | | 31 | | | | 40 | | | | 60 | | | | 48 | |
Net assets, end of period (in millions) | | $ | 8.3 | | | $ | 10.4 | | | $ | 9.4 | | | $ | 10.3 | | | $ | 11.2 | |
| | | | |
| (a) | | Per share amounts based on average shares outstanding during the period. |
| (b) | | Net investment income per share and the ratio of net investment income to average net assets include anon-recurring refund for overbilling of prior years’ custodianout-of-pocket fees which amounted to less than $0.01 per share and 0.01% of average net assets, respectively. |
| (c) | | Net investment income (loss) was less than $0.01. |
| (d) | | Total return does not reflect any insurance, sales, separate account or administrative charges of variable annuity or life insurance contracts or any additional expenses that contract owners may bear under their variable contracts. If these charges were included, the returns would be lower. |
| (e) | | Includes the effects of management fee waivers (see Note 5 of the Notes to Financial Statements). |
| (f) | | Ratio of net investment income (loss) to average net assets was less than 0.01%. |
See accompanying notes to financial statements.
BHFTII-12
Brighthouse Funds Trust II
Frontier Mid Cap Growth Portfolio
Notes to Financial Statements—December 31, 2018
1. Organization
Brighthouse Funds Trust II (the “Trust”) is organized as a Delaware statutory trust and registered under the Investment Company Act of 1940, as amended (the “1940 Act”), as anopen-end management investment company. The Trust, which is managed by Brighthouse Investment Advisers, LLC (“Brighthouse Investment Advisers” or the “Adviser”), currently offers twenty-nine series, each of which operates as a distinct investment vehicle of the Trust. The series included in this report is Frontier Mid Cap Growth Portfolio (the “Portfolio”), which is diversified. Shares in the Portfolio are not offered directly to the general public and are currently available only to separate accounts established by life insurance companies affiliated with the Adviser and Metropolitan Life Insurance Company (the “Insurance Companies”).
The Portfolio has registered and offers four classes of shares: Class A, B, D and E shares. Shares of each Class of the Portfolio represent an equal pro rata interest in the Portfolio and generally give the shareholder the same voting, dividend, liquidation, and other rights. Investment income, realized and unrealized capital gains and losses, the common expenses of the Portfolio, and certain Portfolio-level expense reductions, if any, are allocated on a pro rata basis to each Class based on the relative net assets of each Class to the net assets of the Portfolio. Each Class of shares differs in its respective distribution plan and such distribution expenses are allocated to the corresponding Class of shares.
2. Significant Accounting Policies
The preparation of financial statements in conformity with accounting principles generally accepted in the United States of America (“GAAP”) requires management to make estimates and assumptions that affect the reported amounts of assets and liabilities and disclosure of contingent assets and liabilities as of the date of the financial statements and the reported amounts of income and expenses during the reporting period. Actual results could differ from those estimates. In the preparation of these financial statements, management has evaluated events and transactions subsequent to December 31, 2018 through the date the financial statements were issued.
The Portfolio is an investment company and follows the accounting and reporting guidance of the Financial Accounting Standards Board (“FASB”) Accounting Standards Codification Topic 946—Financial Services—Investment Companies. The following is a summary of significant accounting policies consistently followed by the Portfolio in the preparation of its financial statements.
Investment Valuation and Fair Value Measurements - The Portfolio values its portfolio investments for purposes of calculating its net asset value (“NAV”) using procedures approved by the Board of Trustees of the Trust (the “Board” or “Trustees”). Those procedures allow for a variety of methodologies to be used to value the Portfolio’s investments. The specific methodologies used for a particular investment may vary based on the market data available for a specific investment at the time the Portfolio calculates its NAV or based on other considerations. The procedures also permit a level of judgment to be used in the valuation process. The Portfolio follows the accounting and reporting guidance of FASB Accounting Standards Codification Topic 820—Fair Value Measurement.
Domestic and foreign equity securities, such as common stock, exchange-traded funds, rights, warrants, and preferred stock, that are traded on a securities exchange on a valuation date are generally valued at their last quoted sale price or official closing price on the primary exchange for such security, or, if no sales occurred on that day, at the last reported bid price. Equity securities tradedover-the-counter (“OTC”) are generally valued at the last reported bid price. In the event of a major exchange closing during the trading day, the Adviser may use other market information obtained from quotation reporting systems, established market makers, or pricing services in valuing the securities. Valuation adjustments may be applied to certain foreign equity securities that are traded solely on foreign exchanges that close before the time as of which the Portfolio determines its NAV to account for the market movement between the close of the foreign exchanges and the time as of which the Portfolio determines its NAV. The Portfolio may use a systematic fair valuation model provided by a pricing service to value securities principally traded in these foreign markets in order to adjust for possible market movements or other changes that may occur between the close of the foreign exchanges and the time as of which the Portfolio determines its NAV. Foreign equity securities valued using these valuation adjustments are generally categorized as Level 2 within the fair value hierarchy. Equity securities that are actively traded, and have no valuation adjustments applied, are categorized as Level 1 within the fair value hierarchy. Other equity securities traded on inactive markets, or valued in reference to similar instruments traded on active markets, are generally categorized as Level 2 within the fair value hierarchy.
Investments in registeredopen-end management investment companies are valued at reported NAV per share on the valuation date and are categorized as Level 1 within the fair value hierarchy.
Debt securities, including corporate, convertible and municipal bonds and notes; obligations of the U.S. Treasury and U.S. government agencies; foreign sovereign issues; andnon-U.S. bonds, are generally valued on the basis of evaluated or composite bid quotations obtained from independent pricing services and/or brokers and dealers selected by the Adviser (each a “pricing service”), pursuant to the authorization of and subject to general oversight by the Board. Such pricing services may use matrix pricing, which considers observable inputs including, among other things, issuer details, maturity dates, interest rates, yield curves, rates of prepayment, credit risks/spreads, default rates, reported trades, broker-dealer quotes and quoted prices for similar assets. Short-term obligations with a
BHFTII-13
Brighthouse Funds Trust II
Frontier Mid Cap Growth Portfolio
Notes to Financial Statements—December 31, 2018—(Continued)
remaining maturity of sixty days or less may be valued at amortized cost in the absence of market quotes, so long as the amortized cost value of such short-term debt instrument is approximately the same as the fair value of the instrument as determined without the use of amortized cost valuation. Floating rate loans are generally valued on the basis of an evaluated or composite average of aggregate bid and ask quotations supplied by brokers or dealers, as obtained from the pricing service. Securities that use similar valuation techniques and inputs as described above are generally categorized as Level 2 within the fair value hierarchy.
Options, whether on securities, indices, futures contracts, or otherwise, traded on exchanges are valued at the last sale price available as of the close of business on a valuation day or, if there is no such price available, at the last reported bid price. These types of options are categorized as Level 1 within the fair value hierarchy. Futures contracts that are traded on commodity exchanges are valued at their settlement prices established by the exchanges on which they are traded as of the close of such exchanges and are categorized as Level 1 within the fair value hierarchy.
If no current market value quotation or other observable inputs are readily available or market value quotations are deemed to be unreliable for an investment, the fair value of the investment will be determined in accordance with procedures approved by, and under the general supervision of, the Board. In such a circumstance, the Board will be assisted in its responsibility to determine the fair value of an investment by the Valuation Committee (“Committee”) of Brighthouse Investment Advisers. The Committee provides general pricing oversight and fair value pricing determinations related to portfolio securities and meets on a regular basis to review reports relating to the valuation of the securities in the Portfolio. The Board has delegated to State Street Bank and Trust Company, the Trust’s custodian (“Custodian”), the responsibility for calculating the NAVs of the Trust’s Portfolios. The Committee is responsible for overseeing the calculation of the NAVs of the Portfolios by the custodian. The Committee also periodically reviews pricing services, including the pricing services providing fair value pricing for the Portfolio’s foreign securities, and is responsible for overseeing the correction of pricing errors and addressing other pricing issues that arise in the ordinary course of business, such as making real-time fair value determinations, as necessary.
No single standard for determining the fair value of an investment can be set forth because fair value depends upon the facts and circumstances with respect to each investment. Information relating to any relevant factors may be obtained by the Committee from any appropriate source, including the subadviser of the Portfolio, the custodian, a pricing service, market maker and/or broker for such security or the issuer. Appropriate methodologies for determining fair value under particular circumstances may include: matrix pricing, a discounted cash flow analysis, comparisons of securities with comparable characteristics, value based on multiples of earnings, discount from market price of similar marketable securities, or a combination of these and other methods.
Investment Transactions and Related Investment Income - Portfolio security transactions are recorded on the trade date. Dividend income is recorded on theex-dividend date or, for certain foreign securities, when notified. Interest income, which includes amortization of premium and accretion of discount on debt securities, is recorded on the accrual basis. Realized gains and losses on investments are determined on the identified cost basis, which is the same basis used for federal income tax purposes. Foreign income and foreign capital gains on some foreign securities may be subject to foreign taxes, which are accrued as applicable. These foreign taxes have been provided for in accordance with the Portfolio’s understanding of the applicable countries’ tax rules and rates.
Foreign Currency Translation -The books and records of the Portfolio are maintained in U.S. dollars. The values of securities, currencies, and other assets and liabilities denominated in currencies other than the U.S. dollar are translated into U.S. dollars based upon foreign exchange rates prevailing at the end of the period. Purchases and sales of investment securities, income, and expenses are translated on the respective dates of such transactions. Because the values of investment securities are translated at the foreign exchange rates prevailing at the end of the period, that portion of the results of operations arising from changes in exchange rates and that portion of the results of operations reflecting fluctuations arising from changes in market prices of the investment securities are not separated. Such fluctuations are included in the net realized and unrealized gain or loss on investments.
Net realized foreign exchange gains or losses arise from activity in forward foreign currency exchange contracts, sales of foreign currency, currency gains or losses realized between the trade and settlement dates on securities transactions, and the difference between the amounts of dividends, interest, and foreign withholding taxes recorded by the Portfolio and the U.S. dollar-equivalent of the amounts actually received or paid by the Portfolio. Net unrealized foreign exchange gains and losses arise from changes in the value of assets and liabilities, other than investment securities, resulting from changes in foreign exchange rates.
Dividends and Distributions to Shareholders -The Portfolio records dividends and distributions on theex-dividend date. Net realized gains from securities transactions (if any) are generally distributed annually to shareholders. The timing and characterization of certain income and capital gains distributions are determined in accordance with federal tax regulations that may differ from GAAP. Permanent book and tax basis differences relating to shareholder distributions will result in reclassification between distributable earnings (accumulated losses) andpaid-in surplus. These adjustments have no impact on net assets or the results of operations.
Income Taxes -It is the Portfolio’s policy to comply with the requirements of the Internal Revenue Code of 1986, as amended, and regulations thereunder, applicable to regulated investment companies, and to distribute, with respect to each taxable year, all of its taxable income to shareholders. Therefore, no federal income tax provision is required. The Portfolio files U.S. federal tax returns. No
BHFTII-14
Brighthouse Funds Trust II
Frontier Mid Cap Growth Portfolio
Notes to Financial Statements—December 31, 2018—(Continued)
income tax returns are currently under examination. The Portfolio’s federal tax returns for the prior three fiscal years remain subject to examination by the Internal Revenue Service. As of December 31, 2018, the Portfolio had no uncertain tax positions that would require financial statement recognition, or derecognition or disclosure.
Directed Brokerage Agreement -The Trust has entered into a directed brokerage arrangement with Capital Institutional Services, Inc. (“CAPIS”). Under this arrangement, the Portfolio directs certain trades to CAPIS in return for a recapture credit. CAPIS issues a cash rebate to the Portfolio. Amounts paid to the Portfolio are shown separately as broker commission recapture on the Statement of Operations of the Portfolio. Additionally, these amounts have been excluded from the calculation of the net ratio of expenses to average net assets presented in the Financial Highlights for each share class.
Repurchase Agreements -The Portfolio may enter into repurchase agreements, under the terms of a Master Repurchase Agreement (“MRA”), with selected commercial banks and broker-dealers, under which the Portfolio acquires securities as collateral and agrees to resell the securities at an agreed-upon time and at an agreed-upon price. The Portfolio, through the Custodian or a subcustodian, under atri-party repurchase agreement, receives delivery of the underlying securities collateralizing any repurchase agreements. It is the Portfolio’s policy that the market value of the collateral be equal to at least 100% of the repurchase price in the case of a repurchase agreement ofone-day duration and equal to at least 102% of the repurchase price in the case of all other repurchase agreements. In the event of default or failure by a party to perform an obligation in connection with any repurchase transaction, the MRA gives the non-defaulting party the right toset-off claims and to apply property held by it in connection with any repurchase transaction against obligations owed to it.
At December 31, 2018, the Portfolio had direct investments in repurchase agreements with a gross value of $12,361,702. Additionally, the Portfolio invested cash collateral for loans of portfolio securities in repurchase agreements with a gross value of $34,293,398. The combined value of all repurchase agreements is included as part of investments at value on the Statement of Assets and Liabilities. The value of the related collateral exceeded the value of the repurchase agreements at December 31, 2018.
Securities Lending - The Portfolio may lend its portfolio securities to certain qualified brokers who borrow securities in order to complete certain securities transactions. By lending its portfolio securities, the Portfolio attempts to increase its net investment income through the receipt of income on collateral held from securities on loan. Any gain or loss in the market price of the loaned securities that might occur and any interest earned or dividends declared during the term of the loan would accrue to the account of the Portfolio.
The Trust has entered into aNon-Custodial Securities Lending Agreement with JPMorgan Chase Bank, N.A. (the “Lending Agent”). Under the agreement, the Lending Agent is authorized to loan portfolio securities on the Portfolio’s behalf. In exchange, the Portfolio receives either cash or U.S. government securities as collateral against the loaned securities. The Portfolio receives collateral equal to at least 102% of the market value for loans secured by government securities or cash in the same currency as the loaned shares and 105% for all other loaned securities at each loan’s inception. Collateral representing at least 100% of the market value of the loaned securities is maintained for the duration of the loan. Any cash collateral received by the Portfolio is generally invested by the Lending Agent in short-term investments, which may include certificates of deposit, commercial paper, repurchase agreements, time deposits, master demand notes and money market funds. The market value of investments made with cash collateral received are disclosed in the Schedule of Investments and the valuation techniques are described in Note 2. If the market value of the collateral at the close of trading on a business day is less than 100% of the market value of the loaned securities at the close of trading on that day, the borrower is required to deliver, by the close of business on the following business day, an additional amount of collateral, so that the total amount of posted collateral is equal to at least 100% of the market value of all the loaned securities as of such preceding day. A portion of the income earned on the collateral is rebated to the borrower of the securities and the remainder is split between the Lending Agent and the Portfolio. On loans collateralized by U.S. government securities, a fee is received from the borrower and is allocated between the Portfolio and the Lending Agent.
Income received by the Portfolio in securities lending transactions during the year ended December 31, 2018 is reflected as securities lending income on the Statement of Operations. The values of any securities loaned by the Portfolio and the related collateral at December 31, 2018 are disclosed in the footnotes to the Schedule of Investments. The value of the related collateral received by the Portfolio exceeded the value of the securities out on loan at December 31, 2018.
The risks associated with lending portfolio securities include, but are not limited to, possible delays in receiving additional collateral or in the recovery of the loaned securities, possible loss of rights in the collateral should the borrower fail financially, as well as risk of loss in the value of the collateral or the value of the investments made with the collateral. The Lending Agent shall indemnify the Portfolio in the case of default of any securities borrower, subject to the terms of theNon-Custodial Securities Lending Agreement.
All securities on loan are classified as Common Stocks in the Portfolio’s Schedule of Investments as of December 31, 2018, with a contractual maturity of overnight and continuous.
BHFTII-15
Brighthouse Funds Trust II
Frontier Mid Cap Growth Portfolio
Notes to Financial Statements—December 31, 2018—(Continued)
3. Certain Risks
In the normal course of business, the Portfolio invests in securities and enters into transactions where risks exist. Those risks include:
Market Risk:The value of securities held by the Portfolio may decline in response to certain events, including those directly involving the issuers whose securities are owned by the Portfolio; conditions affecting the general economy; overall market changes; local, regional or global political, social or economic instability; and currency, interest rate, and price fluctuations.
Credit and Counterparty Risk: The Portfolio may be exposed to counterparty risk, or the risk that an entity with which the Portfolio has unsettled or open transactions may default. The potential loss could exceed the value of the financial assets and liabilities recorded in the financial statements. Financial assets that potentially expose the Portfolio to credit and counterparty risk consist principally of cash due from counterparties and investments. The Portfolio manages counterparty risk by entering into agreements only with counterparties that it believes have the financial resources to honor their obligations and by monitoring the financial stability of those counterparties. The Adviser attempts to mitigate counterparty risk by (i) periodically assessing the creditworthiness of its trading partners, (ii) monitoring and/or limiting the amount of its net exposure to each individual counterparty based on its assessment, and (iii) requiring collateral from the counterparty for certain transactions. In order to preserve certain safeguards fornon-standard settlement trades, the Portfolio restricts its exposure to credit and counterparty losses by entering into master netting agreements (“Master Agreements”) with counterparties (approved brokers) with whom it undertakes a significant volume of transactions. Master Agreements govern the terms of certain transactions, and reduce the counterparty risk associated with relevant transactions by specifying credit protection mechanisms and providing standardization that improves legal certainty. Master Agreements can also help limit counterparty risk by specifying collateral posting arrangements atpre-arranged exposure levels.
Repurchase and reverse repurchase agreements are primarily executed under Global Master Repurchase Agreements (“GMRAs”) or Master Repurchase Agreements (“MRAs”), which provide the rights toset-off. Each repurchase and reverse repurchase agreement is initially collateralized at the transaction level. In the event of default, the total market value exposure will be offset against collateral exchanged to date, which would result in a net receivable/(payable) that would be due from/to the counterparty.
Additional risks associated with each type of investment are described above within the respective security type notes. The Portfolio’s prospectus includes a discussion of the principal risks of investing in the Portfolio.
4. Investment Transactions
Aggregate cost of purchases and proceeds of sales of investment securities, excluding short-term securities, for the year ended December 31, 2018 were as follows:
| | | | | | | | | | | | |
Purchases | | | Sales | |
U.S. Government | | Non-U.S. Government | | | U.S. Government | | | Non-U.S. Government | |
| $0 | | $ | 525,004,860 | | | $ | 0 | | | $688,253,652 | | |
5. Investment Management Fees and Other Transactions with Affiliates
Investment Management Agreement -Brighthouse Investment Advisers is the investment adviser to the Portfolio. The Trust has entered into an investment management agreement with Brighthouse Investment Advisers with respect to the Portfolio. For providing investment management services to the Portfolio, Brighthouse Investment Advisers receives monthly compensation at the following annual rates:
| | | | | | |
Management
Fees earned by
Brighthouse
Investment Advisers
for the year ended
December 31, 2018 | | % per annum | | | Average Daily Net Assets |
| $8,526,259 | | | 0.750 | % | | Of the first $500 million |
| | | 0.700 | % | | Of the next $500 million |
| | | 0.650 | % | | On amounts in excess of $1 billion |
Brighthouse Investment Advisers has entered into an investment subadvisory agreement with respect to managing the Portfolio. Frontier Capital Management Company, LLC (the “Subadviser”) is compensated by Brighthouse Investment Advisers to provide subadvisory services for the Portfolio.
BHFTII-16
Brighthouse Funds Trust II
Frontier Mid Cap Growth Portfolio
Notes to Financial Statements—December 31, 2018—(Continued)
Management Fee Waiver - Pursuant to a management fee waiver agreement, the Adviser has agreed, for the period April 30, 2018 to April 30, 2019, to reduce its advisory fees set out above under “Investment Management Agreement” for each class of the Portfolio as follows:
| | |
% per annum reduction | | Average Daily Net Assets |
| 0.050% | | On the first $500 million |
| 0.025% | | Over $850 million and less than $1 billion |
| (0.025)% | | On the next $150 million |
An identical agreement was in place for the period May 1, 2017 to April 30, 2018. Amounts waived for the year ended December 31, 2018 are shown as a management fee waiver in the Statement of Operations.
Certain officers and trustees of the Trust may also be officers of Brighthouse Investment Advisers; however, such officers and trustees receive no compensation from the Trust.
Transfer Agency Agreement -Brighthouse Financial, Inc. serves as the transfer agent for the Trust. Brighthouse Financial, Inc. receives no fees for its services to the Trust.
Distribution and Service Fees -The Trust has a distribution agreement with Brighthouse Securities, LLC (the “Distributor”) pursuant to which the Distributor serves as the general distributor of shares of each class (each a “Class”) of each Portfolio. The Distributor is an affiliate of the Trust. The Trust has adopted a Distribution and Services Plan (the “Plan”) relating to Class B, Class D and Class E shares of each Portfolio, under Rule 12b-1 under the 1940 Act, pursuant to which the Trust may pay the Distributor a fee (the “Service Fee”) at an annual rate not to exceed 0.25% of each such Portfolio’s average daily net assets attributable to the Class B, Class D and Class E shares of the Trust. Each Portfolio may not offer shares of each Class. The Plan also authorizes the Trust, on behalf of each of its Portfolios, may pay the Distributor a distribution Fee (the “Distribution Fee” and together with the Service Fee, the “Fees”) at an annual rate of up to 0.25% of each Portfolio’s average daily net assets attributable to the Class B, Class D and Class E shares in consideration of the services rendered in connection with the sale of such shares by the Distributor. Under the Distribution Agreement with respect to the Trust, Fees are currently paid at an annual rate of 0.25% of average daily net assets in the case of Class B shares, 0.10% of average daily net assets in the case of Class D shares and 0.15% of average daily net assets in the case of Class E shares. The Plan is known as a “compensation plan” because the Trust makes payments to the Distributor for services rendered regardless of the actual level of expenditures by the Distributor. Amounts incurred by the Portfolio for the year ended December 31, 2018 are shown as Distribution and service fees in the Statement of Operations.
Deferred Trustee Compensation -Each Trustee who is not currently an employee of the Adviser or any of its affiliates receives compensation from the Trust for his or her service to the Trust. A deferred compensation plan (the “Plan”) is available to the Trustees on a voluntary basis. Deferred amounts remain in the Trust until distributed in accordance with the provisions of the Plan. The value of a participating Trustee’s deferral account is based on theoretical investments of deferred amounts on the normal payment dates in certain portfolios of the Trust or Brighthouse Funds Trust I, an affiliate of the Trust, as designated by the participating Trustee. Changes in the value of participants’ deferral accounts are reflected as Trustees’ fees and expenses in the Statement of Operations. The portion of the accrued obligations allocated to the Portfolio under the Plan is reflected as Deferred trustees’ fees in the Statement of Assets and Liabilities.
6. Contractual Obligations
Under the Trust’s organizational documents, its officers and Trustees may be indemnified against certain liabilities and expenses arising out of the performance of their duties to the Trust. Additionally, the Trust has a variety of indemnification obligations under contracts with its service providers. The Trust’s maximum exposure under these arrangements is unknown, as this would involve future claims that may be made against the Trust that have not yet occurred.
7. Income Tax Information
The cost basis of investments for federal income tax purposes at December 31, 2018 was as follows:
| | | | |
Cost basis of investments | | $ | 1,125,279,401 | |
Gross unrealized appreciation | | | 163,502,226 | |
Gross unrealized depreciation | | | (75,246,120 | ) |
| | | | |
Net unrealized appreciation (depreciation) | | $ | 88,256,106 | |
| | | | |
BHFTII-17
Brighthouse Funds Trust II
Frontier Mid Cap Growth Portfolio
Notes to Financial Statements—December 31, 2018—(Continued)
The tax character of distributions paid for the years ended December 31, 2018 and 2017 were as follows:
| | | | | | | | | | | | | | | | | | | | |
Ordinary Income | | | Long-Term Capital Gain | | | Total | |
2018 | | 2017 | | | 2018 | | | 2017 | | | 2018 | | | 2017 | |
| $1,005,813 | | $ | — | | | $ | 131,700,509 | | | $ | 28,500,968 | | | $ | 132,706,322 | | | $ | 28,500,968 | |
As of December 31, 2018, the components of distributable earnings (accumulated losses) on a federal income tax basis were as follows:
| | | | | | | | | | | | | | | | |
Undistributed
Ordinary
Income | | Undistributed
Long-Term
Capital Gain | | | Net
Unrealized
Appreciation | | | Accumulated
Capital Losses | | | Total | |
| $5,997,260 | | $ | 147,000,242 | | | $ | 88,256,106 | | | $ | — | | | $ | 241,253,608 | |
The Portfolio utilizes the provisions of the federal income tax laws that provide for the carryforward of capital losses for prior years, offsetting such losses against any future realized capital gains. Under the Regulated Investment Company Modernization Act of 2010 (the “Act”), net capital losses recognized after December 22, 2010 may be carried forward indefinitely and their character is retained as short-term and/or long-term losses.
As of December 31, 2018, the Portfolio had no accumulated capital losses.
8. Recent Accounting Pronouncements and SEC Update
In August 2018, the FASB issued Accounting Standards Update2018-13, Fair Value Measurement (Topic 820)—Disclosure Framework—Changes to the Disclosure Requirements for Fair Value Measurement (“ASU2018-13”) which introduces new fair value disclosure requirements as well as eliminates and modifies certain existing fair value disclosure requirements. ASU2018-13 is effective for fiscal years beginning after December 15, 2019, and interim periods within those fiscal years. Early adoption is permitted and, as such, management has elected to early adopt ASU2018-13 effective with the current reporting period. The impact of the Portfolio’s adoption was limited to changes in the Portfolio’s financial statement disclosures regarding fair value, primarily those disclosures related to transfers between levels of the fair value hierarchy.
In August 2018, the Securities and Exchange Commission released its Final Rule on Disclosure Update and Simplification (the “Final Rule”) which is intended to simplify an issuer’s disclosure compliance efforts by removing redundant or outdated disclosures requirements without significantly altering the mix of information provided to investors. Effective with the current reporting period, the Portfolio adopted the Final Rule with the most notable impacts being that the Portfolio is no longer required to present the components of distributable earnings on the Statement of Assets and Liabilities or the sources of distributions to shareholders and the amounts of undistributed net investment income on the Statements of Changes in Net Assets.
BHFTII-18
Brighthouse Funds Trust II
Frontier Mid Cap Growth Portfolio
Report of Independent Registered Public Accounting Firm
To the Shareholders of Frontier Mid Cap Growth Portfolio and the Board of Trustees of Brighthouse Funds Trust II:
Opinion on the Financial Statements and Financial Highlights
We have audited the accompanying statement of assets and liabilities, including the schedule of investments, of the Frontier Mid Cap Growth Portfolio (the “Portfolio”), one of the portfolios constituting the Brighthouse Funds Trust II, as of December 31, 2018, the related statement of operations for the year then ended, the statements of changes in net assets for each of the two years in the period then ended, the financial highlights for each of the five years in the period then ended, and the related notes. In our opinion, the financial statements and financial highlights present fairly, in all material respects, the financial position of the Frontier Mid Cap Growth Portfolio of the Brighthouse Funds Trust II as of December 31, 2018, the results of its operations for the year then ended, the changes in its net assets for each of the two years in the period then ended, and the financial highlights for each of the five years in the period then ended, in conformity with accounting principles generally accepted in the United States of America.
Basis for Opinion
These financial statements and financial highlights are the responsibility of the Portfolio’s management. Our responsibility is to express an opinion on the Portfolio’s financial statements and financial highlights based on our audits. We are a public accounting firm registered with the Public Company Accounting Oversight Board (United States) (PCAOB) and are required to be independent with respect to the Portfolio in accordance with the U.S. federal securities laws and the applicable rules and regulations of the Securities and Exchange Commission and the PCAOB.
We conducted our audits in accordance with the standards of the PCAOB. Those standards require that we plan and perform the audit to obtain reasonable assurance about whether the financial statements and financial highlights are free of material misstatement, whether due to error or fraud. The Portfolio is not required to have, nor were we engaged to perform, an audit of its internal control over financial reporting. As part of our audits we are required to obtain an understanding of internal control over financial reporting but not for the purpose of expressing an opinion on the effectiveness of the Portfolio’s internal control over financial reporting. Accordingly, we express no such opinion.
Our audits included performing procedures to assess the risks of material misstatement of the financial statements and financial highlights, whether due to error or fraud, and performing procedures that respond to those risks. Such procedures included examining, on a test basis, evidence regarding the amounts and disclosures in the financial statements and financial highlights. Our audits also included evaluating the accounting principles used and significant estimates made by management, as well as evaluating the overall presentation of the financial statements and financial highlights. Our procedures included confirmation of securities owned as of December 31, 2018, by correspondence with the custodian and brokers; when replies were not received from brokers, we performed other auditing procedures. We believe that our audits provide a reasonable basis for our opinion.
/s/ Deloitte & Touche LLP
Boston, Massachusetts
February 25, 2019
We have served as the auditor of one or more of the Brighthouse investment companies since 1983.
BHFTII-19
Brighthouse Funds Trust II
Trustees and Officers
MANAGEMENT OF THE TRUSTS
The Boards of Trustees (the “Board”) of Brighthouse Funds Trust I and Brighthouse Funds Trust II (“BHF I” and “BHF II”, respectively, and collectively the “Trusts”) supervise the Trusts and are responsible for representing the interests of shareholders. The Trustees, the Chairman of the Board and the Chairmen of each subcommittee are the same for both Trusts. The Trustees of each Trust meet periodically throughout the year to oversee the Portfolios’ activities, reviewing, among other things, each Portfolio’s performance and its contractual arrangements with various service providers. The Trustees of each Trust elect the officers of the Trust, who are responsible for administering the Trust’sday-to-day operations.
Trustees and Officers
The Trustees and executive officers of the Trusts, as well as their principal occupations during the past five years, are set forth below. Unless otherwise indicated, the business address of each is c/o Brighthouse Funds, One Financial Center, Boston, Massachusetts 02111. Each Trustee who is deemed an “interested person,” as such term is defined in the 1940 Act, is referred to as an “Interested Trustee.” Those Trustees who are not “interested persons,” as such term is defined in the 1940 Act, are referred to as “Independent Trustees.” There is no limit to the term a Trustee may serve. Trustees serve until their death, resignation or removal in accordance with the BHF I Trust’s and BHF II Trust’s respective organizational documents and policies adopted by the Boards of the respective Trusts from time to time. Officers hold office at the pleasure of each Board and serve until their removal or resignation in accordance with the Trusts’ respective organizational documents and policies adopted by the Board of each Trust from time to time.
| | | | | | | | | | |
Name and Year of Birth | | Current
Position(s)
Held with
Registrant | | Term of Office
and Length of
Time Served | | Principal Occupation(s) During the Past
5 Years(1) | | Number of
Portfolios
in Brighthouse
Funds
Complex(2)
Overseen
by Trustee | | Other Directorships Held
by Trustee During the
Past 5 Years(1) |
| Interested Trustee |
John Rosenthal* (1960) | | Trustee | | Indefinite; From
May 2016
(Trust I and
Trust II) to present | | Chief Investment Officer, Brighthouse Financial, Inc. (2017 to present); until 2017, Senior Managing Director and Head of Global Portfolio Management, MetLife, Inc. | | 72 | | None |
|
| Independent Trustees |
Dawn M. Vroegop (1966) | | Trustee and Chairman of the Board | | Indefinite; From
December 2000
(Trust I)/May
2009 (Trust II) to
present as
Trustee; From
May 2016 (Trust
I and Trust II)
until present as
Chairman | | Private Investor. | | 72 | | Trustee, Driehaus Mutual Funds.** |
| | | | | |
Stephen M. Alderman (1959) | | Trustee | | Indefinite; From
December 2000
(Trust I)/April
2012 (Trust II) to
present | | Shareholder in the law firm of Garfield and Merel, Ltd. | | 72 | | None |
| | | | | |
Robert J. Boulware (1956) | | Trustee | | Indefinite; From
March 2008
(Trust I)/April
2012 (Trust II) to
present | | Managing Director, Pilgrim Funds, LLC (private equity fund). | | 72 | | Trustee, Vertical Capital Income Fund(closed-end fund);** Director, Gainsco, Inc. (auto insurance);** Trustee, SharesPost 100 Fund(closed-end fund).** |
| | | | | |
Susan C. Gause (1952) | | Trustee | | Indefinite; From
March 2008
(Trust I)/April
2012 (Trust II) to
present | | Private Investor. | | 72 | | Trustee, HSBC Funds.** |
BHFTII-20
Brighthouse Funds Trust II
Trustees and Officers—(Continued)
| | | | | | | | | | |
Name and Year of Birth | | Current
Position(s)
Held with
Registrant | | Term of Office
and Length of
Time Served | | Principal Occupation(s) During the Past
5 Years(1) | | Number of
Portfolios
in Brighthouse
Funds
Complex(2)
Overseen
by Trustee | | Other Directorships Held
by Trustee During the
Past 5 Years(1) |
Nancy Hawthorne (1951) | | Trustee | | Indefinite; From
May 2003
(Trust II)/April
2012 (Trust I)
to present | | Partner, Hawthorne Financial Advisors, LLC (registered investment advisor); until 2014, Chief Executive Officer, Clerestory LLC (corporate advisor). | | 72 | | Director and Chairman of the Board of Directors, THL Credit, Inc.;** Director and Chairman of the Board, Avid Technology, Inc.;** Director, CRA International, Inc.** |
| | | | | |
Barbara A. Nugent (1956) | | Trustee | | Indefinite; From
January 2014
(Trust I and
Trust II) to
present | | President, True North Board Governance, LLC (consulting); until December 2013, partner in the law firm of Stradley Ronon Stevens & Young, LLP. | | 72 | | Independent Lead Trustee, BMT Investment Funds** |
| | | | | |
Christopher J. Towle (1957) | | Trustee | | Indefinite; From
April 2018
(Trust I and
Trust II) to
present | | Retired; until 2014, Partner, Portfolio Manager, Director of High Yield and Convertible Strategies, Lord Abbett & Co. | | 72 | | Trustee, Driehaus Mutual Funds** |
Officers
| | | | | | |
Name and Year of Birth | | Position(s)
Held with
Registrant | | Length of
Time Served | | Principal Occupation(s)
During the Past 5 Years(1) |
| Executive Officers | | | | | | |
Kristi Slavin (1973) | | President and Chief Executive Officer, of Trust I and Trust II | | From May
2016
(Trust I and
Trust II) to
present | | President, Brighthouse Investment Advisers, LLC (2016-present); formerly, Senior Vice President, MetLife Advisers, LLC; Vice President, MetLife, Inc.; Vice President, Trust I and Trust II(2015-2016). |
| | | |
Alan R. Otis (1971) | | Chief Financial Officer and Treasurer, of Trust I and Trust II | | From
November
2017
(Trust I and
Trust II) to
present | | Senior Vice President, Brighthouse Investment Advisers, LLC (2017-present); formerly, Vice President, Brighthouse Investment Advisers, LLC (2012-2017); Assistant Treasurer, Trust I and Trust II (2012-2017). |
| | | |
Andrew L. Gangolf (1954) | | Secretary, of Trust I and Trust II | | From May
2011
(Trust I and
Trust II) to
present | | Executive Vice President, Brighthouse Investment Advisers, LLC (2017-present); formerly, Senior Vice President, MetLife Advisers, LLC (2011-2017); until 2011, Senior Vice President & Assistant General Counsel, AllianceBernstein Investments, Inc. |
| | | |
Steven E. Hartstein (1963) | | Chief Compliance Officer (“CCO”), of Trust I and Trust II | | From
February
2014
(Trust I and
Trust II) to
present | | Senior Vice President and CCO, Brighthouse Investment Advisers, LLC (2017-present); Head of Investments Compliance, Vice President, Brighthouse Financial, Inc. (2017-present); formerly, Vice President, MetLife, Inc. (2013-2017); Senior Vice President and CCO, MetLife Advisers, LLC (2013-2017.) |
| | | |
Victor Soto (1978) | | Vice President of Trust I and Trust II | | From May
2018
(Trust I and
Trust II) to
present | | Executive Vice President, Brighthouse Investment Advisers, LLC (2016-present); Assistant Vice President, MetLife Inc. (2015-2017); Portfolio Manager, 1st Global (2013-2015). |
| * | Mr. Rosenthal is an “interested person” of the Trusts because of his position with Brighthouse Financial, Inc., the current parent company of Brighthouse Investment Advisers, LLC. |
| ** | Indicates a directorship with a registered investment company or a company subject to the reporting requirements of the Securities Exchange Act of 1934, as amended. |
| (1) | Previous positions during the past five years with the Trusts, Brighthouse Financial, Inc., MetLife, Inc. or the Manager are omitted if not materially different. |
| (2) | The Fund Complex includes 43 BHF I Portfolios and 29 BHF II Portfolios. |
BHFTII-21
Brighthouse Funds Trust II
Frontier Mid Cap Growth Portfolio
Board of Trustees’ Consideration of Advisory and Sub-Advisory Agreements
At anin-person meeting held on November6-8, 2018 (the “November Meeting”), the Boards of Trustees (the “Board”) of Brighthouse Funds Trust I and Brighthouse Funds Trust II (“BFT I” and “BFT II,” respectively, and collectively, the “Trusts”), including a majority of the Trustees who are not “interested persons” of the Trusts (the “Independent Trustees”) under the Investment Company Act of 1940 (the “1940 Act”), approved the continuation of the Trusts’ advisory agreements (each, an “Advisory Agreement”) with Brighthouse Investment Advisers, LLC (the “Adviser”) and the applicablesub-advisory agreements (each a “Sub-Advisory Agreement,” and collectively with the Advisory Agreement, the “Agreements”) between the Adviser and the investmentsub-advisers (each a “Sub-Adviser,” and collectively, the “Sub-Advisers”) for the series of the Trusts (each a “Portfolio,” and collectively, the “Portfolios”).
In making those approvals, the Board reviewed a variety of materials that were provided for the specific purpose of the annual contract renewal process. In addition, various materials provided to and discussed with the Board throughout the year informed the Board’s decision to renew the Agreements. In particular, the information for each Portfolio included, but was not limited to, investment performance reports, and reports on expenses, legal and compliance matters, asset pricing, brokerage commissions and trade execution.
The Board met in person with personnel of the Adviser on October 17, 2018 for the specific purpose of giving preliminary consideration to the proposed continuation of the Agreements (the “October Meeting”). At that meeting, the Adviser reviewed with the Board the performance and fees experienced by each Portfolio, as well as other information. During and after the October Meeting, the Independent Trustees communicatedfollow-up matters for management to address at the November Meeting. The Independent Trustees were advised by independent legal counsel throughout the contract renewal process, and met with independent legal counsel in several executive sessions outside of the presence of management.
Information furnished and reviewed specifically in connection with the renewal process included, but was not limited to, a report for each Portfolio that was prepared by Broadridge (“Broadridge”), an independent organization. In addition, the Independent Trustees reviewed a report that was prepared by JDL Consultants, LLC (“JDL”), an independent consultant to the Independent Trustees (“JDL Report”), which examined the comparative fees, expenses and performance of each Portfolio, based upon the Broadridge reports. Also, the Board reviewed the responses to wide-ranging questions from the Independent Trustees relating to the business, operations and performance of the Adviser and theSub-Advisers that the Adviser andSub-Advisers had prepared specifically for the renewal process, and reviewed aPortfolio-by-Portfolio analysis of the profitability to the Adviser of each Advisory Agreement, which was prepared by the Adviser for the renewal process.
At the November Meeting, the Board, including a majority of the Independent Trustees, concluded that the nature, extent and quality of services provided by the Adviser and eachSub-Adviser supported the renewal of the Agreements. The Board also concluded that the investment performance of each Portfolio was such that each Agreement should continue, and that the fees paid by each Portfolio to the Adviser appeared to be reasonable in light of the nature, extent and quality of the services provided by the Adviser andSub-Adviser. Further, the Board concluded that the Adviser’s profitability in providing services under the Advisory Agreements did not appear unreasonable in light of the nature, extent and quality of the services provided by the Adviser. Finally, the Board reviewed the extent to which the investment advisory fees paid by the Portfolios shared economies of scale with investors or entailed the potential to share economies of scale with investors and concluded that those considerations generally supported the renewal of each Agreement. In approving the renewal of each of the Agreements, the Board, including the Independent Trustees, gave attention to all of the information that was furnished and each Trustee placed varying degrees of importance on the various pieces of information that were provided to them. The Board evaluated the information available to it on aPortfolio-by-Portfolio basis, and its decision was made separately with respect to each Portfolio. The following paragraphs provide more information about some of the primary factors that were relevant to the Board’s decision. The Board did not identify any single factor as determinative, and the Trustees generally attributed different weights to various factors for the various Portfolios.
Nature, extent and quality of services. The Board evaluated the nature, extent and quality of the services that the Adviser and theSub-Advisers, as relevant, have provided to the Portfolios. The Board considered the Adviser’s services as investment manager to the Portfolios, including its services relating to the hiring and oversight of theSub-Advisers, trading practices and oversight of transition management (as applicable), compliance programs and personnel, and risk management, among other things. The Adviser’s services in coordinating and overseeing the activities of the Trusts’ other service providers were also considered. The Board considered information received from the Trusts’ Chief Compliance Officer (“CCO”) regarding the Portfolios’ compliance policies and procedures that were established pursuant to Rule38a-l under the 1940 Act. The Board also noted that the Adviser’s investment, compliance and legal staff conduct regular and periodic telephonic andin-person meetings with theSub-Advisers to review and assess the services that are provided to the Portfolios, and that personnel of the Adviser prepare and present reports to the Independent Trustees regarding those meetings. In addition, throughout the year, the Board considered the expertise, experience and performance of the personnel of the Adviser who performed the various services that are mentioned above.
BHFTII-22
Brighthouse Funds Trust II
Frontier Mid Cap Growth Portfolio
Board of Trustees’ Consideration of Advisory and Sub-Advisory Agreements—(Continued)
With respect to the services provided by each of theSub-Advisers, the Board considered a variety of information that the Adviser and eachSub-Adviser prepared for the Board’s review. The Board considered eachSub-Adviser’s investment process and philosophy, and the investment performance experienced by the Portfolio (as described in more detail below). The Board took into account that eachSub-Adviser’s responsibilities include the development and maintenance of an investment program for the applicable Portfolio that is consistent with the Portfolio’s investment objectives, the selection of investment securities and the placement of orders for the purchase and sale of such securities, as well as the implementation of compliance controls related to performance of these services. In particular, the Board considered, among other things, theSub-Adviser’s current level of staffing as well as its compensation program and its overall resources. The Board reviewed eachSub-Adviser’s history and investment experience, as well as information provided regarding the qualifications, background and responsibilities of theSub-Adviser’s investment and compliance personnel who provide services to the Portfolios. The Board also considered, among other things, eachSub-Adviser’s compliance program and regulatory and disciplinary history. In its review, the Board also took into account information regarding any services and/or payments provided to the Adviser by theSub-Advisers in connection with marketing activities and considered representations from the Adviser that those payments were not considered in the Adviser’s recommendation to renew any of theSub-Advisory Agreements.
Performance. The Board placed emphasis on the performance of each Portfolio in light of, among other things, its importance to investors. The Board considered the Adviser’s quarterly reviews with the Board of detailed information about each Portfolio’s investment strategies and performance results and composition, including discussions regarding the relevant effect of current market conditions. The Board reviewed and considered the reports prepared by Broadridge, which provided a statistical analysis comparing the Portfolios’ investment performance to that of comparable funds underlying variable insurance products (the “Performance Universe”). The Independent Trustees also met separately with representatives of JDL during the October Meeting to review the JDL Report. The Board also compared the performance records of the Portfolios to those of comparable funds and other accounts that were managed by the relevantSub-Adviser, to the extent such information was available. The Board considered each Portfolio’s performance for periods subsequent to the performance period covered by the Broadridge reports, and the Adviser’s discussion of the same, including the effect of current market conditions on each Portfolio’s more recent performance. The Board also noted that while it found the data provided by Broadridge generally useful, it recognized the limitations of such data, including, in particular, that notable differences may exist between a Portfolio and those of the other funds in a Broadridge category (for example, the investment objectives(s) and investment strategies) and that the results of the performance comparisons may vary depending on (i) the end dates for the performance periods that were selected and (ii) the selection of the peer groups.
The Board focused particular attention on Portfolios with less favorable performance records. The Board noted the Adviser’s focus on eachSub-Adviser’s performance and that the Adviser has been active in monitoring and responding to any performance issues with respect to the Portfolios.
Fees and Expenses. The Board gave consideration to the level and method of computing the fees payable under the Agreements. The Board considered the Broadridge report for each of the Portfolios, which included comparisons for each Portfolio of its contractual management andsub-adviser fees (at current and various asset levels), and total expenses, with those of its peers, including as those peers were divided into a broad group of peer funds (“Expense Universe”), a narrower group of peer funds (“Expense Group”), a broad group of peersub-advised funds (“Sub-advised Expense Universe”), and a narrower group of peersub-advised funds (“Sub-advised Expense Group”). Broadridge selected the peer funds which were similarly situated funds underlying variable insurance products deemed to be comparable to the Portfolios. The Independent Trustees, with the assistance of JDL, also examined the JDL Report. The Board compared the fee payable to aSub-Adviser by the Adviser with respect to the Portfolio to the fee payable to theSub-Adviser by other comparable funds and other accounts, to the extent such information was available.
The Board noted that thesub-advisory fees for the Portfolios are paid by the Adviser out of the advisory fees, and that the Adviser negotiates the fees at arm’s length. The Board also considered that the Adviser had entered into expense limitation or management fee waiver agreements with certain of the Portfolios pursuant to which the Adviser had agreed to waive a portion of its advisory fee and/or reimburse certain expenses as a means of limiting a Portfolio’s total annual operating expenses.
Profitability. The Board examined the profitability to the Adviser of each Advisory Agreement, on aPortfolio-by-Portfolio basis. The Board also considered that an affiliate of the Adviser, Brighthouse Securities, LLC, serves as distributor for the Trusts, and, as such, receives Rule12b-1 payments to support the distribution of the Portfolios. The Board considered the profitability to theSub-Advisers and their affiliates as a result of their relationships with the Portfolios, to the extent available, and the Board considered the ability of the Adviser to negotiate with aSub-Adviser at arm’s length. In reviewing the profitability analyses, the Board recognized that expense allocation methodologies are inherently subjective and various expense allocation methodologies may be reasonable while producing different results.
BHFTII-23
Brighthouse Funds Trust II
Frontier Mid Cap Growth Portfolio
Board of Trustees’ Consideration of Advisory and Sub-Advisory Agreements—(Continued)
Economies of scale. The Board also considered each Portfolio’s fees in light of its size. The Board noted the fee schedules for the Portfolios that contain breakpoints that reduce the fee rate above specified asset levels. The Board noted those Portfolios that did not have breakpoints in their advisory fee and took into account management’s discussion of the same. The Board noted that those Portfolios with Advisory Agreements containing breakpoints generally have breakpoints in the correspondingSub-Advisory Agreement. The Board considered the effective fees under the Advisory Agreement andSub-Advisory Agreement for each Portfolio as a percentage of assets at different asset levels and possible economies of scale that may be realized if the assets of the Portfolio grow. The Board examined, among other data, the effect of a Portfolio’s growth in size, and reduction in size, on various fee schedules and the Board reviewed the Broadridge and JDL Reports, which compared fees among peers. The Board also generally noted that if a Portfolio’s assets increase over time, the Portfolio may realize other economies of scale if assets increase proportionally more than certain other fixed expenses.
Other factors. The Board considered other benefits that may be realized by the Adviser and its affiliates from their relationship with the Trusts. Among them, the Board recognized that Brighthouse Securities, LLC, as the distributor for the Trusts, receives payments pursuant to Rule12b-1 from the Portfolios to compensate for the provision of shareholder services and distribution activities, which could lead to growth in the Trusts’ assets and corresponding benefits from such growth, including economies of scale. The Board considered other benefits that may be realized by eachSub-Adviser and its affiliates from their relationship with the Trusts, including the opportunity to provide advisory services to additional portfolios of the Trusts and reputational benefits. In conjunction with these considerations, the Board noted the ongoing commitment of the Adviser to the Portfolios.
The Board requested, received, and considered information from the Adviser regarding possible conflicts of interest in the form of material benefits to the Adviser resulting from the Adviser’s affiliations and business relationships, as relevant. The Board considered the services that are provided to the Trusts by its service providers, and the manner in which any conflicts were mitigated.
* * *
Frontier Mid Cap Growth Portfolio. The Board also considered the following information in relation to the Agreements with the Adviser and Frontier Capital Management Company, LLC regarding the Portfolio:
Among other data relating specifically to the Portfolio’s performance, the Board considered that the Portfolio outperformed the median of its Performance Universe and the average of its Morningstar Category for the five-year period ended June 30, 2018, and underperformed the median of its Performance Universe and the average of its Morningstar Category for theone-year and three-year periods ended June 30, 2018. The Board further considered that the Portfolio underperformed its benchmark, the Russell Midcap Growth Index, for theone-, three- and five-year periods ended September 30, 2018. The Board took into account management’s discussion of the Portfolio’s performance, including prevailing market conditions.
The Board also considered that the Portfolio’s actual management fees and total expenses (exclusive of12b-1 fees) were below the Expense Group median, the Expense Universe median, and theSub-advised Expense Universe median. The Board noted that the Portfolio’s contractual management fees were below the asset-weighted average of comparable funds selected by Broadridge at the Portfolio’s current size. The Board also noted that the Portfolio’s contractualsub-advisory fees were below the averages of theSub-advised Expense Universe and theSub-advised Expense Group at the Portfolio’s current size.
BHFTII-24
Brighthouse Funds Trust II
Jennison Growth Portfolio
Managed by Jennison Associates LLC
Portfolio Manager Commentary*
PERFORMANCE
For the 12 months ended December 31, 2018, the Class A, B, and E shares of the Jennison Growth Portfolio returned 0.35%, 0.11%, and 0.22%, respectively. The Portfolio’s benchmark, the Russell 1000 Growth Index1, returned-1.51%.
MARKET ENVIRONMENT / CONDITIONS
As 2018 began, global gross domestic product growth was accelerating, the labor market was continuing to strengthen, and lower U.S. corporate tax rates were taking effect, helping to boost wages and capital spending. Given the constructive macroeconomic landscape, investors largely overlooked uncertainty created by White House trade and other policy initiatives. Asell-off in the fourth quarter reflected mounting investor concerns about a range of issues, including the pace of U.S. growth, decelerating expansion innon-U.S. economies, U.S. interest rate increases and their effect on U.S. economic growth, the rising risk of a major trade war with China, the state of U.S. trade alliances with other major trading partners, and discord and uncertainty about domestic policy, which culminated in a partial U.S. government shutdown as the year drew to a close.
PORTFOLIO REVIEW / PERIOD END POSITIONING
The Portfolio outperformed its benchmark over the12-month period ended December 31, 2018. Positive security selection within Information Technology (“IT”) was the primary driver of outperformance while relative sector weightings were modestly additive.
Overall, the Portfolio’s IT positions were strong contributors to Portfolio performance. Digital transformation of the enterprise has become a strategic imperative across many industries and companies and has supplanted Cloudware as the primarily tool to reduce infrastructure costs. In our view, Portfolio holdings Salesforce.com, Red Hat, Adobe, Workday, and Microsoft offered critical applications and services that have created fundamental changes in the way businesses operate. Payments companies continued to benefit from the long-term shift from cash to electronic credit and debit transactions. Both MasterCard and Visa held strong market positions with high barriers to entry, pricing power, and solid operating leverage potential. The Portfolio’s holdings in Square and PayPal offered innovativelow-cost, high-security,easy-to-use digital payment options, in particular for mobile and online transactions. Nvidia, on the other hand, fell significantly in the fourth quarter after strong performance through much of 2017 and 2018. Shares fell during the final quarter and reflectedlow- andmid-end gaming GPU inventory issues that were exacerbated by a slowdown in the cryptocurrency mining boom.
The Portfolio’s long-term holdings in U.S. internet companies continued to contribute meaningfully to performance. In the Communications Services sector, Netflix continued to raise its competitive barriers with investments in content, resulting in strong subscriber growth and increased pricing and operating leverage. Conversely, ongoing concern about data breaches, user-data usage, and increased government scrutiny, coupled with maturation of user engagement, continued to loom over Facebook during the period. However, the company has significant scale benefits and untapped monetization opportunities that we believe should drive better-than-average growth even with higher costs and restriction in data usage. The Portfolio’s holdings in Chinese internet companies fared less well. Tencent was negatively affected by new restrictions on video game approvals implemented by Chinese authorities. While the various business segments of Alibaba were providing significant revenue growth, the company’s stock declined over the period on high business investment spending and Chinese government efforts to tighten control of internet andnon-traditional financial companies.
In Consumer Discretionary, Amazon benefited from its market position, scale, and execution.
In Industrials, Boeing was a top relative performer in the Portfolio. Boeing’s gain reflected strong 787 Dreamliner commercial jet cash generation, solid cost controls, andramped-up 737 jet production. The company’s extensive order backlog reflected strong global demand.
Stock selection within the Portfolio’s Health Care positions were relative detractors over the period. Bristol-Myers Squibb fell on signs that itsnon-small cell lung cancer program has been eclipsed by a competing franchise. However, the likely broad adoption of immuno-oncology therapy in multiple settings pointed to avenues of potential future growth for Bristol. On the positive side, the Portfolio’s position in Illumina was additive on a relative basis and benefited from advances in systems for analyzing genetic variation and function continued to broaden the understanding of the clinical significance of the genome. We believe Illumina is at the forefront of this technology.
The Portfolio is constructed through individual stock selection, based on the fundamentals of individual companies. Sector weights over the course of 2018 were largely stable, with weights in IT and Health Care being increased modestly, and allocations to Communication Services and Financials being decreased slightly. As of December 31,
BHFTII-1
Brighthouse Funds Trust II
Jennison Growth Portfolio
Managed by Jennison Associates LLC
Portfolio Manager Commentary*—(Continued)
2018, and relative to the Russell 1000 Growth Index benchmark, the Portfolio was overweight Consumer Discretionary and Communication Services, and underweight Industrials.
Kathleen A. McCarragher
Spiros “Sig” Segalas
Michael A. Del Balso
Portfolio Managers
Jennison Associates LLC
* This commentary may include statements that constitute “forward-looking statements” under the U.S. securities laws. Forward-looking statements include, among other things, projections, estimates, and information about possible or future results related to the Portfolio, market or regulatory developments. The views expressed above are not guarantees of future performance or economic results and involve certain risks, uncertainties and assumptions that could cause actual outcomes and results to differ materially from the views expressed herein. The views expressed above are subject to change at any time based upon economic, market, or other conditions and the subadvisory firm undertakes no obligation to update the views expressed herein. Any discussions of specific securities should not be considered a recommendation to buy or sell those securities. The views expressed above (including any forward-looking statement) may not be relied upon as investment advice or as an indication of the Portfolio’s trading intent. Information about the Portfolio’s holdings, asset allocation or country diversification is historical and is not an indication of future Portfolio composition, which may vary. Direct investment in any index is not possible. The performance of any index mentioned in this commentary has not been adjusted for ongoing management, distribution and operating expenses, and sales charges applicable to mutual fund investments. In addition, the returns do not reflect additional fees charged by separate accounts or variable insurance contracts that an investor in the Portfolio may pay. If these additional fees were reflected, performance would have been lower.
BHFTII-2
Brighthouse Funds Trust II
Jennison Growth Portfolio
A $10,000 INVESTMENT COMPARED TO THE RUSSELL 1000 GROWTH INDEX
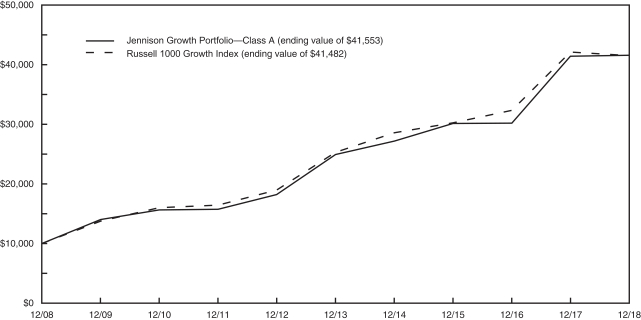
AVERAGE ANNUAL RETURNS (%) (FOR THE YEAR ENDED DECEMBER 31, 2018)
| | | | | | | | | | | | |
| | | | |
| | | 1 Year | | | 5 Year | | | 10 Year | |
| Jennison Growth Portfolio | | | | | | | | | | | | |
Class A | | | 0.35 | | | | 10.77 | | | | 15.31 | |
Class B | | | 0.11 | | | | 10.49 | | | | 15.01 | |
Class E | | | 0.22 | | | | 10.61 | | | | 15.14 | |
| Russell 1000 Growth Index | | | -1.51 | | | | 10.41 | | | | 15.29 | |
1 The Russell 1000 Growth Index is an unmanaged measure of performance of the largest capitalized U.S. companies, within the Russell 1000 companies, that have higher price-to-book ratios and forecasted growth values.
Portfolio performance is calculated including reinvestment of all income and capital gain distributions. Performance numbers are net of all Portfolio expenses but do not include any insurance, sales, separate account or administrative charges of variable annuity or life insurance contracts or any additional expenses that participants may bear relating to the operations of their plans. If these charges were included, the returns would be lower. The performance of any index referenced above has not been adjusted for ongoing management, distribution and operating expenses, and sales charges applicable to mutual fund investments. Direct investment in any index is not possible. The performance of Class A shares, as set forth in the line graph above, will differ from that of other classes because of the difference in expenses paid by policyholders investing in the different share classes.
This information represents past performance and is not indicative of future results. Investment return and principal value may fluctuate so that shares, upon redemption, may be worth more or less than the original cost.
PORTFOLIO COMPOSITION AS OF DECEMBER 31, 2018
Top Holdings
| | | | |
| | | % of
Net Assets | |
| Amazon.com, Inc. | | | 5.8 | |
| Microsoft Corp. | | | 5.2 | |
| Apple, Inc. | | | 4.0 | |
| MasterCard, Inc. - Class A | | | 4.0 | |
| Netflix, Inc. | | | 3.8 | |
| Salesforce.com, Inc. | | | 3.7 | |
| Visa, Inc. - Class A | | | 3.6 | |
| Tencent Holdings, Ltd. | | | 3.2 | |
| Adobe, Inc. | | | 3.1 | |
| Alibaba Group Holding, Ltd.(ADR) | | | 3.1 | |
Top Sectors
| | | | |
| | | % of
Net Assets | |
| Information Technology | | | 33.5 | |
| Consumer Discretionary | | | 21.3 | |
| Communication Services | | | 16.0 | |
| Health Care | | | 14.2 | |
| Industrials | | | 5.1 | |
| Financials | | | 3.8 | |
| Consumer Staples | | | 3.6 | |
| Real Estate | | | 1.3 | |
| Energy | | | 0.5 | |
BHFTII-3
Brighthouse Funds Trust II
Jennison Growth Portfolio
Understanding Your Portfolio’s Expenses
Shareholder Expense Example
As a shareholder of the Portfolio, you incur ongoing costs, including management fees; distribution and service(12b-1) fees; and other Portfolio expenses. This example is intended to help you understand your ongoing costs (in dollars) (referred to as “expenses”) of investing in the Portfolio and compare these costs with the ongoing costs of investing in other mutual funds. The example is based on an investment of $1,000 invested at the beginning of the period and held for the entire period, July 1, 2018 through December 31, 2018.
Actual Expenses
The first line for each share class of the Portfolio in the table below provides information about actual account values and actual expenses. You may use the information in this line, together with the amount you invested in the particular share class of the Portfolio, to estimate the expenses that you paid over the period. Simply divide your account value by $1,000 (for example, an $8,600 account value divided by $1,000 = 8.6), then multiply the result by the number in the first line under the heading entitled “Expenses Paid During Period” to estimate the expenses you paid on your account during this period.
Hypothetical Example for Comparison Purposes
The second line for each share class of the Portfolio in the table below provides information about hypothetical account values and hypothetical expenses based on the Portfolio’s actual expense ratio and an assumed rate of return of 5% per year before expenses, which is not the Portfolio’s actual return. The hypothetical account values and expenses may not be used to estimate the actual ending account balance or expenses you paid for the period. You may use this information to compare the ongoing costs of investing in the Portfolio and other funds. To do so, compare this 5% hypothetical example with the 5% hypothetical examples that appear in the shareholder reports of the other funds.
Please note that the expenses shown in the table are meant to highlight your ongoing costs only and do not reflect any fees or charges of your variable insurance product or any additional expenses that participants in certain eligible qualified plans may bear relating to the operations of their plan. Therefore, the second line for each share class in the table is useful in comparing ongoing costs only, and will not help you determine the relative total costs of owning different funds. In addition, if these other costs were included, your costs would have been higher.
| | | | | | | | | | | | | | | | | | |
Jennison Growth Portfolio | | | | Annualized
Expense
Ratio | | | Beginning
Account Value
July 1,
2018 | | | Ending
Account Value
December 31,
2018 | | | Expenses Paid
During Period**
July 1, 2018
to
December 31,
2018 | |
Class A (a) | | Actual | | | 0.54 | % | | $ | 1,000.00 | | | $ | 896.20 | | | $ | 2.58 | |
| | Hypothetical* | | | 0.54 | % | | $ | 1,000.00 | | | $ | 1,022.48 | | | $ | 2.75 | |
| | | | | |
Class B (a) | | Actual | | | 0.79 | % | | $ | 1,000.00 | | | $ | 895.00 | | | $ | 3.77 | |
| | Hypothetical* | | | 0.79 | % | | $ | 1,000.00 | | | $ | 1,021.22 | | | $ | 4.02 | |
| | | | | |
Class E (a) | | Actual | | | 0.69 | % | | $ | 1,000.00 | | | $ | 895.50 | | | $ | 3.30 | |
| | Hypothetical* | | | 0.69 | % | | $ | 1,000.00 | | | $ | 1,021.73 | | | $ | 3.52 | |
| * | Hypothetical assumes a rate of return of 5% per year before expenses. |
| ** | Expenses paid are equal to the Portfolio’s annualized expense ratio for the most recent six month period, as shown above, multiplied by the average account value over the period, multiplied by the number of days (184 days) in the most recent fiscal half-year, divided by 365 (to reflect theone-half year period). |
| (a) | The annualized expense ratio shown reflects the impact of the management fee waiver as described in Note 5 of the Notes to Financial Statements. |
BHFTII-4
Brighthouse Funds Trust II
Jennison Growth Portfolio
Schedule of Investments as of December 31, 2018
Common Stocks—99.3% of Net Assets
| | | | | | | | |
| Security Description | | Shares | | | Value | |
|
| Aerospace & Defense—4.1% | |
Boeing Co. (The) | | | 230,345 | | | $ | 74,286,262 | |
Safran S.A. | | | 212,104 | | | | 25,482,194 | |
| | | | | | | | |
| | | | | | | 99,768,456 | |
| | | | | | | | |
|
| Automobiles—2.7% | |
Tesla, Inc. (a) (b) | | | 197,487 | | | | 65,723,674 | |
| | | | | | | | |
|
| Banks—1.6% | |
JPMorgan Chase & Co. | | | 405,886 | | | | 39,622,591 | |
| | | | | | | | |
|
| Biotechnology—4.2% | |
Alexion Pharmaceuticals, Inc. (b) | | | 298,264 | | | | 29,038,983 | |
BioMarin Pharmaceutical, Inc. (b) | | | 309,613 | | | | 26,363,547 | |
Celgene Corp. (b) | | | 180,582 | | | | 11,573,500 | |
Vertex Pharmaceuticals, Inc. (b) | | | 214,146 | | | | 35,486,134 | |
| | | | | | | | |
| | | | | | | 102,462,164 | |
| | | | | | | | |
|
| Capital Markets—2.2% | |
Goldman Sachs Group, Inc. (The) | | | 134,540 | | | | 22,474,907 | |
S&P Global, Inc. | | | 182,827 | | | | 31,069,620 | |
| | | | | | | | |
| | | | | | | 53,544,527 | |
| | | | | | | | |
|
| Entertainment—4.9% | |
Activision Blizzard, Inc. | | | 546,843 | | | | 25,466,479 | |
Netflix, Inc. (b) | | | 343,846 | | | | 92,033,820 | |
| | | | | | | | |
| | | | | | | 117,500,299 | |
| | | | | | | | |
|
| Equity Real Estate Investment Trusts—1.3% | |
American Tower Corp. | | | 77,191 | | | | 12,210,845 | |
Crown Castle International Corp. | | | 177,448 | | | | 19,276,176 | |
| | | | | | | | |
| | | | | | | 31,487,021 | |
| | | | | | | | |
|
| Food & Staples Retailing—2.1% | |
Costco Wholesale Corp. | | | 247,326 | | | | 50,382,779 | |
| | | | | | | | |
|
| Health Care Equipment & Supplies—1.9% | |
Edwards Lifesciences Corp. (a) (b) | | | 101,724 | | | | 15,581,065 | |
IDEXX Laboratories, Inc. (b) | | | 29,201 | | | | 5,431,970 | |
Intuitive Surgical, Inc. (b) | | | 51,360 | | | | 24,597,331 | |
| | | | | | | | |
| | | | | | | 45,610,366 | |
| | | | | | | | |
|
| Health Care Providers & Services—1.7% | |
UnitedHealth Group, Inc. | | | 160,842 | | | | 40,068,959 | |
| | | | | | | | |
|
| Hotels, Restaurants & Leisure—3.7% | |
Chipotle Mexican Grill, Inc. (a) (b) | | | 40,833 | | | | 17,631,281 | |
Marriott International, Inc. - Class A (a) | | | 354,650 | | | | 38,500,804 | |
McDonald’s Corp. | | | 181,631 | | | | 32,252,217 | |
| | | | | | | | |
| | | | | | | 88,384,302 | |
| | | | | | | | |
|
| Interactive Media & Services—11.1% | |
Alphabet, Inc. - Class A (b) | | | 60,184 | | | | 62,889,873 | |
Alphabet, Inc. - Class C (b) | | | 60,758 | | | | 62,921,592 | |
Facebook, Inc. - Class A (b) | | | 508,920 | | | | 66,714,323 | |
|
| Interactive Media & Services—(Continued) | |
Tencent Holdings, Ltd. | | | 1,952,849 | | | | 77,409,033 | |
| | | | | | | | |
| | | | | | | 269,934,821 | |
| | | | | | | | |
|
| Internet & Direct Marketing Retail—9.8% | |
Alibaba Group Holding, Ltd. (ADR) (a) (b) | | | 544,217 | | | | 74,595,824 | |
Amazon.com, Inc. (b) | | | 93,464 | | | | 140,380,124 | |
Booking Holdings, Inc. (b) | | | 10,997 | | | | 18,941,453 | |
Farfetch, Ltd. - Class A (a) (b) | | | 257,329 | | | | 4,557,297 | |
| | | | | | | | |
| | | | | | | 238,474,698 | |
| | | | | | | | |
|
| IT Services—9.5% | |
MasterCard, Inc. - Class A | | | 510,228 | | | | 96,254,512 | |
PayPal Holdings, Inc. (b) | | | 400,340 | | | | 33,664,591 | |
Square, Inc. - Class A (a) (b) | | | 250,797 | | | | 14,067,204 | |
Visa, Inc. - Class A (a) | | | 658,864 | | | | 86,930,516 | |
| | | | | | | | |
| | | | | | | 230,916,823 | |
| | | | | | | | |
|
| Life Sciences Tools & Services—1.9% | |
Illumina, Inc. (b) | | | 156,200 | | | | 46,849,066 | |
| | | | | | | | |
|
| Oil, Gas & Consumable Fuels—0.5% | |
EOG Resources, Inc. | | | 135,271 | | | | 11,796,984 | |
| | | | | | | | |
|
| Personal Products—1.6% | |
Estee Lauder Cos., Inc. (The) - Class A | | | 291,098 | | | | 37,871,850 | |
| | | | | | | | |
|
| Pharmaceuticals—4.5% | |
AstraZeneca plc (ADR) (a) | | | 1,387,542 | | | | 52,698,845 | |
Bristol-Myers Squibb Co. | | | 477,152 | | | | 24,802,361 | |
Merck & Co., Inc. | | | 418,967 | | | | 32,013,269 | |
| | | | | | | | |
| | | | | | | 109,514,475 | |
| | | | | | | | |
|
| Road & Rail—1.0% | |
Union Pacific Corp. | | | 178,210 | | | | 24,633,968 | |
| | | | | | | | |
|
| Semiconductors & Semiconductor Equipment—2.8% | |
Broadcom, Inc. | | | 131,531 | | | | 33,445,703 | |
NVIDIA Corp. | | | 257,743 | | | | 34,408,690 | |
| | | | | | | | |
| | | | | | | 67,854,393 | |
| | | | | | | | |
|
| Software—17.2% | |
Adobe, Inc. (b) | | | 333,151 | | | | 75,372,082 | |
Microsoft Corp. | | | 1,249,309 | | | | 126,892,315 | |
Red Hat, Inc. (b) | | | 177,734 | | | | 31,217,200 | |
Salesforce.com, Inc. (b) | | | 657,248 | | | | 90,023,259 | |
ServiceNow, Inc. (b) | | | 83,956 | | | | 14,948,366 | |
Splunk, Inc. (a) (b) | | | 290,737 | | | | 30,483,774 | |
Workday, Inc. - Class A (a) (b) | | | 298,040 | | | | 47,591,027 | |
| | | | | | | | |
| | | | | | | 416,528,023 | |
| | | | | | | | |
|
| Specialty Retail—1.7% | |
Home Depot, Inc. (The) | | | 245,561 | | | | 42,192,291 | |
| | | | | | | | |
See accompanying notes to financial statements.
BHFTII-5
Brighthouse Funds Trust II
Jennison Growth Portfolio
Schedule of Investments as of December 31, 2018
Common Stocks—(Continued)
| | | | | | | | |
| Security Description | | Shares/
Principal
Amount* | | | Value | |
|
| Technology Hardware, Storage & Peripherals—4.0% | |
Apple, Inc. | | | 619,104 | | | $ | 97,657,465 | |
| | | | | | | | |
|
| Textiles, Apparel & Luxury Goods—3.3% | |
Kering S.A. | | | 65,362 | | | | 30,590,363 | |
lululemon athletica, Inc. (b) | | | 103,284 | | | | 12,560,367 | |
NIKE, Inc. - Class B | | | 511,133 | | | | 37,895,401 | |
| | | | | | | | |
| | | | | | | 81,046,131 | |
| | | | | | | | |
Total Common Stocks
(Cost $1,634,101,899) | | | | | | | 2,409,826,126 | |
| | | | | | | | |
|
| Short-Term Investment—0.7% | |
|
| Repurchase Agreement—0.7% | |
Fixed Income Clearing Corp.
Repurchase Agreement dated 12/31/18 at 1.200%, due on 01/02/19 with a maturity value of $18,549,675; collateralized by U.S. Treasury Note at 2.875%, maturing 09/30/23, with a market value of $18,921,863. | | | 18,548,438 | | | | 18,548,438 | |
| | | | | | | | |
Total Short-Term Investments
(Cost $18,548,438) | | | | | | | 18,548,438 | |
| | | | | | | | |
|
| Securities Lending Reinvestments (c)—14.1% | |
|
| Certificates of Deposit—7.3% | |
Banco Del Estado De Chile New York
2.720%, 1M LIBOR + 0.250%, 03/20/19 (d) | | | 3,000,000 | | | | 2,999,742 | |
Bank of Montreal (Chicago)
2.710%, 1M LIBOR + 0.330%, 08/06/19 (d) | | | 8,000,000 | | | | 7,999,800 | |
Bank of Nova Scotia
2.890%, SOFR + 0.430%, 05/16/19 (d) | | | 4,000,000 | | | | 3,999,997 | |
3.072%, 3M LIBOR + 0.280%, 03/20/19 (d) | | | 5,000,000 | | | | 5,001,995 | |
Barclays Bank plc
2.500%, 02/01/19 | | | 3,000,000 | | | | 2,999,613 | |
2.547%, 1M LIBOR + 0.200%, 02/04/19 (d) | | | 3,500,000 | | | | 3,499,668 | |
Canadian Imperial Bank of Commerce
2.556%, 3M LIBOR + 0.120%, 01/14/19 (d) | | | 4,000,000 | | | | 3,999,488 | |
2.740%, 1M LIBOR + 0.270%, 07/19/19 (d) | | | 2,000,000 | | | | 1,999,188 | |
China Construction Bank Corp.
2.550%, 01/07/19 | | | 2,000,000 | | | | 2,000,000 | |
Citibank N.A.
2.490%, 02/04/19 | | | 3,000,000 | | | | 2,999,583 | |
Commonwealth Bank of Australia
2.617%, 3M LIBOR + 0.140%, 04/23/19 (d) | | | 2,000,000 | | | | 2,000,006 | |
2.642%, 1M LIBOR + 0.210%, 09/13/19 (d) | | | 4,500,000 | | | | 4,500,000 | |
Cooperative Rabobank UA
2.608%, 3M LIBOR + 0.200%, 04/05/19 (d) | | | 3,000,000 | | | | 3,000,942 | |
Credit Agricole S.A.
2.500%, 02/12/19 | | | 5,000,000 | | | | 4,999,150 | |
Credit Industriel et Commercial
Zero Coupon, 01/25/19 | | | 7,330,169 | | | | 7,412,377 | |
Credit Suisse AG
2.620%, 04/01/19 | | | 8,000,000 | | | | 7,995,856 | |
2.890%, SOFR + 0.430%, 05/02/19 (d) | | | 4,000,000 | | | | 3,999,952 | |
|
| Certificates of Deposit—(Continued) | |
Mitsubishi UFJ Trust and Banking Corp.
Zero Coupon, 01/15/19 | | | 4,962,437 | | | | 4,994,900 | |
MUFG Bank Ltd.
2.649%, 1M LIBOR + 0.300%, 05/01/19 (d) | | | 4,000,000 | | | | 4,000,024 | |
Natixis New York
2.705%, 3M LIBOR + 0.090%, 05/10/19 (d) | | | 3,000,000 | | | | 2,998,110 | |
2.731%, 3M LIBOR + 0.190%, 02/01/19 (d) | | | 2,000,000 | | | | 1,999,552 | |
2.940%, SOFR + 0.480%, 06/12/19 (d) | | | 2,000,000 | | | | 1,999,788 | |
| Royal Bank of Canada New York | |
2.650%, 1M LIBOR + 0.250%, 01/11/19 (d) | | | 4,000,000 | | | | 4,000,032 | |
2.665%, 1M LIBOR + 0.210%, 09/17/19 (d) | | | 6,000,000 | | | | 5,993,862 | |
Skandinaviska Enskilda Banken
2.645%, 1M LIBOR + 0.190%, 04/17/19 (d) | | | 11,000,000 | | | | 10,999,098 | |
Societe Generale
2.719%, 3M LIBOR + 0.160%, 05/07/19 (d) | | | 3,000,000 | | | | 2,998,668 | |
Standard Chartered plc
2.686%, 1M LIBOR + 0.180%, 02/25/19 (d) | | | 10,000,000 | | | | 9,999,710 | |
State Street Bank and Trust
2.725%, 1M LIBOR + 0.270%, 05/15/19 (d) | | | 6,000,000 | | | | 5,999,880 | |
Sumitomo Mitsui Banking Corp.
2.590%, 1M LIBOR + 0.190%, 04/11/19 (d) | | | 7,000,000 | | | | 6,997,431 | |
| Sumitomo Mitsui Banking Corp., New York | |
2.549%, 1M LIBOR + 0.200%, 04/03/19 (d) | | | 2,000,059 | | | | 1,999,408 | |
2.559%, 1M LIBOR + 0.180%, 03/05/19 (d) | | | 4,000,000 | | | | 3,999,052 | |
2.665%, 1M LIBOR + 0.210%, 05/17/19 (d) | | | 7,000,000 | | | | 6,997,060 | |
Sumitomo Mitsui Trust Bank, Ltd.
Zero Coupon, 03/12/19 | | | 6,949,443 | | | | 6,961,990 | |
| Svenska Handelsbanken AB | |
2.620%, 3M LIBOR + 0.100%, 04/30/19 (d) | | | 5,000,000 | | | | 4,999,775 | |
2.767%, 1M LIBOR + 0.380%, 12/10/19 (d) | | | 5,000,000 | | | | 4,999,835 | |
2.822%, 1M LIBOR + 0.300%, 10/31/19 (d) | | | 4,000,000 | | | | 3,999,064 | |
Toronto-Dominion Bank
2.665%, 1M LIBOR + 0.210%, 09/17/19 (d) | | | 3,000,000 | | | | 2,997,144 | |
Westpac Banking Corp.
2.850%, FEDEFF PRV + 0.450%, 02/15/19 (d) | | | 5,000,000 | | | | 4,999,969 | |
| | | | | | | | |
| | | | | | | 176,341,709 | |
| | | | | | | | |
|
| Commercial Paper—2.4% | |
Alpine Securities Ltd.
2.529%, 1M LIBOR + 0.180%, 04/03/19 (d) | | | 5,000,000 | | | | 4,998,615 | |
Banco Santander S.A. | |
2.500%, 01/16/19 | | | 3,974,444 | | | | 3,995,184 | |
2.740%, 02/07/19 | | | 4,964,989 | | | | 4,985,440 | |
Bank of China, Ltd.
2.690%, 01/17/19 | | | 4,966,375 | | | | 4,994,130 | |
ING Funding LLC
2.707%, 1M LIBOR + 0.320%, 02/08/19 (d) | | | 10,000,000 | | | | 10,000,930 | |
Matchpoint Finance plc
2.890%, 05/08/19 | | | 3,941,879 | | | | 3,957,012 | |
Sheffield Receivables Co.
2.930%, SOFR + 0.470%, 05/30/19 (d) | | | 4,000,000 | | | | 3,999,936 | |
Toronto-Dominion Bank
2.729%, 1M LIBOR + 0.350%, 11/05/19 (d) | | | 2,000,000 | | | | 1,999,780 | |
UBS AG
2.779%, 1M LIBOR + 0.430%, 02/01/19 (d) | | | 15,000,000 | | | | 15,003,675 | |
See accompanying notes to financial statements.
BHFTII-6
Brighthouse Funds Trust II
Jennison Growth Portfolio
Schedule of Investments as of December 31, 2018
Securities Lending Reinvestments (c)—(Continued)
| | | | | | | | |
| Security Description | | Principal
Amount* | | | Value | |
|
| Commercial Paper—(Continued) | |
Westpac Banking Corp.
2.784%, 1M LIBOR + 0.280%, 05/24/19 (d) | | | 5,000,000 | | | $ | 4,999,800 | |
| | | | | | | | |
| | | | | | | 58,934,502 | |
| | | | | | | | |
|
| Master Demand Notes—0.2% | |
Natixis Financial Products LLC
2.640%, OBFR + 0.250%, 01/02/19 (d) | | | 4,000,000 | | | | 4,000,000 | |
| | | | | | | | |
|
| Repurchase Agreements—4.0% | |
Citadel Clearing LLC
Repurchase Agreement dated 12/31/18 at 3.000%, due on 04/02/19 with a maturity value of $15,115,000; collateralized by various Common Stock with an aggregate market value of $16,502,750. | | | 15,000,000 | | | | 15,000,000 | |
Citigroup Global Markets, Inc.
Repurchase Agreement dated 12/31/18 at 2.790%, due on 02/04/19 with a maturity value of $6,016,275; collateralized by U.S. Treasury Obligations at 0.000%, maturing 02/12/19, and various Common Stock with an aggregate market value of $6,529,912. | | | 6,000,000 | | | | 6,000,000 | |
Citigroup Global Markets, Ltd.
Repurchase Agreement dated 12/31/18 at 2.490%, due on 01/02/19 with a maturity value of $34,082; collateralized by U.S. Treasury Obligations with rates ranging from 0.375% - 1.875%, maturity dates ranging from 12/15/20 - 01/15/27, and an aggregate market value of $34,759. | | | 34,077 | | | | 34,077 | |
Repurchase Agreement dated 12/31/18 at 2.490%, due on 01/02/19 with a maturity value of $51,305; collateralized by U.S. Treasury Obligations with rates ranging from 1.625% - 2.875%, maturity dates ranging from 06/30/20 - 11/15/46, and an aggregate market value of $52,324. | | | 51,298 | | | | 51,298 | |
Deutsche Bank AG, London
Repurchase Agreement dated 12/31/18 at 2.750%, due on 01/02/19 with a maturity value of $25,902; collateralized by U.S. Treasury and Foreign Obligations with rates ranging from 1.000% - 2.590%, maturity dates ranging from 03/31/19 - 12/29/26, and an aggregate market value of $26,416. | | | 25,898 | | | | 25,898 | |
Deutsche Bank Securities, Inc.
Repurchase Agreement dated 12/31/18 at 3.200%, due on 01/02/19 with a maturity value of $1,802,203; collateralized by U.S. Treasury Obligations at 0.000%, maturity dates ranging from 08/15/30 - 08/15/39, and an aggregate market value of $1,837,921. | | | 1,801,883 | | | | 1,801,883 | |
Merrill Lynch, Pierce, Fenner & Smith, Inc.
Repurchase Agreement dated 12/31/18 at 2.940%, due on 04/02/19 with a maturity value of $4,533,810; collateralized by various Common Stock with an aggregate market value of $4,950,000. | | | 4,500,000 | | | | 4,500,000 | |
Repurchase Agreement dated 12/31/18 at 2.940%, due on 04/02/19 with a maturity value of $8,563,863; collateralized by various Common Stock with an aggregate market value of $9,350,000. | | | 8,500,000 | | | | 8,500,000 | |
|
| Repurchase Agreements—(Continued) | |
NBC Global Finance, Ltd.
Repurchase Agreement dated 12/31/18 at 2.560%, due on 01/02/19 with a maturity value of $10,001,422; collateralized by various Common Stock with an aggregate market value of $11,132,123. | | | 10,000,000 | | | | 10,000,000 | |
Repurchase Agreement dated 12/31/18 at 2.590%, due on 01/07/19 with a maturity value of $15,007,554; collateralized by various Common Stock with an aggregate market value of $16,699,828. | | | 15,000,000 | | | | 15,000,000 | |
| Societe Generale | |
Repurchase Agreement dated 12/31/18 at 2.530%, due on 01/02/19 with a maturity value of $20,002,811; collateralized by U.S. Treasury Obligations with rates ranging from 0.750% - 8.000%, maturity dates ranging from 09/30/19 - 08/15/46, and various Common Stock with an aggregate market value of $21,909,518. | | | 20,000,000 | | | | 20,000,000 | |
Repurchase Agreement dated 12/31/18 at 2.560%, due on 01/07/19 with a maturity value of $5,002,489; collateralized by U.S. Treasury Obligations with rates ranging from 0.750% - 8.000%, maturity dates ranging from 09/30/19 - 08/15/46, and various Common Stock with an aggregate market value of $5,477,379. | | | 5,000,000 | | | | 5,000,000 | |
Repurchase Agreement dated 12/31/18 at 2.560%, due on 01/07/19 with a maturity value of $11,105,525; collateralized by U.S. Treasury Obligations with rates ranging from 0.750% - 8.000%, maturity dates ranging from 09/30/19 - 08/15/46, and various Common Stock with an aggregate market value of $12,159,782. | | | 11,100,000 | | | | 11,100,000 | |
| | | | | | | | |
| | | | | | | 97,013,156 | |
| | | | | | | | |
|
| Time Deposit—0.2% | |
Royal Bank of Canada
2.420%, 01/02/19 | | | 5,000,000 | | | | 5,000,000 | |
| | | | | | | | |
Total Securities Lending Reinvestments
(Cost $341,319,387) | | | | | | | 341,289,367 | |
| | | | | | | | |
Total Investment—114.1%
(Cost $1,993,969,724) | | | | | | | 2,769,663,931 | |
Other assets and liabilities
(net)—(14.1)% | | | | | | | (342,985,184 | ) |
| | | | | | | | |
| Net Assets—100.0% | | | | | | $ | 2,426,678,747 | |
| | | | | | | | |
| | | | |
| * | | Principal amount stated in U.S. dollars unless otherwise noted. |
| (a) | | All or a portion of the security was held on loan. As of December 31, 2018, the market value of securities loaned was $340,582,384 and the collateral received consisted of cash in the amount of $341,102,951 andnon-cash collateral with a value of $6,327,791. The cash collateral investments are disclosed in the Schedule of Investments and categorized as Securities Lending Reinvestments. Thenon-cash collateral received consists of U.S. government securities that are held in safe- keeping by the lending agent, or a third-party custodian, cannot be sold or repledged by the Portfolio. As such, this collateral is excluded from the Statement of Assets and Liabilities. |
| (b) | | Non-income producing security. |
| (c) | | Represents investment of cash collateral received from securities on loan as of December 31, 2018. |
See accompanying notes to financial statements.
BHFTII-7
Brighthouse Funds Trust II
Jennison Growth Portfolio
Schedule of Investments as of December 31, 2018
| | | | |
| (d) | | Variable or floating rate security. The stated rate represents the rate at December 31, 2018. Maturity date shown for callable securities reflects the earliest possible call date. For securities based on a published reference index and spread, the index and spread are indicated in the description above. For certain variable rate securities, the coupon rate is determined by the issuer/agent based on current market conditions. For certain asset- and mortgage-backed securities, the coupon rate may fluctuate based on changes of the underlying collateral or prepayments of principal. These securities do not indicate a reference index and spread in their description above. |
| (ADR)— | | American Depositary Receipt |
| (FEDEFF PRV)— | | Effective Federal Funds Rate |
| (LIBOR)— | | London Interbank Offered Rate |
| (OBFR)— | | U.S. Overnight Bank Funding Rate |
| (SOFR)— | | Secured Overnight Financing Rate |
Fair Value Hierarchy
Accounting principles generally accepted in the United States of America (“GAAP”) define fair market value as the price that the Portfolio would receive to sell an asset or pay to transfer a liability in an orderly transaction between market participants at the measurement date. It establishes a fair value hierarchy that prioritizes inputs to valuation methods and requires disclosure of the fair value hierarchy, separately for each major category of assets and liabilities, that segregates fair value measurements into three levels. Levels 1, 2 and 3 of the fair value hierarchy are defined as follows:
Level 1 - unadjusted quoted prices in active markets for identical investments
Level 2 - other significant observable inputs (including, but not limited to, quoted prices for similar assets or liabilities in markets that are either active or inactive; inputs other than quoted prices that are observable such as interest rates, yield curves, volatilities, prepayment speeds, loss severities, credit risks, default rates, or other market corroborated inputs)
Level 3 - significant unobservable inputs based on the best information available in the circumstances, to the extent observable inputs are unavailable (including the Portfolio’s own assumptions used in determining the fair value of investments and derivative financial instruments)
The inputs or methodologies used for valuing investments are not necessarily an indication of the risk associated with investing in them. Changes to the inputs or methodologies used may result in transfers between levels. A reconciliation of Level 3 securities, if any, will be disclosed following the fair value hierarchy table. For more information about the Portfolio’s policy regarding the valuation of investments, please refer to the Notes to Financial Statements.
The following table summarizes the fair value hierarchy of the Portfolio’s investments as of December 31, 2018:
| | | | | | | | | | | | | | | | |
| Description | | Level 1 | | | Level 2 | | | Level 3 | | | Total | |
| Common Stocks | |
Aerospace & Defense | | $ | 74,286,262 | | | $ | 25,482,194 | | | $ | — | | | $ | 99,768,456 | |
Automobiles | | | 65,723,674 | | | | — | | | | — | | | | 65,723,674 | |
Banks | | | 39,622,591 | | | | — | | | | — | | | | 39,622,591 | |
Biotechnology | | | 102,462,164 | | | | — | | | | — | | | | 102,462,164 | |
Capital Markets | | | 53,544,527 | | | | — | | | | — | | | | 53,544,527 | |
Entertainment | | | 117,500,299 | | | | — | | | | — | | | | 117,500,299 | |
Equity Real Estate Investment Trusts | | | 31,487,021 | | | | — | | | | — | | | | 31,487,021 | |
Food & Staples Retailing | | | 50,382,779 | | | | — | | | | — | | | | 50,382,779 | |
Health Care Equipment & Supplies | | | 45,610,366 | | | | — | | | | — | | | | 45,610,366 | |
Health Care Providers & Services | | | 40,068,959 | | | | — | | | | — | | | | 40,068,959 | |
Hotels, Restaurants & Leisure | | | 88,384,302 | | | | — | | | | — | | | | 88,384,302 | |
Interactive Media & Services | | | 192,525,788 | | | | 77,409,033 | | | | — | | | | 269,934,821 | |
Internet & Direct Marketing Retail | | | 238,474,698 | | | | — | | | | — | | | | 238,474,698 | |
IT Services | | | 230,916,823 | | | | — | | | | — | | | | 230,916,823 | |
Life Sciences Tools & Services | | | 46,849,066 | | | | — | | | | — | | | | 46,849,066 | |
Oil, Gas & Consumable Fuels | | | 11,796,984 | | | | — | | | | — | | | | 11,796,984 | |
Personal Products | | | 37,871,850 | | | | — | | | | — | | | | 37,871,850 | |
Pharmaceuticals | | | 109,514,475 | | | | — | | | | — | | | | 109,514,475 | |
Road & Rail | | | 24,633,968 | | | | — | | | | — | | | | 24,633,968 | |
Semiconductors & Semiconductor Equipment | | | 67,854,393 | | | | — | | | | — | | | | 67,854,393 | |
Software | | | 416,528,023 | | | | — | | | | — | | | | 416,528,023 | |
Specialty Retail | | | 42,192,291 | | | | — | | | | — | | | | 42,192,291 | |
Technology Hardware, Storage & Peripherals | | | 97,657,465 | | | | — | | | | — | | | | 97,657,465 | |
Textiles, Apparel & Luxury Goods | | | 50,455,768 | | | | 30,590,363 | | | | — | | | | 81,046,131 | |
Total Common Stocks | | | 2,276,344,536 | | | | 133,481,590 | | | | — | | | | 2,409,826,126 | |
Total Short-Term Investment* | | | — | | | | 18,548,438 | | | | — | | | | 18,548,438 | |
Total Securities Lending Reinvestments* | | | — | | | | 341,289,367 | | | | — | | | | 341,289,367 | |
Total Investments | | $ | 2,276,344,536 | | | $ | 493,319,395 | | | $ | — | | | $ | 2,769,663,931 | |
| | | | | | | | | | | | | | | | | |
Collateral for Securities Loaned (Liability) | | $ | — | | | $ | (341,102,951 | ) | | $ | — | | | $ | (341,102,951 | ) |
| | | | |
| * | | See Schedule of Investments for additional detailed categorizations. |
See accompanying notes to financial statements.
BHFTII-8
Brighthouse Funds Trust II
Jennison Growth Portfolio
Statement of Assets and Liabilities
December 31, 2018
| | | | |
Assets | |
Investments at value (a) (b) | | $ | 2,769,663,931 | |
Receivable for: | |
Fund shares sold | | | 213,302 | |
Dividends and interest | | | 343,193 | |
Prepaid expenses | | | 7,712 | |
| | | | |
Total Assets | | | 2,770,228,138 | |
Liabilities | |
Collateral for securities loaned | | | 341,102,951 | |
Payables for: | |
Fund shares redeemed | | | 737,471 | |
Accrued Expenses: | |
Management fees | | | 1,104,037 | |
Distribution and service fees | | | 172,677 | |
Deferred trustees’ fees | | | 160,655 | |
Other expenses | | | 271,600 | |
| | | | |
Total Liabilities | | | 343,549,391 | |
| | | | |
Net Assets | | $ | 2,426,678,747 | |
| | | | |
Net Assets Consist of: | |
Paid in surplus | | $ | 1,248,467,796 | |
Distributable earnings (Accumulated losses) | | | 1,178,210,951 | |
| | | | |
Net Assets | | $ | 2,426,678,747 | |
| | | | |
Net Assets | |
Class A | | $ | 1,625,636,810 | |
Class B | | | 788,698,423 | |
Class E | | | 12,343,514 | |
Capital Shares Outstanding* | |
Class A | | | 112,083,891 | |
Class B | | | 55,367,900 | |
Class E | | | 857,581 | |
Net Asset Value, Offering Price and Redemption Price Per Share | |
Class A | | $ | 14.50 | |
Class B | | | 14.24 | |
Class E | | | 14.39 | |
| | | | |
| * | | The Portfolio is authorized to issue an unlimited number of shares. |
| (a) | | Identified cost of investments was $1,993,969,724. |
| (b) | | Includes securities loaned at value of $340,582,384. |
Statement of Operations
Year Ended December 31, 2018
| | | | |
Investment Income | |
Dividends (a) | | $ | 21,704,004 | |
Non-cash dividends | | | 3,865,685 | |
Interest | | | 52,315 | |
Securities lending income | | | 2,048,647 | |
| | | | |
Total investment income | | | 27,670,651 | |
Expenses | |
Management fees | | | 16,980,818 | |
Administration fees | | | 98,395 | |
Custodian and accounting fees | | | 172,281 | |
Distribution and service fees—Class B | | | 2,261,031 | |
Distribution and service fees—Class E | | | 21,527 | |
Audit and tax services | | | 44,662 | |
Legal | | | 45,316 | |
Trustees’ fees and expenses | | | 33,732 | |
Shareholder reporting | | | 132,532 | |
Insurance | | | 18,319 | |
Miscellaneous | | | 57,937 | |
| | | | |
Total expenses | | | 19,866,550 | |
Less management fee waiver | | | (2,273,574 | ) |
Less broker commission recapture | | | (69,611 | ) |
| | | | |
Net expenses | | | 17,523,365 | |
| | | | |
Net Investment Income | | | 10,147,286 | |
| | | | |
Net Realized and Unrealized Gain (Loss) | |
| Net realized gain on: | |
Investments | | | 395,734,574 | |
Foreign currency transactions | | | 26,039 | |
| | | | |
Net realized gain | | | 395,760,613 | |
| | | | |
| Net change in unrealized depreciation on: | |
Investments | | | (347,677,137 | ) |
Foreign currency transactions | | | (4,945 | ) |
| | | | |
Net change in unrealized depreciation | | | (347,682,082 | ) |
| | | | |
Net realized and unrealized gain | | | 48,078,531 | |
| | | | |
Net Increase in Net Assets From Operations | | $ | 58,225,817 | |
| | | | |
| | | | |
| (a) | | Net of foreign withholding taxes of $691,933. |
See accompanying notes to financial statements.
BHFTII-9
Brighthouse Funds Trust II
Jennison Growth Portfolio
Statements of Changes in Net Assets
| | | | | | | | |
| | | Year Ended
December 31,
2018 | | | Year Ended
December 31,
2017 | |
Increase (Decrease) in Net Assets: | |
From Operations | |
Net investment income | | $ | 10,147,286 | | | $ | 7,969,834 | |
Net realized gain | | | 395,760,613 | | | | 413,530,795 | |
Net change in unrealized appreciation (depreciation) | | | (347,682,082 | ) | | | 456,476,709 | |
| | | | | | | | |
Increase in net assets from operations | | | 58,225,817 | | | | 877,977,338 | |
| | | | | | | | |
From Distributions to Shareholders (a) | |
Class A | | | (285,901,316 | ) | | | (141,964,854 | ) |
Class B | | | (135,875,410 | ) | | | (61,476,425 | ) |
Class E | | | (2,173,787 | ) | | | (893,829 | ) |
| | | | | | | | |
Total distributions | | | (423,950,513 | ) | | | (204,335,108 | ) |
| | | | | | | | |
Decrease in net assets from capital share transactions | | | (94,200,687 | ) | | | (360,449,847 | ) |
| | | | | | | | |
Total increase (decrease) in net assets | | | (459,925,383 | ) | | | 313,192,383 | |
|
Net Assets | |
Beginning of period | | | 2,886,604,130 | | | | 2,573,411,747 | |
| | | | | | | | |
End of period | | $ | 2,426,678,747 | | | $ | 2,886,604,130 | (b) |
| | | | | | | | |
Other Information:
Capital Shares
Transactions in capital shares were as follows:
| | | | | | | | | | | | | | | | |
| | | Year Ended
December 31, 2018 | | | Year Ended
December 31, 2017 | |
| | | Shares | | | Value | | | Shares | | | Value | |
Class A | |
Sales | | | 3,754,595 | | | $ | 63,688,868 | | | | 2,471,333 | | | $ | 38,184,136 | |
Reinvestments | | | 17,099,361 | | | | 285,901,316 | | | | 9,730,285 | | | | 141,964,854 | |
Redemptions | | | (26,652,343 | ) | | | (471,395,522 | ) | | | (29,136,036 | ) | | | (446,966,658 | ) |
| | | | | | | | | | | | | | | | |
Net decrease | | | (5,798,387 | ) | | $ | (121,805,338 | ) | | | (16,934,418 | ) | | $ | (266,817,668 | ) |
| | | | | | | | | | | | | | | | |
Class B | |
Sales | | | 4,409,354 | | | $ | 72,845,490 | | | | 2,193,395 | | | $ | 33,511,604 | |
Reinvestments | | | 8,264,927 | | | | 135,875,410 | | | | 4,272,163 | | | | 61,476,425 | |
Redemptions | | | (10,768,477 | ) | | | (181,998,176 | ) | | | (12,435,218 | ) | | | (188,357,013 | ) |
| | | | | | | | | | | | | | | | |
Net increase (decrease) | | | 1,905,804 | | | $ | 26,722,724 | | | | (5,969,660 | ) | | $ | (93,368,984 | ) |
| | | | | | | | | | | | | | | | |
Class E | |
Sales | | | 238,032 | | | $ | 4,078,585 | | | | 99,379 | | | $ | 1,518,729 | |
Reinvestments | | | 130,951 | | | | 2,173,787 | | | | 61,601 | | | | 893,829 | |
Redemptions | | | (320,539 | ) | | | (5,370,445 | ) | | | (175,341 | ) | | | (2,675,753 | ) |
| | | | | | | | | | | | | | | | |
Net increase (decrease) | | | 48,444 | | | $ | 881,927 | | | | (14,361 | ) | | $ | (263,195 | ) |
| | | | | | | | | | | | | | | | |
Decrease derived from capital shares transactions | | | | | | $ | (94,200,687 | ) | | | | | | $ | (360,449,847 | ) |
| | | | | | | | | | | | | | | | |
| | | | |
| (a) | | Distributions from net investment income and realized gains are no longer required to be separately disclosed. The presentation for the year ended December 31, 2018 has been adjusted for this change (See Note 8). At December 31, 2017 the distributions were as follows. |
| | | | | | | | |
| | | Distributions from net
investment income: | | | Distributions from realized
capital gains: | |
Class A | | $ | (6,092,912 | ) | | $ | (135,871,942 | ) |
Class B | | | (708,505 | ) | | | (60,767,920 | ) |
Class E | | | (21,896 | ) | | | (871,933 | ) |
| | | | |
| (b) | | As part of the update in (a), it is also no longer required to disclose the Undistributed net investment income (Accumulated losses) which was $7,321,723 as of December 31, 2017. |
See accompanying notes to financial statements.
BHFTII-10
Brighthouse Funds Trust II
Jennison Growth Portfolio
Financial Highlights
| | | | | | | | | | | | | | | | | | | | |
| Selected per share data | |
| | | Class A | |
| | | Year Ended December 31, | |
| | | 2018 | | | 2017 | | | 2016 | | | 2015 | | | 2014 | |
Net Asset Value, Beginning of Period | | $ | 16.85 | | | $ | 13.25 | | | $ | 15.30 | | | $ | 16.23 | | | $ | 15.82 | |
| | | | | | | | | | | | | | | | | | | | |
Income (Loss) from Investment Operations | |
Net investment income (a) | | | 0.07 | | | | 0.06 | | | | 0.05 | | | | 0.04 | | | | 0.04 | |
Net realized and unrealized gain (loss) | | | 0.35 | | | | 4.71 | | | | (0.16 | ) | | | 1.67 | | | | 1.26 | |
| | | | | | | | | | | | | | | | | | | | |
Total income (loss) from investment operations | | | 0.42 | | | | 4.77 | | | | (0.11 | ) | | | 1.71 | | | | 1.30 | |
| | | | | | | | | | | | | | | | | | | | |
Less Distributions | |
Distributions from net investment income | | | (0.06 | ) | | | (0.05 | ) | | | (0.04 | ) | | | (0.05 | ) | | | (0.04 | ) |
Distributions from net realized capital gains | | | (2.71 | ) | | | (1.12 | ) | | | (1.90 | ) | | | (2.59 | ) | | | (0.85 | ) |
| | | | | | | | | | | | | | | | | | | | |
Total distributions | | | (2.77 | ) | | | (1.17 | ) | | | (1.94 | ) | | | (2.64 | ) | | | (0.89 | ) |
| | | | | | | | | | | | | | | | | | | | |
Net Asset Value, End of Period | | $ | 14.50 | | | $ | 16.85 | | | $ | 13.25 | | | $ | 15.30 | | | $ | 16.23 | |
| | | | | | | | | | | | | | | | | | | | |
Total Return (%) (b) | | | 0.35 | | | | 37.32 | | | | 0.17 | | | | 10.78 | | | | 9.06 | |
|
Ratios/Supplemental Data | |
Gross ratio of expenses to average net assets (%) | | | 0.62 | | | | 0.62 | | | | 0.62 | | | | 0.62 | | | | 0.62 | |
Net ratio of expenses to average net assets (%) (c) | | | 0.54 | | | | 0.54 | | | | 0.55 | | | | 0.54 | | | | 0.54 | |
Ratio of net investment income to average net assets (%) | | | 0.44 | | | | 0.36 | | | | 0.35 | | | | 0.27 | | | | 0.26 | |
Portfolio turnover rate (%) | | | 26 | | | | 35 | | | | 25 | | | | 28 | | | | 25 | |
Net assets, end of period (in millions) | | $ | 1,625.6 | | | $ | 1,986.1 | | | $ | 1,786.2 | | | $ | 1,897.1 | | | $ | 2,047.5 | |
| |
| | | Class B | |
| | | Year Ended December 31, | |
| | | 2018 | | | 2017 | | | 2016 | | | 2015 | | | 2014 | |
Net Asset Value, Beginning of Period | | $ | 16.59 | | | $ | 13.06 | | | $ | 15.11 | | | $ | 16.05 | | | $ | 15.66 | |
| | | | | | | | | | | | | | | | | | | | |
Income (Loss) from Investment Operations | |
Net investment income (a) | | | 0.03 | | | | 0.02 | | | | 0.01 | | | | 0.00 | (d) | | | 0.00 | (d) |
Net realized and unrealized gain (loss) | | | 0.35 | | | | 4.64 | | | | (0.16 | ) | | | 1.65 | | | | 1.25 | |
| | | | | | | | | | | | | | | | | | | | |
Total income (loss) from investment operations | | | 0.38 | | | | 4.66 | | | | (0.15 | ) | | | 1.65 | | | | 1.25 | |
| | | | | | | | | | | | | | | | | | | | |
Less Distributions | |
Distributions from net investment income | | | (0.02 | ) | | | (0.01 | ) | | | (0.00 | )(e) | | | (0.00 | )(e) | | | (0.01 | ) |
Distributions from net realized capital gains | | | (2.71 | ) | | | (1.12 | ) | | | (1.90 | ) | | | (2.59 | ) | | | (0.85 | ) |
| | | | | | | | | | | | | | | | | | | | |
Total distributions | | | (2.73 | ) | | | (1.13 | ) | | | (1.90 | ) | | | (2.59 | ) | | | (0.86 | ) |
| | | | | | | | | | | | | | | | | | | | |
Net Asset Value, End of Period | | $ | 14.24 | | | $ | 16.59 | | | $ | 13.06 | | | $ | 15.11 | | | $ | 16.05 | |
| | | | | | | | | | | | | | | | | | | | |
Total Return (%) (b) | | | 0.11 | | | | 36.99 | | | | (0.13 | ) | | | 10.54 | | | | 8.74 | |
|
Ratios/Supplemental Data | |
Gross ratio of expenses to average net assets (%) | | | 0.87 | | | | 0.87 | | | | 0.87 | | | | 0.87 | | | | 0.87 | |
Net ratio of expenses to average net assets (%) (c) | | | 0.79 | | | | 0.79 | | | | 0.80 | | | | 0.79 | | | | 0.79 | |
Ratio of net investment income to average net assets (%) | | | 0.19 | | | | 0.11 | | | | 0.10 | | | | 0.02 | | | | 0.01 | |
Portfolio turnover rate (%) | | | 26 | | | | 35 | | | | 25 | | | | 28 | | | | 25 | |
Net assets, end of period (in millions) | | $ | 788.7 | | | $ | 887.0 | | | $ | 776.3 | | | $ | 867.6 | | | $ | 907.1 | |
Please see following page for Financial Highlights footnote legend.
See accompanying notes to financial statements.
BHFTII-11
Brighthouse Funds Trust II
Jennison Growth Portfolio
Financial Highlights
| | | | | | | | | | | | | | | | | | | | |
| Selected per share data | |
| | | Class E | |
| | | Year Ended December 31, | |
| | | 2018 | | | 2017 | | | 2016 | | | 2015 | | | 2014 | |
Net Asset Value, Beginning of Period | | $ | 16.74 | | | $ | 13.17 | | | $ | 15.22 | | | $ | 16.15 | | | $ | 15.75 | |
| | | | | | | | | | | | | | | | | | | | |
Income (Loss) from Investment Operations | |
Net investment income (a) | | | 0.05 | | | | 0.03 | | | | 0.03 | | | | 0.02 | | | | 0.02 | |
Net realized and unrealized gain (loss) | | | 0.35 | | | | 4.69 | | | | (0.16 | ) | | | 1.66 | | | | 1.25 | |
| | | | | | | | | | | | | | | | | | | | |
Total income (loss) from investment operations | | | 0.40 | | | | 4.72 | | | | (0.13 | ) | | | 1.68 | | | | 1.27 | |
| | | | | | | | | | | | | | | | | | | | |
Less Distributions | |
Distributions from net investment income | | | (0.04 | ) | | | (0.03 | ) | | | (0.02 | ) | | | (0.02 | ) | | | (0.02 | ) |
Distributions from net realized capital gains | | | (2.71 | ) | | | (1.12 | ) | | | (1.90 | ) | | | (2.59 | ) | | | (0.85 | ) |
| | | | | | | | | | | | | | | | | | | | |
Total distributions | | | (2.75 | ) | | | (1.15 | ) | | | (1.92 | ) | | | (2.61 | ) | | | (0.87 | ) |
| | | | | | | | | | | | | | | | | | | | |
Net Asset Value, End of Period | | $ | 14.39 | | | $ | 16.74 | | | $ | 13.17 | | | $ | 15.22 | | | $ | 16.15 | |
| | | | | | | | | | | | | | | | | | | | |
Total Return (%) (b) | | | 0.22 | | | | 37.12 | | | | (0.01 | ) | | | 10.66 | | | | 8.86 | |
|
Ratios/Supplemental Data | |
Gross ratio of expenses to average net assets (%) | | | 0.77 | | | | 0.77 | | | | 0.77 | | | | 0.77 | | | | 0.77 | |
Net ratio of expenses to average net assets (%) (c) | | | 0.69 | | | | 0.69 | | | | 0.70 | | | | 0.69 | | | | 0.69 | |
Ratio of net investment income to average net assets (%) | | | 0.28 | | | | 0.21 | | | | 0.20 | | | | 0.12 | | | | 0.11 | |
Portfolio turnover rate (%) | | | 26 | | | | 35 | | | | 25 | | | | 28 | | | | 25 | |
Net assets, end of period (in millions) | | $ | 12.3 | | | $ | 13.5 | | | $ | 10.8 | | | $ | 12.6 | | | $ | 12.0 | |
| | | | |
| (a) | | Per share amounts based on average shares outstanding during the period. |
| (b) | | Total return does not reflect any insurance, sales, separate account or administrative charges of variable annuity or life insurance contracts or any additional expenses that contract owners may bear under their variable contracts. If these charges were included, the returns would be lower. |
| (c) | | Includes the effects of management fee waivers (see Note 5 of the Notes to Financial Statements). |
| (d) | | Net investment income (loss) was less than $0.01. |
| (e) | | Distributions from net investment income were less than $0.01. |
See accompanying notes to financial statements.
BHFTII-12
Brighthouse Funds Trust II
Jennison Growth Portfolio
Notes to Financial Statements—December 31, 2018
1. Organization
Brighthouse Funds Trust II (the “Trust”) is organized as a Delaware statutory trust and registered under the Investment Company Act of 1940, as amended (the “1940 Act”), as anopen-end management investment company. The Trust, which is managed by Brighthouse Investment Advisers, LLC (“Brighthouse Investment Advisers” or the “Adviser”), currently offers twenty-nine series, each of which operates as a distinct investment vehicle of the Trust. The series included in this report is Jennison Growth Portfolio (the “Portfolio”), which is diversified. Shares in the Portfolio are not offered directly to the general public and are currently available only to separate accounts established by life insurance companies affiliated with the Adviser and Metropolitan Life Insurance Company (the “Insurance Companies”).
The Portfolio has registered and offers three classes of shares: Class A, B and E shares. Shares of each Class of the Portfolio represent an equal pro rata interest in the Portfolio and generally give the shareholder the same voting, dividend, liquidation, and other rights. Investment income, realized and unrealized capital gains and losses, the common expenses of the Portfolio, and certain Portfolio-level expense reductions, if any, are allocated on a pro rata basis to each Class based on the relative net assets of each Class to the net assets of the Portfolio. Each Class of shares differs in its respective distribution plan and such distribution expenses are allocated to the corresponding Class of shares.
2. Significant Accounting Policies
The preparation of financial statements in conformity with accounting principles generally accepted in the United States of America (“GAAP”) requires management to make estimates and assumptions that affect the reported amounts of assets and liabilities and disclosure of contingent assets and liabilities as of the date of the financial statements and the reported amounts of income and expenses during the reporting period. Actual results could differ from those estimates. In the preparation of these financial statements, management has evaluated events and transactions subsequent to December 31, 2018 through the date the financial statements were issued.
The Portfolio is an investment company and follows the accounting and reporting guidance of the Financial Accounting Standards Board (“FASB”) Accounting Standards Codification Topic 946—Financial Services—Investment Companies. The following is a summary of significant accounting policies consistently followed by the Portfolio in the preparation of its financial statements.
Investment Valuation and Fair Value Measurements - The Portfolio values its portfolio investments for purposes of calculating its net asset value (“NAV”) using procedures approved by the Board of Trustees of the Trust (the “Board” or “Trustees”). Those procedures allow for a variety of methodologies to be used to value the Portfolio’s investments. The specific methodologies used for a particular investment may vary based on the market data available for a specific investment at the time the Portfolio calculates its NAV or based on other considerations. The procedures also permit a level of judgment to be used in the valuation process. The Portfolio follows the accounting and reporting guidance of FASB Accounting Standards Codification Topic 820—Fair Value Measurement.
Domestic and foreign equity securities, such as common stock, exchange-traded funds, rights, warrants, and preferred stock, that are traded on a securities exchange on a valuation date are generally valued at their last quoted sale price or official closing price on the primary exchange for such security, or, if no sales occurred on that day, at the last reported bid price. Equity securities tradedover-the-counter (“OTC”) are generally valued at the last reported bid price. In the event of a major exchange closing during the trading day, the Adviser may use other market information obtained from quotation reporting systems, established market makers, or pricing services in valuing the securities. Valuation adjustments may be applied to certain foreign equity securities that are traded solely on foreign exchanges that close before the time as of which the Portfolio determines its NAV to account for the market movement between the close of the foreign exchanges and the time as of which the Portfolio determines its NAV. The Portfolio may use a systematic fair valuation model provided by a pricing service to value securities principally traded in these foreign markets in order to adjust for possible market movements or other changes that may occur between the close of the foreign exchanges and the time as of which the Portfolio determines its NAV. Foreign equity securities valued using these valuation adjustments are generally categorized as Level 2 within the fair value hierarchy. Equity securities that are actively traded, and have no valuation adjustments applied, are categorized as Level 1 within the fair value hierarchy. Other equity securities traded on inactive markets, or valued in reference to similar instruments traded on active markets, are generally categorized as Level 2 within the fair value hierarchy.
Investments in registeredopen-end management investment companies are valued at reported NAV per share on the valuation date and are categorized as Level 1 within the fair value hierarchy.
Debt securities, including corporate, convertible and municipal bonds and notes; obligations of the U.S. Treasury and U.S. government agencies; foreign sovereign issues; andnon-U.S. bonds, are generally valued on the basis of evaluated or composite bid quotations obtained from independent pricing services and/or brokers and dealers selected by the Adviser (each a “pricing service”), pursuant to the authorization of and subject to general oversight by the Board. Such pricing services may use matrix pricing, which considers observable inputs including, among other things, issuer details, maturity dates, interest rates, yield curves, rates of prepayment, credit risks/spreads, default rates, reported trades, broker-dealer quotes and quoted prices for similar assets. Short-term obligations with a
BHFTII-13
Brighthouse Funds Trust II
Jennison Growth Portfolio
Notes to Financial Statements—December 31, 2018—(Continued)
remaining maturity of sixty days or less may be valued at amortized cost in the absence of market quotes, so long as the amortized cost value of such short-term debt instrument is approximately the same as the fair value of the instrument as determined without the use of amortized cost valuation. Floating rate loans are generally valued on the basis of an evaluated or composite average of aggregate bid and ask quotations supplied by brokers or dealers, as obtained from the pricing service. Securities that use similar valuation techniques and inputs as described above are generally categorized as Level 2 within the fair value hierarchy.
Options, whether on securities, indices, futures contracts, or otherwise, traded on exchanges are valued at the last sale price available as of the close of business on a valuation day or, if there is no such price available, at the last reported bid price. These types of options are categorized as Level 1 within the fair value hierarchy. Futures contracts that are traded on commodity exchanges are valued at their settlement prices established by the exchanges on which they are traded as of the close of such exchanges and are categorized as Level 1 within the fair value hierarchy.
If no current market value quotation or other observable inputs are readily available or market value quotations are deemed to be unreliable for an investment, the fair value of the investment will be determined in accordance with procedures approved by, and under the general supervision of, the Board. In such a circumstance, the Board will be assisted in its responsibility to determine the fair value of an investment by the Valuation Committee (“Committee”) of Brighthouse Investment Advisers. The Committee provides general pricing oversight and fair value pricing determinations related to portfolio securities and meets on a regular basis to review reports relating to the valuation of the securities in the Portfolio. The Board has delegated to State Street Bank and Trust Company, the Trust’s custodian (“Custodian”), the responsibility for calculating the NAVs of the Trust’s Portfolios. The Committee is responsible for overseeing the calculation of the NAVs of the Portfolios by the custodian. The Committee also periodically reviews pricing services, including the pricing services providing fair value pricing for the Portfolio’s foreign securities, and is responsible for overseeing the correction of pricing errors and addressing other pricing issues that arise in the ordinary course of business, such as making real-time fair value determinations, as necessary.
No single standard for determining the fair value of an investment can be set forth because fair value depends upon the facts and circumstances with respect to each investment. Information relating to any relevant factors may be obtained by the Committee from any appropriate source, including the subadviser of the Portfolio, the custodian, a pricing service, market maker and/or broker for such security or the issuer. Appropriate methodologies for determining fair value under particular circumstances may include: matrix pricing, a discounted cash flow analysis, comparisons of securities with comparable characteristics, value based on multiples of earnings, discount from market price of similar marketable securities, or a combination of these and other methods.
Investment Transactions and Related Investment Income - Portfolio security transactions are recorded on the trade date. Dividend income is recorded on theex-dividend date or, for certain foreign securities, when notified. Interest income, which includes amortization of premium and accretion of discount on debt securities, is recorded on the accrual basis. Realized gains and losses on investments are determined on the identified cost basis, which is the same basis used for federal income tax purposes. Foreign income and foreign capital gains on some foreign securities may be subject to foreign taxes, which are accrued as applicable. These foreign taxes have been provided for in accordance with the Portfolio’s understanding of the applicable countries’ tax rules and rates.
Foreign Currency Translation -The books and records of the Portfolio are maintained in U.S. dollars. The values of securities, currencies, and other assets and liabilities denominated in currencies other than the U.S. dollar are translated into U.S. dollars based upon foreign exchange rates prevailing at the end of the period. Purchases and sales of investment securities, income, and expenses are translated on the respective dates of such transactions. Because the values of investment securities are translated at the foreign exchange rates prevailing at the end of the period, that portion of the results of operations arising from changes in exchange rates and that portion of the results of operations reflecting fluctuations arising from changes in market prices of the investment securities are not separated. Such fluctuations are included in the net realized and unrealized gain or loss on investments.
Net realized foreign exchange gains or losses arise from activity in forward foreign currency exchange contracts, sales of foreign currency, currency gains or losses realized between the trade and settlement dates on securities transactions, and the difference between the amounts of dividends, interest, and foreign withholding taxes recorded by the Portfolio and the U.S. dollar-equivalent of the amounts actually received or paid by the Portfolio. Net unrealized foreign exchange gains and losses arise from changes in the value of assets and liabilities, other than investment securities, resulting from changes in foreign exchange rates.
Dividends and Distributions to Shareholders -The Portfolio records dividends and distributions on theex-dividend date. Net realized gains from securities transactions (if any) are generally distributed annually to shareholders. The timing and characterization of certain income and capital gains distributions are determined in accordance with federal tax regulations that may differ from GAAP. Permanent book and tax basis differences relating to shareholder distributions will result in reclassification between distributable earnings (accumulated losses) andpaid-in surplus. These adjustments have no impact on net assets or the results of operations.
Income Taxes -It is the Portfolio’s policy to comply with the requirements of the Internal Revenue Code of 1986, as amended, and regulations thereunder, applicable to regulated investment companies, and to distribute, with respect to each taxable year, all of its taxable income to shareholders. Therefore, no federal income tax provision is required. The Portfolio files U.S. federal tax returns. No
BHFTII-14
Brighthouse Funds Trust II
Jennison Growth Portfolio
Notes to Financial Statements—December 31, 2018—(Continued)
income tax returns are currently under examination. The Portfolio’s federal tax returns for the prior three fiscal years remain subject to examination by the Internal Revenue Service. As of December 31, 2018, the Portfolio had no uncertain tax positions that would require financial statement recognition, or derecognition or disclosure.
Directed Brokerage Agreement -The Trust has entered into a directed brokerage arrangement with Capital Institutional Services, Inc. (“CAPIS”). Under this arrangement, the Portfolio directs certain trades to CAPIS in return for a recapture credit. CAPIS issues a cash rebate to the Portfolio. Amounts paid to the Portfolio are shown separately as broker commission recapture on the Statement of Operations of the Portfolio. Additionally, these amounts have been excluded from the calculation of the net ratio of expenses to average net assets presented in the Financial Highlights for each share class.
Repurchase Agreements -The Portfolio may enter into repurchase agreements, under the terms of a Master Repurchase Agreement (“MRA”), with selected commercial banks and broker-dealers, under which the Portfolio acquires securities as collateral and agrees to resell the securities at an agreed-upon time and at an agreed-upon price. The Portfolio, through the Custodian or a subcustodian, under atri-party repurchase agreement, receives delivery of the underlying securities collateralizing any repurchase agreements. It is the Portfolio’s policy that the market value of the collateral be equal to at least 100% of the repurchase price in the case of a repurchase agreement ofone-day duration and equal to at least 102% of the repurchase price in the case of all other repurchase agreements. In the event of default or failure by a party to perform an obligation in connection with any repurchase transaction, the MRA gives thenon-defaulting party the right toset-off claims and to apply property held by it in connection with any repurchase transaction against obligations owed to it.
At December 31, 2018, the Portfolio had direct investments in repurchase agreements with a gross value of $18,548,438. Additionally, the Portfolio invested cash collateral for loans of portfolio securities in repurchase agreements with a gross value of $97,013,156. The combined value of all repurchase agreements is included as part of investments at value on the Statement of Assets and Liabilities. The value of the related collateral exceeded the value of the repurchase agreements at December 31, 2018.
Securities Lending - The Portfolio may lend its portfolio securities to certain qualified brokers who borrow securities in order to complete certain securities transactions. By lending its portfolio securities, the Portfolio attempts to increase its net investment income through the receipt of income on collateral held from securities on loan. Any gain or loss in the market price of the loaned securities that might occur and any interest earned or dividends declared during the term of the loan would accrue to the account of the Portfolio.
The Trust has entered into aNon-Custodial Securities Lending Agreement with JPMorgan Chase Bank, N.A. (the “Lending Agent”). Under the agreement, the Lending Agent is authorized to loan portfolio securities on the Portfolio’s behalf. In exchange, the Portfolio receives either cash or U.S. government securities as collateral against the loaned securities. The Portfolio receives collateral equal to at least 102% of the market value for loans secured by government securities or cash in the same currency as the loaned shares and 105% for all other loaned securities at each loan’s inception. Collateral representing at least 100% of the market value of the loaned securities is maintained for the duration of the loan. Any cash collateral received by the Portfolio is generally invested by the Lending Agent in short-term investments, which may include certificates of deposit, commercial paper, repurchase agreements, time deposits, master demand notes and money market funds. The market value of investments made with cash collateral received are disclosed in the Schedule of Investments and the valuation techniques are described in Note 2. If the market value of the collateral at the close of trading on a business day is less than 100% of the market value of the loaned securities at the close of trading on that day, the borrower is required to deliver, by the close of business on the following business day, an additional amount of collateral, so that the total amount of posted collateral is equal to at least 100% of the market value of all the loaned securities as of such preceding day. A portion of the income earned on the collateral is rebated to the borrower of the securities and the remainder is split between the Lending Agent and the Portfolio. On loans collateralized by U.S. government securities, a fee is received from the borrower and is allocated between the Portfolio and the Lending Agent.
Income received by the Portfolio in securities lending transactions during the year ended December 31, 2018 is reflected as securities lending income on the Statement of Operations. The values of any securities loaned by the Portfolio and the related collateral at December 31, 2018 are disclosed in the footnotes to the Schedule of Investments. The value of the related collateral received by the Portfolio exceeded the value of the securities out on loan at December 31, 2018.
The risks associated with lending portfolio securities include, but are not limited to, possible delays in receiving additional collateral or in the recovery of the loaned securities, possible loss of rights in the collateral should the borrower fail financially, as well as risk of loss in the value of the collateral or the value of the investments made with the collateral. The Lending Agent shall indemnify the Portfolio in the case of default of any securities borrower, subject to the terms of theNon-Custodial Securities Lending Agreement.
All securities on loan are classified as Common Stocks in the Portfolio’s Schedule of Investments as of December 31, 2018, with a contractual maturity of overnight and continuous.
BHFTII-15
Brighthouse Funds Trust II
Jennison Growth Portfolio
Notes to Financial Statements—December 31, 2018—(Continued)
3. Certain Risks
In the normal course of business, the Portfolio invests in securities and enters into transactions where risks exist. Those risks include:
Market Risk:The value of securities held by the Portfolio may decline in response to certain events, including those directly involving the issuers whose securities are owned by the Portfolio; conditions affecting the general economy; overall market changes; local, regional or global political, social or economic instability; and currency, interest rate, and price fluctuations.
Credit and Counterparty Risk: The Portfolio may be exposed to counterparty risk, or the risk that an entity with which the Portfolio has unsettled or open transactions may default. The potential loss could exceed the value of the financial assets and liabilities recorded in the financial statements. Financial assets that potentially expose the Portfolio to credit and counterparty risk consist principally of cash due from counterparties and investments. The Portfolio manages counterparty risk by entering into agreements only with counterparties that it believes have the financial resources to honor their obligations and by monitoring the financial stability of those counterparties. The Adviser attempts to mitigate counterparty risk by (i) periodically assessing the creditworthiness of its trading partners, (ii) monitoring and/or limiting the amount of its net exposure to each individual counterparty based on its assessment, and (iii) requiring collateral from the counterparty for certain transactions. In order to preserve certain safeguards fornon-standard settlement trades, the Portfolio restricts its exposure to credit and counterparty losses by entering into master netting agreements (“Master Agreements”) with counterparties (approved brokers) with whom it undertakes a significant volume of transactions. Master Agreements govern the terms of certain transactions, and reduce the counterparty risk associated with relevant transactions by specifying credit protection mechanisms and providing standardization that improves legal certainty. Master Agreements can also help limit counterparty risk by specifying collateral posting arrangements atpre-arranged exposure levels.
Repurchase and reverse repurchase agreements are primarily executed under Global Master Repurchase Agreements (“GMRAs”) or Master Repurchase Agreements (“MRAs”), which provide the rights toset-off. Each repurchase and reverse repurchase agreement is initially collateralized at the transaction level. In the event of default, the total market value exposure will be offset against collateral exchanged to date, which would result in a net receivable/(payable) that would be due from/to the counterparty.
Additional risks associated with each type of investment are described above within the respective security type notes. The Portfolio’s prospectus includes a discussion of the principal risks of investing in the Portfolio.
4. Investment Transactions
Aggregate cost of purchases and proceeds of sales of investment securities, excluding short-term securities, for the year ended December 31, 2018 were as follows:
| | | | | | | | | | | | |
Purchases | | | Sales | |
U.S. Government | | Non-U.S. Government | | | U.S. Government | | | Non-U.S. Government | |
| $0 | | $ | 739,819,387 | | | $ | 0 | | | $ | 1,259,291,185 | |
5. Investment Management Fees and Other Transactions with Affiliates
Investment Management Agreement -Brighthouse Investment Advisers is the investment adviser to the Portfolio. The Trust has entered into an investment management agreement with Brighthouse Investment Advisers with respect to the Portfolio. For providing investment management services to the Portfolio, Brighthouse Investment Advisers receives monthly compensation at the following annual rates:
| | | | | | |
Management
Fees earned by
Brighthouse
Investment Advisers
for the year ended
December 31, 2018 | | % per annum | | | Average Daily Net Assets |
| $16,980,818 | | | 0.700 | % | | Of the first $200 million |
| | | 0.650 | % | | Of the next $300 million |
| | | 0.600 | % | | Of the next $1.5 billion |
| | | 0.550 | % | | On amounts in excess of $2 billion |
Brighthouse Investment Advisers has entered into an investment subadvisory agreement with respect to managing the Portfolio. Jennison Associates LLC (the “Subadviser”) is compensated by Brighthouse Investment Advisers to provide subadvisory services for the Portfolio.
BHFTII-16
Brighthouse Funds Trust II
Jennison Growth Portfolio
Notes to Financial Statements—December 31, 2018—(Continued)
Management Fee Waivers - Pursuant to an expense agreement, Brighthouse Investment Advisers has agreed, for the period April 30, 2018 to April 30, 2019, to reduce its advisory fees set out above under “Investment Management Agreement” for each class of the Portfolio as follows:
| | |
% per annum | | Average Daily Net Assets |
| 0.100% | | Of the first $200 million |
| 0.050% | | On the next $800 million |
| 0.100% | | On the next $1 billion |
| 0.080% | | On amounts in excess of $2 billion |
An identical expense agreement was in place for the period May 1, 2017 to April 30, 2018. Amounts waived for the year ended December 31, 2018 are shown as a management fee waiver in the Statement of Operations.
Certain officers and trustees of the Trust may also be officers of Brighthouse Investment Advisers; however, such officers and trustees receive no compensation from the Trust.
Transfer Agency Agreement -Brighthouse Financial, Inc. serves as the transfer agent for the Trust. Brighthouse Financial, Inc. receives no fees for its services to the Trust.
Distribution and Service Fees -The Trust has a distribution agreement with Brighthouse Securities, LLC (the “Distributor”) pursuant to which the Distributor serves as the general distributor of shares of each class (each a “Class”) of each Portfolio. The Distributor is an affiliate of the Trust. The Trust has adopted a Distribution and Services Plan (the “Plan”) relating to Class B and Class E shares of each Portfolio, under Rule 12b-1 under the 1940 Act, pursuant to which the Trust may pay the Distributor a fee (the “Service Fee”) at an annual rate not to exceed 0.25% of each such Portfolio’s average daily net assets attributable to the Class B and Class E shares of the Trust. Each Portfolio may not offer shares of each Class. The Plan also authorizes the Trust, on behalf of each of its Portfolios, may pay the Distributor a distribution Fee (the “Distribution Fee” and together with the Service Fee, the “Fees”) at an annual rate of up to 0.25% of each Portfolio’s average daily net assets attributable to the Class B and Class E shares in consideration of the services rendered in connection with the sale of such shares by the Distributor. Under the Distribution Agreement with respect to the Trust, Fees are currently paid at an annual rate of 0.25% of average daily net assets in the case of Class B shares and 0.15% of average daily net assets in the case of Class E shares. The Plan is known as a “compensation plan” because the Trust makes payments to the Distributor for services rendered regardless of the actual level of expenditures by the Distributor. Amounts incurred by the Portfolio for the year ended December 31, 2018 are shown as Distribution and service fees in the Statement of Operations.
Deferred Trustee Compensation -Each Trustee who is not currently an employee of the Adviser or any of its affiliates receives compensation from the Trust for his or her service to the Trust. A deferred compensation plan (the “Plan”) is available to the Trustees on a voluntary basis. Deferred amounts remain in the Trust until distributed in accordance with the provisions of the Plan. The value of a participating Trustee’s deferral account is based on theoretical investments of deferred amounts on the normal payment dates in certain portfolios of the Trust or Brighthouse Funds Trust I, an affiliate of the Trust, as designated by the participating Trustee. Changes in the value of participants’ deferral accounts are reflected as Trustees’ fees and expenses in the Statement of Operations. The portion of the accrued obligations allocated to the Portfolio under the Plan is reflected as Deferred trustees’ fees in the Statement of Assets and Liabilities.
6. Contractual Obligations
Under the Trust’s organizational documents, its officers and Trustees may be indemnified against certain liabilities and expenses arising out of the performance of their duties to the Trust. Additionally, the Trust has a variety of indemnification obligations under contracts with its service providers. The Trust’s maximum exposure under these arrangements is unknown, as this would involve future claims that may be made against the Trust that have not yet occurred.
7. Income Tax Information
The cost basis of investments for federal income tax purposes at December 31, 2018 was as follows:
| | | | |
Cost basis of investments | | $ | 1,998,389,744 | |
Gross unrealized appreciation | | | 816,663,785 | |
Gross unrealized depreciation | | | (45,389,598 | ) |
| | | | |
Net unrealized appreciation (depreciation) | | $ | 771,274,187 | |
| | | | |
BHFTII-17
Brighthouse Funds Trust II
Jennison Growth Portfolio
Notes to Financial Statements—December 31, 2018—(Continued)
The tax character of distributions paid for the years ended December 31, 2018 and 2017 were as follows:
| | | | | | | | | | | | | | | | | | | | |
Ordinary Income | | | Long-Term Capital Gain | | | Total | |
2018 | | 2017 | | | 2018 | | | 2017 | | | 2018 | | | 2017 | |
| $10,269,055 | | $ | 6,823,313 | | | $ | 413,681,458 | | | $ | 197,511,795 | | | $ | 423,950,513 | | | $ | 204,335,108 | |
As of December 31, 2018, the components of distributable earnings (accumulated losses) on a federal income tax basis were as follows:
| | | | | | | | | | | | | | | | |
Undistributed
Ordinary
Income | | Undistributed
Long-Term
Capital Gain | | | Net
Unrealized
Appreciation | | | Accumulated
Capital Losses | | | Total | |
| $9,759,883 | | $ | 397,334,198 | | | $ | 771,277,525 | | | $ | — | | | $ | 1,178,371,606 | |
The Portfolio utilizes the provisions of the federal income tax laws that provide for the carryforward of capital losses for prior years, offsetting such losses against any future realized capital gains. Under the Regulated Investment Company Modernization Act of 2010 (the “Act”), net capital losses recognized after December 22, 2010 may be carried forward indefinitely and their character is retained as short-term and/or long-term losses.
As of December 31, 2018, the Portfolio had no accumulated capital losses.
8. Recent Accounting Pronouncements and SEC Update
In August 2018, the FASB issued Accounting Standards Update2018-13, Fair Value Measurement (Topic 820)—Disclosure Framework—Changes to the Disclosure Requirements for Fair Value Measurement (“ASU2018-13”) which introduces new fair value disclosure requirements as well as eliminates and modifies certain existing fair value disclosure requirements. ASU2018-13 is effective for fiscal years beginning after December 15, 2019, and interim periods within those fiscal years. Early adoption is permitted and, as such, management has elected to early adopt ASU2018-13 effective with the current reporting period. The impact of the Portfolio’s adoption was limited to changes in the Portfolio’s financial statement disclosures regarding fair value, primarily those disclosures related to transfers between levels of the fair value hierarchy.
In August 2018, the Securities and Exchange Commission released its Final Rule on Disclosure Update and Simplification (the “Final Rule”) which is intended to simplify an issuer’s disclosure compliance efforts by removing redundant or outdated disclosures requirements without significantly altering the mix of information provided to investors. Effective with the current reporting period, the Portfolio adopted the Final Rule with the most notable impacts being that the Portfolio is no longer required to present the components of distributable earnings on the Statement of Assets and Liabilities or the sources of distributions to shareholders and the amounts of undistributed net investment income on the Statements of Changes in Net Assets.
BHFTII-18
Brighthouse Funds Trust II
Jennison Growth Portfolio
Report of Independent Registered Public Accounting Firm
To the Shareholders of Jennison Growth Portfolio and the Board of Trustees of Brighthouse Funds Trust II:
Opinion on the Financial Statements and Financial Highlights
We have audited the accompanying statement of assets and liabilities, including the schedule of investments, of the Jennison Growth Portfolio (the “Portfolio”), one of the portfolios constituting the Brighthouse Funds Trust II, as of December 31, 2018, the related statement of operations for the year then ended, the statements of changes in net assets for each of the two years in the period then ended, the financial highlights for each of the five years in the period then ended, and the related notes. In our opinion, the financial statements and financial highlights present fairly, in all material respects, the financial position of the Jennison Growth Portfolio of the Brighthouse Funds Trust II as of December 31, 2018, the results of its operations for the year then ended, the changes in its net assets for each of the two years in the period then ended, and the financial highlights for each of the five years in the period then ended, in conformity with accounting principles generally accepted in the United States of America.
Basis for Opinion
These financial statements and financial highlights are the responsibility of the Portfolio’s management. Our responsibility is to express an opinion on the Portfolio’s financial statements and financial highlights based on our audits. We are a public accounting firm registered with the Public Company Accounting Oversight Board (United States) (PCAOB) and are required to be independent with respect to the Portfolio in accordance with the U.S. federal securities laws and the applicable rules and regulations of the Securities and Exchange Commission and the PCAOB.
We conducted our audits in accordance with the standards of the PCAOB. Those standards require that we plan and perform the audit to obtain reasonable assurance about whether the financial statements and financial highlights are free of material misstatement, whether due to error or fraud. The Portfolio is not required to have, nor were we engaged to perform, an audit of its internal control over financial reporting. As part of our audits we are required to obtain an understanding of internal control over financial reporting but not for the purpose of expressing an opinion on the effectiveness of the Portfolio’s internal control over financial reporting. Accordingly, we express no such opinion.
Our audits included performing procedures to assess the risks of material misstatement of the financial statements and financial highlights, whether due to error or fraud, and performing procedures that respond to those risks. Such procedures included examining, on a test basis, evidence regarding the amounts and disclosures in the financial statements and financial highlights. Our audits also included evaluating the accounting principles used and significant estimates made by management, as well as evaluating the overall presentation of the financial statements and financial highlights. Our procedures included confirmation of securities owned as of December 31, 2017, by correspondence with the custodian and brokers; when replies were not received from brokers, we performed other auditing procedures. We believe that our audits provide a reasonable basis for our opinion.
/s/ Deloitte & Touche LLP
Boston, Massachusetts
February 25, 2019
We have served as the auditor of one or more of the Brighthouse investment companies since 1983.
BHFTII-19
Brighthouse Funds Trust II
Trustees and Officers
MANAGEMENT OF THE TRUSTS
The Boards of Trustees (the “Board”) of Brighthouse Funds Trust I and Brighthouse Funds Trust II (“BHF I” and “BHF II”, respectively, and collectively the “Trusts”) supervise the Trusts and are responsible for representing the interests of shareholders. The Trustees, the Chairman of the Board and the Chairmen of each subcommittee are the same for both Trusts. The Trustees of each Trust meet periodically throughout the year to oversee the Portfolios’ activities, reviewing, among other things, each Portfolio’s performance and its contractual arrangements with various service providers. The Trustees of each Trust elect the officers of the Trust, who are responsible for administering the Trust’sday-to-day operations.
Trustees and Officers
The Trustees and executive officers of the Trusts, as well as their principal occupations during the past five years, are set forth below. Unless otherwise indicated, the business address of each is c/o Brighthouse Funds, One Financial Center, Boston, Massachusetts 02111. Each Trustee who is deemed an “interested person,” as such term is defined in the 1940 Act, is referred to as an “Interested Trustee.” Those Trustees who are not “interested persons,” as such term is defined in the 1940 Act, are referred to as “Independent Trustees.” There is no limit to the term a Trustee may serve. Trustees serve until their death, resignation or removal in accordance with the BHF I Trust’s and BHF II Trust’s respective organizational documents and policies adopted by the Boards of the respective Trusts from time to time. Officers hold office at the pleasure of each Board and serve until their removal or resignation in accordance with the Trusts’ respective organizational documents and policies adopted by the Board of each Trust from time to time.
| | | | | | | | | | |
Name and Year of Birth | | Current
Position(s)
Held with
Registrant | | Term of Office
and Length of
Time Served | | Principal Occupation(s) During the Past
5 Years(1) | | Number of
Portfolios
in Brighthouse
Funds
Complex(2)
Overseen
by Trustee | | Other Directorships Held
by Trustee During the
Past 5 Years(1) |
| Interested Trustee |
John Rosenthal* (1960) | | Trustee | | Indefinite; From
May 2016
(Trust I and
Trust II) to present | | Chief Investment Officer, Brighthouse Financial, Inc. (2017 to present); until 2017, Senior Managing Director and Head of Global Portfolio Management, MetLife, Inc. | | 72 | | None |
|
| Independent Trustees |
Dawn M. Vroegop (1966) | | Trustee and Chairman of the Board | | Indefinite; From
December 2000
(Trust I)/May
2009 (Trust II) to
present as
Trustee; From
May 2016 (Trust
I and Trust II)
until present as
Chairman | | Private Investor. | | 72 | | Trustee, Driehaus Mutual Funds.** |
| | | | | |
Stephen M. Alderman (1959) | | Trustee | | Indefinite; From
December 2000
(Trust I)/April
2012 (Trust II) to
present | | Shareholder in the law firm of Garfield and Merel, Ltd. | | 72 | | None |
| | | | | |
Robert J. Boulware (1956) | | Trustee | | Indefinite; From
March 2008
(Trust I)/April
2012 (Trust II) to
present | | Managing Director, Pilgrim Funds, LLC (private equity fund). | | 72 | | Trustee, Vertical Capital Income Fund(closed-end fund);** Director, Gainsco, Inc. (auto insurance);** Trustee, SharesPost 100 Fund(closed-end fund).** |
| | | | | |
Susan C. Gause (1952) | | Trustee | | Indefinite; From
March 2008
(Trust I)/April
2012 (Trust II) to
present | | Private Investor. | | 72 | | Trustee, HSBC Funds.** |
BHFTII-20
Brighthouse Funds Trust II
Trustees and Officers—(Continued)
| | | | | | | | | | |
Name and Year of Birth | | Current
Position(s)
Held with
Registrant | | Term of Office
and Length of
Time Served | | Principal Occupation(s) During the Past
5 Years(1) | | Number of
Portfolios
in Brighthouse
Funds
Complex(2)
Overseen
by Trustee | | Other Directorships Held
by Trustee During the
Past 5 Years(1) |
Nancy Hawthorne (1951) | | Trustee | | Indefinite; From
May 2003
(Trust II)/April
2012 (Trust I)
to present | | Partner, Hawthorne Financial Advisors, LLC (registered investment advisor); until 2014, Chief Executive Officer, Clerestory LLC (corporate advisor). | | 72 | | Director and Chairman of the Board of Directors, THL Credit, Inc.;** Director and Chairman of the Board, Avid Technology, Inc.;** Director, CRA International, Inc.** |
| | | | | |
Barbara A. Nugent (1956) | | Trustee | | Indefinite; From
January 2014
(Trust I and
Trust II) to
present | | President, True North Board Governance, LLC (consulting); until December 2013, partner in the law firm of Stradley Ronon Stevens & Young, LLP. | | 72 | | Independent Lead Trustee, BMT Investment Funds** |
| | | | | |
Christopher J. Towle (1957) | | Trustee | | Indefinite; From
April 2018
(Trust I and
Trust II) to
present | | Retired; until 2014, Partner, Portfolio Manager, Director of High Yield and Convertible Strategies, Lord Abbett & Co. | | 72 | | Trustee, Driehaus Mutual Funds** |
Officers
| | | | | | |
Name and Year of Birth | | Position(s)
Held with
Registrant | | Length of
Time Served | | Principal Occupation(s)
During the Past 5 Years(1) |
| Executive Officers | | | | | | |
Kristi Slavin (1973) | | President and Chief Executive Officer, of Trust I and Trust II | | From May
2016
(Trust I and
Trust II) to
present | | President, Brighthouse Investment Advisers, LLC (2016-present); formerly, Senior Vice President, MetLife Advisers, LLC; Vice President, MetLife, Inc.; Vice President, Trust I and Trust II(2015-2016). |
| | | |
Alan R. Otis (1971) | | Chief Financial Officer and Treasurer, of Trust I and Trust II | | From
November
2017
(Trust I and
Trust II) to
present | | Senior Vice President, Brighthouse Investment Advisers, LLC (2017-present); formerly, Vice President, Brighthouse Investment Advisers, LLC (2012-2017); Assistant Treasurer, Trust I and Trust II (2012-2017). |
| | | |
Andrew L. Gangolf (1954) | | Secretary, of Trust I and Trust II | | From May
2011
(Trust I and
Trust II) to
present | | Executive Vice President, Brighthouse Investment Advisers, LLC (2017-present); formerly, Senior Vice President, MetLife Advisers, LLC (2011-2017); until 2011, Senior Vice President & Assistant General Counsel, AllianceBernstein Investments, Inc. |
| | | |
Steven E. Hartstein (1963) | | Chief Compliance Officer (“CCO”), of Trust I and Trust II | | From
February
2014
(Trust I and
Trust II) to
present | | Senior Vice President and CCO, Brighthouse Investment Advisers, LLC (2017-present); Head of Investments Compliance, Vice President, Brighthouse Financial, Inc. (2017-present); formerly, Vice President, MetLife, Inc. (2013-2017); Senior Vice President and CCO, MetLife Advisers, LLC (2013-2017.) |
| | | |
Victor Soto (1978) | | Vice President of Trust I and Trust II | | From May
2018
(Trust I and
Trust II) to
present | | Executive Vice President, Brighthouse Investment Advisers, LLC (2016-present); Assistant Vice President, MetLife Inc. (2015-2017); Portfolio Manager, 1st Global (2013-2015). |
| * | Mr. Rosenthal is an “interested person” of the Trusts because of his position with Brighthouse Financial, Inc., the current parent company of Brighthouse Investment Advisers, LLC. |
| ** | Indicates a directorship with a registered investment company or a company subject to the reporting requirements of the Securities Exchange Act of 1934, as amended. |
| (1) | Previous positions during the past five years with the Trusts, Brighthouse Financial, Inc., MetLife, Inc. or the Manager are omitted if not materially different. |
| (2) | The Fund Complex includes 43 BHF I Portfolios and 29 BHF II Portfolios. |
BHFTII-21
Brighthouse Funds Trust II
Jennison Growth Portfolio
Board of Trustees’ Consideration of Advisory and Sub-Advisory Agreements
At anin-person meeting held on November6-8, 2018 (the “November Meeting”), the Boards of Trustees (the “Board”) of Brighthouse Funds Trust I and Brighthouse Funds Trust II (“BFT I” and “BFT II,” respectively, and collectively, the “Trusts”), including a majority of the Trustees who are not “interested persons” of the Trusts (the “Independent Trustees”) under the Investment Company Act of 1940 (the “1940 Act”), approved the continuation of the Trusts’ advisory agreements (each, an “Advisory Agreement”) with Brighthouse Investment Advisers, LLC (the “Adviser”) and the applicablesub-advisory agreements (each a “Sub-Advisory Agreement,” and collectively with the Advisory Agreement, the “Agreements”) between the Adviser and the investmentsub-advisers (each a “Sub-Adviser,” and collectively, the “Sub-Advisers”) for the series of the Trusts (each a “Portfolio,” and collectively, the “Portfolios”).
In making those approvals, the Board reviewed a variety of materials that were provided for the specific purpose of the annual contract renewal process. In addition, various materials provided to and discussed with the Board throughout the year informed the Board’s decision to renew the Agreements. In particular, the information for each Portfolio included, but was not limited to, investment performance reports, and reports on expenses, legal and compliance matters, asset pricing, brokerage commissions and trade execution.
The Board met in person with personnel of the Adviser on October 17, 2018 for the specific purpose of giving preliminary consideration to the proposed continuation of the Agreements (the “October Meeting”). At that meeting, the Adviser reviewed with the Board the performance and fees experienced by each Portfolio, as well as other information. During and after the October Meeting, the Independent Trustees communicatedfollow-up matters for management to address at the November Meeting. The Independent Trustees were advised by independent legal counsel throughout the contract renewal process, and met with independent legal counsel in several executive sessions outside of the presence of management.
Information furnished and reviewed specifically in connection with the renewal process included, but was not limited to, a report for each Portfolio that was prepared by Broadridge (“Broadridge”), an independent organization. In addition, the Independent Trustees reviewed a report that was prepared by JDL Consultants, LLC (“JDL”), an independent consultant to the Independent Trustees (“JDL Report”), which examined the comparative fees, expenses and performance of each Portfolio, based upon the Broadridge reports. Also, the Board reviewed the responses to wide-ranging questions from the Independent Trustees relating to the business, operations and performance of the Adviser and theSub-Advisers that the Adviser andSub-Advisers had prepared specifically for the renewal process, and reviewed aPortfolio-by-Portfolio analysis of the profitability to the Adviser of each Advisory Agreement, which was prepared by the Adviser for the renewal process.
At the November Meeting, the Board, including a majority of the Independent Trustees, concluded that the nature, extent and quality of services provided by the Adviser and eachSub-Adviser supported the renewal of the Agreements. The Board also concluded that the investment performance of each Portfolio was such that each Agreement should continue, and that the fees paid by each Portfolio to the Adviser appeared to be reasonable in light of the nature, extent and quality of the services provided by the Adviser andSub-Adviser. Further, the Board concluded that the Adviser’s profitability in providing services under the Advisory Agreements did not appear unreasonable in light of the nature, extent and quality of the services provided by the Adviser. Finally, the Board reviewed the extent to which the investment advisory fees paid by the Portfolios shared economies of scale with investors or entailed the potential to share economies of scale with investors and concluded that those considerations generally supported the renewal of each Agreement. In approving the renewal of each of the Agreements, the Board, including the Independent Trustees, gave attention to all of the information that was furnished and each Trustee placed varying degrees of importance on the various pieces of information that were provided to them. The Board evaluated the information available to it on aPortfolio-by-Portfolio basis, and its decision was made separately with respect to each Portfolio. The following paragraphs provide more information about some of the primary factors that were relevant to the Board’s decision. The Board did not identify any single factor as determinative, and the Trustees generally attributed different weights to various factors for the various Portfolios.
Nature, extent and quality of services. The Board evaluated the nature, extent and quality of the services that the Adviser and theSub-Advisers, as relevant, have provided to the Portfolios. The Board considered the Adviser’s services as investment manager to the Portfolios, including its services relating to the hiring and oversight of theSub-Advisers, trading practices and oversight of transition management (as applicable), compliance programs and personnel, and risk management, among other things. The Adviser’s services in coordinating and overseeing the activities of the Trusts’ other service providers were also considered. The Board considered information received from the Trusts’ Chief Compliance Officer (“CCO”) regarding the Portfolios’ compliance policies and procedures that were established pursuant to Rule38a-l under the 1940 Act. The Board also noted that the Adviser’s investment, compliance and legal staff conduct regular and periodic telephonic andin-person meetings with theSub-Advisers to review and assess the services that are provided to the Portfolios, and that personnel of the Adviser prepare and present reports to the Independent Trustees regarding those meetings. In addition, throughout the year, the Board considered the expertise, experience and performance of the personnel of the Adviser who performed the various services that are mentioned above.
BHFTII-22
Brighthouse Funds Trust II
Jennison Growth Portfolio
Board of Trustees’ Consideration of Advisory and Sub-Advisory Agreements—(Continued)
With respect to the services provided by each of theSub-Advisers, the Board considered a variety of information that the Adviser and eachSub-Adviser prepared for the Board’s review. The Board considered eachSub-Adviser’s investment process and philosophy, and the investment performance experienced by the Portfolio (as described in more detail below). The Board took into account that eachSub-Adviser’s responsibilities include the development and maintenance of an investment program for the applicable Portfolio that is consistent with the Portfolio’s investment objectives, the selection of investment securities and the placement of orders for the purchase and sale of such securities, as well as the implementation of compliance controls related to performance of these services. In particular, the Board considered, among other things, theSub-Adviser’s current level of staffing as well as its compensation program and its overall resources. The Board reviewed eachSub-Adviser’s history and investment experience, as well as information provided regarding the qualifications, background and responsibilities of theSub-Adviser’s investment and compliance personnel who provide services to the Portfolios. The Board also considered, among other things, eachSub-Adviser’s compliance program and regulatory and disciplinary history. In its review, the Board also took into account information regarding any services and/or payments provided to the Adviser by theSub-Advisers in connection with marketing activities and considered representations from the Adviser that those payments were not considered in the Adviser’s recommendation to renew any of theSub-Advisory Agreements.
Performance. The Board placed emphasis on the performance of each Portfolio in light of, among other things, its importance to investors. The Board considered the Adviser’s quarterly reviews with the Board of detailed information about each Portfolio’s investment strategies and performance results and composition, including discussions regarding the relevant effect of current market conditions. The Board reviewed and considered the reports prepared by Broadridge, which provided a statistical analysis comparing the Portfolios’ investment performance to that of comparable funds underlying variable insurance products (the “Performance Universe”). The Independent Trustees also met separately with representatives of JDL during the October Meeting to review the JDL Report. The Board also compared the performance records of the Portfolios to those of comparable funds and other accounts that were managed by the relevantSub-Adviser, to the extent such information was available. The Board considered each Portfolio’s performance for periods subsequent to the performance period covered by the Broadridge reports, and the Adviser’s discussion of the same, including the effect of current market conditions on each Portfolio’s more recent performance. The Board also noted that while it found the data provided by Broadridge generally useful, it recognized the limitations of such data, including, in particular, that notable differences may exist between a Portfolio and those of the other funds in a Broadridge category (for example, the investment objectives(s) and investment strategies) and that the results of the performance comparisons may vary depending on (i) the end dates for the performance periods that were selected and (ii) the selection of the peer groups.
The Board focused particular attention on Portfolios with less favorable performance records. The Board noted the Adviser’s focus on eachSub-Adviser’s performance and that the Adviser has been active in monitoring and responding to any performance issues with respect to the Portfolios.
Fees and Expenses. The Board gave consideration to the level and method of computing the fees payable under the Agreements. The Board considered the Broadridge report for each of the Portfolios, which included comparisons for each Portfolio of its contractual management andsub-adviser fees (at current and various asset levels), and total expenses, with those of its peers, including as those peers were divided into a broad group of peer funds (“Expense Universe”), a narrower group of peer funds (“Expense Group”), a broad group of peersub-advised funds (“Sub-advised Expense Universe”), and a narrower group of peersub-advised funds (“Sub-advised Expense Group”). Broadridge selected the peer funds which were similarly situated funds underlying variable insurance products deemed to be comparable to the Portfolios. The Independent Trustees, with the assistance of JDL, also examined the JDL Report. The Board compared the fee payable to aSub-Adviser by the Adviser with respect to the Portfolio to the fee payable to theSub-Adviser by other comparable funds and other accounts, to the extent such information was available.
The Board noted that thesub-advisory fees for the Portfolios are paid by the Adviser out of the advisory fees, and that the Adviser negotiates the fees at arm’s length. The Board also considered that the Adviser had entered into expense limitation or management fee waiver agreements with certain of the Portfolios pursuant to which the Adviser had agreed to waive a portion of its advisory fee and/or reimburse certain expenses as a means of limiting a Portfolio’s total annual operating expenses.
Profitability. The Board examined the profitability to the Adviser of each Advisory Agreement, on aPortfolio-by-Portfolio basis. The Board also considered that an affiliate of the Adviser, Brighthouse Securities, LLC, serves as distributor for the Trusts, and, as such, receives Rule12b-1 payments to support the distribution of the Portfolios. The Board considered the profitability to theSub-Advisers and their affiliates as a result of their relationships with the Portfolios, to the extent available, and the Board considered the ability of the Adviser to negotiate with aSub-Adviser at arm’s length. In reviewing the profitability analyses, the Board recognized that expense allocation methodologies are inherently subjective and various expense allocation methodologies may be reasonable while producing different results.
BHFTII-23
Brighthouse Funds Trust II
Jennison Growth Portfolio
Board of Trustees’ Consideration of Advisory and Sub-Advisory Agreements—(Continued)
Economies of scale. The Board also considered each Portfolio’s fees in light of its size. The Board noted the fee schedules for the Portfolios that contain breakpoints that reduce the fee rate above specified asset levels. The Board noted those Portfolios that did not have breakpoints in their advisory fee and took into account management’s discussion of the same. The Board noted that those Portfolios with Advisory Agreements containing breakpoints generally have breakpoints in the correspondingSub-Advisory Agreement. The Board considered the effective fees under the Advisory Agreement andSub-Advisory Agreement for each Portfolio as a percentage of assets at different asset levels and possible economies of scale that may be realized if the assets of the Portfolio grow. The Board examined, among other data, the effect of a Portfolio’s growth in size, and reduction in size, on various fee schedules and the Board reviewed the Broadridge and JDL Reports, which compared fees among peers. The Board also generally noted that if a Portfolio’s assets increase over time, the Portfolio may realize other economies of scale if assets increase proportionally more than certain other fixed expenses.
Other factors. The Board considered other benefits that may be realized by the Adviser and its affiliates from their relationship with the Trusts. Among them, the Board recognized that Brighthouse Securities, LLC, as the distributor for the Trusts, receives payments pursuant to Rule12b-1 from the Portfolios to compensate for the provision of shareholder services and distribution activities, which could lead to growth in the Trusts’ assets and corresponding benefits from such growth, including economies of scale. The Board considered other benefits that may be realized by eachSub-Adviser and its affiliates from their relationship with the Trusts, including the opportunity to provide advisory services to additional portfolios of the Trusts and reputational benefits. In conjunction with these considerations, the Board noted the ongoing commitment of the Adviser to the Portfolios.
The Board requested, received, and considered information from the Adviser regarding possible conflicts of interest in the form of material benefits to the Adviser resulting from the Adviser’s affiliations and business relationships, as relevant. The Board considered the services that are provided to the Trusts by its service providers, and the manner in which any conflicts were mitigated.
* * *
Jennison Growth Portfolio. The Board also considered the following information in relation to the Agreements with the Adviser and Jennison Associates LLC regarding the Portfolio:
Among other data relating specifically to the Portfolio’s performance, the Board considered that the Portfolio outperformed the median of its Performance Universe and the average of its Morningstar Category for theone-, three-, and five-year periods ended June 30, 2018. The Board further considered that the Portfolio outperformed its benchmark, the Russell 1000 Growth Index, for theone-, three-, and five-year periods ended September 30, 2018.
The Board also considered that the Portfolio’s actual management fees and total expenses (exclusive of12b-l fees) were below the Expense Group median, the Expense Universe median, and theSub-advised Expense Universe median. The Board further noted that the Portfolio’s contractual management fees were above the asset-weighted average of comparable funds selected by Broadridge at the Portfolio’s current size. The Board also noted that the Portfolio’s contractualsub-advisory fees were below the averages of theSub-advised Expense Group and theSub-advised Expense Universe at the Portfolio’s current size.
BHFTII-24
Brighthouse Funds Trust II
Loomis Sayles Small Cap Core Portfolio
Managed by Loomis, Sayles & Company, L.P.
Portfolio Manager Commentary*
PERFORMANCE
For the 12 months ended December 31, 2018, the Class A, B, and E shares of the Loomis Sayles Small Cap Core Portfolio returned-11.07%,-11.30%, and-11.21%, respectively. The Portfolio’s benchmark, the Russell 2000 Index1, returned-11.01%.
MARKET ENVIRONMENT / CONDITIONS
After a somewhat weak and volatile start to 2018, domestic equity markets returned to broad-based gains during the first half of the year. Despite numerous concerns including the aging economic recovery, Federal Reserve (the “Fed”) interest rate normalization and intensifying threats of import tariffs and trade wars, investors chose to focus on the current healthy state of the U.S. economy and the improved corporate earnings outlook. Against this backdrop of tax reform, trade wars, U.S. dollar strength and weaker international growth, domestically focused U.S. small cap stocks benefited from strong inflows. The first half of the year saw material outperformance from the smallest of the small cap stocks and from small cap growth stocks far exceeding their value counterparts.
Starting late in the third quarter, market leadership began to change. Stocks tumbled during the final quarter of 2018, with concerns about continued Fed policy tightening, trade wars and weaker global growth all contributing to a negative turn in investor sentiment. The market decline was broad based and comprehensive across market capitalization and investment style.Small-cap stocks were particularly weak, continuing a trend that started during the third quarter. The sharp decline more than offset the advantage small caps had over large caps during the first half of the calendar year. The fourth quartersell-off also completely reversed the prioryear-to-date market gains and turned what appeared in late August to be a dynamic and attractive return year for U.S. equities, into modest overall losses. Economic drivers and investor sentiment also shifted, which resulted in distinct changes in market leadership.
The disparity of returns between market capitalizations and investment style proved meaningful for the year. The Russell 2000 Small Cap Index produced a-11.0% return, well below the-4.4% return of the S&P 500 Index. For the calendar year of 2018,small-cap growth stocks outperformed value stocks as the Russell 2000 Growth Index returned-9.3% compared to the Russell 2000 Value Index return of-12.9%.
PORTFOLIO REVIEW /PERIOD-END POSITIONING
The Portfolio underperformed the Russell 2000 Index during the twelve months ended December 31, 2018. An underweight allocation to the Health Care sector, coupled with stock selection in the Financials, Energy, and Information Technology (“IT”) sectors detracted from relative performance. Conversely, positive stock selection in the Health Care sector more than offset the negative effects of the sector underweight. An underweight to the Energy sector, the worst performing sector in the Index, aided relative performance, and an overweight to the IT sector and stock selection in the Industrials and Materials sectors were beneficial to the Portfolio’s return.
The largest detractors from the Portfolio’s performance were LCI Industries, C&J Energy Services. and Marriott Vacations Worldwide. LCI Industries is a leading supplier ofsub-components and parts for recreational vehicles, manufactured housing and other consumer durable end markets. After a strong run during the second half of 2017, the stock came under pressure due to investor concerns over rising raw material costs and the sustainability of robust trends in the RV industry as end market trends continued to weaken. C&J Energy provides well construction, completions and services to the oil and gas industry. While the entire energy sector was under intense pressure for much of the year, C&J was particularly impacted as customers reduced capital spending plans due to lower commodity prices and production bottlenecks in various markets. Marriott Vacations manages and develops vacation ownership resorts, also known as time share properties. In April of 2018, the company announced an anticipated acquisition of peer ILG, but investors were disappointed by cost saving projections and the price of the deal, as well as by numerous merger related accounting adjustments when the newly-combined entity reported its third quarter earnings results. These issues combined with concerns regarding the domestic economy caused the stock to contract further intoyear-end.
The Portfolio’s top contributors over the year included Insperity, Mellanox Technologies, and Five9, Inc. Insperity is a provider of human resource services including payroll, benefits administration, workers comp and recruiting to small and medium sized businesses. The company has posted a string of positive earnings reports and fundamental improvements in employment trends continued to drive the stock materially higher over the year. Mellanox Technologies is a leading provider of networking technologies used for high performance and cloud computing. The explosion of data and proliferation of data centers has driven demand for faster networks and interconnects, matching well with the leading products developed by Mellanox. Five9, the largest cloud contact center solutions provider, reported a solid quarter during the year with record revenues. The company executed well in a market that continued to benefit from the conversion ofon-premise legacy solutions to cloud-based solutions.
During the period, we added new stocks with attractive investment potential and eliminated holdings where the valuation had exceeded our target levels or where fundamentals no longer fit our investment thesis. New positions included NextEra Energy Partners, Vistra Energy, and Harsco Corporation. NextEra Partners is a growth-oriented limited partnership formed to acquire and manage contracted clean energy projects (wind and solar). Vistra Energy is the largest independent, wholesale power producer in the U.S. and also operates TXU Energy, the largest retailer of electricity in Texas. Harsco is a diversified, multinational provider of industrial services and engineered products. Eliminations from the Portfolio included Teradyne, based on market capitalization and stock valuations; Caesars Entertainment on elevated debt levels on balance sheet and near-term operational pressures; and Arch Coal was sold after the stock price recovered from first quarter earnings that were lower than investor expectations.
BHFTII-1
Brighthouse Funds Trust II
Loomis Sayles Small Cap Core Portfolio
Managed by Loomis, Sayles & Company, L.P.
Portfolio Manager Commentary*—(Continued)
We managed the Portfolio in a bottom up, fundamentally grounded fashion and focused on selecting stocks that fit our investment philosophy and process. While the economic backdrop may be a consideration in the analysis of each security’s investment potential, the Portfolio’s decisions were not driven by macroeconomic expectations. Sector weight changes during the period ended December 31, 2018 were modest and reflected both our repositioning within the Portfolio as well as market impacts. We decreased weights in the Energy and Industrials sectors while we increased the weights to the Health Care and Utility sectors.
Mark Burns
John Slavik
Joe Gatz
Jeff Schwatz
Portfolio Managers
Loomis, Sayles & Company, L.P.
* This commentary may include statements that constitute “forward-looking statements” under the U.S. securities laws. Forward-looking statements include, among other things, projections, estimates, and information about possible or future results related to the Portfolio, market or regulatory developments. The views expressed above are not guarantees of future performance or economic results and involve certain risks, uncertainties and assumptions that could cause actual outcomes and results to differ materially from the views expressed herein. The views expressed above are subject to change at any time based upon economic, market, or other conditions and the subadvisory firm undertakes no obligation to update the views expressed herein. Any discussions of specific securities should not be considered a recommendation to buy or sell those securities. The views expressed above (including any forward-looking statement) may not be relied upon as investment advice or as an indication of the Portfolio’s trading intent. Information about the Portfolio’s holdings, asset allocation or country diversification is historical and is not an indication of future Portfolio composition, which may vary. Direct investment in any index is not possible. The performance of any index mentioned in this commentary has not been adjusted for ongoing management, distribution and operating expenses, and sales charges applicable to mutual fund investments. In addition, the returns do not reflect additional fees charged by separate accounts or variable insurance contracts that an investor in the Portfolio may pay. If these additional fees were reflected, performance would have been lower.
BHFTII-2
Brighthouse Funds Trust II
Loomis Sayles Small Cap Core Portfolio
A $10,000 INVESTMENT COMPARED TO THE RUSSELL 2000 INDEX
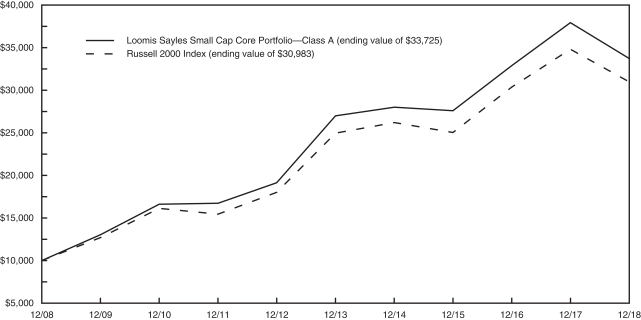
AVERAGE ANNUAL RETURNS (%) (FOR THE YEAR ENDED DECEMBER 31, 2018)
| | | | | | | | | | | | |
| | | | |
| | | 1 Year | | | 5 Year | | | 10 Year | |
| Loomis Sayles Small Cap Core Portfolio | | | | | | | | | | | | |
Class A | | | -11.07 | | | | 4.55 | | | | 12.93 | |
Class B | | | -11.30 | | | | 4.29 | | | | 12.64 | |
Class E | | | -11.21 | | | | 4.40 | | | | 12.76 | |
| Russell 2000 Index | | | -11.01 | | | | 4.41 | | | | 11.97 | |
1 The Russell 2000 Index is an unmanaged measure of performance of the 2,000 smallest companies in the Russell 3000 Index.
Portfolio performance is calculated including reinvestment of all income and capital gain distributions. Performance numbers are net of all Portfolio expenses but do not include any insurance, sales, separate account or administrative charges of variable annuity or life insurance contracts or any additional expenses that participants may bear relating to the operations of their plans. If these charges were included, the returns would be lower. The performance of any index referenced above has not been adjusted for ongoing management, distribution and operating expenses, and sales charges applicable to mutual fund investments. Direct investment in any index is not possible. The performance of Class A shares, as set forth in the line graph above, will differ from that of other classes because of the difference in expenses paid by policyholders investing in the different share classes.
This information represents past performance and is not indicative of future results. Investment return and principal value may fluctuate so that shares, upon redemption, may be worth more or less than the original cost.
PORTFOLIO COMPOSITION AS OF DECEMBER 31, 2018
Top Holdings
| | | | |
| | | % of
Net Assets | |
| Euronet Worldwide, Inc. | | | 1.1 | |
| Littelfuse, Inc. | | | 1.1 | |
| AMN Healthcare Services, Inc. | | | 1.0 | |
| Mellanox Technologies, Ltd. | | | 1.0 | |
| ALLETE, Inc. | | | 1.0 | |
| KAR Auction Services, Inc. | | | 0.9 | |
| Employers Holdings, Inc. | | | 0.8 | |
| Ingevity Corp. | | | 0.8 | |
| Viad Corp. | | | 0.8 | |
| RBC Bearings, Inc. | | | 0.8 | |
Top Sectors
| | | | |
| | | % of
Net Assets | |
| Financials | | | 19.2 | |
| Information Technology | | | 17.9 | |
| Industrials | | | 17.3 | |
| Health Care | | | 12.1 | |
| Consumer Discretionary | | | 10.7 | |
| Real Estate | | | 5.2 | |
| Consumer Staples | | | 3.8 | |
| Utilities | | | 3.4 | |
| Materials | | | 3.1 | |
| Communication Services | | | 2.6 | |
BHFTII-3
Brighthouse Funds Trust II
Loomis Sayles Small Cap Core Portfolio
Understanding Your Portfolio’s Expenses
Shareholder Expense Example
As a shareholder of the Portfolio, you incur ongoing costs, including management fees; distribution and service(12b-1) fees; and other Portfolio expenses. This example is intended to help you understand your ongoing costs (in dollars) (referred to as “expenses”) of investing in the Portfolio and compare these costs with the ongoing costs of investing in other mutual funds. The example is based on an investment of $1,000 invested at the beginning of the period and held for the entire period, July 1, 2018 through December 31, 2018.
Actual Expenses
The first line for each share class of the Portfolio in the table below provides information about actual account values and actual expenses. You may use the information in this line, together with the amount you invested in the particular share class of the Portfolio, to estimate the expenses that you paid over the period. Simply divide your account value by $1,000 (for example, an $8,600 account value divided by $1,000 = 8.6), then multiply the result by the number in the first line under the heading entitled “Expenses Paid During Period” to estimate the expenses you paid on your account during this period.
Hypothetical Example for Comparison Purposes
The second line for each share class of the Portfolio in the table below provides information about hypothetical account values and hypothetical expenses based on the Portfolio’s actual expense ratio and an assumed rate of return of 5% per year before expenses, which is not the Portfolio’s actual return. The hypothetical account values and expenses may not be used to estimate the actual ending account balance or expenses you paid for the period. You may use this information to compare the ongoing costs of investing in the Portfolio and other funds. To do so, compare this 5% hypothetical example with the 5% hypothetical examples that appear in the shareholder reports of the other funds.
Please note that the expenses shown in the table are meant to highlight your ongoing costs only and do not reflect any fees or charges of your variable insurance product or any additional expenses that participants in certain eligible qualified plans may bear relating to the operations of their plan. Therefore, the second line for each share class in the table is useful in comparing ongoing costs only, and will not help you determine the relative total costs of owning different funds. In addition, if these other costs were included, your costs would have been higher.
| | | | | | | | | | | | | | | | | | |
Loomis Sayles Small Cap Core Portfolio | | | | Annualized
Expense
Ratio | | | Beginning
Account Value
July 1,
2018 | | | Ending
Account Value
December 31,
2018 | | | Expenses Paid
During Period**
July 1, 2018
to
December 31,
2018 | |
Class A (a) | | Actual | | | 0.88 | % | | $ | 1,000.00 | | | $ | 843.10 | | | $ | 4.09 | |
| | Hypothetical* | | | 0.88 | % | | $ | 1,000.00 | | | $ | 1,020.77 | | | $ | 4.48 | |
| | | | | |
Class B (a) | | Actual | | | 1.13 | % | | $ | 1,000.00 | | | $ | 842.10 | | | $ | 5.25 | |
| | Hypothetical* | | | 1.13 | % | | $ | 1,000.00 | | | $ | 1,019.51 | | | $ | 5.75 | |
| | | | | |
Class E (a) | | Actual | | | 1.03 | % | | $ | 1,000.00 | | | $ | 842.50 | | | $ | 4.78 | |
| | Hypothetical* | | | 1.03 | % | | $ | 1,000.00 | | | $ | 1,020.01 | | | $ | 5.24 | |
| * | Hypothetical assumes a rate of return of 5% per year before expenses. |
| ** | Expenses paid are equal to the Portfolio’s annualized expense ratio for the most recent six month period, as shown above, multiplied by the average account value over the period, multiplied by the number of days (184 days) in the most recent fiscal half-year, divided by 365 (to reflect theone-half year period). |
| (a) | The annualized expense ratio shown reflects the impact of the management fee waiver as described in Note 5 of the Notes to Financial Statements. |
BHFTII-4
Brighthouse Funds Trust II
Loomis Sayles Small Cap Core Portfolio
Schedule of Investments as of December 31, 2018
Common Stocks—97.5% of Net Assets
| | | | | | | | |
| Security Description | | Shares | | | Value | |
|
| Aerospace & Defense—2.2% | |
AAR Corp. | | | 33,304 | | | $ | 1,243,572 | |
Aerojet Rocketdyne Holdings, Inc. (a) (b) | | | 80,335 | | | | 2,830,202 | |
Astronics Corp. (a) | | | 30,698 | | | | 934,754 | |
BWX Technologies, Inc. | | | 28,779 | | | | 1,100,221 | |
Hexcel Corp. (b) | | | 25,049 | | | | 1,436,310 | |
Mercury Systems, Inc. (a) | | | 19,842 | | | | 938,328 | |
| | | | | | | | |
| | | | | | | 8,483,387 | |
| | | | | | | | |
|
| Auto Components—1.4% | |
Cooper Tire & Rubber Co. (b) | | | 60,215 | | | | 1,946,751 | |
Fox Factory Holding Corp. (a) | | | 30,032 | | | | 1,767,984 | |
LCI Industries | | | 14,151 | | | | 945,287 | |
Stoneridge, Inc. (a) | | | 27,595 | | | | 680,216 | |
| | | | | | | | |
| | | | | | | 5,340,238 | |
| | | | | | | | |
|
| Banks—11.7% | |
Ameris Bancorp | | | 19,662 | | | | 622,696 | |
BancorpSouth Bank | | | 83,888 | | | | 2,192,832 | |
Bank OZK (b) | | | 39,676 | | | | 905,803 | |
Bryn Mawr Bank Corp. | | | 59,197 | | | | 2,036,377 | |
Carolina Financial Corp. | | | 27,114 | | | | 802,303 | |
Cathay General Bancorp (b) | | | 73,024 | | | | 2,448,495 | |
CenterState Bank Corp. | | | 95,934 | | | | 2,018,451 | |
Chemical Financial Corp. | | | 78,053 | | | | 2,857,520 | |
CVB Financial Corp. | | | 128,647 | | | | 2,602,529 | |
First Financial Bancorp | | | 90,458 | | | | 2,145,664 | |
First Financial Bankshares, Inc. | | | 27,618 | | | | 1,593,282 | |
Home BancShares, Inc. | | | 129,552 | | | | 2,116,880 | |
Iberiabank Corp. | | | 35,130 | | | | 2,258,156 | |
Pacific Premier Bancorp, Inc. (a) | | | 25,133 | | | | 641,394 | |
PacWest Bancorp (b) | | | 53,740 | | | | 1,788,467 | |
Pinnacle Financial Partners, Inc. | | | 58,445 | | | | 2,694,315 | |
Popular, Inc. | | | 57,298 | | | | 2,705,612 | |
Prosperity Bancshares, Inc. (b) | | | 42,944 | | | | 2,675,411 | |
Signature Bank | | | 15,796 | | | | 1,623,987 | |
Texas Capital Bancshares, Inc. (a) | | | 28,872 | | | | 1,475,070 | |
Triumph Bancorp, Inc. (a) | | | 78,995 | | | | 2,346,152 | |
UMB Financial Corp. | | | 16,364 | | | | 997,713 | |
Wintrust Financial Corp. | | | 40,182 | | | | 2,671,701 | |
| | | | | | | | |
| | | | | | | 44,220,810 | |
| | | | | | | | |
|
| Beverages—0.8% | |
Cott Corp. | | | 156,629 | | | | 2,183,408 | |
MGP Ingredients, Inc. (b) | | | 17,371 | | | | 991,016 | |
| | | | | | | | |
| | | | | | | 3,174,424 | |
| | | | | | | | |
|
| Biotechnology—1.6% | |
Aimmune Therapeutics, Inc. (a) (b) | | | 34,485 | | | | 824,881 | |
Argenx SE (ADR) (a) | | | 12,057 | | | | 1,158,316 | |
Blueprint Medicines Corp. (a) | | | 14,125 | | | | 761,479 | |
Genomic Health, Inc. (a) | | | 23,025 | | | | 1,483,040 | |
Myriad Genetics, Inc. (a) | | | 28,686 | | | | 833,902 | |
Xencor, Inc. (a) | | | 25,103 | | | | 907,725 | |
| | | | | | | | |
| | | | | | | 5,969,343 | |
| | | | | | | | |
|
| Building Products—1.9% | |
AAON, Inc. | | | 12,621 | | | $ | 442,492 | |
Armstrong World Industries, Inc. | | | 37,848 | | | | 2,203,132 | |
Masonite International Corp. (a) | | | 26,067 | | | | 1,168,584 | |
Resideo Technologies, Inc. (a) | | | 92,388 | | | | 1,898,573 | |
Trex Co., Inc. (a) | | | 26,889 | | | | 1,596,131 | |
| | | | | | | | |
| | | | | | | 7,308,912 | |
| | | | | | | | |
|
| Capital Markets—1.3% | |
Artisan Partners Asset Management, Inc. - Class A | | | 29,863 | | | | 660,271 | |
Donnelley Financial Solutions, Inc. (a) | | | 122,388 | | | | 1,717,104 | |
Hercules Capital, Inc. | | | 72,230 | | | | 798,141 | |
Stifel Financial Corp. | | | 46,489 | | | | 1,925,574 | |
| | | | | | | | |
| | | | | | | 5,101,090 | |
| | | | | | | | |
|
| Chemicals—2.8% | |
AdvanSix, Inc. (a) | | | 78,722 | | | | 1,916,093 | |
Ashland Global Holdings, Inc. | | | 22,086 | | | | 1,567,223 | |
Cabot Corp. | | | 40,908 | | | | 1,756,589 | |
Ingevity Corp. (a) | | | 35,498 | | | | 2,970,828 | |
Minerals Technologies, Inc. | | | 13,763 | | | | 706,592 | |
WR Grace & Co. | | | 26,112 | | | | 1,694,930 | |
| | | | | | | | |
| | | | | | | 10,612,255 | |
| | | | | | | | |
|
| Commercial Services & Supplies—2.4% | |
Clean Harbors, Inc. (a) | | | 33,861 | | | | 1,671,040 | |
KAR Auction Services, Inc. | | | 70,931 | | | | 3,384,827 | |
Kimball International, Inc. - Class B | | | 74,366 | | | | 1,055,254 | |
Viad Corp. | | | 58,200 | | | | 2,915,238 | |
| | | | | | | | |
| | | | | | | 9,026,359 | |
| | | | | | | | |
|
| Communications Equipment—0.6% | |
Digi International, Inc. (a) | | | 95,393 | | | | 962,515 | |
Viavi Solutions, Inc. (a) | | | 119,300 | | | | 1,198,965 | |
| | | | | | | | |
| | | | | | | 2,161,480 | |
| | | | | | | | |
|
| Construction & Engineering—0.5% | |
MYR Group, Inc. (a) | | | 24,384 | | | | 686,897 | |
Primoris Services Corp. | | | 54,077 | | | | 1,034,493 | |
| | | | | | | | |
| | | | | | | 1,721,390 | |
| | | | | | | | |
|
| Consumer Finance—0.8% | |
Green Dot Corp. - Class A (a) | | | 22,014 | | | | 1,750,553 | |
PRA Group, Inc. (a) (b) | | | 47,374 | | | | 1,154,505 | |
| | | | | | | | |
| | | | | | | 2,905,058 | |
| | | | | | | | |
|
| Distributors—0.6% | |
Core-Mark Holding Co., Inc. | | | 16,902 | | | | 392,972 | |
Pool Corp. | | | 13,076 | | | | 1,943,747 | |
| | | | | | | | |
| | | | | | | 2,336,719 | |
| | | | | | | | |
|
| Diversified Consumer Services—2.6% | |
Adtalem Global Education, Inc. (a) | | | 23,401 | | | | 1,107,335 | |
Bright Horizons Family Solutions, Inc. (a) | | | 12,271 | | | | 1,367,603 | |
Chegg, Inc. (a) (b) | | | 56,592 | | | | 1,608,345 | |
See accompanying notes to financial statements.
BHFTII-5
Brighthouse Funds Trust II
Loomis Sayles Small Cap Core Portfolio
Schedule of Investments as of December 31, 2018
Common Stocks—(Continued)
| | | | | | | | |
| Security Description | | Shares | | | Value | |
|
| Diversified Consumer Services—(Continued) | |
frontdoor, Inc. (a) | | | 19,192 | | | $ | 510,699 | �� |
Grand Canyon Education, Inc. (a) | | | 20,435 | | | | 1,964,621 | |
Laureate Education, Inc. - Class A (a) | | | 112,485 | | | | 1,714,271 | |
ServiceMaster Global Holdings, Inc. (a) | | | 38,385 | | | | 1,410,265 | |
| | | | | | | | |
| | | | | | | 9,683,139 | |
| | | | | | | | |
|
| Diversified Financial Services—0.3% | |
Cannae Holdings, Inc. (a) | | | 73,360 | | | | 1,255,923 | |
| | | | | | | | |
|
| Diversified Telecommunication Services—0.4% | |
Cogent Communications Holdings, Inc. | | | 32,529 | | | | 1,470,636 | |
| | | | | | | | |
|
| Electric Utilities—1.0% | |
ALLETE, Inc. | | | 48,118 | | | | 3,667,554 | |
| | | | | | | | |
|
| Electrical Equipment—0.9% | |
Generac Holdings, Inc. (a) | | | 33,833 | | | | 1,681,500 | |
TPI Composites, Inc. (a) (b) | | | 74,238 | | | | 1,824,770 | |
| | | | | | | | |
| | | | | | | 3,506,270 | |
| | | | | | | | |
|
| Electronic Equipment, Instruments & Components—2.3% | |
II-VI, Inc. (a) (b) | | | 26,463 | | | | 858,989 | |
Kimball Electronics, Inc. (a) | | | 31,991 | | | | 495,540 | |
Littelfuse, Inc. | | | 23,346 | | | | 4,003,372 | |
Methode Electronics, Inc. | | | 43,423 | | | | 1,011,322 | |
Novanta, Inc. (a) | | | 8,006 | | | | 504,378 | |
Rogers Corp. (a) | | | 6,902 | | | | 683,712 | |
Vishay Intertechnology, Inc. (b) | | | 60,772 | | | | 1,094,504 | |
| | | | | | | | |
| | | | | | | 8,651,817 | |
| | | | | | | | |
|
| Energy Equipment & Services—1.4% | |
Apergy Corp. (a) | | | 64,606 | | | | 1,749,530 | |
C&J Energy Services, Inc. (a) | | | 91,483 | | | | 1,235,021 | |
Cactus, Inc. - Class A (a) | | | 44,886 | | | | 1,230,325 | |
KLX Energy Services Holdings, Inc. (a) | | | 42,127 | | | | 987,878 | |
| | | | | | | | |
| | | | | | | 5,202,754 | |
| | | | | | | | |
|
| Entertainment—0.5% | |
IMAX Corp. (a) | | | 65,310 | | | | 1,228,481 | |
Liberty Braves Group - Class C (a) | | | 26,346 | | | | 655,752 | |
| | | | | | | | |
| | | | | | | 1,884,233 | |
| | | | | | | | |
|
| Equity Real Estate Investment Trusts—5.2% | |
American Campus Communities, Inc. | | | 38,783 | | | | 1,605,228 | |
Corepoint Lodging, Inc. | | | 32,847 | | | | 402,376 | |
CubeSmart | | | 96,732 | | | | 2,775,241 | |
CyrusOne, Inc. (b) | | | 37,480 | | | | 1,981,942 | |
iStar, Inc. (b) | | | 183,427 | | | | 1,682,026 | |
JBG SMITH Properties | | | 62,434 | | | | 2,173,328 | |
National Retail Properties, Inc. (b) | | | 31,847 | | | | 1,544,898 | |
Retail Opportunity Investments Corp. | | | 178,706 | | | | 2,837,851 | |
Rexford Industrial Realty, Inc. | | | 65,662 | | | | 1,935,059 | |
Ryman Hospitality Properties, Inc. | | | 25,498 | | | | 1,700,462 | |
Sabra Health Care REIT, Inc. | | | 57,386 | | | | 945,721 | |
| | | | | | | | |
| | | | | | | 19,584,132 | |
| | | | | | | | |
|
| Food & Staples Retailing—0.3% | |
Chefs’ Warehouse, Inc. (The) (a) | | | 38,016 | | | | 1,215,752 | |
| | | | | | | | |
|
| Food Products—2.6% | |
Darling Ingredients, Inc. (a) | | | 60,799 | | | | 1,169,773 | |
Freshpet, Inc. (a) (b) | | | 44,867 | | | | 1,442,923 | |
J&J Snack Foods Corp. | | | 15,915 | | | | 2,301,150 | |
Nomad Foods, Ltd. (a) | | | 162,805 | | | | 2,722,099 | |
Post Holdings, Inc. (a) (b) | | | 24,082 | | | | 2,146,429 | |
| | | | | | | | |
| | | | | | | 9,782,374 | |
| | | | | | | | |
|
| Health Care Equipment & Supplies—4.0% | |
AtriCure, Inc. (a) | | | 53,517 | | | | 1,637,620 | |
Avanos Medical, Inc. (a) (b) | | | 45,994 | | | | 2,060,071 | |
Insulet Corp. (a) (b) | | | 21,945 | | | | 1,740,678 | |
iRhythm Technologies, Inc. (a) | | | 19,660 | | | | 1,365,977 | |
Merit Medical Systems, Inc. (a) | | | 24,336 | | | | 1,358,192 | |
Penumbra, Inc. (a) (b) | | | 7,987 | | | | 976,011 | |
Quidel Corp. (a) | | | 31,577 | | | | 1,541,589 | |
Tactile Systems Technology, Inc. (a) | | | 17,620 | | | | 802,591 | |
Varex Imaging Corp. (a) | | | 76,538 | | | | 1,812,420 | |
Wright Medical Group NV (a) (b) | | | 69,910 | | | | 1,902,950 | |
| | | | | | | | |
| | | | | | | 15,198,099 | |
| | | | | | | | |
|
| Health Care Providers & Services—2.0% | |
Amedisys, Inc. (a) | | | 13,227 | | | | 1,549,014 | |
AMN Healthcare Services, Inc. (a) | | | 69,293 | | | | 3,926,141 | |
BioTelemetry, Inc. (a) | | | 26,965 | | | | 1,610,350 | |
LHC Group, Inc. (a) | | | 6,901 | | | | 647,866 | |
| | | | | | | | |
| | | | | | | 7,733,371 | |
| | | | | | | | |
|
| Health Care Technology—1.8% | |
Evolent Health, Inc. - Class A (a) (b) | | | 44,323 | | | | 884,244 | |
HMS Holdings Corp. (a) | | | 26,936 | | | | 757,710 | |
Medidata Solutions, Inc. (a) (b) | | | 26,314 | | | | 1,774,090 | |
Teladoc Health, Inc. (a) (b) | | | 26,582 | | | | 1,317,670 | |
Vocera Communications, Inc. (a) (b) | | | 50,850 | | | | 2,000,947 | |
| | | | | | | | |
| | | | | | | 6,734,661 | |
| | | | | | | | |
|
| Hotels, Restaurants & Leisure—2.5% | |
Churchill Downs, Inc. | | | 10,154 | | | | 2,476,967 | |
Cracker Barrel Old Country Store, Inc. (b) | | | 5,394 | | | | 862,285 | |
Marriott Vacations Worldwide Corp. | | | 28,405 | | | | 2,002,837 | |
Planet Fitness, Inc. - Class A (a) (b) | | | 39,528 | | | | 2,119,491 | |
Wingstop, Inc. | | | 29,916 | | | | 1,920,308 | |
| | | | | | | | |
| | | | | | | 9,381,888 | |
| | | | | | | | |
|
| Household Durables—0.6% | |
Helen of Troy, Ltd. (a) | | | 18,355 | | | | 2,407,809 | |
| | | | | | | | |
|
| Independent Power and Renewable Electricity Producers—1.3% | |
NextEra Energy Partners LP (b) | | | 56,995 | | | | 2,453,635 | |
Vistra Energy Corp. (a) | | | 103,957 | | | | 2,379,575 | |
| | | | | | | | |
| | | | | | | 4,833,210 | |
| | | | | | | | |
See accompanying notes to financial statements.
BHFTII-6
Brighthouse Funds Trust II
Loomis Sayles Small Cap Core Portfolio
Schedule of Investments as of December 31, 2018
Common Stocks—(Continued)
| | | | | | | | |
| Security Description | | Shares | | | Value | |
|
| Industrial Conglomerates—0.6% | |
Raven Industries, Inc. | | | 59,151 | | | $ | 2,140,675 | |
| | | | | | | | |
|
| Insurance—3.7% | |
Employers Holdings, Inc. | | | 75,036 | | | | 3,149,261 | |
First American Financial Corp. | | | 42,713 | | | | 1,906,708 | |
Goosehead Insurance, Inc. - Class A (a) (b) | | | 35,811 | | | | 941,471 | |
Kinsale Capital Group, Inc. (b) | | | 32,803 | | | | 1,822,535 | |
ProAssurance Corp. | | | 40,245 | | | | 1,632,337 | |
Reinsurance Group of America, Inc. | | | 19,152 | | | | 2,685,685 | |
Stewart Information Services Corp. | | | 19,533 | | | | 808,666 | |
Trupanion, Inc. (a) (b) | | | 46,884 | | | | 1,193,667 | |
| | | | | | | | |
| | | | | | | 14,140,330 | |
| | | | | | | | |
|
| Interactive Media & Services—0.2% | |
IAC/InterActiveCorp (a) | | | 3,568 | | | | 653,087 | |
| | | | | | | | |
|
| Internet & Direct Marketing Retail—0.2% | |
Duluth Holdings, Inc. - Class B (a) (b) | | | 36,309 | | | | 916,076 | |
| | | | | | | | |
|
| IT Services—5.3% | |
Conduent, Inc. (a) | | | 145,416 | | | | 1,545,772 | |
CSG Systems International, Inc. | | | 39,060 | | | | 1,240,936 | |
Euronet Worldwide, Inc. (a) | | | 39,741 | | | | 4,068,683 | |
EVERTEC, Inc. | | | 29,459 | | | | 845,473 | |
Evo Payments, Inc. - Class A (a) (b) | | | 55,836 | | | | 1,377,474 | |
Genpact, Ltd. | | | 75,014 | | | | 2,024,628 | |
InterXion Holding NV (a) | | | 31,273 | | | | 1,693,746 | |
Perspecta, Inc. | | | 117,487 | | | | 2,023,126 | |
Virtusa Corp. (a) | | | 34,308 | | | | 1,461,178 | |
WEX, Inc. (a) | | | 16,345 | | | | 2,289,281 | |
WNS Holdings, Ltd. (ADR) (a) | | | 39,904 | | | | 1,646,439 | |
| | | | | | | | |
| | | | | | | 20,216,736 | |
| | | | | | | | |
|
| Leisure Products—0.2% | |
Malibu Boats, Inc. - Class A (a) | | | 25,481 | | | | 886,739 | |
| | | | | | | | |
|
| Life Sciences Tools & Services—1.3% | |
Cambrex Corp. (a) (b) | | | 54,836 | | | | 2,070,607 | |
NeoGenomics, Inc. (a) | | | 64,622 | | | | 814,884 | |
PRA Health Sciences, Inc. (a) | | | 22,803 | | | | 2,096,964 | |
| | | | | | | | |
| | | | | | | 4,982,455 | |
| | | | | | | | |
|
| Machinery—5.3% | |
Alamo Group, Inc. | | | 14,965 | | | | 1,157,094 | |
Albany International Corp. - Class A | | | 27,333 | | | | 1,706,399 | |
Altra Industrial Motion Corp. | | | 57,600 | | | | 1,448,640 | |
Chart Industries, Inc. (a) | | | 15,037 | | | | 977,856 | |
Columbus McKinnon Corp. | | | 60,543 | | | | 1,824,766 | |
EnPro Industries, Inc. | | | 30,064 | | | | 1,806,847 | |
Harsco Corp. (a) | | | 112,442 | | | | 2,233,098 | |
John Bean Technologies Corp. | | | 13,507 | | | | 969,938 | |
Kadant, Inc. | | | 17,934 | | | | 1,460,904 | |
Kornit Digital, Ltd. (a) (b) | | | 51,078 | | | | 956,180 | |
Proto Labs, Inc. (a) | | | 14,341 | | | | 1,617,521 | |
RBC Bearings, Inc. (a) | | | 21,798 | | | | 2,857,718 | |
|
| Machinery—(Continued) | |
Standex International Corp. | | | 15,674 | | | | 1,052,979 | |
| | | | | | | | |
| | | | | | | 20,069,940 | |
| | | | | | | | |
|
| Marine—0.3% | |
Kirby Corp. (a) | | | 17,389 | | | | 1,171,323 | |
| | | | | | | | |
|
| Media—1.6% | |
GCI Liberty, Inc. - Class A (a) | | | 53,435 | | | | 2,199,385 | |
Gray Television, Inc. (a) (b) | | | 159,944 | | | | 2,357,574 | |
John Wiley & Sons, Inc. - Class A | | | 30,665 | | | | 1,440,335 | |
| | | | | | | | |
| | | | | | | 5,997,294 | |
| | | | | | | | |
|
| Metals & Mining—0.3% | |
Ferroglobe Representation & Warranty Insurance Trust (a) (c) | | | 141,548 | | | | 0 | |
Haynes International, Inc. | | | 37,282 | | | | 984,245 | |
| | | | | | | | |
| | | | | | | 984,245 | |
| | | | | | | | |
|
| Multi-Utilities—1.2% | |
MDU Resources Group, Inc. | | | 81,083 | | | | 1,933,019 | |
NorthWestern Corp. | | | 42,410 | | | | 2,520,850 | |
| | | | | | | | |
| | | | | | | 4,453,869 | |
| | | | | | | | |
|
| Multiline Retail—0.4% | |
Big Lots, Inc. (b) | | | 50,203 | | | | 1,451,871 | |
| | | | | | | | |
|
| Oil, Gas & Consumable Fuels—0.9% | |
PDC Energy, Inc. (a) | | | 23,723 | | | | 705,997 | |
QEP Resources, Inc. (a) | | | 86,445 | | | | 486,685 | |
SRC Energy, Inc. (a) (b) | | | 196,779 | | | | 924,861 | |
Viper Energy Partners LP | | | 42,325 | | | | 1,102,143 | |
| | | | | | | | |
| | | | | | | 3,219,686 | |
| | | | | | | | |
|
| Pharmaceuticals—1.3% | |
Catalent, Inc. (a) | | | 55,032 | | | | 1,715,898 | |
Horizon Pharma plc (a) | | | 33,128 | | | | 647,321 | |
Prestige Consumer Healthcare, Inc. (a) (b) | | | 57,057 | | | | 1,761,920 | |
Supernus Pharmaceuticals, Inc. (a) (b) | | | 25,625 | | | | 851,263 | |
| | | | | | | | |
| | | | | | | 4,976,402 | |
| | | | | | | | |
|
| Professional Services—1.7% | |
Huron Consulting Group, Inc. (a) | | | 22,012 | | | | 1,129,436 | |
ICF International, Inc. | | | 13,748 | | | | 890,595 | |
Insperity, Inc. | | | 22,037 | | | | 2,057,374 | |
Korn/Ferry International | | | 55,349 | | | | 2,188,500 | |
| | | | | | | | |
| | | | | | | 6,265,905 | |
| | | | | | | | |
|
| Road & Rail—0.9% | |
Genesee & Wyoming, Inc. - Class A (a) | | | 25,532 | | | | 1,889,879 | |
Old Dominion Freight Line, Inc. (b) | | | 11,243 | | | | 1,388,398 | |
| | | | | | | | |
| | | | | | | 3,278,277 | |
| | | | | | | | |
|
| Semiconductors & Semiconductor Equipment—3.0% | |
Advanced Energy Industries, Inc. (a) | | | 36,828 | | | | 1,581,026 | |
Mellanox Technologies, Ltd. (a) | | | 40,582 | | | | 3,748,965 | |
See accompanying notes to financial statements.
BHFTII-7
Brighthouse Funds Trust II
Loomis Sayles Small Cap Core Portfolio
Schedule of Investments as of December 31, 2018
Common Stocks—(Continued)
| | | | | | | | |
| Security Description | | Shares | | | Value | |
|
| Semiconductors & Semiconductor Equipment—(Continued) | |
MKS Instruments, Inc. | | | 13,168 | | | $ | 850,784 | |
Monolithic Power Systems, Inc. | | | 13,398 | | | | 1,557,518 | |
Semtech Corp. (a) | | | 15,450 | | | | 708,692 | |
Silicon Laboratories, Inc. (a) | | | 16,947 | | | | 1,335,593 | |
Ultra Clean Holdings, Inc. (a) (b) | | | 80,315 | | | | 680,268 | |
Versum Materials, Inc. | | | 31,932 | | | | 885,155 | |
| | | | | | | | |
| | | | | | | 11,348,001 | |
| | | | | | | | |
|
| Software—6.5% | |
CommVault Systems, Inc. (a) | | | 36,028 | | | | 2,128,894 | |
Cornerstone OnDemand, Inc. (a) | | | 20,068 | | | | 1,012,029 | |
Envestnet, Inc. (a) | | | 31,288 | | | | 1,539,057 | |
Five9, Inc. (a) | | | 47,416 | | | | 2,073,028 | |
Globant S.A. (a) | | | 16,707 | | | | 940,938 | |
Guidewire Software, Inc. (a) (b) | | | 20,373 | | | | 1,634,526 | |
HubSpot, Inc. (a) (b) | | | 11,750 | | | | 1,477,327 | |
LogMeIn, Inc. | | | 18,215 | | | | 1,485,798 | |
Mimecast, Ltd. (a) | | | 49,447 | | | | 1,662,903 | |
Q2 Holdings, Inc. (a) | | | 37,413 | | | | 1,853,814 | |
Rapid7, Inc. (a) | | | 50,857 | | | | 1,584,704 | |
RealPage, Inc. (a) | | | 34,308 | | | | 1,653,303 | |
RingCentral, Inc. - Class A (a) | | | 21,975 | | | | 1,811,619 | |
TiVo Corp. | | | 101,535 | | | | 955,444 | |
Varonis Systems, Inc. (a) | | | 17,976 | | | | 950,930 | |
Verint Systems, Inc. (a) | | | 38,164 | | | | 1,614,719 | |
| | | | | | | | |
| | | | | | | 24,379,033 | |
| | | | | | | | |
|
| Specialty Retail—0.9% | |
Aaron’s, Inc. | | | 44,091 | | | | 1,854,027 | |
Genesco, Inc. (a) (b) | | | 15,874 | | | | 703,218 | |
Sally Beauty Holdings, Inc. (a) (b) | | | 48,199 | | | | 821,793 | |
| | | | | | | | |
| | | | | | | 3,379,038 | |
| | | | | | | | |
|
| Technology Hardware, Storage & Peripherals—0.2% | |
Cray, Inc. (a) | | | 42,608 | | | | 919,907 | |
| | | | | | | | |
|
| Textiles, Apparel & Luxury Goods—1.3% | |
Columbia Sportswear Co. | | | 20,182 | | | | 1,697,104 | |
Crocs, Inc. (a) | | | 70,005 | | | | 1,818,730 | |
Steven Madden, Ltd. | | | 42,525 | | | | 1,286,807 | |
| | | | | | | | |
| | | | | | | 4,802,641 | |
| | | | | | | | |
|
| Thrifts & Mortgage Finance—1.3% | |
Essent Group, Ltd. (a) | | | 20,174 | | | | 689,547 | |
Federal Agricultural Mortgage Corp. - Class C | | | 21,608 | | | | 1,305,987 | |
Meta Financial Group, Inc. | | | 62,223 | | | | 1,206,504 | |
OceanFirst Financial Corp. | | | 78,960 | | | | 1,777,390 | |
| | | | | | | | |
| | | | | | | 4,979,428 | |
| | | | | | | | |
|
| Trading Companies & Distributors—0.6% | |
BMC Stock Holdings, Inc. (a) | | | 52,007 | | | | 805,068 | |
|
| Trading Companies & Distributors—(Continued) | |
SiteOne Landscape Supply, Inc. (a) (b) | | | 25,302 | | | | 1,398,442 | |
| | | | | | | | |
| | | | | | | 2,203,510 | |
| | | | | | | | |
Total Common Stocks
(Cost $303,421,535) | | | | | | | 368,371,555 | |
| | | | | | | | |
|
| Short-Term Investment—2.4% | |
|
| Repurchase Agreement—2.4% | |
Fixed Income Clearing Corp.
Repurchase Agreement dated 12/31/18 at 1.200%, due on 01/02/19 with a maturity value of $9,242,118; collateralized by U.S. Treasury Note at 2.875%, maturing 10/31/23, with a market value of $9,428,124. | | | 9,241,502 | | | | 9,241,502 | |
| | | | | | | | |
Total Short-Term Investments
(Cost $9,241,502) | | | | | | | 9,241,502 | |
| | | | | | | | |
|
| Securities Lending Reinvestments (d)—14.4% | |
|
| Certificates of Deposit—6.9% | |
Banco Del Estado De Chile New York
2.820%, 1M LIBOR + 0.350%, 05/20/19 (e) | | | 1,000,000 | | | | 999,979 | |
Bank of Nova Scotia
3.072%, 3M LIBOR + 0.280%, 03/20/19 (e) | | | 1,500,000 | | | | 1,500,598 | |
Barclays Bank plc
2.547%, 1M LIBOR + 0.200%, 02/04/19 (e) | | | 2,000,000 | | | | 1,999,810 | |
BNP Paribas S.A. New York
2.647%, 1M LIBOR + 0.300%, 06/04/19 (e) | | | 1,000,000 | | | | 999,598 | |
Credit Agricole S.A.
2.799%, 1M LIBOR + 0.320%, 05/21/19 (e) | | | 1,000,000 | | | | 1,000,063 | |
Credit Industriel et Commercial
Zero Coupon, 01/25/19 | | | 987,228 | | | | 998,300 | |
Credit Industriel et Commercial (NY)
2.629%, 1M LIBOR + 0.250%, 02/05/19 (e) | | | 1,500,000 | | | | 1,500,038 | |
Industrial & Commercial Bank of China, Ltd.
2.850%, 02/15/19 | | | 2,000,000 | | | | 1,999,852 | |
Mizuho Bank, Ltd., New York
2.649%, 1M LIBOR + 0.300%, 05/01/19 (e) | | | 2,000,000 | | | | 2,000,012 | |
Royal Bank of Canada New York
2.650%, 1M LIBOR + 0.250%, 01/11/19 (e) | | | 1,500,000 | | | | 1,500,012 | |
Standard Chartered plc
2.686%, 1M LIBOR + 0.180%, 02/25/19 (e) | | | 2,000,000 | | | | 1,999,942 | |
2.717%, 3M LIBOR + 0.230%, 04/24/19 (e) | | | 1,000,000 | | | | 999,782 | |
Sumitomo Mitsui Banking Corp.
2.590%, 1M LIBOR + 0.190%, 04/11/19 (e) | | | 2,000,000 | | | | 1,999,266 | |
2.700%, 02/25/19 | | | 1,000,000 | | | | 1,000,092 | |
Sumitomo Mitsui Trust Bank, Ltd.
Zero Coupon, 03/12/19 | | | 992,778 | | | | 994,570 | |
U.S. Bank N.A.
2.764%, 1M LIBOR + 0.260%, 07/23/19 (e) | | | 1,000,000 | | | | 1,000,000 | |
Wells Fargo Bank N.A.
2.560%, 3M LIBOR + 0.140%, 07/11/19 (e) | | | 2,500,000 | | | | 2,502,168 | |
Westpac Banking Corp.
2.850%, FEDEFF PRV + 0.450%, 02/15/19 (e) | | | 1,000,000 | | | | 999,994 | |
| | | | | | | | |
| | | | | | | 25,994,076 | |
| | | | | | | | |
See accompanying notes to financial statements.
BHFTII-8
Brighthouse Funds Trust II
Loomis Sayles Small Cap Core Portfolio
Schedule of Investments as of December 31, 2018
Securities Lending Reinvestments (d)—(Continued)
| | | | | | | | |
| Security Description | | Principal
Amount* | | | Value | |
|
| Commercial Paper—2.8% | |
Banco Santander S.A.
2.740%, 02/07/19 | | | 1,985,996 | | | $ | 1,994,176 | |
HSBC Bank plc
2.842%, 1M LIBOR + 0.320%, 07/30/19 (e) | | | 1,000,000 | | | | 1,000,000 | |
ING Funding LLC
2.725%, 3M LIBOR + 0.110%, 05/10/19 (e) | | | 3,000,000 | | | | 2,999,646 | |
Toronto-Dominion Bank
2.729%, 1M LIBOR + 0.350%, 11/05/19 (e) | | | 1,000,000 | | | | 999,890 | |
UBS AG
2.779%, 1M LIBOR + 0.430%, 02/01/19 (e) | | | 1,500,000 | | | | 1,500,367 | |
Westpac Banking Corp.
2.784%, 1M LIBOR + 0.280%, 05/24/19 (e) | | | 2,000,000 | | | | 1,999,920 | |
| | | | | | | | |
| | | | | | | 10,493,999 | |
| | | | | | | | |
|
| Repurchase Agreements—4.4% | |
Citadel Clearing LLC
Repurchase Agreement dated 12/31/18 at 3.000%, due on 04/02/19 with a maturity value of $4,030,667; collateralized by various Common Stock with an aggregate market value of $4,400,733. | | | 4,000,000 | | | | 4,000,000 | |
Citigroup Global Markets, Inc.
Repurchase Agreement dated 12/31/18 at 2.790%, due on 02/04/19 with a maturity value of $1,002,713; collateralized by U.S. Treasury Obligations at 0.000%, maturing 02/12/19, and various Common Stock with an aggregate market value of $1,088,319. | | | 1,000,000 | | | | 1,000,000 | |
Repurchase Agreement dated 12/31/18 at 2.940%, due on 04/02/19 with a maturity value of $201,503; collateralized by U.S. Treasury Obligations with rates ranging from 1.125% - 2.750%, maturity dates ranging from 01/31/19 - 08/15/24, and an aggregate market value of $204,000. | | | 200,000 | | | | 200,000 | |
Citigroup Global Markets, Ltd.
Repurchase Agreement dated 12/31/18 at 2.490%, due on 01/02/19 with a maturity value of $300,042; collateralized by U.S. Treasury Obligations with rates ranging from 0.375% - 1.875%, maturity dates ranging from 12/15/20 - 01/15/27, and an aggregate market value of $306,000. | | | 300,000 | | | | 300,000 | |
Repurchase Agreement dated 12/31/18 at 2.490%, due on 01/02/19 with a maturity value of $400,055; collateralized by U.S. Treasury Obligations with rates ranging from 1.625% - 2.875%, maturity dates ranging from 06/30/20 - 11/15/46, and an aggregate market value of $408,000. | | | 400,000 | | | | 400,000 | |
Deutsche Bank AG, London
Repurchase Agreement dated 12/31/18 at 2.750%, due on 01/02/19 with a maturity value of $200,031; collateralized by U.S. Treasury and Foreign Obligations with rates ranging from 1.000% - 2.590%, maturity dates ranging from 03/31/19 - 12/29/26, and an aggregate market value of $204,000. | | | 200,000 | | | | 200,000 | |
Deutsche Bank Securities, Inc.
Repurchase Agreement dated 12/31/18 at 3.200%, due on 01/02/19 with a maturity value of $3,681,233; collateralized by U.S. Treasury Obligations at 0.000%, maturity dates ranging from 08/15/30 - 08/15/39, and an aggregate market value of $3,754,190. | | | 3,680,579 | | | | 3,680,579 | |
|
| Repurchase Agreements—(Continued) | |
Merrill Lynch, Pierce, Fenner & Smith, Inc.
Repurchase Agreement dated 12/31/18 at 2.940%, due on 04/02/19 with a maturity value of $201,503; collateralized by various Common Stock with an aggregate market value of $220,000. | | | 200,000 | | | | 200,000 | |
Repurchase Agreement dated 12/31/18 at 2.940%, due on 04/02/19 with a maturity value of $2,266,905; collateralized by various Common Stock with an aggregate market value of $2,475,000. | | | 2,250,000 | | | | 2,250,000 | |
NBC Global Finance, Ltd.
Repurchase Agreement dated 12/31/18 at 2.560%, due on 01/02/19 with a maturity value of $700,100; collateralized by various Common Stock with an aggregate market value of $779,249. | | | 700,000 | | | | 700,000 | |
Repurchase Agreement dated 12/31/18 at 2.560%, due on 01/02/19 with a maturity value of $2,000,284; collateralized by various Common Stock with an aggregate market value of $2,226,425. | | | 2,000,000 | | | | 2,000,000 | |
Societe Generale
Repurchase Agreement dated 12/31/18 at 2.530%, due on 01/02/19 with a maturity value of $700,098; collateralized by U.S. Treasury Obligations with rates ranging from 0.750% - 8.000%, maturity dates ranging from 09/30/19 - 08/15/46, and various Common Stock with an aggregate market value of $766,833. | | | 700,000 | | | | 700,000 | |
Repurchase Agreement dated 12/31/18 at 2.530%, due on 01/02/19 with a maturity value of $600,084; collateralized by U.S. Treasury Obligations with rates ranging from 0.750% - 8.000%, maturity dates ranging from 09/30/19 - 08/15/46, and various Common Stock with an aggregate market value of $657,286. | | | 600,000 | | | | 600,000 | |
Repurchase Agreement dated 12/31/18 at 2.530%, due on 01/02/19 with a maturity value of $500,070; collateralized by U.S. Treasury Obligations with rates ranging from 0.750% - 8.000%, maturity dates ranging from 09/30/19 - 08/15/46, and various Common Stock with an aggregate market value of $547,738. | | | 500,000 | | | | 500,000 | |
| | | | | | | | |
| | | | | | | 16,730,579 | |
| | | | | | | | |
|
| Time Deposit—0.3% | |
Royal Bank of Canada
2.420%, 01/02/19 | | | 1,000,000 | | | | 1,000,000 | |
| | | | | | | | |
Total Securities Lending Reinvestments
(Cost $54,217,957) | | | | | | | 54,218,654 | |
| | | | | | | | |
Total Investments—114.3%
(Cost $366,880,994) | | | | | | | 431,831,711 | |
Other assets and liabilities (net)—(14.3)% | | | | | | | (54,096,480 | ) |
| | | | | | | | |
| Net Assets—100.0% | | | | | | $ | 377,735,231 | |
| | | | | | | | |
| |
See accompanying notes to financial statements.
BHFTII-9
Brighthouse Funds Trust II
Loomis Sayles Small Cap Core Portfolio
Schedule of Investments as of December 31, 2018
| | | | |
| * | | Principal amount stated in U.S. dollars unless otherwise noted. |
| (a) | | Non-income producing security. |
| (b) | | All or a portion of the security was held on loan. As of December 31, 2018, the market value of securities loaned was $53,891,134 and the collateral received consisted of cash in the amount of $54,196,580 andnon-cash collateral with a value of $573,558. The cash collateral investments are disclosed in the Schedule of Investments and categorized as Securities Lending Reinvestments. Thenon-cash collateral received consists of U.S. government securities that are held in safe- keeping by the lending agent, or a third-party custodian, cannot be sold or repledged by the Portfolio. As such, this collateral is excluded from the Statement of Assets and Liabilities. |
| (c) | | Illiquid security. As of December 31, 2018, these securities represent 0.0% of net assets. |
| (d) | | Represents investment of cash collateral received from securities on loan as of December 31, 2018. |
| (e) | | Variable or floating rate security. The stated rate represents the rate at December 31, 2018. Maturity date shown for callable securities reflects the earliest possible call date. For securities based on a published reference index and spread, the index and spread are indicated in the description above. For certain variable rate securities, the coupon rate is determined by the issuer/agent based on current market conditions. For certain asset- and mortgage-backed securities, the coupon rate may fluctuate based on changes of the underlying collateral or prepayments of principal. These securities do not indicate a reference index and spread in their description above. |
| (ADR)— | | American Depositary Receipt |
| (FEDEFF PRV)— | | Effective Federal Funds Rate |
| (LIBOR)— | | London Interbank Offered Rate |
Fair Value Hierarchy
Accounting principles generally accepted in the United States of America (“GAAP”) define fair market value as the price that the Portfolio would receive to sell an asset or pay to transfer a liability in an orderly transaction between market participants at the measurement date. It establishes a fair value hierarchy that prioritizes inputs to valuation methods and requires disclosure of the fair value hierarchy, separately for each major category of assets and liabilities, that segregates fair value measurements into three levels. Levels 1, 2 and 3 of the fair value hierarchy are defined as follows:
Level 1 - unadjusted quoted prices in active markets for identical investments
Level 2 - other significant observable inputs (including, but not limited to, quoted prices for similar assets or liabilities in markets that are either active or inactive; inputs other than quoted prices that are observable such as interest rates, yield curves, volatilities, prepayment speeds, loss severities, credit risks, default rates, or other market corroborated inputs)
Level 3 - significant unobservable inputs based on the best information available in the circumstances, to the extent observable inputs are unavailable (including the Portfolio’s own assumptions used in determining the fair value of investments and derivative financial instruments)
The inputs or methodologies used for valuing investments are not necessarily an indication of the risk associated with investing in them. Changes to the inputs or methodologies used may result in transfers between levels. A reconciliation of Level 3 securities, if any, will be disclosed following the fair value hierarchy table. For more information about the Portfolio’s policy regarding the valuation of investments, please refer to the Notes to Financial Statements.
The following table summarizes the fair value hierarchy of the Portfolio’s investments as of December 31, 2018:
| | | | | | | | | | | | | | | | |
| Description | | Level 1 | | | Level 2 | | | Level 3 | | | Total | |
| Common Stocks | |
Aerospace & Defense | | $ | 8,483,387 | | | $ | — | | | $ | — | | | $ | 8,483,387 | |
Auto Components | | | 5,340,238 | | | | — | | | | — | | | | 5,340,238 | |
Banks | | | 44,220,810 | | | | — | | | | — | | | | 44,220,810 | |
Beverages | | | 3,174,424 | | | | — | | | | — | | | | 3,174,424 | |
Biotechnology | | | 5,969,343 | | | | — | | | | — | | | | 5,969,343 | |
Building Products | | | 7,308,912 | | | | — | | | | — | | | | 7,308,912 | |
Capital Markets | | | 5,101,090 | | | | — | | | | — | | | | 5,101,090 | |
Chemicals | | | 10,612,255 | | | | — | | | | — | | | | 10,612,255 | |
Commercial Services & Supplies | | | 9,026,359 | | | | — | | | | — | | | | 9,026,359 | |
Communications Equipment | | | 2,161,480 | | | | — | | | | — | | | | 2,161,480 | |
Construction & Engineering | | | 1,721,390 | | | | — | | | | — | | | | 1,721,390 | |
Consumer Finance | | | 2,905,058 | | | | — | | | | — | | | | 2,905,058 | |
Distributors | | | 2,336,719 | | | | — | | | | — | | | | 2,336,719 | |
Diversified Consumer Services | | | 9,683,139 | | | | — | | | | — | | | | 9,683,139 | |
Diversified Financial Services | | | 1,255,923 | | | | — | | | | — | | | | 1,255,923 | |
Diversified Telecommunication Services | | | 1,470,636 | | | | — | | | | — | | | | 1,470,636 | |
Electric Utilities | | | 3,667,554 | | | | — | | | | — | | | | 3,667,554 | |
Electrical Equipment | | | 3,506,270 | | | | — | | | | — | | | | 3,506,270 | |
Electronic Equipment, Instruments & Components | | | 8,651,817 | | | | — | | | | — | | | | 8,651,817 | |
Energy Equipment & Services | | | 5,202,754 | | | | — | | | | — | | | | 5,202,754 | |
Entertainment | | | 1,884,233 | | | | — | | | | — | | | | 1,884,233 | |
Equity Real Estate Investment Trusts | | | 19,584,132 | | | | — | | | | — | | | | 19,584,132 | |
Food & Staples Retailing | | | 1,215,752 | | | | — | | | | — | | | | 1,215,752 | |
See accompanying notes to financial statements.
BHFTII-10
Brighthouse Funds Trust II
Loomis Sayles Small Cap Core Portfolio
Schedule of Investments as of December 31, 2018
Fair Value Hierarchy��(Continued)
| | | | | | | | | | | | | | | | |
| Description | | Level 1 | | | Level 2 | | | Level 3 | | | Total | |
Food Products | | $ | 9,782,374 | | | $ | — | | | $ | — | | | $ | 9,782,374 | |
Health Care Equipment & Supplies | | | 15,198,099 | | | | — | | | | — | | | | 15,198,099 | |
Health Care Providers & Services | | | 7,733,371 | | | | — | | | | — | | | | 7,733,371 | |
Health Care Technology | | | 6,734,661 | | | | — | | | | — | | | | 6,734,661 | |
Hotels, Restaurants & Leisure | | | 9,381,888 | | | | — | | | | — | | | | 9,381,888 | |
Household Durables | | | 2,407,809 | | | | — | | | | — | | | | 2,407,809 | |
Independent Power and Renewable Electricity Producers | | | 4,833,210 | | | | — | | | | — | | | | 4,833,210 | |
Industrial Conglomerates | | | 2,140,675 | | | | — | | | | — | | | | 2,140,675 | |
Insurance | | | 14,140,330 | | | | — | | | | — | | | | 14,140,330 | |
Interactive Media & Services | | | 653,087 | | | | — | | | | — | | | | 653,087 | |
Internet & Direct Marketing Retail | | | 916,076 | | | | — | | | | — | | | | 916,076 | |
IT Services | | | 20,216,736 | | | | — | | | | — | | | | 20,216,736 | |
Leisure Products | | | 886,739 | | | | — | | | | — | | | | 886,739 | |
Life Sciences Tools & Services | | | 4,982,455 | | | | — | | | | — | | | | 4,982,455 | |
Machinery | | | 20,069,940 | | | | — | | | | — | | | | 20,069,940 | |
Marine | | | 1,171,323 | | | | — | | | | — | | | | 1,171,323 | |
Media | | | 5,997,294 | | | | — | | | | — | | | | 5,997,294 | |
Metals & Mining | | | 984,245 | | | | 0 | | | | — | | | | 984,245 | |
Multi-Utilities | | | 4,453,869 | | | | — | | | | — | | | | 4,453,869 | |
Multiline Retail | | | 1,451,871 | | | | — | | | | — | | | | 1,451,871 | |
Oil, Gas & Consumable Fuels | | | 3,219,686 | | | | — | | | | — | | | | 3,219,686 | |
Pharmaceuticals | | | 4,976,402 | | | | — | | | | — | | | | 4,976,402 | |
Professional Services | | | 6,265,905 | | | | — | | | | — | | | | 6,265,905 | |
Road & Rail | | | 3,278,277 | | | | — | | | | — | | | | 3,278,277 | |
Semiconductors & Semiconductor Equipment | | | 11,348,001 | | | | — | | | | — | | | | 11,348,001 | |
Software | | | 24,379,033 | | | | — | | | | — | | | | 24,379,033 | |
Specialty Retail | | | 3,379,038 | | | | — | | | | — | | | | 3,379,038 | |
Technology Hardware, Storage & Peripherals | | | 919,907 | | | | — | | | | — | | | | 919,907 | |
Textiles, Apparel & Luxury Goods | | | 4,802,641 | | | | — | | | | — | | | | 4,802,641 | |
Thrifts & Mortgage Finance | | | 4,979,428 | | | | — | | | | — | | | | 4,979,428 | |
Trading Companies & Distributors | | | 2,203,510 | | | | — | | | | — | | | | 2,203,510 | |
Total Common Stocks | | | 368,371,555 | | | | 0 | | | | — | | | | 368,371,555 | |
Total Short-Term Investment* | | | — | | | | 9,241,502 | | | | — | | | | 9,241,502 | |
Total Securities Lending Reinvestments* | | | — | | | | 54,218,654 | | | | — | | | | 54,218,654 | |
Total Investments | | $ | 368,371,555 | | | $ | 63,460,156 | | | $ | — | | | $ | 431,831,711 | |
| | | | | | | | | | | | | | | | | |
Collateral for Securities Loaned (Liability) | | $ | — | | | $ | (54,196,580 | ) | | $ | — | | | $ | (54,196,580 | ) |
| | | | |
| * | | See Schedule of Investments for additional detailed categorizations. |
See accompanying notes to financial statements.
BHFTII-11
Brighthouse Funds Trust II
Loomis Sayles Small Cap Core Portfolio
Statement of Assets and Liabilities
December 31, 2018
| | | | |
Assets | |
Investments at value (a) (b) | | $ | 431,831,711 | |
Receivable for: | |
Investments sold | | | 540,622 | |
Fund shares sold | | | 597,355 | |
Dividends and interest | | | 330,413 | |
Prepaid expenses | | | 1,269 | |
| | | | |
Total Assets | | | 433,301,370 | |
Liabilities | |
Collateral for securities loaned | | | 54,196,580 | |
Payables for: | |
Investments purchased | | | 758,789 | |
Fund shares redeemed | | | 87,534 | |
Accrued Expenses: | |
Management fees | | | 273,505 | |
Distribution and service fees | | | 31,659 | |
Deferred trustees’ fees | | | 111,633 | |
Other expenses | | | 106,439 | |
| | | | |
Total Liabilities | | | 55,566,139 | |
| | | | |
Net Assets | | $ | 377,735,231 | |
| | | | |
Net Assets Consist of: | |
Paid in surplus | | $ | 268,613,885 | |
Distributable earnings (Accumulated losses) | | | 109,121,346 | |
| | | | |
Net Assets | | $ | 377,735,231 | |
| | | | |
Net Assets | |
Class A | | $ | 223,908,195 | |
Class B | | | 131,063,423 | |
Class E | | | 22,763,613 | |
Capital Shares Outstanding* | |
Class A | | | 959,371 | |
Class B | | | 594,117 | |
Class E | | | 100,746 | |
Net Asset Value, Offering Price and Redemption Price Per Share | |
Class A | | $ | 233.39 | |
Class B | | | 220.60 | |
Class E | | | 225.95 | |
| | | | |
| * | | The Portfolio is authorized to issue an unlimited number of shares. |
| (a) | | Identified cost of investments was $366,880,994. |
| (b) | | Includes securities loaned at value of $53,891,134. |
Statement of Operations
Year Ended December 31, 2018
| | | | |
Investment Income | |
Dividends (a) | | $ | 4,710,740 | |
Interest | | | 72,126 | |
Securities lending income | | | 432,669 | |
| | | | |
Total investment income | | | 5,215,535 | |
Expenses | |
Management fees | | | 4,153,978 | |
Administration fees | | | 22,445 | |
Custodian and accounting fees | | | 51,668 | |
Distribution and service fees—Class B | | | 404,509 | |
Distribution and service fees—Class E | | | 43,302 | |
Audit and tax services | | | 44,663 | |
Legal | | | 45,317 | |
Trustees’ fees and expenses | | | 33,734 | |
Shareholder reporting | | | 69,385 | |
Insurance | | | 2,965 | |
Miscellaneous | | | 14,370 | |
| | | | |
Total expenses | | | 4,886,336 | |
Less management fee waiver | | | (361,553 | ) |
Less broker commission recapture | | | (19,543 | ) |
| | | | |
Net expenses | | | 4,505,240 | |
| | | | |
Net Investment Income | | | 710,295 | |
| | | | |
Net Realized and Unrealized Gain (Loss) | |
Net realized gain on investments | | | 43,535,043 | |
| | | | |
Net change in unrealized depreciation on investments | | | (89,313,058 | ) |
| | | | |
Net realized and unrealized loss | | | (45,778,015 | ) |
| | | | |
Net Decrease in Net Assets From Operations | | $ | (45,067,720 | ) |
| | | | |
| | | | |
| (a) | | Net of foreign withholding taxes of $13,639. |
See accompanying notes to financial statements.
BHFTII-12
Brighthouse Funds Trust II
Loomis Sayles Small Cap Core Portfolio
Statements of Changes in Net Assets
| | | | | | | | |
| | | Year Ended
December 31,
2018 | | | Year Ended
December 31,
2017 | |
Increase (Decrease) in Net Assets: | |
From Operations | |
Net investment income | | $ | 710,295 | | | $ | 333,261 | |
Net realized gain | | | 43,535,043 | | | | 47,593,068 | |
Net change in unrealized appreciation (depreciation) | | | (89,313,058 | ) | | | 17,357,192 | |
| | | | | | | | |
Increase (decrease) in net assets from operations | | | (45,067,720 | ) | | | 65,283,521 | |
| | | | | | | | |
From Distributions to Shareholders(a) | |
Class A | | | (27,661,814 | ) | | | (17,838,959 | ) |
Class B | | | (17,342,821 | ) | | | (11,366,745 | ) |
Class E | | | (3,031,392 | ) | | | (2,080,417 | ) |
| | | | | | | | |
Total distributions | | | (48,036,027 | ) | | | (31,286,121 | ) |
| | | | | | | | |
Decrease in net assets from capital share transactions | | | (4,654,482 | ) | | | (18,769,189 | ) |
| | | | | | | | |
Total increase (decrease) in net assets | | | (97,758,229 | ) | | | 15,228,211 | |
|
Net Assets | |
Beginning of period | | | 475,493,460 | | | | 460,265,249 | |
| | | | | | | | |
End of period | | $ | 377,735,231 | | | $ | 475,493,460 | (b) |
| | | | | | | | |
Other Information:
Capital Shares
Transactions in capital shares were as follows:
| | | | | | | | | | | | | | | | |
| | | Year Ended
December 31, 2018 | | | Year Ended
December 31, 2017 | |
| | | Shares | | | Value | | | Shares | | | Value | |
Class A | |
Sales | | | 16,347 | | | $ | 4,466,196 | | | | 40,523 | | | $ | 11,185,340 | |
Reinvestments | | | 97,804 | | | | 27,661,814 | | | | 67,746 | | | | 17,838,959 | |
Redemptions | | | (100,405 | ) | | | (28,654,796 | ) | | | (129,901 | ) | | | (35,696,438 | ) |
| | | | | | | | | | | | | | | | |
Net increase (decrease) | | | 13,746 | | | $ | 3,473,214 | | | | (21,632 | ) | | $ | (6,672,139 | ) |
| | | | | | | | | | | | | | | | |
Class B | |
Sales | | | 19,187 | | | $ | 4,858,923 | | | | 30,477 | | | $ | 7,974,188 | |
Reinvestments | | | 64,785 | | | | 17,342,821 | | | | 45,253 | | | | 11,366,745 | |
Redemptions | | | (104,241 | ) | | | (28,540,326 | ) | | | (108,518 | ) | | | (28,690,239 | ) |
| | | | | | | | | | | | | | | | |
Net decrease | | | (20,269 | ) | | $ | (6,338,582 | ) | | | (32,788 | ) | | $ | (9,349,306 | ) |
| | | | | | | | | | | | | | | | |
Class E | |
Sales | | | 3,267 | | | $ | 847,332 | | | | 4,076 | | | $ | 1,100,417 | |
Reinvestments | | | 11,062 | | | | 3,031,392 | | | | 8,118 | | | | 2,080,417 | |
Redemptions | | | (20,683 | ) | | | (5,667,838 | ) | | | (22,067 | ) | | | (5,928,578 | ) |
| | | | | | | | | | | | | | | | |
Net decrease | | | (6,354 | ) | | $ | (1,789,114 | ) | | | (9,873 | ) | | $ | (2,747,744 | ) |
| | | | | | | | | | | | | | | | |
Decrease derived from capital shares transactions | | | | | | $ | (4,654,482 | ) | | | | | | $ | (18,769,189 | ) |
| | | | | | | | | | | | | | | | |
| | | | |
| (a) | | Distributions from net investment income and realized gains are no longer required to be separately disclosed. The presentation for the year ended December 31, 2018 has been adjusted for this change (See Note 8). At December 31, 2017 the distributions were as follows. |
| | | | | | | | |
| | | Distributions from net
investment income: | | | Distributions from realized
capital gains: | |
Class A | | $ | (766,898 | ) | | $ | (17,072,061 | ) |
Class B | | | (115,507 | ) | | | (11,251,238 | ) |
Class E | | | (48,669 | ) | | | (2,031,748 | ) |
| | | | |
| (b) | | As part of the update in (a), it is also no longer required to disclose the Undistributed net investment income (Accumulated losses) which was $(83,127) as of December 31, 2017. |
See accompanying notes to financial statements.
BHFTII-13
Brighthouse Funds Trust II
Loomis Sayles Small Cap Core Portfolio
Financial Highlights
| | | | | | | | | | | | | | | | | | | | |
| Selected per share data | |
| | | Class A | |
| | | Year Ended December 31, | |
| | | 2018 | | | 2017 | | | 2016 | | | 2015 | | | 2014 | |
Net Asset Value, Beginning of Period | | $ | 290.82 | | | $ | 270.77 | | | $ | 250.78 | | | $ | 290.12 | | | $ | 322.61 | |
| | | | | | | | | | | | | | | | | | | | |
Income (Loss) from Investment Operations | |
Net investment income (a) | | | 0.72 | | | | 0.48 | | | | 1.15 | (b) | | | 1.19 | | | | 0.91 | |
Net realized and unrealized gain (loss) | | | (27.59 | ) | | | 38.81 | | | | 43.25 | | | | (2.32 | ) | | | 8.06 | |
| | | | | | | | | | | | | | | | | | | | |
Total income (loss) from investment operations | | | (26.87 | ) | | | 39.29 | | | | 44.40 | | | | (1.13 | ) | | | 8.97 | |
| | | | | | | | | | | | | | | | | | | | |
Less Distributions | |
Distributions from net investment income | | | (0.06 | ) | | | (0.83 | ) | | | (0.85 | ) | | | (0.46 | ) | | | (0.14 | ) |
Distributions from net realized capital gains | | | (30.50 | ) | | | (18.41 | ) | | | (23.56 | ) | | | (37.75 | ) | | | (41.32 | ) |
| | | | | | | | | | | | | | | | | | | | |
Total distributions | | | (30.56 | ) | | | (19.24 | ) | | | (24.41 | ) | | | (38.21 | ) | | | (41.46 | ) |
| | | | | | | | | | | | | | | | | | | | |
Net Asset Value, End of Period | | $ | 233.39 | | | $ | 290.82 | | | $ | 270.77 | | | $ | 250.78 | | | $ | 290.12 | |
| | | | | | | | | | | | | | | | | | | | |
Total Return (%) (c) | | | (11.07 | ) | | | 15.24 | | | | 19.27 | | | | (1.50 | ) | | | 3.76 | |
|
Ratios/Supplemental Data | |
Gross ratio of expenses to average net assets (%) | | | 0.96 | | | | 0.96 | | | | 0.96 | | | | 0.96 | | | | 0.96 | |
Net ratio of expenses to average net assets (%) (d) | | | 0.88 | | | | 0.89 | | | | 0.88 | | | | 0.88 | | | | 0.88 | |
Ratio of net investment income to average net assets (%) | | | 0.25 | | | | 0.17 | | | | 0.47 | (b) | | | 0.43 | | | | 0.31 | |
Portfolio turnover rate (%) | | | 30 | | | | 28 | | | | 34 | | | | 36 | | | | 35 | |
Net assets, end of period (in millions) | | $ | 223.9 | | | $ | 275.0 | | | $ | 261.9 | | | $ | 241.5 | | | $ | 269.1 | |
| |
| | | Class B | |
| | | Year Ended December 31, | |
| | | 2018 | | | 2017 | | | 2016 | | | 2015 | | | 2014 | |
Net Asset Value, Beginning of Period | | $ | 277.03 | | | $ | 258.82 | | | $ | 240.67 | | | $ | 280.08 | | | $ | 313.49 | |
| | | | | | | | | | | | | | | | | | | | |
Income (Loss) from Investment Operations | |
Net investment income (loss) (a) | | | (0.00 | )(e) | | | (0.21 | ) | | | 0.51 | (b) | | | 0.48 | | | | 0.18 | |
Net realized and unrealized gain (loss) | | | (25.93 | ) | | | 37.02 | | | | 41.37 | | | | (2.14 | ) | | | 7.73 | |
| | | | | | | | | | | | | | | | | | | | |
Total income (loss) from investment operations | | | (25.93 | ) | | | 36.81 | | | | 41.88 | | | | (1.66 | ) | | | 7.91 | |
| | | | | | | | | | | | | | | | | | | | |
Less Distributions | |
Distributions from net investment income | | | 0.00 | | | | (0.19 | ) | | | (0.17 | ) | | | 0.00 | | | | 0.00 | |
Distributions from net realized capital gains | | | (30.50 | ) | | | (18.41 | ) | | | (23.56 | ) | | | (37.75 | ) | | | (41.32 | ) |
| | | | | | | | | | | | | | | | | | | | |
Total distributions | | | (30.50 | ) | | | (18.60 | ) | | | (23.73 | ) | | | (37.75 | ) | | | (41.32 | ) |
| | | | | | | | | | | | | | | | | | | | |
Net Asset Value, End of Period | | $ | 220.60 | | | $ | 277.03 | | | $ | 258.82 | | | $ | 240.67 | | | $ | 280.08 | |
| | | | | | | | | | | | | | | | | | | | |
Total Return (%) (c) | | | (11.30 | ) | | | 14.96 | | | | 18.97 | | | | (1.74 | ) | | | 3.50 | |
|
Ratios/Supplemental Data | |
Gross ratio of expenses to average net assets (%) | | | 1.21 | | | | 1.21 | | | | 1.21 | | | | 1.21 | | | | 1.21 | |
Net ratio of expenses to average net assets (%) (d) | | | 1.13 | | | | 1.14 | | | | 1.13 | | | | 1.13 | | | | 1.13 | |
Ratio of net investment income (loss) to average net assets (%) | | | (0.00 | )(f) | | | (0.08 | ) | | | 0.22 | (b) | | | 0.18 | | | | 0.06 | |
Portfolio turnover rate (%) | | | 30 | | | | 28 | | | | 34 | | | | 36 | | | | 35 | |
Net assets, end of period (in millions) | | $ | 131.1 | | | $ | 170.2 | | | $ | 167.5 | | | $ | 157.9 | | | $ | 179.5 | |
Please see following page for Financial Highlights footnote legend.
See accompanying notes to financial statements.
BHFTII-14
Brighthouse Funds Trust II
Loomis Sayles Small Cap Core Portfolio
Financial Highlights
| | | | | | | | | | | | | | | | | | | | |
| Selected per share data | |
| | | Class E | |
| | | Year Ended December 31, | |
| | | 2018 | | | 2017 | | | 2016 | | | 2015 | | | 2014 | |
Net Asset Value, Beginning of Period | | $ | 282.79 | | | $ | 263.82 | | | $ | 244.89 | | | $ | 284.11 | | | $ | 317.10 | |
| | | | | | | | | | | | | | | | | | | | |
Income (Loss) from Investment Operations | |
Net investment income (a) | | | 0.27 | | | | 0.05 | | | | 0.76 | (b) | | | 0.76 | | | | 0.46 | |
Net realized and unrealized gain (loss) | | | (26.61 | ) | | | 37.77 | | | | 42.15 | | | | (2.23 | ) | | | 7.87 | |
| | | | | | | | | | | | | | | | | | | | |
Total income (loss) from investment operations | | | (26.34 | ) | | | 37.82 | | | | 42.91 | | | | (1.47 | ) | | | 8.33 | |
| | | | | | | | | | | | | | | | | | | | |
Less Distributions | |
Distributions from net investment income | | | 0.00 | | | | (0.44 | ) | | | (0.42 | ) | | | 0.00 | | | | 0.00 | |
Distributions from net realized capital gains | | | (30.50 | ) | | | (18.41 | ) | | | (23.56 | ) | | | (37.75 | ) | | | (41.32 | ) |
| | | | | | | | | | | | | | | | | | | | |
Total distributions | | | (30.50 | ) | | | (18.85 | ) | | | (23.98 | ) | | | (37.75 | ) | | | (41.32 | ) |
| | | | | | | | | | | | | | | | | | | | |
Net Asset Value, End of Period | | $ | 225.95 | | | $ | 282.79 | | | $ | 263.82 | | | $ | 244.89 | | | $ | 284.11 | |
| | | | | | | | | | | | | | | | | | | | |
Total Return (%) (c) | | | (11.21 | ) | | | 15.07 | | | | 19.09 | | | | (1.64 | ) | | | 3.60 | |
|
Ratios/Supplemental Data | |
Gross ratio of expenses to average net assets (%) | | | 1.11 | | | | 1.11 | | | | 1.11 | | | | 1.11 | | | | 1.11 | |
Net ratio of expenses to average net assets (%) (d) | | | 1.03 | | | | 1.04 | | | | 1.03 | | | | 1.03 | | | | 1.03 | |
Ratio of net investment income to average net assets (%) | | | 0.10 | | | | 0.02 | | | | 0.31 | (b) | | | 0.28 | | | | 0.16 | |
Portfolio turnover rate (%) | | | 30 | | | | 28 | | | | 34 | | | | 36 | | | | 35 | |
Net assets, end of period (in millions) | | $ | 22.8 | | | $ | 30.3 | | | $ | 30.9 | | | $ | 29.1 | | | $ | 33.9 | |
| | | | |
| (a) | | Per share amounts based on average shares outstanding during the period. |
| (b) | | Net investment income per share and the ratio of net investment income to average net assets include anon-recurring refund for overbilling of prior years’ custodianout-of-pocket fees which amounted to $0.03 per share and 0.01% of average net assets, respectively. |
| (c) | | Total return does not reflect any insurance, sales, separate account or administrative charges of variable annuity or life insurance contracts or any additional expenses that contract owners may bear under their variable contracts. If these charges were included, the returns would be lower. |
| (d) | | Includes the effects of management fee waivers (see Note 5 of the Notes to Financial Statements). |
| (e) | | Net investment income (loss) was less than $0.01. |
| (f) | | Ratio of net investment income (loss) to average net assets was less than 0.01%. |
See accompanying notes to financial statements.
BHFTII-15
Brighthouse Funds Trust II
Loomis Sayles Small Cap Core Portfolio
Notes to Financial Statements—December 31, 2018
1. Organization
Brighthouse Funds Trust II (the “Trust”) is organized as a Delaware statutory trust and registered under the Investment Company Act of 1940, as amended (the “1940 Act”), as anopen-end management investment company. The Trust, which is managed by Brighthouse Investment Advisers, LLC (“Brighthouse Investment Advisers” or the “Adviser”), currently offers twenty-nine series, each of which operates as a distinct investment vehicle of the Trust. The series included in this report is Loomis Sayles Small Cap Core Portfolio (the “Portfolio”), which is diversified. Shares in the Portfolio are not offered directly to the general public and are currently available only to separate accounts established by life insurance companies affiliated with the Adviser and Metropolitan Life Insurance Company (the “Insurance Companies”).
The Portfolio has registered and offers three classes of shares: Class A, B and E shares. Shares of each Class of the Portfolio represent an equal pro rata interest in the Portfolio and generally give the shareholder the same voting, dividend, liquidation, and other rights. Investment income, realized and unrealized capital gains and losses, the common expenses of the Portfolio, and certain Portfolio-level expense reductions, if any, are allocated on a pro rata basis to each Class based on the relative net assets of each Class to the net assets of the Portfolio. Each Class of shares differs in its respective distribution plan and such distribution expenses are allocated to the corresponding Class of shares.
2. Significant Accounting Policies
The preparation of financial statements in conformity with accounting principles generally accepted in the United States of America (“GAAP”) requires management to make estimates and assumptions that affect the reported amounts of assets and liabilities and disclosure of contingent assets and liabilities as of the date of the financial statements and the reported amounts of income and expenses during the reporting period. Actual results could differ from those estimates. In the preparation of these financial statements, management has evaluated events and transactions subsequent to December 31, 2018 through the date the financial statements were issued.
The Portfolio is an investment company and follows the accounting and reporting guidance of the Financial Accounting Standards Board (“FASB”) Accounting Standards Codification Topic 946—Financial Services—Investment Companies. The following is a summary of significant accounting policies consistently followed by the Portfolio in the preparation of its financial statements.
Investment Valuation and Fair Value Measurements - The Portfolio values its portfolio investments for purposes of calculating its net asset value (“NAV”) using procedures approved by the Board of Trustees of the Trust (the “Board” or “Trustees”). Those procedures allow for a variety of methodologies to be used to value the Portfolio’s investments. The specific methodologies used for a particular investment may vary based on the market data available for a specific investment at the time the Portfolio calculates its NAV or based on other considerations. The procedures also permit a level of judgment to be used in the valuation process. The Portfolio follows the accounting and reporting guidance of FASB Accounting Standards Codification Topic 820—Fair Value Measurement.
Domestic and foreign equity securities, such as common stock, exchange-traded funds, rights, warrants, and preferred stock, that are traded on a securities exchange on a valuation date are generally valued at their last quoted sale price or official closing price on the primary exchange for such security, or, if no sales occurred on that day, at the last reported bid price. Equity securities tradedover-the-counter (“OTC”) are generally valued at the last reported bid price. In the event of a major exchange closing during the trading day, the Adviser may use other market information obtained from quotation reporting systems, established market makers, or pricing services in valuing the securities. Valuation adjustments may be applied to certain foreign equity securities that are traded solely on foreign exchanges that close before the time as of which the Portfolio determines its NAV to account for the market movement between the close of the foreign exchanges and the time as of which the Portfolio determines its NAV. The Portfolio may use a systematic fair valuation model provided by a pricing service to value securities principally traded in these foreign markets in order to adjust for possible market movements or other changes that may occur between the close of the foreign exchanges and the time as of which the Portfolio determines its NAV. Foreign equity securities valued using these valuation adjustments are generally categorized as Level 2 within the fair value hierarchy. Equity securities that are actively traded, and have no valuation adjustments applied, are categorized as Level 1 within the fair value hierarchy. Other equity securities traded on inactive markets, or valued in reference to similar instruments traded on active markets, are generally categorized as Level 2 within the fair value hierarchy.
Investments in registeredopen-end management investment companies are valued at reported NAV per share on the valuation date and are categorized as Level 1 within the fair value hierarchy.
Debt securities, including corporate, convertible and municipal bonds and notes; obligations of the U.S. Treasury and U.S. government agencies; foreign sovereign issues; andnon-U.S. bonds, are generally valued on the basis of evaluated or composite bid quotations obtained from independent pricing services and/or brokers and dealers selected by the Adviser (each a “pricing service”), pursuant to the authorization of and subject to general oversight by the Board. Such pricing services may use matrix pricing, which considers observable inputs including, among other things, issuer details, maturity dates, interest rates, yield curves, rates of prepayment, credit risks/spreads, default rates, reported trades, broker-dealer quotes and quoted prices for similar assets. Short-term obligations with a
BHFTII-16
Brighthouse Funds Trust II
Loomis Sayles Small Cap Core Portfolio
Notes to Financial Statements—December 31, 2018—(Continued)
remaining maturity of sixty days or less may be valued at amortized cost in the absence of market quotes, so long as the amortized cost value of such short-term debt instrument is approximately the same as the fair value of the instrument as determined without the use of amortized cost valuation. Floating rate loans are generally valued on the basis of an evaluated or composite average of aggregate bid and ask quotations supplied by brokers or dealers, as obtained from the pricing service. Securities that use similar valuation techniques and inputs as described above are generally categorized as Level 2 within the fair value hierarchy.
Options, whether on securities, indices, futures contracts, or otherwise, traded on exchanges are valued at the last sale price available as of the close of business on a valuation day or, if there is no such price available, at the last reported bid price. These types of options are categorized as Level 1 within the fair value hierarchy. Futures contracts that are traded on commodity exchanges are valued at their settlement prices established by the exchanges on which they are traded as of the close of such exchanges and are categorized as Level 1 within the fair value hierarchy.
If no current market value quotation or other observable inputs are readily available or market value quotations are deemed to be unreliable for an investment, the fair value of the investment will be determined in accordance with procedures approved by, and under the general supervision of, the Board. In such a circumstance, the Board will be assisted in its responsibility to determine the fair value of an investment by the Valuation Committee (“Committee”) of Brighthouse Investment Advisers. The Committee provides general pricing oversight and fair value pricing determinations related to portfolio securities and meets on a regular basis to review reports relating to the valuation of the securities in the Portfolio. The Board has delegated to State Street Bank and Trust Company, the Trust’s custodian (“Custodian”), the responsibility for calculating the NAVs of the Trust’s Portfolios. The Committee is responsible for overseeing the calculation of the NAVs of the Portfolios by the custodian. The Committee also periodically reviews pricing services, including the pricing services providing fair value pricing for the Portfolio’s foreign securities, and is responsible for overseeing the correction of pricing errors and addressing other pricing issues that arise in the ordinary course of business, such as making real-time fair value determinations, as necessary.
No single standard for determining the fair value of an investment can be set forth because fair value depends upon the facts and circumstances with respect to each investment. Information relating to any relevant factors may be obtained by the Committee from any appropriate source, including the subadviser of the Portfolio, the custodian, a pricing service, market maker and/or broker for such security or the issuer. Appropriate methodologies for determining fair value under particular circumstances may include: matrix pricing, a discounted cash flow analysis, comparisons of securities with comparable characteristics, value based on multiples of earnings, discount from market price of similar marketable securities, or a combination of these and other methods.
Investment Transactions and Related Investment Income - Portfolio security transactions are recorded on the trade date. Dividend income is recorded on theex-dividend date or, for certain foreign securities, when notified. Interest income, which includes amortization of premium and accretion of discount on debt securities, is recorded on the accrual basis. Realized gains and losses on investments are determined on the identified cost basis, which is the same basis used for federal income tax purposes. Foreign income and foreign capital gains on some foreign securities may be subject to foreign taxes, which are accrued as applicable. These foreign taxes have been provided for in accordance with the Portfolio’s understanding of the applicable countries’ tax rules and rates.
Dividends and Distributions to Shareholders -The Portfolio records dividends and distributions on theex-dividend date. Net realized gains from securities transactions (if any) are generally distributed annually to shareholders. The timing and characterization of certain income and capital gains distributions are determined in accordance with federal tax regulations that may differ from GAAP. Permanent book and tax basis differences relating to shareholder distributions will result in reclassification between distributable earnings (accumulated losses) andpaid-in surplus. These adjustments have no impact on net assets or the results of operations.
Income Taxes -It is the Portfolio’s policy to comply with the requirements of the Internal Revenue Code of 1986, as amended, and regulations thereunder, applicable to regulated investment companies, and to distribute, with respect to each taxable year, all of its taxable income to shareholders. Therefore, no federal income tax provision is required. The Portfolio files U.S. federal tax returns. No income tax returns are currently under examination. The Portfolio’s federal tax returns for the prior three fiscal years remain subject to examination by the Internal Revenue Service. As of December 31, 2018, the Portfolio had no uncertain tax positions that would require financial statement recognition, or derecognition or disclosure.
Directed Brokerage Agreement -The Trust has entered into a directed brokerage arrangement with Capital Institutional Services, Inc. (“CAPIS”). Under this arrangement, the Portfolio directs certain trades to CAPIS in return for a recapture credit. CAPIS issues a cash rebate to the Portfolio. Amounts paid to the Portfolio are shown separately as broker commission recapture on the Statement of Operations of the Portfolio. Additionally, these amounts have been excluded from the calculation of the net ratio of expenses to average net assets presented in the Financial Highlights for each share class.
Repurchase Agreements -The Portfolio may enter into repurchase agreements, under the terms of a Master Repurchase Agreement (“MRA”), with selected commercial banks and broker-dealers, under which the Portfolio acquires securities as collateral and agrees to resell the securities at an agreed-upon time and at an agreed-upon price. The Portfolio, through the Custodian or a subcustodian, under atri-party repurchase agreement, receives delivery of the underlying securities collateralizing any repurchase agreements. It is
BHFTII-17
Brighthouse Funds Trust II
Loomis Sayles Small Cap Core Portfolio
Notes to Financial Statements—December 31, 2018—(Continued)
the Portfolio’s policy that the market value of the collateral be equal to at least 100% of the repurchase price in the case of a repurchase agreement ofone-day duration and equal to at least 102% of the repurchase price in the case of all other repurchase agreements. In the event of default or failure by a party to perform an obligation in connection with any repurchase transaction, the MRA gives thenon-defaulting party the right toset-off claims and to apply property held by it in connection with any repurchase transaction against obligations owed to it.
At December 31, 2018, the Portfolio had direct investments in repurchase agreements with a gross value of $9,241,502. Additionally, the Portfolio invested cash collateral for loans of portfolio securities in repurchase agreements with a gross value of $16,730,579. The combined value of all repurchase agreements is included as part of investments at value on the Statement of Assets and Liabilities. The value of the related collateral exceeded the value of the repurchase agreements at December 31, 2018.
Securities Lending - The Portfolio may lend its portfolio securities to certain qualified brokers who borrow securities in order to complete certain securities transactions. By lending its portfolio securities, the Portfolio attempts to increase its net investment income through the receipt of income on collateral held from securities on loan. Any gain or loss in the market price of the loaned securities that might occur and any interest earned or dividends declared during the term of the loan would accrue to the account of the Portfolio.
The Trust has entered into aNon-Custodial Securities Lending Agreement with JPMorgan Chase Bank, N.A. (the “Lending Agent”). Under the agreement, the Lending Agent is authorized to loan portfolio securities on the Portfolio’s behalf. In exchange, the Portfolio receives either cash or U.S. government securities as collateral against the loaned securities. The Portfolio receives collateral equal to at least 102% of the market value for loans secured by government securities or cash in the same currency as the loaned shares and 105% for all other loaned securities at each loan’s inception. Collateral representing at least 100% of the market value of the loaned securities is maintained for the duration of the loan. Any cash collateral received by the Portfolio is generally invested by the Lending Agent in short-term investments, which may include certificates of deposit, commercial paper, repurchase agreements, time deposits, master demand notes and money market funds. The market value of investments made with cash collateral received are disclosed in the Schedule of Investments and the valuation techniques are described in Note 2. If the market value of the collateral at the close of trading on a business day is less than 100% of the market value of the loaned securities at the close of trading on that day, the borrower is required to deliver, by the close of business on the following business day, an additional amount of collateral, so that the total amount of posted collateral is equal to at least 100% of the market value of all the loaned securities as of such preceding day. A portion of the income earned on the collateral is rebated to the borrower of the securities and the remainder is split between the Lending Agent and the Portfolio. On loans collateralized by U.S. government securities, a fee is received from the borrower and is allocated between the Portfolio and the Lending Agent.
Income received by the Portfolio in securities lending transactions during the year ended December 31, 2018 is reflected as securities lending income on the Statement of Operations. The values of any securities loaned by the Portfolio and the related collateral at December 31, 2018 are disclosed in the footnotes to the Schedule of Investments. The value of the related collateral received by the Portfolio exceeded the value of the securities out on loan at December 31, 2018.
The risks associated with lending portfolio securities include, but are not limited to, possible delays in receiving additional collateral or in the recovery of the loaned securities, possible loss of rights in the collateral should the borrower fail financially, as well as risk of loss in the value of the collateral or the value of the investments made with the collateral. The Lending Agent shall indemnify the Portfolio in the case of default of any securities borrower, subject to the terms of theNon-Custodial Securities Lending Agreement.
All securities on loan are classified as Common Stocks in the Portfolio’s Schedule of Investments as of December 31, 2018, with a contractual maturity of overnight and continuous.
3. Certain Risks
In the normal course of business, the Portfolio invests in securities and enters into transactions where risks exist. Those risks include:
Market Risk:The value of securities held by the Portfolio may decline in response to certain events, including those directly involving the issuers whose securities are owned by the Portfolio; conditions affecting the general economy; overall market changes; local, regional or global political, social or economic instability; and currency, interest rate, and price fluctuations.
Credit and Counterparty Risk: The Portfolio may be exposed to counterparty risk, or the risk that an entity with which the Portfolio has unsettled or open transactions may default. The potential loss could exceed the value of the financial assets and liabilities recorded in the financial statements. Financial assets that potentially expose the Portfolio to credit and counterparty risk consist principally of cash due from counterparties and investments. The Portfolio manages counterparty risk by entering into agreements only with counterparties that it believes have the financial resources to honor their obligations and by monitoring the financial stability of those counterparties. The Adviser attempts to mitigate counterparty risk by (i) periodically assessing the creditworthiness of its trading partners, (ii) monitoring and/or limiting the amount of its net exposure to each individual counterparty based on its
BHFTII-18
Brighthouse Funds Trust II
Loomis Sayles Small Cap Core Portfolio
Notes to Financial Statements—December 31, 2018—(Continued)
assessment, and (iii) requiring collateral from the counterparty for certain transactions. In order to preserve certain safeguards fornon-standard settlement trades, the Portfolio restricts its exposure to credit and counterparty losses by entering into master netting agreements (“Master Agreements”) with counterparties (approved brokers) with whom it undertakes a significant volume of transactions. Master Agreements govern the terms of certain transactions, and reduce the counterparty risk associated with relevant transactions by specifying credit protection mechanisms and providing standardization that improves legal certainty. Master Agreements can also help limit counterparty risk by specifying collateral posting arrangements atpre-arranged exposure levels.
Repurchase and reverse repurchase agreements are primarily executed under Global Master Repurchase Agreements (“GMRAs”) or Master Repurchase Agreements (“MRAs”), which provide the rights toset-off. Each repurchase and reverse repurchase agreement is initially collateralized at the transaction level. In the event of default, the total market value exposure will be offset against collateral exchanged to date, which would result in a net receivable/(payable) that would be due from/to the counterparty.
Additional risks associated with each type of investment are described above within the respective security type notes. The Portfolio’s prospectus includes a discussion of the principal risks of investing in the Portfolio.
4. Investment Transactions
Aggregate cost of purchases and proceeds of sales of investment securities, excluding short-term securities, for the year ended December 31, 2018 were as follows:
| | | | | | | | | | | | |
Purchases | | | Sales | |
U.S. Government | | Non-U.S. Government | | | U.S. Government | | | Non-U.S. Government | |
| $0 | | $ | 132,906,482 | | | $ | 0 | | | $ | 183,008,160 | |
5. Investment Management Fees and Other Transactions with Affiliates
Investment Management Agreement -Brighthouse Investment Advisers is the investment adviser to the Portfolio. The Trust has entered into an investment management agreement with Brighthouse Investment Advisers with respect to the Portfolio. For providing investment management services to the Portfolio, Brighthouse Investment Advisers receives monthly compensation at the following annual rates:
| | | | | | |
Management
Fees earned by
Brighthouse
Investment Advisers
for the year ended
December 31, 2018 | | % per annum | | | Average Daily Net Assets |
| $4,153,978 | | | 0.900 | % | | Of the first $500 million |
| | | 0.850 | % | | On amounts in excess of $500 million |
Brighthouse Investment Advisers has entered into an investment subadvisory agreement with respect to managing the Portfolio. Loomis, Sayles & Company, L.P. (the “Subadviser”) is compensated by Brighthouse Investment Advisers to provide subadvisory services for the Portfolio.
Management Fee Waivers- Pursuant to an expense agreement, Brighthouse Investment Advisers has agreed, for the period April 30, 2018 to April 30, 2019, to reduce its advisory fees set out above under “Investment Management Agreement” for each class of the Portfolio as follows:
| | |
% per annum | | Average Daily Net Assets |
| 0.050% | | Of the first $200 million |
| 0.100% | | On the next $300 million |
| 0.050% | | On amounts in excess of $500 million |
An identical expense agreement was in place for the period May 1, 2017 to April 30, 2018. Amounts waived for the year ended December 31, 2018 are shown as management fee waivers in the Statement of Operations.
Certain officers and trustees of the Trust may also be officers of Brighthouse Investment Advisers; however, such officers and trustees receive no compensation from the Trust.
Transfer Agency Agreement -Brighthouse Financial, Inc. serves as the transfer agent for the Trust. Brighthouse Financial, Inc. receives no fees for its services to the Trust.
BHFTII-19
Brighthouse Funds Trust II
Loomis Sayles Small Cap Core Portfolio
Notes to Financial Statements—December 31, 2018—(Continued)
Distribution and Service Fees- The Trust has a distribution agreement with Brighthouse Securities, LLC (the “Distributor”) pursuant to which the Distributor serves as the general distributor of shares of each class (each a “Class”) of each Portfolio. The Distributor is an affiliate of the Trust. The Trust has adopted a Distribution and Services Plan (the “Plan”) relating to Class B and Class E shares of each Portfolio, under Rule 12b-1 under the 1940 Act, pursuant to which the Trust may pay the Distributor a fee (the “Service Fee”) at an annual rate not to exceed 0.25% of each such Portfolio’s average daily net assets attributable to the Class B and Class E shares of the Trust. Each Portfolio may not offer shares of each Class. The Plan also authorizes the Trust, on behalf of each of its Portfolios, may pay the Distributor a distribution Fee (the “Distribution Fee” and together with the Service Fee, the “Fees”) at an annual rate of up to 0.25% of each Portfolio’s average daily net assets attributable to the Class B and Class E shares in consideration of the services rendered in connection with the sale of such shares by the Distributor. Under the Distribution Agreement with respect to the Trust, Fees are currently paid at an annual rate of 0.25% of average daily net assets in the case of Class B shares and 0.15% of average daily net assets in the case of Class E shares. The Plan is known as a “compensation plan” because the Trust makes payments to the Distributor for services rendered regardless of the actual level of expenditures by the Distributor. Amounts incurred by the Portfolio for the year ended December 31, 2018 are shown as Distribution and service fees in the Statement of Operations.
Deferred Trustee Compensation -Each Trustee who is not currently an employee of the Adviser or any of its affiliates receives compensation from the Trust for his or her service to the Trust. A deferred compensation plan (the “Plan”) is available to the Trustees on a voluntary basis. Deferred amounts remain in the Trust until distributed in accordance with the provisions of the Plan. The value of a participating Trustee’s deferral account is based on theoretical investments of deferred amounts on the normal payment dates in certain portfolios of the Trust or Brighthouse Funds Trust I, an affiliate of the Trust, as designated by the participating Trustee. Changes in the value of participants’ deferral accounts are reflected as Trustees’ fees and expenses in the Statement of Operations. The portion of the accrued obligations allocated to the Portfolio under the Plan is reflected as Deferred trustees’ fees in the Statement of Assets and Liabilities.
6. Contractual Obligations
Under the Trust’s organizational documents, its officers and Trustees may be indemnified against certain liabilities and expenses arising out of the performance of their duties to the Trust. Additionally, the Trust has a variety of indemnification obligations under contracts with its service providers. The Trust’s maximum exposure under these arrangements is unknown, as this would involve future claims that may be made against the Trust that have not yet occurred.
7. Income Tax Information
The cost basis of investments for federal income tax purposes at December 31, 2018 was as follows:
| | | | |
Cost basis of investments | | $ | 366,559,230 | |
Gross unrealized appreciation | | | 92,663,277 | |
Gross unrealized depreciation | | | (27,390,796 | ) |
| | | | |
Net unrealized appreciation (depreciation) | | $ | 65,272,481 | |
| | | | |
The tax character of distributions paid for the years ended December 31, 2018 and 2017 were as follows:
| | | | | | | | | | | | | | | | | | | | |
Ordinary Income | | | Long-Term Capital Gain | | | Total | |
2018 | | 2017 | | | 2018 | | | 2017 | | | 2018 | | | 2017 | |
| $469,010 | | $ | 931,074 | | | $ | 47,567,017 | | | $ | 30,355,047 | | | $ | 48,036,027 | | | $ | 31,286,121 | |
As of December 31, 2018, the components of distributable earnings (accumulated losses) on a federal income tax basis were as follows:
| | | | | | | | | | | | | | | | |
Undistributed
Ordinary
Income | | Undistributed
Long-Term
Capital Gain | | | Net
Unrealized
Appreciation | | | Accumulated
Capital Losses | | | Total | |
| $386,930 | | $ | 43,573,565 | | | $ | 65,272,481 | | | $ | — | | | $ | 109,232,976 | |
The Portfolio utilizes the provisions of the federal income tax laws that provide for the carryforward of capital losses for prior years, offsetting such losses against any future realized capital gains. Under the Regulated Investment Company Modernization Act of 2010 (the “Act”), net capital losses recognized after December 22, 2010 may be carried forward indefinitely and their character is retained as short-term and/or long-term losses.
As of December 31, 2018, the Portfolio had no accumulated capital losses.
BHFTII-20
Brighthouse Funds Trust II
Loomis Sayles Small Cap Core Portfolio
Notes to Financial Statements—December 31, 2018—(Continued)
8. Recent Accounting Pronouncements and SEC Update
In August 2018, the FASB issued Accounting Standards Update2018-13, Fair Value Measurement (Topic 820)—Disclosure Framework—Changes to the Disclosure Requirements for Fair Value Measurement (“ASU2018-13”) which introduces new fair value disclosure requirements as well as eliminates and modifies certain existing fair value disclosure requirements. ASU2018-13 is effective for fiscal years beginning after December 15, 2019, and interim periods within those fiscal years. Early adoption is permitted and, as such, management has elected to early adopt ASU2018-13 effective with the current reporting period. The impact of the Portfolio’s adoption was limited to changes in the Portfolio’s financial statement disclosures regarding fair value, primarily those disclosures related to transfers between levels of the fair value hierarchy.
In August 2018, the Securities and Exchange Commission released its Final Rule on Disclosure Update and Simplification (the “Final Rule”) which is intended to simplify an issuer’s disclosure compliance efforts by removing redundant or outdated disclosures requirements without significantly altering the mix of information provided to investors. Effective with the current reporting period, the Portfolio adopted the Final Rule with the most notable impacts being that the Portfolio is no longer required to present the components of distributable earnings on the Statement of Assets and Liabilities or the sources of distributions to shareholders and the amounts of undistributed net investment income on the Statements of Changes in Net Assets.
BHFTII-21
Brighthouse Funds Trust II
Loomis Sayles Small Cap Core Portfolio
Report of Independent Registered Public Accounting Firm
To the Shareholders of Loomis Sayles Small Cap Core Portfolio and the Board of Trustees of Brighthouse Funds Trust II:
Opinion on the Financial Statements and Financial Highlights
We have audited the accompanying statement of assets and liabilities, including the schedule of investments, of the Loomis Sayles Small Cap Core Portfolio (the “Portfolio”), one of the portfolios constituting the Brighthouse Funds Trust II, as of December 31, 2018, the related statement of operations for the year then ended, the statements of changes in net assets for each of the two years in the period then ended, the financial highlights for each of the five years in the period then ended, and the related notes. In our opinion, the financial statements and financial highlights present fairly, in all material respects, the financial position of the Loomis Sayles Small Cap Core Portfolio of the Brighthouse Funds Trust II as of December 31, 2018, the results of its operations for the year then ended, the changes in its net assets for each of the two years in the period then ended, and the financial highlights for each of the five years in the period then ended, in conformity with accounting principles generally accepted in the United States of America.
Basis for Opinion
These financial statements and financial highlights are the responsibility of the Portfolio’s management. Our responsibility is to express an opinion on the Portfolio’s financial statements and financial highlights based on our audits. We are a public accounting firm registered with the Public Company Accounting Oversight Board (United States) (PCAOB) and are required to be independent with respect to the Portfolio in accordance with the U.S. federal securities laws and the applicable rules and regulations of the Securities and Exchange Commission and the PCAOB.
We conducted our audits in accordance with the standards of the PCAOB. Those standards require that we plan and perform the audit to obtain reasonable assurance about whether the financial statements and financial highlights are free of material misstatement, whether due to error or fraud. The Portfolio is not required to have, nor were we engaged to perform, an audit of its internal control over financial reporting. As part of our audits we are required to obtain an understanding of internal control over financial reporting but not for the purpose of expressing an opinion on the effectiveness of the Portfolio’s internal control over financial reporting. Accordingly, we express no such opinion.
Our audits included performing procedures to assess the risks of material misstatement of the financial statements and financial highlights, whether due to error or fraud, and performing procedures that respond to those risks. Such procedures included examining, on a test basis, evidence regarding the amounts and disclosures in the financial statements and financial highlights. Our audits also included evaluating the accounting principles used and significant estimates made by management, as well as evaluating the overall presentation of the financial statements and financial highlights. Our procedures included confirmation of securities owned as of December 31, 2018, by correspondence with the custodian and brokers; when replies were not received from brokers, we performed other auditing procedures. We believe that our audits provide a reasonable basis for our opinion.
/s/ Deloitte & Touche LLP
Boston, Massachusetts
February 25, 2019
We have served as the auditor of one or more of the Brighthouse investment companies since 1983.
BHFTII-22
Brighthouse Funds Trust II
Trustees and Officers
MANAGEMENT OF THE TRUSTS
The Boards of Trustees (the “Board”) of Brighthouse Funds Trust I and Brighthouse Funds Trust II (“BHF I” and “BHF II”, respectively, and collectively the “Trusts”) supervise the Trusts and are responsible for representing the interests of shareholders. The Trustees, the Chairman of the Board and the Chairmen of each subcommittee are the same for both Trusts. The Trustees of each Trust meet periodically throughout the year to oversee the Portfolios’ activities, reviewing, among other things, each Portfolio’s performance and its contractual arrangements with various service providers. The Trustees of each Trust elect the officers of the Trust, who are responsible for administering the Trust’sday-to-day operations.
Trustees and Officers
The Trustees and executive officers of the Trusts, as well as their principal occupations during the past five years, are set forth below. Unless otherwise indicated, the business address of each is c/o Brighthouse Funds, One Financial Center, Boston, Massachusetts 02111. Each Trustee who is deemed an “interested person,” as such term is defined in the 1940 Act, is referred to as an “Interested Trustee.” Those Trustees who are not “interested persons,” as such term is defined in the 1940 Act, are referred to as “Independent Trustees.” There is no limit to the term a Trustee may serve. Trustees serve until their death, resignation or removal in accordance with the BHF I Trust’s and BHF II Trust’s respective organizational documents and policies adopted by the Boards of the respective Trusts from time to time. Officers hold office at the pleasure of each Board and serve until their removal or resignation in accordance with the Trusts’ respective organizational documents and policies adopted by the Board of each Trust from time to time.
| | | | | | | | | | |
Name and Year of Birth | | Current
Position(s)
Held with
Registrant | | Term of Office
and Length of
Time Served | | Principal Occupation(s) During the Past
5 Years(1) | | Number of
Portfolios
in Brighthouse
Funds
Complex(2)
Overseen
by Trustee | | Other Directorships Held
by Trustee During the
Past 5 Years(1) |
| Interested Trustee |
John Rosenthal* (1960) | | Trustee | | Indefinite; From
May 2016
(Trust I and
Trust II) to present | | Chief Investment Officer, Brighthouse Financial, Inc. (2017 to present); until 2017, Senior Managing Director and Head of Global Portfolio Management, MetLife, Inc. | | 72 | | None |
|
| Independent Trustees |
Dawn M. Vroegop (1966) | | Trustee and Chairman of the Board | | Indefinite; From
December 2000
(Trust I)/May
2009 (Trust II) to
present as
Trustee; From
May 2016 (Trust
I and Trust II)
until present as
Chairman | | Private Investor. | | 72 | | Trustee, Driehaus Mutual Funds.** |
| | | | | |
Stephen M. Alderman (1959) | | Trustee | | Indefinite; From
December 2000
(Trust I)/April
2012 (Trust II) to
present | | Shareholder in the law firm of Garfield and Merel, Ltd. | | 72 | | None |
| | | | | |
Robert J. Boulware (1956) | | Trustee | | Indefinite; From
March 2008
(Trust I)/April
2012 (Trust II) to
present | | Managing Director, Pilgrim Funds, LLC (private equity fund). | | 72 | | Trustee, Vertical Capital Income Fund(closed-end fund);** Director, Gainsco, Inc. (auto insurance);** Trustee, SharesPost 100 Fund(closed-end fund).** |
| | | | | |
Susan C. Gause (1952) | | Trustee | | Indefinite; From
March 2008
(Trust I)/April
2012 (Trust II) to
present | | Private Investor. | | 72 | | Trustee, HSBC Funds.** |
BHFTII-23
Brighthouse Funds Trust II
Trustees and Officers—(Continued)
| | | | | | | | | | |
Name and Year of Birth | | Current
Position(s)
Held with
Registrant | | Term of Office
and Length of
Time Served | | Principal Occupation(s) During the Past
5 Years(1) | | Number of
Portfolios
in Brighthouse
Funds
Complex(2)
Overseen
by Trustee | | Other Directorships Held
by Trustee During the
Past 5 Years(1) |
Nancy Hawthorne (1951) | | Trustee | | Indefinite; From
May 2003
(Trust II)/April
2012 (Trust I)
to present | | Partner, Hawthorne Financial Advisors, LLC (registered investment advisor); until 2014, Chief Executive Officer, Clerestory LLC (corporate advisor). | | 72 | | Director and Chairman of the Board of Directors, THL Credit, Inc.;** Director and Chairman of the Board, Avid Technology, Inc.;** Director, CRA International, Inc.** |
| | | | | |
Barbara A. Nugent (1956) | | Trustee | | Indefinite; From
January 2014
(Trust I and
Trust II) to
present | | President, True North Board Governance, LLC (consulting); until December 2013, partner in the law firm of Stradley Ronon Stevens & Young, LLP. | | 72 | | Independent Lead Trustee, BMT Investment Funds** |
| | | | | |
Christopher J. Towle (1957) | | Trustee | | Indefinite; From
April 2018
(Trust I and
Trust II) to
present | | Retired; until 2014, Partner, Portfolio Manager, Director of High Yield and Convertible Strategies, Lord Abbett & Co. | | 72 | | Trustee, Driehaus Mutual Funds** |
Officers
| | | | | | |
Name and Year of Birth | | Position(s)
Held with
Registrant | | Length of
Time Served | | Principal Occupation(s)
During the Past 5 Years(1) |
| Executive Officers | | | | | | |
Kristi Slavin (1973) | | President and Chief Executive Officer, of Trust I and Trust II | | From May
2016
(Trust I and
Trust II) to
present | | President, Brighthouse Investment Advisers, LLC (2016-present); formerly, Senior Vice President, MetLife Advisers, LLC; Vice President, MetLife, Inc.; Vice President, Trust I and Trust II(2015-2016). |
| | | |
Alan R. Otis (1971) | | Chief Financial Officer and Treasurer, of Trust I and Trust II | | From
November
2017
(Trust I and
Trust II) to
present | | Senior Vice President, Brighthouse Investment Advisers, LLC (2017-present); formerly, Vice President, Brighthouse Investment Advisers, LLC (2012-2017); Assistant Treasurer, Trust I and Trust II (2012-2017). |
| | | |
Andrew L. Gangolf (1954) | | Secretary, of Trust I and Trust II | | From May
2011
(Trust I and
Trust II) to
present | | Executive Vice President, Brighthouse Investment Advisers, LLC (2017-present); formerly, Senior Vice President, MetLife Advisers, LLC (2011-2017); until 2011, Senior Vice President & Assistant General Counsel, AllianceBernstein Investments, Inc. |
| | | |
Steven E. Hartstein (1963) | | Chief Compliance Officer (“CCO”), of Trust I and Trust II | | From
February
2014
(Trust I and
Trust II) to
present | | Senior Vice President and CCO, Brighthouse Investment Advisers, LLC (2017-present); Head of Investments Compliance, Vice President, Brighthouse Financial, Inc. (2017-present); formerly, Vice President, MetLife, Inc. (2013-2017); Senior Vice President and CCO, MetLife Advisers, LLC (2013-2017.) |
| | | |
Victor Soto (1978) | | Vice President of Trust I and Trust II | | From May
2018
(Trust I and
Trust II) to
present | | Executive Vice President, Brighthouse Investment Advisers, LLC (2016-present); Assistant Vice President, MetLife Inc. (2015-2017); Portfolio Manager, 1st Global (2013-2015). |
| * | Mr. Rosenthal is an “interested person” of the Trusts because of his position with Brighthouse Financial, Inc., the current parent company of Brighthouse Investment Advisers, LLC. |
| ** | Indicates a directorship with a registered investment company or a company subject to the reporting requirements of the Securities Exchange Act of 1934, as amended. |
| (1) | Previous positions during the past five years with the Trusts, Brighthouse Financial, Inc., MetLife, Inc. or the Manager are omitted if not materially different. |
| (2) | The Fund Complex includes 43 BHF I Portfolios and 29 BHF II Portfolios. |
BHFTII-24
Brighthouse Funds Trust II
Loomis Sayles Small Cap Core Portfolio
Board of Trustees’ Consideration of Advisory and Sub-Advisory Agreements
At anin-person meeting held on November6-8, 2018 (the “November Meeting”), the Boards of Trustees (the “Board”) of Brighthouse Funds Trust I and Brighthouse Funds Trust II (“BFT I” and “BFT II,” respectively, and collectively, the “Trusts”), including a majority of the Trustees who are not “interested persons” of the Trusts (the “Independent Trustees”) under the Investment Company Act of 1940 (the “1940 Act”), approved the continuation of the Trusts’ advisory agreements (each, an “Advisory Agreement”) with Brighthouse Investment Advisers, LLC (the “Adviser”) and the applicablesub-advisory agreements (each a “Sub-Advisory Agreement,” and collectively with the Advisory Agreement, the “Agreements”) between the Adviser and the investmentsub-advisers (each a “Sub-Adviser,” and collectively, the “Sub-Advisers”) for the series of the Trusts (each a “Portfolio,” and collectively, the “Portfolios”).
In making those approvals, the Board reviewed a variety of materials that were provided for the specific purpose of the annual contract renewal process. In addition, various materials provided to and discussed with the Board throughout the year informed the Board’s decision to renew the Agreements. In particular, the information for each Portfolio included, but was not limited to, investment performance reports, and reports on expenses, legal and compliance matters, asset pricing, brokerage commissions and trade execution.
The Board met in person with personnel of the Adviser on October 17, 2018 for the specific purpose of giving preliminary consideration to the proposed continuation of the Agreements (the “October Meeting”). At that meeting, the Adviser reviewed with the Board the performance and fees experienced by each Portfolio, as well as other information. During and after the October Meeting, the Independent Trustees communicatedfollow-up matters for management to address at the November Meeting. The Independent Trustees were advised by independent legal counsel throughout the contract renewal process, and met with independent legal counsel in several executive sessions outside of the presence of management.
Information furnished and reviewed specifically in connection with the renewal process included, but was not limited to, a report for each Portfolio that was prepared by Broadridge (“Broadridge”), an independent organization. In addition, the Independent Trustees reviewed a report that was prepared by JDL Consultants, LLC (“JDL”), an independent consultant to the Independent Trustees (“JDL Report”), which examined the comparative fees, expenses and performance of each Portfolio, based upon the Broadridge reports. Also, the Board reviewed the responses to wide-ranging questions from the Independent Trustees relating to the business, operations and performance of the Adviser and theSub-Advisers that the Adviser andSub-Advisers had prepared specifically for the renewal process, and reviewed aPortfolio-by-Portfolio analysis of the profitability to the Adviser of each Advisory Agreement, which was prepared by the Adviser for the renewal process.
At the November Meeting, the Board, including a majority of the Independent Trustees, concluded that the nature, extent and quality of services provided by the Adviser and eachSub-Adviser supported the renewal of the Agreements. The Board also concluded that the investment performance of each Portfolio was such that each Agreement should continue, and that the fees paid by each Portfolio to the Adviser appeared to be reasonable in light of the nature, extent and quality of the services provided by the Adviser andSub-Adviser. Further, the Board concluded that the Adviser’s profitability in providing services under the Advisory Agreements did not appear unreasonable in light of the nature, extent and quality of the services provided by the Adviser. Finally, the Board reviewed the extent to which the investment advisory fees paid by the Portfolios shared economies of scale with investors or entailed the potential to share economies of scale with investors and concluded that those considerations generally supported the renewal of each Agreement. In approving the renewal of each of the Agreements, the Board, including the Independent Trustees, gave attention to all of the information that was furnished and each Trustee placed varying degrees of importance on the various pieces of information that were provided to them. The Board evaluated the information available to it on aPortfolio-by-Portfolio basis, and its decision was made separately with respect to each Portfolio. The following paragraphs provide more information about some of the primary factors that were relevant to the Board’s decision. The Board did not identify any single factor as determinative, and the Trustees generally attributed different weights to various factors for the various Portfolios.
Nature, extent and quality of services. The Board evaluated the nature, extent and quality of the services that the Adviser and theSub-Advisers, as relevant, have provided to the Portfolios. The Board considered the Adviser’s services as investment manager to the Portfolios, including its services relating to the hiring and oversight of theSub-Advisers, trading practices and oversight of transition management (as applicable), compliance programs and personnel, and risk management, among other things. The Adviser’s services in coordinating and overseeing the activities of the Trusts’ other service providers were also considered. The Board considered information received from the Trusts’ Chief Compliance Officer (“CCO”) regarding the Portfolios’ compliance policies and procedures that were established pursuant to Rule38a-l under the 1940 Act. The Board also noted that the Adviser’s investment, compliance and legal staff conduct regular and periodic telephonic andin-person meetings with theSub-Advisers to review and assess the services that are provided to the Portfolios, and that personnel of the Adviser prepare and present reports to the Independent Trustees regarding those meetings. In addition, throughout the year, the Board considered the expertise, experience and performance of the personnel of the Adviser who performed the various services that are mentioned above.
BHFTII-25
Brighthouse Funds Trust II
Loomis Sayles Small Cap Core Portfolio
Board of Trustees’ Consideration of Advisory and Sub-Advisory Agreements—(Continued)
With respect to the services provided by each of theSub-Advisers, the Board considered a variety of information that the Adviser and eachSub-Adviser prepared for the Board’s review. The Board considered eachSub-Adviser’s investment process and philosophy, and the investment performance experienced by the Portfolio (as described in more detail below). The Board took into account that eachSub-Adviser’s responsibilities include the development and maintenance of an investment program for the applicable Portfolio that is consistent with the Portfolio’s investment objectives, the selection of investment securities and the placement of orders for the purchase and sale of such securities, as well as the implementation of compliance controls related to performance of these services. In particular, the Board considered, among other things, theSub-Adviser’s current level of staffing as well as its compensation program and its overall resources. The Board reviewed eachSub-Adviser’s history and investment experience, as well as information provided regarding the qualifications, background and responsibilities of theSub-Adviser’s investment and compliance personnel who provide services to the Portfolios. The Board also considered, among other things, eachSub-Adviser’s compliance program and regulatory and disciplinary history. In its review, the Board also took into account information regarding any services and/or payments provided to the Adviser by theSub-Advisers in connection with marketing activities and considered representations from the Adviser that those payments were not considered in the Adviser’s recommendation to renew any of theSub-Advisory Agreements.
Performance. The Board placed emphasis on the performance of each Portfolio in light of, among other things, its importance to investors. The Board considered the Adviser’s quarterly reviews with the Board of detailed information about each Portfolio’s investment strategies and performance results and composition, including discussions regarding the relevant effect of current market conditions. The Board reviewed and considered the reports prepared by Broadridge, which provided a statistical analysis comparing the Portfolios’ investment performance to that of comparable funds underlying variable insurance products (the “Performance Universe”). The Independent Trustees also met separately with representatives of JDL during the October Meeting to review the JDL Report. The Board also compared the performance records of the Portfolios to those of comparable funds and other accounts that were managed by the relevantSub-Adviser, to the extent such information was available. The Board considered each Portfolio’s performance for periods subsequent to the performance period covered by the Broadridge reports, and the Adviser’s discussion of the same, including the effect of current market conditions on each Portfolio’s more recent performance. The Board also noted that while it found the data provided by Broadridge generally useful, it recognized the limitations of such data, including, in particular, that notable differences may exist between a Portfolio and those of the other funds in a Broadridge category (for example, the investment objectives(s) and investment strategies) and that the results of the performance comparisons may vary depending on (i) the end dates for the performance periods that were selected and (ii) the selection of the peer groups.
The Board focused particular attention on Portfolios with less favorable performance records. The Board noted the Adviser’s focus on eachSub-Adviser’s performance and that the Adviser has been active in monitoring and responding to any performance issues with respect to the Portfolios.
Fees and Expenses. The Board gave consideration to the level and method of computing the fees payable under the Agreements. The Board considered the Broadridge report for each of the Portfolios, which included comparisons for each Portfolio of its contractual management andsub-adviser fees (at current and various asset levels), and total expenses, with those of its peers, including as those peers were divided into a broad group of peer funds (“Expense Universe”), a narrower group of peer funds (“Expense Group”), a broad group of peersub-advised funds (“Sub-advised Expense Universe”), and a narrower group of peersub-advised funds (“Sub-advised Expense Group”). Broadridge selected the peer funds which were similarly situated funds underlying variable insurance products deemed to be comparable to the Portfolios. The Independent Trustees, with the assistance of JDL, also examined the JDL Report. The Board compared the fee payable to aSub-Adviser by the Adviser with respect to the Portfolio to the fee payable to theSub-Adviser by other comparable funds and other accounts, to the extent such information was available.
The Board noted that thesub-advisory fees for the Portfolios are paid by the Adviser out of the advisory fees, and that the Adviser negotiates the fees at arm’s length. The Board also considered that the Adviser had entered into expense limitation or management fee waiver agreements with certain of the Portfolios pursuant to which the Adviser had agreed to waive a portion of its advisory fee and/or reimburse certain expenses as a means of limiting a Portfolio’s total annual operating expenses.
Profitability. The Board examined the profitability to the Adviser of each Advisory Agreement, on aPortfolio-by-Portfolio basis. The Board also considered that an affiliate of the Adviser, Brighthouse Securities, LLC, serves as distributor for the Trusts, and, as such, receives Rule12b-1 payments to support the distribution of the Portfolios. The Board considered the profitability to theSub-Advisers and their affiliates as a result of their relationships with the Portfolios, to the extent available, and the Board considered the ability of the Adviser to negotiate with aSub-Adviser at arm’s length. In reviewing the profitability analyses, the Board recognized that expense allocation methodologies are inherently subjective and various expense allocation methodologies may be reasonable while producing different results.
BHFTII-26
Brighthouse Funds Trust II
Loomis Sayles Small Cap Core Portfolio
Board of Trustees’ Consideration of Advisory and Sub-Advisory Agreements—(Continued)
Economies of scale. The Board also considered each Portfolio’s fees in light of its size. The Board noted the fee schedules for the Portfolios that contain breakpoints that reduce the fee rate above specified asset levels. The Board noted those Portfolios that did not have breakpoints in their advisory fee and took into account management’s discussion of the same. The Board noted that those Portfolios with Advisory Agreements containing breakpoints generally have breakpoints in the correspondingSub-Advisory Agreement. The Board considered the effective fees under the Advisory Agreement andSub-Advisory Agreement for each Portfolio as a percentage of assets at different asset levels and possible economies of scale that may be realized if the assets of the Portfolio grow. The Board examined, among other data, the effect of a Portfolio’s growth in size, and reduction in size, on various fee schedules and the Board reviewed the Broadridge and JDL Reports, which compared fees among peers. The Board also generally noted that if a Portfolio’s assets increase over time, the Portfolio may realize other economies of scale if assets increase proportionally more than certain other fixed expenses.
Other factors. The Board considered other benefits that may be realized by the Adviser and its affiliates from their relationship with the Trusts. Among them, the Board recognized that Brighthouse Securities, LLC, as the distributor for the Trusts, receives payments pursuant to Rule12b-1 from the Portfolios to compensate for the provision of shareholder services and distribution activities, which could lead to growth in the Trusts’ assets and corresponding benefits from such growth, including economies of scale. The Board considered other benefits that may be realized by eachSub-Adviser and its affiliates from their relationship with the Trusts, including the opportunity to provide advisory services to additional portfolios of the Trusts and reputational benefits. In conjunction with these considerations, the Board noted the ongoing commitment of the Adviser to the Portfolios.
The Board requested, received, and considered information from the Adviser regarding possible conflicts of interest in the form of material benefits to the Adviser resulting from the Adviser’s affiliations and business relationships, as relevant. The Board considered the services that are provided to the Trusts by its service providers, and the manner in which any conflicts were mitigated.
* * *
Loomis Sayles Small Cap Core Portfolio. The Board also considered the following information in relation to the Agreements with the Adviser and Loomis, Sayles & Company, L.P. regarding the Portfolio:
Among other data relating specifically to the Portfolio’s performance, the Board considered that the Portfolio outperformed the median of one of its Performance Universes for the five-year period ended June 30, 2018, and underperformed the median of the same Performance Universe for theone-year and three-year periods ended June 30, 2018. The Board also noted that the Portfolio underperformed the median of its other Performance Universe for theone-, three-, and five-year periods ended June 30, 2018. The Board also considered that the Portfolio underperformed the average of its Morningstar Category for theone-, three- and five-year periods ended June 30, 2018. The Board also noted that the Portfolio outperformed the average of a different, but still comparable, Morningstar Category for theone-, three- and five-year periods ended June 30, 2018. The Board further considered that the Portfolio underperformed its benchmark, the Russell 2000 Index, for theone-, three-, and five-year periods ended September 30, 2018. The Board took into account management’s discussion of the Portfolio’s performance, including prevailing market conditions.
The Board also noted that the Portfolio’s actual management fees were above the Expense Universe median andSub-advised Expense Universe median, and below the Expense Group median. The Board considered that the Portfolio’s total expenses (exclusive of12b-1 fees) were equal to the Expense Universe median, below the Expense Group median and above theSub-advised Expense Universe median. The Board further noted that the Portfolio’s contractual management fees were above the asset-weighted average of comparable funds selected by Broadridge at the Portfolio’s current size. The Board also took into account that the Portfolio’s contractualsub-advisory fees were below the averages of theSub-advised Expense Universe and theSub-advised Expense Group at the Portfolio’s current size.
BHFTII-27
Brighthouse Funds Trust II
Loomis Sayles Small Cap Growth Portfolio
Managed by Loomis, Sayles & Company, L.P.
Portfolio Manager Commentary*
PERFORMANCE
For the 12 months ended December 31, 2018, the Class A, B, and E shares of the Loomis Sayles Small Cap Growth Portfolio returned 0.55%, 0.28%, and 0.43%, respectively. The Portfolio’s benchmark, the Russell 2000 Growth Index1, returned-9.31%.
MARKET ENVIRONMENT / CONDITIONS
After a somewhat weak and volatile start to 2018, domestic equity markets returned to broad-based gains during the first half of the year. Despite numerous concerns including the aging economic recovery, Federal Reserve (the “Fed”) interest rate normalization and intensifying threats of import tariffs and trade wars, investors chose to focus on the current healthy state of the U.S. economy and the improved corporate earnings outlook. Against this backdrop of tax reform, trade wars, U.S. dollar strength, and weaker international growth, domestically focused U.S. small cap stocks benefited from strong inflows. The first half of the year saw material outperformance from the smallest of the small cap stocks and from small cap growth stocks far exceeding their value counterparts.
Starting late in the third quarter, market leadership began to change. Stocks tumbled during the final quarter of 2018, with concerns about continued Fed policy tightening, trade wars and weaker global growth all contributing to a negative turn in investor sentiment. The market decline was broad based and comprehensive across market capitalization and investment style.Small-cap stocks were particularly weak, continuing a trend that started during the third quarter. The sharp decline more than offset the advantage small caps had over large caps during the first half of the calendar year. The fourth quartersell-off also completely reversed the prioryear-to-date market gains and turned what appeared in late August to be a dynamic and attractive return year for U.S. equities, into modest overall losses. Economic drivers and investor sentiment also shifted, which resulted in distinct changes in market leadership.
The disparity of returns between market capitalizations and investment style proved meaningful for the year. The Russell 2000 Small Cap Index produced a-11.0% return, well below the-4.4% return of the S&P 500 Index. For the calendar year of 2018,small-cap growth stocks outperformed value stocks as the Russell 2000 Growth Index returned-9.3% compared to the Russell 2000 Value Index return of-12.9%.
PORTFOLIO REVIEW /PERIOD-END POSITIONING
The Portfolio outperformed the Russell 2000 Growth Index during the year, principally due to stock selection. Positive stock selection in the Health Care and Consumer Discretionary sectors aided relative results. Conversely, the Portfolio’s lack of exposure to the Real Estate sector and stock selection in the Consumer Staples sector detracted from relative performance.
The Portfolio’s top contributors to performance were Five9, WingStop and Ablynx. Five9 is the largest cloud contact center solutions provider. The company reported solid results during the year on record revenues and the company executed well in a market that continued to benefit from the conversion ofon-premise legacy solutions to cloud-based solutions. WingStop is a rapidly growing fast casual restaurant chain. The company has reported solid same store sales growth and new store growth that has exceeded expectations. Biopharmaceutical company Ablynx announced it would be acquired during the year by Sanofi at an attractive premium.
The largest detractors from the Portfolio’s performance were WillScot Corp., Installed Building Products, and Patrick Industries. WillScot, the North American market leader in modular space rental solutions, issued stock to current warrant holders in a significant down market and created selling pressure on the stock price. The stock triggered our stop loss and was sold from the Portfolio during the period. Installed Building Products is the second largest installer of residential insulation in the U.S. The company experienced some issues impacting gross margins over the course of the year and came under the selling pressure that impacted most housing-related stocks. The stock was sold from the Portfolio over the period. Patrick Industries manufactures and supplies products to the recreational vehicle (“RV”), manufactured home and industrial markets. The company reported relatively good results over the course of the year, but the lagging RV cycle weighed on the stock. We exited the position over the period after our stop-loss discipline was triggered.
As of December 31, 2018, the largest absolute sector weight in the Portfolio was Health Care. The Portfolio’s allocation to the Health Care sector increased over the year as we added selectively to our health care technology and provider holdings. This is an area we continued to find attractive investment opportunities. However, on a relative basis, we remained underweight Health Care at period end.
BHFTII-1
Brighthouse Funds Trust II
Loomis Sayles Small Cap Growth Portfolio
Managed by Loomis, Sayles & Company, L.P.
Portfolio Manager Commentary*—(Continued)
The Portfolio’s largest relative overweight was to the Information Technology (“IT”) sector, with the majority of that exposure to IT services and software. Both Industrials and Financials exposure declined over the year. Within Industrials, our stop-loss discipline caused us to exit a few names and within Financials the Portfolio’s exposure to banks declined.
Mark Burns
John Slavik
Portfolio Managers
Loomis, Sayles & Company, L.P.
* This commentary may include statements that constitute “forward-looking statements” under the U.S. securities laws. Forward-looking statements include, among other things, projections, estimates, and information about possible or future results related to the Portfolio, market or regulatory developments. The views expressed above are not guarantees of future performance or economic results and involve certain risks, uncertainties and assumptions that could cause actual outcomes and results to differ materially from the views expressed herein. The views expressed above are subject to change at any time based upon economic, market, or other conditions and the subadvisory firm undertakes no obligation to update the views expressed herein. Any discussions of specific securities should not be considered a recommendation to buy or sell those securities. The views expressed above (including any forward-looking statement) may not be relied upon as investment advice or as an indication of the Portfolio’s trading intent. Information about the Portfolio’s holdings, asset allocation or country diversification is historical and is not an indication of future Portfolio composition, which may vary. Direct investment in any index is not possible. The performance of any index mentioned in this commentary has not been adjusted for ongoing management, distribution and operating expenses, and sales charges applicable to mutual fund investments. In addition, the returns do not reflect additional fees charged by separate accounts or variable insurance contracts that an investor in the Portfolio may pay. If these additional fees were reflected, performance would have been lower.
BHFTII-2
Brighthouse Funds Trust II
Loomis Sayles Small Cap Growth Portfolio
A $10,000 INVESTMENT COMPARED TO THE RUSSELL 2000 GROWTH INDEX
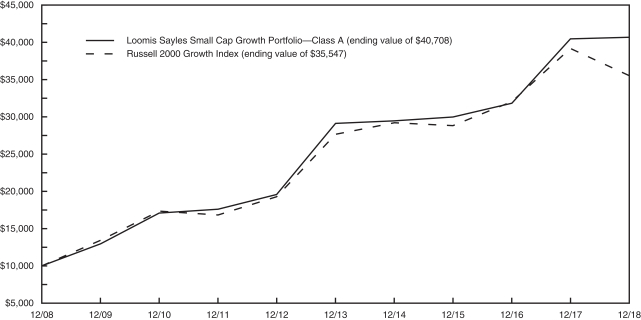
AVERAGE ANNUAL RETURNS (%) (FOR THE YEAR ENDED DECEMBER 31, 2018)
| | | | | | | | | | | | |
| | | | |
| | | 1 Year | | | 5 Year | | | 10 Year | |
| Loomis Sayles Small Cap Growth Portfolio | | | | | | | | | | | | |
Class A | | | 0.55 | | | | 6.92 | | | | 15.07 | |
Class B | | | 0.28 | | | | 6.64 | | | | 14.79 | |
Class E | | | 0.43 | | | | 6.75 | | | | 14.92 | |
| Russell 2000 Growth Index | | | -9.31 | | | | 5.14 | | | | 13.52 | |
1 The Russell 2000 Growth Index is an unmanaged measure of performance of those Russell 2000 companies (small capitalization companies) that have higher price-to book ratios and higher forecasted growth values.
Portfolio performance is calculated including reinvestment of all income and capital gain distributions. Performance numbers are net of all Portfolio expenses but do not include any insurance, sales, separate account or administrative charges of variable annuity or life insurance contracts or any additional expenses that participants may bear relating to the operations of their plans. If these charges were included, the returns would be lower. The performance of any index referenced above has not been adjusted for ongoing management, distribution and operating expenses, and sales charges applicable to mutual fund investments. Direct investment in any index is not possible. The performance of Class A shares, as set forth in the line graph above, will differ from that of other classes because of the difference in expenses paid by policyholders investing in the different share classes.
This information represents past performance and is not indicative of future results. Investment return and principal value may fluctuate so that shares, upon redemption, may be worth more or less than the original cost.
PORTFOLIO COMPOSITION AS OF DECEMBER 31, 2018
Top Holdings
| | | | |
| | | % of
Net Assets | |
| Planet Fitness, Inc.- Class A | | | 1.6 | |
| PRA Health Sciences, Inc. | | | 1.6 | |
| Five9, Inc. | | | 1.6 | |
| Vocera Communications, Inc. | | | 1.5 | |
| Grand Canyon Education, Inc. | | | 1.5 | |
| Pool Corp. | | | 1.5 | |
| Wingstop, Inc. | | | 1.5 | |
| Wright Medical Group NV | | | 1.5 | |
| Q2 Holdings, Inc. | | | 1.4 | |
| Kinsale Capital Group, Inc. | | | 1.4 | |
Top Sectors
| | | | |
| | | % of
Net Assets | |
| Health Care | | | 25.0 | |
| Information Technology | | | 23.8 | |
| Industrials | | | 16.9 | |
| Consumer Discretionary | | | 15.4 | |
| Financials | | | 8.1 | |
| Consumer Staples | | | 2.8 | |
| Communication Services | | | 2.1 | |
| Energy | | | 1.5 | |
| Materials | | | 1.3 | |
BHFTII-3
Brighthouse Funds Trust II
Loomis Sayles Small Cap Growth Portfolio
Understanding Your Portfolio’s Expenses
Shareholder Expense Example
As a shareholder of the Portfolio, you incur ongoing costs, including management fees; distribution and service(12b-1) fees; and other Portfolio expenses. This example is intended to help you understand your ongoing costs (in dollars) (referred to as “expenses”) of investing in the Portfolio and compare these costs with the ongoing costs of investing in other mutual funds. The example is based on an investment of $1,000 invested at the beginning of the period and held for the entire period, July 1, 2018 through December 31, 2018.
Actual Expenses
The first line for each share class of the Portfolio in the table below provides information about actual account values and actual expenses. You may use the information in this line, together with the amount you invested in the particular share class of the Portfolio, to estimate the expenses that you paid over the period. Simply divide your account value by $1,000 (for example, an $8,600 account value divided by $1,000 = 8.6), then multiply the result by the number in the first line under the heading entitled “Expenses Paid During Period” to estimate the expenses you paid on your account during this period.
Hypothetical Example for Comparison Purposes
The second line for each share class of the Portfolio in the table below provides information about hypothetical account values and hypothetical expenses based on the Portfolio’s actual expense ratio and an assumed rate of return of 5% per year before expenses, which is not the Portfolio’s actual return. The hypothetical account values and expenses may not be used to estimate the actual ending account balance or expenses you paid for the period. You may use this information to compare the ongoing costs of investing in the Portfolio and other funds. To do so, compare this 5% hypothetical example with the 5% hypothetical examples that appear in the shareholder reports of the other funds.
Please note that the expenses shown in the table are meant to highlight your ongoing costs only and do not reflect any fees or charges of your variable insurance product or any additional expenses that participants in certain eligible qualified plans may bear relating to the operations of their plan. Therefore, the second line for each share class in the table is useful in comparing ongoing costs only, and will not help you determine the relative total costs of owning different funds. In addition, if these other costs were included, your costs would have been higher.
| | | | | | | | | | | | | | | | | | |
Loomis Sayles Small Cap Growth Portfolio
| | | | Annualized
Expense
Ratio | | | Beginning
Account Value
July 1,
2018 | | | Ending
Account Value
December 31,
2018 | | | Expenses Paid
During Period**
July 1, 2018
to
December 31,
2018 | |
Class A (a) | | Actual | | | 0.87 | % | | $ | 1,000.00 | | | $ | 874.70 | | | $ | 4.11 | |
| | Hypothetical* | | | 0.87 | % | | $ | 1,000.00 | | | $ | 1,020.82 | | | $ | 4.43 | |
| | | | | |
Class B (a) | | Actual | | | 1.12 | % | | $ | 1,000.00 | | | $ | 873.50 | | | $ | 5.29 | |
| | Hypothetical* | | | 1.12 | % | | $ | 1,000.00 | | | $ | 1,019.56 | | | $ | 5.70 | |
| | | | | |
Class E (a) | | Actual | | | 1.03 | % | | $ | 1,000.00 | | | $ | 873.50 | | | $ | 4.86 | |
| | Hypothetical* | | | 1.03 | % | | $ | 1,000.00 | | | $ | 1,020.01 | | | $ | 5.24 | |
| * | Hypothetical assumes a rate of return of 5% per year before expenses. |
| ** | Expenses paid are equal to the Portfolio’s annualized expense ratio for the most recent six month period, as shown above, multiplied by the average account value over the period, multiplied by the number of days (184 days) in the most recent fiscal half-year, divided by 365 (to reflect theone-half year period). |
| (a) | The annualized expense ratio shown reflects the impact of the management fee waiver as described in Note 5 of the Notes to Financial Statements. |
BHFTII-4
Brighthouse Funds Trust II
Loomis Sayles Small Cap Growth Portfolio
Schedule of Investments as of December 31, 2018
Common Stocks—96.9% of Net Assets
| | | | | | | | |
| Security Description | | Shares | | | Value | |
|
| Aerospace & Defense—3.5% | |
AAR Corp. | | | 78,396 | | | $ | 2,927,307 | |
Astronics Corp. (a) | | | 72,261 | | | | 2,200,347 | |
Hexcel Corp. (b) | | | 58,964 | | | | 3,380,996 | |
Mercury Systems, Inc. (a) | | | 47,299 | | | | 2,236,770 | |
| | | | | | | | |
| | | | | | | 10,745,420 | |
| | | | | | | | |
|
| Auto Components—0.5% | |
Stoneridge, Inc. (a) | | | 65,473 | | | | 1,613,909 | |
| | | | | | | | |
|
| Banks—2.6% | |
Chemical Financial Corp. | | | 53,407 | | | | 1,955,230 | |
Pacific Premier Bancorp, Inc. (a) | | | 59,162 | | | | 1,509,814 | |
Pinnacle Financial Partners, Inc. | | | 48,409 | | | | 2,231,655 | |
UMB Financial Corp. | | | 38,521 | | | | 2,348,626 | |
| | | | | | | | |
| | | | | | | 8,045,325 | |
| | | | | | | | |
|
| Beverages—0.8% | |
MGP Ingredients, Inc. (b) | | | 40,891 | | | | 2,332,832 | |
| | | | | | | | |
|
| Biotechnology—4.6% | |
Aimmune Therapeutics, Inc. (a) (b) | | | 81,175 | | | | 1,941,706 | |
Argenx SE (ADR) (a) | | | 28,381 | | | | 2,726,563 | |
Blueprint Medicines Corp. (a) | | | 33,669 | | | | 1,815,096 | |
Genomic Health, Inc. (a) | | | 54,200 | | | | 3,491,022 | |
Myriad Genetics, Inc. (a) | | | 67,997 | | | | 1,976,673 | |
Xencor, Inc. (a) | | | 59,090 | | | | 2,136,694 | |
| | | | | | | | |
| | | | | | | 14,087,754 | |
| | | | | | | | |
|
| Building Products—1.6% | |
AAON, Inc. | | | 30,068 | | | | 1,054,184 | |
Trex Co., Inc. (a) | | | 63,294 | | | | 3,757,132 | |
| | | | | | | | |
| | | | | | | 4,811,316 | |
| | | | | | | | |
|
| Capital Markets—0.5% | |
Artisan Partners Asset Management, Inc. - Class A | | | 70,295 | | | | 1,554,222 | |
| | | | | | | | |
|
| Chemicals—1.3% | |
Ingevity Corp. (a) | | | 46,749 | | | | 3,912,424 | |
| | | | | | | | |
|
| Construction & Engineering—0.8% | |
Primoris Services Corp. | | | 127,292 | | | | 2,435,096 | |
| | | | | | | | |
|
| Consumer Finance—1.4% | |
Green Dot Corp. - Class A (a) | | | 51,819 | | | | 4,120,647 | |
| | | | | | | | |
|
| Distributors—1.5% | |
Pool Corp. | | | 30,781 | | | | 4,575,596 | |
| | | | | | | | |
|
| Diversified Consumer Services—5.1% | |
Bright Horizons Family Solutions, Inc. (a) | | | 28,886 | | | | 3,219,345 | |
Chegg, Inc. (a) (b) | | | 133,214 | | | | 3,785,942 | |
Grand Canyon Education, Inc. (a) | | | 48,102 | | | | 4,624,526 | |
Laureate Education, Inc. - Class A (a) | | | 264,779 | | | | 4,035,232 | |
| | | | | | | | |
| | | | | | | 15,665,045 | |
| | | | | | | | |
|
| Diversified Telecommunication Services—1.1% | |
Cogent Communications Holdings, Inc. | | | 76,571 | | | $ | 3,461,775 | |
| | | | | | | | |
|
| Electrical Equipment—1.3% | |
Generac Holdings, Inc. (a) | | | 79,641 | | | | 3,958,158 | |
| | | | | | | | |
|
| Electronic Equipment, Instruments & Components—0.4% | |
Novanta, Inc. (a) | | | 19,079 | | | | 1,201,977 | |
| | | | | | | | |
|
| Energy Equipment & Services—1.0% | |
Cactus, Inc. - Class A (a) | | | 105,659 | | | | 2,896,113 | |
| | | | | | | | |
|
| Entertainment—1.0% | |
IMAX Corp. (a) | | | 154,142 | | | | 2,899,411 | |
| | | | | | | | |
|
| Food & Staples Retailing—0.9% | |
Chefs’ Warehouse, Inc. (The) (a) | | | 89,725 | | | | 2,869,405 | |
| | | | | | | | |
|
| Food Products—1.1% | |
Freshpet, Inc. (a) | | | 105,616 | | | | 3,396,611 | |
| | | | | | | | |
|
| Health Care Equipment & Supplies—7.5% | |
AtriCure, Inc. (a) | | | 125,975 | | | | 3,854,835 | |
Insulet Corp. (a) (b) | | | 51,656 | | | | 4,097,354 | |
iRhythm Technologies, Inc. (a) | | | 46,280 | | | | 3,215,534 | |
Merit Medical Systems, Inc. (a) | | | 57,288 | | | | 3,197,243 | |
Penumbra, Inc. (a) (b) | | | 18,790 | | | | 2,296,138 | |
Tactile Systems Technology, Inc. (a) (b) | | | 41,585 | | | | 1,894,197 | |
Wright Medical Group NV (a) | | | 164,561 | | | | 4,479,351 | |
| | | | | | | | |
| | | | | | | 23,034,652 | |
| | | | | | | | |
|
| Health Care Providers & Services—4.2% | |
Amedisys, Inc. (a) | | | 31,138 | | | | 3,646,571 | |
AMN Healthcare Services, Inc. (a) | | | 68,021 | | | | 3,854,070 | |
BioTelemetry, Inc. (a) | | | 63,474 | | | | 3,790,667 | |
LHC Group, Inc. (a) | | | 16,444 | | | | 1,543,763 | |
| | | | | | | | |
| | | | | | | 12,835,071 | |
| | | | | | | | |
|
| Health Care Technology—5.2% | |
Evolent Health, Inc. - Class A (a) (b) | | | 104,780 | | | | 2,090,361 | |
HMS Holdings Corp. (a) | | | 64,185 | | | | 1,805,524 | |
Medidata Solutions, Inc. (a) (b) | | | 61,941 | | | | 4,176,062 | |
Teladoc Health, Inc. (a) (b) | | | 62,572 | | | | 3,101,694 | |
Vocera Communications, Inc. (a) (b) | | | 119,696 | | | | 4,710,038 | |
| | | | | | | | |
| | | | | | | 15,883,679 | |
| | | | | | | | |
|
| Hotels, Restaurants & Leisure—3.1% | |
Planet Fitness, Inc. - Class A (a) | | | 93,047 | | | | 4,989,180 | |
Wingstop, Inc. | | | 70,421 | | | | 4,520,324 | |
| | | | | | | | |
| | | | | | | 9,509,504 | |
| | | | | | | | |
|
| Insurance—3.1% | |
Goosehead Insurance, Inc. - Class A (a) (b) | | | 84,966 | | | | 2,233,756 | |
Kinsale Capital Group, Inc. | | | 77,216 | | | | 4,290,121 | |
Trupanion, Inc. (a) (b) | | | 110,361 | | | | 2,809,791 | |
| | | | | | | | |
| | | | | | | 9,333,668 | |
| | | | | | | | |
See accompanying notes to financial statements.
BHFTII-5
Brighthouse Funds Trust II
Loomis Sayles Small Cap Growth Portfolio
Schedule of Investments as of December 31, 2018
Common Stocks—(Continued)
| | | | | | | | |
| Security Description | |
Shares | | | Value | |
|
| Internet & Direct Marketing Retail—0.7% | |
Duluth Holdings, Inc. - Class B (a) (b) | | | 85,009 | | | $ | 2,144,777 | |
| | | | | | | | |
|
| IT Services—6.5% | |
Euronet Worldwide, Inc. (a) | | | 32,628 | | | | 3,340,455 | |
EVERTEC, Inc. | | | 70,178 | | | | 2,014,109 | |
Evo Payments, Inc. - Class A (a) (b) | | | 131,435 | | | | 3,242,501 | |
InterXion Holding NV (a) | | | 73,615 | | | | 3,986,988 | |
Virtusa Corp. (a) | | | 80,760 | | | | 3,439,568 | |
WNS Holdings, Ltd. (ADR) (a) | | | 93,931 | | | | 3,875,593 | |
| | | | | | | | |
| | | | | | | 19,899,214 | |
| | | | | | | | |
|
| Leisure Products—0.7% | |
Malibu Boats, Inc. - Class A (a) | | | 59,982 | | | | 2,087,374 | |
| | | | | | | | |
|
| Life Sciences Tools & Services—2.3% | |
NeoGenomics, Inc. (a) | | | 153,712 | | | | 1,938,308 | |
PRA Health Sciences, Inc. (a) | | | 53,677 | | | | 4,936,137 | |
| | | | | | | | |
| | | | | | | 6,874,445 | |
| | | | | | | | |
|
| Machinery—6.5% | |
Albany International Corp. - Class A | | | 64,341 | | | | 4,016,808 | |
Chart Industries, Inc. (a) | | | 35,661 | | | | 2,319,035 | |
Harsco Corp. (a) | | | 166,770 | | | | 3,312,052 | |
Kornit Digital, Ltd. (a) (b) | | | 121,200 | | | | 2,268,864 | |
Proto Labs, Inc. (a) | | | 33,758 | | | | 3,807,565 | |
RBC Bearings, Inc. (a) | | | 30,239 | | | | 3,964,333 | |
| | | | | | | | |
| | | | | | | 19,688,657 | |
| | | | | | | | |
|
| Oil, Gas & Consumable Fuels—0.5% | |
PDC Energy, Inc. (a) | | | 55,842 | | | | 1,661,858 | |
| | | | | | | | |
|
| Pharmaceuticals—1.2% | |
Horizon Pharma plc (a) | | | 78,967 | | | | 1,543,015 | |
Supernus Pharmaceuticals, Inc. (a) (b) | | | 60,320 | | | | 2,003,831 | |
| | | | | | | | |
| | | | | | | 3,546,846 | |
| | | | | | | | |
|
| Professional Services—1.6% | |
Huron Consulting Group, Inc. (a) | | | 52,141 | | | | 2,675,355 | |
ICF International, Inc. | | | 32,706 | | | | 2,118,694 | |
| | | | | | | | |
| | | | | | | 4,794,049 | |
| | | | | | | | |
|
| Semiconductors & Semiconductor Equipment—2.9% | |
MKS Instruments, Inc. | | | 30,997 | | | | 2,002,716 | |
Monolithic Power Systems, Inc. | | | 31,539 | | | | 3,666,409 | |
Silicon Laboratories, Inc. (a) | | | 39,892 | | | | 3,143,888 | |
| | | | | | | | |
| | | | | | | 8,813,013 | |
| | | | | | | | |
|
| Software—14.0% | |
Cornerstone OnDemand, Inc. (a) | | | 47,568 | | | | 2,398,854 | |
Envestnet, Inc. (a) | | | 73,651 | | | | 3,622,893 | |
Five9, Inc. (a) | | | 111,613 | | | | 4,879,720 | |
Globant S.A. (a) | | | 39,827 | | | | 2,243,057 | |
|
| Software—(Continued) | |
Guidewire Software, Inc. (a) | | | 47,958 | | | | 3,847,670 | |
HubSpot, Inc. (a) (b) | | | 27,659 | | | | 3,477,566 | |
Mimecast, Ltd. (a) | | | 116,394 | | | | 3,914,330 | |
Q2 Holdings, Inc. (a) | | | 88,067 | | | | 4,363,720 | |
Rapid7, Inc. (a) | | | 119,714 | | | | 3,730,288 | |
RealPage, Inc. (a) | | | 80,760 | | | | 3,891,825 | |
RingCentral, Inc. - Class A (a) | | | 51,729 | | | | 4,264,539 | |
Varonis Systems, Inc. (a) | | | 42,317 | | | | 2,238,569 | |
| | | | | | | | |
| | | | | | | 42,873,031 | |
| | | | | | | | |
|
| Textiles, Apparel & Luxury Goods—3.7% | |
Columbia Sportswear Co. | | | 47,506 | | | | 3,994,780 | |
Crocs, Inc. (a) | | | 164,785 | | | | 4,281,114 | |
Steven Madden, Ltd. (b) | | | 100,102 | | | | 3,029,086 | |
| | | | | | | | |
| | | | | | | 11,304,980 | |
| | | | | | | | |
|
| Thrifts & Mortgage Finance—0.5% | |
Essent Group, Ltd. (a) | | | 47,488 | | | | 1,623,140 | |
| | | | | | | | |
|
| Trading Companies & Distributors—1.7% | |
BMC Stock Holdings, Inc. (a) | | | 122,421 | | | | 1,895,077 | |
SiteOne Landscape Supply, Inc. (a) (b) | | | 59,559 | | | | 3,291,826 | |
| | | | | | | | |
| | | | | | | 5,186,903 | |
| | | | | | | | |
Total Common Stocks
(Cost $234,027,393) | | | | | | | 295,677,897 | |
| | | | | | | | |
|
| Short-Term Investment—3.3% | |
|
| Repurchase Agreement—3.3% | |
Fixed Income Clearing Corp.
Repurchase Agreement dated 12/31/18 at 1.200%, due on 01/02/19 with a maturity value of $10,157,948; collateralized by U.S. Treasury Note at 2.125%, maturing 03/31/24, with a market value of $10,363,447. | | | 10,157,271 | | | | 10,157,271 | |
| | | | | | | | |
Total Short-Term Investments
(Cost $10,157,271) | | | | | | | 10,157,271 | |
| | | | | | | | |
|
| Securities Lending Reinvestments (c)—14.9% | |
|
| Certificates of Deposit—7.8% | |
Banco Del Estado De Chile New York
2.820%, 1M LIBOR + 0.350%, 05/20/19 (d) | | | 1,000,000 | | | | 999,979 | |
Bank of Nova Scotia
3.072%, 3M LIBOR + 0.280%, 03/20/19 (d) | | | 1,250,000 | | | | 1,250,499 | |
Barclays Bank plc
2.547%, 1M LIBOR + 0.200%, 02/04/19 (d) | | | 3,000,000 | | | | 2,999,715 | |
BNP Paribas S.A. New York
2.647%, 1M LIBOR + 0.300%, 06/04/19 (d) | | | 1,000,000 | | | | 999,598 | |
Credit Agricole S.A.
2.799%, 1M LIBOR + 0.320%, 05/21/19 (d) | | | 1,000,000 | | | | 1,000,063 | |
Credit Industriel et Commercial
Zero Coupon, 01/25/19 | | | 987,228 | | | | 998,300 | |
See accompanying notes to financial statements.
BHFTII-6
Brighthouse Funds Trust II
Loomis Sayles Small Cap Growth Portfolio
Schedule of Investments as of December 31, 2018
Securities Lending Reinvestments (c)—(Continued)
| | | | | | | | |
| Security Description | | Principal
Amount* | | | Value | |
|
| Certificates of Deposit—(Continued) | |
Credit Industriel et Commercial (NY)
2.629%, 1M LIBOR + 0.250%, 02/05/19 (d) | | | 1,500,000 | | | $ | 1,500,037 | |
Industrial & Commercial Bank of China, Ltd.
2.850%, 02/15/19 | | | 1,000,000 | | | | 999,926 | |
Mizuho Bank, Ltd., New York
2.649%, 1M LIBOR + 0.300%, 05/01/19 (d) | | | 1,000,000 | | | | 1,000,006 | |
Royal Bank of Canada New York
2.650%, 1M LIBOR + 0.250%, 01/11/19 (d) | | | 2,000,000 | | | | 2,000,016 | |
Standard Chartered plc
| |
2.717%, 3M LIBOR + 0.230%, 04/24/19 (d) | | | 1,000,000 | | | | 999,782 | |
Sumitomo Mitsui Banking Corp.
2.590%, 1M LIBOR + 0.190%, 04/11/19 (d) | | | 1,500,000 | | | | 1,499,449 | |
Sumitomo Mitsui Trust Bank, Ltd.
Zero Coupon, 03/12/19 | | | 1,985,555 | | | | 1,989,140 | |
U.S. Bank N.A.
2.764%, 1M LIBOR + 0.260%, 07/23/19 (d) | | | 1,500,000 | | | | 1,500,000 | |
Wells Fargo Bank N.A.
2.560%, 3M LIBOR + 0.140%, 07/11/19 (d) | | | 2,000,000 | | | | 2,001,735 | |
2.730%, 3M LIBOR + 0.210%, 10/25/19 (d) | | | 500,000 | | | | 500,000 | |
Westpac Banking Corp.
2.850%, FEDEFF PRV + 0.450%, 02/15/19 (d) | | | 1,500,000 | | | | 1,499,991 | |
| | | | | | | | |
| | | | | | | 23,738,236 | |
| | | | | | | | |
|
| Commercial Paper—1.8% | |
Banco Santander S.A.
2.740%, 02/07/19 | | | 992,998 | | | | 997,088 | |
HSBC Bank plc
2.842%, 1M LIBOR + 0.320%, 07/30/19 (d) | | | 1,000,000 | | | | 1,000,000 | |
ING Funding LLC
2.725%, 3M LIBOR + 0.110%, 05/10/19 (d) | | | 2,000,000 | | | | 1,999,764 | |
UBS AG
2.779%, 1M LIBOR + 0.430%, 02/01/19 (d) | | | 1,500,000 | | | | 1,500,368 | |
| | | | | | | | |
| | | | | | | 5,497,220 | |
| | | | | | | | |
|
| Repurchase Agreements—5.3% | |
Citigroup Global Markets, Inc.
Repurchase Agreement dated 12/31/18 at 2.660%, due on 01/07/19 with a maturity value of $1,000,517; collateralized by U.S. Treasury Obligations with rates ranging from 0.625% - 3.125%, maturity dates ranging from 02/15/42 - 02/15/46, and various Common Stock with an aggregate market value of $1,054,286. | | | 1,000,000 | | | | 1,000,000 | |
Repurchase Agreement dated 12/31/18 at 2.790%, due on 02/04/19 with a maturity value of $1,002,713; collateralized by U.S. Treasury Obligations at 0.000%, maturing 02/12/19, and various Common Stock with an aggregate market value of $1,088,319. | | | 1,000,000 | | | | 1,000,000 | |
Repurchase Agreement dated 12/31/18 at 2.940%, due on 04/02/19 with a maturity value of $201,503; collateralized by U.S. Treasury Obligations with rates ranging from 1.125% - 2.750%, maturity dates ranging from 01/31/19 - 08/15/24, and an aggregate market value of $204,000. | | | 200,000 | | | | 200,000 | |
|
| Repurchase Agreements—(Continued) | |
Citigroup Global Markets, Ltd.
Repurchase Agreement dated 12/31/18 at 2.490%, due on 01/02/19 with a maturity value of $100,014; collateralized by U.S. Treasury Obligations with rates ranging from 0.375% - 1.875%, maturity dates ranging from 12/15/20 - 01/15/27, and an aggregate market value of $102,000. | | | 100,000 | | | | 100,000 | |
Repurchase Agreement dated 12/31/18 at 2.490%, due on 01/02/19 with a maturity value of $200,028; collateralized by U.S. Treasury Obligations with rates ranging from 1.625% - 2.875%, maturity dates ranging from 06/30/20 - 11/15/46, and an aggregate market value of $204,000. | | | 200,000 | | | | 200,000 | |
Deutsche Bank AG, London
Repurchase Agreement dated 12/31/18 at 2.750%, due on 01/02/19 with a maturity value of $100,015; collateralized by U.S. Treasury and Foreign Obligations with rates ranging from 1.000% - 2.590%, maturity dates ranging from 03/31/19 - 12/29/26, and an aggregate market value of $102,000. | | | 100,000 | | | | 100,000 | |
Deutsche Bank Securities, Inc.
Repurchase Agreement dated 12/31/18 at 3.200%, due on 01/02/19 with a maturity value of $1,344,768; collateralized by U.S. Treasury Obligations at 0.000%, maturity dates ranging from 08/15/30 - 08/15/39, and an aggregate market value of $1,371,420. | | | 1,344,529 | | | | 1,344,529 | |
Merrill Lynch, Pierce, Fenner & Smith, Inc.
Repurchase Agreement dated 12/31/18 at 2.940%, due on 04/02/19 with a maturity value of $503,757; collateralized by various Common Stock with an aggregate market value of $550,000. | | | 500,000 | | | | 500,000 | |
Repurchase Agreement dated 12/31/18 at 2.940%, due on 04/02/19 with a maturity value of $3,274,418; collateralized by various Common Stock with an aggregate market value of $3,575,000. | | | 3,250,000 | | | | 3,250,000 | |
NBC Global Finance, Ltd.
Repurchase Agreement dated 12/31/18 at 2.560%, due on 01/02/19 with a maturity value of $2,000,284; collateralized by various Common Stock with an aggregate market value of $2,226,425. | | | 2,000,000 | | | | 2,000,000 | |
Repurchase Agreement dated 12/31/18 at 2.590%, due on 01/07/19 with a maturity value of $1,000,504; collateralized by various Common Stock with an aggregate market value of $1,113,322. | | | 1,000,000 | | | | 1,000,000 | |
Repurchase Agreement dated 12/31/18 at 2.590%, due on 01/07/19 with a maturity value of $1,500,755; collateralized by various Common Stock with an aggregate market value of $1,669,983. | | | 1,500,000 | | | | 1,500,000 | |
Societe Generale
Repurchase Agreement dated 12/31/18 at 2.560%, due on 01/07/19 with a maturity value of $1,200,597; collateralized by U.S. Treasury Obligations with rates ranging from 0.750% - 8.000%, maturity dates ranging from 09/30/19 - 08/15/46, and various Common Stock with an aggregate market value of $1,314,571. | | | 1,200,000 | | | | 1,200,000 | |
Repurchase Agreement dated 12/31/18 at 2.560%, due on 01/07/19 with a maturity value of $1,500,747; collateralized by U.S. Treasury Obligations with rates ranging from 0.750% - 8.000%, maturity dates ranging from 09/30/19 - 08/15/46, and various Common Stock with an aggregate market value of $1,643,214. | | | 1,500,000 | | | | 1,500,000 | |
See accompanying notes to financial statements.
BHFTII-7
Brighthouse Funds Trust II
Loomis Sayles Small Cap Growth Portfolio
Schedule of Investments as of December 31, 2018
Securities Lending Reinvestments (c)—(Continued)
| | | | | | | | |
| Security Description | | Principal
Amount* | | | Value | |
|
| Repurchase Agreements—(Continued) | |
Societe Generale
Repurchase Agreement dated 12/31/18 at 2.560%, due on 01/07/19 with a maturity value of $1,200,597; collateralized by U.S. Treasury Obligations with rates ranging from 0.750% - 8.000%, maturity dates ranging from 09/30/19 - 08/15/46, and various Common Stock with an aggregate market value of $1,314,571. | | | 1,200,000 | | | $ | 1,200,000 | |
| | | | | | | | |
| | | | | | | 16,094,529 | |
| | | | | | | | |
Total Securities Lending Reinvestments
(Cost $45,329,110) | | | | | | | 45,329,985 | |
| | | | | | | | |
Total Investments—115.1%
(Cost $289,513,774) | | | | | | | 351,165,153 | |
Other assets and liabilities (net)—(15.1)% | | | | | | | (45,959,842 | ) |
| | | | | | | | |
| Net Assets—100.0% | | | | | | $ | 305,205,311 | |
| | | | | | | | |
| | | | |
| * | | Principal amount stated in U.S. dollars unless otherwise noted. |
| (a) | | Non-income producing security. |
| (b) | | All or a portion of the security was held on loan. As of December 31, 2018, the market value of securities loaned was $45,992,792 and the collateral received consisted of cash in the amount of $45,310,310 andnon-cash collateral with a value of $1,379,640. The cash collateral investments are disclosed in the Schedule of Investments and categorized as Securities Lending Reinvestments. Thenon-cash collateral received consists of U.S. government securities that are held in safe- keeping by the lending agent, or a third-party custodian, cannot be sold or repledged by the Portfolio. As such, this collateral is excluded from the Statement of Assets and Liabilities. |
| (c) | | Represents investment of cash collateral received from securities on loan as of December 31, 2018. |
| (d) | | Variable or floating rate security. The stated rate represents the rate at December 31, 2018. Maturity date shown for callable securities reflects the earliest possible call date. For securities based on a published reference index and spread, the index and spread are indicated in the description above. For certain variable rate securities, the coupon rate is determined by the issuer/agent based on current market conditions. For certain asset- and mortgage-backed securities, the coupon rate may fluctuate based on changes of the underlying collateral or prepayments of principal. These securities do not indicate a reference index and spread in their description above. |
| (ADR)— | | American Depositary Receipt |
| (FEDEFF PRV)— | | Effective Federal Funds Rate |
| (LIBOR)— | | London Interbank Offered Rate |
Fair Value Hierarchy
Accounting principles generally accepted in the United States of America (“GAAP”) define fair market value as the price that the Portfolio would receive to sell an asset or pay to transfer a liability in an orderly transaction between market participants at the measurement date. It establishes a fair value hierarchy that prioritizes inputs to valuation methods and requires disclosure of the fair value hierarchy, separately for each major category of assets and liabilities, that segregates fair value measurements into three levels. Levels 1, 2 and 3 of the fair value hierarchy are defined as follows:
Level 1 - unadjusted quoted prices in active markets for identical investments
Level 2 - other significant observable inputs (including, but not limited to, quoted prices for similar assets or liabilities in markets that are either active or inactive; inputs other than quoted prices that are observable such as interest rates, yield curves, volatilities, prepayment speeds, loss severities, credit risks, default rates, or other market corroborated inputs)
Level 3 - significant unobservable inputs based on the best information available in the circumstances, to the extent observable inputs are unavailable (including the Portfolio’s own assumptions used in determining the fair value of investments and derivative financial instruments)
The inputs or methodologies used for valuing investments are not necessarily an indication of the risk associated with investing in them. Changes to the inputs or methodologies used may result in transfers between levels. A reconciliation of Level 3 securities, if any, will be disclosed following the fair value hierarchy table. For more information about the Portfolio’s policy regarding the valuation of investments, please refer to the Notes to Financial Statements.
The following table summarizes the fair value hierarchy of the Portfolio’s investments as of December 31, 2018:
| | | | | | | | | | | | | | | | |
| Description | | Level 1 | | | Level 2 | | | Level 3 | | | Total | |
Total Common Stocks* | | $ | 295,677,897 | | | $ | — | | | $ | — | | | $ | 295,677,897 | |
Total Short-Term Investment* | | | — | | | | 10,157,271 | | | | — | | | | 10,157,271 | |
Total Securities Lending Reinvestments* | | | — | | | | 45,329,985 | | | | — | | | | 45,329,985 | |
Total Investments | | $ | 295,677,897 | | | $ | 55,487,256 | | | $ | — | | | $ | 351,165,153 | |
| | | | | | | | | | | | | | | | | |
Collateral for Securities Loaned (Liability) | | $ | — | | | $ | (45,310,310 | ) | | $ | — | | | $ | (45,310,310 | ) |
| | | | |
| * | | See Schedule of Investments for additional detailed categorizations. |
See accompanying notes to financial statements.
BHFTII-8
Brighthouse Funds Trust II
Loomis Sayles Small Cap Growth Portfolio
Statement of Assets and Liabilities
December 31, 2018
| | | | |
Assets | |
Investments at value (a) (b) | | $ | 351,165,153 | |
Receivable for: | |
Investments sold | | | 1,272,614 | |
Fund shares sold | | | 145,667 | |
Dividends and interest | | | 21,776 | |
Prepaid expenses | | | 1,027 | |
| | | | |
Total Assets | | | 352,606,237 | |
Liabilities | |
Collateral for securities loaned | | | 45,310,310 | |
Payables for: | |
Investments purchased | | | 1,588,272 | |
Fund shares redeemed | | | 76,021 | |
Accrued Expenses: | |
Management fees | | | 217,520 | |
Distribution and service fees | | | 13,606 | |
Deferred trustees’ fees | | | 111,915 | |
Other expenses | | | 83,282 | |
| | | | |
Total Liabilities | | | 47,400,926 | |
| | | | |
Net Assets | | $ | 305,205,311 | |
| | | | |
Net Assets Consist of: | |
Paid in surplus | | $ | 185,967,958 | |
Distributable earnings (Accumulated losses) | | | 119,237,353 | |
| | | | |
Net Assets | | $ | 305,205,311 | |
| | | | |
Net Assets | |
Class A | | $ | 240,366,656 | |
Class B | | | 57,795,817 | |
Class E | | | 7,042,838 | |
Capital Shares Outstanding* | |
Class A | | | 18,220,007 | |
Class B | | | 4,728,686 | |
Class E | | | 557,064 | |
Net Asset Value, Offering Price and Redemption Price Per Share | |
Class A | | $ | 13.19 | |
Class B | | | 12.22 | |
Class E | | | 12.64 | |
| | | | |
| * | | The Portfolio is authorized to issue an unlimited number of shares. |
| (a) | | Identified cost of investments was $289,513,774. |
| (b) | | Includes securities loaned at value of $45,992,792. |
Statement of Operations
Year Ended December 31, 2018
| | | | |
Investment Income | |
Dividends | | $ | 1,686,473 | |
Non-cash dividends | | | 584,041 | |
Interest | | | 86,703 | |
Securities lending income | | | 540,734 | |
| | | | |
Total investment income | | | 2,897,951 | |
Expenses | |
Management fees | | | 3,311,802 | |
Administration fees | | | 19,459 | |
Custodian and accounting fees | | | 44,013 | |
Distribution and service fees—Class B | | | 171,680 | |
Distribution and service fees—Class E | | | 11,839 | |
Audit and tax services | | | 44,663 | |
Legal | | | 45,316 | |
Trustees’ fees and expenses | | | 33,733 | |
Shareholder reporting | | | 31,896 | |
Insurance | | | 2,401 | |
Miscellaneous | | | 13,600 | |
| | | | |
Total expenses | | | 3,730,402 | |
Less management fee waiver | | | (317,978 | ) |
Less broker commission recapture | | | (18,196 | ) |
| | | | |
Net expenses | | | 3,394,228 | |
| | | | |
Net Investment Loss | | | (496,277 | ) |
| | | | |
Net Realized and Unrealized Gain (Loss) | |
Net realized gain on investments | | | 58,287,716 | |
| | | | |
Net change in unrealized depreciation on investments | | | (47,565,860 | ) |
| | | | |
Net realized and unrealized gain | | | 10,721,856 | |
| | | | |
Net Increase in Net Assets From Operations | | $ | 10,225,579 | |
| | | | |
See accompanying notes to financial statements.
BHFTII-9
Brighthouse Funds Trust II
Loomis Sayles Small Cap Growth Portfolio
Statements of Changes in Net Assets
| | | | | | | | |
| | | Year Ended
December 31,
2018 | | | Year Ended
December 31,
2017 | |
Increase (Decrease) in Net Assets: | |
From Operations | |
Net investment loss | | $ | (496,277 | ) | | $ | (1,808,190 | ) |
Net realized gain | | | 58,287,716 | | | | 51,004,809 | |
Net change in unrealized appreciation (depreciation) | | | (47,565,860 | ) | | | 37,593,815 | |
| | | | | | | | |
Increase in net assets from operations | | | 10,225,579 | | | | 86,790,434 | |
| | | | | | | | |
From Distributions to Shareholders (a) | |
Class A | | | (38,694,674 | ) | | | (13,532,335 | ) |
Class B | | | (9,723,909 | ) | | | (3,071,571 | ) |
Class E | | | (1,049,323 | ) | | | (330,190 | ) |
| | | | | | | | |
Total distributions | | | (49,467,906 | ) | | | (16,934,096 | ) |
| | | | | | | | |
Decrease in net assets from capital share transactions | | | (26,909,667 | ) | | | (45,566,602 | ) |
| | | | | | | | |
Total increase (decrease) in net assets | | | (66,151,994 | ) | | | 24,289,736 | |
|
Net Assets | |
Beginning of period | | | 371,357,305 | | | | 347,067,569 | |
| | | | | | | | |
End of period | | $ | 305,205,311 | | | $ | 371,357,305 | (b) |
| | | | | | | | |
Other Information:
Capital Shares
Transactions in capital shares were as follows:
| | | | | | | | | | | | | | | | |
| | | Year Ended
December 31, 2018 | | | Year Ended
December 31, 2017 | |
| | | Shares | | | Value | | | Shares | | | Value | |
Class A | |
Sales | | | 614,073 | | | $ | 9,428,569 | | | | 378,211 | | | $ | 5,066,708 | |
Reinvestments | | | 2,486,804 | | | | 38,694,674 | | | | 1,017,469 | | | | 13,532,335 | |
Redemptions | | | (4,771,409 | ) | | | (76,231,596 | ) | | | (4,198,642 | ) | | | (57,777,599 | ) |
| | | | | | | | | | | | | | | | |
Net decrease | | | (1,670,532 | ) | | $ | (28,108,353 | ) | | | (2,802,962 | ) | | $ | (39,178,556 | ) |
| | | | | | | | | | | | | | | | |
Class B | |
Sales | | | 576,123 | | | $ | 8,362,589 | | | | 275,626 | | | $ | 3,546,325 | |
Reinvestments | | | 673,401 | | | | 9,723,909 | | | | 245,922 | | | | 3,071,571 | |
Redemptions | | | (1,220,790 | ) | | | (17,664,271 | ) | | | (979,589 | ) | | | (12,652,405 | ) |
| | | | | | | | | | | | | | | | |
Net increase (decrease) | | | 28,734 | | | $ | 422,227 | | | | (458,041 | ) | | $ | (6,034,509 | ) |
| | | | | | | | | | | | | | | | |
Class E | |
Sales | | | 123,531 | | | $ | 1,861,145 | | | | 43,788 | | | $ | 577,129 | |
Reinvestments | | | 70,330 | | | | 1,049,323 | | | | 25,696 | | | | 330,190 | |
Redemptions | | | (145,020 | ) | | | (2,134,009 | ) | | | (95,500 | ) | | | (1,260,856 | ) |
| | | | | | | | | | | | | | | | |
Net increase (decrease) | | | 48,841 | | | $ | 776,459 | | | | (26,016 | ) | | $ | (353,537 | ) |
| | | | | | | | | | | | | | | | |
Decrease derived from capital shares transactions | | | | | | $ | (26,909,667 | ) | | | | | | $ | (45,566,602 | ) |
| | | | | | | | | | | | | | | | |
| | | | |
| (a) | | Distributions from net investment income and realized gains are no longer required to be separately disclosed. The presentation for the year ended December 31, 2018 has been adjusted for this change (See Note 8). At December 31, 2017 the distributions were from net realized capital gains. |
| (b) | | As part of the update in (a), it is also no longer required to disclose the Undistributed net investment income (Accumulated losses) which was $(116,751) as of December 31, 2017. |
See accompanying notes to financial statements.
BHFTII-10
Brighthouse Funds Trust II
Loomis Sayles Small Cap Growth Portfolio
Financial Highlights
| | | | | | | | | | | | | | | | | | | | |
| Selected per share data | |
| | | Class A | |
| | | Year Ended December 31, | |
| | | 2018 | | | 2017 | | | 2016 | | | 2015 | | | 2014 | |
Net Asset Value, Beginning of Period | | $ | 14.98 | | | $ | 12.36 | | | $ | 13.07 | | | $ | 14.70 | | | $ | 16.55 | |
| | | | | | | | | | | | | | | | | | | | |
Income (Loss) from Investment Operations | |
Net investment loss (a) | | | (0.01 | ) | | | (0.06 | ) | | | (0.00 | )(b)(c) | | | (0.04 | ) | | | (0.06 | ) |
Net realized and unrealized gain | | | 0.43 | | | | 3.32 | | | | 0.69 | | | | 0.47 | | | | 0.11 | |
| | | | | | | | | | | | | | | | | | | | |
Total income (loss) from investment operations | | | 0.42 | | | | 3.26 | | | | 0.69 | | | | 0.43 | | | | 0.05 | |
| | | | | | | | | | | | | | | | | | | | |
Less Distributions | |
Distributions from net realized capital gains | | | (2.21 | ) | | | (0.64 | ) | | | (1.40 | ) | | | (2.06 | ) | | | (1.90 | ) |
| | | | | | | | | | | | | | | | | | | | |
Total distributions | | | (2.21 | ) | | | (0.64 | ) | | | (1.40 | ) | | | (2.06 | ) | | | (1.90 | ) |
| | | | | | | | | | | | | | | | | | | | |
Net Asset Value, End of Period | | $ | 13.19 | | | $ | 14.98 | | | $ | 12.36 | | | $ | 13.07 | | | $ | 14.70 | |
| | | | | | | | | | | | | | | | | | | | |
Total Return (%) (d) | | | 0.55 | | | | 27.04 | | | | 6.21 | | | | 1.73 | | | | 1.22 | |
|
Ratios/Supplemental Data | |
Gross ratio of expenses to average net assets (%) | | | 0.96 | | | | 0.97 | | | | 0.96 | | | | 0.95 | | | | 0.95 | |
Net ratio of expenses to average net assets (%) (e) | | | 0.88 | | | | 0.88 | | | | 0.87 | | | | 0.86 | | | | 0.86 | |
Ratio of net investment loss to average net assets (%) | | | (0.09 | ) | | | (0.45 | ) | | | (0.00 | )(c)(f) | | | (0.26 | ) | | | (0.40 | ) |
Portfolio turnover rate (%) | | | 44 | | | | 40 | | | | 53 | | | | 64 | | | | 56 | |
Net assets, end of period (in millions) | | $ | 240.4 | | | $ | 298.0 | | | $ | 280.6 | | | $ | 310.7 | | | $ | 355.8 | |
| |
| | | Class B | |
| | | Year Ended December 31, | |
| | | 2018 | | | 2017 | | | 2016 | | | 2015 | | | 2014 | |
Net Asset Value, Beginning of Period | | $ | 14.05 | | | $ | 11.66 | | | $ | 12.43 | | | $ | 14.11 | | | $ | 16.01 | |
| | | | | | | | | | | | | | | | | | | | |
Income (Loss) from Investment Operations | |
Net investment loss (a) | | | (0.05 | ) | | | (0.09 | ) | | | (0.03 | )(c) | | | (0.07 | ) | | | (0.09 | ) |
Net realized and unrealized gain | | | 0.43 | | | | 3.12 | | | | 0.66 | | | | 0.45 | | | | 0.09 | |
| | | | | | | | | | | | | | | | | | | | |
Total income (loss) from investment operations | | | 0.38 | | | | 3.03 | | | | 0.63 | | | | 0.38 | | | | 0.00 | |
| | | | | | | | | | | | | | | | | | | | |
Less Distributions | |
Distributions from net realized capital gains | | | (2.21 | ) | | | (0.64 | ) | | | (1.40 | ) | | | (2.06 | ) | | | (1.90 | ) |
| | | | | | | | | | | | | | | | | | | | |
Total distributions | | | (2.21 | ) | | | (0.64 | ) | | | (1.40 | ) | | | (2.06 | ) | | | (1.90 | ) |
| | | | | | | | | | | | | | | | | | | | |
Net Asset Value, End of Period | | $ | 12.22 | | | $ | 14.05 | | | $ | 11.66 | | | $ | 12.43 | | | $ | 14.11 | |
| | | | | | | | | | | | | | | | | | | | |
Total Return (%) (d) | | | 0.28 | | | | 26.68 | | | | 6.05 | | | | 1.43 | | | | 0.94 | |
|
Ratios/Supplemental Data | |
Gross ratio of expenses to average net assets (%) | | | 1.21 | | | | 1.22 | | | | 1.21 | | | | 1.20 | | | | 1.20 | |
Net ratio of expenses to average net assets (%) (e) | | | 1.13 | | | | 1.13 | | | | 1.12 | | | | 1.11 | | | | 1.11 | |
Ratio of net investment loss to average net assets (%) | | | (0.33 | ) | | | (0.70 | ) | | | (0.25 | )(c) | | | (0.51 | ) | | | (0.65 | ) |
Portfolio turnover rate (%) | | | 44 | | | | 40 | | | | 53 | | | | 64 | | | | 56 | |
Net assets, end of period (in millions) | | $ | 57.8 | | | $ | 66.0 | | | $ | 60.1 | | | $ | 64.2 | | | $ | 71.9 | |
Please see following page for Financial Highlights footnote legend.
See accompanying notes to financial statements.
BHFTII-11
Brighthouse Funds Trust II
Loomis Sayles Small Cap Growth Portfolio
Financial Highlights
| | | | | | | | | | | | | | | | | | | | |
| Selected per share data | |
| | | Class E | |
| | | Year Ended December 31, | |
| | | 2018 | | | 2017 | | | 2016 | | | 2015 | | | 2014 | |
Net Asset Value, Beginning of Period | | $ | 14.45 | | | $ | 11.97 | | | $ | 12.71 | | | $ | 14.37 | | | $ | 16.25 | |
| | | | | | | | | | | | | | | | | | | | |
Income (Loss) from Investment Operations | |
Net investment loss (a) | | | (0.03 | ) | | | (0.08 | ) | | | (0.02 | )(c) | | | (0.06 | ) | | | (0.08 | ) |
Net realized and unrealized gain | | | 0.43 | | | | 3.20 | | | | 0.68 | | | | 0.46 | | | | 0.10 | |
| | | | | | | | | | | | | | | | | | | | |
Total income (loss) from investment operations | | | 0.40 | | | | 3.12 | | | | 0.66 | | | | 0.40 | | | | 0.02 | |
| | | | | | | | | | | | | | | | | | | | |
Less Distributions | |
Distributions from net realized capital gains | | | (2.21 | ) | | | (0.64 | ) | | | (1.40 | ) | | | (2.06 | ) | | | (1.90 | ) |
| | | | | | | | | | | | | | | | | | | | |
Total distributions | | | (2.21 | ) | | | (0.64 | ) | | | (1.40 | ) | | | (2.06 | ) | | | (1.90 | ) |
| | | | | | | | | | | | | | | | | | | | |
Net Asset Value, End of Period | | $ | 12.64 | | | $ | 14.45 | | | $ | 11.97 | | | $ | 12.71 | | | $ | 14.37 | |
| | | | | | | | | | | | | | | | | | | | |
Total Return (%) (d) | | | 0.43 | | | | 26.74 | | | | 6.16 | | | | 1.55 | | | | 1.05 | |
|
Ratios/Supplemental Data | |
Gross ratio of expenses to average net assets (%) | | | 1.11 | | | | 1.12 | | | | 1.11 | | | | 1.10 | | | | 1.10 | |
Net ratio of expenses to average net assets (%) (e) | | | 1.03 | | | | 1.03 | | | | 1.02 | | | | 1.01 | | | | 1.01 | |
Ratio of net investment loss to average net assets (%) | | | (0.22 | ) | | | (0.60 | ) | | | (0.15 | )(c) | | | (0.41 | ) | | | (0.55 | ) |
Portfolio turnover rate (%) | | | 44 | | | | 40 | | | | 53 | | | | 64 | | | | 56 | |
Net assets, end of period (in millions) | | $ | 7.0 | | | $ | 7.3 | | | $ | 6.4 | | | $ | 6.7 | | | $ | 7.4 | |
| | | | |
| (a) | | Per share amounts based on average shares outstanding during the period. |
| (b) | | Net investment income (loss) was less than $0.01. |
| (c) | | Net investment income per share and the ratio of net investment income to average net assets include anon-recurring refund for overbilling of prior years’ custodianout-of-pocket fees which amounted to less than $0.01 per share and 0.02% of average net assets, respectively. |
| (d) | | Total return does not reflect any insurance, sales, separate account or administrative charges of variable annuity or life insurance contracts or any additional expenses that contract owners may bear under their variable contracts. If these charges were included, the returns would be lower. |
| (e) | | Includes the effects of management fee waivers (see Note 5 of the Notes to Financial Statements). |
| (f) | | Ratio of net investment income (loss) to average net assets was less than 0.01%. |
See accompanying notes to financial statements.
BHFTII-12
Brighthouse Funds Trust II
Loomis Sayles Small Cap Growth Portfolio
Notes to Financial Statements—December 31, 2018
1. Organization
Brighthouse Funds Trust II (the “Trust”) is organized as a Delaware statutory trust and registered under the Investment Company Act of 1940, as amended (the “1940 Act”), as anopen-end management investment company. The Trust, which is managed by Brighthouse Investment Advisers, LLC (“Brighthouse Investment Advisers” or the “Adviser”), currently offers twenty-nine series, each of which operates as a distinct investment vehicle of the Trust. The series included in this report is Loomis Sayles Small Cap Growth Portfolio (the “Portfolio”), which is diversified. Shares in the Portfolio are not offered directly to the general public and are currently available only to separate accounts established by life insurance companies affiliated with the Adviser and Metropolitan Life Insurance Company (the “Insurance Companies”).
The Portfolio has registered and offers three classes of shares: Class A, B and E shares. Shares of each Class of the Portfolio represent an equal pro rata interest in the Portfolio and generally give the shareholder the same voting, dividend, liquidation, and other rights. Investment income, realized and unrealized capital gains and losses, the common expenses of the Portfolio, and certain Portfolio-level expense reductions, if any, are allocated on a pro rata basis to each Class based on the relative net assets of each Class to the net assets of the Portfolio. Each Class of shares differs in its respective distribution plan and such distribution expenses are allocated to the corresponding Class of shares.
2. Significant Accounting Policies
The preparation of financial statements in conformity with accounting principles generally accepted in the United States of America (“GAAP”) requires management to make estimates and assumptions that affect the reported amounts of assets and liabilities and disclosure of contingent assets and liabilities as of the date of the financial statements and the reported amounts of income and expenses during the reporting period. Actual results could differ from those estimates. In the preparation of these financial statements, management has evaluated events and transactions subsequent to December 31, 2018 through the date the financial statements were issued.
The Portfolio is an investment company and follows the accounting and reporting guidance of the Financial Accounting Standards Board (“FASB”) Accounting Standards Codification Topic 946—Financial Services—Investment Companies. The following is a summary of significant accounting policies consistently followed by the Portfolio in the preparation of its financial statements.
Investment Valuation and Fair Value Measurements - The Portfolio values its portfolio investments for purposes of calculating its net asset value (“NAV”) using procedures approved by the Board of Trustees of the Trust (the “Board” or “Trustees”). Those procedures allow for a variety of methodologies to be used to value the Portfolio’s investments. The specific methodologies used for a particular investment may vary based on the market data available for a specific investment at the time the Portfolio calculates its NAV or based on other considerations. The procedures also permit a level of judgment to be used in the valuation process. The Portfolio follows the accounting and reporting guidance of FASB Accounting Standards Codification Topic 820—Fair Value Measurement.
Domestic and foreign equity securities, such as common stock, exchange-traded funds, rights, warrants, and preferred stock, that are traded on a securities exchange on a valuation date are generally valued at their last quoted sale price or official closing price on the primary exchange for such security, or, if no sales occurred on that day, at the last reported bid price. Equity securities tradedover-the-counter (“OTC”) are generally valued at the last reported bid price. In the event of a major exchange closing during the trading day, the Adviser may use other market information obtained from quotation reporting systems, established market makers, or pricing services in valuing the securities. Valuation adjustments may be applied to certain foreign equity securities that are traded solely on foreign exchanges that close before the time as of which the Portfolio determines its NAV to account for the market movement between the close of the foreign exchanges and the time as of which the Portfolio determines its NAV. The Portfolio may use a systematic fair valuation model provided by a pricing service to value securities principally traded in these foreign markets in order to adjust for possible market movements or other changes that may occur between the close of the foreign exchanges and the time as of which the Portfolio determines its NAV. Foreign equity securities valued using these valuation adjustments are generally categorized as Level 2 within the fair value hierarchy. Equity securities that are actively traded, and have no valuation adjustments applied, are categorized as Level 1 within the fair value hierarchy. Other equity securities traded on inactive markets, or valued in reference to similar instruments traded on active markets, are generally categorized as Level 2 within the fair value hierarchy.
Investments in registeredopen-end management investment companies are valued at reported NAV per share on the valuation date and are categorized as Level 1 within the fair value hierarchy.
Debt securities, including corporate, convertible and municipal bonds and notes; obligations of the U.S. Treasury and U.S. government agencies; foreign sovereign issues; andnon-U.S. bonds, are generally valued on the basis of evaluated or composite bid quotations obtained from independent pricing services and/or brokers and dealers selected by the Adviser (each a “pricing service”), pursuant to the authorization of and subject to general oversight by the Board. Such pricing services may use matrix pricing, which considers observable inputs including, among other things, issuer details, maturity dates, interest rates, yield curves, rates of prepayment, credit risks/spreads, default rates, reported trades, broker-dealer quotes and quoted prices for similar assets. Short-term obligations with a
BHFTII-13
Brighthouse Funds Trust II
Loomis Sayles Small Cap Growth Portfolio
Notes to Financial Statements—December 31, 2018—(Continued)
remaining maturity of sixty days or less may be valued at amortized cost in the absence of market quotes, so long as the amortized cost value of such short-term debt instrument is approximately the same as the fair value of the instrument as determined without the use of amortized cost valuation. Floating rate loans are generally valued on the basis of an evaluated or composite average of aggregate bid and ask quotations supplied by brokers or dealers, as obtained from the pricing service. Securities that use similar valuation techniques and inputs as described above are generally categorized as Level 2 within the fair value hierarchy.
Options, whether on securities, indices, futures contracts, or otherwise, traded on exchanges are valued at the last sale price available as of the close of business on a valuation day or, if there is no such price available, at the last reported bid price. These types of options are categorized as Level 1 within the fair value hierarchy. Futures contracts that are traded on commodity exchanges are valued at their settlement prices established by the exchanges on which they are traded as of the close of such exchanges and are categorized as Level 1 within the fair value hierarchy.
If no current market value quotation or other observable inputs are readily available or market value quotations are deemed to be unreliable for an investment, the fair value of the investment will be determined in accordance with procedures approved by, and under the general supervision of, the Board. In such a circumstance, the Board will be assisted in its responsibility to determine the fair value of an investment by the Valuation Committee (“Committee”) of Brighthouse Investment Advisers. The Committee provides general pricing oversight and fair value pricing determinations related to portfolio securities and meets on a regular basis to review reports relating to the valuation of the securities in the Portfolio. The Board has delegated to State Street Bank and Trust Company, the Trust’s custodian (“Custodian”), the responsibility for calculating the NAVs of the Trust’s Portfolios. The Committee is responsible for overseeing the calculation of the NAVs of the Portfolios by the custodian. The Committee also periodically reviews pricing services, including the pricing services providing fair value pricing for the Portfolio’s foreign securities, and is responsible for overseeing the correction of pricing errors and addressing other pricing issues that arise in the ordinary course of business, such as making real-time fair value determinations, as necessary.
No single standard for determining the fair value of an investment can be set forth because fair value depends upon the facts and circumstances with respect to each investment. Information relating to any relevant factors may be obtained by the Committee from any appropriate source, including the subadviser of the Portfolio, the custodian, a pricing service, market maker and/or broker for such security or the issuer. Appropriate methodologies for determining fair value under particular circumstances may include: matrix pricing, a discounted cash flow analysis, comparisons of securities with comparable characteristics, value based on multiples of earnings, discount from market price of similar marketable securities, or a combination of these and other methods.
Investment Transactions and Related Investment Income - Portfolio security transactions are recorded on the trade date. Dividend income is recorded on theex-dividend date or, for certain foreign securities, when notified. Interest income, which includes amortization of premium and accretion of discount on debt securities, is recorded on the accrual basis. Realized gains and losses on investments are determined on the identified cost basis, which is the same basis used for federal income tax purposes. Foreign income and foreign capital gains on some foreign securities may be subject to foreign taxes, which are accrued as applicable. These foreign taxes have been provided for in accordance with the Portfolio’s understanding of the applicable countries’ tax rules and rates.
Dividends and Distributions to Shareholders -The Portfolio records dividends and distributions on theex-dividend date. Net realized gains from securities transactions (if any) are generally distributed annually to shareholders. The timing and characterization of certain income and capital gains distributions are determined in accordance with federal tax regulations that may differ from GAAP. Permanent book and tax basis differences relating to shareholder distributions will result in reclassification between distributable earnings (accumulated losses) andpaid-in surplus. These adjustments have no impact on net assets or the results of operations.
Income Taxes -It is the Portfolio’s policy to comply with the requirements of the Internal Revenue Code of 1986, as amended, and regulations thereunder, applicable to regulated investment companies, and to distribute, with respect to each taxable year, all of its taxable income to shareholders. Therefore, no federal income tax provision is required. The Portfolio files U.S. federal tax returns. No income tax returns are currently under examination. The Portfolio’s federal tax returns for the prior three fiscal years remain subject to examination by the Internal Revenue Service. As of December 31, 2018, the Portfolio had no uncertain tax positions that would require financial statement recognition, or derecognition or disclosure.
Directed Brokerage Agreement -The Trust has entered into a directed brokerage arrangement with Capital Institutional Services, Inc. (“CAPIS”). Under this arrangement, the Portfolio directs certain trades to CAPIS in return for a recapture credit. CAPIS issues a cash rebate to the Portfolio. Amounts paid to the Portfolio are shown separately as broker commission recapture on the Statement of Operations of the Portfolio. Additionally, these amounts have been excluded from the calculation of the net ratio of expenses to average net assets presented in the Financial Highlights for each share class.
Repurchase Agreements -The Portfolio may enter into repurchase agreements, under the terms of a Master Repurchase Agreement (“MRA”), with selected commercial banks and broker-dealers, under which the Portfolio acquires securities as collateral and agrees to resell the securities at an agreed-upon time and at an agreed-upon price. The Portfolio, through the Custodian or a subcustodian, under atri-party repurchase agreement, receives delivery of the underlying securities collateralizing any repurchase agreements. It is
BHFTII-14
Brighthouse Funds Trust II
Loomis Sayles Small Cap Growth Portfolio
Notes to Financial Statements—December 31, 2018—(Continued)
the Portfolio’s policy that the market value of the collateral be equal to at least 100% of the repurchase price in the case of a repurchase agreement ofone-day duration and equal to at least 102% of the repurchase price in the case of all other repurchase agreements. In the event of default or failure by a party to perform an obligation in connection with any repurchase transaction, the MRA gives thenon-defaulting party the right toset-off claims and to apply property held by it in connection with any repurchase transaction against obligations owed to it.
At December 31, 2018, the Portfolio had direct investments in repurchase agreements with a gross value of $10,157,271. Additionally, the Portfolio invested cash collateral for loans of portfolio securities in repurchase agreements with a gross value of $16,094,529. The combined value of all repurchase agreements is included as part of investments at value on the Statement of Assets and Liabilities. The value of the related collateral exceeded the value of the repurchase agreements at December 31, 2018.
Securities Lending - The Portfolio may lend its portfolio securities to certain qualified brokers who borrow securities in order to complete certain securities transactions. By lending its portfolio securities, the Portfolio attempts to increase its net investment income through the receipt of income on collateral held from securities on loan. Any gain or loss in the market price of the loaned securities that might occur and any interest earned or dividends declared during the term of the loan would accrue to the account of the Portfolio.
The Trust has entered into aNon-Custodial Securities Lending Agreement with JPMorgan Chase Bank, N.A. (the “Lending Agent”). Under the agreement, the Lending Agent is authorized to loan portfolio securities on the Portfolio’s behalf. In exchange, the Portfolio receives either cash or U.S. government securities as collateral against the loaned securities. The Portfolio receives collateral equal to at least 102% of the market value for loans secured by government securities or cash in the same currency as the loaned shares and 105% for all other loaned securities at each loan’s inception. Collateral representing at least 100% of the market value of the loaned securities is maintained for the duration of the loan. Any cash collateral received by the Portfolio is generally invested by the Lending Agent in short-term investments, which may include certificates of deposit, commercial paper, repurchase agreements, time deposits, master demand notes and money market funds. The market value of investments made with cash collateral received are disclosed in the Schedule of Investments and the valuation techniques are described in Note 2. If the market value of the collateral at the close of trading on a business day is less than 100% of the market value of the loaned securities at the close of trading on that day, the borrower is required to deliver, by the close of business on the following business day, an additional amount of collateral, so that the total amount of posted collateral is equal to at least 100% of the market value of all the loaned securities as of such preceding day. A portion of the income earned on the collateral is rebated to the borrower of the securities and the remainder is split between the Lending Agent and the Portfolio. On loans collateralized by U.S. government securities, a fee is received from the borrower and is allocated between the Portfolio and the Lending Agent.
Income received by the Portfolio in securities lending transactions during the year ended December 31, 2018 is reflected as securities lending income on the Statement of Operations. The values of any securities loaned by the Portfolio and the related collateral at December 31, 2018 are disclosed in the footnotes to the Schedule of Investments. The value of the related collateral received by the Portfolio exceeded the value of the securities out on loan at December 31, 2018.
The risks associated with lending portfolio securities include, but are not limited to, possible delays in receiving additional collateral or in the recovery of the loaned securities, possible loss of rights in the collateral should the borrower fail financially, as well as risk of loss in the value of the collateral or the value of the investments made with the collateral. The Lending Agent shall indemnify the Portfolio in the case of default of any securities borrower, subject to the terms of theNon-Custodial Securities Lending Agreement.
All securities on loan are classified as Common Stocks in the Portfolio’s Schedule of Investments as of December 31, 2018, with a contractual maturity of overnight and continuous.
3. Certain Risks
In the normal course of business, the Portfolio invests in securities and enters into transactions where risks exist. Those risks include:
Market Risk:The value of securities held by the Portfolio may decline in response to certain events, including those directly involving the issuers whose securities are owned by the Portfolio; conditions affecting the general economy; overall market changes; local, regional or global political, social or economic instability; and currency, interest rate, and price fluctuations.
Credit and Counterparty Risk: The Portfolio may be exposed to counterparty risk, or the risk that an entity with which the Portfolio has unsettled or open transactions may default. The potential loss could exceed the value of the financial assets and liabilities recorded in the financial statements. Financial assets that potentially expose the Portfolio to credit and counterparty risk consist principally of cash due from counterparties and investments. The Portfolio manages counterparty risk by entering into agreements only with counterparties that it believes have the financial resources to honor their obligations and by monitoring the financial stability of those counterparties. The Adviser attempts to mitigate counterparty risk by (i) periodically assessing the creditworthiness of its trading partners, (ii) monitoring and/or limiting the amount of its net exposure to each individual counterparty based on its
BHFTII-15
Brighthouse Funds Trust II
Loomis Sayles Small Cap Growth Portfolio
Notes to Financial Statements—December 31, 2018—(Continued)
assessment, and (iii) requiring collateral from the counterparty for certain transactions. In order to preserve certain safeguards fornon-standard settlement trades, the Portfolio restricts its exposure to credit and counterparty losses by entering into master netting agreements (“Master Agreements”) with counterparties (approved brokers) with whom it undertakes a significant volume of transactions. Master Agreements govern the terms of certain transactions, and reduce the counterparty risk associated with relevant transactions by specifying credit protection mechanisms and providing standardization that improves legal certainty. Master Agreements can also help limit counterparty risk by specifying collateral posting arrangements atpre-arranged exposure levels.
Repurchase and reverse repurchase agreements are primarily executed under Global Master Repurchase Agreements (“GMRAs”) or Master Repurchase Agreements (“MRAs”), which provide the rights toset-off. Each repurchase and reverse repurchase agreement is initially collateralized at the transaction level. In the event of default, the total market value exposure will be offset against collateral exchanged to date, which would result in a net receivable/(payable) that would be due from/to the counterparty.
Additional risks associated with each type of investment are described above within the respective security type notes. The Portfolio’s prospectus includes a discussion of the principal risks of investing in the Portfolio.
4. Investment Transactions
Aggregate cost of purchases and proceeds of sales of investment securities, excluding short-term securities, for the year ended December 31, 2018 were as follows:
| | | | | | | | | | | | |
Purchases | | | Sales | |
U.S. Government | | Non-U.S. Government | | | U.S. Government | | | Non-U.S. Government | |
| $0 | | $ | 156,100,497 | | | $ | 0 | | | $ | 229,052,709 | |
5. Investment Management Fees and Other Transactions with Affiliates
Investment Management Agreement -Brighthouse Investment Advisers is the investment adviser to the Portfolio. The Trust has entered into an investment management agreement with Brighthouse Investment Adviserswith respect to the Portfolio. For providing investment management services to the Portfolio, Brighthouse Investment Advisers receives monthly compensation at the following annual rates:
| | | | | | |
Management
Fees earned by
Brighthouse
Investment Advisers
for the year ended
December 31, 2018 | | % per annum | | | Average Daily Net Assets |
| $3,311,802 | | | 0.900 | % | | Of the first $500 million |
| | | 0.850 | % | | On amounts in excess of $500 million |
Brighthouse Investment Advisers has entered into an investment subadvisory agreement with respect to managing the Portfolio. Loomis, Sayles & Company, L.P. (the “Subadviser”) is compensated by Brighthouse Investment Advisers to provide subadvisory services for the Portfolio.
Management Fee Waivers - Pursuant to an expense agreement, Brighthouse Investment Advisers has agreed, for the period April 30, 2018 to April 30, 2019, to reduce its advisory fees set out above under “Investment Management Agreement” for each class of the Portfolio as follows:
| | |
% per annum | | Average Daily Net Assets |
| 0.050% | | On the first $100 million |
| 0.100% | | On the next $400 million |
| 0.050% | | On amounts in excess of $500 million |
An identical expense agreement was in place for the period May 1, 2017 to April 30, 2018. Amounts waived for the year ended December 31, 2018 are shown as management fee waivers in the Statement of Operations.
Certain officers and trustees of the Trust may also be officers of Brighthouse Investment Advisers; however, such officers and trustees receive no compensation from the Trust.
Transfer Agency Agreement -Brighthouse Financial, Inc. serves as the transfer agent for the Trust. Brighthouse Financial, Inc. receives no fees for its services to the Trust.
BHFTII-16
Brighthouse Funds Trust II
Loomis Sayles Small Cap Growth Portfolio
Notes to Financial Statements—December 31, 2018—(Continued)
Distribution and Service Fees- The Trust has a distribution agreement with Brighthouse Securities, LLC (the “Distributor”) pursuant to which the Distributor serves as the general distributor of shares of each class (each a “Class”) of each Portfolio. The Distributor is an affiliate of the Trust. The Trust has adopted a Distribution and Services Plan (the “Plan”) relating to Class B and Class E shares of each Portfolio, under Rule 12b-1 under the 1940 Act, pursuant to which the Trust may pay the Distributor a fee (the “Service Fee”) at an annual rate not to exceed 0.25% of each such Portfolio’s average daily net assets attributable to the Class B and Class E shares of the Trust. Each Portfolio may not offer shares of each Class. The Plan also authorizes the Trust, on behalf of each of its Portfolios, may pay the Distributor a distribution Fee (the “Distribution Fee” and together with the Service Fee, the “Fees”) at an annual rate of up to 0.25% of each Portfolio’s average daily net assets attributable to the Class B and Class E shares in consideration of the services rendered in connection with the sale of such shares by the Distributor. Under the Distribution Agreement with respect to the Trust, Fees are currently paid at an annual rate of 0.25% of average daily net assets in the case of Class B shares and 0.15% of average daily net assets in the case of Class E shares. The Plan is known as a “compensation plan” because the Trust makes payments to the Distributor for services rendered regardless of the actual level of expenditures by the Distributor. Amounts incurred by the Portfolio for the year ended December 31, 2018 are shown as Distribution and service fees in the Statement of Operations.
Deferred Trustee Compensation -Each Trustee who is not currently an employee of the Adviser or any of its affiliates receives compensation from the Trust for his or her service to the Trust. A deferred compensation plan (the “Plan”) is available to the Trustees on a voluntary basis. Deferred amounts remain in the Trust until distributed in accordance with the provisions of the Plan. The value of a participating Trustee’s deferral account is based on theoretical investments of deferred amounts on the normal payment dates in certain portfolios of the Trust or Brighthouse Funds Trust I, an affiliate of the Trust, as designated by the participating Trustee. Changes in the value of participants’ deferral accounts are reflected as Trustees’ fees and expenses in the Statement of Operations. The portion of the accrued obligations allocated to the Portfolio under the Plan is reflected as Deferred trustees’ fees in the Statement of Assets and Liabilities.
6. Contractual Obligations
Under the Trust’s organizational documents, its officers and Trustees may be indemnified against certain liabilities and expenses arising out of the performance of their duties to the Trust. Additionally, the Trust has a variety of indemnification obligations under contracts with its service providers. The Trust’s maximum exposure under these arrangements is unknown, as this would involve future claims that may be made against the Trust that have not yet occurred.
7. Income Tax Information
The cost basis of investments for federal income tax purposes at December 31, 2018 was as follows:
| | | | |
Cost basis of investments | | $ | 289,449,297 | |
Gross unrealized appreciation | | | 74,136,169 | |
Gross unrealized depreciation | | | (12,420,313 | ) |
| | | | |
Net unrealized appreciation (depreciation) | | $ | 61,715,856 | |
| | | | |
The tax character of distributions paid for the years ended December 31, 2018 and 2017 were as follows:
| | | | | | | | | | | | | | | | | | | | |
Ordinary Income | | | Long-Term Capital Gain | | | Total | |
2018 | | 2017 | | | 2018 | | | 2017 | | | 2018 | | | 2017 | |
| $2,060,229 | | $ | — | | | $ | 47,407,677 | | | $ | 16,934,096 | | | $ | 49,467,906 | | | $ | 16,934,096 | |
As of December 31, 2018, the components of distributable earnings (accumulated losses) on a federal income tax basis were as follows:
| | | | | | | | | | | | | | | | |
Undistributed
Ordinary
Income | | Undistributed
Long-Term
Capital Gain | | | Net
Unrealized
Appreciation | | | Accumulated
Capital Losses | | | Total | |
| $1,028,910 | | $ | 56,604,505 | | | $ | 61,715,856 | | | $ | — | | | $ | 119,349,271 | |
The Portfolio utilizes the provisions of the federal income tax laws that provide for the carryforward of capital losses for prior years, offsetting such losses against any future realized capital gains. Under the Regulated Investment Company Modernization Act of 2010 (the “Act”), net capital losses recognized after December 22, 2010 may be carried forward indefinitely and their character is retained as short-term and/or long-term losses.
As of December 31, 2018, the Portfolio had no accumulated capital losses.
BHFTII-17
Brighthouse Funds Trust II
Loomis Sayles Small Cap Growth Portfolio
Notes to Financial Statements—December 31, 2018—(Continued)
8. Recent Accounting Pronouncements and SEC Update
In August 2018, the FASB issued Accounting Standards Update2018-13, Fair Value Measurement (Topic 820)—Disclosure Framework—Changes to the Disclosure Requirements for Fair Value Measurement (“ASU2018-13”) which introduces new fair value disclosure requirements as well as eliminates and modifies certain existing fair value disclosure requirements. ASU2018-13 is effective for fiscal years beginning after December 15, 2019, and interim periods within those fiscal years. Early adoption is permitted and, as such, management has elected to early adopt ASU2018-13 effective with the current reporting period. The impact of the Portfolio’s adoption was limited to changes in the Portfolio’s financial statement disclosures regarding fair value, primarily those disclosures related to transfers between levels of the fair value hierarchy.
In August 2018, the Securities and Exchange Commission released its Final Rule on Disclosure Update and Simplification (the “Final Rule”) which is intended to simplify an issuer’s disclosure compliance efforts by removing redundant or outdated disclosures requirements without significantly altering the mix of information provided to investors. Effective with the current reporting period, the Portfolio adopted the Final Rule with the most notable impacts being that the Portfolio is no longer required to present the components of distributable earnings on the Statement of Assets and Liabilities or the sources of distributions to shareholders and the amounts of undistributed net investment income on the Statements of Changes in Net Assets.
BHFTII-18
Brighthouse Funds Trust II
Loomis Sayles Small Cap Growth Portfolio
Report of Independent Registered Public Accounting Firm
To the Shareholders of Loomis Sayles Small Cap Growth Portfolio and the Board of Trustees of Brighthouse Funds Trust II:
Opinion on the Financial Statements and Financial Highlights
We have audited the accompanying statement of assets and liabilities, including the schedule of investments, of the Loomis Sayles Small Cap Growth Portfolio (the “Portfolio”), one of the portfolios constituting the Brighthouse Funds Trust II, as of December 31, 2018, the related statement of operations for the year then ended, the statements of changes in net assets for each of the two years in the period then ended, the financial highlights for each of the five years in the period then ended, and the related notes. In our opinion, the financial statements and financial highlights present fairly, in all material respects, the financial position of the Loomis Sayles Small Cap Growth Portfolio of the Brighthouse Funds Trust II as of December 31, 2018, the results of its operations for the year then ended, the changes in its net assets for each of the two years in the period then ended, and the financial highlights for each of the five years in the period then ended, in conformity with accounting principles generally accepted in the United States of America.
Basis for Opinion
These financial statements and financial highlights are the responsibility of the Portfolio’s management. Our responsibility is to express an opinion on the Portfolio’s financial statements and financial highlights based on our audits. We are a public accounting firm registered with the Public Company Accounting Oversight Board (United States) (PCAOB) and are required to be independent with respect to the Portfolio in accordance with the U.S. federal securities laws and the applicable rules and regulations of the Securities and Exchange Commission and the PCAOB.
We conducted our audits in accordance with the standards of the PCAOB. Those standards require that we plan and perform the audit to obtain reasonable assurance about whether the financial statements and financial highlights are free of material misstatement, whether due to error or fraud. The Portfolio is not required to have, nor were we engaged to perform, an audit of its internal control over financial reporting. As part of our audits we are required to obtain an understanding of internal control over financial reporting but not for the purpose of expressing an opinion on the effectiveness of the Portfolio’s internal control over financial reporting. Accordingly, we express no such opinion.
Our audits included performing procedures to assess the risks of material misstatement of the financial statements and financial highlights, whether due to error or fraud, and performing procedures that respond to those risks. Such procedures included examining, on a test basis, evidence regarding the amounts and disclosures in the financial statements and financial highlights. Our audits also included evaluating the accounting principles used and significant estimates made by management, as well as evaluating the overall presentation of the financial statements and financial highlights. Our procedures included confirmation of securities owned as of December 31, 2018, by correspondence with the custodian and brokers; when replies were not received from brokers, we performed other auditing procedures. We believe that our audits provide a reasonable basis for our opinion.
/s/ Deloitte & Touche LLP
Boston, Massachusetts
February 25, 2019
We have served as the auditor of one or more of the Brighthouse investment companies since 1983.
BHFTII-19
Brighthouse Funds Trust II
Trustees and Officers
MANAGEMENT OF THE TRUSTS
The Boards of Trustees (the “Board”) of Brighthouse Funds Trust I and Brighthouse Funds Trust II (“BHF I” and “BHF II”, respectively, and collectively the “Trusts”) supervise the Trusts and are responsible for representing the interests of shareholders. The Trustees, the Chairman of the Board and the Chairmen of each subcommittee are the same for both Trusts. The Trustees of each Trust meet periodically throughout the year to oversee the Portfolios’ activities, reviewing, among other things, each Portfolio’s performance and its contractual arrangements with various service providers. The Trustees of each Trust elect the officers of the Trust, who are responsible for administering the Trust’sday-to-day operations.
Trustees and Officers
The Trustees and executive officers of the Trusts, as well as their principal occupations during the past five years, are set forth below. Unless otherwise indicated, the business address of each is c/o Brighthouse Funds, One Financial Center, Boston, Massachusetts 02111. Each Trustee who is deemed an “interested person,” as such term is defined in the 1940 Act, is referred to as an “Interested Trustee.” Those Trustees who are not “interested persons,” as such term is defined in the 1940 Act, are referred to as “Independent Trustees.” There is no limit to the term a Trustee may serve. Trustees serve until their death, resignation or removal in accordance with the BHF I Trust’s and BHF II Trust’s respective organizational documents and policies adopted by the Boards of the respective Trusts from time to time. Officers hold office at the pleasure of each Board and serve until their removal or resignation in accordance with the Trusts’ respective organizational documents and policies adopted by the Board of each Trust from time to time.
| | | | | | | | | | |
Name and Year of Birth | | Current
Position(s)
Held with
Registrant | | Term of Office
and Length of
Time Served | | Principal Occupation(s) During the Past
5 Years(1) | | Number of
Portfolios
in Brighthouse
Funds
Complex(2)
Overseen
by Trustee | | Other Directorships Held
by Trustee During the
Past 5 Years(1) |
| Interested Trustee |
John Rosenthal* (1960) | | Trustee | | Indefinite; From
May 2016
(Trust I and
Trust II) to present | | Chief Investment Officer, Brighthouse Financial, Inc. (2017 to present); until 2017, Senior Managing Director and Head of Global Portfolio Management, MetLife, Inc. | | 72 | | None |
|
| Independent Trustees |
Dawn M. Vroegop (1966) | | Trustee and Chairman of the Board | | Indefinite; From
December 2000
(Trust I)/May
2009 (Trust II) to
present as
Trustee; From
May 2016 (Trust
I and Trust II)
until present as
Chairman | | Private Investor. | | 72 | | Trustee, Driehaus Mutual Funds.** |
| | | | | |
Stephen M. Alderman (1959) | | Trustee | | Indefinite; From
December 2000
(Trust I)/April
2012 (Trust II) to
present | | Shareholder in the law firm of Garfield and Merel, Ltd. | | 72 | | None |
| | | | | |
Robert J. Boulware (1956) | | Trustee | | Indefinite; From
March 2008
(Trust I)/April
2012 (Trust II) to
present | | Managing Director, Pilgrim Funds, LLC (private equity fund). | | 72 | | Trustee, Vertical Capital Income Fund(closed-end fund);** Director, Gainsco, Inc. (auto insurance);** Trustee, SharesPost 100 Fund(closed-end fund).** |
| | | | | |
Susan C. Gause (1952) | | Trustee | | Indefinite; From
March 2008
(Trust I)/April
2012 (Trust II) to
present | | Private Investor. | | 72 | | Trustee, HSBC Funds.** |
BHFTII-20
Brighthouse Funds Trust II
Trustees and Officers—(Continued)
| | | | | | | | | | |
Name and Year of Birth | | Current
Position(s)
Held with
Registrant | | Term of Office
and Length of
Time Served | | Principal Occupation(s) During the Past
5 Years(1) | | Number of
Portfolios
in Brighthouse
Funds
Complex(2)
Overseen
by Trustee | | Other Directorships Held
by Trustee During the
Past 5 Years(1) |
Nancy Hawthorne (1951) | | Trustee | | Indefinite; From
May 2003
(Trust II)/April
2012 (Trust I)
to present | | Partner, Hawthorne Financial Advisors, LLC (registered investment advisor); until 2014, Chief Executive Officer, Clerestory LLC (corporate advisor). | | 72 | | Director and Chairman of the Board of Directors, THL Credit, Inc.;** Director and Chairman of the Board, Avid Technology, Inc.;** Director, CRA International, Inc.** |
| | | | | |
Barbara A. Nugent (1956) | | Trustee | | Indefinite; From
January 2014
(Trust I and
Trust II) to
present | | President, True North Board Governance, LLC (consulting); until December 2013, partner in the law firm of Stradley Ronon Stevens & Young, LLP. | | 72 | | Independent Lead Trustee, BMT Investment Funds** |
| | | | | |
Christopher J. Towle (1957) | | Trustee | | Indefinite; From
April 2018
(Trust I and
Trust II) to
present | | Retired; until 2014, Partner, Portfolio Manager, Director of High Yield and Convertible Strategies, Lord Abbett & Co. | | 72 | | Trustee, Driehaus Mutual Funds** |
Officers
| | | | | | |
Name and Year of Birth | | Position(s)
Held with
Registrant | | Length of
Time Served | | Principal Occupation(s)
During the Past 5 Years(1) |
| Executive Officers | | | | | | |
Kristi Slavin (1973) | | President and Chief Executive Officer, of Trust I and Trust II | | From May
2016
(Trust I and
Trust II) to
present | | President, Brighthouse Investment Advisers, LLC (2016-present); formerly, Senior Vice President, MetLife Advisers, LLC; Vice President, MetLife, Inc.; Vice President, Trust I and Trust II(2015-2016). |
| | | |
Alan R. Otis (1971) | | Chief Financial Officer and Treasurer, of Trust I and Trust II | | From
November
2017
(Trust I and
Trust II) to
present | | Senior Vice President, Brighthouse Investment Advisers, LLC (2017-present); formerly, Vice President, Brighthouse Investment Advisers, LLC (2012-2017); Assistant Treasurer, Trust I and Trust II (2012-2017). |
| | | |
Andrew L. Gangolf (1954) | | Secretary, of Trust I and Trust II | | From May
2011
(Trust I and
Trust II) to
present | | Executive Vice President, Brighthouse Investment Advisers, LLC (2017-present); formerly, Senior Vice President, MetLife Advisers, LLC (2011-2017); until 2011, Senior Vice President & Assistant General Counsel, AllianceBernstein Investments, Inc. |
| | | |
Steven E. Hartstein (1963) | | Chief Compliance Officer (“CCO”), of Trust I and Trust II | | From
February
2014
(Trust I and
Trust II) to
present | | Senior Vice President and CCO, Brighthouse Investment Advisers, LLC (2017-present); Head of Investments Compliance, Vice President, Brighthouse Financial, Inc. (2017-present); formerly, Vice President, MetLife, Inc. (2013-2017); Senior Vice President and CCO, MetLife Advisers, LLC (2013-2017.) |
| | | |
Victor Soto (1978) | | Vice President of Trust I and Trust II | | From May
2018
(Trust I and
Trust II) to
present | | Executive Vice President, Brighthouse Investment Advisers, LLC (2016-present); Assistant Vice President, MetLife Inc. (2015-2017); Portfolio Manager, 1st Global (2013-2015). |
| * | Mr. Rosenthal is an “interested person” of the Trusts because of his position with Brighthouse Financial, Inc., the current parent company of Brighthouse Investment Advisers, LLC. |
| ** | Indicates a directorship with a registered investment company or a company subject to the reporting requirements of the Securities Exchange Act of 1934, as amended. |
| (1) | Previous positions during the past five years with the Trusts, Brighthouse Financial, Inc., MetLife, Inc. or the Manager are omitted if not materially different. |
| (2) | The Fund Complex includes 43 BHF I Portfolios and 29 BHF II Portfolios. |
BHFTII-21
Brighthouse Funds Trust II
Loomis Sayles Small Cap Growth Portfolio
Board of Trustees’ Consideration of Advisory and Sub-Advisory Agreements
At anin-person meeting held on November6-8, 2018 (the “November Meeting”), the Boards of Trustees (the “Board”) of Brighthouse Funds Trust I and Brighthouse Funds Trust II (“BFT I” and “BFT II,” respectively, and collectively, the “Trusts”), including a majority of the Trustees who are not “interested persons” of the Trusts (the “Independent Trustees”) under the Investment Company Act of 1940 (the “1940 Act”), approved the continuation of the Trusts’ advisory agreements (each, an “Advisory Agreement”) with Brighthouse Investment Advisers, LLC (the “Adviser”) and the applicablesub-advisory agreements (each a “Sub-Advisory Agreement,” and collectively with the Advisory Agreement, the “Agreements”) between the Adviser and the investmentsub-advisers (each a “Sub-Adviser,” and collectively, the “Sub-Advisers”) for the series of the Trusts (each a “Portfolio,” and collectively, the “Portfolios”).
In making those approvals, the Board reviewed a variety of materials that were provided for the specific purpose of the annual contract renewal process. In addition, various materials provided to and discussed with the Board throughout the year informed the Board’s decision to renew the Agreements. In particular, the information for each Portfolio included, but was not limited to, investment performance reports, and reports on expenses, legal and compliance matters, asset pricing, brokerage commissions and trade execution.
The Board met in person with personnel of the Adviser on October 17, 2018 for the specific purpose of giving preliminary consideration to the proposed continuation of the Agreements (the “October Meeting”). At that meeting, the Adviser reviewed with the Board the performance and fees experienced by each Portfolio, as well as other information. During and after the October Meeting, the Independent Trustees communicatedfollow-up matters for management to address at the November Meeting. The Independent Trustees were advised by independent legal counsel throughout the contract renewal process, and met with independent legal counsel in several executive sessions outside of the presence of management.
Information furnished and reviewed specifically in connection with the renewal process included, but was not limited to, a report for each Portfolio that was prepared by Broadridge (“Broadridge”), an independent organization. In addition, the Independent Trustees reviewed a report that was prepared by JDL Consultants, LLC (“JDL”), an independent consultant to the Independent Trustees (“JDL Report”), which examined the comparative fees, expenses and performance of each Portfolio, based upon the Broadridge reports. Also, the Board reviewed the responses to wide-ranging questions from the Independent Trustees relating to the business, operations and performance of the Adviser and theSub-Advisers that the Adviser andSub-Advisers had prepared specifically for the renewal process, and reviewed aPortfolio-by-Portfolio analysis of the profitability to the Adviser of each Advisory Agreement, which was prepared by the Adviser for the renewal process.
At the November Meeting, the Board, including a majority of the Independent Trustees, concluded that the nature, extent and quality of services provided by the Adviser and eachSub-Adviser supported the renewal of the Agreements. The Board also concluded that the investment performance of each Portfolio was such that each Agreement should continue, and that the fees paid by each Portfolio to the Adviser appeared to be reasonable in light of the nature, extent and quality of the services provided by the Adviser andSub-Adviser. Further, the Board concluded that the Adviser’s profitability in providing services under the Advisory Agreements did not appear unreasonable in light of the nature, extent and quality of the services provided by the Adviser. Finally, the Board reviewed the extent to which the investment advisory fees paid by the Portfolios shared economies of scale with investors or entailed the potential to share economies of scale with investors and concluded that those considerations generally supported the renewal of each Agreement. In approving the renewal of each of the Agreements, the Board, including the Independent Trustees, gave attention to all of the information that was furnished and each Trustee placed varying degrees of importance on the various pieces of information that were provided to them. The Board evaluated the information available to it on aPortfolio-by-Portfolio basis, and its decision was made separately with respect to each Portfolio. The following paragraphs provide more information about some of the primary factors that were relevant to the Board’s decision. The Board did not identify any single factor as determinative, and the Trustees generally attributed different weights to various factors for the various Portfolios.
Nature, extent and quality of services. The Board evaluated the nature, extent and quality of the services that the Adviser and theSub-Advisers, as relevant, have provided to the Portfolios. The Board considered the Adviser’s services as investment manager to the Portfolios, including its services relating to the hiring and oversight of theSub-Advisers, trading practices and oversight of transition management (as applicable), compliance programs and personnel, and risk management, among other things. The Adviser’s services in coordinating and overseeing the activities of the Trusts’ other service providers were also considered. The Board considered information received from the Trusts’ Chief Compliance Officer (“CCO”) regarding the Portfolios’ compliance policies and procedures that were established pursuant to Rule38a-l under the 1940 Act. The Board also noted that the Adviser’s investment, compliance and legal staff conduct regular and periodic telephonic andin-person meetings with theSub-Advisers to review and assess the services that are provided to the Portfolios, and that personnel of the Adviser prepare and present reports to the Independent Trustees regarding those meetings. In addition, throughout the year, the Board considered the expertise, experience and performance of the personnel of the Adviser who performed the various services that are mentioned above.
BHFTII-22
Brighthouse Funds Trust II
Loomis Sayles Small Cap Growth Portfolio
Board of Trustees’ Consideration of Advisory and Sub-Advisory Agreements—(Continued)
With respect to the services provided by each of theSub-Advisers, the Board considered a variety of information that the Adviser and eachSub-Adviser prepared for the Board’s review. The Board considered eachSub-Adviser’s investment process and philosophy, and the investment performance experienced by the Portfolio (as described in more detail below). The Board took into account that eachSub-Adviser’s responsibilities include the development and maintenance of an investment program for the applicable Portfolio that is consistent with the Portfolio’s investment objectives, the selection of investment securities and the placement of orders for the purchase and sale of such securities, as well as the implementation of compliance controls related to performance of these services. In particular, the Board considered, among other things, theSub-Adviser’s current level of staffing as well as its compensation program and its overall resources. The Board reviewed eachSub-Adviser’s history and investment experience, as well as information provided regarding the qualifications, background and responsibilities of theSub-Adviser’s investment and compliance personnel who provide services to the Portfolios. The Board also considered, among other things, eachSub-Adviser’s compliance program and regulatory and disciplinary history. In its review, the Board also took into account information regarding any services and/or payments provided to the Adviser by theSub-Advisers in connection with marketing activities and considered representations from the Adviser that those payments were not considered in the Adviser’s recommendation to renew any of theSub-Advisory Agreements.
Performance. The Board placed emphasis on the performance of each Portfolio in light of, among other things, its importance to investors. The Board considered the Adviser’s quarterly reviews with the Board of detailed information about each Portfolio’s investment strategies and performance results and composition, including discussions regarding the relevant effect of current market conditions. The Board reviewed and considered the reports prepared by Broadridge, which provided a statistical analysis comparing the Portfolios’ investment performance to that of comparable funds underlying variable insurance products (the “Performance Universe”). The Independent Trustees also met separately with representatives of JDL during the October Meeting to review the JDL Report. The Board also compared the performance records of the Portfolios to those of comparable funds and other accounts that were managed by the relevantSub-Adviser, to the extent such information was available. The Board considered each Portfolio’s performance for periods subsequent to the performance period covered by the Broadridge reports, and the Adviser’s discussion of the same, including the effect of current market conditions on each Portfolio’s more recent performance. The Board also noted that while it found the data provided by Broadridge generally useful, it recognized the limitations of such data, including, in particular, that notable differences may exist between a Portfolio and those of the other funds in a Broadridge category (for example, the investment objectives(s) and investment strategies) and that the results of the performance comparisons may vary depending on (i) the end dates for the performance periods that were selected and (ii) the selection of the peer groups.
The Board focused particular attention on Portfolios with less favorable performance records. The Board noted the Adviser’s focus on eachSub-Adviser’s performance and that the Adviser has been active in monitoring and responding to any performance issues with respect to the Portfolios.
Fees and Expenses. The Board gave consideration to the level and method of computing the fees payable under the Agreements. The Board considered the Broadridge report for each of the Portfolios, which included comparisons for each Portfolio of its contractual management andsub-adviser fees (at current and various asset levels), and total expenses, with those of its peers, including as those peers were divided into a broad group of peer funds (“Expense Universe”), a narrower group of peer funds (“Expense Group”), a broad group of peersub-advised funds (“Sub-advised Expense Universe”), and a narrower group of peersub-advised funds (“Sub-advised Expense Group”). Broadridge selected the peer funds which were similarly situated funds underlying variable insurance products deemed to be comparable to the Portfolios. The Independent Trustees, with the assistance of JDL, also examined the JDL Report. The Board compared the fee payable to aSub-Adviser by the Adviser with respect to the Portfolio to the fee payable to theSub-Adviser by other comparable funds and other accounts, to the extent such information was available.
The Board noted that thesub-advisory fees for the Portfolios are paid by the Adviser out of the advisory fees, and that the Adviser negotiates the fees at arm’s length. The Board also considered that the Adviser had entered into expense limitation or management fee waiver agreements with certain of the Portfolios pursuant to which the Adviser had agreed to waive a portion of its advisory fee and/or reimburse certain expenses as a means of limiting a Portfolio’s total annual operating expenses.
Profitability. The Board examined the profitability to the Adviser of each Advisory Agreement, on aPortfolio-by-Portfolio basis. The Board also considered that an affiliate of the Adviser, Brighthouse Securities, LLC, serves as distributor for the Trusts, and, as such, receives Rule12b-1 payments to support the distribution of the Portfolios. The Board considered the profitability to theSub-Advisers and their affiliates as a result of their relationships with the Portfolios, to the extent available, and the Board considered the ability of the Adviser to negotiate with aSub-Adviser at arm’s length. In reviewing the profitability analyses, the Board recognized that expense allocation methodologies are inherently subjective and various expense allocation methodologies may be reasonable while producing different results.
BHFTII-23
Brighthouse Funds Trust II
Loomis Sayles Small Cap Growth Portfolio
Board of Trustees’ Consideration of Advisory and Sub-Advisory Agreements—(Continued)
Economies of scale. The Board also considered each Portfolio’s fees in light of its size. The Board noted the fee schedules for the Portfolios that contain breakpoints that reduce the fee rate above specified asset levels. The Board noted those Portfolios that did not have breakpoints in their advisory fee and took into account management’s discussion of the same. The Board noted that those Portfolios with Advisory Agreements containing breakpoints generally have breakpoints in the correspondingSub-Advisory Agreement. The Board considered the effective fees under the Advisory Agreement andSub-Advisory Agreement for each Portfolio as a percentage of assets at different asset levels and possible economies of scale that may be realized if the assets of the Portfolio grow. The Board examined, among other data, the effect of a Portfolio’s growth in size, and reduction in size, on various fee schedules and the Board reviewed the Broadridge and JDL Reports, which compared fees among peers. The Board also generally noted that if a Portfolio’s assets increase over time, the Portfolio may realize other economies of scale if assets increase proportionally more than certain other fixed expenses.
Other factors. The Board considered other benefits that may be realized by the Adviser and its affiliates from their relationship with the Trusts. Among them, the Board recognized that Brighthouse Securities, LLC, as the distributor for the Trusts, receives payments pursuant to Rule12b-1 from the Portfolios to compensate for the provision of shareholder services and distribution activities, which could lead to growth in the Trusts’ assets and corresponding benefits from such growth, including economies of scale. The Board considered other benefits that may be realized by eachSub-Adviser and its affiliates from their relationship with the Trusts, including the opportunity to provide advisory services to additional portfolios of the Trusts and reputational benefits. In conjunction with these considerations, the Board noted the ongoing commitment of the Adviser to the Portfolios.
The Board requested, received, and considered information from the Adviser regarding possible conflicts of interest in the form of material benefits to the Adviser resulting from the Adviser’s affiliations and business relationships, as relevant. The Board considered the services that are provided to the Trusts by its service providers, and the manner in which any conflicts were mitigated.
* * *
Loomis Sayles Small Cap Growth Portfolio. The Board also considered the following information in relation to the Agreements with the Adviser and Loomis, Sayles & Company, L.P. regarding the Portfolio:
Among other data relating specifically to the Portfolio’s performance, the Board considered that the Portfolio outperformed the median of its Performance Universe and the average of its Morningstar Category for theone-, three- and five-year periods ended June 30, 2018. The Board further considered that the Portfolio outperformed its benchmark, the Russell 2000 Growth Index, for theone-, three-, and five-year periods ended September 30, 2018.
The Board also noted that the Portfolio’s actual management fees were below the Expense Group median and theSub-advised Expense Universe median, and equal to Expense Universe median. The Board noted that the Portfolio’s total expenses (exclusive of12b-1 fees) were below the Expense Group median and the Expense Universe median, and above theSub-advised Expense Universe median. The Board further noted that the Portfolio’s contractual management fees were above the asset-weighted average of comparable funds selected by Broadridge at the Portfolio’s current size. The Board also took into account that the Portfolio’s contractualsub-advisory fees were below the averages of theSub-advised Expense Universe and theSub-advised Expense Group at the Portfolio’s current size.
BHFTII-24
Brighthouse Funds Trust II
MetLife Aggregate Bond Index Portfolio
Managed by MetLife Investment Advisors, LLC
Portfolio Manager Commentary*
PERFORMANCE
For the 12 months ended December 31, 2018, the Class A, B, E, and G shares of the MetLife Aggregate Bond Index Portfolio returned-0.18%,-0.45%,-0.34%, and-0.49%, respectively. The Portfolio’s benchmark, the Bloomberg Barclays U.S. Aggregate Bond Index1, returned 0.01%.
MARKET ENVIRONMENT / CONDITIONS
The Federal Open Market Committee (the “FOMC”) met eight times during the12-month period and increased the Federal Funds Rate by 1.00% to 2.25%-2.50% range. The FOMC noted that the labor market had continued to strengthen, and that economic activity increased at a solid rate for most of the year. Data suggested that household spending had grown, but that business fixed investment had moderated byyear-end. The FOMC stated that risks to the economic outlook appear roughly balanced and that inflation was expected to remain around the 2.0% objective over the medium term. The FOMC suggested that some further gradual rate increases would be consistent with sustained expansion of economic activity. However, the FOMC decreased its 2019 projection to only two rate hikes, down from three.
During 2018, the U.S. economy showed considerable strength, but increased risk aversion and volatility created uncertainty in the market as the year ended. Bond returns were lower over the period broadly reflecting macro uncertainty with trade tensions and a potentially slowing global economy, even though economic indicators remained strong. The housing and labor markets remained strong and consumer confidence was robust reflecting a resilient consumer. However, after a relatively benign 2017, volatility returned to the market as longer-term risks to the economy increased. U.S. Treasury rates increased during 2018, but the curve flattened over the year as short-term Treasuries sold off and inverted byyear-end. The difference between the10-year and30-year U.S. Treasury remained at 0.33%, while the2-year and10-year differential decreased by 0.33% to 0.19%. The10-year increased 0.28% to 2.69% and the30-year increased 0.28% to 3.02%.
The Bloomberg Barclays U.S. Aggregate Bond Index returned 0.01% in 2018. Asset-Backed Securities performed the best, returning 1.77% in 2018. The worst performing sector during the period was the Corporate sector, returning-2.51%. Credit risk increased as option adjusted spreads widened 18 basis points across the U.S. Aggregate Bond Index. Lower rated debt was most sensitive withBBB-rated Corporates andBBB-rated Government related spreads wider by 72 basis points and 85 basis points, respectively.
PORTFOLIO REVIEW /PERIOD-END POSITIONING
The Portfolio is managed utilizing a Stratified Sampling approach where the objective is to track the performance of the Index by holding a subset of Index constituents and neutralizing exposures across key characteristics (i.e., duration, term structure, high sector,sub-sector, quality). Factors that impact tracking error include sampling, transaction costs, contributions and withdrawals.
Stacey Lituchy
Jason Chapin
Brian Leonard
Portfolio Managers
MetLife Investment Advisors, LLC
* This commentary may include statements that constitute “forward-looking statements” under the U.S. securities laws. Forward-looking statements include, among other things, projections, estimates, and information about possible or future results related to the Portfolio, market or regulatory developments. The views expressed above are not guarantees of future performance or economic results and involve certain risks, uncertainties and assumptions that could cause actual outcomes and results to differ materially from the views expressed herein. The views expressed above are subject to change at any time based upon economic, market, or other conditions and the subadvisory firm undertakes no obligation to update the views expressed herein. Any discussions of specific securities should not be considered a recommendation to buy or sell those securities. The views expressed above (including any forward-looking statement) may not be relied upon as investment advice or as an indication of the Portfolio’s trading intent. Information about the Portfolio’s holdings, asset allocation or country diversification is historical and is not an indication of future Portfolio composition, which may vary. Direct investment in any index is not possible. The performance of any index mentioned in this commentary has not been adjusted for ongoing management, distribution and operating expenses, and sales charges applicable to mutual fund investments. In addition, the returns do not reflect additional fees charged by separate accounts or variable insurance contracts that an investor in the Portfolio may pay. If these additional fees were reflected, performance would have been lower.
BHFTII-1
Brighthouse Funds Trust II
MetLife Aggregate Bond Index Portfolio
A $10,000 INVESTMENT COMPARED TO THE BLOOMBERG BARCLAYS U.S. AGGREGATE BOND INDEX
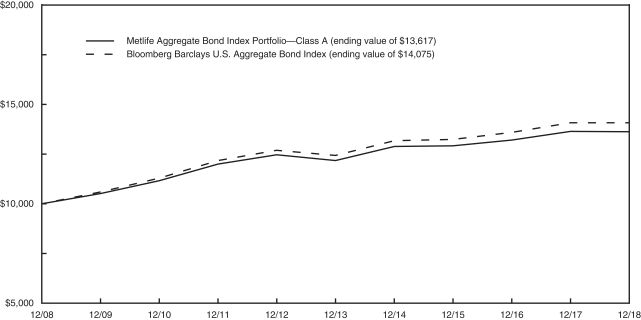
AVERAGE ANNUAL RETURNS (%) (FOR THE YEAR ENDED DECEMBER 31, 2018)
| | | | | | | | | | | | | | | | |
| | | | | |
| | | 1 Year | | | 5 Year | | | 10 Year | | | Since Inception2 | |
| MetLife Aggregate Bond Index Portfolio | | | | | | | | | | | | | | | | |
Class A | | | -0.18 | | | | 2.28 | | | | 3.14 | | | | — | |
Class B | | | -0.45 | | | | 2.02 | | | | 2.88 | | | | — | |
Class E | | | -0.34 | | | | 2.13 | | | | 2.99 | | | | — | |
Class G | | | -0.49 | | | | 1.96 | | | | — | | | | 2.87 | |
| Bloomberg Barclays U.S. Aggregate Bond Index | | | 0.01 | | | | 2.52 | | | | 3.48 | | | | — | |
1 The Bloomberg Barclays U.S. Aggregate Bond Index is a broad based benchmark that measures the investment grade, U.S. dollar-denominated, fixed-rate taxable bond market, including Treasuries, government-related and corporate securities, mortgage-backed securities, asset-backed securities, and commercial mortgage-backed securities.
2 Inception dates of the Class A, Class B, Class E and Class G shares are 11/9/98,1/2/01, 5/1/01 and 4/28/09, respectively.
Portfolio performance is calculated including reinvestment of all income and capital gain distributions. Performance numbers are net of all Portfolio expenses but do not include any insurance, sales, separate account or administrative charges of variable annuity or life insurance contracts or any additional expenses that participants may bear relating to the operations of their plans. If these charges were included, the returns would be lower. The performance of any index referenced above has not been adjusted for ongoing management, distribution and operating expenses, and sales charges applicable to mutual fund investments. Direct investment in any index is not possible. The performance of Class A shares, as set forth in the line graph above, will differ from that of other classes because of the difference in expenses paid by policyholders investing in the different share classes.
This information represents past performance and is not indicative of future results. Investment return and principal value may fluctuate so that shares, upon redemption, may be worth more or less than the original cost.
PORTFOLIO COMPOSITION AS OF DECEMBER 31, 2018
Top Sectors
| | | | |
| | | % of
Net Assets | |
| U.S. Treasury & Government Agencies | | | 68.8 | |
| Corporate Bonds & Notes | | | 26.4 | |
| Foreign Government | | | 1.7 | |
| Mortgage-Backed Securities | | | 1.2 | |
| Asset-Backed Securities | | | 0.6 | |
| Municipals | | | 0.5 | |
BHFTII-2
Brighthouse Funds Trust II
MetLife Aggregate Bond Index Portfolio
Understanding Your Portfolio’s Expenses
Shareholder Expense Example
As a shareholder of the Portfolio, you incur ongoing costs, including management fees; distribution and service(12b-1) fees; and other Portfolio expenses. This example is intended to help you understand your ongoing costs (in dollars) (referred to as “expenses”) of investing in the Portfolio and compare these costs with the ongoing costs of investing in other mutual funds. The example is based on an investment of $1,000 invested at the beginning of the period and held for the entire period, July 1, 2018 through December 31, 2018.
Actual Expenses
The first line for each share class of the Portfolio in the table below provides information about actual account values and actual expenses. You may use the information in this line, together with the amount you invested in the particular share class of the Portfolio, to estimate the expenses that you paid over the period. Simply divide your account value by $1,000 (for example, an $8,600 account value divided by $1,000 = 8.6), then multiply the result by the number in the first line under the heading entitled “Expenses Paid During Period” to estimate the expenses you paid on your account during this period.
Hypothetical Example for Comparison Purposes
The second line for each share class of the Portfolio in the table below provides information about hypothetical account values and hypothetical expenses based on the Portfolio’s actual expense ratio and an assumed rate of return of 5% per year before expenses, which is not the Portfolio’s actual return. The hypothetical account values and expenses may not be used to estimate the actual ending account balance or expenses you paid for the period. You may use this information to compare the ongoing costs of investing in the Portfolio and other funds. To do so, compare this 5% hypothetical example with the 5% hypothetical examples that appear in the shareholder reports of the other funds.
Please note that the expenses shown in the table are meant to highlight your ongoing costs only and do not reflect any fees or charges of your variable insurance product or any additional expenses that participants in certain eligible qualified plans may bear relating to the operations of their plan. Therefore, the second line for each share class in the table is useful in comparing ongoing costs only, and will not help you determine the relative total costs of owning different funds. In addition, if these other costs were included, your costs would have been higher.
| | | | | | | | | | | | | | | | | | |
MetLife Aggregate Bond Index Portfolio
| | | |
Annualized
Expense
Ratio | | | Beginning
Account Value
July 1,
2018 | | | Ending
Account Value
December 31,
2018 | | | Expenses Paid
During Period**
July 1, 2018
to
December 31,
2018 | |
Class A (a) | | Actual | | | 0.27 | % | | $ | 1,000.00 | | | $ | 1,015.40 | | | $ | 1.37 | |
| | Hypothetical* | | | 0.27 | % | | $ | 1,000.00 | | | $ | 1,023.84 | | | $ | 1.38 | |
| | | | | |
Class B (a) | | Actual | | | 0.52 | % | | $ | 1,000.00 | | | $ | 1,013.80 | | | $ | 2.64 | |
| | Hypothetical* | | | 0.52 | % | | $ | 1,000.00 | | | $ | 1,022.58 | | | $ | 2.65 | |
| | | | | |
Class E (a) | | Actual | | | 0.42 | % | | $ | 1,000.00 | | | $ | 1,014.50 | | | $ | 2.13 | |
| | Hypothetical* | | | 0.42 | % | | $ | 1,000.00 | | | $ | 1,023.09 | | | $ | 2.14 | |
| | | | | |
Class G (a) | | Actual | | | 0.57 | % | | $ | 1,000.00 | | | $ | 1,013.80 | | | $ | 2.89 | |
| | Hypothetical* | | | 0.57 | % | | $ | 1,000.00 | | | $ | 1,022.33 | | | $ | 2.91 | |
| * | Hypothetical assumes a rate of return of 5% per year before expenses. |
| ** | Expenses paid are equal to the Portfolio’s annualized expense ratio for the most recent six month period, as shown above, multiplied by the average account value over the period, multiplied by the number of days (184 days) in the most recent fiscal half-year, divided by 365 (to reflect theone-half year period). |
| (a) | The annualized expense ratio shown reflects the impact of the management fee waiver as described in Note 5 of the Notes to Financial Statements. |
BHFTII-3
Brighthouse Funds Trust II
MetLife Aggregate Bond Index Portfolio
Schedule of Investments as of December 31, 2018
U.S. Treasury & Government Agencies—68.8% of Net Assets
| | | | | | | | |
| Security Description | | Principal
Amount* | | | Value | |
|
| Agency Sponsored Mortgage-Backed—29.0% | |
| Fannie Mae 15 Yr. Pool | |
2.500%, 12/01/27 | | | 2,484,531 | | | $ | 2,455,179 | |
2.500%, 02/01/28 | | | 2,012,291 | | | | 1,988,518 | |
2.500%, 07/01/28 | | | 3,530,568 | | | | 3,480,479 | |
2.500%, 10/01/28 | | | 2,178,349 | | | | 2,147,444 | |
2.500%, 03/01/30 | | | 2,339,758 | | | | 2,292,575 | |
2.500%, 09/01/31 | | | 3,709,360 | | | | 3,626,684 | |
2.500%, 01/01/32 | | | 1,192,686 | | | | 1,166,103 | |
2.500%, 04/01/32 | | | 2,498,524 | | | | 2,441,199 | |
2.500%, 09/01/32 | | | 848,116 | | | | 828,658 | |
3.000%, 01/01/27 | | | 921,068 | | | | 923,346 | |
3.000%, 02/01/27 | | | 1,537,285 | | | | 1,541,088 | |
3.000%, 03/01/27 | | | 792,047 | | | | 794,864 | |
3.000%, 01/01/29 | | | 3,836,753 | | | | 3,851,704 | |
3.000%, 10/01/29 | | | 1,755,756 | | | | 1,757,237 | |
3.000%, 06/01/30 | | | 2,036,094 | | | | 2,035,643 | |
3.000%, 02/01/33 | | | 4,533,013 | | | | 4,525,451 | |
3.500%, 02/01/26 | | | 1,308,853 | | | | 1,328,937 | |
3.500%, 03/01/26 | | | 599,295 | | | | 608,353 | |
3.500%, 05/01/29 | | | 1,553,649 | | | | 1,580,045 | |
3.500%, 08/01/32 | | | 768,544 | | | | 778,454 | |
4.000%, 04/01/19 | | | 2,055 | | | | 2,052 | |
4.000%, 05/01/19 | | | 9,244 | | | | 9,234 | |
4.000%, 01/01/20 | | | 35,020 | | | | 35,042 | |
4.000%, 06/01/24 | | | 170,544 | | | | 174,589 | |
4.000%, 11/01/24 | | | 1,055,258 | | | | 1,080,287 | |
4.500%, 05/01/19 | | | 5,349 | | | | 5,349 | |
4.500%, 08/01/24 | | | 275,989 | | | | 283,644 | |
4.500%, 06/01/25 | | | 522,453 | | | | 537,999 | |
5.000%, 01/01/19 | | | 575 | | | | 575 | |
5.000%, 02/01/20 | | | 29,359 | | | | 29,533 | |
5.000%, 01/01/22 | | | 51,227 | | | | 52,278 | |
5.000%, 02/01/24 | | | 246,037 | | | | 251,386 | |
| Fannie Mae 20 Yr. Pool | |
3.000%, 02/01/33 | | | 1,395,066 | | | | 1,395,042 | |
3.000%, 08/01/35 | | | 1,985,653 | | | | 1,973,370 | |
3.000%, 05/01/36 | | | 2,792,014 | | | | 2,759,258 | |
3.500%, 04/01/32 | | | 1,241,882 | | | | 1,262,902 | |
3.500%, 09/01/35 | | | 1,858,344 | | | | 1,881,023 | |
3.500%, 07/01/38 | | | 2,415,886 | | | | 2,441,918 | |
4.000%, 02/01/31 | | | 543,997 | | | | 561,525 | |
4.000%, 03/01/38 | | | 1,804,077 | | | | 1,855,955 | |
4.000%, 07/01/38 | | | 2,404,818 | | | | 2,473,920 | |
4.500%, 08/01/30 | | | 330,331 | | | | 345,216 | |
5.000%, 02/01/24 | | | 109,959 | | | | 115,137 | |
5.000%, 09/01/25 | | | 96,014 | | | | 100,547 | |
5.500%, 07/01/23 | | | 63,282 | | | | 66,881 | |
5.500%, 01/01/24 | | | 42,893 | | | | 45,332 | |
5.500%, 07/01/24 | | | 115,261 | | | | 121,868 | |
5.500%, 07/01/25 | | | 109,658 | | | | 116,153 | |
7.000%, 10/01/21 | | | 3,412 | | | | 3,541 | |
| Fannie Mae 30 Yr. Pool | |
3.000%, 08/01/42 | | | 1,292,855 | | | | 1,270,655 | |
3.000%, 09/01/42 | | | 1,700,261 | | | | 1,671,066 | |
3.000%, 11/01/42 | | | 2,016,159 | | | | 1,981,540 | |
3.000%, 12/01/42 | | | 4,135,790 | | | | 4,064,774 | |
|
| Agency Sponsored Mortgage-Backed—(Continued) | |
| Fannie Mae 30 Yr. Pool | |
3.000%, 01/01/43 | | | 1,006,827 | | | | 989,539 | |
3.000%, 02/01/43 | | | 3,918,962 | | | | 3,851,670 | |
3.000%, 03/01/43 | | | 4,101,847 | | | | 4,028,177 | |
3.000%, 05/01/43 | | | 3,034,997 | | | | 2,980,487 | |
3.000%, 07/01/43 | | | 8,406,940 | | | | 8,255,949 | |
3.000%, 09/01/43 | | | 1,579,530 | | | | 1,551,161 | |
3.000%, 05/01/45 | | | 2,753,896 | | | | 2,696,979 | |
3.000%, 05/01/46 | | | 3,001,500 | | | | 2,928,606 | |
3.000%, 06/01/46 | | | 3,909,926 | | | | 3,814,970 | |
3.000%, 08/01/46 | | | 3,933,486 | | | | 3,837,957 | |
3.000%, 10/01/46 | | | 4,030,551 | | | | 3,932,665 | |
3.000%, 02/01/47 | | | 8,794,250 | | | | 8,580,673 | |
3.500%, 12/01/40 | | | 1,543,716 | | | | 1,558,068 | |
3.500%, 03/01/42 | | | 1,020,306 | | | | 1,028,242 | |
3.500%, 04/01/42 | | | 2,304,704 | | | | 2,322,631 | |
3.500%, 05/01/42 | | | 2,481,744 | | | | 2,501,048 | |
3.500%, 06/01/42 | | | 1,827,499 | | | | 1,841,714 | |
3.500%, 08/01/42 | | | 1,185,727 | | | | 1,194,950 | |
3.500%, 09/01/42 | | | 3,741,800 | | | | 3,770,906 | |
3.500%, 10/01/42 | | | 1,880,524 | | | | 1,895,151 | |
3.500%, 01/01/43 | | | 1,503,549 | | | | 1,515,244 | |
3.500%, 02/01/43 | | | 2,384,679 | | | | 2,403,227 | |
3.500%, 04/01/43 | | | 2,811,384 | | | | 2,831,676 | |
3.500%, 06/01/43 | | | 1,471,805 | | | | 1,475,313 | |
3.500%, 08/01/44 | | | 1,888,800 | | | | 1,898,043 | |
3.500%, 02/01/45 | | | 2,511,421 | | | | 2,523,710 | |
3.500%, 03/01/45 | | | 4,170,112 | | | | 4,186,566 | |
3.500%, 04/01/45 | | | 4,697,186 | | | | 4,712,094 | |
3.500%, 09/01/45 | | | 8,764,026 | | | | 8,791,839 | |
3.500%, 11/01/45 | | | 2,947,178 | | | | 2,956,531 | |
3.500%, 01/01/46 | | | 3,436,477 | | | | 3,447,383 | |
3.500%, 03/01/46 | | | 3,397,911 | | | | 3,406,037 | |
3.500%, 05/01/46 | | | 2,727,524 | | | | 2,734,047 | |
3.500%, 04/01/47 | | | 7,510,136 | | | | 7,510,359 | |
3.500%, 09/01/47 | | | 3,513,227 | | | | 3,513,332 | |
3.500%, 11/01/47 | | | 6,322,200 | | | | 6,322,388 | |
3.500%, 03/01/48 | | | 5,229,595 | | | | 5,229,413 | |
4.000%, 08/01/39 | | | 757,678 | | | | 780,419 | |
4.000%, 09/01/39 | | | 740,453 | | | | 762,677 | |
4.000%, 12/01/39 | | | 880,556 | | | | 906,986 | |
4.000%, 06/01/40 | | | 976,557 | | | | 1,005,559 | |
4.000%, 09/01/40 | | | 587,364 | | | | 604,808 | |
4.000%, 12/01/40 | | | 4,147,281 | | | | 4,270,447 | |
4.000%, 01/01/41 | | | 2,165,344 | | | | 2,229,652 | |
4.000%, 02/01/41 | | | 2,739,210 | | | | 2,820,560 | |
4.000%, 12/01/41 | | | 997,855 | | | | 1,026,917 | |
4.000%, 02/01/42 | | | 1,138,892 | | | | 1,172,062 | |
4.000%, 09/01/43 | | | 1,573,175 | | | | 1,617,932 | |
4.000%, 02/01/44 | | | 2,619,592 | | | | 2,694,120 | |
4.000%, 05/01/44 | | | 1,717,508 | | | | 1,761,544 | |
4.000%, 08/01/44 | | | 2,533,893 | | | | 2,598,861 | |
4.000%, 10/01/44 | | | 1,487,813 | | | | 1,525,960 | |
4.000%, 11/01/44 | | | 2,891,684 | | | | 2,957,722 | |
4.000%, 01/01/45 | | | 2,418,509 | | | | 2,480,518 | |
4.000%, 03/01/45 | | | 1,628,756 | | | | 1,664,944 | |
See accompanying notes to financial statements.
BHFTII-4
Brighthouse Funds Trust II
MetLife Aggregate Bond Index Portfolio
Schedule of Investments as of December 31, 2018
U.S. Treasury & Government Agencies—(Continued)
| | | | | | | | |
| Security Description | | Principal
Amount* | | | Value | |
|
| Agency Sponsored Mortgage-Backed—(Continued) | |
| Fannie Mae 30 Yr. Pool | |
4.000%, 10/01/45 | | | 2,727,686 | | | $ | 2,788,290 | |
4.000%, 03/01/47 | | | 1,077,165 | | | | 1,099,201 | |
4.000%, 05/01/47 | | | 1,525,956 | | | | 1,557,176 | |
4.000%, 06/01/47 | | | 8,035,106 | | | | 8,199,498 | |
4.000%, 07/01/47 | | | 2,008,940 | | | | 2,050,042 | |
4.000%, 10/01/47 | | | 2,567,472 | | | | 2,620,001 | |
4.000%, 05/01/48 | | | 3,785,969 | | | | 3,860,695 | |
4.000%, 06/01/48 | | | 3,853,901 | | | | 3,929,968 | |
4.000%, 07/01/48 | | | 2,906,113 | | | | 2,963,474 | |
4.000%, 09/01/48 | | | 1,644,795 | | | | 1,677,260 | |
4.000%, 10/01/48 | | | 2,466,169 | | | | 2,516,046 | |
4.000%, 11/01/48 | | | 2,973,625 | | | | 3,032,318 | |
4.500%, 08/01/33 | | | 181,273 | | | | 189,670 | |
4.500%, 10/01/33 | | | 163,487 | | | | 171,059 | |
4.500%, 04/01/34 | | | 65,679 | | | | 68,756 | |
4.500%, 01/01/39 | | | 55,719 | | | | 58,301 | |
4.500%, 07/01/39 | | | 1,141,420 | | | | 1,195,303 | |
4.500%, 09/01/39 | | | 1,662,259 | | | | 1,740,731 | |
4.500%, 10/01/39 | | | 717,619 | | | | 751,496 | |
4.500%, 05/01/40 | | | 1,006,638 | | | | 1,057,135 | |
4.500%, 08/01/40 | | | 1,606,423 | | | | 1,681,301 | |
4.500%, 11/01/40 | | | 827,169 | | | | 865,724 | |
4.500%, 12/01/40 | | | 1,544,889 | | | | 1,616,899 | |
4.500%, 04/01/41 | | | 3,778,898 | | | | 3,953,857 | |
4.500%, 05/01/41 | | | 938,127 | | | | 981,329 | |
4.500%, 03/01/44 | | | 1,007,600 | | | | 1,048,469 | |
4.500%, 08/01/47 | | | 2,229,971 | | | | 2,310,000 | |
4.500%, 08/01/48 | | | 6,139,522 | | | | 6,360,835 | |
4.500%, 12/01/48 | | | 2,988,049 | | | | 3,095,760 | |
5.000%, 07/01/33 | | | 87,159 | | | | 92,983 | |
5.000%, 08/01/33 | | | 356,800 | | | | 380,641 | |
5.000%, 09/01/33 | | | 143,045 | | | | 152,603 | |
5.000%, 10/01/33 | | | 1,462,862 | | | | 1,560,607 | |
5.000%, 03/01/34 | | | 169,020 | | | | 180,314 | |
5.000%, 04/01/34 | | | 396,818 | | | | 423,392 | |
5.000%, 05/01/34 | | | 50,174 | | | | 53,540 | |
5.000%, 09/01/34 | | | 195,179 | | | | 208,271 | |
5.000%, 02/01/35 | | | 69,728 | | | | 74,405 | |
5.000%, 04/01/35 | | | 96,877 | | | | 103,082 | |
5.000%, 05/01/35 | | | 40,365 | | | | 42,951 | |
5.000%, 11/01/35 | | | 100,466 | | | | 106,901 | |
5.000%, 03/01/36 | | | 388,131 | | | | 412,994 | |
5.000%, 07/01/37 | | | 328,993 | | | | 350,385 | |
5.000%, 01/01/39 | | | 294,168 | | | | 313,296 | |
5.000%, 04/01/40 | | | 1,080,409 | | | | 1,146,987 | |
5.000%, 07/01/41 | | | 709,355 | | | | 752,419 | |
5.500%, 10/01/32 | | | 28,964 | | | | 30,769 | |
5.500%, 02/01/33 | | | 75,027 | | | | 80,855 | |
5.500%, 03/01/33 | | | 302,568 | | | | 326,085 | |
5.500%, 08/01/33 | | | 491,678 | | | | 529,894 | |
5.500%, 10/01/33 | | | 59,224 | | | | 63,827 | |
5.500%, 12/01/33 | | | 538,710 | | | | 580,581 | |
5.500%, 02/01/34 | | | 102,098 | | | | 109,898 | |
5.500%, 03/01/34 | | | 92,832 | | | | 99,923 | |
5.500%, 04/01/34 | | | 37,473 | | | | 40,336 | |
|
| Agency Sponsored Mortgage-Backed—(Continued) | |
| Fannie Mae 30 Yr. Pool | |
5.500%, 06/01/34 | | | 153,006 | | | | 164,695 | |
5.500%, 09/01/34 | | | 139,063 | | | | 149,687 | |
5.500%, 12/01/34 | | | 100,248 | | | | 107,907 | |
5.500%, 01/01/35 | | | 107,477 | | | | 115,688 | |
5.500%, 04/01/35 | | | 68,804 | | | | 74,278 | |
5.500%, 06/01/35 | | | 105,250 | | | | 113,622 | |
5.500%, 01/01/37 | | | 137,994 | | | | 148,975 | |
5.500%, 05/01/37 | | | 105,860 | | | | 114,098 | |
5.500%, 05/01/38 | | | 70,720 | | | | 76,257 | |
5.500%, 06/01/38 | | | 83,601 | | | | 90,147 | |
5.500%, 07/01/38 | | | 52,835 | | | | 56,972 | |
6.000%, 08/01/28 | | | 2,051 | | | | 2,061 | |
6.000%, 11/01/28 | | | 465 | | | | 493 | |
6.000%, 12/01/28 | | | 597 | | | | 647 | |
6.000%, 06/01/31 | | | 33,365 | | | | 35,110 | |
6.000%, 09/01/32 | | | 60,304 | | | | 66,381 | |
6.000%, 01/01/33 | | | 16,566 | | | | 18,171 | |
6.000%, 02/01/33 | | | 53,460 | | | | 58,471 | |
6.000%, 03/01/33 | | | 76,843 | | | | 79,282 | |
6.000%, 04/01/33 | | | 190,504 | | | | 202,496 | |
6.000%, 05/01/33 | | | 140,659 | | | | 148,959 | |
6.000%, 05/01/34 | | | 134,115 | | | | 141,219 | |
6.000%, 09/01/34 | | | 115,090 | | | | 122,662 | |
6.000%, 11/01/34 | | | 205,039 | | | | 226,658 | |
6.000%, 01/01/35 | | | 62,783 | | | | 67,957 | |
6.000%, 07/01/36 | | | 31,033 | | | | 34,302 | |
6.000%, 09/01/36 | | | 96,879 | | | | 107,201 | |
6.000%, 07/01/37 | | | 46,001 | | | | 48,148 | |
6.000%, 08/01/37 | | | 139,974 | | | | 154,539 | |
6.000%, 09/01/37 | | | 290,306 | | | | 319,455 | |
6.000%, 10/01/37 | | | 96,541 | | | | 106,453 | |
6.000%, 05/01/38 | | | 388,180 | | | | 428,905 | |
6.000%, 12/01/38 | | | 91,892 | | | | 101,193 | |
6.500%, 05/01/28 | | | 31,812 | | | | 34,888 | |
6.500%, 12/01/28 | | | 104,263 | | | | 110,339 | |
6.500%, 03/01/29 | | | 2,309 | | | | 2,503 | |
6.500%, 04/01/29 | | | 19,019 | | | | 20,895 | |
6.500%, 05/01/29 | | | 4,371 | | | | 4,823 | |
6.500%, 08/01/29 | | | 746 | | | | 808 | |
6.500%, 05/01/30 | | | 13,194 | | | | 13,514 | |
6.500%, 09/01/31 | | | 3,669 | | | | 3,836 | |
6.500%, 06/01/32 | | | 15,578 | | | | 17,456 | |
6.500%, 10/01/33 | | | 62,245 | | | | 67,122 | |
6.500%, 10/01/34 | | | 178,790 | | | | 200,793 | |
6.500%, 10/01/37 | | | 56,115 | | | | 62,558 | |
7.000%, 06/01/26 | | | 305 | | | | 319 | |
7.000%, 06/01/28 | | | 6,284 | | | | 6,401 | |
7.000%, 10/01/29 | | | 5,750 | | | | 6,466 | |
7.000%, 12/01/29 | | | 3,070 | | | | 3,215 | |
7.000%, 06/01/32 | | | 43,631 | | | | 49,228 | |
7.000%, 10/01/37 | | | 116,253 | | | | 132,250 | |
7.500%, 09/01/25 | | | 3,013 | | | | 3,287 | |
7.500%, 06/01/26 | | | 2,574 | | | | 2,833 | |
7.500%, 07/01/29 | | | 7,382 | | | | 8,318 | |
7.500%, 10/01/29 | | | 4,061 | | | | 4,299 | |
See accompanying notes to financial statements.
BHFTII-5
Brighthouse Funds Trust II
MetLife Aggregate Bond Index Portfolio
Schedule of Investments as of December 31, 2018
U.S. Treasury & Government Agencies—(Continued)
| | | | | | | | |
| Security Description | | Principal
Amount* | | | Value | |
|
| Agency Sponsored Mortgage-Backed—(Continued) | |
| Fannie Mae 30 Yr. Pool | |
8.000%, 11/01/29 | | | 82 | | | $ | 95 | |
8.000%, 05/01/30 | | | 15,258 | | | | 16,214 | |
8.000%, 11/01/30 | | | 1,915 | | | | 2,183 | |
8.000%, 01/01/31 | | | 1,258 | | | | 1,417 | |
8.000%, 02/01/31 | | | 3,737 | | | | 4,315 | |
| Freddie Mac 15 Yr. Gold Pool | |
2.500%, 12/01/27 | | | 1,139,617 | | | | 1,124,839 | |
2.500%, 02/01/28 | | | 1,829,123 | | | | 1,801,046 | |
2.500%, 04/01/28 | | | 1,610,840 | | | | 1,586,114 | |
2.500%, 12/01/29 | | | 2,373,965 | | | | 2,331,082 | |
2.500%, 01/01/31 | | | 3,142,896 | | | | 3,075,847 | |
2.500%, 01/01/32 | | | 4,811,276 | | | | 4,698,371 | |
3.000%, 03/01/27 | | | 859,443 | | | | 860,088 | |
3.000%, 05/01/27 | | | 1,153,218 | | | | 1,155,334 | |
3.000%, 11/01/28 | | | 1,442,681 | | | | 1,445,817 | |
3.000%, 12/01/29 | | | 2,590,496 | | | | 2,588,208 | |
3.000%, 05/01/31 | | | 3,105,348 | | | | 3,096,412 | |
3.000%, 10/01/32 | | | 1,710,147 | | | | 1,704,324 | |
3.500%, 12/01/25 | | | 902,708 | | | | 916,566 | |
3.500%, 05/01/26 | | | 321,827 | | | | 326,687 | |
3.500%, 09/01/30 | | | 2,056,452 | | | | 2,088,981 | |
4.000%, 06/01/19 | | | 12,516 | | | | 12,517 | |
4.000%, 05/01/25 | | | 463,941 | | | | 475,409 | |
4.000%, 08/01/25 | | | 219,504 | | | | 224,930 | |
4.000%, 10/01/25 | | | 247,188 | | | | 253,299 | |
4.500%, 04/01/19 | | | 10,262 | | | | 10,265 | |
4.500%, 06/01/19 | | | 13,353 | | | | 13,354 | |
4.500%, 08/01/19 | | | 2,385 | | | | 2,387 | |
5.000%, 06/01/19 | | | 11,396 | | | | 11,413 | |
5.500%, 01/01/24 | | | 201,734 | | | | 209,369 | |
| Freddie Mac 20 Yr. Gold Pool | |
3.000%, 04/01/33 | | | 2,170,539 | | | | 2,167,477 | |
3.000%, 02/01/37 | | | 2,502,524 | | | | 2,472,412 | |
3.500%, 04/01/32 | | | 1,554,000 | | | | 1,580,053 | |
4.000%, 01/01/31 | | | 604,505 | | | | 623,925 | |
4.000%, 08/01/31 | | | 601,681 | | | | 621,896 | |
4.500%, 05/01/29 | | | 152,733 | | | | 159,555 | |
5.000%, 03/01/27 | | | 78,716 | | | | 82,701 | |
| Freddie Mac 30 Yr. Gold Pool | |
2.500%, 07/01/43 | | | 2,263,927 | | | | 2,157,521 | |
3.000%, 10/01/42 | | | 2,079,753 | | | | 2,043,411 | |
3.000%, 01/01/43 | | | 1,970,232 | | | | 1,935,804 | |
3.000%, 03/01/43 | | | 5,202,596 | | | | 5,108,878 | |
3.000%, 04/01/43 | | | 3,565,785 | | | | 3,500,658 | |
3.000%, 06/01/43 | | | 1,667,550 | | | | 1,637,094 | |
3.000%, 07/01/43 | | | 3,142,764 | | | | 3,085,364 | |
3.000%, 06/01/45 | | | 3,550,046 | | | | 3,475,587 | |
3.000%, 06/01/46 | | | 3,869,568 | | | | 3,774,419 | |
3.000%, 10/01/46 | | | 3,215,517 | | | | 3,136,451 | |
3.000%, 11/01/46 | | | 4,086,634 | | | | 3,986,148 | |
3.000%, 01/01/47 | | | 6,540,452 | | | | 6,379,629 | |
3.500%, 01/01/42 | | | 1,100,747 | | | | 1,109,388 | |
3.500%, 03/01/42 | | | 997,042 | | | | 1,004,603 | |
3.500%, 08/01/42 | | | 2,659,284 | | | | 2,679,451 | |
3.500%, 02/01/43 | | | 1,440,365 | | | | 1,451,288 | |
|
| Agency Sponsored Mortgage-Backed—(Continued) | |
| Freddie Mac 30 Yr. Gold Pool | |
3.500%, 05/01/43 | | | 2,233,082 | | | | 2,248,771 | |
3.500%, 06/01/43 | | | 1,293,909 | | | | 1,302,999 | |
3.500%, 06/01/44 | | | 1,625,201 | | | | 1,632,839 | |
3.500%, 10/01/44 | | | 1,743,282 | | | | 1,751,475 | |
3.500%, 11/01/44 | | | 2,508,102 | | | | 2,519,889 | |
3.500%, 12/01/44 | | | 2,342,409 | | | | 2,353,418 | |
3.500%, 05/01/45 | | | 2,902,807 | | | | 2,911,456 | |
3.500%, 08/01/45 | | | 3,219,576 | | | | 3,229,169 | |
3.500%, 11/01/45 | | | 3,093,608 | | | | 3,102,825 | |
3.500%, 12/01/45 | | | 1,875,187 | | | | 1,880,774 | |
3.500%, 03/01/46 | | | 5,769,620 | | | | 5,784,748 | |
3.500%, 06/01/47 | | | 3,416,655 | | | | 3,416,082 | |
3.500%, 08/01/47 | | | 2,178,641 | | | | 2,178,372 | |
3.500%, 10/01/47 | | | 2,716,224 | | | | 2,715,889 | |
3.500%, 11/01/47 | | | 2,685,108 | | | | 2,684,658 | |
3.500%, 02/01/48 | | | 5,646,437 | | | | 5,645,490 | |
4.000%, 06/01/39 | | | 553,498 | | | | 570,047 | |
4.000%, 12/01/39 | | | 869,548 | | | | 895,548 | |
4.000%, 11/01/40 | | | 877,463 | | | | 903,445 | |
4.000%, 04/01/41 | | | 874,466 | | | | 899,836 | |
4.000%, 09/01/41 | | | 919,917 | | | | 946,605 | |
4.000%, 10/01/41 | | | 2,021,334 | | | | 2,079,976 | |
4.000%, 11/01/41 | | | 822,678 | | | | 846,545 | |
4.000%, 10/01/43 | | | 2,515,065 | | | | 2,586,430 | |
4.000%, 07/01/44 | | | 2,478,658 | | | | 2,541,998 | |
4.000%, 10/01/44 | | | 1,879,916 | | | | 1,927,956 | |
4.000%, 07/01/45 | | | 2,970,883 | | | | 3,036,632 | |
4.000%, 01/01/46 | | | 2,997,679 | | | | 3,064,021 | |
4.000%, 02/01/46 | | | 1,616,684 | | | | 1,652,463 | |
4.000%, 06/01/47 | | | 3,581,061 | | | | 3,654,004 | |
4.000%, 10/01/47 | | | 1,718,014 | | | | 1,753,009 | |
4.000%, 11/01/47 | | | 1,712,853 | | | | 1,747,742 | |
4.000%, 03/01/48 | | | 2,724,687 | | | | 2,780,186 | |
4.000%, 05/01/48 | | | 1,889,251 | | | | 1,926,369 | |
4.000%, 10/01/48 | | | 2,467,654 | | | | 2,517,336 | |
4.000%, 11/01/48 | | | 2,976,562 | | | | 3,035,041 | |
4.500%, 10/01/35 | | | 265,946 | | | | 278,311 | |
4.500%, 06/01/38 | | | 405,514 | | | | 424,368 | |
4.500%, 02/01/39 | | | 310,810 | | | | 325,174 | |
4.500%, 03/01/39 | | | 253,697 | | | | 265,611 | |
4.500%, 04/01/39 | | | 470,504 | | | | 492,598 | |
4.500%, 09/01/39 | | | 510,815 | | | | 534,802 | |
4.500%, 10/01/39 | | | 1,327,588 | | | | 1,389,930 | |
4.500%, 11/01/39 | | | 376,255 | | | | 393,923 | |
4.500%, 01/01/40 | | | 310,882 | | | | 325,480 | |
4.500%, 05/01/40 | | | 509,025 | | | | 532,642 | |
4.500%, 11/01/40 | | | 792,581 | | | | 829,354 | |
4.500%, 02/01/41 | | | 158,505 | | | | 165,772 | |
4.500%, 05/01/41 | | | 452,740 | | | | 473,495 | |
4.500%, 06/01/41 | | | 332,149 | | | | 347,376 | |
4.500%, 12/01/43 | | | 737,017 | | | | 768,112 | |
4.500%, 12/01/45 | | | 928,504 | | | | 965,942 | |
4.500%, 08/01/47 | | | 2,306,246 | | | | 2,388,475 | |
4.500%, 08/01/48 | | | 1,449,804 | | | | 1,501,707 | |
4.500%, 10/01/48 | | | 2,459,193 | | | | 2,547,232 | |
See accompanying notes to financial statements.
BHFTII-6
Brighthouse Funds Trust II
MetLife Aggregate Bond Index Portfolio
Schedule of Investments as of December 31, 2018
U.S. Treasury & Government Agencies—(Continued)
| | | | | | | | |
| Security Description | | Principal
Amount* | | | Value | |
|
| Agency Sponsored Mortgage-Backed—(Continued) | |
| Freddie Mac 30 Yr. Gold Pool | |
5.000%, 10/01/33 | | | 435,809 | | | $ | 464,710 | |
5.000%, 03/01/34 | | | 64,927 | | | | 69,248 | |
5.000%, 08/01/35 | | | 292,626 | | | | 311,258 | |
5.000%, 09/01/35 | | | 120,789 | | | | 128,480 | |
5.000%, 10/01/35 | | | 92,402 | | | | 98,286 | |
5.000%, 01/01/36 | | | 313,403 | | | | 333,359 | |
5.000%, 04/01/38 | | | 221,267 | | | | 235,567 | |
5.000%, 11/01/39 | | | 969,284 | | | | 1,028,328 | |
5.000%, 05/01/40 | | | 1,244,893 | | | | 1,320,988 | |
5.500%, 06/01/34 | | | 184,639 | | | | 198,678 | |
5.500%, 10/01/35 | | | 132,605 | | | | 143,097 | |
5.500%, 12/01/35 | | | 325,834 | | | | 351,617 | |
5.500%, 01/01/36 | | | 254,936 | | | | 275,109 | |
5.500%, 12/01/37 | | | 249,579 | | | | 269,307 | |
5.500%, 04/01/38 | | | 1,069,056 | | | | 1,152,396 | |
5.500%, 07/01/38 | | | 119,047 | | | | 128,328 | |
5.500%, 08/01/38 | | | 326,534 | | | | 351,990 | |
6.000%, 11/01/28 | | | 4,840 | | | | 5,206 | |
6.000%, 12/01/28 | | | 3,821 | | | | 4,139 | |
6.000%, 04/01/29 | | | 1,801 | | | | 1,914 | |
6.000%, 06/01/31 | | | 1,855 | | | | 1,980 | |
6.000%, 07/01/31 | | | 517 | | | | 567 | |
6.000%, 09/01/31 | | | 51,763 | | | | 54,156 | |
6.000%, 11/01/32 | | | 17,955 | | | | 19,662 | |
6.000%, 06/01/34 | | | 65,380 | | | | 69,439 | |
6.000%, 11/01/35 | | | 63,745 | | | | 70,334 | |
6.000%, 02/01/36 | | | 123,702 | | | | 134,348 | |
6.000%, 08/01/36 | | | 31,381 | | | | 34,680 | |
6.000%, 10/01/36 | | | 97,822 | | | | 108,091 | |
6.000%, 11/01/36 | | | 45,805 | | | | 48,714 | |
6.000%, 01/01/37 | | | 45,236 | | | | 49,008 | |
6.000%, 02/01/38 | | | 109,444 | | | | 120,463 | |
6.000%, 11/01/39 | | | 886,600 | | | | 979,026 | |
6.000%, 04/01/40 | | | 304,624 | | | | 336,900 | |
6.500%, 02/01/30 | | | 4,713 | | | | 5,070 | |
6.500%, 08/01/31 | | | 5,725 | | | | 6,403 | |
6.500%, 10/01/31 | | | 6,404 | | | | 6,696 | |
6.500%, 11/01/31 | | | 12,309 | | | | 13,782 | |
6.500%, 03/01/32 | | | 284,420 | | | | 317,611 | |
6.500%, 04/01/32 | | | 216,244 | | | | 241,358 | |
6.500%, 09/01/36 | | | 252,639 | | | | 283,483 | |
6.500%, 11/01/37 | | | 90,123 | | | | 100,123 | |
7.000%, 12/01/27 | | | 825 | | | | 910 | |
7.000%, 11/01/28 | | | 2,316 | | | | 2,573 | |
7.000%, 04/01/29 | | | 2,199 | | | | 2,463 | |
7.000%, 05/01/29 | | | 587 | | | | 634 | |
7.000%, 06/01/29 | | | 5,200 | | | | 5,464 | |
7.000%, 07/01/29 | | | 1,068 | | | | 1,162 | |
7.000%, 01/01/31 | | | 39,872 | | | | 41,249 | |
7.500%, 08/01/24 | | | 6,261 | | | | 6,286 | |
7.500%, 10/01/27 | | | 5,309 | | | | 5,924 | |
7.500%, 10/01/29 | | | 8,051 | | | | 9,186 | |
7.500%, 05/01/30 | | | 10,735 | | | | 11,967 | |
8.000%, 02/01/27 | | | 2,159 | | | | 2,423 | |
8.000%, 10/01/28 | | | 3,936 | | | | 4,417 | |
|
| Agency Sponsored Mortgage-Backed—(Continued) | |
| Freddie Mac Multifamily Structured Pass-Through Certificates (CMO) | |
2.902%, 08/25/20 | | | 454,450 | | | | 452,675 | |
3.060%, 07/25/23 (a) | | | 4,800,000 | | | | 4,816,161 | |
3.117%, 06/25/27 | | | 2,000,000 | | | | 1,972,415 | |
3.187%, 09/25/27 (a) | | | 1,265,000 | | | | 1,250,926 | |
3.194%, 07/25/27 | | | 685,000 | | | | 678,624 | |
3.780%, 10/25/28 (a) | | | 4,000,000 | | | | 4,124,194 | |
3.920%, 09/25/28 (a) | | | 2,900,000 | | | | 3,023,330 | |
Ginnie Mae I 15 Yr. Pool | |
3.000%, 08/15/28 | | | 1,631,193 | | | | 1,634,084 | |
5.000%, 10/15/20 | | | 44,672 | | | | 45,191 | |
5.000%, 01/15/21 | | | 43,610 | | | | 44,049 | |
| Ginnie Mae I 30 Yr. Pool | |
3.000%, 11/15/42 | | | 1,935,817 | | | | 1,917,910 | |
3.000%, 12/15/42 | | | 1,563,381 | | | | 1,548,919 | |
3.000%, 02/15/43 | | | 1,250,000 | | | | 1,238,437 | |
3.000%, 03/15/43 | | | 1,480,596 | | | | 1,468,160 | |
3.000%, 05/15/43 | | | 2,069,512 | | | | 2,052,129 | |
3.000%, 07/15/43 | | | 1,370,014 | | | | 1,358,506 | |
3.500%, 01/15/42 | | | 1,886,403 | | | | 1,912,566 | |
3.500%, 02/15/42 | | | 612,015 | | | | 620,231 | |
3.500%, 03/15/42 | | | 1,343,468 | | | | 1,361,504 | |
3.500%, 05/15/42 | | | 851,434 | | | | 862,865 | |
3.500%, 09/15/42 | | | 1,161,883 | | | | 1,177,482 | |
3.500%, 05/15/43 | | | 1,612,822 | | | | 1,630,125 | |
4.000%, 07/15/39 | | | 1,284,571 | | | | 1,326,687 | |
4.000%, 07/15/40 | | | 765,165 | | | | 790,488 | |
4.000%, 03/15/41 | | | 502,946 | | | | 519,261 | |
4.000%, 10/15/41 | | | 1,083,301 | | | | 1,118,441 | |
4.500%, 01/15/39 | | | 183,015 | | | | 191,343 | |
4.500%, 04/15/39 | | | 606,525 | | | | 634,138 | |
4.500%, 05/15/39 | | | 1,161,435 | | | | 1,214,309 | |
4.500%, 08/15/39 | | | 530,829 | | | | 554,996 | |
4.500%, 01/15/40 | | | 559,605 | | | | 585,081 | |
4.500%, 04/15/40 | | | 589,695 | | | | 617,209 | |
4.500%, 02/15/41 | | | 149,113 | | | | 156,070 | |
4.500%, 04/15/41 | | | 361,868 | | | | 377,517 | |
5.000%, 12/15/35 | | | 202,044 | | | | 214,089 | |
5.000%, 12/15/36 | | | 99,210 | | | | 105,116 | |
5.000%, 01/15/39 | | | 634,892 | | | | 678,681 | |
5.000%, 02/15/39 | | | 115,192 | | | | 123,137 | |
5.000%, 08/15/39 | | | 802,025 | | | | 857,413 | |
5.000%, 09/15/39 | | | 195,529 | | | | 209,032 | |
5.000%, 12/15/39 | | | 409,254 | | | | 437,516 | |
5.000%, 05/15/40 | | | 628,194 | | | | 668,666 | |
5.500%, 03/15/36 | | | 130,452 | | | | 140,066 | |
5.500%, 01/15/37 | | | 208,564 | | | | 223,976 | |
5.500%, 11/15/37 | | | 289,117 | | | | 313,848 | |
5.500%, 09/15/38 | | | 51,504 | | | | 54,221 | |
5.500%, 08/15/39 | | | 744,631 | | | | 815,943 | |
6.000%, 01/15/29 | | | 2,604 | | | | 2,803 | |
6.000%, 01/15/33 | | | 139,337 | | | | 155,325 | |
6.000%, 03/15/35 | | | 147,143 | | | | 165,492 | |
6.000%, 12/15/35 | | | 137,533 | | | | 153,514 | |
6.000%, 06/15/36 | | | 95,881 | | | | 107,100 | |
See accompanying notes to financial statements.
BHFTII-7
Brighthouse Funds Trust II
MetLife Aggregate Bond Index Portfolio
Schedule of Investments as of December 31, 2018
U.S. Treasury & Government Agencies—(Continued)
| | | | | | | | |
| Security Description | | Principal
Amount* | | | Value | |
|
| Agency Sponsored Mortgage-Backed—(Continued) | |
| Ginnie Mae I 30 Yr. Pool | |
6.000%, 09/15/36 | | | 99,743 | | | $ | 111,355 | |
6.000%, 07/15/38 | | | 639,994 | | | | 715,620 | |
6.500%, 05/15/23 | | | 821 | | | | 824 | |
6.500%, 02/15/27 | | | 18,216 | | | | 19,656 | |
6.500%, 07/15/28 | | | 7,563 | | | | 8,199 | |
6.500%, 08/15/28 | | | 7,967 | | | | 8,712 | |
6.500%, 11/15/28 | | | 5,369 | | | | 5,922 | |
6.500%, 12/15/28 | | | 7,848 | | | | 8,327 | |
6.500%, 07/15/29 | | | 1,812 | | | | 1,880 | |
6.500%, 05/15/36 | | | 106,506 | | | | 120,436 | |
7.000%, 01/15/28 | | | 1,126 | | | | 1,235 | |
7.000%, 05/15/28 | | | 6,779 | | | | 7,170 | |
7.000%, 06/15/28 | | | 6,201 | | | | 6,932 | |
7.000%, 10/15/28 | | | 6,328 | | | | 6,961 | |
7.000%, 09/15/29 | | | 1,844 | | | | 1,878 | |
7.000%, 01/15/31 | | | 1,190 | | | | 1,235 | |
7.000%, 03/15/31 | | | 11,006 | | | | 11,450 | |
7.000%, 07/15/31 | | | 273,125 | | | | 312,548 | |
7.000%, 08/15/31 | | | 49,421 | | | | 56,559 | |
7.000%, 02/15/32 | | | 8,090 | | | | 8,215 | |
7.000%, 07/15/32 | | | 13,375 | | | | 15,475 | |
8.000%, 08/15/26 | | | 2,261 | | | | 2,489 | |
8.000%, 09/15/26 | | | 2,174 | | | | 2,370 | |
8.000%, 06/15/29 | | | 19,849 | | | | 21,294 | |
9.000%, 11/15/24 | | | 1,700 | | | | 1,764 | |
| Ginnie Mae II 30 Yr. Pool | |
3.000%, 12/20/42 | | | 1,810,890 | | | | 1,799,456 | |
3.000%, 03/20/43 | | | 2,640,530 | | | | 2,617,127 | |
3.000%, 12/20/44 | | | 2,294,575 | | | | 2,271,078 | |
3.000%, 04/20/45 | | | 2,151,255 | | | | 2,126,420 | |
3.000%, 08/20/45 | | | 3,253,254 | | | | 3,215,697 | |
3.000%, 11/20/45 | | | 1,850,244 | | | | 1,828,884 | |
3.000%, 01/20/46 | | | 3,242,402 | | | | 3,204,970 | |
3.000%, 09/20/46 | | | 3,741,427 | | | | 3,689,094 | |
3.000%, 10/20/46 | | | 3,803,879 | | | | 3,750,672 | |
3.000%, 11/20/46 | | | 3,948,183 | | | | 3,892,958 | |
3.000%, 01/20/47 | | | 3,998,368 | | | | 3,942,440 | |
3.000%, 04/20/47 | | | 1,632,482 | | | | 1,607,793 | |
3.000%, 02/20/48 | | | 2,930,887 | | | | 2,886,562 | |
3.500%, 12/20/41 | | | 1,098,115 | | | | 1,115,594 | |
3.500%, 03/20/42 | | | 2,091,747 | | | | 2,125,702 | |
3.500%, 08/20/42 | | | 1,065,429 | | | | 1,082,723 | |
3.500%, 01/20/43 | | | 3,116,878 | | | | 3,167,473 | |
3.500%, 04/20/43 | | | 1,249,907 | | | | 1,268,495 | |
3.500%, 05/20/43 | | | 2,149,645 | | | | 2,181,613 | |
3.500%, 07/20/44 | | | 2,761,456 | | | | 2,793,649 | |
3.500%, 02/20/45 | | | 2,991,514 | | | | 3,026,390 | |
3.500%, 06/20/45 | | | 1,913,897 | | | | 1,934,388 | |
3.500%, 08/20/45 | | | 4,453,036 | | | | 4,500,712 | |
3.500%, 09/20/45 | | | 5,133,303 | | | | 5,188,262 | |
3.500%, 10/20/45 | | | 3,035,816 | | | | 3,068,319 | |
3.500%, 12/20/45 | | | 2,694,550 | | | | 2,723,399 | |
3.500%, 01/20/46 | | | 2,681,911 | | | | 2,710,625 | |
3.500%, 02/20/46 | | | 2,215,704 | | | | 2,239,427 | |
3.500%, 06/20/46 | | | 2,594,555 | | | | 2,617,800 | |
|
| Agency Sponsored Mortgage-Backed—(Continued) | |
| Ginnie Mae II 30 Yr. Pool | |
3.500%, 02/20/47 | | | 4,263,399 | | | | 4,301,595 | |
3.500%, 03/20/47 | | | 3,856,663 | | | | 3,885,329 | |
3.500%, 06/20/47 | | | 4,951,476 | | | | 4,988,280 | |
3.500%, 09/20/47 | | | 1,765,700 | | | | 1,778,825 | |
3.500%, 12/20/47 | | | 8,316,572 | | | | 8,378,390 | |
3.500%, 03/20/48 | | | 3,344,932 | | | | 3,369,596 | |
3.500%, 10/20/48 | | | 995,027 | | | | 1,002,364 | |
4.000%, 11/20/40 | | | 1,043,000 | | | | 1,077,758 | |
4.000%, 12/20/40 | | | 1,236,727 | | | | 1,277,941 | |
4.000%, 05/20/43 | | | 1,997,523 | | | | 2,062,580 | |
4.000%, 11/20/43 | | | 746,144 | | | | 770,445 | |
4.000%, 02/20/44 | | | 2,654,293 | | | | 2,740,740 | |
4.000%, 04/20/44 | | | 1,047,700 | | | | 1,080,297 | |
4.000%, 05/20/44 | | | 1,275,127 | | | | 1,314,800 | |
4.000%, 09/20/44 | | | 1,987,131 | | | | 2,048,957 | |
4.000%, 10/20/44 | | | 2,841,061 | | | | 2,929,456 | |
4.000%, 11/20/44 | | | 555,399 | | | | 572,680 | |
4.000%, 10/20/45 | | | 2,300,720 | | | | 2,367,618 | |
4.000%, 11/20/45 | | | 1,207,967 | | | | 1,243,091 | |
4.000%, 02/20/47 | | | 3,119,095 | | | | 3,205,554 | |
4.000%, 03/20/47 | | | 659,535 | | | | 677,817 | |
4.000%, 04/20/47 | | | 2,696,595 | | | | 2,764,661 | |
4.000%, 05/20/47 | | | 2,907,411 | | | | 2,980,798 | |
4.000%, 09/20/47 | | | 2,508,382 | | | | 2,571,697 | |
4.000%, 07/20/48 | | | 2,359,707 | | | | 2,418,520 | |
4.000%, 08/20/48 | | | 1,643,987 | | | | 1,684,961 | |
4.000%, 09/20/48 | | | 2,977,743 | | | | 3,051,960 | |
4.000%, 11/20/48 | | | 1,496,839 | | | | 1,534,146 | |
4.500%, 08/20/40 | | | 875,210 | | | | 916,562 | |
4.500%, 12/20/40 | | | 561,196 | | | | 587,711 | |
4.500%, 04/20/41 | | | 482,150 | | | | 504,572 | |
4.500%, 03/20/42 | | | 403,288 | | | | 422,042 | |
4.500%, 10/20/43 | | | 607,259 | | | | 632,875 | |
4.500%, 02/20/44 | | | 1,213,198 | | | | 1,264,375 | |
4.500%, 04/20/45 | | | 1,117,106 | | | | 1,164,229 | |
4.500%, 03/20/47 | | | 1,553,791 | | | | 1,616,552 | |
4.500%, 11/20/47 | | | 1,678,936 | | | | 1,740,712 | |
4.500%, 08/20/48 | | | 8,109,534 | | | | 8,397,725 | |
5.000%, 08/20/40 | | | 397,452 | | | | 421,329 | |
5.000%, 10/20/40 | | | 413,962 | | | | 438,830 | |
5.000%, 06/20/44 | | | 928,977 | | | | 984,785 | |
5.000%, 10/20/48 | | | 2,490,592 | | | | 2,597,321 | |
6.500%, 06/20/31 | | | 16,263 | | | | 18,272 | |
6.500%, 11/20/38 | | | 336,892 | | | | 380,083 | |
7.500%, 02/20/28 | | | 1,703 | | | | 1,893 | |
| | | | | | | | |
| | | | | | | 719,882,171 | |
| | | | | | | | |
|
| Federal Agencies—1.4% | |
Federal Home Loan Bank
1.750%, 06/12/20 | | | 12,700,000 | | | | 12,546,711 | |
| Federal Home Loan Mortgage Corp. | |
1.125%, 08/12/21 (b) | | | 5,200,000 | | | | 5,022,264 | |
1.375%, 05/01/20 (b) | | | 2,645,000 | | | | 2,604,161 | |
See accompanying notes to financial statements.
BHFTII-8
Brighthouse Funds Trust II
MetLife Aggregate Bond Index Portfolio
Schedule of Investments as of December 31, 2018
U.S. Treasury & Government Agencies—(Continued)
| | | | | | | | |
| Security Description | | Principal
Amount* | | | Value | |
|
| Federal Agencies—(Continued) | |
| Federal National Mortgage Association | |
2.125%, 04/24/26 | | | 3,500,000 | | | $ | 3,339,105 | |
2.375%, 01/19/23 (b) | | | 1,600,000 | | | | 1,587,600 | |
2.625%, 09/06/24 | | | 2,000,000 | | | | 1,991,480 | |
6.625%, 11/15/30 | | | 2,450,000 | | | | 3,291,502 | |
Tennessee Valley Authority
5.250%, 09/15/39 (b) | | | 3,350,000 | | | | 4,193,999 | |
| | | | | | | | |
| | | | | | | 34,576,822 | |
| | | | | | | | |
|
| U.S. Treasury—38.4% | |
| U.S. Treasury Bonds | |
2.250%, 08/15/46 | | | 3,000,000 | | | | 2,563,562 | |
2.500%, 02/15/45 | | | 7,400,000 | | | | 6,703,143 | |
2.500%, 02/15/46 | | | 8,200,000 | | | | 7,402,909 | |
2.500%, 05/15/46 | | | 4,800,000 | | | | 4,328,956 | |
2.750%, 08/15/42 | | | 2,020,000 | | | | 1,933,574 | |
2.750%, 11/15/42 | | | 3,200,000 | | | | 3,059,319 | |
2.750%, 08/15/47 | | | 3,000,000 | | | | 2,841,635 | |
2.750%, 11/15/47 | | | 7,300,000 | | | | 6,910,218 | |
2.875%, 05/15/43 | | | 5,760,000 | | | | 5,623,473 | |
2.875%, 08/15/45 | | | 5,000,000 | | | | 4,869,553 | |
2.875%, 11/15/46 | | | 4,600,000 | | | | 4,473,182 | |
3.000%, 11/15/44 | | | 11,000,000 | | | | 10,978,805 | |
3.000%, 05/15/45 | | | 4,500,000 | | | | 4,489,385 | |
3.000%, 11/15/45 | | | 7,700,000 | | | | 7,681,449 | |
3.000%, 02/15/47 | | | 3,000,000 | | | | 2,991,714 | |
3.000%, 05/15/47 | | | 5,800,000 | | | | 5,775,940 | |
3.000%, 08/15/48 (b) | | | 13,200,000 | | | | 13,138,947 | |
3.125%, 11/15/41 | | | 3,000,000 | | | | 3,071,194 | |
3.125%, 02/15/42 | | | 1,800,000 | | | | 1,842,523 | |
3.125%, 02/15/43 | | | 3,270,000 | | | | 3,336,010 | |
3.125%, 08/15/44 | | | 4,700,000 | | | | 4,796,421 | |
3.375%, 05/15/44 | | | 3,000,000 | | | | 3,193,712 | |
3.500%, 02/15/39 | | | 2,080,000 | | | | 2,274,919 | |
3.625%, 08/15/43 | | | 2,600,000 | | | | 2,877,211 | |
3.625%, 02/15/44 | | | 8,020,000 | | | | 8,884,745 | |
3.750%, 08/15/41 | | | 1,830,000 | | | | 2,064,007 | |
3.750%, 11/15/43 | | | 2,600,000 | | | | 2,936,076 | |
3.875%, 08/15/40 | | | 5,380,000 | | | | 6,179,035 | |
4.250%, 05/15/39 (b) | | | 2,500,000 | | | | 3,016,472 | |
4.250%, 11/15/40 (b) | | | 4,280,000 | | | | 5,172,509 | |
4.375%, 11/15/39 (b) | | | 3,900,000 | | | | 4,781,624 | |
4.375%, 05/15/40 | | | 3,220,000 | | | | 3,953,846 | |
4.375%, 05/15/41 | | | 1,350,000 | | | | 1,661,486 | |
4.500%, 02/15/36 (b) | | | 1,600,000 | | | | 1,972,234 | |
4.500%, 05/15/38 (b) | | | 4,950,000 | | | | 6,160,797 | |
5.000%, 05/15/37 | | | 1,560,000 | | | | 2,047,338 | |
5.250%, 02/15/29 | | | 750,000 | | | | 916,845 | |
5.375%, 02/15/31 | | | 3,675,000 | | | | 4,670,293 | |
6.125%, 11/15/27 | | | 1,750,000 | | | | 2,223,518 | |
6.250%, 08/15/23 | | | 7,700,000 | | | | 8,945,610 | |
6.250%, 05/15/30 | | | 2,500,000 | | | | 3,354,654 | |
6.375%, 08/15/27 (b) | | | 2,900,000 | | | | 3,725,280 | |
6.500%, 11/15/26 | | | 2,500,000 | | | | 3,185,471 | |
7.125%, 02/15/23 | | | 11,125,000 | | | | 13,117,587 | |
|
| U.S. Treasury—(Continued) | |
| U.S. Treasury Bonds | |
7.250%, 08/15/22 | | | 6,120,000 | | | | 7,119,518 | |
7.875%, 02/15/21 (b) | | | 4,450,000 | | | | 4,940,459 | |
8.000%, 11/15/21 | | | 2,920,000 | | | | 3,362,886 | |
8.125%, 08/15/21 | | | 1,250,000 | | | | 1,427,727 | |
8.750%, 08/15/20 | | | 1,000,000 | | | | 1,097,283 | |
U.S. Treasury Notes | |
1.125%, 02/28/21 | | | 10,100,000 | | | | 9,810,354 | |
1.125%, 06/30/21 | | | 14,200,000 | | | | 13,745,278 | |
1.125%, 07/31/21 | | | 12,300,000 | | | | 11,886,300 | |
1.125%, 08/31/21 (b) | | | 6,300,000 | | | | 6,081,974 | |
1.250%, 01/31/20 | | | 3,000,000 | | | | 2,956,501 | |
1.250%, 03/31/21 | | | 6,100,000 | | | | 5,939,128 | |
1.250%, 07/31/23 | | | 8,600,000 | | | | 8,135,113 | |
1.375%, 01/31/20 | | | 11,100,000 | | | | 10,954,541 | |
1.375%, 03/31/20 | | | 16,000,000 | | | | 15,765,728 | |
1.375%, 04/30/20 | | | 11,000,000 | | | | 10,831,615 | |
1.375%, 08/31/20 | | | 14,900,000 | | | | 14,620,489 | |
1.500%, 08/15/20 (b) | | | 2,000,000 | | | | 1,967,257 | |
1.500%, 02/28/23 (b) | | | 7,200,000 | | | | 6,917,991 | |
1.500%, 08/15/26 (b) | | | 10,600,000 | | | | 9,779,791 | |
1.625%, 11/30/20 | | | 5,000,000 | | | | 4,917,721 | |
1.625%, 11/15/22 | | | 5,000,000 | | | | 4,840,965 | |
1.625%, 05/31/23 | | | 7,900,000 | | | | 7,611,790 | |
1.625%, 02/15/26 | | | 8,300,000 | | | | 7,770,875 | |
1.625%, 05/15/26 | | | 10,900,000 | | | | 10,180,165 | |
1.750%, 10/31/20 | | | 10,000,000 | | | | 9,862,769 | |
1.750%, 12/31/20 (b) | | | 14,800,000 | | | | 14,591,727 | |
1.750%, 11/30/21 | | | 11,000,000 | | | | 10,779,858 | |
1.750%, 02/28/22 | | | 9,000,000 | | | | 8,804,244 | |
1.750%, 05/15/22 | | | 8,000,000 | | | | 7,812,312 | |
1.750%, 05/31/22 | | | 5,100,000 | | | | 4,979,220 | |
1.750%, 05/15/23 (b) | | | 22,720,000 | | | | 22,017,932 | |
1.875%, 02/28/22 | | | 15,000,000 | | | | 14,728,563 | |
1.875%, 03/31/22 | | | 11,000,000 | | | | 10,795,303 | |
1.875%, 04/30/22 | | | 12,100,000 | | | | 11,869,328 | |
1.875%, 07/31/22 | | | 11,100,000 | | | | 10,871,444 | |
1.875%, 08/31/22 | | | 7,400,000 | | | | 7,242,256 | |
1.875%, 09/30/22 | | | 3,000,000 | | | | 2,935,106 | |
2.000%, 11/30/20 | | | 14,800,000 | | | | 14,663,148 | |
2.000%, 02/28/21 | | | 5,000,000 | | | | 4,948,232 | |
2.000%, 10/31/21 | | | 6,000,000 | | | | 5,923,302 | |
2.000%, 02/15/22 | | | 3,800,000 | | | | 3,746,702 | |
2.000%, 11/30/22 | | | 14,700,000 | | | | 14,434,833 | |
2.000%, 02/15/23 | | | 6,900,000 | | | | 6,766,719 | |
2.000%, 05/31/24 | | | 8,400,000 | | | | 8,174,707 | |
2.000%, 06/30/24 | | | 7,300,000 | | | | 7,099,769 | |
2.000%, 02/15/25 (b) | | | 16,300,000 | | | | 15,770,470 | |
2.000%, 08/15/25 | | | 14,100,000 | | | | 13,595,657 | |
2.000%, 11/15/26 | | | 7,300,000 | | | | 6,969,253 | |
2.125%, 08/31/20 | | | 5,800,000 | | | | 5,761,051 | |
2.125%, 06/30/21 | | | 12,000,000 | | | | 11,902,682 | |
2.125%, 08/15/21 (b) | | | 8,710,000 | | | | 8,630,554 | |
2.125%, 12/31/21 | | | 11,900,000 | | | | 11,785,650 | |
2.125%, 12/31/22 | | | 7,200,000 | | | | 7,099,408 | |
2.125%, 02/29/24 | | | 12,000,000 | | | | 11,773,324 | |
See accompanying notes to financial statements.
BHFTII-9
Brighthouse Funds Trust II
MetLife Aggregate Bond Index Portfolio
Schedule of Investments as of December 31, 2018
U.S. Treasury & Government Agencies—(Continued)
| | | | | | | | |
| Security Description | | Principal
Amount* | | | Value | |
|
| U.S. Treasury—(Continued) | |
| U.S. Treasury Notes | |
2.125%, 03/31/24 | | | 6,200,000 | | | $ | 6,078,819 | |
2.125%, 05/15/25 | | | 16,400,000 | | | | 15,961,631 | |
2.250%, 02/15/21 | | | 11,000,000 | | | | 10,942,439 | |
2.250%, 07/31/21 (b) | | | 13,000,000 | | | | 12,928,900 | |
2.250%, 11/15/24 | | | 18,100,000 | | | | 17,793,021 | |
2.250%, 11/15/25 | | | 10,800,000 | | | | 10,563,409 | |
2.250%, 02/15/27 | | | 9,900,000 | | | | 9,614,993 | |
2.250%, 08/15/27 | | | 2,100,000 | | | | 2,032,466 | |
2.250%, 11/15/27 | | | 7,600,000 | | | | 7,341,806 | |
2.375%, 12/31/20 | | | 7,600,000 | | | | 7,583,421 | |
2.375%, 04/15/21 | | | 5,000,000 | | | | 4,987,928 | |
2.375%, 08/15/24 | | | 15,900,000 | | | | 15,757,205 | |
2.375%, 05/15/27 (b) | | | 8,000,000 | | | | 7,833,157 | |
2.500%, 06/30/20 | | | 7,000,000 | | | | 6,994,599 | |
2.500%, 08/15/23 | | | 14,400,000 | | | | 14,398,207 | |
2.500%, 05/15/24 | | | 10,000,000 | | | | 9,983,132 | |
2.625%, 08/15/20 | | | 6,000,000 | | | | 6,008,197 | |
2.625%, 11/15/20 | | | 4,000,000 | | | | 4,007,180 | |
2.750%, 09/30/20 | | | 16,000,000 | | | | 16,060,659 | |
2.750%, 11/15/23 | | | 19,335,000 | | | | 19,549,536 | |
2.750%, 02/15/24 | | | 5,600,000 | | | | 5,660,880 | |
2.750%, 02/15/28 (b) | | | 9,100,000 | | | | 9,147,452 | |
2.875%, 05/15/28 (b) | | | 6,000,000 | | | | 6,092,245 | |
2.875%, 08/15/28 | | | 4,100,000 | | | | 4,163,440 | |
3.500%, 05/15/20 | | | 25,390,000 | | | | 25,702,197 | |
3.625%, 02/15/20 | | | 9,190,000 | | | | 9,289,237 | |
3.625%, 02/15/21 | | | 1,500,000 | | | | 1,534,717 | |
| | | | | | | | |
| | | | | | | 953,135,026 | |
| | | | | | | | |
Total U.S. Treasury & Government Agencies
(Cost $1,709,929,868) | | | | | | | 1,707,594,019 | |
| | | | | | | | |
|
| Corporate Bonds & Notes—26.4% | |
|
| Aerospace/Defense—0.5% | |
Boeing Co. (The)
7.250%, 06/15/25 | | | 460,000 | | | | 553,969 | |
Lockheed Martin Corp.
3.550%, 01/15/26 | | | 1,000,000 | | | | 991,090 | |
4.090%, 09/15/52 | | | 3,454,000 | | | | 3,234,153 | |
Northrop Grumman Corp.
3.250%, 01/15/28 | | | 1,100,000 | | | | 1,027,741 | |
Northrop Grumman Systems Corp.
7.750%, 02/15/31 | | | 515,000 | | | | 677,838 | |
Raytheon Co.
3.125%, 10/15/20 (b) | | | 1,000,000 | | | | 1,002,580 | |
United Technologies Corp.
3.125%, 05/04/27 | | | 2,000,000 | | | | 1,850,260 | |
4.500%, 06/01/42 | | | 2,645,000 | | | | 2,513,755 | |
7.500%, 09/15/29 (b) | | | 200,000 | | | | 251,474 | |
| | | | | | | | |
| | | | | | | 12,102,860 | |
| | | | | | | | |
|
| Agriculture—0.4% | |
Altria Group, Inc.
4.000%, 01/31/24 | | | 1,000,000 | | | | 982,690 | |
Archer-Daniels-Midland Co.
4.479%, 03/01/21 (b) | | | 2,000,000 | | | | 2,056,000 | |
Philip Morris International, Inc.
3.250%, 11/10/24 | | | 3,000,000 | | | | 2,906,610 | |
Reynolds American, Inc.
4.450%, 06/12/25 | | | 3,800,000 | | | | 3,654,992 | |
| | | | | | | | |
| | | | | | | 9,600,292 | |
| | | | | | | | |
|
| Auto Manufacturers—0.6% | |
American Honda Finance Corp.
2.300%, 09/09/26 | | | 1,100,000 | | | | 999,229 | |
Daimler Finance North America LLC
8.500%, 01/18/31 | | | 1,050,000 | | | | 1,424,682 | |
Ford Motor Co.
7.450%, 07/16/31 | | | 2,200,000 | | | | 2,279,068 | |
Ford Motor Credit Co. LLC
2.597%, 11/04/19 | | | 3,000,000 | | | | 2,965,620 | |
General Motors Financial Co., Inc.
2.400%, 05/09/19 | | | 2,500,000 | | | | 2,488,325 | |
Toyota Motor Credit Corp.
3.300%, 01/12/22 | | | 4,000,000 | | | | 4,017,240 | |
| | | | | | | | |
| | | | | | | 14,174,164 | |
| | | | | | | | |
|
| Banks—6.1% | |
Bank of America Corp. | | | | | | | | |
2.625%, 04/19/21 (b) | | | 1,000,000 | | | | 986,080 | |
3.300%, 01/11/23 (b) | | | 4,075,000 | | | | 4,015,057 | |
4.100%, 07/24/23 | | | 2,905,000 | | | | 2,952,439 | |
4.200%, 08/26/24 | | | 3,000,000 | | | | 2,979,360 | |
5.875%, 02/07/42 | | | 3,000,000 | | | | 3,468,660 | |
Bank of Montreal
1.900%, 08/27/21 | | | 1,000,000 | | | | 968,700 | |
Bank of Nova Scotia (The)
2.700%, 03/07/22 | | | 3,000,000 | | | | 2,935,800 | |
Barclays plc
4.375%, 01/12/26 | | | 3,500,000 | | | | 3,343,095 | |
BNP Paribas S.A.
5.000%, 01/15/21 | | | 3,225,000 | | | | 3,331,135 | |
Branch Banking & Trust Co.
2.850%, 04/01/21 | | | 3,400,000 | | | | 3,375,214 | |
Capital One N.A.
2.250%, 09/13/21 (b) | | | 3,000,000 | | | | 2,889,930 | |
| Citigroup, Inc. | | | | | | |
2.700%, 03/30/21 (b) | | | 2,000,000 | | | | 1,968,540 | |
3.200%, 10/21/26 | | | 1,700,000 | | | | 1,568,709 | |
4.750%, 05/18/46 | | | 4,400,000 | | | | 4,079,900 | |
5.375%, 08/09/20 | | | 2,200,000 | | | | 2,265,318 | |
Cooperatieve Rabobank UA
5.250%, 05/24/41 | | | 1,640,000 | | | | 1,803,426 | |
Credit Suisse AG
4.375%, 08/05/20 | | | 2,611,000 | | | | 2,653,768 | |
Credit Suisse Group Funding Guernsey, Ltd.
3.800%, 09/15/22 | | | 1,000,000 | | | | 995,120 | |
See accompanying notes to financial statements.
BHFTII-10
Brighthouse Funds Trust II
MetLife Aggregate Bond Index Portfolio
Schedule of Investments as of December 31, 2018
Corporate Bonds & Notes—(Continued)
| | | | | | | | |
| Security Description | | Principal
Amount* | | | Value | |
|
| Banks—(Continued) | |
Deutsche Bank AG
4.250%, 10/14/21 | | | 900,000 | | | $ | 886,014 | |
Fifth Third Bancorp
8.250%, 03/01/38 | | | 1,175,000 | | | | 1,560,835 | |
Goldman Sachs Group, Inc. (The) | | | | | | | | |
3.850%, 01/26/27 | | | 1,900,000 | | | | 1,790,332 | |
4.000%, 03/03/24 | | | 2,000,000 | | | | 1,974,920 | |
4.017%, 3M LIBOR + 1.373%, 10/31/38 (a) | | | 2,000,000 | | | | 1,757,160 | |
6.000%, 06/15/20 | | | 2,000,000 | | | | 2,069,760 | |
6.125%, 02/15/33 | | | 2,075,000 | | | | 2,354,751 | |
HSBC Holdings plc | | | | | | | | |
5.100%, 04/05/21 | | | 2,556,000 | | | | 2,639,862 | |
5.250%, 03/14/44 | | | 900,000 | | | | 894,834 | |
6.500%, 09/15/37 | | | 905,000 | | | | 1,034,478 | |
HSBC USA, Inc.
2.350%, 03/05/20 | | | 3,000,000 | | | | 2,970,630 | |
JPMorgan Chase & Co. | | | | | | | | |
2.950%, 10/01/26 | | | 2,000,000 | | | | 1,845,920 | |
3.250%, 09/23/22 | | | 2,850,000 | | | | 2,829,366 | |
3.882%, 3M LIBOR + 1.360%, 07/24/38 (a) | | | 2,100,000 | | | | 1,900,857 | |
3.900%, 07/15/25 | | | 4,700,000 | | | | 4,664,280 | |
4.950%, 03/25/20 | | | 2,650,000 | | | | 2,706,392 | |
KeyBank N.A.
3.300%, 06/01/25 (b) | | | 3,800,000 | | | | 3,711,346 | |
KFW | | | | | | | | |
1.500%, 02/06/19 | | | 2,500,000 | | | | 2,497,650 | |
1.625%, 03/15/21 | | | 5,500,000 | | | | 5,387,140 | |
2.375%, 08/25/21 | | | 1,945,000 | | | | 1,933,486 | |
2.750%, 09/08/20 (b) | | | 2,300,000 | | | | 2,304,301 | |
Landwirtschaftliche Rentenbank
| |
2.000%, 01/13/25 | | | 3,500,000 | | | | 3,350,130 | |
Lloyds Bank plc
6.375%, 01/21/21 | | | 1,500,000 | | | | 1,582,755 | |
Mitsubishi UFJ Financial Group, Inc.
2.998%, 02/22/22 (b) | | | 1,900,000 | | | | 1,873,020 | |
Morgan Stanley | |
4.300%, 01/27/45 | | | 2,900,000 | | | | 2,741,051 | |
4.350%, 09/08/26 | | | 3,800,000 | | | | 3,685,848 | |
5.625%, 09/23/19 | | | 1,900,000 | | | | 1,928,158 | |
7.250%, 04/01/32 | | | 1,850,000 | | | | 2,334,977 | |
National Australia Bank, Ltd.
2.800%, 01/10/22 | | | 1,900,000 | | | | 1,866,047 | |
Oesterreichische Kontrollbank AG
2.875%, 03/13/23 | | | 1,300,000 | | | | 1,309,269 | |
PNC Bank N.A.
2.950%, 02/23/25 | | | 4,100,000 | | | | 3,938,706 | |
Royal Bank of Scotland Group plc | |
3.498%, 3M LIBOR + 1.480%, 05/15/23 (a) | | | 1,000,000 | | | | 959,200 | |
3.875%, 09/12/23 | | | 1,000,000 | | | | 958,550 | |
Santander UK plc
2.375%, 03/16/20 (b) | | | 2,000,000 | | | | 1,975,940 | |
Sumitomo Mitsui Financial Group, Inc.
2.632%, 07/14/26 | | | 4,700,000 | | | | 4,305,717 | |
Toronto-Dominion Bank (The)
3.500%, 07/19/23 (b) | | | 3,000,000 | | | | 3,019,290 | |
|
| Banks—(Continued) | |
U.S. Bancorp
3.600%, 09/11/24 | | | 3,000,000 | | | | 2,986,350 | |
UBS AG
4.875%, 08/04/20 | | | 3,500,000 | | | | 3,580,255 | |
Wells Fargo & Co. | |
2.600%, 07/22/20 | | | 4,000,000 | | | | 3,959,440 | |
3.000%, 01/22/21 (b) | | | 3,400,000 | | | | 3,382,796 | |
3.000%, 10/23/26 | | | 2,000,000 | | | | 1,851,420 | |
Wells Fargo Bank N.A.
5.950%, 08/26/36 | | | 1,900,000 | | | | 2,188,895 | |
Westpac Banking Corp.
2.800%, 01/11/22 | | | 2,000,000 | | | | 1,963,940 | |
| | | | | | | | |
| | | | | | | 152,036,319 | |
| | | | | | | | |
|
| Beverages—0.6% | |
Anheuser-Busch InBev Finance, Inc. | |
3.650%, 02/01/26 | | | 2,000,000 | | | | 1,883,640 | |
4.900%, 02/01/46 | | | 5,300,000 | | | | 4,879,392 | |
Anheuser-Busch InBev Worldwide, Inc.
4.439%, 10/06/48 | | | 1,165,000 | | | | 1,005,092 | |
Coca-Cola Co. (The) | |
3.150%, 11/15/20 (b) | | | 280,000 | | | | 281,395 | |
3.200%, 11/01/23 (b) | | | 3,000,000 | | | | 3,010,650 | |
Keurig Dr Pepper, Inc.
4.057%, 05/25/23 (144A) | | | 1,000,000 | | | | 996,990 | |
PepsiCo, Inc.
3.600%, 03/01/24 | | | 3,975,000 | | | | 4,034,267 | |
| | | | | | | | |
| | | | | | | 16,091,426 | |
| | | | | | | | |
|
| Biotechnology—0.4% | |
Amgen, Inc. | |
2.600%, 08/19/26 (b) | | | 3,200,000 | | | | 2,907,776 | |
3.625%, 05/22/24 | | | 1,200,000 | | | | 1,196,256 | |
Celgene Corp.
| |
4.625%, 05/15/44 | | | 2,000,000 | | | | 1,766,280 | |
Gilead Sciences, Inc.
3.650%, 03/01/26 | | | 3,000,000 | | | | 2,944,410 | |
| | | | | | | | |
| | | | | | | 8,814,722 | |
| | | | | | | | |
|
| Chemicals—0.4% | |
Dow Chemical Co. (The) | |
4.250%, 11/15/20 | | | 2,750,000 | | | | 2,788,005 | |
9.400%, 05/15/39 | | | 650,000 | | | | 930,579 | |
LyondellBasell Industries NV
4.625%, 02/26/55 | | | 1,400,000 | | | | 1,180,088 | |
Nutrien, Ltd.
4.875%, 03/30/20 | | | 970,000 | | | | 987,615 | |
Praxair, Inc.
3.000%, 09/01/21 (b) | | | 3,950,000 | | | | 3,950,672 | |
| | | | | | | | |
| | | | | | | 9,836,959 | |
| | | | | | | | |
|
| Computers—0.6% | |
| Apple, Inc. | |
2.250%, 02/23/21 (b) | | | 3,000,000 | | | | 2,965,890 | |
See accompanying notes to financial statements.
BHFTII-11
Brighthouse Funds Trust II
MetLife Aggregate Bond Index Portfolio
Schedule of Investments as of December 31, 2018
Corporate Bonds & Notes—(Continued)
| | | | | | | | |
| Security Description | | Principal
Amount* | | | Value | |
|
| Computers—(Continued) | |
| Apple, Inc. | |
2.400%, 05/03/23 | | | 2,072,000 | | | $ | 2,004,225 | |
4.450%, 05/06/44 | | | 2,944,000 | | | | 3,037,560 | |
4.650%, 02/23/46 | | | 2,700,000 | | | | 2,854,710 | |
Hewlett Packard Enterprise Co.
4.900%, 10/15/25 (b) | | | 1,400,000 | | | | 1,413,944 | |
International Business Machines Corp. | |
4.000%, 06/20/42 (b) | | | 3,200,000 | | | | 2,899,744 | |
8.375%, 11/01/19 | | | 425,000 | | | | 443,670 | |
| | | | | | | | |
| | | | | | | 15,619,743 | |
| | | | | | | | |
|
| Cosmetics/Personal Care—0.3% | |
Procter & Gamble Co. (The)
2.300%, 02/06/22 (b) | | | 3,600,000 | | | | 3,541,680 | |
Unilever Capital Corp. | |
2.900%, 05/05/27 | | | 1,500,000 | | | | 1,427,955 | |
5.900%, 11/15/32 | | | 1,500,000 | | | | 1,832,760 | |
| | | | | | | | |
| | | | | | | 6,802,395 | |
| | | | | | | | |
|
| Diversified Financial Services—0.6% | |
AerCap Ireland Capital DAC / AerCap Global Aviation Trust
3.950%, 02/01/22 (b) | | | 1,800,000 | | | | 1,764,540 | |
American Express Credit Corp.
3.300%, 05/03/27 (b) | | | 3,000,000 | | | | 2,915,520 | |
BlackRock, Inc.
3.500%, 03/18/24 | | | 3,800,000 | | | | 3,842,104 | |
GE Capital International Funding Co.
4.418%, 11/15/35 | | | 2,700,000 | | | | 2,262,870 | |
Nomura Holdings, Inc.
6.700%, 03/04/20 | | | 1,325,000 | | | | 1,376,490 | |
Visa, Inc.
2.800%, 12/14/22 (b) | | | 3,000,000 | | | | 2,965,110 | |
| | | | | | | | |
| | | | | | | 15,126,634 | |
| | | | | | | | |
|
| Electric—1.7% | |
Connecticut Light & Power Co. (The)
4.000%, 04/01/48 (b) | | | 1,000,000 | | | | 983,330 | |
Consolidated Edison Co. of New York, Inc.
| |
3.950%, 03/01/43 | | | 3,070,000 | | | | 2,845,644 | |
Dominion Energy, Inc.
3.900%, 10/01/25 | | | 1,900,000 | | | | 1,888,220 | |
DTE Electric Co.
3.700%, 03/15/45 | | | 4,000,000 | | | | 3,717,800 | |
Duke Energy Carolinas LLC
5.300%, 02/15/40 | | | 2,000,000 | | | | 2,270,100 | |
Duke Energy Corp.
3.050%, 08/15/22 | | | 4,000,000 | | | | 3,921,600 | |
Exelon Corp. | |
3.400%, 04/15/26 | | | 3,000,000 | | | | 2,843,190 | |
5.625%, 06/15/35 | | | 1,500,000 | | | | 1,629,795 | |
FirstEnergy Corp.
3.900%, 07/15/27 | | | 2,000,000 | | | | 1,937,360 | |
Florida Power & Light Co.
5.950%, 02/01/38 | | | 1,700,000 | | | | 2,094,094 | |
|
| Electric—(Continued) | |
Georgia Power Co.
4.300%, 03/15/42 | | | 2,000,000 | | | | 1,843,440 | |
Northern States Power Co.
6.250%, 06/01/36 | | | 2,200,000 | | | | 2,750,242 | |
Ohio Power Co.
5.375%, 10/01/21 | | | 1,640,000 | | | | 1,734,956 | |
Oncor Electric Delivery Co. LLC
7.000%, 05/01/32 | | | 950,000 | | | | 1,231,285 | |
Pacific Gas & Electric Co.
5.400%, 01/15/40 | | | 3,320,000 | | | | 2,932,656 | |
PacifiCorp
2.950%, 02/01/22 | | | 2,800,000 | | | | 2,773,260 | |
PPL Capital Funding, Inc.
3.400%, 06/01/23 (b) | | | 2,000,000 | | | | 1,960,380 | |
PSEG Power LLC
8.625%, 04/15/31 | | | 1,000,000 | | | | 1,301,170 | |
Sempra Energy
3.400%, 02/01/28 | | | 2,100,000 | | | | 1,921,626 | |
| | | | | | | | |
| | | | | | | 42,580,148 | |
| | | | | | | | |
|
| Electrical Components & Equipment—0.1% | |
Emerson Electric Co.
4.875%, 10/15/19 (b) | | | 1,800,000 | | | | 1,824,786 | |
| | | | | | | | |
|
| Environmental Control—0.1% | |
Waste Management, Inc.
7.000%, 07/15/28 | | | 1,265,000 | | | | 1,527,057 | |
| | | | | | | | |
|
| Food—0.4% | |
General Mills, Inc.
4.200%, 04/17/28 (b) | | | 1,500,000 | | | | 1,469,310 | |
Kraft Heinz Foods Co.
3.000%, 06/01/26 (b) | | | 3,300,000 | | | | 2,944,689 | |
Kroger Co. (The)
3.300%, 01/15/21 | | | 1,900,000 | | | | 1,891,526 | |
Sysco Corp.
2.600%, 06/12/22 | | | 2,400,000 | | | | 2,313,240 | |
Tyson Foods, Inc.
3.550%, 06/02/27 (b) | | | 1,200,000 | | | | 1,120,464 | |
| | | | | | | | |
| | | | | | | 9,739,229 | |
| | | | | | | | |
|
| Forest Products & Paper—0.1% | |
Georgia-Pacific LLC
8.000%, 01/15/24 | | | 1,800,000 | | | | 2,161,188 | |
International Paper Co.
3.000%, 02/15/27 (b) | | | 1,500,000 | | | | 1,372,305 | |
| | | | | | | | |
| | | | | | | 3,533,493 | |
| | | | | | | | |
|
| Gas—0.1% | |
NiSource, Inc.
4.800%, 02/15/44 | | | 1,500,000 | | | | 1,453,515 | |
| | | | | | | | |
|
| Healthcare-Products—0.5% | |
Abbott Laboratories
4.750%, 11/30/36 | | | 3,000,000 | | | | 3,133,620 | |
See accompanying notes to financial statements.
BHFTII-12
Brighthouse Funds Trust II
MetLife Aggregate Bond Index Portfolio
Schedule of Investments as of December 31, 2018
Corporate Bonds & Notes—(Continued)
| | | | | | | | |
| Security Description | | Principal
Amount* | | | Value | |
|
| Healthcare-Products—(Continued) | |
Becton Dickinson & Co.
4.669%, 06/06/47 | | | 2,000,000 | | | $ | 1,881,980 | |
Medtronic, Inc.
4.625%, 03/15/45 | | | 3,000,000 | | | | 3,154,380 | |
Thermo Fisher Scientific, Inc.
4.150%, 02/01/24 | | | 3,445,000 | | | | 3,496,055 | |
| | | | | | | | |
| | | | | | | 11,666,035 | |
| | | | | | | | |
|
| Healthcare-Services—0.5% | |
Aetna, Inc.
2.750%, 11/15/22 | | | 3,000,000 | | | | 2,874,450 | |
Anthem, Inc.
5.850%, 01/15/36 | | | 1,800,000 | | | | 2,017,692 | |
Laboratory Corp. of America Holdings
4.625%, 11/15/20 | | | 1,900,000 | | | | 1,941,857 | |
| UnitedHealth Group, Inc. | |
3.750%, 07/15/25 | | | 3,600,000 | | | | 3,638,052 | |
4.250%, 06/15/48 | | | 1,000,000 | | | | 999,460 | |
| | | | | | | | |
| | | | | | | 11,471,511 | |
| | | | | | | | |
|
| Insurance—0.9% | |
Aflac, Inc.
3.625%, 06/15/23 | | | 1,475,000 | | | | 1,481,195 | |
Allstate Corp. (The)
7.450%, 05/16/19 | | | 1,700,000 | | | | 1,725,653 | |
| American International Group, Inc. | |
3.300%, 03/01/21 (b) | | | 3,000,000 | | | | 2,989,140 | |
4.500%, 07/16/44 | | | 1,100,000 | | | | 977,801 | |
AXA S.A.
8.600%, 12/15/30 | | | 1,165,000 | | | | 1,439,882 | |
Berkshire Hathaway, Inc.
3.125%, 03/15/26 (b) | | | 2,900,000 | | | | 2,811,115 | |
Chubb Corp. (The)
6.000%, 05/11/37 | | | 865,000 | | | | 1,039,790 | |
Chubb INA Holdings, Inc.
3.350%, 05/15/24 | | | 2,000,000 | | | | 1,986,960 | |
Hartford Financial Services Group, Inc. (The)
6.100%, 10/01/41 | | | 780,000 | | | | 921,398 | |
Marsh & McLennan Cos., Inc.
3.750%, 03/14/26 (b) | | | 4,000,000 | | | | 3,951,400 | |
Principal Financial Group, Inc.
3.100%, 11/15/26 | | | 1,000,000 | | | | 934,250 | |
Prudential Financial, Inc.
5.700%, 12/14/36 | | | 1,525,000 | | | | 1,720,246 | |
| | | | | | | | |
| | | | | | | 21,978,830 | |
| | | | | | | | |
|
| Internet—0.3% | |
Alibaba Group Holding, Ltd.
4.200%, 12/06/47 (b) | | | 1,400,000 | | | | 1,243,284 | |
Amazon.com, Inc. | |
3.800%, 12/05/24 (b) | | | 1,800,000 | | | | 1,842,768 | |
3.875%, 08/22/37 | | | 1,900,000 | | | | 1,848,187 | |
|
| Internet—(Continued) | |
eBay, Inc.
3.600%, 06/05/27 (b) | | | 1,500,000 | | | | 1,401,465 | |
| | | | | | | | |
| | | | | | | 6,335,704 | |
| | | | | | | | |
|
| Iron/Steel—0.0% | |
Vale Overseas, Ltd.
6.875%, 11/21/36 | | | 528,000 | | | | 603,198 | |
| | | | | | | | |
|
| Machinery-Construction & Mining—0.1% | |
Caterpillar, Inc.
3.803%, 08/15/42 (b) | | | 1,500,000 | | | | 1,397,490 | |
| | | | | | | | |
|
| Machinery-Diversified—0.1% | |
Deere & Co.
2.600%, 06/08/22 | | | 1,950,000 | | | | 1,910,259 | |
| | | | | | | | |
|
| Media—1.1% | |
21st Century Fox America, Inc.
6.550%, 03/15/33 | | | 1,950,000 | | | | 2,445,358 | |
Charter Communications Operating LLC / Charter Communications Operating Capital Corp.
4.464%, 07/23/22 | | | 2,800,000 | | | | 2,826,964 | |
Comcast Corp. | |
3.150%, 03/01/26 (b) | | | 2,000,000 | | | | 1,909,440 | |
3.969%, 11/01/47 | | | 2,900,000 | | | | 2,603,881 | |
4.650%, 07/15/42 | | | 3,670,000 | | | | 3,672,092 | |
5.650%, 06/15/35 | | | 1,500,000 | | | | 1,644,015 | |
Discovery Communications LLC
6.350%, 06/01/40 | | | 1,800,000 | | | | 1,887,426 | |
Time Warner Cable LLC | |
5.000%, 02/01/20 (b) | | | 1,900,000 | | | | 1,927,626 | |
6.550%, 05/01/37 | | | 100,000 | | | | 101,091 | |
Time Warner Entertainment Co. L.P.
8.375%, 03/15/23 | | | 380,000 | | | | 433,360 | |
Time Warner, Inc. | |
6.100%, 07/15/40 | | | 925,000 | | | | 956,395 | |
7.700%, 05/01/32 | | | 685,000 | | | | 872,217 | |
Viacom, Inc.
4.375%, 03/15/43 | | | 3,500,000 | | | | 2,828,350 | |
Walt Disney Co. (The)
2.950%, 06/15/27 (b) | | | 2,000,000 | | | | 1,911,980 | |
Warner Media LLC
3.600%, 07/15/25 | | | 1,900,000 | | | | 1,802,568 | |
| | | | | | | | |
| | | | | | | 27,822,763 | |
| | | | | | | | |
|
| Mining—0.2% | |
Newmont Mining Corp.
6.250%, 10/01/39 | | | 1,800,000 | | | | 1,961,514 | |
Rio Tinto Alcan, Inc.
6.125%, 12/15/33 | | | 1,751,000 | | | | 2,099,537 | |
| | | | | | | | |
| | | | | | | 4,061,051 | |
| | | | | | | | |
|
| Miscellaneous Manufacturing—0.3% | |
3M Co.
3.625%, 10/15/47 | | | 1,000,000 | | | | 926,850 | |
See accompanying notes to financial statements.
BHFTII-13
Brighthouse Funds Trust II
MetLife Aggregate Bond Index Portfolio
Schedule of Investments as of December 31, 2018
Corporate Bonds & Notes—(Continued)
| | | | | | | | |
| Security Description | | Principal
Amount* | | | Value | |
|
| Miscellaneous Manufacturing—(Continued) | |
General Electric Co. | |
3.375%, 03/11/24 | | | 2,900,000 | | | $ | 2,683,196 | |
5.300%, 02/11/21 (b) | | | 1,915,000 | | | | 1,918,600 | |
6.750%, 03/15/32 | | | 1,250,000 | | | | 1,303,188 | |
7.500%, 08/21/35 | | | 100,000 | | | | 104,681 | |
Ingersoll-Rand Luxembourg Finance S.A.
2.625%, 05/01/20 | | | 1,200,000 | | | | 1,187,964 | |
| | | | | | | | |
| | | | | | | 8,124,479 | |
| | | | | | | | |
|
| Multi-National—1.4% | |
African Development Bank
1.875%, 03/16/20 | | | 1,000,000 | | | | 991,240 | |
Asian Development Bank | |
1.625%, 08/26/20 (b) | | | 4,000,000 | | | | 3,937,200 | |
2.000%, 02/16/22 (b) | | | 2,000,000 | | | | 1,964,820 | |
European Investment Bank | |
1.625%, 12/15/20 (b) | | | 2,000,000 | | | | 1,962,280 | |
1.875%, 02/10/25 (b) | | | 2,500,000 | | | | 2,375,375 | |
2.500%, 10/15/24 (b) | | | 3,800,000 | | | | 3,756,072 | |
4.000%, 02/16/21 | | | 1,700,000 | | | | 1,749,453 | |
4.875%, 02/15/36 | | | 1,100,000 | | | | 1,349,766 | |
Inter-American Development Bank | |
2.125%, 01/15/25 | | | 6,000,000 | | | | 5,795,280 | |
2.375%, 07/07/27 (b) | | | 1,500,000 | | | | 1,446,615 | |
7.000%, 06/15/25 | | | 200,000 | | | | 245,010 | |
International Bank for Reconstruction & Development | |
2.125%, 03/03/25 (b) | | | 3,000,000 | | | | 2,899,410 | |
2.500%, 07/29/25 | | | 2,000,000 | | | | 1,971,140 | |
7.625%, 01/19/23 | | | 2,970,000 | | | | 3,529,132 | |
International Finance Corp.
1.125%, 07/20/21 (b) | | | 1,600,000 | | | | 1,542,848 | |
| | | | | | | | |
| | | | | | | 35,515,641 | |
| | | | | | | | |
|
| Oil & Gas—1.5% | |
Apache Finance Canada Corp.
7.750%, 12/15/29 | | | 300,000 | | | | 355,848 | |
BP Capital Markets America, Inc.
3.245%, 05/06/22 | | | 3,900,000 | | | | 3,875,040 | |
Canadian Natural Resources, Ltd.
6.250%, 03/15/38 | | | 1,800,000 | | | | 1,964,646 | |
Chevron Corp.
3.191%, 06/24/23 (b) | | | 2,025,000 | | | | 2,021,598 | |
ConocoPhillips Canada Funding Co. I
5.950%, 10/15/36 (b) | | | 1,550,000 | | | | 1,834,998 | |
ConocoPhillips Holding Co.
6.950%, 04/15/29 | | | 700,000 | | | | 856,058 | |
Equinor ASA
3.250%, 11/10/24 (b) | | | 3,100,000 | | | | 3,080,346 | |
Exxon Mobil Corp.
3.176%, 03/15/24 | | | 2,900,000 | | | | 2,900,754 | |
Marathon Oil Corp.
6.600%, 10/01/37 | | | 2,000,000 | | | | 2,147,060 | |
Noble Energy, Inc.
3.900%, 11/15/24 | | | 4,200,000 | | | | 4,051,698 | |
|
| Oil & Gas—(Continued) | |
Occidental Petroleum Corp.
| |
3.400%, 04/15/26 (b) | | | 1,000,000 | | | | 978,450 | |
Petroleos Mexicanos | |
4.875%, 01/24/22 | | | 1,900,000 | | | | 1,852,101 | |
6.625%, 06/15/35 (b) | | | 3,400,000 | | | | 2,970,478 | |
6.750%, 09/21/47 | | | 1,700,000 | | | | 1,408,688 | |
Phillips 66
4.875%, 11/15/44 | | | 1,000,000 | | | | 974,990 | |
Shell International Finance B.V.
1.875%, 05/10/21 | | | 3,000,000 | | | | 2,916,810 | |
Total Capital International S.A.
2.700%, 01/25/23 | | | 1,500,000 | | | | 1,466,610 | |
Valero Energy Corp.
3.400%, 09/15/26 | | | 1,000,000 | | | | 917,290 | |
| | | | | | | | |
| | | | | | | 36,573,463 | |
| | | | | | | | |
|
| Oil & Gas Services—0.2% | |
Halliburton Co.
3.500%, 08/01/23 | | | 4,000,000 | | | | 3,946,280 | |
| | | | | | | | |
|
| Pharmaceuticals—1.4% | |
AbbVie, Inc.
4.400%, 11/06/42 | | | 3,200,000 | | | | 2,821,760 | |
Allergan Funding SCS
3.800%, 03/15/25 (b) | | | 2,400,000 | | | | 2,341,224 | |
AstraZeneca plc
4.000%, 09/18/42 | | | 1,200,000 | | | | 1,087,944 | |
CVS Health Corp. | |
3.350%, 03/09/21 | | | 1,500,000 | | | | 1,495,470 | |
3.700%, 03/09/23 | | | 3,000,000 | | | | 2,970,540 | |
5.050%, 03/25/48 | | | 1,500,000 | | | | 1,463,445 | |
5.125%, 07/20/45 | | | 1,900,000 | | | | 1,852,709 | |
Express Scripts Holding Co. | |
4.500%, 02/25/26 | | | 2,700,000 | | | | 2,738,097 | |
6.125%, 11/15/41 | | | 313,000 | | | | 357,283 | |
GlaxoSmithKline Capital, Inc.
3.875%, 05/15/28 (b) | | | 2,000,000 | | | | 2,033,840 | |
Johnson & Johnson | |
3.700%, 03/01/46 (b) | | | 2,000,000 | | | | 1,903,140 | |
5.950%, 08/15/37 | | | 910,000 | | | | 1,145,426 | |
Merck & Co., Inc. | |
2.400%, 09/15/22 | | | 1,000,000 | | | | 975,670 | |
6.550%, 09/15/37 | | | 1,000,000 | | | | 1,327,090 | |
Merck Sharp & Dohme Corp.
5.950%, 12/01/28 | | | 300,000 | | | | 357,792 | |
Novartis Capital Corp.
4.400%, 04/24/20 (b) | | | 900,000 | | | | 917,469 | |
Sanofi
4.000%, 03/29/21 (b) | | | 2,775,000 | | | | 2,835,329 | |
Shire Acquisitions Investments Ireland DAC
3.200%, 09/23/26 | | | 3,000,000 | | | | 2,734,620 | |
Wyeth LLC
5.950%, 04/01/37 | | | 3,300,000 | | | | 3,975,543 | |
| | | | | | | | |
| | | | | | | 35,334,391 | |
| | | | | | | | |
See accompanying notes to financial statements.
BHFTII-14
Brighthouse Funds Trust II
MetLife Aggregate Bond Index Portfolio
Schedule of Investments as of December 31, 2018
Corporate Bonds & Notes—(Continued)
| | | | | | | | |
| Security Description | | Principal
Amount* | | | Value | |
|
| Pipelines—1.0% | |
El Paso Natural Gas Co. LLC
8.375%, 06/15/32 | | | 220,000 | | | $ | 270,787 | |
Enbridge Energy Partners L.P.
5.875%, 10/15/25 | | | 3,000,000 | | | | 3,252,780 | |
Energy Transfer Operating L.P. | |
4.650%, 06/01/21 | | | 1,950,000 | | | | 1,977,378 | |
5.150%, 03/15/45 | | | 2,600,000 | | | | 2,257,606 | |
Enterprise Products Operating LLC
3.950%, 02/15/27 | | | 3,800,000 | | | | 3,756,338 | |
Kinder Morgan Energy Partners L.P.
6.500%, 02/01/37 (b) | | | 2,000,000 | | | | 2,163,900 | |
Kinder Morgan, Inc.
4.300%, 06/01/25 (b) | | | 1,000,000 | | | | 994,790 | |
MPLX L.P.
5.200%, 03/01/47 | | | 1,000,000 | | | | 928,500 | |
Sabine Pass Liquefaction LLC
5.625%, 04/15/23 (b) | | | 2,700,000 | | | | 2,825,064 | |
Tennessee Gas Pipeline Co. LLC | |
7.000%, 10/15/28 | | | 1,050,000 | | | | 1,202,512 | |
7.625%, 04/01/37 | | | 640,000 | | | | 766,304 | |
TransCanada PipeLines, Ltd.
6.200%, 10/15/37 | | | 1,800,000 | | | | 1,978,902 | |
Williams Cos., Inc. (The)
5.250%, 03/15/20 | | | 3,575,000 | | | | 3,645,821 | |
| | | | | | | | |
| | | | | | | 26,020,682 | |
| | | | | | | | |
|
| Real Estate Investment Trusts—0.6% | |
American Tower Corp.
3.000%, 06/15/23 | | | 2,100,000 | | | | 2,014,530 | |
Boston Properties L.P.
3.850%, 02/01/23 | | | 2,950,000 | | | | 2,953,982 | |
Digital Realty Trust L.P.
3.700%, 08/15/27 | | | 3,500,000 | | | | 3,317,055 | |
Simon Property Group L.P.
3.300%, 01/15/26 (b) | | | 3,800,000 | | | | 3,662,022 | |
Ventas Realty L.P.
3.100%, 01/15/23 | | | 2,100,000 | | | | 2,046,765 | |
Welltower, Inc.
4.000%, 06/01/25 | | | 1,500,000 | | | | 1,474,935 | |
| | | | | | | | |
| | | | | | | 15,469,289 | |
| | | | | | | | |
|
| Retail—0.7% | |
Home Depot, Inc. (The) | |
2.000%, 04/01/21 (b) | | | 1,000,000 | | | | 980,570 | |
4.250%, 04/01/46 | | | 2,000,000 | | | | 1,996,940 | |
4.400%, 04/01/21 (b) | | | 1,450,000 | | | | 1,494,341 | |
Lowe’s Cos., Inc.
4.050%, 05/03/47 | | | 1,500,000 | | | | 1,293,345 | |
McDonald’s Corp.
3.700%, 01/30/26 | | | 3,000,000 | | | | 2,947,020 | |
Target Corp. | |
4.000%, 07/01/42 (b) | | | 1,000,000 | | | | 943,440 | |
6.350%, 11/01/32 | | | 708,000 | | | | 879,414 | |
Walgreens Boots Alliance, Inc.
2.700%, 11/18/19 | | | 3,000,000 | | | | 2,986,740 | |
|
| Retail—(Continued) | |
Walmart, Inc. | |
2.550%, 04/11/23 | | | 4,000,000 | | | | 3,904,680 | |
5.250%, 09/01/35 | | | 935,000 | | | | 1,075,596 | |
| | | | | | | | |
| | | | | | | 18,502,086 | |
| | | | | | | | |
|
| Semiconductors—0.3% | |
Broadcom Corp. / Broadcom Cayman Finance, Ltd.
3.000%, 01/15/22 | | | 3,100,000 | | | | 2,980,836 | |
Intel Corp.
| |
2.700%, 12/15/22 (b) | | | 2,000,000 | | | | 1,967,860 | |
QUALCOMM, Inc.
3.450%, 05/20/25 | | | 4,000,000 | | | | 3,847,320 | |
| | | | | | | | |
| | | | | | | 8,796,016 | |
| | | | | | | | |
|
| Software—0.8% | |
Adobe, Inc.
4.750%, 02/01/20 | | | 2,200,000 | | | | 2,243,978 | |
Microsoft Corp. | |
3.125%, 11/03/25 (b) | | | 5,100,000 | | | | 5,047,317 | |
3.300%, 02/06/27 | | | 2,000,000 | | | | 1,982,260 | |
4.250%, 02/06/47 | | | 3,000,000 | | | | 3,148,500 | |
Oracle Corp. | |
1.900%, 09/15/21 (b) | | | 1,800,000 | | | | 1,741,212 | |
2.500%, 10/15/22 | | | 2,100,000 | | | | 2,043,384 | |
4.125%, 05/15/45 | | | 4,200,000 | | | | 3,981,390 | |
| | | | | | | | |
| | | | | | | 20,188,041 | |
| | | | | | | | |
|
| Telecommunications—1.1% | |
AT&T, Inc. | |
4.100%, 02/15/28 | | | 2,687,000 | | | | 2,583,754 | |
4.125%, 02/17/26 | | | 3,000,000 | | | | 2,933,640 | |
5.150%, 11/15/46 | | | 1,308,000 | | | | 1,215,504 | |
5.300%, 08/15/58 | | | 2,500,000 | | | | 2,316,547 | |
7.125%, 12/15/31 | | | 100,000 | | | | 109,596 | |
British Telecommunications plc
9.625%, 12/15/30 | | | 1,000,000 | | | | 1,354,580 | |
Cisco Systems, Inc. | |
2.500%, 09/20/26 | | | 1,200,000 | | | | 1,117,584 | |
5.500%, 01/15/40 | | | 2,000,000 | | | | 2,361,060 | |
Deutsche Telekom International Finance B.V.
8.750%, 06/15/30 | | | 1,000,000 | | | | 1,313,690 | |
Orange S.A.
5.500%, 02/06/44 (b) | | | 1,000,000 | | | | 1,067,910 | |
Telefonica Emisiones S.A.
4.103%, 03/08/27 | | | 1,900,000 | | | | 1,835,609 | |
Verizon Communications, Inc. | |
3.376%, 02/15/25 | | | 2,078,000 | | | | 2,015,722 | |
4.812%, 03/15/39 | | | 3,927,000 | | | | 3,862,951 | |
5.012%, 04/15/49 | | | 2,032,000 | | | | 2,024,563 | |
Vodafone Group plc
6.150%, 02/27/37 | | | 2,170,000 | | | | 2,274,551 | |
| | | | | | | | |
| | | | | | | 28,387,261 | |
| | | | | | | | |
See accompanying notes to financial statements.
BHFTII-15
Brighthouse Funds Trust II
MetLife Aggregate Bond Index Portfolio
Schedule of Investments as of December 31, 2018
Corporate Bonds & Notes—(Continued)
| | | | | | | | |
| Security Description | | Principal
Amount* | | | Value | |
|
| Transportation—0.4% | |
Burlington Northern Santa Fe LLC
4.150%, 04/01/45 | | | 3,900,000 | | | $ | 3,799,848 | |
CSX Corp.
6.150%, 05/01/37 | | | 1,600,000 | | | | 1,883,024 | |
FedEx Corp.
4.550%, 04/01/46 | | | 1,000,000 | | | | 912,490 | |
Norfolk Southern Corp. | |
3.000%, 04/01/22 | | | 1,911,000 | | | | 1,897,451 | |
5.590%, 05/17/25 | | | 28,000 | | | | 30,903 | |
Union Pacific Corp.
| |
6.625%, 02/01/29 | | | 1,200,000 | | | | 1,451,352 | |
United Parcel Service, Inc.
5.125%, 04/01/19 | | | 760,000 | | | | 763,861 | |
| | | | | | | | |
| | | | | | | 10,738,929 | |
| | | | | | | | |
Total Corporate Bonds & Notes
(Cost $676,248,571) | | | | | | | 655,707,141 | |
| | | | | | | | |
|
| Foreign Government—1.7% | |
|
| Electric—0.0% | |
Hydro-Quebec
8.400%, 01/15/22 | | | 1,000,000 | | | | 1,158,370 | |
| | | | | | | | |
|
| Provincial — 0.4% | |
Province of British Columbia Canada
2.000%, 10/23/22 | | | 1,970,000 | | | | 1,918,603 | |
Province of Nova Scotia Canada
9.250%, 03/01/20 | | | 250,000 | | | | 267,758 | |
| Province of Ontario Canada | |
2.450%, 06/29/22 | | | 4,000,000 | | | | 3,945,560 | |
4.400%, 04/14/20 | | | 2,100,000 | | | | 2,144,436 | |
Province of Quebec Canada
7.500%, 07/15/23 | | | 350,000 | | | | 415,439 | |
| | | | | | | | |
| | | | | | | 8,691,796 | |
| | | | | | | | |
|
| Sovereign—1.3% | |
Colombia Government International Bonds | |
5.000%, 06/15/45 (b) | | | 1,000,000 | | | | 953,520 | |
8.125%, 05/21/24 | | | 1,500,000 | | | | 1,759,530 | |
Export-Import Bank of Korea
2.250%, 01/21/20 | | | 2,000,000 | | | | 1,985,720 | |
Japan Bank for International Cooperation
1.750%, 05/28/20 | | | 5,000,000 | | | | 4,933,450 | |
Mexico Government International Bonds | |
5.750%, 10/12/10 (b) | | | 2,000,000 | | | | 1,880,260 | |
6.750%, 09/27/34 | | | 1,050,000 | | | | 1,199,457 | |
8.000%, 09/24/22 | | | 2,200,000 | | | | 2,531,386 | |
Panama Government International Bonds | |
4.500%, 05/15/47 (c) | | | 1,400,000 | | | | 1,362,284 | |
5.200%, 01/30/20 | | | 1,370,000 | | | | 1,399,345 | |
Peruvian Government International Bond
8.750%, 11/21/33 (b) | | | 1,450,000 | | | | 2,143,376 | |
|
| Sovereign—(Continued) | |
Philippine Government International Bonds | |
3.950%, 01/20/40 | | | 2,100,000 | | | | 2,050,881 | |
5.000%, 01/13/37 | | | 1,740,000 | | | | 1,930,965 | |
Poland Government International Bond
3.250%, 04/06/26 (b) | | | 2,000,000 | | | | 1,963,620 | |
Republic of Korea
7.125%, 04/16/19 | | | 2,400,000 | | | | 2,430,312 | |
Ukraine Government AID Bond
1.471%, 09/29/21 | | | 1,600,000 | | | | 1,554,784 | |
Uruguay Government International Bond
4.375%, 10/27/27 (c) | | | 1,900,000 | | | | 1,910,773 | |
| | | | | | | | |
| | | | | | | 31,989,663 | |
| | | | | | | | |
Total Foreign Government
(Cost $43,336,661) | | | | | | | 41,839,829 | |
| | | | | | | | |
|
| Mortgage-Backed Securities—1.2% | |
|
| Commercial Mortgage-Backed Securities—1.2% | |
Commercial Mortgage Pass-Through Certificates Mortgage Trust | |
3.765%, 02/10/49 | | | 1,539,000 | | | | 1,554,302 | |
3.902%, 07/10/50 | | | 1,835,000 | | | | 1,859,418 | |
Commercial Mortgage Trust
3.838%, 09/10/47 | | | 3,800,000 | | | | 3,873,619 | |
GS Mortgage Securities Corp. II
3.382%, 05/10/50 | | | 1,835,000 | | | | 1,823,929 | |
GS Mortgage Securities Trust | |
3.135%, 06/10/46 | | | 2,935,000 | | | | 2,915,861 | |
3.377%, 05/10/45 | | | 2,520,719 | | | | 2,520,719 | |
4.243%, 08/10/46 | | | 966,000 | | | | 1,001,838 | |
JPMBB Commercial Mortgage Securities Trust | |
3.598%, 11/15/48 | | | 3,900,000 | | | | 3,912,233 | |
3.801%, 08/15/48 | | | 1,534,000 | | | | 1,559,227 | |
Morgan Stanley Bank of America Merrill Lynch Trust | |
3.544%, 01/15/49 | | | 3,850,000 | | | | 3,835,081 | |
3.635%, 10/15/48 | | | 1,547,000 | | | | 1,548,856 | |
3.732%, 05/15/48 | | | 3,750,000 | | | | 3,788,174 | |
WF-RBS Commercial Mortgage Trust
3.488%, 06/15/46 | | | 1,054,000 | | | | 1,040,423 | |
| | | | | | | | |
Total Mortgage-Backed Securities
(Cost $32,329,822) | | | | | | | 31,233,680 | |
| | | | | | | | |
|
| Asset-Backed Securities—0.6% | |
|
| Asset-Backed - Automobile—0.3% | |
Ally Auto Receivables Trust
1.990%, 11/15/21 | | | 2,990,000 | | | | 2,949,039 | |
AmeriCredit Automobile Receivables Trust
3.080%, 12/18/23 | | | 1,500,000 | | | | 1,483,417 | |
Ford Credit Auto Owner Trust
3.160%, 10/15/23 | | | 1,000,000 | | | | 1,006,712 | |
See accompanying notes to financial statements.
BHFTII-16
Brighthouse Funds Trust II
MetLife Aggregate Bond Index Portfolio
Schedule of Investments as of December 31, 2018
Asset-Backed Securities—(Continued)
| | | | | | | | |
| Security Description | | Principal
Amount* | | | Value | |
|
| Asset-Backed - Automobile—(Continued) | |
Honda Auto Receivables Owner Trust
1.330%, 11/18/22 | | | 1,011,000 | | | $ | 997,154 | |
| | | | | | | | |
| | | | | | | 6,436,322 | |
| | | | | | | | |
|
| Asset-Backed - Credit Card—0.3% | |
Capital One Multi-Asset Execution Trust
1.660%, 06/17/24 | | | 3,000,000 | | | | 2,910,602 | |
Citibank Credit Card Issuance Trust
2.880%, 01/23/23 | | | 4,924,000 | | | | 4,921,201 | |
| | | | | | | | |
| | | | | | | 7,831,803 | |
| | | | | | | | |
Total Asset-Backed Securities
(Cost $20,594,490) | | | | | | | 14,268,125 | |
| | | | | | | | |
|
| Municipals—0.5% | |
Los Angeles, CA Unified School District, Build America Bond
6.758%, 07/01/34 | | | 660,000 | | | | 849,360 | |
Municipal Electric Authority of Georgia, Build America Bond
6.637%, 04/01/57 | | | 1,999,000 | | | | 2,113,423 | |
New Jersey State Turnpike Authority, Build America Bond
7.414%, 01/01/40 | | | 1,700,000 | | | | 2,395,300 | |
Oregon School Boards Association, General Obligation Unlimited
5.680%, 06/30/28 | | | 1,900,000 | | | | 2,206,508 | |
State of California General Obligation Unlimited, Build America Bond
7.300%, 10/01/39 | | | 2,000,000 | | | | 2,745,440 | |
State of Illinois, General Obligation Unlimited
5.100%, 06/01/33 | | | 1,230,000 | | | | 1,172,719 | |
| | | | | | | | |
Total Municipals
(Cost $10,434,358) | | | | | | | 11,482,750 | |
| | | | | | | | |
|
| Short-Term Investment—0.1% | |
|
| U.S. Treasury—0.1% | |
U.S. Treasury Bill
1.997%, 01/08/19 (d) | | | 2,500,000 | | | | 2,499,064 | |
| | | | | | | | |
Total Short-Term Investments
(Cost $2,498,906) | | | | | | | 2,499,064 | |
| | | | | | | | |
|
| Securities Lending Reinvestments (e)—8.3% | |
|
| Certificates of Deposit—4.8% | |
Banco Del Estado De Chile New York
2.720%, 1M LIBOR + 0.250%, 03/20/19 (a) | | | 5,000,000 | | | | 4,999,570 | |
2.820%, 1M LIBOR + 0.350%, 05/20/19 (a) | | | 3,000,000 | | | | 2,999,937 | |
Bank of Montreal (Chicago)
2.710%, 1M LIBOR + 0.330%, 08/06/19 (a) | | | 2,000,000 | | | | 1,999,950 | |
Bank of Nova Scotia
3.072%, 3M LIBOR + 0.280%, 03/20/19 (a) | | | 8,000,000 | | | | 8,003,192 | |
Barclays Bank plc
2.547%, 1M LIBOR + 0.200%, 02/04/19 (a) | | | 5,000,000 | | | | 4,999,525 | |
BNP Paribas S.A. New York
2.647%, 1M LIBOR + 0.300%, 06/04/19 (a) | | | 2,000,000 | | | | 1,999,196 | |
|
| Certificates of Deposit—(Continued) | |
Canadian Imperial Bank of Commerce
2.556%, 3M LIBOR + 0.120%, 01/14/19 (a) | | | 5,000,000 | | | | 4,999,360 | |
2.740%, 1M LIBOR + 0.270%, 07/19/19 (a) | | | 3,000,000 | | | | 2,998,782 | |
Citibank N.A.
2.490%, 02/04/19 | | | 7,000,000 | | | | 6,999,027 | |
Commonwealth Bank of Australia
2.617%, 3M LIBOR + 0.140%, 04/23/19 (a) | | | 2,500,000 | | | | 2,500,008 | |
Credit Agricole S.A.
2.799%, 1M LIBOR + 0.320%, 05/21/19 (a) | | | 3,000,000 | | | | 3,000,189 | |
Credit Industriel et Commercial
Zero Coupon, 01/25/19 | | | 4,936,141 | | | | 4,991,500 | |
Credit Industriel et Commercial (NY)
2.629%, 1M LIBOR + 0.250%, 02/05/19 (a) | | | 2,500,000 | | | | 2,500,062 | |
Credit Suisse AG
2.620%, 04/01/19 | | | 5,000,000 | | | | 4,997,410 | |
Industrial & Commercial Bank of China, Ltd.
2.850%, 02/15/19 | | | 4,000,000 | | | | 3,999,704 | |
Mitsubishi UFJ Trust and Banking Corp.
Zero Coupon, 01/15/19 | | | 4,962,437 | | | | 4,994,900 | |
Natixis New York
2.940%, SOFR + 0.480%, 06/12/19 (a) | | | 2,000,000 | | | | 1,999,788 | |
Natixis S.A. New York
2.705%, 3M LIBOR + 0.090%, 05/10/19 (a) | | | 3,000,000 | | | | 2,998,110 | |
Skandinaviska Enskilda Banken
2.645%, 1M LIBOR + 0.190%, 04/17/19 (a) | | | 1,000,000 | | | | 999,918 | |
| Standard Chartered plc | |
2.686%, 1M LIBOR + 0.180%, 02/25/19 (a) | | | 5,000,000 | | | | 4,999,855 | |
2.717%, 3M LIBOR + 0.230%, 04/24/19 (a) | | | 3,000,000 | | | | 2,999,346 | |
2.785%, 1M LIBOR + 0.330%, 05/17/19 (a) | | | 2,000,000 | | | | 1,999,954 | |
Sumitomo Mitsui Banking Corp.
2.590%, 1M LIBOR + 0.190%, 04/11/19 (a) | | | 7,000,000 | | | | 6,997,431 | |
Sumitomo Mitsui Banking Corp., New York
2.559%, 1M LIBOR + 0.180%, 03/05/19 (a) | | | 2,000,000 | | | | 1,999,526 | |
Sumitomo Mitsui Trust Bank, Ltd.
Zero Coupon, 03/12/19 | | | 1,985,555 | | | | 1,989,140 | |
Svenska Handelsbanken AB
2.620%, 3M LIBOR + 0.100%, 04/30/19 (a) | | | 4,000,000 | | | | 3,999,820 | |
U.S. Bank N.A.
| |
2.764%, 1M LIBOR + 0.260%, 07/23/19 (a) | | | 4,000,000 | | | | 4,000,000 | |
Wells Fargo Bank N.A.
2.560%, 3M LIBOR + 0.140%, 07/11/19 (a) | | | 10,000,000 | | | | 10,008,674 | |
Westpac Banking Corp.
2.850%, FEDEFF PRV + 0.450%, 02/15/19 (a) | | | 7,000,000 | | | | 6,999,956 | |
| | | | | | | | |
| | | | | | | 118,973,830 | |
| | | | | | | | |
|
| Commercial Paper—1.5% | |
Alpine Securities Ltd.
2.529%, 1M LIBOR + 0.180%, 04/03/19 (a) | | | 4,000,000 | | | | 3,998,892 | |
Banco Santander S.A.
2.740%, 02/07/19 | | | 3,971,991 | | | | 3,988,352 | |
HSBC Bank plc
2.842%, 1M LIBOR + 0.320%, 07/30/19 (a) | | | 2,000,000 | | | | 2,000,000 | |
ING Funding LLC
2.707%, 1M LIBOR + 0.320%, 02/08/19 (a) | | | 2,000,000 | | | | 2,000,186 | |
2.725%, 3M LIBOR + 0.110%, 05/10/19 (a) | | | 2,000,000 | | | | 1,999,764 | |
See accompanying notes to financial statements.
BHFTII-17
Brighthouse Funds Trust II
MetLife Aggregate Bond Index Portfolio
Schedule of Investments as of December 31, 2018
Securities Lending Reinvestments (e)—(Continued)
| | | | | | | | |
| Security Description | | Principal
Amount* | | | Value | |
|
| Commercial Paper—(Continued) | |
Matchpoint Finance plc
2.890%, 05/08/19 | | | 3,941,879 | | | $ | 3,957,012 | |
Sheffield Receivables Co.
2.930%, SOFR + 0.470%, 05/30/19 (a) | | | 5,000,000 | | | | 4,999,920 | |
UBS AG
2.779%, 1M LIBOR + 0.430%, 02/01/19 (a) | | | 10,000,000 | | | | 10,002,450 | |
Westpac Banking Corp.
2.784%, 1M LIBOR + 0.280%, 05/24/19 (a) | | | 5,000,000 | | | | 4,999,800 | |
| | | | | | | | |
| | | | | | | 37,946,376 | |
| | | | | | | | |
|
| Master Demand Notes—0.2% | |
Natixis Financial Products LLC
2.740%, OBFR + 0.350%, 02/04/19 (a) | | | 5,000,000 | | | | 5,000,000 | |
| | | | | | | | |
|
| Repurchase Agreements—1.6% | |
Citigroup Global Markets, Inc.
Repurchase Agreement dated 12/31/18 at 2.660%, due on 01/07/19 with a maturity value of $4,002,069; collateralized by U.S. Treasury Obligations with rates ranging from 0.625% - 3.125%, maturity dates ranging from 02/15/42 - 02/15/46, and various Common Stock with an aggregate market value of $4,217,144. | | | 4,000,000 | | | | 4,000,000 | |
Repurchase Agreement dated 12/31/18 at 2.790%, due on 02/04/19 with a maturity value of $5,013,563; collateralized by U.S. Treasury Obligations at 0.000%, maturing 02/12/19, and various Common Stock with an aggregate market value of $5,441,594. | | | 5,000,000 | | | | 5,000,000 | |
Repurchase Agreement dated 12/31/18 at 2.940%, due on 04/02/19 with a maturity value of $1,511,270; collateralized by U.S. Treasury Obligations with rates ranging from 1.125% - 2.750%, maturity dates ranging from 01/31/19 - 08/15/24, and an aggregate market value of $1,530,000. | | | 1,500,000 | | | | 1,500,000 | |
Deutsche Bank Securities, Inc.
Repurchase Agreement dated 12/31/18 at 3.200%, due on 01/02/19 with a maturity value of $1,175,831; collateralized by U.S. Treasury Obligations at 0.000%, maturity dates ranging from 08/15/30 - 08/15/39, and an aggregate market value of $1,199,135. | | | 1,175,622 | | | | 1,175,622 | |
Merrill Lynch, Pierce, Fenner & Smith, Inc.
Repurchase Agreement dated 12/31/18 at 2.940%, due on 04/02/19 with a maturity value of $4,130,805; collateralized by various Common Stock with an aggregate market value of $4,510,000. | | | 4,100,000 | | | | 4,100,000 | |
Repurchase Agreement dated 12/31/18 at 2.940%, due on 04/02/19 with a maturity value of $8,060,107; collateralized by various Common Stock with an aggregate market value of $8,800,000. | | | 8,000,000 | | | | 8,000,000 | |
NBC Global Finance, Ltd.
Repurchase Agreement dated 12/31/18 at 2.590%, due on 01/07/19 with a maturity value of $6,003,022; collateralized by various Common Stock with an aggregate market value of $6,679,931. | | | 6,000,000 | | | | 6,000,000 | |
|
| Repurchase Agreements—(Continued) | |
NBC Global Finance, Ltd.
Repurchase Agreement dated 12/31/18 at 2.590%, due on 01/07/19 with a maturity value of $4,002,014; collateralized by various Common Stock with an aggregate market value of $4,453,288. | | | 4,000,000 | | | | 4,000,000 | |
Societe Generale
Repurchase Agreement dated 12/31/18 at 2.560%, due on 01/07/19 with a maturity value of $4,802,389; collateralized by U.S. Treasury Obligations with rates ranging from 0.750% - 8.000%, maturity dates ranging from 09/30/19 - 08/15/46, and various Common Stock with an aggregate market value of $5,258,284. | | | 4,800,000 | | | | 4,800,000 | |
Repurchase Agreement dated 12/31/18 at 2.560%, due on 01/07/19 with a maturity value of $2,401,195; collateralized by U.S. Treasury Obligations with rates ranging from 0.750% - 8.000%, maturity dates ranging from 09/30/19 - 08/15/46, and various Common Stock with an aggregate market value of $2,629,142. | | | 2,400,000 | | | | 2,400,000 | |
| | | | | | | | |
| | | | | | | 40,975,622 | |
| | | | | | | | |
|
| Time Deposit—0.2% | |
Royal Bank of Canada
2.420%, 01/02/19 | | | 4,000,000 | | | | 4,000,000 | |
| | | | | | | | |
Total Securities Lending Reinvestments
(Cost $206,900,622) | | | | | | | 206,895,828 | |
| | | | | | | | |
Total Investments—107.6%
(Cost $2,702,273,298) | | | | | | | 2,671,520,436 | |
Other assets and liabilities (net)—(7.6)% | | | | | | | (188,625,622 | ) |
| | | | | | | | |
| Net Assets—100.0% | | | | | | $ | 2,482,894,814 | |
| | | | | | | | |
| | | | |
| * | | Principal amount stated in U.S. dollars unless otherwise noted. |
| (a) | | Variable or floating rate security. The stated rate represents the rate at December 31, 2018. Maturity date shown for callable securities reflects the earliest possible call date. For securities based on a published reference index and spread, the index and spread are indicated in the description above. For certain variable rate securities, the coupon rate is determined by the issuer/agent based on current market conditions. For certain asset- and mortgage-backed securities, the coupon rate may fluctuate based on changes of the underlying collateral or prepayments of principal. These securities do not indicate a reference index and spread in their description above. |
| (b) | | All or a portion of the security was held on loan. As of December 31, 2018, the market value of securities loaned was $201,519,074 and the collateral received consisted of cash in the amount of $206,773,625. The cash collateral investments are disclosed in the Schedule of Investments and categorized as Securities Lending Reinvestments. |
| (c) | | Principal amount of security is adjusted for inflation. |
| (d) | | The rate shown represents current yield to maturity. |
| (e) | | Represents investment of cash collateral received from securities on loan as of December 31, 2018. |
| (144A)— | | Securities exempt from registration under Rule 144A of the Securities Act of 1933. These securities may be resold in transactions exempt from registration, normally to qualified institutional buyers. As of December 31, 2018, the market value of 144A securities was $996,990, which is 0.0% of net assets. |
| (CMO)— | | Collateralized Mortgage Obligation |
See accompanying notes to financial statements.
BHFTII-18
Brighthouse Funds Trust II
MetLife Aggregate Bond Index Portfolio
Schedule of Investments as of December 31, 2018
| | | | |
| (FEDEFF PRV)— | | Effective Federal Funds Rate |
| (LIBOR)— | | London Interbank Offered Rate |
| (OBFR)— | | U.S. Overnight Bank Funding Rate |
| (SOFR)— | | Secured Overnight Financing Rate |
Fair Value Hierarchy
Accounting principles generally accepted in the United States of America (“GAAP”) define fair market value as the price that the Portfolio would receive to sell an asset or pay to transfer a liability in an orderly transaction between market participants at the measurement date. It establishes a fair value hierarchy that prioritizes inputs to valuation methods and requires disclosure of the fair value hierarchy, separately for each major category of assets and liabilities, that segregates fair value measurements into three levels. Levels 1, 2 and 3 of the fair value hierarchy are defined as follows:
Level 1 - unadjusted quoted prices in active markets for identical investments
Level 2 - other significant observable inputs (including, but not limited to, quoted prices for similar assets or liabilities in markets that are either active or inactive; inputs other than quoted prices that are observable such as interest rates, yield curves, volatilities, prepayment speeds, loss severities, credit risks, default rates, or other market corroborated inputs)
Level 3 - significant unobservable inputs based on the best information available in the circumstances, to the extent observable inputs are unavailable (including the Portfolio’s own assumptions used in determining the fair value of investments and derivative financial instruments)
The inputs or methodologies used for valuing investments are not necessarily an indication of the risk associated with investing in them. Changes to the inputs or methodologies used may result in transfers between levels. A reconciliation of Level 3 securities, if any, will be disclosed following the fair value hierarchy table. For more information about the Portfolio’s policy regarding the valuation of investments, please refer to the Notes to Financial Statements.
The following table summarizes the fair value hierarchy of the Portfolio’s investments as of December 31, 2018:
| | | | | | | | | | | | | | | | |
| Description | | Level 1 | | | Level 2 | | | Level 3 | | | Total | |
Total U.S. Treasury & Government Agencies* | | $ | — | | | $ | 1,707,594,019 | | | $ | — | | | $ | 1,707,594,019 | |
Total Corporate Bonds & Notes* | | | — | | | | 655,707,141 | | | | — | | | | 655,707,141 | |
Total Foreign Government* | | | — | | | | 41,839,829 | | | | — | | | | 41,839,829 | |
Total Mortgage-Backed Securities* | | | — | | | | 31,233,680 | | | | — | | | | 31,233,680 | |
Total Asset-Backed Securities* | | | — | | | | 14,268,125 | | | | — | | | | 14,268,125 | |
Total Municipals | | | — | | | | 11,482,750 | | | | — | | | | 11,482,750 | |
Total Short-Term Investment* | | | — | | | | 2,499,064 | | | | — | | | | 2,499,064 | |
Total Securities Lending Reinvestments* | | | — | | | | 206,895,828 | | | | — | | | | 206,895,828 | |
Total Investments | | $ | — | | | $ | 2,671,520,436 | | | $ | — | | | $ | 2,671,520,436 | |
| | | | | | | | | | | | | | | | | |
Collateral for Securities Loaned (Liability) | | $ | — | | | $ | (206,773,625 | ) | | $ | — | | | $ | (206,773,625 | ) |
| | | | |
| * | | See Schedule of Investments for additional detailed categorizations. |
See accompanying notes to financial statements.
BHFTII-19
Brighthouse Funds Trust II
MetLife Aggregate Bond Index Portfolio
Statement of Assets and Liabilities
December 31, 2018
| | | | |
Assets | |
Investments at value (a) (b) | | $ | 2,671,520,436 | |
Cash | | | 55,055 | |
Receivable for: | |
Investments sold | | | 18,959,028 | |
Fund shares sold | | | 3,995,018 | |
Interest | | | 16,149,214 | |
Prepaid expenses | | | 6,935 | |
| | | | |
Total Assets | | | 2,710,685,686 | |
Liabilities | |
Collateral for securities loaned | | | 206,773,625 | |
Payables for: | |
Investments purchased | | | 8,630,809 | |
Fund shares redeemed | | | 11,102,552 | |
Accrued Expenses: | |
Management fees | | | 517,525 | |
Distribution and service fees | | | 264,112 | |
Deferred trustees’ fees | | | 111,323 | |
Other expenses | | | 390,926 | |
| | | | |
Total Liabilities | | | 227,790,872 | |
| | | | |
Net Assets | | $ | 2,482,894,814 | |
| | | | |
Net Assets Consist of: | |
Paid in surplus | | $ | 2,523,104,413 | |
Distributable earnings (Accumulated losses) | | | (40,209,599 | ) |
| | | | |
Net Assets | | $ | 2,482,894,814 | |
| | | | |
Net Assets | |
Class A | | $ | 1,293,641,453 | |
Class B | | | 824,771,699 | |
Class E | | | 52,259,648 | |
Class G | | | 312,222,014 | |
Capital Shares Outstanding* | |
Class A | | | 122,594,137 | |
Class B | | | 79,895,458 | |
Class E | | | 4,981,476 | |
Class G | | | 30,360,639 | |
Net Asset Value, Offering Price and Redemption Price Per Share | |
Class A | | $ | 10.55 | |
Class B | | | 10.32 | |
Class E | | | 10.49 | |
Class G | | | 10.28 | |
| | | | |
| * | | The Portfolio is authorized to issue an unlimited number of shares. |
| (a) | | Identified cost of investments was $2,702,273,298. |
| (b) | | Includes securities loaned at value of $201,519,074. |
Statement of Operations
Year Ended December 31, 2018
| | | | |
Investment Income | |
Interest | | $ | 76,410,583 | |
Securities lending income | | | 1,011,049 | |
| | | | |
Total investment income | | | 77,421,632 | |
Expenses | |
Management fees | | | 6,532,200 | |
Administration fees | | | 92,425 | |
Custodian and accounting fees | | | 251,407 | |
Distribution and service fees—Class B | | | 2,234,474 | |
Distribution and service fees—Class E | | | 84,025 | |
Distribution and service fees—Class G | | | 956,596 | |
Audit and tax services | | | 92,932 | |
Legal | | | 45,317 | |
Trustees’ fees and expenses | | | 33,733 | |
Shareholder reporting | | | 254,178 | |
Insurance | | | 17,053 | |
Miscellaneous | | | 32,373 | |
| | | | |
Total expenses | | | 10,626,713 | |
Less management fee waiver | | | (216,932 | ) |
| | | | |
Net expenses | | | 10,409,781 | |
| | | | |
Net Investment Income | | | 67,011,851 | |
| | | | |
Net Realized and Unrealized Loss | |
Net realized loss on investments | | | (2,602,372 | ) |
| | | | |
Net change in unrealized depreciation on investments | | | (76,723,188 | ) |
| | | | |
Net realized and unrealized loss | | | (79,325,560 | ) |
| | | | |
Net Decrease in Net Assets From Operations | | $ | (12,313,709 | ) |
| | | | |
See accompanying notes to financial statements.
BHFTII-20
Brighthouse Funds Trust II
MetLife Aggregate Bond Index Portfolio
Statements of Changes in Net Assets
| | | | | | | | |
| | | Year Ended
December 31,
2018 | | | Year Ended
December 31,
2017 | |
Increase (Decrease) in Net Assets: | |
From Operations | |
Net investment income | | $ | 67,011,851 | | | $ | 63,880,811 | |
Net realized gain (loss) | | | (2,602,372 | ) | | | 7,610,419 | |
Net change in unrealized appreciation (depreciation) | | | (76,723,188 | ) | | | 12,433,886 | |
| | | | | | | | |
Increase (decrease) in net assets from operations | | | (12,313,709 | ) | | | 83,925,116 | |
| | | | | | | | |
From Distributions to Shareholders (a) | |
Class A | | | (40,620,231 | ) | | | (38,670,834 | ) |
Class B | | | (25,318,977 | ) | | | (26,417,841 | ) |
Class E | | | (1,621,378 | ) | | | (1,698,687 | ) |
Class G | | | (8,969,174 | ) | | | (8,827,881 | ) |
| | | | | | | | |
Total distributions | | | (76,529,760 | ) | | | (75,615,243 | ) |
| | | | | | | | |
Increase (decrease) in net assets from capital share transactions | | | (147,877,103 | ) | | | 50,385,070 | |
| | | | | | | | |
Total increase (decrease) in net assets | | | (236,720,572 | ) | | | 58,694,943 | |
|
Net Assets | |
Beginning of period | | | 2,719,615,386 | | | | 2,660,920,443 | |
| | | | | | | | |
End of period | | $ | 2,482,894,814 | | | $ | 2,719,615,386 | (b) |
| | | | | | | | |
Other Information:
Capital Shares
Transactions in capital shares were as follows:
| | | | | | | | | | | | | | | | |
| | | Year Ended
December 31, 2018 | | | Year Ended
December 31, 2017 | |
| | | Shares | | | Value | | | Shares | | | Value | |
Class A | |
Sales | | | 7,811,010 | | | $ | 83,227,218 | | | | 9,597,934 | | | $ | 104,655,031 | |
Reinvestments | | | 3,932,259 | | | | 40,620,231 | | | | 3,574,014 | | | | 38,670,834 | |
Redemptions | | | (15,087,766 | ) | | | (158,992,730 | ) | | | (6,734,519 | ) | | | (73,618,212 | ) |
| | | | | | | | | | | | | | | | |
Net increase (decrease) | | | (3,344,497 | ) | | $ | (35,145,281 | ) | | | 6,437,429 | | | $ | 69,707,653 | |
| | | | | | | | | | | | | | | | |
Class B | |
Sales | | | 2,704,053 | | | $ | 27,987,348 | | | | 3,934,275 | | | $ | 41,976,475 | |
Reinvestments | | | 2,501,875 | | | | 25,318,977 | | | | 2,489,900 | | | | 26,417,841 | |
Redemptions | | | (14,670,824 | ) | | | (150,861,531 | ) | | | (8,608,962 | ) | | | (92,021,533 | ) |
| | | | | | | | | | | | | | | | |
Net decrease | | | (9,464,896 | ) | | $ | (97,555,206 | ) | | | (2,184,787 | ) | | $ | (23,627,217 | ) |
| | | | | | | | | | | | | | | | |
Class E | |
Sales | | | 190,181 | | | $ | 2,005,901 | | | | 294,447 | | | $ | 3,195,564 | |
Reinvestments | | | 157,875 | | | | 1,621,378 | | | | 157,724 | | | | 1,698,687 | |
Redemptions | | | (892,352 | ) | | | (9,342,466 | ) | | | (616,136 | ) | | | (6,685,675 | ) |
| | | | | | | | | | | | | | | | |
Net decrease | | | (544,296 | ) | | $ | (5,715,187 | ) | | | (163,965 | ) | | $ | (1,791,424 | ) |
| | | | | | | | | | | | | | | | |
Class G | |
Sales | | | 3,960,786 | | | $ | 40,765,196 | | | | 4,460,762 | | | $ | 47,491,947 | |
Reinvestments | | | 889,799 | | | | 8,969,174 | | | | 835,183 | | | | 8,827,881 | |
Redemptions | | | (5,767,983 | ) | | | (59,195,799 | ) | | | (4,717,044 | ) | | | (50,223,770 | ) |
| | | | | | | | | | | | | | | | |
Net increase (decrease) | | | (917,398 | ) | | $ | (9,461,429 | ) | | | 578,901 | | | $ | 6,096,058 | |
| | | | | | | | | | | | | | | | |
Increase (decrease) derived from capital shares transactions | | | | | | $ | (147,877,103 | ) | | | | | | $ | 50,385,070 | |
| | | | | | | | | | | | | | | | |
| | | | |
| (a) | | Distributions from net investment income and realized gains are no longer required to be separately disclosed. The presentation for the year ended December 31, 2018 has been adjusted for this change (See Note 8). At December 31, 2017 the distributions were from net investment income. |
| (b) | | As part of the update in (a), it is also no longer required to disclose the Undistributed net investment income (Accumulated losses) which was $76,054,727 as of December 31, 2017. |
See accompanying notes to financial statements.
BHFTII-21
Brighthouse Funds Trust II
MetLife Aggregate Bond Index Portfolio
Financial Highlights
| | | | | | | | | | | | | | | | | | | | |
| Selected per share data | |
| | | Class A | |
| | | Year Ended December 31, | |
| | | 2018 | | | 2017 | | | 2016 | | | 2015 | | | 2014 | |
Net Asset Value, Beginning of Period | | $ | 10.90 | | | $ | 10.87 | | | $ | 10.92 | | | $ | 11.22 | | | $ | 10.93 | |
| | | | | | | | | | | | | | | | | | | | |
Income (Loss) from Investment Operations | |
Net investment income (a) | | | 0.28 | | | | 0.27 | | | | 0.27 | | | | 0.28 | | | | 0.29 | |
Net realized and unrealized gain (loss) | | | (0.31 | ) | | | 0.08 | | | | (0.01 | ) | | | (0.25 | ) | | | 0.33 | |
| | | | | | | | | | | | | | | | | | | | |
Total income (loss) from investment operations | | | (0.03 | ) | | | 0.35 | | | | 0.26 | | | | 0.03 | | | | 0.62 | |
| | | | | | | | | | | | | | | | | | | | |
Less Distributions | |
Distributions from net investment income | | | (0.32 | ) | | | (0.32 | ) | | | (0.31 | ) | | | (0.33 | ) | | | (0.33 | ) |
| | | | | | | | | | | | | | | | | | | | |
Total distributions | | | (0.32 | ) | | | (0.32 | ) | | | (0.31 | ) | | | (0.33 | ) | | | (0.33 | ) |
| | | | | | | | | | | | | | | | | | | | |
Net Asset Value, End of Period | | $ | 10.55 | | | $ | 10.90 | | | $ | 10.87 | | | $ | 10.92 | | | $ | 11.22 | |
| | | | | | | | | | | | | | | | | | | | |
Total Return (%) (b) | | | (0.18 | ) | | | 3.26 | | | | 2.35 | | | | 0.25 | | | | 5.81 | |
|
Ratios/Supplemental Data | |
Gross ratio of expenses to average net assets (%) | | | 0.28 | | | | 0.28 | | | | 0.28 | | | | 0.28 | | | | 0.28 | |
Net ratio of expenses to average net assets (%) (c) | | | 0.27 | | | | 0.27 | | | | 0.27 | | | | 0.27 | | | | 0.28 | |
Ratio of net investment income to average net assets (%) | | | 2.69 | | | | 2.50 | | | | 2.39 | | | | 2.48 | | | | 2.62 | |
Portfolio turnover rate (%) | | | 19 | | | | 22 | | | | 16 | | | | 18 | | | | 13 | |
Net assets, end of period (in millions) | | $ | 1,293.6 | | | $ | 1,373.3 | | | $ | 1,299.2 | | | $ | 1,177.2 | | | $ | 1,008.2 | |
| |
| | | Class B | |
| | | Year Ended December 31, | |
| | | 2018 | | | 2017 | | | 2016 | | | 2015 | | | 2014 | |
Net Asset Value, Beginning of Period | | $ | 10.67 | | | $ | 10.65 | | | $ | 10.70 | | | $ | 10.99 | | | $ | 10.72 | |
| | | | | | | | | | | | | | | | | | | | |
Income (Loss) from Investment Operations | |
Net investment income (a) | | | 0.25 | | | | 0.24 | | | | 0.23 | | | | 0.24 | | | | 0.26 | |
Net realized and unrealized gain (loss) | | | (0.30 | ) | | | 0.07 | | | | 0.01 | | | | (0.23 | ) | | | 0.32 | |
| | | | | | | | | | | | | | | | | | | | |
Total income (loss) from investment operations | | | (0.05 | ) | | | 0.31 | | | | 0.24 | | | | 0.01 | | | | 0.58 | |
| | | | | | | | | | | | | | | | | | | | |
Less Distributions | |
Distributions from net investment income | | | (0.30 | ) | | | (0.29 | ) | | | (0.29 | ) | | | (0.30 | ) | | | (0.31 | ) |
| | | | | | | | | | | | | | | | | | | | |
Total distributions | | | (0.30 | ) | | | (0.29 | ) | | | (0.29 | ) | | | (0.30 | ) | | | (0.31 | ) |
| | | | | | | | | | | | | | | | | | | | |
Net Asset Value, End of Period | | $ | 10.32 | | | $ | 10.67 | | | $ | 10.65 | | | $ | 10.70 | | | $ | 10.99 | |
| | | | | | | | | | | | | | | | | | | | |
Total Return (%) (b) | | | (0.45 | ) | | | 2.96 | | | | 2.14 | | | | 0.09 | | | | 5.48 | |
|
Ratios/Supplemental Data | |
Gross ratio of expenses to average net assets (%) | | | 0.53 | | | | 0.53 | | | | 0.53 | | | | 0.53 | | | | 0.53 | |
Net ratio of expenses to average net assets (%) (c) | | | 0.52 | | | | 0.52 | | | | 0.52 | | | | 0.52 | | | | 0.53 | |
Ratio of net investment income to average net assets (%) | | | 2.44 | | | | 2.25 | | | | 2.14 | | | | 2.23 | | | | 2.37 | |
Portfolio turnover rate (%) | | | 19 | | | | 22 | | | | 16 | | | | 18 | | | | 13 | |
Net assets, end of period (in millions) | | $ | 824.8 | | | $ | 953.7 | | | $ | 974.5 | | | $ | 973.6 | | | $ | 997.1 | |
Please see following page for Financial Highlights footnote legend.
See accompanying notes to financial statements.
BHFTII-22
Brighthouse Funds Trust II
MetLife Aggregate Bond Index Portfolio
Financial Highlights
| | | | | | | | | | | | | | | | | | | | |
| Selected per share data | |
| | | Class E | |
| | | Year Ended December 31, | |
| | | 2018 | | | 2017 | | | 2016 | | | 2015 | | | 2014 | |
Net Asset Value, Beginning of Period | | $ | 10.84 | | | $ | 10.81 | | | $ | 10.86 | | | $ | 11.15 | | | $ | 10.87 | |
| | | | | | | | | | | | | | | | | | | | |
Income (Loss) from Investment Operations | |
Net investment income (a) | | | 0.27 | | | | 0.25 | | | | 0.25 | | | | 0.26 | | | | 0.27 | |
Net realized and unrealized gain (loss) | | | (0.31 | ) | | | 0.09 | | | | (0.01 | ) | | | (0.24 | ) | | | 0.33 | |
| | | | | | | | | | | | | | | | | | | | |
Total income (loss) from investment operations | | | (0.04 | ) | | | 0.34 | | | | 0.24 | | | | 0.02 | | | | 0.60 | |
| | | | | | | | | | | | | | | | | | | | |
Less Distributions | |
Distributions from net investment income | | | (0.31 | ) | | | (0.31 | ) | | | (0.29 | ) | | | (0.31 | ) | | | (0.32 | ) |
| | | | | | | | | | | | | | | | | | | | |
Total distributions | | | (0.31 | ) | | | (0.31 | ) | | | (0.29 | ) | | | (0.31 | ) | | | (0.32 | ) |
| | | | | | | | | | | | | | | | | | | | |
Net Asset Value, End of Period | | $ | 10.49 | | | $ | 10.84 | | | $ | 10.81 | | | $ | 10.86 | | | $ | 11.15 | |
| | | | | | | | | | | | | | | | | | | | |
Total Return (%) (b) | | | (0.34 | ) | | | 3.12 | | | | 2.19 | | | | 0.19 | | | | 5.58 | |
|
Ratios/Supplemental Data | |
Gross ratio of expenses to average net assets (%) | | | 0.43 | | | | 0.43 | | | | 0.43 | | | | 0.43 | | | | 0.43 | |
Net ratio of expenses to average net assets (%) (c) | | | 0.42 | | | | 0.42 | | | | 0.42 | | | | 0.42 | | | | 0.43 | |
Ratio of net investment income to average net assets (%) | | | 2.54 | | | | 2.35 | | | | 2.24 | | | | 2.33 | | | | 2.47 | |
Portfolio turnover rate (%) | | | 19 | | | | 22 | | | | 16 | | | | 18 | | | | 13 | |
Net assets, end of period (in millions) | | $ | 52.3 | | | $ | 59.9 | | | $ | 61.5 | | | $ | 67.0 | | | $ | 76.9 | |
| |
| | | Class G | |
| | | Year Ended December 31, | |
| | | 2018 | | | 2017 | | | 2016 | | | 2015 | | | 2014 | |
Net Asset Value, Beginning of Period | | $ | 10.63 | | | $ | 10.61 | | | $ | 10.67 | | | $ | 10.97 | | | $ | 10.70 | |
| | | | | | | | | | | | | | | | | | | | |
Income (Loss) from Investment Operations | |
Net investment income (a) | | | 0.25 | | | | 0.23 | | | | 0.23 | | | | 0.24 | | | | 0.25 | |
Net realized and unrealized gain (loss) | | | (0.31 | ) | | | 0.08 | | | | 0.00 | | | | (0.25 | ) | | | 0.33 | |
| | | | | | | | | | | | | | | | | | | | |
Total income (loss) from investment operations | | | (0.06 | ) | | | 0.31 | | | | 0.23 | | | | (0.01 | ) | | | 0.58 | |
| | | | | | | | | | | | | | | | | | | | |
Less Distributions | |
Distributions from net investment income | | | (0.29 | ) | | | (0.29 | ) | | | (0.29 | ) | | | (0.29 | ) | | | (0.31 | ) |
| | | | | | | | | | | | | | | | | | | | |
Total distributions | | | (0.29 | ) | | | (0.29 | ) | | | (0.29 | ) | | | (0.29 | ) | | | (0.31 | ) |
| | | | | | | | | | | | | | | | | | | | |
Net Asset Value, End of Period | | $ | 10.28 | | | $ | 10.63 | | | $ | 10.61 | | | $ | 10.67 | | | $ | 10.97 | |
| | | | | | | | | | | | | | | | | | | | |
Total Return (%) (b) | | | (0.49 | ) | | | 2.94 | | | | 2.09 | | | | (0.06 | ) | | | 5.46 | |
|
Ratios/Supplemental Data | |
Gross ratio of expenses to average net assets (%) | | | 0.58 | | | | 0.58 | | | | 0.58 | | | | 0.58 | | | | 0.58 | |
Net ratio of expenses to average net assets (%) (c) | | | 0.57 | | | | 0.57 | | | | 0.57 | | | | 0.57 | | | | 0.58 | |
Ratio of net investment income to average net assets (%) | | | 2.39 | | | | 2.20 | | | | 2.09 | | | | 2.18 | | | | 2.32 | |
Portfolio turnover rate (%) | | | 19 | | | | 22 | | | | 16 | | | | 18 | | | | 13 | |
Net assets, end of period (in millions) | | $ | 312.2 | | | $ | 332.6 | | | $ | 325.7 | | | $ | 257.7 | | | $ | 223.3 | |
| | | | |
| (a) | | Per share amounts based on average shares outstanding during the period. |
| (b) | | Total return does not reflect any insurance, sales, separate account or administrative charges of variable annuity or life insurance contracts or any additional expenses that contract owners may bear under their variable contracts. If these charges were included, the returns would be lower. |
| (c) | | Includes the effects of management fee waivers (see Note 5 of the Notes to Financial Statements). |
See accompanying notes to financial statements.
BHFTII-23
Brighthouse Funds Trust II
MetLife Aggregate Bond Index Portfolio
Notes to Financial Statements—December 31, 2018
1. Organization
Brighthouse Funds Trust II (the “Trust”) is organized as a Delaware statutory trust and registered under the Investment Company Act of 1940, as amended (the “1940 Act”), as anopen-end management investment company. The Trust, which is managed by Brighthouse Investment Advisers, LLC (“Brighthouse Investment Advisers” or the “Adviser”), currently offers twenty-nine series, each of which operates as a distinct investment vehicle of the Trust. The series included in this report is MetLife Aggregate Bond Index Portfolio (the “Portfolio”), which is diversified. Shares of the Portfolio are not offered directly to the general public and are currently available only to separate accounts of insurance companies, including insurance companies affiliated with the Adviser (together, the “Insurance Companies”).
The Portfolio has registered and offers four classes of shares: Class A, B, E and G shares. Shares of each Class of the Portfolio represent an equal pro rata interest in the Portfolio and generally give the shareholder the same voting, dividend, liquidation, and other rights. Investment income, realized and unrealized capital gains and losses, the common expenses of the Portfolio, and certain Portfolio-level expense reductions, if any, are allocated on a pro rata basis to each Class based on the relative net assets of each Class to the net assets of the Portfolio. Each Class of shares differs in its respective distribution plan and such distribution expenses are allocated to the corresponding Class of shares.
2. Significant Accounting Policies
The preparation of financial statements in conformity with accounting principles generally accepted in the United States of America (“GAAP”) requires management to make estimates and assumptions that affect the reported amounts of assets and liabilities and disclosure of contingent assets and liabilities as of the date of the financial statements and the reported amounts of income and expenses during the reporting period. Actual results could differ from those estimates. In the preparation of these financial statements, management has evaluated events and transactions subsequent to December 31, 2018 through the date the financial statements were issued.
The Portfolio is an investment company and follows the accounting and reporting guidance of the Financial Accounting Standards Board (“FASB”) Accounting Standards Codification Topic946- Financial Services- Investment Companies. The following is a summary of significant accounting policies consistently followed by the Portfolio in the preparation of its financial statements.
Investment Valuation and Fair Value Measurements - The Portfolio values its portfolio investments for purposes of calculating its net asset value (“NAV”) using procedures approved by the Board of Trustees of the Trust (the “Board” or “Trustees”). Those procedures allow for a variety of methodologies to be used to value the Portfolio’s investments. The specific methodologies used for a particular investment may vary based on the market data available for a specific investment at the time the Portfolio calculates its NAV or based on other considerations. The procedures also permit a level of judgment to be used in the valuation process. The Portfolio follows the accounting and reporting guidance of FASB Accounting Standards Codification Topic820- Fair Value Measurement.
Debt securities, including corporate, convertible and municipal bonds and notes; obligations of the U.S. Treasury and U.S. government agencies; foreign sovereign issues; andnon-U.S. bonds, are generally valued on the basis of evaluated or composite bid quotations obtained from independent pricing services and/or brokers and dealers selected by the Adviser (each a “pricing service”), pursuant to authorization of and subject to general oversight by the Board. Such pricing services may use matrix pricing, which considers observable inputs including, among other things, issuer details, maturity dates, interest rates, yield curves, rates of prepayment, credit risks/spreads, default rates, reported trades, broker-dealer quotes and quoted prices for similar assets. Short-term obligations with a remaining maturity of sixty days or less may be valued at amortized cost in the absence of market quotes, so long as the amortized cost value of such short-term debt instrument is approximately the same as the fair value of the instrument as determined without the use of amortized cost valuation. Floating rate loans are generally valued on the basis of an evaluated or composite average of aggregate bid and ask quotations supplied by brokers or dealers, as obtained from the pricing service. Securities that use similar valuation techniques and inputs as described above are generally categorized as Level 2 within the fair value hierarchy.
Mortgage- and asset-backed securities are generally valued on the basis of evaluated or composite bid quotations obtained from pricing services selected by the Adviser pursuant to the authorization of and subject to general oversight by the Board. These securities are usually issued as separate tranches, or classes, of securities within each deal. The pricing models for these securities usually consider tranche-level attributes, current market data, estimated cash flows and market-based yield spreads for each tranche and incorporate deal collateral performance, as available. Mortgage- and asset-backed securities that use similar valuation techniques and inputs as described above are generally categorized as Level 2 within the fair value hierarchy.
Domestic and foreign equity securities, such as common stock, exchange-traded funds, rights, warrants, and preferred stock, that are traded on a securities exchange on a valuation date are generally valued at their last quoted sale price or official closing price on the primary exchange for such security, or, if no sales occurred on that day, at the last reported bid price. Equity securities tradedover-the-counter (“OTC”) are generally valued at the last reported bid price. In the event of a major exchange closing during the trading day, the Adviser may use other market information obtained from quotation reporting systems, established market makers, or
BHFTII-24
Brighthouse Funds Trust II
MetLife Aggregate Bond Index Portfolio
Notes to Financial Statements—December 31, 2018—(Continued)
pricing services in valuing the securities. Valuation adjustments may be applied to certain foreign equity securities that are traded solely on foreign exchanges that close before the time as of which the Portfolio determines its NAV to account for the market movement between the close of the foreign exchanges and the time as of which the Portfolio determines its NAV. The Portfolio may use a systematic fair valuation model provided by a pricing service to value securities principally traded in these foreign markets in order to adjust for possible market movements or other changes that may occur between the close of the foreign exchanges and the time as of which the Portfolio determines its NAV. Foreign equity securities valued using these valuation adjustments are generally categorized as Level 2 within the fair value hierarchy. Equity securities that are actively traded, and have no valuation adjustments applied, are categorized as Level 1 within the fair value hierarchy. Other equity securities traded on inactive markets, or valued in reference to similar instruments traded on active markets, are generally categorized as Level 2 within the fair value hierarchy.
Investments in registeredopen-end management investment companies are valued at reported NAV per share on the valuation date and are categorized as Level 1 within the fair value hierarchy.
Futures contracts that are traded on commodity exchanges are valued at their closing prices as of the close of such exchanges and are categorized as Level 1 within the fair value hierarchy.
If no current market value quotation or other observable inputs are readily available or market value quotations are deemed to be unreliable for an investment, the fair value of the investment will be determined in accordance with procedures approved by, and under the general supervision of, the Board. In such a circumstance, the Board will be assisted in its responsibility to determine the fair value of an investment by the Valuation Committee (“Committee”) of Brighthouse Investment Advisers. The Committee provides general pricing oversight and fair value pricing determinations related to portfolio securities and meets on a regular basis to review reports relating to the valuation of the securities in the Portfolio. The Board has delegated to State Street Bank and Trust Company, the Trust’s custodian (“Custodian”), the responsibility for calculating the NAVs of the Trust’s Portfolios. The Committee is responsible for overseeing the calculation of the NAVs of the Portfolios by the custodian. The Committee also periodically reviews pricing services, including the pricing services providing fair value pricing for the Portfolio’s foreign securities, and is responsible for overseeing the correction of pricing errors and addressing other pricing issues that arise in the ordinary course of business, such as making real-time fair value determinations, as necessary.
No single standard for determining the fair value of an investment can be set forth because fair value depends upon the facts and circumstances with respect to each investment. Information relating to any relevant factors may be obtained by the Committee from any appropriate source, including the subadviser of the Portfolio, the custodian, a pricing service, market maker and/or broker for such security or the issuer. Appropriate methodologies for determining fair value under particular circumstances may include: matrix pricing, a discounted cash flow analysis, comparisons of securities with comparable characteristics, value based on multiples of earnings, discount from market price of similar marketable securities, or a combination of these and other methods.
Investment Transactions and Related Investment Income - Portfolio security transactions are recorded on the trade date. Dividend income is recorded on theex-dividend date or, for certain foreign securities, when notified. Interest income, which includes amortization of premium and accretion of discount on debt securities, is recorded on the accrual basis. Realized gains and losses on investments are determined on the identified cost basis, which is the same basis used for federal income tax purposes. Foreign income and foreign capital gains on some foreign securities may be subject to foreign taxes, which are accrued as applicable. These foreign taxes have been provided for in accordance with the Portfolio’s understanding of the applicable countries’ tax rules and rates.
Dividends and Distributions to Shareholders -The Portfolio records dividends and distributions on theex-dividend date. Net realized gains from securities transactions (if any) are generally distributed annually to shareholders. The timing and characterization of certain income and capital gains distributions are determined in accordance with federal tax regulations that may differ from GAAP. Permanent book and tax basis differences relating to shareholder distributions will result in reclassification between distributable earnings (accumulated losses) andpaid-in surplus. These adjustments have no impact on net assets or the results of operations.
Income Taxes -It is the Portfolio’s policy to comply with the requirements of the Internal Revenue Code of 1986, as amended, and regulations thereunder, applicable to regulated investment companies, and to distribute, with respect to each taxable year, all of its taxable income to shareholders. Therefore, no federal income tax provision is required. The Portfolio files U.S. federal tax returns. No income tax returns are currently under examination. The Portfolio’s federal tax returns for the prior three fiscal years remain subject to examination by the Internal Revenue Service. As of December 31, 2018, the Portfolio had no uncertain tax positions that would require financial statement recognition, or derecognition or disclosure.
Mortgage-Related and Other Asset-Backed Securities - The Portfolio may invest in mortgage-related or other asset-backed securities. These securities may include mortgage pass-through securities, collateralized mortgage obligations (“CMOs”), commercial mortgage-backed securities, CMO residuals, stripped mortgage-backed securities (“SMBS”), and other securities that directly or indirectly represent a participation in, or are secured by or payable from, mortgage loans on real property or other receivables. The value of some mortgage- or asset-backed securities may be particularly sensitive to changes in prevailing interest rates. Early
BHFTII-25
Brighthouse Funds Trust II
MetLife Aggregate Bond Index Portfolio
Notes to Financial Statements—December 31, 2018—(Continued)
repayment of principal on some mortgage-related securities may expose the Portfolio to a lower rate of return upon reinvestment of principal. The value of these securities may fluctuate in response to the market’s perception of the creditworthiness of the issuers. Additionally, although mortgages and mortgage-related securities are generally supported by some form of government or private guarantee and/or insurance, there is no assurance that private guarantors or insurers will meet their obligations.
In one type of SMBS, one class receives all of the interest from the mortgage assets (the interest-only or “IO” class), while the other class will receive all of the principal (the principal-only or “PO” class). Because principal will not be received at the maturity of an IO, adjustments are made to the book value of the security until maturity. These adjustments are netted against payments received for the IOs and the net amount is included in interest income on the Statement of Operations of the Portfolio. Payments received for POs are treated as reductions to the cost and par value of the securities. Details of mortgage-related and other asset-backed securities held by the Portfolio are included in the Portfolio’s Schedule of Investments.
The Portfolio may invest a significant portion of its assets in securities of issuers that hold mortgage- and asset-backed securities and direct investments in securities backed by commercial and residential mortgage loans and other financial assets. The value and related income of these securities are sensitive to changes in economic conditions, including delinquencies and/or defaults, and may be negatively impacted by increased volatility of market prices and periods of illiquidity.
When-Issued and Delayed-Delivery Securities- The Portfolio may purchase securities on a when-issued or delayed-delivery basis. Settlement of such transactions will occur beyond the customary settlement period. The Portfolio may purchase securities under such conditions only with the intention of actually acquiring them, but may enter into a separate agreement to sell the securities before the settlement date. Since the value of securities purchased may fluctuate prior to settlement, the Portfolio may be required to pay more at settlement than the security is worth. In addition, the Portfolio is not entitled to any of the interest earned prior to settlement.
Upon making a commitment to purchase a security on a when-issued or delayed-delivery basis, the Portfolio will hold liquid assets in a segregated account with the Portfolio’s Custodian, or set aside liquid assets in the Portfolio’s records, worth at least the equivalent of the amount due. The liquid assets will be monitored on a daily basis and adjusted as necessary to maintain the necessary value.
Repurchase Agreements -The Portfolio may enter into repurchase agreements, under the terms of a Master Repurchase Agreement (“MRA”), with selected commercial banks and broker-dealers, under which the Portfolio acquires securities as collateral and agrees to resell the securities at an agreed-upon time and at an agreed-upon price. The Portfolio, through the Custodian or a subcustodian, under atri-party repurchase agreement, receives delivery of the underlying securities collateralizing any repurchase agreements. It is the Portfolio’s policy that the market value of the collateral be equal to at least 100% of the repurchase price in the case of a repurchase agreement ofone-day duration and equal to at least 102% of the repurchase price in the case of all other repurchase agreements. In the event of default or failure by a party to perform an obligation in connection with any repurchase transaction, the MRA gives thenon-defaulting party the right toset-off claims and to apply property held by it in connection with any repurchase transaction against obligations owed to it.
At December 31, 2018, the Portfolio invested cash collateral for loans of portfolio securities in repurchase agreements with a gross value of $40,975,622. The combined value of all repurchase agreements is included as part of investments at value on the Statement of Assets and Liabilities. The value of the related collateral exceeded the value of the repurchase agreements at December 31, 2018.
Securities Lending - The Portfolio may lend its portfolio securities to certain qualified brokers who borrow securities in order to complete certain securities transactions. By lending its portfolio securities, the Portfolio attempts to increase its net investment income through the receipt of income on collateral held from securities on loan. Any gain or loss in the market price of the loaned securities that might occur and any interest earned or dividends declared during the term of the loan would accrue to the account of the Portfolio.
The Trust has entered into aNon-Custodial Securities Lending Agreement with JPMorgan Chase Bank, N.A. (the “Lending Agent”). Under the agreement, the Lending Agent is authorized to loan portfolio securities on the Portfolio’s behalf. In exchange, the Portfolio receives either cash or U.S. government securities as collateral against the loaned securities. The Portfolio receives collateral equal to at least 102% of the market value for loans secured by government securities or cash in the same currency as the loaned shares and 105% for all other loaned securities at each loan’s inception. Collateral representing at least 100% of the market value of the loaned securities is maintained for the duration of the loan. Any cash collateral received by the Portfolio is generally invested by the Lending Agent in short-term investments, which may include certificates of deposit, commercial paper, repurchase agreements, time deposits, master demand notes and money market funds. The market value of investments made with cash collateral received are disclosed in the Schedule of Investments and the valuation techniques are described in Note 2. If the market value of the collateral at the close of trading on a business day is less than 100% of the market value of the loaned securities at the close of trading on that day, the borrower is required to deliver, by the close of business on the following business day, an additional amount of collateral, so that the total amount of posted collateral is equal to at least 100% of the market value of all the loaned securities as of such preceding day. A portion of the income earned on the collateral is rebated to the borrower of the securities and the remainder is split between the Lending Agent and the Portfolio. On loans collateralized by U.S. government securities, a fee is received from the borrower and is allocated between the Portfolio and the Lending Agent.
BHFTII-26
Brighthouse Funds Trust II
MetLife Aggregate Bond Index Portfolio
Notes to Financial Statements—December 31, 2018—(Continued)
Income received by the Portfolio in securities lending transactions during the year ended December 31, 2018 is reflected as securities lending income on the Statement of Operations. The values of any securities loaned by the Portfolio and the related collateral at December 31, 2018 are disclosed in the footnotes to the Schedule of Investments. The value of the related collateral received by the Portfolio exceeded the value of the securities out on loan at December 31, 2018.
The risks associated with lending portfolio securities include, but are not limited to, possible delays in receiving additional collateral or in the recovery of the loaned securities, possible loss of rights in the collateral should the borrower fail financially, as well as risk of loss in the value of the collateral or the value of the investments made with the collateral. The Lending Agent shall indemnify the Portfolio in the case of default of any securities borrower, subject to the terms of theNon-Custodial Securities Lending Agreement.
The following table provides a breakdown of transactions accounted for as secured borrowings, the gross obligations by the type of collateral pledged, and the remaining contractual maturities of those transactions, which are accounted for as secured borrowings.
| | | | | | | | | | | | | | | | | | | | |
| | | Remaining Contractual Maturity of the Agreements
As of December 31, 2018 | |
| | | Overnight and
Continuous | | | Up to
30 Days | | | 31 - 90
Days | | | Greater than
90 days | | | Total | |
| Securities Lending Transactions | |
Corporate Bonds & Notes | | $ | (78,660,011 | ) | | $ | — | | | $ | — | | | $ | — | | | $ | (78,660,011 | ) |
Foreign Government | | | (5,530,547 | ) | | | — | | | | — | | | | — | | | | (5,530,547 | ) |
U.S. Treasury & Government Agencies | | | (122,583,067 | ) | | | — | | | | — | | | | — | | | | (122,583,067 | ) |
Total | | $ | (206,773,625 | ) | | $ | — | | | $ | — | | | $ | — | | | $ | (206,773,625 | ) |
Total Borrowings | | $ | (206,773,625 | ) | | $ | — | | | $ | — | | | $ | — | | | $ | (206,773,625 | ) |
Gross amount of recognized liabilities for securities lending transactions | | | $ | (206,773,625 | ) |
| | | | | | | | | | | | | | | | | | | | |
3. Certain Risks
In the normal course of business, the Portfolio invests in securities and enters into transactions where risks exist. Those risks include:
Market Risk:The value of securities held by the Portfolio may decline in response to certain events, including those directly involving the issuers whose securities are owned by the Portfolio; conditions affecting the general economy; overall market changes; local, regional or global political, social or economic instability; and currency, interest rate, and price fluctuations.
Credit and Counterparty Risk: The Portfolio may be exposed to counterparty risk, or the risk that an entity with which the Portfolio has unsettled or open transactions may default. The potential loss could exceed the value of the financial assets and liabilities recorded in the financial statements. Financial assets that potentially expose the Portfolio to credit and counterparty risk consist principally of cash due from counterparties and investments. The Portfolio manages counterparty risk by entering into agreements only with counterparties that it believes have the financial resources to honor their obligations and by monitoring the financial stability of those counterparties. The Adviser attempts to mitigate counterparty risk by (i) periodically assessing the creditworthiness of its trading partners, (ii) monitoring and/or limiting the amount of its net exposure to each individual counterparty based on its assessment, and (iii) requiring collateral from the counterparty for certain transactions. In order to preserve certain safeguards fornon-standard settlement trades, the Portfolio restricts its exposure to credit and counterparty losses by entering into master netting agreements (“Master Agreements”) with counterparties (approved brokers) with whom it undertakes a significant volume of transactions. Master Agreements govern the terms of certain transactions, and reduce the counterparty risk associated with relevant transactions by specifying credit protection mechanisms and providing standardization that improves legal certainty. Master Agreements can also help limit counterparty risk by specifying collateral posting arrangements atpre-arranged exposure levels.
Additional risks associated with each type of investment are described above within the respective security type notes. The Portfolio’s prospectus includes a discussion of the principal risks of investing in the Portfolio.
4. Investment Transactions
Aggregate cost of purchases and proceeds of sales of investment securities, excluding short-term securities, for the year ended December 31, 2018 were as follows:
| | | | | | | | | | | | |
Purchases | | | Sales | |
U.S. Government | | Non-U.S. Government | | | U.S. Government | | | Non-U.S. Government | |
| $390,713,923 | | $ | 109,338,006 | | | $ | 464,633,592 | | | $ | 178,636,786 | |
BHFTII-27
Brighthouse Funds Trust II
MetLife Aggregate Bond Index Portfolio
Notes to Financial Statements—December 31, 2018—(Continued)
5. Investment Management Fees and Other Transactions with Affiliates
Investment Management Agreement -Brighthouse Investment Advisers is the investment adviser to the Portfolio. The Trust has entered into an investment management agreement with Brighthouse Investment Advisers with respect to the Portfolio. For providing investment management services to the Portfolio, Brighthouse Investment Advisers receives monthly compensation at the annual rate of 0.250% of average daily net assets. Fees earned by Brighthouse Investment Advisers with respect to the Portfolio for the year ended December 31, 2018 were $6,532,200.
Brighthouse Investment Advisers has entered into an investment subadvisory agreement with MetLife Investment Advisors, LLC (“MIA”) with respect to managing the Portfolio. For providing subadvisory services to the Portfolio, Brighthouse Investment Advisers has agreed to pay MIA an investment subadvisory fee for each class of the Portfolio as follows:
| | |
% per annum | | Average Daily Net Assets |
| 0.040% | | On the first $500 million |
| 0.030% | | Of the next $500 million |
| 0.015% | | On amounts over $1 billion |
Fees earned by MIA with respect to the Portfolio for the year ended December 31, 2018 were $591,932.
Management Fee Waivers -Pursuant to an expense agreement, Brighthouse Investment Advisers has agreed, for the period April 30, 2018 to April 30, 2019, to reduce its advisory fees set out above under “Investment Management Agreement” for each class of the Portfolio as follows:
| | |
% per annum | | Average Daily Net Assets |
| 0.005% | | Over $500 million and under $1 billion |
| 0.010% | | Of the next $1 billion |
| 0.015% | | On amounts over $2 billion |
An identical expense agreement was in place for the period May 1, 2017 to April 30, 2018. Amounts waived for the year ended December 31, 2018 are shown as management fee waivers in the Statement of Operations.
Certain officers and trustees of the Trust may also be officers of Brighthouse Investment Advisers; however, such officers and trustees receive no compensation from the Trust.
Transfer Agency Agreement -Brighthouse Financial, Inc. serves as the transfer agent for the Trust. Brighthouse Financial, Inc. receives no fees for its services to the Trust.
Distribution and Service Fees - The Trust has a distribution agreement with Brighthouse Securities, LLC (the “Distributor”) pursuant to which the Distributor serves as the general distributor of shares of each class (each a “Class”) of each Portfolio. The Distributor is an affiliate of the Trust. The Trust has adopted a Distribution and Services Plan (the “Plan”) relating to Class B, Class E and Class G shares of each Portfolio, under Rule 12b-1 under the 1940 Act, pursuant to which the Trust may pay the Distributor a fee (the “Service Fee”) at an annual rate not to exceed 0.25% of each such Portfolio’s average daily net assets attributable to the Class B, Class E and Class G shares of the Trust. Each Portfolio may not offer shares of each Class. The Plan also authorizes the Trust, on behalf of each of its Portfolios, may pay the Distributor a distribution Fee (the “Distribution Fee” and together with the Service Fee, the “Fees”) at an annual rate of up to 0.25% of each Portfolio’s average daily net assets attributable to the Class B, Class E and Class G shares in consideration of the services rendered in connection with the sale of such shares by the Distributor. Under the Distribution Agreement with respect to the Trust, Fees are currently paid at an annual rate of 0.25% of average daily net assets in the case of Class B shares, 0.15% of average daily net assets in the case of Class E shares and 0.30% of average daily net assets in the case of Class G shares. The Plan is known as a “compensation plan” because the Trust makes payments to the Distributor for services rendered regardless of the actual level of expenditures by the Distributor. Amounts incurred by the Portfolio for the year ended December 31, 2018 are shown as Distribution and service fees in the Statement of Operations.
Deferred Trustee Compensation -Each Trustee who is not currently an employee of the Adviser or any of its affiliates receives compensation from the Trust for his or her service to the Trust. A deferred compensation plan (the “Plan”) is available to the Trustees on a voluntary basis. Deferred amounts remain in the Trust until distributed in accordance with the provisions of the Plan. The value of a participating Trustee’s deferral account is based on theoretical investments of deferred amounts on the normal payment dates in certain portfolios of the Trust or Brighthouse Funds Trust I, an affiliate of the Trust, as designated by the participating Trustee. Changes in the value of participants’ deferral accounts are reflected as Trustees’ fees and expenses in the Statement of Operations. The portion of the accrued obligations allocated to the Portfolio under the Plan is reflected as Deferred trustees’ fees in the Statement of Assets and Liabilities.
BHFTII-28
Brighthouse Funds Trust II
MetLife Aggregate Bond Index Portfolio
Notes to Financial Statements—December 31, 2018—(Continued)
6. Contractual Obligations
Under the Trust’s organizational documents, its officers and Trustees may be indemnified against certain liabilities and expenses arising out of the performance of their duties to the Trust. Additionally, the Trust has a variety of indemnification obligations under contracts with its service providers. The Trust’s maximum exposure under these arrangements is unknown, as this would involve future claims that may be made against the Trust that have not yet occurred.
7. Income Tax Information
The cost basis of investments for federal income tax purposes at December 31, 2018 was as follows:
| | | | |
Cost basis of investments | | $ | 2,725,372,886 | |
| | | | |
Gross unrealized appreciation | | | 23,298,059 | |
Gross unrealized depreciation | | | (77,150,509 | ) |
| | | | |
Net unrealized appreciation (depreciation) | | $ | (53,852,450 | ) |
| | | | |
The tax character of distributions paid for the years ended December 31, 2018 and 2017 were as follows:
| | | | | | | | | | | | | | | | | | | | |
Ordinary Income | | | Long-Term Capital Gain | | | Total | |
2018 | | 2017 | | | 2018 | | | 2017 | | | 2018 | | | 2017 | |
| $76,529,760 | | $ | 75,615,243 | | | $ | — | | | $ | — | | | $ | 76,529,760 | | | $ | 75,615,243 | |
As of December 31, 2018, the components of distributable earnings (accumulated losses) on a federal income tax basis were as follows:
| | | | | | | | | | | | | | | | |
Undistributed
Ordinary
Income | | Undistributed
Long-Term
Capital Gain | | | Net
Unrealized
Depreciation | | | Accumulated
Capital Losses | | | Total | |
| $76,589,245 | | $ | — | | | $ | (53,852,450 | ) | | $ | (62,835,071 | ) | | $ | (40,098,276 | ) |
The Portfolio utilizes the provisions of the federal income tax laws that provide for the carryforward of capital losses for prior years, offsetting such losses against any future realized capital gains. Under the Regulated Investment Company Modernization Act of 2010, net capital losses recognized after December 22, 2010 may be carried forward indefinitely and their character is retained as short-term and/or long-term losses.
As of December 31, 2018, the Portfolio had accumulated short-term capital losses of $9,341,024 and accumulated long-term capital losses of $53,494,047.
8. Recent Accounting Pronouncements and SEC Update
In March 2017, FASB issued Accounting Standards UpdateNo. 2017-08 “Premium Amortization of Purchased Callable Debt Securities”, which amends the amortization period for certain purchased callable debt securities. Under the standards update, the premium amortization of purchased callable debt securities that have explicit,non-contingent call features and are callable at fixed prices will be amortized to the earliest call date. The guidance will be applied on a modified retrospective basis and is effective for fiscal years, and their interim periods, beginning after December 15, 2018. Management is currently assessing the impact of ASU 2017-08, but does not believe the adoption will have a material impact on the Portfolios’ financial statements.
In August 2018, the FASB issued Accounting Standards Update 2018-13, Fair Value Measurement (Topic 820)—Disclosure Framework—Changes to the Disclosure Requirements for Fair Value Measurement (“ASU 2018-13”) which introduces new fair value disclosure requirements as well as eliminates and modifies certain existing fair value disclosure requirements. ASU 2018-13 is effective for fiscal years beginning after December 15, 2019, and interim periods within those fiscal years. Early adoption is permitted and, as such, management has elected to early adopt ASU 2018-13 effective with the current reporting period. The impact of the Portfolio’s adoption was limited to changes in the Portfolio’s financial statement disclosures regarding fair value, primarily those disclosures related to transfers between levels of the fair value hierarchy.
In August 2018, the Securities and Exchange Commission released its Final Rule on Disclosure Update and Simplification (the “Final Rule”) which is intended to simplify an issuer’s disclosure compliance efforts by removing redundant or outdated disclosures requirements without significantly altering the mix of information provided to investors. Effective with the current reporting period, the Portfolio adopted the Final Rule with the most notable impacts being that the Portfolio is no longer required to present the components of distributable earnings on the Statement of Assets and Liabilities or the sources of distributions to shareholders and the amounts of undistributed net investment income on the Statements of Changes in Net Assets.
BHFTII-29
Brighthouse Funds Trust II
MetLife Aggregate Bond Index Portfolio
Report of Independent Registered Public Accounting Firm
To the Shareholders of MetLife Aggregate Bond Index Portfolio and the Board of Trustees of Brighthouse Funds Trust II:
Opinion on the Financial Statements and Financial Highlights
We have audited the accompanying statement of assets and liabilities, including the schedule of investments, of the MetLife Aggregate Bond Index Portfolio (the “Portfolio”), one of the portfolios constituting the Brighthouse Funds Trust II, as of December 31, 2018, the related statement of operations for the year then ended, the statements of changes in net assets for each of the two years in the period then ended, the financial highlights for each of the five years in the period then ended, and the related notes. In our opinion, the financial statements and financial highlights present fairly, in all material respects, the financial position of the MetLife Aggregate Bond Index Portfolio of the Brighthouse Funds Trust II as of December 31, 2018, the results of its operations for the year then ended, the changes in its net assets for each of the two years in the period then ended, and the financial highlights for each of the five years in the period then ended, in conformity with accounting principles generally accepted in the United States of America.
Basis for Opinion
These financial statements and financial highlights are the responsibility of the Portfolio’s management. Our responsibility is to express an opinion on the Portfolio’s financial statements and financial highlights based on our audits. We are a public accounting firm registered with the Public Company Accounting Oversight Board (United States) (PCAOB) and are required to be independent with respect to the Portfolio in accordance with the U.S. federal securities laws and the applicable rules and regulations of the Securities and Exchange Commission and the PCAOB.
We conducted our audits in accordance with the standards of the PCAOB. Those standards require that we plan and perform the audit to obtain reasonable assurance about whether the financial statements and financial highlights are free of material misstatement, whether due to error or fraud. The Portfolio is not required to have, nor were we engaged to perform, an audit of its internal control over financial reporting. As part of our audits we are required to obtain an understanding of internal control over financial reporting but not for the purpose of expressing an opinion on the effectiveness of the Portfolio’s internal control over financial reporting. Accordingly, we express no such opinion.
Our audits included performing procedures to assess the risks of material misstatement of the financial statements and financial highlights, whether due to error or fraud, and performing procedures that respond to those risks. Such procedures included examining, on a test basis, evidence regarding the amounts and disclosures in the financial statements and financial highlights. Our audits also included evaluating the accounting principles used and significant estimates made by management, as well as evaluating the overall presentation of the financial statements and financial highlights. Our procedures included confirmation of securities owned as of December 31, 2018, by correspondence with the custodian and brokers; when replies were not received from brokers, we performed other auditing procedures. We believe that our audits provide a reasonable basis for our opinion.
/s/ Deloitte & Touche LLP
Boston, Massachusetts
February 25, 2019
We have served as the auditor of one or more of the Brighthouse investment companies since 1983.
BHFTII-30
Brighthouse Funds Trust II
Trustees and Officers
MANAGEMENT OF THE TRUSTS
The Boards of Trustees (the “Board”) of Brighthouse Funds Trust I and Brighthouse Funds Trust II (“BHF I” and “BHF II”, respectively, and collectively the “Trusts”) supervise the Trusts and are responsible for representing the interests of shareholders. The Trustees, the Chairman of the Board and the Chairmen of each subcommittee are the same for both Trusts. The Trustees of each Trust meet periodically throughout the year to oversee the Portfolios’ activities, reviewing, among other things, each Portfolio’s performance and its contractual arrangements with various service providers. The Trustees of each Trust elect the officers of the Trust, who are responsible for administering the Trust’sday-to-day operations.
Trustees and Officers
The Trustees and executive officers of the Trusts, as well as their principal occupations during the past five years, are set forth below. Unless otherwise indicated, the business address of each is c/o Brighthouse Funds, One Financial Center, Boston, Massachusetts 02111. Each Trustee who is deemed an “interested person,” as such term is defined in the 1940 Act, is referred to as an “Interested Trustee.” Those Trustees who are not “interested persons,” as such term is defined in the 1940 Act, are referred to as “Independent Trustees.” There is no limit to the term a Trustee may serve. Trustees serve until their death, resignation or removal in accordance with the BHF I Trust’s and BHF II Trust’s respective organizational documents and policies adopted by the Boards of the respective Trusts from time to time. Officers hold office at the pleasure of each Board and serve until their removal or resignation in accordance with the Trusts’ respective organizational documents and policies adopted by the Board of each Trust from time to time.
| | | | | | | | | | |
Name and Year of Birth | | Current
Position(s)
Held with
Registrant | | Term of Office
and Length of
Time Served | | Principal Occupation(s) During the Past 5 Years(1) | | Number of
Portfolios in
Brighthouse Funds
Complex(2)
Overseen
by Trustee | | Other Directorships Held
by Trustee During
the Past 5 Years(1) |
| Interested Trustee |
John Rosenthal* (1960) | | Trustee | | Indefinite;
From
May
2016
(Trust I
and
Trust II) to
present | | Chief Investment Officer, Brighthouse Financial, Inc. (2017 to present); until 2017, Senior Managing Director and Head of Global Portfolio Management, MetLife, Inc. | | 72 | | None |
|
| Independent Trustees |
Dawn M. Vroegop (1966) | | Trustee and Chairman of the Board | | Indefinite;
From
December
2000
(Trust I)/
May
2009
(Trust II)
to present
as
Trustee;
From
May
2016
(Trust I
and
Trust II)
until
present as
Chairman | | Private Investor. | | 72 | | Trustee, Driehaus Mutual Funds.** |
BHFTII-31
Brighthouse Funds Trust II
Trustees and Officers—(Continued)
| | | | | | | | | | |
Name and Year of Birth | | Current
Position(s)
Held with
Registrant | | Term of Office
and Length of
Time Served | | Principal Occupation(s) During the Past 5 Years(1) | | Number of
Portfolios in
Brighthouse Funds
Complex(2)
Overseen
by Trustee | | Other Directorships Held
by Trustee During
the Past 5 Years(1) |
Stephen M. Alderman (1959) | | Trustee | | Indefinite;
From
December
2000
(Trust I)/
April
2012
(Trust II)
to present | | Shareholder in the law firm of Garfield and Merel, Ltd. | | 72 | | None |
| | | | | |
Robert J. Boulware (1956) | | Trustee | | Indefinite;
From
March
2008
(Trust I)/
April
2012
(Trust II)
to present | | Managing Director, Pilgrim Funds, LLC (private equity fund). | | 72 | | Trustee, Vertical Capital Income Fund(closed-end fund);** Director, Gainsco, Inc. (auto insurance);** Trustee, SharesPost 100 Fund(closed-end fund).** |
| | | | | |
Susan C. Gause (1952) | | Trustee | | Indefinite;
From
March
2008
(Trust I)/
April
2012
(Trust II)
to present | | Private Investor. | | 72 | | Trustee, HSBC Funds.** |
| | | | | |
Nancy Hawthorne (1951) | | Trustee | | Indefinite;
From
May
2003
(Trust II)/
April
2012
(Trust I) to
present | | Partner, Hawthorne Financial Advisors, LLC (registered investment advisor); until 2014, Chief Executive Officer, Clerestory LLC (corporate advisor). | | 72 | | Director and Chairman of the Board of Directors, THL Credit, Inc.;** Director and Chairman of the Board, Avid Technology, Inc.;** Director, CRA International, Inc.** |
| | | | | |
Barbara A. Nugent (1956) | | Trustee | | Indefinite;
From
January
2014
(Trust I
and
Trust II) to
present | | President, True North Board Governance, LLC (consulting); until December 2013, partner in the law firm of Stradley Ronon Stevens & Young, LLP. | | 72 | | Independent Lead Trustee, BMT Investment Funds** |
| | | | | |
Christopher J. Towle (1957) | | Trustee | | Indefinite;
From
April
2018
(Trust I
and
Trust II) to
present | | Retired; until 2014, Partner, Portfolio Manager, Director of High Yield and Convertible Strategies, Lord Abbett & Co. | | 72 | | Trustee, Driehaus Mutual Funds** |
BHFTII-32
Brighthouse Funds Trust II
Trustees and Officers—(Continued)
Officers
| | | | | | |
Name and Year of Birth | | Position(s)
Held with
Registrant | | Length of
Time Served | | Principal Occupation(s)
During the Past 5 Years(1) |
| Executive Officers | | | | | | |
Kristi Slavin (1973) | | President and Chief Executive Officer, of Trust I and Trust II | | From May
2016
(Trust I
and
Trust II) to
present | | President, Brighthouse Investment Advisers, LLC (2016-present); formerly, Senior Vice President, MetLife Advisers, LLC; Vice President, MetLife, Inc.; Vice President, Trust I and Trust II(2015-2016). |
| | | |
Alan R. Otis (1971) | | Chief Financial Officer and Treasurer, of Trust I and Trust II | | From
November
2017
(Trust I
and
Trust II) to
present | | Senior Vice President, Brighthouse Investment Advisers, LLC (2017-present); formerly, Vice President, Brighthouse Investment Advisers, LLC (2012-2017); Assistant Treasurer, Trust I and Trust II(2012-2017). |
| | | |
Andrew L. Gangolf (1954) | | Secretary, of Trust I and Trust II | | From May
2011
(Trust I
and
Trust II) to
present | | Executive Vice President, Brighthouse Investment Advisers, LLC (2017-present); formerly, Senior Vice President, MetLife Advisers, LLC (2011-2017); until 2011, Senior Vice President & Assistant General Counsel, AllianceBernstein Investments, Inc. |
| | | |
Steven E. Hartstein (1963) | | Chief Compliance Officer (“CCO”), of Trust I and Trust II | | From
February
2014
(Trust I
and
Trust II) to
present | | Senior Vice President and CCO, Brighthouse Investment Advisers, LLC (2017-present); Head of Investments Compliance, Vice President, Brighthouse Financial, Inc. (2017-present); formerly, Vice President, MetLife, Inc. (2013-2017); Senior Vice President and CCO, MetLife Advisers, LLC (2013-2017.) |
| | | |
Victor Soto (1978) | | Vice President of Trust I and Trust II | | From May
2018
(Trust I
and
Trust II) to
present | | Executive Vice President, Brighthouse Investment Advisers, LLC (2016-present); Assistant Vice President, MetLife Inc. (2015-2017); Portfolio Manager, 1st Global (2013-2015). |
| * | Mr. Rosenthal is an “interested person” of the Trusts because of his position with Brighthouse Financial, Inc., the current parent company of Brighthouse Investment Advisers, LLC. |
| ** | Indicates a directorship with a registered investment company or a company subject to the reporting requirements of the Securities Exchange Act of 1934, as amended. |
| (1) | Previous positions during the past five years with the Trusts, Brighthouse Financial, Inc., MetLife, Inc. or the Manager are omitted if not materially different. |
| (2) | The Fund Complex includes 43 BHF I Portfolios and 29 BHF II Portfolios. |
BHFTII-33
Brighthouse Funds Trust II
MetLife Aggregate Bond Index Portfolio
Board of Trustees’ Consideration of Advisory and Sub-Advisory Agreements
At anin-person meeting held on November6-8, 2018 (the “November Meeting”), the Boards of Trustees (the “Board”) of Brighthouse Funds Trust I and Brighthouse Funds Trust II (“BFT I” and “BFT II,” respectively, and collectively, the “Trusts”), including a majority of the Trustees who are not “interested persons” of the Trusts (the “Independent Trustees”) under the Investment Company Act of 1940 (the “1940 Act”), approved the continuation of the Trusts’ advisory agreements (each, an “Advisory Agreement”) with Brighthouse Investment Advisers, LLC (the “Adviser”) and the applicablesub-advisory agreements (each a “Sub-Advisory Agreement,” and collectively with the Advisory Agreement, the “Agreements”) between the Adviser and the investmentsub-advisers (each a “Sub-Adviser,” and collectively, the “Sub-Advisers”) for the series of the Trusts (each a “Portfolio,” and collectively, the “Portfolios”).
In making those approvals, the Board reviewed a variety of materials that were provided for the specific purpose of the annual contract renewal process. In addition, various materials provided to and discussed with the Board throughout the year informed the Board’s decision to renew the Agreements. In particular, the information for each Portfolio included, but was not limited to, investment performance reports, and reports on expenses, legal and compliance matters, asset pricing, brokerage commissions and trade execution.
The Board met in person with personnel of the Adviser on October 17, 2018 for the specific purpose of giving preliminary consideration to the proposed continuation of the Agreements (the “October Meeting”). At that meeting, the Adviser reviewed with the Board the performance and fees experienced by each Portfolio, as well as other information. During and after the October Meeting, the Independent Trustees communicatedfollow-up matters for management to address at the November Meeting. The Independent Trustees were advised by independent legal counsel throughout the contract renewal process, and met with independent legal counsel in several executive sessions outside of the presence of management.
Information furnished and reviewed specifically in connection with the renewal process included, but was not limited to, a report for each Portfolio that was prepared by Broadridge (“Broadridge”), an independent organization. In addition, the Independent Trustees reviewed a report that was prepared by JDL Consultants, LLC (“JDL”), an independent consultant to the Independent Trustees (“JDL Report”), which examined the comparative fees, expenses and performance of each Portfolio, based upon the Broadridge reports. Also, the Board reviewed the responses to wide-ranging questions from the Independent Trustees relating to the business, operations and performance of the Adviser and theSub-Advisers that the Adviser andSub-Advisers had prepared specifically for the renewal process, and reviewed aPortfolio-by-Portfolio analysis of the profitability to the Adviser of each Advisory Agreement, which was prepared by the Adviser for the renewal process.
At the November Meeting, the Board, including a majority of the Independent Trustees, concluded that the nature, extent and quality of services provided by the Adviser and eachSub-Adviser supported the renewal of the Agreements. The Board also concluded that the investment performance of each Portfolio was such that each Agreement should continue, and that the fees paid by each Portfolio to the Adviser appeared to be reasonable in light of the nature, extent and quality of the services provided by the Adviser andSub-Adviser. Further, the Board concluded that the Adviser’s profitability in providing services under the Advisory Agreements did not appear unreasonable in light of the nature, extent and quality of the services provided by the Adviser. Finally, the Board reviewed the extent to which the investment advisory fees paid by the Portfolios shared economies of scale with investors or entailed the potential to share economies of scale with investors and concluded that those considerations generally supported the renewal of each Agreement. In approving the renewal of each of the Agreements, the Board, including the Independent Trustees, gave attention to all of the information that was furnished and each Trustee placed varying degrees of importance on the various pieces of information that were provided to them. The Board evaluated the information available to it on aPortfolio-by-Portfolio basis, and its decision was made separately with respect to each Portfolio. The following paragraphs provide more information about some of the primary factors that were relevant to the Board’s decision. The Board did not identify any single factor as determinative, and the Trustees generally attributed different weights to various factors for the various Portfolios.
Nature, extent and quality of services. The Board evaluated the nature, extent and quality of the services that the Adviser and theSub-Advisers, as relevant, have provided to the Portfolios. The Board considered the Adviser’s services as investment manager to the Portfolios, including its services relating to the hiring and oversight of theSub-Advisers, trading practices and oversight of transition management (as applicable), compliance programs and personnel, and risk management, among other things. The Adviser’s services in coordinating and overseeing the activities of the Trusts’ other service providers were also considered. The Board considered information received from the Trusts’ Chief Compliance Officer (“CCO”) regarding the Portfolios’ compliance policies and procedures that were established pursuant to Rule38a-l under the 1940 Act. The Board also noted that the Adviser’s investment, compliance and legal staff conduct regular and periodic telephonic andin-person meetings with theSub-Advisers to review and assess the services that are provided to the Portfolios, and that personnel of the Adviser prepare and present reports to the Independent Trustees regarding those meetings. In addition, throughout the year, the Board considered the expertise, experience and performance of the personnel of the Adviser who performed the various services that are mentioned above.
BHFTII-34
Brighthouse Funds Trust II
MetLife Aggregate Bond Index Portfolio
Board of Trustees’ Consideration of Advisory and Sub-Advisory Agreements—(Continued)
With respect to the services provided by each of theSub-Advisers, the Board considered a variety of information that the Adviser and eachSub-Adviser prepared for the Board’s review. The Board considered eachSub-Adviser’s investment process and philosophy, and the investment performance experienced by the Portfolio (as described in more detail below). The Board took into account that eachSub-Adviser’s responsibilities include the development and maintenance of an investment program for the applicable Portfolio that is consistent with the Portfolio’s investment objectives, the selection of investment securities and the placement of orders for the purchase and sale of such securities, as well as the implementation of compliance controls related to performance of these services. In particular, the Board considered, among other things, theSub-Adviser’s current level of staffing as well as its compensation program and its overall resources. The Board reviewed eachSub-Adviser’s history and investment experience, as well as information provided regarding the qualifications, background and responsibilities of theSub-Adviser’s investment and compliance personnel who provide services to the Portfolios. The Board also considered, among other things, eachSub-Adviser’s compliance program and regulatory and disciplinary history. In its review, the Board also took into account information regarding any services and/or payments provided to the Adviser by theSub-Advisers in connection with marketing activities and considered representations from the Adviser that those payments were not considered in the Adviser’s recommendation to renew any of theSub-Advisory Agreements.
Performance. The Board placed emphasis on the performance of each Portfolio in light of, among other things, its importance to investors. The Board considered the Adviser’s quarterly reviews with the Board of detailed information about each Portfolio’s investment strategies and performance results and composition, including discussions regarding the relevant effect of current market conditions. The Board reviewed and considered the reports prepared by Broadridge, which provided a statistical analysis comparing the Portfolios’ investment performance to that of comparable funds underlying variable insurance products (the “Performance Universe”). The Independent Trustees also met separately with representatives of JDL during the October Meeting to review the JDL Report. The Board also compared the performance records of the Portfolios to those of comparable funds and other accounts that were managed by the relevantSub-Adviser, to the extent such information was available. The Board considered each Portfolio’s performance for periods subsequent to the performance period covered by the Broadridge reports, and the Adviser’s discussion of the same, including the effect of current market conditions on each Portfolio’s more recent performance. The Board also noted that while it found the data provided by Broadridge generally useful, it recognized the limitations of such data, including, in particular, that notable differences may exist between a Portfolio and those of the other funds in a Broadridge category (for example, the investment objectives(s) and investment strategies) and that the results of the performance comparisons may vary depending on (i) the end dates for the performance periods that were selected and (ii) the selection of the peer groups.
The Board focused particular attention on Portfolios with less favorable performance records. The Board noted the Adviser’s focus on eachSub-Adviser’s performance and that the Adviser has been active in monitoring and responding to any performance issues with respect to the Portfolios.
Fees and Expenses. The Board gave consideration to the level and method of computing the fees payable under the Agreements. The Board considered the Broadridge report for each of the Portfolios, which included comparisons for each Portfolio of its contractual management andsub-adviser fees (at current and various asset levels), and total expenses, with those of its peers, including as those peers were divided into a broad group of peer funds (“Expense Universe”), a narrower group of peer funds (“Expense Group”), a broad group of peersub-advised funds (“Sub-advised Expense Universe”), and a narrower group of peersub-advised funds (“Sub-advised Expense Group”). Broadridge selected the peer funds which were similarly situated funds underlying variable insurance products deemed to be comparable to the Portfolios. The Independent Trustees, with the assistance of JDL, also examined the JDL Report. The Board compared the fee payable to aSub-Adviser by the Adviser with respect to the Portfolio to the fee payable to theSub-Adviser by other comparable funds and other accounts, to the extent such information was available.
The Board noted that thesub-advisory fees for the Portfolios are paid by the Adviser out of the advisory fees, and that the Adviser negotiates the fees at arm’s length. The Board also considered that the Adviser had entered into expense limitation or management fee waiver agreements with certain of the Portfolios pursuant to which the Adviser had agreed to waive a portion of its advisory fee and/or reimburse certain expenses as a means of limiting a Portfolio’s total annual operating expenses.
Profitability. The Board examined the profitability to the Adviser of each Advisory Agreement, on aPortfolio-by-Portfolio basis. The Board also considered that an affiliate of the Adviser, Brighthouse Securities, LLC, serves as distributor for the Trusts, and, as such, receives Rule12b-1 payments to support the distribution of the Portfolios. The Board considered the profitability to theSub-Advisers and their affiliates as a result of their relationships with the Portfolios, to the extent available, and the Board considered the ability of the Adviser to negotiate with aSub-Adviser at arm’s length. In reviewing the profitability analyses, the Board recognized that expense allocation methodologies are inherently subjective and various expense allocation methodologies may be reasonable while producing different results.
BHFTII-35
Brighthouse Funds Trust II
MetLife Aggregate Bond Index Portfolio
Board of Trustees’ Consideration of Advisory and Sub-Advisory Agreements—(Continued)
Economies of scale. The Board also considered each Portfolio’s fees in light of its size. The Board noted the fee schedules for the Portfolios that contain breakpoints that reduce the fee rate above specified asset levels. The Board noted those Portfolios that did not have breakpoints in their advisory fee and took into account management’s discussion of the same. The Board noted that those Portfolios with Advisory Agreements containing breakpoints generally have breakpoints in the correspondingSub-Advisory Agreement. The Board considered the effective fees under the Advisory Agreement andSub-Advisory Agreement for each Portfolio as a percentage of assets at different asset levels and possible economies of scale that may be realized if the assets of the Portfolio grow. The Board examined, among other data, the effect of a Portfolio’s growth in size, and reduction in size, on various fee schedules and the Board reviewed the Broadridge and JDL Reports, which compared fees among peers. The Board also generally noted that if a Portfolio’s assets increase over time, the Portfolio may realize other economies of scale if assets increase proportionally more than certain other fixed expenses.
Other factors. The Board considered other benefits that may be realized by the Adviser and its affiliates from their relationship with the Trusts. Among them, the Board recognized that Brighthouse Securities, LLC, as the distributor for the Trusts, receives payments pursuant to Rule12b-1 from the Portfolios to compensate for the provision of shareholder services and distribution activities, which could lead to growth in the Trusts’ assets and corresponding benefits from such growth, including economies of scale. The Board considered other benefits that may be realized by eachSub-Adviser and its affiliates from their relationship with the Trusts, including the opportunity to provide advisory services to additional portfolios of the Trusts and reputational benefits. In conjunction with these considerations, the Board noted the ongoing commitment of the Adviser to the Portfolios.
The Board requested, received, and considered information from the Adviser regarding possible conflicts of interest in the form of material benefits to the Adviser resulting from the Adviser’s affiliations and business relationships, as relevant. The Board considered the services that are provided to the Trusts by its service providers, and the manner in which any conflicts were mitigated.
* * *
MetLife Aggregate Bond Index Portfolio. The Board also considered the following information in relation to the Agreements with the Adviser and MetLife Investment Advisors, LLC regarding the Portfolio:
Among other data relating specifically to the Portfolio’s performance, the Board considered that the Portfolio underperformed the median of its Performance Universe and the average of its Morningstar Category for theone-, three-, and five-year periods ended June 30, 2018. The Board further considered that the Portfolio underperformed its benchmark, the Bloomberg Barclays U.S. Aggregate Bond Index, for theone-, three-, and five-year periods ended September 30, 2018. The Board took into account management’s discussion of the Portfolio’s performance, including prevailing market conditions.
The Board also considered that the Portfolio’s actual management fees were equal to the Expense Group median, below the Expense Universe median, and above theSub-advised Expense Universe median. The Board further considered that the Portfolio’s total expenses (exclusive of12b-1 fees) were equal to the Expense Group median but below the Expense Universe median and theSub-advised Expense Universe median. The Board noted that the Portfolio’s contractual management fees were below the asset-weighted average of comparable funds selected by Broadridge at the Portfolio’s current size. The Board also noted that the Portfolio’s contractualsub-advisory fees were below the averages of theSub-advised Expense Group andSub-advised Expense Universe at the Portfolio’s current size.
BHFTII-36
Brighthouse Funds Trust II
MetLife Mid Cap Stock Index Portfolio
Managed by MetLife Investment Advisors, LLC
Portfolio Manager Commentary*
PERFORMANCE
For the 12 months ended December 31, 2018, the Class A, B, E, and G shares of the MetLife Mid Cap Stock Index Portfolio returned-11.30%,-11.51%,-11.44%, and-11.56%, respectively. The Portfolio’s benchmark, the Standard & Poor’s (“S&P”) MidCap 400 Index1, returned-11.08%.
MARKET ENVIRONMENT / CONDITIONS
Equity markets ended the period down with outperformance in the middle of the year bracketed by underperformance during the first and fourth quarters. The main concerns during the year were slowing global growth, political unrest in Europe, a more hawkish Federal Reserve (the “Fed”), and continued fears about a global trade war. Equity markets were impacted as the10-year Treasury yield reached its highest level since 2014, which was driven by a more hawkish Fed and higher than expected wage growth. Equity markets also feared the impact of President Trump’s plan to impose tariffs on steel and aluminum imports and Fed Chair Powell’s Congressional testimony during the first quarter where he hinted at the possibility of four rate hikes during the year. Other issues equity investors were concerned about included unrest in the Middle East, political uncertainty in Italy, and the U.S. withdrawal from the Iran nuclear deal. In the middle of the year, equity markets rallied as trade negotiations eased concerns of a global trade war and leaders of North and South Korea met for the first time since 2007. Equity markets also reacted favorably after Fed Chair Powell made dovish comments in the third quarter during the Jackson Hole symposium and progress was made with trade negotiations with the European Union and the North American Free Trade Agreement. Equity markets underperformed again towards the end of the year on concerns about a weakening global economy, the partial U.S. government shut-down, and continued uncertainty surrounding Brexit.
During the year, the Federal Open Market Committee (the “FOMC”) met eight times and raised the target for the Federal Funds Rate four times from a range of 1.25%—1.50% to a range of 2.25%—2.50%. The FOMC stated that the labor market had continued to strengthen, and that economic activity had been rising at a strong rate. The FOMC also stated that job gains had been strong, and the unemployment rate had remained low.
Three of the eleven sectors comprising the S&P MidCap 400 Index experienced positive returns for the year. Utilities (5.3% beginning weight in the benchmark), up 6.7%, was the best-performing sector. Health Care (7.5% beginning weight), up 6.5%; and Communication Services (0.1% beginning weight), up 0.2%, were the next best-performing sectors. Energy (4.3% beginning weight), down 29.4%; Materials (7.2% beginning weight), down 20.4%; and Consumer Discretionary (12.1% beginning weight), down 17.6%, were the worst-performing sectors.
The stocks with the largest positive impact on the Portfolio return for the year were Abiomed (sold on 5/30/18), up 107.3%; Bioverativ (acquired on 3/17/18), up 94.1%; and Fortinet (sold on 10/10/18), up 82.1%. The stocks with the largest negative impact were Thor Industries, down 64.8%; Coherent, down 62.5%; and ManpowerGroup, down 47.4% (all three were held throughout the entire year).
PORTFOLIO REVIEW / PERIOD END POSITIONING
The Portfolio is managed utilizing a full replication strategy versus the S&P MidCap 400 Index. This strategy seeks to replicate the performance of the Index by owning all of the components of the Index at their respective Index capitalization weights. The Portfolio is periodically rebalanced for compositional changes in the S&P MidCap 400 Index. Factors that impact tracking error include transaction costs, cash drag, securities lending activity, Net Asset Value rounding, contributions, and withdrawals.
Stacey Lituchy
Norman Hu
Mirsad Usejnoski
Portfolio Managers
MetLife Investment Advisors, LLC
* This commentary may include statements that constitute “forward-looking statements” under the U.S. securities laws. Forward-looking statements include, among other things, projections, estimates, and information about possible or future results related to the Portfolio, market or regulatory developments. The views expressed above are not guarantees of future performance or economic results and involve certain risks, uncertainties and assumptions that could cause actual outcomes and results to differ materially from the views expressed herein. The views expressed above are subject to change at any time based upon economic, market, or other conditions and the subadvisory firm undertakes no obligation to update the views expressed herein. Any discussions of specific securities should not be considered a recommendation to buy or sell those securities. The views expressed above (including any forward-looking statement) may not be relied upon as investment advice or as an indication of the Portfolio’s trading intent. Information about the Portfolio’s holdings, asset allocation or country diversification is historical and is not an indication of future Portfolio composition, which may vary. Direct investment in any index is not possible. The performance of any index mentioned in this commentary has not been adjusted for ongoing management, distribution and operating expenses, and sales charges applicable to mutual fund investments. In addition, the returns do not reflect additional fees charged by separate accounts or variable insurance contracts that an investor in the Portfolio may pay. If these additional fees were reflected, performance would have been lower.
BHFTII-1
Brighthouse Funds Trust II
MetLife Mid Cap Stock Index Portfolio
A $10,000 INVESTMENT COMPARED TO THE S&P MIDCAP 400 INDEX
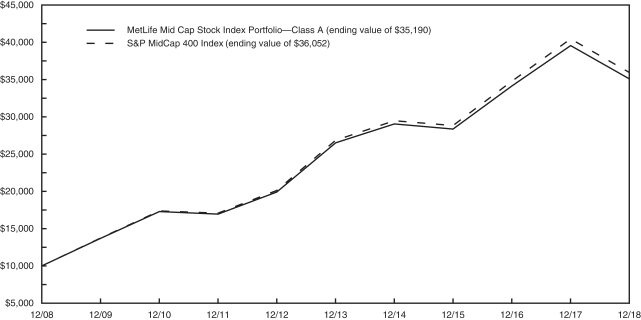
AVERAGE ANNUAL RETURNS (%) (FOR THE YEAR ENDED DECEMBER 31, 2018)
| | | | | | | | | | | | | | | | |
| | | | | |
| | | 1 Year | | | 5 Year | | | 10 Year | | | Since Inception2 | |
| MetLife Mid Cap Stock Index Portfolio | | | | | | | | | | | | | | | | |
Class A | | | -11.30 | | | | 5.78 | | | | 13.41 | | | | — | |
Class B | | | -11.51 | | | | 5.51 | | | | 13.13 | | | | — | |
Class E | | | -11.44 | | | | 5.62 | | | | 13.24 | | | | — | |
Class G | | | -11.56 | | | | 5.47 | | | | — | | | | 13.30 | |
| S&P MidCap 400 Index | | | -11.08 | | | | 6.03 | | | | 13.68 | | | | — | |
1 The S&P MidCap 400 Index is an unmanaged index measuring the performance of the mid-size company segment of the U.S. market. The Index consists of 400 domestic stocks chosen for market size, liquidity, and industry group representation.
2 Inception dates of the Class A, Class B, Class E and Class G shares are 7/5/00, 1/2/01, 5/1/01 and 4/28/09, respectively.
Portfolio performance is calculated including reinvestment of all income and capital gain distributions. Performance numbers are net of all Portfolio expenses but do not include any insurance, sales, separate account or administrative charges of variable annuity or life insurance contracts or any additional expenses that participants may bear relating to the operations of their plans. If these charges were included, the returns would be lower. The performance of any index referenced above has not been adjusted for ongoing management, distribution and operating expenses, and sales charges applicable to mutual fund investments. Direct investment in any index is not possible. The performance of Class A shares, as set forth in the line graph above, will differ from that of other classes because of the difference in expenses paid by policyholders investing in the different share classes.
This information represents past performance and is not indicative of future results. Investment return and principal value may fluctuate so that shares, upon redemption, may be worth more or less than the original cost.
PORTFOLIO COMPOSITION AS OF DECEMBER 31, 2018
Top Holdings
| | | | |
| | | % of
Net Assets | |
| SPDR S&P MidCap 400 ETF Trust | | | 1.9 | |
| Teleflex, Inc. | | | 0.8 | |
| Atmos Energy Corp. | | | 0.7 | |
| Domino’s Pizza, Inc. | | | 0.7 | |
| IDEX Corp. | | | 0.6 | |
| UGI Corp. | | | 0.6 | |
| Alleghany Corp. | | | 0.6 | |
| STERIS plc | | | 0.6 | |
| PTC, Inc. | | | 0.6 | |
| Reinsurance Group of America, Inc. | | | 0.6 | |
Top Sectors
| | | | |
| | | % of
Net Assets | |
| Financials | | | 17.8 | |
| Industrials | | | 15.0 | |
| Information Technology | | | 14.8 | |
| Consumer Discretionary | | | 11.4 | |
| Health Care | | | 9.7 | |
| Real Estate | | | 9.4 | |
| Materials | | | 6.4 | |
| Utilities | | | 5.5 | |
| Energy | | | 3.6 | |
| Consumer Staples | | | 2.9 | |
BHFTII-2
Brighthouse Funds Trust II
MetLife Mid Cap Stock Index Portfolio
Understanding Your Portfolio’s Expenses
Shareholder Expense Example
As a shareholder of the Portfolio, you incur ongoing costs, including management fees; distribution and service(12b-1) fees; and other Portfolio expenses. This example is intended to help you understand your ongoing costs (in dollars) (referred to as “expenses”) of investing in the Portfolio and compare these costs with the ongoing costs of investing in other mutual funds. The example is based on an investment of $1,000 invested at the beginning of the period and held for the entire period, July 1, 2018 through December 31, 2018.
Actual Expenses
The first line for each share class of the Portfolio in the table below provides information about actual account values and actual expenses. You may use the information in this line, together with the amount you invested in the particular share class of the Portfolio, to estimate the expenses that you paid over the period. Simply divide your account value by $1,000 (for example, an $8,600 account value divided by $1,000 = 8.6), then multiply the result by the number in the first line under the heading entitled “Expenses Paid During Period” to estimate the expenses you paid on your account during this period.
Hypothetical Example for Comparison Purposes
The second line for each share class of the Portfolio in the table below provides information about hypothetical account values and hypothetical expenses based on the Portfolio’s actual expense ratio and an assumed rate of return of 5% per year before expenses, which is not the Portfolio’s actual return. The hypothetical account values and expenses may not be used to estimate the actual ending account balance or expenses you paid for the period. You may use this information to compare the ongoing costs of investing in the Portfolio and other funds. To do so, compare this 5% hypothetical example with the 5% hypothetical examples that appear in the shareholder reports of the other funds.
Please note that the expenses shown in the table are meant to highlight your ongoing costs only and do not reflect any fees or charges of your variable insurance product or any additional expenses that participants in certain eligible qualified plans may bear relating to the operations of their plan. Therefore, the second line for each share class in the table is useful in comparing ongoing costs only, and will not help you determine the relative total costs of owning different funds. In addition, if these other costs were included, your costs would have been higher.
| | | | | | | | | | | | | | | | | | |
MetLife Mid Cap Stock Index Portfolio
| | | | Annualized
Expense
Ratio | | | Beginning
Account Value
July 1,
2018 | | | Ending
Account Value
December 31,
2018 | | | Expenses Paid
During Period**
July 1, 2018
to
December 31,
2018 | |
Class A (a) | | Actual | | | 0.29 | % | | $ | 1,000.00 | | | $ | 858.00 | | | $ | 1.36 | |
| | Hypothetical* | | | 0.29 | % | | $ | 1,000.00 | | | $ | 1,023.74 | | | $ | 1.48 | |
| | | | | |
Class B (a) | | Actual | | | 0.54 | % | | $ | 1,000.00 | | | $ | 857.40 | | | $ | 2.53 | |
| | Hypothetical* | | | 0.54 | % | | $ | 1,000.00 | | | $ | 1,022.48 | | | $ | 2.75 | |
| | | | | |
Class E (a) | | Actual | | | 0.44 | % | | $ | 1,000.00 | | | $ | 857.40 | | | $ | 2.06 | |
| | Hypothetical* | | | 0.44 | % | | $ | 1,000.00 | | | $ | 1,022.99 | | | $ | 2.24 | |
| | | | | |
Class G (a) | | Actual | | | 0.59 | % | | $ | 1,000.00 | | | $ | 856.90 | | | $ | 2.76 | |
| | Hypothetical* | | | 0.59 | % | | $ | 1,000.00 | | | $ | 1,022.23 | | | $ | 3.01 | |
| * | Hypothetical assumes a rate of return of 5% per year before expenses. |
| ** | Expenses paid are equal to the Portfolio’s annualized expense ratio for the most recent six month period, as shown above, multiplied by the average account value over the period, multiplied by the number of days (184 days) in the most recent fiscal half-year, divided by 365 (to reflect theone-half year period). |
| (a) | The annualized expense ratio shown reflects the impact of the management fee waiver as described in Note 6 of the Notes to Financial Statements. |
BHFTII-3
Brighthouse Funds Trust II
MetLife Mid Cap Stock Index Portfolio
Schedule of Investments as of December 31, 2018
Common Stocks—97.1% of Net Assets
| | | | | | | | |
| Security Description | | Shares | | | Value | |
|
| Aerospace & Defense—1.0% | |
Curtiss-Wright Corp. | | | 26,642 | | | $ | 2,720,681 | |
Esterline Technologies Corp. (a) | | | 16,163 | | | | 1,962,996 | |
Teledyne Technologies, Inc. (a) | | | 21,951 | | | | 4,545,394 | |
| | | | | | | | |
| | | | | | | 9,229,071 | |
| | | | | | | | |
|
| Airlines—0.3% | |
JetBlue Airways Corp. (a) (b) | | | 185,432 | | | | 2,978,038 | |
| | | | | | | | |
|
| Auto Components—0.8% | |
Adient plc (c) | | | 52,844 | | | | 795,831 | |
Dana, Inc. | | | 88,013 | | | | 1,199,617 | |
Delphi Technologies plc | | | 53,838 | | | | 770,960 | |
Gentex Corp. | | | 159,472 | | | | 3,222,929 | |
Visteon Corp. (a) | | | 17,589 | | | | 1,060,265 | |
| | | | | | | | |
| | | | | | | 7,049,602 | |
| | | | | | | | |
|
| Automobiles—0.2% | |
Thor Industries, Inc. | | | 30,521 | | | | 1,587,092 | |
| | | | | | | | |
|
| Banks—7.2% | |
Associated Banc-Corp. | | | 100,861 | | | | 1,996,039 | |
BancorpSouth Bank | | | 55,184 | | | | 1,442,510 | |
Bank of Hawaii Corp. (c) | | | 25,402 | | | | 1,710,063 | |
Bank OZK | | | 73,546 | | | | 1,679,055 | |
Cathay General Bancorp (c) | | | 46,860 | | | | 1,571,216 | |
Chemical Financial Corp. | | | 43,467 | | | | 1,591,327 | |
Commerce Bancshares, Inc. | | | 60,395 | | | | 3,404,466 | |
Cullen/Frost Bankers, Inc. | | | 38,904 | | | | 3,421,218 | |
East West Bancorp, Inc. | | | 88,193 | | | | 3,839,041 | |
First Horizon National Corp. | | | 197,087 | | | | 2,593,665 | |
FNB Corp. (c) | | | 197,302 | | | | 1,941,452 | |
Fulton Financial Corp. (c) | | | 107,136 | | | | 1,658,465 | |
Hancock Whitney Corp. | | | 51,815 | | | | 1,795,390 | |
Home BancShares, Inc. | | | 96,795 | | | | 1,581,630 | |
International Bancshares Corp. | | | 33,406 | | | | 1,149,166 | |
MB Financial, Inc. | | | 51,249 | | | | 2,030,998 | |
PacWest Bancorp | | | 74,084 | | | | 2,465,516 | |
Pinnacle Financial Partners, Inc. | | | 44,544 | | | | 2,053,478 | |
Prosperity Bancshares, Inc. (c) | | | 40,365 | | | | 2,514,740 | |
Signature Bank | | | 32,478 | | | | 3,339,063 | |
Sterling Bancorp | | | 136,542 | | | | 2,254,308 | |
Synovus Financial Corp. | | | 100,860 | | | | 3,226,511 | |
TCF Financial Corp. | | | 101,484 | | | | 1,977,923 | |
Texas Capital Bancshares, Inc. (a) | | | 30,530 | | | | 1,559,778 | |
Trustmark Corp. (c) | | | 40,817 | | | | 1,160,427 | |
UMB Financial Corp. (c) | | | 27,310 | | | | 1,665,091 | |
Umpqua Holdings Corp. | | | 133,994 | | | | 2,130,505 | |
United Bankshares, Inc. (c) | | | 62,777 | | | | 1,952,993 | |
Valley National Bancorp | | | 201,680 | | | | 1,790,918 | |
Webster Financial Corp. | | | 56,117 | | | | 2,766,007 | |
Wintrust Financial Corp. | | | 34,309 | | | | 2,281,205 | |
| | | | | | | | |
| | | | | | | 66,544,164 | |
| | | | | | | | |
|
| Beverages—0.1% | |
Boston Beer Co., Inc. (The) - Class A (a) | | | 5,234 | | | | 1,260,557 | |
| | | | | | | | |
|
| Biotechnology—0.9% | |
Exelixis, Inc. (a) | | | 181,901 | | | $ | 3,577,993 | |
Ligand Pharmaceuticals, Inc. (a) (c) | | | 12,931 | | | | 1,754,737 | |
United Therapeutics Corp. (a) | | | 26,518 | | | | 2,887,810 | |
| | | | | | | | |
| | | | | | | 8,220,540 | |
| | | | | | | | |
|
| Building Products—0.7% | |
Lennox International, Inc. | | | 22,058 | | | | 4,827,614 | |
Resideo Technologies, Inc. (a) | | | 74,813 | | | | 1,537,407 | |
| | | | | | | | |
| | | | | | | 6,365,021 | |
| | | | | | | | |
|
| Capital Markets—2.9% | |
Eaton Vance Corp. | | | 70,895 | | | | 2,494,086 | |
Evercore, Inc. - Class A | | | 24,622 | | | | 1,761,950 | |
FactSet Research Systems, Inc. (c) | | | 23,142 | | | | 4,631,408 | |
Federated Investors, Inc. - Class B (c) | | | 58,081 | | | | 1,542,051 | |
Interactive Brokers Group, Inc. - Class A | | | 45,681 | | | | 2,496,467 | |
Janus Henderson Group plc | | | 101,512 | | | | 2,103,329 | |
Legg Mason, Inc. | | | 52,035 | | | | 1,327,413 | |
MarketAxess Holdings, Inc. | | | 22,872 | | | | 4,833,082 | |
SEI Investments Co. | | | 79,489 | | | | 3,672,392 | |
Stifel Financial Corp. | | | 43,812 | | | | 1,814,693 | |
| | | | | | | | |
| | | | | | | 26,676,871 | |
| | | | | | | | |
|
| Chemicals—2.6% | |
Ashland Global Holdings, Inc. | | | 38,017 | | | | 2,697,686 | |
Cabot Corp. | | | 36,521 | | | | 1,568,212 | |
Chemours Co. (The) | | | 104,088 | | | | 2,937,363 | |
Minerals Technologies, Inc. | | | 21,452 | | | | 1,101,346 | |
NewMarket Corp. (c) | | | 5,412 | | | | 2,230,231 | |
Olin Corp. | | | 101,502 | | | | 2,041,205 | |
PolyOne Corp. | | | 48,562 | | | | 1,388,873 | |
RPM International, Inc. | | | 80,745 | | | | 4,746,191 | |
ScottsMiracle-Gro Co. (The) (c) | | | 23,899 | | | | 1,468,833 | |
Sensient Technologies Corp. (c) | | | 25,720 | | | | 1,436,462 | |
Valvoline, Inc. | | | 114,478 | | | | 2,215,149 | |
| | | | | | | | |
| | | | | | | 23,831,551 | |
| | | | | | | | |
|
| Commercial Services & Supplies—1.4% | |
Brink’s Co. (The) (c) | | | 30,795 | | | | 1,990,897 | |
Clean Harbors, Inc. (a) | | | 31,006 | | | | 1,530,146 | |
Deluxe Corp. | | | 28,173 | | | | 1,082,970 | |
Healthcare Services Group, Inc. (c) | | | 44,898 | | | | 1,804,002 | |
Herman Miller, Inc. | | | 36,100 | | | | 1,092,025 | |
HNI Corp. | | | 26,660 | | | | 944,564 | |
MSA Safety, Inc. | | | 21,296 | | | | 2,007,574 | |
Pitney Bowes, Inc. (c) | | | 114,148 | | | | 674,615 | |
Stericycle, Inc. (a) | | | 51,811 | | | | 1,900,945 | |
| | | | | | | | |
| | | | | | | 13,027,738 | |
| | | | | | | | |
|
| Communications Equipment—1.4% | |
ARRIS International plc (a) | | | 99,428 | | | | 3,039,514 | |
Ciena Corp. (a) | | | 86,376 | | | | 2,929,010 | |
InterDigital, Inc. | | | 20,589 | | | | 1,367,727 | |
Lumentum Holdings, Inc. (a) | | | 44,806 | | | | 1,882,300 | |
NetScout Systems, Inc. (a) | | | 42,548 | | | | 1,005,409 | |
See accompanying notes to financial statements.
BHFTII-4
Brighthouse Funds Trust II
MetLife Mid Cap Stock Index Portfolio
Schedule of Investments as of December 31, 2018
Common Stocks—(Continued)
| | | | | | | | |
| Security Description | | Shares | | | Value | |
|
| Communications Equipment—(Continued) | |
Plantronics, Inc. | | | 20,099 | | | $ | 665,277 | |
ViaSat, Inc. (a) (c) | | | 34,113 | | | | 2,010,962 | |
| | | | | | | | |
| | | | | | | 12,900,199 | |
| | | | | | | | |
|
| Construction & Engineering—1.2% | |
AECOM (a) | | | 95,124 | | | | 2,520,786 | |
Dycom Industries, Inc. (a) (c) | | | 19,041 | | | | 1,028,975 | |
EMCOR Group, Inc. (c) | | | 35,019 | | | | 2,090,284 | |
Granite Construction, Inc. (c) | | | 28,532 | | | | 1,149,269 | |
KBR, Inc. | | | 85,710 | | | | 1,301,078 | |
MasTec, Inc. (a) (c) | | | 38,773 | | | | 1,572,633 | |
Valmont Industries, Inc. | | | 13,438 | | | | 1,490,946 | |
| | | | | | | | |
| | | | | | | 11,153,971 | |
| | | | | | | | |
|
| Construction Materials—0.2% | |
Eagle Materials, Inc. | | | 28,527 | | | | 1,741,003 | |
| | | | | | | | |
|
| Consumer Finance—0.4% | |
Navient Corp. | | | 139,682 | | | | 1,230,599 | |
SLM Corp. (a) (c) | | | 265,056 | | | | 2,202,615 | |
| | | | | | | | |
| | | | | | | 3,433,214 | |
| | | | | | | | |
|
| Containers & Packaging—1.4% | |
AptarGroup, Inc. | | | 38,216 | | | | 3,594,979 | |
Bemis Co., Inc. | | | 55,374 | | | | 2,541,667 | |
Greif, Inc. - Class A | | | 15,782 | | | | 585,670 | |
Owens-Illinois, Inc. | | | 96,552 | | | | 1,664,556 | |
Silgan Holdings, Inc. (c) | | | 47,110 | | | | 1,112,738 | |
Sonoco Products Co. (c) | | | 60,723 | | | | 3,226,213 | |
| | | | | | | | |
| | | | | | | 12,725,823 | |
| | | | | | | | |
|
| Distributors—0.4% | |
Pool Corp. | | | 24,496 | | | | 3,641,330 | |
| | | | | | | | |
|
| Diversified Consumer Services—1.0% | |
Adtalem Global Education, Inc. (a) | | | 35,740 | | | | 1,691,217 | |
Graham Holdings Co. - Class B | | | 2,640 | | | | 1,691,131 | |
Service Corp. International | | | 110,090 | | | | 4,432,224 | |
Sotheby’s (a) | | | 21,173 | | | | 841,415 | |
Weight Watchers International, Inc. (a) | | | 23,584 | | | | 909,163 | |
| | | | | | | | |
| | | | | | | 9,565,150 | |
| | | | | | | | |
|
| Electric Utilities—1.5% | |
ALLETE, Inc. | | | 31,287 | | | | 2,384,695 | |
Hawaiian Electric Industries, Inc. | | | 66,242 | | | | 2,425,782 | |
IDACORP, Inc. | | | 30,659 | | | | 2,853,127 | |
OGE Energy Corp. | | | 121,517 | | | | 4,762,251 | |
PNM Resources, Inc. | | | 48,461 | | | | 1,991,262 | |
| | | | | | | | |
| | | | | | | 14,417,117 | |
| | | | | | | | |
|
| Electrical Equipment—1.3% | |
Acuity Brands, Inc. | | | 24,390 | | | | 2,803,631 | |
EnerSys | | | 25,643 | | | | 1,990,153 | |
Hubbell, Inc. | | | 33,284 | | | | 3,306,433 | |
|
| Electrical Equipment—(Continued) | |
Nvent Electric plc | | | 99,338 | | | | 2,231,131 | |
Regal-Beloit Corp. | | | 26,247 | | | | 1,838,602 | |
| | | | | | | | |
| | | | | | | 12,169,950 | |
| | | | | | | | |
|
| Electronic Equipment, Instruments & Components—3.9% | |
Arrow Electronics, Inc. (a) | | | 53,035 | | | | 3,656,763 | |
Avnet, Inc. | | | 67,670 | | | | 2,442,887 | |
Belden, Inc. (c) | | | 24,521 | | | | 1,024,242 | |
Cognex Corp. (c) | | | 104,761 | | | | 4,051,108 | |
Coherent, Inc. (a) (c) | | | 14,832 | | | | 1,567,891 | |
Jabil, Inc. | | | 87,468 | | | | 2,168,332 | |
Littelfuse, Inc. | | | 15,306 | | | | 2,624,673 | |
National Instruments Corp. | | | 68,486 | | | | 3,107,895 | |
SYNNEX Corp. | | | 25,212 | | | | 2,038,138 | |
Tech Data Corp. (a) | | | 22,704 | | | | 1,857,414 | |
Trimble, Inc. (a) | | | 152,798 | | | | 5,028,582 | |
Vishay Intertechnology, Inc. (c) | | | 80,380 | | | | 1,447,644 | |
Zebra Technologies Corp. - Class A (a) | | | 32,735 | | | | 5,212,394 | |
| | | | | | | | |
| | | | | | | 36,227,963 | |
| | | | | | | | |
|
| Energy Equipment & Services—1.1% | |
Apergy Corp. (a) | | | 47,054 | | | | 1,274,222 | |
Core Laboratories NV (c) | | | 26,899 | | | | 1,604,794 | |
Diamond Offshore Drilling, Inc. (a) (c) | | | 39,299 | | | | 370,983 | |
Dril-Quip, Inc. (a) | | | 21,766 | | | | 653,633 | |
Ensco plc - Class A (c) | | | 265,932 | | | | 946,718 | |
McDermott International, Inc. (a) | | | 109,867 | | | | 718,530 | |
Oceaneering International, Inc. (a) (c) | | | 59,947 | | | | 725,359 | |
Patterson-UTI Energy, Inc. | | | 132,274 | | | | 1,369,036 | |
Rowan Cos. plc - Class A (a) (c) | | | 77,308 | | | | 648,614 | |
Transocean, Ltd. (a) (c) | | | 307,815 | | | | 2,136,236 | |
| | | | | | | | |
| | | | | | | 10,448,125 | |
| | | | | | | | |
|
| Entertainment—0.9% | |
Cinemark Holdings, Inc. | | | 64,678 | | | | 2,315,473 | |
Live Nation Entertainment, Inc. (a) | | | 84,141 | | | | 4,143,944 | |
World Wrestling Entertainment, Inc. - Class A | | | 26,414 | | | | 1,973,654 | |
| | | | | | | | |
| | | | | | | 8,433,071 | |
| | | | | | | | |
|
| Equity Real Estate Investment Trusts—8.9% | |
Alexander & Baldwin, Inc. (a) | | | 41,192 | | | | 757,109 | |
American Campus Communities, Inc. | | | 83,369 | | | | 3,450,643 | |
Camden Property Trust | | | 56,663 | | | | 4,989,177 | |
CoreCivic, Inc. | | | 72,205 | | | | 1,287,415 | |
CoreSite Realty Corp. | | | 22,328 | | | | 1,947,671 | |
Corporate Office Properties Trust | | | 66,227 | | | | 1,392,754 | |
Cousins Properties, Inc. | | | 255,762 | | | | 2,020,520 | |
CyrusOne, Inc. | | | 64,389 | | | | 3,404,890 | |
Douglas Emmett, Inc. | | | 98,221 | | | | 3,352,283 | |
EPR Properties | | | 45,227 | | | | 2,895,885 | |
First Industrial Realty Trust, Inc. | | | 76,845 | | | | 2,217,747 | |
Geo Group, Inc. (The) | | | 74,100 | | | | 1,459,770 | |
Healthcare Realty Trust, Inc. | | | 76,194 | | | | 2,166,957 | |
Highwoods Properties, Inc. | | | 62,962 | | | | 2,436,000 | |
Hospitality Properties Trust | | | 100,046 | | | | 2,389,098 | |
See accompanying notes to financial statements.
BHFTII-5
Brighthouse Funds Trust II
MetLife Mid Cap Stock Index Portfolio
Schedule of Investments as of December 31, 2018
Common Stocks—(Continued)
| | | | | | | | |
| Security Description | | Shares | | | Value | |
|
| Equity Real Estate Investment Trusts—(Continued) | |
JBG SMITH Properties | | | 66,209 | | | $ | 2,304,735 | |
Kilroy Realty Corp. | | | 61,294 | | | | 3,854,167 | |
Lamar Advertising Co. - Class A | | | 51,766 | | | | 3,581,172 | |
Liberty Property Trust | | | 89,934 | | | | 3,766,436 | |
Life Storage, Inc. | | | 28,352 | | | | 2,636,452 | |
Mack-Cali Realty Corp. (c) | | | 54,950 | | | | 1,076,471 | |
Medical Properties Trust, Inc. | | | 222,030 | | | | 3,570,242 | |
National Retail Properties, Inc. | | | 96,821 | | | | 4,696,787 | |
Omega Healthcare Investors, Inc. | | | 122,104 | | | | 4,291,956 | |
Pebblebrook Hotel Trust | | | 77,884 | | | | 2,204,896 | |
PotlatchDeltic Corp. | | | 41,112 | | | | 1,300,784 | |
Rayonier, Inc. | | | 78,768 | | | | 2,181,086 | |
Sabra Health Care REIT, Inc. (c) | | | 108,468 | | | | 1,787,553 | |
Senior Housing Properties Trust | | | 144,635 | | | | 1,695,122 | |
Tanger Factory Outlet Centers, Inc. (c) | | | 57,133 | | | | 1,155,229 | |
Taubman Centers, Inc. | | | 37,152 | | | | 1,690,044 | |
Uniti Group, Inc. | | | 108,892 | | | | 1,695,448 | |
Urban Edge Properties | | | 69,543 | | | | 1,155,805 | |
Weingarten Realty Investors | | | 72,607 | | | | 1,801,380 | |
| | | | | | | | |
| | | | | | | 82,613,684 | |
| | | | | | | | |
|
| Food & Staples Retailing—0.5% | |
Casey’s General Stores, Inc. | | | 22,271 | | | | 2,853,806 | |
Sprouts Farmers Market, Inc. (a) | | | 77,634 | | | | 1,825,175 | |
| | | | | | | | |
| | | | | | | 4,678,981 | |
| | | | | | | | |
|
| Food Products—1.7% | |
Flowers Foods, Inc. | | | 111,628 | | | | 2,061,769 | |
Hain Celestial Group, Inc. (The) (a) (c) | | | 54,448 | | | | 863,545 | |
Ingredion, Inc. | | | 43,016 | | | | 3,931,663 | |
Lancaster Colony Corp. | | | 11,875 | | | | 2,100,213 | |
Post Holdings, Inc. (a) (c) | | | 40,569 | | | | 3,615,915 | |
Sanderson Farms, Inc. (c) | | | 12,227 | | | | 1,214,019 | |
Tootsie Roll Industries, Inc. (c) | | | 11,278 | | | | 376,685 | |
TreeHouse Foods, Inc. (a) (c) | | | 34,068 | | | | 1,727,588 | |
| | | | | | | | |
| | | | | | | 15,891,397 | |
| | | | | | | | |
|
| Gas Utilities—2.4% | |
Atmos Energy Corp. | | | 71,097 | | | | 6,592,114 | |
National Fuel Gas Co. | | | 52,300 | | | | 2,676,714 | |
New Jersey Resources Corp. | | | 53,846 | | | | 2,459,147 | |
ONE Gas, Inc. | | | 31,957 | | | | 2,543,777 | |
Southwest Gas Holdings, Inc. | | | 32,245 | | | | 2,466,742 | |
UGI Corp. | | | 105,768 | | | | 5,642,723 | |
| | | | | | | | |
| | | | | | | 22,381,217 | |
| | | | | | | | |
|
| Health Care Equipment & Supplies—4.5% | |
Avanos Medical, Inc. (a) | | | 28,855 | | | | 1,292,416 | |
Cantel Medical Corp. | | | 22,083 | | | | 1,644,079 | |
Globus Medical, Inc. - Class A (a) | | | 46,250 | | | | 2,001,700 | |
Haemonetics Corp. (a) | | | 31,445 | | | | 3,146,072 | |
Hill-Rom Holdings, Inc. (c) | | | 40,935 | | | | 3,624,794 | |
ICU Medical, Inc. (a) | | | 10,097 | | | | 2,318,574 | |
Inogen, Inc. (a) | | | 10,738 | | | | 1,333,338 | |
Integra LifeSciences Holdings Corp. (a) | | | 43,013 | | | | 1,939,886 | |
|
| Health Care Equipment & Supplies—(Continued) | |
LivaNova plc (a) | | | 29,620 | | | | 2,709,341 | |
Masimo Corp. (a) | | | 29,663 | | | | 3,184,916 | |
NuVasive, Inc. (a) | | | 31,285 | | | | 1,550,485 | |
STERIS plc | | | 51,410 | | | | 5,493,159 | |
Teleflex, Inc. | | | 27,976 | | | | 7,231,237 | |
West Pharmaceutical Services, Inc. | | | 45,070 | | | | 4,418,212 | |
| | | | | | | | |
| | | | | | | 41,888,209 | |
| | | | | | | | |
|
| Health Care Providers & Services—1.9% | |
Acadia Healthcare Co., Inc. (a) (c) | | | 53,695 | | | | 1,380,498 | |
Chemed Corp. | | | 9,742 | | | | 2,759,714 | |
Encompass Health Corp. | | | 60,188 | | | | 3,713,600 | |
HealthEquity, Inc. (a) | | | 33,023 | | | | 1,969,822 | |
MEDNAX, Inc. (a) | | | 54,403 | | | | 1,795,299 | |
Molina Healthcare, Inc. (a) | | | 37,958 | | | | 4,411,479 | |
Patterson Cos., Inc. | | | 50,259 | | | | 988,092 | |
Tenet Healthcare Corp. (a) | | | 50,511 | | | | 865,758 | |
| | | | | | | | |
| | | | | | | 17,884,262 | |
| | | | | | | | |
|
| Health Care Technology—0.4% | |
Allscripts Healthcare Solutions, Inc. (a) (c) | | | 106,296 | | | | 1,024,693 | |
Medidata Solutions, Inc. (a) (c) | | | 37,228 | | | | 2,509,912 | |
| | | | | | | | |
| | | | | | | 3,534,605 | |
| | | | | | | | |
|
| Hotels, Restaurants & Leisure—3.8% | |
Boyd Gaming Corp. | | | 49,151 | | | | 1,021,358 | |
Brinker International, Inc. (c) | | | 23,484 | | | | 1,032,826 | |
Cheesecake Factory, Inc. (The) (c) | | | 25,375 | | | | 1,104,066 | |
Churchill Downs, Inc. | | | 7,267 | | | | 1,772,712 | |
Cracker Barrel Old Country Store, Inc. (c) | | | 14,623 | | | | 2,337,633 | |
Domino’s Pizza, Inc. | | | 25,307 | | | | 6,275,883 | |
Dunkin’ Brands Group, Inc. | | | 50,252 | | | | 3,222,158 | |
Eldorado Resorts, Inc. (a) | | | 39,551 | | | | 1,432,142 | |
International Speedway Corp. - Class A | | | 14,871 | | | | 652,242 | |
Jack in the Box, Inc. | | | 15,662 | | | | 1,215,841 | |
Marriott Vacations Worldwide Corp. | | | 24,897 | | | | 1,755,488 | |
Papa John’s International, Inc. (c) | | | 13,625 | | | | 542,411 | |
Penn National Gaming, Inc. (a) | | | 65,804 | | | | 1,239,089 | |
Scientific Games Corp. - Class A (a) (c) | | | 33,476 | | | | 598,551 | |
Six Flags Entertainment Corp. | | | 43,656 | | | | 2,428,583 | |
Texas Roadhouse, Inc. | | | 40,484 | | | | 2,416,895 | |
Wendy’s Co. (The) (c) | | | 113,799 | | | | 1,776,402 | |
Wyndham Hotels & Resorts, Inc. | | | 60,343 | | | | 2,737,762 | |
Wyndham Worldwide Corp. | | | 59,290 | | | | 2,124,954 | |
| | | | | | | | |
| | | | | | | 35,686,996 | |
| | | | | | | | |
|
| Household Durables—1.5% | |
Helen of Troy, Ltd. (a) | | | 16,063 | | | | 2,107,144 | |
KB Home | | | 52,440 | | | | 1,001,604 | |
NVR, Inc. (a) | | | 2,068 | | | | 5,039,695 | |
Tempur Sealy International, Inc. (a) (c) | | | 27,852 | | | | 1,153,073 | |
Toll Brothers, Inc. | | | 82,483 | | | | 2,716,165 | |
TRI Pointe Group, Inc. (a) | | | 86,515 | | | | 945,609 | |
Tupperware Brands Corp. | | | 29,556 | | | | 933,083 | |
| | | | | | | | |
| | | | | | | 13,896,373 | |
| | | | | | | | |
See accompanying notes to financial statements.
BHFTII-6
Brighthouse Funds Trust II
MetLife Mid Cap Stock Index Portfolio
Schedule of Investments as of December 31, 2018
Common Stocks—(Continued)
| | | | | | | | |
| Security Description | | Shares | | | Value | |
|
| Household Products—0.2% | |
Energizer Holdings, Inc. (c) | | | 36,266 | | | $ | 1,637,410 | |
| | | | | | | | |
|
| Industrial Conglomerates—0.4% | |
Carlisle Cos., Inc. (c) | | | 36,227 | | | | 3,641,538 | |
| | | | | | | | |
|
| Insurance—5.0% | |
Alleghany Corp. | | | 9,027 | | | | 5,626,710 | |
American Financial Group, Inc. | | | 42,898 | | | | 3,883,556 | |
Aspen Insurance Holdings, Ltd. | | | 36,320 | | | | 1,525,077 | |
Brown & Brown, Inc. | | | 142,698 | | | | 3,932,757 | |
CNO Financial Group, Inc. | | | 100,172 | | | | 1,490,559 | |
First American Financial Corp. | | | 68,011 | | | | 3,036,011 | |
Genworth Financial, Inc. - Class A (a) | | | 304,661 | | | | 1,419,720 | |
Hanover Insurance Group, Inc. (The) | | | 25,755 | | | | 3,007,411 | |
Kemper Corp. | | | 37,028 | | | | 2,457,919 | |
Mercury General Corp. | | | 16,497 | | | | 853,060 | |
Old Republic International Corp. | | | 173,080 | | | | 3,560,256 | |
Primerica, Inc. | | | 26,124 | | | | 2,552,576 | |
Reinsurance Group of America, Inc. | | | 38,193 | | | | 5,355,804 | |
RenaissanceRe Holdings, Ltd. | | | 24,498 | | | | 3,275,383 | |
W.R. Berkley Corp. | | | 58,697 | | | | 4,338,295 | |
| | | | | | | | |
| | | | | | | 46,315,094 | |
| | | | | | | | |
|
| Interactive Media & Services—0.3% | |
Cars.com, Inc. (a) (c) | | | 38,379 | | | | 825,148 | |
Yelp, Inc. (a) (c) | | | 46,504 | | | | 1,627,175 | |
| | | | | | | | |
| | | | | | | 2,452,323 | |
| | | | | | | | |
|
| IT Services—2.8% | |
CACI International, Inc. - Class A (a) | | | 15,118 | | | | 2,177,446 | |
CoreLogic, Inc. (a) | | | 49,013 | | | | 1,638,014 | |
Leidos Holdings, Inc. | | | 91,114 | | | | 4,803,530 | |
LiveRamp Holdings, Inc. (a) (c) | | | 41,380 | | | | 1,598,509 | |
MAXIMUS, Inc. | | | 39,018 | | | | 2,539,682 | |
Perspecta, Inc. | | | 86,053 | | | | 1,481,833 | |
Sabre Corp. | | | 167,500 | | | | 3,624,700 | |
Science Applications International Corp. | | | 25,884 | | | | 1,648,811 | |
Teradata Corp. (a) | | | 71,913 | | | | 2,758,583 | |
WEX, Inc. (a) | | | 26,224 | | | | 3,672,933 | |
| | | | | | | | |
| | | | | | | 25,944,041 | |
| | | | | | | | |
|
| Leisure Products—0.6% | |
Brunswick Corp. | | | 52,772 | | | | 2,451,259 | |
Polaris Industries, Inc. | | | 35,332 | | | | 2,709,258 | |
| | | | | | | | |
| | | | | | | 5,160,517 | |
| | | | | | | | |
|
| Life Sciences Tools & Services—1.5% | |
Bio-Rad Laboratories, Inc. - Class A (a) | | | 12,251 | | | | 2,844,927 | |
Bio-Techne Corp. | | | 22,977 | | | | 3,325,231 | |
Charles River Laboratories International, Inc. (a) | | | 29,262 | | | | 3,311,873 | |
PRA Health Sciences, Inc. (a) | | | 35,578 | | | | 3,271,753 | |
Syneos Health, Inc. (a) | | | 37,053 | | | | 1,458,036 | |
| | | | | | | | |
| | | | | | | 14,211,820 | |
| | | | | | | | |
|
| Machinery—5.0% | |
AGCO Corp. | | | 40,007 | | | | 2,227,190 | |
Crane Co. | | | 30,743 | | | | 2,219,030 | |
Donaldson Co., Inc. | | | 77,809 | | | | 3,376,132 | |
Graco, Inc. (c) | | | 101,260 | | | | 4,237,731 | |
IDEX Corp. | | | 46,671 | | | | 5,892,680 | |
ITT, Inc. | | | 53,295 | | | | 2,572,550 | |
Kennametal, Inc. | | | 49,951 | | | | 1,662,369 | |
Lincoln Electric Holdings, Inc. | | | 39,209 | | | | 3,091,630 | |
Nordson Corp. | | | 31,840 | | | | 3,800,104 | |
Oshkosh Corp. | | | 43,740 | | | | 2,681,699 | |
Terex Corp. | | | 39,458 | | | | 1,087,857 | |
Timken Co. (The) | | | 42,086 | | | | 1,570,650 | |
Toro Co. (The) | | | 64,000 | | | | 3,576,320 | |
Trinity Industries, Inc. | | | 89,008 | | | | 1,832,675 | |
Wabtec Corp. | | | 52,315 | | | | 3,675,129 | |
Woodward, Inc. | | | 33,829 | | | | 2,513,156 | |
| | | | | | | | |
| | | | | | | 46,016,902 | |
| | | | | | | | |
|
| Marine—0.2% | |
Kirby Corp. (a) | | | 32,780 | | | | 2,208,061 | |
| | | | | | | | |
|
| Media—1.1% | |
AMC Networks, Inc. - Class A (a) (c) | | | 27,405 | | | | 1,503,986 | |
Cable One, Inc. | | | 3,020 | | | | 2,476,702 | |
John Wiley & Sons, Inc. - Class A | | | 27,520 | | | | 1,292,614 | |
Meredith Corp. (c) | | | 24,262 | | | | 1,260,168 | |
New York Times Co. (The) - Class A (c) | | | 85,885 | | | | 1,914,377 | |
TEGNA, Inc. | | | 130,989 | | | | 1,423,851 | |
| | | | | | | | |
| | | | | | | 9,871,698 | |
| | | | | | | | |
|
| Metals & Mining—2.0% | |
Allegheny Technologies, Inc. (a) (c) | | | 76,466 | | | | 1,664,665 | |
Carpenter Technology Corp. | | | 28,819 | | | | 1,026,245 | |
Commercial Metals Co. | | | 71,566 | | | | 1,146,487 | |
Compass Minerals International, Inc. (c) | | | 20,595 | | | | 858,605 | |
Reliance Steel & Aluminum Co. | | | 42,851 | | | | 3,049,706 | |
Royal Gold, Inc. | | | 39,856 | | | | 3,413,666 | |
Steel Dynamics, Inc. | | | 139,659 | | | | 4,195,356 | |
United States Steel Corp. (c) | | | 107,850 | | | | 1,967,184 | |
Worthington Industries, Inc. | | | 24,477 | | | | 852,779 | |
| | | | | | | | |
| | | | | | | 18,174,693 | |
| | | | | | | | |
|
| Multi-Utilities—1.1% | |
Black Hills Corp. (c) | | | 32,840 | | | | 2,061,695 | |
MDU Resources Group, Inc. | | | 119,257 | | | | 2,843,087 | |
NorthWestern Corp. | | | 30,615 | | | | 1,819,756 | |
Vectren Corp. | | | 50,546 | | | | 3,638,301 | |
| | | | | | | | |
| | | | | | | 10,362,839 | |
| | | | | | | | |
|
| Multiline Retail—0.4% | |
Big Lots, Inc. | | | 24,543 | | | | 709,783 | |
Dillard’s, Inc. - Class A (c) | | | 11,242 | | | | 678,005 | |
Ollie’s Bargain Outlet Holdings, Inc. (a) | | | 31,370 | | | | 2,086,419 | |
| | | | | | | | |
| | | | | | | 3,474,207 | |
| | | | | | | | |
See accompanying notes to financial statements.
BHFTII-7
Brighthouse Funds Trust II
MetLife Mid Cap Stock Index Portfolio
Schedule of Investments as of December 31, 2018
Common Stocks—(Continued)
| | | | | | | | |
| Security Description | | Shares | | | Value | |
|
| Oil, Gas & Consumable Fuels—2.5% | |
Callon Petroleum Co. (a) (c) | | | 138,460 | | | $ | 898,605 | |
Chesapeake Energy Corp. (a) (c) | | | 555,902 | | | | 1,167,394 | |
CNX Resources Corp. (a) (c) | | | 123,870 | | | | 1,414,595 | |
EQT Corp. | | | 154,793 | | | | 2,924,040 | |
Equitrans Midstream Corp. (a) | | | 123,758 | | | | 2,477,635 | |
Matador Resources Co. (a) (c) | | | 62,992 | | | | 978,266 | |
Murphy Oil Corp. | | | 98,970 | | | | 2,314,908 | |
Oasis Petroleum, Inc. (a) (c) | | | 162,737 | | | | 899,936 | |
PBF Energy, Inc. - Class A | | | 72,941 | | | | 2,382,983 | |
QEP Resources, Inc. (a) | | | 144,051 | | | | 811,007 | |
Range Resources Corp. (c) | | | 125,993 | | | | 1,205,753 | |
SM Energy Co. | | | 62,769 | | | | 971,664 | |
Southwestern Energy Co. (a) | | | 353,650 | | | | 1,205,947 | |
World Fuel Services Corp. | | | 40,903 | | | | 875,733 | |
WPX Energy, Inc. (a) (c) | | | 240,363 | | | | 2,728,120 | |
| | | | | | | | |
| | | | | | | 23,256,586 | |
| | | | | | | | |
|
| Paper & Forest Products—0.3% | |
Domtar Corp. | | | 38,269 | | | | 1,344,390 | |
Louisiana-Pacific Corp. | | | 85,892 | | | | 1,908,520 | |
| | | | | | | | |
| | | | | | | 3,252,910 | |
| | | | | | | | |
|
| Personal Products—0.3% | |
Edgewell Personal Care Co. (a) (c) | | | 32,878 | | | | 1,227,993 | |
Nu Skin Enterprises, Inc. - Class A | | | 33,796 | | | | 2,072,709 | |
| | | | | | | | |
| | | | | | | 3,300,702 | |
| | | | | | | | |
|
| Pharmaceuticals—0.5% | |
Catalent, Inc. (a) | | | 88,444 | | | | 2,757,684 | |
Mallinckrodt plc (a) | | | 50,687 | | | | 800,854 | |
Prestige Consumer Healthcare, Inc. (a) (c) | | | 31,477 | | | | 972,010 | |
| | | | | | | | |
| | | | | | | 4,530,548 | |
| | | | | | | | |
|
| Professional Services—1.0% | |
ASGN, Inc. (a) | | | 31,927 | | | | 1,740,022 | |
Dun & Bradstreet Corp. (The) | | | 22,591 | | | | 3,224,639 | |
Insperity, Inc. | | | 23,148 | | | | 2,161,097 | |
ManpowerGroup, Inc. | | | 37,618 | | | | 2,437,646 | |
| | | | | | | | |
| | | | | | | 9,563,404 | |
| | | | | | | | |
|
| Real Estate Management & Development—0.5% | |
Jones Lang LaSalle, Inc. | | | 27,723 | | | | 3,509,732 | |
Realogy Holdings Corp. (c) | | | 71,885 | | | | 1,055,272 | |
| | | | | | | | |
| | | | | | | 4,565,004 | |
| | | | | | | | |
|
| Road & Rail—1.6% | |
Avis Budget Group, Inc. (a) | | | 39,528 | | | | 888,589 | |
Genesee & Wyoming, Inc. - Class A (a) | | | 35,525 | | | | 2,629,561 | |
Knight-Swift Transportation Holdings, Inc. (c) | | | 76,457 | | | | 1,916,777 | |
Landstar System, Inc. | | | 25,014 | | | | 2,393,089 | |
Old Dominion Freight Line, Inc. | | | 39,790 | | | | 4,913,667 | |
Ryder System, Inc. | | | 32,298 | | | | 1,555,149 | |
|
| Road & Rail—(Continued) | |
Werner Enterprises, Inc. (c) | | | 26,854 | | | | 793,267 | |
| | | | | | | | |
| | | | | | | 15,090,099 | |
| | | | | | | | |
|
| Semiconductors & Semiconductor Equipment—3.0% | |
Cirrus Logic, Inc. (a) | | | 36,409 | | | | 1,208,051 | |
Cree, Inc. (a) (c) | | | 62,397 | | | | 2,669,032 | |
Cypress Semiconductor Corp. (c) | | | 220,210 | | | | 2,801,071 | |
First Solar, Inc. (a) (c) | | | 45,914 | | | | 1,949,279 | |
Integrated Device Technology, Inc. (a) | | | 78,505 | | | | 3,801,997 | |
MKS Instruments, Inc. | | | 32,845 | | | | 2,122,115 | |
Monolithic Power Systems, Inc. | | | 23,739 | | | | 2,759,659 | |
Silicon Laboratories, Inc. (a) | | | 26,251 | | | | 2,068,841 | |
Synaptics, Inc. (a) (c) | | | 21,062 | | | | 783,717 | |
Teradyne, Inc. | | | 109,055 | | | | 3,422,146 | |
Universal Display Corp. (c) | | | 25,791 | | | | 2,413,264 | |
Versum Materials, Inc. | | | 66,336 | | | | 1,838,834 | |
| | | | | | | | |
| | | | | | | 27,838,006 | |
| | | | | | | | |
|
| Software—3.5% | |
ACI Worldwide, Inc. (a) | | | 70,562 | | | | 1,952,451 | |
Blackbaud, Inc. | | | 29,549 | | | | 1,858,632 | |
CDK Global, Inc. | | | 78,345 | | | | 3,751,159 | |
CommVault Systems, Inc. (a) | | | 23,655 | | | | 1,397,774 | |
Fair Isaac Corp. (a) | | | 17,616 | | | | 3,294,192 | |
j2 Global, Inc. (c) | | | 28,487 | | | | 1,976,428 | |
LogMeIn, Inc. | | | 31,127 | | | | 2,539,029 | |
Manhattan Associates, Inc. (a) | | | 39,776 | | | | 1,685,309 | |
PTC, Inc. (a) | | | 64,982 | | | | 5,387,008 | |
Tyler Technologies, Inc. (a) (c) | | | 23,620 | | | | 4,389,068 | |
Ultimate Software Group, Inc. (The) (a) | | | 19,024 | | | | 4,658,407 | |
| | | | | | | | |
| | | | | | | 32,889,457 | |
| | | | | | | | |
|
| Specialty Retail—2.1% | |
Aaron’s, Inc. | | | 41,733 | | | | 1,754,873 | |
American Eagle Outfitters, Inc. | | | 102,514 | | | | 1,981,595 | |
AutoNation, Inc. (a) (c) | | | 35,014 | | | | 1,250,000 | |
Bed Bath & Beyond, Inc. (c) | | | 83,990 | | | | 950,767 | |
Dick’s Sporting Goods, Inc. (c) | | | 44,876 | | | | 1,400,131 | |
Five Below, Inc. (a) | | | 33,924 | | | | 3,471,104 | |
Michaels Cos., Inc. (The) (a) (c) | | | 54,686 | | | | 740,448 | |
Murphy USA, Inc. (a) | | | 18,242 | | | | 1,398,067 | |
Sally Beauty Holdings, Inc. (a) (c) | | | 73,096 | | | | 1,246,287 | |
Signet Jewelers, Ltd. (c) | | | 31,583 | | | | 1,003,392 | |
Urban Outfitters, Inc. (a) | | | 45,842 | | | | 1,521,954 | |
Williams-Sonoma, Inc. (c) | | | 48,766 | | | | 2,460,245 | |
| | | | | | | | |
| | | | | | | 19,178,863 | |
| | | | | | | | |
|
| Technology Hardware, Storage & Peripherals—0.2% | |
NCR Corp. (a) (c) | | | 71,913 | | | | 1,659,752 | |
| | | | | | | | |
|
| Textiles, Apparel & Luxury Goods—0.7% | |
Carter’s, Inc. | | | 27,894 | | | | 2,276,709 | |
Deckers Outdoor Corp. (a) | | | 17,718 | | | | 2,267,018 | |
See accompanying notes to financial statements.
BHFTII-8
Brighthouse Funds Trust II
MetLife Mid Cap Stock Index Portfolio
Schedule of Investments as of December 31, 2018
Common Stocks—(Continued)
| | | | | | | | |
| Security Description | | Shares/
Principal
Amount* | | | Value | |
|
| Textiles, Apparel & Luxury Goods—(Continued) | |
Skechers USA, Inc. - Class A (a) (c) | | | 81,452 | | | $ | 1,864,436 | |
| | | | | | | | |
| | | | | | | 6,408,163 | |
| | | | | | | | |
|
| Thrifts & Mortgage Finance—0.5% | |
LendingTree, Inc. (a) (c) | | | 4,527 | | | | 993,993 | |
New York Community Bancorp, Inc. (c) | | | 298,323 | | | | 2,807,220 | |
Washington Federal, Inc. | | | 49,582 | | | | 1,324,335 | |
| | | | | | | | |
| | | | | | | 5,125,548 | |
| | | | | | | | |
|
| Trading Companies & Distributors—0.8% | |
GATX Corp. (c) | | | 22,876 | | | | 1,619,850 | |
MSC Industrial Direct Co., Inc. - Class A | | | 27,625 | | | | 2,124,915 | |
NOW, Inc. (a) (c) | | | 65,963 | | | | 767,809 | |
Watsco, Inc. | | | 19,541 | | | | 2,718,935 | |
| | | | | | | | |
| | | | | | | 7,231,509 | |
| | | | | | | | |
|
| Water Utilities—0.4% | |
Aqua America, Inc. | | | 108,258 | | | | 3,701,341 | |
| | | | | | | | |
|
| Wireless Telecommunication Services—0.2% | |
Telephone & Data Systems, Inc. | | | 56,554 | | | | 1,840,267 | |
| | | | | | | | |
Total Common Stocks
(Cost $782,110,895) | | | | | | | 900,986,187 | |
| | | | | | | | |
|
| Mutual Fund—1.9% | |
|
| Investment Company Security—1.9% | |
SPDR S&P MidCap 400 ETF Trust (c)
(Cost $17,614,170) | | | 56,600 | | | | 17,131,122 | |
| | | | | | | | |
|
| Short-Term Investments—1.4% | |
|
| Discount Notes—0.4% | |
| Federal Home Loan Bank | |
2.056%, 01/09/19 (d) | | | 600,000 | | | | 599,722 | |
2.190%, 01/18/11 (d) | | | 100,000 | | | | 99,894 | |
2.273%, 01/23/19 (d) | | | 450,000 | | | | 449,376 | |
2.351%, 02/06/19 (d) | | | 2,600,000 | | | | 2,593,934 | |
| | | | | | | | |
| | | | | | | 3,742,926 | |
| | | | | | | | |
|
| U.S. Treasury—1.0% | |
| U.S. Treasury Bills | |
1.995%, 01/08/19 (d) | | | 1,700,000 | | | | 1,699,354 | |
2.140%, 01/17/19 (d) | | | 550,000 | | | | 549,469 | |
2.221%, 01/22/19 (d) | | | 5,750,000 | | | | 5,742,541 | |
2.305%, 01/29/19 (d) | | | 300,000 | | | | 299,448 | |
2.339%, 02/21/19 (d) | | | 1,275,000 | | | | 1,270,744 | |
| | | | | | | | |
| | | | | | | 9,561,556 | |
| | | | | | | | |
Total Short-Term Investments
(Cost $13,304,000) | | | | | | | 13,304,482 | |
| | | | | | | | |
| Securities Lending Reinvestments (e)—14.5% | |
| Security Description | |
Principal
Amount* | | | Value | |
|
| Certificates of Deposit—9.6% | |
Banco Del Estado De Chile New York
2.820%, 1M LIBOR + 0.350%, 05/20/19 (f) | | | 3,000,000 | | | | 2,999,937 | |
Bank of Montreal (Chicago)
2.710%, 1M LIBOR + 0.330%, 08/06/19 (f) | | | 5,000,000 | | | | 4,999,875 | |
Bank of Nova Scotia
2.890%, SOFR + 0.430%, 05/16/19 (f) | | | 4,000,000 | | | | 3,999,997 | |
3.072%, 3M LIBOR + 0.280%, 03/20/19 (f) | | | 2,000,000 | | | | 2,000,798 | |
Barclays Bank plc
2.500%, 02/01/19 | | | 2,000,000 | | | | 1,999,742 | |
2.547%, 1M LIBOR + 0.200%, 02/04/19 (f) | | | 2,500,000 | | | | 2,499,762 | |
Canadian Imperial Bank of Commerce
2.556%, 3M LIBOR + 0.120%, 01/14/19 (f) | | | 2,000,000 | | | | 1,999,744 | |
2.740%, 1M LIBOR + 0.270%, 07/19/19 (f) | | | 3,000,000 | | | | 2,998,782 | |
China Construction Bank Corp.
2.550%, 01/07/19 | | | 2,500,000 | | | | 2,500,000 | |
Commonwealth Bank of Australia | | | | | | | | |
2.617%, 3M LIBOR + 0.140%, 04/23/19 (f) | | | 1,250,000 | | | | 1,250,004 | |
2.642%, 1M LIBOR + 0.210%, 09/13/19 (f) | | | 5,000,000 | | | | 5,000,000 | |
Credit Agricole S.A.
2.500%, 02/12/19 | | | 3,000,000 | | | | 2,999,490 | |
2.799%, 1M LIBOR + 0.320%, 05/21/19 (f) | | | 3,000,000 | | | | 3,000,189 | |
Credit Industriel et Commercial
Zero Coupon, 01/25/19 | | | 987,228 | | | | 998,300 | |
Credit Suisse AG
2.620%, 04/01/19 | | | 5,000,000 | | | | 4,997,410 | |
Industrial & Commercial Bank of China, Ltd.
2.850%, 02/15/19 | | | 2,500,000 | | | | 2,499,815 | |
Mitsubishi UFJ Trust and Banking Corp.
Zero Coupon, 01/15/19 | | | 5,954,925 | | | | 5,993,880 | |
Natixis New York
2.731%, 3M LIBOR + 0.190%, 02/01/19 (f) | | | 2,000,000 | | | | 1,999,552 | |
2.810%, 1M LIBOR + 0.370%, 02/14/19 (f) | | | 3,000,000 | | | | 3,000,561 | |
Royal Bank of Canada New York
| |
2.665%, 1M LIBOR + 0.210%, 09/17/19 (f) | | | 2,000,000 | | | | 1,997,954 | |
Skandinaviska Enskilda Banken
2.645%, 1M LIBOR + 0.190%, 04/17/19 (f) | | | 3,000,000 | | | | 2,999,754 | |
Societe Generale
2.719%, 3M LIBOR + 0.160%, 05/07/19 (f) | | | 2,000,000 | | | | 1,999,112 | |
Standard Chartered plc
2.686%, 1M LIBOR + 0.180%, 02/25/19 (f) | | | 4,000,000 | | | | 3,999,884 | |
State Street Bank and Trust
2.725%, 1M LIBOR + 0.270%, 05/15/19 (f) | | | 3,500,000 | | | | 3,499,930 | |
Sumitomo Mitsui Banking Corp.
2.590%, 1M LIBOR + 0.190%, 04/11/19 (f) | | | 3,000,000 | | | | 2,998,899 | |
Svenska Handelsbanken AB
2.767%, 1M LIBOR + 0.380%, 12/10/19 (f) | | | 3,000,000 | | | | 2,999,901 | |
2.822%, 1M LIBOR + 0.300%, 10/31/19 (f) | | | 2,000,000 | | | | 1,999,532 | |
Toronto-Dominion Bank
2.665%, 1M LIBOR + 0.210%, 09/17/19 (f) | | | 2,000,000 | | | | 1,998,096 | |
U.S. Bank N.A.
2.764%, 1M LIBOR + 0.260%, 07/23/19 (f) | | | 3,000,000 | | | | 3,000,000 | |
Wells Fargo Bank N.A.
2.730%, 3M LIBOR + 0.210%, 10/25/19 (f) | | | 2,000,000 | | | | 2,000,000 | |
See accompanying notes to financial statements.
BHFTII-9
Brighthouse Funds Trust II
MetLife Mid Cap Stock Index Portfolio
Schedule of Investments as of December 31, 2018
Securities Lending Reinvestments (e)—(Continued)
| | | | | | | | |
| Security Description | | Principal
Amount* | | | Value | |
|
| Certificates of Deposit—(Continued) | |
Westpac Banking Corp.
2.850%, FEDEFF PRV + 0.450%, 02/15/19 (f) | | | 1,500,000 | | | $ | 1,499,991 | |
| | | | | | | | |
| | | | | | | 88,730,891 | |
| | | | | | | | |
|
| Commercial Paper—1.9% | |
Alpine Securities Ltd.
2.529%, 1M LIBOR + 0.180%, 04/03/19 (f) | | | 5,000,000 | | | | 4,998,615 | |
Banco Santander S.A.
2.740%, 02/07/19 | | | 2,482,494 | | | | 2,492,720 | |
ING Funding LLC
2.707%, 1M LIBOR + 0.320%, 02/08/19 (f) | | | 4,000,000 | | | | 4,000,372 | |
2.725%, 3M LIBOR + 0.110%, 05/10/19 (f) | | | 1,000,000 | | | | 999,882 | |
UBS AG
2.779%, 1M LIBOR + 0.430%, 02/01/19 (f) | | | 4,000,000 | | | | 4,000,980 | |
Westpac Banking Corp.
2.659%, 3M LIBOR + 0.070%, 08/07/19 (f) | | | 1,500,000 | | | | 1,499,014 | |
| | | | | | | | |
| | | | | | | 17,991,583 | |
| | | | | | | | |
|
| Repurchase Agreements—3.0% | |
Citadel Clearing LLC
Repurchase Agreement dated 12/31/18 at 3.000%, due on 04/02/19 with a maturity value of $10,076,667; collateralized by various Common Stock with an aggregate market value of $11,001,834. | | | 10,000,000 | | | | 10,000,000 | |
Citigroup Global Markets, Inc.
Repurchase Agreement dated 12/31/18 at 2.790%, due on 02/04/19 with a maturity value of $2,005,425; collateralized by U.S. Treasury Obligations at 0.000%, maturing 02/12/19, and various Common Stock with an aggregate market value of $2,176,637. | | | 2,000,000 | | | | 2,000,000 | |
Citigroup Global Markets, Ltd.
Repurchase Agreement dated 12/31/18 at 2.490%, due on 01/02/19 with a maturity value of $700,097; collateralized by U.S. Treasury Obligations with rates ranging from 1.625% - 2.875%, maturity dates ranging from 06/30/20 - 11/15/46, and an aggregate market value of $714,000. | | | 700,000 | | | | 700,000 | |
Repurchase Agreement dated 12/31/18 at 2.490%, due on 01/02/19 with a maturity value of $400,055; collateralized by U.S. Treasury Obligations with rates ranging from 0.375% - 1.875%, maturity dates ranging from 12/15/20 - 01/15/27, and an aggregate market value of $408,000. | | | 400,000 | | | | 400,000 | |
Deutsche Bank AG, London
Repurchase Agreement dated 12/31/18 at 2.750%, due on 01/02/19 with a maturity value of $300,046; collateralized by U.S. Treasury and Foreign Obligations with rates ranging from 1.000% - 2.590%, maturity dates ranging from 03/31/19 - 12/29/26, and an aggregate market value of $306,000. | | | 300,000 | | | | 300,000 | |
|
| Repurchase Agreements—(Continued) | |
Deutsche Bank Securities, Inc.
Repurchase Agreement dated 12/31/18 at 3.200%, due on 01/02/19 with a maturity value of $1,518,331; collateralized by U.S. Treasury Obligations at 0.000%, maturity dates ranging from 08/15/30 - 08/15/39, and an aggregate market value of $1,548,422. | | | 1,518,061 | | | | 1,518,061 | |
Merrill Lynch, Pierce, Fenner & Smith, Inc.
Repurchase Agreement dated 12/31/18 at 2.940%, due on 04/02/19 with a maturity value of $4,030,053; collateralized by various Common Stock with an aggregate market value of $4,400,000. | | | 4,000,000 | | | | 4,000,000 | |
Repurchase Agreement dated 12/31/18 at 2.940%, due on 04/02/19 with a maturity value of $1,007,513; collateralized by various Common Stock with an aggregate market value of $1,100,000. | | | 1,000,000 | | | | 1,000,000 | |
NBC Global Finance Ltd.
Repurchase Agreement dated 12/31/18 at 2.560%, due on 01/02/19 with a maturity value of $1,000,142; collateralized by various Common Stock with an aggregate market value of $1,113,212. | | | 1,000,000 | | | | 1,000,000 | |
Repurchase Agreement dated 12/31/18 at 2.560%, due on 01/02/19 with a maturity value of $3,000,427; collateralized by various Common Stock with an aggregate market value of $3,339,637. | | | 3,000,000 | | | | 3,000,000 | |
Repurchase Agreement dated 12/31/18 at 2.560%, due on 01/02/19 with a maturity value of $2,000,284; collateralized by various Common Stock with an aggregate market value of $2,226,425. | | | 2,000,000 | | | | 2,000,000 | |
Societe Generale
Repurchase Agreement dated 12/31/18 at 2.530%, due on 01/02/19 with a maturity value of $700,098; collateralized by U.S. Treasury Obligations with rates ranging from 0.750% - 8.000%, maturity dates ranging from 09/30/19 - 08/15/46, and various Common Stock with an aggregate market value of $766,833. | | | 700,000 | | | | 700,000 | |
Repurchase Agreement dated 12/31/18 at 2.530%, due on 01/02/19 with a maturity value of $800,112; collateralized by U.S. Treasury Obligations with rates ranging from 0.750% - 8.000%, maturity dates ranging from 09/30/19 - 08/15/46, and various Common Stock with an aggregate market value of $876,381. | | | 800,000 | | | | 800,000 | |
| | | | | | | | |
| | | | | | | 27,418,061 | |
| | | | | | | | |
Total Securities Lending Reinvestments
(Cost $134,154,230) | | | | | | | 134,140,535 | |
| | | | | | | | |
Total Investments—114.9%
(Cost $947,183,295) | | | | | | | 1,065,562,326 | |
Other assets and liabilities (net)—(14.9)% | | | | | | | (137,927,031 | ) |
| | | | | | | | |
| Net Assets—100.0% | | | | | | $ | 927,635,295 | |
| | | | | | | | |
| | | | |
| * | | Principal amount stated in U.S. dollars unless otherwise noted. |
| (a) | | Non-income producing security. |
| (b) | | All or a portion of the security was pledged as collateral against open futures contracts. As of December 31, 2018, the market value of securities pledged was $2,795,600. |
See accompanying notes to financial statements.
BHFTII-10
Brighthouse Funds Trust II
MetLife Mid Cap Stock Index Portfolio
Schedule of Investments as of December 31, 2018
| | | | |
| (c) | | All or a portion of the security was held on loan. As of December 31, 2018, the market value of securities loaned was $137,078,200 and the collateral received consisted of cash in the amount of $134,092,708 andnon-cash collateral with a value of $5,380,131. The cash collateral investments are disclosed in the Schedule of Investments and categorized as Securities Lending Reinvestments. Thenon-cash collateral received consists of U.S. government securities that are held in safe-keeping by the lending agent, or a third-party custodian, cannot be sold or repledged by the Portfolio. As such, this collateral is excluded from the Statement of Assets and Liabilities. |
| (d) | | The rate shown represents current yield to maturity. |
| (e) | | Represents investment of cash collateral received from securities on loan as of December 31, 2018. |
| (f) | | Variable or floating rate security. The stated rate represents the rate at December 31, 2018. Maturity date shown for callable securities reflects the earliest possible call date. For securities based on a published reference index and spread, the index and spread are indicated in the description above. For certain variable rate securities, the coupon rate is determined by the issuer/agent based on current market conditions. For certain asset- and mortgage-backed securities, the coupon rate may fluctuate based on changes of the underlying collateral or prepayments of principal. These securities do not indicate a reference index and spread in their description above. |
Futures Contracts
| | | | | | | | | | | | | | | | | | | | |
Futures Contracts—Long | | Expiration
Date | | | Number of
Contracts | | | Notional
Amount | | | Value/
Unrealized
Depreciation | |
S&P Midcap 400 IndexE-Mini Futures | | | 03/15/19 | | | | 46 | | | | USD | | | | 7,646,120 | | | $ | (339,547 | ) |
| | | | | | | | | | | | | | | | | | | | |
Glossary of Abbreviations
Currencies
| | | | |
| (USD)— | | United States Dollar |
Other Abbreviations
| | | | |
| (FEDEFF PRV)— | | Effective Federal Funds Rate |
| (ETF)— | | Exchange-Traded Fund |
| (LIBOR)— | | London Interbank Offered Rate |
| (REIT)— | | Real Estate Investment Trust |
| (SOFR)— | | Secured Overnight Financing Rate |
Fair Value Hierarchy
Accounting principles generally accepted in the United States of America (“GAAP”) define fair market value as the price that the Portfolio would receive to sell an asset or pay to transfer a liability in an orderly transaction between market participants at the measurement date. It establishes a fair value hierarchy that prioritizes inputs to valuation methods and requires disclosure of the fair value hierarchy, separately for each major category of assets and liabilities, that segregates fair value measurements into three levels. Levels 1, 2 and 3 of the fair value hierarchy are defined as follows:
Level 1 - unadjusted quoted prices in active markets for identical investments
Level 2 - other significant observable inputs (including, but not limited to, quoted prices for similar assets or liabilities in markets that are either active or inactive; inputs other than quoted prices that are observable such as interest rates, yield curves, volatilities, prepayment speeds, loss severities, credit risks, default rates, or other market corroborated inputs)
Level 3 - significant unobservable inputs based on the best information available in the circumstances, to the extent observable inputs are unavailable (including the Portfolio’s own assumptions used in determining the fair value of investments and derivative financial instruments)
The inputs or methodologies used for valuing investments are not necessarily an indication of the risk associated with investing in them. Changes to the inputs or methodologies used may result in transfers between levels. A reconciliation of Level 3 securities, if any, will be disclosed following the fair value hierarchy table. For more information about the Portfolio’s policy regarding the valuation of investments, please refer to the Notes to Financial Statements.
The following table summarizes the fair value hierarchy of the Portfolio’s investments as of December 31, 2018:
| | | | | | | | | | | | | | | | |
| Description | | Level 1 | | | Level 2 | | | Level 3 | | | Total | |
Total Common Stocks* | | $ | 900,986,187 | | | $ | — | | | $ | — | | | $ | 900,986,187 | |
Total Mutual Fund* | | | 17,131,122 | | | | — | | | | — | | | | 17,131,122 | |
Total Short-Term Investments* | | | — | | | | 13,304,482 | | | | — | | | | 13,304,482 | |
Total Securities Lending Reinvestments* | | | — | | | | 134,140,535 | | | | — | | | | 134,140,535 | |
Total Investments | | $ | 918,117,309 | | | $ | 147,445,017 | | | $ | — | | | $ | 1,065,562,326 | |
| | | | | | | | | | | | | | | | | |
Collateral for Securities Loaned (Liability) | | $ | — | | | $ | (134,092,708 | ) | | $ | — | | | $ | (134,092,708 | ) |
| Futures Contracts | |
Futures Contracts (Unrealized Depreciation) | | $ | (339,547 | ) | | $ | — | | | $ | — | | | $ | (339,547 | ) |
| | | | |
| * | | See Schedule of Investments for additional detailed categorizations. |
See accompanying notes to financial statements.
BHFTII-11
Brighthouse Funds Trust II
MetLife Mid Cap Stock Index Portfolio
Statement of Assets and Liabilities
December 31, 2018
| | | | |
Assets | |
Investments at value (a) (b) | | $ | 1,065,562,326 | |
Receivable for: | |
Investments sold | | | 479,610 | |
Fund shares sold | | | 2,089,665 | |
Dividends | | | 1,020,435 | |
Variation margin on futures contracts | | | 74,980 | |
Prepaid expenses | | | 3,031 | |
| | | | |
Total Assets | | | 1,069,230,047 | |
Liabilities | |
Due to custodian | | | 64,108 | |
Collateral for securities loaned | | | 134,092,708 | |
Payables for: | |
Investments purchased | | | 5,760,224 | |
Fund shares redeemed | | | 1,049,279 | |
Accrued Expenses: | |
Management fees | | | 201,067 | |
Distribution and service fees | | | 108,827 | |
Deferred trustees’ fees | | | 111,916 | |
Other expenses | | | 206,623 | |
| | | | |
Total Liabilities | | | 141,594,752 | |
| | | | |
Net Assets | | $ | 927,635,295 | |
| | | | |
Net Assets Consist of: | |
Paid in surplus | | $ | 698,708,236 | |
Distributable earnings (Accumulated losses) | | | 228,927,059 | |
| | | | |
Net Assets | | $ | 927,635,295 | |
| | | | |
Net Assets | |
Class A | | $ | 442,169,311 | |
Class B | | | 330,817,623 | |
Class E | | | 30,646,223 | |
Class G | | | 124,002,138 | |
Capital Shares Outstanding* | |
Class A | | | 27,090,557 | |
Class B | | | 20,610,337 | |
Class E | | | 1,894,721 | |
Class G | | | 7,784,665 | |
Net Asset Value, Offering Price and Redemption Price Per Share | |
Class A | | $ | 16.32 | |
Class B | | | 16.05 | |
Class E | | | 16.17 | |
Class G | | | 15.93 | |
| | | | |
| * | | The Portfolio is authorized to issue an unlimited number of shares. |
| (a) | | Identified cost of investments was $947,183,295. |
| (b) | | Includes securities loaned at value of $137,078,200. |
Statement of Operations
Year Ended December 31, 2018
| | | | |
Investment Income | |
Dividends (a) | | $ | 17,222,412 | |
Interest | | | 274,524 | |
Securities lending income | | | 669,706 | |
| | | | |
Total investment income | | | 18,166,642 | |
Expenses | |
Management fees | | | 2,775,496 | |
Administration fees | | | 43,143 | |
Custodian and accounting fees | | | 93,685 | |
Distribution and service fees—Class B | | | 1,005,222 | |
Distribution and service fees—Class E | | | 56,552 | |
Distribution and service fees—Class G | | | 435,006 | |
Audit and tax services | | | 44,663 | |
Legal | | | 45,317 | |
Trustees’ fees and expenses | | | 33,734 | |
Shareholder reporting | | | 176,982 | |
Insurance | | | 7,192 | |
Miscellaneous | | | 121,664 | |
| | | | |
Total expenses | | | 4,838,656 | |
Less management fee waiver | | | (36,237 | ) |
| | | | |
Net expenses | | | 4,802,419 | |
| | | | |
Net Investment Income | | | 13,364,223 | |
| | | | |
Net Realized and Unrealized Gain (Loss) | |
| Net realized gain (loss) on: | |
Investments | | | 101,293,561 | |
Futures contracts | | | (179,592 | ) |
| | | | |
Net realized gain | | | 101,113,969 | |
| | | | |
| Net change in unrealized depreciation on: | |
Investments | | | (228,859,339 | ) |
Futures contracts | | | (521,360 | ) |
| | | | |
Net change in unrealized depreciation | | | (229,380,699 | ) |
| | | | |
Net realized and unrealized loss | | | (128,266,730 | ) |
| | | | |
Net Decrease in Net Assets From Operations | | $ | (114,902,507 | ) |
| | | | |
| | | | |
| (a) | | Net of foreign withholding taxes of $9,089. |
See accompanying notes to financial statements.
BHFTII-12
Brighthouse Funds Trust II
MetLife Mid Cap Stock Index Portfolio
Statements of Changes in Net Assets
| | | | | | | | |
| | | Year Ended
December 31,
2018 | | | Year Ended
December 31,
2017 | |
Increase (Decrease) in Net Assets: | |
From Operations | |
Net investment income | | $ | 13,364,223 | | | $ | 12,504,559 | |
Net realized gain | | | 101,113,969 | | | | 91,129,049 | |
Net change in unrealized appreciation (depreciation) | | | (229,380,699 | ) | | | 61,164,045 | |
| | | | | | | | |
Increase (decrease) in net assets from operations | | | (114,902,507 | ) | | | 164,797,653 | |
| | | | | | | | |
From Distributions to Shareholders (a) | |
Class A | | | (49,701,046 | ) | | | (39,181,289 | ) |
Class B | | | (37,914,266 | ) | | | (31,449,360 | ) |
Class E | | | (3,540,444 | ) | | | (2,945,440 | ) |
Class G | | | (13,653,593 | ) | | | (10,777,522 | ) |
| | | | | | | | |
Total distributions | | | (104,809,349 | ) | | | (84,353,611 | ) |
| | | | | | | | |
Increase (decrease) in net assets from capital share transactions | | | (14,733,599 | ) | | | 5,767,226 | |
| | | | | | | | |
Total increase (decrease) in net assets | | | (234,445,455 | ) | | | 86,211,268 | |
|
Net Assets | |
Beginning of period | | | 1,162,080,750 | | | | 1,075,869,482 | |
| | | | | | | | |
End of period | | $ | 927,635,295 | | | $ | 1,162,080,750 | (b) |
| | | | | | | | |
Other Information:
Capital Shares
Transactions in capital shares were as follows:
| | | | | | | | | | | | | | | | |
| | | Year Ended
December 31, 2018 | | | Year Ended
December 31, 2017 | |
| | | Shares | | | Value | | | Shares | | | Value | |
Class A | |
Sales | | | 1,527,734 | | | $ | 29,079,587 | | | | 3,333,449 | | | $ | 62,740,951 | |
Reinvestments | | | 2,563,231 | | | | 49,701,046 | | | | 2,113,338 | | | | 39,181,289 | |
Redemptions | | | (3,938,405 | ) | | | (77,535,807 | ) | | | (4,666,967 | ) | | | (88,550,204 | ) |
| | | | | | | | | | | | | | | | |
Net increase | | | 152,560 | | | $ | 1,244,826 | | | | 779,820 | | | $ | 13,372,036 | |
| | | | | | | | | | | | | | | | |
Class B | |
Sales | | | 640,410 | | | $ | 11,405,224 | | | | 760,758 | | | $ | 14,432,396 | |
Reinvestments | | | 1,986,080 | | | | 37,914,266 | | | | 1,720,424 | | | | 31,449,360 | |
Redemptions | | | (3,437,673 | ) | | | (66,807,275 | ) | | | (3,035,028 | ) | | | (57,912,482 | ) |
| | | | | | | | | | | | | | | | |
Net decrease | | | (811,183 | ) | | $ | (17,487,785 | ) | | | (553,846 | ) | | $ | (12,030,726 | ) |
| | | | | | | | | | | | | | | | |
Class E | |
Sales | | | 67,928 | | | $ | 1,289,311 | | | | 67,080 | | | $ | 1,286,199 | |
Reinvestments | | | 184,110 | | | | 3,540,444 | | | | 160,078 | | | | 2,945,440 | |
Redemptions | | | (352,470 | ) | | | (6,861,678 | ) | | | (325,322 | ) | | | (6,259,722 | ) |
| | | | | | | | | | | | | | | | |
Net decrease | | | (100,432 | ) | | $ | (2,031,923 | ) | | | (98,164 | ) | | $ | (2,028,083 | ) |
| | | | | | | | | | | | | | | | |
Class G | |
Sales | | | 1,038,856 | | | $ | 19,550,263 | | | | 1,097,750 | | | $ | 20,684,599 | |
Reinvestments | | | 720,506 | | | | 13,653,593 | | | | 593,149 | | | | 10,777,522 | |
Redemptions | | | (1,539,013 | ) | | | (29,662,573 | ) | | | (1,319,461 | ) | | | (25,008,122 | ) |
| | | | | | | | | | | | | | | | |
Net increase | | | 220,349 | | | $ | 3,541,283 | | | | 371,438 | | | $ | 6,453,999 | |
| | | | | | | | | | | | | | | | |
Increase (decrease) derived from capital shares transactions | | | | | | $ | (14,733,599 | ) | | | | | | $ | 5,767,226 | |
| | | | | | | | | | | | | | | | |
| | | | |
| (a) | | Distributions from net investment income and realized gains are no longer required to be separately disclosed. The presentation for the year ended December 31, 2018 has been adjusted for this change (See Note 9). At December 31, 2017 the distributions were as follows. |
| | | | | | | | |
| | | Distributions from net
investment income: | | | Distributions from
realized capital gains: | |
Class A | | $ | (7,049,030 | ) | | $ | (32,132,259 | ) |
Class B | | | (4,872,736 | ) | | | (26,576,624 | ) |
Class E | | | (484,668 | ) | | | (2,460,772 | ) |
Class G | | | (1,663,693 | ) | | | (9,113,829 | ) |
| | | | |
| (b) | | As part of the update in (a), it is also no longer required to disclose the Undistributed net investment income (Accumulated losses) which was $11,982,487 as of December 31, 2017. |
See accompanying notes to financial statements.
BHFTII-13
Brighthouse Funds Trust II
MetLife Mid Cap Stock Index Portfolio
Financial Highlights
| | | | | | | | | | | | | | | | | | | | |
| Selected per share data | |
| | | Class A | |
| | | Year Ended December 31, | |
| | | 2018 | | | 2017 | | | 2016 | | | 2015 | | | 2014 | |
Net Asset Value, Beginning of Period | | $ | 20.24 | | | $ | 18.89 | | | $ | 17.23 | | | $ | 19.01 | | | $ | 18.45 | |
| | | | | | | | | | | | | | | | | | | | |
Income (Loss) from Investment Operations | |
Net investment income (a) | | | 0.26 | | | | 0.24 | | | | 0.27 | | | | 0.24 | | | | 0.24 | |
Net realized and unrealized gain (loss) | | | (2.24 | ) | | | 2.63 | | | | 3.04 | | | | (0.57 | ) | | | 1.41 | |
| | | | | | | | | | | | | | | | | | | | |
Total income (loss) from investment operations | | | (1.98 | ) | | | 2.87 | | | | 3.31 | | | | (0.33 | ) | | | 1.65 | |
| | | | | | | | | | | | | | | | | | | | |
Less Distributions | |
Distributions from net investment income | | | (0.26 | ) | | | (0.27 | ) | | | (0.24 | ) | | | (0.23 | ) | | | (0.20 | ) |
Distributions from net realized capital gains | | | (1.68 | ) | | | (1.25 | ) | | | (1.41 | ) | | | (1.22 | ) | | | (0.89 | ) |
| | | | | | | | | | | | | | | | | | | | |
Total distributions | | | (1.94 | ) | | | (1.52 | ) | | | (1.65 | ) | | | (1.45 | ) | | | (1.09 | ) |
| | | | | | | | | | | | | | | | | | | | |
Net Asset Value, End of Period | | $ | 16.32 | | | $ | 20.24 | | | $ | 18.89 | | | $ | 17.23 | | | $ | 19.01 | |
| | | | | | | | | | | | | | | | | | | | |
Total Return (%) (b) | | | (11.30 | ) | | | 15.95 | | | | 20.43 | | | | (2.35 | ) | | | 9.49 | |
|
Ratios/Supplemental Data | |
Gross ratio of expenses to average net assets (%) | | | 0.30 | | | | 0.30 | | | | 0.30 | | | | 0.30 | | | | 0.30 | |
Net ratio of expenses to average net assets (%) (c) | | | 0.30 | | | | 0.29 | | | | 0.29 | | | | 0.29 | | | | 0.30 | |
Ratio of net investment income to average net assets (%) | | | 1.34 | | | | 1.26 | | | | 1.53 | | | | 1.30 | | | | 1.33 | |
Portfolio turnover rate (%) | | | 25 | | | | 23 | | | | 28 | | | | 25 | | | | 17 | |
Net assets, end of period (in millions) | | $ | 442.2 | | | $ | 545.3 | | | $ | 494.1 | | | $ | 411.5 | | | $ | 399.6 | |
| |
| | | Class B | |
| | | Year Ended December 31, | |
| | | 2018 | | | 2017 | | | 2016 | | | 2015 | | | 2014 | |
Net Asset Value, Beginning of Period | | $ | 19.93 | | | $ | 18.63 | | | $ | 17.01 | | | $ | 18.79 | | | $ | 18.25 | |
| | | | | | | | | | | | | | | | | | | | |
Income (Loss) from Investment Operations | |
Net investment income (a) | | | 0.21 | | | | 0.19 | | | | 0.22 | | | | 0.19 | | | | 0.19 | |
Net realized and unrealized gain (loss) | | | (2.20 | ) | | | 2.59 | | | | 3.00 | | | | (0.57 | ) | | | 1.39 | |
| | | | | | | | | | | | | | | | | | | | |
Total income (loss) from investment operations | | | (1.99 | ) | | | 2.78 | | | | 3.22 | | | | (0.38 | ) | | | 1.58 | |
| | | | | | | | | | | | | | | | | | | | |
Less Distributions | |
Distributions from net investment income | | | (0.21 | ) | | | (0.23 | ) | | | (0.19 | ) | | | (0.18 | ) | | | (0.15 | ) |
Distributions from net realized capital gains | | | (1.68 | ) | | | (1.25 | ) | | | (1.41 | ) | | | (1.22 | ) | | | (0.89 | ) |
| | | | | | | | | | | | | | | | | | | | |
Total distributions | | | (1.89 | ) | | | (1.48 | ) | | | (1.60 | ) | | | (1.40 | ) | | | (1.04 | ) |
| | | | | | | | | | | | | | | | | | | | |
Net Asset Value, End of Period | | $ | 16.05 | | | $ | 19.93 | | | $ | 18.63 | | | $ | 17.01 | | | $ | 18.79 | |
| | | | | | | | | | | | | | | | | | | | |
Total Return (%) (b) | | | (11.51 | ) | | | 15.63 | | | | 20.14 | | | | (2.62 | ) | | | 9.23 | |
|
Ratios/Supplemental Data | |
Gross ratio of expenses to average net assets (%) | | | 0.55 | | | | 0.55 | | | | 0.55 | | | | 0.55 | | | | 0.55 | |
Net ratio of expenses to average net assets (%) (c) | | | 0.55 | | | | 0.54 | | | | 0.54 | | | | 0.54 | | | | 0.55 | |
Ratio of net investment income to average net assets (%) | | | 1.09 | | | | 1.01 | | | | 1.28 | | | | 1.04 | | | | 1.08 | |
Portfolio turnover rate (%) | | | 25 | | | | 23 | | | | 28 | | | | 25 | | | | 17 | |
Net assets, end of period (in millions) | | $ | 330.8 | | | $ | 427.0 | | | $ | 409.3 | | | $ | 374.7 | | | $ | 404.0 | |
Please see following page for Financial Highlights footnote legend.
See accompanying notes to financial statements.
BHFTII-14
Brighthouse Funds Trust II
MetLife Mid Cap Stock Index Portfolio
Financial Highlights
| | | | | | | | | | | | | | | | | | | | |
| Selected per share data | |
| | | Class E | |
| | | Year Ended December 31, | |
| | | 2018 | | | 2017 | | | 2016 | | | 2015 | | | 2014 | |
Net Asset Value, Beginning of Period | | $ | 20.07 | | | $ | 18.75 | | | $ | 17.10 | | | $ | 18.89 | | | $ | 18.33 | |
| | | | | | | | | | | | | | | | | | | | |
Income (Loss) from Investment Operations | |
Net investment income (a) | | | 0.23 | | | | 0.21 | | | | 0.24 | | | | 0.21 | | | | 0.21 | |
Net realized and unrealized gain (loss) | | | (2.22 | ) | | | 2.61 | | | | 3.03 | | | | (0.59 | ) | | | 1.41 | |
| | | | | | | | | | | | | | | | | | | | |
Total income (loss) from investment operations | | | (1.99 | ) | | | 2.82 | | | | 3.27 | | | | (0.38 | ) | | | 1.62 | |
| | | | | | | | | | | | | | | | | | | | |
Less Distributions | |
Distributions from net investment income | | | (0.23 | ) | | | (0.25 | ) | | | (0.21 | ) | | | (0.19 | ) | | | (0.17 | ) |
Distributions from net realized capital gains | | | (1.68 | ) | | | (1.25 | ) | | | (1.41 | ) | | | (1.22 | ) | | | (0.89 | ) |
| | | | | | | | | | | | | | | | | | | | |
Total distributions | | | (1.91 | ) | | | (1.50 | ) | | | (1.62 | ) | | | (1.41 | ) | | | (1.06 | ) |
| | | | | | | | | | | | | | | | | | | | |
Net Asset Value, End of Period | | $ | 16.17 | | | $ | 20.07 | | | $ | 18.75 | | | $ | 17.10 | | | $ | 18.89 | |
| | | | | | | | | | | | | | | | | | | | |
Total Return (%) (b) | | | (11.44 | ) | | | 15.80 | | | | 20.26 | | | | (2.58 | ) | | | 9.39 | |
|
Ratios/Supplemental Data | |
Gross ratio of expenses to average net assets (%) | | | 0.45 | | | | 0.45 | | | | 0.45 | | | | 0.45 | | | | 0.45 | |
Net ratio of expenses to average net assets (%) (c) | | | 0.45 | | | | 0.44 | | | | 0.44 | | | | 0.44 | | | | 0.45 | |
Ratio of net investment income to average net assets (%) | | | 1.19 | | | | 1.11 | | | | 1.38 | | | | 1.13 | | | | 1.17 | |
Portfolio turnover rate (%) | | | 25 | | | | 23 | | | | 28 | | | | 25 | | | | 17 | |
Net assets, end of period (in millions) | | $ | 30.6 | | | $ | 40.0 | | | $ | 39.2 | | | $ | 36.7 | | | $ | 42.4 | |
| |
| | | Class G | |
| | | Year Ended December 31, | |
| | | 2018 | | | 2017 | | | 2016 | | | 2015 | | | 2014 | |
Net Asset Value, Beginning of Period | | $ | 19.80 | | | $ | 18.52 | | | $ | 16.92 | | | $ | 18.70 | | | $ | 18.16 | |
| | | | | | | | | | | | | | | | | | | | |
Income (Loss) from Investment Operations | |
Net investment income (a) | | | 0.20 | | | | 0.18 | | | | 0.21 | | | | 0.18 | | | | 0.18 | |
Net realized and unrealized gain (loss) | | | (2.19 | ) | | | 2.58 | | | | 2.98 | | | | (0.57 | ) | | | 1.39 | |
| | | | | | | | | | | | | | | | | | | | |
Total income (loss) from investment operations | | | (1.99 | ) | | | 2.76 | | | | 3.19 | | | | (0.39 | ) | | | 1.57 | |
| | | | | | | | | | | | | | | | | | | | |
Less Distributions | |
Distributions from net investment income | | | (0.20 | ) | | | (0.23 | ) | | | (0.18 | ) | | | (0.17 | ) | | | (0.14 | ) |
Distributions from net realized capital gains | | | (1.68 | ) | | | (1.25 | ) | | | (1.41 | ) | | | (1.22 | ) | | | (0.89 | ) |
| | | | | | | | | | | | | | | | | | | | |
Total distributions | | | (1.88 | ) | | | (1.48 | ) | | | (1.59 | ) | | | (1.39 | ) | | | (1.03 | ) |
| | | | | | | | | | | | | | | | | | | | |
Net Asset Value, End of Period | | $ | 15.93 | | | $ | 19.80 | | | $ | 18.52 | | | $ | 16.92 | | | $ | 18.70 | |
| | | | | | | | | | | | | | | | | | | | |
Total Return (%) (b) | | | (11.56 | ) | | | 15.60 | | | | 20.08 | | | | (2.68 | ) | | | 9.21 | |
|
Ratios/Supplemental Data | |
Gross ratio of expenses to average net assets (%) | | | 0.60 | | | | 0.60 | | | | 0.60 | | | | 0.60 | | | | 0.60 | |
Net ratio of expenses to average net assets (%) (c) | | | 0.60 | | | | 0.59 | | | | 0.59 | | | | 0.59 | | | | 0.60 | |
Ratio of net investment income to average net assets (%) | | | 1.04 | | | | 0.96 | | | | 1.24 | | | | 1.00 | | | | 1.02 | |
Portfolio turnover rate (%) | | | 25 | | | | 23 | | | | 28 | | | | 25 | | | | 17 | |
Net assets, end of period (in millions) | | $ | 124.0 | | | $ | 149.8 | | | $ | 133.2 | | | $ | 104.0 | | | $ | 105.2 | |
| | | | |
| (a) | | Per share amounts based on average shares outstanding during the period. |
| (b) | | Total return does not reflect any insurance, sales, separate account or administrative charges of variable annuity or life insurance contracts or any additional expenses that contract owners may bear under their variable contracts. If these charges were included, the returns would be lower. |
| (c) | | Includes the effects of management fee waivers (see Note 6 of the Notes to Financial Statements). |
See accompanying notes to financial statements.
BHFTII-15
Brighthouse Funds Trust II
MetLife Mid Cap Stock Index Portfolio
Notes to Financial Statements—December 31, 2018
1. Organization
Brighthouse Funds Trust II (the “Trust”) is organized as a Delaware statutory trust and registered under the Investment Company Act of 1940, as amended (the “1940 Act”), as anopen-end management investment company. The Trust, which is managed by Brighthouse Investment Advisers, LLC (“Brighthouse Investment Advisers” or the “Adviser”), currently offers twenty-nine series, each of which operates as a distinct investment vehicle of the Trust. The series included in this report is MetLife Mid Cap Stock Index Portfolio (the “Portfolio”), which is diversified. Shares in the Portfolio are not offered directly to the general public and are currently available only to separate accounts established by life insurance companies affiliated with the Adviser and Metropolitan Life Insurance Company (the “Insurance Companies”).
The Portfolio has registered and offers four classes of shares: Class A, B, E and G shares. Shares of each Class of the Portfolio represent an equal pro rata interest in the Portfolio and generally give the shareholder the same voting, dividend, liquidation, and other rights. Investment income, realized and unrealized capital gains and losses, the common expenses of the Portfolio, and certain Portfolio-level expense reductions, if any, are allocated on a pro rata basis to each Class based on the relative net assets of each Class to the net assets of the Portfolio. Each Class of shares differs in its respective distribution plan and such distribution expenses are allocated to the corresponding Class of shares.
2. Significant Accounting Policies
The preparation of financial statements in conformity with accounting principles generally accepted in the United States of America (“GAAP”) requires management to make estimates and assumptions that affect the reported amounts of assets and liabilities and disclosure of contingent assets and liabilities as of the date of the financial statements and the reported amounts of income and expenses during the reporting period. Actual results could differ from those estimates. In the preparation of these financial statements, management has evaluated events and transactions subsequent to December 31, 2018 through the date the financial statements were issued.
The Portfolio is an investment company and follows the accounting and reporting guidance of the Financial Accounting Standards Board (“FASB”) Accounting Standards Codification Topic 946—Financial Services—Investment Companies. The following is a summary of significant accounting policies consistently followed by the Portfolio in the preparation of its financial statements.
Investment Valuation and Fair Value Measurements - The Portfolio values its portfolio investments for purposes of calculating its net asset value (“NAV”) using procedures approved by the Board of Trustees of the Trust (the “Board” or “Trustees”). Those procedures allow for a variety of methodologies to be used to value the Portfolio’s investments. The specific methodologies used for a particular investment may vary based on the market data available for a specific investment at the time the Portfolio calculates its NAV or based on other considerations. The procedures also permit a level of judgment to be used in the valuation process. The Portfolio follows the accounting and reporting guidance of FASB Accounting Standards Codification Topic 820—Fair Value Measurement.
Domestic and foreign equity securities, such as common stock, exchange-traded funds, rights, warrants, and preferred stock, that are traded on a securities exchange on a valuation date are generally valued at their last quoted sale price or official closing price on the primary exchange for such security, or, if no sales occurred on that day, at the last reported bid price. Equity securities tradedover-the-counter (“OTC”) are generally valued at the last reported bid price. In the event of a major exchange closing during the trading day, the Adviser may use other market information obtained from quotation reporting systems, established market makers, or pricing services in valuing the securities. Valuation adjustments may be applied to certain foreign equity securities that are traded solely on foreign exchanges that close before the time as of which the Portfolio determines its NAV to account for the market movement between the close of the foreign exchanges and the time as of which the Portfolio determines its NAV. The Portfolio may use a systematic fair valuation model provided by a pricing service to value securities principally traded in these foreign markets in order to adjust for possible market movements or other changes that may occur between the close of the foreign exchanges and the time as of which the Portfolio determines its NAV. Foreign equity securities valued using these valuation adjustments are generally categorized as Level 2 within the fair value hierarchy. Equity securities that are actively traded, and have no valuation adjustments applied, are categorized as Level 1 within the fair value hierarchy. Other equity securities traded on inactive markets, or valued in reference to similar instruments traded on active markets, are generally categorized as Level 2 within the fair value hierarchy.
Investments in registeredopen-end management investment companies are valued at reported NAV per share on the valuation date and are categorized as Level 1 within the fair value hierarchy.
Debt securities, including corporate, convertible and municipal bonds and notes; obligations of the U.S. Treasury and U.S. government agencies; foreign sovereign issues; andnon-U.S. bonds, are generally valued on the basis of evaluated or composite bid quotations obtained from independent pricing services and/or brokers and dealers selected by the Adviser (each a “pricing service”), pursuant to the authorization of and subject to general oversight by the Board. Such pricing services may use matrix pricing, which considers observable inputs including, among other things, issuer details, maturity dates, interest rates, yield curves, rates of prepayment, credit risks/spreads, default rates, reported trades, broker-dealer quotes and quoted prices for similar assets. Short-term obligations with a remaining maturity of sixty days or less may be valued at amortized cost in the absence of market quotes, so long as the amortized cost
BHFTII-16
Brighthouse Funds Trust II
MetLife Mid Cap Stock Index Portfolio
Notes to Financial Statements—December 31, 2018—(Continued)
value of such short-term debt instrument is approximately the same as the fair value of the instrument as determined without the use of amortized cost valuation. Floating rate loans are generally valued on the basis of an evaluated or composite average of aggregate bid and ask quotations supplied by brokers or dealers, as obtained from the pricing service. Securities that use similar valuation techniques and inputs as described above are generally categorized as Level 2 within the fair value hierarchy.
Options, whether on securities, indices, futures contracts, or otherwise, traded on exchanges are valued at the last sale price available as of the close of business on a valuation day or, if there is no such price available, at the last reported bid price. These types of options are categorized as Level 1 within the fair value hierarchy. Futures contracts that are traded on commodity exchanges are valued at their settlement prices established by the exchanges on which they are traded as of the close of such exchanges and are categorized as Level 1 within the fair value hierarchy.
If no current market value quotation or other observable inputs are readily available or market value quotations are deemed to be unreliable for an investment, the fair value of the investment will be determined in accordance with procedures approved by, and under the general supervision of, the Board. In such a circumstance, the Board will be assisted in its responsibility to determine the fair value of an investment by the Valuation Committee (“Committee”) of Brighthouse Investment Advisers. The Committee provides general pricing oversight and fair value pricing determinations related to portfolio securities and meets on a regular basis to review reports relating to the valuation of the securities in the Portfolio. The Board has delegated to State Street Bank and Trust Company, the Trust’s custodian (“Custodian”), the responsibility for calculating the NAVs of the Trust’s Portfolios. The Committee is responsible for overseeing the calculation of the NAVs of the Portfolios by the custodian. The Committee also periodically reviews pricing services, including the pricing services providing fair value pricing for the Portfolio’s foreign securities, and is responsible for overseeing the correction of pricing errors and addressing other pricing issues that arise in the ordinary course of business, such as making real-time fair value determinations, as necessary.
No single standard for determining the fair value of an investment can be set forth because fair value depends upon the facts and circumstances with respect to each investment. Information relating to any relevant factors may be obtained by the Committee from any appropriate source, including the subadviser of the Portfolio, the custodian, a pricing service, market maker and/or broker for such security or the issuer. Appropriate methodologies for determining fair value under particular circumstances may include: matrix pricing, a discounted cash flow analysis, comparisons of securities with comparable characteristics, value based on multiples of earnings, discount from market price of similar marketable securities, or a combination of these and other methods.
Investment Transactions and Related Investment Income - Portfolio security transactions are recorded on the trade date. Dividend income is recorded on theex-dividend date or, for certain foreign securities, when notified. Interest income, which includes amortization of premium and accretion of discount on debt securities, is recorded on the accrual basis. Realized gains and losses on investments are determined on the identified cost basis, which is the same basis used for federal income tax purposes. Foreign income and foreign capital gains on some foreign securities may be subject to foreign taxes, which are accrued as applicable. These foreign taxes have been provided for in accordance with the Portfolio’s understanding of the applicable countries’ tax rules and rates.
Foreign Currency Translation -The books and records of the Portfolio are maintained in U.S. dollars. The values of securities, currencies, and other assets and liabilities denominated in currencies other than the U.S. dollar are translated into U.S. dollars based upon foreign exchange rates prevailing at the end of the period. Purchases and sales of investment securities, income, and expenses are translated on the respective dates of such transactions. Because the values of investment securities are translated at the foreign exchange rates prevailing at the end of the period, that portion of the results of operations arising from changes in exchange rates and that portion of the results of operations reflecting fluctuations arising from changes in market prices of the investment securities are not separated. Such fluctuations are included in the net realized and unrealized gain or loss on investments.
Net realized foreign exchange gains or losses arise from activity in forward foreign currency exchange contracts, sales of foreign currency, currency gains or losses realized between the trade and settlement dates on securities transactions, and the difference between the amounts of dividends, interest, and foreign withholding taxes recorded by the Portfolio and the U.S. dollar-equivalent of the amounts actually received or paid by the Portfolio. Net unrealized foreign exchange gains and losses arise from changes in the value of assets and liabilities, other than investment securities, resulting from changes in foreign exchange rates.
Due to Custodian -Pursuant to the custodian agreement, the Custodian may, in its discretion, advance funds to the Portfolio to make properly authorized payments. When such payments result in an overdraft, the Portfolio is obligated to repay the Custodian at the current rate of interest charged by the Custodian for secured loans (currently, the federal funds rate plus 2%). This obligation is payable on demand to the Custodian. The Custodian has a lien on the Portfolio’s assets to the extent of any overdraft. At December 31, 2018, the Portfolio had a payment of $64,108 due to the Custodian pursuant to the foregoing arrangement. Based on the short-term nature of these payments and the variable interest rate, the carrying value of the overdraft advances approximated its fair value at December 31, 2018. If measured at fair value, overdraft advances would have been considered as Level 2 in the fair value hierarchy at December 31, 2018. The Portfolio’s average overdraft advances during the year ended December 31, 2018 were not significant.
BHFTII-17
Brighthouse Funds Trust II
MetLife Mid Cap Stock Index Portfolio
Notes to Financial Statements—December 31, 2018—(Continued)
Dividends and Distributions to Shareholders -The Portfolio records dividends and distributions on theex-dividend date. Net realized gains from securities transactions (if any) are generally distributed annually to shareholders. The timing and characterization of certain income and capital gains distributions are determined in accordance with federal tax regulations that may differ from GAAP. Permanent book and tax basis differences relating to shareholder distributions will result in reclassification between distributable earnings (accumulated losses) andpaid-in surplus. These adjustments have no impact on net assets or the results of operations.
Income Taxes -It is the Portfolio’s policy to comply with the requirements of the Internal Revenue Code of 1986, as amended, and regulations thereunder, applicable to regulated investment companies, and to distribute, with respect to each taxable year, all of its taxable income to shareholders. Therefore, no federal income tax provision is required. The Portfolio files U.S. federal tax returns. No income tax returns are currently under examination. The Portfolio’s federal tax returns for the prior three fiscal years remain subject to examination by the Internal Revenue Service. As of December 31, 2018, the Portfolio had no uncertain tax positions that would require financial statement recognition, or derecognition or disclosure.
Repurchase Agreements -The Portfolio may enter into repurchase agreements, under the terms of a Master Repurchase Agreement (“MRA”), with selected commercial banks and broker-dealers, under which the Portfolio acquires securities as collateral and agrees to resell the securities at an agreed-upon time and at an agreed-upon price. The Portfolio, through the custodian or a subcustodian, under atri-party repurchase agreement, receives delivery of the underlying securities collateralizing any repurchase agreements. It is the Portfolio’s policy that the market value of the collateral be equal to at least 100% of the repurchase price in the case of a repurchase agreement ofone-day duration and equal to at least 102% of the repurchase price in the case of all other repurchase agreements. In the event of default or failure by a party to perform an obligation in connection with any repurchase transaction, the MRA gives thenon-defaulting party the right toset-off claims and to apply property held by it in connection with any repurchase transaction against obligations owed to it.
At December 31, 2018, the Portfolio invested cash collateral for loans of portfolio securities in repurchase agreements with a gross value of $27,418,061. The value of all repurchase agreements is included as part of investments at value on the Statement of Assets and Liabilities. The value of the related collateral exceeded the value of the repurchase agreements at December 31, 2018.
Securities Lending - The Portfolio may lend its portfolio securities to certain qualified brokers who borrow securities in order to complete certain securities transactions. By lending its portfolio securities, the Portfolio attempts to increase its net investment income through the receipt of income on collateral held from securities on loan. Any gain or loss in the market price of the loaned securities that might occur and any interest earned or dividends declared during the term of the loan would accrue to the account of the Portfolio.
The Trust has entered into aNon-Custodial Securities Lending Agreement with JPMorgan Chase Bank, N.A. (the “Lending Agent”). Under the agreement, the Lending Agent is authorized to loan portfolio securities on the Portfolio’s behalf. In exchange, the Portfolio receives either cash or U.S. government securities as collateral against the loaned securities. The Portfolio receives collateral equal to at least 102% of the market value for loans secured by government securities or cash in the same currency as the loaned shares and 105% for all other loaned securities at each loan’s inception. Collateral representing at least 100% of the market value of the loaned securities is maintained for the duration of the loan. Any cash collateral received by the Portfolio is generally invested by the Lending Agent in short-term investments, which may include certificates of deposit, commercial paper, repurchase agreements, time deposits, master demand notes and money market funds. The market value of investments made with cash collateral received are disclosed in the Schedule of Investments and the valuation techniques are described in Note 2. If the market value of the collateral at the close of trading on a business day is less than 100% of the market value of the loaned securities at the close of trading on that day, the borrower is required to deliver, by the close of business on the following business day, an additional amount of collateral, so that the total amount of posted collateral is equal to at least 100% of the market value of all the loaned securities as of such preceding day. A portion of the income earned on the collateral is rebated to the borrower of the securities and the remainder is split between the Lending Agent and the Portfolio. On loans collateralized by U.S. government securities, a fee is received from the borrower and is allocated between the Portfolio and the Lending Agent.
Income received by the Portfolio in securities lending transactions during the year ended December 31, 2018 is reflected as securities lending income on the Statement of Operations. The values of any securities loaned by the Portfolio and the related collateral at December 31, 2018 are disclosed in the footnotes to the Schedule of Investments. The value of the related collateral received by the Portfolio exceeded the value of the securities out on loan at December 31, 2018.
The risks associated with lending portfolio securities include, but are not limited to, possible delays in receiving additional collateral or in the recovery of the loaned securities, possible loss of rights in the collateral should the borrower fail financially, as well as risk of loss in the value of the collateral or the value of the investments made with the collateral. The Lending Agent shall indemnify the Portfolio in the case of default of any securities borrower, subject to the terms of theNon-Custodial Securities Lending Agreement.
BHFTII-18
Brighthouse Funds Trust II
MetLife Mid Cap Stock Index Portfolio
Notes to Financial Statements—December 31, 2018—(Continued)
The following table provides a breakdown of transactions accounted for as secured borrowings, the gross obligations by the type of collateral pledged, and the remaining contractual maturities of those transactions.
| | | | | | | | | | | | | | | | | | | | |
| | | Remaining Contractual Maturity of the Agreements
As of December 31, 2018 | |
| | | Overnight and
Continuous | | | Up to
30 Days | | | 31 - 90
Days | | | Greater than
90 days | | | Total | |
| Securities Lending Transactions | |
Common Stocks | | $ | (128,372,300 | ) | | $ | — | | | $ | — | | | $ | — | | | $ | (128,372,300 | ) |
Mutual Funds | | | (5,720,408 | ) | | | — | | | | — | | | | — | | | | (5,720,408 | ) |
Total | | $ | (134,092,708 | ) | | $ | — | | | $ | — | | | $ | — | | | $ | (134,092,708 | ) |
Total Borrowings | | $ | (134,092,708 | ) | | $ | — | | | $ | — | | | $ | — | | | $ | (134,092,708 | ) |
Gross amount of recognized liabilities for securities lending transactions | | | $ | (134,092,708 | ) |
| | | | | | | | | | | | | | | | | | | | |
3. Investments in Derivative Instruments
Futures Contracts -The Portfolio may buy and sell futures contracts as a hedge, to maintain investment exposure to a target asset class or to enhance return. The Portfolio may be subject to fluctuations in equity prices, interest rates, commodity prices, and foreign currency exchange rates in the normal course of pursuing its investment objective. Futures contracts are standardized agreements to buy or sell a security, or deliver a final cash settlement price in connection with an index, interest rate, currency, or other asset. The Portfolio must deposit an amount (“initial margin”) equal to a certain percentage of the face value of the futures contract. The initial margin may be in the form of cash or securities, which is returned when the Portfolio’s obligations under the contract have been satisfied. If cash is deposited as the initial margin, it is shown as cash collateral on the Statement of Assets and Liabilities. Futures contracts aremarked-to-market daily and subsequent payments (“variation margin”) are made or received by the Portfolio depending on whether unrealized gains or losses are incurred. These amounts are reflected as receivables or payables on the Statement of Assets and Liabilities and as a component of net change in unrealized appreciation/depreciation on the Statement of Operations. When the contract is closed or expires, the Portfolio records a realized gain or loss equal to the difference between the value of the contract at the time it was opened and the value at the time it was closed. Risks of entering into futures contracts (and related options) include the possibility that the market for these instruments may be illiquid and that a change in the value of the contract or option may not correlate perfectly with changes in the value of the underlying instrument. If futures contracts areexchange-traded, the exchange’s clearinghouse, as counterparty to all exchange-traded futures, guarantees the futures contracts against default. For OTC futures, the Portfolio’s ability to terminate the positions may be more limited than in the case of exchange-traded positions and may also involve the risk that securities dealers participating in such transactions would fail to meet their obligations to the Portfolio.
The following table summarizes the fair value of derivatives held by the Portfolio at December 31, 2018 by category of risk exposure:
| | | | | | |
| | | Liability Derivatives | |
Risk Exposure | | Statement of Assets &
Liabilities Location | | Fair Value | |
Equity | | Unrealized depreciation on futures contracts (a) | | $ | 339,547 | |
| | | | | | |
| | | | |
| (a) | | Includes cumulative appreciation/depreciation of futures contracts as reported in the Schedule of Investments. Only the current day’s variation margin is reported within the Statement of Assets and Liabilities. |
The following tables summarize the effect of derivative instruments on the Statement of Operations, classified by derivative type and category of risk exposure, for the year ended December 31, 2018:
| | | | |
Statement of Operations Location—Net Realized Gain (Loss) | | Equity | |
Futures contracts | | $ | (179,592 | ) |
| | | | |
| |
Statement of Operations Location—Net Change in Unrealized Appreciation (Depreciation) | | Equity | |
Futures contracts | | $ | (521,360 | ) |
| | | | |
For the year ended December 31, 2018, the average notional par or face amount outstanding for each derivative type was as follows:
| | | | |
Derivative Description | | Average
Notional Par or
Face Amount‡ | |
Futures contracts long | | $ | 8,033 | |
| | | | |
| ‡ | | Averages are based on activity levels during the period for which the amounts are outstanding. |
BHFTII-19
Brighthouse Funds Trust II
MetLife Mid Cap Stock Index Portfolio
Notes to Financial Statements—December 31, 2018—(Continued)
4. Certain Risks
In the normal course of business, the Portfolio invests in securities and enters into transactions where risks exist. Those risks include:
Market Risk:The value of securities held by the Portfolio may decline in response to certain events, including those directly involving the issuers whose securities are owned by the Portfolio; conditions affecting the general economy; overall market changes; local, regional or global political, social or economic instability; and currency, interest rate, and price fluctuations.
Credit and Counterparty Risk: The Portfolio may be exposed to counterparty risk, or the risk that an entity with which the Portfolio has unsettled or open transactions may default. The potential loss could exceed the value of the financial assets and liabilities recorded in the financial statements. Financial assets that potentially expose the Portfolio to credit and counterparty risk consist principally of cash due from counterparties and investments. The Portfolio manages counterparty risk by entering into agreements only with counterparties that it believes have the financial resources to honor their obligations and by monitoring the financial stability of those counterparties. The Adviser attempts to mitigate counterparty risk by (i) periodically assessing the creditworthiness of its trading partners, (ii) monitoring and/or limiting the amount of its net exposure to each individual counterparty based on its assessment, and (iii) requiring collateral from the counterparty for certain transactions. In order to preserve certain safeguards fornon-standard settlement trades, the Portfolio restricts its exposure to credit and counterparty losses by entering into master netting agreements (“Master Agreements”) with counterparties (approved brokers) with whom it undertakes a significant volume of transactions. Master Agreements govern the terms of certain transactions, and reduce the counterparty risk associated with relevant transactions by specifying credit protection mechanisms and providing standardization that improves legal certainty. Master Agreements can also help limit counterparty risk by specifying collateral posting arrangements atpre-arranged exposure levels.
Repurchase and reverse repurchase agreements are primarily executed under Global Master Repurchase Agreements (“GMRAs”) or Master Repurchase Agreements (“MRAs”), which provide the rights toset-off. Each repurchase and reverse repurchase agreement is initially collateralized at the transaction level. In the event of default, the total market value exposure will be offset against collateral exchanged to date, which would result in a net receivable/(payable) that would be due from/to the counterparty.
Customer Account Agreements and related addenda govern cleared derivatives transactions such as futures, options on futures, and cleared OTC derivatives. Cleared derivative transactions require posting of initial margin as determined by each relevant clearing agency, which is segregated at a broker account registered with the Commodities Futures Trading Commission (“CFTC”), or the applicable regulator. In the U.S., counterparty risk is significantly reduced as creditors of the futures broker do not have claim to portfolio assets in the segregated account. Additionally, portability of exposure in the event of default further reduces risk to the Portfolio. Variation margin, or changes in market value, are exchanged daily, but may not be netted between futures and cleared OTC derivatives.
Additional risks associated with each type of investment are described above within the respective security type notes. The Portfolio’s prospectus includes a discussion of the principal risks of investing in the Portfolio.
5. Investment Transactions
Aggregate cost of purchases and proceeds of sales of investment securities, excluding short-term securities, for the year ended December 31, 2018 were as follows:
| | | | | | | | | | | | |
Purchases | | | Sales | |
U.S. Government | | Non-U.S. Government | | | U.S. Government | | | Non-U.S. Government | |
| $0 | | $ | 271,470,832 | | | $ | 0 | | | $ | 359,424,046 | |
6. Investment Management Fees and Other Transactions with Affiliates
Investment Management Agreement -Brighthouse Investment Advisers is the investment adviser to the Portfolio. The Trust has entered into an investment management agreement with Brighthouse Investment Advisers with respect to the Portfolio. For providing investment management services to the Portfolio, Brighthouse Investment Advisers receives monthly compensation at the annual rate of 0.250% of average daily net assets. Fees earned by Brighthouse Investment Advisers with respect to the Portfolio for the year ended December 31, 2018 were $2,775,496.
BHFTII-20
Brighthouse Funds Trust II
MetLife Mid Cap Stock Index Portfolio
Notes to Financial Statements—December 31, 2018—(Continued)
Brighthouse Investment Advisers has entered into an investment subadvisory agreement with MetLife Investment Advisors, LLC (“MIA”) with respect to managing the Portfolio. For providing subadvisory services to the Portfolio, Brighthouse Investment Advisers has agreed to pay MIA an investment subadvisory fee for each class of the Portfolio as follows:
| | |
% per annum | | Average Daily Net Assets |
| 0.030% | �� | On the first $500 million |
| 0.020% | | On the next $500 million |
| 0.010% | | On amounts over $1 billion |
Fees earned by MIA with respect to the Portfolio for the year ended December 31, 2018 were $260,585.
Management Fee Waivers - Pursuant to an expense agreement, Brighthouse Investment Advisers has agreed, for the period April 30, 2018 to April 30, 2019, to reduce its advisory fees set out above under “Investment Management Agreement” for each class of the Portfolio as follows:
| | |
% per annum reduction | | Average Daily Net Assets |
| 0.005% | | Over $500 million and under $1 billion |
| 0.010% | | Of the next $1 billion |
| 0.015% | | On amounts over $2 billion |
An identical expense agreement was in place for the period May 1, 2017 to April 30, 2018. Amounts waived for the year ended December 31, 2018 are shown as management fee waivers in the Statement of Operations.
Certain officers and trustees of the Trust may also be officers of Brighthouse Investment Advisers; however, such officers and trustees receive no compensation from the Trust.
Transfer Agency Agreement -Brighthouse Financial, Inc. serves as the transfer agent for the Trust. Brighthouse Financial, Inc. receives no fees for its services to the Trust.
Distribution and Service Fees -The Trust has a distribution agreement with Brighthouse Securities, LLC (the “Distributor”) pursuant to which the Distributor serves as the general distributor of shares of each class (each a “Class”) of each Portfolio. The Distributor is an affiliate of the Trust. The Trust has adopted a Distribution and Services Plan (the “Plan”) relating to Class B, Class E and Class G shares of each Portfolio, under Rule 12b-1 under the 1940 Act, pursuant to which the Trust may pay the Distributor a fee (the “Service Fee”) at an annual rate not to exceed 0.25% of each such Portfolio’s average daily net assets attributable to the Class B, Class E and Class G shares of the Trust. Each Portfolio may not offer shares of each Class. The Plan also authorizes the Trust, on behalf of each of its Portfolios, may pay the Distributor a distribution Fee (the “Distribution Fee” and together with the Service Fee, the “Fees”) at an annual rate of up to 0.25% of each Portfolio’s average daily net assets attributable to the Class B, Class E and Class G shares in consideration of the services rendered in connection with the sale of such shares by the Distributor. Under the Distribution Agreement with respect to the Trust, Fees are currently paid at an annual rate of 0.25% of average daily net assets in the case of Class B shares, 0.15% of average daily net assets in the case of Class E shares and 0.30% of average daily net assets in the case of Class G shares. The Plan is known as a “compensation plan” because the Trust makes payments to the Distributor for services rendered regardless of the actual level of expenditures by the Distributor. Amounts incurred by the Portfolio for the year ended December 31, 2018 are shown as Distribution and service fees in the Statement of Operations.
Deferred Trustee Compensation -Each Trustee who is not currently an employee of the Adviser or any of its affiliates receives compensation from the Trust for his or her service to the Trust. A deferred compensation plan (the “Plan”) is available to the Trustees on a voluntary basis. Deferred amounts remain in the Trust until distributed in accordance with the provisions of the Plan. The value of a participating Trustee’s deferral account is based on theoretical investments of deferred amounts on the normal payment dates in certain portfolios of the Trust or Brighthouse Funds Trust I, an affiliate of the Trust, as designated by the participating Trustee. Changes in the value of participants’ deferral accounts are reflected as Trustees’ fees and expenses in the Statement of Operations. The portion of the accrued obligations allocated to the Portfolio under the Plan is reflected as Deferred trustees’ fees in the Statement of Assets and Liabilities.
7. Contractual Obligations
Under the Trust’s organizational documents, its officers and Trustees may be indemnified against certain liabilities and expenses arising out of the performance of their duties to the Trust. Additionally, the Trust has a variety of indemnification obligations under contracts with its service providers. The Trust’s maximum exposure under these arrangements is unknown, as this would involve future claims that may be made against the Trust that have not yet occurred.
BHFTII-21
Brighthouse Funds Trust II
MetLife Mid Cap Stock Index Portfolio
Notes to Financial Statements—December 31, 2018—(Continued)
8. Income Tax Information
The cost basis of investments for federal income tax purposes at December 31, 2018 was as follows:
| | | | |
Cost basis of investments | | $ | 950,243,198 | |
Gross unrealized appreciation | | | 225,917,431 | |
Gross unrealized depreciation | | | (110,598,303 | ) |
| | | | |
Net unrealized appreciation (depreciation) | | $ | 115,319,128 | |
| | | | |
The tax character of distributions paid for the years ended December 31, 2018 and 2017 were as follows:
| | | | | | | | | | | | | | | | | | | | |
Ordinary Income | | | Long-Term Capital Gain | | | Total | |
2018 | | 2017 | | | 2018 | | | 2017 | | | 2018 | | | 2017 | |
| $17,717,458 | | $ | 15,139,291 | | | $ | 87,091,891 | | | $ | 69,214,320 | | | $ | 104,809,349 | | | $ | 84,353,611 | |
As of December 31, 2018, the components of distributable earnings (accumulated losses) on a federal income tax basis were as follows:
| | | | | | | | | | | | | | | | |
Undistributed
Ordinary
Income | | Undistributed
Long-Term
Capital Gain | | | Net
Unrealized
Appreciation | | | Accumulated
Capital Losses | | | Total | |
| $17,093,429 | | $ | 96,626,418 | | | $ | 115,319,128 | | | $ | — | | | $ | 229,038,975 | |
The Portfolio utilizes the provisions of the federal income tax laws that provide for the carryforward of capital losses for prior years, offsetting such losses against any future realized capital gains. Under the Regulated Investment Company Modernization Act of 2010, net capital losses recognized after December 22, 2010 may be carried forward indefinitely and their character is retained as short-term and/or long-term losses.
As of December 31, 2018, the Portfolio had no accumulated capital losses.
9. Recent Accounting Pronouncements and SEC Update
In August 2018, the FASB issued Accounting Standards Update2018-13, Fair Value Measurement (Topic 820)—Disclosure Framework—Changes to the Disclosure Requirements for Fair Value Measurement (“ASU2018-13”) which introduces new fair value disclosure requirements as well as eliminates and modifies certain existing fair value disclosure requirements. ASU2018-13 is effective for fiscal years beginning after December 15, 2019, and interim periods within those fiscal years. Early adoption is permitted and, as such, management has elected to early adopt ASU2018-13 effective with the current reporting period. The impact of the Portfolio’s adoption was limited to changes in the Portfolio’s financial statement disclosures regarding fair value, primarily those disclosures related to transfers between levels of the fair value hierarchy.
In August 2018, the Securities and Exchange Commission released its Final Rule on Disclosure Update and Simplification (the “Final Rule”) which is intended to simplify an issuer’s disclosure compliance efforts by removing redundant or outdated disclosures requirements without significantly altering the mix of information provided to investors. Effective with the current reporting period, the Portfolio adopted the Final Rule with the most notable impacts being that the Portfolio is no longer required to present the components of distributable earnings on the Statement of Assets and Liabilities or the sources of distributions to shareholders and the amounts of undistributed net investment income on the Statements of Changes in Net Assets.
BHFTII-22
Brighthouse Funds Trust II
MetLife Mid Cap Stock Index Portfolio
Report of Independent Registered Public Accounting Firm
To the Shareholders of MetLife Mid Cap Stock Index Portfolio and the Board of Trustees of Brighthouse Funds Trust II:
Opinion on the Financial Statements and Financial Highlights
We have audited the accompanying statement of assets and liabilities, including the schedule of investments, of the MetLife Mid Cap Stock Index Portfolio (the “Portfolio”), one of the portfolios constituting the Brighthouse Funds Trust II, as of December 31, 2018, the related statement of operations for the year then ended, the statements of changes in net assets for each of the two years in the period then ended, the financial highlights for each of the five years in the period then ended, and the related notes. In our opinion, the financial statements and financial highlights present fairly, in all material respects, the financial position of the MetLife Mid Cap Stock Index Portfolio of the Brighthouse Funds Trust II as of December 31, 2018, the results of its operations for the year then ended, the changes in its net assets for each of the two years in the period then ended, and the financial highlights for each of the five years in the period then ended, in conformity with accounting principles generally accepted in the United States of America.
Basis for Opinion
These financial statements and financial highlights are the responsibility of the Portfolio’s management. Our responsibility is to express an opinion on the Portfolio’s financial statements and financial highlights based on our audits. We are a public accounting firm registered with the Public Company Accounting Oversight Board (United States) (PCAOB) and are required to be independent with respect to the Portfolio in accordance with the U.S. federal securities laws and the applicable rules and regulations of the Securities and Exchange Commission and the PCAOB.
We conducted our audits in accordance with the standards of the PCAOB. Those standards require that we plan and perform the audit to obtain reasonable assurance about whether the financial statements and financial highlights are free of material misstatement, whether due to error or fraud. The Portfolio is not required to have, nor were we engaged to perform, an audit of its internal control over financial reporting. As part of our audits we are required to obtain an understanding of internal control over financial reporting but not for the purpose of expressing an opinion on the effectiveness of the Portfolio’s internal control over financial reporting. Accordingly, we express no such opinion.
Our audits included performing procedures to assess the risks of material misstatement of the financial statements and financial highlights, whether due to error or fraud, and performing procedures that respond to those risks. Such procedures included examining, on a test basis, evidence regarding the amounts and disclosures in the financial statements and financial highlights. Our audits also included evaluating the accounting principles used and significant estimates made by management, as well as evaluating the overall presentation of the financial statements and financial highlights. Our procedures included confirmation of securities owned as of December 31, 2018, by correspondence with the custodian and brokers; when replies were not received from brokers, we performed other auditing procedures. We believe that our audits provide a reasonable basis for our opinion.
/s/ Deloitte & Touche LLP
Boston, Massachusetts
February 25, 2019
We have served as the auditor of one or more of the Brighthouse investment companies since 1983.
BHFTII-23
Brighthouse Funds Trust II
Trustees and Officers
MANAGEMENT OF THE TRUSTS
The Boards of Trustees (the “Board”) of Brighthouse Funds Trust I and Brighthouse Funds Trust II (“BHF I” and “BHF II”, respectively, and collectively the “Trusts”) supervise the Trusts and are responsible for representing the interests of shareholders. The Trustees, the Chairman of the Board and the Chairmen of each subcommittee are the same for both Trusts. The Trustees of each Trust meet periodically throughout the year to oversee the Portfolios’ activities, reviewing, among other things, each Portfolio’s performance and its contractual arrangements with various service providers. The Trustees of each Trust elect the officers of the Trust, who are responsible for administering the Trust’sday-to-day operations.
Trustees and Officers
The Trustees and executive officers of the Trusts, as well as their principal occupations during the past five years, are set forth below. Unless otherwise indicated, the business address of each is c/o Brighthouse Funds, One Financial Center, Boston, Massachusetts 02111. Each Trustee who is deemed an “interested person,” as such term is defined in the 1940 Act, is referred to as an “Interested Trustee.” Those Trustees who are not “interested persons,” as such term is defined in the 1940 Act, are referred to as “Independent Trustees.” There is no limit to the term a Trustee may serve. Trustees serve until their death, resignation or removal in accordance with the BHF I Trust’s and BHF II Trust’s respective organizational documents and policies adopted by the Boards of the respective Trusts from time to time. Officers hold office at the pleasure of each Board and serve until their removal or resignation in accordance with the Trusts’ respective organizational documents and policies adopted by the Board of each Trust from time to time.
| | | | | | | | | | |
Name and Year of Birth | | Current
Position(s)
Held with
Registrant | | Term of Office
and Length of
Time Served | | Principal Occupation(s) During the Past
5 Years(1) | | Number of
Portfolios
in Brighthouse
Funds
Complex(2)
Overseen
by Trustee | | Other Directorships Held
by Trustee During the
Past 5 Years(1) |
| Interested Trustee |
John Rosenthal* (1960) | | Trustee | | Indefinite; From
May 2016
(Trust I and
Trust II) to present | | Chief Investment Officer, Brighthouse Financial, Inc. (2017 to present); until 2017, Senior Managing Director and Head of Global Portfolio Management, MetLife, Inc. | | 72 | | None |
|
| Independent Trustees |
Dawn M. Vroegop (1966) | | Trustee and Chairman of the Board | | Indefinite; From
December 2000
(Trust I)/May
2009 (Trust II) to
present as
Trustee; From
May 2016 (Trust
I and Trust II)
until present as
Chairman | | Private Investor. | | 72 | | Trustee, Driehaus Mutual Funds.** |
| | | | | |
Stephen M. Alderman (1959) | | Trustee | | Indefinite; From
December 2000
(Trust I)/April
2012 (Trust II) to
present | | Shareholder in the law firm of Garfield and Merel, Ltd. | | 72 | | None |
| | | | | |
Robert J. Boulware (1956) | | Trustee | | Indefinite; From
March 2008
(Trust I)/April
2012 (Trust II) to
present | | Managing Director, Pilgrim Funds, LLC (private equity fund). | | 72 | | Trustee, Vertical Capital Income Fund(closed-end fund);** Director, Gainsco, Inc. (auto insurance);** Trustee, SharesPost 100 Fund(closed-end fund).** |
| | | | | |
Susan C. Gause (1952) | | Trustee | | Indefinite; From
March 2008
(Trust I)/April
2012 (Trust II) to
present | | Private Investor. | | 72 | | Trustee, HSBC Funds.** |
BHFTII-24
Brighthouse Funds Trust II
Trustees and Officers—(Continued)
| | | | | | | | | | |
Name and Year of Birth | | Current
Position(s)
Held with
Registrant | | Term of Office
and Length of
Time Served | | Principal Occupation(s) During the Past
5 Years(1) | | Number of
Portfolios
in Brighthouse
Funds
Complex(2)
Overseen
by Trustee | | Other Directorships Held
by Trustee During the
Past 5 Years(1) |
Nancy Hawthorne (1951) | | Trustee | | Indefinite; From
May 2003
(Trust II)/April
2012 (Trust I)
to present | | Partner, Hawthorne Financial Advisors, LLC (registered investment advisor); until 2014, Chief Executive Officer, Clerestory LLC (corporate advisor). | | 72 | | Director and Chairman of the Board of Directors, THL Credit, Inc.;** Director and Chairman of the Board, Avid Technology, Inc.;** Director, CRA International, Inc.** |
| | | | | |
Barbara A. Nugent (1956) | | Trustee | | Indefinite; From
January 2014
(Trust I and
Trust II) to
present | | President, True North Board Governance, LLC (consulting); until December 2013, partner in the law firm of Stradley Ronon Stevens & Young, LLP. | | 72 | | Independent Lead Trustee, BMT Investment Funds** |
| | | | | |
Christopher J. Towle (1957) | | Trustee | | Indefinite; From
April 2018
(Trust I and
Trust II) to
present | | Retired; until 2014, Partner, Portfolio Manager, Director of High Yield and Convertible Strategies, Lord Abbett & Co. | | 72 | | Trustee, Driehaus Mutual Funds** |
Officers
| | | | | | |
Name and Year of Birth | | Position(s)
Held with
Registrant | | Length of
Time Served | | Principal Occupation(s)
During the Past 5 Years(1) |
| Executive Officers | | | | | | |
Kristi Slavin (1973) | | President and Chief Executive Officer, of Trust I and Trust II | | From May
2016
(Trust I and
Trust II) to
present | | President, Brighthouse Investment Advisers, LLC (2016-present); formerly, Senior Vice President, MetLife Advisers, LLC; Vice President, MetLife, Inc.; Vice President, Trust I and Trust II(2015-2016). |
| | | |
Alan R. Otis (1971) | | Chief Financial Officer and Treasurer, of Trust I and Trust II | | From
November
2017
(Trust I and
Trust II) to
present | | Senior Vice President, Brighthouse Investment Advisers, LLC (2017-present); formerly, Vice President, Brighthouse Investment Advisers, LLC (2012-2017); Assistant Treasurer, Trust I and Trust II (2012-2017). |
| | | |
Andrew L. Gangolf (1954) | | Secretary, of Trust I and Trust II | | From May
2011
(Trust I and
Trust II) to
present | | Executive Vice President, Brighthouse Investment Advisers, LLC (2017-present); formerly, Senior Vice President, MetLife Advisers, LLC (2011-2017); until 2011, Senior Vice President & Assistant General Counsel, AllianceBernstein Investments, Inc. |
| | | |
Steven E. Hartstein (1963) | | Chief Compliance Officer (“CCO”), of Trust I and Trust II | | From
February
2014
(Trust I and
Trust II) to
present | | Senior Vice President and CCO, Brighthouse Investment Advisers, LLC (2017-present); Head of Investments Compliance, Vice President, Brighthouse Financial, Inc. (2017-present); formerly, Vice President, MetLife, Inc. (2013-2017); Senior Vice President and CCO, MetLife Advisers, LLC (2013-2017.) |
| | | |
Victor Soto (1978) | | Vice President of Trust I and Trust II | | From May
2018
(Trust I and
Trust II) to
present | | Executive Vice President, Brighthouse Investment Advisers, LLC (2016-present); Assistant Vice President, MetLife Inc. (2015-2017); Portfolio Manager, 1st Global (2013-2015). |
| * | Mr. Rosenthal is an “interested person” of the Trusts because of his position with Brighthouse Financial, Inc., the current parent company of Brighthouse Investment Advisers, LLC. |
| ** | Indicates a directorship with a registered investment company or a company subject to the reporting requirements of the Securities Exchange Act of 1934, as amended. |
| (1) | Previous positions during the past five years with the Trusts, Brighthouse Financial, Inc., MetLife, Inc. or the Manager are omitted if not materially different. |
| (2) | The Fund Complex includes 43 BHF I Portfolios and 29 BHF II Portfolios. |
BHFTII-25
Brighthouse Funds Trust II
MetLife Mid Cap Stock Index Portfolio
Board of Trustees’ Consideration of Advisory and Sub-Advisory Agreements
At anin-person meeting held on November6-8, 2018 (the “November Meeting”), the Boards of Trustees (the “Board”) of Brighthouse Funds Trust I and Brighthouse Funds Trust II (“BFT I” and “BFT II,” respectively, and collectively, the “Trusts”), including a majority of the Trustees who are not “interested persons” of the Trusts (the “Independent Trustees”) under the Investment Company Act of 1940 (the “1940 Act”), approved the continuation of the Trusts’ advisory agreements (each, an “Advisory Agreement”) with Brighthouse Investment Advisers, LLC (the “Adviser”) and the applicablesub-advisory agreements (each a “Sub-Advisory Agreement,” and collectively with the Advisory Agreement, the “Agreements”) between the Adviser and the investmentsub-advisers (each a “Sub-Adviser,” and collectively, the “Sub-Advisers”) for the series of the Trusts (each a “Portfolio,” and collectively, the “Portfolios”).
In making those approvals, the Board reviewed a variety of materials that were provided for the specific purpose of the annual contract renewal process. In addition, various materials provided to and discussed with the Board throughout the year informed the Board’s decision to renew the Agreements. In particular, the information for each Portfolio included, but was not limited to, investment performance reports, and reports on expenses, legal and compliance matters, asset pricing, brokerage commissions and trade execution.
The Board met in person with personnel of the Adviser on October 17, 2018 for the specific purpose of giving preliminary consideration to the proposed continuation of the Agreements (the “October Meeting”). At that meeting, the Adviser reviewed with the Board the performance and fees experienced by each Portfolio, as well as other information. During and after the October Meeting, the Independent Trustees communicatedfollow-up matters for management to address at the November Meeting. The Independent Trustees were advised by independent legal counsel throughout the contract renewal process, and met with independent legal counsel in several executive sessions outside of the presence of management.
Information furnished and reviewed specifically in connection with the renewal process included, but was not limited to, a report for each Portfolio that was prepared by Broadridge (“Broadridge”), an independent organization. In addition, the Independent Trustees reviewed a report that was prepared by JDL Consultants, LLC (“JDL”), an independent consultant to the Independent Trustees (“JDL Report”), which examined the comparative fees, expenses and performance of each Portfolio, based upon the Broadridge reports. Also, the Board reviewed the responses to wide-ranging questions from the Independent Trustees relating to the business, operations and performance of the Adviser and theSub-Advisers that the Adviser andSub-Advisers had prepared specifically for the renewal process, and reviewed aPortfolio-by-Portfolio analysis of the profitability to the Adviser of each Advisory Agreement, which was prepared by the Adviser for the renewal process.
At the November Meeting, the Board, including a majority of the Independent Trustees, concluded that the nature, extent and quality of services provided by the Adviser and eachSub-Adviser supported the renewal of the Agreements. The Board also concluded that the investment performance of each Portfolio was such that each Agreement should continue, and that the fees paid by each Portfolio to the Adviser appeared to be reasonable in light of the nature, extent and quality of the services provided by the Adviser andSub-Adviser. Further, the Board concluded that the Adviser’s profitability in providing services under the Advisory Agreements did not appear unreasonable in light of the nature, extent and quality of the services provided by the Adviser. Finally, the Board reviewed the extent to which the investment advisory fees paid by the Portfolios shared economies of scale with investors or entailed the potential to share economies of scale with investors and concluded that those considerations generally supported the renewal of each Agreement. In approving the renewal of each of the Agreements, the Board, including the Independent Trustees, gave attention to all of the information that was furnished and each Trustee placed varying degrees of importance on the various pieces of information that were provided to them. The Board evaluated the information available to it on aPortfolio-by-Portfolio basis, and its decision was made separately with respect to each Portfolio. The following paragraphs provide more information about some of the primary factors that were relevant to the Board’s decision. The Board did not identify any single factor as determinative, and the Trustees generally attributed different weights to various factors for the various Portfolios.
Nature, extent and quality of services. The Board evaluated the nature, extent and quality of the services that the Adviser and theSub-Advisers, as relevant, have provided to the Portfolios. The Board considered the Adviser’s services as investment manager to the Portfolios, including its services relating to the hiring and oversight of theSub-Advisers, trading practices and oversight of transition management (as applicable), compliance programs and personnel, and risk management, among other things. The Adviser’s services in coordinating and overseeing the activities of the Trusts’ other service providers were also considered. The Board considered information received from the Trusts’ Chief Compliance Officer (“CCO”) regarding the Portfolios’ compliance policies and procedures that were established pursuant to Rule38a-l under the 1940 Act. The Board also noted that the Adviser’s investment, compliance and legal staff conduct regular and periodic telephonic andin-person meetings with theSub-Advisers to review and assess the services that are provided to the Portfolios, and that personnel of the Adviser prepare and present reports to the Independent Trustees regarding those meetings. In addition, throughout the year, the Board considered the expertise, experience and performance of the personnel of the Adviser who performed the various services that are mentioned above.
BHFTII-26
Brighthouse Funds Trust II
MetLife Mid Cap Stock Index Portfolio
Board of Trustees’ Consideration of Advisory and Sub-Advisory Agreements—(Continued)
With respect to the services provided by each of theSub-Advisers, the Board considered a variety of information that the Adviser and eachSub-Adviser prepared for the Board’s review. The Board considered eachSub-Adviser’s investment process and philosophy, and the investment performance experienced by the Portfolio (as described in more detail below). The Board took into account that eachSub-Adviser’s responsibilities include the development and maintenance of an investment program for the applicable Portfolio that is consistent with the Portfolio’s investment objectives, the selection of investment securities and the placement of orders for the purchase and sale of such securities, as well as the implementation of compliance controls related to performance of these services. In particular, the Board considered, among other things, theSub-Adviser’s current level of staffing as well as its compensation program and its overall resources. The Board reviewed eachSub-Adviser’s history and investment experience, as well as information provided regarding the qualifications, background and responsibilities of theSub-Adviser’s investment and compliance personnel who provide services to the Portfolios. The Board also considered, among other things, eachSub-Adviser’s compliance program and regulatory and disciplinary history. In its review, the Board also took into account information regarding any services and/or payments provided to the Adviser by theSub-Advisers in connection with marketing activities and considered representations from the Adviser that those payments were not considered in the Adviser’s recommendation to renew any of theSub-Advisory Agreements.
Performance. The Board placed emphasis on the performance of each Portfolio in light of, among other things, its importance to investors. The Board considered the Adviser’s quarterly reviews with the Board of detailed information about each Portfolio’s investment strategies and performance results and composition, including discussions regarding the relevant effect of current market conditions. The Board reviewed and considered the reports prepared by Broadridge, which provided a statistical analysis comparing the Portfolios’ investment performance to that of comparable funds underlying variable insurance products (the “Performance Universe”). The Independent Trustees also met separately with representatives of JDL during the October Meeting to review the JDL Report. The Board also compared the performance records of the Portfolios to those of comparable funds and other accounts that were managed by the relevantSub-Adviser, to the extent such information was available. The Board considered each Portfolio’s performance for periods subsequent to the performance period covered by the Broadridge reports, and the Adviser’s discussion of the same, including the effect of current market conditions on each Portfolio’s more recent performance. The Board also noted that while it found the data provided by Broadridge generally useful, it recognized the limitations of such data, including, in particular, that notable differences may exist between a Portfolio and those of the other funds in a Broadridge category (for example, the investment objectives(s) and investment strategies) and that the results of the performance comparisons may vary depending on (i) the end dates for the performance periods that were selected and (ii) the selection of the peer groups.
The Board focused particular attention on Portfolios with less favorable performance records. The Board noted the Adviser’s focus on eachSub-Adviser’s performance and that the Adviser has been active in monitoring and responding to any performance issues with respect to the Portfolios.
Fees and Expenses. The Board gave consideration to the level and method of computing the fees payable under the Agreements. The Board considered the Broadridge report for each of the Portfolios, which included comparisons for each Portfolio of its contractual management andsub-adviser fees (at current and various asset levels), and total expenses, with those of its peers, including as those peers were divided into a broad group of peer funds (“Expense Universe”), a narrower group of peer funds (“Expense Group”), a broad group of peersub-advised funds (“Sub-advised Expense Universe”), and a narrower group of peersub-advised funds (“Sub-advised Expense Group”). Broadridge selected the peer funds which were similarly situated funds underlying variable insurance products deemed to be comparable to the Portfolios. The Independent Trustees, with the assistance of JDL, also examined the JDL Report. The Board compared the fee payable to aSub-Adviser by the Adviser with respect to the Portfolio to the fee payable to theSub-Adviser by other comparable funds and other accounts, to the extent such information was available.
The Board noted that thesub-advisory fees for the Portfolios are paid by the Adviser out of the advisory fees, and that the Adviser negotiates the fees at arm’s length. The Board also considered that the Adviser had entered into expense limitation or management fee waiver agreements with certain of the Portfolios pursuant to which the Adviser had agreed to waive a portion of its advisory fee and/or reimburse certain expenses as a means of limiting a Portfolio’s total annual operating expenses.
Profitability. The Board examined the profitability to the Adviser of each Advisory Agreement, on aPortfolio-by-Portfolio basis. The Board also considered that an affiliate of the Adviser, Brighthouse Securities, LLC, serves as distributor for the Trusts, and, as such, receives Rule12b-1 payments to support the distribution of the Portfolios. The Board considered the profitability to theSub-Advisers and their affiliates as a result of their relationships with the Portfolios, to the extent available, and the Board considered the ability of the Adviser to negotiate with aSub-Adviser at arm’s length. In reviewing the profitability analyses, the Board recognized that expense allocation methodologies are inherently subjective and various expense allocation methodologies may be reasonable while producing different results.
BHFTII-27
Brighthouse Funds Trust II
MetLife Mid Cap Stock Index Portfolio
Board of Trustees’ Consideration of Advisory and Sub-Advisory Agreements—(Continued)
Economies of scale. The Board also considered each Portfolio’s fees in light of its size. The Board noted the fee schedules for the Portfolios that contain breakpoints that reduce the fee rate above specified asset levels. The Board noted those Portfolios that did not have breakpoints in their advisory fee and took into account management’s discussion of the same. The Board noted that those Portfolios with Advisory Agreements containing breakpoints generally have breakpoints in the correspondingSub-Advisory Agreement. The Board considered the effective fees under the Advisory Agreement andSub-Advisory Agreement for each Portfolio as a percentage of assets at different asset levels and possible economies of scale that may be realized if the assets of the Portfolio grow. The Board examined, among other data, the effect of a Portfolio’s growth in size, and reduction in size, on various fee schedules and the Board reviewed the Broadridge and JDL Reports, which compared fees among peers. The Board also generally noted that if a Portfolio’s assets increase over time, the Portfolio may realize other economies of scale if assets increase proportionally more than certain other fixed expenses.
Other factors. The Board considered other benefits that may be realized by the Adviser and its affiliates from their relationship with the Trusts. Among them, the Board recognized that Brighthouse Securities, LLC, as the distributor for the Trusts, receives payments pursuant to Rule12b-1 from the Portfolios to compensate for the provision of shareholder services and distribution activities, which could lead to growth in the Trusts’ assets and corresponding benefits from such growth, including economies of scale. The Board considered other benefits that may be realized by eachSub-Adviser and its affiliates from their relationship with the Trusts, including the opportunity to provide advisory services to additional portfolios of the Trusts and reputational benefits. In conjunction with these considerations, the Board noted the ongoing commitment of the Adviser to the Portfolios.
The Board requested, received, and considered information from the Adviser regarding possible conflicts of interest in the form of material benefits to the Adviser resulting from the Adviser’s affiliations and business relationships, as relevant. The Board considered the services that are provided to the Trusts by its service providers, and the manner in which any conflicts were mitigated.
* * *
MetLife Mid Cap Stock Index Portfolio. The Board also considered the following information in relation to the Agreements with the Adviser and MetLife Investment Advisors, LLC regarding the Portfolio:
Among other data relating specifically to the Portfolio’s performance, the Board considered that the Portfolio outperformed the median of its Performance Universe and the average of its Morningstar Category for theone-, three-, and five-year periods ended June 30, 2018. The Board further considered that the Portfolio underperformed its benchmark, the S&P 400 Index, for theone-, three-, and five-year periods ended September 30, 2018.
The Board also considered that the Portfolio’s actual management fees were equal to the Expense Group median and theSub-advised Expense Universe median, but below the Expense Universe median. The Board considered that the Portfolio’s total expenses (exclusive of12b-1 fees) were below the Expense Group median, Expense Universe median, andSub-advised Expense Universe median. The Board further noted that the Portfolio’s contractual management fees were below the asset-weighted average of comparable funds selected by Broadridge at the Portfolio’s current size. The Board also took into account that the Portfolio’s contractualsub-advisory fees were below the averages of theSub-advised Expense Group and theSub-advised Expense Universe at the Portfolio’s current size.
BHFTII-28
Brighthouse Funds Trust II
MetLife MSCI EAFE Index Portfolio
Managed by MetLife Investment Advisors, LLC
Portfolio Manager Commentary*
PERFORMANCE
For the 12 months ended December 31, 2018, the Class A, B, E, and G shares of the MetLife MSCI EAFE Index Portfolio returned-13.91%,-14.08%,-14.06%, and-14.12%, respectively. The Portfolio’s benchmark, the MSCI EAFE Index1, returned-13.79%.
MARKET ENVIRONMENT / CONDITIONS
Equity markets ended the period down with outperformance in the middle of the year bracketed by underperformance during the first and fourth quarters. The main concerns during the year were slowing global growth, political unrest in Europe, a more hawkish Federal Reserve (the “Fed”), and continued fears about a global trade war. Equity markets were impacted as the10-year Treasury yield reached its highest level since 2014, which was driven by a more hawkish Fed and higher than expected wage growth. Equity markets also feared the impact of President Trump’s plan to impose tariffs on steel and aluminum imports and Fed Chair Powell’s Congressional testimony during the first quarter where he hinted at the possibility of four rate hikes during the year. Other issues equity investors were concerned about included unrest in the Middle East, political uncertainty in Italy and the U.S. withdrawal from the Iran nuclear deal. In the middle of the year, equity markets rallied as trade negotiations eased concerns of a global trade war and leaders of North and South Korea met for the first time since 2007. Equity markets also reacted favorably after the Fed Chair Powell made dovish comments in the third quarter during the Jackson Hole symposium and progress was made with trade negotiations with the European Union and the North American Free Trade Agreement. Equity markets underperformed again towards the end of the year on concerns about a weakening global economy, the partial U.S. government shut-down, and continued uncertainty surrounding Brexit.
The U.S. dollar strengthened during the year, which negatively impacted the U.S. investors’ MSCI EAFE Index return versus the local currency return by approximately 2.8%.
Alltwenty-one countries comprising the MSCI EAFE Index experienced negative returns for the year. Japan (24.0% beginning weight in the benchmark), the largest country in the benchmark, down 12.6%, had the largest negative contribution to Portfolio return. Austria (0.3% beginning weight), down 27.1%; Belgium (1.1% beginning weight), down 26.1%; and Ireland (0.5% beginning weight), down 25.0%, were the worst-performing countries.
The stocks in the MSCI EAFE Index with the largest positive impact on the portfolio return for the year were Sky (United Kingdom—acquired on November 11, 2018), up 69.2%; AstraZeneca (United Kingdom—held throughout the entire year), up 12.3%; and GlaxoSmithKline (United Kingdom—held throughout the entire year), up 12.1%. The stocks with the largest negative impact were British American Tobacco (United Kingdom), down 50.3%; Bayer (Germany), down 42.1%; and BASF (Germany), down 35.1% (all three were held throughout the entire year).
PORTFOLIO REVIEW / PERIOD END POSITIONING
The Portfolio is managed utilizing a stratified sampling strategy versus the MSCI EAFE Index. This strategy seeks to replicate the performance of the Index by owning a subset of Index constituents and neutralizing exposures across countries. The Portfolio is periodically rebalanced for compositional changes in the MSCI EAFE Index. Factors that impact tracking error include sampling, fair value pricing, transaction costs, cash drag, securities lending, Net Asset Value rounding, contributions and withdrawals.
Stacey Lituchy
Norman Hu
Mirsad Usejnoski
Portfolio Managers
MetLife Investment Advisors, LLC
* This commentary may include statements that constitute “forward-looking statements” under the U.S. securities laws. Forward-looking statements include, among other things, projections, estimates, and information about possible or future results related to the Portfolio, market or regulatory developments. The views expressed above are not guarantees of future performance or economic results and involve certain risks, uncertainties and assumptions that could cause actual outcomes and results to differ materially from the views expressed herein. The views expressed above are subject to change at any time based upon economic, market, or other conditions and the subadvisory firm undertakes no obligation to update the views expressed herein. Any discussions of specific securities should not be considered a recommendation to buy or sell those securities. The views expressed above (including any forward-looking statement) may not be relied upon as investment advice or as an indication of the Portfolio’s trading intent. Information about the Portfolio’s holdings, asset allocation or country diversification is historical and is not an indication of future Portfolio composition, which may vary. Direct investment in any index is not possible. The performance of any index mentioned in this commentary has not been adjusted for ongoing management, distribution and operating expenses, and sales charges applicable to mutual fund investments. In addition, the returns do not reflect additional fees charged by separate accounts or variable insurance contracts that an investor in the Portfolio may pay. If these additional fees were reflected, performance would have been lower.
BHFTII-1
Brighthouse Funds Trust II
MetLife MSCI EAFE Index Portfolio
A $10,000 INVESTMENT COMPARED TO THE MSCI EAFE INDEX
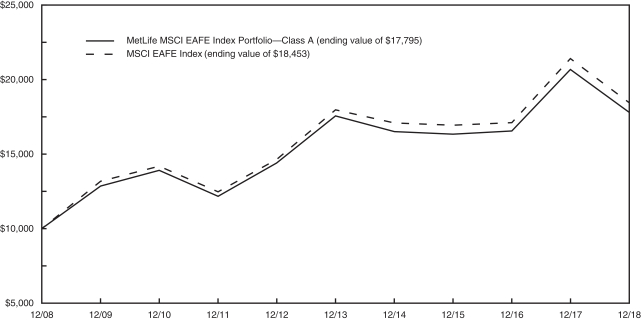
AVERAGE ANNUAL RETURNS (%) (FOR THE YEAR ENDED DECEMBER 31, 2018)
| | | | | | | | | | | | | | | | |
| | | | | |
| | | 1 Year | | | 5 Year | | | 10 Year | | | Since Inception2 | |
| MetLife MSCI EAFE Index Portfolio | | | | | | | | | | | | | | | | |
Class A | | | -13.91 | | | | 0.26 | | | | 5.93 | | | | — | |
Class B | | | -14.08 | | | | 0.01 | | | | 5.67 | | | | — | |
Class E | | | -14.06 | | | | 0.12 | | | | 5.77 | | | | — | |
Class G | | | -14.12 | | | | -0.03 | | | | — | | | | 6.78 | |
| MSCI EAFE Index | | | -13.79 | | | | 0.53 | | | | 6.32 | | | | — | |
1 The MSCI EAFE (Europe, Australasia, Far East) Index is a free float-adjusted market capitalization index that is designed to measure the equity market performance of developed markets, excluding the U.S. & Canada.
2 Inception dates of the Class A, Class B, Class E and Class G shares are 11/9/98, 1/2/01, 5/1/01 and 4/28/09, respectively.
Portfolio performance is calculated including reinvestment of all income and capital gain distributions. Performance numbers are net of all Portfolio expenses but do not include any insurance, sales, separate account or administrative charges of variable annuity or life insurance contracts or any additional expenses that participants may bear relating to the operations of their plans. If these charges were included, the returns would be lower. The performance of any index referenced above has not been adjusted for ongoing management, distribution and operating expenses, and sales charges applicable to mutual fund investments. Direct investment in any index is not possible. The performance of Class A shares, as set forth in the line graph above, will differ from that of other classes because of the difference in expenses paid by policyholders investing in the different share classes.
This information represents past performance and is not indicative of future results. Investment return and principal value may fluctuate so that shares, upon redemption, may be worth more or less than the original cost.
PORTFOLIO COMPOSITION AS OF DECEMBER 31, 2018
Top Holdings
| | | | |
| | | % of
Net Assets | |
| iShares MSCI EAFE ETF | | | 3.6 | |
| Nestle S.A. | | | 1.9 | |
| Novartis AG | | | 1.4 | |
| Roche Holding AG | | | 1.3 | |
| HSBC Holdings plc | | | 1.2 | |
| Royal Dutch Shell plc- A Shares | | | 1.0 | |
| Toyota Motor Corp. | | | 1.0 | |
| Total S.A. | | | 1.0 | |
| BP plc | | | 1.0 | |
| Royal Dutch Shell plc- B Shares | | | 0.8 | |
Top Countries
| | | | |
| | | % of
Net Assets | |
| Japan | | | 23.0 | |
| United Kingdom | | | 13.9 | |
| France | | | 10.1 | |
| Switzerland | | | 8.7 | |
| Germany | | | 7.8 | |
| Netherlands | | | 4.4 | |
| Hong Kong | | | 3.4 | |
| Spain | | | 2.9 | |
| Sweden | | | 2.3 | |
| Italy | | | 1.9 | |
BHFTII-2
Brighthouse Funds Trust II
MetLife MSCI EAFE Index Portfolio
Understanding Your Portfolio’s Expenses
Shareholder Expense Example
As a shareholder of the Portfolio, you incur ongoing costs, including management fees; distribution and service(12b-1) fees; and other Portfolio expenses. This example is intended to help you understand your ongoing costs (in dollars) (referred to as “expenses”) of investing in the Portfolio and compare these costs with the ongoing costs of investing in other mutual funds. The example is based on an investment of $1,000 invested at the beginning of the period and held for the entire period, July 1, 2018 through December 31, 2018.
Actual Expenses
The first line for each share class of the Portfolio in the table below provides information about actual account values and actual expenses. You may use the information in this line, together with the amount you invested in the particular share class of the Portfolio, to estimate the expenses that you paid over the period. Simply divide your account value by $1,000 (for example, an $8,600 account value divided by $1,000 = 8.6), then multiply the result by the number in the first line under the heading entitled “Expenses Paid During Period” to estimate the expenses you paid on your account during this period.
Hypothetical Example for Comparison Purposes
The second line for each share class of the Portfolio in the table below provides information about hypothetical account values and hypothetical expenses based on the Portfolio’s actual expense ratio and an assumed rate of return of 5% per year before expenses, which is not the Portfolio’s actual return. The hypothetical account values and expenses may not be used to estimate the actual ending account balance or expenses you paid for the period. You may use this information to compare the ongoing costs of investing in the Portfolio and other funds. To do so, compare this 5% hypothetical example with the 5% hypothetical examples that appear in the shareholder reports of the other funds.
Please note that the expenses shown in the table are meant to highlight your ongoing costs only and do not reflect any fees or charges of your variable insurance product or any additional expenses that participants in certain eligible qualified plans may bear relating to the operations of their plan. Therefore, the second line for each share class in the table is useful in comparing ongoing costs only, and will not help you determine the relative total costs of owning different funds. In addition, if these other costs were included, your costs would have been higher.
| | | | | | | | | | | | | | | | | | |
MetLife MSCI EAFE Index Portfolio | | | |
Annualized
Expense
Ratio | | | Beginning
Account Value
July 1,
2018 | | | Ending
Account Value
December 31,
2018 | | | Expenses Paid
During Period**
July 1, 2018
to
December 31,
2018 | |
Class A (a) | | Actual | | | 0.39 | % | | $ | 1,000.00 | | | $ | 885.00 | | | $ | 1.85 | |
| | Hypothetical* | | | 0.39 | % | | $ | 1,000.00 | | | $ | 1,023.24 | | | $ | 1.99 | |
| | | | | |
Class B (a) | | Actual | | | 0.64 | % | | $ | 1,000.00 | | | $ | 884.20 | | | $ | 3.04 | |
| | Hypothetical* | | | 0.64 | % | | $ | 1,000.00 | | | $ | 1,021.98 | | | $ | 3.26 | |
| | | | | |
Class E (a) | | Actual | | | 0.54 | % | | $ | 1,000.00 | | | $ | 883.80 | | | $ | 2.56 | |
| | Hypothetical* | | | 0.54 | % | | $ | 1,000.00 | | | $ | 1,022.48 | | | $ | 2.75 | |
| | | | | |
Class G (a) | | Actual | | | 0.69 | % | | $ | 1,000.00 | | | $ | 883.50 | | | $ | 3.28 | |
| | Hypothetical* | | | 0.69 | % | | $ | 1,000.00 | | | $ | 1,021.73 | | | $ | 3.52 | |
| * | Hypothetical assumes a rate of return of 5% per year before expenses. |
| ** | Expenses paid are equal to the Portfolio’s annualized expense ratio for the most recent six month period, as shown above, multiplied by the average account value over the period, multiplied by the number of days (184 days) in the most recent fiscal half-year, divided by 365 (to reflect theone-half year period). |
| (a) | The annualized expense ratio shown reflects the impact of the management fee waiver as described in Note 6 of the Notes to Financial Statements. |
BHFTII-3
Brighthouse Funds Trust II
MetLife MSCI EAFE Index Portfolio
Schedule of Investments as of December 31, 2018
Common Stocks—94.1% of Net Assets
| | | | | | | | |
| Security Description | | Shares | | | Value | |
|
| Australia—6.9% | |
AGL Energy, Ltd. | | | 45,920 | | | $ | 664,120 | |
Alumina, Ltd. | | | 191,453 | | | | 307,204 | |
Amcor, Ltd. | | | 83,280 | | | | 776,814 | |
AMP, Ltd. | | | 197,480 | | | | 340,706 | |
APA Group | | | 80,604 | | | | 482,308 | |
Aristocrat Leisure, Ltd. | | | 41,217 | | | | 629,176 | |
ASX, Ltd. | | | 14,426 | | | | 609,331 | |
Aurizon Holdings, Ltd. | | | 157,842 | | | | 475,570 | |
AusNet Services | | | 135,720 | | | | 148,656 | |
Australia & New Zealand Banking Group, Ltd. | | | 210,073 | | | | 3,618,001 | |
Bank of Queensland, Ltd. | | | 24,917 | | | | 169,508 | |
Bendigo & Adelaide Bank, Ltd. | | | 35,779 | | | | 271,998 | |
BGP Holdings plc (a) (b) (c) (d) | | | 713,624 | | | | 0 | |
BHP Group plc | | | 154,705 | | | | 3,231,741 | |
BHP Group, Ltd. | | | 215,308 | | | | 5,192,043 | |
BlueScope Steel, Ltd. | | | 45,759 | | | | 353,019 | |
Boral, Ltd. | | | 86,560 | | | | 301,012 | |
Brambles, Ltd. | | | 109,798 | | | | 784,535 | |
Caltex Australia, Ltd. | | | 18,604 | | | | 333,704 | |
Challenger, Ltd. | | | 44,035 | | | | 294,191 | |
CIMIC Group, Ltd. | | | 8,428 | | | | 257,541 | |
Coca-Cola Amatil, Ltd. | | | 42,510 | | | | 245,084 | |
Cochlear, Ltd. | | | 4,099 | | | | 497,833 | |
Coles Group, Ltd. (b) | | | 80,874 | | | | 668,420 | |
Commonwealth Bank of Australia | | | 127,215 | | | | 6,489,534 | |
Computershare, Ltd. | | | 28,910 | | | | 349,838 | |
Crown Resorts, Ltd. | | | 29,464 | | | | 245,996 | |
CSL, Ltd. | | | 32,919 | | | | 4,296,956 | |
Dexus | | | 77,269 | | | | 577,586 | |
Domino’s Pizza Enterprises, Ltd. | | | 4,557 | | | | 130,401 | |
Flight Centre Travel Group, Ltd. | | | 4,135 | | | | 124,935 | |
Fortescue Metals Group, Ltd. | | | 125,869 | | | | 368,689 | |
Goodman Group (REIT) | | | 118,280 | | | | 884,882 | |
GPT Group (The) (REIT) | | | 140,241 | | | | 527,205 | |
Incitec Pivot, Ltd. | | | 131,085 | | | | 302,671 | |
Insurance Australia Group, Ltd. | | | 180,136 | | | | 887,646 | |
Lend Lease Group (REIT) | | | 39,184 | | | | 319,479 | |
Macquarie Group, Ltd. | | | 23,361 | | | | 1,786,696 | |
Medibank Private, Ltd. | | | 199,900 | | | | 361,656 | |
Mirvac Group (REIT) | | | 272,935 | | | | 430,393 | |
National Australia Bank, Ltd. | | | 198,109 | | | | 3,360,026 | |
Newcrest Mining, Ltd. | | | 51,539 | | | | 793,628 | |
Oil Search, Ltd. | | | 104,563 | | | | 527,022 | |
Orica, Ltd. | | | 26,176 | | | | 317,857 | |
Origin Energy, Ltd. (b) | | | 119,590 | | | | 544,666 | |
QBE Insurance Group, Ltd. | | | 93,998 | | | | 668,329 | |
Ramsay Health Care, Ltd. | | | 10,616 | | | | 431,427 | |
REA Group, Ltd. | | | 4,158 | | | | 216,538 | |
Rio Tinto, Ltd. | | | 28,205 | | | | 1,559,227 | |
Santos, Ltd. | | | 145,305 | | | | 560,524 | |
Scentre Group (REIT) | | | 367,395 | | | | 1,008,629 | |
Seek, Ltd. | | | 22,233 | | | | 264,811 | |
Sonic Healthcare, Ltd. | | | 32,696 | | | | 508,901 | |
South32, Ltd. | | | 363,229 | | | | 856,540 | |
Stockland (REIT) | | | 162,137 | | | | 402,042 | |
Suncorp Group, Ltd. | | | 95,658 | | | | 850,491 | |
Sydney Airport | | | 80,467 | | | | 381,231 | |
|
| Australia—(Continued) | |
Tabcorp Holdings, Ltd. | | | 153,298 | | | | 462,951 | |
Telstra Corp., Ltd. | | | 309,539 | | | | 621,031 | |
TPG Telecom, Ltd. | | | 27,310 | | | | 123,809 | |
Transurban Group | | | 183,536 | | | | 1,506,029 | |
Treasury Wine Estates, Ltd. | | | 53,467 | | | | 557,012 | |
Vicinity Centres (REIT) | | | 252,185 | | | | 461,518 | |
Washington H Soul Pattinson & Co., Ltd. | | | 7,905 | | | | 137,817 | |
Wesfarmers, Ltd. | | | 80,874 | | | | 1,835,691 | |
Westpac Banking Corp. | | | 248,548 | | | | 4,381,552 | |
Woodside Petroleum, Ltd. | | | 65,682 | | | | 1,449,962 | |
Woolworths Group, Ltd. | | | 97,245 | | | | 2,014,014 | |
WorleyParsons, Ltd. | | | 23,498 | | | | 188,892 | |
| | | | | | | | |
| | | | | | | 65,729,245 | |
| | | | | | | | |
|
| Austria—0.2% | |
Andritz AG | | | 5,828 | | | | 267,482 | |
Erste Group Bank AG (b) | | | 20,408 | | | | 678,458 | |
OMV AG | | | 9,828 | | | | 428,875 | |
Raiffeisen Bank International AG | | | 9,390 | | | | 238,615 | |
Verbund AG | | | 4,951 | | | | 210,796 | |
Voestalpine AG | | | 9,525 | | | | 284,225 | |
| | | | | | | | |
| | | | | | | 2,108,451 | |
| | | | | | | | |
|
| Belgium—0.9% | |
Ageas | | | 12,505 | | | | 560,514 | |
Anheuser-Busch InBev S.A. | | | 55,258 | | | | 3,648,802 | |
Colruyt S.A. | | | 4,373 | | | | 310,815 | |
Groupe Bruxelles Lambert S.A. | | | 5,864 | | | | 508,127 | |
KBC Group NV | | | 17,769 | | | | 1,147,168 | |
Proximus SADP | | | 11,920 | | | | 320,986 | |
Solvay S.A. | | | 5,735 | | | | 569,877 | |
Telenet Group Holding NV | | | 4,184 | | | | 193,792 | |
UCB S.A. | | | 9,619 | | | | 782,435 | |
Umicore S.A. | | | 15,189 | | | | 602,742 | |
| | | | | | | | |
| | | | | | | 8,645,258 | |
| | | | | | | | |
|
| Chile—0.0% | |
Antofagasta plc | | | 26,957 | | | | 266,948 | |
| | | | | | | | |
|
| China—0.2% | |
BeiGene, Ltd. (ADR) (b) | | | 2,400 | | | | 336,624 | |
BOC Hong Kong Holdings, Ltd. | | | 258,465 | | | | 954,776 | |
Minth Group, Ltd. | | | 54,000 | | | | 172,365 | |
Yangzijiang Shipbuilding Holdings, Ltd. | | | 176,900 | | | | 160,824 | |
| | | | | | | | |
| | | | | | | 1,624,589 | |
| | | | | | | | |
|
| Denmark—1.7% | |
AP Moller - Maersk A/S - Class A | | | 274 | | | | 322,844 | |
AP Moller - Maersk A/S - Class B | | | 493 | | | | 621,087 | |
Carlsberg A/S - Class B | | | 7,850 | | | | 833,685 | |
Chr Hansen Holding A/S | | | 7,473 | | | | 660,676 | |
Coloplast A/S - Class B | | | 8,619 | | | | 799,247 | |
Danske Bank A/S | | | 53,890 | | | | 1,065,898 | |
DSV A/S | | | 14,050 | | | | 924,829 | |
Genmab A/S (b) | | | 4,236 | | | | 692,964 | |
See accompanying notes to financial statements.
BHFTII-4
Brighthouse Funds Trust II
MetLife MSCI EAFE Index Portfolio
Schedule of Investments as of December 31, 2018
Common Stocks—(Continued)
| | | | | | | | |
| Security Description | | Shares | | | Value | |
|
| Denmark—(Continued) | |
H Lundbeck A/S | | | 5,421 | | | $ | 237,304 | |
ISS A/S | | | 12,164 | | | | 338,941 | |
Novo Nordisk A/S - Class B | | | 132,271 | | | | 6,069,530 | |
Novozymes A/S - B Shares | | | 16,399 | | | | 731,726 | |
Orsted A/S | | | 14,039 | | | | 938,100 | |
Pandora A/S | | | 7,708 | | | | 312,982 | |
Tryg A/S | | | 8,735 | | | | 219,491 | |
Vestas Wind Systems A/S | | | 13,376 | | | | 1,013,846 | |
William Demant Holding A/S (b) | | | 7,349 | | | | 207,964 | |
| | | | | | | | |
| | | | | | | 15,991,114 | |
| | | | | | | | |
|
| Finland—1.2% | |
Elisa Oyj | | | 9,227 | | | | 381,230 | |
Fortum Oyj | | | 30,377 | | | | 664,720 | |
Kone Oyj - Class B | | | 26,344 | | | | 1,252,110 | |
Metso Oyj | | | 7,511 | | | | 197,656 | |
Neste Oyj | | | 9,073 | | | | 698,941 | |
Nokia Oyj | | | 432,039 | | | | 2,490,617 | |
Nokian Renkaat Oyj | | | 7,495 | | | | 230,438 | |
Nordea Bank Abp | | | 226,093 | | | | 1,906,260 | |
Orion Oyj - Class B | | | 8,084 | | | | 280,188 | |
Sampo Oyj - A Shares | | | 32,484 | | | | 1,424,794 | |
Stora Enso Oyj - R Shares | | | 40,497 | | | | 467,820 | |
UPM-Kymmene Oyj | | | 37,640 | | | | 954,915 | |
Wartsila Oyj Abp | | | 31,392 | | | | 497,059 | |
| | | | | | | | |
| | | | | | | 11,446,748 | |
| | | | | | | | |
|
| France—10.1% | |
Accor S.A. | | | 13,973 | | | | 591,220 | |
Aeroports de Paris | | | 2,209 | | | | 416,725 | |
Air Liquide S.A. | | | 30,993 | | | | 3,828,393 | |
Airbus SE | | | 42,287 | | | | 4,035,191 | |
Alstom S.A. | | | 9,907 | | | | 398,126 | |
Amundi S.A. | | | 4,463 | | | | 234,107 | |
Arkema S.A. | | | 5,073 | | | | 431,931 | |
Atos SE | | | 7,084 | | | | 575,074 | |
AXA S.A. | | | 140,288 | | | | 3,015,733 | |
BioMerieux | | | 3,058 | | | | 201,119 | |
BNP Paribas S.A. | | | 81,356 | | | | 3,655,813 | |
Bollore S.A. | | | 61,600 | | | | 245,536 | |
Bouygues S.A. | | | 14,921 | | | | 532,340 | |
Bureau Veritas S.A. | | | 19,643 | | | | 398,057 | |
Capgemini SE | | | 11,166 | | | | 1,099,862 | |
Carrefour S.A. | | | 42,889 | | | | 729,351 | |
Casino Guichard Perrachon S.A. (e) | | | 3,989 | | | | 165,219 | |
Cie deSt-Gobain | | | 37,286 | | | | 1,238,261 | |
Cie Generale des Etablissements Michelin | | | 12,172 | | | | 1,200,705 | |
CNP Assurances | | | 10,520 | | | | 222,019 | |
Covivio | | | 3,163 | | | | 303,823 | |
Credit Agricole S.A. | | | 81,608 | | | | 875,791 | |
Danone S.A. | | | 44,560 | | | | 3,133,437 | |
Dassault Aviation S.A. | | | 183 | | | | 252,826 | |
Dassault Systemes SE | | | 9,434 | | | | 1,111,316 | |
Edenred | | | 17,136 | | | | 626,732 | |
Eiffage S.A. | | | 5,760 | | | | 480,792 | |
Electricite de France S.A. | | | 42,972 | | | | 675,554 | |
|
| France—(Continued) | |
Engie S.A. | | | 134,009 | | | | 1,910,929 | |
EssilorLuxottica S.A. | | | 15,153 | | | | 1,909,061 | |
Eurazeo S.A. | | | 2,731 | | | | 192,366 | |
Eutelsat Communications S.A. | | | 14,990 | | | | 295,767 | |
Faurecia S.A. | | | 5,604 | | | | 209,852 | |
Gecina S.A. (REIT) | | | 3,720 | | | | 479,131 | |
Getlink SE | | | 32,808 | | | | 439,285 | |
Hermes International | | | 2,306 | | | | 1,272,431 | |
ICADE (REIT) | | | 2,561 | | | | 194,246 | |
Iliad S.A. | | | 1,762 | | | | 245,694 | |
Imerys S.A. | | | 2,253 | | | | 107,548 | |
Ingenico Group S.A. | | | 4,093 | | | | 230,971 | |
Ipsen S.A. | | | 2,947 | | | | 379,223 | |
JCDecaux S.A. | | | 4,706 | | | | 131,403 | |
Kering S.A. | | | 5,564 | | | | 2,598,124 | |
Klepierre S.A. (REIT) | | | 16,658 | | | | 511,705 | |
L’Oreal S.A. | | | 18,412 | | | | 4,216,921 | |
Legrand S.A. | | | 18,736 | | | | 1,052,136 | |
LVMH Moet Hennessy Louis Vuitton SE | | | 20,298 | | | | 5,950,947 | |
Natixis S.A. | | | 61,192 | | | | 288,070 | |
Orange S.A. | | | 146,174 | | | | 2,360,075 | |
Pernod-Ricard S.A. | | | 15,201 | | | | 2,490,301 | |
Peugeot S.A. | | | 40,345 | | | | 855,678 | |
Publicis Groupe S.A. | | | 15,420 | | | | 880,508 | |
Remy Cointreau S.A. | | | 1,860 | | | | 209,828 | |
Renault S.A. | | | 14,189 | | | | 881,294 | |
Rexel S.A. | | | 20,752 | | | | 220,769 | |
Safran S.A. | | | 24,628 | | | | 2,952,096 | |
Sanofi | | | 82,145 | | | | 7,082,783 | |
Sartorius Stedim Biotech | | | 2,011 | | | | 200,202 | |
Schneider Electric SE | | | 39,783 | | | | 2,701,368 | |
SCOR SE | | | 11,686 | | | | 525,116 | |
SEB S.A. | | | 1,809 | | | | 232,279 | |
Societe BIC S.A. | | | 2,149 | | | | 218,432 | |
Societe Generale S.A. | | | 55,187 | | | | 1,748,153 | |
Sodexo S.A. | | | 6,778 | | | | 691,639 | |
Suez | | | 28,840 | | | | 379,260 | |
Teleperformance SE | | | 4,265 | | | | 681,177 | |
Thales S.A. | | | 7,807 | | | | 906,101 | |
Total S.A. | | | 174,203 | | | | 9,181,917 | |
UBISOFT Entertainment S.A. (b) | | | 5,696 | | | | 455,924 | |
Unibail-Rodamco-Westfield | | | 9,927 | | | | 1,529,931 | |
Valeo S.A. | | | 18,217 | | | | 527,036 | |
Veolia Environnement S.A. | | | 38,959 | | | | 797,312 | |
Vinci S.A. | | | 37,291 | | | | 3,057,540 | |
Vivendi S.A. | | | 76,316 | | | | 1,850,066 | |
Wendel S.A. | | | 2,267 | | | | 271,303 | |
| | | | | | | | |
| | | | | | | 97,178,951 | |
| | | | | | | | |
|
| Germany—7.8% | |
1&1 Drillisch AG | | | 3,915 | | | | 198,701 | |
adidas AG | | | 13,435 | | | | 2,801,154 | |
Allianz SE | | | 31,257 | | | | 6,257,997 | |
Aroundtown S.A. | | | 56,219 | | | | 465,522 | |
Axel Springer SE | | | 3,006 | | | | 169,578 | |
BASF SE | | | 66,273 | | | | 4,575,723 | |
See accompanying notes to financial statements.
BHFTII-5
Brighthouse Funds Trust II
MetLife MSCI EAFE Index Portfolio
Schedule of Investments as of December 31, 2018
Common Stocks—(Continued)
| | | | | | | | |
| Security Description | | Shares | | | Value | |
|
| Germany—(Continued) | |
Bayer AG | | | 67,889 | | | $ | 4,696,819 | |
Bayerische Motoren Werke AG | | | 23,596 | | | | 1,906,635 | |
Beiersdorf AG | | | 7,090 | | | | 738,252 | |
Brenntag AG | | | 11,405 | | | | 491,113 | |
Commerzbank AG (b) | | | 77,199 | | | | 510,183 | |
Continental AG | | | 8,198 | | | | 1,131,033 | |
Covestro AG | | | 13,863 | | | | 684,278 | |
Daimler AG | | | 66,196 | | | | 3,472,466 | |
Delivery Hero AG (b) | | | 6,695 | | | | 248,076 | |
Deutsche Bank AG | | | 146,810 | | | | 1,168,909 | |
Deutsche Boerse AG | | | 14,033 | | | | 1,683,741 | |
Deutsche Lufthansa AG | | | 17,782 | | | | 400,114 | |
Deutsche Post AG | | | 71,872 | | | | 1,964,028 | |
Deutsche Telekom AG | | | 241,713 | | | | 4,096,577 | |
Deutsche Wohnen SE | | | 24,681 | | | | 1,128,726 | |
E.ON SE | | | 159,780 | | | | 1,576,083 | |
Evonik Industries AG | | | 13,109 | | | | 326,671 | |
Fraport AG Frankfurt Airport Services Worldwide | | | 3,260 | | | | 232,490 | |
Fresenius Medical Care AG & Co. KGaA | | | 15,649 | | | | 1,014,191 | |
Fresenius SE & Co. KGaA | | | 30,614 | | | | 1,476,451 | |
GEA Group AG | | | 14,300 | | | | 367,920 | |
Hannover Rueck SE | | | 4,145 | | | | 557,476 | |
HeidelbergCement AG | | | 10,444 | | | | 637,285 | |
Henkel AG & Co. KGaA | | | 7,933 | | | | 778,393 | |
HOCHTIEF AG | | | 1,646 | | | | 221,346 | |
Hugo Boss AG | | | 4,934 | | | | 303,610 | |
Infineon Technologies AG | | | 84,354 | | | | 1,674,727 | |
Innogy SE | | | 11,200 | | | | 521,476 | |
KION Group AG | | | 5,441 | | | | 275,528 | |
LANXESS AG | | | 5,571 | | | | 256,016 | |
Merck KGaA | | | 9,421 | | | | 969,841 | |
METRO AG | | | 15,747 | | | | 241,570 | |
MTU Aero Engines AG | | | 3,839 | | | | 695,701 | |
Muenchener Rueckversicherungs-Gesellschaft AG | | | 10,610 | | | | 2,310,180 | |
OSRAM Licht AG | | | 7,381 | | | | 319,729 | |
ProSiebenSat.1 Media SE | | | 14,779 | | | | 262,260 | |
Puma SE | | | 604 | | | | 295,176 | |
RWE AG | | | 39,146 | | | | 849,086 | |
SAP SE | | | 71,302 | | | | 7,086,253 | |
Siemens AG | | | 55,353 | | | | 6,159,470 | |
Siemens Healthineers AG (b) | | | 10,900 | | | | 455,342 | |
Symrise AG | | | 8,745 | | | | 644,780 | |
Telefonica Deutschland Holding AG | | | 58,800 | | | | 229,549 | |
ThyssenKrupp AG | | | 31,577 | | | | 540,742 | |
TUI AG | | | 30,068 | | | | 431,182 | |
Uniper SE | | | 14,858 | | | | 383,805 | |
United Internet AG | | | 8,781 | | | | 383,255 | |
Volkswagen AG | | | 2,495 | | | | 396,629 | |
Vonovia SE | | | 35,809 | | | | 1,621,536 | |
Wirecard AG | | | 8,665 | | | | 1,316,098 | |
Zalando SE (b) | | | 8,719 | | | | 223,560 | |
| | | | | | | | |
| | | | | | | 74,825,032 | |
| | | | | | | | |
|
| Hong Kong—3.4% | |
AIA Group, Ltd. | | | 879,000 | | | | 7,231,943 | |
ASM Pacific Technology, Ltd. | | | 19,600 | | | | 187,844 | |
|
| Hong Kong—(Continued) | |
Bank of East Asia, Ltd. (The) | | | 103,920 | | | | 328,964 | |
CK Asset Holdings, Ltd. | | | 188,440 | | | | 1,370,492 | |
CK Hutchison Holdings, Ltd. | | | 201,440 | | | | 1,925,302 | |
CK Infrastructure Holdings, Ltd. | | | 49,500 | | | | 373,697 | |
CLP Holdings, Ltd. | | | 116,377 | | | | 1,312,084 | |
Dairy Farm International Holdings, Ltd. | | | 24,600 | | | | 222,173 | |
Galaxy Entertainment Group, Ltd. | | | 173,000 | | | | 1,086,031 | |
Hang Lung Group, Ltd. | | | 74,000 | | | | 188,032 | |
Hang Lung Properties, Ltd. | | | 162,000 | | | | 308,829 | |
Hang Seng Bank, Ltd. | | | 54,400 | | | | 1,215,229 | |
Henderson Land Development Co., Ltd. | | | 91,192 | | | | 452,140 | |
HK Electric Investments & HK Electric Investments, Ltd. | | | 197,500 | | | | 199,046 | |
HKT Trust & HKT, Ltd. | | | 277,980 | | | | 400,293 | |
Hong Kong & China Gas Co., Ltd. | | | 693,469 | | | | 1,431,409 | |
Hong Kong Exchanges and Clearing, Ltd. | | | 84,300 | | | | 2,419,506 | |
Hongkong Land Holdings, Ltd. | | | 86,500 | | | | 545,289 | |
Hysan Development Co., Ltd. | | | 45,000 | | | | 213,401 | |
Jardine Matheson Holdings, Ltd. | | | 16,900 | | | | 1,176,712 | |
Jardine Strategic Holdings, Ltd. | | | 14,600 | | | | 533,406 | |
Kerry Properties, Ltd. | | | 57,500 | | | | 195,384 | |
Link REIT (REIT) | | | 162,641 | | | | 1,638,134 | |
Melco Resorts & Entertainment, Ltd. (ADR) | | | 19,800 | | | | 348,876 | |
MTR Corp., Ltd. | | | 110,500 | | | | 581,641 | |
New World Development Co., Ltd. | | | 463,707 | | | | 609,239 | |
NWS Holdings, Ltd. | | | 99,000 | | | | 203,200 | |
PCCW, Ltd. | | | 316,000 | | | | 181,821 | |
Power Assets Holdings, Ltd. | | | 107,549 | | | | 746,777 | |
Sino Land Co., Ltd. | | | 247,600 | | | | 421,437 | |
Sun Hung Kai Properties, Ltd. | | | 116,250 | | | | 1,648,550 | |
Swire Pacific, Ltd. - Class A | | | 36,817 | | | | 386,831 | |
Swire Properties, Ltd. | | | 83,600 | | | | 292,175 | |
Techtronic Industries Co., Ltd. | | | 95,000 | | | | 500,813 | |
WH Group, Ltd. | | | 654,000 | | | | 498,765 | |
Wharf Holdings, Ltd. (The) | | | 87,976 | | | | 228,266 | |
Wharf Real Estate Investment Co., Ltd. | | | 87,976 | | | | 523,030 | |
Wheelock & Co., Ltd. | | | 68,000 | | | | 386,254 | |
Yue Yuen Industrial Holdings, Ltd. | | | 50,500 | | | | 161,174 | |
| | | | | | | | |
| | | | | | | 32,674,189 | |
| | | | | | | | |
|
| Ireland—0.6% | |
AerCap Holdings NV (b) | | | 10,200 | | | | 403,920 | |
AIB Group plc | | | 60,112 | | | | 252,117 | |
Bank of Ireland Group plc | | | 80,170 | | | | 443,934 | |
CRH plc | | | 63,163 | | | | 1,661,228 | |
James Hardie Industries plc | | | 31,140 | | | | 331,450 | |
Kerry Group plc - Class A | | | 11,539 | | | | 1,137,304 | |
Kingspan Group plc | | | 11,136 | | | | 475,878 | |
Paddy Power Betfair plc | | | 6,200 | | | | 506,789 | |
Smurfit Kappa Group plc | | | 16,402 | | | | 434,589 | |
| | | | | | | | |
| | | | | | | 5,647,209 | |
| | | | | | | | |
|
| Israel—0.5% | |
Azrieli Group, Ltd. | | | 3,090 | | | | 147,631 | |
Bank Hapoalim B.M. | | | 79,475 | | | | 504,336 | |
Bank LeumiLe-Israel B.M. | | | 109,068 | | | | 660,782 | |
Bezeq The Israeli Telecommunication Corp., Ltd. | | | 160,513 | | | | 157,088 | |
See accompanying notes to financial statements.
BHFTII-6
Brighthouse Funds Trust II
MetLife MSCI EAFE Index Portfolio
Schedule of Investments as of December 31, 2018
Common Stocks—(Continued)
| | | | | | | | |
| Security Description | | Shares | | | Value | |
|
| Israel—(Continued) | |
Check Point Software Technologies, Ltd. (b) | | | 9,300 | | | $ | 954,645 | |
Elbit Systems, Ltd. | | | 895 | | | | 102,916 | |
Israel Chemicals, Ltd. | | | 54,463 | | | | 309,883 | |
Mizrahi Tefahot Bank, Ltd. | | | 11,922 | | | | 201,912 | |
Nice, Ltd. (b) | | | 4,746 | | | | 514,296 | |
Teva Pharmaceutical Industries, Ltd. (ADR) (b) | | | 70,353 | | | | 1,084,843 | |
Wix.com, Ltd. (b) | | | 3,200 | | | | 289,088 | |
| | | | | | | | |
| | | | | | | 4,927,420 | |
| | | | | | | | |
|
| Italy—1.9% | |
Assicurazioni Generali S.p.A. | | | 85,274 | | | | 1,423,690 | |
Atlantia S.p.A. | | | 36,067 | | | | 745,181 | |
Davide Campari-Milano S.p.A. | | | 42,874 | | | | 362,053 | |
Enel S.p.A. | | | 602,326 | | | | 3,466,976 | |
Eni S.p.A. | | | 184,398 | | | | 2,897,336 | |
Ferrari NV | | | 8,377 | | | | 831,433 | |
Intesa Sanpaolo S.p.A. | | | 1,083,294 | | | | 2,395,430 | |
Leonardo S.p.A. | | | 28,782 | | | | 252,769 | |
Luxottica Group S.p.A. | | | 13,581 | | | | 801,725 | |
Mediobanca S.p.A. | | | 44,816 | | | | 378,095 | |
Moncler S.p.A. | | | 13,024 | | | | 434,220 | |
Pirelli & C S.p.A. (b) | | | 29,117 | | | | 186,822 | |
Poste Italiane S.p.A. | | | 41,357 | | | | 331,168 | |
Prysmian S.p.A. | | | 16,202 | | | | 313,442 | |
Recordati S.p.A. | | | 8,194 | | | | 283,773 | |
Snam S.p.A. | | | 162,854 | | | | 711,229 | |
Telecom Italia S.p.A. (b) | | | 826,906 | | | | 457,051 | |
Telecom Italia S.p.A. - Risparmio Shares | | | 437,140 | | | | 208,472 | |
Terna Rete Elettrica Nazionale S.p.A. | | | 92,957 | | | | 526,484 | |
UniCredit S.p.A. | | | 142,434 | | | | 1,612,094 | |
| | | | | | | | |
| | | | | | | 18,619,443 | |
| | | | | | | | |
|
| Japan—23.0% | |
Aeon Co., Ltd. | | | 44,500 | | | | 874,895 | |
AEON Financial Service Co., Ltd. | | | 8,400 | | | | 150,744 | |
Aeon Mall Co., Ltd. | | | 7,600 | | | | 121,466 | |
Air Water, Inc. | | | 10,000 | | | | 150,091 | |
Aisin Seiki Co., Ltd. | | | 10,600 | | | | 365,394 | |
Ajinomoto Co., Inc. | | | 31,900 | | | | 565,356 | |
Alfresa Holdings Corp. | | | 15,300 | | | | 395,434 | |
Alps Electric Co., Ltd. | | | 13,100 | | | | 252,755 | |
Amada Holdings Co., Ltd. | | | 27,000 | | | | 240,572 | |
ANA Holdings, Inc. | | | 8,400 | | | | 302,497 | |
Aozora Bank, Ltd. | | | 9,600 | | | | 284,390 | |
Asahi Glass Co., Ltd. | | | 12,600 | | | | 390,576 | |
Asahi Group Holdings, Ltd. | | | 27,300 | | | | 1,065,254 | |
Asahi Intecc Co., Ltd. | | | 7,100 | | | | 301,907 | |
Asahi Kasei Corp. | | | 97,000 | | | | 988,710 | |
Asics Corp. | | | 11,000 | | | | 139,285 | |
Astellas Pharma, Inc. | | | 141,100 | | | | 1,793,856 | |
Bandai Namco Holdings, Inc. | | | 16,000 | | | | 713,155 | |
Bank of Kyoto, Ltd. (The) | | | 4,400 | | | | 180,271 | |
Benesse Holdings, Inc. | | | 5,400 | | | | 137,172 | |
Bridgestone Corp. | | | 44,400 | | | | 1,702,290 | |
Brother Industries, Ltd. | | | 16,400 | | | | 240,483 | |
Calbee, Inc. | | | 5,500 | | | | 171,708 | |
|
| Japan—(Continued) | |
Canon, Inc. (e) | | | 72,900 | | | | 2,006,703 | |
Casio Computer Co., Ltd. | | | 16,900 | | | | 202,247 | |
Central Japan Railway Co. | | | 10,100 | | | | 2,143,977 | |
Chiba Bank, Ltd. (The) | | | 49,000 | | | | 271,436 | |
Chubu Electric Power Co., Inc. | | | 45,700 | | | | 649,204 | |
Chugai Pharmaceutical Co., Ltd. | | | 16,800 | | | | 969,518 | |
Chugoku Electric Power Co., Inc. (The) | | | 23,700 | | | | 306,980 | |
Coca-Cola Bottlers Japan Holdings, Inc. | | | 9,900 | | | | 295,244 | |
Concordia Financial Group, Ltd. | | | 83,000 | | | | 316,160 | |
Credit Saison Co., Ltd. | | | 10,500 | | | | 122,321 | |
CyberAgent, Inc. | | | 7,400 | | | | 288,667 | |
Dai Nippon Printing Co., Ltd. | | | 20,000 | | | | 415,725 | |
Dai-ichi Life Holdings, Inc. | | | 75,800 | | | | 1,173,366 | |
Daicel Corp. | | | 22,000 | | | | 225,853 | |
Daifuku Co., Ltd. | | | 7,400 | | | | 333,241 | |
Daiichi Sankyo Co., Ltd. | | | 42,100 | | | | 1,352,037 | |
Daikin Industries, Ltd. | | | 18,200 | | | | 1,913,286 | |
Daito Trust Construction Co., Ltd. | | | 5,200 | | | | 709,527 | |
Daiwa House Industry Co., Ltd. | | | 42,500 | | | | 1,348,428 | |
Daiwa House REIT Investment Corp. (REIT) | | | 110 | | | | 245,987 | |
Daiwa Securities Group, Inc. | | | 118,000 | | | | 601,067 | |
DeNA Co., Ltd. | | | 8,400 | | | | 139,643 | |
Denso Corp. | | | 31,000 | | | | 1,374,403 | |
Dentsu, Inc. | | | 16,600 | | | | 737,209 | |
Disco Corp. | | | 2,300 | | | | 265,189 | |
Don Quijote Holdings Co., Ltd. | | | 8,200 | | | | 508,186 | |
East Japan Railway Co. | | | 22,300 | | | | 1,980,117 | |
Eisai Co., Ltd. | | | 18,200 | | | | 1,415,709 | |
Electric Power Development Co., Ltd. | | | 10,900 | | | | 257,916 | |
FamilyMart UNY Holdings Co., Ltd. | | | 4,400 | | | | 555,321 | |
FANUC Corp. | | | 14,000 | | | | 2,102,617 | |
Fast Retailing Co., Ltd. | | | 4,300 | | | | 2,197,404 | |
Fuji Electric Co., Ltd. | | | 8,600 | | | | 250,520 | |
FUJIFILM Holdings Corp. | | | 29,400 | | | | 1,133,371 | |
Fujitsu, Ltd. | | | 14,600 | | | | 914,368 | |
Fukuoka Financial Group, Inc. | | | 10,600 | | | | 213,538 | |
Hakuhodo DY Holdings, Inc. | | | 17,600 | | | | 249,492 | |
Hamamatsu Photonics KK | | | 9,600 | | | | 324,491 | |
Hankyu Hanshin Holdings, Inc. | | | 16,400 | | | | 548,687 | |
Hikari Tsushin, Inc. | | | 1,800 | | | | 282,872 | |
Hino Motors, Ltd. | | | 19,000 | | | | 178,243 | |
Hirose Electric Co., Ltd. | | | 2,415 | | | | 238,770 | |
Hisamitsu Pharmaceutical Co., Inc. | | | 4,500 | | | | 245,325 | |
Hitachi Construction Machinery Co., Ltd. | | | 8,900 | | | | 205,938 | |
Hitachi High-Technologies Corp. | | | 5,500 | | | | 171,387 | |
Hitachi Metals, Ltd. | | | 20,000 | | | | 207,484 | |
Hitachi, Ltd. | | | 70,200 | | | | 1,864,172 | |
Honda Motor Co., Ltd. | | | 118,800 | | | | 3,101,268 | |
Hoshizaki Corp. | | | 4,100 | | | | 250,903 | |
Hoya Corp. | | | 26,800 | | | | 1,636,435 | |
Hulic Co., Ltd. | | | 17,100 | | | | 152,866 | |
Idemitsu Kosan Co., Ltd. | | | 10,500 | | | | 345,725 | |
IHI Corp. | | | 12,200 | | | | 334,541 | |
Iida Group Holdings Co., Ltd. | | | 12,700 | | | | 221,673 | |
Inpex Corp. | | | 71,100 | | | | 633,873 | |
Isetan Mitsukoshi Holdings, Ltd. | | | 26,900 | | | | 296,673 | |
Isuzu Motors, Ltd. | | | 43,700 | | | | 609,539 | |
See accompanying notes to financial statements.
BHFTII-7
Brighthouse Funds Trust II
MetLife MSCI EAFE Index Portfolio
Schedule of Investments as of December 31, 2018
Common Stocks—(Continued)
| | | | | | | | |
| Security Description | | Shares | | | Value | |
|
| Japan—(Continued) | |
ITOCHU Corp. | | | 105,400 | | | $ | 1,775,888 | |
J Front Retailing Co., Ltd. | | | 17,900 | | | | 206,692 | |
Japan Airlines Co., Ltd. | | | 8,400 | | | | 297,222 | |
Japan Exchange Group, Inc. | | | 38,100 | | | | 611,264 | |
Japan Post Bank Co., Ltd. | | | 30,800 | | | | 337,824 | |
Japan Post Holdings Co., Ltd. | | | 119,400 | | | | 1,371,418 | |
Japan Prime Realty Investment Corp. (REIT) | | | 51 | | | | 193,474 | |
Japan Real Estate Investment Corp. (REIT) | | | 96 | | | | 538,567 | |
Japan Retail Fund Investment Corp. (REIT) | | | 202 | | | | 404,059 | |
Japan Tobacco, Inc. | | | 79,300 | | | | 1,879,499 | |
JFE Holdings, Inc. | | | 35,100 | | | | 557,910 | |
JGC Corp. | | | 14,000 | | | | 195,235 | |
JSR Corp. | | | 11,000 | | | | 164,210 | |
JTEKT Corp. | | | 20,000 | | | | 221,106 | |
JXTG Holdings, Inc. | | | 237,600 | | | | 1,244,099 | |
Kajima Corp. | | | 32,000 | | | | 428,524 | |
Kakaku.com, Inc. | | | 10,700 | | | | 187,990 | |
Kamigumi Co., Ltd. | | | 8,500 | | | | 173,267 | |
Kaneka Corp. | | | 4,400 | | | | 157,080 | |
Kansai Electric Power Co., Inc. (The) | | | 55,000 | | | | 825,044 | |
Kansai Paint Co., Ltd. | | | 10,300 | | | | 197,481 | |
Kao Corp. | | | 35,200 | | | | 2,592,550 | |
Kawasaki Heavy Industries, Ltd. | | | 12,400 | | | | 263,424 | |
KDDI Corp. | | | 127,000 | | | | 3,023,385 | |
Keihan Holdings Co., Ltd. | | | 7,800 | | | | 316,968 | |
Keikyu Corp. | | | 18,000 | | | | 296,248 | |
Keio Corp. | | | 6,600 | | | | 385,889 | |
Keisei Electric Railway Co., Ltd. | | | 10,000 | | | | 310,996 | |
Keyence Corp. | | | 7,100 | | | | 3,574,675 | |
Kikkoman Corp. | | | 9,600 | | | | 514,671 | |
Kintetsu Group Holdings Co., Ltd. | | | 10,812 | | | | 467,412 | |
Kirin Holdings Co., Ltd. | | | 60,300 | | | | 1,267,131 | |
Kobayashi Pharmaceutical Co., Ltd. | | | 3,600 | | | | 246,303 | |
Kobe Steel, Ltd. | | | 27,200 | | | | 188,195 | |
Koito Manufacturing Co., Ltd. | | | 7,700 | | | | 392,403 | |
Komatsu, Ltd. | | | 65,500 | | | | 1,393,862 | |
Konami Holdings Corp. | | | 7,300 | | | | 321,124 | |
Konica Minolta, Inc. | | | 37,000 | | | | 331,757 | |
Kose Corp. | | | 2,300 | | | | 364,401 | |
Kubota Corp. | | | 70,700 | | | | 994,516 | |
Kuraray Co., Ltd. | | | 24,500 | | | | 343,374 | |
Kurita Water Industries, Ltd. | | | 7,100 | | | | 170,394 | |
Kyocera Corp. | | | 22,700 | | | | 1,127,719 | |
Kyowa Hakko Kirin Co., Ltd. | | | 20,000 | | | | 375,444 | |
Kyushu Electric Power Co., Inc. | | | 25,900 | | | | 307,661 | |
Kyushu Railway Co. | | | 12,700 | | | | 427,424 | |
Lawson, Inc. | | | 3,800 | | | | 241,043 | |
LINE Corp. (b) (e) | | | 5,300 | | | | 180,995 | |
Lion Corp. | | | 19,000 | | | | 391,515 | |
LIXIL Group Corp. | | | 19,000 | | | | 236,976 | |
M3, Inc. | | | 31,400 | | | | 425,066 | |
Makita Corp. | | | 15,200 | | | | 537,716 | |
Marubeni Corp. | | | 105,000 | | | | 729,945 | |
Marui Group Co., Ltd. | | | 16,000 | | | | 309,096 | |
Mazda Motor Corp. | | | 43,000 | | | | 441,878 | |
McDonald’s Holdings Co. Japan, Ltd. (e) | | | 5,400 | | | | 229,836 | |
Mebuki Financial Group, Inc. | | | 63,100 | | | | 166,403 | |
|
| Japan—(Continued) | |
Medipal Holdings Corp. | | | 10,700 | | | | 231,227 | |
MEIJI Holdings Co., Ltd. | | | 9,600 | | | | 781,477 | |
Minebea Mitsumi, Inc. | | | 30,800 | | | | 441,845 | |
MISUMI Group, Inc. | | | 22,200 | | | | 462,846 | |
Mitsubishi Chemical Holdings Corp. | | | 93,700 | | | | 704,214 | |
Mitsubishi Corp. | | | 98,500 | | | | 2,685,657 | |
Mitsubishi Electric Corp. | | | 131,200 | | | | 1,436,891 | |
Mitsubishi Estate Co., Ltd. | | | 82,300 | | | | 1,288,426 | |
Mitsubishi Gas Chemical Co., Inc. | | | 13,000 | | | | 194,019 | |
Mitsubishi Heavy Industries, Ltd. | | | 20,800 | | | | 746,384 | |
Mitsubishi Materials Corp. | | | 7,900 | | | | 206,907 | |
Mitsubishi Motors Corp. | | | 44,999 | | | | 248,191 | |
Mitsubishi Tanabe Pharma Corp. | | | 15,300 | | | | 219,596 | |
Mitsubishi UFJ Financial Group, Inc. | | | 860,888 | | | | 4,240,903 | |
Mitsubishi UFJ Lease & Finance Co., Ltd. | | | 16,700 | | | | 79,940 | |
Mitsui & Co., Ltd. | | | 118,417 | | | | 1,833,407 | |
Mitsui Chemicals, Inc. | | | 15,000 | | | | 336,209 | |
Mitsui Fudosan Co., Ltd. | | | 65,000 | | | | 1,438,786 | |
Mitsui OSK Lines, Ltd. | | | 7,500 | | | | 162,792 | |
Mizuho Financial Group, Inc. | | | 1,752,400 | | | | 2,728,500 | |
MonotaRO Co., Ltd. | | | 9,200 | | | | 224,129 | |
MS&AD Insurance Group Holdings, Inc. | | | 35,900 | | | | 1,018,011 | |
Murata Manufacturing Co., Ltd. | | | 12,900 | | | | 1,775,677 | |
Nabtesco Corp. | | | 7,500 | | | | 161,208 | |
Nagoya Railroad Co., Ltd. | | | 14,800 | | | | 392,135 | |
NEC Corp. | | | 20,600 | | | | 616,099 | |
Nexon Co., Ltd. (b) | | | 32,300 | | | | 412,206 | |
NGK Insulators, Ltd. | | | 19,300 | | | | 259,913 | |
NGK Spark Plug Co., Ltd. | | | 12,000 | | | | 236,481 | |
NH Foods, Ltd. | | | 7,000 | | | | 262,878 | |
Nidec Corp. | | | 16,300 | | | | 1,866,184 | |
Nikon Corp. | | | 22,500 | | | | 333,083 | |
Nintendo Co., Ltd. | | | 8,100 | | | | 2,137,962 | |
Nippon Building Fund, Inc. (REIT) | | | 88 | | | | 553,648 | |
Nippon Electric Glass Co., Ltd. | | | 6,200 | | | | 150,601 | |
Nippon Express Co., Ltd. | | | 5,900 | | | | 327,442 | |
Nippon Paint Holdings Co., Ltd. (e) | | | 9,500 | | | | 321,800 | |
Nippon Prologis REIT, Inc. | | | 143 | | | | 301,571 | |
Nippon Steel & Sumitomo Metal Corp. | | | 56,300 | | | | 961,755 | |
Nippon Telegraph & Telephone Corp. | | | 50,400 | | | | 2,050,031 | |
Nippon Yusen KK | | | 12,600 | | | | 195,037 | |
Nissan Chemical Corp. | | | 10,000 | | | | 520,037 | |
Nissan Motor Co., Ltd. | | | 166,900 | | | | 1,343,836 | |
Nisshin Seifun Group, Inc. | | | 15,700 | | | | 323,791 | |
Nissin Foods Holdings Co., Ltd. | | | 4,700 | | | | 294,639 | |
Nitori Holdings Co., Ltd. | | | 5,800 | | | | 719,731 | |
Nitto Denko Corp. | | | 12,600 | | | | 628,464 | |
Nomura Holdings, Inc. | | | 241,200 | | | | 918,722 | |
Nomura Real Estate Holdings, Inc. | | | 9,500 | | | | 173,156 | |
Nomura Real Estate Master Fund, Inc. (REIT) | | | 322 | | | | 423,329 | |
Nomura Research Institute, Ltd. | | | 6,900 | | | | 253,388 | |
NSK, Ltd. | | | 26,600 | | | | 227,805 | |
NTT Data Corp. | | | 40,780 | | | | 445,094 | |
NTT DoCoMo, Inc. | | | 94,600 | | | | 2,122,112 | |
Obayashi Corp. | | | 45,500 | | | | 408,147 | |
Obic Co., Ltd. | | | 5,000 | | | | 382,271 | |
Odakyu Electric Railway Co., Ltd. | | | 20,100 | | | | 440,063 | |
See accompanying notes to financial statements.
BHFTII-8
Brighthouse Funds Trust II
MetLife MSCI EAFE Index Portfolio
Schedule of Investments as of December 31, 2018
Common Stocks—(Continued)
| | | | | | | | |
| Security Description | | Shares | | | Value | |
|
| Japan—(Continued) | |
OJI Holdings Corp. | | | 68,000 | | | $ | 347,696 | |
Olympus Corp. | | | 22,800 | | | | 696,483 | |
Omron Corp. | | | 13,400 | | | | 482,493 | |
Ono Pharmaceutical Co., Ltd. | | | 26,100 | | | | 527,685 | |
Oracle Corp. Japan | | | 3,000 | | | | 189,622 | |
Oriental Land Co., Ltd. | | | 14,000 | | | | 1,420,007 | |
ORIX Corp. | | | 92,600 | | | | 1,344,094 | |
Osaka Gas Co., Ltd. | | | 29,000 | | | | 529,372 | |
Otsuka Corp. | | | 7,400 | | | | 202,391 | |
Otsuka Holdings Co., Ltd. | | | 28,200 | | | | 1,149,637 | |
Panasonic Corp. | | | 161,300 | | | | 1,445,843 | |
Park24 Co., Ltd. | | | 7,400 | | | | 163,408 | |
Persol Holdings Co., Ltd. | | | 13,400 | | | | 196,596 | |
Pigeon Corp. | | | 8,500 | | | | 366,659 | |
Pola Orbis Holdings, Inc. | | | 7,600 | | | | 203,395 | |
Rakuten, Inc. | | | 61,500 | | | | 408,519 | |
Recruit Holdings Co., Ltd. | | | 80,900 | | | | 1,934,866 | |
Renesas Electronics Corp. (b) | | | 61,100 | | | | 279,964 | |
Resona Holdings, Inc. | | | 143,300 | | | | 684,792 | |
Ricoh Co., Ltd. | | | 48,600 | | | | 474,843 | |
Rinnai Corp. | | | 2,800 | | | | 183,178 | |
Rohm Co., Ltd. | | | 6,700 | | | | 422,866 | |
Ryohin Keikaku Co., Ltd. | | | 1,800 | | | | 437,626 | |
Sankyo Co., Ltd. | | | 3,300 | | | | 124,836 | |
Santen Pharmaceutical Co., Ltd. | | | 27,500 | | | | 393,157 | |
SBI Holdings, Inc. | | | 16,511 | | | | 321,965 | |
Secom Co., Ltd. | | | 15,500 | | | | 1,278,449 | |
Sega Sammy Holdings, Inc. | | | 12,900 | | | | 181,728 | |
Seibu Holdings, Inc. | | | 13,800 | | | | 239,137 | |
Seiko Epson Corp. | | | 20,000 | | | | 280,347 | |
Sekisui Chemical Co., Ltd. | | | 29,500 | | | | 436,053 | |
Sekisui House, Ltd. | | | 45,500 | | | | 666,444 | |
Seven & i Holdings Co., Ltd. | | | 55,000 | | | | 2,392,430 | |
Seven Bank, Ltd. | | | 44,200 | | | | 125,937 | |
SG Holdings Co., Ltd. | | | 7,200 | | | | 188,642 | |
Sharp Corp. | | | 12,000 | | | | 121,819 | |
Shimadzu Corp. | | | 14,600 | | | | 285,406 | |
Shimano, Inc. | | | 5,400 | | | | 766,916 | |
Shimizu Corp. | | | 39,000 | | | | 320,192 | |
Shin-Etsu Chemical Co., Ltd. | | | 26,400 | | | | 2,031,838 | |
Shinsei Bank, Ltd. | | | 12,900 | | | | 152,530 | |
Shionogi & Co., Ltd. | | | 19,700 | | | | 1,115,942 | |
Shiseido Co., Ltd. | | | 27,700 | | | | 1,719,414 | |
Shizuoka Bank, Ltd. (The) | | | 25,800 | | | | 200,613 | |
Showa Denko KK | | | 9,900 | | | | 290,095 | |
Showa Shell Sekiyu KK | | | 14,800 | | | | 207,050 | |
SMC Corp. | | | 4,100 | | | | 1,223,443 | |
SoftBank Group Corp. | | | 60,500 | | | | 3,983,844 | |
Sohgo Security Services Co., Ltd. | | | 4,800 | | | | 225,761 | |
Sompo Holdings, Inc. | | | 23,599 | | | | 795,777 | |
Sony Corp. | | | 91,800 | | | | 4,416,371 | |
Sony Financial Holdings, Inc. | | | 12,800 | | | | 237,348 | |
Stanley Electric Co., Ltd. | | | 9,700 | | | | 270,240 | |
Subaru Corp. | | | 45,400 | | | | 968,215 | |
SUMCO Corp. (e) | | | 17,600 | | | | 198,256 | |
Sumitomo Chemical Co., Ltd. | | | 117,000 | | | | 571,598 | |
Sumitomo Corp. | | | 83,900 | | | | 1,182,391 | |
|
| Japan—(Continued) | |
Sumitomo Dainippon Pharma Co., Ltd. | | | 12,500 | | | | 402,179 | |
Sumitomo Electric Industries, Ltd. | | | 57,634 | | | | 760,075 | |
Sumitomo Heavy Industries, Ltd. | | | 7,800 | | | | 229,718 | |
Sumitomo Metal Mining Co., Ltd. | | | 16,600 | | | | 441,067 | |
Sumitomo Mitsui Financial Group, Inc. | | | 95,300 | | | | 3,139,541 | |
Sumitomo Mitsui Trust Holdings, Inc. | | | 22,826 | | | | 830,008 | |
Sumitomo Realty & Development Co., Ltd. | | | 26,000 | | | | 948,664 | |
Sumitomo Rubber Industries, Ltd. | | | 12,500 | | | | 148,615 | |
Sundrug Co., Ltd. | | | 6,000 | | | | 178,294 | |
Suntory Beverage & Food, Ltd. | | | 10,400 | | | | 468,939 | |
Suzuken Co., Ltd. | | | 5,800 | | | | 297,381 | |
Suzuki Motor Corp. | | | 26,200 | | | | 1,324,404 | |
Sysmex Corp. | | | 12,200 | | | | 588,025 | |
T&D Holdings, Inc. | | | 39,400 | | | | 454,078 | |
Taiheiyo Cement Corp. | | | 8,200 | | | | 252,123 | |
Taisei Corp. | | | 16,000 | | | | 679,561 | |
Taisho Pharmaceutical Holdings Co., Ltd. | | | 3,000 | | | | 297,963 | |
Taiyo Nippon Sanso Corp. | | | 9,600 | | | | 157,903 | |
Takashimaya Co., Ltd. | | | 9,500 | | | | 120,597 | |
Takeda Pharmaceutical Co., Ltd. | | | 50,800 | | | | 1,721,954 | |
TDK Corp. | | | 9,500 | | | | 675,299 | |
Teijin, Ltd. | | | 13,200 | | | | 209,932 | |
Terumo Corp. | | | 22,100 | | | | 1,240,321 | |
THK Co., Ltd. | | | 7,700 | | | | 142,945 | |
Tobu Railway Co., Ltd. | | | 14,600 | | | | 391,220 | |
Toho Co., Ltd. | | | 8,500 | | | | 306,870 | |
Toho Gas Co., Ltd. | | | 6,200 | | | | 260,993 | |
Tohoku Electric Power Co., Inc. | | | 28,000 | | | | 367,664 | |
Tokio Marine Holdings, Inc. | | | 49,700 | | | | 2,360,148 | |
Tokyo Century Corp. | | | 3,200 | | | | 139,088 | |
Tokyo Electric Power Co. Holdings, Inc. (b) | | | 112,000 | | | | 661,675 | |
Tokyo Electron, Ltd. | | | 11,300 | | | | 1,295,143 | |
Tokyo Gas Co., Ltd. | | | 26,400 | | | | 666,975 | |
Tokyu Corp. | | | 37,500 | | | | 608,848 | |
Tokyu Fudosan Holdings Corp. | | | 37,000 | | | | 183,487 | |
Toppan Printing Co., Ltd. | | | 20,500 | | | | 299,712 | |
Toray Industries, Inc. | | | 108,500 | | | | 757,313 | |
Toshiba Corp. | | | 47,500 | | | | 1,347,038 | |
Tosoh Corp. | | | 23,000 | | | | 297,300 | |
TOTO, Ltd. | | | 10,400 | | | | 357,138 | |
Toyo Seikan Group Holdings, Ltd. | | | 8,300 | | | | 189,146 | |
Toyo Suisan Kaisha, Ltd. | | | 6,000 | | | | 209,178 | |
Toyota Industries Corp. | | | 10,100 | | | | 464,291 | |
Toyota Motor Corp. | | | 166,300 | | | | 9,649,149 | |
Toyota Tsusho Corp. | | | 15,500 | | | | 455,410 | |
Trend Micro, Inc. | | | 8,900 | | | | 481,194 | |
Tsuruha Holdings, Inc. | | | 2,900 | | | | 248,510 | |
Unicharm Corp. | | | 27,400 | | | | 884,326 | |
United Urban Investment Corp. (REIT) | | | 213 | | | | 329,947 | |
USS Co., Ltd. | | | 16,600 | | | | 276,773 | |
Welcia Holdings Co., Ltd. | | | 3,500 | | | | 158,803 | |
West Japan Railway Co. | | | 11,500 | | | | 811,370 | |
Yahoo Japan Corp. | | | 206,700 | | | | 518,752 | |
Yakult Honsha Co., Ltd. | | | 8,200 | | | | 574,346 | |
Yamada Denki Co., Ltd. | | | 46,500 | | | | 222,567 | |
Yamaguchi Financial Group, Inc. | | | 15,000 | | | | 143,229 | |
Yamaha Corp. | | | 8,800 | | | | 373,242 | |
See accompanying notes to financial statements.
BHFTII-9
Brighthouse Funds Trust II
MetLife MSCI EAFE Index Portfolio
Schedule of Investments as of December 31, 2018
Common Stocks—(Continued)
| | | | | | | | |
| Security Description | | Shares | | | Value | |
|
| Japan—(Continued) | |
Yamaha Motor Co., Ltd. | | | 18,700 | | | $ | 363,582 | |
Yamato Holdings Co., Ltd. | | | 21,800 | | | | 593,482 | |
Yamazaki Baking Co., Ltd. | | | 9,000 | | | | 188,345 | |
Yaskawa Electric Corp. | | | 18,000 | | | | 435,467 | |
Yokogawa Electric Corp. | | | 16,300 | | | | 279,308 | |
Yokohama Rubber Co., Ltd. (The) | | | 9,200 | | | | 171,441 | |
ZOZO, Inc. | | | 14,400 | | | | 259,659 | |
| | | | | | | | |
| | | | | | | 220,369,938 | |
| | | | | | | | |
|
| Luxembourg—0.3% | |
ArcelorMittal | | | 46,976 | | | | 967,062 | |
Eurofins Scientific SE | | | 878 | | | | 325,313 | |
Millicom International Cellular S.A. | | | 5,384 | | | | 341,534 | |
RTL Group S.A. | | | 2,700 | | | | 144,189 | |
SES S.A. | | | 29,140 | | | | 556,877 | |
Tenaris S.A. | | | 35,513 | | | | 379,809 | |
| | | | | | | | |
| | | | | | | 2,714,784 | |
| | | | | | | | |
|
| Macau—0.1% | |
Sands China, Ltd. | | | 176,400 | | | | 764,016 | |
Wynn Macau, Ltd. | | | 95,600 | | | | 205,746 | |
| | | | | | | | |
| | | | | | | 969,762 | |
| | | | | | | | |
|
| Mexico—0.0% | |
Fresnillo plc | | | 14,894 | | | | 162,656 | |
| | | | | | | | |
|
| Netherlands—4.4% | |
ABN AMRO Group NV | | | 29,995 | | | | 700,988 | |
Aegon NV | | | 119,047 | | | | 552,162 | |
Akzo Nobel NV | | | 18,312 | | | | 1,468,626 | |
ASML Holding NV | | | 29,837 | | | | 4,644,811 | |
EXOR NV | | | 8,104 | | | | 436,925 | |
Heineken Holding NV | | | 7,836 | | | | 658,010 | |
Heineken NV | | | 18,534 | | | | 1,629,831 | |
ING Groep NV | | | 284,141 | | | | 3,038,180 | |
Koninklijke Ahold Delhaize NV | | | 91,575 | | | | 2,304,973 | |
Koninklijke DSM NV | | | 13,712 | | | | 1,113,163 | |
Koninklijke KPN NV | | | 263,537 | | | | 768,497 | |
Koninklijke Philips NV | | | 68,497 | | | | 2,408,566 | |
Koninklijke Vopak NV | | | 3,942 | | | | 178,169 | |
NN Group NV | | | 21,018 | | | | 833,039 | |
NXP Semiconductors NV | | | 25,300 | | | | 1,853,984 | |
Randstad NV | | | 9,402 | | | | 429,039 | |
Royal Dutch Shell plc - A Shares | | | 334,642 | | | | 9,814,207 | |
Royal Dutch Shell plc - B Shares | | | 271,764 | | | | 8,080,474 | |
Wolters Kluwer NV | | | 21,135 | | | | 1,245,259 | |
| | | | | | | | |
| | | | | | | 42,158,903 | |
| | | | | | | | |
|
| New Zealand—0.2% | |
a2 Milk Co., Ltd. (b) | | | 53,251 | | | | 393,414 | |
Auckland International Airport, Ltd. | | | 69,174 | | | | 331,717 | |
Fisher & Paykel Healthcare Corp., Ltd. | | | 44,270 | | | | 383,485 | |
Fletcher Building, Ltd. (b) | | | 68,594 | | | | 224,368 | |
Meridian Energy, Ltd. | | | 93,292 | | | | 212,141 | |
Ryman Healthcare, Ltd. | | | 29,900 | | | | 214,651 | |
|
| New Zealand—(Continued) | |
Spark New Zealand, Ltd. | | | 106,142 | | | | 294,513 | |
| | | | | | | | |
| | | | | | | 2,054,289 | |
| | | | | | | | |
|
| Norway—0.7% | |
Aker BP ASA | | | 7,864 | | | | 198,854 | |
DNB ASA | | | 68,520 | | | | 1,097,451 | |
Equinor ASA | | | 87,269 | | | | 1,858,397 | |
Gjensidige Forsikring ASA | | | 14,357 | | | | 223,283 | |
Marine Harvest ASA | | | 30,284 | | | | 636,578 | |
Norsk Hydro ASA | | | 91,188 | | | | 412,124 | |
Orkla ASA | | | 62,161 | | | | 488,087 | |
Schibsted ASA - B Shares | | | 7,443 | | | | 225,474 | |
Telenor ASA | | | 51,893 | | | | 1,000,273 | |
Yara International ASA | | | 14,337 | | | | 549,503 | |
| | | | | | | | |
| | | | | | | 6,690,024 | |
| | | | | | | | |
|
| Portugal—0.2% | |
Banco Espirito Santo S.A. (a) (b) (c) (d) | | | 199,038 | | | | 0 | |
EDP - Energias de Portugal S.A. | | | 185,244 | | | | 644,746 | |
Galp Energia SGPS S.A. | | | 37,002 | | | | 584,606 | |
Jeronimo Martins SGPS S.A. | | | 18,255 | | | | 215,637 | |
| | | | | | | | |
| | | | | | | 1,444,989 | |
| | | | | | | | |
|
| Singapore—1.3% | |
Ascendas Real Estate Investment Trust (REIT) | | | 215,000 | | | | 404,239 | |
CapitaLand Commercial Trust (REIT) | | | 166,738 | | | | 213,636 | |
CapitaLand Mall Trust (REIT) | | | 157,500 | | | | 260,581 | |
CapitaLand, Ltd. | | | 172,300 | | | | 391,851 | |
City Developments, Ltd. | | | 34,000 | | | | 201,763 | |
ComfortDelGro Corp., Ltd. | | | 153,000 | | | | 240,260 | |
DBS Group Holdings, Ltd. | | | 131,667 | | | | 2,274,792 | |
Genting Singapore, Ltd. | | | 418,200 | | | | 299,361 | |
Jardine Cycle & Carriage, Ltd. | | | 8,888 | | | | 229,430 | |
Keppel Corp., Ltd. | | | 113,900 | | | | 494,841 | |
Oversea-Chinese Banking Corp., Ltd. | | | 230,564 | | | | 1,893,710 | |
SATS, Ltd. | | | 56,300 | | | | 192,929 | |
Sembcorp Industries, Ltd. | | | 73,200 | | | | 136,691 | |
Singapore Airlines, Ltd. | | | 33,140 | | | | 228,161 | |
Singapore Exchange, Ltd. | | | 54,400 | | | | 284,248 | |
Singapore Press Holdings, Ltd. | | | 84,250 | | | | 144,757 | |
Singapore Technologies Engineering, Ltd. | | | 130,000 | | | | 331,521 | |
Singapore Telecommunications, Ltd. | | | 601,420 | | | | 1,289,988 | |
Suntec Real Estate Investment Trust (REIT) | | | 179,000 | | | | 233,220 | |
United Overseas Bank, Ltd. | | | 96,892 | | | | 1,736,609 | |
UOL Group, Ltd. | | | 33,000 | | | | 149,309 | |
Venture Corp., Ltd. | | | 20,500 | | | | 207,743 | |
Wilmar International, Ltd. | | | 144,000 | | | | 329,900 | |
| | | | | | | | |
| | | | | | | 12,169,540 | |
| | | | | | | | |
|
| South Africa—0.2% | |
Anglo American plc | | | 76,685 | | | | 1,693,872 | |
Investec plc | | | 52,596 | | | | 293,227 | |
| | | | | | | | |
| | | | | | | 1,987,099 | |
| | | | | | | | |
See accompanying notes to financial statements.
BHFTII-10
Brighthouse Funds Trust II
MetLife MSCI EAFE Index Portfolio
Schedule of Investments as of December 31, 2018
Common Stocks—(Continued)
| | | | | | | | |
| Security Description | | Shares | | | Value | |
|
| Spain—2.9% | |
ACS Actividades de Construccion y Servicios S.A. | | | 19,619 | | | $ | 752,508 | |
Aena SME S.A. | | | 5,006 | | | | 774,404 | |
Amadeus IT Group S.A. | | | 31,507 | | | | 2,188,827 | |
Banco Bilbao Vizcaya Argentaria S.A. | | | 485,964 | | | | 2,557,649 | |
Banco de Sabadell S.A. | | | 385,331 | | | | 437,434 | |
Banco Santander S.A. | | | 1,181,455 | | | | 5,319,621 | |
Bankia S.A. | | | 80,824 | | | | 234,824 | |
Bankinter S.A. | | | 48,939 | | | | 390,247 | |
CaixaBank S.A. | | | 268,510 | | | | 964,203 | |
Enagas S.A. | | | 17,953 | | | | 483,677 | |
Endesa S.A. | | | 23,384 | | | | 536,975 | |
Ferrovial S.A. | | | 34,181 | | | | 687,819 | |
Grifols S.A. | | | 21,632 | | | | 563,752 | |
Iberdrola S.A. | | | 433,857 | | | | 3,463,603 | |
Industria de Diseno Textil S.A. | | | 79,108 | | | | 2,012,129 | |
Mapfre S.A. | | | 74,474 | | | | 196,957 | |
Naturgy Energy Group S.A. | | | 25,426 | | | | 643,588 | |
Red Electrica Corp. S.A. | | | 29,508 | | | | 655,788 | |
Repsol S.A. | | | 99,138 | | | | 1,590,064 | |
Siemens Gamesa Renewable Energy S.A. (b) | | | 18,682 | | | | 225,847 | |
Telefonica S.A. | | | 338,883 | | | | 2,853,766 | |
| | | | | | | | |
| | | | | | | 27,533,682 | |
| | | | | | | | |
|
| Sweden—2.3% | |
Alfa Laval AB | | | 20,852 | | | | 445,011 | |
Assa Abloy AB - Class B | | | 72,914 | | | | 1,303,223 | |
Atlas Copco AB - A Shares (b) | | | 49,888 | | | | 1,191,463 | |
Atlas Copco AB - B Shares (b) | | | 28,433 | | | | 623,192 | |
Boliden AB | | | 20,002 | | | | 434,894 | |
Electrolux AB - Series B | | | 17,118 | | | | 362,566 | |
Epiroc AB - Class A (b) | | | 49,888 | | | | 473,628 | |
Epiroc AB - Class B (b) | | | 28,433 | | | | 254,432 | |
Essity AB - Class B | | | 43,954 | | | | 1,079,779 | |
Hennes & Mauritz AB - B Shares (e) | | | 61,284 | | | | 870,167 | |
Hexagon AB - B Shares | | | 19,206 | | | | 886,202 | |
Husqvarna AB - B Shares | | | 25,677 | | | | 190,847 | |
ICA Gruppen AB | | | 5,619 | | | | 200,973 | |
Industrivarden AB - C Shares | | | 10,214 | | | | 207,141 | |
Investor AB - B Shares | | | 31,910 | | | | 1,355,837 | |
Kinnevik AB - Class B | | | 16,046 | | | | 388,118 | |
L E Lundbergforetagen AB - B Shares | | | 6,090 | | | | 179,951 | |
Lundin Petroleum AB | | | 16,017 | | | | 400,314 | |
Sandvik AB | | | 84,986 | | | | 1,215,620 | |
Securitas AB - B Shares | | | 21,462 | | | | 344,944 | |
Skandinaviska Enskilda Banken AB - Class A | | | 113,560 | | | | 1,105,062 | |
Skanska AB - B Shares | | | 24,008 | | | | 383,202 | |
SKF AB - B Shares | | | 25,976 | | | | 395,414 | |
Svenska Handelsbanken AB - A Shares | | | 113,277 | | | | 1,254,438 | |
Swedbank AB - A Shares | | | 65,848 | | | | 1,467,403 | |
Swedish Match AB | | | 14,499 | | | | 571,433 | |
Tele2 AB - B Shares | | | 33,676 | | | | 430,167 | |
Telefonaktiebolaget LM Ericsson - B Shares | | | 220,757 | | | | 1,945,116 | |
Telia Co. AB | | | 204,113 | | | | 968,268 | |
Volvo AB - B Shares | | | 113,997 | | | | 1,498,423 | |
| | | | | | | | |
| | | | | | | 22,427,228 | |
| | | | | | | | |
|
| Switzerland—8.7% | |
ABB, Ltd. | | | 136,042 | | | | 2,586,088 | |
Adecco Group AG | | | 10,992 | | | | 513,251 | |
Baloise Holding AG | | | 3,839 | | | | 528,327 | |
Barry Callebaut AG | | | 132 | | | | 204,665 | |
Chocoladefabriken Lindt & Spruengli AG | | | 7 | | | | 520,171 | |
Chocoladefabriken Lindt & Spruengli AG (Participation Certifcate) | | | 81 | | | | 501,692 | |
Cie Financiere Richemont S.A. | | | 37,512 | | | | 2,403,708 | |
Clariant AG (b) | | | 17,152 | | | | 315,543 | |
Coca-Cola HBC AG (b) | | | 13,800 | | | | 429,061 | |
Credit Suisse Group AG (b) | | | 186,061 | | | | 2,044,387 | |
Dufry AG (b) (e) | | | 2,729 | | | | 258,421 | |
EMS-Chemie Holding AG | | | 579 | | | | 274,890 | |
Ferguson plc | | | 17,515 | | | | 1,120,884 | |
Geberit AG | | | 2,723 | | | | 1,057,755 | |
Givaudan S.A. | | | 649 | | | | 1,500,875 | |
Glencore plc (b) | | | 840,024 | | | | 3,095,881 | |
Julius Baer Group, Ltd. (b) | | | 17,027 | | | | 606,649 | |
Kuehne & Nagel International AG | | | 4,135 | | | | 531,484 | |
LafargeHolcim, Ltd. (b) | | | 35,343 | | | | 1,456,156 | |
Lonza Group AG (b) | | | 5,308 | | | | 1,375,898 | |
Nestle S.A. | | | 222,716 | | | | 18,053,733 | |
Novartis AG | | | 157,830 | | | | 13,478,117 | |
Pargesa Holding S.A. | | | 3,025 | | | | 217,881 | |
Partners Group Holding AG | | | 1,182 | | | | 716,344 | |
Roche Holding AG | | | 50,970 | | | | 12,566,491 | |
Schindler Holding AG | | | 1,428 | | | | 276,894 | |
Schindler Holding AG (Participation Certificate) | | | 3,216 | | | | 637,050 | |
SGS S.A. | | | 367 | | | | 824,420 | |
Sika AG | | | 9,000 | | | | 1,140,476 | |
Sonova Holding AG | | | 4,058 | | | | 659,716 | |
STMicroelectronics NV | | | 49,712 | | | | 707,810 | |
Straumann Holding AG | | | 747 | | | | 471,094 | |
Swatch Group AG (The) | | | 4,374 | | | | 252,796 | |
Swatch Group AG (The) - Bearer Shares | | | 2,245 | | | | 654,832 | |
Swiss Life Holding AG (b) | | | 2,458 | | | | 945,944 | |
Swiss Prime Site AG (b) | | | 5,000 | | | | 403,905 | |
Swiss Re AG | | | 22,839 | | | | 2,092,319 | |
Swisscom AG | | | 1,853 | | | | 884,160 | |
Temenos AG (b) | | | 4,384 | | | | 526,771 | |
UBS Group AG (b) | | | 280,535 | | | | 3,491,606 | |
Vifor Pharma AG | | | 3,820 | | | | 413,395 | |
Zurich Insurance Group AG | | | 10,792 | | | | 3,215,052 | |
| | | | | | | | |
| | | | | | | 83,956,592 | |
| | | | | | | | |
|
| United Arab Emirates—0.0% | |
NMC Health plc | | | 7,569 | | | | 264,379 | |
| | | | | | | | |
|
| United Kingdom—13.9% | |
3i Group plc | | | 70,865 | | | | 695,240 | |
Admiral Group plc | | | 16,009 | | | | 415,826 | |
Ashtead Group plc | | | 37,846 | | | | 783,493 | |
Associated British Foods plc | | | 27,546 | | | | 715,852 | |
AstraZeneca plc | | | 91,643 | | | | 6,848,187 | |
Auto Trader Group plc | | | 75,401 | | | | 434,833 | |
Aviva plc | | | 288,445 | | | | 1,374,644 | |
Babcock International Group plc | | | 22,688 | | | | 141,397 | |
See accompanying notes to financial statements.
BHFTII-11
Brighthouse Funds Trust II
MetLife MSCI EAFE Index Portfolio
Schedule of Investments as of December 31, 2018
Common Stocks—(Continued)
| | | | | | | | |
| Security Description | | Shares | | | Value | |
|
| United Kingdom—(Continued) | |
BAE Systems plc | | | 231,979 | | | $ | 1,352,888 | |
Barclays plc | | | 1,244,471 | | | | 2,385,298 | |
Barratt Developments plc | | | 69,622 | | | | 410,633 | |
Berkeley Group Holdings plc | | | 10,289 | | | | 456,012 | |
BP plc | | | 1,449,949 | | | | 9,141,165 | |
British American Tobacco plc | | | 166,044 | | | | 5,290,853 | |
British Land Co. plc (The) (REIT) | | | 73,348 | | | | 498,011 | |
BT Group plc | | | 630,635 | | | | 1,907,452 | |
Bunzl plc | | | 27,344 | | | | 822,102 | |
Burberry Group plc | | | 32,742 | | | | 719,795 | |
Centrica plc | | | 412,821 | | | | 709,309 | |
CNH Industrial NV | | | 78,026 | | | | 700,367 | |
Coca-Cola European Partners plc | | | 16,100 | | | | 738,185 | |
Compass Group plc | | | 116,519 | | | | 2,444,360 | |
ConvaTec Group plc | | | 91,978 | | | | 162,336 | |
Croda International plc | | | 9,266 | | | | 549,967 | |
DCC plc | | | 7,008 | | | | 532,314 | |
Diageo plc | | | 178,216 | | | | 6,329,454 | |
Direct Line Insurance Group plc | | | 89,919 | | | | 363,913 | |
easyJet plc | | | 10,815 | | | | 151,706 | |
Experian plc | | | 65,580 | | | | 1,592,653 | |
Fiat Chrysler Automobiles NV (b) | | | 78,476 | | | | 1,138,354 | |
G4S plc | | | 108,086 | | | | 270,291 | |
GlaxoSmithKline plc | | | 360,925 | | | | 6,844,856 | |
GVC Holdings plc | | | 39,400 | | | | 338,381 | |
Hammerson plc (REIT) | | | 54,049 | | | | 226,166 | |
Hargreaves Lansdown plc | | | 20,716 | | | | 487,718 | |
HSBC Holdings plc | | | 1,456,681 | | | | 11,944,682 | |
Imperial Brands plc | | | 70,611 | | | | 2,133,600 | |
Informa plc | | | 91,052 | | | | 729,546 | |
InterContinental Hotels Group plc | | | 12,234 | | | | 657,904 | |
International Consolidated Airlines Group S.A. - Class DI | | | 49,850 | | | | 394,715 | |
Intertek Group plc | | | 11,453 | | | | 696,711 | |
J Sainsbury plc | | | 120,106 | | | | 404,684 | |
John Wood Group plc | | | 51,100 | | | | 326,922 | |
Johnson Matthey plc | | | 15,590 | | | | 555,798 | |
Kingfisher plc (e) | | | 151,460 | | | | 400,388 | |
Land Securities Group plc (REIT) | | | 54,641 | | | | 559,691 | |
Legal & General Group plc | | | 421,904 | | | | 1,237,013 | |
Lloyds Banking Group plc | | | 5,220,354 | | | | 3,446,776 | |
London Stock Exchange Group plc | | | 22,230 | | | | 1,146,280 | |
Marks & Spencer Group plc | | | 137,472 | | | | 432,941 | |
Meggitt plc | | | 55,862 | | | | 333,916 | |
Melrose Industries plc (e) | | | 351,107 | | | | 726,482 | |
Merlin Entertainments plc | | | 52,353 | | | | 211,715 | |
Micro Focus International plc | | | 33,650 | | | | 587,673 | |
Mondi plc | | | 27,093 | | | | 560,177 | |
National Grid plc | | | 249,620 | | | | 2,412,072 | |
Next plc | | | 9,783 | | | | 497,470 | |
Pearson plc | | | 63,486 | | | | 756,253 | |
Persimmon plc | | | 22,805 | | | | 558,271 | |
Prudential plc | | | 186,011 | | | | 3,320,863 | |
Reckitt Benckiser Group plc | | | 48,931 | | | | 3,733,733 | |
RELX plc | | | 143,278 | | | | 2,940,467 | |
Rio Tinto plc | | | 84,969 | | | | 4,048,218 | |
Rolls-Royce Holdings plc (b) | | | 116,835 | | | | 1,228,552 | |
Royal Bank of Scotland Group plc | | | 355,393 | | | | 976,411 | |
|
| United Kingdom—(Continued) | |
Royal Mail plc | | | 67,965 | | | | 235,767 | |
RSA Insurance Group plc | | | 74,322 | | | | 484,550 | |
Sage Group plc (The) | | | 77,930 | | | | 596,178 | |
Schroders plc | | | 7,697 | | | | 238,523 | |
Segro plc (REIT) | | | 74,212 | | | | 556,225 | |
Severn Trent plc | | | 20,415 | | | | 471,289 | |
Smith & Nephew plc | | | 62,049 | | | | 1,153,109 | |
Smiths Group plc | | | 31,976 | | | | 553,190 | |
SSE plc | | | 72,948 | | | | 1,002,192 | |
St. James’s Place plc | | | 38,927 | | | | 466,036 | |
Standard Chartered plc | | | 203,987 | | | | 1,575,516 | |
Standard Life Aberdeen plc | | | 163,097 | | | | 533,240 | |
Taylor Wimpey plc | | | 240,026 | | | | 414,850 | |
Tesco plc | | | 690,838 | | | | 1,672,683 | |
Unilever NV | | | 112,339 | | | | 6,090,087 | |
Unilever plc | | | 82,237 | | | | 4,300,715 | |
United Utilities Group plc | | | 57,234 | | | | 535,529 | |
Vodafone Group plc | | | 1,935,083 | | | | 3,757,165 | |
Weir Group plc (The) | | | 17,104 | | | | 281,000 | |
Whitbread plc | | | 14,502 | | | | 843,530 | |
WM Morrison Supermarkets plc | | | 166,578 | | | | 451,140 | |
WPP plc | | | 93,040 | | | | 998,493 | |
| | | | | | | | |
| | | | | | | 133,144,942 | |
| | | | | | | | |
|
| United States—0.5% | |
Carnival plc | | | 13,029 | | | | 624,468 | |
QIAGEN NV (b) | | | 15,166 | | | | 515,961 | |
Shire plc | | | 65,970 | | | | 3,830,892 | |
| | | | | | | | |
| | | | | | | 4,971,321 | |
| | | | | | | | |
Total Common Stocks
(Cost $862,711,809) | | | | | | | 902,704,725 | |
| | | | | | | | |
|
| Mutual Fund—3.6% | |
|
| United States—3.6% | |
iShares MSCI EAFE ETF (e) (f)
(Cost $38,839,999) | | | 590,000 | | | | 34,680,200 | |
| | | | | | | | |
|
| Preferred Stocks—0.5% | |
|
| Germany—0.5% | |
Bayerische Motoren Werke (BMW) AG | | | 3,581 | | | | 254,281 | |
FUCHS Petrolub SE | | | 4,900 | | | | 201,533 | |
Henkel AG & Co. KGaA | | | 12,893 | | | | 1,404,713 | |
Porsche Automobil Holding SE | | | 11,105 | | | | 655,939 | |
Sartorius AG | | | 2,589 | | | | 322,572 | |
Volkswagen AG | | | 13,371 | | | | 2,122,945 | |
| | | | | | | | |
Total Preferred Stocks
(Cost $4,249,327) | | | | | | | 4,961,983 | |
| | | | | | | | |
See accompanying notes to financial statements.
BHFTII-12
Brighthouse Funds Trust II
MetLife MSCI EAFE Index Portfolio
Schedule of Investments as of December 31, 2018
Rights—0.0%
| | | | | | | | |
| Security Description | | Shares/
Principal
Amount* | | | Value | |
|
| Spain—0.0% | |
Repsol S.A., Expires 12/19/18 (b)
(Cost $46,505) | | | 99,138 | | | $ | 45,332 | |
| | | | | | | | |
|
| Short-Term Investments—1.6% | |
|
| Discount Notes—0.5% | |
Federal Home Loan Bank
2.056%, 01/09/19 (g) | | | 650,000 | | | | 649,699 | |
2.189%, 01/18/11 (g) | | | 375,000 | | | | 374,603 | |
2.273%, 01/23/19 (g) | | | 125,000 | | | | 124,826 | |
2.288%, 01/30/19 (g) | | | 675,000 | | | | 673,751 | |
2.329%, 02/06/19 (g) | | | 2,650,000 | | | | 2,643,818 | |
| | | | | | | | |
| | | | | | | 4,466,697 | |
| | | | | | | | |
|
| U.S. Treasury—1.1% | |
U.S. Treasury Bills
1.998%, 01/08/19 (g) | | | 2,375,000 | | | | 2,374,098 | |
2.138%, 01/17/19 (g) | | | 575,000 | | | | 574,444 | |
2.210%, 01/22/19 (g) | | | 2,350,000 | | | | 2,346,952 | |
2.305%, 01/29/19 (g) | | | 3,500,000 | | | | 3,493,554 | |
2.332%, 02/21/19 (g) | | | 1,950,000 | | | | 1,943,491 | |
| | | | | | | | |
| | | | | | | 10,732,539 | |
| | | | | | | | |
Total Short-Term Investments
(Cost $15,198,987) | | | | | | | 15,199,236 | |
| | | | | | | | |
|
| Securities Lending Reinvestments (h)—2.3% | |
|
| Certificate of Deposit—0.1% | |
Natixis New York
2.940%, SOFR + 0.480%, 06/12/19 (i) | | | 1,000,000 | | | | 999,894 | |
| | | | | | | | |
|
| Commercial Paper—0.2% | |
ING Funding LLC
2.707%, 1M LIBOR + 0.320%, 02/08/19 (i) | | | 1,500,000 | | | | 1,500,140 | |
| | | | | | | | |
|
| Repurchase Agreements—1.9% | |
Citigroup Global Markets, Ltd.
Repurchase Agreement dated 12/31/18 at 2.490%, due on 01/02/19 with a maturity value of $3,500,484; collateralized by U.S. Treasury Obligations with rates ranging from 1.625% - 2.875%, maturity dates ranging from 06/30/20 - 11/15/46, and an aggregate market value of $3,570,000. | | | 3,500,000 | | | | 3,500,000 | |
Deutsche Bank Securities, Inc.
Repurchase Agreement dated 12/31/18 at 3.200%, due on 01/02/19 with a maturity value of $4,833,068; collateralized by U.S. Treasury Obligations at 0.000%, maturity dates ranging from 08/15/30 - 08/15/39, and an aggregate market value of $4,928,853. | | | 4,832,209 | | | | 4,832,209 | |
| NBC Global Finance, Ltd. | | | | | | |
Repurchase Agreement dated 12/31/18 at 2.560%, due on 01/02/19 with a maturity value of $500,071; collateralized by various Common Stock with an aggregate market value of $556,606. | | | 500,000 | | | | 500,000 | |
|
| Repurchase Agreements—(Continued) | |
| NBC Global Finance, Ltd. | | | | | | |
Repurchase Agreement dated 12/31/18 at 2.560%, due on 01/02/19 with a maturity value of $3,500,498; collateralized by various Common Stock with an aggregate market value of $3,896,243. | | | 3,500,000 | | | | 3,500,000 | |
Repurchase Agreement dated 12/31/18 at 2.560%, due on 01/02/19 with a maturity value of $800,114; collateralized by various Common Stock with an aggregate market value of $890,570. | | | 800,000 | | | | 800,000 | |
Nomura Securities International, Inc.
Repurchase Agreement dated 12/31/18 at 2.950%, due on 01/02/19 with a maturity value of $3,000,492; collateralized by U.S. Treasury Obligations with rates ranging from 0.000% - 6.500%, maturity dates ranging from 02/15/19 - 08/15/48, and an aggregate market value of $3,060,000. | | | 3,000,000 | | | | 3,000,000 | |
Societe Generale
Repurchase Agreement dated 12/31/18 at 2.530%, due on 01/02/19 with a maturity value of $700,098; collateralized by U.S. Treasury Obligations with rates ranging from 0.750% - 8.000%, maturity dates ranging from 09/30/19 - 08/15/46, and various Common Stock with an aggregate market value of $766,833. | | | 700,000 | | | | 700,000 | |
Repurchase Agreement dated 12/31/18 at 2.530%, due on 01/02/19 with a maturity value of $1,172,543; collateralized by U.S. Treasury Obligations with rates ranging from 0.750% - 8.000%, maturity dates ranging from 09/30/19 - 08/15/46, and various Common Stock with an aggregate market value of $1,284,312. | | | 1,172,378 | | | | 1,172,378 | |
Repurchase Agreement dated 12/31/18 at 2.560%, due on 01/07/19 with a maturity value of $460,229; collateralized by U.S. Treasury Obligations with rates ranging from 0.750% - 8.000%, maturity dates ranging from 09/30/19 - 08/15/46, and various Common Stock with an aggregate market value of $503,919. | | | 460,000 | | | | 460,000 | |
| | | | | | | | |
| | | | | | | 18,464,587 | |
| | | | | | | | |
|
| Time Deposit—0.1% | |
Royal Bank of Canada
2.420%, 01/02/19 | | | 1,000,000 | | | | 1,000,000 | |
| | | | | | | | |
Total Securities Lending Reinvestments
(Cost $21,964,587) | | | | | | | 21,964,621 | |
| | | | | | | | |
Total Investments—102.1%
(Cost $943,011,214) | | | | | | | 979,556,097 | |
Other assets and liabilities (net)—(2.1)% | | | | | | | (19,965,502 | ) |
| | | | | | | | |
| Net Assets—100.0% | | | | | | $ | 959,590,595 | |
| | | | | | | | |
| | | | |
| * | | Principal amount stated in U.S. dollars unless otherwise noted. |
| (a) | | Security was valued in good faith under procedures approved by the Board of Trustees. As of December 31, 2018, these securities represent 0.1% of net assets. |
| (b) | | Non-income producing security. |
| (c) | | Illiquid security. As of December 31, 2018, these securities represent 0.0% of net assets. |
| (d) | | Significant unobservable inputs were used in the valuation of this portfolio security; i.e. Level 3. |
See accompanying notes to financial statements.
BHFTII-13
Brighthouse Funds Trust II
MetLife MSCI EAFE Index Portfolio
Schedule of Investments as of December 31, 2018
| | | | |
| (e) | | All or a portion of the security was held on loan. As of December 31, 2018, the market value of securities loaned was $21,344,817 and the collateral received consisted of cash in the amount of $21,964,587. The cash collateral investments are disclosed in the Schedule of Investments and categorized as Securities Lending Reinvestments. |
| (f) | | All or a portion of the security was pledged as collateral against open futures contracts. As of December 31, 2018, the market value of securities pledged was $2,351,200. |
| (g) | | The rate shown represents current yield to maturity. |
| (h) | | Represents investment of cash collateral received from securities on loan as of December 31, 2018. |
| (i) | | Variable or floating rate security. The stated rate represents the rate at December 31, 2018. Maturity date shown for callable securities reflects the earliest possible call date. For securities based on a published reference index and spread, the index and spread are indicated in the description above. For certain variable rate securities, the coupon rate is determined by the issuer/agent based on current market conditions. For certain asset- and mortgage-backed securities, the coupon rate may fluctuate based on changes of the underlying collateral or prepayments of principal. These securities do not indicate a reference index and spread in their description above. |
| | | | |
Ten Largest Industries as of
December 31, 2018 (Unaudited) | | % of
Net Assets | |
Banks | | | 10.2 | |
Pharmaceuticals | | | 7.7 | |
Oil, Gas & Consumable Fuels | | | 5.4 | |
Insurance | | | 5.2 | |
Chemicals | | | 3.2 | |
Automobiles | | | 3.2 | |
Food Products | | | 3.2 | |
Metals & Mining | | | 2.8 | |
Machinery | | | 2.3 | |
Diversified Telecommunication Services | | | 2.3 | |
Futures Contracts
| | | | | | | | | | | | | | | | | | | | |
Futures Contracts—Long | | Expiration
Date | | | Number of
Contracts | | | Notional
Amount | | | Value/
Unrealized
Depreciation | |
MSCI EAFE Index Mini Futures | | | 03/15/19 | | | | 140 | | | | USD | | | | 12,012,000 | | | $ | (204,691 | ) |
| | | | | | | | | | | | | | | | | | | | |
Glossary of Abbreviations
Currencies
| | | | |
| (USD)— | | United States Dollar |
Index Abbreviations
| | | | |
| (LIBOR)— | | London Interbank Offered Rate |
| (SOFR)— | | Secured Overnight Financing Rate |
Other Abbreviations
| | | | |
| (ADR)— | | American Depositary Receipt |
| (ETF)— | | Exchange-Traded Fund |
| (REIT)— | | Real Estate Investment Trust |
See accompanying notes to financial statements.
BHFTII-14
Brighthouse Funds Trust II
MetLife MSCI EAFE Index Portfolio
Schedule of Investments as of December 31, 2018
Fair Value Hierarchy
Accounting principles generally accepted in the United States of America (“GAAP”) define fair market value as the price that the Portfolio would receive to sell an asset or pay to transfer a liability in an orderly transaction between market participants at the measurement date. It establishes a fair value hierarchy that prioritizes inputs to valuation methods and requires disclosure of the fair value hierarchy, separately for each major category of assets and liabilities, that segregates fair value measurements into three levels. Levels 1, 2 and 3 of the fair value hierarchy are defined as follows:
Level 1 - unadjusted quoted prices in active markets for identical investments
Level 2 - other significant observable inputs (including, but not limited to, quoted prices for similar assets or liabilities in markets that are either active or inactive; inputs other than quoted prices that are observable such as interest rates, yield curves, volatilities, prepayment speeds, loss severities, credit risks, default rates, or other market corroborated inputs)
Level 3 - significant unobservable inputs based on the best information available in the circumstances, to the extent observable inputs are unavailable (including the Portfolio’s own assumptions used in determining the fair value of investments and derivative financial instruments)
The inputs or methodologies used for valuing investments are not necessarily an indication of the risk associated with investing in them. Changes to the inputs or methodologies used may result in transfers between levels. A reconciliation of Level 3 securities, if any, will be disclosed following the fair value hierarchy table. For more information about the Portfolio’s policy regarding the valuation of investments, please refer to the Notes to Financial Statements.
The following table summarizes the fair value hierarchy of the Portfolio’s investments as of December 31, 2018:
| | | | | | | | | | | | | | | | |
| Description | | Level 1 | | | Level 2 | | | Level 3 | | | Total | |
| Common Stocks | |
Australia | | $ | 668,420 | | | $ | 65,060,825 | | | $ | 0 | | | $ | 65,729,245 | |
Austria | | | — | | | | 2,108,451 | | | | — | | | | 2,108,451 | |
Belgium | | | — | | | | 8,645,258 | | | | — | | | | 8,645,258 | |
Chile | | | — | | | | 266,948 | | | | — | | | | 266,948 | |
China | | | 336,624 | | | | 1,287,965 | | | | — | | | | 1,624,589 | |
Denmark | | | — | | | | 15,991,114 | | | | — | | | | 15,991,114 | |
Finland | | | — | | | | 11,446,748 | | | | — | | | | 11,446,748 | |
France | | | — | | | | 97,178,951 | | | | — | | | | 97,178,951 | |
Germany | | | — | | | | 74,825,032 | | | | — | | | | 74,825,032 | |
Hong Kong | | | 348,876 | | | | 32,325,313 | | | | — | | | | 32,674,189 | |
Ireland | | | 403,920 | | | | 5,243,289 | | | | — | | | | 5,647,209 | |
Israel | | | 2,328,576 | | | | 2,598,844 | | | | — | | | | 4,927,420 | |
Italy | | | — | | | | 18,619,443 | | | | — | | | | 18,619,443 | |
Japan | | | — | | | | 220,369,938 | | | | — | | | | 220,369,938 | |
Luxembourg | | | — | | | | 2,714,784 | | | | — | | | | 2,714,784 | |
Macau | | | — | | | | 969,762 | | | | — | | | | 969,762 | |
Mexico | | | — | | | | 162,656 | | | | — | | | | 162,656 | |
Netherlands | | | 1,853,984 | | | | 40,304,919 | | | | — | | | | 42,158,903 | |
New Zealand | | | — | | | | 2,054,289 | | | | — | | | | 2,054,289 | |
Norway | | | — | | | | 6,690,024 | | | | — | | | | 6,690,024 | |
Portugal | | | — | | | | 1,444,989 | | | | 0 | | | | 1,444,989 | |
Singapore | | | — | | | | 12,169,540 | | | | — | | | | 12,169,540 | |
South Africa | | | — | | | | 1,987,099 | | | | — | | | | 1,987,099 | |
Spain | | | — | | | | 27,533,682 | | | | — | | | | 27,533,682 | |
Sweden | | | — | | | | 22,427,228 | | | | — | | | | 22,427,228 | |
Switzerland | | | — | | | | 83,956,592 | | | | — | | | | 83,956,592 | |
United Arab Emirates | | | — | | | | 264,379 | | | | — | | | | 264,379 | |
United Kingdom | | | 738,185 | | | | 132,406,757 | | | | — | | | | 133,144,942 | |
United States | | | 57 | | | | 4,971,264 | | | | — | | �� | | 4,971,321 | |
Total Common Stocks | | | 6,678,642 | | | | 896,026,083 | | | | 0 | | | | 902,704,725 | |
Total Mutual Fund* | | | 34,680,200 | | | | — | | | | — | | | | 34,680,200 | |
Total Preferred Stocks* | | | — | | | | 4,961,983 | | | | — | | | | 4,961,983 | |
Total Rights* | | | 45,332 | | | | — | | | | — | | | | 45,332 | |
Total Short-Term Investments* | | | — | | | | 15,199,236 | | | | — | | | | 15,199,236 | |
Total Securities Lending Reinvestments* | | | — | | | | 21,964,621 | | | | — | | | | 21,964,621 | |
Total Investments | | $ | 41,404,174 | | | $ | 938,151,923 | | | $ | 0 | | | $ | 979,556,097 | |
| | | | | | | | | | | | | | | | | |
Collateral for Securities Loaned (Liability) | | $ | — | | | $ | (21,964,587 | ) | | $ | — | | | $ | (21,964,587 | ) |
| Futures Contracts | |
Futures Contracts (Unrealized Depreciation) | | $ | (204,691 | ) | | $ | — | | | $ | — | | | $ | (204,691 | ) |
| | | | |
| * | | See Schedule of Investments for additional detailed categorizations. |
Level 3 investments at the beginning and/or end of the period in relation to net assets were not significant and accordingly, a reconciliation of Level 3 assets for the year ended December 31, 2018 is not presented.
See accompanying notes to financial statements.
BHFTII-15
Brighthouse Funds Trust II
MetLife MSCI EAFE Index Portfolio
Statement of Assets and Liabilities
December 31, 2018
| | | | |
Assets | |
Investments at value (a) (b) | | $ | 979,556,097 | |
Cash | | | 1,659,684 | |
Cash denominated in foreign currencies (c) | | | 57,196 | |
Receivable for: | |
Investments sold | | | 550,751 | |
Fund shares sold | | | 2,202,544 | |
Dividends | | | 3,402,510 | |
Variation margin on futures contracts | | | 5,611 | |
Prepaid expenses | | | 2,889 | |
| | | | |
Total Assets | | | 987,437,282 | |
Liabilities | |
Collateral for securities loaned | | | 21,964,587 | |
Payables for: | |
Investments purchased | | | 2,998,795 | |
Fund shares redeemed | | | 337,969 | |
Accrued Expenses: | |
Management fees | | | 245,302 | |
Distribution and service fees | | | 101,509 | |
Deferred trustees’ fees | | | 112,668 | |
Other expenses | | | 2,085,857 | |
| | | | |
Total Liabilities | | | 27,846,687 | |
| | | | |
Net Assets | | $ | 959,590,595 | |
| | | | |
Net Assets Consist of: | |
Paid in surplus | | $ | 902,128,703 | |
Distributable earnings (Accumulated losses) | | | 57,461,892 | |
| | | | |
Net Assets | | $ | 959,590,595 | |
| | | | |
Net Assets | |
Class A | | $ | 497,545,694 | |
Class B | | | 336,313,465 | |
Class E | | | 25,233,482 | |
Class G | | | 100,497,954 | |
Capital Shares Outstanding* | |
Class A | | | 40,913,147 | |
Class B | | | 28,241,888 | |
Class E | | | 2,086,386 | |
Class G | | | 8,495,824 | |
Net Asset Value, Offering Price and Redemption Price Per Share | |
Class A | | $ | 12.16 | |
Class B | | | 11.91 | |
Class E | | | 12.09 | |
Class G | | | 11.83 | |
| | | | |
| * | | The Portfolio is authorized to issue an unlimited number of shares. |
| (a) | | Identified cost of investments was $943,011,214. |
| (b) | | Includes securities loaned at value of $21,344,817. |
| (c) | | Identified cost of cash denominated in foreign currencies was $57,014. |
Statement of Operations
Year Ended December 31, 2018
| | | | |
Investment Income | | | | |
Dividends (a) | | $ | 33,259,482 | |
Interest | | | 247,999 | |
Securities lending income | | | 345,534 | |
| | | | |
Total investment income | | | 33,853,015 | |
Expenses | | | | |
Management fees | | | 3,265,624 | |
Administration fees | | | 42,456 | |
Custodian and accounting fees | | | 312,123 | |
Distribution and service fees—Class B | | | 974,409 | |
Distribution and service fees—Class E | | | 43,724 | |
Distribution and service fees—Class G | | | 335,994 | |
Audit and tax services | | | 46,743 | |
Legal | | | 45,317 | |
Trustees’ fees and expenses | | | 33,733 | |
Shareholder reporting | | | 163,664 | |
Insurance | | | 7,102 | |
Miscellaneous | | | 264,521 | |
| | | | |
Total expenses | | | 5,535,410 | |
Less management fee waiver | | | (33,993 | ) |
| | | | |
Net expenses | | | 5,501,417 | |
| | | | |
Net Investment Income | | | 28,351,598 | |
| | | | |
Net Realized and Unrealized Gain (Loss) | | | | |
| Net realized gain (loss) on: | | | | |
Investments | | | 12,333,553 | |
Futures contracts | | | (1,896,353 | ) |
Foreign currency transactions | | | (300,284 | ) |
| | | | |
Net realized gain | | | 10,136,916 | |
| | | | |
| Net change in unrealized depreciation on: | | | | |
Investments | | | (193,417,298 | ) |
Futures contracts | | | (327,149 | ) |
Foreign currency transactions | | | (75,102 | ) |
| | | | |
Net change in unrealized depreciation | | | (193,819,549 | ) |
| | | | |
Net realized and unrealized loss | | | (183,682,633 | ) |
| | | | |
Net Decrease in Net Assets From Operations | | $ | (155,331,035 | ) |
| | | | |
| | | | |
| (a) | | Net of foreign withholding taxes of $2,971,242. |
See accompanying notes to financial statements.
BHFTII-16
Brighthouse Funds Trust II
MetLife MSCI EAFE Index Portfolio
Statements of Changes in Net Assets
| | | | | | | | | | | | |
| | | Year Ended
December 31,
2018 | | | Year Ended
December 31,
2017 | |
Increase (Decrease) in Net Assets: | |
From Operations | |
Net investment income | | $ | 28,351,598 | | | $ | 27,181,125 | |
Net realized gain | | | 10,136,916 | | | | 26,700,205 | |
Net change in unrealized appreciation (depreciation) | | | (193,819,549 | ) | | | 187,439,791 | |
| | | | | | | | |
Increase (decrease) in net assets from operations | | | (155,331,035 | ) | | | 241,321,121 | |
| | | | | | | | |
From Distributions to Shareholders (a) | |
Class A | | | (16,673,785 | ) | | | (14,750,511 | ) |
Class B | | | (10,835,559 | ) | | | (10,394,985 | ) |
Class E | | | (823,070 | ) | | | (789,604 | ) |
Class G | | | (3,102,863 | ) | | | (2,690,889 | ) |
| | | | | | | | |
Total distributions | | | (31,435,277 | ) | | | (28,625,989 | ) |
| | | | | | | | |
Increase (decrease) in net assets from capital share transactions | | | 2,610,269 | | | | (86,644,632 | ) |
| | | | | | | | |
Total increase (decrease) in net assets | | | (184,156,043 | ) | | | 126,050,500 | |
|
Net Assets | |
Beginning of period | | | 1,143,746,638 | | | | 1,017,696,138 | |
| | | | | | | | |
End of period | | $ | 959,590,595 | | | $ | 1,143,746,638 | (b) |
| | | | | | | | |
Other Information:
Capital Shares
Transactions in capital shares were as follows:
| | | | | | | | | | | | | | | | |
| | | Year Ended
December 31, 2018 | | | Year Ended
December 31, 2017 | |
| | | Shares | | | Value | | | Shares | | | Value | |
Class A | |
Sales | | | 3,939,329 | | | $ | 54,805,801 | | | | 2,238,430 | | | $ | 29,784,034 | |
Reinvestments | | | 1,178,359 | | | | 16,673,785 | | | | 1,113,246 | | | | 14,750,511 | |
Redemptions | | | (3,946,676 | ) | | | (55,809,870 | ) | | | (5,285,048 | ) | | | (70,703,508 | ) |
| | | | | | | | | | | | | | | | |
Net increase (decrease) | | | 1,171,012 | | | $ | 15,669,716 | | | | (1,933,372 | ) | | $ | (26,168,963 | ) |
| | | | | | | | | | | | | | | | |
Class B | |
Sales | | | 1,290,742 | | | $ | 17,223,346 | | | | 594,686 | | | $ | 7,680,284 | |
Reinvestments | | | 780,660 | | | | 10,835,559 | | | | 799,615 | | | | 10,394,985 | |
Redemptions | | | (3,158,638 | ) | | | (43,643,536 | ) | | | (5,370,398 | ) | | | (70,878,217 | ) |
| | | | | | | | | | | | | | | | |
Net decrease | | | (1,087,236 | ) | | $ | (15,584,631 | ) | | | (3,976,097 | ) | | $ | (52,802,948 | ) |
| | | | | | | | | | | | | | | | |
Class E | |
Sales | | | 143,756 | | | $ | 1,979,666 | | | | 43,936 | | | $ | 577,766 | |
Reinvestments | | | 58,415 | | | | 823,070 | | | | 59,864 | | | | 789,604 | |
Redemptions | | | (278,661 | ) | | | (3,924,036 | ) | | | (427,733 | ) | | | (5,710,770 | ) |
| | | | | | | | | | | | | | | | |
Net decrease | | | (76,490 | ) | | $ | (1,121,300 | ) | | | (323,933 | ) | | $ | (4,343,400 | ) |
| | | | | | | | | | | | | | | | |
Class G | |
Sales | | | 1,208,495 | | | $ | 16,281,035 | | | | 998,246 | | | $ | 12,971,391 | |
Reinvestments | | | 225,008 | | | | 3,102,863 | | | | 208,273 | | | | 2,690,889 | |
Redemptions | | | (1,145,821 | ) | | | (15,737,414 | ) | | | (1,456,545 | ) | | | (18,991,601 | ) |
| | | | | | | | | | | | | | | | |
Net increase (decrease) | | | 287,682 | | | $ | 3,646,484 | | | | (250,026 | ) | | $ | (3,329,321 | ) |
| | | | | | | | | | | | | | | | |
Increase (decrease) derived from capital shares transactions | | | | | | $ | 2,610,269 | | | | | | | $ | (86,644,632 | ) |
| | | | | | | | | | | | | | | | |
| | | | |
| (a) | | Distributions from net investment income and realized gains are no longer required to be separately disclosed. The presentation for the year ended December 31, 2018 has been adjusted for this change (See Note 9). At December 31, 2017 the distributions were from net investment income. |
| (b) | | As part of the update in (a), it is also no longer required to disclose the Undistributed net investment income (Accumulated losses) which was $20,649,206 as of December 31, 2017. |
See accompanying notes to financial statements.
BHFTII-17
Brighthouse Funds Trust II
MetLife MSCI EAFE Index Portfolio
Financial Highlights
| | | | | | | | | | | | | | | | | | | | |
| Selected per share data | |
| | | Class A | |
| | | Year Ended December 31, | |
| | | 2018 | | | 2017 | | | 2016 | | | 2015 | | | 2014 | |
Net Asset Value, Beginning of Period | | $ | 14.55 | | | $ | 11.97 | | | $ | 12.14 | | | $ | 12.67 | | | $ | 13.83 | |
| | | | | | | | | | | | | | | | | | | | |
Income (Loss) from Investment Operations | |
Net investment income (a) | | | 0.38 | | | | 0.35 | | | | 0.34 | (b) | | | 0.34 | | | | 0.45 | |
Net realized and unrealized gain (loss) | | | (2.34 | ) | | | 2.60 | | | | (0.20 | ) | | | (0.45 | ) | | | (1.26 | ) |
| | | | | | | | | | | | | | | | | | | | |
Total income (loss) from investment operations | | | (1.96 | ) | | | 2.95 | | | | 0.14 | | | | (0.11 | ) | | | (0.81 | ) |
| | | | | | | | | | | | | | | | | | | | |
Less Distributions | |
Distributions from net investment income | | | (0.43 | ) | | | (0.37 | ) | | | (0.31 | ) | | | (0.42 | ) | | | (0.35 | ) |
| | | | | | | | | | | | | | | | | | | | |
Total distributions | | | (0.43 | ) | | | (0.37 | ) | | | (0.31 | ) | | | (0.42 | ) | | | (0.35 | ) |
| | | | | | | | | | | | | | | | | | | | |
Net Asset Value, End of Period | | $ | 12.16 | | | $ | 14.55 | | | $ | 11.97 | | | $ | 12.14 | | | $ | 12.67 | |
| | | | | | | | | | | | | | | | | | | | |
Total Return (%) (c) | | | (13.91 | ) | | | 24.90 | | | | 1.34 | | | | (1.09 | ) | | | (6.00 | ) |
|
Ratios/Supplemental Data | |
Gross ratio of expenses to average net assets (%) | | | 0.38 | | | | 0.37 | | | | 0.38 | | | | 0.40 | | | | 0.40 | |
Net ratio of expenses to average net assets (%) (d) | | | 0.38 | | | | 0.37 | | | | 0.38 | | | | 0.40 | | | | 0.40 | |
Ratio of net investment income to average net assets (%) | | | 2.72 | | | | 2.59 | | | | 2.93 | (b) | | | 2.59 | | | | 3.34 | |
Portfolio turnover rate (%) | | | 9 | | | | 12 | | | | 12 | | | | 9 | | | | 9 | |
Net assets, end of period (in millions) | | $ | 497.5 | | | $ | 578.2 | | | $ | 498.7 | | | $ | 464.9 | | | $ | 430.0 | |
| |
| | | Class B | |
| | | Year Ended December 31, | |
| | | 2018 | | | 2017 | | | 2016 | | | 2015 | | | 2014 | |
Net Asset Value, Beginning of Period | | $ | 14.25 | | | $ | 11.73 | | | $ | 11.91 | | | $ | 12.43 | | | $ | 13.58 | |
| | | | | | | | | | | | | | | | | | | | |
Income (Loss) from Investment Operations | |
Net investment income (a) | | | 0.34 | | | | 0.31 | | | | 0.31 | (b) | | | 0.30 | | | | 0.42 | |
Net realized and unrealized gain (loss) | | | (2.29 | ) | | | 2.54 | | | | (0.21 | ) | | | (0.43 | ) | | | (1.25 | ) |
| | | | | | | | | | | | | | | | | | | | |
Total income (loss) from investment operations | | | (1.95 | ) | | | 2.85 | | | | 0.10 | | | | (0.13 | ) | | | (0.83 | ) |
| | | | | | | | | | | | | | | | | | | | |
Less Distributions | |
Distributions from net investment income | | | (0.39 | ) | | | (0.33 | ) | | | (0.28 | ) | | | (0.39 | ) | | | (0.32 | ) |
| | | | | | | | | | | | | | | | | | | | |
Total distributions | | | (0.39 | ) | | | (0.33 | ) | | | (0.28 | ) | | | (0.39 | ) | | | (0.32 | ) |
| | | | | | | | | | | | | | | | | | | | |
Net Asset Value, End of Period | | $ | 11.91 | | | $ | 14.25 | | | $ | 11.73 | | | $ | 11.91 | | | $ | 12.43 | |
| | | | | | | | | | | | | | | | | | | | |
Total Return (%) (c) | | | (14.08 | ) | | | 24.60 | | | | 1.00 | | | | (1.28 | ) | | | (6.27 | ) |
|
Ratios/Supplemental Data | |
Gross ratio of expenses to average net assets (%) | | | 0.63 | | | | 0.62 | | | | 0.63 | | | | 0.65 | | | | 0.65 | |
Net ratio of expenses to average net assets (%) (d) | | | 0.63 | | | | 0.62 | | | | 0.63 | | | | 0.65 | | | | 0.65 | |
Ratio of net investment income to average net assets (%) | | | 2.49 | | | | 2.36 | | | | 2.69 | (b) | | | 2.37 | | | | 3.14 | |
Portfolio turnover rate (%) | | | 9 | | | | 12 | | | | 12 | | | | 9 | | | | 9 | |
Net assets, end of period (in millions) | | $ | 336.3 | | | $ | 418.0 | | | $ | 390.7 | | | $ | 394.0 | | | $ | 405.3 | |
Please see following page for Financial Highlights footnote legend.
See accompanying notes to financial statements.
BHFTII-18
Brighthouse Funds Trust II
MetLife MSCI EAFE Index Portfolio
Financial Highlights
Selected per share data
| | | | | | | | | | | | | | | | | | | | |
| | | Class E | |
| | | Year Ended December 31, | |
| | | 2018 | | | 2017 | | | 2016 | | | 2015 | | | 2014 | |
Net Asset Value, Beginning of Period | | $ | 14.47 | | | $ | 11.90 | | | $ | 12.08 | | | $ | 12.60 | | | $ | 13.75 | |
| | | | | | | | | | | | | | | | | | | | |
Income (Loss) from Investment Operations | |
Net investment income (a) | | | 0.36 | | | | 0.33 | | | | 0.33 | (b) | | | 0.32 | | | | 0.44 | |
Net realized and unrealized gain (loss) | | | (2.34 | ) | | | 2.59 | | | | (0.22 | ) | | | (0.44 | ) | | | (1.26 | ) |
| | | | | | | | | | | | | | | | | | | | |
Total income (loss) from investment operations | | | (1.98 | ) | | | 2.92 | | | | 0.11 | | | | (0.12 | ) | | | (0.82 | ) |
| | | | | | | | | | | | | | | | | | | | |
Less Distributions | |
Distributions from net investment income | | | (0.40 | )�� | | | (0.35 | ) | | | (0.29 | ) | | | (0.40 | ) | | | (0.33 | ) |
| | | | | | | | | | | | | | | | | | | | |
Total distributions | | | (0.40 | ) | | | (0.35 | ) | | | (0.29 | ) | | | (0.40 | ) | | | (0.33 | ) |
| | | | | | | | | | | | | | | | | | | | |
Net Asset Value, End of Period | | $ | 12.09 | | | $ | 14.47 | | | $ | 11.90 | | | $ | 12.08 | | | $ | 12.60 | |
| | | | | | | | | | | | | | | | | | | | |
Total Return (%) (c) | | | (14.06 | ) | | | 24.78 | | | | 1.08 | | | | (1.18 | ) | | | (6.11 | ) |
|
Ratios/Supplemental Data | |
Gross ratio of expenses to average net assets (%) | | | 0.53 | | | | 0.52 | | | | 0.53 | | | | 0.55 | | | | 0.55 | |
Net ratio of expenses to average net assets (%) (d) | | | 0.53 | | | | 0.52 | | | | 0.53 | | | | 0.55 | | | | 0.55 | |
Ratio of net investment income to average net assets (%) | | | 2.58 | | | | 2.46 | | | | 2.80 | (b) | | | 2.48 | | | | 3.26 | |
Portfolio turnover rate (%) | | | 9 | | | | 12 | | | | 12 | | | | 9 | | | | 9 | |
Net assets, end of period (in millions) | | $ | 25.2 | | | $ | 31.3 | | | $ | 29.6 | | | $ | 31.3 | | | $ | 34.3 | |
| |
| | | Class G | |
| | | Year Ended December 31, | |
| | | 2018 | | | 2017 | | | 2016 | | | 2015 | | | 2014 | |
Net Asset Value, Beginning of Period | | $ | 14.16 | | | $ | 11.66 | | | $ | 11.84 | | | $ | 12.36 | | | $ | 13.51 | |
| | | | | | | | | | | | | | | | | | | | |
Income (Loss) from Investment Operations | |
Net investment income (a) | | | 0.33 | | | | 0.30 | | | | 0.30 | (b) | | | 0.29 | | | | 0.41 | |
Net realized and unrealized gain (loss) | | | (2.27 | ) | | | 2.53 | | | | (0.20 | ) | | | (0.42 | ) | | | (1.25 | ) |
| | | | | | | | | | | | | | | | | | | | |
Total income (loss) from investment operations | | | (1.94 | ) | | | 2.83 | | | | 0.10 | | | | (0.13 | ) | | | (0.84 | ) |
| | | | | | | | | | | | | | | | | | | | |
Less Distributions | |
Distributions from net investment income | | | (0.39 | ) | | | (0.33 | ) | | | (0.28 | ) | | | (0.39 | ) | | | (0.31 | ) |
| | | | | | | | | | | | | | | | | | | | |
Total distributions | | | (0.39 | ) | | | (0.33 | ) | | | (0.28 | ) | | | (0.39 | ) | | | (0.31 | ) |
| | | | | | | | | | | | | | | | | | | | |
Net Asset Value, End of Period | | $ | 11.83 | | | $ | 14.16 | | | $ | 11.66 | | | $ | 11.84 | | | $ | 12.36 | |
| | | | | | | | | | | | | | | | | | | | |
Total Return (%) (c) | | | (14.12 | ) | | | 24.54 | | | | 0.97 | | | | (1.31 | ) | | | (6.33 | ) |
|
Ratios/Supplemental Data | |
Gross ratio of expenses to average net assets (%) | | | 0.68 | | | | 0.67 | | | | 0.68 | | | | 0.70 | | | | 0.70 | |
Net ratio of expenses to average net assets (%) (d) | | | 0.68 | | | | 0.67 | | | | 0.68 | | | | 0.70 | | | | 0.70 | |
Ratio of net investment income to average net assets (%) | | | 2.42 | | | | 2.29 | | | | 2.63 | (b) | | | 2.32 | | | | 3.10 | |
Portfolio turnover rate (%) | | | 9 | | | | 12 | | | | 12 | | | | 9 | | | | 9 | |
Net assets, end of period (in millions) | | $ | 100.5 | | | $ | 116.3 | | | $ | 98.6 | | | $ | 93.1 | | | $ | 90.7 | |
| | | | | | | | | | | | |
| (a) | | | | Per share amounts based on average shares outstanding during the period. |
| (b) | | | | Net investment income per share and the ratio of net investment income to average net assets include anon-recurring refund for overbilling of prior years’ custodianout-of-pocket fees which amounted to less than $0.01 per share and 0.04% of average net assets, respectively. |
| (c) | | | | Total return does not reflect any insurance, sales, separate account or administrative charges of variable annuity or life insurance contracts or any additional expenses that contract owners may bear under their variable contracts. If these charges were included, the returns would be lower. |
| (d) | | | | Includes the effects of management fee waivers (see Note 6 of the Notes to Financial Statements). |
See accompanying notes to financial statements.
BHFTII-19
Brighthouse Funds Trust II
MetLife MSCI EAFE Index Portfolio
Notes to Financial Statements—December 31, 2018
1. Organization
Brighthouse Funds Trust II (the “Trust”) is organized as a Delaware statutory trust and registered under the Investment Company Act of 1940, as amended (the “1940 Act”), as anopen-end management investment company. The Trust, which is managed by Brighthouse Investment Advisers, LLC (“Brighthouse Investment Advisers” or the “Adviser”), currently offers twenty-nine series, each of which operates as a distinct investment vehicle of the Trust. The series included in this report is MetLife MSCI EAFE Index Portfolio (the “Portfolio”), which is diversified. Shares of the Portfolio are not offered directly to the general public and are currently available only to separate accounts of insurance companies, including insurance companies affiliated with the Adviser (together, the “Insurance Companies”).
The Portfolio has registered and offers four classes of shares: Class A, B, E and G shares. Shares of each Class of the Portfolio represent an equal pro rata interest in the Portfolio and generally give the shareholder the same voting, dividend, liquidation, and other rights. Investment income, realized and unrealized capital gains and losses, the common expenses of the Portfolio, and certain Portfolio-level expense reductions, if any, are allocated on a pro rata basis to each Class based on the relative net assets of each Class to the net assets of the Portfolio. Each Class of shares differs in its respective distribution plan and such distribution expenses are allocated to the corresponding Class of shares.
2. Significant Accounting Policies
The preparation of financial statements in conformity with accounting principles generally accepted in the United States of America (“GAAP”) requires management to make estimates and assumptions that affect the reported amounts of assets and liabilities and disclosure of contingent assets and liabilities as of the date of the financial statements and the reported amounts of income and expenses during the reporting period. Actual results could differ from those estimates. In the preparation of these financial statements, management has evaluated events and transactions subsequent to December 31, 2018 through the date the financial statements were issued.
The Portfolio is an investment company and follows the accounting and reporting guidance of the Financial Accounting Standards Board (“FASB”) Accounting Standards Codification Topic 946—Financial Services—Investment Companies. The following is a summary of significant accounting policies consistently followed by the Portfolio in the preparation of its financial statements.
Investment Valuation and Fair Value Measurements - The Portfolio values its portfolio investments for purposes of calculating its net asset value (“NAV”) using procedures approved by the Board of Trustees of the Trust (the “Board” or “Trustees”). Those procedures allow for a variety of methodologies to be used to value the Portfolio’s investments. The specific methodologies used for a particular investment may vary based on the market data available for a specific investment at the time the Portfolio calculates its NAV or based on other considerations. The procedures also permit a level of judgment to be used in the valuation process. The Portfolio follows the accounting and reporting guidance of FASB Accounting Standards Codification Topic 820—Fair Value Measurement.
Domestic and foreign equity securities, such as common stock, exchange-traded funds, rights, warrants, and preferred stock, that are traded on a securities exchange on a valuation date are generally valued at their last quoted sale price or official closing price on the primary exchange for such security, or, if no sales occurred on that day, at the last reported bid price. Equity securities tradedover-the-counter (“OTC”) are generally valued at the last reported bid price. In the event of a major exchange closing during the trading day, the Adviser may use other market information obtained from quotation reporting systems, established market makers, or pricing services in valuing the securities. Valuation adjustments may be applied to certain foreign equity securities that are traded solely on foreign exchanges that close before the time as of which the Portfolio determines its NAV to account for the market movement between the close of the foreign exchanges and the time as of which the Portfolio determines its NAV. The Portfolio may use a systematic fair valuation model provided by a pricing service to value securities principally traded in these foreign markets in order to adjust for possible market movements or other changes that may occur between the close of the foreign exchanges and the time as of which the Portfolio determines its NAV. Foreign equity securities valued using these valuation adjustments are generally categorized as Level 2 within the fair value hierarchy. Equity securities that are actively traded, and have no valuation adjustments applied, are categorized as Level 1 within the fair value hierarchy. Other equity securities traded on inactive markets, or valued in reference to similar instruments traded on active markets, are generally categorized as Level 2 within the fair value hierarchy.
Investments in registeredopen-end management investment companies are valued at reported NAV per share on the valuation date and are categorized as Level 1 within the fair value hierarchy.
Debt securities, including corporate, convertible and municipal bonds and notes; obligations of the U.S. Treasury and U.S. government agencies; foreign sovereign issues; andnon-U.S. bonds, are generally valued on the basis of evaluated or composite bid quotations obtained from independent pricing services and/or brokers and dealers selected by the Adviser (each a “pricing service”), pursuant to the authorization of and subject to general oversight by the Board. Such pricing services may use matrix pricing, which considers observable inputs including, among other things, issuer details, maturity dates, interest rates, yield curves, rates of prepayment, credit risks/spreads, default rates, reported trades, broker-dealer quotes and quoted prices for similar assets. Short-term obligations with a remaining maturity of sixty days or less may be valued at amortized cost in the absence of market quotes, so long as the amortized cost
BHFTII-20
Brighthouse Funds Trust II
MetLife MSCI EAFE Index Portfolio
Notes to Financial Statements—December 31, 2018—(Continued)
value of such short-term debt instrument is approximately the same as the fair value of the instrument as determined without the use of amortized cost valuation. Floating rate loans are generally valued on the basis of an evaluated or composite average of aggregate bid and ask quotations supplied by brokers or dealers, as obtained from the pricing service. Securities that use similar valuation techniques and inputs as described above are generally categorized as Level 2 within the fair value hierarchy.
Options, whether on securities, indices, futures contracts, or otherwise, traded on exchanges are valued at the last sale price available as of the close of business on a valuation day or, if there is no such price available, at the last reported bid price. These types of options are categorized as Level 1 within the fair value hierarchy. Futures contracts that are traded on commodity exchanges are valued at their settlement prices established by the exchanges on which they are traded as of the close of such exchanges and are categorized as Level 1 within the fair value hierarchy.
If no current market value quotation or other observable inputs are readily available or market value quotations are deemed to be unreliable for an investment, the fair value of the investment will be determined in accordance with procedures approved by, and under the general supervision of, the Board. In such a circumstance, the Board will be assisted in its responsibility to determine the fair value of an investment by the Valuation Committee (“Committee”) of Brighthouse Investment Advisers. The Committee provides general pricing oversight and fair value pricing determinations related to portfolio securities and meets on a regular basis to review reports relating to the valuation of the securities in the Portfolio. The Board has delegated to State Street Bank and Trust Company, the Trust’s custodian (“Custodian”), the responsibility for calculating the NAVs of the Trust’s Portfolios. The Committee is responsible for overseeing the calculation of the NAVs of the Portfolios by the custodian. The Committee also periodically reviews pricing services, including the pricing services providing fair value pricing for the Portfolio’s foreign securities, and is responsible for overseeing the correction of pricing errors and addressing other pricing issues that arise in the ordinary course of business, such as making real-time fair value determinations, as necessary.
No single standard for determining the fair value of an investment can be set forth because fair value depends upon the facts and circumstances with respect to each investment. Information relating to any relevant factors may be obtained by the Committee from any appropriate source, including the subadviser of the Portfolio, the custodian, a pricing service, market maker and/or broker for such security or the issuer. Appropriate methodologies for determining fair value under particular circumstances may include: matrix pricing, a discounted cash flow analysis, comparisons of securities with comparable characteristics, value based on multiples of earnings, discount from market price of similar marketable securities, or a combination of these and other methods.
Investment Transactions and Related Investment Income - Portfolio security transactions are recorded on the trade date. Dividend income is recorded on theex-dividend date or, for certain foreign securities, when notified. Interest income, which includes amortization of premium and accretion of discount on debt securities, is recorded on the accrual basis. Realized gains and losses on investments are determined on the identified cost basis, which is the same basis used for federal income tax purposes. Foreign income and foreign capital gains on some foreign securities may be subject to foreign taxes, which are accrued as applicable. These foreign taxes have been provided for in accordance with the Portfolio’s understanding of the applicable countries’ tax rules and rates.
Foreign Currency Translation -The books and records of the Portfolio are maintained in U.S. dollars. The values of securities, currencies, and other assets and liabilities denominated in currencies other than the U.S. dollar are translated into U.S. dollars based upon foreign exchange rates prevailing at the end of the period. Purchases and sales of investment securities, income, and expenses are translated on the respective dates of such transactions. Because the values of investment securities are translated at the foreign exchange rates prevailing at the end of the period, that portion of the results of operations arising from changes in exchange rates and that portion of the results of operations reflecting fluctuations arising from changes in market prices of the investment securities are not separated. Such fluctuations are included in the net realized and unrealized gain or loss on investments.
Net realized foreign exchange gains or losses arise from activity in forward foreign currency exchange contracts, sales of foreign currency, currency gains or losses realized between the trade and settlement dates on securities transactions, and the difference between the amounts of dividends, interest, and foreign withholding taxes recorded by the Portfolio and the U.S. dollar-equivalent of the amounts actually received or paid by the Portfolio. Net unrealized foreign exchange gains and losses arise from changes in the value of assets and liabilities, other than investment securities, resulting from changes in foreign exchange rates.
Dividends and Distributions to Shareholders -The Portfolio records dividends and distributions on theex-dividend date. Net realized gains from securities transactions (if any) are generally distributed annually to shareholders. The timing and characterization of certain income and capital gains distributions are determined in accordance with federal tax regulations that may differ from GAAP. Permanent book and tax basis differences relating to shareholder distributions will result in reclassification between distributable earnings (accumulated losses) andpaid-in surplus. These adjustments have no impact on net assets or the results of operations.
Income Taxes -It is the Portfolio’s policy to comply with the requirements of the Internal Revenue Code of 1986, as amended, and regulations thereunder, applicable to regulated investment companies, and to distribute, with respect to each taxable year, all of its taxable income to shareholders. Therefore, no federal income tax provision is required. The Portfolio files U.S. federal tax returns. No
BHFTII-21
Brighthouse Funds Trust II
MetLife MSCI EAFE Index Portfolio
Notes to Financial Statements—December 31, 2018—(Continued)
income tax returns are currently under examination. The Portfolio’s federal tax returns for the prior three fiscal years remain subject to examination by the Internal Revenue Service. As of December 31, 2018, the Portfolio had no uncertain tax positions that would require financial statement recognition, or derecognition or disclosure.
Repurchase Agreements -The Portfolio may enter into repurchase agreements, under the terms of a Master Repurchase Agreement (“MRA”), with selected commercial banks and broker-dealers, under which the Portfolio acquires securities as collateral and agrees to resell the securities at an agreed-upon time and at an agreed-upon price. The Portfolio, through the custodian or a subcustodian, under atri-party repurchase agreement, receives delivery of the underlying securities collateralizing any repurchase agreements. It is the Portfolio’s policy that the market value of the collateral be equal to at least 100% of the repurchase price in the case of a repurchase agreement ofone-day duration and equal to at least 102% of the repurchase price in the case of all other repurchase agreements. In the event of default or failure by a party to perform an obligation in connection with any repurchase transaction, the MRA gives thenon-defaulting party the right toset-off claims and to apply property held by it in connection with any repurchase transaction against obligations owed to it.
At December 31, 2018, the Portfolio invested cash collateral for loans of portfolio securities in repurchase agreements with a gross value of $18,464,587. The value of all repurchase agreements is included as part of investments at value on the Statement of Assets and Liabilities. The value of the related collateral exceeded the value of the repurchase agreements at December 31, 2018.
Securities Lending - The Portfolio may lend its portfolio securities to certain qualified brokers who borrow securities in order to complete certain securities transactions. By lending its portfolio securities, the Portfolio attempts to increase its net investment income through the receipt of income on collateral held from securities on loan. Any gain or loss in the market price of the loaned securities that might occur and any interest earned or dividends declared during the term of the loan would accrue to the account of the Portfolio.
The Trust has entered into aNon-Custodial Securities Lending Agreement with JPMorgan Chase Bank, N.A. (the “Lending Agent”). Under the agreement, the Lending Agent is authorized to loan portfolio securities on the Portfolio’s behalf. In exchange, the Portfolio receives either cash or U.S. government securities as collateral against the loaned securities. The Portfolio receives collateral equal to at least 102% of the market value for loans secured by government securities or cash in the same currency as the loaned shares and 105% for all other loaned securities at each loan’s inception. Collateral representing at least 100% of the market value of the loaned securities is maintained for the duration of the loan. Any cash collateral received by the Portfolio is generally invested by the Lending Agent in short-term investments, which may include certificates of deposit, commercial paper, repurchase agreements, time deposits, master demand notes and money market funds. The market value of investments made with cash collateral received are disclosed in the Schedule of Investments and the valuation techniques are described in Note 2. If the market value of the collateral at the close of trading on a business day is less than 100% of the market value of the loaned securities at the close of trading on that day, the borrower is required to deliver, by the close of business on the following business day, an additional amount of collateral, so that the total amount of posted collateral is equal to at least 100% of the market value of all the loaned securities as of such preceding day. A portion of the income earned on the collateral is rebated to the borrower of the securities and the remainder is split between the Lending Agent and the Portfolio. On loans collateralized by U.S. government securities, a fee is received from the borrower and is allocated between the Portfolio and the Lending Agent.
Income received by the Portfolio in securities lending transactions during the year ended December 31, 2018 is reflected as securities lending income on the Statement of Operations. The values of any securities loaned by the Portfolio and the related collateral at December 31, 2018 are disclosed in the footnotes to the Schedule of Investments. The value of the related collateral received by the Portfolio exceeded the value of the securities out on loan at December 31, 2018.
The risks associated with lending portfolio securities include, but are not limited to, possible delays in receiving additional collateral or in the recovery of the loaned securities, possible loss of rights in the collateral should the borrower fail financially, as well as risk of loss in the value of the collateral or the value of the investments made with the collateral. The Lending Agent shall indemnify the Portfolio in the case of default of any securities borrower, subject to the terms of theNon-Custodial Securities Lending Agreement.
The following table provides a breakdown of transactions accounted for as secured borrowings, the gross obligations by the type of collateral pledged, and the remaining contractual maturities of those transactions.
| | | | | | | | | | | | | | | | | | | | |
| | | Remaining Contractual Maturity of the Agreements
As of December 31, 2018 | |
| | | Overnight and Continuous | | | Up to 30 Days | | | 31 - 90 Days | | | Greater than 90 days | | | Total | |
| Securities Lending Transactions | |
Common Stocks | | $ | (3,766,355 | ) | | $ | — | | | $ | — | | | $ | — | | | $ | (3,766,355 | ) |
Mutual Funds | | | (18,198,232 | ) | | | — | | | | — | | | | — | | | | (18,198,232 | ) |
Total | | $ | (21,964,587 | ) | | $ | — | | | $ | — | | | $ | — | | | $ | (21,964,587 | ) |
Total Borrowings | | $ | (21,964,587 | ) | | $ | — | | | $ | — | | | $ | — | | | $ | (21,964,587 | ) |
Gross amount of recognized liabilities for securities lending transactions | | | $ | (21,964,587 | ) |
| | | | | | | | | | | | | | | | | | | | |
BHFTII-22
Brighthouse Funds Trust II
MetLife MSCI EAFE Index Portfolio
Notes to Financial Statements—December 31, 2018—(Continued)
3. Investments in Derivative Instruments
Futures Contracts - The Portfolio may buy and sell futures contracts as a hedge, to maintain investment exposure to a target asset class or to enhance return. The Portfolio may be subject to fluctuations in equity prices, interest rates, commodity prices, and foreign currency exchange rates in the normal course of pursuing its investment objective. Futures contracts are standardized agreements to buy or sell a security, or deliver a final cash settlement price in connection with an index, interest rate, currency, or other asset. The Portfolio must deposit an amount (“initial margin”) equal to a certain percentage of the face value of the futures contract. The initial margin may be in the form of cash or securities, which is returned when the Portfolio’s obligations under the contract have been satisfied. If cash is deposited as the initial margin, it is shown as cash collateral on the Statement of Assets and Liabilities. Futures contracts aremarked-to-market daily and subsequent payments (“variation margin”) are made or received by the Portfolio depending on whether unrealized gains or losses are incurred. These amounts are reflected as receivables or payables on the Statement of Assets and Liabilities and as a component of net change in unrealized appreciation/depreciation on the Statement of Operations. When the contract is closed or expires, the Portfolio records a realized gain or loss equal to the difference between the value of the contract at the time it was opened and the value at the time it was closed. Risks of entering into futures contracts (and related options) include the possibility that the market for these instruments may be illiquid and that a change in the value of the contract or option may not correlate perfectly with changes in the value of the underlying instrument. If futures contracts areexchange-traded, the exchange’s clearinghouse, as counterparty to all exchange-traded futures, guarantees the futures contracts against default. For OTC futures, the Portfolio’s ability to terminate the positions may be more limited than in the case of exchange-traded positions and may also involve the risk that securities dealers participating in such transactions would fail to meet their obligations to the Portfolio.
The following table summarizes the fair value of derivatives held by the Portfolio at December 31, 2018 by category of risk exposure:
| | | | | | |
| | | Liability Derivatives | |
Risk Exposure | | Statement of Assets &
Liabilities Location | | Fair Value | |
Equity | | Unrealized depreciation on futures contracts (a) | | $ | 204,691 | |
| | | | | | |
| | | | |
| (a) | | Includes cumulative appreciation/depreciation of futures contracts as reported in the Schedule of Investments. Only the current day’s variation margin is reported within the Statement of Assets and Liabilities. |
The following tables summarize the effect of derivative instruments on the Statement of Operations, classified by derivative type and category of risk exposure, for the year ended December 31, 2018:
| | | | |
Statement of Operations Location—Net Realized Gain (Loss) | | Equity | |
Futures contracts | | $ | (1,896,353 | ) |
| | | | |
| |
Statement of Operations Location—Net Change in Unrealized Appreciation (Depreciation) | | Equity | |
Futures contracts | | $ | (327,149 | ) |
| | | | |
For the year ended December 31, 2018, the average notional par or face amount outstanding for each derivative type was as follows:
| | | | | | |
Derivative Description | | Average
Notional Par or
Face Amount‡ | |
Futures contracts long | | $ | 7,008 | |
| | | | |
| ‡ | | Averages are based on activity levels during the period for which the amounts are outstanding. |
4. Certain Risks
In the normal course of business, the Portfolio invests in securities and enters into transactions where risks exist. Those risks include:
Market Risk: The value of securities held by the Portfolio may decline in response to certain events, including those directly involving the issuers whose securities are owned by the Portfolio; conditions affecting the general economy; overall market changes; local, regional or global political, social or economic instability; and currency, interest rate, and price fluctuations.
Credit and Counterparty Risk: The Portfolio may be exposed to counterparty risk, or the risk that an entity with which the Portfolio has unsettled or open transactions may default. The potential loss could exceed the value of the financial assets and liabilities recorded in the financial statements. Financial assets that potentially expose the Portfolio to credit and counterparty risk consist principally of cash due from counterparties and investments. The Portfolio manages counterparty risk by entering into agreements only with counterparties that it believes have the financial resources to honor their obligations and by monitoring the financial
BHFTII-23
Brighthouse Funds Trust II
MetLife MSCI EAFE Index Portfolio
Notes to Financial Statements—December 31, 2018—(Continued)
stability of those counterparties. The Adviser attempts to mitigate counterparty risk by (i) periodically assessing the creditworthiness of its trading partners, (ii) monitoring and/or limiting the amount of its net exposure to each individual counterparty based on its assessment, and (iii) requiring collateral from the counterparty for certain transactions. In order to preserve certain safeguards fornon-standard settlement trades, the Portfolio restricts its exposure to credit and counterparty losses by entering into master netting agreements (“Master Agreements”) with counterparties (approved brokers) with whom it undertakes a significant volume of transactions. Master Agreements govern the terms of certain transactions, and reduce the counterparty risk associated with relevant transactions by specifying credit protection mechanisms and providing standardization that improves legal certainty. Master Agreements can also help limit counterparty risk by specifying collateral posting arrangements atpre-arranged exposure levels.
Repurchase and reverse repurchase agreements are primarily executed under Global Master Repurchase Agreements (“GMRAs”) or Master Repurchase Agreements (“MRAs”), which provide the rights toset-off. Each repurchase and reverse repurchase agreement is initially collateralized at the transaction level. In the event of default, the total market value exposure will be offset against collateral exchanged to date, which would result in a net receivable/(payable) that would be due from/to the counterparty.
Customer Account Agreements and related addenda govern cleared derivatives transactions such as futures, options on futures, and cleared OTC derivatives. Cleared derivative transactions require posting of initial margin as determined by each relevant clearing agency, which is segregated at a broker account registered with the Commodities Futures Trading Commission (“CFTC”), or the applicable regulator. In the U.S., counterparty risk is significantly reduced as creditors of the futures broker do not have claim to portfolio assets in the segregated account. Additionally, portability of exposure in the event of default further reduces risk to the Portfolio. Variation margin, or changes in market value, are exchanged daily, but may not be netted between futures and cleared OTC derivatives.
Foreign Investment Risk:The investments by the Portfolio in foreign securities may involve risks not present in domestic investments. Because securities may be denominated in foreign currencies, may require settlement in foreign currencies and may pay interest or dividends in foreign currencies, changes in the relationship of these foreign currencies to the U.S. dollar can significantly affect the value of the investments and earnings of the Portfolio. Foreign investments may also subject the Portfolio to foreign government exchange restrictions, expropriation, taxation or other political, social or economic developments, all of which could affect the market and/or credit risk of the investments. In addition to the risks described above, risks may arise from forward foreign currency contracts with respect to the potential inability of counterparties to meet the terms of their contracts.
Additional risks associated with each type of investment are described above within the respective security type notes. The Portfolio’s prospectus includes a discussion of the principal risks of investing in the Portfolio.
5. Investment Transactions
Aggregate cost of purchases and proceeds of sales of investment securities, excluding short-term securities, for the year ended December 31, 2018 were as follows:
| | | | | | | | | | | | |
Purchases | | | Sales | |
U.S. Government | | Non-U.S. Government | | | U.S. Government | | | Non-U.S. Government | |
| $ 0 | | $ | 97,610,672 | | | $ | 0 | | | $ | 101,271,971 | |
6. Investment Management Fees and Other Transactions with Affiliates
Investment Management Agreement -Brighthouse Investment Advisers is the investment adviser to the Portfolio. The Trust has entered into an investment management agreement with Brighthouse Investment Advisers with respect to the Portfolio. For providing investment management services to the Portfolio, Brighthouse Investment Advisers receives monthly compensation at the annual rate of 0.300% of average daily net assets. Fees earned by Brighthouse Investment Advisers with respect to the Portfolio for the year ended December 31, 2018 were $3,265,624.
Brighthouse Investment Advisers has entered into an investment subadvisory agreement with MetLife Investment Advisors, LLC (“MIA”) with respect to managing the Portfolio. For providing subadvisory services to the Portfolio, Brighthouse Investment Advisers has agreed to pay MIA an investment subadvisory fee for each class of the Portfolio as follows:
| | |
% per annum | | Average Daily Net Assets |
| 0.050% | | On the first $500 million |
| 0.040% | | Of the next $500 million |
| 0.020% | | On amounts over $1 billion |
Fees earned by MIA with respect to the Portfolio for the year ended December 31, 2018 were $467,153.
BHFTII-24
Brighthouse Funds Trust II
MetLife MSCI EAFE Index Portfolio
Notes to Financial Statements—December 31, 2018—(Continued)
Management Fee Waiver - Pursuant to a management fee waiver agreement, the Adviser has agreed, for the period April 30, 2018 to April 30, 2019, to reduce its advisory fees set out above under “Investment Management Agreement” for each class of the Portfolio as follows:
| | |
% per annum | | Average Daily Net Assets |
| 0.005% | | Over $500 million and under $1 billion |
| 0.010% | | Of the next $1 billion |
| 0.015% | | On amounts over $2 billion |
An identical agreement was in place for the period May 1, 2017 to April 30, 2018. Amounts waived for the year ended December 31, 2018 are shown as a management fee waiver in the Statement of Operations.
Certain officers and trustees of the Trust may also be officers of Brighthouse Investment Advisers; however, such officers and trustees receive no compensation from the Trust.
Transfer Agency Agreement -Brighthouse Financial, Inc. serves as the transfer agent for the Trust. Brighthouse Financial, Inc. receives no fees for its services to the Trust.
Distribution and Service Fees -The Trust has a distribution agreement with Brighthouse Securities, LLC (the “Distributor”) pursuant to which the Distributor serves as the general distributor of shares of each class (each a “Class”) of each Portfolio. The Distributor is an affiliate of the Trust. The Trust has adopted a Distribution and Services Plan (the “Plan”) relating to Class B, Class E and Class G shares of each Portfolio, under Rule 12b-1 under the 1940 Act, pursuant to which the Trust may pay the Distributor a fee (the “Service Fee”) at an annual rate not to exceed 0.25% of each such Portfolio’s average daily net assets attributable to the Class B, Class E and Class G shares of the Trust. Each Portfolio may not offer shares of each Class. The Plan also authorizes the Trust, on behalf of each of its Portfolios, may pay the Distributor a distribution Fee (the “Distribution Fee” and together with the Service Fee, the “Fees”) at an annual rate of up to 0.25% of each Portfolio’s average daily net assets attributable to the Class B, Class E and Class G shares in consideration of the services rendered in connection with the sale of such shares by the Distributor. Under the Distribution Agreement with respect to the Trust, Fees are currently paid at an annual rate of 0.25% of average daily net assets in the case of Class B shares, 0.15% of average daily net assets in the case of Class E shares and 0.30% of average daily net assets in the case of Class G shares. The Plan is known as a “compensation plan” because the Trust makes payments to the Distributor for services rendered regardless of the actual level of expenditures by the Distributor. Amounts incurred by the Portfolio for the year ended December 31, 2018 are shown as Distribution and service fees in the Statement of Operations.
Deferred Trustee Compensation - Each Trustee who is not currently an employee of the Adviser or any of its affiliates receives compensation from the Trust for his or her service to the Trust. A deferred compensation plan (the “Plan”) is available to the Trustees on a voluntary basis. Deferred amounts remain in the Trust until distributed in accordance with the provisions of the Plan. The value of a participating Trustee’s deferral account is based on theoretical investments of deferred amounts on the normal payment dates in certain portfolios of the Trust or Brighthouse Funds Trust I, an affiliate of the Trust, as designated by the participating Trustee. Changes in the value of participants’ deferral accounts are reflected as Trustees’ fees and expenses in the Statement of Operations. The portion of the accrued obligations allocated to the Portfolio under the Plan is reflected as Deferred trustees’ fees in the Statement of Assets and Liabilities.
7. Contractual Obligations
Under the Trust’s organizational documents, its officers and Trustees may be indemnified against certain liabilities and expenses arising out of the performance of their duties to the Trust. Additionally, the Trust has a variety of indemnification obligations under contracts with its service providers. The Trust’s maximum exposure under these arrangements is unknown, as this would involve future claims that may be made against the Trust that have not yet occurred.
8. Income Tax Information
The cost basis of investments for federal income tax purposes at December 31, 2018 was as follows:
| | | | |
Cost basis of investments | | $ | 955,553,805 | |
| | | | |
Gross unrealized appreciation | | | 188,307,703 | |
Gross unrealized depreciation | | | (164,297,083 | ) |
| | | | |
Net unrealized appreciation (depreciation) | | $ | 24,010,620 | |
| | | | |
BHFTII-25
Brighthouse Funds Trust II
MetLife MSCI EAFE Index Portfolio
Notes to Financial Statements—December 31, 2018—(Continued)
The tax character of distributions paid for the years ended December 31, 2018 and 2017 were as follows:
| | | | | | | | | | | | | | | | | | | | |
Ordinary Income | | | Long-Term Capital Gain | | | Total | |
2018 | | 2017 | | | 2018 | | | 2017 | | | 2018 | | | 2017 | |
| $31,435,277 | | $ | 28,625,989 | | | $ | — | | | $ | — | | | $ | 31,435,277 | | | $ | 28,625,989 | |
As of December 31, 2018, the components of distributable earnings (accumulated losses) on a federal income tax basis were as follows:
| | | | | | | | | | | | | | | | |
Undistributed
Ordinary
Income | | Undistributed
Long-Term
Capital Gain | | | Net
Unrealized
Appreciation | | | Accumulated
Capital Losses | | | Total | |
| $26,231,044 | | $ | 7,352,775 | | | $ | 23,990,742 | | | $ | — | | | $ | 57,574,561 | |
The Portfolio utilizes the provisions of the federal income tax laws that provide for the carryforward of capital losses for prior years, offsetting such losses against any future realized capital gains. Under the Regulated Investment Company Modernization Act of 2010, net capital losses recognized after December 22, 2010 may be carried forward indefinitely and their character is retained as short-term and/or long-term losses.
During the year ended December 31, 2018, the Portfolio utilized capital loss carryforwards of $3,109,329.
As of December 31, 2018, the Portfolio had no accumulated capital losses.
9. Recent Accounting Pronouncements and SEC Update
In August 2018, the FASB issued Accounting Standards Update 2018-13, Fair Value Measurement (Topic 820)—Disclosure Framework—Changes to the Disclosure Requirements for Fair Value Measurement (“ASU 2018-13”) which introduces new fair value disclosure requirements as well as eliminates and modifies certain existing fair value disclosure requirements. ASU 2018-13 is effective for fiscal years beginning after December 15, 2019, and interim periods within those fiscal years. Early adoption is permitted and, as such, management has elected to early adopt ASU 2018-13 effective with the current reporting period. The impact of the Portfolio’s adoption was limited to changes in the Portfolio’s financial statement disclosures regarding fair value, primarily those disclosures related to transfers between levels of the fair value hierarchy.
In August 2018, the Securities and Exchange Commission released its Final Rule on Disclosure Update and Simplification (the “Final Rule”) which is intended to simplify an issuer’s disclosure compliance efforts by removing redundant or outdated disclosures requirements without significantly altering the mix of information provided to investors. Effective with the current reporting period, the Portfolio adopted the Final Rule with the most notable impacts being that the Portfolio is no longer required to present the components of distributable earnings on the Statement of Assets and Liabilities or the sources of distributions to shareholders and the amounts of undistributed net investment income on the Statements of Changes in Net Assets.
BHFTII-26
Brighthouse Funds Trust II
MetLife MSCI EAFE Index Portfolio
Report of Independent Registered Public Accounting Firm
To the Shareholders of MetLife MSCI EAFE Index Portfolio and the Board of Trustees of Brighthouse Funds Trust II:
Opinion on the Financial Statements and Financial Highlights
We have audited the accompanying statement of assets and liabilities, including the schedule of investments, of the MetLife MSCI EAFE Index Portfolio (the “Portfolio”), one of the portfolios constituting the Brighthouse Funds Trust II, as of December 31, 2018, the related statement of operations for the year then ended, the statements of changes in net assets for each of the two years in the period then ended, the financial highlights for each of the five years in the period then ended, and the related notes. In our opinion, the financial statements and financial highlights present fairly, in all material respects, the financial position of the MetLife MSCI EAFE Index Portfolio of the Brighthouse Funds Trust II as of December 31, 2018, the results of its operations for the year then ended, the changes in its net assets for each of the two years in the period then ended, and the financial highlights for each of the five years in the period then ended, in conformity with accounting principles generally accepted in the United States of America.
Basis for Opinion
These financial statements and financial highlights are the responsibility of the Portfolio’s management. Our responsibility is to express an opinion on the Portfolio’s financial statements and financial highlights based on our audits. We are a public accounting firm registered with the Public Company Accounting Oversight Board (United States) (PCAOB) and are required to be independent with respect to the Portfolio in accordance with the U.S. federal securities laws and the applicable rules and regulations of the Securities and Exchange Commission and the PCAOB.
We conducted our audits in accordance with the standards of the PCAOB. Those standards require that we plan and perform the audit to obtain reasonable assurance about whether the financial statements and financial highlights are free of material misstatement, whether due to error or fraud. The Portfolio is not required to have, nor were we engaged to perform, an audit of its internal control over financial reporting. As part of our audits we are required to obtain an understanding of internal control over financial reporting but not for the purpose of expressing an opinion on the effectiveness of the Portfolio’s internal control over financial reporting. Accordingly, we express no such opinion.
Our audits included performing procedures to assess the risks of material misstatement of the financial statements and financial highlights, whether due to error or fraud, and performing procedures that respond to those risks. Such procedures included examining, on a test basis, evidence regarding the amounts and disclosures in the financial statements and financial highlights. Our audits also included evaluating the accounting principles used and significant estimates made by management, as well as evaluating the overall presentation of the financial statements and financial highlights. Our procedures included confirmation of securities owned as of December 31, 2018, by correspondence with the custodian and brokers; when replies were not received from brokers, we performed other auditing procedures. We believe that our audits provide a reasonable basis for our opinion.
/s/ Deloitte & Touche LLP
Boston, Massachusetts
February 25, 2019
We have served as the auditor of one or more of the Brighthouse investment companies since 1983.
BHFTII-27
Brighthouse Funds Trust II
Trustees and Officers
MANAGEMENT OF THE TRUSTS
The Boards of Trustees (the “Board”) of Brighthouse Funds Trust I and Brighthouse Funds Trust II (“BHF I” and “BHF II”, respectively, and collectively the “Trusts”) supervise the Trusts and are responsible for representing the interests of shareholders. The Trustees, the Chairman of the Board and the Chairmen of each subcommittee are the same for both Trusts. The Trustees of each Trust meet periodically throughout the year to oversee the Portfolios’ activities, reviewing, among other things, each Portfolio’s performance and its contractual arrangements with various service providers. The Trustees of each Trust elect the officers of the Trust, who are responsible for administering the Trust’sday-to-day operations.
Trustees and Officers
The Trustees and executive officers of the Trusts, as well as their principal occupations during the past five years, are set forth below. Unless otherwise indicated, the business address of each is c/o Brighthouse Funds, One Financial Center, Boston, Massachusetts 02111. Each Trustee who is deemed an “interested person,” as such term is defined in the 1940 Act, is referred to as an “Interested Trustee.” Those Trustees who are not “interested persons,” as such term is defined in the 1940 Act, are referred to as “Independent Trustees.” There is no limit to the term a Trustee may serve. Trustees serve until their death, resignation or removal in accordance with the BHF I Trust’s and BHF II Trust’s respective organizational documents and policies adopted by the Boards of the respective Trusts from time to time. Officers hold office at the pleasure of each Board and serve until their removal or resignation in accordance with the Trusts’ respective organizational documents and policies adopted by the Board of each Trust from time to time.
| | | | | | | | | | |
Name and Year of Birth | | Current
Position(s)
Held with
Registrant | | Term of Office
and Length of
Time Served | | Principal Occupation(s) During the Past 5 Years(1) | | Number of
Portfolios in
Brighthouse Funds
Complex(2)
Overseen
by Trustee | | Other Directorships Held
by Trustee During
the Past 5 Years(1) |
| Interested Trustee |
John Rosenthal* (1960) | | Trustee | | Indefinite;
From
May
2016
(Trust I
and
Trust II) to
present | | Chief Investment Officer, Brighthouse Financial, Inc. (2017 to present); until 2017, Senior Managing Director and Head of Global Portfolio Management, MetLife, Inc. | | 72 | | None |
|
| Independent Trustees |
Dawn M. Vroegop (1966) | | Trustee and Chairman of the Board | | Indefinite;
From
December
2000
(Trust I)/
May
2009
(Trust II)
to present
as
Trustee;
From
May
2016
(Trust I
and
Trust II)
until
present as
Chairman | | Private Investor. | | 72 | | Trustee, Driehaus Mutual Funds.** |
BHFTII-28
Brighthouse Funds Trust II
Trustees and Officers—(Continued)
| | | | | | | | | | |
Name and Year of Birth | | Current
Position(s)
Held with
Registrant | | Term of Office
and Length of
Time Served | | Principal Occupation(s) During the Past 5 Years(1) | | Number of
Portfolios in
Brighthouse Funds
Complex(2)
Overseen
by Trustee | | Other Directorships Held
by Trustee During
the Past 5 Years(1) |
Stephen M. Alderman (1959) | | Trustee | | Indefinite;
From
December
2000
(Trust I)/
April
2012
(Trust II)
to present | | Shareholder in the law firm of Garfield and Merel, Ltd. | | 72 | | None |
| | | | | |
Robert J. Boulware (1956) | | Trustee | | Indefinite;
From
March
2008
(Trust I)/
April
2012
(Trust II)
to present | | Managing Director, Pilgrim Funds, LLC (private equity fund). | | 72 | | Trustee, Vertical Capital Income Fund(closed-end fund);** Director, Gainsco, Inc. (auto insurance);** Trustee, SharesPost 100 Fund(closed-end fund).** |
| | | | | |
Susan C. Gause (1952) | | Trustee | | Indefinite;
From
March
2008
(Trust I)/
April
2012
(Trust II)
to present | | Private Investor. | | 72 | | Trustee, HSBC Funds.** |
| | | | | |
Nancy Hawthorne (1951) | | Trustee | | Indefinite;
From
May
2003
(Trust II)/
April
2012
(Trust I) to
present | | Partner, Hawthorne Financial Advisors, LLC (registered investment advisor); until 2014, Chief Executive Officer, Clerestory LLC (corporate advisor). | | 72 | | Director and Chairman of the Board of Directors, THL Credit, Inc.;** Director and Chairman of the Board, Avid Technology, Inc.;** Director, CRA International, Inc.** |
| | | | | |
Barbara A. Nugent (1956) | | Trustee | | Indefinite;
From
January
2014
(Trust I
and
Trust II) to
present | | President, True North Board Governance, LLC (consulting); until December 2013, partner in the law firm of Stradley Ronon Stevens & Young, LLP. | | 72 | | Independent Lead Trustee, BMT Investment Funds** |
| | | | | |
Christopher J. Towle (1957) | | Trustee | | Indefinite;
From
April
2018
(Trust I
and
Trust II) to
present | | Retired; until 2014, Partner, Portfolio Manager, Director of High Yield and Convertible Strategies, Lord Abbett & Co. | | 72 | | Trustee, Driehaus Mutual Funds** |
BHFTII-29
Brighthouse Funds Trust II
Trustees and Officers—(Continued)
Officers
| | | | | | |
Name and Year of Birth | | Position(s)
Held with
Registrant | | Length of
Time Served | | Principal Occupation(s)
During the Past 5 Years(1) |
| Executive Officers | | | | | | |
Kristi Slavin (1973) | | President and Chief Executive Officer, of Trust I and Trust II | | From May
2016
(Trust I
and
Trust II) to
present | | President, Brighthouse Investment Advisers, LLC (2016-present); formerly, Senior Vice President, MetLife Advisers, LLC; Vice President, MetLife, Inc.; Vice President, Trust I and Trust II(2015-2016). |
| | | |
Alan R. Otis (1971) | | Chief Financial Officer and Treasurer, of Trust I and Trust II | | From
November
2017
(Trust I
and
Trust II) to
present | | Senior Vice President, Brighthouse Investment Advisers, LLC (2017-present); formerly, Vice President, Brighthouse Investment Advisers, LLC (2012-2017); Assistant Treasurer, Trust I and Trust II(2012-2017). |
| | | |
Andrew L. Gangolf (1954) | | Secretary, of Trust I and Trust II | | From May
2011
(Trust I
and
Trust II) to
present | | Executive Vice President, Brighthouse Investment Advisers, LLC (2017-present); formerly, Senior Vice President, MetLife Advisers, LLC (2011-2017); until 2011, Senior Vice President & Assistant General Counsel, AllianceBernstein Investments, Inc. |
| | | |
Steven E. Hartstein (1963) | | Chief Compliance Officer (“CCO”), of Trust I and Trust II | | From
February
2014
(Trust I
and
Trust II) to
present | | Senior Vice President and CCO, Brighthouse Investment Advisers, LLC (2017-present); Head of Investments Compliance, Vice President, Brighthouse Financial, Inc. (2017-present); formerly, Vice President, MetLife, Inc. (2013-2017); Senior Vice President and CCO, MetLife Advisers, LLC (2013-2017.) |
| | | |
Victor Soto (1978) | | Vice President of Trust I and Trust II | | From May
2018
(Trust I
and
Trust II) to
present | | Executive Vice President, Brighthouse Investment Advisers, LLC (2016-present); Assistant Vice President, MetLife Inc. (2015-2017); Portfolio Manager, 1st Global (2013-2015). |
| * | Mr. Rosenthal is an “interested person” of the Trusts because of his position with Brighthouse Financial, Inc., the current parent company of Brighthouse Investment Advisers, LLC. |
| ** | Indicates a directorship with a registered investment company or a company subject to the reporting requirements of the Securities Exchange Act of 1934, as amended. |
| (1) | Previous positions during the past five years with the Trusts, Brighthouse Financial, Inc., MetLife, Inc. or the Manager are omitted if not materially different. |
| (2) | The Fund Complex includes 43 BHF I Portfolios and 29 BHF II Portfolios. |
BHFTII-30
Brighthouse Funds Trust II
MetLife MSCI EAFE Index Portfolio
Board of Trustees’ Consideration of Advisory and Sub-Advisory Agreements
At anin-person meeting held on November6-8, 2018 (the “November Meeting”), the Boards of Trustees (the “Board”) of Brighthouse Funds Trust I and Brighthouse Funds Trust II (“BFT I” and “BFT II,” respectively, and collectively, the “Trusts”), including a majority of the Trustees who are not “interested persons” of the Trusts (the “Independent Trustees”) under the Investment Company Act of 1940 (the “1940 Act”), approved the continuation of the Trusts’ advisory agreements (each, an “Advisory Agreement”) with Brighthouse Investment Advisers, LLC (the “Adviser”) and the applicablesub-advisory agreements (each a “Sub-Advisory Agreement,” and collectively with the Advisory Agreement, the “Agreements”) between the Adviser and the investmentsub-advisers (each a “Sub-Adviser,” and collectively, the “Sub-Advisers”) for the series of the Trusts (each a “Portfolio,” and collectively, the “Portfolios”).
In making those approvals, the Board reviewed a variety of materials that were provided for the specific purpose of the annual contract renewal process. In addition, various materials provided to and discussed with the Board throughout the year informed the Board’s decision to renew the Agreements. In particular, the information for each Portfolio included, but was not limited to, investment performance reports, and reports on expenses, legal and compliance matters, asset pricing, brokerage commissions and trade execution.
The Board met in person with personnel of the Adviser on October 17, 2018 for the specific purpose of giving preliminary consideration to the proposed continuation of the Agreements (the “October Meeting”). At that meeting, the Adviser reviewed with the Board the performance and fees experienced by each Portfolio, as well as other information. During and after the October Meeting, the Independent Trustees communicatedfollow-up matters for management to address at the November Meeting. The Independent Trustees were advised by independent legal counsel throughout the contract renewal process, and met with independent legal counsel in several executive sessions outside of the presence of management.
Information furnished and reviewed specifically in connection with the renewal process included, but was not limited to, a report for each Portfolio that was prepared by Broadridge (“Broadridge”), an independent organization. In addition, the Independent Trustees reviewed a report that was prepared by JDL Consultants, LLC (“JDL”), an independent consultant to the Independent Trustees (“JDL Report”), which examined the comparative fees, expenses and performance of each Portfolio, based upon the Broadridge reports. Also, the Board reviewed the responses to wide-ranging questions from the Independent Trustees relating to the business, operations and performance of the Adviser and theSub-Advisers that the Adviser andSub-Advisers had prepared specifically for the renewal process, and reviewed aPortfolio-by-Portfolio analysis of the profitability to the Adviser of each Advisory Agreement, which was prepared by the Adviser for the renewal process.
At the November Meeting, the Board, including a majority of the Independent Trustees, concluded that the nature, extent and quality of services provided by the Adviser and eachSub-Adviser supported the renewal of the Agreements. The Board also concluded that the investment performance of each Portfolio was such that each Agreement should continue, and that the fees paid by each Portfolio to the Adviser appeared to be reasonable in light of the nature, extent and quality of the services provided by the Adviser andSub-Adviser. Further, the Board concluded that the Adviser’s profitability in providing services under the Advisory Agreements did not appear unreasonable in light of the nature, extent and quality of the services provided by the Adviser. Finally, the Board reviewed the extent to which the investment advisory fees paid by the Portfolios shared economies of scale with investors or entailed the potential to share economies of scale with investors and concluded that those considerations generally supported the renewal of each Agreement. In approving the renewal of each of the Agreements, the Board, including the Independent Trustees, gave attention to all of the information that was furnished and each Trustee placed varying degrees of importance on the various pieces of information that were provided to them. The Board evaluated the information available to it on aPortfolio-by-Portfolio basis, and its decision was made separately with respect to each Portfolio. The following paragraphs provide more information about some of the primary factors that were relevant to the Board’s decision. The Board did not identify any single factor as determinative, and the Trustees generally attributed different weights to various factors for the various Portfolios.
Nature, extent and quality of services. The Board evaluated the nature, extent and quality of the services that the Adviser and theSub-Advisers, as relevant, have provided to the Portfolios. The Board considered the Adviser’s services as investment manager to the Portfolios, including its services relating to the hiring and oversight of theSub-Advisers, trading practices and oversight of transition management (as applicable), compliance programs and personnel, and risk management, among other things. The Adviser’s services in coordinating and overseeing the activities of the Trusts’ other service providers were also considered. The Board considered information received from the Trusts’ Chief Compliance Officer (“CCO”) regarding the Portfolios’ compliance policies and procedures that were established pursuant to Rule38a-l under the 1940 Act. The Board also noted that the Adviser’s investment, compliance and legal staff conduct regular and periodic telephonic andin-person meetings with theSub-Advisers to review and assess the services that are provided to the Portfolios, and that personnel of the Adviser prepare and present reports to the Independent Trustees regarding those meetings. In addition, throughout the year, the Board considered the expertise, experience and performance of the personnel of the Adviser who performed the various services that are mentioned above.
BHFTII-31
Brighthouse Funds Trust II
MetLife MSCI EAFE Index Portfolio
Board of Trustees’ Consideration of Advisory and Sub-Advisory Agreements—(Continued)
With respect to the services provided by each of theSub-Advisers, the Board considered a variety of information that the Adviser and eachSub-Adviser prepared for the Board’s review. The Board considered eachSub-Adviser’s investment process and philosophy, and the investment performance experienced by the Portfolio (as described in more detail below). The Board took into account that eachSub-Adviser’s responsibilities include the development and maintenance of an investment program for the applicable Portfolio that is consistent with the Portfolio’s investment objectives, the selection of investment securities and the placement of orders for the purchase and sale of such securities, as well as the implementation of compliance controls related to performance of these services. In particular, the Board considered, among other things, theSub-Adviser’s current level of staffing as well as its compensation program and its overall resources. The Board reviewed eachSub-Adviser’s history and investment experience, as well as information provided regarding the qualifications, background and responsibilities of theSub-Adviser’s investment and compliance personnel who provide services to the Portfolios. The Board also considered, among other things, eachSub-Adviser’s compliance program and regulatory and disciplinary history. In its review, the Board also took into account information regarding any services and/or payments provided to the Adviser by theSub-Advisers in connection with marketing activities and considered representations from the Adviser that those payments were not considered in the Adviser’s recommendation to renew any of theSub-Advisory Agreements.
Performance. The Board placed emphasis on the performance of each Portfolio in light of, among other things, its importance to investors. The Board considered the Adviser’s quarterly reviews with the Board of detailed information about each Portfolio’s investment strategies and performance results and composition, including discussions regarding the relevant effect of current market conditions. The Board reviewed and considered the reports prepared by Broadridge, which provided a statistical analysis comparing the Portfolios’ investment performance to that of comparable funds underlying variable insurance products (the “Performance Universe”). The Independent Trustees also met separately with representatives of JDL during the October Meeting to review the JDL Report. The Board also compared the performance records of the Portfolios to those of comparable funds and other accounts that were managed by the relevantSub-Adviser, to the extent such information was available. The Board considered each Portfolio’s performance for periods subsequent to the performance period covered by the Broadridge reports, and the Adviser’s discussion of the same, including the effect of current market conditions on each Portfolio’s more recent performance. The Board also noted that while it found the data provided by Broadridge generally useful, it recognized the limitations of such data, including, in particular, that notable differences may exist between a Portfolio and those of the other funds in a Broadridge category (for example, the investment objectives(s) and investment strategies) and that the results of the performance comparisons may vary depending on (i) the end dates for the performance periods that were selected and (ii) the selection of the peer groups.
The Board focused particular attention on Portfolios with less favorable performance records. The Board noted the Adviser’s focus on eachSub-Adviser’s performance and that the Adviser has been active in monitoring and responding to any performance issues with respect to the Portfolios.
Fees and Expenses. The Board gave consideration to the level and method of computing the fees payable under the Agreements. The Board considered the Broadridge report for each of the Portfolios, which included comparisons for each Portfolio of its contractual management andsub-adviser fees (at current and various asset levels), and total expenses, with those of its peers, including as those peers were divided into a broad group of peer funds (“Expense Universe”), a narrower group of peer funds (“Expense Group”), a broad group of peersub-advised funds (“Sub-advised Expense Universe”), and a narrower group of peersub-advised funds (“Sub-advised Expense Group”). Broadridge selected the peer funds which were similarly situated funds underlying variable insurance products deemed to be comparable to the Portfolios. The Independent Trustees, with the assistance of JDL, also examined the JDL Report. The Board compared the fee payable to aSub-Adviser by the Adviser with respect to the Portfolio to the fee payable to theSub-Adviser by other comparable funds and other accounts, to the extent such information was available.
The Board noted that thesub-advisory fees for the Portfolios are paid by the Adviser out of the advisory fees, and that the Adviser negotiates the fees at arm’s length. The Board also considered that the Adviser had entered into expense limitation or management fee waiver agreements with certain of the Portfolios pursuant to which the Adviser had agreed to waive a portion of its advisory fee and/or reimburse certain expenses as a means of limiting a Portfolio’s total annual operating expenses.
Profitability. The Board examined the profitability to the Adviser of each Advisory Agreement, on aPortfolio-by-Portfolio basis. The Board also considered that an affiliate of the Adviser, Brighthouse Securities, LLC, serves as distributor for the Trusts, and, as such, receives Rule12b-1 payments to support the distribution of the Portfolios. The Board considered the profitability to theSub-Advisers and their affiliates as a result of their relationships with the Portfolios, to the extent available, and the Board considered the ability of the Adviser to negotiate with aSub-Adviser at arm’s length. In reviewing the profitability analyses, the Board recognized that expense allocation methodologies are inherently subjective and various expense allocation methodologies may be reasonable while producing different results.
BHFTII-32
Brighthouse Funds Trust II
MetLife MSCI EAFE Index Portfolio
Board of Trustees’ Consideration of Advisory and Sub-Advisory Agreements—(Continued)
Economies of scale. The Board also considered each Portfolio’s fees in light of its size. The Board noted the fee schedules for the Portfolios that contain breakpoints that reduce the fee rate above specified asset levels. The Board noted those Portfolios that did not have breakpoints in their advisory fee and took into account management’s discussion of the same. The Board noted that those Portfolios with Advisory Agreements containing breakpoints generally have breakpoints in the correspondingSub-Advisory Agreement. The Board considered the effective fees under the Advisory Agreement andSub-Advisory Agreement for each Portfolio as a percentage of assets at different asset levels and possible economies of scale that may be realized if the assets of the Portfolio grow. The Board examined, among other data, the effect of a Portfolio’s growth in size, and reduction in size, on various fee schedules and the Board reviewed the Broadridge and JDL Reports, which compared fees among peers. The Board also generally noted that if a Portfolio’s assets increase over time, the Portfolio may realize other economies of scale if assets increase proportionally more than certain other fixed expenses.
Other factors. The Board considered other benefits that may be realized by the Adviser and its affiliates from their relationship with the Trusts. Among them, the Board recognized that Brighthouse Securities, LLC, as the distributor for the Trusts, receives payments pursuant to Rule12b-1 from the Portfolios to compensate for the provision of shareholder services and distribution activities, which could lead to growth in the Trusts’ assets and corresponding benefits from such growth, including economies of scale. The Board considered other benefits that may be realized by eachSub-Adviser and its affiliates from their relationship with the Trusts, including the opportunity to provide advisory services to additional portfolios of the Trusts and reputational benefits. In conjunction with these considerations, the Board noted the ongoing commitment of the Adviser to the Portfolios.
The Board requested, received, and considered information from the Adviser regarding possible conflicts of interest in the form of material benefits to the Adviser resulting from the Adviser’s affiliations and business relationships, as relevant. The Board considered the services that are provided to the Trusts by its service providers, and the manner in which any conflicts were mitigated.
* * *
MetLife MSCI EAFE Index Portfolio. The Board also considered the following information in relation to the Agreements with the Adviser and MetLife Investment Advisors, LLC regarding the Portfolio:
Among other data relating specifically to the Portfolio’s performance, the Board considered that the Portfolio outperformed the median of its Performance Universe and the average of its Morningstar Category for theone-, three- and five-year periods ended June 30, 2018. The Board took into account that the Portfolio underperformed its benchmark, the MSCI EAFE Index, for theone-, three- and five-year periods ended September 30, 2018.
The Board also considered that the Portfolio’s actual management fees were equal to the Expense Group median, and above the Expense Universe median andSub-advised Expense Universe median. The Board considered that the Portfolio’s total expenses (exclusive of12b-1 fees) were equal to the Expense Group median, below the Expense Universe median, and above theSub-advised Expense Universe median. The Board further noted that the Portfolio’s contractual management fees were below the asset-weighted average of comparable funds selected by Broadridge at the Portfolio’s current size. The Board also noted that the Portfolio’s contractualsub-advisory fees were below the averages of theSub-advised Expense Group and theSub-advised Expense Universe at the Portfolio’s current size.
BHFTII-33
Brighthouse Funds Trust II
MetLife Russell 2000 Index Portfolio
Managed by MetLife Investment Advisors, LLC
Portfolio Manager Commentary*
PERFORMANCE
For the 12 months ended December 31, 2018, the Class A, B, E, and G shares of the MetLife Russell 2000 Index Portfolio returned-10.97%,-11.18%,-11.08%, and-11.20%, respectively. The Portfolio’s benchmark, the Russell 2000 Index1, returned-11.01%.
MARKET ENVIRONMENT / CONDITIONS
Equity markets ended the period down with outperformance in the middle of the year bracketed by underperformance during the first and fourth quarters. The main concerns during the year were slowing global growth, political unrest in Europe, a more hawkish Federal Reserve (the “Fed”), and continued fears about a global trade war. Equity markets were impacted as the10-year Treasury yield reached its highest level since 2014, which was driven by a more hawkish Fed and higher than expected wage growth. Equity markets also feared the impact of President Trump’s plan to impose tariffs on steel and aluminum imports and Fed Chair Powell’s Congressional testimony during the first quarter where he hinted at the possibility of four rate hikes during the year. Other issues equity investors were concerned about included unrest in the Middle East, political uncertainty in Italy, and the U.S. withdrawal from the Iran nuclear deal. In the middle of the year, equity markets rallied as trade negotiations eased concerns of a global trade war and leaders of North and South Korea met for the first time since 2007. Equity markets also reacted favorably after Fed Chair Powell made dovish comments in the third quarter during the Jackson Hole symposium and progress was made with trade negotiations with the European Union and the North American Free Trade Agreement. Equity markets underperformed again towards the end of the year on concerns about a weakening global economy, the partial U.S. government shut-down, and continued uncertainty surrounding Brexit.
During the year, the Federal Open Market Committee (the “FOMC”) met eight times and raised the target for the Federal Funds Rate four times from a range of 1.25%—1.50% to a range of 2.25%—2.50%. The FOMC stated that the labor market had continued to strengthen, and that economic activity had been rising at a strong rate. The FOMC also stated that job gains had been strong, and the unemployment rate had remained low.
Only one of the eleven sectors comprising the Russell 2000 Index experienced a positive return for the year. Utilities (4.5% beginning weight in the benchmark), up 1.5%, was the best-performing sector. Energy (3.8% beginning weight), down 36.8%; Materials & Processing (7.5% beginning weight), down 27.1%; and Producer Durables (14.1% beginning weight), down 14.6%, were the worst-performing sectors.
The stocks with the largest positive impact on the Portfolio return for the year were Sarepta Therapeutics (sold on 6/22/2018), up 152.2%; Etsy (held throughout the entire year), up 132.6%; and Grubhub (sold on 6/22/2018), up 49.0%. The stocks with the largest negative impact were Clovis Oncology, down 73.6%; McDermott International, down 66.9%; and Dana, Inc., down 56.6% (all three were held throughout the entire year).
PORTFOLIO REVIEW / PERIOD END POSITIONING
The Portfolio is managed utilizing a stratified sampling strategy versus the Russell 2000 Index. This strategy seeks to replicate the performance of the Index by owning a subset of Index constituents and neutralizing exposures across sectors. The Portfolio is periodically rebalanced for compositional changes in the Russell 2000 Index. Factors that impact tracking error include sampling, transaction costs, cash drag, securities lending activity, Net Asset Value rounding, contributions, and withdrawals.
Stacey Lituchy
Norman Hu
Mirsad Usejnoski
Portfolio Managers
MetLife Investment Advisors, LLC
* This commentary may include statements that constitute “forward-looking statements” under the U.S. securities laws. Forward-looking statements include, among other things, projections, estimates, and information about possible or future results related to the Portfolio, market or regulatory developments. The views expressed above are not guarantees of future performance or economic results and involve certain risks, uncertainties and assumptions that could cause actual outcomes and results to differ materially from the views expressed herein. The views expressed above are subject to change at any time based upon economic, market, or other conditions and the subadvisory firm undertakes no obligation to update the views expressed herein. Any discussions of specific securities should not be considered a recommendation to buy or sell those securities. The views expressed above (including any forward-looking statement) may not be relied upon as investment advice or as an indication of the Portfolio’s trading intent. Information about the Portfolio’s holdings, asset allocation or country diversification is historical and is not an indication of future Portfolio composition, which may vary. Direct investment in any index is not possible. The performance of any index mentioned in this commentary has not been adjusted for ongoing management, distribution and operating expenses, and sales charges applicable to mutual fund investments. In addition, the returns do not reflect additional fees charged by separate accounts or variable insurance contracts that an investor in the Portfolio may pay. If these additional fees were reflected, performance would have been lower.
BHFTII-1
Brighthouse Funds Trust II
MetLife Russell 2000 Index Portfolio
A $10,000 INVESTMENT COMPARED TO THE RUSSELL 2000 INDEX
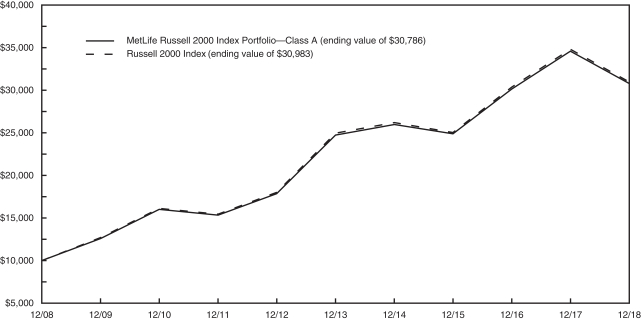
AVERAGE ANNUAL RETURNS (%) (FOR THE YEAR ENDED DECEMBER 31, 2018)
| | | | | | | | | | | | | | | | |
| | | | | |
| | | 1 Year | | | 5 Year | | | 10 Year | | | Since Inception2 | |
| MetLife Russell 2000 Index Portfolio | | | | | | | | | | | | | | | | |
Class A | | | -10.97 | | | | 4.48 | | | | 11.90 | | | | — | |
Class B | | | -11.18 | | | | 4.23 | | | | 11.62 | | | | — | |
Class E | | | -11.08 | | | | 4.34 | | | | 11.74 | | | | — | |
Class G | | | -11.20 | | | | 4.18 | | | | — | | | | 12.62 | |
| Russell 2000 Index | | | -11.01 | | | | 4.41 | | | | 11.97 | | | | — | |
1 The Russell 2000 Index is an unmanaged measure of performance of the 2,000 smallest companies in the Russell 3000 Index.
2 Inception dates of the Class A, Class B, Class E and Class G shares are 11/9/98, 1/2/01, 5/1/01 and 4/28/09, respectively.
Portfolio performance is calculated including reinvestment of all income and capital gain distributions. Performance numbers are net of all Portfolio expenses but do not include any insurance, sales, separate account or administrative charges of variable annuity or life insurance contracts or any additional expenses that participants may bear relating to the operations of their plans. If these charges were included, the returns would be lower. The performance of any index referenced above has not been adjusted for ongoing management, distribution and operating expenses, and sales charges applicable to mutual fund investments. Direct investment in any index is not possible. The performance of Class A shares, as set forth in the line graph above, will differ from that of other classes because of the difference in expenses paid by policyholders investing in the different share classes.
This information represents past performance and is not indicative of future results. Investment return and principal value may fluctuate so that shares, upon redemption, may be worth more or less than the original cost.
PORTFOLIO COMPOSITION AS OF DECEMBER 31, 2018
Top Holdings
| | | | |
| | | % of
Net Assets | |
| iShares Russell 2000 Index Fund | | | 3.0 | |
| Integrated Device Technology, Inc. | | | 0.3 | |
| Etsy, Inc. | | | 0.3 | |
| Five Below, Inc. | | | 0.3 | |
| Haemonetics Corp. | | | 0.3 | |
| Ciena Corp. | | | 0.3 | |
| Planet Fitness, Inc.- Class A | | | 0.3 | |
| HubSpot, Inc. | | | 0.3 | |
| IDACORP, Inc. | | | 0.3 | |
| LivaNova plc | | | 0.2 | |
Top Sectors
| | | | |
| | | % of
Net Assets | |
| Financials | | | 20.4 | |
| Health Care | | | 15.0 | |
| Industrials | | | 14.4 | |
| Information Technology | | | 14.1 | |
| Consumer Discretionary | | | 11.6 | |
| Real Estate | | | 7.1 | |
| Utilities | | | 3.7 | |
| Materials | | | 3.6 | |
| Energy | | | 3.3 | |
| Communication Services | | | 3.2 | |
BHFTII-2
Brighthouse Funds Trust II
MetLife Russell 2000 Index Portfolio
Understanding Your Portfolio’s Expenses
Shareholder Expense Example
As a shareholder of the Portfolio, you incur ongoing costs, including management fees; distribution and service(12b-1) fees; and other Portfolio expenses. This example is intended to help you understand your ongoing costs (in dollars) (referred to as “expenses”) of investing in the Portfolio and compare these costs with the ongoing costs of investing in other mutual funds. The example is based on an investment of $1,000 invested at the beginning of the period and held for the entire period, July 1, 2018 through December 31, 2018.
Actual Expenses
The first line for each share class of the Portfolio in the table below provides information about actual account values and actual expenses. You may use the information in this line, together with the amount you invested in the particular share class of the Portfolio, to estimate the expenses that you paid over the period. Simply divide your account value by $1,000 (for example, an $8,600 account value divided by $1,000 = 8.6), then multiply the result by the number in the first line under the heading entitled “Expenses Paid During Period” to estimate the expenses you paid on your account during this period.
Hypothetical Example for Comparison Purposes
The second line for each share class of the Portfolio in the table below provides information about hypothetical account values and hypothetical expenses based on the Portfolio’s actual expense ratio and an assumed rate of return of 5% per year before expenses, which is not the Portfolio’s actual return. The hypothetical account values and expenses may not be used to estimate the actual ending account balance or expenses you paid for the period. You may use this information to compare the ongoing costs of investing in the Portfolio and other funds. To do so, compare this 5% hypothetical example with the 5% hypothetical examples that appear in the shareholder reports of the other funds.
Please note that the expenses shown in the table are meant to highlight your ongoing costs only and do not reflect any fees or charges of your variable insurance product or any additional expenses that participants in certain eligible qualified plans may bear relating to the operations of their plan. Therefore, the second line for each share class in the table is useful in comparing ongoing costs only, and will not help you determine the relative total costs of owning different funds. In addition, if these other costs were included, your costs would have been higher.
| | | | | | | | | | | | | | | | | | |
MetLife Russell 2000 Index Portfolio
| | | | Annualized
Expense
Ratio | | | Beginning
Account Value
July 1,
2018 | | | Ending
Account Value
December 31,
2018 | | | Expenses Paid
During Period**
July 1, 2018
to
December 31,
2018 | |
Class A (a) | | Actual | | | 0.30 | % | | $ | 1,000.00 | | | $ | 827.50 | | | $ | 1.38 | |
| | Hypothetical* | | | 0.30 | % | | $ | 1,000.00 | | | $ | 1,023.69 | | | $ | 1.53 | |
| | | | | |
Class B (a) | | Actual | | | 0.55 | % | | $ | 1,000.00 | | | $ | 826.40 | | | $ | 2.53 | |
| | Hypothetical* | | | 0.55 | % | | $ | 1,000.00 | | | $ | 1,022.43 | | | $ | 2.80 | |
| | | | | |
Class E (a) | | Actual | | | 0.45 | % | | $ | 1,000.00 | | | $ | 827.30 | | | $ | 2.07 | |
| | Hypothetical* | | | 0.45 | % | | $ | 1,000.00 | | | $ | 1,022.94 | | | $ | 2.29 | |
| | | | | |
Class G (a) | | Actual | | | 0.60 | % | | $ | 1,000.00 | | | $ | 826.20 | | | $ | 2.76 | |
| | Hypothetical* | | | 0.60 | % | | $ | 1,000.00 | | | $ | 1,022.18 | | | $ | 3.06 | |
| * | Hypothetical assumes a rate of return of 5% per year before expenses. |
| ** | Expenses paid are equal to the Portfolio’s annualized expense ratio for the most recent six month period, as shown above, multiplied by the average account value over the period, multiplied by the number of days (184 days) in the most recent fiscal half-year, divided by 365 (to reflect theone-half year period). |
| (a) | The annualized expense ratio shown reflects the impact of the management fee waiver as described in Note 6 of the Notes to Financial Statements. |
BHFTII-3
Brighthouse Funds Trust II
MetLife Russell 2000 Index Portfolio
Schedule of Investments as of December 31, 2018
Common Stocks—96.2% of Net Assets
| | | | | | | | |
| Security Description | | Shares | | | Value | |
|
| Aerospace & Defense—1.2% | |
AAR Corp. | | | 13,862 | | | $ | 517,607 | |
Aerojet Rocketdyne Holdings, Inc. (a) (b) | | | 31,677 | | | | 1,115,981 | |
Aerovironment, Inc. (a) (b) | | | 8,967 | | | | 609,308 | |
Astronics Corp. (a) | | | 10,382 | | | | 316,132 | |
Axon Enterprise, Inc. (a) | | | 25,220 | | | | 1,103,375 | |
Cubic Corp. | | | 10,857 | | | | 583,455 | |
Ducommun, Inc. (a) | | | 5,959 | | | | 216,431 | |
Engility Holdings, Inc. (a) | | | 8,737 | | | | 248,655 | |
Esterline Technologies Corp. (a) | | | 11,408 | | | | 1,385,501 | |
KEYW Holding Corp. (The) (a) (b) | | | 23,342 | | | | 156,158 | |
Kratos Defense & Security Solutions, Inc. (a) | | | 39,769 | | | | 560,345 | |
Maxar Technologies, Ltd. | | | 25,232 | | | | 301,775 | |
Mercury Systems, Inc. (a) | | | 19,716 | | | | 932,370 | |
Moog, Inc. - Class A | | | 14,345 | | | | 1,111,451 | |
National Presto Industries, Inc. | | | 2,572 | | | | 300,718 | |
Triumph Group, Inc. (b) | | | 24,082 | | | | 276,943 | |
Vectrus, Inc. (a) | | | 5,647 | | | | 121,862 | |
Wesco Aircraft Holdings, Inc. (a) | | | 26,069 | | | | 205,945 | |
| | | | | | | | |
| | | | | | | 10,064,012 | |
| | | | | | | | |
|
| Air Freight & Logistics—0.3% | |
Air Transport Services Group, Inc. (a) | | | 27,538 | | | | 628,142 | |
Atlas Air Worldwide Holdings, Inc. (a) | | | 10,224 | | | | 431,351 | |
Echo Global Logistics, Inc. (a) | | | 13,053 | | | | 265,367 | |
Forward Air Corp. | | | 12,974 | | | | 711,624 | |
HUB Group, Inc. - Class A (a) | | | 15,117 | | | | 560,387 | |
| | | | | | | | |
| | | | | | | 2,596,871 | |
| | | | | | | | |
|
| Airlines—0.5% | |
Allegiant Travel Co. | | | 5,919 | | | | 593,202 | |
Hawaiian Holdings, Inc. (b) | | | 22,400 | | | | 591,584 | |
SkyWest, Inc. | | | 22,461 | | | | 998,841 | |
Spirit Airlines, Inc. (a) | | | 29,877 | | | | 1,730,476 | |
| | | | | | | | |
| | | | | | | 3,914,103 | |
| | | | | | | | |
|
| Auto Components—1.0% | |
American Axle & Manufacturing Holdings, Inc. (a) | | | 51,196 | | | | 568,276 | |
Cooper Tire & Rubber Co. (b) | | | 22,320 | | | | 721,606 | |
Cooper-Standard Holdings, Inc. (a) | | | 7,342 | | | | 456,085 | |
Dana, Inc. | | | 65,547 | | | | 893,406 | |
Dorman Products, Inc. (a) (b) | | | 11,341 | | | | 1,020,917 | |
Fox Factory Holding Corp. (a) | | | 15,112 | | | | 889,643 | |
Gentherm, Inc. (a) | | | 15,174 | | | | 606,657 | |
LCI Industries | | | 10,785 | | | | 720,438 | |
Modine Manufacturing Co. (a) | | | 23,187 | | | | 250,651 | |
Motorcar Parts of America, Inc. (a) (b) | | | 8,000 | | | | 133,120 | |
Standard Motor Products, Inc. | | | 9,638 | | | | 466,768 | |
Stoneridge, Inc. (a) | | | 13,705 | | | | 337,828 | |
Tenneco, Inc. - Class A | | | 22,605 | | | | 619,151 | |
Tower International, Inc. | | | 10,455 | | | | 248,829 | |
| | | | | | | | |
| | | | | | | 7,933,375 | |
| | | | | | | | |
|
| Automobiles—0.0% | |
Winnebago Industries, Inc. | | | 14,967 | | | | 362,351 | |
| | | | | | | | |
| | | | | | | | |
| Security Description | | Shares | | | Value | |
|
| Banks—9.2% | |
1st Source Corp. | | | 7,645 | | | $ | 308,399 | |
Access National Corp. | | | 7,093 | | | | 151,294 | |
ACNB Corp. | | | 3,451 | | | | 135,452 | |
Allegiance Bancshares, Inc. (a) | | | 5,825 | | | | 188,555 | |
Amalgamated Bank | | | 6,010 | | | | 117,195 | |
American National Bankshares, Inc. | | | 4,311 | | | | 126,355 | |
Ameris Bancorp | | | 18,334 | | | | 580,638 | |
Ames National Corp. | | | 4,321 | | | | 109,840 | |
Arrow Financial Corp. | | | 6,358 | | | | 203,583 | |
Atlantic Capital Bancshares, Inc. (a) | | | 10,440 | | | | 170,903 | |
Banc of California, Inc. | | | 18,620 | | | | 247,832 | |
BancFirst Corp. | | | 8,433 | | | | 420,807 | |
Bancorp, Inc. (The) (a) | | | 25,747 | | | | 204,946 | |
BancorpSouth Bank | | | 40,565 | | | | 1,060,369 | |
Bank of Marin Bancorp | | | 6,398 | | | | 263,854 | |
Bank of NT Butterfield & Son, Ltd. (The) | | | 23,242 | | | | 728,637 | |
Banner Corp. | | | 14,787 | | | | 790,809 | |
Bar Harbor Bankshares | | | 7,342 | | | | 164,681 | |
Baycom Corp. (a) | | | 5,323 | | | | 122,908 | |
Berkshire Hills Bancorp, Inc. | | | 18,786 | | | | 506,658 | |
Blue Hills Bancorp, Inc. | | | 9,156 | | | | 195,389 | |
Boston Private Financial Holdings, Inc. | | | 40,232 | | | | 425,252 | |
Bridge Bancorp, Inc. | | | 8,870 | | | | 226,096 | |
Brookline Bancorp, Inc. | | | 36,642 | | | | 506,392 | |
Bryn Mawr Bank Corp. | | | 9,382 | | | | 322,741 | |
Business First Bancshares, Inc. | | | 5,338 | | | | 129,340 | |
Byline Bancorp, Inc. (a) | | | 8,170 | | | | 136,112 | |
Cadence BanCorp | | | 32,156 | | | | 539,578 | |
Cambridge Bancorp | | | 1,469 | | | | 122,294 | |
Camden National Corp. | | | 7,839 | | | | 281,969 | |
Capital City Bank Group, Inc. | | | 5,769 | | | | 133,899 | |
Carolina Financial Corp. | | | 8,963 | | | | 265,215 | |
Cathay General Bancorp (b) | | | 34,405 | | | | 1,153,600 | |
CBTX, Inc. | | | 8,948 | | | | 263,071 | |
CenterState Bank Corp. | | | 38,953 | | | | 819,571 | |
Central Pacific Financial Corp. | | | 11,636 | | | | 283,337 | |
Central Valley Community Bancorp | | | 5,828 | | | | 109,974 | |
Century Bancorp, Inc. - Class A | | | 1,458 | | | | 98,750 | |
Chemical Financial Corp. | | | 30,603 | | | | 1,120,376 | |
Citizens & Northern Corp. | | | 6,716 | | | | 177,504 | |
City Holding Co. (b) | | | 7,242 | | | | 489,487 | |
Civista Bancshares, Inc. | | | 6,893 | | | | 120,076 | |
CNB Financial Corp. | | | 6,782 | | | | 155,647 | |
Codorus Valley Bancorp, Inc. | | | 4,739 | | | | 100,704 | |
Columbia Banking System, Inc. | | | 32,810 | | | | 1,190,675 | |
Community Bank System, Inc. (b) | | | 22,304 | | | | 1,300,323 | |
Community Trust Bancorp, Inc. | | | 7,150 | | | | 283,212 | |
ConnectOne Bancorp, Inc. | | | 13,860 | | | | 255,994 | |
Customers Bancorp, Inc. (a) | | | 13,560 | | | | 246,792 | |
CVB Financial Corp. | | | 49,490 | | | | 1,001,183 | |
Eagle Bancorp, Inc. (a) | | | 13,255 | | | | 645,651 | |
Enterprise Bancorp, Inc. | | | 4,064 | | | | 130,698 | |
Enterprise Financial Services Corp. | | | 10,782 | | | | 405,727 | |
Equity Bancshares, Inc. - Class A (a) | | | 5,404 | | | | 190,491 | |
Farmers & Merchants Bancorp, Inc. | | | 4,006 | | | | 154,191 | |
Farmers National Banc Corp. | | | 13,414 | | | | 170,894 | |
FB Financial Corp. | | | 6,411 | | | | 224,513 | |
See accompanying notes to financial statements.
BHFTII-4
Brighthouse Funds Trust II
MetLife Russell 2000 Index Portfolio
Schedule of Investments as of December 31, 2018
Common Stocks—(Continued)
| | | | | | | | |
| Security Description | | Shares | | | Value | |
|
| Banks—(Continued) | |
Fidelity Southern Corp. | | | 10,827 | | | $ | 281,719 | |
Financial Institutions, Inc. | | | 6,461 | | | | 166,048 | |
First BanCorp | | | 94,227 | | | | 810,352 | |
First Bancorp | | | 12,826 | | | | 418,897 | |
First Bancorp, Inc. | | | 5,308 | | | | 139,600 | |
First Bancshares, Inc. (The) | | | 6,100 | | | | 184,525 | |
First Busey Corp. | | | 20,300 | | | | 498,162 | |
First Choice Bancorp | | | 4,579 | | | | 103,485 | |
First Commonwealth Financial Corp. | | | 45,936 | | | | 554,907 | |
First Community Bancshares, Inc. | | | 8,470 | | | | 266,636 | |
First Financial Bancorp | | | 41,209 | | | | 977,477 | |
First Financial Bankshares, Inc. | | | 27,909 | | | | 1,610,070 | |
First Financial Corp. | | | 5,203 | | | | 208,900 | |
First Foundation, Inc. (a) (b) | | | 17,720 | | | | 227,879 | |
First Interstate BancSystem, Inc. - Class A | | | 15,279 | | | | 558,600 | |
First Merchants Corp. | | | 22,695 | | | | 777,758 | |
FirstMid-Illinois Bancshares, Inc. | | | 5,809 | | | | 185,423 | |
First Midwest Bancorp, Inc. | | | 46,471 | | | | 920,591 | |
First of Long Island Corp. (The) | | | 9,924 | | | | 197,984 | |
Flushing Financial Corp. | | | 13,422 | | | | 288,976 | |
Franklin Financial Network, Inc. (a) (b) | | | 4,922 | | | | 129,793 | |
Fulton Financial Corp. | | | 76,291 | | | | 1,180,985 | |
German American Bancorp, Inc. | | | 10,138 | | | | 281,532 | |
Glacier Bancorp, Inc. (b) | | | 36,365 | | | | 1,440,781 | |
Great Southern Bancorp, Inc. | | | 4,991 | | | | 229,736 | |
Great Western Bancorp, Inc. | | | 26,273 | | | | 821,031 | |
Green Bancorp, Inc. | | | 11,285 | | | | 193,425 | |
Guaranty Bancorp | | | 11,425 | | | | 237,069 | |
Guaranty Bancshares, Inc. | | | 3,924 | | | | 117,014 | |
Hancock Whitney Corp. | | | 36,710 | | | | 1,272,002 | |
Hanmi Financial Corp. | | | 15,681 | | | | 308,916 | |
HarborOne Bancorp, Inc. (a) | | | 7,489 | | | | 119,000 | |
Heartland Financial USA, Inc. | | | 13,588 | | | | 597,193 | |
Heritage Commerce Corp. | | | 17,854 | | | | 202,464 | |
Heritage Financial Corp. | | | 15,777 | | | | 468,892 | |
Hilltop Holdings, Inc. | | | 34,409 | | | | 613,512 | |
Home BancShares, Inc. | | | 68,087 | | | | 1,112,542 | |
HomeTrust Bancshares, Inc. | | | 8,531 | | | | 223,342 | |
Hope Bancorp, Inc. | | | 53,525 | | | | 634,807 | |
Horizon Bancorp | | | 17,556 | | | | 277,034 | |
Iberiabank Corp. | | | 24,314 | | | | 1,562,904 | |
Independent Bank Corp. | | | 11,863 | | | | 249,360 | |
Independent Bank Corp./Rockland Trust | | | 11,523 | | | | 810,182 | |
Independent Bank Group, Inc. | | | 9,806 | | | | 448,821 | |
International Bancshares Corp. | | | 23,225 | | | | 798,940 | |
Investar Holding Corp. | | | 4,526 | | | | 112,245 | |
Investors Bancorp, Inc. | | | 105,579 | | | | 1,098,022 | |
Lakeland Bancorp, Inc. | | | 19,901 | | | | 294,734 | |
Lakeland Financial Corp. | | | 11,384 | | | | 457,181 | |
LegacyTexas Financial Group, Inc. (b) | | | 21,060 | | | | 675,815 | |
Live Oak Bancshares, Inc. (b) | | | 10,534 | | | | 156,009 | |
Macatawa Bank Corp. | | | 14,416 | | | | 138,682 | |
MB Financial, Inc. | | | 35,622 | | | | 1,411,700 | |
Mercantile Bank Corp. | | | 8,647 | | | | 244,364 | |
Metropolitan Bank Holding Corp. (a) | | | 3,277 | | | | 101,095 | |
Midland States Bancorp, Inc. | | | 10,034 | | | | 224,160 | |
MidWestOne Financial Group, Inc. | | | 5,585 | | | | 138,676 | |
| | | | | | | | |
| Security Description | | Shares | | | Value | |
|
| Banks—(Continued) | |
National Bank Holdings Corp. - Class A | | | 12,889 | | | $ | 397,883 | |
National Bankshares, Inc. | | | 3,487 | | | | 127,031 | |
National Commerce Corp. (a) | | | 7,109 | | | | 255,924 | |
NBT Bancorp, Inc. (b) | | | 17,543 | | | | 606,812 | |
Nicolet Bankshares, Inc. (a) (b) | | | 4,410 | | | | 215,208 | |
Northrim BanCorp, Inc. | | | 3,529 | | | | 115,998 | |
OFG Bancorp | | | 19,884 | | | | 327,291 | |
Old Line Bancshares, Inc. | | | 7,597 | | | | 199,953 | |
Old National Bancorp | | | 63,652 | | | | 980,241 | |
Old Second Bancorp, Inc. | | | 14,296 | | | | 185,848 | |
Opus Bank | | | 8,631 | | | | 169,081 | |
Origin Bancorp, Inc. | | | 6,937 | | | | 236,413 | |
Pacific Premier Bancorp, Inc. (a) | | | 21,020 | | | | 536,430 | |
Park National Corp. | | | 5,741 | | | | 487,698 | |
Peapack Gladstone Financial Corp. | | | 8,311 | | | | 209,271 | |
People’s Utah Bancorp | | | 7,011 | | | | 211,382 | |
Peoples Bancorp, Inc. | | | 8,443 | | | | 254,134 | |
Peoples Financial Services Corp. | | | 3,673 | | | | 161,832 | |
Preferred Bank | | | 6,573 | | | | 284,940 | |
QCR Holdings, Inc. | | | 5,811 | | | | 186,475 | |
RBB Bancorp | | | 6,720 | | | | 118,070 | |
Reliant Bancorp, Inc. (b) | | | 5,179 | | | | 119,324 | |
Renasant Corp. | | | 22,158 | | | | 668,728 | |
Republic Bancorp, Inc. - Class A | | | 5,421 | | | | 209,901 | |
Republic First Bancorp, Inc. (a) | | | 22,031 | | | | 131,525 | |
S&T Bancorp, Inc. (b) | | | 15,660 | | | | 592,574 | |
Sandy Spring Bancorp, Inc. | | | 16,080 | | | | 503,947 | |
Seacoast Banking Corp. of Florida (a) (b) | | | 21,315 | | | | 554,616 | |
ServisFirst Bancshares, Inc. (b) | | | 20,928 | | | | 666,975 | |
Sierra Bancorp | | | 5,841 | | | | 140,359 | |
Simmons First National Corp. - Class A | | | 41,478 | | | | 1,000,864 | |
SmartFinancial, Inc. (a) | | | 5,821 | | | | 106,350 | |
South State Corp. | | | 15,302 | | | | 917,355 | |
Southern First Bancshares, Inc. (a) | | | 3,419 | | | | 109,647 | |
Southern National Bancorp of Virginia, Inc. | | | 10,799 | | | | 142,763 | |
Southside Bancshares, Inc. | | | 15,530 | | | | 493,078 | |
State Bank Financial Corp. | | | 16,379 | | | | 353,623 | |
Stock Yards Bancorp, Inc. | | | 10,633 | | | | 348,762 | |
Summit Financial Group, Inc. | | | 5,705 | | | | 110,164 | |
Tompkins Financial Corp. | | | 6,912 | | | | 518,469 | |
Towne Bank | | | 30,317 | | | | 726,092 | |
TriCo Bancshares | | | 11,734 | | | | 396,492 | |
TriState Capital Holdings, Inc. (a) | | | 11,422 | | | | 222,272 | |
Triumph Bancorp, Inc. (a) | | | 11,267 | | | | 334,630 | |
Trustmark Corp. (b) | | | 28,210 | | | | 802,010 | |
UMB Financial Corp. | | | 19,210 | | | | 1,171,234 | |
Union Bankshares Corp. (b) | | | 30,030 | | | | 847,747 | |
United Bankshares, Inc. (b) | | | 43,338 | | | | 1,348,245 | |
United Community Banks, Inc. | | | 34,521 | | | | 740,821 | |
Univest Corp. of Pennsylvania | | | 12,133 | | | | 261,709 | |
Valley National Bancorp | | | 137,865 | | | | 1,224,241 | |
Veritex Holdings, Inc. (a) (b) | | | 11,061 | | | | 236,484 | |
Washington Trust Bancorp, Inc. | | | 5,960 | | | | 283,279 | |
WesBanco, Inc. | | | 23,770 | | | | 872,121 | |
West Bancorp, Inc. | | | 8,036 | | | | 153,407 | |
Westamerica Bancorp (b) | | | 11,738 | | | | 653,572 | |
| | | | | | | | |
| | | | | | | 73,973,677 | |
| | | | | | | | |
See accompanying notes to financial statements.
BHFTII-5
Brighthouse Funds Trust II
MetLife Russell 2000 Index Portfolio
Schedule of Investments as of December 31, 2018
Common Stocks—(Continued)
| | | | | | | | |
| Security Description | | Shares | | | Value | |
|
| Beverages—0.3% | |
Boston Beer Co., Inc. (The) - Class A (a) | | | 3,688 | | | $ | 888,218 | |
Coca-Cola Bottling Co. Consolidated | | | 1,932 | | | | 342,698 | |
MGP Ingredients, Inc. (b) | | | 6,119 | | | | 349,089 | |
National Beverage Corp. (b) | | | 4,782 | | | | 343,204 | |
Primo Water Corp. (a) (b) | | | 15,449 | | | | 216,441 | |
| | | | | | | | |
| | | | | | | 2,139,650 | |
| | | | | | | | |
|
| Biotechnology—5.9% | |
Abeona Therapeutics, Inc. (a) | | | 12,572 | | | | 89,764 | |
ACADIA Pharmaceuticals, Inc. (a) (b) | | | 45,819 | | | | 740,893 | |
Acceleron Pharma, Inc. (a) (b) | | | 17,406 | | | | 758,031 | |
Acorda Therapeutics, Inc. (a) (b) | | | 20,455 | | | | 318,689 | |
Agenus, Inc. (a) | | | 46,040 | | | | 109,575 | |
Aimmune Therapeutics, Inc. (a) (b) | | | 20,346 | | | | 486,676 | |
Akebia Therapeutics, Inc. (a) (b) | | | 40,608 | | | | 224,562 | |
Albireo Pharma, Inc. (a) | | | 4,713 | | | | 115,610 | |
Alder Biopharmaceuticals, Inc. (a) (b) | | | 25,046 | | | | 256,722 | |
Allakos, Inc. (a) (b) | | | 4,042 | | | | 211,275 | |
Allogene Therapeutics, Inc. (a) (b) | | | 12,636 | | | | 340,287 | |
AMAG Pharmaceuticals, Inc. (a) | | | 16,034 | | | | 243,556 | |
Amicus Therapeutics, Inc. (a) (b) | | | 85,724 | | | | 821,236 | |
AnaptysBio, Inc. (a) | | | 9,482 | | | | 604,857 | |
Apellis Pharmaceuticals, Inc. (a) | | | 17,298 | | | | 228,161 | |
Aptinyx, Inc. (a) | | | 9,990 | | | | 165,235 | |
Arcus Biosciences, Inc. (a) | | | 15,645 | | | | 168,497 | |
Arena Pharmaceuticals, Inc. (a) | | | 22,490 | | | | 875,986 | |
Arqule, Inc. (a) | | | 43,816 | | | | 121,370 | |
Array BioPharma, Inc. (a) (b) | | | 91,194 | | | | 1,299,514 | |
Arrowhead Pharmaceuticals, Inc. (a) (b) | | | 40,960 | | | | 508,723 | |
Atara Biotherapeutics, Inc. (a) | | | 18,837 | | | | 654,397 | |
Athenex, Inc. (a) (b) | | | 20,171 | | | | 255,970 | |
Audentes Therapeutics, Inc. (a) | | | 17,143 | | | | 365,489 | |
Avid Bioservices, Inc. (a) | | | 26,181 | | | | 107,342 | |
BioCryst Pharmaceuticals, Inc. (a) (b) | | | 50,588 | | | | 408,245 | |
Biohaven Pharmaceutical Holding Co., Ltd. (a) | | | 12,167 | | | | 449,936 | |
BioSpecifics Technologies Corp. (a) | | | 3,035 | | | | 183,921 | |
Blueprint Medicines Corp. (a) (b) | | | 17,806 | | | | 959,921 | |
Cara Therapeutics, Inc. (a) | | | 15,682 | | | | 203,866 | |
CareDx, Inc. (a) | | | 16,080 | | | | 404,251 | |
CASI Pharmaceuticals, Inc. (a) (b) | | | 26,316 | | | | 105,790 | |
Catalyst Pharmaceuticals, Inc. (a) | | | 49,243 | | | | 94,547 | |
Cellular Biomedicine Group, Inc. (a) | | | 6,244 | | | | 110,269 | |
ChemoCentryx, Inc. (a) | | | 12,392 | | | | 135,197 | |
Clovis Oncology, Inc. (a) (b) | | | 21,967 | | | | 394,527 | |
Coherus Biosciences, Inc. (a) | | | 22,472 | | | | 203,372 | |
Concert Pharmaceuticals, Inc. (a) | | | 8,973 | | | | 112,611 | |
Corbus Pharmaceuticals Holdings, Inc. (a) (b) | | | 23,089 | | | | 134,840 | |
Cytokinetics, Inc. (a) | | | 18,716 | | | | 118,285 | |
CytomX Therapeutics, Inc. (a) | | | 18,290 | | | | 276,179 | |
Denali Therapeutics, Inc. (a) (b) | | | 20,915 | | | | 432,104 | |
Dicerna Pharmaceuticals, Inc. (a) | | | 21,711 | | | | 232,091 | |
Dynavax Technologies Corp. (a) (b) | | | 28,690 | | | | 262,514 | |
Eagle Pharmaceuticals, Inc. (a) (b) | | | 4,988 | | | | 200,967 | |
Editas Medicine, Inc. (a) | | | 21,164 | | | | 481,481 | |
Emergent BioSolutions, Inc. (a) | | | 20,011 | | | | 1,186,252 | |
Enanta Pharmaceuticals, Inc. (a) (b) | | | 7,598 | | | | 538,166 | |
| | | | | | | | |
| Security Description | | Shares | | | Value | |
|
| Biotechnology—(Continued) | |
Epizyme, Inc. (a) | | | 25,075 | | | $ | 154,462 | |
Esperion Therapeutics, Inc. (a) (b) | | | 10,901 | | | | 501,446 | |
Fate Therapeutics, Inc. (a) (b) | | | 27,883 | | | | 357,739 | |
FibroGen, Inc. (a) | | | 33,355 | | | | 1,543,669 | |
Five Prime Therapeutics, Inc. (a) (b) | | | 19,957 | | | | 185,600 | |
Flexion Therapeutics, Inc. (a) (b) | | | 15,518 | | | | 175,664 | |
G1 Therapeutics, Inc. (a) | | | 9,655 | | | | 184,893 | |
Genomic Health, Inc. (a) | | | 8,834 | | | | 568,998 | |
Global Blood Therapeutics, Inc. (a) (b) | | | 23,097 | | | | 948,132 | |
GlycoMimetics, Inc. (a) | | | 16,635 | | | | 157,533 | |
Halozyme Therapeutics, Inc. (a) | | | 55,733 | | | | 815,374 | |
Heron Therapeutics, Inc. (a) (b) | | | 29,366 | | | | 761,754 | |
Homology Medicines, Inc. (a) | | | 8,430 | | | | 188,495 | |
ImmunoGen, Inc. (a) | | | 59,746 | | | | 286,781 | |
Immunomedics, Inc. (a) (b) | | | 65,050 | | | | 928,264 | |
Inovio Pharmaceuticals, Inc. (a) | | | 36,297 | | | | 145,188 | |
Insmed, Inc. (a) (b) | | | 33,233 | | | | 436,017 | |
Intellia Therapeutics, Inc. (a) (b) | | | 15,741 | | | | 214,865 | |
Intercept Pharmaceuticals, Inc. (a) | | | 9,678 | | | | 975,446 | |
Intrexon Corp. (a) (b) | | | 32,766 | | | | 214,290 | |
Invitae Corp. (a) | | | 31,538 | | | | 348,810 | |
Iovance Biotherapeutics, Inc. (a) | | | 48,312 | | | | 427,561 | |
Ironwood Pharmaceuticals, Inc. (a) | | | 63,682 | | | | 659,746 | |
Kadmon Holdings, Inc. (a) (b) | | | 50,200 | | | | 104,416 | |
Karyopharm Therapeutics, Inc. (a) (b) | | | 23,047 | | | | 215,950 | |
Kindred Biosciences, Inc. (a) | | | 13,711 | | | | 150,135 | |
Kura Oncology, Inc. (a) | | | 13,652 | | | | 191,674 | |
La Jolla Pharmaceutical Co. (a) (b) | | | 12,259 | | | | 115,602 | |
Lexicon Pharmaceuticals, Inc. (a) (b) | | | 23,843 | | | | 158,318 | |
Ligand Pharmaceuticals, Inc. (a) (b) | | | 9,331 | | | | 1,266,217 | |
Loxo Oncology, Inc. (a) | | | 12,113 | | | | 1,696,668 | |
MacroGenics, Inc. (a) | | | 18,661 | | | | 236,995 | |
Madrigal Pharmaceuticals, Inc. (a) (b) | | | 3,123 | | | | 352,025 | |
MediciNova, Inc. (a) (b) | | | 18,638 | | | | 152,272 | |
Minerva Neurosciences, Inc. (a) | | | 16,304 | | | | 109,889 | |
Mirati Therapeutics, Inc. (a) | | | 8,594 | | | | 364,557 | |
Momenta Pharmaceuticals, Inc. (a) | | | 35,673 | | | | 393,830 | |
Myriad Genetics, Inc. (a) (b) | | | 29,763 | | | | 865,210 | |
Natera, Inc. (a) | | | 13,813 | | | | 192,829 | |
Novavax, Inc. (a) (b) | | | 181,370 | | | | 333,721 | |
Opko Health, Inc. (a) (b) | | | 146,687 | | | | 441,528 | |
PDL BioPharma, Inc. (a) | | | 76,001 | | | | 220,403 | |
Portola Pharmaceuticals, Inc. (a) (b) | | | 29,932 | | | | 584,273 | |
Progenics Pharmaceuticals, Inc. (a) | | | 32,263 | | | | 135,505 | |
Prothena Corp. plc (a) | | | 18,324 | | | | 188,737 | |
PTC Therapeutics, Inc. (a) (b) | | | 21,050 | | | | 722,436 | |
Puma Biotechnology, Inc. (a) (b) | | | 13,791 | | | | 280,647 | |
Ra Pharmaceuticals, Inc. (a) | | | 7,515 | | | | 136,773 | |
Radius Health, Inc. (a) | | | 17,562 | | | | 289,597 | |
REGENXBIO, Inc. (a) | | | 14,093 | | | | 591,201 | |
Repligen Corp. (a) (b) | | | 17,598 | | | | 928,119 | |
Retrophin, Inc. (a) | | | 18,842 | | | | 426,394 | |
Rhythm Pharmaceuticals, Inc. (a) (b) | | | 6,192 | | | | 166,441 | |
Rigel Pharmaceuticals, Inc. (a) | | | 68,148 | | | | 156,740 | |
Rocket Pharmaceuticals, Inc. (a) (b) | | | 10,482 | | | | 155,343 | |
Rubius Therapeutics, Inc. (a) (b) | | | 10,781 | | | | 173,358 | |
Sangamo Therapeutics, Inc. (a) (b) | | | 47,157 | | | | 541,362 | |
See accompanying notes to financial statements.
BHFTII-6
Brighthouse Funds Trust II
MetLife Russell 2000 Index Portfolio
Schedule of Investments as of December 31, 2018
Common Stocks—(Continued)
| | | | | | | | |
| Security Description | | Shares | | | Value | |
|
| Biotechnology—(Continued) | |
Solid Biosciences, Inc. (a) | | | 5,744 | | | $ | 153,939 | |
Sorrento Therapeutics, Inc. (a) (b) | | | 42,779 | | | | 102,670 | |
Spark Therapeutics, Inc. (a) (b) | | | 14,454 | | | | 565,730 | |
Spectrum Pharmaceuticals, Inc. (a) | | | 45,835 | | | | 401,056 | |
Stemline Therapeutics, Inc. (a) | | | 11,947 | | | | 113,497 | |
TG Therapeutics, Inc. (a) (b) | | | 28,284 | | | | 115,964 | |
Tyme Technologies, Inc. (a) (b) | | | 51,546 | | | | 190,205 | |
Ultragenyx Pharmaceutical, Inc. (a) | | | 20,227 | | | | 879,470 | |
UNITY Biotechnology, Inc. (a) (b) | | | 12,061 | | | | 196,112 | |
Vanda Pharmaceuticals, Inc. (a) | | | 24,336 | | | | 635,900 | |
Veracyte, Inc. (a) | | | 14,557 | | | | 183,127 | |
Verastem, Inc. (a) (b) | | | 26,692 | | | | 89,685 | |
Vericel Corp. (a) | | | 18,632 | | | | 324,197 | |
Viking Therapeutics, Inc. (a) (b) | | | 28,602 | | | | 218,805 | |
Voyager Therapeutics, Inc. (a) | | | 10,649 | | | | 100,101 | |
Xencor, Inc. (a) | | | 21,420 | | | | 774,547 | |
ZIOPHARM Oncology, Inc. (a) (b) | | | 64,378 | | | | 120,387 | |
| | | | | | | | |
| | | | | | | 47,087,033 | |
| | | | | | | | |
|
| Building Products—1.2% | |
AAON, Inc. (b) | | | 19,095 | | | | 669,471 | |
Advanced Drainage Systems, Inc. | | | 16,264 | | | | 394,402 | |
American Woodmark Corp. (a) | | | 6,699 | | | | 373,000 | |
Apogee Enterprises, Inc. | | | 11,475 | | | | 342,529 | |
Armstrong Flooring, Inc. (a) | | | 11,681 | | | | 138,303 | |
Builders FirstSource, Inc. (a) | | | 50,475 | | | | 550,682 | |
Caesarstone, Ltd. | | | 11,687 | | | | 158,709 | |
Continental Building Products, Inc. (a) | | | 17,313 | | | | 440,616 | |
CSW Industrials, Inc. (a) | | | 7,377 | | | | 356,678 | |
Gibraltar Industries, Inc. (a) (b) | | | 14,856 | | | | 528,725 | |
Griffon Corp. | | | 14,438 | | | | 150,877 | |
Insteel Industries, Inc. | | | 9,004 | | | | 218,617 | |
JELD-WEN Holding, Inc. (a) (b) | | | 31,537 | | | | 448,141 | |
Masonite International Corp. (a) | | | 12,167 | | | | 545,447 | |
NCI Building Systems, Inc. (a) | | | 19,586 | | | | 141,999 | |
Patrick Industries, Inc. (a) | | | 10,680 | | | | 316,235 | |
PGT Innovations, Inc. (a) | | | 22,494 | | | | 356,530 | |
Quanex Building Products Corp. | | | 17,697 | | | | 240,502 | |
Simpson Manufacturing Co., Inc. (b) | | | 17,526 | | | | 948,682 | |
Trex Co., Inc. (a) | | | 25,565 | | | | 1,517,538 | |
Universal Forest Products, Inc. | | | 25,733 | | | | 668,029 | |
| | | | | | | | |
| | | | | | | 9,505,712 | |
| | | | | | | | |
|
| Capital Markets—1.2% | |
Arlington Asset Investment Corp. - Class A (b) | | | 10,056 | | | | 72,805 | |
Artisan Partners Asset Management, Inc. - Class A | | | 21,101 | | | | 466,543 | |
B. Riley Financial, Inc. (b) | | | 10,620 | | | | 150,804 | |
Blucora, Inc. (a) | | | 20,338 | | | | 541,804 | |
BrightSphere Investment Group plc | | | 35,717 | | | | 381,458 | |
Cohen & Steers, Inc. (b) | | | 9,693 | | | | 332,664 | |
Cowen Group, Inc. (a) (b) | | | 13,196 | | | | 176,035 | |
Diamond Hill Investment Group, Inc. | | | 1,546 | | | | 231,050 | |
Donnelley Financial Solutions, Inc. (a) | | | 16,100 | | | | 225,883 | |
Federated Investors, Inc. - Class B (b) | | | 41,142 | | | | 1,092,320 | |
Focus Financial Partners, Inc. - Class A (a) | | | 7,357 | | | | 193,710 | |
Greenhill & Co., Inc. | | | 10,011 | | | | 244,268 | |
|
| Capital Markets—(Continued) | |
Hamilton Lane, Inc. - Class A | | | 7,658 | | | | 283,346 | |
Houlihan Lokey, Inc. | | | 15,059 | | | | 554,171 | |
International FCStone, Inc. (a) | | | 7,668 | | | | 280,495 | |
Investment Technology Group, Inc. | | | 14,591 | | | | 441,232 | |
Ladenburg Thalmann Financial Services, Inc. | | | 50,140 | | | | 116,826 | |
Moelis & Co. - Class A | | | 20,136 | | | | 692,276 | |
Oppenheimer Holdings, Inc. - Class A | | | 4,998 | | | | 127,699 | |
Piper Jaffray Cos. | | | 7,063 | | | | 465,028 | |
PJT Partners, Inc. - Class A | | | 9,330 | | | | 361,631 | |
Stifel Financial Corp. | | | 29,695 | | | | 1,229,967 | |
Virtus Investment Partners, Inc. | | | 3,239 | | | | 257,274 | |
Waddell & Reed Financial, Inc. - Class A (b) | | | 33,654 | | | | 608,464 | |
Westwood Holdings Group, Inc. | | | 3,235 | | | | 109,990 | |
WisdomTree Investments, Inc. | | | 53,688 | | | | 357,025 | |
| | | | | | | | |
| | | | | | | 9,994,768 | |
| | | | | | | | |
|
| Chemicals—1.8% | |
AdvanSix, Inc. (a) | | | 14,472 | | | | 352,248 | |
American Vanguard Corp. | | | 14,887 | | | | 226,133 | |
Balchem Corp. | | | 13,712 | | | | 1,074,335 | |
Chase Corp. | | | 3,533 | | | | 353,477 | |
Ferro Corp. (a) | | | 38,898 | | | | 609,921 | |
FutureFuel Corp. | | | 10,195 | | | | 161,693 | |
GCP Applied Technologies, Inc. (a) | | | 29,565 | | | | 725,821 | |
Hawkins, Inc. | | | 4,778 | | | | 195,659 | |
HB Fuller Co. | | | 21,308 | | | | 909,212 | |
Ingevity Corp. (a) | | | 18,263 | | | | 1,528,430 | |
Innophos Holdings, Inc. | | | 9,207 | | | | 225,848 | |
Innospec, Inc. | | | 9,939 | | | | 613,833 | |
Intrepid Potash, Inc. (a) | | | 46,261 | | | | 120,279 | |
Koppers Holdings, Inc. (a) | | | 10,265 | | | | 174,916 | |
Kraton Corp. (a) | | | 14,021 | | | | 306,219 | |
Kronos Worldwide, Inc. | | | 11,199 | | | | 129,012 | |
Livent Corp. (a) | | | 16,565 | | | | 228,597 | |
Minerals Technologies, Inc. | | | 14,525 | | | | 745,713 | |
OMNOVA Solutions, Inc. (a) | | | 21,500 | | | | 157,595 | |
PolyOne Corp. | | | 34,248 | | | | 979,493 | |
PQ Group Holdings, Inc. (a) | | | 14,392 | | | | 213,145 | |
Quaker Chemical Corp. | | | 5,838 | | | | 1,037,471 | |
Rayonier Advanced Materials, Inc. (b) | | | 22,944 | | | | 244,354 | |
Sensient Technologies Corp. (b) | | | 18,001 | | | | 1,005,356 | |
Stepan Co. | | | 9,222 | | | | 682,428 | |
Tredegar Corp. | | | 13,367 | | | | 212,001 | |
Trinseo S.A. | | | 17,985 | | | | 823,353 | |
Tronox, Ltd. - Class A | | | 43,198 | | | | 336,080 | |
| | | | | | | | |
| | | | | | | 14,372,622 | |
| | | | | | | | |
|
| Commercial Services & Supplies—2.6% | |
ABM Industries, Inc. (b) | | | 27,637 | | | | 887,424 | |
ACCO Brands Corp. | | | 48,975 | | | | 332,050 | |
Advanced Disposal Services, Inc. (a) | | | 33,294 | | | | 797,058 | |
Brady Corp. - Class A | | | 21,723 | | | | 944,082 | |
BrightView Holdings, Inc. (a) | | | 8,836 | | | | 90,216 | |
Brink’s Co. (The) | | | 21,381 | | | | 1,382,282 | |
Casella Waste Systems, Inc. - Class A (a) | | | 16,372 | | | | 466,438 | |
Ceco Environmental Corp. (a) | | | 14,832 | | | | 100,116 | |
See accompanying notes to financial statements.
BHFTII-7
Brighthouse Funds Trust II
MetLife Russell 2000 Index Portfolio
Schedule of Investments as of December 31, 2018
Common Stocks—(Continued)
| | | | | | | | |
| Security Description | | Shares | | | Value | |
|
| Commercial Services & Supplies—(Continued) | |
Cimpress NV (a) | | | 9,290 | | | $ | 960,772 | |
Covanta Holding Corp. | | | 53,904 | | | | 723,392 | |
Deluxe Corp. | | | 19,398 | | | | 745,659 | |
Ennis, Inc. (b) | | | 14,123 | | | | 271,868 | |
Essendant, Inc. | | | 18,301 | | | | 230,227 | |
Healthcare Services Group, Inc. (b) | | | 32,315 | | | | 1,298,417 | |
Heritage-Crystal Clean, Inc. (a) | | | 7,474 | | | | 171,977 | |
Herman Miller, Inc. | | | 27,251 | | | | 824,343 | |
HNI Corp. | | | 18,317 | | | | 648,971 | |
Interface, Inc. | | | 27,071 | | | | 385,762 | |
Kimball International, Inc. - Class B | | | 16,738 | | | | 237,512 | |
Knoll, Inc. | | | 23,781 | | | | 391,911 | |
LSC Communications, Inc. | | | 16,124 | | | | 112,868 | |
Matthews International Corp. - Class A | | | 14,349 | | | | 582,856 | |
McGrath RentCorp | | | 10,515 | | | | 541,312 | |
Mobile Mini, Inc. | | | 20,245 | | | | 642,779 | |
MSA Safety, Inc. | | | 14,519 | | | | 1,368,706 | |
Multi-Color Corp. | | | 6,168 | | | | 216,435 | |
Pitney Bowes, Inc. (b) | | | 83,241 | | | | 491,954 | |
Quad/Graphics, Inc. (b) | | | 13,076 | | | | 161,096 | |
RR Donnelley & Sons Co. | | | 33,165 | | | | 131,333 | |
SP Plus Corp. (a) | | | 10,567 | | | | 312,149 | |
Steelcase, Inc. - Class A | | | 39,276 | | | | 582,463 | |
Team, Inc. (a) (b) | | | 14,183 | | | | 207,781 | |
Tetra Tech, Inc. (c) | | | 24,133 | | | | 1,249,365 | |
U.S. Ecology, Inc. | | | 10,067 | | | | 634,020 | |
UniFirst Corp. | | | 6,349 | | | | 908,351 | |
Viad Corp. | | | 8,932 | | | | 447,404 | |
VSE Corp. | | | 4,190 | | | | 125,323 | |
| | | | | | | | |
| | | | | | | 20,606,672 | |
| | | | | | | | |
|
| Communications Equipment—1.6% | |
Acacia Communications, Inc. (a) | | | 12,769 | | | | 485,222 | |
ADTRAN, Inc. | | | 24,190 | | | | 259,801 | |
Applied Optoelectronics, Inc. (a) (b) | | | 8,622 | | | | 133,037 | |
CalAmp Corp. (a) | | | 14,239 | | | | 185,249 | |
Calix, Inc. (a) | | | 21,486 | | | | 209,489 | |
Casa Systems, Inc. (a) | | | 12,603 | | | | 165,477 | |
Ciena Corp. (a) | | | 61,746 | | | | 2,093,807 | |
Comtech Telecommunications Corp. | | | 11,475 | | | | 279,302 | |
Digi International, Inc. (a) | | | 12,500 | | | | 126,125 | |
Extreme Networks, Inc. (a) | | | 50,414 | | | | 307,525 | |
Finisar Corp. (a) | | | 52,901 | | | | 1,142,662 | |
Harmonic, Inc. (a) | | | 38,803 | | | | 183,150 | |
Infinera Corp. (a) (b) | | | 66,643 | | | | 265,906 | |
InterDigital, Inc. | | | 14,704 | | | | 976,787 | |
Lumentum Holdings, Inc. (a) | | | 31,637 | | | | 1,329,070 | |
NETGEAR, Inc. (a) (b) | | | 13,343 | | | | 694,236 | |
NetScout Systems, Inc. (a) | | | 32,759 | | | | 774,095 | |
Plantronics, Inc. | | | 14,059 | | | | 465,353 | |
Quantenna Communications, Inc. (a) | | | 15,870 | | | | 227,735 | |
Ribbon Communications, Inc. (a) | | | 25,862 | | | | 124,655 | |
ViaSat, Inc. (a) (b) | | | 24,578 | | | | 1,448,873 | |
Viavi Solutions, Inc. (a) | | | 100,089 | | | | 1,005,894 | |
| | | | | | | | |
| | | | | | | 12,883,450 | |
| | | | | | | | |
|
| Construction & Engineering—1.0% | |
Aegion Corp. (a) (b) | | | 15,075 | | | | 246,024 | |
Ameresco, Inc. - Class A (a) | | | 9,620 | | | | 135,642 | |
Argan, Inc. | | | 6,140 | | | | 232,338 | |
Comfort Systems USA, Inc. | | | 16,446 | | | | 718,361 | |
Dycom Industries, Inc. (a) (b) | | | 13,476 | | | | 728,243 | |
EMCOR Group, Inc. (b) | | | 25,321 | | | | 1,511,410 | |
Granite Construction, Inc. (b) | | | 19,793 | | | | 797,262 | |
Great Lakes Dredge & Dock Corp. (a) | | | 27,775 | | | | 183,870 | |
KBR, Inc. | | | 62,037 | | | | 941,722 | |
MasTec, Inc. (a) (b) | | | 26,785 | | | | 1,086,400 | |
MYR Group, Inc. (a) | | | 6,874 | | | | 193,641 | |
Northwest Pipe Co. (a) | | | 4,538 | | | | 105,690 | |
NV5 Global, Inc. (a) (b) | | | 3,969 | | | | 240,323 | |
Primoris Services Corp. | | | 17,845 | | | | 341,375 | |
Sterling Construction Co., Inc. (a) | | | 13,246 | | | | 144,249 | |
Tutor Perini Corp. (a) (b) | | | 19,192 | | | | 306,496 | |
Willscot Corp. (a) | | | 14,553 | | | | 137,089 | |
| | | | | | | | |
| | | | | | | 8,050,135 | |
| | | | | | | | |
|
| Construction Materials—0.1% | |
Summit Materials, Inc. - Class A (a) (b) | | | 51,305 | | | | 636,182 | |
U.S. Concrete, Inc. (a) (b) | | | 7,217 | | | | 254,616 | |
| | | | | | | | |
| | | | | | | 890,798 | |
| | | | | | | | |
|
| Consumer Finance—0.7% | |
Encore Capital Group, Inc. (a) (b) | | | 11,469 | | | | 269,522 | |
Enova International, Inc. (a) | | | 15,391 | | | | 299,509 | |
EZCORP, Inc. - Class A (a) (b) | | | 25,543 | | | | 197,447 | |
FirstCash, Inc. | | | 19,348 | | | | 1,399,828 | |
Green Dot Corp. - Class A (a) | | | 21,516 | | | | 1,710,952 | |
LendingClub Corp. (a) | | | 142,833 | | | | 375,651 | |
Nelnet, Inc. - Class A | | | 9,125 | | | | 477,602 | |
PRA Group, Inc. (a) (b) | | | 19,388 | | | | 472,486 | |
Regional Management Corp. (a) | | | 5,496 | | | | 132,179 | |
World Acceptance Corp. (a) | | | 2,848 | | | | 291,236 | |
| | | | | | | | |
| | | | | | | 5,626,412 | |
| | | | | | | | |
|
| Containers & Packaging—0.1% | |
Greif, Inc. - Class A | | | 12,112 | | | | 449,476 | |
Greif, Inc. - Class B | | | 2,277 | | | | 101,099 | |
Myers Industries, Inc. | | | 14,676 | | | | 221,754 | |
UFP Technologies, Inc. (a) | | | 3,172 | | | | 95,287 | |
| | | | | | | | |
| | | | | | | 867,616 | |
| | | | | | | | |
|
| Distributors—0.1% | |
Core-Mark Holding Co., Inc. | | | 21,704 | | | | 504,618 | |
| | | | | | | | |
|
| Diversified Consumer Services—0.9% | |
Adtalem Global Education, Inc. (a) | | | 25,502 | | | | 1,206,755 | |
American Public Education, Inc. (a) | | | 6,406 | | | | 182,315 | |
Career Education Corp. (a) | | | 31,150 | | | | 355,733 | |
Carriage Services, Inc. | | | 7,506 | | | | 116,343 | |
Chegg, Inc. (a) | | | 48,634 | | | | 1,382,178 | |
Houghton Mifflin Harcourt Co. (a) | | | 46,134 | | | | 408,747 | |
K12, Inc. (a) | | | 17,337 | | | | 429,784 | |
See accompanying notes to financial statements.
BHFTII-8
Brighthouse Funds Trust II
MetLife Russell 2000 Index Portfolio
Schedule of Investments as of December 31, 2018
Common Stocks—(Continued)
| | | | | | | | |
| Security Description | | Shares | | | Value | |
|
| Diversified Consumer Services—(Continued) | |
Laureate Education, Inc. - Class A (a) | | | 41,832 | | | $ | 637,520 | |
Regis Corp. (a) | | | 18,180 | | | | 308,151 | |
Sotheby’s (a) | | | 15,890 | | | | 631,469 | |
Strategic Education, Inc. | | | 9,106 | | | | 1,032,802 | |
Weight Watchers International, Inc. (a) | | | 17,564 | | | | 677,092 | |
| | | | | | | | |
| | | | | | | 7,368,889 | |
| | | | | | | | |
|
| Diversified Financial Services—0.2% | |
Banco Latinoamericano de Comercio Exterior S.A. - Class E | | | 14,005 | | | | 242,287 | |
Cannae Holdings, Inc. (a) | | | 30,326 | | | | 519,181 | |
FGL Holdings (a) | | | 61,920 | | | | 412,387 | |
On Deck Capital, Inc. (a) | | | 25,436 | | | | 150,072 | |
| | | | | | | | |
| | | | | | | 1,323,927 | |
| | | | | | | | |
|
| Diversified Telecommunication Services—0.5% | |
ATN International, Inc. | | | 4,754 | | | | 340,054 | |
Cincinnati Bell, Inc. (a) (b) | | | 19,517 | | | | 151,842 | |
Cogent Communications Holdings, Inc. | | | 17,728 | | | | 801,483 | |
Consolidated Communications Holdings, Inc. (b) | | | 32,698 | | | | 323,056 | |
Frontier Communications Corp. (b) | | | 47,610 | | | | 113,312 | |
Intelsat S.A. (a) | | | 23,051 | | | | 493,061 | |
Iridium Communications, Inc. (a) | | | 44,054 | | | | 812,796 | |
Ooma, Inc. (a) | | | 9,215 | | | | 127,904 | |
ORBCOMM, Inc. (a) (b) | | | 31,662 | | | | 261,528 | |
pdvWireless, Inc. (a) | | | 4,481 | | | | 167,545 | |
Vonage Holdings Corp. (a) | | | 92,718 | | | | 809,428 | |
| | | | | | | | |
| | | | | | | 4,402,009 | |
| | | | | | | | |
|
| Electric Utilities—1.2% | |
ALLETE, Inc. | | | 22,048 | | | | 1,680,499 | |
El Paso Electric Co. | | | 17,076 | | | | 856,020 | |
IDACORP, Inc. | | | 21,685 | | | | 2,018,006 | |
MGE Energy, Inc. | | | 15,960 | | | | 956,962 | |
Otter Tail Corp. | | | 18,035 | | | | 895,257 | |
PNM Resources, Inc. | | | 34,438 | | | | 1,415,057 | |
Portland General Electric Co. | | | 38,292 | | | | 1,755,688 | |
| | | | | | | | |
| | | | | | | 9,577,489 | |
| | | | | | | | |
|
| Electrical Equipment—0.7% | |
Allied Motion Technologies, Inc. | | | 3,283 | | | | 146,717 | |
Atkore International Group, Inc. (a) | | | 18,445 | | | | 365,949 | |
AZZ, Inc. | | | 10,507 | | | | 424,062 | |
Encore Wire Corp. | | | 9,729 | | | | 488,201 | |
EnerSys | | | 17,852 | | | | 1,385,494 | |
Enphase Energy, Inc. (a) (b) | | | 41,498 | | | | 196,286 | |
Generac Holdings, Inc. (a) | | | 26,660 | | | | 1,325,002 | |
Plug Power, Inc. (a) (b) | | | 104,473 | | | | 129,547 | |
Powell Industries, Inc. | | | 4,404 | | | | 110,144 | |
Sunrun, Inc. (a) (b) | | | 43,801 | | | | 476,993 | |
Thermon Group Holdings, Inc. (a) | | | 15,847 | | | | 321,377 | |
TPI Composites, Inc. (a) (b) | | | 7,332 | | | | 180,221 | |
Vicor Corp. (a) | | | 7,027 | | | | 265,550 | |
| | | | | | | | |
| | | | | | | 5,815,543 | |
| | | | | | | | |
|
| Electronic Equipment, Instruments & Components—2.4% | |
Anixter International, Inc. (a) | | | 12,098 | | | | 657,042 | |
AVX Corp. | | | 21,871 | | | | 333,533 | |
Badger Meter, Inc. | | | 12,590 | | | | 619,554 | |
Belden, Inc. (b) | | | 17,022 | | | | 711,009 | |
Benchmark Electronics, Inc. | | | 20,690 | | | | 438,214 | |
Control4 Corp. (a) (b) | | | 10,604 | | | | 186,630 | |
CTS Corp. | | | 15,701 | | | | 406,499 | |
Daktronics, Inc. | | | 17,820 | | | | 131,868 | |
Electro Scientific Industries, Inc. (a) | | | 13,300 | | | | 398,468 | |
ePlus, Inc. (a) | | | 6,246 | | | | 444,528 | |
Fabrinet (a) | | | 14,928 | | | | 765,956 | |
FARO Technologies, Inc. (a) | | | 7,841 | | | | 318,658 | |
Fitbit, Inc. - Class A (a) (b) | | | 94,378 | | | | 469,059 | |
II-VI, Inc. (a) | | | 28,216 | | | | 915,891 | |
Insight Enterprises, Inc. (a) (c) | | | 15,396 | | | | 627,387 | |
Itron, Inc. (a) | | | 14,816 | | | | 700,649 | |
KEMET Corp. | | | 25,798 | | | | 452,497 | |
Kimball Electronics, Inc. (a) | | | 14,109 | | | | 218,548 | |
Knowles Corp. (a) (b) | | | 40,362 | | | | 537,218 | |
Mesa Laboratories, Inc. | | | 1,474 | | | | 307,167 | |
Methode Electronics, Inc. | | | 15,351 | | | | 357,525 | |
MTS Systems Corp. | | | 7,482 | | | | 300,253 | |
nLight, Inc. (a) | | | 10,315 | | | | 183,401 | |
Novanta, Inc. (a) | | | 13,765 | | | | 867,195 | |
OSI Systems, Inc. (a) | | | 7,093 | | | | 519,917 | |
PAR Technology Corp. (a) | | | 5,391 | | | | 117,254 | |
Park Electrochemical Corp. (b) | | | 10,569 | | | | 190,982 | |
PC Connection, Inc. | | | 5,366 | | | | 159,531 | |
Plexus Corp. (a) (c) | | | 13,647 | | | | 697,089 | |
Rogers Corp. (a) | | | 8,166 | | | | 808,924 | |
Sanmina Corp. (a) | | | 28,234 | | | | 679,310 | |
ScanSource, Inc. (a) | | | 12,162 | | | | 418,130 | |
SYNNEX Corp. | | | 18,075 | | | | 1,461,183 | |
Tech Data Corp. (a) (b) | | | 16,409 | | | | 1,342,420 | |
TTM Technologies, Inc. (a) | | | 43,439 | | | | 422,661 | |
Vishay Intertechnology, Inc. (b) | | | 56,238 | | | | 1,012,846 | |
Vishay Precision Group, Inc. (a) | | | 5,267 | | | | 159,221 | |
| | | | | | | | |
| | | | | | | 19,338,217 | |
| | | | | | | | |
|
| Energy Equipment & Services—1.1% | |
Archrock, Inc. | | | 54,537 | | | | 408,482 | |
C&J Energy Services, Inc. (a) | | | 30,083 | | | | 406,121 | |
Cactus, Inc. - Class A (a) | | | 17,081 | | | | 468,190 | |
Diamond Offshore Drilling, Inc. (a) (b) | | | 27,291 | | | | 257,627 | |
Dril-Quip, Inc. (a) | | | 15,999 | | | | 480,450 | |
Exterran Corp. (a) | | | 14,849 | | | | 262,827 | |
Forum Energy Technologies, Inc. (a) | | | 38,569 | | | | 159,290 | |
Frank’s International NV (a) | | | 36,054 | | | | 188,202 | |
FTS International, Inc. (a) | | | 16,194 | | | | 115,139 | |
Helix Energy Solutions Group, Inc. (a) (b) | | | 67,569 | | | | 365,548 | |
Keane Group, Inc. (a) | | | 25,842 | | | | 211,388 | |
KLX Energy Services Holdings, Inc. (a) | | | 9,171 | | | | 215,060 | |
Liberty Oilfield Services, Inc. - Class A (b) | | | 20,373 | | | | 263,830 | |
Mammoth Energy Services, Inc. | | | 6,277 | | | | 112,861 | |
Matrix Service Co. (a) | | | 14,196 | | | | 254,676 | |
McDermott International, Inc. (a) | | | 78,718 | | | | 514,816 | |
See accompanying notes to financial statements.
BHFTII-9
Brighthouse Funds Trust II
MetLife Russell 2000 Index Portfolio
Schedule of Investments as of December 31, 2018
Common Stocks—(Continued)
| | | | | | | | |
| Security Description | | Shares | | | Value | |
|
| Energy Equipment & Services—(Continued) | |
Natural Gas Services Group, Inc. (a) | | | 6,643 | | | $ | 109,211 | |
Newpark Resources, Inc. (a) | | | 41,815 | | | | 287,269 | |
Nine Energy Service, Inc. (a) | | | 7,202 | | | | 162,333 | |
Noble Corp. plc (a) (b) | | | 121,320 | | | | 317,858 | |
Oceaneering International, Inc. (a) | | | 45,596 | | | | 551,712 | |
Oil States International, Inc. (a) (b) | | | 27,605 | | | | 394,199 | |
ProPetro Holding Corp. (a) | | | 33,439 | | | | 411,969 | |
Rowan Cos. plc - Class A (a) (b) | | | 56,769 | | | | 476,292 | |
SEACOR Holdings, Inc. (a) | | | 7,977 | | | | 295,149 | |
SEACOR Marine Holdings, Inc. (a) | | | 8,966 | | | | 105,440 | |
Select Energy Services, Inc. - Class A (a) | | | 21,969 | | | | 138,844 | |
Solaris Oilfield Infrastructure, Inc. - Class A (b) | | | 13,032 | | | | 157,557 | |
Superior Energy Services, Inc. (a) | | | 73,574 | | | | 246,473 | |
Tidewater, Inc. (a) | | | 11,300 | | | | 216,169 | |
U.S. Silica Holdings, Inc. (b) | | | 34,136 | | | | 347,505 | |
Unit Corp. (a) | | | 24,655 | | | | 352,073 | |
| | | | | | | | |
| | | | | | | 9,254,560 | |
| | | | | | | | |
|
| Entertainment—0.6% | |
AMC Entertainment Holdings, Inc. - Class A (b) | | | 25,675 | | | | 315,289 | |
Eros International plc (a) | | | 13,360 | | | | 110,754 | |
Glu Mobile, Inc. (a) | | | 50,565 | | | | 408,060 | |
IMAX Corp. (a) | | | 23,016 | | | | 432,931 | |
Liberty Braves Group - Class A (a) | | | 5,080 | | | | 126,695 | |
Liberty Braves Group - Class C (a) | | | 16,010 | | | | 398,489 | |
Marcus Corp. (The) | | | 9,550 | | | | 377,225 | |
Pandora Media, Inc. (a) | | | 113,159 | | | | 915,456 | |
Reading International, Inc. - Class A (a) | | | 8,504 | | | | 123,648 | |
Rosetta Stone, Inc. (a) | | | 9,843 | | | | 161,425 | |
World Wrestling Entertainment, Inc. - Class A | | | 19,301 | | | | 1,442,171 | |
| | | | | | | | |
| | | | | | | 4,812,143 | |
| | | | | | | | |
|
| Equity Real Estate Investment Trusts—6.5% | |
Acadia Realty Trust | | | 34,500 | | | | 819,720 | |
Agree Realty Corp. | | | 14,748 | | | | 871,902 | |
Alexander & Baldwin, Inc. | | | 29,617 | | | | 544,360 | |
Alexander’s, Inc. | | | 1,029 | | | | 313,577 | |
American Assets Trust, Inc. | | | 16,370 | | | | 657,583 | |
Americold Realty Trust | | | 38,305 | | | | 978,310 | |
Armada Hoffler Properties, Inc. | | | 19,662 | | | | 276,448 | |
Ashford Hospitality Trust, Inc. | | | 36,619 | | | | 146,476 | |
Bluerock Residential Growth REIT, Inc. | | | 11,894 | | | | 107,284 | |
Braemar Hotels & Resorts, Inc. | | | 14,521 | | | | 129,672 | |
CareTrust REIT, Inc. | | | 36,768 | | | | 678,737 | |
CatchMark Timber Trust, Inc. - Class A | | | 23,620 | | | | 167,702 | |
CBL & Associates Properties, Inc. (b) | | | 78,126 | | | | 150,002 | |
Cedar Realty Trust, Inc. | | | 37,954 | | | | 119,176 | |
Chatham Lodging Trust | | | 19,109 | | | | 337,847 | |
Chesapeake Lodging Trust | | | 24,761 | | | | 602,930 | |
City Office REIT, Inc. | | | 14,820 | | | | 151,905 | |
Community Healthcare Trust, Inc. | | | 6,825 | | | | 196,765 | |
CoreCivic, Inc. | | | 50,114 | | | | 893,533 | |
CorEnergy Infrastructure Trust, Inc. (b) | | | 5,980 | | | | 197,818 | |
Corepoint Lodging, Inc. | | | 18,376 | | | | 225,106 | |
Cousins Properties, Inc. | | | 183,442 | | | | 1,449,192 | |
DiamondRock Hospitality Co. | | | 92,371 | | | | 838,729 | |
|
| Equity Real Estate Investment Trusts—(Continued) | |
Easterly Government Properties, Inc. (b) | | | 27,307 | | | | 428,174 | |
EastGroup Properties, Inc. | | | 15,737 | | | | 1,443,555 | |
First Industrial Realty Trust, Inc. | | | 53,382 | | | | 1,540,604 | |
Four Corners Property Trust, Inc. | | | 29,818 | | | | 781,232 | |
Franklin Street Properties Corp. | | | 48,177 | | | | 300,143 | |
Front Yard Residential Corp. | | | 23,934 | | | | 208,944 | |
Geo Group, Inc. (The) | | | 53,292 | | | | 1,049,852 | |
Getty Realty Corp. | | | 13,449 | | | | 395,535 | |
Gladstone Commercial Corp. | | | 13,243 | | | | 237,315 | |
Global Net Lease, Inc. | | | 31,987 | | | | 563,611 | |
Government Properties Income Trust (b) | | | 44,872 | | | | 308,271 | |
Hannon Armstrong Sustainable Infrastructure Capital, Inc. | | | 23,478 | | | | 447,256 | |
Healthcare Realty Trust, Inc. (b) | | | 53,035 | | | | 1,508,315 | |
Hersha Hospitality Trust | | | 16,071 | | | | 281,885 | |
Independence Realty Trust, Inc. | | | 39,339 | | | | 361,132 | |
Industrial Logistics Properties Trust (b) | | | 27,724 | | | | 545,334 | |
InfraREIT, Inc. | | | 19,986 | | | | 420,106 | |
Innovative Industrial Properties, Inc. (b) | | | 4,310 | | | | 195,631 | |
Investors Real Estate Trust | | | 5,565 | | | | 273,075 | |
iStar, Inc. | | | 31,393 | | | | 287,874 | |
Jernigan Capital, Inc. | | | 8,813 | | | | 174,674 | |
Kite Realty Group Trust | | | 38,990 | | | | 549,369 | |
Lexington Realty Trust | | | 93,551 | | | | 768,054 | |
LTC Properties, Inc. | | | 17,896 | | | | 745,905 | |
Mack-Cali Realty Corp. | | | 38,134 | | | | 747,045 | |
Monmouth Real Estate Investment Corp. | | | 38,893 | | | | 482,273 | |
National Health Investors, Inc. | | | 18,042 | | | | 1,362,893 | |
National Storage Affiliates Trust | | | 25,366 | | | | 671,184 | |
New Senior Investment Group, Inc. | | | 35,722 | | | | 147,175 | |
NexPoint Residential Trust, Inc. | | | 9,154 | | | | 320,848 | |
NorthStar Realty Europe Corp. | | | 22,208 | | | | 322,904 | |
One Liberty Properties, Inc. | | | 6,290 | | | | 152,344 | |
Pebblebrook Hotel Trust | | | 59,002 | | | | 1,670,347 | |
Pennsylvania Real Estate Investment Trust (b) | | | 32,570 | | | | 193,466 | |
Physicians Realty Trust (b) | | | 82,152 | | | | 1,316,897 | |
Piedmont Office Realty Trust, Inc. - Class A | | | 53,950 | | | | 919,308 | |
PotlatchDeltic Corp. | | | 29,869 | | | | 945,055 | |
Preferred Apartment Communities, Inc. - Class A | | | 18,839 | | | | 264,876 | |
PS Business Parks, Inc. | | | 8,900 | | | | 1,165,900 | |
QTS Realty Trust, Inc. - Class A | | | 22,822 | | | | 845,555 | |
Retail Opportunity Investments Corp. (b) | | | 47,153 | | | | 748,790 | |
Rexford Industrial Realty, Inc. | | | 40,096 | | | | 1,181,629 | |
RLJ Lodging Trust | | | 77,648 | | | | 1,273,427 | |
RPT Realty | | | 37,976 | | | | 453,813 | |
Ryman Hospitality Properties, Inc. | | | 19,180 | | | | 1,279,114 | |
Sabra Health Care REIT, Inc. (b) | | | 75,831 | | | | 1,249,695 | |
Saul Centers, Inc. | | | 5,405 | | | | 255,224 | |
Select Income REIT | | | 36,937 | | | | 271,856 | |
Seritage Growth Properties - Class A (b) | | | 15,000 | | | | 484,950 | |
Spirit MTA REIT | | | 21,163 | | | | 150,892 | |
STAG Industrial, Inc. | | | 41,512 | | | | 1,032,819 | |
Summit Hotel Properties, Inc. | | | 48,101 | | | | 468,023 | |
Sunstone Hotel Investors, Inc. | | | 103,053 | | | | 1,340,719 | |
Tanger Factory Outlet Centers, Inc. (b) | | | 42,302 | | | | 855,346 | |
Terreno Realty Corp. | | | 25,347 | | | | 891,454 | |
Tier REIT, Inc. | | | 22,342 | | | | 460,915 | |
UMH Properties, Inc. | | | 14,825 | | | | 175,528 | |
See accompanying notes to financial statements.
BHFTII-10
Brighthouse Funds Trust II
MetLife Russell 2000 Index Portfolio
Schedule of Investments as of December 31, 2018
Common Stocks—(Continued)
| | | | | | | | |
| Security Description | | Shares | | | Value | |
|
| Equity Real Estate Investment Trusts—(Continued) | |
Universal Health Realty Income Trust | | | 6,109 | | | $ | 374,909 | |
Urban Edge Properties | | | 50,231 | | | | 834,839 | |
Urstadt Biddle Properties, Inc. - Class A | | | 13,207 | | | | 253,839 | |
Washington Prime Group, Inc. (b) | | | 85,471 | | | | 415,389 | |
Washington Real Estate Investment Trust | | | 34,947 | | | | 803,781 | |
Whitestone REIT (b) | | | 18,215 | | | | 223,316 | |
Xenia Hotels & Resorts, Inc. | | | 49,824 | | | | 856,973 | |
| | | | | | | | |
| | | | | | | 52,535,930 | |
| | | | | | | | |
|
| Food & Staples Retailing—0.6% | |
Andersons, Inc. (The) | | | 13,251 | | | | 396,072 | |
BJ’s Wholesale Club Holdings, Inc. (a) | | | 31,105 | | | | 689,287 | |
Chefs’ Warehouse, Inc. (The) (a) | | | 8,577 | | | | 274,293 | |
Ingles Markets, Inc. - Class A | | | 6,173 | | | | 168,029 | |
Performance Food Group Co. (a) | | | 45,579 | | | | 1,470,834 | |
Pricesmart, Inc. | | | 9,083 | | | | 536,805 | |
Rite Aid Corp. (a) (b) | | | 368,023 | | | | 260,671 | |
SpartanNash Co. | | | 16,917 | | | | 290,634 | |
United Natural Foods, Inc. (a) (b) | | | 23,843 | | | | 252,497 | |
Village Super Market, Inc. - Class A | | | 4,043 | | | | 108,110 | |
Weis Markets, Inc. (b) | | | 4,490 | | | | 214,532 | |
| | | | | | | | |
| | | | | | | 4,661,764 | |
| | | | | | | | |
|
| Food Products—1.2% | |
B&G Foods, Inc. (b) | | | 30,133 | | | | 871,145 | |
Cal-Maine Foods, Inc. | | | 14,364 | | | | 607,597 | |
Calavo Growers, Inc. | | | 7,353 | | | | 536,475 | |
Darling Ingredients, Inc. (a) | | | 72,905 | | | | 1,402,692 | |
Dean Foods Co. (b) | | | 42,544 | | | | 162,093 | |
Farmer Bros Co. (a) | | | 3,967 | �� | | | 92,550 | |
Fresh Del Monte Produce, Inc. | | | 13,189 | | | | 372,853 | |
Freshpet, Inc. (a) | | | 10,616 | | | | 341,411 | |
Hostess Brands, Inc. (a) | | | 45,622 | | | | 499,105 | |
J&J Snack Foods Corp. | | | 6,582 | | | | 951,691 | |
John B Sanfilippo & Son, Inc. | | | 4,150 | | | | 230,989 | |
Lancaster Colony Corp. | | | 8,191 | | | | 1,448,660 | |
Landec Corp. (a) | | | 14,010 | | | | 165,878 | |
Limoneira Co. | | | 6,209 | | | | 121,386 | |
Sanderson Farms, Inc. (b) | | | 9,362 | | | | 929,553 | |
Seneca Foods Corp. - Class A (a) | | | 3,596 | | | | 101,479 | |
Simply Good Foods Co. (The) (a) | | | 26,653 | | | | 503,742 | |
Tootsie Roll Industries, Inc. (b) | | | 6,429 | | | | 214,729 | |
| | | | | | | | |
| | | | | | | 9,554,028 | |
| | | | | | | | |
|
| Gas Utilities—1.2% | |
Chesapeake Utilities Corp. | | | 6,975 | | | | 567,068 | |
New Jersey Resources Corp. | | | 38,723 | | | | 1,768,479 | |
Northwest Natural Holding Co. | | | 13,257 | | | | 801,518 | |
ONE Gas, Inc. | | | 22,361 | | | | 1,779,936 | |
RGC Resources, Inc. | | | 3,484 | | | | 104,381 | |
South Jersey Industries, Inc. (b) | | | 37,782 | | | | 1,050,340 | |
Southwest Gas Holdings, Inc. | | | 21,731 | | | | 1,662,421 | |
Spire, Inc. | | | 20,952 | | | | 1,552,124 | |
| | | | | | | | |
| | | | | | | 9,286,267 | |
| | | | | | | | |
|
| Health Care Equipment & Supplies—3.7% | |
Accuray, Inc. (a) | | | 42,251 | | | | 144,076 | |
AngioDynamics, Inc. (a) | | | 17,852 | | | | 359,361 | |
Anika Therapeutics, Inc. (a) (b) | | | 7,087 | | | | 238,194 | |
Antares Pharma, Inc. (a) | | | 69,581 | | | | 189,260 | |
AtriCure, Inc. (a) | | | 16,270 | | | | 497,862 | |
Atrion Corp. | | | 618 | | | | 457,987 | |
Avanos Medical, Inc. (a) | | | 20,898 | | | | 936,021 | |
AxoGen, Inc. (a) | | | 15,476 | | | | 316,175 | |
Cardiovascular Systems, Inc. (a) | | | 14,951 | | | | 425,954 | |
Cerus Corp. (a) | | | 58,326 | | | | 295,713 | |
CONMED Corp. | | | 11,683 | | | | 750,049 | |
CryoLife, Inc. (a) | | | 17,220 | | | | 488,704 | |
CryoPort, Inc. (a) (b) | | | 12,188 | | | | 134,434 | |
Cutera, Inc. (a) | | | 6,744 | | | | 114,783 | |
CytoSorbents Corp. (a) | | | 14,785 | | | | 119,463 | |
GenMark Diagnostics, Inc. (a) | | | 26,350 | | | | 128,061 | |
Glaukos Corp. (a) (b) | | | 15,446 | | | | 867,602 | |
Globus Medical, Inc. - Class A (a) | | | 32,771 | | | | 1,418,329 | |
Haemonetics Corp. (a) | | | 22,809 | | | | 2,282,040 | |
Heska Corp. (a) (b) | | | 3,277 | | | | 282,150 | |
Inogen, Inc. (a) | | | 7,603 | | | | 944,064 | |
Integer Holdings Corp. (a) | | | 13,621 | | | | 1,038,737 | |
iRhythm Technologies, Inc. (a) | | | 11,010 | | | | 764,975 | |
Lantheus Holdings, Inc. (a) | | | 18,267 | | | | 285,878 | |
LeMaitre Vascular, Inc. | | | 7,651 | | | | 180,870 | |
LivaNova plc (a) | | | 21,333 | | | | 1,951,329 | |
Meridian Bioscience, Inc. | | | 22,552 | | | | 391,503 | |
Merit Medical Systems, Inc. (a) | | | 23,561 | | | | 1,314,939 | |
Natus Medical, Inc. (a) (b) | | | 15,157 | | | | 515,793 | |
Neogen Corp. (a) | | | 21,760 | | | | 1,240,320 | |
Nevro Corp. (a) | | | 13,030 | | | | 506,737 | |
Novocure, Ltd. (a) | | | 33,161 | | | | 1,110,230 | |
NuVasive, Inc. (a) | | | 22,101 | | | | 1,095,326 | |
Nuvectra Corp. (a) | | | 7,371 | | | | 120,442 | |
NxStage Medical, Inc. (a) | | | 30,508 | | | | 873,139 | |
OraSure Technologies, Inc. (a) | | | 28,446 | | | | 332,249 | |
Orthofix Medical, Inc. (a) | | | 7,561 | | | | 396,877 | |
OrthoPediatrics Corp. (a) | | | 3,676 | | | | 128,219 | |
Oxford Immunotec Global plc (a) | | | 12,520 | | | | 160,006 | |
Quidel Corp. (a) | | | 15,132 | | | | 738,744 | |
RTI Surgical, Inc. (a) | | | 30,074 | | | | 111,274 | |
SeaSpine Holdings Corp. (a) | | | 7,730 | | | | 140,995 | |
Senseonics Holdings, Inc. (a) (b) | | | 42,278 | | | | 109,500 | |
Sientra, Inc. (a) | | | 11,599 | | | | 147,423 | |
STAAR Surgical Co. (a) | | | 19,419 | | | | 619,660 | |
SurModics, Inc. (a) | | | 6,159 | | | | 291,074 | |
Tactile Systems Technology, Inc. (a) | | | 8,238 | | | | 375,241 | |
Tandem Diabetes Care, Inc. (a) | | | 22,706 | | | | 862,147 | |
TransEnterix, Inc. (a) (b) | | | 73,037 | | | | 165,064 | |
Utah Medical Products, Inc. | | | 2,002 | | | | 166,326 | |
Varex Imaging Corp. (a) | | | 17,885 | | | | 423,517 | |
ViewRay, Inc. (a) (b) | | | 25,410 | | | | 154,239 | |
Wright Medical Group NV (a) | | | 55,761 | | | | 1,517,814 | |
| | | | | | | | |
| | | | | | | 29,620,869 | |
| | | | | | | | |
See accompanying notes to financial statements.
BHFTII-11
Brighthouse Funds Trust II
MetLife Russell 2000 Index Portfolio
Schedule of Investments as of December 31, 2018
Common Stocks—(Continued)
| | | | | | | | |
| Security Description | | Shares | | | Value | |
|
| Health Care Providers & Services—1.9% | |
Addus HomeCare Corp. (a) | | | 4,191 | | | $ | 284,485 | |
Amedisys, Inc. (a) | | | 11,809 | | | | 1,382,952 | |
AMN Healthcare Services, Inc. (a) | | | 21,592 | | | | 1,223,403 | |
BioScrip, Inc. (a) | | | 62,422 | | | | 222,846 | |
BioTelemetry, Inc. (a) | | | 15,132 | | | | 903,683 | |
Brookdale Senior Living, Inc. (a) | | | 86,808 | | | | 581,614 | |
Civitas Solutions, Inc. (a) | | | 8,134 | | | | 142,426 | |
Community Health Systems, Inc. (a) (b) | | | 43,641 | | | | 123,068 | |
Corvel Corp. (a) | | | 4,267 | | | | 263,359 | |
Cross Country Healthcare, Inc. (a) | | | 16,495 | | | | 120,908 | |
Diplomat Pharmacy, Inc. (a) (b) | | | 26,141 | | | | 351,858 | |
Ensign Group, Inc. (The) | | | 21,431 | | | | 831,308 | |
Guardant Health, Inc. (a) | | | 8,622 | | | | 324,101 | |
HealthEquity, Inc. (a) (b) | | | 23,550 | | | | 1,404,757 | |
LHC Group, Inc. (a) | | | 13,057 | | | | 1,225,791 | |
Magellan Health, Inc. (a) | | | 11,100 | | | | 631,479 | |
National Healthcare Corp. | | | 5,246 | | | | 411,549 | |
National Research Corp. - Class A | | | 4,950 | | | | 188,793 | |
Owens & Minor, Inc. | | | 28,475 | | | | 180,247 | |
Patterson Cos., Inc. | | | 37,980 | | | | 746,687 | |
PetIQ, Inc. (a) (b) | | | 7,710 | | | | 180,954 | |
Providence Service Corp. (The) (a) | | | 5,978 | | | | 358,799 | |
R1 RCM, Inc. (a) | | | 47,026 | | | | 373,857 | |
RadNet, Inc. (a) | | | 21,044 | | | | 214,017 | |
Select Medical Holdings Corp. (a) | | | 47,385 | | | | 727,360 | |
Surgery Partners, Inc. (a) | | | 9,540 | | | | 93,397 | |
Tenet Healthcare Corp. (a) | | | 38,490 | | | | 659,719 | |
Tivity Health, Inc. (a) | | | 18,680 | | | | 463,451 | |
Triple-S Management Corp. - Class B (a) | | | 9,291 | | | | 161,570 | |
U.S. Physical Therapy, Inc. | | | 6,011 | | | | 615,226 | |
| | | | | | | | |
| | | | | | | 15,393,664 | |
| | | | | | | | |
|
| Health Care Technology—1.1% | |
Allscripts Healthcare Solutions, Inc. (a) (b) | | | 77,571 | | | | 747,784 | |
Computer Programs & Systems, Inc. (b) | | | 5,856 | | | | 146,986 | |
Evolent Health, Inc. - Class A (a) | | | 31,066 | | | | 619,767 | |
HealthStream, Inc. | | | 12,016 | | | | 290,186 | |
HMS Holdings Corp. (a) | | | 37,216 | | | | 1,046,886 | |
Inovalon Holdings, Inc. - Class A (a) (b) | | | 29,972 | | | | 425,003 | |
Inspire Medical Systems, Inc. (a) | | | 5,663 | | | | 239,262 | |
Medidata Solutions, Inc. (a) (b) | | | 24,663 | | | | 1,662,780 | |
NextGen Healthcare, Inc. (a) | | | 24,814 | | | | 375,932 | |
Omnicell, Inc. (a) | | | 16,836 | | | | 1,031,037 | |
Simulations Plus, Inc. | | | 5,451 | | | | 108,475 | |
Tabula Rasa HealthCare, Inc. (a) | | | 8,170 | | | | 520,919 | |
Teladoc Health, Inc. (a) (b) | | | 29,056 | | | | 1,440,306 | |
Vocera Communications, Inc. (a) (b) | | | 13,407 | | | | 527,565 | |
| | | | | | | | |
| | | | | | | 9,182,888 | |
| | | | | | | | |
|
| Hotels, Restaurants & Leisure—2.9% | |
BBX Capital Corp. | | | 25,192 | | | | 144,350 | |
Belmond, Ltd. - Class A (a) | | | 38,434 | | | | 962,003 | |
BJ’s Restaurants, Inc. | | | 9,083 | | | | 459,327 | |
Bloomin’ Brands, Inc. | | | 36,028 | | | | 644,541 | |
Bojangles’, Inc. (a) | | | 8,300 | | | | 133,464 | |
Boyd Gaming Corp. (b) | | | 36,831 | | | | 765,348 | |
|
| Hotels, Restaurants & Leisure—(Continued) | |
Brinker International, Inc. (b) | | | 16,964 | | | | 746,077 | |
Carrols Restaurant Group, Inc. (a) | | | 17,458 | | | | 171,787 | |
Cheesecake Factory, Inc. (The) (b) | | | 18,905 | | | | 822,557 | |
Churchill Downs, Inc. | | | 4,976 | | | | 1,213,846 | |
Chuy’s Holdings, Inc. (a) (b) | | | 8,272 | | | | 146,745 | |
Cracker Barrel Old Country Store, Inc. (b) | | | 8,458 | | | | 1,352,096 | |
Dave & Buster’s Entertainment, Inc. (b) | | | 17,269 | | | | 769,507 | |
Del Frisco’s Restaurant Group, Inc. (a) | | | 16,266 | | | | 116,302 | |
Del Taco Restaurants, Inc. (a) | | | 16,196 | | | | 161,798 | |
Denny’s Corp. (a) | | | 25,229 | | | | 408,962 | |
Dine Brands Global, Inc. | | | 7,762 | | | | 522,693 | |
Drive Shack, Inc. (a) | | | 29,184 | | | | 114,401 | |
El Pollo Loco Holdings, Inc. (a) | | | 10,879 | | | | 165,034 | |
Eldorado Resorts, Inc. (a) | | | 27,820 | | | | 1,007,362 | |
Fiesta Restaurant Group, Inc. (a) | | | 9,712 | | | | 150,633 | |
Golden Entertainment, Inc. (a) | | | 8,432 | | | | 135,081 | |
Habit Restaurants, Inc. (The) - Class A (a) | | | 10,004 | | | | 105,042 | |
International Speedway Corp. - Class A | | | 10,424 | | | | 457,197 | |
Jack in the Box, Inc. | | | 12,021 | | | | 933,190 | |
Lindblad Expeditions Holdings, Inc. (a) | | | 10,779 | | | | 145,085 | |
Marriott Vacations Worldwide Corp. | | | 16,923 | | | | 1,193,241 | |
Monarch Casino & Resort, Inc. (a) | | | 5,265 | | | | 200,807 | |
Papa John’s International, Inc. (b) | | | 10,257 | | | | 408,331 | |
Penn National Gaming, Inc. (a) | | | 48,164 | | | | 906,928 | |
Planet Fitness, Inc. - Class A (a) | | | 37,935 | | | | 2,034,075 | |
PlayAGS, Inc. (a) | | | 9,992 | | | | 229,816 | |
Potbelly Corp. (a) | | | 12,520 | | | | 100,786 | |
Red Robin Gourmet Burgers, Inc. (a) (b) | | | 5,863 | | | | 156,659 | |
Red Rock Resorts, Inc. - Class A | | | 32,000 | | | | 649,920 | |
Ruth’s Hospitality Group, Inc. | | | 13,027 | | | | 296,104 | |
Scientific Games Corp. - Class A (a) (b) | | | 24,798 | | | | 443,388 | |
SeaWorld Entertainment, Inc. (a) | | | 25,485 | | | | 562,964 | |
Shake Shack, Inc. - Class A (a) | | | 11,359 | | | | 515,926 | |
Texas Roadhouse, Inc. | | | 29,169 | | | | 1,741,389 | |
Wingstop, Inc. | | | 12,085 | | | | 775,736 | |
| | | | | | | | |
| | | | | | | 22,970,498 | |
| | | | | | | | |
|
| Household Durables—1.4% | |
Bassett Furniture Industries, Inc. | | | 4,989 | | | | 99,980 | |
Beazer Homes USA, Inc. (a) | | | 13,700 | | | | 129,876 | |
Cavco Industries, Inc. (a) | | | 3,571 | | | | 465,587 | |
Century Communities, Inc. (a) | | | 12,109 | | | | 209,001 | |
Ethan Allen Interiors, Inc. (b) | | | 12,159 | | | | 213,877 | |
GoPro, Inc. - Class A (a) (b) | | | 52,565 | | | | 222,876 | |
Helen of Troy, Ltd. (a) | | | 11,424 | | | | 1,498,600 | |
Hooker Furniture Corp. | | | 5,444 | | | | 143,395 | |
Installed Building Products, Inc. (a) | | | 9,469 | | | | 319,011 | |
iRobot Corp. (a) (b) | | | 11,431 | | | | 957,232 | |
KB Home | | | 37,780 | | | | 721,598 | |
La-Z-Boy, Inc. | | | 21,678 | | | | 600,697 | |
LGI Homes, Inc. (a) (b) | | | 8,210 | | | | 371,256 | |
M/I Homes, Inc. (a) | | | 12,868 | | | | 270,485 | |
MDC Holdings, Inc. | | | 19,261 | | | | 541,427 | |
Meritage Homes Corp. (a) | | | 15,760 | | | | 578,707 | |
Roku, Inc. (a) | | | 19,013 | | | | 582,558 | |
Skyline Champion Corp. | | | 13,094 | | | | 192,351 | |
See accompanying notes to financial statements.
BHFTII-12
Brighthouse Funds Trust II
MetLife Russell 2000 Index Portfolio
Schedule of Investments as of December 31, 2018
Common Stocks—(Continued)
| | | | | | | | |
| Security Description | | Shares | | | Value | |
|
| Household Durables—(Continued) | |
Taylor Morrison Home Corp. - Class A (a) | | | 53,102 | | | $ | 844,322 | |
TopBuild Corp. (a) | | | 15,564 | | | | 700,380 | |
TRI Pointe Group, Inc. (a) (b) | | | 66,237 | | | | 723,970 | |
Tupperware Brands Corp. | | | 21,006 | | | | 663,160 | |
Universal Electronics, Inc. (a) | | | 6,028 | | | | 152,388 | |
William Lyon Homes - Class A (a) | | | 14,816 | | | | 158,383 | |
ZAGG, Inc. (a) | | | 14,118 | | | | 138,074 | |
| | | | | | | | |
| | | | | | | 11,499,191 | |
| | | | | | | | |
|
| Household Products—0.2% | |
Central Garden and Pet Co. (a) | | | 4,446 | | | | 153,165 | |
Central Garden and Pet Co. - Class A (a) | | | 18,062 | | | | 564,437 | |
WD-40 Co. (b) | | | 5,879 | | | | 1,077,386 | |
| | | | | | | | |
| | | | | | | 1,794,988 | |
| | | | | | | | |
|
| Independent Power and Renewable Electricity Producers—0.4% | |
Atlantic Power Corp. (a) | | | 50,551 | | | | 109,696 | |
Clearway Energy, Inc. - Class A | | | 16,087 | | | | 272,192 | |
Clearway Energy, Inc. - Class C | | | 32,256 | | | | 556,416 | |
Ormat Technologies, Inc. | | | 16,822 | | | | 879,791 | |
Pattern Energy Group, Inc. - Class A | | | 35,949 | | | | 669,370 | |
TerraForm Power, Inc. - Class A | | | 34,889 | | | | 391,454 | |
| | | | | | | | |
| | | | | | | 2,878,919 | |
| | | | | | | | |
|
| Industrial Conglomerates—0.1% | |
Raven Industries, Inc. | | | 15,898 | | | | 575,349 | |
| | | | | | | | |
|
| Insurance—2.8% | |
Ambac Financial Group, Inc. (a) | | | 22,444 | | | | 386,935 | |
American Equity Investment Life Holding Co. | | | 37,983 | | | | 1,061,245 | |
AMERISAFE, Inc. | | | 7,822 | | | | 443,429 | |
Argo Group International Holdings, Ltd. | | | 14,435 | | | | 970,754 | |
Citizens, Inc. (a) (b) | | | 22,172 | | | | 166,733 | |
CNO Financial Group, Inc. | | | 71,414 | | | | 1,062,640 | |
eHealth, Inc. (a) | | | 7,987 | | | | 306,861 | |
EMC Insurance Group, Inc. | | | 4,472 | | | | 142,433 | |
Employers Holdings, Inc. | | | 14,789 | | | | 620,694 | |
Enstar Group, Ltd. (a) | | | 5,526 | | | | 925,992 | |
FBL Financial Group, Inc. - Class A | | | 4,790 | | | | 314,463 | |
FedNat Holding Co. | | | 5,989 | | | | 119,301 | |
Genworth Financial, Inc. - Class A (a) | | | 223,663 | | | | 1,042,270 | |
Global Indemnity, Ltd. | | | 3,335 | | | | 120,827 | |
Goosehead Insurance, Inc. - Class A (a) | | | 5,024 | | | | 132,081 | |
Greenlight Capital Re, Ltd. - Class A (a) (b) | | | 13,998 | | | | 120,663 | |
HCI Group, Inc. (b) | | | 2,670 | | | | 135,663 | |
Health Insurance Innovations, Inc. - Class A (a) (b) | | | 5,782 | | | | 154,553 | |
Heritage Insurance Holdings, Inc. | | | 11,792 | | | | 173,578 | |
Horace Mann Educators Corp. | | | 18,978 | | | | 710,726 | |
Investors Title Co. | | | 687 | | | | 121,379 | |
James River Group Holdings, Ltd. | | | 12,177 | | | | 444,948 | |
Kemper Corp. | | | 23,579 | | | | 1,565,174 | |
Kinsale Capital Group, Inc. | | | 9,172 | | | | 509,596 | |
MBIA, Inc. (a) | | | 41,874 | | | | 373,516 | |
National General Holdings Corp. | | | 28,508 | | | | 690,179 | |
National Western Life Group, Inc. - Class A | | | 1,054 | | | | 316,938 | |
|
| Insurance—(Continued) | |
Navigators Group, Inc. (The) | | | 9,344 | | | | 649,315 | |
Primerica, Inc. | | | 18,907 | | | | 1,847,403 | |
ProAssurance Corp. | | | 22,282 | | | | 903,758 | |
RLI Corp. (b) | | | 16,583 | | | | 1,144,061 | |
Safety Insurance Group, Inc. | | | 6,815 | | | | 557,535 | |
Selective Insurance Group, Inc. | | | 24,829 | | | | 1,513,079 | |
State Auto Financial Corp. | | | 7,940 | | | | 270,278 | |
Stewart Information Services Corp. | | | 10,993 | | | | 455,110 | |
Third Point Reinsurance, Ltd. (a) | | | 34,789 | | | | 335,366 | |
Trupanion, Inc. (a) (b) | | | 11,074 | | | | 281,944 | |
United Fire Group, Inc. | | | 9,677 | | | | 536,590 | |
United Insurance Holdings Corp. | | | 8,654 | | | | 143,829 | |
Universal Insurance Holdings, Inc. (b) | | | 13,371 | | | | 507,028 | |
| | | | | | | | |
| | | | | | | 22,278,867 | |
| | | | | | | | |
|
| Interactive Media & Services—0.5% | |
Care.com, Inc. (a) | | | 6,999 | | | | 135,151 | |
Cargurus, Inc. (a) | | | 21,694 | | | | 731,739 | |
Cars.com, Inc. (a) (b) | | | 29,503 | | | | 634,314 | |
Liberty TripAdvisor Holdings, Inc. - Class A (a) | | | 34,803 | | | | 553,020 | |
Meet Group, Inc. (The) (a) | | | 33,008 | | | | 152,827 | |
QuinStreet, Inc. (a) | | | 18,085 | | | | 293,520 | |
TrueCar, Inc. (a) | | | 42,606 | | | | 386,010 | |
Yelp, Inc. (a) (b) | | | 36,366 | | | | 1,272,446 | |
| | | | | | | | |
| | | | | | | 4,159,027 | |
| | | | | | | | |
|
| Internet & Direct Marketing Retail—0.9% | |
1-800-Flowers.com, Inc. - Class A (a) | | | 13,330 | | | | 163,026 | |
Etsy, Inc. (a) (b) | | | 52,499 | | | | 2,497,378 | |
Groupon, Inc. (a) (b) | | | 195,286 | | | | 624,915 | |
Liberty Expedia Holdings, Inc. - Class A (a) | | | 22,829 | | | | 892,842 | |
Nutrisystem, Inc. | | | 12,339 | | | | 541,435 | |
Overstock.com, Inc. (a) (b) | | | 9,776 | | | | 132,758 | |
PetMed Express, Inc. (b) | | | 9,436 | | | | 219,481 | |
Quotient Technology, Inc. (a) | | | 35,202 | | | | 375,958 | |
Shutterfly, Inc. (a) | | | 15,092 | | | | 607,604 | |
Shutterstock, Inc. | | | 9,230 | | | | 332,372 | |
Stamps.com, Inc. (a) | | | 7,719 | | | | 1,201,385 | |
| | | | | | | | |
| | | | | | | 7,589,154 | |
| | | | | | | | |
|
| IT Services—2.0% | |
Brightcove, Inc. (a) | | | 17,189 | | | | 121,011 | |
CACI International, Inc. - Class A (a) (c) | | | 10,580 | | | | 1,523,837 | |
Carbonite, Inc. (a) | | | 13,993 | | | | 353,463 | |
Cardtronics plc - Class A (a) | | | 17,673 | | | | 459,498 | |
Cass Information Systems, Inc. | | | 5,890 | | | | 311,699 | |
ConvergeOne Holdings, Inc. | | | 12,447 | | | | 154,094 | |
CSG Systems International, Inc. (b) | | | 15,258 | | | | 484,747 | |
Endurance International Group Holdings, Inc. (a) | | | 27,122 | | | | 180,361 | |
Everi Holdings, Inc. (a) | | | 31,818 | | | | 163,863 | |
EVERTEC, Inc. | | | 25,916 | | | | 743,789 | |
Evo Payments, Inc. - Class A (a) (b) | | | 11,615 | | | | 286,542 | |
ExlService Holdings, Inc. (a) | | | 15,305 | | | | 805,349 | |
GTT Communications, Inc. (a) (b) | | | 18,758 | | | | 443,814 | |
Hackett Group, Inc. (The) | | | 11,151 | | | | 178,527 | |
See accompanying notes to financial statements.
BHFTII-13
Brighthouse Funds Trust II
MetLife Russell 2000 Index Portfolio
Schedule of Investments as of December 31, 2018
Common Stocks—(Continued)
| | | | | | | | |
| Security Description | | Shares | | | Value | |
|
| IT Services—(Continued) | |
Limelight Networks, Inc. (a) | | | 43,835 | | | $ | 102,574 | |
LiveRamp Holdings, Inc. (a) | | | 34,321 | | | | 1,325,820 | |
ManTech International Corp. - Class A | | | 10,826 | | | | 566,146 | |
MAXIMUS, Inc. | | | 27,829 | | | | 1,811,390 | |
NIC, Inc. | | | 29,109 | | | | 363,280 | |
Perficient, Inc. (a) | | | 13,564 | | | | 301,935 | |
Perspecta, Inc. (b) | | | 61,282 | | | | 1,055,276 | |
Presidio, Inc. | | | 16,489 | | | | 215,181 | |
Science Applications International Corp. | | | 17,892 | | | | 1,139,720 | |
Sykes Enterprises, Inc. (a) | | | 18,634 | | | | 460,819 | |
Travelport Worldwide, Ltd. | | | 56,729 | | | | 886,107 | |
TTEC Holdings, Inc. | | | 7,377 | | | | 210,761 | |
Tucows, Inc. - Class A (a) (b) | | | 4,376 | | | | 262,823 | |
Unisys Corp. (a) (b) | | | 20,742 | | | | 241,229 | |
Virtusa Corp. (a) | | | 12,986 | | | | 553,074 | |
| | | | | | | | |
| | | | | | | 15,706,729 | |
| | | | | | | | |
|
| Leisure Products—0.4% | |
Acushnet Holdings Corp. | | | 14,893 | | | | 313,796 | |
American Outdoor Brands Corp. (a) | | | 25,637 | | | | 329,692 | |
Callaway Golf Co. | | | 43,200 | | | | 660,960 | |
Clarus Corp. | | | 10,372 | | | | 104,965 | |
Johnson Outdoors, Inc. - Class A | | | 2,524 | | | | 148,260 | |
Malibu Boats, Inc. - Class A (a) | | | 8,768 | | | | 305,126 | |
MasterCraft Boat Holdings, Inc. (a) | | | 9,205 | | | | 172,133 | |
Nautilus, Inc. (a) | | | 16,328 | | | | 177,975 | |
Sturm Ruger & Co., Inc. | | | 7,553 | | | | 401,971 | |
Vista Outdoor, Inc. (a) (b) | | | 27,041 | | | | 306,915 | |
YETI Holdings, Inc. (a) | | | 13,847 | | | | 205,489 | |
| | | | | | | | |
| | | | | | | 3,127,282 | |
| | | | | | | | |
|
| Life Sciences Tools & Services—0.5% | |
Accelerate Diagnostics, Inc. (a) (b) | | | 11,348 | | | | 130,502 | |
Cambrex Corp. (a) (b) | | | 15,180 | | | | 573,197 | |
Codexis, Inc. (a) (b) | | | 21,463 | | | | 358,432 | |
Luminex Corp. | | | 18,901 | | | | 436,802 | |
Medpace Holdings, Inc. (a) | | | 9,844 | | | | 521,043 | |
NanoString Technologies, Inc. (a) | | | 11,330 | | | | 168,024 | |
NeoGenomics, Inc. (a) (b) | | | 26,497 | | | | 334,127 | |
Pacific Biosciences of California, Inc. (a) | | | 57,706 | | | | 427,024 | |
Syneos Health, Inc. (a) | | | 28,231 | | | | 1,110,890 | |
| | | | | | | | |
| | | | | | | 4,060,041 | |
| | | | | | | | |
|
| Machinery—3.6% | |
Actuant Corp. - Class A | | | 28,401 | | | | 596,137 | |
Alamo Group, Inc. | | | 4,629 | | | | 357,914 | |
Albany International Corp. - Class A | | | 12,352 | | | | 771,135 | |
Altra Industrial Motion Corp. | | | 27,121 | | | | 682,093 | |
Astec Industries, Inc. | | | 10,105 | | | | 305,070 | |
Barnes Group, Inc. | | | 20,566 | | | | 1,102,749 | |
Blue Bird Corp. (a) | | | 5,751 | | | | 104,611 | |
Briggs & Stratton Corp. (b) | | | 19,347 | | | | 253,059 | |
Chart Industries, Inc. (a) | | | 14,133 | | | | 919,069 | |
CIRCOR International, Inc. | | | 7,291 | | | | 155,298 | |
Columbus McKinnon Corp. | | | 10,074 | | | | 303,630 | |
|
| Machinery—(Continued) | |
DMC Global, Inc. | | | 7,160 | | | | 251,459 | |
Douglas Dynamics, Inc. | | | 9,877 | | | | 354,486 | |
Energy Recovery, Inc. (a) (b) | | | 17,996 | | | | 121,113 | |
EnPro Industries, Inc. | | | 8,388 | | | | 504,119 | |
ESCO Technologies, Inc. | | | 10,899 | | | | 718,789 | |
Evoqua Water Technologies Corp. (a) | | | 34,844 | | | | 334,502 | |
Federal Signal Corp. | | | 27,402 | | | | 545,300 | |
Franklin Electric Co., Inc. | | | 21,104 | | | | 904,940 | |
Global Brass & Copper Holdings, Inc. | | | 11,099 | | | | 279,140 | |
Gorman-Rupp Co. (The) | | | 7,300 | | | | 236,593 | |
Graham Corp. | | | 4,832 | | | | 110,363 | |
Greenbrier Cos., Inc. (The) | | | 14,568 | | | | 576,019 | |
Harsco Corp. (a) | | | 33,858 | | | | 672,420 | |
Hillenbrand, Inc. | | | 26,557 | | | | 1,007,307 | |
Hurco Cos., Inc. | | | 3,167 | | | | 113,062 | |
Hyster-Yale Materials Handling, Inc. | | | 4,976 | | | | 308,313 | |
John Bean Technologies Corp. | | | 13,882 | | | | 996,866 | |
Kadant, Inc. | | | 4,675 | | | | 380,825 | |
Kennametal, Inc. (b) | | | 34,945 | | | | 1,162,970 | |
Lindsay Corp. | | | 4,595 | | | | 442,269 | |
Lydall, Inc. (a) | | | 8,342 | | | | 169,426 | |
Manitowoc Co., Inc. (The) (a) | | | 15,849 | | | | 234,090 | |
Meritor, Inc. (a) | | | 37,321 | | | | 631,098 | |
Milacron Holdings Corp. (a) | | | 30,587 | | | | 363,679 | |
Miller Industries, Inc. | | | 5,680 | | | | 153,360 | |
Mueller Industries, Inc. | | | 26,115 | | | | 610,046 | |
Mueller Water Products, Inc. - Class A | | | 67,872 | | | | 617,635 | |
Navistar International Corp. (a) | | | 21,262 | | | | 551,749 | |
NN, Inc. (b) | | | 12,696 | | | | 85,190 | |
Park-Ohio Holdings Corp. | | | 4,748 | | | | 145,716 | |
Proto Labs, Inc. (a) | | | 11,672 | | | | 1,316,485 | |
RBC Bearings, Inc. (a) | | | 10,400 | | | | 1,363,440 | |
REV Group, Inc. (b) | | | 11,893 | | | | 89,316 | |
Rexnord Corp. (a) | | | 44,341 | | | | 1,017,626 | |
Spartan Motors, Inc. | | | 16,327 | | | | 118,044 | |
SPX Corp. (a) | | | 17,680 | | | | 495,217 | |
SPX FLOW, Inc. (a) | | | 19,349 | | | | 588,597 | |
Standex International Corp. | | | 5,879 | | | | 394,951 | |
Sun Hydraulics Corp. | | | 12,428 | | | | 412,485 | |
Tennant Co. | | | 8,362 | | | | 435,744 | |
Titan International, Inc. | | | 22,706 | | | | 105,810 | |
TriMas Corp. (a) | | | 18,947 | | | | 517,064 | |
Wabash National Corp. | | | 27,273 | | | | 356,731 | |
Watts Water Technologies, Inc. - Class A | | | 12,721 | | | | 820,886 | |
Woodward, Inc. | | | 22,995 | | | | 1,708,299 | |
| | | | | | | | |
| | | | | | | 28,874,304 | |
| | | | | | | | |
|
| Marine—0.1% | |
Costamare, Inc. | | | 19,016 | | | | 83,480 | |
Eagle Bulk Shipping, Inc. (a) | | | 23,786 | | | | 109,654 | |
Matson, Inc. | | | 17,506 | | | | 560,542 | |
Scorpio Bulkers, Inc. | | | 28,455 | | | | 157,356 | |
| | | | | | | | |
| | | | | | | 911,032 | |
| | | | | | | | |
|
| Media—1.4% | |
Central European Media Enterprises, Ltd. - Class A (a) | | | 41,828 | | | | 116,282 | |
See accompanying notes to financial statements.
BHFTII-14
Brighthouse Funds Trust II
MetLife Russell 2000 Index Portfolio
Schedule of Investments as of December 31, 2018
Common Stocks—(Continued)
| | | | | | | | |
| Security Description | | Shares | | | Value | |
|
| Media—(Continued) | |
Clear Channel Outdoor Holdings, Inc. - Class A | | | 18,388 | | | $ | 95,434 | |
Daily Journal Corp. (a) (b) | | | 598 | | | | 139,932 | |
Emerald Expositions Events, Inc. | | | 11,929 | | | | 147,204 | |
Entercom Communications Corp. - Class A (b) | | | 57,510 | | | | 328,382 | |
EW Scripps Co. (The) - Class A | | | 21,625 | | | | 340,161 | |
Gannett Co., Inc. | | | 48,407 | | | | 412,912 | |
Gray Television, Inc. (a) | | | 36,845 | | | | 543,095 | |
Hemisphere Media Group, Inc. (a) | | | 9,041 | | | | 109,758 | |
Liberty Latin America, Ltd. - Class A (a) (b) | | | 20,395 | | | | 295,320 | |
Liberty Latin America, Ltd. - Class C (a) (b) | | | 52,143 | | | | 759,724 | |
Loral Space & Communications, Inc. (a) | | | 6,669 | | | | 248,420 | |
Meredith Corp. (b) | | | 16,644 | | | | 864,489 | |
MSG Networks, Inc. - Class A (a) (b) | | | 24,914 | | | | 586,974 | |
National CineMedia, Inc. | | | 30,282 | | | | 196,227 | |
New Media Investment Group, Inc. | | | 27,741 | | | | 320,963 | |
New York Times Co. (The) - Class A | | | 58,218 | | | | 1,297,679 | |
Nexstar Media Group, Inc. - Class A (b) | | | 19,881 | | | | 1,563,442 | |
Scholastic Corp. | | | 13,390 | | | | 539,081 | |
Sinclair Broadcast Group, Inc. - Class A | | | 28,841 | | | | 759,672 | |
TechTarget, Inc. (a) | | | 9,817 | | | | 119,866 | |
TEGNA, Inc. | | | 94,828 | | | | 1,030,780 | |
Tribune Publishing Co. (a) | | | 6,955 | | | | 78,870 | |
WideOpenWest, Inc. (a) | | | 15,386 | | | | 109,702 | |
| | | | | | | | |
| | | | | | | 11,004,369 | |
| | | | | | | | |
|
| Metals & Mining—1.1% | |
AK Steel Holding Corp. (a) (b) | | | 106,332 | | | | 239,247 | |
Allegheny Technologies, Inc. (a) (b) | | | 56,239 | | | | 1,224,323 | |
Carpenter Technology Corp. | | | 20,845 | | | | 742,290 | |
Century Aluminum Co. (a) (b) | | | 22,819 | | | | 166,807 | |
Cleveland-Cliffs, Inc. (a) (b) | | | 134,737 | | | | 1,036,128 | |
Coeur Mining, Inc. (a) | | | 83,654 | | | | 373,933 | |
Commercial Metals Co. | | | 48,444 | | | | 776,073 | |
Compass Minerals International, Inc. (b) | | | 15,656 | | | | 652,699 | |
Ferroglobe Representation & Warranty Insurance Trust (a) (d) | | | 31,634 | | | | 0 | |
Gold Resource Corp. | | | 25,100 | | | | 100,400 | |
Haynes International, Inc. | | | 6,653 | | | | 175,639 | |
Hecla Mining Co. (b) | | | 201,874 | | | | 476,423 | |
Kaiser Aluminum Corp. | | | 6,611 | | | | 590,296 | |
Materion Corp. | | | 9,498 | | | | 427,315 | |
Schnitzer Steel Industries, Inc. - Class A | | | 10,351 | | | | 223,064 | |
SunCoke Energy, Inc. (a) | | | 32,541 | | | | 278,226 | |
Tahoe Resources, Inc. (a) | | | 117,368 | | | | 428,393 | |
TimkenSteel Corp. (a) (b) | | | 18,629 | | | | 162,817 | |
Warrior Met Coal, Inc. | | | 19,698 | | | | 474,919 | |
Worthington Industries, Inc. | | | 17,089 | | | | 595,381 | |
| | | | | | | | |
| | | | | | | 9,144,373 | |
| | | | | | | | |
|
| Mortgage Real Estate Investment Trusts—1.1% | |
AG Mortgage Investment Trust, Inc. | | | 14,345 | | | | 228,516 | |
Anworth Mortgage Asset Corp. | | | 45,782 | | | | 184,959 | |
Apollo Commercial Real Estate Finance, Inc. | | | 56,688 | | | | 944,422 | |
Arbor Realty Trust, Inc. (b) | | | 29,936 | | | | 301,455 | |
Ares Commercial Real Estate Corp. | | | 11,438 | | | | 149,152 | |
ARMOUR Residential REIT, Inc. | | | 19,400 | | | | 397,700 | |
Blackstone Mortgage Trust, Inc. - Class A (b) | | | 49,203 | | | | 1,567,608 | |
|
| Mortgage Real Estate Investment Trusts—(Continued) | |
Capstead Mortgage Corp. | | | 43,532 | | | | 290,358 | |
Cherry Hill Mortgage Investment Corp. | | | 7,926 | | | | 139,022 | |
Colony Credit Real Estate, Inc. | | | 37,213 | | | | 587,593 | |
Dynex Capital, Inc. | | | 27,274 | | | | 156,007 | |
Exantas Capital Corp. | | | 16,059 | | | | 160,911 | |
Granite Point Mortgage Trust, Inc. (b) | | | 19,775 | | | | 356,543 | |
Invesco Mortgage Capital, Inc. | | | 49,693 | | | | 719,555 | |
KKR Real Estate Finance Trust, Inc. | | | 10,088 | | | | 193,185 | |
Ladder Capital Corp. | | | 40,418 | | | | 625,266 | |
New York Mortgage Trust, Inc. (b) | | | 63,517 | | | | 374,115 | |
Orchid Island Capital, Inc. (b) | | | 21,449 | | | | 137,059 | |
PennyMac Mortgage Investment Trust | | | 26,727 | | | | 497,657 | |
Ready Capital Corp. | | | 8,791 | | | | 121,580 | |
Redwood Trust, Inc. | | | 36,925 | | | | 556,460 | |
TPG RE Finance Trust, Inc. | | | 15,059 | | | | 275,279 | |
Western Asset Mortgage Capital Corp. | | | 19,929 | | | | 166,208 | |
| | | | | | | | |
| | | | | | | 9,130,610 | |
| | | | | | | | |
|
| Multi-Utilities—0.5% | |
Avista Corp. | | | 27,924 | | | | 1,186,211 | |
Black Hills Corp. | | | 22,987 | | | | 1,443,124 | |
NorthWestern Corp. | | | 21,883 | | | | 1,300,725 | |
Unitil Corp. | | | 7,429 | | | | 376,205 | |
| | | | | | | | |
| | | | | | | 4,306,265 | |
| | | | | | | | |
|
| Multiline Retail—0.3% | |
Big Lots, Inc. | | | 17,050 | | | | 493,086 | |
Dillard’s, Inc. - Class A (b) | | | 4,781 | | | | 288,342 | |
J.C. Penney Co., Inc. (a) (b) | | | 69,879 | | | | 72,674 | |
Ollie’s Bargain Outlet Holdings, Inc. (a) | | | 21,477 | | | | 1,428,436 | |
| | | | | | | | |
| | | | | | | 2,282,538 | |
| | | | | | | | |
|
| Oil, Gas & Consumable Fuels—2.2% | |
Arch Coal, Inc. - Class A | | | 7,564 | | | | 627,736 | |
Bonanza Creek Energy, Inc. (a) | | | 9,142 | | | | 188,965 | |
California Resources Corp. (a) | | | 20,491 | | | | 349,167 | |
Callon Petroleum Co. (a) (b) | | | 106,061 | | | | 688,336 | |
Carrizo Oil & Gas, Inc. (a) | | | 37,509 | | | | 423,477 | |
Clean Energy Fuels Corp. (a) | | | 71,620 | | | | 123,186 | |
CONSOL Energy, Inc. (a) | | | 13,213 | | | | 418,984 | |
CVR Energy, Inc. | | | 8,533 | | | | 294,218 | |
Delek U.S. Holdings, Inc. | | | 35,683 | | | | 1,160,054 | |
Denbury Resources, Inc. (a) | | | 204,313 | | | | 349,375 | |
DHT Holdings, Inc. | | | 42,744 | | | | 167,556 | |
Energy Fuels, Inc. (a) (b) | | | 40,972 | | | | 116,770 | |
Frontline, Ltd. (a) (b) | | | 36,108 | | | | 199,677 | |
GasLog, Ltd. | | | 20,748 | | | | 341,512 | |
Golar LNG, Ltd. | | | 40,113 | | | | 872,859 | |
Green Plains, Inc. (b) | | | 17,956 | | | | 235,403 | |
Gulfport Energy Corp. (a) (b) | | | 80,820 | | | | 529,371 | |
Halcon Resources Corp. (a) (b) | | | 63,394 | | | | 107,770 | |
HighPoint Resources Corp. (a) | | | 55,908 | | | | 139,211 | |
International Seaways, Inc. (a) | | | 9,606 | | | | 161,765 | |
Jagged Peak Energy, Inc. (a) (b) | | | 28,571 | | | | 260,568 | |
Laredo Petroleum, Inc. (a) | | | 72,739 | | | | 263,315 | |
See accompanying notes to financial statements.
BHFTII-15
Brighthouse Funds Trust II
MetLife Russell 2000 Index Portfolio
Schedule of Investments as of December 31, 2018
Common Stocks—(Continued)
| | | | | | | | |
| Security Description | | Shares | | | Value | |
|
| Oil, Gas & Consumable Fuels—(Continued) | |
Matador Resources Co. (a) (b) | | | 46,595 | | | $ | 723,620 | |
Nordic American Tankers, Ltd. | | | 26,170 | | | | 52,340 | |
Northern Oil and Gas, Inc. (a) (b) | | | 91,303 | | | | 206,345 | |
Oasis Petroleum, Inc. (a) (b) | | | 124,006 | | | | 685,753 | |
Panhandle Oil and Gas, Inc. - Class A | | | 7,855 | | | | 121,753 | |
Par Pacific holdings, Inc. (a) | | | 16,282 | | | | 230,879 | |
PDC Energy, Inc. (a) | | | 28,041 | | | | 834,500 | |
Peabody Energy Corp. (b) | | | 34,338 | | | | 1,046,622 | |
Penn Virginia Corp. (a) | | | 5,878 | | | | 317,765 | |
Renewable Energy Group, Inc. (a) (b) | | | 16,294 | | | | 418,756 | |
Resolute Energy Corp. (a) | | | 11,063 | | | | 320,606 | |
REX American Resources Corp. (a) | | | 2,989 | | | | 203,581 | |
Ring Energy, Inc. (a) (b) | | | 28,500 | | | | 144,780 | |
SandRidge Energy, Inc. (a) | | | 13,335 | | | | 101,479 | |
Scorpio Tankers, Inc. | | | 205,129 | | | | 361,027 | |
SemGroup Corp. - Class A | | | 36,615 | | | | 504,555 | |
Ship Finance International, Ltd. (b) | | | 38,547 | | | | 405,900 | |
Southwestern Energy Co. (a) | | | 270,546 | | | | 922,562 | |
SRC Energy, Inc. (a) (b) | | | 107,906 | | | | 507,158 | |
Talos Energy, Inc. (a) (b) | | | 10,507 | | | | 171,474 | |
Teekay Corp. | | | 29,414 | | | | 98,243 | |
Tellurian, Inc. (a) (b) | | | 38,940 | | | | 270,633 | |
Uranium Energy Corp. (a) | | | 5,866 | | | | 7,333 | |
W&T Offshore, Inc. (a) (b) | | | 35,854 | | | | 147,718 | |
WildHorse Resource Development Corp. (a) | | | 13,227 | | | | 186,633 | |
World Fuel Services Corp. | | | 31,238 | | | | 668,806 | |
| | | | | | | | |
| | | | | | | 17,680,096 | |
| | | | | | | | |
|
| Paper & Forest Products—0.4% | |
Boise Cascade Co. | | | 18,411 | | | | 439,102 | |
Clearwater Paper Corp. (a) | | | 7,836 | | | | 190,963 | |
Louisiana-Pacific Corp. | | | 62,872 | | | | 1,397,016 | |
Neenah, Inc. | | | 7,745 | | | | 456,336 | |
PH Glatfelter Co. | | | 21,278 | | | | 207,673 | |
Schweitzer-Mauduit International, Inc. | | | 12,254 | | | | 306,963 | |
Verso Corp. - Class A (a) | | | 16,813 | | | | 376,611 | |
| | | | | | | | |
| | | | | | | 3,374,664 | |
| | | | | | | | |
|
| Personal Products—0.3% | |
Edgewell Personal Care Co. (a) | | | 24,669 | | | | 921,387 | |
Inter Parfums, Inc. | | | 8,191 | | | | 537,084 | |
Medifast, Inc. | | | 5,370 | | | | 671,358 | |
USANA Health Sciences, Inc. (a) | | | 5,606 | | | | 659,994 | |
| | | | | | | | |
| | | | | | | 2,789,823 | |
| | | | | | | | |
|
| Pharmaceuticals—1.9% | |
Aclaris Therapeutics, Inc. (a) (b) | | | 13,157 | | | | 97,230 | |
Aerie Pharmaceuticals, Inc. (a) | | | 16,392 | | | | 591,751 | |
Akcea Therapeutics, Inc. (a) (b) | | | 7,356 | | | | 221,710 | |
Akorn, Inc. (a) | | | 43,557 | | | | 147,658 | |
Amneal Pharmaceuticals, Inc. (a) (b) | | | 40,537 | | | | 548,466 | |
Amphastar Pharmaceuticals, Inc. (a) | | | 18,205 | | | | 362,280 | |
ANI Pharmaceuticals, Inc. (a) | | | 3,945 | | | | 177,604 | |
Aratana Therapeutics, Inc. (a) | | | 23,524 | | | | 144,202 | |
Assembly Biosciences, Inc. (a) | | | 9,765 | | | | 220,884 | |
|
| Pharmaceuticals—(Continued) | |
Assertio Therapeutics, Inc. (a) | | | 30,866 | | | | 111,426 | |
Collegium Pharmaceutical, Inc. (a) (b) | | | 14,032 | | | | 240,929 | |
Corcept Therapeutics, Inc. (a) | | | 43,446 | | | | 580,439 | |
Cymabay Therapeutics, Inc. (a) | | | 28,178 | | | | 221,761 | |
Dermira, Inc. (a) | | | 18,139 | | | | 130,419 | |
Eloxx Pharmaceuticals, Inc. (a) (b) | | | 14,403 | | | | 172,980 | |
Endo International plc (a) | | | 96,815 | | | | 706,750 | |
Horizon Pharma plc (a) | | | 73,606 | | | | 1,438,261 | |
Innoviva, Inc. (a) | | | 33,334 | | | | 581,678 | |
Intersect ENT, Inc. (a) | | | 13,971 | | | | 393,703 | |
Intra-Cellular Therapies, Inc. (a) | | | 19,606 | | | | 223,312 | |
Mallinckrodt plc (a) | | | 38,301 | | | | 605,156 | |
Medicines Co. (The) (a) (b) | | | 32,038 | | | | 613,207 | |
MyoKardia, Inc. (a) | | | 15,152 | | | | 740,327 | |
Omeros Corp. (a) (b) | | | 21,460 | | | | 239,064 | |
Pacira Pharmaceuticals, Inc. (a) | | | 18,507 | | | | 796,171 | |
Phibro Animal Health Corp. - Class A | | | 9,993 | | | | 321,375 | |
Prestige Consumer Healthcare, Inc. (a) (b) | | | 22,778 | | | | 703,385 | |
Reata Pharmaceuticals, Inc. - Class A (a) | | | 8,381 | | | | 470,174 | |
Revance Therapeutics, Inc. (a) (b) | | | 15,532 | | | | 312,659 | |
SIGA Technologies, Inc. (a) | | | 22,951 | | | | 181,313 | |
Supernus Pharmaceuticals, Inc. (a) (b) | | | 22,494 | | | | 747,251 | |
TherapeuticsMD, Inc. (a) (b) | | | 78,988 | | | | 300,944 | |
Theravance Biopharma, Inc. (a) (b) | | | 19,690 | | | | 503,867 | |
Tricida, Inc. (a) | | | 5,217 | | | | 123,017 | |
WAVE Life Sciences, Ltd. (a) (b) | | | 8,571 | | | | 360,325 | |
Zogenix, Inc. (a) (b) | | | 19,414 | | | | 707,835 | |
| | | | | | | | |
| | | | | | | 15,039,513 | |
| | | | | | | | |
|
| Professional Services—1.5% | |
ASGN, Inc. (a) | | | 22,539 | | | | 1,228,375 | |
Barrett Business Services, Inc. | | | 3,358 | | | | 192,246 | |
CBIZ, Inc. (a) | | | 24,387 | | | | 480,424 | |
CRA International, Inc. | | | 2,862 | | | | 121,778 | |
Exponent, Inc. | | | 21,852 | | | | 1,108,115 | |
Forrester Research, Inc. | | | 3,707 | | | | 165,703 | |
Franklin Covey Co. (a) | | | 4,809 | | | | 107,385 | |
FTI Consulting, Inc. (a) | | | 16,848 | | | | 1,122,751 | |
Heidrick & Struggles International, Inc. | | | 9,634 | | | | 300,484 | |
Huron Consulting Group, Inc. (a) | | | 10,356 | | | | 531,366 | |
ICF International, Inc. | | | 7,485 | | | | 484,878 | |
Insperity, Inc. | | | 16,476 | | | | 1,538,199 | |
Kelly Services, Inc. - Class A | | | 14,944 | | | | 306,053 | |
Kforce, Inc. | | | 9,613 | | | | 297,234 | |
Korn/Ferry International | | | 25,738 | | | | 1,017,681 | |
Mistras Group, Inc. (a) | | | 8,222 | | | | 118,232 | |
Navigant Consulting, Inc. | | | 18,001 | | | | 432,924 | |
Resources Connection, Inc. | | | 12,083 | | | | 171,579 | |
TriNet Group, Inc. (a) | | | 19,326 | | | | 810,726 | |
TrueBlue, Inc. (a) | | | 19,573 | | | | 435,499 | |
Upwork, Inc. (a) | | | 9,503 | | | | 172,099 | |
WageWorks, Inc. (a) | | | 18,480 | | | | 501,917 | |
Willdan Group, Inc. (a) | | | 4,570 | | | | 159,859 | |
| | | | | | | | |
| | | | | | | 11,805,507 | |
| | | | | | | | |
See accompanying notes to financial statements.
BHFTII-16
Brighthouse Funds Trust II
MetLife Russell 2000 Index Portfolio
Schedule of Investments as of December 31, 2018
Common Stocks—(Continued)
| | | | | | | | |
| Security Description | | Shares | | | Value | |
|
| Real Estate Management & Development—0.6% | |
Altisource Portfolio Solutions S.A. (a) (b) | | | 3,645 | | | $ | 81,976 | |
Cushman & Wakefield plc (a) | | | 20,526 | | | | 297,011 | |
Essential Properties Realty Trust, Inc. | | | 16,519 | | | | 228,623 | |
FRP Holdings, Inc. (a) | | | 3,389 | | | | 155,928 | |
HFF, Inc. - Class A | | | 17,641 | | | | 584,976 | |
Kennedy-Wilson Holdings, Inc. | | | 56,325 | | | | 1,023,425 | |
Marcus & Millichap, Inc. (a) | | | 9,235 | | | | 317,037 | |
Newmark Group, Inc. - Class A | | | 64,506 | | | | 517,338 | |
RE/MAX Holdings, Inc. - Class A | | | 8,877 | | | | 272,968 | |
Redfin Corp. (a) (b) | | | 34,295 | | | | 493,848 | |
RMR Group, Inc. (The) - Class A (b) | | | 3,481 | | | | 184,771 | |
St. Joe Co. (The) (a) (b) | | | 13,592 | | | | 179,007 | |
Tejon Ranch Co. (a) | | | 9,079 | | | | 150,530 | |
| | | | | | | | |
| | | | | | | 4,487,438 | |
| | | | | | | | |
|
| Road & Rail—0.4% | |
ArcBest Corp. | | | 10,451 | | | | 358,051 | |
Avis Budget Group, Inc. (a) | | | 29,503 | | | | 663,228 | |
Covenant Transportation Group, Inc. - Class A (a) | | | 5,776 | | | | 110,899 | |
Heartland Express, Inc. | | | 22,410 | | | | 410,103 | |
Hertz Global Holdings, Inc. (a) (b) | | | 26,814 | | | | 366,011 | |
Marten Transport, Ltd. | | | 19,376 | | | | 313,697 | |
Saia, Inc. (a) | | | 11,835 | | | | 660,630 | |
Werner Enterprises, Inc. (b) | | | 19,256 | | | | 568,822 | |
| | | | | | | | |
| | | | | | | 3,451,441 | |
| | | | | | | | |
|
| Semiconductors & Semiconductor Equipment—2.6% | |
Advanced Energy Industries, Inc. (a) | | | 17,261 | | | | 741,015 | |
Alpha & Omega Semiconductor, Ltd. (a) | | | 9,409 | | | | 95,878 | |
Ambarella, Inc. (a) | | | 14,056 | | | | 491,679 | |
Amkor Technology, Inc. (a) | | | 46,149 | | | | 302,737 | |
Axcelis Technologies, Inc. (a) | | | 13,934 | | | | 248,025 | |
Brooks Automation, Inc. | | | 29,420 | | | | 770,216 | |
Cabot Microelectronics Corp. | | | 12,772 | | | | 1,217,810 | |
Ceva, Inc. (a) | | | 10,183 | | | | 224,942 | |
Cirrus Logic, Inc. (a) | | | 26,378 | | | | 875,222 | |
Cohu, Inc. | | | 17,431 | | | | 280,116 | |
Cree, Inc. (a) (b) | | | 43,635 | | | | 1,866,487 | |
Diodes, Inc. (a) | | | 18,315 | | | | 590,842 | |
Entegris, Inc. (b) | | | 61,443 | | | | 1,713,952 | |
FormFactor, Inc. (a) (c) | | | 31,702 | | | | 446,681 | |
Ichor Holdings, Ltd. (a) (b) | | | 12,029 | | | | 196,073 | |
Impinj, Inc. (a) (b) | | | 8,561 | | | | 124,563 | |
Inphi Corp. (a) (b) | | | 19,424 | | | | 624,482 | |
Integrated Device Technology, Inc. (a) | | | 55,643 | | | | 2,694,790 | |
Lattice Semiconductor Corp. (a) | | | 55,030 | | | | 380,808 | |
MACOM Technology Solutions Holdings, Inc. (a) (b) | | | 18,984 | | | | 275,458 | |
MaxLinear, Inc. (a) (b) | | | 26,699 | | | | 469,902 | |
Nanometrics, Inc. (a) | | | 9,845 | | | | 269,064 | |
NeoPhotonics Corp. (a) | | | 16,522 | | | | 107,063 | |
NVE Corp. | | | 1,671 | | | | 146,279 | |
PDF Solutions, Inc. (a) | | | 12,971 | | | | 109,346 | |
Photronics, Inc. (a) | | | 30,362 | | | | 293,904 | |
Power Integrations, Inc. | | | 11,988 | | | | 731,028 | |
Rambus, Inc. (a) | | | 49,965 | | | | 383,232 | |
Rudolph Technologies, Inc. (a) | | | 13,085 | | | | 267,850 | |
|
| Semiconductors & Semiconductor Equipment—(Continued) | |
Semtech Corp. (a) | | | 27,797 | | | | 1,275,048 | |
Silicon Laboratories, Inc. (a) | | | 18,379 | | | | 1,448,449 | |
SMART Global Holdings, Inc. (a) (b) | | | 4,560 | | | | 135,432 | |
SunPower Corp. (a) (b) | | | 31,453 | | | | 156,321 | |
Synaptics, Inc. (a) (b) | | | 14,825 | | | | 551,638 | |
Ultra Clean Holdings, Inc. (a) (b) | | | 16,793 | | | | 142,237 | |
Veeco Instruments, Inc. (a) | | | 22,250 | | | | 164,873 | |
Xperi Corp. (b) | | | 19,629 | | | | 360,977 | |
| | | | | | | | |
| | | | | | | 21,174,419 | |
| | | | | | | | |
|
| Software—5.3% | |
8x8, Inc. (a) | | | 41,065 | | | | 740,813 | |
A10 Networks, Inc. (a) | | | 21,727 | | | | 135,576 | |
ACI Worldwide, Inc. (a) | | | 49,533 | | | | 1,370,578 | |
Agilysys, Inc. (a) | | | 7,276 | | | | 104,338 | |
Alarm.com Holdings, Inc. (a) (b) | | | 14,286 | | | | 741,015 | |
Altair Engineering, Inc. - Class A (a) | | | 10,426 | | | | 287,549 | |
Alteryx, Inc. - Class A (a) (b) | | | 12,993 | | | | 772,694 | |
American Software, Inc. - Class A | | | 12,761 | | | | 133,352 | |
Anaplan, Inc. (a) | | | 11,119 | | | | 295,098 | |
Appfolio, Inc. - Class A (a) | | | 6,877 | | | | 407,256 | |
Apptio, Inc. - Class A (a) | | | 15,604 | | | | 592,328 | |
Avalara, Inc. (a) | | | 3,853 | | | | 120,021 | |
Avaya Holdings Corp. (a) | | | 46,353 | | | | 674,900 | |
Benefitfocus, Inc. (a) (b) | | | 9,362 | | | | 428,031 | |
Blackbaud, Inc. (b) | | | 20,813 | | | | 1,309,138 | |
Blackline, Inc. (a) | | | 16,099 | | | | 659,254 | |
Bottomline Technologies de, Inc. (a) | | | 18,440 | | | | 885,120 | |
Box, Inc. - Class A (a) | | | 53,384 | | | | 901,122 | |
Carbon Black, Inc. (a) (b) | | | 17,262 | | | | 231,656 | |
ChannelAdvisor Corp. (a) | | | 10,403 | | | | 118,074 | |
Cision, Ltd. (a) (b) | | | 29,687 | | | | 347,338 | |
Cloudera, Inc. (a) | | | 44,625 | | | | 493,553 | |
CommVault Systems, Inc. (a) | | | 17,956 | | | | 1,061,020 | |
Cornerstone OnDemand, Inc. (a) | | | 24,008 | | | | 1,210,723 | |
Coupa Software, Inc. (a) | | | 23,704 | | | | 1,490,033 | |
Ebix, Inc. (b) | | | 10,806 | | | | 459,903 | |
Ellie Mae, Inc. (a) (b) | | | 15,120 | | | | 949,990 | |
Envestnet, Inc. (a) | | | 20,207 | | | | 993,982 | |
Everbridge, Inc. (a) | | | 12,141 | | | | 689,123 | |
Five9, Inc. (a) | | | 24,673 | | | | 1,078,704 | |
ForeScout Technologies, Inc. (a) | | | 13,416 | | | | 348,682 | |
Hortonworks, Inc. (a) | | | 31,713 | | | | 457,301 | |
HubSpot, Inc. (a) (b) | | | 16,070 | | | | 2,020,481 | |
Imperva, Inc. (a) | | | 15,746 | | | | 876,895 | |
Instructure, Inc. (a) | | | 14,481 | | | | 543,182 | |
j2 Global, Inc. (b) | | | 19,963 | | | | 1,385,033 | |
LivePerson, Inc. (a) | | | 24,337 | | | | 458,996 | |
MicroStrategy, Inc. - Class A (a) | | | 4,222 | | | | 539,360 | |
MINDBODY, Inc. - Class A (a) (b) | | | 20,014 | | | | 728,510 | |
Mitek Systems, Inc. (a) | | | 14,980 | | | | 161,934 | |
MobileIron, Inc. (a) | | | 28,325 | | | | 130,012 | |
Model N, Inc. (a) | | | 11,583 | | | | 153,243 | |
Monotype Imaging Holdings, Inc. | | | 18,592 | | | | 288,548 | |
New Relic, Inc. (a) | | | 19,122 | | | | 1,548,308 | |
OneSpan, Inc. (a) (b) | | | 15,031 | | | | 194,651 | |
See accompanying notes to financial statements.
BHFTII-17
Brighthouse Funds Trust II
MetLife Russell 2000 Index Portfolio
Schedule of Investments as of December 31, 2018
Common Stocks—(Continued)
| | | | | | | | |
| Security Description | | Shares | | | Value | |
|
| Software—(Continued) | |
Paylocity Holding Corp. (a) | | | 13,301 | | | $ | 800,853 | |
Progress Software Corp. | | | 18,551 | | | | 658,375 | |
PROS Holdings, Inc. (a) | | | 12,910 | | | | 405,374 | |
Q2 Holdings, Inc. (a) | | | 16,765 | | | | 830,706 | |
QAD, Inc. - Class A | | | 4,798 | | | | 188,705 | |
Qualys, Inc. (a) (b) | | | 14,838 | | | | 1,108,992 | |
Rapid7, Inc. (a) | | | 16,703 | | | | 520,465 | |
SailPoint Technologies Holding, Inc. (a) | | | 30,549 | | | | 717,596 | |
SendGrid, Inc. (a) | | | 12,940 | | | | 558,620 | |
ShotSpotter, Inc. (a) | | | 3,603 | | | | 112,342 | |
SPS Commerce, Inc. (a) | | | 7,550 | | | | 621,969 | |
SVMK, Inc. (a) (b) | | | 15,244 | | | | 187,044 | |
Tenable Holdings, Inc. (a) | | | 4,699 | | | | 104,271 | |
TiVo Corp. | | | 54,357 | | | | 511,499 | |
Trade Desk, Inc. (The) - Class A (a) (b) | | | 14,265 | | | | 1,655,596 | |
Upland Software, Inc. (a) | | | 7,503 | | | | 203,932 | |
Varonis Systems, Inc. (a) | | | 12,721 | | | | 672,941 | |
Verint Systems, Inc. (a) | | | 27,089 | | | | 1,146,136 | |
Workiva, Inc. (a) | | | 12,561 | | | | 450,814 | |
Yext, Inc. (a) (b) | | | 37,385 | | | | 555,167 | |
Zix Corp. (a) | | | 25,140 | | | | 144,052 | |
Zscaler, Inc. (a) (b) | | | 26,496 | | | | 1,038,908 | |
| | | | | | | | |
| | | | | | | 42,711,775 | |
| | | | | | | | |
|
| Specialty Retail—2.9% | |
Aaron’s, Inc. | | | 30,071 | | | | 1,264,486 | |
Abercrombie & Fitch Co. - Class A (b) | | | 28,497 | | | | 571,365 | |
America’sCar-Mart, Inc. (a) | | | 2,826 | | | | 204,744 | |
American Eagle Outfitters, Inc. (b) | | | 68,438 | | | | 1,322,906 | |
Asbury Automotive Group, Inc. (a) | | | 9,029 | | | | 601,873 | |
Ascena Retail Group, Inc. (a) (b) | | | 80,127 | | | | 201,119 | |
At Home Group, Inc. (a) (b) | | | 19,716 | | | | 367,901 | |
Barnes & Noble, Inc. | | | 27,765 | | | | 196,854 | |
Bed Bath & Beyond, Inc. (b) | | | 61,523 | | | | 696,440 | |
Boot Barn Holdings, Inc. (a) | | | 12,612 | | | | 214,782 | |
Buckle, Inc. (The) (b) | | | 14,188 | | | | 274,396 | |
Caleres, Inc. | | | 17,181 | | | | 478,147 | |
Camping World Holdings, Inc. - Class A (b) | | | 14,592 | | | | 167,370 | |
Carvana Co. (a) (b) | | | 14,356 | | | | 469,585 | |
Cato Corp. (The) - Class A | | | 9,562 | | | | 136,450 | |
Chico’s FAS, Inc. | | | 59,471 | | | | 334,227 | |
Children’s Place, Inc. (The) | | | 7,101 | | | | 639,729 | |
Citi Trends, Inc. | | | 4,579 | | | | 93,366 | |
Conn’s, Inc. (a) (b) | | | 10,289 | | | | 194,051 | |
DSW, Inc. - Class A | | | 31,615 | | | | 780,890 | |
Express, Inc. (a) (b) | | | 34,677 | | | | 177,199 | |
Five Below, Inc. (a) (b) | | | 23,446 | | | | 2,398,995 | |
GameStop Corp. - Class A (b) | | | 46,271 | | | | 583,940 | |
Genesco, Inc. (a) (b) | | | 8,683 | | | | 384,657 | |
Group 1 Automotive, Inc. | | | 7,911 | | | | 417,068 | |
Guess?, Inc. | | | 25,521 | | | | 530,071 | |
Haverty Furniture Cos., Inc. (b) | | | 10,391 | | | | 195,143 | |
Hibbett Sports, Inc. (a) (b) | | | 10,209 | | | | 145,989 | |
Hudson, Ltd. - Class A (a) | | | 18,056 | | | | 309,660 | |
Lithia Motors, Inc. - Class A (b) | | | 9,344 | | | | 713,227 | |
Lumber Liquidators Holdings, Inc. (a) (b) | | | 13,856 | | | | 131,909 | |
MarineMax, Inc. (a) | | | 8,107 | | | | 148,439 | |
|
| Specialty Retail—(Continued) | |
Monro, Inc. | | | 13,506 | | | | 928,537 | |
Murphy USA, Inc. (a) (b) | | | 12,944 | | | | 992,028 | |
National Vision Holdings, Inc. (a) | | | 27,759 | | | | 781,971 | |
Office Depot, Inc. | | | 240,796 | | | | 621,254 | |
Party City Holdco, Inc. (a) (b) | | | 25,796 | | | | 257,444 | |
Rent-A-Center, Inc. (a) | | | 21,277 | | | | 344,475 | |
RH (a) (b) | | | 8,668 | | | | 1,038,600 | |
Sally Beauty Holdings, Inc. (a) (b) | | | 51,377 | | | | 875,978 | |
Shoe Carnival, Inc. (b) | | | 4,114 | | | | 137,860 | |
Signet Jewelers, Ltd. (b) | | | 22,572 | | | | 717,112 | |
Sleep Number Corp. (a) | | | 14,171 | | | | 449,646 | |
Sonic Automotive, Inc. - Class A | | | 9,480 | | | | 130,445 | |
Tailored Brands, Inc. (b) | | | 22,434 | | | | 306,000 | |
Tile Shop Holdings, Inc. | | | 20,043 | | | | 109,836 | |
Tilly’s, Inc. - Class A | | | 7,301 | | | | 79,289 | |
Winmark Corp. | | | 1,140 | | | | 181,260 | |
Zumiez, Inc. (a) | | | 10,452 | | | | 200,365 | |
| | | | | | | | |
| | | | | | | 23,499,078 | |
| | | | | | | | |
|
| Technology Hardware, Storage & Peripherals—0.3% | |
3D Systems Corp. (a) (b) | | | 50,283 | | | | 511,378 | |
Cray, Inc. (a) | | | 19,290 | | | | 416,471 | |
Diebold Nixdorf, Inc. (b) | | | 35,435 | | | | 88,233 | |
Electronics for Imaging, Inc. (a) (b) | | | 18,879 | | | | 468,199 | |
Immersion Corp. (a) | | | 14,029 | | | | 125,700 | |
Stratasys, Ltd. (a) | | | 23,667 | | | | 426,243 | |
USA Technologies, Inc. (a) | | | 23,924 | | | | 93,064 | |
| | | | | | | | |
| | | | | | | 2,129,288 | |
| | | | | | | | |
|
| Textiles, Apparel & Luxury Goods—0.8% | |
Crocs, Inc. (a) (c) | | | 28,518 | | | | 740,898 | |
Culp, Inc. | | | 4,697 | | | | 88,774 | |
Deckers Outdoor Corp. (a) | | | 12,597 | | | | 1,611,786 | |
Fossil Group, Inc. (a) (b) | | | 20,656 | | | | 324,919 | |
G-III Apparel Group, Ltd. (a) | | | 18,501 | | | | 515,993 | |
Movado Group, Inc. | | | 7,984 | | | | 252,454 | |
Oxford Industries, Inc. | | | 7,657 | | | | 543,953 | |
Steven Madden, Ltd. (b) | | | 38,178 | | | | 1,155,266 | |
Unifi, Inc. (a) | | | 7,892 | | | | 180,253 | |
Wolverine World Wide, Inc. (b) | | | 39,246 | | | | 1,251,555 | |
| | | | | | | | |
| | | | | | | 6,665,851 | |
| | | | | | | | |
|
| Thrifts & Mortgage Finance—2.2% | |
Axos Financial, Inc. (a) (b) | | | 27,157 | | | | 683,813 | |
Beneficial Bancorp, Inc. | | | 32,692 | | | | 467,169 | |
Bridgewater Bancshares, Inc. (a) | | | 11,530 | | | | 121,642 | |
BSB Bancorp, Inc. (a) | | | 4,295 | | | | 120,518 | |
Capitol Federal Financial, Inc. | | | 59,838 | | | | 764,131 | |
Columbia Financial, Inc. (a) | | | 20,912 | | | | 319,744 | |
Dime Community Bancshares, Inc. | | | 15,501 | | | | 263,207 | |
Essent Group, Ltd. (a) | | | 41,392 | | | | 1,414,779 | |
Federal Agricultural Mortgage Corp. - Class C | | | 4,263 | | | | 257,656 | |
First Defiance Financial Corp. | | | 10,076 | | | | 246,963 | |
Flagstar Bancorp, Inc. (a) | | | 12,717 | | | | 335,729 | |
Hingham Institution for Savings | | | 716 | | | | 141,582 | |
Home Bancorp, Inc. | | | 3,086 | | | | 109,244 | |
See accompanying notes to financial statements.
BHFTII-18
Brighthouse Funds Trust II
MetLife Russell 2000 Index Portfolio
Schedule of Investments as of December 31, 2018
Common Stocks—(Continued)
| | | | | | | | |
| Security Description | |
Shares | | | Value | |
|
| Thrifts & Mortgage Finance—(Continued) | |
HomeStreet, Inc. (a) | | | 12,382 | | | $ | 262,870 | |
Kearny Financial Corp. | | | 41,863 | | | | 536,684 | |
LendingTree, Inc. (a) (b) | | | 3,578 | | | | 785,621 | |
Merchants Bancorp | | | 7,914 | | | | 157,963 | |
Meridian Bancorp, Inc. | | | 23,292 | | | | 333,541 | |
Meta Financial Group, Inc. | | | 12,654 | | | | 245,361 | |
MGIC Investment Corp. (a) | | | 157,311 | | | | 1,645,473 | |
Mr Cooper Group, Inc. (a) | | | 33,464 | | | | 390,525 | |
NMI Holdings, Inc. - Class A (a) | | | 27,711 | | | | 494,641 | |
Northfield Bancorp, Inc. | | | 19,366 | | | | 262,409 | |
Northwest Bancshares, Inc. (b) | | | 41,735 | | | | 706,991 | |
OceanFirst Financial Corp. | | | 22,048 | | | | 496,300 | |
Oritani Financial Corp. | | | 16,857 | | | | 248,641 | |
PCSB Financial Corp. | | | 6,336 | | | | 123,932 | |
PennyMac Financial Services, Inc. | | | 7,331 | | | | 155,857 | |
Provident Financial Services, Inc. | | | 29,105 | | | | 702,304 | |
Radian Group, Inc. | | | 93,977 | | | | 1,537,464 | |
Southern Missouri Bancorp, Inc. | | | 3,592 | | | | 121,769 | |
Territorial Bancorp, Inc. | | | 3,955 | | | | 102,751 | |
TrustCo Bank Corp. | | | 42,750 | | | | 293,265 | |
United Community Financial Corp. | | | 24,319 | | | | 215,223 | |
United Financial Bancorp, Inc. | | | 21,901 | | | | 321,945 | |
Walker & Dunlop, Inc. | | | 12,545 | | | | 542,571 | |
Washington Federal, Inc. | | | 37,662 | | | | 1,005,952 | |
Waterstone Financial, Inc. | | | 10,900 | | | | 182,684 | |
Western New England Bancorp, Inc. | | | 13,397 | | | | 134,506 | |
WSFS Financial Corp. | | | 14,223 | | | | 539,194 | |
| | | | | | | | |
| | | | | | | 17,792,614 | |
| | | | | | | | |
|
| Tobacco—0.1% | |
22nd Century Group, Inc. (a) (b) | | | 55,642 | | | | 138,549 | |
Turning Point Brands, Inc. (b) | | | 4,000 | | | | 108,880 | |
Universal Corp. | | | 10,254 | | | | 555,254 | |
Vector Group, Ltd. (b) | | | 41,836 | | | | 407,064 | |
| | | | | | | | |
| | | | | | | 1,209,747 | |
| | | | | | | | |
|
| Trading Companies & Distributors—1.2% | |
Aircastle, Ltd. | | | 23,576 | | | | 406,450 | |
Applied Industrial Technologies, Inc. | | | 16,061 | | | | 866,330 | |
Beacon Roofing Supply, Inc. (a) (b) | | | 28,344 | | | | 899,072 | |
BMC Stock Holdings, Inc. (a) | | | 31,129 | | | | 481,877 | |
CAI International, Inc. (a) | | | 8,107 | | | | 188,326 | |
DXP Enterprises, Inc. (a) | | | 6,978 | | | | 194,267 | |
GATX Corp. (b) | | | 16,296 | | | | 1,153,920 | |
GMS, Inc. (a) | | | 14,993 | | | | 222,796 | |
H&E Equipment Services, Inc. | | | 15,412 | | | | 314,713 | |
Herc Holdings, Inc. (a) | | | 11,071 | | | | 287,735 | |
Kaman Corp. | | | 11,410 | | | | 639,987 | |
Lawson Products, Inc. (a) | | | 3,183 | | | | 100,583 | |
MRC Global, Inc. (a) | | | 38,704 | | | | 473,350 | |
Nexeo Solutions, Inc. (a) | | | 13,514 | | | | 116,085 | |
NOW, Inc. (a) (b) | | | 51,271 | | | | 596,794 | |
Rush Enterprises, Inc. - Class A | | | 12,945 | | | | 446,343 | |
SiteOne Landscape Supply, Inc. (a) (b) | | | 17,769 | | | | 982,093 | |
|
| Trading Companies & Distributors—(Continued) | |
Systemax, Inc. | | | 5,954 | | | | 142,241 | |
Textainer Group Holdings, Ltd. (a) | | | 11,532 | | | | 114,859 | |
Titan Machinery, Inc. (a) | | | 9,306 | | | | 122,374 | |
Triton International, Ltd. (b) | | | 21,253 | | | | 660,331 | |
Veritiv Corp. (a) | | | 5,727 | | | | 143,003 | |
| | | | | | | | |
| | | | | | | 9,553,529 | |
| | | | | | | | |
|
| Water Utilities—0.5% | |
American States Water Co. | | | 15,588 | | | | 1,045,020 | |
AquaVenture Holdings, Ltd. (a) | | | 5,135 | | | | 97,000 | |
Artesian Resources Corp. - Class A | | | 3,766 | | | | 131,321 | |
Cadiz, Inc. (a) (b) | | | 11,218 | | | | 115,545 | |
California Water Service Group | | | 20,902 | | | | 996,189 | |
Connecticut Water Service, Inc. | | | 4,908 | | | | 328,198 | |
Middlesex Water Co. | | | 7,497 | | | | 399,965 | |
SJW Group | | | 7,394 | | | | 411,254 | |
York Water Co. (The) | | | 6,695 | | | | 214,642 | |
| | | | | | | | |
| | | | | | | 3,739,134 | |
| | | | | | | | |
|
| Wireless Telecommunication Services—0.2% | |
Boingo Wireless, Inc. (a) | | | 17,390 | | | | 357,712 | |
NII Holdings, Inc. (a) (b) | | | 41,560 | | | | 183,279 | |
Shenandoah Telecommunications Co. | | | 20,059 | | | | 887,611 | |
Spok Holdings, Inc. | | | 8,518 | | | | 112,949 | |
| | | | | | | | |
| | | | | | | 1,541,551 | |
| | | | | | | | |
Total Common Stocks
(Cost $633,122,869) | | | | | | | 774,441,066 | |
| | | | | | | | |
|
| Mutual Fund—3.0% | |
|
| Investment Company Security—3.0% | |
iShares Russell 2000 Index ETF (b)
(Cost $26,864,095) | | | 177,600 | | | | 23,780,640 | |
| | | | | | | | |
|
| Rights—0.0% | |
|
| Biotechnology—0.0% | |
Tobira Therapeutics, Inc., Expires 12/31/28 (a) (d) (e) (f) | | | 4,660 | | | | 37,093 | |
| | | | | | | | |
|
| Chemicals—0.0% | |
A. Schulman, Inc. (d) | | | 12,704 | | | | 24,265 | |
| | | | | | | | |
Total Rights
(Cost $24,544) | | | | | | | 61,358 | |
| | | | | | | | |
|
| Short-Term Investments—1.0% | |
|
| Discount Notes—0.1% | |
Federal Home Loan Bank
2.288%, 01/30/19 (g) | | | 475,000 | | | | 474,121 | |
2.319%, 02/06/19 (g) | | | 525,000 | | | | 523,775 | |
| | | | | | | | |
| | | | | | | 997,896 | |
| | | | | | | | |
See accompanying notes to financial statements.
BHFTII-19
Brighthouse Funds Trust II
MetLife Russell 2000 Index Portfolio
Schedule of Investments as of December 31, 2018
Short-Term Investments—(Continued)
| | | | | | | | |
| Security Description | | Principal
Amount* | | | Value | |
|
| U.S. Treasury—0.9% | |
U.S. Treasury Bills
1.997%, 01/08/19 (g) | | | 650,000 | | | $ | 649,753 | |
2.231%, 01/22/19 (g) | | | 5,650,000 | | | | 5,642,671 | |
2.305%, 01/29/19 (g) | | | 200,000 | | | | 199,631 | |
2.334%, 02/21/19 (g) | | | 800,000 | | | | 797,330 | |
| | | | | | | | |
| | | | | | | 7,289,385 | |
| | | | | | | | |
Total Short-Term Investments
(Cost $8,286,989) | | | | | | | 8,287,281 | |
| | | | | | | | |
|
| Securities Lending Reinvestments (h)—20.8% | |
|
| Certificates of Deposit—13.1% | |
Bank of Nova Scotia
2.890%, SOFR + 0.430%, 05/16/19 (i) | | | 3,000,000 | | | | 2,999,998 | |
3.072%, 3M LIBOR + 0.280%, 03/20/19 (i) | | | 3,000,000 | | | | 3,001,197 | |
Barclays Bank plc
2.547%, 1M LIBOR + 0.200%, 02/04/19 (i) | | | 5,000,000 | | | | 4,999,525 | |
BNP Paribas S.A. New York
2.647%, 1M LIBOR + 0.300%, 06/04/19 (i) | | | 2,000,000 | | | | 1,999,196 | |
Canadian Imperial Bank of Commerce
2.740%, 1M LIBOR + 0.270%, 07/19/19 (i) | | | 4,000,000 | | | | 3,998,376 | |
China Construction Bank Corp.
2.550%, 01/07/19 | | | 4,000,000 | | | | 4,000,000 | |
Commonwealth Bank of Australia
2.617%, 3M LIBOR + 0.140%, 04/23/19 (i) | | | 1,000,000 | | | | 1,000,003 | |
2.642%, 1M LIBOR + 0.210%, 09/13/19 (i) | | | 5,000,000 | | | | 5,000,000 | |
Credit Agricole S.A.
2.500%, 02/12/19 | | | 3,000,000 | | | | 2,999,490 | |
Credit Suisse AG
2.620%, 04/01/19 | | | 5,000,000 | | | | 4,997,410 | |
2.890%, SOFR + 0.430%, 05/02/19 (i) | | | 1,000,000 | | | | 999,988 | |
Mitsubishi UFJ Trust and Banking Corp.
Zero Coupon, 01/15/19 | | | 6,947,412 | | | | 6,992,860 | |
Mizuho Bank, Ltd., New York
2.649%, 1M LIBOR + 0.300%, 05/01/19 (i) | | | 5,000,000 | | | | 5,000,030 | |
MUFG Bank Ltd.
2.649%, 1M LIBOR + 0.300%, 05/01/19 (i) | | | 1,000,000 | | | | 1,000,006 | |
Natixis New York
2.705%, 3M LIBOR + 0.090%, 05/10/19 (i) | | | 4,000,000 | | | | 3,997,480 | |
2.731%, 3M LIBOR + 0.190%, 02/01/19 (i) | | | 1,500,000 | | | | 1,499,664 | |
2.810%, 1M LIBOR + 0.370%, 02/14/19 (i) | | | 2,000,000 | | | | 2,000,374 | |
2.940%, SOFR + 0.480%, 06/12/19 (i) | | | 1,000,000 | | | | 999,894 | |
Royal Bank of Canada New York
2.650%, 1M LIBOR + 0.250%, 01/11/19 (i) | | | 2,000,000 | | | | 2,000,016 | |
2.665%, 1M LIBOR + 0.210%, 09/17/19 (i) | | | 8,000,000 | | | | 7,991,816 | |
Skandinaviska Enskilda Banken
2.645%, 1M LIBOR + 0.190%, 04/17/19 (i) | | | 4,000,000 | | | | 3,999,672 | |
Societe Generale
2.719%, 3M LIBOR + 0.160%, 05/07/19 (i) | | | 3,000,000 | | | | 2,998,668 | |
Standard Chartered plc
2.686%, 1M LIBOR + 0.180%, 02/25/19 (i) | | | 10,000,000 | | | | 9,999,710 | |
Svenska Handelsbanken AB
2.620%, 3M LIBOR + 0.100%, 04/30/19 (i) | | | 5,000,000 | | | | 4,999,775 | |
2.822%, 1M LIBOR + 0.300%, 10/31/19 (i) | | | 2,000,000 | | | | 1,999,532 | |
|
| Certificates of Deposit—(Continued) | |
Toronto-Dominion Bank
2.665%, 1M LIBOR + 0.210%, 09/17/19 (i) | | | 7,000,000 | | | | 6,993,336 | |
U.S. Bank N.A.
2.764%, 1M LIBOR + 0.260%, 07/23/19 (i) | | | 4,000,000 | | | | 4,000,000 | |
Wells Fargo Bank N.A.
2.730%, 3M LIBOR + 0.210%, 10/25/19 (i) | | | 1,520,000 | | | | 1,520,000 | |
Westpac Banking Corp.
2.850%, FEDEFF PRV + 0.450%, 02/15/19 (i) | | | 1,500,000 | | | | 1,499,991 | |
| | | | | | | | |
| | | | | | | 105,488,007 | |
| | | | | | | | |
|
| Commercial Paper—4.0% | |
Alpine Securities Ltd.
2.529%, 1M LIBOR + 0.180%, 04/03/19 (i) | | | 4,000,000 | | | | 3,998,892 | |
Banco Santander S.A.
2.740%, 02/07/19 | | | 3,971,991 | | | | 3,988,352 | |
HSBC Bank plc
2.842%, 1M LIBOR + 0.320%, 07/30/19 (i) | | | 2,000,000 | | | | 2,000,000 | |
ING Funding LLC
2.707%, 1M LIBOR + 0.320%, 02/08/19 (i) | | | 3,000,000 | | | | 3,000,279 | |
2.725%, 3M LIBOR + 0.110%, 05/10/19 (i) | | | 3,000,000 | | | | 2,999,646 | |
Matchpoint Finance plc
2.890%, 05/08/19 | | | 3,941,879 | | | | 3,957,012 | |
Toronto-Dominion Bank
2.729%, 1M LIBOR + 0.350%, 11/05/19 (i) | | | 2,000,000 | | | | 1,999,780 | |
UBS AG
2.779%, 1M LIBOR + 0.430%, 02/01/19 (i) | | | 5,000,000 | | | | 5,001,225 | |
Westpac Banking Corp.
2.659%, 3M LIBOR + 0.070%, 08/07/19 (i) | | | 3,000,000 | | | | 2,998,029 | |
2.784%, 1M LIBOR + 0.280%, 05/24/19 (i) | | | 2,000,000 | | | | 1,999,920 | |
| | | | | | | | |
| | | | | | | 31,943,135 | |
| | | | | | | | |
|
| Repurchase Agreements—3.7% | |
Citadel Clearing LLC
Repurchase Agreement dated 12/31/18 at 3.000%, due on 04/02/19 with a maturity value of $12,595,833; collateralized by various Common Stock with an aggregate market value of $13,752,292. | | | 12,500,000 | | | | 12,500,000 | |
| Citigroup Global Markets, Inc. | | | | | | |
Repurchase Agreement dated 12/31/18 at 2.790%, due on 02/04/19 with a maturity value of $1,002,713; collateralized by U.S. Treasury Obligations at 0.000%, maturing 02/12/19, and various Common Stock with an aggregate market value of $1,088,319. | | | 1,000,000 | | | $ | 1,000,000 | |
Repurchase Agreement dated 12/31/18 at 2.940%, due on 04/02/19 with a maturity value of $50,376; collateralized by U.S. Treasury Obligations with rates ranging from 1.125% - 2.750%, maturity dates ranging from 01/31/19 - 08/15/24, and an aggregate market value of $51,000. | | | 50,000 | | | | 50,000 | |
Citigroup Global Markets, Ltd.
Repurchase Agreement dated 12/31/18 at 2.490%, due on 01/02/19 with a maturity value of $300,042; collateralized by U.S. Treasury Obligations with rates ranging from 0.375% - 1.875%, maturity dates ranging from 12/15/20 - 01/15/27, and an aggregate market value of $306,000. | | | 300,000 | | | | 300,000 | |
See accompanying notes to financial statements.
BHFTII-20
Brighthouse Funds Trust II
MetLife Russell 2000 Index Portfolio
Schedule of Investments as of December 31, 2018
Securities Lending Reinvestments (h)—(Continued)
| | | | | | | | |
| Security Description | | Principal
Amount* | | | Value | |
|
| Repurchase Agreements—(Continued) | |
Citigroup Global Markets, Ltd.
Repurchase Agreement dated 12/31/18 at 2.490%, due on 01/02/19 with a maturity value of $400,055; collateralized by U.S. Treasury Obligations with rates ranging from 1.625% - 2.875%, maturity dates ranging from 06/30/20 - 11/15/46, and an aggregate market value of $408,000. | | | 400,000 | | | $ | 400,000 | |
Deutsche Bank AG, London
Repurchase Agreement dated 12/31/18 at 2.750%, due on 01/02/19 with a maturity value of $200,031; collateralized by U.S. Treasury and Foreign Obligations with rates ranging from 1.000% - 2.590%, maturity dates ranging from 03/31/19 - 12/29/26, and an aggregate market value of $204,000. | | | 200,000 | | | | 200,000 | |
Deutsche Bank Securities, Inc.
Repurchase Agreement dated 12/31/18 at 3.200%, due on 01/02/19 with a maturity value of $1,560,016; collateralized by U.S. Treasury Obligations at 0.000%, maturity dates ranging from 08/15/30 - 08/15/39, and an aggregate market value of $1,590,933. | | | 1,559,738 | | | | 1,559,738 | |
Merrill Lynch, Pierce, Fenner & Smith, Inc.
Repurchase Agreement dated 12/31/18 at 2.940%, due on 04/02/19 with a maturity value of $3,526,297; collateralized by various Common Stock with an aggregate market value of $3,850,000. | | | 3,500,000 | | | | 3,500,000 | |
Repurchase Agreement dated 12/31/18 at 2.940%, due on 04/02/19 with a maturity value of $2,015,027; collateralized by various Common Stock with an aggregate market value of $2,200,000. | | | 2,000,000 | | | | 2,000,000 | |
NBC Global Finance, Ltd.
Repurchase Agreement dated 12/31/18 at 2.560%, due on 01/02/19 with a maturity value of $3,000,427; collateralized by various Common Stock with an aggregate market value of $3,339,637. | | | 3,000,000 | | | | 3,000,000 | |
|
| Repurchase Agreements—(Continued) | |
NBC Global Finance, Ltd.
Repurchase Agreement dated 12/31/18 at 2.560%, due on 01/02/19 with a maturity value of $5,000,711; collateralized by various Common Stock with an aggregate market value of $5,566,061. | | | 5,000,000 | | | | 5,000,000 | |
| | | | | | | | |
| | | | | | | 29,509,738 | |
| | | | | | | | |
Total Securities Lending Reinvestments
(Cost $166,972,046) | | | | | | | 166,940,880 | |
| | | | | | | | |
Total Investments—121.0%
(Cost $835,270,543) | | | | | | | 973,511,225 | |
Other assets and liabilities (net)—(21.0)% | | | | | | | (168,672,124 | ) |
| | | | | | | | |
| Net Assets—100.0% | | | | | | $ | 804,839,101 | |
| | | | | | | | |
| | | | |
| * | | Principal amount stated in U.S. dollars unless otherwise noted. |
| (a) | | Non-income producing security. |
| (b) | | All or a portion of the security was held on loan. As of December 31, 2018, the market value of securities loaned was $166,928,760 and the collateral received consisted of cash in the amount of $166,891,020 andnon-cash collateral with a value of $3,439,662. The cash collateral investments are disclosed in the Schedule of Investments and categorized as Securities Lending Reinvestments. Thenon-cash collateral received consists of U.S. government securities that are held in safe-keeping by the lending agent, or a third-party custodian, cannot be sold or repledged by the Portfolio. As such, this collateral is excluded from the Statement of Assets and Liabilities. |
| (c) | | All or a portion of the security was pledged as collateral against open futures contracts. As of December 31, 2018, the market value of securities pledged was $2,747,289. |
| (d) | | Illiquid security. As of December 31, 2018, these securities represent 0.0% of net assets. |
| (e) | | Significant unobservable inputs were used in the valuation of this portfolio security; i.e. Level 3. |
| (f) | | Security was valued in good faith under procedures approved by the Board of Trustees. As of December 31, 2018, these securities represent less than 0.05% of net assets. |
| (g) | | The rate shown represents current yield to maturity. |
| (h) | | Represents investment of cash collateral received from securities on loan as of December 31, 2018. |
| (i) | | Variable or floating rate security. The stated rate represents the rate at December 31, 2018. Maturity date shown for callable securities reflects the earliest possible call date. For securities based on a published reference index and spread, the index and spread are indicated in the description above. For certain variable rate securities, the coupon rate is determined by the issuer/agent based on current market conditions. For certain asset- and mortgage-backed securities, the coupon rate may fluctuate based on changes of the underlying collateral or prepayments of principal. These securities do not indicate a reference index and spread in their description above. |
Futures Contracts
| | | | | | | | | | | | | | | | | | | | |
Futures Contracts—Long | | Expiration
Date | | | Number of
Contracts | | | Notional
Amount | | | Value/
Unrealized
Depreciation | |
Russell 2000 Index E-Mini Futures | | | 03/15/19 | | | | 42 | | | | USD | | | | 2,832,900 | | | $ | (140,131 | ) |
| | | | | | | | | | | | | | | | | | | | |
See accompanying notes to financial statements.
BHFTII-21
Brighthouse Funds Trust II
MetLife Russell 2000 Index Portfolio
Schedule of Investments as of December 31, 2018
Glossary of Abbreviations
Currencies
| | | | |
| (USD)— | | United States Dollar |
Index Abbreviations
| | | | |
| (FEDEFF PRV)— | | Effective Federal Funds Rate |
| (LIBOR)— | | London Interbank Offered Rate |
| (SOFR)— | | Secured Overnight Financing Rate |
Other Abbreviations
| | | | |
| (ETF)— | | Exchange-Traded Fund |
| (REIT)— | | Real Estate Investment Trust |
Fair Value Hierarchy
Accounting principles generally accepted in the United States of America (“GAAP”) define fair market value as the price that the Portfolio would receive to sell an asset or pay to transfer a liability in an orderly transaction between market participants at the measurement date. It establishes a fair value hierarchy that prioritizes inputs to valuation methods and requires disclosure of the fair value hierarchy, separately for each major category of assets and liabilities, that segregates fair value measurements into three levels. Levels 1, 2 and 3 of the fair value hierarchy are defined as follows:
Level 1 - unadjusted quoted prices in active markets for identical investments
Level 2 - other significant observable inputs (including, but not limited to, quoted prices for similar assets or liabilities in markets that are either active or inactive; inputs other than quoted prices that are observable such as interest rates, yield curves, volatilities, prepayment speeds, loss severities, credit risks, default rates, or other market corroborated inputs)
Level 3 - significant unobservable inputs based on the best information available in the circumstances, to the extent observable inputs are unavailable (including the Portfolio’s own assumptions used in determining the fair value of investments and derivative financial instruments)
The inputs or methodologies used for valuing investments are not necessarily an indication of the risk associated with investing in them. Changes to the inputs or methodologies used may result in transfers between levels. A reconciliation of Level 3 securities, if any, will be disclosed following the fair value hierarchy table. For more information about the Portfolio’s policy regarding the valuation of investments, please refer to the Notes to Financial Statements.
The following table summarizes the fair value hierarchy of the Portfolio’s investments as of December 31, 2018:
| | | | | | | | | | | | | | | | |
| Description | | Level 1 | | | Level 2 | | | Level 3 | | | Total | |
| Common Stocks | |
Aerospace & Defense | | $ | 10,064,012 | | | $ | — | | | $ | — | | | $ | 10,064,012 | |
Air Freight & Logistics | | | 2,596,871 | | | | — | | | | — | | | | 2,596,871 | |
Airlines | | | 3,914,103 | | | | — | | | | — | | | | 3,914,103 | |
Auto Components | | | 7,933,375 | | | | — | | | | — | | | | 7,933,375 | |
Automobiles | | | 362,351 | | | | — | | | | — | | | | 362,351 | |
Banks | | | 73,973,677 | | | | — | | | | — | | | | 73,973,677 | |
Beverages | | | 2,139,650 | | | | — | | | | — | | | | 2,139,650 | |
Biotechnology | | | 47,087,033 | | | | — | | | | — | | | | 47,087,033 | |
Building Products | | | 9,505,712 | | | | — | | | | — | | | | 9,505,712 | |
Capital Markets | | | 9,994,768 | | | | — | | | | — | | | | 9,994,768 | |
Chemicals | | | 14,372,622 | | | | — | | | | — | | | | 14,372,622 | |
Commercial Services & Supplies | | | 20,606,672 | | | | — | | | | — | | | | 20,606,672 | |
Communications Equipment | | | 12,883,450 | | | | — | | | | — | | | | 12,883,450 | |
Construction & Engineering | | | 8,050,135 | | | | — | | | | — | | | | 8,050,135 | |
Construction Materials | | | 890,798 | | | | — | | | | — | | | | 890,798 | |
Consumer Finance | | | 5,626,412 | | | | — | | | | — | | | | 5,626,412 | |
Containers & Packaging | | | 867,616 | | | | — | | | | — | | | | 867,616 | |
Distributors | | | 504,618 | | | | — | | | | — | | | | 504,618 | |
Diversified Consumer Services | | | 7,368,889 | | | | — | | | | — | | | | 7,368,889 | |
Diversified Financial Services | | | 1,323,927 | | | | — | | | | — | | | | 1,323,927 | |
Diversified Telecommunication Services | | | 4,402,009 | | | | — | | | | — | | | | 4,402,009 | |
Electric Utilities | | | 9,577,489 | | | | — | | | | — | | | | 9,577,489 | |
Electrical Equipment | | | 5,815,543 | | | | — | | | | — | | | | 5,815,543 | |
Electronic Equipment, Instruments & Components | | | 19,338,217 | | | | — | | | | — | | | | 19,338,217 | |
Energy Equipment & Services | | | 9,254,560 | | | | — | | | | — | | | | 9,254,560 | |
Entertainment | | | 4,812,143 | | | | — | | | | — | | | | 4,812,143 | |
Equity Real Estate Investment Trusts | | | 52,535,930 | | | | — | | | | — | | | | 52,535,930 | |
Food & Staples Retailing | | | 4,661,764 | | | | — | | | | — | | | | 4,661,764 | |
Food Products | | | 9,554,028 | | | | — | | | | — | | | | 9,554,028 | |
See accompanying notes to financial statements.
BHFTII-22
Brighthouse Funds Trust II
MetLife Russell 2000 Index Portfolio
Schedule of Investments as of December 31, 2018
Fair Value Hierarchy—(Continued)
| | | | | | | | | | | | | | | | |
| Description | | Level 1 | | | Level 2 | | | Level 3 | | | Total | |
Gas Utilities | | $ | 9,286,267 | | | $ | — | | | $ | — | | | $ | 9,286,267 | |
Health Care Equipment & Supplies | | | 29,620,869 | | | | — | | | | — | | | | 29,620,869 | |
Health Care Providers & Services | | | 15,393,664 | | | | — | | | | — | | | | 15,393,664 | |
Health Care Technology | | | 9,182,888 | | | | — | | | | — | | | | 9,182,888 | |
Hotels, Restaurants & Leisure | | | 22,970,498 | | | | — | | | | — | | | | 22,970,498 | |
Household Durables | | | 11,499,191 | | | | — | | | | — | | | | 11,499,191 | |
Household Products | | | 1,794,988 | | | | — | | | | — | | | | 1,794,988 | |
Independent Power and Renewable Electricity Producers | | | 2,878,919 | | | | — | | | | — | | | | 2,878,919 | |
Industrial Conglomerates | | | 575,349 | | | | — | | | | — | | | | 575,349 | |
Insurance | | | 22,278,867 | | | | — | | | | — | | | | 22,278,867 | |
Interactive Media & Services | | | 4,159,027 | | | | — | | | | — | | | | 4,159,027 | |
Internet & Direct Marketing Retail | | | 7,589,154 | | | | — | | | | — | | | | 7,589,154 | |
IT Services | | | 15,706,729 | | | | — | | | | — | | | | 15,706,729 | |
Leisure Products | | | 3,127,282 | | | | — | | | | — | | | | 3,127,282 | |
Life Sciences Tools & Services | | | 4,060,041 | | | | — | | | | — | | | | 4,060,041 | |
Machinery | | | 28,874,304 | | | | — | | | | — | | | | 28,874,304 | |
Marine | | | 911,032 | | | | — | | | | — | | | | 911,032 | |
Media | | | 11,004,369 | | | | — | | | | — | | | | 11,004,369 | |
Metals & Mining | | | 9,144,373 | | | | — | | | | — | | | | 9,144,373 | |
Mortgage Real Estate Investment Trusts | | | 9,130,610 | | | | — | | | | — | | | | 9,130,610 | |
Multi-Utilities | | | 4,306,265 | | | | — | | | | — | | | | 4,306,265 | |
Multiline Retail | | | 2,282,538 | | | | — | | | | — | | | | 2,282,538 | |
Oil, Gas & Consumable Fuels | | | 17,680,096 | | | | — | | | | — | | | | 17,680,096 | |
Paper & Forest Products | | | 3,374,664 | | | | — | | | | — | | | | 3,374,664 | |
Personal Products | | | 2,789,823 | | | | — | | | | — | | | | 2,789,823 | |
Pharmaceuticals | | | 15,039,513 | | | | — | | | | — | | | | 15,039,513 | |
Professional Services | | | 11,805,507 | | | | — | | | | — | | | | 11,805,507 | |
Real Estate Management & Development | | | 4,487,438 | | | | — | | | | — | | | | 4,487,438 | |
Road & Rail | | | 3,451,441 | | | | — | | | | — | | | | 3,451,441 | |
Semiconductors & Semiconductor Equipment | | | 21,174,419 | | | | — | | | | — | | | | 21,174,419 | |
Software | | | 42,711,775 | | | | — | | | | — | | | | 42,711,775 | |
Specialty Retail | | | 23,499,078 | | | | — | | | | — | | | | 23,499,078 | |
Technology Hardware, Storage & Peripherals | | | 2,129,288 | | | | — | | | | — | | | | 2,129,288 | |
Textiles, Apparel & Luxury Goods | | | 6,665,851 | | | | — | | | | — | | | | 6,665,851 | |
Thrifts & Mortgage Finance | | | 17,792,614 | | | | — | | | | — | | | | 17,792,614 | |
Tobacco | | | 1,209,747 | | | | — | | | | — | | | | 1,209,747 | |
Trading Companies & Distributors | | | 9,553,529 | | | | — | | | | — | | | | 9,553,529 | |
Water Utilities | | | 3,739,134 | | | | — | | | | — | | | | 3,739,134 | |
Wireless Telecommunication Services | | | 1,541,551 | | | | — | | | | — | | | | 1,541,551 | |
Total Common Stocks | | | 774,441,066 | | | | — | | | | — | | | | 774,441,066 | |
Total Mutual Fund* | | | 23,780,640 | | | | — | | | | — | | | | 23,780,640 | |
Total Rights* | | | — | | | | 24,265 | | | | 37,093 | | | | 61,358 | |
Total Short-Term Investments* | | | — | | | | 8,287,281 | | | | — | | | | 8,287,281 | |
Total Securities Lending Reinvestments* | | | — | | | | 166,940,880 | | | | — | | | | 166,940,880 | |
Total Investments | | $ | 798,221,706 | | | $ | 175,252,426 | | | $ | 37,093 | | | $ | 973,511,225 | |
| | | | | | | | | | | | | | | | | |
Collateral for Securities Loaned (Liability) | | $ | — | | | $ | (166,891,020 | ) | | $ | — | | | $ | (166,891,020 | ) |
Futures Contracts
Futures Contracts (Unrealized Depreciation) | | $ | (140,131 | ) | | $ | — | | | $ | — | | | $ | (140,131 | ) |
| | | | |
| * | | See Schedule of Investments for additional detailed categorizations. |
Level 3 investments at the beginning and/or end of the period in relation to net assets were not significant and accordingly, a reconciliation of Level 3 assets for the year ended December 31, 2018 is not presented.
See accompanying notes to financial statements.
BHFTII-23
Brighthouse Funds Trust II
MetLife Russell 2000 Index Portfolio
Statement of Assets and Liabilities
December 31, 2018
| | | | |
Assets | |
Investments at value (a) (b) | | $ | 973,511,225 | |
Receivable for: | |
Investments sold | | | 778,473 | |
Fund shares sold | | | 2,480,690 | |
Dividends | | | 1,420,194 | |
Variation margin on futures contracts | | | 17,015 | |
Prepaid expenses | | | 2,690 | |
| | | | |
Total Assets | | | 978,210,287 | |
Liabilities | |
Due to custodian | | | 8,371 | |
Collateral for securities loaned | | | 166,891,020 | |
Payables for: | |
Investments purchased | | | 5,452,015 | |
Fund shares redeemed | | | 418,667 | |
Accrued Expenses: | |
Management fees | | | 174,589 | |
Distribution and service fees | | | 83,380 | |
Deferred trustees’ fees | | | 111,916 | |
Other expenses | | | 231,228 | |
| | | | |
Total Liabilities | | | 173,371,186 | |
| | | | |
Net Assets | | $ | 804,839,101 | |
| | | | |
Net Assets Consist of: | |
Paid in surplus | | $ | 574,779,317 | |
Distributable earnings (Accumulated losses) | | | 230,059,784 | |
| | | | |
Net Assets | | $ | 804,839,101 | |
| | | | |
Net Assets | |
Class A | | $ | 441,456,226 | |
Class B | | | 205,813,862 | |
Class E | | | 21,876,667 | |
Class G | | | 135,692,346 | |
Capital Shares Outstanding* | |
Class A | | | 24,344,069 | |
Class B | | | 11,652,249 | |
Class E | | | 1,214,898 | |
Class G | | | 7,714,543 | |
Net Asset Value, Offering Price and Redemption Price Per Share | |
Class A | | $ | 18.13 | |
Class B | | | 17.66 | |
Class E | | | 18.01 | |
Class G | | | 17.59 | |
| | | | |
| * | | The Portfolio is authorized to issue an unlimited number of shares. |
| (a) | | Identified cost of investments was $835,270,543. |
| (b) | | Includes securities loaned at value of $166,928,760. |
Statement of Operations
Year Ended December 31, 2018
| | | | |
Investment Income | |
Dividends (a) | | $ | 11,538,025 | |
Non-cash dividends | | | 925,824 | |
Interest | | | 182,231 | |
Securities lending income | | | 1,661,989 | |
| | | | |
Total investment income | | | 14,308,069 | |
Expenses | |
Management fees | | | 2,422,681 | |
Administration fees | | | 38,644 | |
Custodian and accounting fees | | | 111,876 | |
Distribution and service fees—Class B | | | 628,032 | |
Distribution and service fees—Class E | | | 41,577 | |
Distribution and service fees—Class G | | | 468,911 | |
Audit and tax services | | | 48,334 | |
Legal | | | 45,316 | |
Trustees’ fees and expenses | | | 33,734 | |
Shareholder reporting | | | 176,084 | |
Insurance | | | 6,208 | |
Miscellaneous | | | 115,368 | |
| | | | |
Total expenses | | | 4,136,765 | |
Less management fee waiver | | | (23,794 | ) |
| | | | |
Net expenses | | | 4,112,971 | |
| | | | |
Net Investment Income | | | 10,195,098 | |
| | | | |
Net Realized and Unrealized Gain (Loss) | |
| Net realized gain (loss) on: | |
Investments | | | 86,242,648 | |
Futures contracts | | | 726,780 | |
Foreign currency transactions | | | (105 | ) |
| | | | |
Net realized gain | | | 86,969,323 | |
| | | | |
| Net change in unrealized depreciation on: | |
Investments | | | (191,124,375 | ) |
Futures contracts | | | (271,123 | ) |
| | | | |
Net change in unrealized depreciation | | | (191,395,498 | ) |
| | | | |
Net realized and unrealized loss | | | (104,426,175 | ) |
| | | | |
Net Decrease in Net Assets From Operations | | $ | (94,231,077 | ) |
| | | | |
| | | | |
| (a) | | Net of foreign withholding taxes of $5,865. |
See accompanying notes to financial statements.
BHFTII-24
Brighthouse Funds Trust II
MetLife Russell 2000 Index Portfolio
Statements of Changes in Net Assets
| | | | | | | | |
| | | Year Ended
December 31,
2018 | | | Year Ended
December 31,
2017 | |
Increase (Decrease) in Net Assets: | |
From Operations | |
Net investment income | | $ | 10,195,098 | | | $ | 10,169,485 | |
Net realized gain | | | 86,969,323 | | | | 63,371,248 | |
Net change in unrealized appreciation (depreciation) | | | (191,395,498 | ) | | | 56,533,733 | |
| | | | | | | | |
Increase (decrease) in net assets from operations | | | (94,231,077 | ) | | | 130,074,466 | |
| | | | | | | | |
From Distributions to Shareholders (a) | |
Class A | | | (41,433,317 | ) | | | (26,918,576 | ) |
Class B | | | (19,552,744 | ) | | | (12,944,359 | ) |
Class E | | | (2,137,411 | ) | | | (1,425,044 | ) |
Class G | | | (12,083,917 | ) | | | (7,733,615 | ) |
| | | | | | | | |
Total distributions | | | (75,207,389 | ) | | | (49,021,594 | ) |
| | | | | | | | |
Decrease in net assets from capital share transactions | | | (10,258,796 | ) | | | (29,700,774 | ) |
| | | | | | | | |
Total increase (decrease) in net assets | | | (179,697,262 | ) | | | 51,352,098 | |
|
Net Assets | |
Beginning of period | | | 984,536,363 | | | | 933,184,265 | |
| | | | | | | | |
End of period | | $ | 804,839,101 | | | $ | 984,536,363 | (b) |
| | | | | | | | |
Other Information:
Capital Shares
Transactions in capital shares were as follows:
| | | | | | | | | | | | | | | | |
| | | Year Ended
December 31, 2018 | | | Year Ended
December 31, 2017 | |
| | | Shares | | | Value | | | Shares | | | Value | |
Class A | |
Sales | | | 2,089,324 | | | $ | 45,001,947 | | | | 2,341,690 | | | $ | 48,037,267 | |
Reinvestments | | | 1,853,840 | | | | 41,433,317 | | | | 1,342,573 | | | | 26,918,576 | |
Redemptions | | | (4,238,089 | ) | | | (93,485,795 | ) | | | (4,450,174 | ) | | | (91,944,147 | ) |
| | | | | | | | | | | | | | | | |
Net decrease | | | (294,925 | ) | | $ | (7,050,531 | ) | | | (765,911 | ) | | $ | (16,988,304 | ) |
| | | | | | | | | | | | | | | | |
Class B | |
Sales | | | 696,527 | | | $ | 14,021,234 | | | | 745,990 | | | $ | 15,024,502 | |
Reinvestments | | | 896,915 | | | | 19,552,744 | | | | 660,427 | | | | 12,944,359 | |
Redemptions | | | (2,015,203 | ) | | | (43,828,289 | ) | | | (1,811,625 | ) | | | (36,864,871 | ) |
| | | | | | | | | | | | | | | | |
Net decrease | | | (421,761 | ) | | $ | (10,254,311 | ) | | | (405,208 | ) | | $ | (8,896,010 | ) |
| | | | | | | | | | | | | | | | |
Class E | |
Sales | | | 146,139 | | | $ | 3,141,616 | | | | 135,410 | | | $ | 2,776,996 | |
Reinvestments | | | 96,236 | | | | 2,137,411 | | | | 71,467 | | | | 1,425,044 | |
Redemptions | | | (338,328 | ) | | | (7,307,187 | ) | | | (278,255 | ) | | | (5,722,889 | ) |
| | | | | | | | | | | | | | | | |
Net decrease | | | (95,953 | ) | | $ | (2,028,160 | ) | | | (71,378 | ) | | $ | (1,520,849 | ) |
| | | | | | | | | | | | | | | | |
Class G | |
Sales | | | 1,216,007 | | | $ | 25,584,159 | | | | 1,014,353 | | | $ | 20,315,522 | |
Reinvestments | | | 556,606 | | | | 12,083,917 | | | | 395,986 | | | | 7,733,615 | |
Redemptions | | | (1,329,824 | ) | | | (28,593,870 | ) | | | (1,503,870 | ) | | | (30,344,748 | ) |
| | | | | | | | | | | | | | | | |
Net increase (decrease) | | | 442,789 | | | $ | 9,074,206 | | | | (93,531 | ) | | $ | (2,295,611 | ) |
| | | | | | | | | | | | | | | | |
Decrease derived from capital shares transactions | | | | | | $ | (10,258,796 | ) | | | | | | $ | (29,700,774 | ) |
| | | | | | | | | | | | | | | | |
| | | | |
| (a) | | Distributions from net investment income and realized gains are no longer required to be separately disclosed. The presentation for the year ended December 31, 2018 has been adjusted for this change (See Note 9). At December 31, 2017 the distributions were as follows. |
| | | | | | | | |
| | | Distributions from net
investment income: | | | Distributions from realized
capital gains: | |
Class A | | $ | (6,289,158 | ) | | $ | (20,629,418 | ) |
Class B | | | (2,591,328 | ) | | | (10,353,031 | ) |
Class E | | | (304,417 | ) | | | (1,120,627 | ) |
Class G | | | (1,512,778 | ) | | | (6,220,837 | ) |
| | | | |
| (b) | | As part of the update in (a), it is also no longer required to disclose the Undistributed net investment income (Accumulated losses) which was $9,799,053 as of December 31, 2017. |
See accompanying notes to financial statements.
BHFTII-25
Brighthouse Funds Trust II
MetLife Russell 2000 Index Portfolio
Financial Highlights
| | | | | | | | | | | | | | | | | | | | |
| Selected per share data | |
| | | Class A | |
| | | Year Ended December 31, | |
| | | 2018 | | | 2017 | | | 2016 | | | 2015 | | | 2014 | |
Net Asset Value, Beginning of Period | | $ | 21.98 | | | $ | 20.22 | | | $ | 17.98 | | | $ | 20.11 | | | $ | 19.83 | |
| | | | | | | | | | | | | | | | | | | | |
Income (Loss) from Investment Operations | |
Net investment income (a) | | | 0.26 | | | | 0.25 | | | | 0.25 | (b) | | | 0.26 | | | | 0.24 | |
Net realized and unrealized gain (loss) | | | (2.34 | ) | | | 2.61 | | | | 3.33 | | | | (0.98 | ) | | | 0.71 | |
| | | | | | | | | | | | | | | | | | | | |
Total income (loss) from investment operations | | | (2.08 | ) | | | 2.86 | | | | 3.58 | | | | (0.72 | ) | | | 0.95 | |
| | | | | | | | | | | | | | | | | | | | |
Less Distributions | |
Distributions from net investment income | | | (0.25 | ) | | | (0.26 | ) | | | (0.26 | ) | | | (0.25 | ) | | | (0.23 | ) |
Distributions from net realized capital gains | | | (1.52 | ) | | | (0.84 | ) | | | (1.08 | ) | | | (1.16 | ) | | | (0.44 | ) |
| | | | | | | | | | | | | | | | | | | | |
Total distributions | | | (1.77 | ) | | | (1.10 | ) | | | (1.34 | ) | | | (1.41 | ) | | | (0.67 | ) |
| | | | | | | | | | | | | | | | | | | | |
Net Asset Value, End of Period | | $ | 18.13 | | | $ | 21.98 | | | $ | 20.22 | | | $ | 17.98 | | | $ | 20.11 | |
| | | | | | | | | | | | | | | | | | | | |
Total Return (%) (c) | | | (10.97 | ) | | | 14.67 | | | | 21.28 | | | | (4.27 | ) | | | 5.04 | |
|
Ratios/Supplemental Data | |
Gross ratio of expenses to average net assets (%) | | | 0.31 | | | | 0.31 | | | | 0.31 | | | | 0.31 | | | | 0.32 | |
Net ratio of expenses to average net assets (%) (d) | | | 0.31 | | | | 0.31 | | | | 0.31 | | | | 0.31 | | | | 0.31 | |
Ratio of net investment income to average net assets (%) | | | 1.17 | | | | 1.19 | | | | 1.40 | (b) | | | 1.35 | | | | 1.26 | |
Portfolio turnover rate (%) | | | 26 | | | | 20 | | | | 24 | | | | 27 | | | | 24 | |
Net assets, end of period (in millions) | | $ | 441.5 | | | $ | 541.5 | | | $ | 513.7 | | | $ | 459.0 | | | $ | 488.3 | |
| |
| | | Class B | |
| | | Year Ended December 31, | |
| | | 2018 | | | 2017 | | | 2016 | | | 2015 | | | 2014 | |
Net Asset Value, Beginning of Period | | $ | 21.45 | | | $ | 19.76 | | | $ | 17.60 | | | $ | 19.71 | | | $ | 19.45 | |
| | | | | | | | | | | | | | | | | | | | |
Income (Loss) from Investment Operations | |
Net investment income (a) | | | 0.20 | | | | 0.19 | | | | 0.20 | (b) | | | 0.21 | | | | 0.19 | |
Net realized and unrealized gain (loss) | | | (2.27 | ) | | | 2.55 | | | | 3.25 | | | | (0.96 | ) | | | 0.69 | |
| | | | | | | | | | | | | | | | | | | | |
Total income (loss) from investment operations | | | (2.07 | ) | | | 2.74 | | | | 3.45 | | | | (0.75 | ) | | | 0.88 | |
| | | | | | | | | | | | | | | | | | | | |
Less Distributions | |
Distributions from net investment income | | | (0.20 | ) | | | (0.21 | ) | | | (0.21 | ) | | | (0.20 | ) | | | (0.18 | ) |
Distributions from net realized capital gains | | | (1.52 | ) | | | (0.84 | ) | | | (1.08 | ) | | | (1.16 | ) | | | (0.44 | ) |
| | | | | | | | | | | | | | | | | | | | |
Total distributions | | | (1.72 | ) | | | (1.05 | ) | | | (1.29 | ) | | | (1.36 | ) | | | (0.62 | ) |
| | | | | | | | | | | | | | | | | | | | |
Net Asset Value, End of Period | | $ | 17.66 | | | $ | 21.45 | | | $ | 19.76 | | | $ | 17.60 | | | $ | 19.71 | |
| | | | | | | | | | | | | | | | | | | | |
Total Return (%) (c) | | | (11.18 | ) | | | 14.39 | | | | 20.96 | | | | (4.49 | ) | | | 4.78 | |
|
Ratios/Supplemental Data | |
Gross ratio of expenses to average net assets (%) | | | 0.56 | | | | 0.56 | | | | 0.56 | | | | 0.56 | | | | 0.57 | |
Net ratio of expenses to average net assets (%) (d) | | | 0.56 | | | | 0.56 | | | | 0.56 | | | | 0.56 | | | | 0.56 | |
Ratio of net investment income to average net assets (%) | | | 0.92 | | | | 0.94 | | | | 1.15 | (b) | | | 1.10 | | | | 1.01 | |
Portfolio turnover rate (%) | | | 26 | | | | 20 | | | | 24 | | | | 27 | | | | 24 | |
Net assets, end of period (in millions) | | $ | 205.8 | | | $ | 259.0 | | | $ | 246.6 | | | $ | 220.8 | | | $ | 240.2 | |
Please see following page for Financial Highlights footnote legend.
See accompanying notes to financial statements.
BHFTII-26
Brighthouse Funds Trust II
MetLife Russell 2000 Index Portfolio
Financial Highlights
| | | | | | | | | | | | | | | | | | | | |
| Selected per share data | |
| | | Class E | |
| | | Year Ended December 31, | |
| | | 2018 | | | 2017 | | | 2016 | | | 2015 | | | 2014 | |
Net Asset Value, Beginning of Period | | $ | 21.84 | | | $ | 20.10 | | | $ | 17.88 | | | $ | 20.00 | | | $ | 19.72 | |
| | | | | | | | | | | | | | | | | | | | |
Income (Loss) from Investment Operations | �� |
Net investment income (a) | | | 0.22 | | | | 0.21 | | | | 0.22 | (b) | | | 0.23 | | | | 0.21 | |
Net realized and unrealized gain (loss) | | | (2.31 | ) | | | 2.60 | | | | 3.31 | | | | (0.98 | ) | | | 0.71 | |
| | | | | | | | | | | | | | | | | | | | |
Total income (loss) from investment operations | | | (2.09 | ) | | | 2.81 | | | | 3.53 | | | | (0.75 | ) | | | 0.92 | |
| | | | | | | | | | | | | | | | | | | | |
Less Distributions | |
Distributions from net investment income | | | (0.22 | ) | | | (0.23 | ) | | | (0.23 | ) | | | (0.21 | ) | | | (0.20 | ) |
Distributions from net realized capital gains | | | (1.52 | ) | | | (0.84 | ) | | | (1.08 | ) | | | (1.16 | ) | | | (0.44 | ) |
| | | | | | | | | | | | | | | | | | | | |
Total distributions | | | (1.74 | ) | | | (1.07 | ) | | | (1.31 | ) | | | (1.37 | ) | | | (0.64 | ) |
| | | | | | | | | | | | | | | | | | | | |
Net Asset Value, End of Period | | $ | 18.01 | | | $ | 21.84 | | | $ | 20.10 | | | $ | 17.88 | | | $ | 20.00 | |
| | | | | | | | | | | | | | | | | | | | |
Total Return (%) (c) | | | (11.08 | ) | | | 14.50 | | | | 21.09 | | | | (4.39 | ) | | | 4.91 | |
|
Ratios/Supplemental Data | |
Gross ratio of expenses to average net assets (%) | | | 0.46 | | | | 0.46 | | | | 0.46 | | | | 0.46 | | | | 0.47 | |
Net ratio of expenses to average net assets (%) (d) | | | 0.46 | | | | 0.46 | | | | 0.46 | | | | 0.46 | | | | 0.46 | |
Ratio of net investment income to average net assets (%) | | | 1.01 | | | | 1.04 | | | | 1.25 | (b) | | | 1.19 | | | | 1.10 | |
Portfolio turnover rate (%) | | | 26 | | | | 20 | | | | 24 | | | | 27 | | | | 24 | |
Net assets, end of period (in millions) | | $ | 21.9 | | | $ | 28.6 | | | $ | 27.8 | | | $ | 25.0 | | | $ | 28.7 | |
| |
| | | Class G | |
| | | Year Ended December 31, | |
| | | 2018 | | | 2017 | | | 2016 | | | 2015 | | | 2014 | |
Net Asset Value, Beginning of Period | | $ | 21.37 | | | $ | 19.70 | | | $ | 17.54 | | | $ | 19.65 | | | $ | 19.40 | |
| | | | | | | | | | | | | | | | | | | | |
Income (Loss) from Investment Operations | |
Net investment income (a) | | | 0.19 | | | | 0.18 | | | | 0.19 | (b) | | | 0.20 | | | | 0.18 | |
Net realized and unrealized gain (loss) | | | (2.26 | ) | | | 2.54 | | | | 3.24 | | | | (0.96 | ) | | | 0.69 | |
| | | | | | | | | | | | | | | | | | | | |
Total income (loss) from investment operations | | | (2.07 | ) | | | 2.72 | | | | 3.43 | | | | (0.76 | ) | | | 0.87 | |
| | | | | | | | | | | | | | | | | | | | |
Less Distributions | |
Distributions from net investment income | | | (0.19 | ) | | | (0.21 | ) | | | (0.19 | ) | | | (0.19 | ) | | | (0.18 | ) |
Distributions from net realized capital gains | | | (1.52 | ) | | | (0.84 | ) | | | (1.08 | ) | | | (1.16 | ) | | | (0.44 | ) |
| | | | | | | | | | | | | | | | | | | | |
Total distributions | | | (1.71 | ) | | | (1.05 | ) | | | (1.27 | ) | | | (1.35 | ) | | | (0.62 | ) |
| | | | | | | | | | | | | | | | | | | | |
Net Asset Value, End of Period | | $ | 17.59 | | | $ | 21.37 | | | $ | 19.70 | | | $ | 17.54 | | | $ | 19.65 | |
| | | | | | | | | | | | | | | | | | | | |
Total Return (%) (c) | | | (11.20 | ) | | | 14.30 | | | | 20.92 | | | | (4.54 | ) | | | 4.73 | |
|
Ratios/Supplemental Data | |
Gross ratio of expenses to average net assets (%) | | | 0.61 | | | | 0.61 | | | | 0.61 | | | | 0.61 | | | | 0.62 | |
Net ratio of expenses to average net assets (%) (d) | | | 0.61 | | | | 0.61 | | | | 0.61 | | | | 0.61 | | | | 0.61 | |
Ratio of net investment income to average net assets (%) | | | 0.88 | | | | 0.89 | | | | 1.10 | (b) | | | 1.04 | | | | 0.96 | |
Portfolio turnover rate (%) | | | 26 | | | | 20 | | | | 24 | | | | 27 | | | | 24 | |
Net assets, end of period (in millions) | | $ | 135.7 | | | $ | 155.4 | | | $ | 145.1 | | | $ | 131.0 | | | $ | 144.7 | |
| | | | |
| (a) | | Per share amounts based on average shares outstanding during the period. |
| (b) | | Net investment income per share and the ratio of net investment income to average net assets include anon-recurring refund for overbilling of prior years’ custodianout-of-pocket fees which amounted to less than $0.01 per share and 0.02% of average net assets, respectively. |
| (c) | | Total return does not reflect any insurance, sales, separate account or administrative charges of variable annuity or life insurance contracts or any additional expenses that contract owners may bear under their variable contracts. If these charges were included, the returns would be lower. |
| (d) | | Includes the effects of management fee waivers (see Note 6 of the Notes to Financial Statements). |
See accompanying notes to financial statements.
BHFTII-27
Brighthouse Funds Trust II
MetLife Russell 2000 Index Portfolio
Notes to Financial Statements—December 31, 2018
1. Organization
Brighthouse Funds Trust II (the “Trust”) is organized as a Delaware statutory trust and registered under the Investment Company Act of 1940, as amended (the “1940 Act”), as anopen-end management investment company. The Trust, which is managed by Brighthouse Investment Advisers, LLC (“Brighthouse Investment Advisers” or the “Adviser”), currently offers twenty-nine series, each of which operates as a distinct investment vehicle of the Trust. The series included in this report is MetLife Russell 2000 Index Portfolio (the “Portfolio”), which is diversified. Shares in the Portfolio are not offered directly to the general public and are currently available only to separate accounts established by life insurance companies affiliated with the Adviser and Metropolitan Life Insurance Company (the “Insurance Companies”).
The Portfolio has registered and offers four classes of shares: Class A, B, E and G shares. Shares of each Class of the Portfolio represent an equal pro rata interest in the Portfolio and generally give the shareholder the same voting, dividend, liquidation, and other rights. Investment income, realized and unrealized capital gains and losses, the common expenses of the Portfolio, and certain Portfolio-level expense reductions, if any, are allocated on a pro rata basis to each Class based on the relative net assets of each Class to the net assets of the Portfolio. Each Class of shares differs in its respective distribution plan and such distribution expenses are allocated to the corresponding Class of shares.
2. Significant Accounting Policies
The preparation of financial statements in conformity with accounting principles generally accepted in the United States of America (“GAAP”) requires management to make estimates and assumptions that affect the reported amounts of assets and liabilities and disclosure of contingent assets and liabilities as of the date of the financial statements and the reported amounts of income and expenses during the reporting period. Actual results could differ from those estimates. In the preparation of these financial statements, management has evaluated events and transactions subsequent to December 31, 2018 through the date the financial statements were issued.
The Portfolio is an investment company and follows the accounting and reporting guidance of the Financial Accounting Standards Board (“FASB”) Accounting Standards Codification Topic946- Financial Services- Investment Companies. The following is a summary of significant accounting policies consistently followed by the Portfolio in the preparation of its financial statements.
Investment Valuation and Fair Value Measurements - The Portfolio values its portfolio investments for purposes of calculating its net asset value (“NAV”) using procedures approved by the Board of Trustees of the Trust (the “Board” or “Trustees”). Those procedures allow for a variety of methodologies to be used to value the Portfolio’s investments. The specific methodologies used for a particular investment may vary based on the market data available for a specific investment at the time the Portfolio calculates its NAV or based on other considerations. The procedures also permit a level of judgment to be used in the valuation process. The Portfolio follows the accounting and reporting guidance of FASB Accounting Standards Codification Topic820- Fair Value Measurement.
Domestic and foreign equity securities, such as common stock, exchange-traded funds, rights, warrants, and preferred stock, that are traded on a securities exchange on a valuation date are generally valued at their last quoted sale price or official closing price on the primary exchange for such security, or, if no sales occurred on that day, at the last reported bid price. Equity securities tradedover-the-counter (“OTC”) are generally valued at the last reported bid price. In the event of a major exchange closing during the trading day, the Adviser may use other market information obtained from quotation reporting systems, established market makers, or pricing services in valuing the securities. Valuation adjustments may be applied to certain foreign equity securities that are traded solely on foreign exchanges that close before the time as of which the Portfolio determines its NAV to account for the market movement between the close of the foreign exchanges and the time as of which the Portfolio determines its NAV. The Portfolio may use a systematic fair valuation model provided by a pricing service to value securities principally traded in these foreign markets in order to adjust for possible market movements or other changes that may occur between the close of the foreign exchanges and the time as of which the Portfolio determines its NAV. Foreign equity securities valued using these valuation adjustments are generally categorized as Level 2 within the fair value hierarchy. Equity securities that are actively traded, and have no valuation adjustments applied, are categorized as Level 1 within the fair value hierarchy. Other equity securities traded on inactive markets, or valued in reference to similar instruments traded on active markets, are generally categorized as Level 2 within the fair value hierarchy.
Investments in registeredopen-end management investment companies are valued at reported NAV per share on the valuation date and are categorized as Level 1 within the fair value hierarchy.
Debt securities, including corporate, convertible and municipal bonds and notes; obligations of the U.S. Treasury and U.S. government agencies; foreign sovereign issues; andnon-U.S. bonds, are generally valued on the basis of evaluated or composite bid quotations obtained from independent pricing services and/or brokers and dealers selected by the Adviser (each a “pricing service”), pursuant to the authorization of and subject to general oversight by the Board. Such pricing services may use matrix pricing, which considers observable inputs including, among other things, issuer details, maturity dates, interest rates, yield curves, rates of prepayment, credit risks/spreads, default rates, reported trades, broker-dealer quotes and quoted prices for similar assets. Short-term obligations with a
BHFTII-28
Brighthouse Funds Trust II
MetLife Russell 2000 Index Portfolio
Notes to Financial Statements—December 31, 2018—(Continued)
remaining maturity of sixty days or less may be valued at amortized cost in the absence of market quotes, so long as the amortized cost value of such short-term debt instrument is approximately the same as the fair value of the instrument as determined without the use of amortized cost valuation. Floating rate loans are generally valued on the basis of an evaluated or composite average of aggregate bid and ask quotations supplied by brokers or dealers, as obtained from the pricing service. Securities that use similar valuation techniques and inputs as described above are generally categorized as Level 2 within the fair value hierarchy.
Options, whether on securities, indices, futures contracts, or otherwise, traded on exchanges are valued at the last sale price available as of the close of business on a valuation day or, if there is no such price available, at the last reported bid price. These types of options are categorized as Level 1 within the fair value hierarchy. Futures contracts that are traded on commodity exchanges are valued at their settlement prices established by the exchanges on which they are traded as of the close of such exchanges and are categorized as Level 1 within the fair value hierarchy.
If no current market value quotation or other observable inputs are readily available or market value quotations are deemed to be unreliable for an investment, the fair value of the investment will be determined in accordance with procedures approved by, and under the general supervision of, the Board. In such a circumstance, the Board will be assisted in its responsibility to determine the fair value of an investment by the Valuation Committee (“Committee”) of Brighthouse Investment Advisers. The Committee provides general pricing oversight and fair value pricing determinations related to portfolio securities and meets on a regular basis to review reports relating to the valuation of the securities in the Portfolio. The Board has delegated to State Street Bank and Trust Company, the Trust’s custodian (“Custodian”), the responsibility for calculating the NAVs of the Trust’s Portfolios. The Committee is responsible for overseeing the calculation of the NAVs of the Portfolios by the custodian. The Committee also periodically reviews pricing services, including the pricing services providing fair value pricing for the Portfolio’s foreign securities, and is responsible for overseeing the correction of pricing errors and addressing other pricing issues that arise in the ordinary course of business, such as making real-time fair value determinations, as necessary.
No single standard for determining the fair value of an investment can be set forth because fair value depends upon the facts and circumstances with respect to each investment. Information relating to any relevant factors may be obtained by the Committee from any appropriate source, including the subadviser of the Portfolio, the custodian, a pricing service, market maker and/or broker for such security or the issuer. Appropriate methodologies for determining fair value under particular circumstances may include: matrix pricing, a discounted cash flow analysis, comparisons of securities with comparable characteristics, value based on multiples of earnings, discount from market price of similar marketable securities, or a combination of these and other methods.
Investment Transactions and Related Investment Income - Portfolio security transactions are recorded on the trade date. Dividend income is recorded on theex-dividend date or, for certain foreign securities, when notified. Interest income, which includes amortization of premium and accretion of discount on debt securities, is recorded on the accrual basis. Realized gains and losses on investments are determined on the identified cost basis, which is the same basis used for federal income tax purposes. Foreign income and foreign capital gains on some foreign securities may be subject to foreign taxes, which are accrued as applicable. These foreign taxes have been provided for in accordance with the Portfolio’s understanding of the applicable countries’ tax rules and rates.
Foreign Currency Translation -The books and records of the Portfolio are maintained in U.S. dollars. The values of securities, currencies, and other assets and liabilities denominated in currencies other than the U.S. dollar are translated into U.S. dollars based upon foreign exchange rates prevailing at the end of the period. Purchases and sales of investment securities, income, and expenses are translated on the respective dates of such transactions. Because the values of investment securities are translated at the foreign exchange rates prevailing at the end of the period, that portion of the results of operations arising from changes in exchange rates and that portion of the results of operations reflecting fluctuations arising from changes in market prices of the investment securities are not separated. Such fluctuations are included in the net realized and unrealized gain or loss on investments.
Net realized foreign exchange gains or losses arise from activity in forward foreign currency exchange contracts, sales of foreign currency, currency gains or losses realized between the trade and settlement dates on securities transactions, and the difference between the amounts of dividends, interest, and foreign withholding taxes recorded by the Portfolio and the U.S. dollar-equivalent of the amounts actually received or paid by the Portfolio. Net unrealized foreign exchange gains and losses arise from changes in the value of assets and liabilities, other than investment securities, resulting from changes in foreign exchange rates.
Dividends and Distributions to Shareholders -The Portfolio records dividends and distributions on theex-dividend date. Net realized gains from securities transactions (if any) are generally distributed annually to shareholders. The timing and characterization of certain income and capital gains distributions are determined in accordance with federal tax regulations that may differ from GAAP. Permanent book and tax basis differences relating to shareholder distributions will result in reclassification between distributable earnings (accumulated losses) andpaid-in surplus. These adjustments have no impact on net assets or the results of operations.
Due to Custodian - Pursuant to the custodian agreement, the Custodian may, in its discretion, advance funds to the Portfolio to make properly authorized payments. When such payments result in an overdraft, the Portfolio is obligated to repay the Custodian at the
BHFTII-29
Brighthouse Funds Trust II
MetLife Russell 2000 Index Portfolio
Notes to Financial Statements—December 31, 2018—(Continued)
current rate of interest charged by the Custodian for secured loans (currently, the federal funds rate plus 2%). This obligation is payable on demand to the Custodian. The Custodian has a lien on the Portfolio’s assets to the extent of any overdraft. At December 31, 2018, the Portfolio had a payment of $8,371 due to the Custodian pursuant to the foregoing arrangement. Based on the short-term nature of these payments and the variable interest rate, the carrying value of the overdraft advances approximated its fair value at December 31, 2018. If measured at fair value, overdraft advances would have been considered as Level 2 in the fair value hierarchy at December 31, 2018. The Portfolio’s average overdraft advances during the year ended December 31, 2018 were not significant.
Income Taxes -It is the Portfolio’s policy to comply with the requirements of the Internal Revenue Code of 1986, as amended, and regulations thereunder, applicable to regulated investment companies, and to distribute, with respect to each taxable year, all of its taxable income to shareholders. Therefore, no federal income tax provision is required. The Portfolio files U.S. federal tax returns. No income tax returns are currently under examination. The Portfolio’s federal tax returns for the prior three fiscal years remain subject to examination by the Internal Revenue Service. As of December 31, 2018, the Portfolio had no uncertain tax positions that would require financial statement recognition, or derecognition or disclosure.
Repurchase Agreements -The Portfolio may enter into repurchase agreements, under the terms of a Master Repurchase Agreement (“MRA”), with selected commercial banks and broker-dealers, under which the Portfolio acquires securities as collateral and agrees to resell the securities at an agreed-upon time and at an agreed-upon price. The Portfolio, through the custodian or a subcustodian, under atri-party repurchase agreement, receives delivery of the underlying securities collateralizing any repurchase agreements. It is the Portfolio’s policy that the market value of the collateral be equal to at least 100% of the repurchase price in the case of a repurchase agreement ofone-day duration and equal to at least 102% of the repurchase price in the case of all other repurchase agreements. In the event of default or failure by a party to perform an obligation in connection with any repurchase transaction, the MRA gives thenon-defaulting party the right toset-off claims and to apply property held by it in connection with any repurchase transaction against obligations owed to it.
At December 31, 2018, the Portfolio invested cash collateral for loans of portfolio securities in repurchase agreements with a gross value of $29,509,738. The combined value of all repurchase agreements is included as part of investments at value on the Statement of Assets and Liabilities. The value of the related collateral exceeded the value of the repurchase agreements at December 31, 2018.
Securities Lending - The Portfolio may lend its portfolio securities to certain qualified brokers who borrow securities in order to complete certain securities transactions. By lending its portfolio securities, the Portfolio attempts to increase its net investment income through the receipt of income on collateral held from securities on loan. Any gain or loss in the market price of the loaned securities that might occur and any interest earned or dividends declared during the term of the loan would accrue to the account of the Portfolio.
The Trust has entered into aNon-Custodial Securities Lending Agreement with JPMorgan Chase Bank, N.A. (the “Lending Agent”). Under the agreement, the Lending Agent is authorized to loan portfolio securities on the Portfolio’s behalf. In exchange, the Portfolio receives either cash or U.S. government securities as collateral against the loaned securities. The Portfolio receives collateral equal to at least 102% of the market value for loans secured by government securities or cash in the same currency as the loaned shares and 105% for all other loaned securities at each loan’s inception. Collateral representing at least 100% of the market value of the loaned securities is maintained for the duration of the loan. Any cash collateral received by the Portfolio is generally invested by the Lending Agent in short-term investments, which may include certificates of deposit, commercial paper, repurchase agreements, time deposits, master demand notes and money market funds. The market value of investments made with cash collateral received are disclosed in the Schedule of Investments and the valuation techniques are described in Note 2. If the market value of the collateral at the close of trading on a business day is less than 100% of the market value of the loaned securities at the close of trading on that day, the borrower is required to deliver, by the close of business on the following business day, an additional amount of collateral, so that the total amount of posted collateral is equal to at least 100% of the market value of all the loaned securities as of such preceding day. A portion of the income earned on the collateral is rebated to the borrower of the securities and the remainder is split between the Lending Agent and the Portfolio. On loans collateralized by U.S. government securities, a fee is received from the borrower and is allocated between the Portfolio and the Lending Agent.
Income received by the Portfolio in securities lending transactions during the year ended December 31, 2018 is reflected as securities lending income on the Statement of Operations. The values of any securities loaned by the Portfolio and the related collateral at December 31, 2018 are disclosed in the footnotes to the Schedule of Investments. The value of the related collateral received by the Portfolio exceeded the value of the securities out on loan at December 31, 2018.
The risks associated with lending portfolio securities include, but are not limited to, possible delays in receiving additional collateral or in the recovery of the loaned securities, possible loss of rights in the collateral should the borrower fail financially, as well as risk of loss in the value of the collateral or the value of the investments made with the collateral. The Lending Agent shall indemnify the Portfolio in the case of default of any securities borrower, subject to the terms of theNon-Custodial Securities Lending Agreement.
BHFTII-30
Brighthouse Funds Trust II
MetLife Russell 2000 Index Portfolio
Notes to Financial Statements—December 31, 2018—(Continued)
The following table provides a breakdown of transactions accounted for as secured borrowings, the gross obligations by the type of collateral pledged, and the remaining contractual maturities of those transactions.
| | | | | | | | | | | | | | | | | | | | |
| | | Remaining Contractual Maturity of the Agreements
As of December 31, 2018 | |
| | | Overnight and
Continuous | | | Up to
30 Days | | | 31 - 90
Days | | | Greater than
90 days | | | Total | |
| Securities Lending Transactions | | | | | | | | | | | | | | | | | | | | |
Common Stocks | | $ | (148,697,481 | ) | | $ | — | | | $ | — | | | $ | — | | | $ | (148,697,481 | ) |
Mutual Funds | | | (18,193,539 | ) | | | — | | | | — | | | | — | | | | (18,193,539 | ) |
Total | | $ | (166,891,020 | ) | | $ | — | | | $ | — | | | $ | — | | | $ | (166,891,020 | ) |
Total Borrowings | | $ | (166,891,020 | ) | | $ | — | | | $ | — | | | $ | — | | | $ | (166,891,020 | ) |
Gross amount of recognized liabilities for securities lending transactions | | | $ | (166,891,020 | ) |
| | | | | | | | | | | | | | | | | | | | |
3. Investments in Derivative Instruments
Futures Contracts -The Portfolio may buy and sell futures contracts as a hedge, to maintain investment exposure to a target asset class or to enhance return. The Portfolio may be subject to fluctuations in equity prices, interest rates, commodity prices, and foreign currency exchange rates in the normal course of pursuing its investment objective. Futures contracts are standardized agreements to buy or sell a security, or deliver a final cash settlement price in connection with an index, interest rate, currency, or other asset. The Portfolio must deposit an amount (“initial margin”) equal to a certain percentage of the face value of the futures contract. The initial margin may be in the form of cash or securities, which is returned when the Portfolio’s obligations under the contract have been satisfied. If cash is deposited as the initial margin, it is shown as cash collateral on the Statement of Assets and Liabilities. Futures contracts aremarked-to-market daily and subsequent payments (“variation margin”) are made or received by the Portfolio depending on whether unrealized gains or losses are incurred. These amounts are reflected as receivables or payables on the Statement of Assets and Liabilities and as a component of net change in unrealized appreciation/depreciation on the Statement of Operations. When the contract is closed or expires, the Portfolio records a realized gain or loss equal to the difference between the value of the contract at the time it was opened and the value at the time it was closed. Risks of entering into futures contracts (and related options) include the possibility that the market for these instruments may be illiquid and that a change in the value of the contract or option may not correlate perfectly with changes in the value of the underlying instrument. If futures contracts areexchange-traded, the exchange’s clearinghouse, as counterparty to all exchange-traded futures, guarantees the futures contracts against default. For OTC futures, the Portfolio’s ability to terminate the positions may be more limited than in the case of exchange-traded positions and may also involve the risk that securities dealers participating in such transactions would fail to meet their obligations to the Portfolio.
The following table summarizes the fair value of derivatives held by the Portfolio at December 31, 2018 by category of risk exposure:
| | | | | | |
| | | Liability Derivatives | |
Risk Exposure | | Statement of Assets &
Liabilities Location | | Fair Value | |
Equity | | Unrealized depreciation on futures contracts (a) | | $ | 140,131 | |
| | | | | | |
| | | | |
| (a) | | Includes cumulative appreciation/depreciation of futures contracts as reported in the Schedule of Investments. Only the current day’s variation margin is reported within the Statement of Assets and Liabilities. |
The following tables summarize the effect of derivative instruments on the Statement of Operations, classified by derivative type and category of risk exposure, for the year ended December 31, 2018:
| | | | |
Statement of Operations Location—Net Realized Gain (Loss) | | Equity | |
Futures contracts | | $ | 726,780 | |
| | | | |
| |
Statement of Operations Location—Net Change in Unrealized Appreciation (Depreciation) | | Equity | |
Futures contracts | | $ | (271,123 | ) |
| | | | |
For the year ended December 31, 2018, the average notional par or face amount outstanding for each derivative type was as follows:
| | | | |
Derivative Description | | Average
Notional Par or
Face Amount‡ | |
Futures contracts long | | $ | 7,706 | |
| | | | |
| ‡ | | Averages are based on activity levels during the period for which the amounts are outstanding. |
BHFTII-31
Brighthouse Funds Trust II
MetLife Russell 2000 Index Portfolio
Notes to Financial Statements—December 31, 2018—(Continued)
4. Certain Risks
In the normal course of business, the Portfolio invests in securities and enters into transactions where risks exist. Those risks include:
Market Risk:The value of securities held by the Portfolio may decline in response to certain events, including those directly involving the issuers whose securities are owned by the Portfolio; conditions affecting the general economy; overall market changes; local, regional or global political, social or economic instability; and currency, interest rate, and price fluctuations.
Credit and Counterparty Risk: The Portfolio may be exposed to counterparty risk, or the risk that an entity with which the Portfolio has unsettled or open transactions may default. The potential loss could exceed the value of the financial assets and liabilities recorded in the financial statements. Financial assets that potentially expose the Portfolio to credit and counterparty risk consist principally of cash due from counterparties and investments. The Portfolio manages counterparty risk by entering into agreements only with counterparties that it believes have the financial resources to honor their obligations and by monitoring the financial stability of those counterparties. The Adviser attempts to mitigate counterparty risk by (i) periodically assessing the creditworthiness of its trading partners, (ii) monitoring and/or limiting the amount of its net exposure to each individual counterparty based on its assessment, and (iii) requiring collateral from the counterparty for certain transactions. In order to preserve certain safeguards fornon-standard settlement trades, the Portfolio restricts its exposure to credit and counterparty losses by entering into master netting agreements (“Master Agreements”) with counterparties (approved brokers) with whom it undertakes a significant volume of transactions. Master Agreements govern the terms of certain transactions, and reduce the counterparty risk associated with relevant transactions by specifying credit protection mechanisms and providing standardization that improves legal certainty. Master Agreements can also help limit counterparty risk by specifying collateral posting arrangements atpre-arranged exposure levels.
Customer Account Agreements and related addenda govern cleared derivatives transactions such as futures, options on futures, and cleared OTC derivatives. Cleared derivative transactions require posting of initial margin as determined by each relevant clearing agency, which is segregated at a broker account registered with the Commodities Futures Trading Commission (“CFTC”), or the applicable regulator. In the U.S., counterparty risk is significantly reduced as creditors of the futures broker do not have claim to portfolio assets in the segregated account. Additionally, portability of exposure in the event of default further reduces risk to the Portfolio. Variation margin, or changes in market value, are exchanged daily, but may not be netted between futures and cleared OTC derivatives.
Repurchase and reverse repurchase agreements are primarily executed under Global Master Repurchase Agreements (“GMRAs”) or Master Repurchase Agreements (“MRAs”), which provide the rights to set-off. Each repurchase and reverse repurchase agreement is initially collateralized at the transaction level. In the event of default, the total market value exposure will be offset against collateral exchanged to date, which would result in a net receivable/(payable) that would be due from/to the counterparty.
Additional risks associated with each type of investment are described above within the respective security type notes. The Portfolio’s prospectus includes a discussion of the principal risks of investing in the Portfolio.
5. Investment Transactions
Aggregate cost of purchases and proceeds of sales of investment securities, excluding short-term securities, for the year ended December 31, 2018 were as follows:
| | | | | | | | | | | | |
Purchases | | | Sales | |
U.S. Government | | Non-U.S. Government | | | U.S. Government | | | Non-U.S. Government | |
| $0 | | $ | 242,730,226 | | | $ | 0 | | | $ | 290,966,621 | |
6. Investment Management Fees and Other Transactions with Affiliates
Investment Management Agreement -Brighthouse Investment Advisers is the investment adviser to the Portfolio. The Trust has entered into an investment management agreement with Brighthouse Investment Advisers with respect to the Portfolio. For providing investment management services to the Portfolio, Brighthouse Investment Advisers receives monthly compensation at the annual rate of 0.250% of average daily net assets. Fees earned by Brighthouse Investment Advisers with respect to the Portfolio for the year ended December 31, 2018 were $2,422,681.
Brighthouse Investment Advisers has entered into an investment subadvisory agreement with MetLife Investment Advisors, LLC (“MIA”) with respect to managing the Portfolio. For providing subadvisory services to the Portfolio, Brighthouse Investment Advisers has agreed to pay MIA an investment subadvisory fee for each class of the Portfolio as follows:
| | |
% per annum | | Average daily net assets |
| 0.040% | | On the first $500 million |
| 0.030% | | Of the next $500 million |
| 0.015% | | On amounts over $1 billion |
BHFTII-32
Brighthouse Funds Trust II
MetLife Russell 2000 Index Portfolio
Notes to Financial Statements—December 31, 2018—(Continued)
Fees earned by MIA with respect to the Portfolio for the year ended December 31, 2018 were $339,716.
Management Fee Waiver- Pursuant to a management fee waiver agreement, Brighthouse Investment Advisers has agreed, for the period April 30, 2018 to April 30, 2019, to reduce its advisory fees set out above under “Investment Management Agreement” for each class of the Portfolio as follows:
| | |
% per annum | | Average daily net assets |
| 0.005% | | Over $500 million and under $1 billion |
| 0.010% | | Of the next $1 billion |
| 0.015% | | On amounts over $2 billion |
An identical agreement was in place for the period May 1, 2017 to April 30, 2018. Amounts waived for the year ended December 31, 2018 are shown as a management fee waiver in the Statement of Operations.
Certain officers and trustees of the Trust may also be officers of Brighthouse Investment Advisers; however, such officers and trustees receive no compensation from the Trust.
Transfer Agency Agreement -Brighthouse Financial, Inc. serves as the transfer agent for the Trust. Brighthouse Financial, Inc. receives no fees for its services to the Trust.
Distribution and Service Fees- The Trust has a distribution agreement with Brighthouse Securities, LLC (the “Distributor”) pursuant to which the Distributor serves as the general distributor of shares of each class (each a “Class”) of each Portfolio. The Distributor is an affiliate of the Trust. The Trust has adopted a Distribution and Services Plan (the “Plan”) relating to Class B, Class E and Class G shares of each Portfolio, under Rule 12b-1 under the 1940 Act, pursuant to which the Trust may pay the Distributor a fee (the “Service Fee”) at an annual rate not to exceed 0.25% of each such Portfolio’s average daily net assets attributable to the Class B, Class E and Class G shares of the Trust. Each Portfolio may not offer shares of each Class. The Plan also authorizes the Trust, on behalf of each of its Portfolios, may pay the Distributor a distribution Fee (the “Distribution Fee” and together with the Service Fee, the “Fees”) at an annual rate of up to 0.25% of each Portfolio’s average daily net assets attributable to the Class B, Class E and Class G shares in consideration of the services rendered in connection with the sale of such shares by the Distributor. Under the Distribution Agreement with respect to the Trust, Fees are currently paid at an annual rate of 0.25% of average daily net assets in the case of Class B shares, 0.15% of average daily net assets in the case of Class E shares and 0.30% of average daily net assets in the case of Class G shares. The Plan is known as a “compensation plan” because the Trust makes payments to the Distributor for services rendered regardless of the actual level of expenditures by the Distributor. Amounts incurred by the Portfolio for the year ended December 31, 2018 are shown as Distribution and service fees in the Statement of Operations.
Deferred Trustee Compensation -Each Trustee who is not currently an employee of the Adviser or any of its affiliates receives compensation from the Trust for his or her service to the Trust. A deferred compensation plan (the “Plan”) is available to the Trustees on a voluntary basis. Deferred amounts remain in the Trust until distributed in accordance with the provisions of the Plan. The value of a participating Trustee’s deferral account is based on theoretical investments of deferred amounts on the normal payment dates in certain portfolios of the Trust or Brighthouse Funds Trust I, an affiliate of the Trust, as designated by the participating Trustee. Changes in the value of participants’ deferral accounts are reflected as Trustees’ fees and expenses in the Statement of Operations. The portion of the accrued obligations allocated to the Portfolio under the Plan is reflected as Deferred trustees’ fees in the Statement of Assets and Liabilities.
7. Contractual Obligations
Under the Trust’s organizational documents, its officers and Trustees may be indemnified against certain liabilities and expenses arising out of the performance of their duties to the Trust. Additionally, the Trust has a variety of indemnification obligations under contracts with its service providers. The Trust’s maximum exposure under these arrangements is unknown, as this would involve future claims that may be made against the Trust that have not yet occurred.
8. Income Tax Information
The cost basis of investments for federal income tax purposes at December 31, 2018 was as follows:
| | | | |
Cost basis of investments | | $ | 839,875,116 | |
Gross unrealized appreciation | | | 229,879,910 | |
Gross unrealized depreciation | | | (96,243,801 | ) |
| | | | |
Net unrealized appreciation (depreciation) | | $ | 133,636,109 | |
| | | | |
BHFTII-33
Brighthouse Funds Trust II
MetLife Russell 2000 Index Portfolio
Notes to Financial Statements—December 31, 2018—(Continued)
The tax character of distributions paid for the years ended December 31, 2018 and 2017 were as follows:
| | | | | | | | | | | | | | | | | | | | |
Ordinary Income | | | Long-Term Capital Gain | | | Total | |
2018 | | 2017 | | | 2018 | | | 2017 | | | 2018 | | | 2017 | |
| $17,802,707 | | $ | 10,697,682 | | | $ | 57,404,682 | | | $ | 38,323,913 | | | $ | 75,207,389 | | | $ | 49,021,595 | |
As of December 31, 2018, the components of distributable earnings (accumulated losses) on a federal income tax basis were as follows:
| | | | | | | | | | | | | | | | |
Undistributed
Ordinary
Income | | Undistributed
Long-Term
Capital Gain | | | Net
Unrealized
Appreciation | | | Accumulated
Capital Losses | | | Total | |
| $10,052,786 | | $ | 86,482,802 | | | $ | 133,636,109 | | | $ | — | | | $ | 230,171,697 | |
The Portfolio utilizes the provisions of the federal income tax laws that provide for the carryforward of capital losses for prior years, offsetting such losses against any future realized capital gains. Under the Regulated Investment Company Modernization Act of 2010, net capital losses recognized after December 22, 2010 may be carried forward indefinitely and their character is retained as short-term and/or long-term losses.
As of December 31, 2018, the Portfolio had no accumulated capital losses.
9. Recent Accounting Pronouncements and SEC Update
In August 2018, the FASB issued Accounting Standards Update2018-13, Fair Value Measurement (Topic 820)—Disclosure Framework—Changes to the Disclosure Requirements for Fair Value Measurement (“ASU2018-13”) which introduces new fair value disclosure requirements as well as eliminates and modifies certain existing fair value disclosure requirements. ASU2018-13 is effective for fiscal years beginning after December 15, 2019, and interim periods within those fiscal years. Early adoption is permitted and, as such, management has elected to early adopt ASU2018-13 effective with the current reporting period. The impact of the Portfolio’s adoption was limited to changes in the Portfolio’s financial statement disclosures regarding fair value, primarily those disclosures related to transfers between levels of the fair value hierarchy.
In August 2018, the Securities and Exchange Commission released its Final Rule on Disclosure Update and Simplification (the “Final Rule”) which is intended to simplify an issuer’s disclosure compliance efforts by removing redundant or outdated disclosures requirements without significantly altering the mix of information provided to investors. Effective with the current reporting period, the Portfolio adopted the Final Rule with the most notable impacts being that the Portfolio is no longer required to present the components of distributable earnings on the Statement of Assets and Liabilities or the sources of distributions to shareholders and the amounts of undistributed net investment income on the Statements of Changes in Net Assets.
BHFTII-34
Brighthouse Funds Trust II
MetLife Russell 2000 Index Portfolio
Report of Independent Registered Public Accounting Firm
To the Shareholders of MetLife Russell 2000 Index Portfolio and the Board of Trustees of Brighthouse Funds Trust II:
Opinion on the Financial Statements and Financial Highlights
We have audited the accompanying statement of assets and liabilities, including the schedule of investments, of the MetLife Russell 2000 Index Portfolio (the “Portfolio”), one of the portfolios constituting the Brighthouse Funds Trust II, as of December 31, 2018, the related statement of operations for the year then ended, the statements of changes in net assets for each of the two years in the period then ended, the financial highlights for each of the five years in the period then ended, and the related notes. In our opinion, the financial statements and financial highlights present fairly, in all material respects, the financial position of the MetLife Russell 2000 Index Portfolio of the Brighthouse Funds Trust II as of December 31, 2018, the results of its operations for the year then ended, the changes in its net assets for each of the two years in the period then ended, and the financial highlights for each of the five years in the period then ended, in conformity with accounting principles generally accepted in the United States of America.
Basis for Opinion
These financial statements and financial highlights are the responsibility of the Portfolio’s management. Our responsibility is to express an opinion on the Portfolio’s financial statements and financial highlights based on our audits. We are a public accounting firm registered with the Public Company Accounting Oversight Board (United States) (PCAOB) and are required to be independent with respect to the Portfolio in accordance with the U.S. federal securities laws and the applicable rules and regulations of the Securities and Exchange Commission and the PCAOB.
We conducted our audits in accordance with the standards of the PCAOB. Those standards require that we plan and perform the audit to obtain reasonable assurance about whether the financial statements and financial highlights are free of material misstatement, whether due to error or fraud. The Portfolio is not required to have, nor were we engaged to perform, an audit of its internal control over financial reporting. As part of our audits we are required to obtain an understanding of internal control over financial reporting but not for the purpose of expressing an opinion on the effectiveness of the Portfolio’s internal control over financial reporting. Accordingly, we express no such opinion.
Our audits included performing procedures to assess the risks of material misstatement of the financial statements and financial highlights, whether due to error or fraud, and performing procedures that respond to those risks. Such procedures included examining, on a test basis, evidence regarding the amounts and disclosures in the financial statements and financial highlights. Our audits also included evaluating the accounting principles used and significant estimates made by management, as well as evaluating the overall presentation of the financial statements and financial highlights. Our procedures included confirmation of securities owned as of December 31, 2018, by correspondence with the custodian and brokers; when replies were not received from brokers, we performed other auditing procedures. We believe that our audits provide a reasonable basis for our opinion.
/s/ Deloitte & Touche LLP
Boston, Massachusetts
February 25, 2019
We have served as the auditor of one or more of the Brighthouse investment companies since 1983.
BHFTII-35
Brighthouse Funds Trust II
Trustees and Officers
MANAGEMENT OF THE TRUSTS
The Boards of Trustees (the “Board”) of Brighthouse Funds Trust I and Brighthouse Funds Trust II (“BHF I” and “BHF II”, respectively, and collectively the “Trusts”) supervise the Trusts and are responsible for representing the interests of shareholders. The Trustees, the Chairman of the Board and the Chairmen of each subcommittee are the same for both Trusts. The Trustees of each Trust meet periodically throughout the year to oversee the Portfolios’ activities, reviewing, among other things, each Portfolio’s performance and its contractual arrangements with various service providers. The Trustees of each Trust elect the officers of the Trust, who are responsible for administering the Trust’sday-to-day operations.
Trustees and Officers
The Trustees and executive officers of the Trusts, as well as their principal occupations during the past five years, are set forth below. Unless otherwise indicated, the business address of each is c/o Brighthouse Funds, One Financial Center, Boston, Massachusetts 02111. Each Trustee who is deemed an “interested person,” as such term is defined in the 1940 Act, is referred to as an “Interested Trustee.” Those Trustees who are not “interested persons,” as such term is defined in the 1940 Act, are referred to as “Independent Trustees.” There is no limit to the term a Trustee may serve. Trustees serve until their death, resignation or removal in accordance with the BHF I Trust’s and BHF II Trust’s respective organizational documents and policies adopted by the Boards of the respective Trusts from time to time. Officers hold office at the pleasure of each Board and serve until their removal or resignation in accordance with the Trusts’ respective organizational documents and policies adopted by the Board of each Trust from time to time.
| | | | | | | | | | |
Name and Year of Birth | | Current
Position(s)
Held with
Registrant | | Term of Office
and Length of
Time Served | | Principal Occupation(s) During the Past
5 Years(1) | | Number of
Portfolios
in Brighthouse
Funds
Complex(2)
Overseen
by Trustee | | Other Directorships Held
by Trustee During the
Past 5 Years(1) |
| Interested Trustee |
John Rosenthal* (1960) | | Trustee | | Indefinite; From
May 2016
(Trust I and
Trust II) to present | | Chief Investment Officer, Brighthouse Financial, Inc. (2017 to present); until 2017, Senior Managing Director and Head of Global Portfolio Management, MetLife, Inc. | | 72 | | None |
|
| Independent Trustees |
Dawn M. Vroegop (1966) | | Trustee and Chairman of the Board | | Indefinite; From
December 2000
(Trust I)/May
2009 (Trust II) to
present as
Trustee; From
May 2016 (Trust
I and Trust II)
until present as
Chairman | | Private Investor. | | 72 | | Trustee, Driehaus Mutual Funds.** |
| | | | | |
Stephen M. Alderman (1959) | | Trustee | | Indefinite; From
December 2000
(Trust I)/April
2012 (Trust II) to
present | | Shareholder in the law firm of Garfield and Merel, Ltd. | | 72 | | None |
| | | | | |
Robert J. Boulware (1956) | | Trustee | | Indefinite; From
March 2008
(Trust I)/April
2012 (Trust II) to
present | | Managing Director, Pilgrim Funds, LLC (private equity fund). | | 72 | | Trustee, Vertical Capital Income Fund(closed-end fund);** Director, Gainsco, Inc. (auto insurance);** Trustee, SharesPost 100 Fund(closed-end fund).** |
| | | | | |
Susan C. Gause (1952) | | Trustee | | Indefinite; From
March 2008
(Trust I)/April
2012 (Trust II) to
present | | Private Investor. | | 72 | | Trustee, HSBC Funds.** |
BHFTII-36
Brighthouse Funds Trust II
Trustees and Officers—(Continued)
| | | | | | | | | | |
Name and Year of Birth | | Current
Position(s)
Held with
Registrant | | Term of Office
and Length of
Time Served | | Principal Occupation(s) During the Past
5 Years(1) | | Number of
Portfolios
in Brighthouse
Funds
Complex(2)
Overseen
by Trustee | | Other Directorships Held
by Trustee During the
Past 5 Years(1) |
Nancy Hawthorne (1951) | | Trustee | | Indefinite; From
May 2003
(Trust II)/April
2012 (Trust I)
to present | | Partner, Hawthorne Financial Advisors, LLC (registered investment advisor); until 2014, Chief Executive Officer, Clerestory LLC (corporate advisor). | | 72 | | Director and Chairman of the Board of Directors, THL Credit, Inc.;** Director and Chairman of the Board, Avid Technology, Inc.;** Director, CRA International, Inc.** |
| | | | | |
Barbara A. Nugent (1956) | | Trustee | | Indefinite; From
January 2014
(Trust I and
Trust II) to
present | | President, True North Board Governance, LLC (consulting); until December 2013, partner in the law firm of Stradley Ronon Stevens & Young, LLP. | | 72 | | Independent Lead Trustee, BMT Investment Funds** |
| | | | | |
Christopher J. Towle (1957) | | Trustee | | Indefinite; From
April 2018
(Trust I and
Trust II) to
present | | Retired; until 2014, Partner, Portfolio Manager, Director of High Yield and Convertible Strategies, Lord Abbett & Co. | | 72 | | Trustee, Driehaus Mutual Funds** |
Officers
| | | | | | |
Name and Year of Birth | | Position(s)
Held with
Registrant | | Length of
Time Served | | Principal Occupation(s)
During the Past 5 Years(1) |
| Executive Officers | | | | | | |
Kristi Slavin (1973) | | President and Chief Executive Officer, of Trust I and Trust II | | From May
2016
(Trust I and
Trust II) to
present | | President, Brighthouse Investment Advisers, LLC (2016-present); formerly, Senior Vice President, MetLife Advisers, LLC; Vice President, MetLife, Inc.; Vice President, Trust I and Trust II(2015-2016). |
| | | |
Alan R. Otis (1971) | | Chief Financial Officer and Treasurer, of Trust I and Trust II | | From
November
2017
(Trust I and
Trust II) to
present | | Senior Vice President, Brighthouse Investment Advisers, LLC (2017-present); formerly, Vice President, Brighthouse Investment Advisers, LLC (2012-2017); Assistant Treasurer, Trust I and Trust II (2012-2017). |
| | | |
Andrew L. Gangolf (1954) | | Secretary, of Trust I and Trust II | | From May
2011
(Trust I and
Trust II) to
present | | Executive Vice President, Brighthouse Investment Advisers, LLC (2017-present); formerly, Senior Vice President, MetLife Advisers, LLC (2011-2017); until 2011, Senior Vice President & Assistant General Counsel, AllianceBernstein Investments, Inc. |
| | | |
Steven E. Hartstein (1963) | | Chief Compliance Officer (“CCO”), of Trust I and Trust II | | From
February
2014
(Trust I and
Trust II) to
present | | Senior Vice President and CCO, Brighthouse Investment Advisers, LLC (2017-present); Head of Investments Compliance, Vice President, Brighthouse Financial, Inc. (2017-present); formerly, Vice President, MetLife, Inc. (2013-2017); Senior Vice President and CCO, MetLife Advisers, LLC (2013-2017.) |
| | | |
Victor Soto (1978) | | Vice President of Trust I and Trust II | | From May
2018
(Trust I and
Trust II) to
present | | Executive Vice President, Brighthouse Investment Advisers, LLC (2016-present); Assistant Vice President, MetLife Inc. (2015-2017); Portfolio Manager, 1st Global (2013-2015). |
| * | Mr. Rosenthal is an “interested person” of the Trusts because of his position with Brighthouse Financial, Inc., the current parent company of Brighthouse Investment Advisers, LLC. |
| ** | Indicates a directorship with a registered investment company or a company subject to the reporting requirements of the Securities Exchange Act of 1934, as amended. |
| (1) | Previous positions during the past five years with the Trusts, Brighthouse Financial, Inc., MetLife, Inc. or the Manager are omitted if not materially different. |
| (2) | The Fund Complex includes 43 BHF I Portfolios and 29 BHF II Portfolios. |
BHFTII-37
Brighthouse Funds Trust II
MetLife Russell 2000 Index Portfolio
Board of Trustees’ Consideration of Advisory and Sub-Advisory Agreements
At anin-person meeting held on November6-8, 2018 (the “November Meeting”), the Boards of Trustees (the “Board”) of Brighthouse Funds Trust I and Brighthouse Funds Trust II (“BFT I” and “BFT II,” respectively, and collectively, the “Trusts”), including a majority of the Trustees who are not “interested persons” of the Trusts (the “Independent Trustees”) under the Investment Company Act of 1940 (the “1940 Act”), approved the continuation of the Trusts’ advisory agreements (each, an “Advisory Agreement”) with Brighthouse Investment Advisers, LLC (the “Adviser”) and the applicablesub-advisory agreements (each a “Sub-Advisory Agreement,” and collectively with the Advisory Agreement, the “Agreements”) between the Adviser and the investmentsub-advisers (each a “Sub-Adviser,” and collectively, the “Sub-Advisers”) for the series of the Trusts (each a “Portfolio,” and collectively, the “Portfolios”).
In making those approvals, the Board reviewed a variety of materials that were provided for the specific purpose of the annual contract renewal process. In addition, various materials provided to and discussed with the Board throughout the year informed the Board’s decision to renew the Agreements. In particular, the information for each Portfolio included, but was not limited to, investment performance reports, and reports on expenses, legal and compliance matters, asset pricing, brokerage commissions and trade execution.
The Board met in person with personnel of the Adviser on October 17, 2018 for the specific purpose of giving preliminary consideration to the proposed continuation of the Agreements (the “October Meeting”). At that meeting, the Adviser reviewed with the Board the performance and fees experienced by each Portfolio, as well as other information. During and after the October Meeting, the Independent Trustees communicatedfollow-up matters for management to address at the November Meeting. The Independent Trustees were advised by independent legal counsel throughout the contract renewal process, and met with independent legal counsel in several executive sessions outside of the presence of management.
Information furnished and reviewed specifically in connection with the renewal process included, but was not limited to, a report for each Portfolio that was prepared by Broadridge (“Broadridge”), an independent organization. In addition, the Independent Trustees reviewed a report that was prepared by JDL Consultants, LLC (“JDL”), an independent consultant to the Independent Trustees (“JDL Report”), which examined the comparative fees, expenses and performance of each Portfolio, based upon the Broadridge reports. Also, the Board reviewed the responses to wide-ranging questions from the Independent Trustees relating to the business, operations and performance of the Adviser and theSub-Advisers that the Adviser andSub-Advisers had prepared specifically for the renewal process, and reviewed aPortfolio-by-Portfolio analysis of the profitability to the Adviser of each Advisory Agreement, which was prepared by the Adviser for the renewal process.
At the November Meeting, the Board, including a majority of the Independent Trustees, concluded that the nature, extent and quality of services provided by the Adviser and eachSub-Adviser supported the renewal of the Agreements. The Board also concluded that the investment performance of each Portfolio was such that each Agreement should continue, and that the fees paid by each Portfolio to the Adviser appeared to be reasonable in light of the nature, extent and quality of the services provided by the Adviser andSub-Adviser. Further, the Board concluded that the Adviser’s profitability in providing services under the Advisory Agreements did not appear unreasonable in light of the nature, extent and quality of the services provided by the Adviser. Finally, the Board reviewed the extent to which the investment advisory fees paid by the Portfolios shared economies of scale with investors or entailed the potential to share economies of scale with investors and concluded that those considerations generally supported the renewal of each Agreement. In approving the renewal of each of the Agreements, the Board, including the Independent Trustees, gave attention to all of the information that was furnished and each Trustee placed varying degrees of importance on the various pieces of information that were provided to them. The Board evaluated the information available to it on aPortfolio-by-Portfolio basis, and its decision was made separately with respect to each Portfolio. The following paragraphs provide more information about some of the primary factors that were relevant to the Board’s decision. The Board did not identify any single factor as determinative, and the Trustees generally attributed different weights to various factors for the various Portfolios.
Nature, extent and quality of services. The Board evaluated the nature, extent and quality of the services that the Adviser and theSub-Advisers, as relevant, have provided to the Portfolios. The Board considered the Adviser’s services as investment manager to the Portfolios, including its services relating to the hiring and oversight of theSub-Advisers, trading practices and oversight of transition management (as applicable), compliance programs and personnel, and risk management, among other things. The Adviser’s services in coordinating and overseeing the activities of the Trusts’ other service providers were also considered. The Board considered information received from the Trusts’ Chief Compliance Officer (“CCO”) regarding the Portfolios’ compliance policies and procedures that were established pursuant to Rule38a-l under the 1940 Act. The Board also noted that the Adviser’s investment, compliance and legal staff conduct regular and periodic telephonic andin-person meetings with theSub-Advisers to review and assess the services that are provided to the Portfolios, and that personnel of the Adviser prepare and present reports to the Independent Trustees regarding those meetings. In addition, throughout the year, the Board considered the expertise, experience and performance of the personnel of the Adviser who performed the various services that are mentioned above.
BHFTII-38
Brighthouse Funds Trust II
MetLife Russell 2000 Index Portfolio
Board of Trustees’ Consideration of Advisory and Sub-Advisory Agreements—(Continued)
With respect to the services provided by each of theSub-Advisers, the Board considered a variety of information that the Adviser and eachSub-Adviser prepared for the Board’s review. The Board considered eachSub-Adviser’s investment process and philosophy, and the investment performance experienced by the Portfolio (as described in more detail below). The Board took into account that eachSub-Adviser’s responsibilities include the development and maintenance of an investment program for the applicable Portfolio that is consistent with the Portfolio’s investment objectives, the selection of investment securities and the placement of orders for the purchase and sale of such securities, as well as the implementation of compliance controls related to performance of these services. In particular, the Board considered, among other things, theSub-Adviser’s current level of staffing as well as its compensation program and its overall resources. The Board reviewed eachSub-Adviser’s history and investment experience, as well as information provided regarding the qualifications, background and responsibilities of theSub-Adviser’s investment and compliance personnel who provide services to the Portfolios. The Board also considered, among other things, eachSub-Adviser’s compliance program and regulatory and disciplinary history. In its review, the Board also took into account information regarding any services and/or payments provided to the Adviser by theSub-Advisers in connection with marketing activities and considered representations from the Adviser that those payments were not considered in the Adviser’s recommendation to renew any of theSub-Advisory Agreements.
Performance. The Board placed emphasis on the performance of each Portfolio in light of, among other things, its importance to investors. The Board considered the Adviser’s quarterly reviews with the Board of detailed information about each Portfolio’s investment strategies and performance results and composition, including discussions regarding the relevant effect of current market conditions. The Board reviewed and considered the reports prepared by Broadridge, which provided a statistical analysis comparing the Portfolios’ investment performance to that of comparable funds underlying variable insurance products (the “Performance Universe”). The Independent Trustees also met separately with representatives of JDL during the October Meeting to review the JDL Report. The Board also compared the performance records of the Portfolios to those of comparable funds and other accounts that were managed by the relevantSub-Adviser, to the extent such information was available. The Board considered each Portfolio’s performance for periods subsequent to the performance period covered by the Broadridge reports, and the Adviser’s discussion of the same, including the effect of current market conditions on each Portfolio’s more recent performance. The Board also noted that while it found the data provided by Broadridge generally useful, it recognized the limitations of such data, including, in particular, that notable differences may exist between a Portfolio and those of the other funds in a Broadridge category (for example, the investment objectives(s) and investment strategies) and that the results of the performance comparisons may vary depending on (i) the end dates for the performance periods that were selected and (ii) the selection of the peer groups.
The Board focused particular attention on Portfolios with less favorable performance records. The Board noted the Adviser’s focus on eachSub-Adviser’s performance and that the Adviser has been active in monitoring and responding to any performance issues with respect to the Portfolios.
Fees and Expenses. The Board gave consideration to the level and method of computing the fees payable under the Agreements. The Board considered the Broadridge report for each of the Portfolios, which included comparisons for each Portfolio of its contractual management andsub-adviser fees (at current and various asset levels), and total expenses, with those of its peers, including as those peers were divided into a broad group of peer funds (“Expense Universe”), a narrower group of peer funds (“Expense Group”), a broad group of peersub-advised funds (“Sub-advised Expense Universe”), and a narrower group of peersub-advised funds (“Sub-advised Expense Group”). Broadridge selected the peer funds which were similarly situated funds underlying variable insurance products deemed to be comparable to the Portfolios. The Independent Trustees, with the assistance of JDL, also examined the JDL Report. The Board compared the fee payable to aSub-Adviser by the Adviser with respect to the Portfolio to the fee payable to theSub-Adviser by other comparable funds and other accounts, to the extent such information was available.
The Board noted that thesub-advisory fees for the Portfolios are paid by the Adviser out of the advisory fees, and that the Adviser negotiates the fees at arm’s length. The Board also considered that the Adviser had entered into expense limitation or management fee waiver agreements with certain of the Portfolios pursuant to which the Adviser had agreed to waive a portion of its advisory fee and/or reimburse certain expenses as a means of limiting a Portfolio’s total annual operating expenses.
Profitability. The Board examined the profitability to the Adviser of each Advisory Agreement, on aPortfolio-by-Portfolio basis. The Board also considered that an affiliate of the Adviser, Brighthouse Securities, LLC, serves as distributor for the Trusts, and, as such, receives Rule12b-1 payments to support the distribution of the Portfolios. The Board considered the profitability to theSub-Advisers and their affiliates as a result of their relationships with the Portfolios, to the extent available, and the Board considered the ability of the Adviser to negotiate with aSub-Adviser at arm’s length. In reviewing the profitability analyses, the Board recognized that expense allocation methodologies are inherently subjective and various expense allocation methodologies may be reasonable while producing different results.
BHFTII-39
Brighthouse Funds Trust II
MetLife Russell 2000 Index Portfolio
Board of Trustees’ Consideration of Advisory and Sub-Advisory Agreements—(Continued)
Economies of scale. The Board also considered each Portfolio’s fees in light of its size. The Board noted the fee schedules for the Portfolios that contain breakpoints that reduce the fee rate above specified asset levels. The Board noted those Portfolios that did not have breakpoints in their advisory fee and took into account management’s discussion of the same. The Board noted that those Portfolios with Advisory Agreements containing breakpoints generally have breakpoints in the correspondingSub-Advisory Agreement. The Board considered the effective fees under the Advisory Agreement andSub-Advisory Agreement for each Portfolio as a percentage of assets at different asset levels and possible economies of scale that may be realized if the assets of the Portfolio grow. The Board examined, among other data, the effect of a Portfolio’s growth in size, and reduction in size, on various fee schedules and the Board reviewed the Broadridge and JDL Reports, which compared fees among peers. The Board also generally noted that if a Portfolio’s assets increase over time, the Portfolio may realize other economies of scale if assets increase proportionally more than certain other fixed expenses.
Other factors. The Board considered other benefits that may be realized by the Adviser and its affiliates from their relationship with the Trusts. Among them, the Board recognized that Brighthouse Securities, LLC, as the distributor for the Trusts, receives payments pursuant to Rule12b-1 from the Portfolios to compensate for the provision of shareholder services and distribution activities, which could lead to growth in the Trusts’ assets and corresponding benefits from such growth, including economies of scale. The Board considered other benefits that may be realized by eachSub-Adviser and its affiliates from their relationship with the Trusts, including the opportunity to provide advisory services to additional portfolios of the Trusts and reputational benefits. In conjunction with these considerations, the Board noted the ongoing commitment of the Adviser to the Portfolios.
The Board requested, received, and considered information from the Adviser regarding possible conflicts of interest in the form of material benefits to the Adviser resulting from the Adviser’s affiliations and business relationships, as relevant. The Board considered the services that are provided to the Trusts by its service providers, and the manner in which any conflicts were mitigated.
* * *
MetLife Russell 2000 Index Portfolio. The Board also considered the following information in relation to the Agreements with the Adviser and MetLife Investment Advisors, LLC regarding the Portfolio:
Among other data relating specifically to the Portfolio’s performance, the Board considered that the Portfolio outperformed the median of its Performance Universe and the average of its Morningstar Category for theone-, three and five-year periods ended June 30, 2018. The Board further considered that the Portfolio outperformed its benchmark, the Russell 2000 Index, for the five-year period ended September 30, 2018, and underperformed its benchmark for theone-year and three-year periods ended September 30, 2018.
The Board also considered that the Portfolio’s actual management fees and total expenses (exclusive of12b-1 fees) were below the Expense Group median, the Expense Universe median, and theSub-advised Expense Universe median. The Board further noted that the Portfolio’s contractual management fees were below the asset-weighted average of comparable funds selected by Broadridge at the Portfolio’s current size. The Board also noted that the Portfolio’s contractualsub-advisory fees were below the averages of theSub-advised Expense Group and theSub-advised Expense Universe at the Portfolio’s current size.
BHFTII-40
Brighthouse Funds Trust II
MetLife Stock Index Portfolio
Managed by MetLife Investment Advisors, LLC
Portfolio Manager Commentary*
PERFORMANCE
For the 12 months ended December 31, 2018, the Class A, B, D, E, and G shares of the MetLife Stock Index Portfolio returned-4.60%,-4.83%,-4.69%,-4.72%, and-4.89%, respectively. The Portfolio’s benchmark, the Standard & Poor’s (“S&P”) 500 Index1, returned-4.38%.
MARKET ENVIRONMENT / CONDITIONS
Equity markets ended the period down with outperformance in the middle of the year bracketed by underperformance during the first and fourth quarters. The main concerns during the year were slowing global growth, political unrest in Europe, a more hawkish Federal Reserve (the “Fed”), and continued fears about a global trade war. Equity markets were impacted as the10-year Treasury yield reached its highest level since 2014, which was driven by a more hawkish Fed and higher than expected wage growth. Equity markets also feared the impact of President Trump’s plan to impose tariffs on steel and aluminum imports and Fed Chair Powell’s Congressional testimony during the first quarter where he hinted at the possibility of four rate hikes during the year. Other issues equity investors were concerned about included unrest in the Middle East, political uncertainty in Italy and the U.S. withdrawal from the Iran nuclear deal. In the middle of the year, equity markets rallied as trade negotiations eased concerns of a global trade war and leaders of North and South Korea met for the first time since 2007. Equity markets also reacted favorably after Fed Chair Powell made dovish comments in the third quarter during the Jackson Hole symposium and progress was made with trade negotiations with the European Union and the North American Free Trade Agreement. Equity markets underperformed again towards the end of the year on concerns about a weakening global economy, the partial U.S. government shut-down, and continued uncertainty surrounding Brexit.
During the year, the Federal Open Market Committee (the “FOMC”) met eight times and raised the target for the Federal Funds Rate four times from a range of 1.25%—1.50% to a range of 2.25%—2.50%. The FOMC stated that the labor market had continued to strengthen, and that economic activity had been rising at a strong rate. The FOMC also stated that job gains had been strong, and the unemployment rate had remained low.
Three of the eleven sectors comprising the S&P 500 Index experienced positive returns for the year. Health Care (13.7% beginning weight in the benchmark), up 6.5%, was the best-performing sector and had the largest positive impact on the portfolio return. Utilities (2.9% beginning weight), up 4.1%; and Consumer Discretionary (12.2% beginning weight), up 0.8%, were the next best-performing sectors. Energy (6.1% beginning weight), down 18.1%; Communication Services (2.1% beginning weight), down 14.7%; and Materials (3.0% beginning weight), down 14.6%, were the worst-performing sectors.
The stocks in the S&P 500 Index with the largest positive impact on the Portfolio return for the year were Merck, up 40.0%; Amazon, up 28.4%; and Microsoft, up 20.8% (all three were held throughout the entire year). The stocks with the largest negative impact were General Electric, down 55.4%; Facebook, down 25.7%; and Wells Fargo, down 21.8% (all three were held throughout the entire year).
PORTFOLIO REVIEW / PERIOD END POSITIONING
The Portfolio is managed utilizing a full replication strategy versus the S&P 500 Index. This strategy seeks to replicate the performance of the Index by owning all of the components of the Index at their respective Index capitalization weights. The Portfolio is periodically rebalanced for compositional changes in the S&P 500 Index. Factors that impact tracking error include transaction costs, cash drag, securities lending activity, Net Asset Value rounding, contributions and withdrawals.
Stacey Lituchy
Norman Hu
Mirsad Usejnoski
Portfolio Managers
MetLife Investment Advisors, LLC
* This commentary may include statements that constitute “forward-looking statements” under the U.S. securities laws. Forward-looking statements include, among other things, projections, estimates, and information about possible or future results related to the Portfolio, market or regulatory developments. The views expressed above are not guarantees of future performance or economic results and involve certain risks, uncertainties and assumptions that could cause actual outcomes and results to differ materially from the views expressed herein. The views expressed above are subject to change at any time based upon economic, market, or other conditions and the subadvisory firm undertakes no obligation to update the views expressed herein. Any discussions of specific securities should not be considered a recommendation to buy or sell those securities. The views expressed above (including any forward-looking statement) may not be relied upon as investment advice or as an indication of the Portfolio’s trading intent. Information about the Portfolio’s holdings, asset allocation or country diversification is historical and is not an indication of future Portfolio composition, which may vary. Direct investment in any index is not possible. The performance of any index mentioned in this commentary has not been adjusted for ongoing management, distribution and operating expenses, and sales charges applicable to mutual fund investments. In addition, the returns do not reflect additional fees charged by separate accounts or variable insurance contracts that an investor in the Portfolio may pay. If these additional fees were reflected, performance would have been lower.
BHFTII-1
Brighthouse Funds Trust II
MetLife Stock Index Portfolio
A $10,000 INVESTMENT COMPARED TO THE S&P 500 INDEX
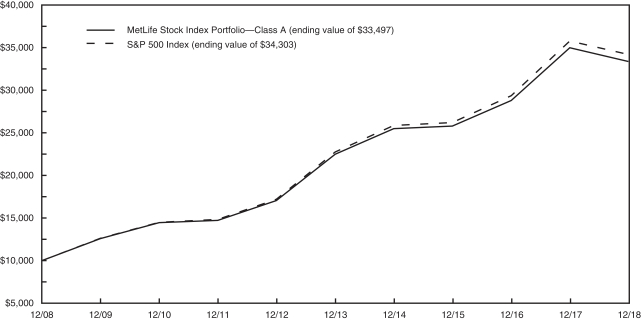
AVERAGE ANNUAL RETURNS (%) (FOR THE YEAR ENDED DECEMBER 31, 2018)
| | | | | | | | | | | | | | | | | | |
| | | | | | |
| | | | | 1 Year | | | 5 Year | | | 10 Year | | | Since Inception2 | |
| MetLife Stock Index Portfolio | | | | | | | | | | | | | | | | |
Class A | | | -4.60 | | | | 8.23 | | | | 12.85 | | | | — | |
Class B | | | -4.83 | | | | 7.96 | | | | 12.57 | | | | — | |
Class D | | | -4.69 | | | | 8.12 | | | | — | | | | 13.72 | |
Class E | | | -4.72 | | | | 8.07 | | | | 12.68 | | | | — | |
Class G | | | -4.89 | | | | — | | | | — | | | | 6.75 | |
| S&P 500 Index | | | -4.38 | | | | 8.50 | | | | 13.12 | | | | — | |
1 The S&P 500 Index is an unmanaged index consisting of 500 stocks chosen for market size, liquidity, and industry group representation. It is a market-weighted index (stock price times number of shares outstanding) with each stock’s weight in the Index proportionate to its market value.
2 Inception dates of the Class A, Class B, Class D, Class E and Class G shares are 5/1/90, 1/2/01, 4/28/09, 5/1/01 and 11/12/14, respectively.
Portfolio performance is calculated including reinvestment of all income and capital gain distributions. Performance numbers are net of all Portfolio expenses but do not include any insurance, sales, separate account or administrative charges of variable annuity or life insurance contracts or any additional expenses that participants may bear relating to the operations of their plans. If these charges were included, the returns would be lower. The performance of any index referenced above has not been adjusted for ongoing management, distribution and operating expenses, and sales charges applicable to mutual fund investments. Direct investment in any index is not possible. The performance of Class A shares, as set forth in the line graph above, will differ from that of other classes because of the difference in expenses paid by policyholders investing in the different share classes.
This information represents past performance and is not indicative of future results. Investment return and principal value may fluctuate so that shares, upon redemption, may be worth more or less than the original cost.
PORTFOLIO COMPOSITION AS OF DECEMBER 31, 2018
Top Holdings
| | | | |
| | | % of
Net Assets | |
| Microsoft Corp. | | | 3.7 | |
| Apple, Inc. | | | 3.3 | |
| Amazon.com, Inc. | | | 2.9 | |
| Berkshire Hathaway, Inc. - Class B | | | 1.9 | |
| Johnson & Johnson | | | 1.6 | |
| JPMorgan Chase & Co. | | | 1.5 | |
| Alphabet, Inc. - Class C | | | 1.5 | |
| Facebook, Inc. - Class A | | | 1.5 | |
| Alphabet, Inc. - Class A | | | 1.5 | |
| Exxon Mobil Corp. | | | 1.4 | |
Top Sectors
| | | | |
| | | % of
Net Assets | |
| Information Technology | | | 19.8 | |
| Health Care | | | 15.3 | |
| Financials | | | 14.1 | |
| Communication Services | | | 10.0 | |
| Consumer Discretionary | | | 9.8 | |
| Industrials | | | 9.0 | |
| Consumer Staples | | | 7.3 | |
| Energy | | | 5.2 | |
| Utilities | | | 3.3 | |
| Real Estate | | | 2.9 | |
BHFTII-2
Brighthouse Funds Trust II
MetLife Stock Index Portfolio
Understanding Your Portfolio’s Expenses
Shareholder Expense Example
As a shareholder of the Portfolio, you incur ongoing costs, including management fees; distribution and service(12b-1) fees; and other Portfolio expenses. This example is intended to help you understand your ongoing costs (in dollars) (referred to as “expenses”) of investing in the Portfolio and compare these costs with the ongoing costs of investing in other mutual funds. The example is based on an investment of $1,000 invested at the beginning of the period and held for the entire period, July 1, 2018 through December 31, 2018.
Actual Expenses
The first line for each share class of the Portfolio in the table below provides information about actual account values and actual expenses. You may use the information in this line, together with the amount you invested in the particular share class of the Portfolio, to estimate the expenses that you paid over the period. Simply divide your account value by $1,000 (for example, an $8,600 account value divided by $1,000 = 8.6), then multiply the result by the number in the first line under the heading entitled “Expenses Paid During Period” to estimate the expenses you paid on your account during this period.
Hypothetical Example for Comparison Purposes
The second line for each share class of the Portfolio in the table below provides information about hypothetical account values and hypothetical expenses based on the Portfolio’s actual expense ratio and an assumed rate of return of 5% per year before expenses, which is not the Portfolio’s actual return. The hypothetical account values and expenses may not be used to estimate the actual ending account balance or expenses you paid for the period. You may use this information to compare the ongoing costs of investing in the Portfolio and other funds. To do so, compare this 5% hypothetical example with the 5% hypothetical examples that appear in the shareholder reports of the other funds.
Please note that the expenses shown in the table are meant to highlight your ongoing costs only and do not reflect any fees or charges of your variable insurance product or any additional expenses that participants in certain eligible qualified plans may bear relating to the operations of their plan. Therefore, the second line for each share class in the table is useful in comparing ongoing costs only, and will not help you determine the relative total costs of owning different funds. In addition, if these other costs were included, your costs would have been higher.
| | | | | | | | | | | | | | | | | | |
MetLife Stock Index Portfolio
| | | | Annualized
Expense
Ratio | | | Beginning
Account Value
July 1,
2018 | | | Ending
Account Value
December 31,
2018 | | | Expenses Paid
During Period**
July 1, 2018
to
December 31,
2018 | |
Class A (a) | | Actual | | | 0.26 | % | | $ | 1,000.00 | | | $ | 930.70 | | | $ | 1.27 | |
| | Hypothetical* | | | 0.26 | % | | $ | 1,000.00 | | | $ | 1,023.90 | | | $ | 1.33 | |
| | | | | |
Class B (a) | | Actual | | | 0.51 | % | | $ | 1,000.00 | | | $ | 929.50 | | | $ | 2.48 | |
| | Hypothetical* | | | 0.51 | % | | $ | 1,000.00 | | | $ | 1,022.64 | | | $ | 2.60 | |
| | | | | |
Class D (a) | | Actual | | | 0.36 | % | | $ | 1,000.00 | | | $ | 930.10 | | | $ | 1.75 | |
| | Hypothetical* | | | 0.36 | % | | $ | 1,000.00 | | | $ | 1,023.39 | | | $ | 1.84 | |
| | | | | |
Class E (a) | | Actual | | | 0.41 | % | | $ | 1,000.00 | | | $ | 930.00 | | | $ | 1.99 | |
| | Hypothetical* | | | 0.41 | % | | $ | 1,000.00 | | | $ | 1,023.14 | | | $ | 2.09 | |
| | | | | |
Class G (a) | | Actual | | | 0.56 | % | | $ | 1,000.00 | | | $ | 929.10 | | | $ | 2.72 | |
| | Hypothetical* | | | 0.56 | % | | $ | 1,000.00 | | | $ | 1,022.38 | | | $ | 2.85 | |
| * | Hypothetical assumes a rate of return of 5% per year before expenses. |
| ** | Expenses paid are equal to the Portfolio’s annualized expense ratio for the most recent six month period, as shown above, multiplied by the average account value over the period, multiplied by the number of days (184 days) in the most recent fiscal half-year, divided by 365 (to reflect theone-half year period). |
| (a) | The annualized expense ratio shown reflects the impact of the management fee waiver as described in Note 6 of the Notes to Financial Statements. |
BHFTII-3
Brighthouse Funds Trust II
MetLife Stock Index Portfolio
Schedule of Investments as of December 31, 2018
Common Stocks—98.4% of Net Assets
| | | | | | | | |
| Security Description | | Shares | | | Value | |
|
| Aerospace & Defense—2.5% | |
Arconic, Inc. | | | 122,407 | | | $ | 2,063,782 | |
Boeing Co. (The) | | | 150,313 | | | | 48,475,942 | |
General Dynamics Corp. | | | 79,231 | | | | 12,455,905 | |
Harris Corp. (a) | | | 33,487 | | | | 4,509,025 | |
Huntington Ingalls Industries, Inc. | | | 12,225 | | | | 2,326,540 | |
L3 Technologies, Inc. | | | 22,399 | | | | 3,889,810 | |
Lockheed Martin Corp. | | | 70,428 | | | | 18,440,868 | |
Northrop Grumman Corp. | | | 49,415 | | | | 12,101,733 | |
Raytheon Co. | | | 80,994 | | | | 12,420,430 | |
Textron, Inc. | | | 69,149 | | | | 3,180,163 | |
TransDigm Group, Inc. (a) (b) | | | 13,812 | | | | 4,696,909 | |
United Technologies Corp. | | | 230,986 | | | | 24,595,389 | |
| | | | | | | | |
| | | | | | | 149,156,496 | |
| | | | | | | | |
|
| Air Freight & Logistics—0.6% | |
C.H. Robinson Worldwide, Inc. (a) | | | 39,135 | | | | 3,290,862 | |
Expeditors International of Washington, Inc. (a) | | | 49,121 | | | | 3,344,649 | |
FedEx Corp. (a) | | | 69,000 | | | | 11,131,770 | |
United Parcel Service, Inc. - Class B | | | 197,866 | | | | 19,297,871 | |
| | | | | | | | |
| | | | | | | 37,065,152 | |
| | | | | | | | |
|
| Airlines—0.4% | |
Alaska Air Group, Inc. (a) | | | 35,092 | | | | 2,135,348 | |
American Airlines Group, Inc. (a) | | | 116,667 | | | | 3,746,177 | |
Delta Air Lines, Inc. | | | 177,573 | | | | 8,860,893 | |
Southwest Airlines Co. | | | 144,035 | | | | 6,694,747 | |
United Continental Holdings, Inc. (b) | | | 65,139 | | | | 5,454,089 | |
| | | | | | | | |
| | | | | | | 26,891,254 | |
| | | | | | | | |
|
| Auto Components—0.1% | |
Aptiv plc | | | 74,987 | | | | 4,616,950 | |
BorgWarner, Inc. | | | 59,277 | | | | 2,059,283 | |
Goodyear Tire & Rubber Co. (The) | | | 66,317 | | | | 1,353,530 | |
| | | | | | | | |
| | | | | | | 8,029,763 | |
| | | | | | | | |
|
| Automobiles—0.4% | |
Ford Motor Co. (a) | | | 1,111,994 | | | | 8,506,754 | |
General Motors Co. | | | 373,583 | | | | 12,496,352 | |
Harley-Davidson, Inc. | | | 46,344 | | | | 1,581,257 | |
| | | | | | | | |
| | | | | | | 22,584,363 | |
| | | | | | | | |
|
| Banks—5.6% | |
Bank of America Corp. (a) | | | 2,597,714 | | | | 64,007,673 | |
BB&T Corp. (a) | | | 219,327 | | | | 9,501,246 | |
Citigroup, Inc. | | | 695,062 | | | | 36,184,928 | |
Citizens Financial Group, Inc. | | | 133,173 | | | | 3,959,233 | |
Comerica, Inc. | | | 46,021 | | | | 3,161,182 | |
Fifth Third Bancorp | | | 186,596 | | | | 4,390,604 | |
First Republic Bank | | | 46,612 | | | | 4,050,583 | |
Huntington Bancshares, Inc. (a) | | | 302,124 | | | | 3,601,318 | |
JPMorgan Chase & Co. | | | 946,453 | | | | 92,392,742 | |
KeyCorp | | | 294,439 | | | | 4,351,808 | |
M&T Bank Corp. (a) | | | 39,948 | | | | 5,717,757 | |
People’s United Financial, Inc. (a) | | | 107,426 | | | | 1,550,157 | |
PNC Financial Services Group, Inc. (The) | | | 131,327 | | | | 15,353,440 | |
|
| Banks—(Continued) | |
Regions Financial Corp. | | | 294,252 | | | | 3,937,092 | |
SunTrust Banks, Inc. | | | 127,872 | | | | 6,449,864 | |
SVB Financial Group (b) | | | 15,156 | | | | 2,878,427 | |
U.S. Bancorp | | | 432,362 | | | | 19,758,943 | |
Wells Fargo & Co. | | | 1,205,765 | | | | 55,561,651 | |
Zions Bancorp N.A. | | | 54,698 | | | | 2,228,397 | |
| | | | | | | | |
| | | | | | | 339,037,045 | |
| | | | | | | | |
|
| Beverages—1.9% | |
Brown-Forman Corp. - Class B (a) | | | 47,328 | | | | 2,251,866 | |
Coca-Cola Co. (The) | | | 1,090,310 | | | | 51,626,179 | |
Constellation Brands, Inc. - Class A | | | 47,285 | | | | 7,604,374 | |
Molson Coors Brewing Co. - Class B | | | 53,308 | | | | 2,993,777 | |
Monster Beverage Corp. (b) | | | 113,313 | | | | 5,577,266 | |
PepsiCo, Inc. | | | 401,750 | | | | 44,385,340 | |
| | | | | | | | |
| | | | | | | 114,438,802 | |
| | | | | | | | |
|
| Biotechnology—2.6% | |
AbbVie, Inc. (a) | | | 428,118 | | | | 39,468,198 | |
Alexion Pharmaceuticals, Inc. (b) | | | 63,496 | | | | 6,181,971 | |
Amgen, Inc. | | | 181,361 | | | | 35,305,546 | |
Biogen, Inc. (a) (b) | | | 57,345 | | | | 17,256,257 | |
Celgene Corp. (b) | | | 199,015 | | | | 12,754,871 | |
Gilead Sciences, Inc. | | | 368,180 | | | | 23,029,659 | |
Incyte Corp. (a) (b) | | | 50,271 | | | | 3,196,733 | |
Regeneron Pharmaceuticals, Inc. (b) | | | 22,091 | | | | 8,250,989 | |
Vertex Pharmaceuticals, Inc. (b) | | | 72,735 | | | | 12,052,917 | |
| | | | | | | | |
| | | | | | | 157,497,141 | |
| | | | | | | | |
|
| Building Products—0.3% | |
A.O. Smith Corp. | | | 40,952 | | | | 1,748,650 | |
Allegion plc (a) | | | 27,054 | | | | 2,156,474 | |
Fortune Brands Home & Security, Inc. | | | 40,245 | | | | 1,528,908 | |
Johnson Controls International plc | | | 262,998 | | | | 7,797,891 | |
Masco Corp. | | | 86,948 | | | | 2,542,360 | |
| | | | | | | | |
| | | | | | | 15,774,283 | |
| | | | | | | | |
|
| Capital Markets—2.7% | |
Affiliated Managers Group, Inc. | | | 14,991 | | | | 1,460,723 | |
Ameriprise Financial, Inc. | | | 39,662 | | | | 4,139,523 | |
Bank of New York Mellon Corp. (The) | | | 258,904 | | | | 12,186,611 | |
BlackRock, Inc. | | | 34,563 | | | | 13,577,038 | |
Cboe Global Markets, Inc. | | | 31,934 | | | | 3,124,103 | |
Charles Schwab Corp. (The) | | | 342,076 | | | | 14,206,416 | |
CME Group, Inc. (a) | | | 101,827 | | | | 19,155,695 | |
E*Trade Financial Corp. | | | 72,359 | | | | 3,175,113 | |
Franklin Resources, Inc. (a) | | | 84,699 | | | | 2,512,172 | |
Goldman Sachs Group, Inc. (The) | | | 98,458 | | | | 16,447,409 | |
Intercontinental Exchange, Inc. | | | 162,110 | | | | 12,211,746 | |
Invesco, Ltd. (a) | | | 117,071 | | | | 1,959,769 | |
Moody’s Corp. (a) | | | 47,443 | | | | 6,643,918 | |
Morgan Stanley | | | 372,078 | | | | 14,752,893 | |
MSCI, Inc. | | | 25,055 | | | | 3,693,859 | |
Nasdaq, Inc. | | | 32,665 | | | | 2,664,484 | |
Northern Trust Corp. | | | 63,012 | | | | 5,267,173 | |
See accompanying notes to financial statements.
BHFTII-4
Brighthouse Funds Trust II
MetLife Stock Index Portfolio
Schedule of Investments as of December 31, 2018
Common Stocks—(Continued)
| | | | | | | | |
| Security Description | | Shares | | | Value | |
|
| Capital Markets—(Continued) | |
Raymond James Financial, Inc. | | | 36,702 | | | $ | 2,730,996 | |
S&P Global, Inc. | | | 71,409 | | | | 12,135,245 | |
State Street Corp. | | | 108,020 | | | | 6,812,821 | |
T. Rowe Price Group, Inc. (a) | | | 68,493 | | | | 6,323,274 | |
| | | | | | | | |
| | | | | | | 165,180,981 | |
| | | | | | | | |
|
| Chemicals—2.1% | |
Air Products & Chemicals, Inc. | | | 62,482 | | | | 10,000,244 | |
Albemarle Corp. (a) | | | 30,227 | | | | 2,329,595 | |
Celanese Corp. (a) | | | 38,069 | | | | 3,425,068 | |
CF Industries Holdings, Inc. | | | 65,685 | | | | 2,857,954 | |
DowDuPont, Inc. | | | 652,970 | | | | 34,920,836 | |
Eastman Chemical Co. | | | 39,857 | | | | 2,913,945 | |
Ecolab, Inc. | | | 72,351 | | | | 10,660,920 | |
FMC Corp. | | | 38,325 | | | | 2,834,517 | |
International Flavors & Fragrances, Inc. (a) | | | 28,828 | | | | 3,870,736 | |
Linde plc | | | 156,837 | | | | 24,472,845 | |
LyondellBasell Industries NV - Class A | | | 89,539 | | | | 7,446,063 | |
Mosaic Co. (The) | | | 100,932 | | | | 2,948,224 | |
PPG Industries, Inc. (a) | | | 68,274 | | | | 6,979,651 | |
Sherwin-Williams Co. (The) | | | 23,450 | | | | 9,226,637 | |
| | | | | | | | |
| | | | | | | 124,887,235 | |
| | | | | | | | |
|
| Commercial Services & Supplies—0.4% | |
Cintas Corp. | | | 24,643 | | | | 4,139,777 | |
Copart, Inc. (b) | | | 58,611 | | | | 2,800,434 | |
Republic Services, Inc. (a) | | | 61,892 | | | | 4,461,794 | |
Rollins, Inc. (a) | | | 41,920 | | | | 1,513,312 | |
Waste Management, Inc. | | | 111,636 | | | | 9,934,488 | |
| | | | | | | | |
| | | | | | | 22,849,805 | |
| | | | | | | | |
|
| Communications Equipment—1.1% | |
Arista Networks, Inc. (b) | | | 14,813 | | | | 3,121,099 | |
Cisco Systems, Inc. | | | 1,279,606 | | | | 55,445,328 | |
F5 Networks, Inc. (b) | | | 17,255 | | | | 2,795,827 | |
Juniper Networks, Inc. | | | 98,235 | | | | 2,643,504 | |
Motorola Solutions, Inc. | | | 46,542 | | | | 5,354,192 | |
| | | | | | | | |
| | | | | | | 69,359,950 | |
| | | | | | | | |
|
| Construction & Engineering—0.1% | |
Fluor Corp. | | | 40,035 | | | | 1,289,127 | |
Jacobs Engineering Group, Inc. | | | 34,028 | | | | 1,989,277 | |
Quanta Services, Inc. (a) | | | 41,562 | | | | 1,251,016 | |
| | | | | | | | |
| | | | | | | 4,529,420 | |
| | | | | | | | |
|
| Construction Materials—0.1% | |
Martin Marietta Materials, Inc. (a) | | | 17,849 | | | | 3,067,708 | |
Vulcan Materials Co. (a) | | | 37,582 | | | | 3,713,101 | |
| | | | | | | | |
| | | | | | | 6,780,809 | |
| | | | | | | | |
|
| Consumer Finance—0.6% | |
American Express Co. (a) | | | 199,369 | | | | 19,003,853 | |
Capital One Financial Corp. | | | 134,808 | | | | 10,190,137 | |
Discover Financial Services | | | 95,619 | | | | 5,639,608 | |
|
| Consumer Finance—(Continued) | |
Synchrony Financial | | | 188,195 | | | | 4,415,055 | |
| | | | | | | | |
| | | | | | | 39,248,653 | |
| | | | | | | | |
|
| Containers & Packaging—0.3% | |
Avery Dennison Corp. | | | 24,679 | | | | 2,216,914 | |
Ball Corp. (a) | | | 96,537 | | | | 4,438,771 | |
International Paper Co. | | | 115,275 | | | | 4,652,499 | |
Packaging Corp. of America | | | 26,895 | | | | 2,244,657 | |
Sealed Air Corp. (a) | | | 44,662 | | | | 1,556,024 | |
WestRock Co. | | | 72,164 | | | | 2,724,913 | |
| | | | | | | | |
| | | | | | | 17,833,778 | |
| | | | | | | | |
|
| Distributors—0.1% | |
Genuine Parts Co. | | | 41,769 | | | | 4,010,659 | |
LKQ Corp. (a) (b) | | | 90,564 | | | | 2,149,084 | |
| | | | | | | | |
| | | | | | | 6,159,743 | |
| | | | | | | | |
|
| Diversified Consumer Services—0.0% | |
H&R Block, Inc. (a) | | | 58,495 | | | | 1,484,018 | |
| | | | | | | | |
|
| Diversified Financial Services—1.9% | |
Berkshire Hathaway, Inc. - Class B (b) | | | 553,683 | | | | 113,050,995 | |
Jefferies Financial Group, Inc. (a) | | | 79,996 | | | | 1,388,730 | |
| | | | | | | | |
| | | | | | | 114,439,725 | |
| | | | | | | | |
|
| Diversified Telecommunication Services—2.1% | |
AT&T, Inc. (a) | | | 2,071,408 | | | | 59,117,984 | |
CenturyLink, Inc. (a) | | | 270,660 | | | | 4,100,499 | |
Verizon Communications, Inc. | | | 1,176,022 | | | | 66,115,957 | |
| | | | | | | | |
| | | | | | | 129,334,440 | |
| | | | | | | | |
|
| Electric Utilities—2.0% | |
Alliant Energy Corp. (a) | | | 67,150 | | | | 2,837,088 | |
American Electric Power Co., Inc. | | | 140,345 | | | | 10,489,385 | |
Duke Energy Corp. | | | 202,894 | | | | 17,509,752 | |
Edison International (a) | | | 92,729 | | | | 5,264,225 | |
Entergy Corp. | | | 51,555 | | | | 4,437,339 | |
Evergy, Inc. | | | 74,982 | | | | 4,256,728 | |
Eversource Energy (a) | | | 90,189 | | | | 5,865,893 | |
Exelon Corp. | | | 275,222 | | | | 12,412,512 | |
FirstEnergy Corp. (a) | | | 138,285 | | | | 5,192,602 | |
NextEra Energy, Inc. (a) | | | 136,029 | | | | 23,644,561 | |
PG&E Corp. (b) | | | 147,621 | | | | 3,505,999 | |
Pinnacle West Capital Corp. | | | 31,899 | | | | 2,717,795 | |
PPL Corp. | | | 204,977 | | | | 5,806,998 | |
Southern Co. (The) | | | 292,834 | | | | 12,861,269 | |
Xcel Energy, Inc. (a) | | | 146,297 | | | | 7,208,053 | |
| | | | | | | | |
| | | | | | | 124,010,199 | |
| | | | | | | | |
|
| Electrical Equipment—0.5% | |
AMETEK, Inc. | | | 66,063 | | | | 4,472,465 | |
Eaton Corp. plc | | | 123,351 | | | | 8,469,280 | |
Emerson Electric Co. | | | 178,212 | | | | 10,648,167 | |
Rockwell Automation, Inc. (a) | | | 34,348 | | | | 5,168,687 | |
| | | | | | | | |
| | | | | | | 28,758,599 | |
| | | | | | | | |
See accompanying notes to financial statements.
BHFTII-5
Brighthouse Funds Trust II
MetLife Stock Index Portfolio
Schedule of Investments as of December 31, 2018
Common Stocks—(Continued)
| | | | | | | | |
| Security Description | | Shares | | | Value | |
|
| Electronic Equipment, Instruments & Components—0.5% | |
Amphenol Corp. - Class A | | | 85,761 | | | $ | 6,948,356 | |
Corning, Inc. | | | 227,803 | | | | 6,881,929 | |
FLIR Systems, Inc. | | | 39,375 | | | | 1,714,387 | |
IPG Photonics Corp. (a) (b) | | | 10,183 | | | | 1,153,632 | |
Keysight Technologies, Inc. (b) | | | 53,344 | | | | 3,311,595 | |
TE Connectivity, Ltd. | | | 97,631 | | | | 7,383,833 | |
| | | | | | | | |
| | | | | | | 27,393,732 | |
| | | | | | | | |
|
| Energy Equipment & Services—0.5% | |
Baker Hughes a GE Co. (a) | | | 146,116 | | | | 3,141,494 | |
Halliburton Co. (a) | | | 249,333 | | | | 6,627,271 | |
Helmerich & Payne, Inc. | | | 31,033 | | | | 1,487,722 | |
National Oilwell Varco, Inc. (a) | | | 109,110 | | | | 2,804,127 | |
Schlumberger, Ltd. | | | 394,131 | | | | 14,220,247 | |
TechnipFMC plc (a) | | | 121,095 | | | | 2,371,040 | |
| | | | | | | | |
| | | | | | | 30,651,901 | |
| | | | | | | | |
|
| Entertainment—2.0% | |
Activision Blizzard, Inc. (a) | | | 217,173 | | | | 10,113,747 | |
Electronic Arts, Inc. (b) | | | 85,989 | | | | 6,785,392 | |
Netflix, Inc. (a) (b) | | | 124,115 | | | | 33,220,621 | |
Take-Two Interactive Software, Inc. (a) (b) | | | 32,409 | | | | 3,336,182 | |
Twenty-First Century Fox, Inc. - Class A | | | 300,827 | | | | 14,475,795 | |
Twenty-First Century Fox, Inc. - Class B | | | 138,634 | | | | 6,623,933 | |
Viacom, Inc. - Class B | | | 100,592 | | | | 2,585,214 | |
Walt Disney Co. (The) (a) | | | 423,694 | | | | 46,458,047 | |
| | | | | | | | |
| | | | | | | 123,598,931 | |
| | | | | | | | |
|
| Equity Real Estate Investment Trusts—2.9% | |
Alexandria Real Estate Equities, Inc. | | | 30,604 | | | | 3,526,805 | |
American Tower Corp. | | | 125,368 | | | | 19,831,964 | |
Apartment Investment & Management Co. - Class A | | | 44,298 | | | | 1,943,796 | |
AvalonBay Communities, Inc. | | | 39,340 | | | | 6,847,127 | |
Boston Properties, Inc. | | | 43,956 | | | | 4,947,248 | |
Crown Castle International Corp. | | | 118,071 | | | | 12,826,053 | |
Digital Realty Trust, Inc. (a) | | | 58,710 | | | | 6,255,550 | |
Duke Realty Corp. | | | 101,982 | | | | 2,641,334 | |
Equinix, Inc. | | | 22,880 | | | | 8,066,573 | |
Equity Residential | | | 104,862 | | | | 6,921,941 | |
Essex Property Trust, Inc. | | | 18,803 | | | | 4,610,684 | |
Extra Space Storage, Inc. | | | 36,008 | | | | 3,258,004 | |
Federal Realty Investment Trust | | | 21,022 | | | | 2,481,437 | |
HCP, Inc. | | | 135,898 | | | | 3,795,631 | |
Host Hotels & Resorts, Inc. | | | 211,200 | | | | 3,520,704 | |
Iron Mountain, Inc. (a) | | | 81,461 | | | | 2,640,151 | |
Kimco Realty Corp. (a) | | | 119,933 | | | | 1,757,018 | |
Macerich Co. (The) (a) | | | 30,108 | | | | 1,303,074 | |
Mid-America Apartment Communities, Inc. | | | 32,400 | | | | 3,100,680 | |
Prologis, Inc. (a) | | | 179,172 | | | | 10,520,980 | |
Public Storage | | | 42,679 | | | | 8,638,656 | |
Realty Income Corp. (a) | | | 83,993 | | | | 5,294,919 | |
Regency Centers Corp. | | | 48,225 | | | | 2,829,843 | |
SBA Communications Corp. (b) | | | 32,253 | | | | 5,221,438 | |
Simon Property Group, Inc. | | | 88,030 | | | | 14,788,160 | |
SL Green Realty Corp. | | | 24,269 | | | | 1,919,193 | |
UDR, Inc. | | | 78,423 | | | | 3,107,119 | |
|
| Equity Real Estate Investment Trusts—(Continued) | |
Ventas, Inc. | | | 101,455 | | | | 5,944,248 | |
Vornado Realty Trust | | | 49,283 | | | | 3,057,024 | |
Welltower, Inc. | | | 106,913 | | | | 7,420,831 | |
Weyerhaeuser Co. | | | 213,231 | | | | 4,661,230 | |
| | | | | | | | |
| | | | | | | 173,679,415 | |
| | | | | | | | |
|
| Food & Staples Retailing—1.5% | |
Costco Wholesale Corp. | | | 124,720 | | | | 25,406,711 | |
Kroger Co. (The) (a) | | | 227,120 | | | | 6,245,800 | |
Sysco Corp. | | | 136,103 | | | | 8,528,214 | |
Walgreens Boots Alliance, Inc. (a) | | | 228,806 | | | | 15,634,314 | |
Walmart, Inc. | | | 405,167 | | | | 37,741,306 | |
| | | | | | | | |
| | | | | | | 93,556,345 | |
| | | | | | | | |
|
| Food Products—1.1% | |
Archer-Daniels-Midland Co. | | | 159,566 | | | | 6,537,419 | |
Campbell Soup Co. (a) | | | 54,833 | | | | 1,808,941 | |
Conagra Brands, Inc. | | | 138,211 | | | | 2,952,187 | |
General Mills, Inc. (a) | | | 169,694 | | | | 6,607,884 | |
Hershey Co. (The) | | | 39,913 | | | | 4,277,875 | |
Hormel Foods Corp. (a) | | | 77,597 | | | | 3,311,840 | |
J.M. Smucker Co. (The) (a) | | | 32,377 | | | | 3,026,926 | |
Kellogg Co. (a) | | | 72,099 | | | | 4,110,364 | |
Kraft Heinz Co. (The) (a) | | | 177,003 | | | | 7,618,209 | |
Lamb Weston Holdings, Inc. | | | 41,683 | | | | 3,066,201 | |
McCormick & Co., Inc. (a) | | | 34,657 | | | | 4,825,641 | |
Mondelez International, Inc. - Class A | | | 413,779 | | | | 16,563,573 | |
Tyson Foods, Inc. - Class A | | | 83,989 | | | | 4,485,013 | |
| | | | | | | | |
| | | | | | | 69,192,073 | |
| | | | | | | | |
|
| Health Care Equipment & Supplies—3.3% | |
Abbott Laboratories | | | 499,874 | | | | 36,155,886 | |
ABIOMED, Inc. (b) | | | 12,819 | | | | 4,166,688 | |
Align Technology, Inc. (a) (b) | | | 20,716 | | | | 4,338,552 | |
Baxter International, Inc. | | | 140,852 | | | | 9,270,879 | |
Becton Dickinson & Co. | | | 76,350 | | | | 17,203,182 | |
Boston Scientific Corp. (b) | | | 393,846 | | | | 13,918,518 | |
Cooper Cos., Inc. (The) (a) | | | 13,986 | | | | 3,559,437 | |
Danaher Corp. | | | 175,547 | | | | 18,102,407 | |
DENTSPLY SIRONA, Inc. | | | 63,339 | | | | 2,356,844 | |
Edwards Lifesciences Corp. (b) | | | 59,498 | | | | 9,113,309 | |
Hologic, Inc. (b) | | | 76,674 | | | | 3,151,301 | |
IDEXX Laboratories, Inc. (a) (b) | | | 24,543 | | | | 4,565,489 | |
Intuitive Surgical, Inc. (b) | | | 32,503 | | | | 15,566,337 | |
Medtronic plc | | | 382,247 | | | | 34,769,187 | |
ResMed, Inc. | | | 40,557 | | | | 4,618,225 | |
Stryker Corp. | | | 88,394 | | | | 13,855,759 | |
Varian Medical Systems, Inc. (b) | | | 25,933 | | | | 2,938,468 | |
Zimmer Biomet Holdings, Inc. (a) | | | 58,054 | | | | 6,021,361 | |
| | | | | | | | |
| | | | | | | 203,671,829 | |
| | | | | | | | |
|
| Health Care Providers & Services—3.1% | |
AmerisourceBergen Corp. (a) | | | 44,636 | | | | 3,320,919 | |
Anthem, Inc. | | | 73,613 | | | | 19,332,982 | |
Cardinal Health, Inc. | | | 84,797 | | | | 3,781,946 | |
See accompanying notes to financial statements.
BHFTII-6
Brighthouse Funds Trust II
MetLife Stock Index Portfolio
Schedule of Investments as of December 31, 2018
Common Stocks—(Continued)
| | | | | | | | |
| Security Description | | Shares | | | Value | |
|
| Health Care Providers & Services—(Continued) | |
Centene Corp. (b) | | | 58,447 | | | $ | 6,738,939 | |
Cigna Corp. | | | 108,375 | | | | 20,582,563 | |
CVS Health Corp. | | | 368,060 | | | | 24,115,291 | |
DaVita, Inc. (b) | | | 35,903 | | | | 1,847,568 | |
HCA Healthcare, Inc. | | | 76,403 | | | | 9,508,353 | |
Henry Schein, Inc. (a) (b) | | | 43,385 | | | | 3,406,590 | |
Humana, Inc. | | | 39,045 | | | | 11,185,612 | |
Laboratory Corp. of America Holdings (b) | | | 28,717 | | | | 3,628,680 | |
McKesson Corp. | | | 55,606 | | | | 6,142,795 | |
Quest Diagnostics, Inc. (a) | | | 38,728 | | | | 3,224,881 | |
UnitedHealth Group, Inc. | | | 273,807 | | | | 68,210,800 | |
Universal Health Services, Inc. - Class B (a) | | | 24,265 | | | | 2,828,328 | |
WellCare Health Plans, Inc. (a) (b) | | | 14,229 | | | | 3,359,325 | |
| | | | | | | | |
| | | | | | | 191,215,572 | |
| | | | | | | | |
|
| Health Care Technology—0.1% | |
Cerner Corp. (b) | | | 93,776 | | | | 4,917,613 | |
| | | | | | | | |
|
| Hotels, Restaurants & Leisure—1.8% | |
Carnival Corp. | | | 113,960 | | | | 5,618,228 | |
Chipotle Mexican Grill, Inc. (a) (b) | | | 6,960 | | | | 3,005,258 | |
Darden Restaurants, Inc. | | | 35,323 | | | | 3,527,355 | |
Hilton Worldwide Holdings, Inc. | | | 84,407 | | | | 6,060,423 | |
Marriott International, Inc. - Class A (a) | | | 80,584 | | | | 8,748,199 | |
McDonald’s Corp. | | | 219,411 | | | | 38,960,811 | |
MGM Resorts International (a) | | | 142,544 | | | | 3,458,118 | |
Norwegian Cruise Line Holdings, Ltd. (b) | | | 62,607 | | | | 2,653,911 | |
Royal Caribbean Cruises, Ltd. | | | 48,776 | | | | 4,769,805 | |
Starbucks Corp. | | | 353,090 | | | | 22,738,996 | |
Wynn Resorts, Ltd. | | | 27,854 | | | | 2,755,039 | |
Yum! Brands, Inc. (a) | | | 88,885 | | | | 8,170,309 | |
| | | | | | | | |
| | | | | | | 110,466,452 | |
| | | | | | | | |
|
| Household Durables—0.3% | |
DR Horton, Inc. | | | 97,454 | | | | 3,377,756 | |
Garmin, Ltd. | | | 34,391 | | | | 2,177,638 | |
Leggett & Platt, Inc. (a) | | | 37,118 | | | | 1,330,309 | |
Lennar Corp. - Class A (a) | | | 83,260 | | | | 3,259,629 | |
Mohawk Industries, Inc. (a) (b) | | | 17,950 | | | | 2,099,432 | |
Newell Brands, Inc. (a) | | | 122,228 | | | | 2,272,218 | |
PulteGroup, Inc. | | | 73,541 | | | | 1,911,331 | |
Whirlpool Corp. | | | 18,161 | | | | 1,940,866 | |
| | | | | | | | |
| | | | | | | 18,369,179 | |
| | | | | | | | |
|
| Household Products—1.7% | |
Church & Dwight Co., Inc. (a) | | | 70,081 | | | | 4,608,527 | |
Clorox Co. (The) (a) | | | 36,331 | | | | 5,600,060 | |
Colgate-Palmolive Co. | | | 246,849 | | | | 14,692,453 | |
Kimberly-Clark Corp. | | | 98,562 | | | | 11,230,154 | |
Procter & Gamble Co. (The) | | | 709,085 | | | | 65,179,093 | |
| | | | | | | | |
| | | | | | | 101,310,287 | |
| | | | | | | | |
|
| Independent Power and Renewable Electricity Producers—0.1% | |
AES Corp. (a) | | | 188,497 | | | | 2,725,667 | |
NRG Energy, Inc. | | | 82,517 | | | | 3,267,673 | |
| | | | | | | | |
| | | | | | | 5,993,340 | |
| | | | | | | | |
|
| Industrial Conglomerates—1.4% | |
3M Co. | | | 165,726 | | | | 31,577,432 | |
General Electric Co. | | | 2,475,590 | | | | 18,740,216 | |
Honeywell International, Inc. | | | 210,695 | | | | 27,837,023 | |
Roper Technologies, Inc. | | | 29,438 | | | | 7,845,816 | |
| | | | | | | | |
| | | | | | | 86,000,487 | |
| | | | | | | | |
|
| Insurance—2.3% | |
Aflac, Inc. | | | 216,669 | | | | 9,871,440 | |
Allstate Corp. (The) | | | 98,032 | | | | 8,100,384 | |
American International Group, Inc. (a) | | | 251,781 | | | | 9,922,689 | |
Aon plc | | | 68,547 | | | | 9,963,992 | |
Arthur J. Gallagher & Co. | | | 52,269 | | | | 3,852,225 | |
Assurant, Inc. | | | 14,835 | | | | 1,326,842 | |
Brighthouse Financial, Inc. (a) (b) (c) | | | 33,755 | | | | 1,028,852 | |
Chubb, Ltd. | | | 131,151 | | | | 16,942,086 | |
Cincinnati Financial Corp. (a) | | | 43,075 | | | | 3,334,867 | |
Everest Re Group, Ltd. (a) | | | 11,569 | | | | 2,519,266 | |
Hartford Financial Services Group, Inc. (The) | | | 102,100 | | | | 4,538,345 | |
Lincoln National Corp. | | | 60,794 | | | | 3,119,340 | |
Loews Corp. | | | 78,691 | | | | 3,582,014 | |
Marsh & McLennan Cos., Inc. | | | 143,361 | | | | 11,433,040 | |
MetLife, Inc. (a) (c) | | | 280,866 | | | | 11,532,358 | |
Principal Financial Group, Inc. | | | 74,919 | | | | 3,309,172 | |
Progressive Corp. (The) | | | 165,957 | | | | 10,012,186 | |
Prudential Financial, Inc. | | | 117,545 | | | | 9,585,795 | |
Torchmark Corp. | | | 29,206 | | | | 2,176,723 | |
Travelers Cos., Inc. (The) | | | 75,389 | | | | 9,027,833 | |
Unum Group | | | 62,258 | | | | 1,829,140 | |
Willis Towers Watson plc (a) | | | 36,982 | | | | 5,616,087 | |
| | | | | | | | |
| | | | | | | 142,624,676 | |
| | | | | | | | |
|
| Interactive Media & Services—4.5% | |
Alphabet, Inc. - Class A (b) | | | 85,091 | | | | 88,916,691 | |
Alphabet, Inc. - Class C (b) (d) | | | 87,565 | | | | 90,683,190 | |
Facebook, Inc. - Class A (b) | | | 683,772 | | | | 89,635,671 | |
TripAdvisor, Inc. (b) | | | 29,141 | | | | 1,571,866 | |
Twitter, Inc. (a) (b) | | | 205,828 | | | | 5,915,497 | |
| | | | | | | | |
| | | | | | | 276,722,915 | |
| | | | | | | | |
|
| Internet & Direct Marketing Retail—3.4% | |
Amazon.com, Inc. (b) | | | 116,900 | | | | 175,580,293 | |
Booking Holdings, Inc. (b) | | | 13,187 | | | | 22,713,553 | |
eBay, Inc. (b) | | | 257,590 | | | | 7,230,551 | |
Expedia Group, Inc. (a) | | | 33,718 | | | | 3,798,333 | |
| | | | | | | | |
| | | | | | | 209,322,730 | |
| | | | | | | | |
|
| IT Services—4.7% | |
Accenture plc - Class A | | | 181,426 | | | | 25,582,880 | |
Akamai Technologies, Inc. (b) | | | 46,353 | | | | 2,831,241 | |
Alliance Data Systems Corp. (a) | | | 13,334 | | | | 2,001,167 | |
Automatic Data Processing, Inc. | | | 124,584 | | | | 16,335,454 | |
Broadridge Financial Solutions, Inc. | | | 33,229 | | | | 3,198,291 | |
Cognizant Technology Solutions Corp. - Class A | | | 164,798 | | | | 10,461,377 | |
DXC Technology Co. | | | 79,723 | | | | 4,238,872 | |
Fidelity National Information Services, Inc. | | | 93,207 | | | | 9,558,378 | |
See accompanying notes to financial statements.
BHFTII-7
Brighthouse Funds Trust II
MetLife Stock Index Portfolio
Schedule of Investments as of December 31, 2018
Common Stocks—(Continued)
| | | | | | | | |
| Security Description | | Shares | | | Value | |
|
| IT Services—(Continued) | |
Fiserv, Inc. (b) | | | 113,409 | | | $ | 8,334,427 | |
FleetCor Technologies, Inc. (a) (b) | | | 25,238 | | | | 4,687,201 | |
Gartner, Inc. (a) (b) | | | 25,869 | | | | 3,307,093 | |
Global Payments, Inc. (a) | | | 45,029 | | | | 4,643,841 | |
International Business Machines Corp. (a) | | | 258,654 | | | | 29,401,200 | |
Jack Henry & Associates, Inc. | | | 22,000 | | | | 2,783,440 | |
MasterCard, Inc. - Class A | | | 258,607 | | | | 48,786,210 | |
Paychex, Inc. (a) | | | 90,957 | | | | 5,925,849 | |
PayPal Holdings, Inc. (b) | | | 335,375 | | | | 28,201,684 | |
Total System Services, Inc. | | | 47,771 | | | | 3,883,305 | |
VeriSign, Inc. (b) | | | 30,278 | | | | 4,489,925 | |
Visa, Inc. - Class A (a) | | | 500,133 | | | | 65,987,548 | |
Western Union Co. (The) (a) | | | 126,028 | | | | 2,150,038 | |
| | | | | | | | |
| | | | | | | 286,789,421 | |
| | | | | | | | |
|
| Leisure Products—0.1% | |
Hasbro, Inc. (a) | | | 33,125 | | | | 2,691,406 | |
Mattel, Inc. (a) (b) | | | 98,234 | | | | 981,358 | |
| | | | | | | | |
| | | | | | | 3,672,764 | |
| | | | | | | | |
|
| Life Sciences Tools & Services—1.0% | |
Agilent Technologies, Inc. | | | 90,725 | | | | 6,120,308 | |
Illumina, Inc. (b) | | | 41,838 | | | | 12,548,471 | |
IQVIA Holdings, Inc. (b) | | | 45,093 | | | | 5,238,454 | |
Mettler-Toledo International, Inc. (a) (b) | | | 7,129 | | | | 4,032,020 | |
PerkinElmer, Inc. (a) | | | 31,660 | | | | 2,486,893 | |
Thermo Fisher Scientific, Inc. | | | 114,578 | | | | 25,641,411 | |
Waters Corp. (a) (b) | | | 21,558 | | | | 4,066,917 | |
| | | | | | | | |
| | | | | | | 60,134,474 | |
| | | | | | | | |
|
| Machinery—1.5% | |
Caterpillar, Inc. | | | 167,952 | | | | 21,341,661 | |
Cummins, Inc. | | | 42,042 | | | | 5,618,493 | |
Deere & Co. | | | 91,552 | | | | 13,656,812 | |
Dover Corp. (a) | | | 41,648 | | | | 2,954,926 | |
Flowserve Corp. (a) | | | 37,243 | | | | 1,415,979 | |
Fortive Corp. (a) | | | 83,644 | | | | 5,659,353 | |
Illinois Tool Works, Inc. | | | 86,880 | | | | 11,006,827 | |
Ingersoll-Rand plc | | | 69,917 | | | | 6,378,528 | |
PACCAR, Inc. (a) | | | 99,453 | | | | 5,682,744 | |
Parker-Hannifin Corp. | | | 37,668 | | | | 5,617,805 | |
Pentair plc (a) | | | 45,456 | | | | 1,717,328 | |
Snap-on, Inc. (a) | | | 15,848 | | | | 2,302,556 | |
Stanley Black & Decker, Inc. | | | 42,994 | | | | 5,148,101 | |
Xylem, Inc. | | | 51,149 | | | | 3,412,661 | |
| | | | | | | | |
| | | | | | | 91,913,774 | |
| | | | | | | | |
|
| Media—1.3% | |
CBS Corp. - Class B (a) | | | 95,829 | | | | 4,189,644 | |
Charter Communications, Inc. - Class A (b) | | | 50,168 | | | | 14,296,375 | |
Comcast Corp. - Class A | | | 1,292,157 | | | | 43,997,946 | |
Discovery, Inc. - Class A (a) (b) | | | 44,610 | | | | 1,103,651 | |
Discovery, Inc. - Class C (a) (b) | | | 102,530 | | | | 2,366,392 | |
DISH Network Corp. - Class A (b) | | | 65,244 | | | | 1,629,143 | |
Interpublic Group of Cos., Inc. (The) (a) | | | 109,391 | | | | 2,256,736 | |
|
| Media—(Continued) | |
News Corp. - Class A (a) | | | 109,636 | | | | 1,244,369 | |
News Corp. - Class B (a) | | | 35,226 | | | | 406,860 | |
Omnicom Group, Inc. (a) | | | 63,783 | | | | 4,671,467 | |
| | | | | | | | |
| | | | | | | 76,162,583 | |
| | | | | | | | |
|
| Metals & Mining—0.2% | |
Freeport-McMoRan, Inc. (a) | | | 412,412 | | | | 4,251,968 | |
Newmont Mining Corp. (a) | | | 151,601 | | | | 5,252,974 | |
Nucor Corp. (a) | | | 89,349 | | | | 4,629,172 | |
| | | | | | | | |
| | | | | | | 14,134,114 | |
| | | | | | | | |
|
| Multi-Utilities—1.1% | |
Ameren Corp. | | | 69,529 | | | | 4,535,377 | |
CenterPoint Energy, Inc. | | | 142,645 | | | | 4,026,868 | |
CMS Energy Corp. | | | 80,639 | | | | 4,003,726 | |
Consolidated Edison, Inc. | | | 88,650 | | | | 6,778,179 | |
Dominion Energy, Inc. (a) | | | 186,840 | | | | 13,351,586 | |
DTE Energy Co. (a) | | | 51,778 | | | | 5,711,113 | |
NiSource, Inc. (a) | | | 103,396 | | | | 2,621,089 | |
Public Service Enterprise Group, Inc. | | | 143,857 | | | | 7,487,757 | |
SCANA Corp. | | | 40,591 | | | | 1,939,438 | |
Sempra Energy (a) | | | 77,887 | | | | 8,426,595 | |
WEC Energy Group, Inc. (a) | | | 89,802 | | | | 6,219,687 | |
| | | | | | | | |
| | | | | | | 65,101,415 | |
| | | | | | | | |
|
| Multiline Retail—0.5% | |
Dollar General Corp. (a) | | | 74,820 | | | | 8,086,546 | |
Dollar Tree, Inc. (b) | | | 67,729 | | | | 6,117,283 | |
Kohl’s Corp. (a) | | | 46,997 | | | | 3,117,781 | |
Macy’s, Inc. (a) | | | 87,508 | | | | 2,605,988 | |
Nordstrom, Inc. (a) | | | 32,383 | | | | 1,509,372 | |
Target Corp. (a) | | | 148,520 | | | | 9,815,687 | |
| | | | | | | | |
| | | | | | | 31,252,657 | |
| | | | | | | | |
|
| Oil, Gas & Consumable Fuels—4.7% | |
Anadarko Petroleum Corp. | | | 143,524 | | | | 6,292,092 | |
Apache Corp. (a) | | | 108,022 | | | | 2,835,577 | |
Cabot Oil & Gas Corp. (a) | | | 122,719 | | | | 2,742,770 | |
Chevron Corp. | | | 543,830 | | | | 59,163,266 | |
Cimarex Energy Co. (a) | | | 27,214 | | | | 1,677,743 | |
Concho Resources, Inc. (b) | | | 56,994 | | | | 5,858,413 | |
ConocoPhillips | | | 327,657 | | | | 20,429,414 | |
Devon Energy Corp. | | | 133,255 | | | | 3,003,568 | |
Diamondback Energy, Inc. | | | 43,898 | | | | 4,069,345 | |
EOG Resources, Inc. (a) | | | 165,047 | | | | 14,393,749 | |
Exxon Mobil Corp. | | | 1,204,993 | | | | 82,168,473 | |
Hess Corp. (a) | | | 70,826 | | | | 2,868,453 | |
HollyFrontier Corp. (a) | | | 45,370 | | | | 2,319,314 | |
Kinder Morgan, Inc. | | | 540,204 | | | | 8,308,337 | |
Marathon Oil Corp. | | | 236,591 | | | | 3,392,715 | |
Marathon Petroleum Corp. | | | 196,625 | | | | 11,602,841 | |
Newfield Exploration Co. (b) | | | 57,024 | | | | 835,972 | |
Noble Energy, Inc. (a) | | | 136,556 | | | | 2,561,791 | |
Occidental Petroleum Corp. | | | 214,889 | | | | 13,189,887 | |
ONEOK, Inc. (a) | | | 117,078 | | | | 6,316,358 | |
See accompanying notes to financial statements.
BHFTII-8
Brighthouse Funds Trust II
MetLife Stock Index Portfolio
Schedule of Investments as of December 31, 2018
Common Stocks—(Continued)
| | | | | | | | |
| Security Description | | Shares | | | Value | |
|
| Oil, Gas & Consumable Fuels—(Continued) | |
Phillips 66 (a) | | | 120,742 | | | $ | 10,401,923 | |
Pioneer Natural Resources Co. | | | 48,516 | | | | 6,380,824 | |
Valero Energy Corp. | | | 120,763 | | | | 9,053,602 | |
Williams Cos., Inc. (The) | | | 344,535 | | | | 7,596,997 | |
| | | | | | | | |
| | | | | | | 287,463,424 | |
| | | | | | | | |
|
| Personal Products—0.1% | |
Coty, Inc. - Class A | | | 128,259 | | | | 841,379 | |
Estee Lauder Cos., Inc. (The) - Class A (a) | | | 62,586 | | | | 8,142,439 | |
| | | | | | | | |
| | | | | | | 8,983,818 | |
| | | | | | | | |
|
| Pharmaceuticals—5.1% | |
Allergan plc | | | 90,236 | | | | 12,060,944 | |
Bristol-Myers Squibb Co. | | | 464,543 | | | | 24,146,945 | |
Eli Lilly & Co. | | | 268,332 | | | | 31,051,379 | |
Johnson & Johnson | | | 763,324 | | | | 98,506,962 | |
Merck & Co., Inc. | | | 740,099 | | | | 56,550,964 | |
Mylan NV (b) | | | 146,754 | | | | 4,021,060 | |
Nektar Therapeutics (a) (b) | | | 49,262 | | | | 1,619,242 | |
Perrigo Co. plc (a) | | | 35,573 | | | | 1,378,454 | |
Pfizer, Inc. | | | 1,645,194 | | | | 71,812,718 | |
Zoetis, Inc. | | | 136,742 | | | | 11,696,911 | |
| | | | | | | | |
| | | | | | | 312,845,579 | |
| | | | | | | | |
|
| Professional Services—0.3% | |
Equifax, Inc. | | | 34,317 | | | | 3,195,942 | |
IHS Markit, Ltd. (b) | | | 102,087 | | | | 4,897,113 | |
Nielsen Holdings plc | | | 101,032 | | | | 2,357,077 | |
Robert Half International, Inc. (a) | | | 34,573 | | | | 1,977,576 | |
Verisk Analytics, Inc. (a) (b) | | | 46,853 | | | | 5,108,851 | |
| | | | | | | | |
| | | | | | | 17,536,559 | |
| | | | | | | | |
|
| Real Estate Management & Development—0.1% | |
CBRE Group, Inc. - Class A (b) | | | 90,227 | | | | 3,612,689 | |
| | | | | | | | |
|
| Road & Rail—1.0% | |
CSX Corp. | | | 228,315 | | | | 14,185,211 | |
J.B. Hunt Transport Services, Inc. (a) | | | 24,858 | | | | 2,312,788 | |
Kansas City Southern | | | 28,944 | | | | 2,762,705 | |
Norfolk Southern Corp. (a) | | | 77,513 | | | | 11,591,294 | |
Union Pacific Corp. | | | 209,700 | | | | 28,986,831 | |
| | | | | | | | |
| | | | | | | 59,838,829 | |
| | | | | | | | |
|
| Semiconductors & Semiconductor Equipment—3.7% | |
Advanced Micro Devices, Inc. (a) (b) | | | 250,310 | | | | 4,620,723 | |
Analog Devices, Inc. (a) | | | 105,352 | | | | 9,042,362 | |
Applied Materials, Inc. | | | 279,771 | | | | 9,159,702 | |
Broadcom, Inc. | | | 117,672 | | | | 29,921,636 | |
Intel Corp. | | | 1,298,970 | | | | 60,960,662 | |
KLA-Tencor Corp. | | | 43,567 | | | | 3,898,811 | |
Lam Research Corp. (a) | | | 44,167 | | | | 6,014,220 | |
Maxim Integrated Products, Inc. (a) | | | 78,855 | | | | 4,009,777 | |
Microchip Technology, Inc. (a) | | | 67,313 | | | | 4,841,151 | |
Micron Technology, Inc. (a) (b) | | | 318,793 | | | | 10,115,302 | |
NVIDIA Corp. | | | 173,614 | | | | 23,177,469 | |
|
| Semiconductors & Semiconductor Equipment—(Continued) | |
Qorvo, Inc. (a) (b) | | | 35,549 | | | | 2,158,891 | |
QUALCOMM, Inc. | | | 344,996 | | | | 19,633,722 | |
Skyworks Solutions, Inc. (a) | | | 50,527 | | | | 3,386,320 | |
Texas Instruments, Inc. | | | 273,382 | | | | 25,834,599 | |
Xilinx, Inc. | | | 72,019 | | | | 6,133,858 | |
| | | | | | | | |
| | | | | | | 222,909,205 | |
| | | | | | | | |
|
| Software—6.1% | |
Adobe, Inc. (b) | | | 138,929 | | | | 31,431,297 | |
ANSYS, Inc. (a) (b) | | | 23,782 | | | | 3,399,399 | |
Autodesk, Inc. (b) | | | 62,333 | | | | 8,016,647 | |
Cadence Design Systems, Inc. (b) | | | 80,301 | | | | 3,491,487 | |
Citrix Systems, Inc. | | | 36,437 | | | | 3,733,335 | |
Fortinet, Inc. (a) (b) | | | 41,216 | | | | 2,902,843 | |
Intuit, Inc. | | | 73,867 | | | | 14,540,719 | |
Microsoft Corp. | | | 2,199,744 | | | | 223,427,998 | |
Oracle Corp. | | | 725,230 | | | | 32,744,135 | |
Red Hat, Inc. (b) | | | 50,308 | | | | 8,836,097 | |
Salesforce.com, Inc. (b) | | | 217,728 | | | | 29,822,204 | |
Symantec Corp. | | | 181,835 | | | | 3,435,772 | |
Synopsys, Inc. (b) | | | 42,482 | | | | 3,578,684 | |
| | | | | | | | |
| | | | | | | 369,360,617 | |
| | | | | | | | |
|
| Specialty Retail—2.3% | |
Advance Auto Parts, Inc. | | | 20,747 | | | | 3,266,823 | |
AutoZone, Inc. (a) (b) | | | 7,177 | | | | 6,016,766 | |
Best Buy Co., Inc. (a) | | | 66,633 | | | | 3,528,884 | |
CarMax, Inc. (a) (b) | | | 49,699 | | | | 3,117,618 | |
Foot Locker, Inc. | | | 32,700 | | | | 1,739,640 | |
Gap, Inc. (The) (a) | | | 60,794 | | | | 1,566,053 | |
Home Depot, Inc. (The) | | | 321,478 | | | | 55,236,350 | |
L Brands, Inc. (a) | | | 64,992 | | | | 1,668,345 | |
Lowe’s Cos., Inc. | | | 228,531 | | | | 21,107,123 | |
O’Reilly Automotive, Inc. (b) | | | 22,799 | | | | 7,850,380 | |
Ross Stores, Inc. | | | 106,264 | | | | 8,841,165 | |
Tiffany & Co. (a) | | | 30,877 | | | | 2,485,907 | |
TJX Cos., Inc. (The) | | | 352,215 | | | | 15,758,099 | |
Tractor Supply Co. | | | 34,742 | | | | 2,898,872 | |
Ulta Salon Cosmetics & Fragrance, Inc. (a) (b) | | | 16,037 | | | | 3,926,499 | |
| | | | | | | | |
| | | | | | | 139,008,524 | |
| | | | | | | | |
|
| Technology Hardware, Storage & Peripherals—3.8% | |
Apple, Inc. (a) | | | 1,283,069 | | | | 202,391,304 | |
Hewlett Packard Enterprise Co. (a) | | | 405,003 | | | | 5,350,089 | |
HP, Inc. | | | 450,373 | | | | 9,214,631 | |
NetApp, Inc. | | | 71,689 | | | | 4,277,683 | |
Seagate Technology plc (a) | | | 74,125 | | | | 2,860,484 | |
Western Digital Corp. (a) | | | 82,373 | | | | 3,045,330 | |
Xerox Corp. | | | 59,001 | | | | 1,165,860 | |
| | | | | | | | |
| | | | | | | 228,305,381 | |
| | | | | | | | |
|
| Textiles, Apparel & Luxury Goods—0.7% | |
Hanesbrands, Inc. | | | 102,669 | | | | 1,286,443 | |
Michael Kors Holdings, Ltd. (b) | | | 42,758 | | | | 1,621,383 | |
NIKE, Inc. - Class B | | | 362,330 | | | | 26,863,146 | |
See accompanying notes to financial statements.
BHFTII-9
Brighthouse Funds Trust II
MetLife Stock Index Portfolio
Schedule of Investments as of December 31, 2018
Common Stocks—(Continued)
| | | | | | | | |
| Security Description | | Shares/
Principal
Amount* | | | Value | |
|
| Textiles, Apparel & Luxury Goods—(Continued) | |
PVH Corp. | | | 21,555 | | | $ | 2,003,537 | |
Ralph Lauren Corp. | | | 15,528 | | | | 1,606,527 | |
Tapestry, Inc. | | | 82,479 | | | | 2,783,666 | |
Under Armour, Inc. - Class A (a) (b) | | | 53,397 | | | | 943,525 | |
Under Armour, Inc. - Class C (b) | | | 54,746 | | | | 885,243 | |
VF Corp. | | | 92,607 | | | | 6,606,584 | |
| | | | | | | | |
| | | | | | | 44,600,054 | |
| | | | | | | | |
|
| Tobacco—0.9% | |
Altria Group, Inc. | | | 534,799 | | | | 26,413,723 | |
Philip Morris International, Inc. | | | 442,436 | | | | 29,537,027 | |
| | | | | | | | |
| | | | | | | 55,950,750 | |
| | | | | | | | |
|
| Trading Companies & Distributors—0.2% | |
Fastenal Co. (a) | | | 81,699 | | | | 4,272,041 | |
United Rentals, Inc. (a) (b) | | | 23,083 | | | | 2,366,700 | |
WW Grainger, Inc. | | | 12,984 | | | | 3,666,162 | |
| | | | | | | | |
| | | | | | | 10,304,903 | |
| | | | | | | | |
|
| Water Utilities—0.1% | |
American Water Works Co., Inc. | | | 51,401 | | | | 4,665,669 | |
| | | | | | | | |
Total Common Stocks
(Cost $3,189,391,339) | | | | | | | 5,988,566,334 | |
| | | | | | | | |
|
| Mutual Fund—1.0% | |
|
| Investment Company Security—1.0% | |
SPDR S&P 500 ETF Trust (a)
(Cost $59,807,620) | | | 237,000 | | | | 59,231,040 | |
| | | | | | | | |
|
| Short-Term Investments—0.8% | |
|
| Discount Notes—0.2% | |
Federal Home Loan Bank
2.189%, 01/18/11 (e) | | | 1,175,000 | | | | 1,173,757 | |
2.066%, 01/09/19 (e) | | | 5,700,000 | | | | 5,697,361 | |
2.236%, 01/16/19 (e) | | | 675,000 | | | | 674,375 | |
2.276%, 01/23/19 (e) | | | 3,125,000 | | | | 3,120,662 | |
2.323%, 02/06/19 (e) | | | 1,225,000 | | | | 1,222,142 | |
| | | | | | | | |
| | | | | | | 11,888,297 | |
| | | | | | | | |
|
| U.S. Treasury—0.6% | |
U.S. Treasury Bills
2.015%, 01/08/19 (e) | | | 6,650,000 | | | | 6,647,473 | |
2.028%, 01/10/19 (e) | | | 1,350,000 | | | | 1,349,314 | |
2.225%, 01/22/19 (e) | | | 19,525,000 | | | | 19,499,673 | |
2.288%, 02/07/19 (e) | | | 200,000 | | | | 199,520 | |
2.305%, 01/29/19 (e) | | | 900,000 | | | | 898,342 | |
|
| U.S. Treasury—(Continued) | |
U.S. Treasury Bills
2.333%, 02/21/19 (e) | | | 9,300,000 | | | | 9,268,959 | |
| | | | | | | | |
| | | | | | | 37,863,281 | |
| | | | | | | | |
Total Short-Term Investments
(Cost $49,750,052) | | | | | | | 49,751,578 | |
| | | | | | | | |
|
| Securities Lending Reinvestments (f)—10.0% | |
|
| Certificates of Deposit—4.9% | |
Banco Del Estado De Chile New York
2.720%, 1M LIBOR + 0.250%, 03/20/19 (g) | | | 10,000,000 | | | | 9,999,140 | |
Bank of Montreal (Chicago)
2.710%, 1M LIBOR + 0.330%, 08/06/19 (g) | | | 10,000,000 | | | | 9,999,750 | |
Bank of Nova Scotia
2.890%, SOFR + 0.430%, 05/16/19 (g) | | | 5,000,000 | | | | 4,999,996 | |
3.072%, 3M LIBOR + 0.280%, 03/20/19 (g) | | | 15,000,000 | | | | 15,005,985 | |
Barclays Bank plc
2.500%, 02/01/19 | | | 8,000,000 | | | | 7,998,968 | |
2.547%, 1M LIBOR + 0.200%, 02/04/19 (g) | | | 5,000,000 | | | | 4,999,525 | |
China Construction Bank Corp.
2.550%, 01/07/19 | | | 8,000,000 | | | | 8,000,000 | |
Citibank N.A.
2.490%, 02/04/19 | | | 10,000,000 | | | | 9,998,610 | |
Commonwealth Bank of Australia
2.617%, 3M LIBOR + 0.140%, 04/23/19 (g) | | | 4,000,000 | | | | 4,000,012 | |
2.642%, 1M LIBOR + 0.210%, 09/13/19 (g) | | | 12,000,000 | | | | 12,000,000 | |
Cooperative Rabobank UA
2.608%, 3M LIBOR + 0.200%, 04/05/19 (g) | | | 10,000,000 | | | | 10,003,140 | |
Credit Agricole S.A.
2.500%, 02/12/19 | | | 2,000,000 | | | | 1,999,660 | |
Credit Suisse AG
2.620%, 04/01/19 | | | 10,000,000 | | | | 9,994,820 | |
2.890%, SOFR + 0.430%, 05/02/19 (g) | | | 7,000,000 | | | | 6,999,916 | |
Mitsubishi UFJ Trust and Banking Corp.
Zero Coupon, 01/15/19 | | | 7,939,899 | | | | 7,991,840 | |
Mizuho Bank, Ltd., New York
2.649%, 1M LIBOR + 0.300%, 05/01/19 (g) | | | 12,000,000 | | | | 12,000,072 | |
MUFG Bank Ltd.
2.649%, 1M LIBOR + 0.300%, 05/01/19 (g) | | | 5,000,000 | | | | 5,000,030 | |
Natixis New York
2.705%, 3M LIBOR + 0.090%, 05/10/19 (g) | | | 5,000,000 | | | | 4,996,850 | |
2.731%, 3M LIBOR + 0.190%, 02/01/19 (g) | | | 10,000,000 | | | | 9,997,760 | |
2.810%, 1M LIBOR + 0.370%, 02/14/19 (g) | | | 10,000,000 | | | | 10,001,870 | |
Nordea Bank New York
2.608%, 3M LIBOR + 0.200%, 04/05/19 (g) | | | 10,000,000 | | | | 10,009,619 | |
Royal Bank of Canada New York
2.665%, 1M LIBOR + 0.210%, 09/17/19 (g) | | | 15,000,000 | | | | 14,984,655 | |
Skandinaviska Enskilda Banken
2.645%, 1M LIBOR + 0.190%, 04/17/19 (g) | | | 10,000,000 | | | | 9,999,180 | |
Societe Generale
2.719%, 3M LIBOR + 0.160%, 05/07/19 (g) | | | 5,000,000 | | | | 4,997,780 | |
Standard Chartered plc
2.686%, 1M LIBOR + 0.180%, 02/25/19 (g) | | | 13,000,000 | | | | 12,999,623 | |
2.717%, 3M LIBOR + 0.230%, 04/24/19 (g) | | | 3,000,000 | | | | 2,999,346 | |
See accompanying notes to financial statements.
BHFTII-10
Brighthouse Funds Trust II
MetLife Stock Index Portfolio
Schedule of Investments as of December 31, 2018
Securities Lending Reinvestments (f)—(Continued)
| | | | | | | | |
| Security Description | | Principal
Amount* | | | Value | |
|
| Certificates of Deposit—(Continued) | |
Sumitomo Mitsui Banking Corp.
2.590%, 1M LIBOR + 0.190%, 04/11/19 (g) | | | 15,000,000 | | | $ | 14,994,495 | |
Sumitomo Mitsui Banking Corp., New York
2.559%, 1M LIBOR + 0.180%, 03/05/19 (g) | | | 5,000,000 | | | | 4,998,815 | |
2.665%, 1M LIBOR + 0.210%, 05/17/19 (g) | | | 6,000,000 | | | | 5,997,480 | |
Svenska Handelsbanken AB
2.620%, 3M LIBOR + 0.100%, 04/30/19 (g) | | | 15,000,000 | | | | 14,999,325 | |
2.799%, 1M LIBOR + 0.450%, 04/03/19 (g) | | | 7,000,000 | | | | 7,004,046 | |
2.822%, 1M LIBOR + 0.300%, 10/31/19 (g) | | | 5,000,000 | | | | 4,998,830 | |
Toronto-Dominion Bank
2.665%, 1M LIBOR + 0.210%, 09/17/19 (g) | | | 5,000,000 | | | | 4,995,240 | |
U.S. Bank N.A.
2.764%, 1M LIBOR + 0.260%, 07/23/19 (g) | | | 10,000,000 | | | | 10,000,000 | |
Westpac Banking Corp.
2.850%, FEDEFF PRV + 0.450%, 02/15/19 (g) | | | 11,000,000 | | | | 10,999,931 | |
| | | | | | | | |
| | | | | | | 300,966,309 | |
| | | | | | | | |
|
| Commercial Paper—1.9% | |
Alpine Securities Ltd.
2.529%, 1M LIBOR + 0.180%, 04/03/19 (g) | | | 5,000,000 | | | | 4,998,615 | |
Banco Santander S.A.
2.500%, 01/16/19 | | | 6,955,278 | | | | 6,991,572 | |
2.740%, 02/07/19 | | | 19,859,956 | | | | 19,941,760 | |
HSBC Bank plc
2.842%, 1M LIBOR + 0.320%, 07/30/19 (g) | | | 15,000,000 | | | | 15,000,000 | |
ING Funding LLC
2.707%, 1M LIBOR + 0.320%, 02/08/19 (g) | | | 15,000,000 | | | | 15,001,395 | |
2.725%, 3M LIBOR + 0.110%, 05/10/19 (g) | | | 10,000,000 | | | | 9,998,820 | |
Kells Funding LLC
2.610%, 04/10/19 | | | 9,869,500 | | | | 9,926,180 | |
Sheffield Receivables Co.
2.930%, SOFR + 0.470%, 05/30/19 (g) | | | 15,000,000 | | | | 14,999,760 | |
Toronto-Dominion Bank
2.729%, 1M LIBOR + 0.350%, 11/05/19 (g) | | | 10,000,000 | | | | 9,998,900 | |
Westpac Banking Corp.
2.659%, 3M LIBOR + 0.070%, 08/07/19 (g) | | | 7,500,000 | | | | 7,495,073 | |
| | | | | | | | |
| | | | | | | 114,352,075 | |
| | | | | | | | |
|
| Repurchase Agreements—3.1% | |
Citadel Clearing LLC
Repurchase Agreement dated 12/31/18 at 3.000%, due on 04/02/19 with a maturity value of $22,672,500; collateralized by various Common Stock with an aggregate market value of $24,754,126. | | | 22,500,000 | | | | 22,500,000 | |
Citigroup Global Markets, Inc.
Repurchase Agreement dated 12/31/18 at 2.790%, due on 02/04/19 with a maturity value of $18,048,825; collateralized by U.S. Treasury Obligations at 0.000%, maturing 02/12/19, and various Common Stock with an aggregate market value of $19,589,737. | | | 18,000,000 | | | | 18,000,000 | |
Repurchase Agreement dated 12/31/18 at 2.940%, due on 04/02/19 with a maturity value of $1,007,513; collateralized by U.S. Treasury Obligations with rates ranging from 1.125% - 2.750%, maturity dates ranging from 01/31/19 - 08/15/24, and an aggregate market value of $1,020,000. | | | 1,000,000 | | | | 1,000,000 | |
|
| Repurchase Agreements—(Continued) | |
Citigroup Global Markets, Ltd.
Repurchase Agreement dated 12/31/18 at 2.490%, due on 01/02/19 with a maturity value of $3,400,470; collateralized by U.S. Treasury Obligations with rates ranging from 0.375% - 1.875%, maturity dates ranging from 12/15/20 - 01/15/27, and an aggregate market value of $3,468,003. | | | 3,400,000 | | | | 3,400,000 | |
Repurchase Agreement dated 12/31/18 at 2.490%, due on 01/02/19 with a maturity value of $5,100,706; collateralized by U.S. Treasury Obligations with rates ranging from 1.625% - 2.875%, maturity dates ranging from 06/30/20 - 11/15/46, and an aggregate market value of $5,202,001. | | | 5,100,000 | | | | 5,100,000 | |
Deutsche Bank AG, London
Repurchase Agreement dated 12/31/18 at 2.750%, due on 01/02/19 with a maturity value of $2,000,306; collateralized by U.S. Treasury and Foreign Obligations with rates ranging from 1.000% - 2.590%, maturity dates ranging from 03/31/19 - 12/29/26, and an aggregate market value of $2,040,000.. | | | 2,000,000 | | | | 2,000,000 | |
Deutsche Bank Securities, Inc.
Repurchase Agreement dated 12/31/18 at 3.200%, due on 01/02/19 with a maturity value of $7,840,391; collateralized by U.S. Treasury Obligations at 0.000%, maturity dates ranging from 08/15/30 - 08/15/39, and an aggregate market value of $7,995,778. | | | 7,838,998 | | | | 7,838,998 | |
Merrill Lynch, Pierce, Fenner & Smith, Inc.
Repurchase Agreement dated 12/31/18 at 2.940%, due on 04/02/19 with a maturity value of $11,183,398; collateralized by various Common Stock with an aggregate market value of $12,210,001. | | | 11,100,000 | | | | 11,100,000 | |
Repurchase Agreement dated 12/31/18 at 2.940%, due on 04/02/19 with a maturity value of $12,090,160; collateralized by various Common Stock with an aggregate market value of $13,200,000. | | | 12,000,000 | | | | 12,000,000 | |
NBC Global Finance, Ltd.
Repurchase Agreement dated 12/31/18 at 2.560%, due on 01/02/19 with a maturity value of $40,505,760; collateralized by various Common Stock with an aggregate market value of $45,085,097. | | | 40,500,000 | | | | 40,500,000 | |
Repurchase Agreement dated 12/31/18 at 2.590%, due on 01/07/19 with a maturity value of $20,510,324; collateralized by various Common Stock with an aggregate market value of $22,823,099. | | | 20,500,000 | | | | 20,500,000 | |
Societe Generale
Repurchase Agreement dated 12/31/18 at 2.530%, due on 01/02/19 with a maturity value of $10,001,406; collateralized by U.S. Treasury Obligations with rates ranging from 0.750% - 8.000%, maturity dates ranging from 09/30/19 - 08/15/46, and various Common Stock with an aggregate market value of $10,954,759. | | | 10,000,000 | | | | 10,000,000 | |
Repurchase Agreement dated 12/31/18 at 2.530%, due on 01/02/19 with a maturity value of $10,001,406; collateralized by U.S. Treasury Obligations with rates ranging from 0.750% - 8.000%, maturity dates ranging from 09/30/19 - 08/15/46, and various Common Stock with an aggregate market value of $10,954,759. | | | 10,000,000 | | | | 10,000,000 | |
See accompanying notes to financial statements.
BHFTII-11
Brighthouse Funds Trust II
MetLife Stock Index Portfolio
Schedule of Investments as of December 31, 2018
Securities Lending Reinvestments (f)—(Continued)
| | | | | | | | |
| Security Description | | Principal
Amount* | | | Value | |
|
| Repurchase Agreements—(Continued) | |
Societe Generale
Repurchase Agreement dated 12/31/18 at 2.560%, due on 01/07/19 with a maturity value of $25,012,444; collateralized by U.S. Treasury Obligations with rates ranging from 0.750% - 8.000%, maturity dates ranging from 09/30/19 - 08/15/46, and various Common Stock with an aggregate market value of $27,386,897. | | | 25,000,000 | | | $ | 25,000,000 | |
| | | | | | | | |
| | | | | | | 188,938,998 | |
| | | | | | | | |
|
| Time Deposit—0.1% | |
Royal Bank of Canada
2.420%, 01/02/19 | | | 5,000,000 | | | | 5,000,000 | |
| | | | | | | | |
Total Securities Lending Reinvestments
(Cost $609,299,174) | | | | | | | 609,257,382 | |
| | | | | | | | |
Total Investments—110.2%
(Cost $3,908,248,185) | | | | | | | 6,706,806,334 | |
Other assets and liabilities (net)—(10.2)% | | | | | | | (622,947,343 | ) |
| | | | | | | | |
| Net Assets—100.0% | | | | | | $ | 6,083,858,991 | |
| | | | | | | | |
| | | | |
| * | | Principal amount stated in U.S. dollars unless otherwise noted. |
| (a) | | All or a portion of the security was held on loan. As of December 31, 2018, the market value of securities loaned was $600,389,313 and the collateral received consisted of cash in the amount of $609,063,630 andnon-cash collateral with a value of $410,211. The cash collateral investments are disclosed in the Schedule of Investments and categorized as Securities Lending Reinvestments. Thenon-cash collateral received consists of U.S. government securities that are held in safe-keeping by the lending agent, or a third-party custodian, cannot be sold or repledged by the Portfolio. As such, this collateral is excluded from the Statement of Assets and Liabilities. |
| (b) | | Non-income producing security. |
| (c) | | Affiliated Issuer. (See Note 7 of the Notes to Financial Statements for a summary of transactions in securities of affiliated issuers.) |
| (d) | | All or a portion of the security was pledged as collateral against open futures contracts. As of December 31, 2018, the market value of securities pledged was $20,769,159. |
| (e) | | The rate shown represents current yield to maturity. |
| (f) | | Represents investment of cash collateral received from securities on loan as of December 31, 2018. |
| (g) | | Variable or floating rate security. The stated rate represents the rate at December 31, 2018. Maturity date shown for callable securities reflects the earliest possible call date. For securities based on a published reference index and spread, the index and spread are indicated in the description above. For certain variable rate securities, the coupon rate is determined by the issuer/agent based on current market conditions. For certain asset- and mortgage-backed securities, the coupon rate may fluctuate based on changes of the underlying collateral or prepayments of principal. These securities do not indicate a reference index and spread in their description above. |
Futures Contracts
| | | | | | | | | | | | | | | | | | | | |
Futures Contracts—Long | | Expiration
Date | | | Number of
Contracts | | | Notional
Amount | | | Value/
Unrealized
Depreciation | |
S&P 500 IndexE-Mini Futures | | | 03/15/19 | | | | 210 | | | | USD | | | | 26,304,600 | | | $ | (1,052,405 | ) |
| | | | | | | | | | | | | | | | | | | | |
Glossary of Abbreviations
Currencies
| | | | |
| (USD)— | | United States Dollar |
Index Abbreviations
| | | | |
| (FEDEFF PRV)— | | Effective Federal Funds Rate |
| (LIBOR)— | | London Interbank Offered Rate |
| (SOFR)— | | Secured Overnight Financing Rate |
Other Abbreviations
| | | | |
| (ETF)— | | Exchange-Traded Fund |
See accompanying notes to financial statements.
BHFTII-12
Brighthouse Funds Trust II
MetLife Stock Index Portfolio
Schedule of Investments as of December 31, 2018
Fair Value Hierarchy
Accounting principles generally accepted in the United States of America (“GAAP”) define fair market value as the price that the Portfolio would receive to sell an asset or pay to transfer a liability in an orderly transaction between market participants at the measurement date. It establishes a fair value hierarchy that prioritizes inputs to valuation methods and requires disclosure of the fair value hierarchy, separately for each major category of assets and liabilities, that segregates fair value measurements into three levels. Levels 1, 2 and 3 of the fair value hierarchy are defined as follows:
Level 1 - unadjusted quoted prices in active markets for identical investments
Level 2 - other significant observable inputs (including, but not limited to, quoted prices for similar assets or liabilities in markets that are either active or inactive; inputs other than quoted prices that are observable such as interest rates, yield curves, volatilities, prepayment speeds, loss severities, credit risks, default rates, or other market corroborated inputs)
Level 3 - significant unobservable inputs based on the best information available in the circumstances, to the extent observable inputs are unavailable (including the Portfolio’s own assumptions used in determining the fair value of investments and derivative financial instruments)
The inputs or methodologies used for valuing investments are not necessarily an indication of the risk associated with investing in them. Changes to the inputs or methodologies used may result in transfers between levels. A reconciliation of Level 3 securities, if any, will be disclosed following the fair value hierarchy table. For more information about the Portfolio’s policy regarding the valuation of investments, please refer to the Notes to Financial Statements.
The following table summarizes the fair value hierarchy of the Portfolio’s investments as of December 31, 2018:
| | | | | | | | | | | | | | | | |
| Description | | Level 1 | | | Level 2 | | | Level 3 | | | Total | |
Total Common Stocks* | | $ | 5,988,566,334 | | | $ | — | | | $ | — | | | $ | 5,988,566,334 | |
Total Mutual Fund* | | | 59,231,040 | | | | — | | | | — | | | | 59,231,040 | |
Total Short-Term Investments* | | | — | | | | 49,751,578 | | | | — | | | | 49,751,578 | |
Total Securities Lending Reinvestments* | | | — | | | | 609,257,382 | | | | — | | | | 609,257,382 | |
Total Investments | | $ | 6,047,797,374 | | | $ | 659,008,960 | | | $ | — | | | $ | 6,706,806,334 | |
| | | | | | | | | | | | | | | | | |
Collateral for Securities Loaned (Liability) | | $ | — | | | $ | (609,063,630 | ) | | $ | — | | | $ | (609,063,630 | ) |
| Futures Contracts | |
Futures Contracts (Unrealized Depreciation) | | $ | (1,052,405 | ) | | $ | — | | | $ | — | | | $ | (1,052,405 | ) |
| | | | |
| * | | See Schedule of Investments for additional detailed categorizations. |
See accompanying notes to financial statements.
BHFTII-13
Brighthouse Funds Trust II
MetLife Stock Index Portfolio
Statement of Assets and Liabilities
December 31, 2018
| | | | |
Assets | |
Investments at value (a) (b) | | $ | 6,694,245,124 | |
Affiliated investments at value (c) (d) | | | 12,561,210 | |
Cash | | | 65,406 | |
Receivable for: | |
Investments sold | | | 1,808,822 | |
Fund shares sold | | | 5,966,954 | |
Dividends | | | 6,797,890 | |
Variation margin on futures contracts | | | 201,600 | |
Prepaid expenses | | | 18,370 | |
| | | | |
Total Assets | | | 6,721,665,376 | |
Liabilities | |
Collateral for securities loaned | | | 609,063,630 | |
Payables for: | |
Investments purchased | | | 21,910,648 | |
Fund shares redeemed | | | 4,258,753 | |
Accrued Expenses: | |
Management fees | | | 1,260,599 | |
Distribution and service fees | | | 411,386 | |
Deferred trustees’ fees | | | 130,256 | |
Other expenses | | | 771,113 | |
| | | | |
Total Liabilities | | | 637,806,385 | |
| | | | |
Net Assets | | $ | 6,083,858,991 | |
| | | | |
Net Assets Consist of: | |
Paid in surplus | | $ | 2,737,108,791 | |
Distributable earnings (Accumulated losses) | | | 3,346,750,200 | |
| | | | |
Net Assets | | $ | 6,083,858,991 | |
| | | | |
Net Assets | |
Class A | | $ | 4,117,875,067 | |
Class B | | | 1,779,383,655 | |
Class D | | | 45,116,782 | |
Class E | | | 125,164,730 | |
Class G | | | 16,318,757 | |
Capital Shares Outstanding* | |
Class A | | | 87,152,879 | |
Class B | | | 39,246,804 | |
Class D | | | 957,650 | |
Class E | | | 2,669,623 | |
Class G | | | 360,696 | |
Net Asset Value, Offering Price and Redemption Price Per Share | |
Class A | | $ | 47.25 | |
Class B | | | 45.34 | |
Class D | | | 47.11 | |
Class E | | | 46.88 | |
Class G | | | 45.24 | |
| | | | |
| * | | The Portfolio is authorized to issue an unlimited number of shares. |
| (a) | | Identified cost of investments, excluding affiliated investments, was $3,897,314,701. |
| (b) | | Includes securities loaned at value of $598,154,892. |
| (c) | | Identified cost of affiliated investments was $10,933,484. |
| (d) | | Includes securities loaned at value of $2,234,421. |
Statement of Operations
Year Ended December 31, 2018
| | | | |
Investment Income | |
Dividends (a) | | $ | 146,746,888 | |
Dividends from affiliated investments | | | 500,140 | |
Interest | | | 532,783 | |
Securities lending income | | | 2,624,992 | |
| | | | |
Total investment income | | | 150,404,803 | |
Expenses | |
Management fees | | | 17,343,709 | |
Administration fees | | | 229,169 | |
Custodian and accounting fees | | | 366,561 | |
Distribution and service fees—Class B | | | 5,099,449 | |
Distribution and service fees—Class D | | | 52,861 | |
Distribution and service fees—Class E | | | 218,464 | |
Distribution and service fees—Class G | | | 55,566 | |
Audit and tax services | | | 44,663 | |
Legal | | | 45,317 | |
Trustees’ fees and expenses | | | 33,734 | |
Shareholder reporting | | | 479,762 | |
Insurance | | | 44,099 | |
Miscellaneous | | | 688,401 | |
| | | | |
Total expenses | | | 24,701,755 | |
Less management fee waiver | | | (865,623 | ) |
| | | | |
Net expenses | | | 23,836,132 | |
| | | | |
Net Investment Income | | | 126,568,671 | |
| | | | |
Net Realized and Unrealized Gain (Loss) | |
| Net realized gain (loss) on: | |
Investments | | | 526,168,809 | |
Affiliated investments | | | 586,836 | |
Futures contracts | | | (559,464 | ) |
| | | | |
Net realized gain | | | 526,196,181 | |
| | | | |
| Net change in unrealized depreciation on: | |
Investments | | | (913,501,875 | ) |
Affiliated investments | | | (4,290,498 | ) |
Futures contracts | | | (1,138,295 | ) |
| | | | |
Net change in unrealized depreciation | | | (918,930,668 | ) |
| | | | |
Net realized and unrealized loss | | | (392,734,487 | ) |
| | | | |
Net Decrease in Net Assets From Operations | | $ | (266,165,816 | ) |
| | | | |
| | | | |
| (a) | | Net of foreign withholding taxes of $6,351. |
See accompanying notes to financial statements.
BHFTII-14
Brighthouse Funds Trust II
MetLife Stock Index Portfolio
Statements of Changes in Net Assets
| | | | | | | | |
| | | Year Ended
December 31,
2018 | | | Year Ended
December 31,
2017 | |
Increase (Decrease) in Net Assets: | |
From Operations | |
Net investment income | | $ | 126,568,671 | | | $ | 122,226,194 | |
Net realized gain | | | 526,196,181 | | | | 399,951,192 | |
Net change in unrealized appreciation (depreciation) | | | (918,930,668 | ) | | | 808,122,724 | |
| | | | | | | | |
Increase (decrease) in net assets from operations | | | (266,165,816 | ) | | | 1,330,300,110 | |
| | | | | | | | |
From Distributions to Shareholders (a) | |
Class A | | | (345,323,756 | ) | | | (206,844,489 | ) |
Class B | | | (151,903,972 | ) | | | (92,336,236 | ) |
Class D | | | (3,829,769 | ) | | | (2,710,034 | ) |
Class E | | | (10,642,785 | ) | | | (6,592,358 | ) |
Class G | | | (1,367,706 | ) | | | (781,608 | ) |
| | | | | | | | |
Total distributions | | | (513,067,988 | ) | | | (309,264,725 | ) |
| | | | | | | | |
Decrease in net assets from capital share transactions | | | (251,123,564 | ) | | | (464,951,761 | ) |
| | | | | | | | |
Total increase (decrease) in net assets | | | (1,030,357,368 | ) | | | 556,083,624 | |
|
Net Assets | |
Beginning of period | | | 7,114,216,359 | | | | 6,558,132,735 | |
| | | | | | | | |
End of period | | $ | 6,083,858,991 | | | $ | 7,114,216,359 | (b) |
| | | | | | | | |
Other Information:
Capital Shares
Transactions in capital shares were as follows:
| | | | | | | | | | | | | | | | |
| | | Year Ended
December 31, 2018 | | | Year Ended
December 31, 2017 | |
| | | Shares | | | Value | | | Shares | | | Value | |
Class A | |
Sales | | | 2,439,630 | | | $ | 125,872,646 | | | | 2,565,526 | | | $ | 125,800,863 | |
Reinvestments | | | 6,665,195 | | | | 345,323,756 | | | | 4,295,836 | | | | 206,844,489 | |
Redemptions | | | (11,144,179 | ) | | | (591,671,377 | ) | | | (12,118,957 | ) | | | (599,372,121 | ) |
| | | | | | | | | | | | | | | | |
Net decrease | | | (2,039,354 | ) | | $ | (120,474,975 | ) | | | (5,257,595 | ) | | $ | (266,726,769 | ) |
| | | | | | | | | | | | | | | | |
Class B | |
Sales | | | 2,102,037 | | | $ | 104,947,642 | | | | 1,383,010 | | | $ | 65,105,674 | |
Reinvestments | | | 3,051,506 | | | | 151,903,972 | | | | 1,990,005 | | | | 92,336,236 | |
Redemptions | | | (7,227,146 | ) | | | (369,794,918 | ) | | | (6,861,898 | ) | | | (327,592,006 | ) |
| | | | | | | | | | | | | | | | |
Net decrease | | | (2,073,603 | ) | | $ | (112,943,304 | ) | | | (3,488,883 | ) | | $ | (170,150,096 | ) |
| | | | | | | | | | | | | | | | |
Class D | |
Sales | | | 53,658 | | | $ | 2,925,553 | | | | 291,987 | | | $ | 14,334,939 | |
Reinvestments | | | 74,091 | | | | 3,829,769 | | | | 56,424 | | | | 2,710,034 | |
Redemptions | | | (240,446 | ) | | | (12,910,665 | ) | | | (678,819 | ) | | | (33,434,038 | ) |
| | | | | | | | | | | | | | | | |
Net decrease | | | (112,697 | ) | | $ | (6,155,343 | ) | | | (330,408 | ) | | $ | (16,389,065 | ) |
| | | | | | | | | | | | | | | | |
Class E | |
Sales | | | 51,228 | | | $ | 2,619,302 | | | | 51,868 | | | $ | 2,549,769 | |
Reinvestments | | | 206,857 | | | | 10,642,785 | | | | 137,800 | | | | 6,592,358 | |
Redemptions | | | (460,536 | ) | | | (24,371,905 | ) | | | (471,239 | ) | | | (23,245,491 | ) |
| | | | | | | | | | | | | | | | |
Net decrease | | | (202,451 | ) | | $ | (11,109,818 | ) | | | (281,571 | ) | | $ | (14,103,364 | ) |
| | | | | | | | | | | | | | | | |
Class G | |
Sales | | | 7,719 | | | $ | 389,067 | | | | 83,420 | | | $ | 3,864,519 | |
Reinvestments | | | 27,525 | | | | 1,367,706 | | | | 16,871 | | | | 781,608 | |
Redemptions | | | (42,916 | ) | | | (2,196,897 | ) | | | (46,868 | ) | | | (2,228,594 | ) |
| | | | | | | | | | | | | | | | |
Net increase (decrease) | | | (7,672 | ) | | $ | (440,124 | ) | | | 53,423 | | | $ | 2,417,533 | |
| | | | | | | | | | | | | | | | |
Decrease derived from capital shares transactions | | | | | | $ | (251,123,564 | ) | | | | | | $ | (464,951,761 | ) |
| | | | | | | | | | | | | | | | |
See accompanying notes to financial statements.
BHFTII-15
Brighthouse Funds Trust II
MetLife Stock Index Portfolio
Statements of Changes in Net Assets
| | | | |
| (a) | | Distributions from net investment income and realized gains are no longer required to be separately disclosed. The presentation for the year ended December 31, 2018 has been adjusted for this change (See Note 10). At December 31, 2017 the distributions were as follows. |
| | | | | | | | |
| | | Distributions from net
investment income: | | | Distributions from realized
capital gains: | |
Class A | | $ | (80,429,505 | ) | | $ | (126,414,984 | ) |
Class B | | | (32,596,779 | ) | | | (59,739,457 | ) |
Class D | | | (1,016,112 | ) | | | (1,693,922 | ) |
Class E | | | (2,425,322 | ) | | | (4,167,036 | ) |
Class G | | | (270,023 | ) | | | (511,585 | ) |
| | | | |
| (b) | | As part of the update in (a), it is also no longer required to disclose the Undistributed net investment income (Accumulated losses) which was $120,116,513 as of December 31, 2017. |
See accompanying notes to financial statements.
BHFTII-16
Brighthouse Funds Trust II
MetLife Stock Index Portfolio
Financial Highlights
| | | | | | | | | | | | | | | | | | | | |
| Selected per share data | |
| | | Class A | |
| | | Year Ended December 31, | |
| | | 2018 | | | 2017 | | | 2016 | | | 2015 | | | 2014 | |
Net Asset Value, Beginning of Period | | $ | 53.40 | | | $ | 46.03 | | | $ | 44.04 | | | $ | 46.21 | | | $ | 42.58 | |
| | | | | | | | | | | | | | | | | | | | |
Income (Loss) from Investment Operations | |
Net investment income (a) | | | 1.01 | | | | 0.92 | | | | 0.89 | | | | 0.85 | | | | 0.79 | |
Net realized and unrealized gain (loss) | | | (3.11 | ) | | | 8.74 | | | | 3.98 | | | | (0.26 | ) | | | 4.66 | |
| | | | | | | | | | | | | | | | | | | | |
Total income (loss) from investment operations | | | (2.10 | ) | | | 9.66 | | | | 4.87 | | | | 0.59 | | | | 5.45 | |
| | | | | | | | | | | | | | | | | | | | |
Less Distributions | |
Distributions from net investment income | | | (0.98 | ) | | | (0.89 | ) | | | (0.90 | ) | | | (0.81 | ) | | | (0.74 | ) |
Distributions from net realized capital gains | | | (3.07 | ) | | | (1.40 | ) | | | (1.98 | ) | | | (1.95 | ) | | | (1.08 | ) |
| | | | | | | | | | | | | | | | | | | | |
Total distributions | | | (4.05 | ) | | | (2.29 | ) | | | (2.88 | ) | | | (2.76 | ) | | | (1.82 | ) |
| | | | | | | | | | | | | | | | | | | | |
Net Asset Value, End of Period | | $ | 47.25 | | | $ | 53.40 | | | $ | 46.03 | | | $ | 44.04 | | | $ | 46.21 | |
| | | | | | | | | | | | | | | | | | | | |
Total Return (%) (b) | | | (4.60 | ) | | | 21.54 | | | | 11.67 | | | | 1.17 | | | | 13.36 | |
|
Ratios/Supplemental Data | |
Gross ratio of expenses to average net assets (%) | | | 0.28 | | | | 0.28 | | | | 0.27 | | | | 0.27 | | | | 0.27 | |
Net ratio of expenses to average net assets (%) (c) | | | 0.27 | | | | 0.26 | | | | 0.26 | | | | 0.26 | | | | 0.26 | |
Ratio of net investment income to average net assets (%) | | | 1.90 | | | | 1.86 | | | | 2.02 | | | | 1.88 | | | | 1.81 | |
Portfolio turnover rate (%) | | | 14 | | | | 11 | | | | 8 | | | | 9 | | | | 12 | |
Net assets, end of period (in millions) | | $ | 4,117.9 | | | $ | 4,762.6 | | | $ | 4,347.5 | | | $ | 4,108.5 | | | $ | 4,295.4 | |
| |
| | | Class B | |
| | | Year Ended December 31, | |
| | | 2018 | | | 2017 | | | 2016 | | | 2015 | | | 2014 | |
Net Asset Value, Beginning of Period | | $ | 51.39 | | | $ | 44.37 | | | $ | 42.55 | | | $ | 44.73 | | | $ | 41.27 | |
| | | | | | | | | | | | | | | | | | | | |
Income (Loss) from Investment Operations | |
Net investment income (a) | | | 0.84 | | | | 0.77 | | | | 0.75 | | | | 0.71 | | | | 0.66 | |
Net realized and unrealized gain (loss) | | | (2.97 | ) | | | 8.42 | | | | 3.84 | | | | (0.25 | ) | | | 4.52 | |
| | | | | | | | | | | | | | | | | | | | |
Total income (loss) from investment operations | | | (2.13 | ) | | | 9.19 | | | | 4.59 | | | | 0.46 | | | | 5.18 | |
| | | | | | | | | | | | | | | | | | | | |
Less Distributions | |
Distributions from net investment income | | | (0.85 | ) | | | (0.77 | ) | | | (0.79 | ) | | | (0.69 | ) | | | (0.64 | ) |
Distributions from net realized capital gains | | | (3.07 | ) | | | (1.40 | ) | | | (1.98 | ) | | | (1.95 | ) | | | (1.08 | ) |
| | | | | | | | | | | | | | | | | | | | |
Total distributions | | | (3.92 | ) | | | (2.17 | ) | | | (2.77 | ) | | | (2.64 | ) | | | (1.72 | ) |
| | | | | | | | | | | | | | | | | | | | |
Net Asset Value, End of Period | | $ | 45.34 | | | $ | 51.39 | | | $ | 44.37 | | | $ | 42.55 | | | $ | 44.73 | |
| | | | | | | | | | | | | | | | | | | | |
Total Return (%) (b) | | | (4.83 | ) | | | 21.23 | | | | 11.38 | | | | 0.91 | | | | 13.10 | |
|
Ratios/Supplemental Data | |
Gross ratio of expenses to average net assets (%) | | | 0.53 | | | | 0.53 | | | | 0.52 | | | | 0.52 | | | | 0.52 | |
Net ratio of expenses to average net assets (%) (c) | | | 0.52 | | | | 0.51 | | | | 0.51 | | | | 0.51 | | | | 0.51 | |
Ratio of net investment income to average net assets (%) | | | 1.65 | | | | 1.61 | | | | 1.77 | | | | 1.63 | | | | 1.56 | |
Portfolio turnover rate (%) | | | 14 | | | | 11 | | | | 8 | | | | 9 | | | | 12 | |
Net assets, end of period (in millions) | | $ | 1,779.4 | | | $ | 2,123.5 | | | $ | 1,988.2 | | | $ | 1,892.0 | | | $ | 2,025.6 | |
See accompanying notes to financial statements.
BHFTII-17
Brighthouse Funds Trust II
MetLife Stock Index Portfolio
Financial Highlights
| | | | | | | | | | | | | | | | | | | | |
| Selected per share data | |
| | | Class D | |
| | | Year Ended December 31, | |
| | | 2018 | | | 2017 | | | 2016 | | | 2015 | | | 2014 | |
Net Asset Value, Beginning of Period | | $ | 53.24 | | | $ | 45.90 | | | $ | 43.93 | | | $ | 46.10 | | | $ | 42.46 | |
| | | | | | | | | | | | | | | | | | | | |
Income (Loss) from Investment Operations | |
Net investment income (a) | | | 0.95 | | | | 0.87 | | | | 0.84 | | | | 0.80 | | | | 0.73 | |
Net realized and unrealized gain (loss) | | | (3.09 | ) | | | 8.71 | | | | 3.97 | | | | (0.26 | ) | | | 4.67 | |
| | | | | | | | | | | | | | | | | | | | |
Total income (loss) from investment operations | | | (2.14 | ) | | | 9.58 | | | | 4.81 | | | | 0.54 | | | | 5.40 | |
| | | | | | | | | | | | | | | | | | | | |
Less Distributions | |
Distributions from net investment income | | | (0.92 | ) | | | (0.84 | ) | | | (0.86 | ) | | | (0.76 | ) | | | (0.68 | ) |
Distributions from net realized capital gains | | | (3.07 | ) | | | (1.40 | ) | | | (1.98 | ) | | | (1.95 | ) | | | (1.08 | ) |
| | | | | | | | | | | | | | | | | | | | |
Total distributions | | | (3.99 | ) | | | (2.24 | ) | | | (2.84 | ) | | | (2.71 | ) | | | (1.76 | ) |
| | | | | | | | | | | | | | | | | | | | |
Net Asset Value, End of Period | | $ | 47.11 | | | $ | 53.24 | | | $ | 45.90 | | | $ | 43.93 | | | $ | 46.10 | |
| | | | | | | | | | | | | | | | | | | | |
Total Return (%) (b) | | | (4.69 | ) | | | 21.41 | | | | 11.54 | | | | 1.07 | | | | 13.26 | |
| | | | | |
Ratios/Supplemental Data | | | | | | | | | | | | | | | | | | | | |
Gross ratio of expenses to average net assets (%) | | | 0.38 | | | | 0.38 | | | | 0.37 | | | | 0.37 | | | | 0.37 | |
Net ratio of expenses to average net assets (%) (c) | | | 0.37 | | | | 0.36 | | | | 0.36 | | | | 0.36 | | | | 0.36 | |
Ratio of net investment income to average net assets (%) | | | 1.80 | | | | 1.77 | | | | 1.92 | | | | 1.76 | | | | 1.70 | |
Portfolio turnover rate (%) | | | 14 | | | | 11 | | | | 8 | | | | 9 | | | | 12 | |
Net assets, end of period (in millions) | | $ | 45.1 | | | $ | 57.0 | | | $ | 64.3 | | | $ | 84.1 | | | $ | 143.5 | |
| |
| | | Class E | |
| | | Year Ended December 31, | |
| | | 2018 | | | 2017 | | | 2016 | | | 2015 | | | 2014 | |
Net Asset Value, Beginning of Period | | $ | 53.01 | | | $ | 45.71 | | | $ | 43.75 | | | $ | 45.92 | | | $ | 42.32 | |
| | | | | | | | | | | | | | | | | | | | |
Income (Loss) from Investment Operations | |
Net investment income (a) | | | 0.92 | | | | 0.84 | | | | 0.81 | | | | 0.78 | | | | 0.72 | |
Net realized and unrealized gain (loss) | | | (3.08 | ) | | | 8.68 | | | | 3.97 | | | | (0.26 | ) | | | 4.64 | |
| | | | | | | | | | | | | | | | | | | | |
Total income (loss) from investment operations | | | (2.16 | ) | | | 9.52 | | | | 4.78 | | | | 0.52 | | | | 5.36 | |
| | | | | | | | | | | | | | | | | | | | |
Less Distributions | |
Distributions from net investment income | | | (0.90 | ) | | | (0.82 | ) | | | (0.84 | ) | | | (0.74 | ) | | | (0.68 | ) |
Distributions from net realized capital gains | | | (3.07 | ) | | | (1.40 | ) | | | (1.98 | ) | | | (1.95 | ) | | | (1.08 | ) |
| | | | | | | | | | | | | | | | | | | | |
Total distributions | | | (3.97 | ) | | | (2.22 | ) | | | (2.82 | ) | | | (2.69 | ) | | | (1.76 | ) |
| | | | | | | | | | | | | | | | | | | | |
Net Asset Value, End of Period | | $ | 46.88 | | | $ | 53.01 | | | $ | 45.71 | | | $ | 43.75 | | | $ | 45.92 | |
| | | | | | | | | | | | | | | | | | | | |
Total Return (%) (b) | | | (4.72 | ) | | | 21.35 | | | | 11.50 | | | | 1.02 | | | | 13.20 | |
| | | | | |
Ratios/Supplemental Data | | | | | | | | | | | | | | | | | | | | |
Gross ratio of expenses to average net assets (%) | | | 0.43 | | | | 0.43 | | | | 0.42 | | | | 0.42 | | | | 0.42 | |
Net ratio of expenses to average net assets (%) (c) | | | 0.42 | | | | 0.41 | | | | 0.41 | | | | 0.41 | | | | 0.41 | |
Ratio of net investment income to average net assets (%) | | | 1.75 | | | | 1.71 | | | | 1.87 | | | | 1.73 | | | | 1.66 | |
Portfolio turnover rate (%) | | | 14 | | | | 11 | | | | 8 | | | | 9 | | | | 12 | |
Net assets, end of period (in millions) | | $ | 125.2 | | | $ | 152.3 | | | $ | 144.2 | | | $ | 143.5 | | | $ | 161.4 | |
Please see following page for Financial Highlights footnote legend.
See accompanying notes to financial statements.
BHFTII-18
Brighthouse Funds Trust II
MetLife Stock Index Portfolio
Financial Highlights
| | | | | | | | | | | | | | | | | | | | |
| Selected per share data | |
| | | Class G | |
| | | Year Ended December 31, | |
| | | 2018 | | | 2017 | | | 2016 | | | 2015 | | | 2014(d) | |
Net Asset Value, Beginning of Period | | $ | 51.30 | | | $ | 44.29 | | | $ | 42.48 | | | $ | 44.64 | | | $ | 44.10 | |
| | | | | | | | | | | | | | | | | | | | |
Income (Loss) from Investment Operations | |
Net investment income (a) | | | 0.82 | | | | 0.75 | | | | 0.73 | | | | 0.70 | | | | 0.09 | |
Net realized and unrealized gain (loss) | | | (2.98 | ) | | | 8.40 | | | | 3.83 | | | | (0.24 | ) | | | 0.45 | |
| | | | | | | | | | | | | | | | | | | | |
Total income (loss) from investment operations | | | (2.16 | ) | | | 9.15 | | | | 4.56 | | | | 0.46 | | | | 0.54 | |
| | | | | | | | | | | | | | | | | | | | |
Less Distributions | |
Distributions from net investment income | | | (0.83 | ) | | | (0.74 | ) | | | (0.77 | ) | | | (0.67 | ) | | | 0.00 | |
Distributions from net realized capital gains | | | (3.07 | ) | | | (1.40 | ) | | | (1.98 | ) | | | (1.95 | ) | | | 0.00 | |
| | | | | | | | | | | | | | | | | | | | |
Total distributions | | | (3.90 | ) | | | (2.14 | ) | | | (2.75 | ) | | | (2.62 | ) | | | 0.00 | |
| | | | | | | | | | | | | | | | | | | | |
Net Asset Value, End of Period | | $ | 45.24 | | | $ | 51.30 | | | $ | 44.29 | | | $ | 42.48 | | | $ | 44.64 | |
| | | | | | | | | | | | | | | | | | | | |
Total Return (%) (b) | | | (4.89 | ) | | | 21.18 | | | | 11.32 | | | | 0.91 | | | | 1.22 | (e) |
| | | | | |
Ratios/Supplemental Data | | | | | | | | | | | | | | | | | | | | |
Gross ratio of expenses to average net assets (%) | | | 0.58 | | | | 0.58 | | | | 0.57 | | | | 0.57 | | | | 0.58 | (f) |
Net ratio of expenses to average net assets (%) (c) | | | 0.57 | | | | 0.56 | | | | 0.56 | | | | 0.56 | | | | 0.57 | (f) |
Ratio of net investment income to average net assets (%) | | | 1.60 | | | | 1.57 | | | | 1.72 | | | | 1.64 | | | | 1.54 | (f) |
Portfolio turnover rate (%) | | | 14 | | | | 11 | | | | 8 | | | | 9 | | | | 12 | |
Net assets, end of period (in millions) | | $ | 16.3 | | | $ | 18.9 | | | $ | 14.0 | | | $ | 8.5 | | | $ | 0.4 | |
| | | | |
| (a) | | Per share amounts based on average shares outstanding during the period. |
| (b) | | Total return does not reflect any insurance, sales, separate account or administrative charges of variable annuity or life insurance contracts or any additional expenses that contract owners may bear under their variable contracts. If these charges were included, the returns would be lower. |
| (c) | | Includes the effects of management fee waivers (see Note 6 of the Notes to Financial Statements). |
| (d) | | Commencement of operations was November 12, 2014. |
| (e) | | Periods less than one year are not computed on an annualized basis. |
| (f) | | Computed on an annualized basis. |
See accompanying notes to financial statements.
BHFTII-19
Brighthouse Funds Trust II
MetLife Stock Index Portfolio
Notes to Financial Statements—December 31, 2018
1. Organization
Brighthouse Funds Trust II (the “Trust”) is organized as a Delaware statutory trust and registered under the Investment Company Act of 1940, as amended (the “1940 Act”), as anopen-end management investment company. The Trust, which is managed by Brighthouse Investment Advisers, LLC (“Brighthouse Investment Advisers” or the “Adviser”), currently offers twenty-nine series, each of which operates as a distinct investment vehicle of the Trust. The series included in this report is MetLife Stock Index Portfolio (the “Portfolio”), which is diversified. Shares in the Portfolio are not offered directly to the general public and are currently available only to separate accounts established by life insurance companies affiliated with the Adviser and Metropolitan Life Insurance Company (the “Insurance Companies”).
The Portfolio has registered and offers five classes of shares: Class A, B, D, E and G shares. Shares of each Class of the Portfolio represent an equal pro rata interest in the Portfolio and generally give the shareholder the same voting, dividend, liquidation, and other rights. Investment income, realized and unrealized capital gains and losses, the common expenses of the Portfolio, and certain Portfolio-level expense reductions, if any, are allocated on a pro rata basis to each Class based on the relative net assets of each Class to the net assets of the Portfolio. Each Class of shares differs in its respective distribution plan and such distribution expenses are allocated to the corresponding Class of shares.
2. Significant Accounting Policies
The preparation of financial statements in conformity with accounting principles generally accepted in the United States of America (“GAAP”) requires management to make estimates and assumptions that affect the reported amounts of assets and liabilities and disclosure of contingent assets and liabilities as of the date of the financial statements and the reported amounts of income and expenses during the reporting period. Actual results could differ from those estimates. In the preparation of these financial statements, management has evaluated events and transactions subsequent to December 31, 2018 through the date the financial statements were issued.
The Portfolio is an investment company and follows the accounting and reporting guidance of the Financial Accounting Standards Board (“FASB”) Accounting Standards Codification Topic946- Financial Services- Investment Companies. The following is a summary of significant accounting policies consistently followed by the Portfolio in the preparation of its financial statements.
Investment Valuation and Fair Value Measurements - The Portfolio values its portfolio investments for purposes of calculating its net asset value (“NAV”) using procedures approved by the Board of Trustees of the Trust (the “Board” or “Trustees”). Those procedures allow for a variety of methodologies to be used to value the Portfolio’s investments. The specific methodologies used for a particular investment may vary based on the market data available for a specific investment at the time the Portfolio calculates its NAV or based on other considerations. The procedures also permit a level of judgment to be used in the valuation process. The Portfolio follows the accounting and reporting guidance of FASB Accounting Standards Codification Topic820- Fair Value Measurement.
Domestic and foreign equity securities, such as common stock, exchange-traded funds, rights, warrants, and preferred stock, that are traded on a securities exchange on a valuation date are generally valued at their last quoted sale price or official closing price on the primary exchange for such security, or, if no sales occurred on that day, at the last reported bid price. Equity securities tradedover-the-counter (“OTC”) are generally valued at the last reported bid price. In the event of a major exchange closing during the trading day, the Adviser may use other market information obtained from quotation reporting systems, established market makers, or pricing services in valuing the securities. Valuation adjustments may be applied to certain foreign equity securities that are traded solely on foreign exchanges that close before the time as of which the Portfolio determines its NAV to account for the market movement between the close of the foreign exchanges and the time as of which the Portfolio determines its NAV. The Portfolio may use a systematic fair valuation model provided by a pricing service to value securities principally traded in these foreign markets in order to adjust for possible market movements or other changes that may occur between the close of the foreign exchanges and the time as of which the Portfolio determines its NAV. Foreign equity securities valued using these valuation adjustments are generally categorized as Level 2 within the fair value hierarchy. Equity securities that are actively traded, and have no valuation adjustments applied, are categorized as Level 1 within the fair value hierarchy. Other equity securities traded on inactive markets, or valued in reference to similar instruments traded on active markets, are generally categorized as Level 2 within the fair value hierarchy.
Investments in registeredopen-end management investment companies are valued at reported NAV per share on the valuation date and are categorized as Level 1 within the fair value hierarchy.
Debt securities, including corporate, convertible and municipal bonds and notes; obligations of the U.S. Treasury and U.S. government agencies; foreign sovereign issues; andnon-U.S. bonds, are generally valued on the basis of evaluated or composite bid quotations obtained from independent pricing services and/or brokers and dealers selected by the Adviser (each a “pricing service”), pursuant to the authorization of and subject to general oversight by the Board. Such pricing services may use matrix pricing, which considers observable inputs including, among other things, issuer details, maturity dates, interest rates, yield curves, rates of prepayment, credit risks/spreads, default rates, reported trades, broker-dealer quotes and quoted prices for similar assets. Short-term obligations with a
BHFTII-20
Brighthouse Funds Trust II
MetLife Stock Index Portfolio
Notes to Financial Statements—December 31, 2018—(Continued)
remaining maturity of sixty days or less may be valued at amortized cost in the absence of market quotes, so long as the amortized cost value of such short-term debt instrument is approximately the same as the fair value of the instrument as determined without the use of amortized cost valuation. Floating rate loans are generally valued on the basis of an evaluated or composite average of aggregate bid and ask quotations supplied by brokers or dealers, as obtained from the pricing service. Securities that use similar valuation techniques and inputs as described above are generally categorized as Level 2 within the fair value hierarchy.
Options, whether on securities, indices, futures contracts, or otherwise, traded on exchanges are valued at the last sale price available as of the close of business on a valuation day or, if there is no such price available, at the last reported bid price. These types of options are categorized as Level 1 within the fair value hierarchy. Futures contracts that are traded on commodity exchanges are valued at their settlement prices established by the exchanges on which they are traded as of the close of such exchanges and are categorized as Level 1 within the fair value hierarchy.
If no current market value quotation or other observable inputs are readily available or market value quotations are deemed to be unreliable for an investment, the fair value of the investment will be determined in accordance with procedures approved by, and under the general supervision of, the Board. In such a circumstance, the Board will be assisted in its responsibility to determine the fair value of an investment by the Valuation Committee (“Committee”) of Brighthouse Investment Advisers. The Committee provides general pricing oversight and fair value pricing determinations related to portfolio securities and meets on a regular basis to review reports relating to the valuation of the securities in the Portfolio. The Board has delegated to State Street Bank and Trust Company, the Trust’s custodian (“Custodian”), the responsibility for calculating the NAVs of the Trust’s Portfolios. The Committee is responsible for overseeing the calculation of the NAVs of the Portfolios by the custodian. The Committee also periodically reviews pricing services, including the pricing services providing fair value pricing for the Portfolio’s foreign securities, and is responsible for overseeing the correction of pricing errors and addressing other pricing issues that arise in the ordinary course of business, such as making real-time fair value determinations, as necessary.
No single standard for determining the fair value of an investment can be set forth because fair value depends upon the facts and circumstances with respect to each investment. Information relating to any relevant factors may be obtained by the Committee from any appropriate source, including the subadviser of the Portfolio, the custodian, a pricing service, market maker and/or broker for such security or the issuer. Appropriate methodologies for determining fair value under particular circumstances may include: matrix pricing, a discounted cash flow analysis, comparisons of securities with comparable characteristics, value based on multiples of earnings, discount from market price of similar marketable securities, or a combination of these and other methods.
Investment Transactions and Related Investment Income - Portfolio security transactions are recorded on the trade date. Dividend income is recorded on theex-dividend date or, for certain foreign securities, when notified. Interest income, which includes amortization of premium and accretion of discount on debt securities, is recorded on the accrual basis. Realized gains and losses on investments are determined on the identified cost basis, which is the same basis used for federal income tax purposes. Foreign income and foreign capital gains on some foreign securities may be subject to foreign taxes, which are accrued as applicable. These foreign taxes have been provided for in accordance with the Portfolio’s understanding of the applicable countries’ tax rules and rates.
Foreign Currency Translation -The books and records of the Portfolio are maintained in U.S. dollars. The values of securities, currencies, and other assets and liabilities denominated in currencies other than the U.S. dollar are translated into U.S. dollars based upon foreign exchange rates prevailing at the end of the period. Purchases and sales of investment securities, income, and expenses are translated on the respective dates of such transactions. Because the values of investment securities are translated at the foreign exchange rates prevailing at the end of the period, that portion of the results of operations arising from changes in exchange rates and that portion of the results of operations reflecting fluctuations arising from changes in market prices of the investment securities are not separated. Such fluctuations are included in the net realized and unrealized gain or loss on investments.
Net realized foreign exchange gains or losses arise from activity in forward foreign currency exchange contracts, sales of foreign currency, currency gains or losses realized between the trade and settlement dates on securities transactions, and the difference between the amounts of dividends, interest, and foreign withholding taxes recorded by the Portfolio and the U.S. dollar-equivalent of the amounts actually received or paid by the Portfolio. Net unrealized foreign exchange gains and losses arise from changes in the value of assets and liabilities, other than investment securities, resulting from changes in foreign exchange rates.
Dividends and Distributions to Shareholders -The Portfolio records dividends and distributions on theex-dividend date. Net realized gains from securities transactions (if any) are generally distributed annually to shareholders. The timing and characterization of certain income and capital gains distributions are determined in accordance with federal tax regulations that may differ from GAAP. Permanent book and tax basis differences relating to shareholder distributions will result in reclassification between distributable earnings (accumulated losses) andpaid-in surplus.Book-tax differences are primarily due to adjustments to prior period accumulated balances. These adjustments have no impact on net assets or the results of operations.
BHFTII-21
Brighthouse Funds Trust II
MetLife Stock Index Portfolio
Notes to Financial Statements—December 31, 2018—(Continued)
Income Taxes -It is the Portfolio’s policy to comply with the requirements of the Internal Revenue Code of 1986, as amended, and regulations thereunder, applicable to regulated investment companies, and to distribute, with respect to each taxable year, all of its taxable income to shareholders. Therefore, no federal income tax provision is required. The Portfolio files U.S. federal tax returns. No income tax returns are currently under examination. The Portfolio’s federal tax returns for the prior three fiscal years remain subject to examination by the Internal Revenue Service. As of December 31, 2018, the Portfolio had no uncertain tax positions that would require financial statement recognition, or derecognition or disclosure.
Repurchase Agreements -The Portfolio may enter into repurchase agreements, under the terms of a Master Repurchase Agreement (“MRA”), with selected commercial banks and broker-dealers, under which the Portfolio acquires securities as collateral and agrees to resell the securities at an agreed-upon time and at an agreed-upon price. The Portfolio, through the Custodian or a subcustodian, under atri-party repurchase agreement, receives delivery of the underlying securities collateralizing any repurchase agreements. It is the Portfolio’s policy that the market value of the collateral be equal to at least 100% of the repurchase price in the case of a repurchase agreement ofone-day duration and equal to at least 102% of the repurchase price in the case of all other repurchase agreements. In the event of default or failure by a party to perform an obligation in connection with any repurchase transaction, the MRA gives thenon-defaulting party the right toset-off claims and to apply property held by it in connection with any repurchase transaction against obligations owed to it.
At December 31, 2018, the Portfolio invested cash collateral for loans of portfolio securities in repurchase agreements with a gross value of $188,938,998. The combined value of all repurchase agreements is included as part of investments at value on the Statement of Assets and Liabilities. The value of the related collateral exceeded the value of the repurchase agreements at December 31, 2018.
Securities Lending - The Portfolio may lend its portfolio securities to certain qualified brokers who borrow securities in order to complete certain securities transactions. By lending its portfolio securities, the Portfolio attempts to increase its net investment income through the receipt of income on collateral held from securities on loan. Any gain or loss in the market price of the loaned securities that might occur and any interest earned or dividends declared during the term of the loan would accrue to the account of the Portfolio.
The Trust has entered into aNon-Custodial Securities Lending Agreement with JPMorgan Chase Bank, N.A. (the “Lending Agent”). Under the agreement, the Lending Agent is authorized to loan portfolio securities on the Portfolio’s behalf. In exchange, the Portfolio receives either cash or U.S. government securities as collateral against the loaned securities. The Portfolio receives collateral equal to at least 102% of the market value for loans secured by government securities or cash in the same currency as the loaned shares and 105% for all other loaned securities at each loan’s inception. Collateral representing at least 100% of the market value of the loaned securities is maintained for the duration of the loan. Any cash collateral received by the Portfolio is generally invested by the Lending Agent in short-term investments, which may include certificates of deposit, commercial paper, repurchase agreements, time deposits, master demand notes and money market funds. The market value of investments made with cash collateral received are disclosed in the Schedule of Investments and the valuation techniques are described in Note 2. If the market value of the collateral at the close of trading on a business day is less than 100% of the market value of the loaned securities at the close of trading on that day, the borrower is required to deliver, by the close of business on the following business day, an additional amount of collateral, so that the total amount of posted collateral is equal to at least 100% of the market value of all the loaned securities as of such preceding day. A portion of the income earned on the collateral is rebated to the borrower of the securities and the remainder is split between the Lending Agent and the Portfolio. On loans collateralized by U.S. government securities, a fee is received from the borrower and is allocated between the Portfolio and the Lending Agent.
Income received by the Portfolio in securities lending transactions during the year ended December 31, 2018 is reflected as securities lending income on the Statement of Operations. The values of any securities loaned by the Portfolio and the related collateral at December 31, 2018 are disclosed in the footnotes to the Schedule of Investments. The value of the related collateral received by the Portfolio exceeded the value of the securities out on loan at December 31, 2018.
The risks associated with lending portfolio securities include, but are not limited to, possible delays in receiving additional collateral or in the recovery of the loaned securities, possible loss of rights in the collateral should the borrower fail financially, as well as risk of loss in the value of the collateral or the value of the investments made with the collateral. The Lending Agent shall indemnify the Portfolio in the case of default of any securities borrower, subject to the terms of theNon-Custodial Securities Lending Agreement.
BHFTII-22
Brighthouse Funds Trust II
MetLife Stock Index Portfolio
Notes to Financial Statements—December 31, 2018—(Continued)
The following table provides a breakdown of transactions accounted for as secured borrowings, the gross obligations by the type of collateral pledged, and the remaining contractual maturities of those transactions.
| | | | | | | | | | | | | | | | | | | | |
| | | Remaining Contractual Maturity of the Agreements
As of December 31, 2018 | |
| | | Overnight and
Continuous | | | Up to
30 Days | | | 31 - 90
Days | | | Greater than
90 days | | | Total | |
| Securities Lending Transactions | |
Common Stocks | | $ | (568,218,416 | ) | | $ | — | | | $ | — | | | $ | — | | | $ | (568,218,416 | ) |
Mutual Funds | | | (40,845,214 | ) | | | — | | | | — | | | | — | | | | (40,845,214 | ) |
Total | | $ | (609,063,630 | ) | | $ | — | | | $ | — | | | $ | — | | | $ | (609,063,630 | ) |
Total Borrowings | | $ | (609,063,630 | ) | | $ | — | | | $ | — | | | $ | — | | | $ | (609,063,630 | ) |
| Gross amount of recognized liabilities for securities lending transactions | | | $ | (609,063,630 | ) |
| | | | | | | | | | | | | | | | | | | | |
3. Investments in Derivative Instruments
Futures Contracts -The Portfolio may buy and sell futures contracts as a hedge, to maintain investment exposure to a target asset class or to enhance return. The Portfolio may be subject to fluctuations in equity prices, interest rates, commodity prices, and foreign currency exchange rates in the normal course of pursuing its investment objective. Futures contracts are standardized agreements to buy or sell a security, or deliver a final cash settlement price in connection with an index, interest rate, currency, or other asset. The Portfolio must deposit an amount (“initial margin”) equal to a certain percentage of the face value of the futures contract. The initial margin may be in the form of cash or securities, which is returned when the Portfolio’s obligations under the contract have been satisfied. If cash is deposited as the initial margin, it is shown as cash collateral on the Statement of Assets and Liabilities. Futures contracts aremarked-to-market daily and subsequent payments (“variation margin”) are made or received by the Portfolio depending on whether unrealized gains or losses are incurred. These amounts are reflected as receivables or payables on the Statement of Assets and Liabilities and as a component of net change in unrealized appreciation/depreciation on the Statement of Operations. When the contract is closed or expires, the Portfolio records a realized gain or loss equal to the difference between the value of the contract at the time it was opened and the value at the time it was closed. Risks of entering into futures contracts (and related options) include the possibility that the market for these instruments may be illiquid and that a change in the value of the contract or option may not correlate perfectly with changes in the value of the underlying instrument. If futures contracts areexchange-traded, the exchange’s clearinghouse, as counterparty to all exchange-traded futures, guarantees the futures contracts against default. For OTC futures, the Portfolio’s ability to terminate the positions may be more limited than in the case of exchange-traded positions and may also involve the risk that securities dealers participating in such transactions would fail to meet their obligations to the Portfolio.
The following table summarizes the fair value of derivatives held by the Portfolio at December 31, 2018 by category of risk exposure:
| | | | | | |
| | | Liability Derivatives | |
Risk Exposure | | Statement of Assets &
Liabilities Location | | Fair Value | |
Equity | | Unrealized depreciation on futures contracts (a) | | $ | 1,052,405 | |
| | | | | | |
| | | | |
| (a) | | Includes cumulative appreciation/depreciation of futures contracts as reported in the Schedule of Investments. Only the current day’s variation margin is reported within the Statement of Assets and Liabilities. |
The following tables summarize the effect of derivative instruments on the Statement of Operations, classified by derivative type and category of risk exposure, for the year ended December 31, 2018:
| | | | |
Statement of Operations Location—Net Realized Gain (Loss) | | Equity | |
Futures contracts | | $ | (559,464 | ) |
| | | | |
| |
Statement of Operations Location—Net Change in Unrealized Appreciation (Depreciation) | | Equity | |
Futures contracts | | $ | (1,138,295 | ) |
| | | | |
For the year ended December 31, 2018, the average notional par or face amount outstanding for each derivative type was as follows:
| | | | |
Derivative Description | | Average
Notional Par or
Face Amount‡ | |
Futures contracts long | | $ | 11,333 | |
| | | | |
| ‡ | | Averages are based on activity levels during the period for which the amounts are outstanding. |
BHFTII-23
Brighthouse Funds Trust II
MetLife Stock Index Portfolio
Notes to Financial Statements—December 31, 2018—(Continued)
4. Certain Risks
In the normal course of business, the Portfolio invests in securities and enters into transactions where risks exist. Those risks include:
Market Risk:The value of securities held by the Portfolio may decline in response to certain events, including those directly involving the issuers whose securities are owned by the Portfolio; conditions affecting the general economy; overall market changes; local, regional or global political, social or economic instability; and currency, interest rate, and price fluctuations.
Credit and Counterparty Risk: The Portfolio may be exposed to counterparty risk, or the risk that an entity with which the Portfolio has unsettled or open transactions may default. The potential loss could exceed the value of the financial assets and liabilities recorded in the financial statements. Financial assets that potentially expose the Portfolio to credit and counterparty risk consist principally of cash due from counterparties and investments. The Portfolio manages counterparty risk by entering into agreements only with counterparties that it believes have the financial resources to honor their obligations and by monitoring the financial stability of those counterparties. The Adviser attempts to mitigate counterparty risk by (i) periodically assessing the creditworthiness of its trading partners, (ii) monitoring and/or limiting the amount of its net exposure to each individual counterparty based on its assessment, and (iii) requiring collateral from the counterparty for certain transactions. In order to preserve certain safeguards fornon-standard settlement trades, the Portfolio restricts its exposure to credit and counterparty losses by entering into master netting agreements (“Master Agreements”) with counterparties (approved brokers) with whom it undertakes a significant volume of transactions. Master Agreements govern the terms of certain transactions, and reduce the counterparty risk associated with relevant transactions by specifying credit protection mechanisms and providing standardization that improves legal certainty. Master Agreements can also help limit counterparty risk by specifying collateral posting arrangements atpre-arranged exposure levels.
Customer Account Agreements and related addenda govern cleared derivatives transactions such as futures, options on futures, and cleared OTC derivatives. Cleared derivative transactions require posting of initial margin as determined by each relevant clearing agency, which is segregated at a broker account registered with the Commodities Futures Trading Commission (“CFTC”), or the applicable regulator. In the U.S., counterparty risk is significantly reduced as creditors of the futures broker do not have claim to portfolio assets in the segregated account. Additionally, portability of exposure in the event of default further reduces risk to the Portfolio. Variation margin, or changes in market value, are exchanged daily, but may not be netted between futures and cleared OTC derivatives.
Additional risks associated with each type of investment are described above within the respective security type notes. The Portfolio’s prospectus includes a discussion of the principal risks of investing in the Portfolio.
5. Investment Transactions
Aggregate cost of purchases and proceeds of sales of investment securities, excluding short-term securities, for the year ended December 31, 2018 were as follows:
| | | | | | | | | | | | |
Purchases | | | Sales | |
U.S. Government | | Non-U.S. Government | | | U.S. Government | | | Non-U.S. Government | |
| $0 | | $ | 944,374,814 | | | $ | 0 | | | $ | 1,548,329,185 | |
6. Investment Management Fees and Other Transactions with Affiliates
Investment Management Agreement - Brighthouse Investment Advisers is the investment adviser to the Portfolio. The Trust has entered into an investment management agreement with Brighthouse Investment Advisers with respect to the Portfolio. For providing investment management services to the Portfolio, Brighthouse Investment Advisers receives monthly compensation at the annual rate of 0.250% of average daily net assets. Fees earned by Brighthouse Investment Advisers with respect to the Portfolio for the year ended December 31, 2018 were $17,343,709.
Brighthouse Investment Advisers has entered into an investment subadvisory agreement with MetLife Investment Advisors, LLC (“MIA”) with respect to managing the Portfolio. For providing subadvisory services to the Portfolio, Brighthouse Investment Advisers has agreed to pay MIA an investment subadvisory fee for each class of the Portfolio as follows:
| | |
% per annum | | Average Daily Net Assets |
| 0.020% | | On the first $500 million |
| 0.015% | | Of the next $500 million |
| 0.010% | | Of the next $1 billion |
| 0.005% | | On amounts over $2 billion |
Fees earned by MIA with respect to the Portfolio for the year ended December 31, 2018 were $521,874.
BHFTII-24
Brighthouse Funds Trust II
MetLife Stock Index Portfolio
Notes to Financial Statements—December 31, 2018—(Continued)
Management Fee Waiver - Pursuant to a management fee waiver agreement, the Adviser has agreed, for the period April 30, 2018 to April 30, 2019, to reduce its advisory fees set out above under “Investment Management Agreement” for each class of the Portfolio as follows:
| | |
% per annum | | Average Daily Net Assets |
| 0.005% | | Over $500 million and under $1 billion |
| 0.010% | | Of the next $1 billion |
| 0.015% | | On amounts over $2 billion |
An identical agreement was in place for the period May 1, 2017 to April 30, 2018. Amounts waived for the year ended December 31, 2018 are shown as a management fee waiver in the Statement of Operations.
Certain officers and trustees of the Trust may also be officers of Brighthouse Investment Advisers; however, such officers and trustees receive no compensation from the Trust.
Transfer Agency Agreement - Brighthouse Financial, Inc. serves as the transfer agent for the Trust. Brighthouse Financial, Inc. receives no fees for its services to the Trust.
Distribution and Service Fees -The Trust has a distribution agreement with Brighthouse Securities, LLC (the “Distributor”) pursuant to which the Distributor serves as the general distributor of shares of each class (each a “Class”) of each Portfolio. The Distributor is an affiliate of the Trust. The Trust has adopted a Distribution and Services Plan (the “Plan”) relating to Class B, Class D, Class E and Class G shares of each Portfolio, under Rule 12b-1 under the 1940 Act, pursuant to which the Trust may pay the Distributor a fee (the “Service Fee”) at an annual rate not to exceed 0.25% of each such Portfolio’s average daily net assets attributable to the Class B, Class D, Class E and Class G shares of the Trust. Each Portfolio may not offer shares of each Class. The Plan also authorizes the Trust, on behalf of each of its Portfolios, may pay the Distributor a distribution Fee (the “Distribution Fee” and together with the Service Fee, the “Fees”) at an annual rate of up to 0.25% of each Portfolio’s average daily net assets attributable to the Class B, Class D, Class E and Class G shares in consideration of the services rendered in connection with the sale of such shares by the Distributor. Under the Distribution Agreement with respect to the Trust, Fees are currently paid at an annual rate of 0.25% of average daily net assets in the case of Class B shares, 0.10% of average daily net assets in the case of Class D shares, 0.15% of average daily net assets in the case of Class E shares and 0.30% of average daily net assets in the case of Class G shares. The Plan is known as a “compensation plan” because the Trust makes payments to the Distributor for services rendered regardless of the actual level of expenditures by the Distributor. Amounts incurred by the Portfolio for the year ended December 31, 2018 are shown as Distribution and service fees in the Statement of Operations.
Deferred Trustee Compensation -Each Trustee who is not currently an employee of the Adviser or any of its affiliates receives compensation from the Trust for his or her service to the Trust. A deferred compensation plan (the “Plan”) is available to the Trustees on a voluntary basis. Deferred amounts remain in the Trust until distributed in accordance with the provisions of the Plan. The value of a participating Trustee’s deferral account is based on theoretical investments of deferred amounts on the normal payment dates in certain portfolios of the Trust or Brighthouse Funds Trust I, an affiliate of the Trust, as designated by the participating Trustee. Changes in the value of participants’ deferral accounts are reflected as Trustees’ fees and expenses in the Statement of Operations. The portion of the accrued obligations allocated to the Portfolio under the Plan is reflected as Deferred trustees’ fees in the Statement of Assets and Liabilities.
7. Transactions in Securities of Affiliated Issuers
A summary of the Portfolio’s transactions in the securities of affiliated issuers during the year ended December 31, 2018 is as follows:
| | | | | | | | | | | | | | | | | | | | | | | | |
Security Description | | Market Value
December 31, 2017 | | | Purchases | | | Sales | | | Realized
Gain/(Loss) | | | Change in
Unrealized
Appreciation/
(Depreciation) | | | Ending Value
as of
December 31, 2018 | |
Brighthouse Financial, Inc. | | $ | 1,738,500 | | | $ | 321,825 | | | $ | (148,039 | ) | | $ | (2,994 | ) | | $ | (880,440) | | | $ | 1,028,852 | |
MetLife, Inc. | | | 16,461,831 | | | | — | | | | (2,109,246 | ) | | | 589,830 | | | | (3,410,057 | ) | | | 11,532,358 | |
| | | | | | | | | | | | | | | | | | | | | | | | |
| | $ | 18,200,331 | | | $ | 321,825 | | | $ | (2,257,285 | ) | | $ | 586,836 | | | $ | (4,290,497 | ) | | $ | 12,561,210 | |
| | | | | | | | | | | | | | | | | | | | | | | | |
| | | | | | | | |
Security Description | | Income earned
from affiliates
during the period | | | Number of
shares held at
December 31, 2018 | |
Brighthouse Financial, Inc. | | $ | — | | | | 33,755 | |
MetLife, Inc. | | | 500,140 | | | | 280,866 | |
| | | | | | | | |
| | $ | 500,140 | | | | | |
| | | | | | | | |
BHFTII-25
Brighthouse Funds Trust II
MetLife Stock Index Portfolio
Notes to Financial Statements—December 31, 2018—(Continued)
8. Contractual Obligations
Under the Trust’s organizational documents, its officers and Trustees may be indemnified against certain liabilities and expenses arising out of the performance of their duties to the Trust. Additionally, the Trust has a variety of indemnification obligations under contracts with its service providers. The Trust’s maximum exposure under these arrangements is unknown, as this would involve future claims that may be made against the Trust that have not yet occurred.
9. Income Tax Information
The cost basis of investments for federal income tax purposes at December 31, 2018 was as follows:
| | | | |
Cost basis of investments | | $ | 4,011,075,995 | |
Gross unrealized appreciation | | | 2,901,516,740 | |
Gross unrealized depreciation | | | (205,786,401 | ) |
| | | | |
Net unrealized appreciation (depreciation) | | $ | 2,695,730,339 | |
| | | | |
The tax character of distributions paid for the years ended December 31, 2018 and 2017 were as follows:
| | | | | | | | | | | | | | | | | | | | |
Ordinary Income | | | Long-Term Capital Gain | | | Total | |
2018 | | 2017 | | | 2018 | | | 2017 | | | 2018 | | | 2017 | |
| $135,078,703 | | $ | 125,663,743 | | | $ | 377,989,285 | | | $ | 183,600,982 | | | $ | 513,067,988 | | | $ | 309,264,725 | |
As of December 31, 2018, the components of distributable earnings (accumulated losses) on a federal income tax basis were as follows:
| | | | | | | | | | | | | | | | |
Undistributed
Ordinary
Income | | Undistributed
Long-Term
Capital Gain | | | Net
Unrealized
Appreciation | | | Accumulated
Capital Losses | | | Total | |
| $125,277,688 | | $ | 525,872,429 | | | $ | 2,695,730,339 | | | $ | — | | | $ | 3,346,880,456 | |
The Portfolio utilizes the provisions of the federal income tax laws that provide for the carryforward of capital losses for prior years, offsetting such losses against any future realized capital gains. Under the Regulated Investment Company Modernization Act of 2010, net capital losses recognized after December 22, 2010 may be carried forward indefinitely and their character is retained as short-term and/or long-term losses.
As of December 31, 2018, the Portfolio had no accumulated capital losses.
10. Recent Accounting Pronouncements and SEC Update
In August 2018, the FASB issued Accounting Standards Update2018-13, Fair Value Measurement (Topic 820)—Disclosure Framework—Changes to the Disclosure Requirements for Fair Value Measurement (“ASU2018-13”) which introduces new fair value disclosure requirements as well as eliminates and modifies certain existing fair value disclosure requirements. ASU2018-13 is effective for fiscal years beginning after December 15, 2019, and interim periods within those fiscal years. Early adoption is permitted and, as such, management has elected to early adopt ASU2018-13 effective with the current reporting period. The impact of the Portfolio’s adoption was limited to changes in the Portfolio’s financial statement disclosures regarding fair value, primarily those disclosures related to transfers between levels of the fair value hierarchy.
In August 2018, the Securities and Exchange Commission released its Final Rule on Disclosure Update and Simplification (the “Final Rule”) which is intended to simplify an issuer’s disclosure compliance efforts by removing redundant or outdated disclosures requirements without significantly altering the mix of information provided to investors. Effective with the current reporting period, the Portfolio adopted the Final Rule with the most notable impacts being that the Portfolio is no longer required to present the components of distributable earnings on the Statement of Assets and Liabilities or the sources of distributions to shareholders and the amounts of undistributed net investment income on the Statements of Changes in Net Assets.
BHFTII-26
Brighthouse Funds Trust II
MetLife Stock Index Portfolio
Report of Independent Registered Public Accounting Firm
To the Shareholders of MetLife Stock Index Portfolio and the Board of Trustees of Brighthouse Funds Trust II:
Opinion on the Financial Statements and Financial Highlights
We have audited the accompanying statement of assets and liabilities, including the schedule of investments, of the MetLife Stock Index Portfolio (the “Portfolio”), one of the portfolios constituting the Brighthouse Funds Trust II, as of December 31, 2018, the related statement of operations for the year then ended, the statements of changes in net assets for each of the two years in the period then ended, the financial highlights for each of the five years in the period then ended, and the related notes. In our opinion, the financial statements and financial highlights present fairly, in all material respects, the financial position of the MetLife Stock Index Portfolio of the Brighthouse Funds Trust II as of December 31, 2018, the results of its operations for the year then ended, the changes in its net assets for each of the two years in the period then ended, and the financial highlights for each of the five years in the period then ended, in conformity with accounting principles generally accepted in the United States of America.
Basis for Opinion
These financial statements and financial highlights are the responsibility of the Portfolio’s management. Our responsibility is to express an opinion on the Portfolio’s financial statements and financial highlights based on our audits. We are a public accounting firm registered with the Public Company Accounting Oversight Board (United States) (PCAOB) and are required to be independent with respect to the Portfolio in accordance with the U.S. federal securities laws and the applicable rules and regulations of the Securities and Exchange Commission and the PCAOB.
We conducted our audits in accordance with the standards of the PCAOB. Those standards require that we plan and perform the audit to obtain reasonable assurance about whether the financial statements and financial highlights are free of material misstatement, whether due to error or fraud. The Portfolio is not required to have, nor were we engaged to perform, an audit of its internal control over financial reporting. As part of our audits we are required to obtain an understanding of internal control over financial reporting but not for the purpose of expressing an opinion on the effectiveness of the Portfolio’s internal control over financial reporting. Accordingly, we express no such opinion.
Our audits included performing procedures to assess the risks of material misstatement of the financial statements and financial highlights, whether due to error or fraud, and performing procedures that respond to those risks. Such procedures included examining, on a test basis, evidence regarding the amounts and disclosures in the financial statements and financial highlights. Our audits also included evaluating the accounting principles used and significant estimates made by management, as well as evaluating the overall presentation of the financial statements and financial highlights. Our procedures included confirmation of securities owned as of December 31, 2018, by correspondence with the custodian and brokers; when replies were not received from brokers, we performed other auditing procedures. We believe that our audits provide a reasonable basis for our opinion.
/s/ Deloitte & Touche LLP
Boston, Massachusetts
February 25, 2019
We have served as the auditor of one or more of the Brighthouse investment companies since 1983.
BHFTII-27
Brighthouse Funds Trust II
Trustees and Officers
MANAGEMENT OF THE TRUSTS
The Boards of Trustees (the “Board”) of Brighthouse Funds Trust I and Brighthouse Funds Trust II (“BHF I” and “BHF II”, respectively, and collectively the “Trusts”) supervise the Trusts and are responsible for representing the interests of shareholders. The Trustees, the Chairman of the Board and the Chairmen of each subcommittee are the same for both Trusts. The Trustees of each Trust meet periodically throughout the year to oversee the Portfolios’ activities, reviewing, among other things, each Portfolio’s performance and its contractual arrangements with various service providers. The Trustees of each Trust elect the officers of the Trust, who are responsible for administering the Trust’sday-to-day operations.
Trustees and Officers
The Trustees and executive officers of the Trusts, as well as their principal occupations during the past five years, are set forth below. Unless otherwise indicated, the business address of each is c/o Brighthouse Funds, One Financial Center, Boston, Massachusetts 02111. Each Trustee who is deemed an “interested person,” as such term is defined in the 1940 Act, is referred to as an “Interested Trustee.” Those Trustees who are not “interested persons,” as such term is defined in the 1940 Act, are referred to as “Independent Trustees.” There is no limit to the term a Trustee may serve. Trustees serve until their death, resignation or removal in accordance with the BHF I Trust’s and BHF II Trust’s respective organizational documents and policies adopted by the Boards of the respective Trusts from time to time. Officers hold office at the pleasure of each Board and serve until their removal or resignation in accordance with the Trusts’ respective organizational documents and policies adopted by the Board of each Trust from time to time.
| | | | | | | | | | |
Name and Year of Birth | | Current
Position(s)
Held with
Registrant | | Term of Office
and Length of
Time Served | | Principal Occupation(s) During the Past
5 Years(1) | | Number of
Portfolios
in Brighthouse
Funds
Complex(2)
Overseen
by Trustee | | Other Directorships Held
by Trustee During the
Past 5 Years(1) |
| Interested Trustee |
John Rosenthal* (1960) | | Trustee | | Indefinite; From
May 2016
(Trust I and
Trust II) to present | | Chief Investment Officer, Brighthouse Financial, Inc. (2017 to present); until 2017, Senior Managing Director and Head of Global Portfolio Management, MetLife, Inc. | | 72 | | None |
|
| Independent Trustees |
Dawn M. Vroegop (1966) | | Trustee and Chairman of the Board | | Indefinite; From
December 2000
(Trust I)/May
2009 (Trust II) to
present as
Trustee; From
May 2016 (Trust
I and Trust II)
until present as
Chairman | | Private Investor. | | 72 | | Trustee, Driehaus Mutual Funds.** |
| | | | | |
Stephen M. Alderman (1959) | | Trustee | | Indefinite; From
December 2000
(Trust I)/April
2012 (Trust II) to
present | | Shareholder in the law firm of Garfield and Merel, Ltd. | | 72 | | None |
| | | | | |
Robert J. Boulware (1956) | | Trustee | | Indefinite; From
March 2008
(Trust I)/April
2012 (Trust II) to
present | | Managing Director, Pilgrim Funds, LLC (private equity fund). | | 72 | | Trustee, Vertical Capital Income Fund(closed-end fund);** Director, Gainsco, Inc. (auto insurance);** Trustee, SharesPost 100 Fund(closed-end fund).** |
| | | | | |
Susan C. Gause (1952) | | Trustee | | Indefinite; From
March 2008
(Trust I)/April
2012 (Trust II) to
present | | Private Investor. | | 72 | | Trustee, HSBC Funds.** |
BHFTII-28
Brighthouse Funds Trust II
Trustees and Officers—(Continued)
| | | | | | | | | | |
Name and Year of Birth | | Current
Position(s)
Held with
Registrant | | Term of Office
and Length of
Time Served | | Principal Occupation(s) During the Past
5 Years(1) | | Number of
Portfolios
in Brighthouse
Funds
Complex(2)
Overseen
by Trustee | | Other Directorships Held
by Trustee During the
Past 5 Years(1) |
Nancy Hawthorne (1951) | | Trustee | | Indefinite; From
May 2003
(Trust II)/April
2012 (Trust I)
to present | | Partner, Hawthorne Financial Advisors, LLC (registered investment advisor); until 2014, Chief Executive Officer, Clerestory LLC (corporate advisor). | | 72 | | Director and Chairman of the Board of Directors, THL Credit, Inc.;** Director and Chairman of the Board, Avid Technology, Inc.;** Director, CRA International, Inc.** |
| | | | | |
Barbara A. Nugent (1956) | | Trustee | | Indefinite; From
January 2014
(Trust I and
Trust II) to
present | | President, True North Board Governance, LLC (consulting); until December 2013, partner in the law firm of Stradley Ronon Stevens & Young, LLP. | | 72 | | Independent Lead Trustee, BMT Investment Funds** |
| | | | | |
Christopher J. Towle (1957) | | Trustee | | Indefinite; From
April 2018
(Trust I and
Trust II) to
present | | Retired; until 2014, Partner, Portfolio Manager, Director of High Yield and Convertible Strategies, Lord Abbett & Co. | | 72 | | Trustee, Driehaus Mutual Funds** |
Officers
| | | | | | |
Name and Year of Birth | | Position(s)
Held with
Registrant | | Length of
Time Served | | Principal Occupation(s)
During the Past 5 Years(1) |
| Executive Officers | | | | | | |
Kristi Slavin (1973) | | President and Chief Executive Officer, of Trust I and Trust II | | From May
2016
(Trust I and
Trust II) to
present | | President, Brighthouse Investment Advisers, LLC (2016-present); formerly, Senior Vice President, MetLife Advisers, LLC; Vice President, MetLife, Inc.; Vice President, Trust I and Trust II(2015-2016). |
| | | |
Alan R. Otis (1971) | | Chief Financial Officer and Treasurer, of Trust I and Trust II | | From
November
2017
(Trust I and
Trust II) to
present | | Senior Vice President, Brighthouse Investment Advisers, LLC (2017-present); formerly, Vice President, Brighthouse Investment Advisers, LLC (2012-2017); Assistant Treasurer, Trust I and Trust II (2012-2017). |
| | | |
Andrew L. Gangolf (1954) | | Secretary, of Trust I and Trust II | | From May
2011
(Trust I and
Trust II) to
present | | Executive Vice President, Brighthouse Investment Advisers, LLC (2017-present); formerly, Senior Vice President, MetLife Advisers, LLC (2011-2017); until 2011, Senior Vice President & Assistant General Counsel, AllianceBernstein Investments, Inc. |
| | | |
Steven E. Hartstein (1963) | | Chief Compliance Officer (“CCO”), of Trust I and Trust II | | From
February
2014
(Trust I and
Trust II) to
present | | Senior Vice President and CCO, Brighthouse Investment Advisers, LLC (2017-present); Head of Investments Compliance, Vice President, Brighthouse Financial, Inc. (2017-present); formerly, Vice President, MetLife, Inc. (2013-2017); Senior Vice President and CCO, MetLife Advisers, LLC (2013-2017.) |
| | | |
Victor Soto (1978) | | Vice President of Trust I and Trust II | | From May
2018
(Trust I and
Trust II) to
present | | Executive Vice President, Brighthouse Investment Advisers, LLC (2016-present); Assistant Vice President, MetLife Inc. (2015-2017); Portfolio Manager, 1st Global (2013-2015). |
| * | Mr. Rosenthal is an “interested person” of the Trusts because of his position with Brighthouse Financial, Inc., the current parent company of Brighthouse Investment Advisers, LLC. |
| ** | Indicates a directorship with a registered investment company or a company subject to the reporting requirements of the Securities Exchange Act of 1934, as amended. |
| (1) | Previous positions during the past five years with the Trusts, Brighthouse Financial, Inc., MetLife, Inc. or the Manager are omitted if not materially different. |
| (2) | The Fund Complex includes 43 BHF I Portfolios and 29 BHF II Portfolios. |
BHFTII-29
Brighthouse Funds Trust II
MetLife Stock Index Portfolio
Board of Trustees’ Consideration of Advisory and Sub-Advisory Agreements
At anin-person meeting held on November6-8, 2018 (the “November Meeting”), the Boards of Trustees (the “Board”) of Brighthouse Funds Trust I and Brighthouse Funds Trust II (“BFT I” and “BFT II,” respectively, and collectively, the “Trusts”), including a majority of the Trustees who are not “interested persons” of the Trusts (the “Independent Trustees”) under the Investment Company Act of 1940 (the “1940 Act”), approved the continuation of the Trusts’ advisory agreements (each, an “Advisory Agreement”) with Brighthouse Investment Advisers, LLC (the “Adviser”) and the applicablesub-advisory agreements (each a “Sub-Advisory Agreement,” and collectively with the Advisory Agreement, the “Agreements”) between the Adviser and the investmentsub-advisers (each a “Sub-Adviser,” and collectively, the “Sub-Advisers”) for the series of the Trusts (each a “Portfolio,” and collectively, the “Portfolios”).
In making those approvals, the Board reviewed a variety of materials that were provided for the specific purpose of the annual contract renewal process. In addition, various materials provided to and discussed with the Board throughout the year informed the Board’s decision to renew the Agreements. In particular, the information for each Portfolio included, but was not limited to, investment performance reports, and reports on expenses, legal and compliance matters, asset pricing, brokerage commissions and trade execution.
The Board met in person with personnel of the Adviser on October 17, 2018 for the specific purpose of giving preliminary consideration to the proposed continuation of the Agreements (the “October Meeting”). At that meeting, the Adviser reviewed with the Board the performance and fees experienced by each Portfolio, as well as other information. During and after the October Meeting, the Independent Trustees communicatedfollow-up matters for management to address at the November Meeting. The Independent Trustees were advised by independent legal counsel throughout the contract renewal process, and met with independent legal counsel in several executive sessions outside of the presence of management.
Information furnished and reviewed specifically in connection with the renewal process included, but was not limited to, a report for each Portfolio that was prepared by Broadridge (“Broadridge”), an independent organization. In addition, the Independent Trustees reviewed a report that was prepared by JDL Consultants, LLC (“JDL”), an independent consultant to the Independent Trustees (“JDL Report”), which examined the comparative fees, expenses and performance of each Portfolio, based upon the Broadridge reports. Also, the Board reviewed the responses to wide-ranging questions from the Independent Trustees relating to the business, operations and performance of the Adviser and theSub-Advisers that the Adviser andSub-Advisers had prepared specifically for the renewal process, and reviewed aPortfolio-by-Portfolio analysis of the profitability to the Adviser of each Advisory Agreement, which was prepared by the Adviser for the renewal process.
At the November Meeting, the Board, including a majority of the Independent Trustees, concluded that the nature, extent and quality of services provided by the Adviser and eachSub-Adviser supported the renewal of the Agreements. The Board also concluded that the investment performance of each Portfolio was such that each Agreement should continue, and that the fees paid by each Portfolio to the Adviser appeared to be reasonable in light of the nature, extent and quality of the services provided by the Adviser andSub-Adviser. Further, the Board concluded that the Adviser’s profitability in providing services under the Advisory Agreements did not appear unreasonable in light of the nature, extent and quality of the services provided by the Adviser. Finally, the Board reviewed the extent to which the investment advisory fees paid by the Portfolios shared economies of scale with investors or entailed the potential to share economies of scale with investors and concluded that those considerations generally supported the renewal of each Agreement. In approving the renewal of each of the Agreements, the Board, including the Independent Trustees, gave attention to all of the information that was furnished and each Trustee placed varying degrees of importance on the various pieces of information that were provided to them. The Board evaluated the information available to it on aPortfolio-by-Portfolio basis, and its decision was made separately with respect to each Portfolio. The following paragraphs provide more information about some of the primary factors that were relevant to the Board’s decision. The Board did not identify any single factor as determinative, and the Trustees generally attributed different weights to various factors for the various Portfolios.
Nature, extent and quality of services. The Board evaluated the nature, extent and quality of the services that the Adviser and theSub-Advisers, as relevant, have provided to the Portfolios. The Board considered the Adviser’s services as investment manager to the Portfolios, including its services relating to the hiring and oversight of theSub-Advisers, trading practices and oversight of transition management (as applicable), compliance programs and personnel, and risk management, among other things. The Adviser’s services in coordinating and overseeing the activities of the Trusts’ other service providers were also considered. The Board considered information received from the Trusts’ Chief Compliance Officer (“CCO”) regarding the Portfolios’ compliance policies and procedures that were established pursuant to Rule38a-l under the 1940 Act. The Board also noted that the Adviser’s investment, compliance and legal staff conduct regular and periodic telephonic andin-person meetings with theSub-Advisers to review and assess the services that are provided to the Portfolios, and that personnel of the Adviser prepare and present reports to the Independent Trustees regarding those meetings. In addition, throughout the year, the Board considered the expertise, experience and performance of the personnel of the Adviser who performed the various services that are mentioned above.
BHFTII-30
Brighthouse Funds Trust II
MetLife Stock Index Portfolio
Board of Trustees’ Consideration of Advisory and Sub-Advisory Agreements—(Continued)
With respect to the services provided by each of theSub-Advisers, the Board considered a variety of information that the Adviser and eachSub-Adviser prepared for the Board’s review. The Board considered eachSub-Adviser’s investment process and philosophy, and the investment performance experienced by the Portfolio (as described in more detail below). The Board took into account that eachSub-Adviser’s responsibilities include the development and maintenance of an investment program for the applicable Portfolio that is consistent with the Portfolio’s investment objectives, the selection of investment securities and the placement of orders for the purchase and sale of such securities, as well as the implementation of compliance controls related to performance of these services. In particular, the Board considered, among other things, theSub-Adviser’s current level of staffing as well as its compensation program and its overall resources. The Board reviewed eachSub-Adviser’s history and investment experience, as well as information provided regarding the qualifications, background and responsibilities of theSub-Adviser’s investment and compliance personnel who provide services to the Portfolios. The Board also considered, among other things, eachSub-Adviser’s compliance program and regulatory and disciplinary history. In its review, the Board also took into account information regarding any services and/or payments provided to the Adviser by theSub-Advisers in connection with marketing activities and considered representations from the Adviser that those payments were not considered in the Adviser’s recommendation to renew any of theSub-Advisory Agreements.
Performance. The Board placed emphasis on the performance of each Portfolio in light of, among other things, its importance to investors. The Board considered the Adviser’s quarterly reviews with the Board of detailed information about each Portfolio’s investment strategies and performance results and composition, including discussions regarding the relevant effect of current market conditions. The Board reviewed and considered the reports prepared by Broadridge, which provided a statistical analysis comparing the Portfolios’ investment performance to that of comparable funds underlying variable insurance products (the “Performance Universe”). The Independent Trustees also met separately with representatives of JDL during the October Meeting to review the JDL Report. The Board also compared the performance records of the Portfolios to those of comparable funds and other accounts that were managed by the relevantSub-Adviser, to the extent such information was available. The Board considered each Portfolio’s performance for periods subsequent to the performance period covered by the Broadridge reports, and the Adviser’s discussion of the same, including the effect of current market conditions on each Portfolio’s more recent performance. The Board also noted that while it found the data provided by Broadridge generally useful, it recognized the limitations of such data, including, in particular, that notable differences may exist between a Portfolio and those of the other funds in a Broadridge category (for example, the investment objectives(s) and investment strategies) and that the results of the performance comparisons may vary depending on (i) the end dates for the performance periods that were selected and (ii) the selection of the peer groups.
The Board focused particular attention on Portfolios with less favorable performance records. The Board noted the Adviser’s focus on eachSub-Adviser’s performance and that the Adviser has been active in monitoring and responding to any performance issues with respect to the Portfolios.
Fees and Expenses. The Board gave consideration to the level and method of computing the fees payable under the Agreements. The Board considered the Broadridge report for each of the Portfolios, which included comparisons for each Portfolio of its contractual management andsub-adviser fees (at current and various asset levels), and total expenses, with those of its peers, including as those peers were divided into a broad group of peer funds (“Expense Universe”), a narrower group of peer funds (“Expense Group”), a broad group of peersub-advised funds (“Sub-advised Expense Universe”), and a narrower group of peersub-advised funds (“Sub-advised Expense Group”). Broadridge selected the peer funds which were similarly situated funds underlying variable insurance products deemed to be comparable to the Portfolios. The Independent Trustees, with the assistance of JDL, also examined the JDL Report. The Board compared the fee payable to aSub-Adviser by the Adviser with respect to the Portfolio to the fee payable to theSub-Adviser by other comparable funds and other accounts, to the extent such information was available.
The Board noted that thesub-advisory fees for the Portfolios are paid by the Adviser out of the advisory fees, and that the Adviser negotiates the fees at arm’s length. The Board also considered that the Adviser had entered into expense limitation or management fee waiver agreements with certain of the Portfolios pursuant to which the Adviser had agreed to waive a portion of its advisory fee and/or reimburse certain expenses as a means of limiting a Portfolio’s total annual operating expenses.
Profitability. The Board examined the profitability to the Adviser of each Advisory Agreement, on aPortfolio-by-Portfolio basis. The Board also considered that an affiliate of the Adviser, Brighthouse Securities, LLC, serves as distributor for the Trusts, and, as such, receives Rule12b-1 payments to support the distribution of the Portfolios. The Board considered the profitability to theSub-Advisers and their affiliates as a result of their relationships with the Portfolios, to the extent available, and the Board considered the ability of the Adviser to negotiate with aSub-Adviser at arm’s length. In reviewing the profitability analyses, the Board recognized that expense allocation methodologies are inherently subjective and various expense allocation methodologies may be reasonable while producing different results.
BHFTII-31
Brighthouse Funds Trust II
MetLife Stock Index Portfolio
Board of Trustees’ Consideration of Advisory and Sub-Advisory Agreements—(Continued)
Economies of scale. The Board also considered each Portfolio’s fees in light of its size. The Board noted the fee schedules for the Portfolios that contain breakpoints that reduce the fee rate above specified asset levels. The Board noted those Portfolios that did not have breakpoints in their advisory fee and took into account management’s discussion of the same. The Board noted that those Portfolios with Advisory Agreements containing breakpoints generally have breakpoints in the correspondingSub-Advisory Agreement. The Board considered the effective fees under the Advisory Agreement andSub-Advisory Agreement for each Portfolio as a percentage of assets at different asset levels and possible economies of scale that may be realized if the assets of the Portfolio grow. The Board examined, among other data, the effect of a Portfolio’s growth in size, and reduction in size, on various fee schedules and the Board reviewed the Broadridge and JDL Reports, which compared fees among peers. The Board also generally noted that if a Portfolio’s assets increase over time, the Portfolio may realize other economies of scale if assets increase proportionally more than certain other fixed expenses.
Other factors. The Board considered other benefits that may be realized by the Adviser and its affiliates from their relationship with the Trusts. Among them, the Board recognized that Brighthouse Securities, LLC, as the distributor for the Trusts, receives payments pursuant to Rule12b-1 from the Portfolios to compensate for the provision of shareholder services and distribution activities, which could lead to growth in the Trusts’ assets and corresponding benefits from such growth, including economies of scale. The Board considered other benefits that may be realized by eachSub-Adviser and its affiliates from their relationship with the Trusts, including the opportunity to provide advisory services to additional portfolios of the Trusts and reputational benefits. In conjunction with these considerations, the Board noted the ongoing commitment of the Adviser to the Portfolios.
The Board requested, received, and considered information from the Adviser regarding possible conflicts of interest in the form of material benefits to the Adviser resulting from the Adviser’s affiliations and business relationships, as relevant. The Board considered the services that are provided to the Trusts by its service providers, and the manner in which any conflicts were mitigated.
* * *
MetLife Stock Index Portfolio. The Board also considered the following information in relation to the Agreements with the Adviser and MetLife Investment Advisors, LLC regarding the Portfolio:
Among other data relating specifically to the Portfolio’s performance, the Board considered that the Portfolio outperformed the median of its Performance Universe and the average of its Morningstar Category for theone-, three-, and five-year periods ended June 30, 2018. The Board further considered that the Portfolio underperformed its benchmark, the S&P 500 Index, for theone-, three-, and five-year periods ended September 30, 2018.
The Board also considered that the Portfolio’s actual management fees were equal to the Expense Group median, but above the Expense Universe median and theSub-advised Expense Universe median. The Board also noted that the Portfolio’s total expenses (exclusive of12b-1 fees) were equal to the Expense Group median, but below the Expense Universe median and theSub-advised Expense Universe median. The Board further noted that the Portfolio’s contractual management fees were above the asset-weighted average of comparable funds selected by Broadridge at the Portfolio’s current size. The Board also took into account that the Portfolio’s contractualsub-advisory fees were below the averages of theSub-advised Expense Group andSub-advised Expense Universe at the Portfolio’s current size.
BHFTII-32
Brighthouse Funds Trust II
MFS Total Return Portfolio
Managed by MFS Investment Management
Portfolio Manager Commentary*
PERFORMANCE
For the 12 months ended December 31, 2018, the Class A, B, E, and F shares of the MFS Total Return Portfolio returned-5.57%,-5.81%,-5.72%, and-5.76%, respectively. The Portfolio’s benchmarks, the Standard & Poor’s (“S&P”) 500 Index1 and the Bloomberg Barclays U.S. Aggregate Bond Index2, returned-4.38% and 0.01%, respectively. The Blended Index3, a blend of the S&P 500 Index (60%) and the Bloomberg Barclays U.S. Aggregate Bond Index (40%) returned-2.35%.
MARKET ENVIRONMENT/CONDITIONS
During the reporting period, the U.S. Federal Reserve raised interest rates by 100 basis points, bringing the total number of rate hikes to nine since the central bank began to normalize monetary policy in late 2015. Economic growth rates in the U.S., Eurozone and Japan remained above trend, despite a slowing in global growth, particularly toward the end of the period. Inflation remained contained, particularly outside the U.S. Late in the period, the European Central Bank halted its asset purchase program but issued forward guidance that it does not expect to raise interest rates at least until after the summer of 2019. The Bank of England (once) and the Bank of Canada (three times) each raised rates during the period. The European political backdrop became a bit more volatile, late in the period, spurred by concerns over cohesion in the eurozone after the election of an anti-establishment, Eurosceptic coalition government in Italy and widespread protests over stagnant wage growth in France.
Bond yields rose in the U.S. during most of the period but remained low by historical standards and slipped from their highs, late in the period, as market volatility increased. Yields in many developed markets fell. Outside of emerging markets, where spreads and currencies came under pressure, credit spreads remained quite tight until the end of the period, when thinner liquidity, lower oil prices and concerns over high degrees of corporate leverage emerged. Growing concern over increasing global trade friction appeared to have weighed on business sentiment during the period’s second half, especially outside the U.S. Tighter financial conditions from rising U.S. rates and a strong dollar, combined with trade uncertainty, helped expose structural weaknesses in several emerging markets in the second half of the period.
Volatility increased, at the end of the period, amid signs of slowing global economic growth and increasing trade tensions, which prompted a market setback shortly after U.S. markets set record highs in September. It was the second such equity market decline during the reporting period. The correction came despite a third consecutive quarter of strong growth in U.S. earnings per share. Strong earnings growth, combined with the market decline, brought U.S. equity valuations down from elevated levels, earlier in the period, to multiples more in line with long-term averages. While the U.S. economy held up better than most, global economic growth became less synchronized during the period, with Europe and China showing signs of a slowdown and some emerging markets coming under stress.
PORTFOLIOREVIEW/PERIOD-END POSITIONING
Within the equity portion of the Portfolio, an overweight position and stock selection within the Financials sector detracted from performance relative to the S&P 500 Index. The Portfolio’s overweight positions in shares of financial services firms Goldman Sachs Group and Citigroup and insurance company Prudential Financial held back relative returns.
An underweight allocation and security selection within the Information Technology (“IT”)sector also detracted from relative performance. Within this sector, an underweight position in software giant Microsoft and the Portfolio’s overweight holding of DXC Technology hurt relative returns.
Elsewhere, the Portfolio’s underweight position in internet retailer Amazon.com negatively impacted relative results as the stock outperformed the benchmark during the year. The Portfolio’s overweight holdings of tobacco company Philip Morris International and food producer Tyson Foods also weighed on relative performance. The Portfolio’s holdings of residential and commercial building materials manufacturer Owens Corningand pharmaceutical company Bayer(Germany) further held back relative returns.
Stock selection and an overweight allocation to the Health Caresector contributed to performance relative to the S&P 500 Index. The Portfolio’s overweight holdings of pharmaceutical giant Pfizer, life sciences supply company Thermo Fisher Scientific, pharmaceutical company Eli Lilly, medical device maker Medtronic, healthcare equipment manufacturer Danaher, and pharmaceutical and medical products maker Abbott Laboratories all positively impacted relative returns.
Security selection in the Real Estate sector also aided relative performance. Most notably, the Portfolio’s holding of real estate investment trust Medical Properties Trust boosted relative performance.
In other sectors, avoiding shares of poor-performing diversified industrial conglomerate General Electric bolstered relative performance. Also, the timing of the Portfolio’s ownership in shares of social networking service provider Facebookand telecommunication services provider AT&Tstrengthened relative returns as both stocks underperformed the benchmark during the reporting year.
Within the fixed income portion of the Portfolio, an underweight allocation to the U.S. Treasuries sector was a detractor from performance relative to the Bloomberg Barclays U.S. Aggregate Bond Index. Bond selection within Industrialssector further weighed on relative results.
Selection within both the Agency Mortgage-Backed Securities (“MBS”) fixed rateandUtilitiessectors aided performance relative to the Bloomberg Barclays U.S. Aggregate Bond Index. Furthermore, the Portfolio’s shorter durationstance contributed to relative performance as interest rates rose during the period.
BHFTII-1
Brighthouse Funds Trust II
MFS Total Return Portfolio
Managed by MFS Investment Management
Portfolio Manager Commentary*—(Continued)
Over the trailing 12 months ended December 31, 2018, the Portfolio’s equity portion increased its exposure to Health Care, IT, and Utilities. During the same period, the Portfolio reduced its weighting to Financials, Consumer Staples, and Communications Services. At the end of the period, the Portfolio’s equity portion was overweight Financials, Industrials, and Health Care, while being underweight IT, Communication Services, and Consumer Discretionary.
Over the trailing 12 months, the Portfolio increased its exposure to MBS, Corporate, and Commercial Mortgage-Backed Securities (“CMBS”). During the same period, the Portfolio reduced its weighting to government securities. At the end of the period, the fixed income allocation was most overweight CMBS, MBS, and Collateralized Loan Obligations. In contrast, the fixed income allocation was most underweight government securities and international securities.
Brooks Taylor
Steven Gorham
Nevin Chitkara
Joshua Marston
Jonathan Sage
Robert Persons
Portfolio Managers
MFS Investment Management
* This commentary may include statements that constitute “forward-looking statements” under the U.S. securities laws. Forward-looking statements include, among other things, projections, estimates, and information about possible or future results related to the Portfolio, market or regulatory developments. The views expressed above are not guarantees of future performance or economic results and involve certain risks, uncertainties and assumptions that could cause actual outcomes and results to differ materially from the views expressed herein. The views expressed above are subject to change at any time based upon economic, market, or other conditions and the subadvisory firm undertakes no obligation to update the views expressed herein. Any discussions of specific securities should not be considered a recommendation to buy or sell those securities. The views expressed above (including any forward-looking statement) may not be relied upon as investment advice or as an indication of the Portfolio’s trading intent. Information about the Portfolio’s holdings, asset allocation or country diversification is historical and is not an indication of future Portfolio composition, which may vary. Direct investment in any index is not possible. The performance of any index mentioned in this commentary has not been adjusted for ongoing management, distribution and operating expenses, and sales charges applicable to mutual fund investments. In addition, the returns do not reflect additional fees charged by separate accounts or variable insurance contracts that an investor in the Portfolio may pay. If these additional fees were reflected, performance would have been lower.
BHFTII-2
Brighthouse Funds Trust II
MFS Total Return Portfolio
A $10,000 INVESTMENT COMPARED TO THE S&P 500 INDEX & THE BLOOMBERG BARCLAYS U.S. AGGREGATE BOND INDEX & THE BLENDED INDEX
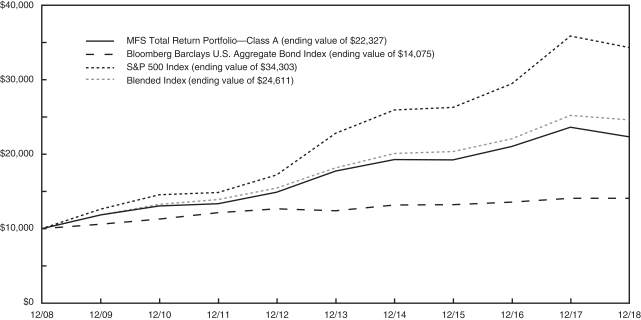
AVERAGE ANNUAL RETURNS (%) (FOR THE YEAR ENDED DECEMBER 31, 2018)
| | | | | | | | | | | | |
| | | | |
| | | 1 Year | | | 5 Year | | | 10 Year | |
| MFS Total Return Portfolio | | | | | | | | | | | | |
Class A | | | -5.57 | | | | 4.69 | | | | 8.36 | |
Class B | | | -5.81 | | | | 4.43 | | | | 8.09 | |
Class E | | | -5.72 | | | | 4.54 | | | | 8.20 | |
Class F | | | -5.76 | | | | 4.48 | | | | 8.15 | |
| Bloomberg Barclays U.S. Aggregate Bond Index | | | 0.01 | | | | 2.52 | | | | 3.48 | |
| S&P 500 Index | | | -4.38 | | | | 8.50 | | | | 13.12 | |
| Blended Index | | | -2.35 | | | | 6.24 | | | | 9.43 | |
1 The Standard & Poor’s (S&P) 500 Index is an unmanaged index consisting of 500 stocks chosen for market size, liquidity, and industry group representation. It is a market-weighted index (stock price times number of shares outstanding) with each stock’s weight in the Index proportionate to its market value.
2 The Bloomberg Barclays U.S. Aggregate Bond Index is a broad based benchmark that measures the investment grade, U.S. dollar-denominated, fixed-rate taxable bond market, including Treasuries, government-related and corporate securities, mortgage-backed securities, asset-backed securities, and commercial mortgage-backed securities.
3 The Blended Index is a composite index consisting of 60% S&P 500 Index and 40% Bloomberg Barclays U.S. Aggregate Bond Index.
Portfolio performance is calculated including reinvestment of all income and capital gain distributions. Performance numbers are net of all Portfolio expenses but do not include any insurance, sales, separate account or administrative charges of variable annuity or life insurance contracts or any additional expenses that participants may bear relating to the operations of their plans. If these charges were included, the returns would be lower. The performance of any index referenced above has not been adjusted for ongoing management, distribution and operating expenses, and sales charges applicable to mutual fund investments. Direct investment in any index is not possible. The performance of Class A shares, as set forth in the line graph above, will differ from that of other classes because of the difference in expenses paid by policyholders investing in the different share classes.
This information represents past performance and is not indicative of future results. Investment return and principal value may fluctuate so that shares, upon redemption, may be worth more or less than the original cost.
PORTFOLIO COMPOSITION AS OF DECEMBER 31, 2018
Top Equity Sectors
| | | | |
| | | % of
Net Assets | |
| Financials | | | 12.6 | |
| Health Care | | | 9.8 | |
| Industrials | | | 7.3 | |
| Information Technology | | | 6.6 | |
| Consumer Staples | | | 5.1 | |
Top Equity Holdings
| | | | |
| | | % of
Net Assets | |
| JPMorgan Chase & Co. | | | 1.8 | |
| Pfizer, Inc. | | | 1.5 | |
| Comcast Corp. | | | 1.4 | |
| Johnson & Johnson | | | 1.2 | |
| Philip Morris International, Inc. | | | 1.1 | |
Top Fixed Income Sectors
| | | | |
| | | % of
Net Assets | |
| U.S. Treasury & Government Agencies | | | 27.7 | |
| Corporate Bonds & Notes | | | 11.7 | |
| Mortgage-Backed Securities | | | 2.5 | |
| Asset-Backed Securities | | | 1.9 | |
| Municipals | | | 0.2 | |
Top Fixed Income Issuers
| | | | |
| | | % of
Net Assets | |
| U.S. Treasury Notes | | | 10.1 | |
| Fannie Mae 30 Yr. Pool | | | 5.1 | |
| U.S. Treasury Bonds | | | 3.8 | |
| Freddie Mac 30 Yr. Gold Pool | | | 2.8 | |
| Ginnie Mae II 30 Yr. Pool | | | 2.4 | |
BHFTII-3
Brighthouse Funds Trust II
MFS Total Return Portfolio
Understanding Your Portfolio’s Expenses
Shareholder Expense Example
As a shareholder of the Portfolio, you incur ongoing costs, including management fees; distribution and service(12b-1) fees; and other Portfolio expenses. This example is intended to help you understand your ongoing costs (in dollars) (referred to as “expenses”) of investing in the Portfolio and compare these costs with the ongoing costs of investing in other mutual funds. The example is based on an investment of $1,000 invested at the beginning of the period and held for the entire period, July 1, 2018 through December 31, 2018.
Actual Expenses
The first line for each share class of the Portfolio in the table below provides information about actual account values and actual expenses. You may use the information in this line, together with the amount you invested in the particular share class of the Portfolio, to estimate the expenses that you paid over the period. Simply divide your account value by $1,000 (for example, an $8,600 account value divided by $1,000 = 8.6), then multiply the result by the number in the first line under the heading entitled “Expenses Paid During Period” to estimate the expenses you paid on your account during this period.
Hypothetical Example for Comparison Purposes
The second line for each share class of the Portfolio in the table below provides information about hypothetical account values and hypothetical expenses based on the Portfolio’s actual expense ratio and an assumed rate of return of 5% per year before expenses, which is not the Portfolio’s actual return. The hypothetical account values and expenses may not be used to estimate the actual ending account balance or expenses you paid for the period. You may use this information to compare the ongoing costs of investing in the Portfolio and other funds. To do so, compare this 5% hypothetical example with the 5% hypothetical examples that appear in the shareholder reports of the other funds.
Please note that the expenses shown in the table are meant to highlight your ongoing costs only and do not reflect any fees or charges of your variable insurance product or any additional expenses that participants in certain eligible qualified plans may bear relating to the operations of their plan. Therefore, the second line for each share class in the table is useful in comparing ongoing costs only, and will not help you determine the relative total costs of owning different funds. In addition, if these other costs were included, your costs would have been higher.
| | | | | | | | | | | | | | | | | | |
MFS Total Return Portfolio | | | | Annualized
Expense
Ratio | | | Beginning
Account Value
July 1,
2018 | | | Ending
Account Value
December 31,
2018 | | | Expenses Paid
During Period**
July 1, 2018
to
December 31,
2018 | |
Class A | | Actual | | | 0.62 | % | | $ | 1,000.00 | | | $ | 963.90 | | | $ | 3.07 | |
| | Hypothetical* | | | 0.62 | % | | $ | 1,000.00 | | | $ | 1,022.08 | | | $ | 3.16 | |
| | | | | |
Class B | | Actual | | | 0.87 | % | | $ | 1,000.00 | | | $ | 962.70 | | | $ | 4.30 | |
| | Hypothetical* | | | 0.87 | % | | $ | 1,000.00 | | | $ | 1,020.82 | | | $ | 4.43 | |
| | | | | |
Class E | | Actual | | | 0.77 | % | | $ | 1,000.00 | | | $ | 963.20 | | | $ | 3.81 | |
| | Hypothetical* | | | 0.77 | % | | $ | 1,000.00 | | | $ | 1,021.32 | | | $ | 3.92 | |
| | | | | |
Class F | | Actual | | | 0.82 | % | | $ | 1,000.00 | | | $ | 963.00 | | | $ | 4.06 | |
| | Hypothetical* | | | 0.82 | % | | $ | 1,000.00 | | | $ | 1,021.07 | | | $ | 4.18 | |
| * | Hypothetical assumes a rate of return of 5% per year before expenses. |
| ** | Expenses paid are equal to the Portfolio’s annualized expense ratio for the most recent six month period, as shown above, multiplied by the average account value over the period, multiplied by the number of days (184 days) in the most recent fiscal half-year, divided by 365 (to reflect theone-half year period). |
BHFTII-4
Brighthouse Funds Trust II
MFS Total Return Portfolio
Schedule of Investments as of December 31, 2018
Common Stocks—55.9% of Net Assets
| | | | | | | | |
| Security Description | | Shares | | | Value | |
|
| Aerospace & Defense—1.8% | |
Boeing Co. (The) | | | 12,934 | | | $ | 4,171,215 | |
Harris Corp. (a) | | | 6,161 | | | | 829,579 | |
Lockheed Martin Corp. | | | 7,074 | | | | 1,852,256 | |
Northrop Grumman Corp. | | | 9,559 | | | | 2,340,999 | |
United Technologies Corp. | | | 36,659 | | | | 3,903,450 | |
| | | | | | | | |
| | | | | | | 13,097,499 | |
| | | | | | | | |
|
| Air Freight & Logistics—0.2% | |
United Parcel Service, Inc. - Class B | | | 17,231 | | | | 1,680,539 | |
| | | | | | | | |
|
| Airlines—0.1% | |
Delta Air Lines, Inc. | | | 21,049 | | | | 1,050,345 | |
| | | | | | | | |
|
| Auto Components—0.6% | |
Aptiv plc (a) | | | 27,786 | | | | 1,710,784 | |
Lear Corp. | | | 22,145 | | | | 2,720,735 | |
| | | | | | | | |
| | | | | | | 4,431,519 | |
| | | | | | | | |
|
| Automobiles—0.2% | |
Harley-Davidson, Inc. | | | 5,005 | | | | 170,771 | |
Toyota Motor Corp. | | | 19,700 | | | | 1,144,191 | |
| | | | | | | | |
| | | | | | | 1,314,962 | |
| | | | | | | | |
|
| Banks—5.6% | |
Bank of America Corp. | | | 253,656 | | | | 6,250,084 | |
BNP Paribas S.A. | | | 8,594 | | | | 387,058 | |
Citigroup, Inc. | | | 116,961 | | | | 6,088,990 | |
JPMorgan Chase & Co. | | | 132,032 | | | | 12,888,964 | |
PNC Financial Services Group, Inc. (The) | | | 32,685 | | | | 3,821,203 | |
Royal Bank of Canada | | | 10,446 | | | | 714,968 | |
Sumitomo Mitsui Financial Group, Inc. | | | 11,000 | | | | 362,745 | |
SunTrust Banks, Inc. | | | 14,269 | | | | 719,729 | |
U.S. Bancorp (a) | | | 103,640 | | | | 4,736,348 | |
Wells Fargo & Co. | | | 91,541 | | | | 4,218,209 | |
Westpac Banking Corp. | | | 39,105 | | | | 689,709 | |
| | | | | | | | |
| | | | | | | 40,878,007 | |
| | | | | | | | |
|
| Beverages—0.8% | |
Coca-Cola European Partners plc | | | 18,638 | | | | 854,552 | |
Diageo plc | | | 84,364 | | | | 2,998,593 | |
Molson Coors Brewing Co. - Class B | | | 27,672 | | | | 1,554,060 | |
PepsiCo, Inc. | | | 6,947 | | | | 767,505 | |
| | | | | | | | |
| | | | | | | 6,174,710 | |
| | | | | | | | |
|
| Biotechnology—0.3% | |
Biogen, Inc. (a) (b) | | | 7,495 | | | | 2,255,395 | |
|
| Building Products—0.5% | |
Johnson Controls International plc | | | 134,302 | | | | 3,982,054 | |
| | | | | | | | |
|
| Capital Markets—3.1% | |
Apollo Global Management LLC - Class A | | | 57,643 | | | | 1,414,559 | |
Bank of New York Mellon Corp. (The) | | | 96,507 | | | | 4,542,585 | |
BlackRock, Inc. | | | 6,366 | | | | 2,500,692 | |
Blackstone Group L.P. (The) | | | 40,765 | | | | 1,215,205 | |
|
| Capital Markets—(Continued) | |
Charles Schwab Corp. (The) | | | 18,331 | | | | 761,287 | |
Goldman Sachs Group, Inc. (The) | | | 24,608 | | | | 4,110,766 | |
Invesco, Ltd. (a) | | | 21,842 | | | | 365,635 | |
Moody’s Corp. (a) | | | 6,934 | | | | 971,037 | |
Morgan Stanley | | | 36,277 | | | | 1,438,383 | |
Nasdaq, Inc. (a) | | | 19,633 | | | | 1,601,464 | |
State Street Corp. | | | 39,146 | | | | 2,468,938 | |
T. Rowe Price Group, Inc. (a) | | | 17,622 | | | | 1,626,863 | |
| | | | | | | | |
| | | | | | | 23,017,414 | |
| | | | | | | | |
|
| Chemicals—2.0% | |
Axalta Coating Systems, Ltd. (b) | | | 43,915 | | | | 1,028,490 | |
Celanese Corp. (a) | | | 13,117 | | | | 1,180,137 | |
CF Industries Holdings, Inc. | | | 60,706 | | | | 2,641,318 | |
DowDuPont, Inc. | | | 27,394 | | | | 1,465,031 | |
Methanex Corp. | | | 6,919 | | | | 333,288 | |
PPG Industries, Inc. (a) | | | 51,436 | | | | 5,258,302 | |
Sherwin-Williams Co. (The) | | | 6,398 | | | | 2,517,357 | |
| | | | | | | | |
| | | | | | | 14,423,923 | |
| | | | | | | | |
|
| Commercial Services & Supplies—0.1% | |
Transcontinental, Inc. - Class A | | | 38,667 | | | | 546,640 | |
| | | | | | | | |
|
| Communications Equipment—0.7% | |
Cisco Systems, Inc. | | | 113,064 | | | | 4,899,063 | |
| | | | | | | | |
|
| Consumer Finance—0.2% | |
American Express Co. | | | 13,946 | | | | 1,329,333 | |
Synchrony Financial | | | 20,404 | | | | 478,678 | |
| | | | | | | | |
| | | | | | | 1,808,011 | |
| | | | | | | | |
|
| Containers & Packaging—0.1% | |
Crown Holdings, Inc. (a) (b) | | | 21,258 | | | | 883,695 | |
| | | | | | | | |
|
| Diversified Financial Services—0.2% | |
ORIX Corp. | | | 119,300 | | | | 1,733,384 | |
| | | | | | | | |
|
| Diversified Telecommunication Services—0.4% | |
Verizon Communications, Inc. | | | 56,228 | | | | 3,161,138 | |
| | | | | | | | |
|
| Electric Utilities—1.7% | |
Duke Energy Corp. (a) | | | 41,016 | | | | 3,539,681 | |
Exelon Corp. | | | 89,521 | | | | 4,037,397 | |
PPL Corp. | | | 24,009 | | | | 680,175 | |
Southern Co. (The) (a) | | | 57,181 | | | | 2,511,390 | |
SSE plc | | | 82,329 | | | | 1,131,960 | |
Xcel Energy, Inc. (a) | | | 13,494 | | | | 664,849 | |
| | | | | | | | |
| | | | | | | 12,565,452 | |
| | | | | | | | |
|
| Electrical Equipment—0.8% | |
Eaton Corp. plc | | | 75,541 | | | | 5,186,645 | |
Regal-Beloit Corp. (a) | | | 5,111 | | | | 358,026 | |
Schneider Electric SE | | | 5,180 | | | | 352,535 | |
| | | | | | | | |
| | | | | | | 5,897,206 | |
| | | | | | | | |
See accompanying notes to financial statements.
BHFTII-5
Brighthouse Funds Trust II
MFS Total Return Portfolio
Schedule of Investments as of December 31, 2018
Common Stocks—(Continued)
| | | | | | | | |
| Security Description | | Shares | | | Value | |
|
| Energy Equipment & Services—0.3% | |
Schlumberger, Ltd. | | | 56,953 | | | $ | 2,054,864 | |
| | | | | | | | |
|
| Entertainment—0.1% | |
Electronic Arts, Inc. (b) | | | 7,034 | | | | 555,053 | |
| | | | | | | | |
|
| Equity Real Estate Investment Trusts—1.1% | |
EPR Properties | | | 8,268 | | | | 529,400 | |
Life Storage, Inc. | | | 8,342 | | | | 775,723 | |
Medical Properties Trust, Inc. | | | 192,482 | | | | 3,095,110 | |
Public Storage (a) | | | 2,797 | | | | 566,141 | |
Simon Property Group, Inc. | | | 6,915 | | | | 1,161,651 | |
STORE Capital Corp. | | | 73,697 | | | | 2,086,362 | |
| | | | | | | | |
| | | | | | | 8,214,387 | |
| | | | | | | | |
|
| Food & Staples Retailing—0.2% | |
U.S. Foods Holding Corp. (b) | | | 23,345 | | | | 738,636 | |
Walgreens Boots Alliance, Inc. (a) | | | 9,747 | | | | 666,012 | |
| | | | | | | | |
| | | | | | | 1,404,648 | |
| | | | | | | | |
|
| Food Products—1.8% | |
Archer-Daniels-Midland Co. | | | 33,354 | | | | 1,366,513 | |
Danone S.A. | | | 20,349 | | | | 1,434,186 | |
General Mills, Inc. (a) | | | 64,759 | | | | 2,521,715 | |
J.M. Smucker Co. (The) (a) | | | 5,694 | | | | 532,332 | |
Marine Harvest ASA | | | 65,105 | | | | 1,370,528 | |
Mondelez International, Inc. - Class A | | | 20,191 | | | | 808,246 | |
Nestle S.A. | | | 42,284 | | | | 3,437,725 | |
Tyson Foods, Inc. - Class A | | | 27,129 | | | | 1,448,689 | |
| | | | | | | | |
| | | | | | | 12,919,934 | |
| | | | | | | | |
|
| Health Care Equipment & Supplies—2.4% | |
Abbott Laboratories (a) | | | 63,087 | | | | 4,563,083 | |
Danaher Corp. | | | 55,395 | | | | 5,712,332 | |
Medtronic plc | | | 69,856 | | | | 6,354,102 | |
Zimmer Biomet Holdings, Inc. (a) | | | 10,808 | | | | 1,121,006 | |
| | | | | | | | |
| | | | | | | 17,750,523 | |
| | | | | | | | |
|
| Health Care Providers & Services—1.7% | |
AmerisourceBergen Corp. | | | 12,976 | | | | 965,414 | |
Cigna Corp. | | | 21,118 | | | | 4,010,667 | |
CVS Health Corp. | | | 8,659 | | | | 567,338 | |
HCA Healthcare, Inc. | | | 20,394 | | | | 2,538,033 | |
Humana, Inc. | | | 10,985 | | | | 3,146,983 | |
McKesson Corp. | | | 14,429 | | | | 1,593,972 | |
| | | | | | | | |
| | | | | | | 12,822,407 | |
| | | | | | | | |
|
| Hotels, Restaurants & Leisure—0.6% | |
Aramark (a) | | | 29,752 | | | | 861,915 | |
Marriott International, Inc. - Class A (a) | | | 6,044 | | | | 656,137 | |
Starbucks Corp. | | | 40,846 | | | | 2,630,482 | |
| | | | | | | | |
| | | | | | | 4,148,534 | |
| | | | | | | | |
|
| Household Durables—0.3% | |
PulteGroup, Inc. | | | 27,330 | | | | 710,307 | |
|
| Household Durables—(Continued) | |
Whirlpool Corp. | | | 12,397 | | | | 1,324,867 | |
| | | | | | | | |
| | | | | | | 2,035,174 | |
| | | | | | | | |
|
| Household Products—0.7% | |
Colgate-Palmolive Co. | | | 4,815 | | | | 286,589 | |
Kimberly-Clark Corp. | | | 25,715 | | | | 2,929,967 | |
Procter & Gamble Co. (The) | | | 4,442 | | | | 408,309 | |
Reckitt Benckiser Group plc | | | 17,752 | | | | 1,355,649 | |
| | | | | | | | |
| | | | | | | 4,980,514 | |
| | | | | | | | |
|
| Industrial Conglomerates—1.2% | |
3M Co. | | | 15,784 | | | | 3,007,483 | |
Honeywell International, Inc. | | | 44,078 | | | | 5,823,586 | |
| | | | | | | | |
| | | | | | | 8,831,069 | |
| | | | | | | | |
|
| Insurance—3.3% | |
Aon plc (a) | | | 34,455 | | | | 5,008,379 | |
Chubb, Ltd. | | | 45,596 | | | | 5,890,091 | |
Prudential Financial, Inc. (a) | | | 44,308 | | | | 3,613,318 | |
Tokio Marine Holdings, Inc. | | | 8,700 | | | | 413,559 | |
Travelers Cos., Inc. (The) (a) | | | 57,951 | | | | 6,939,632 | |
Unum Group | | | 23,198 | | | | 681,557 | |
Zurich Insurance Group AG | | | 6,277 | | | | 1,875,503 | |
| | | | | | | | |
| | | | | | | 24,422,039 | |
| | | | | | | | |
|
| Interactive Media & Services—0.3% | |
Alphabet, Inc. - Class A (b) | | | 1,956 | | | | 2,043,942 | |
| | | | | | | | |
|
| Internet & Direct Marketing Retail—0.5% | |
Amazon.com, Inc. (b) | | | 2,529 | | | | 3,798,482 | |
| | | | | | | | |
|
| IT Services—2.3% | |
Accenture plc - Class A | | | 43,120 | | | | 6,080,351 | |
Amdocs, Ltd. | | | 30,237 | | | | 1,771,284 | |
Cognizant Technology Solutions Corp. - Class A | | | 11,090 | | | | 703,993 | |
DXC Technology Co. | | | 60,070 | | | | 3,193,922 | |
Fidelity National Information Services, Inc. | | | 17,097 | | | | 1,753,297 | |
Fiserv, Inc. (b) | | | 20,217 | | | | 1,485,747 | |
Visa, Inc. - Class A | | | 9,114 | | | | 1,202,501 | |
Worldpay, Inc. - Class A (b) | | | 11,611 | | | | 887,429 | |
| | | | | | | | |
| | | | | | | 17,078,524 | |
| | | | | | | | |
|
| Leisure Products—0.1% | |
Brunswick Corp. | | | 10,514 | | | | 488,375 | |
| | | | | | | | |
|
| Life Sciences Tools & Services—0.8% | |
Thermo Fisher Scientific, Inc. | | | 25,594 | | | | 5,727,681 | |
| | | | | | | | |
|
| Machinery—1.2% | |
AGCO Corp. | | | 12,807 | | | | 712,966 | |
Allison Transmission Holdings, Inc. | | | 6,341 | | | | 278,433 | |
Deere & Co. | | | 6,803 | | | | 1,014,803 | |
Illinois Tool Works, Inc. (a) | | | 29,456 | | | | 3,731,781 | |
Ingersoll-Rand plc | | | 14,049 | | | | 1,281,690 | |
See accompanying notes to financial statements.
BHFTII-6
Brighthouse Funds Trust II
MFS Total Return Portfolio
Schedule of Investments as of December 31, 2018
Common Stocks—(Continued)
| | | | | | | | |
| Security Description | | Shares | | | Value | |
|
| Machinery—(Continued) | |
Stanley Black & Decker, Inc. (a) | | | 16,416 | | | $ | 1,965,652 | |
| | | | | | | | |
| | | | | | | 8,985,325 | |
| | | | | | | | |
|
| Media—1.9% | |
Comcast Corp. - Class A | | | 294,885 | | | | 10,040,835 | |
Interpublic Group of Cos., Inc. (The) (a) | | | 53,948 | | | | 1,112,947 | |
Omnicom Group, Inc. (a) | | | 35,401 | | | | 2,592,769 | |
| | | | | | | | |
| | | | | | | 13,746,551 | |
| | | | | | | | |
|
| Metals & Mining—0.3% | |
Rio Tinto plc | | | 43,609 | | | | 2,079,315 | |
| | | | | | | | |
|
| Mortgage Real Estate Investment Trusts—0.1% | |
Annaly Capital Management, Inc. (a) | | | 53,639 | | | | 526,735 | |
| | | | | | | | |
|
| Multi-Utilities—0.5% | |
Engie S.A. | | | 55,110 | | | | 787,639 | |
Public Service Enterprise Group, Inc. | | | 23,213 | | | | 1,208,237 | |
Sempra Energy (a) | | | 9,317 | | | | 1,008,006 | |
WEC Energy Group, Inc. (a) | | | 12,307 | | | | 852,383 | |
| | | | | | | | |
| | | | | | | 3,856,265 | |
| | | | | | | | |
|
| Multiline Retail—0.1% | |
Dollar Tree, Inc. (b) | | | 9,754 | | | | 880,981 | |
| | | | | | | | |
|
| Oil, Gas & Consumable Fuels—3.1% | |
Anadarko Petroleum Corp. | | | 20,641 | | | | 904,902 | |
BP plc | | | 338,214 | | | | 2,133,935 | |
Chevron Corp. | | | 24,997 | | | | 2,719,424 | |
Eni S.p.A. | | | 72,330 | | | | 1,139,063 | |
Enterprise Products Partners L.P. | | | 105,663 | | | | 2,598,253 | |
EOG Resources, Inc. | | | 26,521 | | | | 2,312,896 | |
EQT Midstream Partners LP | | | 11,835 | | | | 511,864 | |
Equitrans Midstream Corp. (a) (b) | | | 28,204 | | | | 564,644 | |
Exxon Mobil Corp. | | | 39,807 | | | | 2,714,439 | |
Hess Corp. (a) | | | 17,926 | | | | 726,003 | |
Marathon Petroleum Corp. | | | 11,682 | | | | 689,355 | |
MPLX L.P. | | | 21,604 | | | | 654,601 | |
Noble Energy, Inc. (a) | | | 27,519 | | | | 516,256 | |
Occidental Petroleum Corp. | | | 14,651 | | | | 899,278 | |
Phillips 66 | | | 11,218 | | | | 966,431 | |
Pioneer Natural Resources Co. | | | 5,578 | | | | 733,619 | |
Plains All American Pipeline L.P. | | | 41,309 | | | | 827,832 | |
Plains GP Holdings L.P. - Class A (b) | | | 47,008 | | | | 944,861 | |
| | | | | | | | |
| | | | | | | 22,557,656 | |
| | | | | | | | |
|
| Personal Products—0.0% | |
Coty, Inc. - Class A (a) (b) | | | 45,906 | | | | 301,143 | |
| | | | | | | | |
|
| Pharmaceuticals—4.5% | |
Bayer AG | | | 24,182 | | | | 1,676,808 | |
Bristol-Myers Squibb Co. | | | 68,893 | | | | 3,581,058 | |
Eli Lilly & Co. | | | 36,016 | | | | 4,167,772 | |
Johnson & Johnson | | | 66,662 | | | | 8,602,731 | |
Merck & Co., Inc. | | | 22,219 | | | | 1,697,754 | |
|
| Pharmaceuticals—(Continued) | |
Mylan NV (b) | | | 19,932 | | | | 546,137 | |
Novartis AG | | | 4,243 | | | | 363,406 | |
Pfizer, Inc. | | | 245,676 | | | | 10,723,757 | |
Roche Holding AG | | | 7,242 | | | | 1,790,760 | |
| | | | | | | | |
| | | | | | | 33,150,183 | |
| | | | | | | | |
|
| Professional Services—0.2% | |
Equifax, Inc. | | | 16,928 | | | | 1,576,505 | |
| | | | | | | | |
|
| Road & Rail—1.1% | |
Canadian National Railway Co. | | | 10,866 | | | | 805,279 | |
Union Pacific Corp. | | | 52,433 | | | | 7,247,814 | |
| | | | | | | | |
| | | | | | | 8,053,093 | |
| | | | | | | | |
|
| Semiconductors & Semiconductor Equipment—1.4% | |
Analog Devices, Inc. (a) | | | 9,268 | | | | 795,473 | |
Intel Corp. | | | 30,082 | | | | 1,411,748 | |
Marvell Technology Group, Ltd. (a) | | | 43,493 | | | | 704,152 | |
Maxim Integrated Products, Inc. (a) | | | 21,532 | | | | 1,094,902 | |
Taiwan Semiconductor Manufacturing Co., Ltd. (ADR) | | | 70,512 | | | | 2,602,598 | |
Texas Instruments, Inc. | | | 40,722 | | | | 3,848,229 | |
| | | | | | | | |
| | | | | | | 10,457,102 | |
| | | | | | | | |
|
| Software—1.7% | |
Adobe, Inc. (b) | | | 17,707 | | | | 4,006,032 | |
Check Point Software Technologies, Ltd. (b) | | | 8,621 | | | | 884,945 | |
Microsoft Corp. | | | 63,849 | | | | 6,485,143 | |
Oracle Corp. | | | 28,465 | | | | 1,285,195 | |
| | | | | | | | |
| | | | | | | 12,661,315 | |
| | | | | | | | |
|
| Specialty Retail—0.2% | |
Tractor Supply Co. | | | 8,382 | | | | 699,394 | |
Urban Outfitters, Inc. (b) | | | 20,610 | | | | 684,252 | |
| | | | | | | | |
| | | | | | | 1,383,646 | |
| | | | | | | | |
|
| Technology Hardware, Storage & Peripherals—0.5% | |
Apple, Inc. | | | 13,907 | | | | 2,193,690 | |
Samsung Electronics Co., Ltd. | | | 15,964 | | | | 455,373 | |
Seagate Technology plc (a) | | | 12,994 | | | | 501,439 | |
Western Digital Corp. | | | 8,865 | | | | 327,739 | |
| | | | | | | | |
| | | | | | | 3,478,241 | |
| | | | | | | | |
|
| Textiles, Apparel & Luxury Goods—0.4% | |
Hanesbrands, Inc. | | | 34,084 | | | | 427,073 | |
LVMH Moet Hennessy Louis Vuitton SE | | | 3,279 | | | | 963,520 | |
NIKE, Inc. - Class B | | | 16,814 | | | | 1,246,590 | |
| | | | | | | | |
| | | | | | | 2,637,183 | |
| | | | | | | | |
|
| Tobacco—1.6% | |
Altria Group, Inc. (a) | | | 63,122 | | | | 3,117,596 | |
Japan Tobacco, Inc. | | | 25,700 | | | | 609,730 | |
Philip Morris International, Inc. | | | 118,038 | | | | 7,880,217 | |
| | | | | | | | |
| | | | | | | 11,607,543 | |
| | | | | | | | |
See accompanying notes to financial statements.
BHFTII-7
Brighthouse Funds Trust II
MFS Total Return Portfolio
Schedule of Investments as of December 31, 2018
Common Stocks—(Continued)
| | | | | | | | |
| Security Description | | Shares/
Principal
Amount* | | | Value | |
|
| Trading Companies & Distributors—0.0% | |
HD Supply Holdings, Inc. (b) | | | 8,248 | | | $ | 309,465 | |
| | | | | | | | |
Total Common Stocks
(Cost $357,049,871) | | | | | | | 411,325,353 | |
| | | | | | | | |
|
| U.S. Treasury & Government Agencies—27.7% | |
|
| Agency Sponsored Mortgage - Backed—13.8% | |
Fannie Mae 15 Yr. Pool
2.500%, TBA (c) | | | 1,000,000 | | | | 976,632 | |
3.000%, 12/01/31 | | | 1,174,619 | | | | 1,172,896 | |
3.000%, TBA (c) | | | 1,600,000 | | | | 1,596,565 | |
4.500%, 03/01/19 | | | 710 | | | | 723 | |
4.500%, 06/01/19 | | | 2,313 | | | | 2,355 | |
4.500%, 04/01/20 | | | 5,353 | | | | 5,449 | |
4.500%, 07/01/20 | | | 2,633 | | | | 2,680 | |
5.000%, 07/01/19 | | | 5,154 | | | | 5,239 | |
5.000%, 07/01/20 | | | 7,313 | | | | 7,434 | |
5.000%, 08/01/20 | | | 7,466 | | | | 7,596 | |
5.000%, 12/01/20 | | | 17,154 | | | | 17,438 | |
5.500%, 06/01/19 | | | 5,366 | | | | 5,366 | |
5.500%, 07/01/19 | | | 6,285 | | | | 6,287 | |
5.500%, 08/01/19 | | | 1,192 | | | | 1,192 | |
5.500%, 09/01/19 | | | 6,796 | | | | 6,799 | |
5.500%, 01/01/21 | | | 8,047 | | | | 8,115 | |
5.500%, 03/01/21 | | | 3,073 | | | | 3,099 | |
6.000%, 01/01/21 | | | 14,952 | | | | 15,091 | |
6.000%, 05/01/21 | | | 4,561 | | | | 4,572 | |
Fannie Mae 20 Yr. Pool
3.000%, 07/01/37 | | | 259,625 | | | | 257,116 | |
3.000%, 11/01/37 | | | 502,120 | | | | 497,268 | |
3.500%, 04/01/38 | | | 475,493 | | | | 482,109 | |
Fannie Mae 30 Yr. Pool
3.000%, 09/01/46 | | | 196,566 | | | | 192,350 | |
3.000%, 10/01/46 | | | 785,597 | | | | 768,749 | |
3.000%, 11/01/46 | | | 1,009,913 | | | | 988,254 | |
3.000%, 09/01/48 | | | 675,000 | | | | 659,004 | |
3.500%, 11/01/41 | | | 42,644 | | | | 42,885 | |
3.500%, 01/01/42 | | | 623,159 | | | | 628,218 | |
3.500%, 01/01/43 | | | 216,976 | | | | 218,734 | |
3.500%, 04/01/43 | | | 723,787 | | | | 729,662 | |
3.500%, 05/01/43 | | | 937,629 | | | | 945,191 | |
3.500%, 07/01/43 | | | 1,064,408 | | | | 1,071,600 | |
3.500%, 08/01/43 | | | 363,840 | | | | 366,794 | |
3.500%, 09/01/43 | | | 1,488,990 | | | | 1,499,578 | |
3.500%, 02/01/45 | | | 1,088,193 | | | | 1,093,911 | |
3.500%, 09/01/45 | | | 1,270,478 | | | | 1,275,351 | |
3.500%, 10/01/45 | | | 860,609 | | | | 864,229 | |
3.500%, 01/01/46 | | | 274,848 | | | | 276,036 | |
3.500%, 05/01/46 | | | 516,286 | | | | 517,977 | |
3.500%, 07/01/46 | | | 1,129,963 | | | | 1,133,538 | |
3.500%, 10/01/46 | | | 349,792 | | | | 350,825 | |
3.500%, 12/01/46 | | | 930,734 | | | | 933,198 | |
3.500%, 01/01/47 | | | 134,289 | | | | 134,535 | |
4.000%, 09/01/40 | | | 1,077,985 | | | | 1,108,782 | |
|
| Agency Sponsored Mortgage - Backed—(Continued) | |
Fannie Mae 30 Yr. Pool
4.000%, 11/01/40 | | | 249,146 | | | | 256,267 | |
4.000%, 12/01/40 | | | 572,088 | | | | 588,440 | |
4.000%, 02/01/41 | | | 667,029 | | | | 686,335 | |
4.000%, 06/01/41 | | | 662,405 | | | | 681,311 | |
4.000%, 11/01/41 | | | 220,530 | | | | 226,835 | |
4.000%, 01/01/42 | | | 1,583,946 | | | | 1,629,229 | |
4.000%, 04/01/42 | | | 204,523 | | | | 210,369 | |
4.000%, 10/01/42 | | | 172,783 | | | | 177,721 | |
4.000%, 12/01/42 | | | 192,576 | | | | 198,079 | |
4.000%, 01/01/43 | | | 322,112 | | | | 331,321 | |
4.000%, 04/01/43 | | | 57,908 | | | | 59,562 | |
4.000%, 05/01/43 | | | 649,393 | | | | 667,947 | |
4.000%, 06/01/43 | | | 290,367 | | | | 298,661 | |
4.000%, 07/01/43 | | | 266,394 | | | | 273,184 | |
4.000%, 01/01/44 | | | 120,654 | | | | 124,083 | |
4.000%, 04/01/44 | | | 133,067 | | | | 136,869 | |
4.000%, 05/01/44 | | | 486,543 | | | | 500,412 | |
4.000%, 11/01/44 | | | 237,710 | | | | 242,868 | |
4.000%, 02/01/45 | | | 375,136 | | | | 386,228 | |
4.000%, 06/01/47 | | | 1,028,802 | | | | 1,049,461 | |
4.000%, 10/01/48 | | | 1,578,348 | | | | 1,610,275 | |
4.000%, TBA (c) | | | 500,000 | | | | 509,854 | |
4.500%, 08/01/33 | | | 127,082 | | | | 132,155 | |
4.500%, 03/01/34 | | | 392,560 | | | | 408,882 | |
4.500%, 01/01/40 | | | 142,260 | | | | 149,031 | |
4.500%, 08/01/40 | | | 32,584 | | | | 34,146 | |
4.500%, 02/01/41 | | | 236,689 | | | | 248,035 | |
4.500%, 04/01/41 | | | 397,100 | | | | 416,108 | |
4.500%, 11/01/42 | | | 126,396 | | | | 132,388 | |
4.500%, 01/01/43 | | | 295,741 | | | | 309,906 | |
4.500%, 04/01/44 | | | 1,719,476 | | | | 1,801,838 | |
4.500%, 06/01/44 | | | 173,383 | | | | 181,685 | |
5.000%, 11/01/33 | | | 75,870 | | | | 80,589 | |
5.000%, 03/01/34 | | | 63,383 | | | | 67,444 | |
5.000%, 05/01/34 | | | 26,850 | | | | 28,519 | |
5.000%, 08/01/34 | | | 26,499 | | | | 28,148 | |
5.000%, 09/01/34 | | | 100,066 | | | | 106,288 | |
5.000%, 06/01/35 | | | 65,606 | | | | 69,646 | |
5.000%, 07/01/35 | | | 201,193 | | | | 213,616 | |
5.000%, 08/01/35 | | | 65,693 | | | | 69,800 | |
5.000%, 09/01/35 | | | 43,479 | | | | 46,198 | |
5.000%, 10/01/35 | | | 175,967 | | | | 186,981 | |
5.000%, 07/01/39 | | | 189,807 | | | | 201,941 | |
5.000%, 10/01/39 | | | 105,905 | | | | 111,685 | |
5.000%, 11/01/39 | | | 54,380 | | | | 57,868 | |
5.000%, 11/01/40 | | | 78,551 | | | | 83,277 | |
5.000%, 01/01/41 | | | 6,159 | | | | 6,455 | |
5.000%, 03/01/41 | | | 46,277 | | | | 49,142 | |
5.000%, TBA (c) | | | 300,000 | | | | 314,336 | |
5.500%, 02/01/33 | | | 34,396 | | | | 36,951 | |
5.500%, 05/01/33 | | | 4,369 | | | | 4,638 | |
5.500%, 06/01/33 | | | 132,256 | | | | 142,535 | |
5.500%, 07/01/33 | | | 121,679 | | | | 130,954 | |
5.500%, 11/01/33 | | | 75,285 | | | | 81,033 | |
See accompanying notes to financial statements.
BHFTII-8
Brighthouse Funds Trust II
MFS Total Return Portfolio
Schedule of Investments as of December 31, 2018
U.S. Treasury & Government Agencies—(Continued)
| | | | | | | | |
| Security Description | | Principal
Amount* | | | Value | |
|
| Agency Sponsored Mortgage - Backed—(Continued) | |
Fannie Mae 30 Yr. Pool
5.500%, 12/01/33 | | | 11,584 | | | $ | 12,265 | |
5.500%, 01/01/34 | | | 92,752 | | | | 98,861 | |
5.500%, 02/01/34 | | | 109,782 | | | | 117,700 | |
5.500%, 03/01/34 | | | 32,762 | | | | 35,114 | |
5.500%, 04/01/34 | | | 40,503 | | | | 42,940 | |
5.500%, 05/01/34 | | | 232,153 | | | | 249,763 | |
5.500%, 06/01/34 | | | 273,328 | | | | 294,148 | |
5.500%, 07/01/34 | | | 93,576 | | | | 99,999 | |
5.500%, 09/01/34 | | | 235,544 | | | | 250,391 | |
5.500%, 10/01/34 | | | 361,848 | | | | 388,714 | |
5.500%, 11/01/34 | | | 474,318 | | | | 508,635 | |
5.500%, 12/01/34 | | | 239,334 | | | | 257,601 | |
5.500%, 01/01/35 | | | 276,049 | | | | 297,199 | |
5.500%, 02/01/35 | | | 6,650 | | | | 7,041 | |
5.500%, 04/01/35 | | | 46,467 | | | | 50,023 | |
5.500%, 07/01/35 | | | 16,798 | | | | 17,785 | |
5.500%, 08/01/35 | | | 7,596 | | | | 8,042 | |
5.500%, 09/01/35 | | | 160,298 | | | | 172,695 | |
6.000%, 02/01/32 | | | 67,316 | | | | 72,315 | |
6.000%, 03/01/34 | | | 21,887 | | | | 23,881 | |
6.000%, 04/01/34 | | | 179,639 | | | | 195,070 | |
6.000%, 06/01/34 | | | 186,298 | | | | 203,250 | |
6.000%, 07/01/34 | | | 161,952 | | | | 176,247 | |
6.000%, 08/01/34 | | | 205,200 | | | | 222,099 | |
6.000%, 10/01/34 | | | 145,286 | | | | 158,400 | |
6.000%, 11/01/34 | | | 31,815 | | | | 34,169 | |
6.000%, 12/01/34 | | | 8,369 | | | | 8,983 | |
6.000%, 08/01/35 | | | 25,186 | | | | 27,076 | |
6.000%, 09/01/35 | | | 37,746 | | | | 41,481 | |
6.000%, 10/01/35 | | | 62,836 | | | | 68,164 | |
6.000%, 11/01/35 | | | 8,908 | | | | 9,564 | |
6.000%, 12/01/35 | | | 76,145 | | | | 82,980 | |
6.000%, 02/01/36 | | | 72,526 | | | | 77,906 | |
6.000%, 04/01/36 | | | 56,461 | | | | 61,009 | |
6.000%, 06/01/36 | | | 8,574 | | | | 9,420 | |
6.000%, 07/01/37 | | | 98,001 | | | | 106,842 | |
6.500%, 06/01/31 | | | 25,761 | | | | 28,886 | |
6.500%, 07/01/31 | | | 3,830 | | | | 4,111 | |
6.500%, 09/01/31 | | | 23,706 | | | | 25,661 | |
6.500%, 02/01/32 | | | 14,140 | | | | 15,796 | |
6.500%, 07/01/32 | | | 69,785 | | | | 78,602 | |
6.500%, 08/01/32 | | | 52,179 | | | | 58,735 | |
6.500%, 01/01/33 | | | 29,964 | | | | 33,702 | |
6.500%, 04/01/34 | | | 47,190 | | | | 51,606 | |
6.500%, 06/01/34 | | | 21,788 | | | | 23,707 | |
6.500%, 08/01/34 | | | 15,315 | | | | 16,437 | |
6.500%, 04/01/36 | | | 11,652 | | | | 12,506 | |
6.500%, 05/01/36 | | | 36,318 | | | | 38,979 | |
6.500%, 02/01/37 | | | 65,375 | | | | 72,210 | |
6.500%, 05/01/37 | | | 31,145 | | | | 33,898 | |
6.500%, 07/01/37 | | | 41,323 | | | | 45,120 | |
Fannie Mae Multifamily REMIC Trust (CMO)
2.641%, 1M LIBOR + 0.340%, 04/25/20 (d) | | | 18,449 | | | | 18,431 | |
Fannie Mae Pool
2.280%, 11/01/26 | | | 154,128 | | | | 146,523 | |
|
| Agency Sponsored Mortgage - Backed—(Continued) | |
Fannie Mae Pool
2.410%, 05/01/23 | | | 89,731 | | | | 88,557 | |
2.550%, 05/01/23 | | | 144,053 | | | | 142,957 | |
2.700%, 07/01/25 | | | 121,000 | | | | 119,114 | |
4.600%, 09/01/19 | | | 123,998 | | | | 125,093 | |
5.000%, 03/01/26 | | | 82,578 | | | | 89,982 | |
Fannie Mae REMICS (CMO)
2.000%, 05/25/44 | | | 182,714 | | | | 176,227 | |
3.500%, 05/25/25 | | | 228,192 | | | | 232,148 | |
FannieMae-ACES (CMO)
2.597%, 12/25/26 (d) | | | 511,000 | | | | 486,284 | |
Freddie Mac 15 Yr. Gold Pool
4.500%, 01/01/19 | | | 51 | | | | 51 | |
4.500%, 08/01/19 | | | 428 | | | | 435 | |
4.500%, 02/01/20 | | | 5,611 | | | | 5,712 | |
4.500%, 08/01/24 | | | 141,629 | | | | 146,059 | |
5.500%, 01/01/19 | | | 30 | | | | 30 | |
5.500%, 04/01/19 | | | 251 | | | | 251 | |
5.500%, 06/01/19 | | | 363 | | | | 363 | |
5.500%, 08/01/19 | | | 332 | | | | 332 | |
5.500%, 02/01/20 | | | 838 | | | | 840 | |
6.000%, 08/01/19 | | | 4,943 | | | | 4,949 | |
6.000%, 09/01/19 | | | 1,249 | | | | 1,249 | |
6.000%, 11/01/19 | | | 2,108 | | | | 2,111 | |
6.000%, 05/01/21 | | | 5,596 | | | | 5,662 | |
6.000%, 10/01/21 | | | 19,617 | | | | 19,889 | |
Freddie Mac 20 Yr. Gold Pool
3.000%, 01/01/38 | | | 831,345 | | | | 822,378 | |
3.500%, 11/01/37 | | | 553,410 | | | | 559,284 | |
3.500%, 05/01/38 | | | 166,249 | | | | 168,553 | |
4.000%, 08/01/37 | | | 111,848 | | | | 115,357 | |
Freddie Mac 30 Yr. Gold Pool
3.000%, 10/01/42 | | | 529,411 | | | | 520,303 | |
3.000%, 04/01/43 | | | 1,177,238 | | | | 1,157,066 | |
3.000%, 05/01/43 | | | 1,034,068 | | | | 1,016,339 | |
3.000%, 05/01/46 | | | 521,105 | | | | 509,343 | |
3.000%, 10/01/46 | | | 981,940 | | | | 959,776 | |
3.000%, 11/01/46 | | | 1,887,470 | | | | 1,843,831 | |
3.000%, 03/01/48 | | | 479,725 | | | | 467,705 | |
3.000%, 09/01/48 | | | 148,878 | | | | 145,173 | |
3.500%, 02/01/42 | | | 499,566 | | | | 503,400 | |
3.500%, 04/01/42 | | | 333,407 | | | | 335,966 | |
3.500%, 12/01/42 | | | 795,493 | | | | 801,599 | |
3.500%, 04/01/43 | | | 228,490 | | | | 230,244 | |
3.500%, 07/01/43 | | | 47,182 | | | | 47,539 | |
3.500%, 08/01/43 | | | 499,481 | | | | 503,161 | |
3.500%, 12/01/45 | | | 507,403 | | | | 509,257 | |
3.500%, 11/01/46 | | | 404,569 | | | | 405,467 | |
3.500%, 12/01/46 | | | 1,967,844 | | | | 1,972,211 | |
3.500%, 01/01/47 | | | 1,372,296 | | | | 1,375,342 | |
3.500%, 09/01/48 | | | 794,337 | | | | 794,332 | |
4.000%, 11/01/40 | | | 598,417 | | | | 615,731 | |
4.000%, 01/01/41 | | | 1,255,330 | | | | 1,291,649 | |
4.000%, 04/01/44 | | | 401,075 | | | | 409,951 | |
4.000%, 08/01/47 | | | 1,157,488 | | | | 1,180,871 | |
4.500%, 04/01/35 | | | 34,945 | | | | 36,346 | |
See accompanying notes to financial statements.
BHFTII-9
Brighthouse Funds Trust II
MFS Total Return Portfolio
Schedule of Investments as of December 31, 2018
U.S. Treasury & Government Agencies—(Continued)
| | | | | | | | |
| Security Description | | Principal
Amount* | | | Value | |
|
| Agency Sponsored Mortgage - Backed—(Continued) | |
Freddie Mac 30 Yr. Gold Pool
4.500%, 07/01/39 | | | 196,765 | | | $ | 205,769 | |
4.500%, 09/01/39 | | | 110,704 | | | | 115,940 | |
4.500%, 10/01/39 | | | 63,947 | | | | 66,975 | |
4.500%, 12/01/39 | | | 97,778 | | | | 102,410 | |
4.500%, 05/01/42 | | | 174,920 | | | | 183,195 | |
5.000%, 09/01/33 | | | 150,650 | | | | 159,902 | |
5.000%, 03/01/34 | | | 30,264 | | | | 32,228 | |
5.000%, 04/01/34 | | | 26,883 | | | | 28,531 | |
5.000%, 08/01/35 | | | 34,848 | | | | 36,977 | |
5.000%, 10/01/35 | | | 75,991 | | | | 80,635 | |
5.000%, 11/01/35 | | | 62,529 | | | | 66,344 | |
5.000%, 12/01/36 | | | 41,651 | | | | 44,206 | |
5.000%, 07/01/39 | | | 309,162 | | | | 327,327 | |
5.500%, 12/01/33 | | | 185,451 | | | | 200,827 | |
5.500%, 01/01/34 | | | 121,219 | | | | 131,064 | |
5.500%, 04/01/34 | | | 22,000 | | | | 23,279 | |
5.500%, 11/01/34 | | | 23,365 | | | | 25,215 | |
5.500%, 12/01/34 | | | 8,900 | | | | 9,418 | |
5.500%, 05/01/35 | | | 24,470 | | | | 25,977 | |
5.500%, 09/01/35 | | | 31,510 | | | | 33,608 | |
5.500%, 10/01/35 | | | 41,936 | | | | 44,800 | |
6.000%, 04/01/34 | | | 94,681 | | | | 103,119 | |
6.000%, 07/01/34 | | | 26,374 | | | | 28,505 | |
6.000%, 08/01/34 | | | 184,953 | | | | 201,201 | |
6.000%, 09/01/34 | | | 2,479 | | | | 2,666 | |
6.000%, 07/01/35 | | | 32,381 | | | | 35,356 | |
6.000%, 08/01/35 | | | 39,684 | | | | 43,314 | |
6.000%, 11/01/35 | | | 58,920 | | | | 64,401 | |
6.000%, 03/01/36 | | | 21,071 | | | | 22,660 | |
6.000%, 10/01/36 | | | 33,814 | | | | 36,842 | |
6.000%, 03/01/37 | | | 7,461 | | | | 8,023 | |
6.000%, 05/01/37 | | | 57,237 | | | | 62,419 | |
6.000%, 06/01/37 | | | 38,778 | | | | 42,372 | |
6.500%, 05/01/34 | | | 12,237 | | | | 13,286 | |
6.500%, 06/01/34 | | | 59,670 | | | | 65,355 | |
6.500%, 08/01/34 | | | 50,225 | | | | 54,527 | |
6.500%, 10/01/34 | | | 59,007 | | | | 66,656 | |
6.500%, 11/01/34 | | | 41,883 | | | | 45,470 | |
6.500%, 05/01/37 | | | 60,038 | | | | 66,951 | |
6.500%, 07/01/37 | | | 59,401 | | | | 66,069 | |
Freddie Mac Multifamily Structured Pass-Through Certificates (CMO)
0.197%, 11/25/27 (d) (e) | | | 5,207,000 | | | | 95,134 | |
0.240%, 12/25/27 (d) (e) | | | 3,235,000 | | | | 71,335 | |
0.275%, 11/25/24 (d) (e) | | | 4,908,000 | | | | 81,502 | |
0.279%, 09/25/27 (d) (e) | | | 3,341,000 | | | | 81,452 | |
0.288%, 12/25/27 (d) (e) | | | 3,579,000 | | | | 90,566 | |
0.292%, 11/25/27 (d) (e) | | | 3,693,583 | | | | 83,550 | |
0.312%, 11/25/32 (d) (e) | | | 2,840,428 | | | | 89,835 | |
0.315%, 08/25/24 (d) (e) | | | 4,897,000 | | | | 94,035 | |
0.327%, 11/25/27 (d) (e) | | | 3,361,585 | | | | 88,064 | |
0.330%, 08/25/27 (d) (e) | | | 3,107,000 | | | | 86,808 | |
0.366%, 10/25/24 (d) (e) | | | 6,509,054 | | | | 117,731 | |
0.369%, 09/25/27 (d) (e) | | | 2,758,385 | | | | 78,466 | |
0.370%, 12/25/27 (d) (e) | | | 5,736,309 | | | | 162,826 | |
0.415%, 08/25/24 (d) (e) | | | 8,948,239 | | | | 181,205 | |
|
| Agency Sponsored Mortgage - Backed—(Continued) | |
Freddie Mac Multifamily Structured Pass-Through Certificates (CMO)
0.437%, 08/25/27 (d) (e) | | | 2,148,354 | | | | 68,654 | |
0.509%, 07/25/24 (d) (e) | | | 4,483,000 | | | | 123,988 | |
0.579%, 07/25/27 (d) (e) | | | 3,880,187 | | | | 163,086 | |
0.618%, 07/25/24 (d) (e) | | | 1,649,211 | | | | 46,293 | |
0.636%, 06/25/27 (d) (e) | | | 4,356,000 | | | | 217,769 | |
0.753%, 06/25/27 (d) (e) | | | 1,479,535 | | | | 78,098 | |
0.882%, 04/25/24 (d) (e) | | | 1,977,058 | | | | 74,820 | |
1.869%, 11/25/19 | | | 311,354 | | | | 308,744 | |
2.456%, 08/25/19 | | | 219,110 | | | | 218,334 | |
2.510%, 11/25/22 | | | 489,000 | | | | 481,675 | |
2.670%, 12/25/24 | | | 507,000 | | | | 496,759 | |
2.673%, 03/25/26 | | | 676,000 | | | | 655,354 | |
2.716%, 06/25/22 | | | 346,271 | | | | 343,938 | |
2.791%, 01/25/22 | | | 474,000 | | | | 472,134 | |
3.010%, 07/25/25 | | | 134,000 | | | | 133,288 | |
3.060%, 07/25/23 (d) | | | 219,000 | | | | 219,888 | |
3.064%, 08/25/24 (d) | | | 255,000 | | | | 255,716 | |
3.111%, 02/25/23 | | | 695,000 | | | | 699,451 | |
3.117%, 06/25/27 | | | 354,000 | | | | 350,093 | |
3.151%, 11/25/25 | | | 317,000 | | | | 317,645 | |
3.171%, 10/25/24 | | | 424,000 | | | | 426,664 | |
3.187%, 09/25/27 (d) | | | 242,000 | | | | 239,758 | |
3.194%, 07/25/27 | | | 389,000 | | | | 386,408 | |
3.224%, 03/25/27 | | | 334,000 | | | | 333,356 | |
3.244%, 08/25/27 | | | 920,000 | | | | 916,418 | |
3.250%, 04/25/23 (d) | | | 803,000 | | | | 812,005 | |
3.300%, 10/25/26 | | | 310,000 | | | | 311,184 | |
3.303%, 11/25/27 (d) | | | 85,000 | | | | 84,875 | |
3.320%, 02/25/23 (d) | | | 227,000 | | | | 230,182 | |
3.413%, 12/25/26 | | | 248,000 | | | | 250,839 | |
3.430%, 01/25/27 (d) | | | 242,707 | | | | 245,774 | |
3.458%, 08/25/23 (d) | | | 835,000 | | | | 851,566 | |
3.650%, 02/25/28 (d) | | | 285,000 | | | | 292,060 | |
3.900%, 06/25/51 | | | 528,000 | | | | 551,053 | |
5.085%, 03/25/19 | | | 1,021,047 | | | | 1,020,218 | |
Ginnie Mae I 30 Yr. Pool
3.500%, 12/15/41 | | | 331,919 | | | | 335,749 | |
3.500%, 02/15/42 | | | 106,615 | | | | 107,840 | |
4.500%, 09/15/33 | | | 71,791 | | | | 74,947 | |
4.500%, 11/15/39 | | | 216,339 | | | | 225,886 | |
4.500%, 03/15/40 | | | 245,546 | | | | 259,464 | |
4.500%, 04/15/40 | | | 257,637 | | | | 269,016 | |
4.500%, 06/15/40 | | | 106,794 | | | | 111,618 | |
5.000%, 03/15/34 | | | 24,562 | | | | 26,039 | |
5.000%, 06/15/34 | | | 59,212 | | | | 62,783 | |
5.000%, 12/15/34 | | | 26,344 | | | | 27,922 | |
5.000%, 06/15/35 | | | 7,010 | | | | 7,291 | |
5.500%, 11/15/32 | | | 129,143 | | | | 137,460 | |
5.500%, 08/15/33 | | | 202,575 | | | | 218,937 | |
5.500%, 12/15/33 | | | 108,808 | | | | 117,742 | |
5.500%, 09/15/34 | | | 94,447 | | | | 102,163 | |
5.500%, 10/15/35 | | | 11,468 | | | | 12,180 | |
6.000%, 12/15/28 | | | 27,630 | | | | 29,957 | |
6.000%, 12/15/31 | | | 26,598 | | | | 28,958 | |
6.000%, 03/15/32 | | | 1,088 | | | | 1,167 | |
See accompanying notes to financial statements.
BHFTII-10
Brighthouse Funds Trust II
MFS Total Return Portfolio
Schedule of Investments as of December 31, 2018
U.S. Treasury & Government Agencies—(Continued)
| | | | | | | | |
| Security Description | | Principal
Amount* | | | Value | |
|
| Agency Sponsored Mortgage - Backed—(Continued) | |
Ginnie Mae I 30 Yr. Pool
6.000%, 10/15/32 | | | 131,730 | | | $ | 143,437 | |
6.000%, 01/15/33 | | | 30,341 | | | | 32,589 | |
6.000%, 02/15/33 | | | 1,472 | | | | 1,580 | |
6.000%, 04/15/33 | | | 134,581 | | | | 146,531 | |
6.000%, 08/15/33 | | | 1,004 | | | | 1,078 | |
6.000%, 07/15/34 | | | 76,698 | | | | 83,742 | |
6.000%, 09/15/34 | | | 24,922 | | | | 26,748 | |
6.000%, 01/15/38 | | | 111,891 | | | | 122,623 | |
Ginnie Mae II 30 Yr. Pool
3.000%, 11/20/47 | | | 2,352,035 | | | | 2,314,909 | |
3.000%, 01/20/48 | | | 3,688,374 | | | | 3,629,975 | |
3.000%, 02/20/48 | | | 179,724 | | | | 176,877 | |
3.000%, 03/20/48 | | | 686,603 | | | | 675,726 | |
3.000%, 04/20/48 | | | 635,879 | | | | 625,803 | |
3.500%, 06/20/43 | | | 606,379 | | | | 613,670 | |
3.500%, 07/20/43 | | | 767,750 | | | | 776,983 | |
3.500%, 11/20/47 | | | 195,490 | | | | 196,914 | |
3.500%, 03/20/48 | | | 2,447,165 | | | | 2,464,995 | |
3.500%, 08/20/48 | | | 1,105,153 | | | | 1,113,205 | |
3.500%, 09/20/48 | | | 470,480 | | | | 473,908 | |
3.500%, 12/20/48 | | | 500,000 | | | | 503,643 | |
4.000%, 01/20/41 | | | 734,406 | | | | 758,677 | |
4.000%, 02/20/41 | | | 182,937 | | | | 188,972 | |
4.000%, 04/20/41 | | | 140,163 | | | | 144,790 | |
4.000%, 02/20/42 | | | 186,594 | | | | 192,740 | |
4.000%, 06/20/48 | | | 448,028 | | | | 459,124 | |
4.000%, 07/20/48 | | | 373,623 | | | | 382,877 | |
4.000%, 11/20/48 | | | 997,892 | | | | 1,022,606 | |
4.500%, 07/20/33 | | | 14,841 | | | | 15,495 | |
4.500%, 09/20/33 | | | 8,254 | | | | 8,615 | |
4.500%, 12/20/34 | | | 5,359 | | | | 5,582 | |
4.500%, 03/20/35 | | | 33,752 | | | | 35,218 | |
4.500%, 01/20/41 | | | 188,697 | | | | 198,015 | |
4.500%, TBA (c) | | | 550,000 | | | | 569,126 | |
5.000%, 07/20/33 | | | 26,973 | | | | 28,636 | |
6.000%, 01/20/35 | | | 33,389 | | | | 36,423 | |
6.000%, 02/20/35 | | | 17,037 | | | | 18,941 | |
6.000%, 04/20/35 | | | 29,316 | | | | 31,801 | |
Government National Mortgage Association (CMO)
0.659%, 02/16/59 (d) (e) | | | 2,436,978 | | | | 147,589 | |
| | | | | | | | |
| | | | | | | 101,379,799 | |
| | | | | | | | |
|
| U.S. Treasury—13.9% | |
U.S. Treasury Bonds
2.500%, 02/15/45 | | | 68,000 | | | | 61,741 | |
2.875%, 05/15/43 | | | 14,475,100 | | | | 14,156,077 | |
2.875%, 11/15/46 | | | 5,439,000 | | | | 5,297,910 | |
3.000%, 11/15/45 | | | 350,000 | | | | 349,907 | |
3.000%, 02/15/48 (a) | | | 350,000 | | | | 348,736 | |
3.500%, 02/15/39 | | | 5,026,000 | | | | 5,504,880 | |
4.500%, 02/15/36 | | | 179,000 | | | | 220,820 | |
4.500%, 08/15/39 | | | 743,000 | | | | 927,167 | |
5.000%, 05/15/37 | | | 232,000 | | | | 304,812 | |
5.250%, 02/15/29 | | | 16,000 | | | | 19,569 | |
|
| U.S. Treasury—(Continued) | |
U.S. Treasury Bonds
5.375%, 02/15/31 | | | 276,000 | | | | 350,816 | |
6.250%, 08/15/23 | | | 80,000 | | | | 92,923 | |
U.S. Treasury Notes
1.750%, 11/30/21 | | | 28,134,000 | | | | 27,565,323 | |
1.750%, 09/30/22 | | | 1,741,000 | | | | 1,695,065 | |
2.000%, 11/15/26 | | | 1,875,000 | | | | 1,791,103 | |
2.250%, 08/15/27 (a) | | | 733,000 | | | | 709,917 | |
2.500%, 08/15/23 | | | 16,705,000 | | | | 16,699,418 | |
3.125%, 05/15/21 | | | 3,504,000 | | | | 3,555,420 | |
3.500%, 05/15/20 | | | 22,011,000 | | | | 22,284,041 | |
| | | | | | | | |
| | | | | | | 101,935,645 | |
| | | | | | | | |
Total U.S. Treasury & Government Agencies
(Cost $203,162,997) | | | | | | | 203,315,444 | |
| | | | | | | | |
|
| Corporate Bonds & Notes—11.7% | |
|
| Aerospace/Defense—0.2% | |
L3 Technologies, Inc.
3.850%, 06/15/23 | | | 862,000 | | | | 863,288 | |
United Technologies Corp.
4.625%, 11/16/48 | | | 562,000 | | | | 543,479 | |
| | | | | | | | |
| | | | | | | 1,406,767 | |
| | | | | | | | |
|
| Agriculture—0.1% | |
Imperial Brands Finance plc
2.950%, 07/21/20 (144A) (a) | | | 828,000 | | | | 815,501 | |
| | | | | | | | |
|
| Auto Manufacturers—0.2% | |
| General Motors Co. | |
5.150%, 04/01/38 | | | 235,000 | | | | 200,969 | |
6.750%, 04/01/46 | | | 374,000 | | | | 362,449 | |
| General Motors Financial Co., Inc. | |
3.200%, 07/06/21 | | | 776,000 | | | | 757,972 | |
4.350%, 04/09/25 | | | 360,000 | | | | 341,115 | |
| | | | | | | | |
| | | | | | | 1,662,505 | |
| | | | | | | | |
|
| Auto Parts & Equipment—0.1% | |
Lear Corp.
3.800%, 09/15/27 | | | 585,000 | | | | 534,678 | |
| | | | | | | | |
|
| Banks—2.7% | |
ABN AMRO Bank NV
4.800%, 04/18/26 (144A) | | | 800,000 | | | | 798,648 | |
Banco de Credito del Peru
5.375%, 09/16/20 | | | 835,000 | | | | 861,720 | |
Bank of America Corp. | | | | | | | | |
3.004%, 3M LIBOR + 0.790%, 12/20/23 (d) | | | 766,000 | | | | 743,676 | |
3.366%, 3M LIBOR + 0.810%, 01/23/26 (d) | | | 591,000 | | | | 565,289 | |
3.500%, 04/19/26 | | | 583,000 | | | | 561,505 | |
4.100%, 07/24/23 (a) | | | 1,270,000 | | | | 1,287,148 | |
4.125%, 01/22/24 | | | 1,357,000 | | | | 1,375,399 | |
5.490%, 03/15/19 | | | 196,000 | | | | 196,889 | |
See accompanying notes to financial statements.
BHFTII-11
Brighthouse Funds Trust II
MFS Total Return Portfolio
Schedule of Investments as of December 31, 2018
Corporate Bonds & Notes—(Continued)
| | | | | | | | |
| Security Description | | Principal
Amount* | | | Value | |
|
| Banks—(Continued) | |
Bank of New York Mellon Corp. (The)
2.600%, 08/17/20 | | | 1,029,000 | | | $ | 1,022,055 | |
BBVA Bancomer S.A. | |
6.750%, 09/30/22 (144A) (a) | | | 810,000 | | | | 853,546 | |
Goldman Sachs Group, Inc. (The)
3.850%, 01/26/27 | | | 616,000 | | | | 579,748 | |
JPMorgan Chase & Co.
3.200%, 01/25/23 | | | 1,756,000 | | | | 1,730,318 | |
3.782%, 3M LIBOR + 1.337%, 02/01/28 (d) | | | 1,362,000 | | | | 1,322,832 | |
3.897%, 3M LIBOR + 1.220%, 01/23/49 (d) | | | 400,000 | | | | 351,339 | |
KFW
4.875%, 06/17/19 | | | 1,290,000 | | | | 1,303,747 | |
Morgan Stanley
3.125%, 01/23/23 | | | 480,000 | | | | 468,562 | |
3.625%, 01/20/27 | | | 1,695,000 | | | | 1,611,791 | |
3.875%, 04/29/24 | | | 557,000 | | | | 554,298 | |
4.000%, 07/23/25 (a) | | | 396,000 | | | | 390,848 | |
PNC Bank N.A.
2.300%, 06/01/20 | | | 719,000 | | | | 709,213 | |
Royal Bank of Scotland Group plc
3.875%, 09/12/23 | | | 1,128,000 | | | | 1,081,331 | |
UBS Group Funding Switzerland AG
3.491%, 05/23/23 (144A) | | | 700,000 | | | | 682,621 | |
4.125%, 04/15/26 (144A) (a) (f) | | | 838,000 | | | | 833,009 | |
4.253%, 03/23/28 (144A) (a) | | | 200,000 | | | | 197,314 | |
| | | | | | | | |
| | | | | | | 20,082,846 | |
| | | | | | | | |
|
| Beverages—0.3% | |
Anheuser-Busch InBev Worldwide, Inc.
8.000%, 11/15/39 | | | 706,000 | | | | 895,355 | |
Constellation Brands, Inc.
3.500%, 05/09/27 | | | 1,077,000 | | | | 997,818 | |
| | | | | | | | |
| | | | | | | 1,893,173 | |
| | | | | | | | |
|
| Biotechnology—0.1% | |
Celgene Corp.
2.875%, 08/15/20 (a) | | | 504,000 | | | | 500,425 | |
| | | | | | | | |
|
| Building Materials—0.2% | |
CRH America Finance, Inc.
4.500%, 04/04/48 (144A) | | | 362,000 | | | | 322,208 | |
Martin Marietta Materials, Inc.
3.500%, 12/15/27 (a) | | | 297,000 | | | | 270,943 | |
Masco Corp.
4.375%, 04/01/26 | | | 623,000 | | | | 623,371 | |
| | | | | | | | |
| | | | | | | 1,216,522 | |
| | | | | | | | |
|
| Chemicals—0.2% | |
SASOL Financing USA LLC
5.875%, 03/27/24 | | | 502,000 | | | | 500,907 | |
| Sherwin-Williams Co. (The) | |
2.250%, 05/15/20 | | | 344,000 | | | | 338,684 | |
4.500%, 06/01/47 | | | 402,000 | | | | 362,999 | |
| | | | | | | | |
| | | | | | | 1,202,590 | |
| | | | | | | | |
|
| Commercial Services—0.2% | |
ERAC USA Finance LLC
7.000%, 10/15/37 (144A) | | | 1,115,000 | | | | 1,387,567 | |
| | | | | | | | |
|
| Computers—0.3% | |
| Apple, Inc. | |
2.850%, 02/23/23 | | | 1,176,000 | | | | 1,161,515 | |
3.350%, 02/09/27 | | | 745,000 | | | | 728,845 | |
3.850%, 05/04/43 | | | 370,000 | | | | 352,187 | |
| | | | | | | | |
| | | | | | | 2,242,547 | |
| | | | | | | | |
|
| Diversified Financial Services—0.9% | |
AerCap Ireland Capital DAC / AerCap Global Aviation Trust
3.650%, 07/21/27 | | | 520,000 | | | | 450,672 | |
Capital One Financial Corp. | |
2.500%, 05/12/20 | | | 689,000 | | | | 679,986 | |
3.750%, 03/09/27 | | | 820,000 | | | | 762,023 | |
Charles Schwab Corp. (The)
3.200%, 01/25/28 (a) | | | 891,000 | | | | 854,397 | |
E*TRADE Financial Corp.
2.950%, 08/24/22 | | | 338,000 | | | | 327,895 | |
Intercontinental Exchange, Inc. | |
2.350%, 09/15/22 | | | 487,000 | | | | 470,828 | |
2.750%, 12/01/20 | | | 301,000 | | | | 299,056 | |
4.000%, 10/15/23 | | | 832,000 | | | | 851,604 | |
Raymond James Financial, Inc.
4.950%, 07/15/46 | | | 778,000 | | | | 748,438 | |
Visa, Inc.
3.150%, 12/14/25 | | | 983,000 | | | | 966,452 | |
| | | | | | | | |
| | | | | | | 6,411,351 | |
| | | | | | | | |
|
| Electric—0.8% | |
Berkshire Hathaway Energy Co.
3.750%, 11/15/23 (a) | | | 440,000 | | | | 446,220 | |
Duke Energy Corp.
2.650%, 09/01/26 | | | 131,000 | | | | 119,326 | |
Enel Finance International NV
4.875%, 06/14/29 (144A) | | | 696,000 | | | | 664,357 | |
Exelon Corp.
3.400%, 04/15/26 | | | 1,137,000 | | | | 1,081,513 | |
Oncor Electric Delivery Co. LLC
5.750%, 03/15/29 (144A) (f) | | | 795,000 | | | | 928,433 | |
| PPL Capital Funding, Inc. | |
3.400%, 06/01/23 | | | 880,000 | | | | 870,585 | |
5.000%, 03/15/44 | | | 296,000 | | | | 302,102 | |
Progress Energy, Inc.
3.150%, 04/01/22 | | | 1,083,000 | | | | 1,066,591 | |
State Grid Overseas Investment, Ltd.
2.750%, 05/07/19 (144A) (f) | | | 778,000 | | | | 777,204 | |
| | | | | | | | |
| | | | | | | 6,256,331 | |
| | | | | | | | |
|
| Environmental Control—0.1% | |
Republic Services, Inc.
3.950%, 05/15/28 (a) | | | 446,000 | | | | 446,560 | |
| | | | | | | | |
See accompanying notes to financial statements.
BHFTII-12
Brighthouse Funds Trust II
MFS Total Return Portfolio
Schedule of Investments as of December 31, 2018
Corporate Bonds & Notes—(Continued)
| | | | | | | | |
| Security Description | | Principal
Amount* | | | Value | |
|
| Food—0.2% | |
Conagra Brands, Inc.
5.300%, 11/01/38 | | | 232,000 | | | $ | 219,458 | |
5.400%, 11/01/48 | | | 308,000 | | | | 284,014 | |
Danone S.A.
2.947%, 11/02/26 (144A) | | | 1,133,000 | | | | 1,034,297 | |
Kraft Heinz Foods Co.
5.000%, 07/15/35 | | | 254,000 | | | | 238,786 | |
| | | | | | | | |
| | | | | | | 1,776,555 | |
| | | | | | | | |
|
| Gas—0.0% | |
NiSource, Inc.
5.650%, 02/01/45 | | | 176,000 | | | | 191,849 | |
| | | | | | | | |
|
| Healthcare-Products—0.8% | |
Abbott Laboratories
4.900%, 11/30/46 (a) | | | 749,000 | | | | 787,310 | |
Becton Dickinson & Co.
2.675%, 12/15/19 | | | 520,000 | | | | 515,063 | |
3.125%, 11/08/21 | | | 344,000 | | | | 339,257 | |
4.669%, 06/06/47 | | | 729,000 | | | | 686,590 | |
Medtronic, Inc.
4.375%, 03/15/35 | | | 446,000 | | | | 457,101 | |
Thermo Fisher Scientific, Inc.
2.950%, 09/19/26 | | | 851,000 | | | | 785,759 | |
3.200%, 08/15/27 | | | 1,100,000 | | | | 1,022,891 | |
Zimmer Biomet Holdings, Inc.
3.550%, 04/01/25 | | | 955,000 | | | | 908,075 | |
3.554%, 3M LIBOR + 0.750%, 03/19/21 (d) | | | 313,000 | | | | 310,069 | |
| | | | | | | | |
| | | | | | | 5,812,115 | |
| | | | | | | | |
|
| Healthcare-Services—0.2% | |
Laboratory Corp. of America Holdings
3.200%, 02/01/22 | | | 213,000 | | | | 211,379 | |
3.250%, 09/01/24 | | | 558,000 | | | | 534,005 | |
4.700%, 02/01/45 | | | 267,000 | | | | 248,882 | |
Northwell Healthcare, Inc.
3.979%, 11/01/46 | | | 57,000 | | | | 51,999 | |
4.260%, 11/01/47 | | | 456,000 | | | | 433,993 | |
| | | | | | | | |
| | | | | | | 1,480,258 | |
| | | | | | | | |
|
| Household Products/Wares—0.2% | |
Reckitt Benckiser Treasury Services plc
2.750%, 06/26/24 (144A) | | | 348,000 | | | | 328,876 | |
3.625%, 09/21/23 (144A) | | | 1,070,000 | | | | 1,076,823 | |
| | | | | | | | |
| | | | | | | 1,405,699 | |
| | | | | | | | |
|
| Insurance—0.6% | |
American International Group, Inc.
4.125%, 02/15/24 (a) | | | 750,000 | | | | 753,019 | |
4.875%, 06/01/22 | | | 1,770,000 | | | | 1,836,332 | |
Berkshire Hathaway, Inc.
3.125%, 03/15/26 | | | 390,000 | | | | 378,192 | |
Liberty Mutual Group, Inc.
4.850%, 08/01/44 (144A) | | | 484,000 | | | | 470,584 | |
|
| Insurance—(Continued) | |
Marsh & McLennan Cos., Inc.
4.800%, 07/15/21 (a) | | | 920,000 | | | | 948,093 | |
| | | | | | | | |
| | | | | | | 4,386,220 | |
| | | | | | | | |
|
| Internet—0.2% | |
Booking Holdings, Inc.
2.750%, 03/15/23 | | | 1,315,000 | | | | 1,262,104 | |
| | | | | | | | |
|
| Investment Company Security—0.2% | |
Temasek Financial I, Ltd.
2.375%, 01/23/23 (144A) | | | 1,790,000 | | | | 1,733,369 | |
| | | | | | | | |
|
| Lodging—0.1% | |
Marriott International, Inc.
4.000%, 04/15/28 (a) | | | 698,000 | | | | 671,401 | |
| | | | | | | | |
|
| Machinery-Diversified—0.2% | |
CNH Industrial Capital LLC
4.200%, 01/15/24 | | | 675,000 | | | | 667,030 | |
Roper Technologies, Inc.
4.200%, 09/15/28 | | | 281,000 | | | | 278,372 | |
Wabtec Corp.
4.700%, 09/15/28 | | | 648,000 | | | | 608,095 | |
| | | | | | | | |
| | | | | | | 1,553,497 | |
| | | | | | | | |
|
| Media—0.3% | |
Charter Communications Operating LLC / Charter Communications Operating Capital Corp.
4.908%, 07/23/25 | | | 523,000 | | | | 519,813 | |
Time Warner Entertainment Co. L.P.
8.375%, 07/15/33 | | | 1,240,000 | | | | 1,512,771 | |
| | | | | | | | |
| | | | | | | 2,032,584 | |
| | | | | | | | |
|
| Mining—0.1% | |
Glencore Funding LLC
4.000%, 03/27/27 (144A) (a) | | | 200,000 | | | | 182,293 | |
4.125%, 05/30/23 (144A) | | | 684,000 | | | | 671,680 | |
| | | | | | | | |
| | | | | | | 853,973 | |
| | | | | | | | |
|
| Oil & Gas—0.4% | |
BP Capital Markets plc
4.500%, 10/01/20 | | | 306,000 | | | | 313,245 | |
Eni S.p.A.
4.750%, 09/12/28 (144A) | | | 617,000 | | | | 603,504 | |
Equinor ASA
7.750%, 06/15/23 | | | 100,000 | | | | 118,249 | |
Marathon Petroleum Corp.
3.625%, 09/15/24 (a) | | | 858,000 | | | | 834,808 | |
4.750%, 09/15/44 | | | 583,000 | | | | 514,626 | |
Valero Energy Corp.
4.900%, 03/15/45 | | | 896,000 | | | | 843,235 | |
| | | | | | | | |
| | | | | | | 3,227,667 | |
| | | | | | | | |
See accompanying notes to financial statements.
BHFTII-13
Brighthouse Funds Trust II
MFS Total Return Portfolio
Schedule of Investments as of December 31, 2018
Corporate Bonds & Notes—(Continued)
| | | | | | | | |
| Security Description | | Principal
Amount* | | | Value | |
|
| Pharmaceuticals—0.1% | |
Cigna Corp
4.125%, 11/15/25 (144A) | | | 823,000 | | | $ | 822,222 | |
| | | | | | | | |
|
| Pipelines—0.7% | |
APT Pipelines, Ltd.
4.200%, 03/23/25 (144A) | | | 1,228,000 | | | | 1,196,454 | |
4.250%, 07/15/27 (144A) | | | 93,000 | | | | 90,542 | |
Enterprise Products Operating LLC
6.500%, 01/31/19 (a) | | | 908,000 | | | | 909,997 | |
Kinder Morgan Energy Partners L.P.
4.150%, 02/01/24 | | | 691,000 | | | | 685,656 | |
MPLX L.P.
4.500%, 04/15/38 | | | 297,000 | | | | 259,666 | |
ONEOK, Inc.
4.950%, 07/13/47 | | | 869,000 | | | | 803,823 | |
Sabine Pass Liquefaction LLC
5.000%, 03/15/27 | | | 1,100,000 | | | | 1,104,221 | |
| | | | | | | | |
| | | | | | | 5,050,359 | |
| | | | | | | | |
|
| Real Estate Investment Trusts—0.3% | |
American Tower Corp.
3.000%, 06/15/23 | | | 415,000 | | | | 399,257 | |
3.600%, 01/15/28 | | | 415,000 | | | | 387,979 | |
Crown Castle International Corp.
3.650%, 09/01/27 | | | 1,014,000 | | | | 940,555 | |
GLP Capital L.P. / GLP Financing II, Inc.
5.300%, 01/15/29 | | | 574,000 | | | | 561,389 | |
| | | | | | | | |
| | | | | | | 2,289,180 | |
| | | | | | | | |
|
| Retail—0.2% | |
Dollar Tree, Inc.
4.000%, 05/15/25 | | | 349,000 | | | | 335,658 | |
Home Depot, Inc. (The)
3.900%, 06/15/47 | | | 471,000 | | | | 445,019 | |
Tapestry, Inc.
4.125%, 07/15/27 | | | 572,000 | | | | 535,511 | |
| | | | | | | | |
| | | | | | | 1,316,188 | |
| | | | | | | | |
|
| Semiconductors—0.2% | |
Broadcom Corp. / Broadcom Cayman Finance, Ltd.
3.500%, 01/15/28 | | | 837,000 | | | | 725,609 | |
Intel Corp.
4.100%, 05/11/47 | | | 591,000 | | | | 568,082 | |
| | | | | | | | |
| | | | | | | 1,293,691 | |
| | | | | | | | |
|
| Shipbuilding—0.0% | |
Huntington Ingalls Industries, Inc.
3.483%, 12/01/27 | | | 250,000 | | | | 232,857 | |
| | | | | | | | |
|
| Software—0.2% | |
Fidelity National Information Services, Inc.
4.500%, 08/15/46 | | | 210,000 | | | | 191,239 | |
4.750%, 05/15/48 | | | 498,000 | | | | 463,543 | |
|
| Software—(Continued) | |
Microsoft Corp.
4.250%, 02/06/47 | | | 1,092,000 | | | | 1,148,016 | |
| | | | | | | | |
| | | | | | | 1,802,798 | |
| | | | | | | | |
|
| Telecommunications—0.1% | |
AT&T, Inc.
5.450%, 03/01/47 (a) | | | 896,000 | | | | 876,218 | |
| | | | | | | | |
Total Corporate Bonds & Notes
(Cost $88,611,414) | | | | | | | 86,130,167 | |
| | | | | | | | |
|
| Mortgage-Backed Securities—2.5% | |
|
| Commercial Mortgage-Backed Securities—2.5% | |
AREIT Trust
3.287%, 1M LIBOR + 0.980%,, 11/14/35 (144A) (d) (f) | | | 1,382,500 | | | | 1,382,497 | |
Bancorp Commercial Mortgage Trust
3.355%, 1M LIBOR + 0.900%, 09/15/35 (144A) (d) (f) | | | 1,006,017 | | | | 1,004,201 | |
BDS, Ltd.
3.855%, 1M LIBOR + 1.400%, 08/15/35 (144A) (d) (f) | | | 1,322,500 | | | | 1,322,518 | |
Benchmark Mortgage Trust
3.666%, 01/15/51 (d) | | | 1,235,000 | | | | 1,236,435 | |
CD Commercial Mortgage Trust
3.514%, 05/10/50 (d) | | | 1,519,456 | | | | 1,509,088 | |
Citigroup Commercial Mortgage Trust
3.471%, 10/12/50 | | | 334,128 | | | | 329,698 | |
Commercial Mortgage Pass-Through Certificates Mortgage Trust
3.510%, 09/10/50 | | | 980,547 | | | | 963,618 | |
Commercial Mortgage Trust
3.708%, 07/10/48 | | | 1,300,833 | | | | 1,315,901 | |
CSAIL Commercial Mortgage Trust
3.504%, 06/15/57 | | | 738,578 | | | | 738,348 | |
GS Mortgage Securities Corp. II
3.382%, 05/10/50 | | | 1,387,991 | | | | 1,377,837 | |
GS Mortgage Securities Trust
3.433%, 05/10/50 | | | 687,654 | | | | 674,998 | |
JPMBB Commercial Mortgage Securities Trust | |
3.227%, 10/15/48 | | | 1,036,740 | | | | 1,021,945 | |
3.494%, 01/15/48 | | | 1,590,000 | | | | 1,591,741 | |
JPMCC Commercial Mortgage Securities Trust
3.454%, 09/15/50 | | | 266,697 | | | | 262,937 | |
Morgan Stanley Bank of America Merrill Lynch Trust
3.536%, 11/15/52 | | | 519,442 | | | | 512,240 | |
Morgan Stanley Capital I, Inc.
3.530%, 06/15/50 | | | 470,148 | | | | 465,029 | |
UBS Commercial Mortgage Trust
3.679%, 12/15/50 | | | 1,210,000 | | | | 1,207,021 | |
Wells Fargo Commercial Mortgage Trust
3.540%, 05/15/48 | | | 1,410,327 | | | | 1,411,845 | |
| | | | | | | | |
Total Mortgage-Backed Securities
(Cost $18,836,542) | | | | | | | 18,327,897 | |
| | | | | | | | |
See accompanying notes to financial statements.
BHFTII-14
Brighthouse Funds Trust II
MFS Total Return Portfolio
Schedule of Investments as of December 31, 2018
Asset-Backed Securities—1.9%
| | | | | | | | |
| Security Description | |
Principal
Amount* | | | Value | |
|
| Asset-Backed - Automobile—0.3% | |
Chesapeake Funding II LLC | |
3.040%, 04/15/30 (144A) (f) | | | 518,130 | | | $ | 517,780 | |
3.455%, 1M LIBOR + 1.000%, 06/15/28 (144A) (d) (f) | | | 421,263 | | | | 422,321 | |
Ford Credit Auto Owner Trust | |
2.260%, 11/15/25 (144A) | | | 550,000 | | | | 548,309 | |
2.310%, 04/15/26 (144A) | | | 425,000 | | | | 422,025 | |
| | | | | | | | |
| | | | | | | 1,910,435 | |
| | | | | | | | |
|
| Asset-Backed - Home Equity—0.1% | |
Bayview Financial Revolving Asset Trust
4.106%, 1M LIBOR + 1.600%, 12/28/40 (144A) (d) (f) | | | 461,832 | | | | 426,556 | |
GMAC Home Equity Loan Trust
5.805%, 10/25/36 (d) | | | 126,811 | | | | 132,602 | |
Home Equity Loan Trust
5.320%, 12/25/35 (d) | | | 236,097 | | | | 228,540 | |
| | | | | | | | |
| | | | | | | 787,698 | |
| | | | | | | | |
|
| Asset-Backed - Other—1.5% | |
ALM, Ltd.
2.604%, 3M LIBOR + 1.250%, 10/18/27 (144A) (d) (f) | | | 849,000 | | | | 834,770 | |
3.836%, 3M LIBOR + 1.400%, 10/15/27 (144A) (d) (f) | | | 1,395,000 | | | | 1,380,329 | |
American Tower Trust I
3.070%, 03/15/48 (144A) | | | 1,000,000 | | | | 984,464 | |
Cutwater, Ltd.
| |
3.656%, 3M LIBOR + 1.220%, 01/15/29 (144A) (d) | | | 1,395,000 | | | | 1,384,844 | |
Dryden 55 CLO, Ltd.
3.456%, 3M LIBOR + 1.020%, 04/15/31 (144A) (d) | | | 1,430,000 | | | | 1,409,296 | |
Dryden Senior Loan Fund
3.336%, 3M LIBOR + 0.900%, 04/15/29 (144A) (d) (f) | | | 663,000 | | | | 654,728 | |
Figueroa CLO, Ltd.
3.936%, 3M LIBOR + 1.500%, 01/15/27 (144A) (d) | | | 420,000 | | | | 413,645 | |
Fort Credit LLC
4.117%, 10/21/23 (144A) | | | 518,500 | | | | 515,789 | |
KREF, Ltd.
3.402%, 1M LIBOR + 1.100%, 06/15/36 (144A) (d) (f) | | | 691,000 | | | | 690,988 | |
Mountain Hawk CLO, Ltd.
4.245%, 3M LIBOR + 1.800%, 04/18/25 (144A) (d) | | | 1,463,576 | | | | 1,458,931 | |
Navistar Financial Dealer Note Master Trust
3.136%, 1M LIBOR + 0.630%, 09/25/23 (144A) (d) (f) | | | 808,000 | | | | 807,696 | |
Neuberger Berman CLO, Ltd.
3.236%, 3M LIBOR + 0.800%, 01/15/28 (144A) (d) (f) | | | 600,000 | | | | 592,727 | |
Small Business Administration Participation Certificates
4.350%, 07/01/23 | | | 99,556 | | | | 101,805 | |
4.770%, 04/01/24 | | | 6,596 | | | | 6,787 | |
4.950%, 03/01/25 | | | 40,462 | | | | 41,786 | |
4.990%, 09/01/24 | | | 22,850 | | | | 23,637 | |
5.110%, 08/01/25 | | | 57,852 | | | | 59,806 | |
5.180%, 05/01/24 | | | 9,843 | | | | 10,138 | |
5.520%, 06/01/24 | | | 22,983 | | | | 23,917 | |
| | | | | | | | |
| | | | | | | 11,396,083 | |
| | | | | | | | |
Total Asset-Backed Securities
(Cost $15,046,080) | | | | | | | 14,094,216 | |
| | | | | | | | |
| Municipals—0.2% | |
| Security Description | | Principal
Amount*/
Shares | | | Value | |
New Jersey State Turnpike Authority, Build America Bond
7.414%, 01/01/40
(Cost $1,092,733) | | | 1,050,000 | | | | 1,479,450 | |
| | | | | | | | |
|
| Convertible Preferred Stocks—0.2% | |
|
| Electric Utilities—0.1% | |
NextEra Energy, Inc.
6.123%, 09/01/19 | | | 6,834 | | | | 393,912 | |
| | | | | | | | |
|
| Multi-Utilities—0.1% | |
CenterPoint Energy, Inc.
7.000%, 09/01/21 | | | 18,520 | | | | 932,852 | |
| | | | | | | | |
Total Convertible Preferred Stocks
(Cost $1,321,006) | | | | | | | 1,326,764 | |
| | | | | | | | |
|
| Short-Term Investment—0.1% | |
|
| Discount Note—0.1% | |
Federal Home Loan Bank
1.065%, 01/02/19 (g) | | | 806,000 | | | | 806,000 | |
| | | | | | | | |
Total Short-Term Investments
(Cost $805,953) | | | | | | | 806,000 | |
| | | | | | | | |
|
| Securities Lending Reinvestments (h)—8.2% | |
|
| Certificates of Deposit—2.9% | |
Bank of Nova Scotia
3.072%, 3M LIBOR + 0.280%, 03/20/19 (d) | | | 2,000,000 | | | | 2,000,798 | |
Barclays Bank plc
2.547%, 1M LIBOR + 0.200%, 02/04/19 (d) | | | 1,000,000 | | | | 999,905 | |
BNP Paribas S.A. New York
2.647%, 1M LIBOR + 0.300%, 06/04/19 (d) | | | 2,000,000 | | | | 1,999,196 | |
Credit Industriel et Commercial
Zero Coupon, 01/25/19 | | | 1,480,842 | | | | 1,497,450 | |
Industrial & Commercial Bank of China, Ltd.
2.850%, 02/15/19 | | | 2,000,000 | | | | 1,999,852 | |
Natixis S.A. New York
2.705%, 3M LIBOR + 0.090%, 05/10/19 (d) | | | 1,000,000 | | | | 999,370 | |
2.810%, 1M LIBOR + 0.370%, 02/14/19 (d) | | | 2,000,000 | | | | 2,000,374 | |
Royal Bank of Canada New York
2.650%, 1M LIBOR + 0.250%, 01/11/19 (d) | | | 1,500,000 | | | | 1,500,012 | |
Standard Chartered plc
2.686%, 1M LIBOR + 0.180%, 02/25/19 (d) | | | 2,000,000 | | | | 1,999,942 | |
Sumitomo Mitsui Banking Corp.
2.590%, 1M LIBOR + 0.190%, 04/11/19 (d) | | | 1,500,000 | | | | 1,499,449 | |
Sumitomo Mitsui Trust Bank, Ltd.
Zero Coupon, 03/12/19 | | | 1,985,555 | | | | 1,989,140 | |
Wells Fargo Bank N.A.
2.560%, 3M LIBOR + 0.140%, 07/11/19 (d) | | | 1,000,000 | | | | 1,000,867 | |
Westpac Banking Corp.
2.850%, FEDEFF PRV + 0.450%, 02/15/19 (d) | | | 1,500,000 | | | | 1,499,991 | |
| | | | | | | | |
| | | | | | | 20,986,346 | |
| | | | | | | | |
See accompanying notes to financial statements.
BHFTII-15
Brighthouse Funds Trust II
MFS Total Return Portfolio
Schedule of Investments as of December 31, 2018
Securities Lending Reinvestments (h)—(Continued)
| | | | | | | | |
| Security Description | | Principal
Amount* | | | Value | |
|
| Commercial Paper—0.7% | |
HSBC Bank plc
2.842%, 1M LIBOR + 0.320%, 07/30/19 (d) | | | 1,000,000 | | | $ | 1,000,000 | |
ING Funding LLC
2.707%, 1M LIBOR + 0.320%, 02/08/19 (d) | | | 2,000,000 | | | | 2,000,186 | |
UBS AG
2.779%, 1M LIBOR + 0.430%, 02/01/19 (d) | | | 1,500,000 | | | | 1,500,368 | |
Westpac Banking Corp.
2.784%, 1M LIBOR + 0.280%, 05/24/19 (d) | | | 1,000,000 | | | | 999,960 | |
| | | | | | | | |
| | | | | | | 5,500,514 | |
| | | | | | | | |
|
| Repurchase Agreements—4.6% | |
Citigroup Global Markets, Inc.
Repurchase Agreement dated 12/31/18 at 2.940%, due on 04/02/19 with a maturity value of $50,376; collateralized by U.S. Treasury Obligations with rates ranging from 1.125% - 2.750%, maturity dates ranging from 01/31/19 - 08/15/24, and an aggregate market value of $51,000. | | | 50,000 | | | | 50,000 | |
Citigroup Global Markets, Ltd. | |
Repurchase Agreement dated 12/31/18 at 2.490%, due on 01/02/19 with a maturity value of $700,097; collateralized by U.S. Treasury Obligations with rates ranging from 0.375% - 1.875%, maturity dates ranging from 12/15/20 - 01/15/27, and an aggregate market value of $714,001. | | | 700,000 | | | | 700,000 | |
Repurchase Agreement dated 12/31/18 at 2.490%, due on 01/02/19 with a maturity value of $1,000,138; collateralized by U.S. Treasury Obligations with rates ranging from 1.625% - 2.875%, maturity dates ranging from 06/30/20 - 11/15/46, and an aggregate market value of $1,020,000. | | | 1,000,000 | | | | 1,000,000 | |
Deutsche Bank AG, London
Repurchase Agreement dated 12/31/18 at 2.750%, due on 01/02/19 with a maturity value of $500,076; collateralized by U.S. Treasury and Foreign Obligations with rates ranging from 1.000% - 2.590%, maturity dates ranging from 03/31/19 - 12/29/26, and an aggregate market value of $510,000. | | | 500,000 | | | | 500,000 | |
Deutsche Bank Securities, Inc.
Repurchase Agreement dated 12/31/18 at 3.200%, due on 01/02/19 with a maturity value of $1,395,509; collateralized by U.S. Treasury Obligations at 0.000%, maturity dates ranging from 08/15/30 - 08/15/39, and an aggregate market value of $1,423,166. | | | 1,395,261 | | | | 1,395,261 | |
Merrill Lynch, Pierce, Fenner & Smith, Inc.
Repurchase Agreement dated 12/31/18 at 2.940%, due on 04/02/19 with a maturity value of $1,108,265; collateralized by various Common Stock with an aggregate market value of $1,210,000. | | | 1,100,000 | | | | 1,100,000 | |
Repurchase Agreement dated 12/31/18 at 2.940%, due on 04/02/19 with a maturity value of $3,022,540; collateralized by various Common Stock with an aggregate market value of $3,300,000. | | | 3,000,000 | | | | 3,000,000 | |
NBC Global Finance, Ltd.
Repurchase Agreement dated 12/31/18 at 2.560%, due on 01/02/19 with a maturity value of $4,000,569; collateralized by various Common Stock with an aggregate market value of $4,452,849. | | | 4,000,000 | | | | 4,000,000 | |
|
| Repurchase Agreements—(Continued) | |
NBC Global Finance, Ltd.
Repurchase Agreement dated 12/31/18 at 2.560%, due on 01/02/19 with a maturity value of $2,600,370; collateralized by various Common Stock with an aggregate market value of $2,894,352. | | | 2,600,000 | | | | 2,600,000 | |
Repurchase Agreement dated 12/31/18 at 2.560%, due on 01/02/19 with a maturity value of $1,500,213; collateralized by various Common Stock with an aggregate market value of $1,669,818. | | | 1,500,000 | | �� | | 1,500,000 | |
Repurchase Agreement dated 12/31/18 at 2.590%, due on 01/07/19 with a maturity value of $1,000,504; collateralized by various Common Stock with an aggregate market value of $1,113,322. | | | 1,000,000 | | | | 1,000,000 | |
Repurchase Agreement dated 12/31/18 at 2.590%, due on 01/07/19 with a maturity value of $1,500,755; collateralized by various Common Stock with an aggregate market value of $1,669,983. | | | 1,500,000 | | | | 1,500,000 | |
Nomura Securities International, Inc.
Repurchase Agreement dated 12/31/18 at 2.950%, due on 01/02/19 with a maturity value of $6,000,983; collateralized by U.S. Treasury Obligations with rates ranging from 0.000% - 6.500%, maturity dates ranging from 02/15/19 - 08/15/48, and an aggregate market value of $6,120,000. | | | 6,000,000 | | | | 6,000,000 | |
Societe Generale
Repurchase Agreement dated 12/31/18 at 2.530%, due on 01/02/19 with a maturity value of $1,100,155; collateralized by U.S. Treasury Obligations with rates ranging from 0.750% - 8.000%, maturity dates ranging from 09/30/19 - 08/15/46, and various Common Stock with an aggregate market value of $1,205,023. | | | 1,100,000 | | | | 1,100,000 | |
Repurchase Agreement dated 12/31/18 at 2.530%, due on 01/02/19 with a maturity value of $1,300,183; collateralized by U.S. Treasury Obligations with rates ranging from 0.750% - 8.000%, maturity dates ranging from 09/30/19 - 08/15/46, and various Common Stock with an aggregate market value of $1,424,119. | | | 1,300,000 | | | | 1,300,000 | |
Repurchase Agreement dated 12/31/18 at 2.530%, due on 01/02/19 with a maturity value of $5,000,703; collateralized by U.S. Treasury Obligations with rates ranging from 0.750% - 8.000%, maturity dates ranging from 09/30/19 - 08/15/46, and various Common Stock with an aggregate market value of $5,477,379. | | | 5,000,000 | | | | 5,000,000 | |
Repurchase Agreement dated 12/31/18 at 2.560%, due on 01/07/19 with a maturity value of $600,299; collateralized by U.S. Treasury Obligations with rates ranging from 0.750% - 8.000%, maturity dates ranging from 09/30/19 - 08/15/46, and various Common Stock with an aggregate market value of $657,286. | | | 600,000 | | | | 600,000 | |
See accompanying notes to financial statements.
BHFTII-16
Brighthouse Funds Trust II
MFS Total Return Portfolio
Schedule of Investments as of December 31, 2018
Securities Lending Reinvestments (h)—(Continued)
| | | | | | | | |
| Security Description | | Principal
Amount* | | | Value | |
|
| Repurchase Agreements—(Continued) | |
Societe Generale
Repurchase Agreement dated 12/31/18 at 2.560%, due on 01/07/19 with a maturity value of $600,299; collateralized by U.S. Treasury Obligations with rates ranging from 0.750% - 8.000%, maturity dates ranging from 09/30/19 - 08/15/46, and various Common Stock with an aggregate market value of $1,862,309. | | | 1,700,000 | | | $ | 1,700,000 | |
| | | | | | | | |
| | | | | | | 34,045,261 | |
| | | | | | | | |
Total Securities Lending Reinvestments
(Cost $60,531,779) | | | | | | | 60,532,121 | |
| | | | | | | | |
Total Investments—108.4%
(Cost $746,458,375) | | | | | | | 797,337,412 | |
Other assets and liabilities (net)—(8.4)% | | | | | | | (62,124,021 | ) |
| | | | | | | | |
| Net Assets—100.0% | | | | | | $ | 735,213,391 | |
| | | | | | | | |
| | | | |
| * | | Principal amount stated in U.S. dollars unless otherwise noted. |
| (a) | | All or a portion of the security was held on loan. As of December 31, 2018, the market value of securities loaned was $59,599,422 and the collateral received consisted of cash in the amount of $60,511,658. The cash collateral investments are disclosed in the Schedule of Investments and categorized as Securities Lending Reinvestments |
| (b) | | Non-income producing security. |
| (c) | | TBA (To Be Announced) Securities are purchased on a forward commitment basis with an approximate principal amount and no defined maturity date. The actual principal and maturity date will be determined upon settlement date. |
| (d) | | Variable or floating rate security. The stated rate represents the rate at December 31, 2018. Maturity date shown for callable securities reflects the earliest possible call date. For securities based on a published reference index and spread, the index and spread are indicated in the description above. For certain variable rate securities, the coupon rate is determined by the issuer/agent based on current market conditions. For certain asset- and mortgage-backed securities, the coupon rate may fluctuate based on changes of the underlying collateral or prepayments of principal. These securities do not indicate a reference index and spread in their description above. |
| (e) | | Interest only security. |
| (f) | | Restricted securities are not registered under the Securities Act of 1933 and are subject to legal restrictions on resale. These securities generally may be resold in transactions exempt from registration or to the public if the securities are subsequently registered. Disposal of these securities may involve time-consuming negotiations and prompt sale at an acceptable price may be difficult. As of December 31, 2018, the market value of restricted securities was $12,575,757, which is 1.7% of net assets. See details shown in the Restricted Securities table that follows. |
| (g) | | The rate shown represents current yield to maturity. |
| (h) | | Represents investment of cash collateral received from securities on loan as of December 31, 2018. |
| (144A)— | | Securities exempt from registration under Rule 144A of the Securities Act of 1933. These securities may be resold in transactions exempt from registration, normally to qualified institutional buyers. As of December 31, 2018, the market value of 144A securities was $33,645,466, which is 4.6% of net assets. |
| (ACES)— | | Alternative Credit Enhancement Securities |
| (ADR)— | | American Depositary Receipt |
| (CLO)— | | Collateralized Loan Obligation |
| (CMO)— | | Collateralized Mortgage Obligation |
| (FEDEFF PRV)— | | Effective Federal Funds Rate |
| (LIBOR)— | | London Interbank Offered Rate |
| (REMIC)— | | Real Estate Mortgage Investment Conduit |
| | | | | | | | | | | | | | | | |
Restricted Securities | | Acquisition
Date | | | Principal
Amount | | | Cost | | | Value | |
ALM, Ltd., 2.604%, 10/18/27 | | | 10/04/17 | | | $ | 849,000 | | | $ | 849,000 | | | $ | 834,770 | |
ALM, Ltd., 3.836%, 10/15/27 | | | 09/21/18 | | | | 1,395,000 | | | | 1,395,000 | | | | 1,380,329 | |
AREIT Trust, 3.287%, 11/14/35 | | | 10/30/18 | | | | 1,382,500 | | | | 1,382,500 | | | | 1,382,497 | |
BDS, Ltd., 3.855%, 08/15/35 | | | 07/25/18 | | | | 1,322,500 | | | | 1,323,456 | | | | 1,322,518 | |
Bancorp Commercial Mortgage Trust, 3.355%, 09/15/35 | | | 09/17/18 | | | | 1,006,017 | | | | 1,006,017 | | | | 1,004,201 | |
Bayview Financial Revolving Asset Trust, 4.106%, 12/28/40 | | | 03/01/06 | | | | 461,832 | | | | 461,832 | | | | 426,556 | |
Chesapeake Funding II LLC, 3.455%, 06/15/28 | | | 06/14/16 | | | | 421,263 | | | | 421,263 | | | | 422,321 | |
Chesapeake Funding II LLC, 3.040%, 04/15/30 | | | 04/11/18 | | | | 518,130 | | | | 518,114 | | | | 517,780 | |
Dryden Senior Loan Fund, 3.336%, 04/15/29 | | | 04/09/18 | | | | 663,000 | | | | 663,000 | | | | 654,728 | |
KREF, Ltd., 3.402%, 06/15/36 | | | 11/07/18 | | | | 691,000 | | | | 691,000 | | | | 690,988 | |
Navistar Financial Dealer Note Master Trust, 3.136%, 09/25/23 | | | 09/17/18 | | | | 808,000 | | | | 808,000 | | | | 807,696 | |
Neuberger Berman CLO, Ltd., 3.236%, 01/15/28 | | | 09/19/18 | | | | 600,000 | | | | 598,050 | | | | 592,727 | |
Oncor Electric Delivery Co. LLC, 5.750%, 03/15/29 | | | 11/27/18 | | | | 795,000 | | | | 912,477 | | | | 928,433 | |
State Grid Overseas Investment, Ltd., 2.750%, 05/07/19 | | | 04/28/14 | | | | 778,000 | | | | 777,466 | | | | 777,204 | |
UBS Group Funding Switzerland AG, 4.125%, 04/15/26 | | | 03/29/16 | | | | 838,000 | | | | 836,581 | | | | 833,009 | |
| | | | | | | | | | | | | | | | |
| | | | | | | | | | | | | | $ | 12,575,757 | |
| | | | | | | | | | | | | | | | |
See accompanying notes to financial statements.
BHFTII-17
Brighthouse Funds Trust II
MFS Total Return Portfolio
Schedule of Investments as of December 31, 2018
Fair Value Hierarchy
Accounting principles generally accepted in the United States of America (“GAAP”) define fair market value as the price that the Portfolio would receive to sell an asset or pay to transfer a liability in an orderly transaction between market participants at the measurement date. It establishes a fair value hierarchy that prioritizes inputs to valuation methods and requires disclosure of the fair value hierarchy, separately for each major category of assets and liabilities, that segregates fair value measurements into three levels. Levels 1, 2 and 3 of the fair value hierarchy are defined as follows:
Level 1 - unadjusted quoted prices in active markets for identical investments
Level 2 - other significant observable inputs (including, but not limited to, quoted prices for similar assets or liabilities in markets that are either active or inactive; inputs other than quoted prices that are observable such as interest rates, yield curves, volatilities, prepayment speeds, loss severities, credit risks, default rates, or other market corroborated inputs)
Level 3 - significant unobservable inputs based on the best information available in the circumstances, to the extent observable inputs are unavailable (including the Portfolio’s own assumptions used in determining the fair value of investments and derivative financial instruments)
The inputs or methodologies used for valuing investments are not necessarily an indication of the risk associated with investing in them. Changes to the inputs or methodologies used may result in transfers between levels. A reconciliation of Level 3 securities, if any, will be disclosed following the fair value hierarchy table. For more information about the Portfolio’s policy regarding the valuation of investments, please refer to the Notes to Financial Statements.
The following table summarizes the fair value hierarchy of the Portfolio’s investments as of December 31, 2018:
| | | | | | | | | | | | | | | | |
| Description | | Level 1 | | | Level 2 | | | Level 3 | | | Total | |
| Common Stocks | |
Aerospace & Defense | | $ | 13,097,499 | | | $ | — | | | $ | — | | | $ | 13,097,499 | |
Air Freight & Logistics | | | 1,680,539 | | | | — | | | | — | | | | 1,680,539 | |
Airlines | | | 1,050,345 | | | | — | | | | — | | | | 1,050,345 | |
Auto Components | | | 4,431,519 | | | | — | | | | — | | | | 4,431,519 | |
Automobiles | | | 170,771 | | | | 1,144,191 | | | | — | | | | 1,314,962 | |
Banks | | | 39,438,495 | | | | 1,439,512 | | | | — | | | | 40,878,007 | |
Beverages | | | 3,176,117 | | | | 2,998,593 | | | | — | | | | 6,174,710 | |
Biotechnology | | | 2,255,395 | | | | — | | | | — | | | | 2,255,395 | |
Building Products | | | 3,982,054 | | | | — | | | | — | | | | 3,982,054 | |
Capital Markets | | | 23,017,414 | | | | — | | | | — | | | | 23,017,414 | |
Chemicals | | | 14,423,923 | | | | — | | | | — | | | | 14,423,923 | |
Commercial Services & Supplies | | | 546,640 | | | | — | | | | — | | | | 546,640 | |
Communications Equipment | | | 4,899,063 | | | | — | | | | — | | | | 4,899,063 | |
Consumer Finance | | | 1,808,011 | | | | — | | | | — | | | | 1,808,011 | |
Containers & Packaging | | | 883,695 | | | | — | | | | — | | | | 883,695 | |
Diversified Financial Services | | | — | | | | 1,733,384 | | | | — | | | | 1,733,384 | |
Diversified Telecommunication Services | | | 3,161,138 | | | | — | | | | — | | | | 3,161,138 | |
Electric Utilities | | | 11,433,492 | | | | 1,131,960 | | | | — | | | | 12,565,452 | |
Electrical Equipment | | | 5,544,671 | | | | 352,535 | | | | — | | | | 5,897,206 | |
Energy Equipment & Services | | | 2,054,864 | | | | — | | | | — | | | | 2,054,864 | |
Entertainment | | | 555,053 | | | | — | | | | — | | | | 555,053 | |
Equity Real Estate Investment Trusts | | | 8,214,387 | | | | — | | | | — | | | | 8,214,387 | |
Food & Staples Retailing | | | 1,404,648 | | | | — | | | | — | | | | 1,404,648 | |
Food Products | | | 6,677,495 | | | | 6,242,439 | | | | — | | | | 12,919,934 | |
Health Care Equipment & Supplies | | | 17,750,523 | | | | — | | | | — | | | | 17,750,523 | |
Health Care Providers & Services | | | 12,822,407 | | | | — | | | | — | | | | 12,822,407 | |
Hotels, Restaurants & Leisure | | | 4,148,534 | | | | — | | | | — | | | | 4,148,534 | |
Household Durables | | | 2,035,174 | | | | — | | | | — | | | | 2,035,174 | |
Household Products | | | 3,624,865 | | | | 1,355,649 | | | | — | | | | 4,980,514 | |
Industrial Conglomerates | | | 8,831,069 | | | | — | | | | — | | | | 8,831,069 | |
Insurance | | | 22,132,977 | | | | 2,289,062 | | | | — | | | | 24,422,039 | |
Interactive Media & Services | | | 2,043,942 | | | | — | | | | — | | | | 2,043,942 | |
Internet & Direct Marketing Retail | | | 3,798,482 | | | | — | | | | — | | | | 3,798,482 | |
IT Services | | | 17,078,524 | | | | — | | | | — | | | | 17,078,524 | |
Leisure Products | | | 488,375 | | | | — | | | | — | | | | 488,375 | |
Life Sciences Tools & Services | | | 5,727,681 | | | | — | | | | — | | | | 5,727,681 | |
Machinery | | | 8,985,325 | | | | — | | | | — | | | | 8,985,325 | |
Media | | | 13,746,551 | | | | — | | | | — | | | | 13,746,551 | |
Metals & Mining | | | — | | | | 2,079,315 | | | | — | | | | 2,079,315 | |
Mortgage Real Estate Investment Trusts | | | 526,735 | | | | — | | | | — | | | | 526,735 | |
Multi-Utilities | | | 3,068,626 | | | | 787,639 | | | | — | | | | 3,856,265 | |
See accompanying notes to financial statements.
BHFTII-18
Brighthouse Funds Trust II
MFS Total Return Portfolio
Schedule of Investments as of December 31, 2018
Fair Value Hierarchy—(Continued)
| | | | | | | | | | | | | | | | |
| Description | | Level 1 | | | Level 2 | | | Level 3 | | | Total | |
Multiline Retail | | $ | 880,981 | | | $ | — | | | $ | — | | | $ | 880,981 | |
Oil, Gas & Consumable Fuels | | | 19,284,658 | | | | 3,272,998 | | | | — | | | | 22,557,656 | |
Personal Products | | | 301,143 | | | | — | | | | — | | | | 301,143 | |
Pharmaceuticals | | | 29,319,209 | | | | 3,830,974 | | | | — | | | | 33,150,183 | |
Professional Services | | | 1,576,505 | | | | — | | | | — | | | | 1,576,505 | |
Road & Rail | | | 8,053,093 | | | | — | | | | — | | | | 8,053,093 | |
Semiconductors & Semiconductor Equipment | | | 10,457,102 | | | | — | | | | — | | | | 10,457,102 | |
Software | | | 12,661,315 | | | | — | | | | — | | | | 12,661,315 | |
Specialty Retail | | | 1,383,646 | | | | — | | | | — | | | | 1,383,646 | |
Technology Hardware, Storage & Peripherals | | | 3,022,868 | | | | 455,373 | | | | — | | | | 3,478,241 | |
Textiles, Apparel & Luxury Goods | | | 1,673,663 | | | | 963,520 | | | | — | | | | 2,637,183 | |
Tobacco | | | 10,997,813 | | | | 609,730 | | | | — | | | | 11,607,543 | |
Trading Companies & Distributors | | | 309,465 | | | | — | | | | — | | | | 309,465 | |
Total Common Stocks | | | 380,638,479 | | | | 30,686,874 | | | | — | | | | 411,325,353 | |
Total U.S. Treasury & Government Agencies* | | | — | | | | 203,315,444 | | | | — | | | | 203,315,444 | |
Total Corporate Bonds & Notes* | | | — | | | | 86,130,167 | | | | — | | | | 86,130,167 | |
Total Mortgage-Backed Securities* | | | — | | | | 18,327,897 | | | | — | | | | 18,327,897 | |
Total Asset-Backed Securities* | | | — | | | | 14,094,216 | | | | — | | | | 14,094,216 | |
Total Municipals | | | — | | | | 1,479,450 | | | | — | | | | 1,479,450 | |
Total Convertible Preferred Stocks* | | | 1,326,764 | | | | — | | | | — | | | | 1,326,764 | |
Total Short-Term Investment* | | | — | | | | 806,000 | | | | — | | | | 806,000 | |
Total Securities Lending Reinvestments* | | | — | | | | 60,532,121 | | | | — | | | | 60,532,121 | |
Total Investments | | $ | 381,965,243 | | | $ | 415,372,169 | | | $ | — | | | $ | 797,337,412 | |
| | | | | | | | | | | | | | | | | |
Collateral for Securities Loaned (Liability) | | $ | — | | | $ | (60,511,658 | ) | | $ | — | | | $ | (60,511,658 | ) |
| | | | |
| * | | See Schedule of Investments for additional detailed categorizations. |
See accompanying notes to financial statements.
BHFTII-19
Brighthouse Funds Trust II
MFS Total Return Portfolio
Statement of Assets and Liabilities
December 31, 2018
| | | | |
Assets | |
Investments at value (a) (b) | | $ | 797,337,412 | |
Cash | | | 10,142 | |
Cash denominated in foreign currencies (c) | | | 65 | |
Receivable for: | |
Investments sold | | | 821,296 | |
TBA securities sold | | | 361,424 | |
Fund shares sold | | | 10,907 | |
Dividends and interest | | | 2,930,831 | |
Prepaid expenses | | | 2,157 | |
| | | | |
Total Assets | | | 801,474,234 | |
Liabilities | |
Collateral for securities loaned | | | 60,511,658 | |
Payables for: | |
TBA securities purchased | | | 4,314,511 | |
Fund shares redeemed | | | 632,082 | |
Accrued Expenses: | |
Management fees | | | 360,741 | |
Distribution and service fees | | | 107,714 | |
Deferred trustees’ fees | | | 111,586 | |
Other expenses | | | 222,551 | |
| | | | |
Total Liabilities | | | 66,260,843 | |
| | | | |
Net Assets | | $ | 735,213,391 | |
| | | | |
Net Assets Consist of: | |
Paid in surplus | | $ | 639,860,045 | |
Distributable earnings (Accumulated losses) | | | 95,353,346 | |
| | | | |
Net Assets | | $ | 735,213,391 | |
| | | | |
Net Assets | |
Class A | | $ | 160,713,634 | |
Class B | | | 207,901,736 | |
Class E | | | 22,490,054 | |
Class F | | | 344,107,967 | |
Capital Shares Outstanding* | |
Class A | | | 1,049,425 | |
Class B | | | 1,379,095 | |
Class E | | | 147,794 | |
Class F | | | 2,269,649 | |
Net Asset Value, Offering Price and Redemption Price Per Share | |
Class A | | $ | 153.14 | |
Class B | | | 150.75 | |
Class E | | | 152.17 | |
Class F | | | 151.61 | |
| | | | |
| * | | The Portfolio is authorized to issue an unlimited number of shares. |
| (a) | | Identified cost of investments was $746,458,375. |
| (b) | | Includes securities loaned at value of $59,599,422. |
| (c) | | Identified cost of cash denominated in foreign currencies was $64. |
Statement of Operations
Year Ended December 31, 2018
| | | | |
Investment Income | |
Dividends (a) | | $ | 12,618,102 | |
Interest | | | 10,377,516 | |
Securities lending income | | | 220,298 | |
| | | | |
Total investment income | | | 23,215,916 | |
Expenses | |
Management fees | | | 4,624,488 | |
Administration fees | | | 35,785 | |
Custodian and accounting fees | | | 157,178 | |
Distribution and service fees—Class B | | | 586,371 | |
Distribution and service fees—Class E | | | 37,824 | |
Distribution and service fees—Class F | | | 778,341 | |
Audit and tax services | | | 65,808 | |
Legal | | | 45,317 | |
Trustees’ fees and expenses | | | 33,734 | |
Shareholder reporting | | | 90,697 | |
Insurance | | | 5,421 | |
Miscellaneous | | | 23,750 | |
| | | | |
Total expenses | | | 6,484,714 | |
Less broker commission recapture | | | (1,466 | ) |
| | | | |
Net expenses | | | 6,483,248 | |
| | | | |
Net Investment Income | | | 16,732,668 | |
| | | | |
Net Realized and Unrealized Gain (Loss) | |
| Net realized gain on: | |
Investments | | | 33,148,745 | |
Foreign currency transactions | | | 5,637 | |
| | | | |
Net realized gain | | | 33,154,382 | |
| | | | |
| Net change in unrealized depreciation on: | |
Investments | | | (95,584,078 | ) |
Foreign currency transactions | | | (3,756 | ) |
| | | | |
Net change in unrealized depreciation | | | (95,587,834 | ) |
| | | | |
Net realized and unrealized loss | | | (62,433,452 | ) |
| | | | |
Net Decrease in Net Assets From Operations | | $ | (45,700,784 | ) |
| | | | |
| | | | |
| (a) | | Net of foreign withholding taxes of $180,493. |
See accompanying notes to financial statements.
BHFTII-20
Brighthouse Funds Trust II
MFS Total Return Portfolio
Statements of Changes in Net Assets
| | | | | | | | |
| | | Year Ended
December 31,
2018 | | | Year Ended
December 31,
2017 | |
Increase (Decrease) in Net Assets: | |
From Operations | |
Net investment income | | $ | 16,732,668 | | | $ | 16,377,955 | |
Net realized gain | | | 33,154,382 | | | | 53,358,697 | |
Net change in unrealized appreciation (depreciation) | | | (95,587,834 | ) | | | 31,365,429 | |
| | | | | | | | |
Increase (decrease) in net assets from operations | | | (45,700,784 | ) | | | 101,102,081 | |
| | | | | | | | |
From Distributions to Shareholders (a) | |
Class A | | | (14,737,131 | ) | | | (14,024,809 | ) |
Class B | | | (19,453,121 | ) | | | (17,373,702 | ) |
Class E | | | (2,097,343 | ) | | | (2,036,170 | ) |
Class F | | | (32,316,162 | ) | | | (32,758,163 | ) |
| | | | | | | | |
Total distributions | | | (68,603,757 | ) | | | (66,192,844 | ) |
| | | | | | | | |
Decrease in net assets from capital share transactions | | | (35,848,597 | ) | | | (10,282,117 | ) |
| | | | | | | | |
Total increase (decrease) in net assets | | | (150,153,138 | ) | | | 24,627,120 | |
|
Net Assets | |
Beginning of period | | | 885,366,529 | | | | 860,739,409 | |
| | | | | | | | |
End of period | | $ | 735,213,391 | | | $ | 885,366,529 | (b) |
| | | | | | | | |
Other Information:
Capital Shares
Transactions in capital shares were as follows:
| | | | | | | | | | | | | | | | |
| | | Year Ended
December 31, 2018 | | | Year Ended
December 31, 2017 | |
| | | Shares | | | Value | | | Shares | | | Value | |
Class A | |
Sales | | | 58,743 | | | $ | 9,903,134 | | | | 153,443 | | | $ | 26,118,792 | |
Reinvestments | | | 91,705 | | | | 14,737,131 | | | | 83,730 | | | | 14,024,809 | |
Redemptions | | | (144,679 | ) | | | (24,334,597 | ) | | | (237,699 | ) | | | (40,759,034 | ) |
| | | | | | | | | | | | | | | | |
Net increase (decrease) | | | 5,769 | | | $ | 305,668 | | | | (526 | ) | | $ | (615,433 | ) |
| | | | | | | | | | | | | | | | |
Class B | |
Sales | | | 54,637 | | | $ | 9,037,288 | | | | 184,798 | | | $ | 31,144,654 | |
Reinvestments | | | 122,802 | | | | 19,453,121 | | | | 105,097 | | | | 17,373,702 | |
Redemptions | | | (236,470 | ) | | | (38,957,577 | ) | | | (203,455 | ) | | | (34,773,301 | ) |
| | | | | | | | | | | | | | | | |
Net increase (decrease) | | | (59,031 | ) | | $ | (10,467,168 | ) | | | 86,440 | | | $ | 13,745,055 | |
| | | | | | | | | | | | | | | | |
Class E | |
Sales | | | 3,124 | | | $ | 533,358 | | | | 5,803 | | | $ | 1,001,333 | |
Reinvestments | | | 13,124 | | | | 2,097,343 | | | | 12,219 | | | | 2,036,170 | |
Redemptions | | | (22,260 | ) | | | (3,717,856 | ) | | | (19,286 | ) | | | (3,325,803 | ) |
| | | | | | | | | | | | | | | | |
Net decrease | | | (6,012 | ) | | $ | (1,087,155 | ) | | | (1,264 | ) | | $ | (288,300 | ) |
| | | | | | | | | | | | | | | | |
Class F | |
Sales | | | 93,601 | | | $ | 15,608,427 | | | | 131,860 | | | $ | 22,684,980 | |
Reinvestments | | | 202,902 | | | | 32,316,162 | | | | 197,219 | | | | 32,758,163 | |
Redemptions | | | (436,754 | ) | | | (72,524,531 | ) | | | (457,959 | ) | | | (78,566,582 | ) |
| | | | | | | | | | | | | | | | |
Net decrease | | | (140,251 | ) | | $ | (24,599,942 | ) | | | (128,880 | ) | | $ | (23,123,439 | ) |
| | | | | | | | | | | | | | | | |
Decrease derived from capital shares transactions | | | | | | $ | (35,848,597 | ) | | | | | | $ | (10,282,117 | ) |
| | | | | | | | | | | | | | | | |
| | | | |
| (a) | | Distributions from net investment income and realized gains are no longer required to be separately disclosed. The presentation for the year ended December 31, 2018 has been adjusted for this change (See Note 8). At December 31, 2017 the distributions were as follows. |
| | | | | | | | |
| | | Distributions from net
investment income: | | | Distributions from realized
capital gains: | |
Class A | | $ | (4,594,873 | ) | | $ | (9,429,936 | ) |
Class B | | | (5,313,686 | ) | | | (12,060,016 | ) |
Class E | | | (640,383 | ) | | | (1,395,787 | ) |
Class F | | | (10,139,950 | ) | | | (22,618,213 | ) |
| | | | |
| (b) | | As part of the update in (a), it is also no longer required to disclose the Undistributed net investment income (Accumulated losses) which was $17,814,529 as of December 31, 2017. |
See accompanying notes to financial statements.
BHFTII-21
Brighthouse Funds Trust II
MFS Total Return Portfolio
Financial Highlights
| | | | | | | | | | | | | | | | | | | | |
| Selected per share data | |
| | | Class A | |
| | | Year Ended December 31, | |
| | | 2018 | | | 2017 | | | 2016 | | | 2015 | | | 2014 | |
Net Asset Value, Beginning of Period | | $ | 177.03 | | | $ | 170.50 | | | $ | 168.01 | | | $ | 172.72 | | | $ | 162.91 | |
| | | | | | | | | | | | | | | | | | | | |
Income (Loss) from Investment Operations | |
Net investment income (a) | | | 3.68 | | | | 3.55 | | | | 3.94 | (b) | | | 3.66 | | | | 3.85 | |
Net realized and unrealized gain (loss) | | | (12.86 | ) | | | 16.87 | | | | 10.93 | | | | (3.83 | ) | | | 9.94 | |
| | | | | | | | | | | | | | | | | | | | |
Total income (loss) from investment operations | | | (9.18 | ) | | | 20.42 | | | | 14.87 | | | | (0.17 | ) | | | 13.79 | |
| | | | | | | | | | | | | | | | | | | | |
Less Distributions | |
Distributions from net investment income | | | (4.04 | ) | | | (4.55 | ) | | | (5.10 | ) | | | (4.54 | ) | | | (3.98 | ) |
Distributions from net realized capital gains | | | (10.67 | ) | | | (9.34 | ) | | | (7.28 | ) | | | 0.00 | | | | 0.00 | |
| | | | | | | | | | | | | | | | | | | | |
Total distributions | | | (14.71 | ) | | | (13.89 | ) | | | (12.38 | ) | | | (4.54 | ) | | | (3.98 | ) |
| | | | | | | | | | | | | | | | | | | | |
Net Asset Value, End of Period | | $ | 153.14 | | | $ | 177.03 | | | $ | 170.50 | | | $ | 168.01 | | | $ | 172.72 | |
| | | | | | | | | | | | | | | | | | | | |
Total Return (%) (c) | | | (5.57 | ) | | | 12.44 | | | | 9.20 | | | | (0.16 | ) | | | 8.64 | |
|
Ratios/Supplemental Data | |
Ratio of expenses to average net assets (%) | | | 0.62 | | | | 0.61 | | | | 0.61 | | | | 0.60 | | | | 0.60 | |
Ratio of net investment income to average net assets (%) | | | 2.20 | | | | 2.05 | | | | 2.34 | (b) | | | 2.13 | | | | 2.32 | |
Portfolio turnover rate (%) | | | 29 | (d) | | | 35 | (d) | | | 35 | (d) | | | 41 | (d) | | | 34 | (d) |
Net assets, end of period (in millions) | | $ | 160.7 | | | $ | 184.8 | | | $ | 178.0 | | | $ | 165.9 | | | $ | 186.7 | |
| |
| | | Class B | |
| | | Year Ended December 31, | |
| | | 2018 | | | 2017 | | | 2016 | | | 2015 | | | 2014 | |
Net Asset Value, Beginning of Period | | $ | 174.48 | | | $ | 168.22 | | | $ | 165.89 | | | $ | 170.57 | | | $ | 160.94 | |
| | | | | | | | | | | | | | | | | | | | |
Income (Loss) from Investment Operations | |
Net investment income (a) | | | 3.21 | | | | 3.06 | | | | 3.48 | (b) | | | 3.20 | | | | 3.40 | |
Net realized and unrealized gain (loss) | | | (12.66 | ) | | | 16.66 | | | | 10.77 | | | | (3.79 | ) | | | 9.81 | |
| | | | | | | | | | | | | | | | | | | | |
Total income (loss) from investment operations | | | (9.45 | ) | | | 19.72 | | | | 14.25 | | | | (0.59 | ) | | | 13.21 | |
| | | | | | | | | | | | | | | | | | | | |
Less Distributions | |
Distributions from net investment income | | | (3.61 | ) | | | (4.12 | ) | | | (4.64 | ) | | | (4.09 | ) | | | (3.58 | ) |
Distributions from net realized capital gains | | | (10.67 | ) | | | (9.34 | ) | | | (7.28 | ) | | | 0.00 | | | | 0.00 | |
| | | | | | | | | | | | | | | | | | | | |
Total distributions | | | (14.28 | ) | | | (13.46 | ) | | | (11.92 | ) | | | (4.09 | ) | | | (3.58 | ) |
| | | | | | | | | | | | | | | | | | | | |
Net Asset Value, End of Period | | $ | 150.75 | | | $ | 174.48 | | | $ | 168.22 | | | $ | 165.89 | | | $ | 170.57 | |
| | | | | | | | | | | | | | | | | | | | |
Total Return (%) (c) | | | (5.81 | ) | | | 12.17 | | | | 8.92 | | | | (0.40 | ) | | | 8.36 | |
|
Ratios/Supplemental Data | |
Ratio of expenses to average net assets (%) | | | 0.87 | | | | 0.86 | | | | 0.86 | | | | 0.85 | | | | 0.85 | |
Ratio of net investment income to average net assets (%) | | | 1.95 | | | | 1.79 | | | | 2.09 | (b) | | | 1.88 | | | | 2.07 | |
Portfolio turnover rate (%) | | | 29 | (d) | | | 35 | (d) | | | 35 | (d) | | | 41 | (d) | | | 34 | (d) |
Net assets, end of period (in millions) | | $ | 207.9 | | | $ | 250.9 | | | $ | 227.4 | | | $ | 223.0 | | | $ | 247.5 | |
Please see following page for Financial Highlights footnote legend.
See accompanying notes to financial statements.
BHFTII-22
Brighthouse Funds Trust II
MFS Total Return Portfolio
Financial Highlights
| | | | | | | | | | | | | | | | | | | | |
| Selected per share data | | | | | | | | | | | | | | | |
| | | Class E | |
| | | Year Ended December 31, | |
| | | 2018 | | | 2017 | | | 2016 | | | 2015 | | | 2014 | |
Net Asset Value, Beginning of Period | | $ | 175.98 | | | $ | 169.55 | | | $ | 167.11 | | | $ | 171.80 | | | $ | 162.06 | |
| | | | | | | | | | | | | | | | | | | | |
Income (Loss) from Investment Operations | |
Net investment income (a) | | | 3.41 | | | | 3.27 | | | | 3.67 | (b) | | | 3.39 | | | | 3.59 | |
Net realized and unrealized gain (loss) | | | (12.78 | ) | | | 16.79 | | | | 10.86 | | | | (3.82 | ) | | | 9.88 | |
| | | | | | | | | | | | | | | | | | | | |
Total income (loss) from investment operations | | | (9.37 | ) | | | 20.06 | | | | 14.53 | | | | (0.43 | ) | | | 13.47 | |
| | | | | | | | | | | | | | | | | | | | |
Less Distributions | |
Distributions from net investment income | | | (3.77 | ) | | | (4.29 | ) | | | (4.81 | ) | | | (4.26 | ) | | | (3.73 | ) |
Distributions from net realized capital gains | | | (10.67 | ) | | | (9.34 | ) | | | (7.28 | ) | | | 0.00 | | | | 0.00 | |
| | | | | | | | | | | | | | | | | | | | |
Total distributions | | | (14.44 | ) | | | (13.63 | ) | | | (12.09 | ) | | | (4.26 | ) | | | (3.73 | ) |
| | | | | | | | | | | | | | | | | | | | |
Net Asset Value, End of Period | | $ | 152.17 | | | $ | 175.98 | | | $ | 169.55 | | | $ | 167.11 | | | $ | 171.80 | |
| | | | | | | | | | | | | | | | | | | | |
Total Return (%) (c) | | | (5.72 | ) | | | 12.28 | | | | 9.03 | | | | (0.31 | ) | | | 8.48 | |
|
Ratios/Supplemental Data | |
Ratio of expenses to average net assets (%) | | | 0.77 | | | | 0.76 | | | | 0.76 | | | | 0.75 | | | | 0.75 | |
Ratio of net investment income to average net assets (%) | | | 2.05 | | | | 1.90 | | | | 2.19 | (b) | | | 1.98 | | | | 2.17 | |
Portfolio turnover rate (%) | | | 29 | (d) | | | 35 | (d) | | | 35 | (d) | | | 41 | (d) | | | 34 | (d) |
Net assets, end of period (in millions) | | $ | 22.5 | | | $ | 27.1 | | | $ | 26.3 | | | $ | 27.1 | | | $ | 30.9 | |
| |
| | | Class F | |
| | | Year Ended December 31, | |
| | | 2018 | | | 2017 | | | 2016 | | | 2015 | | | 2014 | |
Net Asset Value, Beginning of Period | | $ | 175.36 | | | $ | 168.99 | | | $ | 166.59 | | | $ | 171.25 | | | $ | 161.54 | |
| | | | | | | | | | | | | | | | | | | | |
Income (Loss) from Investment Operations | |
Net investment income (a) | | | 3.31 | | | | 3.17 | | | | 3.57 | (b) | | | 3.29 | | | | 3.50 | |
Net realized and unrealized gain (loss) | | | (12.72 | ) | | | 16.73 | | | | 10.83 | | | | (3.79 | ) | | | 9.84 | |
| | | | | | | | | | | | | | | | | | | | |
Total income (loss) from investment operations | | | (9.41 | ) | | | 19.90 | | | | 14.40 | | | | (0.50 | ) | | | 13.34 | |
| | | | | | | | | | | | | | | | | | | | |
Less Distributions | |
Distributions from net investment income | | | (3.66 | ) | | | (4.19 | ) | | | (4.72 | ) | | | (4.16 | ) | | | (3.63 | ) |
Distributions from net realized capital gains | | | (10.68 | ) | | | (9.34 | ) | | | (7.28 | ) | | | 0.00 | | | | 0.00 | |
| | | | | | | | | | | | | | | | | | | | |
Total distributions | | | (14.34 | ) | | | (13.53 | ) | | | (12.00 | ) | | | (4.16 | ) | | | (3.63 | ) |
| | | | | | | | | | | | | | | | | | | | |
Net Asset Value, End of Period | | $ | 151.61 | | | $ | 175.36 | | | $ | 168.99 | | | $ | 166.59 | | | $ | 171.25 | |
| | | | | | | | | | | | | | | | | | | | |
Total Return (%) (c) | | | (5.76 | ) | | | 12.22 | | | | 8.97 | | | | (0.35 | ) | | | 8.42 | |
| | | | | |
Ratios/Supplemental Data | | | | | | | | | | | | | | | | | | | | |
Ratio of expenses to average net assets (%) | | | 0.82 | | | | 0.81 | | | | 0.81 | | | | 0.80 | | | | 0.80 | |
Ratio of net investment income to average net assets (%) | | | 2.00 | | | | 1.85 | | | | 2.14 | (b) | | | 1.93 | | | | 2.12 | |
Portfolio turnover rate (%) | | | 29 | (d) | | | 35 | (d) | | | 35 | (d) | | | 41 | (d) | | | 34 | (d) |
Net assets, end of period (in millions) | | $ | 344.1 | | | $ | 422.6 | | | $ | 429.0 | | | $ | 450.4 | | | $ | 524.7 | |
| | | | |
| (a) | | Per share amounts based on average shares outstanding during the period. |
| (b) | | Net investment income per share and the ratio of net investment income to average net assets include anon-recurring refund for overbilling of prior years’ custodianout-of-pocket fees which amounted to $0.12 per share and 0.07% of average net assets, respectively. |
| (c) | | Total return does not reflect any insurance, sales, separate account or administrative charges of variable annuity or life insurance contracts or any additional expenses that contract owners may bear under their variable contracts. If these charges were included, the returns would be lower. |
| (d) | | Includes mortgage dollar roll and TBA transactions; excluding these transactions the portfolio turnover rates would have been 28%, 35%, 34%, 37%, and 25% for the years ended December 31, 2018, 2017, 2016, 2015 and 2014, respectively. |
See accompanying notes to financial statements.
BHFTII-23
Brighthouse Funds Trust II
MFS Total Return Portfolio
Notes to Financial Statements—December 31, 2018
1. Organization
Brighthouse Funds Trust II (the “Trust”) is organized as a Delaware statutory trust and registered under the Investment Company Act of 1940, as amended (the “1940 Act”), as anopen-end management investment company. The Trust, which is managed by Brighthouse Investment Advisers, LLC (“Brighthouse Investment Advisers” or the “Adviser”), currently offers twenty-nine series, each of which operates as a distinct investment vehicle of the Trust. The series included in this report is MFS Total Return Portfolio (the “Portfolio”), which is diversified. Shares of the Portfolio are not offered directly to the general public and are currently available only to separate accounts of insurance companies, including insurance companies affiliated with the Adviser (together, the “Insurance Companies”).
The Portfolio has registered and offers four classes of shares: Class A, B, E and F shares. Shares of each Class of the Portfolio represent an equal pro rata interest in the Portfolio and generally give the shareholder the same voting, dividend, liquidation, and other rights. Investment income, realized and unrealized capital gains and losses, the common expenses of the Portfolio, and certain Portfolio-level expense reductions, if any, are allocated on a pro rata basis to each Class based on the relative net assets of each Class to the net assets of the Portfolio. Each Class of shares differs in its respective distribution plan and such distribution expenses are allocated to the corresponding Class of shares.
2. Significant Accounting Policies
The preparation of financial statements in conformity with accounting principles generally accepted in the United States of America (“GAAP”) requires management to make estimates and assumptions that affect the reported amounts of assets and liabilities and disclosure of contingent assets and liabilities as of the date of the financial statements and the reported amounts of income and expenses during the reporting period. Actual results could differ from those estimates. In the preparation of these financial statements, management has evaluated events and transactions subsequent to December 31, 2018 through the date the financial statements were issued.
The Portfolio is an investment company and follows the accounting and reporting guidance of the Financial Accounting Standards Board (“FASB”) Accounting Standards Codification Topic 946—Financial Services—Investment Companies. The following is a summary of significant accounting policies consistently followed by the Portfolio in the preparation of its financial statements.
Investment Valuation and Fair Value Measurements - The Portfolio values its portfolio investments for purposes of calculating its net asset value (“NAV”) using procedures approved by the Board of Trustees of the Trust (the “Board” or “Trustees”). Those procedures allow for a variety of methodologies to be used to value the Portfolio’s investments. The specific methodologies used for a particular investment may vary based on the market data available for a specific investment at the time the Portfolio calculates its NAV or based on other considerations. The procedures also permit a level of judgment to be used in the valuation process. The Portfolio follows the accounting and reporting guidance of FASB Accounting Standards Codification Topic 820—Fair Value Measurement.
Debt securities, including corporate, convertible and municipal bonds and notes; obligations of the U.S. Treasury and U.S. government agencies; foreign sovereign issues; andnon-U.S. bonds, are generally valued on the basis of evaluated or composite bid quotations obtained from independent pricing services and/or brokers and dealers selected by the Adviser (each a “pricing service”), pursuant to authorization of and subject to general oversight by the Board. Such pricing services may use matrix pricing, which considers observable inputs including, among other things, issuer details, maturity dates, interest rates, yield curves, rates of prepayment, credit risks/spreads, default rates, reported trades, broker-dealer quotes and quoted prices for similar assets. Short-term obligations with a remaining maturity of sixty days or less may be valued at amortized cost in the absence of market quotes, so long as the amortized cost value of such short-term debt instrument is approximately the same as the fair value of the instrument as determined without the use of amortized cost valuation. Floating rate loans are generally valued on the basis of an evaluated or composite average of aggregate bid and ask quotations supplied by brokers or dealers, as obtained from the pricing service. Securities that use similar valuation techniques and inputs as described above are generally categorized as Level 2 within the fair value hierarchy.
Mortgage- and asset-backed securities are generally valued on the basis of evaluated or composite bid quotations obtained from pricing services selected by the Adviser pursuant to the authorization of and subject to general oversight by the Board. These securities are usually issued as separate tranches, or classes, of securities within each deal. The pricing models for these securities usually consider tranche-level attributes, current market data, estimated cash flows and market-based yield spreads for each tranche and incorporate deal collateral performance, as available. Mortgage- and asset-backed securities that use similar valuation techniques and inputs as described above are generally categorized as Level 2 within the fair value hierarchy.
Domestic and foreign equity securities, such as common stock, exchange-traded funds, rights, warrants, and preferred stock, that are traded on a securities exchange on a valuation date are generally valued at their last quoted sale price or official closing price on the primary exchange for such security, or, if no sales occurred on that day, at the last reported bid price. Equity securities tradedover-the-counter (“OTC”) are generally valued at the last reported bid price. In the event of a major exchange closing during the trading day, the Adviser may use other market information obtained from quotation reporting systems, established market makers, or pricing services in valuing the securities. Valuation adjustments may be applied to certain foreign equity securities that are traded
BHFTII-24
Brighthouse Funds Trust II
MFS Total Return Portfolio
Notes to Financial Statements—December 31, 2018—(Continued)
solely on foreign exchanges that close before the time as of which the Portfolio determines its NAV to account for the market movement between the close of the foreign exchanges and the time as of which the Portfolio determines its NAV. The Portfolio may use a systematic fair valuation model provided by a pricing service to value securities principally traded in these foreign markets in order to adjust for possible market movements or other changes that may occur between the close of the foreign exchanges and the time as of which the Portfolio determines its NAV. Foreign equity securities valued using these valuation adjustments are generally categorized as Level 2 within the fair value hierarchy. Equity securities that are actively traded, and have no valuation adjustments applied, are categorized as Level 1 within the fair value hierarchy. Other equity securities traded on inactive markets, or valued in reference to similar instruments traded on active markets, are generally categorized as Level 2 within the fair value hierarchy.
Investments in registeredopen-end management investment companies are valued at reported NAV per share on the valuation date and are categorized as Level 1 within the fair value hierarchy.
Futures contracts that are traded on commodity exchanges are valued at their closing prices as of the close of such exchanges and are categorized as Level 1 within the fair value hierarchy.
If no current market value quotation or other observable inputs are readily available or market value quotations are deemed to be unreliable for an investment, the fair value of the investment will be determined in accordance with procedures approved by, and under the general supervision of, the Board. In such a circumstance, the Board will be assisted in its responsibility to determine the fair value of an investment by the Valuation Committee (“Committee”) of Brighthouse Investment Advisers. The Committee provides general pricing oversight and fair value pricing determinations related to portfolio securities and meets on a regular basis to review reports relating to the valuation of the securities in the Portfolio. The Board has delegated to State Street Bank and Trust Company, the Trust’s custodian (“Custodian”), the responsibility for calculating the NAVs of the Trust’s Portfolios. The Committee is responsible for overseeing the calculation of the NAVs of the Portfolios by the custodian. The Committee also periodically reviews pricing services, including the pricing services providing fair value pricing for the Portfolio’s foreign securities, and is responsible for overseeing the correction of pricing errors and addressing other pricing issues that arise in the ordinary course of business, such as making real-time fair value determinations, as necessary.
No single standard for determining the fair value of an investment can be set forth because fair value depends upon the facts and circumstances with respect to each investment. Information relating to any relevant factors may be obtained by the Committee from any appropriate source, including the subadviser of the Portfolio, the custodian, a pricing service, market maker and/or broker for such security or the issuer. Appropriate methodologies for determining fair value under particular circumstances may include: matrix pricing, a discounted cash flow analysis, comparisons of securities with comparable characteristics, value based on multiples of earnings, discount from market price of similar marketable securities, or a combination of these and other methods.
Investment Transactions and Related Investment Income - Portfolio security transactions are recorded on the trade date. Dividend income is recorded on theex-dividend date or, for certain foreign securities, when notified. Interest income, which includes amortization of premium and accretion of discount on debt securities, is recorded on the accrual basis. Realized gains and losses on investments are determined on the identified cost basis, which is the same basis used for federal income tax purposes. Foreign income and foreign capital gains on some foreign securities may be subject to foreign taxes, which are accrued as applicable. These foreign taxes have been provided for in accordance with the Portfolio’s understanding of the applicable countries’ tax rules and rates.
Foreign Currency Translation -The books and records of the Portfolio are maintained in U.S. dollars. The values of securities, currencies, and other assets and liabilities denominated in currencies other than the U.S. dollar are translated into U.S. dollars based upon foreign exchange rates prevailing at the end of the period. Purchases and sales of investment securities, income, and expenses are translated on the respective dates of such transactions. Because the values of investment securities are translated at the foreign exchange rates prevailing at the end of the period, that portion of the results of operations arising from changes in exchange rates and that portion of the results of operations reflecting fluctuations arising from changes in market prices of the investment securities are not separated. Such fluctuations are included in the net realized and unrealized gain or loss on investments.
Net realized foreign exchange gains or losses arise from activity in forward foreign currency exchange contracts, sales of foreign currency, currency gains or losses realized between the trade and settlement dates on securities transactions, and the difference between the amounts of dividends, interest, and foreign withholding taxes recorded by the Portfolio and the U.S. dollar-equivalent of the amounts actually received or paid by the Portfolio. Net unrealized foreign exchange gains and losses arise from changes in the value of assets and liabilities, other than investment securities, resulting from changes in foreign exchange rates.
Dividends and Distributions to Shareholders - The Portfolio records dividends and distributions on theex-dividend date. Net realized gains from securities transactions (if any) are generally distributed annually to shareholders. The timing and characterization of certain income and capital gains distributions are determined in accordance with federal tax regulations that may differ from GAAP. Permanent book and tax basis differences relating to shareholder distributions will result in reclassification between distributable earnings (accumulated losses), andpaid-in surplus.Book-tax differences are primarily due to adjustments to prior period accumulated balances. These adjustments have no impact on net assets or the results of operations.
BHFTII-25
Brighthouse Funds Trust II
MFS Total Return Portfolio
Notes to Financial Statements—December 31, 2018—(Continued)
Income Taxes - It is the Portfolio’s policy to comply with the requirements of the Internal Revenue Code of 1986, as amended, and regulations thereunder, applicable to regulated investment companies, and to distribute, with respect to each taxable year, all of its taxable income to shareholders. Therefore, no federal income tax provision is required. The Portfolio files U.S. federal tax returns. No income tax returns are currently under examination. The Portfolio’s federal tax returns for the prior three fiscal years remain subject to examination by the Internal Revenue Service. As of December 31, 2018, the Portfolio had no uncertain tax positions that would require financial statement recognition, or derecognition or disclosure.
Mortgage Dollar Rolls - The Portfolio may enter into mortgage “dollar rolls” in which a Portfolio sellsto-be-announced (“TBA”) mortgage-backed securities for delivery in the current month and simultaneously contracts to repurchase substantially similar (same type, coupon, and maturity) securities on a specified future date. For the duration of the transaction, or roll period, the Portfolio foregoes principal (including prepayments of principal) and interest paid on the securities sold. Dollar rolls are accounted for as purchase and sale transactions; gain or loss is recognized at the commencement of the term of the dollar roll and each time the mortgage-backed security is rolled.
Mortgage dollar roll transactions involve the risk that the market value of the securities that the Portfolio is required to repurchase or reacquire may be less than the agreed-upon repurchase price of those securities and that the investment performance of securities purchased with proceeds from these transactions does not exceed the income, capital appreciation, and gain or loss that would have been realized on the securities transferred or sold, as applicable, as part of the treasury or mortgage dollar roll.
Mortgage-Related and Other Asset-Backed Securities - The Portfolio may invest in mortgage-related or other asset-backed securities. These securities may include mortgage pass-through securities, collateralized mortgage obligations (“CMOs”), commercial mortgage-backed securities, CMO residuals, stripped mortgage-backed securities (“SMBS”), and other securities that directly or indirectly represent a participation in, or are secured by or payable from, mortgage loans on real property or other receivables. The value of some mortgage- or asset-backed securities may be particularly sensitive to changes in prevailing interest rates. Early repayment of principal on some mortgage-related securities may expose the Portfolio to a lower rate of return upon reinvestment of principal. The value of these securities may fluctuate in response to the market’s perception of the creditworthiness of the issuers. Additionally, although mortgages and mortgage-related securities are generally supported by some form of government or private guarantee and/or insurance, there is no assurance that private guarantors or insurers will meet their obligations.
In one type of SMBS, one class receives all of the interest from the mortgage assets (the interest-only or “IO” class), while the other class will receive all of the principal (the principal-only or “PO” class). Because principal will not be received at the maturity of an IO, adjustments are made to the book value of the security until maturity. These adjustments are netted against payments received for the IOs and the net amount is included in interest income on the Statement of Operations of the Portfolio. Payments received for POs are treated as reductions to the cost and par value of the securities. Details of mortgage-related and other asset-backed securities held by the Portfolio are included in the Portfolio’s Schedule of Investments.
The Portfolio may invest a significant portion of its assets in securities of issuers that hold mortgage- and asset-backed securities and direct investments in securities backed by commercial and residential mortgage loans and other financial assets. The value and related income of these securities are sensitive to changes in economic conditions, including delinquencies and/or defaults, and may be negatively impacted by increased volatility of market prices and periods of illiquidity.
TBA Purchase and Forward Sale Commitments - The Portfolio may enter into TBA commitments to purchase or sell securities for a fixed price at a future date. TBA commitments are considered securities in themselves, and involve a risk of loss if the value of the security to be purchased or sold declines or increases prior to the settlement date, which is in addition to the risk of decline in the value of the Portfolio’s other assets. TBA forward sale commitments are valued at the current market value of the underlying securities, according to the procedures described under “Investment Valuation and Fair Value Measurements”.
When-Issued and Delayed-Delivery Securities - The Portfolio may purchase securities on a when-issued or delayed-delivery basis. Settlement of such transactions will occur beyond the customary settlement period. The Portfolio may purchase securities under such conditions only with the intention of actually acquiring them, but may enter into a separate agreement to sell the securities before the settlement date. Since the value of securities purchased may fluctuate prior to settlement, the Portfolio may be required to pay more at settlement than the security is worth. In addition, the Portfolio is not entitled to any of the interest earned prior to settlement.
Upon making a commitment to purchase a security on a when-issued or delayed-delivery basis, the Portfolio will hold liquid assets in a segregated account with the Portfolio’s Custodian, or set aside liquid assets in the Portfolio’s records, worth at least the equivalent of the amount due. The liquid assets will be monitored on a daily basis and adjusted as necessary to maintain the necessary value.
Directed Brokerage Agreement -The Trust has entered into a directed brokerage arrangement with Capital Institutional Services, Inc. (“CAPIS”). Under this arrangement, the Portfolio directs certain trades to CAPIS in return for a recapture credit. CAPIS issues a cash rebate to the Portfolio. Amounts paid to the Portfolio are shown separately as broker commission recapture on the Statement of Operations of the Portfolio. Additionally, these amounts have been excluded from the calculation of the net ratio of expenses to average net assets presented in the Financial Highlights for each share class.
BHFTII-26
Brighthouse Funds Trust II
MFS Total Return Portfolio
Notes to Financial Statements—December 31, 2018—(Continued)
Repurchase Agreements -The Portfolio may enter into repurchase agreements, under the terms of a Master Repurchase Agreement (“MRA”), with selected commercial banks and broker-dealers, under which the Portfolio acquires securities as collateral and agrees to resell the securities at an agreed-upon time and at an agreed-upon price. The Portfolio, through the Custodian or a subcustodian, under atri-party repurchase agreement, receives delivery of the underlying securities collateralizing any repurchase agreements. It is the Portfolio’s policy that the market value of the collateral be equal to at least 100% of the repurchase price in the case of a repurchase agreement ofone-day duration and equal to at least 102% of the repurchase price in the case of all other repurchase agreements. In the event of default or failure by a party to perform an obligation in connection with any repurchase transaction, the MRA gives thenon-defaulting party the right toset-off claims and to apply property held by it in connection with any repurchase transaction against obligations owed to it.
At December 31, 2018, the Portfolio invested cash collateral for loans of portfolio securities in repurchase agreements with a gross value of $34,045,261. The combined value of all repurchase agreements is included as part of investments at value on the Statement of Assets and Liabilities. The value of the related collateral exceeded the value of the repurchase agreements at December 31, 2018.
Securities Lending - The Portfolio may lend its portfolio securities to certain qualified brokers who borrow securities in order to complete certain securities transactions. By lending its portfolio securities, the Portfolio attempts to increase its net investment income through the receipt of income on collateral held from securities on loan. Any gain or loss in the market price of the loaned securities that might occur and any interest earned or dividends declared during the term of the loan would accrue to the account of the Portfolio.
The Trust has entered into aNon-Custodial Securities Lending Agreement with JPMorgan Chase Bank, N.A. (the “Lending Agent”). Under the agreement, the Lending Agent is authorized to loan portfolio securities on the Portfolio’s behalf. In exchange, the Portfolio receives either cash or U.S. government securities as collateral against the loaned securities. The Portfolio receives collateral equal to at least 102% of the market value for loans secured by government securities or cash in the same currency as the loaned shares and 105% for all other loaned securities at each loan’s inception. Collateral representing at least 100% of the market value of the loaned securities is maintained for the duration of the loan. Any cash collateral received by the Portfolio is generally invested by the Lending Agent in short-term investments, which may include certificates of deposit, commercial paper, repurchase agreements, time deposits, master demand notes and money market funds. The market value of investments made with cash collateral received are disclosed in the Schedule of Investments and the valuation techniques are described in Note 2. If the market value of the collateral at the close of trading on a business day is less than 100% of the market value of the loaned securities at the close of trading on that day, the borrower is required to deliver, by the close of business on the following business day, an additional amount of collateral, so that the total amount of posted collateral is equal to at least 100% of the market value of all the loaned securities as of such preceding day. A portion of the income earned on the collateral is rebated to the borrower of the securities and the remainder is split between the Lending Agent and the Portfolio. On loans collateralized by U.S. government securities, a fee is received from the borrower and is allocated between the Portfolio and the Lending Agent.
Income received by the Portfolio in securities lending transactions during the year ended December 31, 2018 is reflected as securities lending income on the Statement of Operations. The values of any securities loaned by the Portfolio and the related collateral at December 31, 2018 are disclosed in the footnotes to the Schedule of Investments. The value of the related collateral received by the Portfolio exceeded the value of the securities out on loan at December 31, 2018.
The risks associated with lending portfolio securities include, but are not limited to, possible delays in receiving additional collateral or in the recovery of the loaned securities, possible loss of rights in the collateral should the borrower fail financially, as well as risk of loss in the value of the collateral or the value of the investments made with the collateral. The Lending Agent shall indemnify the Portfolio in the case of default of any securities borrower, subject to the terms of theNon-Custodial Securities Lending Agreement.
The following table provides a breakdown of transactions accounted for as secured borrowings, the gross obligations by the type of collateral pledged, and the remaining contractual maturities of those transactions.
| | | | | | | | | | | | | | | | | | | | |
| | | Remaining Contractual Maturity of the Agreements
As of December 31, 2018 | |
| | | Overnight and
Continuous | | | Up to
30 Days | | | 31 - 90
Days | | | Greater than
90 days | | | Total | |
| Securities Lending Transactions | |
Common Stocks | | $ | (51,779,730 | ) | | $ | — | | | $ | — | | | $ | — | | | $ | (51,779,730 | ) |
Corporate Bonds & Notes | | | (8,103,531 | ) | | | — | | | | — | | | | — | | | | (8,103,531 | ) |
U.S. Treasury & Government Agencies | | | (628,397 | ) | | | — | | | | — | | | | — | | | | (628,397 | ) |
Total | | $ | (60,511,658 | ) | | $ | — | | | $ | — | | | $ | — | | | $ | (60,511,658 | ) |
Total Borrowings | | $ | (60,511,658 | ) | | $ | — | | | $ | — | | | $ | — | | | $ | (60,511,658 | ) |
Gross amount of recognized liabilities for securities lending transactions | | | $ | (60,511,658 | ) |
| | | | | | | | | | | | | | | | | | | | |
BHFTII-27
Brighthouse Funds Trust II
MFS Total Return Portfolio
Notes to Financial Statements—December 31, 2018—(Continued)
3. Certain Risks
In the normal course of business, the Portfolio invests in securities and enters into transactions where risks exist. Those risks include:
Market Risk:The value of securities held by the Portfolio may decline in response to certain events, including those directly involving the issuers whose securities are owned by the Portfolio; conditions affecting the general economy; overall market changes; local, regional or global political, social or economic instability; and currency, interest rate, and price fluctuations.
Credit and Counterparty Risk: The Portfolio may be exposed to counterparty risk, or the risk that an entity with which the Portfolio has unsettled or open transactions may default. The potential loss could exceed the value of the financial assets and liabilities recorded in the financial statements. Financial assets that potentially expose the Portfolio to credit and counterparty risk consist principally of cash due from counterparties and investments. The Portfolio manages counterparty risk by entering into agreements only with counterparties that it believes have the financial resources to honor their obligations and by monitoring the financial stability of those counterparties. The Adviser attempts to mitigate counterparty risk by (i) periodically assessing the creditworthiness of its trading partners, (ii) monitoring and/or limiting the amount of its net exposure to each individual counterparty based on its assessment, and (iii) requiring collateral from the counterparty for certain transactions. In order to preserve certain safeguards fornon-standard settlement trades, the Portfolio restricts its exposure to credit and counterparty losses by entering into master netting agreements (“Master Agreements”) with counterparties (approved brokers) with whom it undertakes a significant volume of transactions. Master Agreements govern the terms of certain transactions, and reduce the counterparty risk associated with relevant transactions by specifying credit protection mechanisms and providing standardization that improves legal certainty. Master Agreements can also help limit counterparty risk by specifying collateral posting arrangements atpre-arranged exposure levels.
Repurchase and reverse repurchase agreements are primarily executed under Global Master Repurchase Agreements (“GMRAs”) or Master Repurchase Agreements (“MRAs”), which provide the rights toset-off. Each repurchase and reverse repurchase agreement is initially collateralized at the transaction level. In the event of default, the total market value exposure will be offset against collateral exchanged to date, which would result in a net receivable/(payable) that would be due from/to the counterparty.
Master Securities Forward Transaction Agreements (“MSFTA”) govern the considerations and factors surrounding the settlement of certain forward settling transactions, such as TBA securities and delayed-delivery or secured borrowings transactions by and between the Portfolio and select counterparties. The MSFTA maintain provisions for, among other things, initiation and confirmation, payment and transfer, events of default, termination, and maintenance of collateral.
Additional risks associated with each type of investment are described above within the respective security type notes. The Portfolio’s prospectus includes a discussion of the principal risks of investing in the Portfolio.
4. Investment Transactions
Aggregate cost of purchases and proceeds of sales of investment securities, including mortgage dollar rolls and TBA transactions but excluding short-term securities, for the year ended December 31, 2018 were as follows:
| | | | | | | | | | | | |
Purchases | | | Sales | |
U.S. Government | | Non-U.S. Government | | | U.S. Government | | | Non-U.S. Government | |
| $106,945,935 | | $ | 131,834,588 | | | $ | 118,775,659 | | | $ | 193,934,707 | |
The Portfolio engaged in security transactions with other accounts managed by Massachusetts Financial Services Company, the subadviser to the Portfolio, that amounted to $240,042 in sales of investments, which are included above, and resulted in realized losses of $79,732.
Purchases and sales of mortgage dollar rolls and TBA transactions for the year ended December 31, 2018 were as follows:
| | | | |
Purchases | | Sales | |
| $14,996,185 | | $ | 11,773,770 | |
BHFTII-28
Brighthouse Funds Trust II
MFS Total Return Portfolio
Notes to Financial Statements—December 31, 2018—(Continued)
5. Investment Management Fees and Other Transactions with Affiliates
Investment Management Agreement - Brighthouse Investment Advisers is the investment adviser to the Portfolio. The Trust has entered into an investment management agreement with Brighthouse Investment Advisers with respect to the Portfolio. For providing investment management services to the Portfolio, Brighthouse Investment Advisers receives monthly compensation at the following annual rates:
| | | | | | |
Management
Fees earned by
Brighthouse
Investment Advisers for the year ended December 31, 2018 | | % per annum | | | Average Daily Net
Assets |
| $4,624,488 | | | 0.600 | % | | Of the first $250 million |
| | | 0.550 | % | | Of the next $500 million |
| | | 0.500 | % | | On amounts in excess of $750 million |
Certain officers and trustees of the Trust may also be officers of Brighthouse Investment Advisers; however, such officers and trustees receive no compensation from the Trust.
Brighthouse Investment Advisers has entered into an investment subadvisory agreement with respect to managing the Portfolio. Massachusetts Financial Services Company (the “Subadviser”) is compensated by Brighthouse Investment Advisers to provide subadvisory services for the Portfolio.
Transfer Agency Agreement - Brighthouse Financial, Inc. serves as the transfer agent for the Trust. Brighthouse Financial, Inc. receives no fees for its services to the Trust.
Distribution and Service Fees - The Trust has a distribution agreement with Brighthouse Securities, LLC (the “Distributor”) pursuant to which the Distributor serves as the general distributor of shares of each class (each a “Class”) of each Portfolio. The Distributor is an affiliate of the Trust. The Trust has adopted a Distribution and Services Plan (the “Plan”) relating to Class B, Class E and Class F shares of each Portfolio, under Rule 12b-1 under the 1940 Act, pursuant to which the Trust may pay the Distributor a fee (the “Service Fee”) at an annual rate not to exceed 0.25% of each such Portfolio’s average daily net assets attributable to the Class B, Class E and Class F shares of the Trust. Each Portfolio may not offer shares of each Class. The Plan also authorizes the Trust, on behalf of each of its Portfolios, may pay the Distributor a distribution Fee (the “Distribution Fee” and together with the Service Fee, the “Fees”) at an annual rate of up to 0.25% of each Portfolio’s average daily net assets attributable to the Class B, Class E and Class F shares in consideration of the services rendered in connection with the sale of such shares by the Distributor. Under the Distribution Agreement with respect to the Trust, Fees are currently paid at an annual rate of 0.25% of average daily net assets in the case of Class B shares, 0.15% of average daily net assets in the case of Class E shares and 0.20% of average daily net assets in the case of Class F shares. The Plan is known as a “compensation plan” because the Trust makes payments to the Distributor for services rendered regardless of the actual level of expenditures by the Distributor. Amounts incurred by the Portfolio for the year ended December 31, 2018 are shown as Distribution and service fees in the Statement of Operations.
Deferred Trustee Compensation - Each Trustee who is not currently an employee of the Adviser or any of its affiliates receives compensation from the Trust for his or her service to the Trust. A deferred compensation plan (the “Plan”) is available to the Trustees on a voluntary basis. Deferred amounts remain in the Trust until distributed in accordance with the provisions of the Plan. The value of a participating Trustee’s deferral account is based on theoretical investments of deferred amounts on the normal payment dates in certain portfolios of the Trust or Brighthouse Funds Trust I, an affiliate of the Trust, as designated by the participating Trustee. Changes in the value of participants’ deferral accounts are reflected as Trustees’ fees and expenses in the Statement of Operations. The portion of the accrued obligations allocated to the Portfolio under the Plan is reflected as Deferred trustees’ fees in the Statement of Assets and Liabilities.
6. Contractual Obligations
Under the Trust’s organizational documents, its officers and Trustees may be indemnified against certain liabilities and expenses arising out of the performance of their duties to the Trust. Additionally, the Trust has a variety of indemnification obligations under contracts with its service providers. The Trust’s maximum exposure under these arrangements is unknown, as this would involve future claims that may be made against the Trust that have not yet occurred.
BHFTII-29
Brighthouse Funds Trust II
MFS Total Return Portfolio
Notes to Financial Statements—December 31, 2018—(Continued)
7. Income Tax Information
The cost basis of investments for federal income tax purposes at December 31, 2018 was as follows:
| | | | |
Cost basis of investments | | $ | 750,051,513 | |
| | | | |
Gross unrealized appreciation | | | 80,408,989 | |
Gross unrealized depreciation | | | (33,123,090 | ) |
| | | | |
Net unrealized appreciation (depreciation) | | $ | 47,285,899 | |
| | | | |
The tax character of distributions paid for the years ended December 31, 2018 and 2017 were as follows:
| | | | | | | | | | | | | | | | | | | | |
Ordinary Income | | | Long-Term Capital Gain | | | Total | |
2018 | | 2017 | | | 2018 | | | 2017 | | | 2018 | | | 2017 | |
| $20,298,439 | | $ | 22,797,540 | | | $ | 48,305,318 | | | $ | 43,395,304 | | | $ | 68,603,757 | | | $ | 66,192,844 | |
As of December 31, 2018, the components of distributable earnings (accumulated losses) on a federal income tax basis were as follows:
| | | | | | | | | | | | | | | | |
Undistributed
Ordinary
Income | | Undistributed
Long-Term
Capital Gain | | | Net
Unrealized
Appreciation | | | Accumulated
Capital Losses | | | Total | |
| $17,379,312 | | $ | 30,801,703 | | | $ | 47,283,920 | | | $ | — | | | $ | 95,464,935 | |
The Portfolio utilizes the provisions of the federal income tax laws that provide for the carryforward of capital losses for prior years, offsetting such losses against any future realized capital gains. Under the Regulated Investment Company Modernization Act of 2010, net capital losses recognized after December 22, 2010 may be carried forward indefinitely and their character is retained as short-term and/or long-term losses.
As of December 31, 2018, the Portfolio had no accumulated capital losses.
8. Recent Accounting Pronouncements and SEC Update
In March 2017, FASB issued Accounting Standards Update No. 2017-08, Receivables—Nonrefundable Fees and Other Costs (Subtopic 310-20)—Premium Amortization on Purchased Callable Debt Securities (“ASU 2017-08”) which amends the amortization period for certain purchased callable debt securities. Under the standards update, the premium amortization of purchased callable debt securities that have explicit, non-contingent call features and are callable at fixed prices will be amortized to the earliest call date. The guidance will be applied on a modified retrospective basis and is effective for fiscal years, and their interim periods, beginning after December 15, 2018. Management is currently assessing the impact of ASU 2017-08, but does not believe the adoption will have a material impact on the Portfolios’ financial statements.
In August 2018, the FASB issued Accounting Standards Update 2018-13, Fair Value Measurement (Topic 820)—Disclosure Framework—Changes to the Disclosure Requirements for Fair Value Measurement (“ASU 2018-13”) which introduces new fair value disclosure requirements as well as eliminates and modifies certain existing fair value disclosure requirements. ASU 2018-13 is effective for fiscal years beginning after December 15, 2019, and interim periods within those fiscal years. Early adoption is permitted and, as such, management has elected to early adopt ASU 2018-13 effective with the current reporting period. The impact of the Portfolio’s adoption was limited to changes in the Portfolio’s financial statement disclosures regarding fair value, primarily those disclosures related to transfers between levels of the fair value hierarchy.
In August 2018, the Securities and Exchange Commission released its Final Rule on Disclosure Update and Simplification (the “Final Rule”) which is intended to simplify an issuer’s disclosure compliance efforts by removing redundant or outdated disclosures requirements without significantly altering the mix of information provided to investors. Effective with the current reporting period, the Portfolio adopted the Final Rule with the most notable impacts being that the Portfolio is no longer required to present the components of distributable earnings on the Statement of Assets and Liabilities or the sources of distributions to shareholders and the amounts of undistributed net investment income on the Statements of Changes in Net Assets.
BHFTII-30
Brighthouse Funds Trust II
MFS Total Return Portfolio
Report of Independent Registered Public Accounting Firm
To the Shareholders of MFS Total Return Portfolio and the Board of Trustees of Brighthouse Funds Trust II:
Opinion on the Financial Statements and Financial Highlights
We have audited the accompanying statement of assets and liabilities, including the schedule of investments, of the MFS Total Return Portfolio (the “Portfolio”), one of the portfolios constituting the Brighthouse Funds Trust II, as of December 31, 2018, the related statement of operations for the year then ended, the statements of changes in net assets for each of the two years in the period then ended, the financial highlights for each of the five years in the period then ended, and the related notes. In our opinion, the financial statements and financial highlights present fairly, in all material respects, the financial position of the MFS Total Return Portfolio of the Brighthouse Funds Trust II as of December 31, 2018, the results of its operations for the year then ended, the changes in its net assets for each of the two years in the period then ended, and the financial highlights for each of the five years in the period then ended, in conformity with accounting principles generally accepted in the United States of America.
Basis for Opinion
These financial statements and financial highlights are the responsibility of the Portfolio’s management. Our responsibility is to express an opinion on the Portfolio’s financial statements and financial highlights based on our audits. We are a public accounting firm registered with the Public Company Accounting Oversight Board (United States) (PCAOB) and are required to be independent with respect to the Portfolio in accordance with the U.S. federal securities laws and the applicable rules and regulations of the Securities and Exchange Commission and the PCAOB.
We conducted our audits in accordance with the standards of the PCAOB. Those standards require that we plan and perform the audit to obtain reasonable assurance about whether the financial statements and financial highlights are free of material misstatement, whether due to error or fraud. The Portfolio is not required to have, nor were we engaged to perform, an audit of its internal control over financial reporting. As part of our audits we are required to obtain an understanding of internal control over financial reporting but not for the purpose of expressing an opinion on the effectiveness of the Portfolio’s internal control over financial reporting. Accordingly, we express no such opinion.
Our audits included performing procedures to assess the risks of material misstatement of the financial statements and financial highlights, whether due to error or fraud, and performing procedures that respond to those risks. Such procedures included examining, on a test basis, evidence regarding the amounts and disclosures in the financial statements and financial highlights. Our audits also included evaluating the accounting principles used and significant estimates made by management, as well as evaluating the overall presentation of the financial statements and financial highlights. Our procedures included confirmation of securities owned as of December 31, 2018, by correspondence with the custodian and brokers; when replies were not received from brokers, we performed other auditing procedures. We believe that our audits provide a reasonable basis for our opinion.
/s/ Deloitte & Touche LLP
Boston, Massachusetts
February 25, 2019
We have served as the auditor of one or more of the Brighthouse investment companies since 1983.
BHFTII-31
Brighthouse Funds Trust II
Trustees and Officers
MANAGEMENT OF THE TRUSTS
The Boards of Trustees (the “Board”) of Brighthouse Funds Trust I and Brighthouse Funds Trust II (“BHF I” and “BHF II”, respectively, and collectively the “Trusts”) supervise the Trusts and are responsible for representing the interests of shareholders. The Trustees, the Chairman of the Board and the Chairmen of each subcommittee are the same for both Trusts. The Trustees of each Trust meet periodically throughout the year to oversee the Portfolios’ activities, reviewing, among other things, each Portfolio’s performance and its contractual arrangements with various service providers. The Trustees of each Trust elect the officers of the Trust, who are responsible for administering the Trust’sday-to-day operations.
Trustees and Officers
The Trustees and executive officers of the Trusts, as well as their principal occupations during the past five years, are set forth below. Unless otherwise indicated, the business address of each is c/o Brighthouse Funds, One Financial Center, Boston, Massachusetts 02111. Each Trustee who is deemed an “interested person,” as such term is defined in the 1940 Act, is referred to as an “Interested Trustee.” Those Trustees who are not “interested persons,” as such term is defined in the 1940 Act, are referred to as “Independent Trustees.” There is no limit to the term a Trustee may serve. Trustees serve until their death, resignation or removal in accordance with the BHF I Trust’s and BHF II Trust’s respective organizational documents and policies adopted by the Boards of the respective Trusts from time to time. Officers hold office at the pleasure of each Board and serve until their removal or resignation in accordance with the Trusts’ respective organizational documents and policies adopted by the Board of each Trust from time to time.
| | | | | | | | | | |
Name and Year of Birth | | Current
Position(s)
Held with
Registrant | | Term of Office
and Length of
Time Served | | Principal Occupation(s) During the Past 5 Years(1) | | Number of
Portfolios in
Brighthouse Funds
Complex(2)
Overseen
by Trustee | | Other Directorships Held
by Trustee During
the Past 5 Years(1) |
| Interested Trustee |
John Rosenthal* (1960) | | Trustee | | Indefinite;
From
May
2016
(Trust I
and
Trust II) to
present | | Chief Investment Officer, Brighthouse Financial, Inc. (2017 to present); until 2017, Senior Managing Director and Head of Global Portfolio Management, MetLife, Inc. | | 72 | | None |
|
| Independent Trustees |
Dawn M. Vroegop (1966) | | Trustee and Chairman of the Board | | Indefinite;
From
December
2000
(Trust I)/
May
2009
(Trust II)
to present
as
Trustee;
From
May
2016
(Trust I
and
Trust II)
until
present as
Chairman | | Private Investor. | | 72 | | Trustee, Driehaus Mutual Funds.** |
BHFTII-32
Brighthouse Funds Trust II
Trustees and Officers—(Continued)
| | | | | | | | | | |
Name and Year of Birth | | Current
Position(s)
Held with
Registrant | | Term of Office
and Length of
Time Served | | Principal Occupation(s) During the Past 5 Years(1) | | Number of
Portfolios in
Brighthouse Funds
Complex(2)
Overseen
by Trustee | | Other Directorships Held
by Trustee During
the Past 5 Years(1) |
Stephen M. Alderman (1959) | | Trustee | | Indefinite;
From
December
2000
(Trust I)/
April
2012
(Trust II)
to present | | Shareholder in the law firm of Garfield and Merel, Ltd. | | 72 | | None |
| | | | | |
Robert J. Boulware (1956) | | Trustee | | Indefinite;
From
March
2008
(Trust I)/
April
2012
(Trust II)
to present | | Managing Director, Pilgrim Funds, LLC (private equity fund). | | 72 | | Trustee, Vertical Capital Income Fund(closed-end fund);** Director, Gainsco, Inc. (auto insurance);** Trustee, SharesPost 100 Fund(closed-end fund).** |
| | | | | |
Susan C. Gause (1952) | | Trustee | | Indefinite;
From
March
2008
(Trust I)/
April
2012
(Trust II)
to present | | Private Investor. | | 72 | | Trustee, HSBC Funds.** |
| | | | | |
Nancy Hawthorne (1951) | | Trustee | | Indefinite;
From
May
2003
(Trust II)/
April
2012
(Trust I) to
present | | Partner, Hawthorne Financial Advisors, LLC (registered investment advisor); until 2014, Chief Executive Officer, Clerestory LLC (corporate advisor). | | 72 | | Director and Chairman of the Board of Directors, THL Credit, Inc.;** Director and Chairman of the Board, Avid Technology, Inc.;** Director, CRA International, Inc.** |
| | | | | |
Barbara A. Nugent (1956) | | Trustee | | Indefinite;
From
January
2014
(Trust I
and
Trust II) to
present | | President, True North Board Governance, LLC (consulting); until December 2013, partner in the law firm of Stradley Ronon Stevens & Young, LLP. | | 72 | | Independent Lead Trustee, BMT Investment Funds** |
| | | | | |
Christopher J. Towle (1957) | | Trustee | | Indefinite;
From
April
2018
(Trust I
and
Trust II) to
present | | Retired; until 2014, Partner, Portfolio Manager, Director of High Yield and Convertible Strategies, Lord Abbett & Co. | | 72 | | Trustee, Driehaus Mutual Funds** |
BHFTII-33
Brighthouse Funds Trust II
Trustees and Officers—(Continued)
Officers
| | | | | | |
Name and Year of Birth | | Position(s)
Held with
Registrant | | Length of
Time Served | | Principal Occupation(s)
During the Past 5 Years(1) |
| Executive Officers | | | | | | |
Kristi Slavin (1973) | | President and Chief Executive Officer, of Trust I and Trust II | | From May
2016
(Trust I
and
Trust II) to
present | | President, Brighthouse Investment Advisers, LLC (2016-present); formerly, Senior Vice President, MetLife Advisers, LLC; Vice President, MetLife, Inc.; Vice President, Trust I and Trust II(2015-2016). |
| | | |
Alan R. Otis (1971) | | Chief Financial Officer and Treasurer, of Trust I and Trust II | | From
November
2017
(Trust I
and
Trust II) to
present | | Senior Vice President, Brighthouse Investment Advisers, LLC (2017-present); formerly, Vice President, Brighthouse Investment Advisers, LLC (2012-2017); Assistant Treasurer, Trust I and Trust II(2012-2017). |
| | | |
Andrew L. Gangolf (1954) | | Secretary, of Trust I and Trust II | | From May
2011
(Trust I
and
Trust II) to
present | | Executive Vice President, Brighthouse Investment Advisers, LLC (2017-present); formerly, Senior Vice President, MetLife Advisers, LLC (2011-2017); until 2011, Senior Vice President & Assistant General Counsel, AllianceBernstein Investments, Inc. |
| | | |
Steven E. Hartstein (1963) | | Chief Compliance Officer (“CCO”), of Trust I and Trust II | | From
February
2014
(Trust I
and
Trust II) to
present | | Senior Vice President and CCO, Brighthouse Investment Advisers, LLC (2017-present); Head of Investments Compliance, Vice President, Brighthouse Financial, Inc. (2017-present); formerly, Vice President, MetLife, Inc. (2013-2017); Senior Vice President and CCO, MetLife Advisers, LLC (2013-2017.) |
| | | |
Victor Soto (1978) | | Vice President of Trust I and Trust II | | From May
2018
(Trust I
and
Trust II) to
present | | Executive Vice President, Brighthouse Investment Advisers, LLC (2016-present); Assistant Vice President, MetLife Inc. (2015-2017); Portfolio Manager, 1st Global (2013-2015). |
| * | Mr. Rosenthal is an “interested person” of the Trusts because of his position with Brighthouse Financial, Inc., the current parent company of Brighthouse Investment Advisers, LLC. |
| ** | Indicates a directorship with a registered investment company or a company subject to the reporting requirements of the Securities Exchange Act of 1934, as amended. |
| (1) | Previous positions during the past five years with the Trusts, Brighthouse Financial, Inc., MetLife, Inc. or the Manager are omitted if not materially different. |
| (2) | The Fund Complex includes 43 BHF I Portfolios and 29 BHF II Portfolios. |
BHFTII-34
Brighthouse Funds Trust II
MFS Total Return Portfolio
Board of Trustees’ Consideration of Advisory and Sub-Advisory Agreements
At anin-person meeting held on November6-8, 2018 (the “November Meeting”), the Boards of Trustees (the “Board”) of Brighthouse Funds Trust I and Brighthouse Funds Trust II (“BFT I” and “BFT II,” respectively, and collectively, the “Trusts”), including a majority of the Trustees who are not “interested persons” of the Trusts (the “Independent Trustees”) under the Investment Company Act of 1940 (the “1940 Act”), approved the continuation of the Trusts’ advisory agreements (each, an “Advisory Agreement”) with Brighthouse Investment Advisers, LLC (the “Adviser”) and the applicablesub-advisory agreements (each a “Sub-Advisory Agreement,” and collectively with the Advisory Agreement, the “Agreements”) between the Adviser and the investmentsub-advisers (each a “Sub-Adviser,” and collectively, the “Sub-Advisers”) for the series of the Trusts (each a “Portfolio,” and collectively, the “Portfolios”).
In making those approvals, the Board reviewed a variety of materials that were provided for the specific purpose of the annual contract renewal process. In addition, various materials provided to and discussed with the Board throughout the year informed the Board’s decision to renew the Agreements. In particular, the information for each Portfolio included, but was not limited to, investment performance reports, and reports on expenses, legal and compliance matters, asset pricing, brokerage commissions and trade execution.
The Board met in person with personnel of the Adviser on October 17, 2018 for the specific purpose of giving preliminary consideration to the proposed continuation of the Agreements (the “October Meeting”). At that meeting, the Adviser reviewed with the Board the performance and fees experienced by each Portfolio, as well as other information. During and after the October Meeting, the Independent Trustees communicatedfollow-up matters for management to address at the November Meeting. The Independent Trustees were advised by independent legal counsel throughout the contract renewal process, and met with independent legal counsel in several executive sessions outside of the presence of management.
Information furnished and reviewed specifically in connection with the renewal process included, but was not limited to, a report for each Portfolio that was prepared by Broadridge (“Broadridge”), an independent organization. In addition, the Independent Trustees reviewed a report that was prepared by JDL Consultants, LLC (“JDL”), an independent consultant to the Independent Trustees (“JDL Report”), which examined the comparative fees, expenses and performance of each Portfolio, based upon the Broadridge reports. Also, the Board reviewed the responses to wide-ranging questions from the Independent Trustees relating to the business, operations and performance of the Adviser and theSub-Advisers that the Adviser andSub-Advisers had prepared specifically for the renewal process, and reviewed aPortfolio-by-Portfolio analysis of the profitability to the Adviser of each Advisory Agreement, which was prepared by the Adviser for the renewal process.
At the November Meeting, the Board, including a majority of the Independent Trustees, concluded that the nature, extent and quality of services provided by the Adviser and eachSub-Adviser supported the renewal of the Agreements. The Board also concluded that the investment performance of each Portfolio was such that each Agreement should continue, and that the fees paid by each Portfolio to the Adviser appeared to be reasonable in light of the nature, extent and quality of the services provided by the Adviser andSub-Adviser. Further, the Board concluded that the Adviser’s profitability in providing services under the Advisory Agreements did not appear unreasonable in light of the nature, extent and quality of the services provided by the Adviser. Finally, the Board reviewed the extent to which the investment advisory fees paid by the Portfolios shared economies of scale with investors or entailed the potential to share economies of scale with investors and concluded that those considerations generally supported the renewal of each Agreement. In approving the renewal of each of the Agreements, the Board, including the Independent Trustees, gave attention to all of the information that was furnished and each Trustee placed varying degrees of importance on the various pieces of information that were provided to them. The Board evaluated the information available to it on aPortfolio-by-Portfolio basis, and its decision was made separately with respect to each Portfolio. The following paragraphs provide more information about some of the primary factors that were relevant to the Board’s decision. The Board did not identify any single factor as determinative, and the Trustees generally attributed different weights to various factors for the various Portfolios.
Nature, extent and quality of services. The Board evaluated the nature, extent and quality of the services that the Adviser and theSub-Advisers, as relevant, have provided to the Portfolios. The Board considered the Adviser’s services as investment manager to the Portfolios, including its services relating to the hiring and oversight of theSub-Advisers, trading practices and oversight of transition management (as applicable), compliance programs and personnel, and risk management, among other things. The Adviser’s services in coordinating and overseeing the activities of the Trusts’ other service providers were also considered. The Board considered information received from the Trusts’ Chief Compliance Officer (“CCO”) regarding the Portfolios’ compliance policies and procedures that were established pursuant to Rule38a-l under the 1940 Act. The Board also noted that the Adviser’s investment, compliance and legal staff conduct regular and periodic telephonic andin-person meetings with theSub-Advisers to review and assess the services that are provided to the Portfolios, and that personnel of the Adviser prepare and present reports to the Independent Trustees regarding those meetings. In addition, throughout the year, the Board considered the expertise, experience and performance of the personnel of the Adviser who performed the various services that are mentioned above.
BHFTII-35
Brighthouse Funds Trust II
MFS Total Return Portfolio
Board of Trustees’ Consideration of Advisory and Sub-Advisory Agreements—(Continued)
With respect to the services provided by each of theSub-Advisers, the Board considered a variety of information that the Adviser and eachSub-Adviser prepared for the Board’s review. The Board considered eachSub-Adviser’s investment process and philosophy, and the investment performance experienced by the Portfolio (as described in more detail below). The Board took into account that eachSub-Adviser’s responsibilities include the development and maintenance of an investment program for the applicable Portfolio that is consistent with the Portfolio’s investment objectives, the selection of investment securities and the placement of orders for the purchase and sale of such securities, as well as the implementation of compliance controls related to performance of these services. In particular, the Board considered, among other things, theSub-Adviser’s current level of staffing as well as its compensation program and its overall resources. The Board reviewed eachSub-Adviser’s history and investment experience, as well as information provided regarding the qualifications, background and responsibilities of theSub-Adviser’s investment and compliance personnel who provide services to the Portfolios. The Board also considered, among other things, eachSub-Adviser’s compliance program and regulatory and disciplinary history. In its review, the Board also took into account information regarding any services and/or payments provided to the Adviser by theSub-Advisers in connection with marketing activities and considered representations from the Adviser that those payments were not considered in the Adviser’s recommendation to renew any of theSub-Advisory Agreements.
Performance. The Board placed emphasis on the performance of each Portfolio in light of, among other things, its importance to investors. The Board considered the Adviser’s quarterly reviews with the Board of detailed information about each Portfolio’s investment strategies and performance results and composition, including discussions regarding the relevant effect of current market conditions. The Board reviewed and considered the reports prepared by Broadridge, which provided a statistical analysis comparing the Portfolios’ investment performance to that of comparable funds underlying variable insurance products (the “Performance Universe”). The Independent Trustees also met separately with representatives of JDL during the October Meeting to review the JDL Report. The Board also compared the performance records of the Portfolios to those of comparable funds and other accounts that were managed by the relevantSub-Adviser, to the extent such information was available. The Board considered each Portfolio’s performance for periods subsequent to the performance period covered by the Broadridge reports, and the Adviser’s discussion of the same, including the effect of current market conditions on each Portfolio’s more recent performance. The Board also noted that while it found the data provided by Broadridge generally useful, it recognized the limitations of such data, including, in particular, that notable differences may exist between a Portfolio and those of the other funds in a Broadridge category (for example, the investment objectives(s) and investment strategies) and that the results of the performance comparisons may vary depending on (i) the end dates for the performance periods that were selected and (ii) the selection of the peer groups.
The Board focused particular attention on Portfolios with less favorable performance records. The Board noted the Adviser’s focus on eachSub-Adviser’s performance and that the Adviser has been active in monitoring and responding to any performance issues with respect to the Portfolios.
Fees and Expenses. The Board gave consideration to the level and method of computing the fees payable under the Agreements. The Board considered the Broadridge report for each of the Portfolios, which included comparisons for each Portfolio of its contractual management andsub-adviser fees (at current and various asset levels), and total expenses, with those of its peers, including as those peers were divided into a broad group of peer funds (“Expense Universe”), a narrower group of peer funds (“Expense Group”), a broad group of peersub-advised funds (“Sub-advised Expense Universe”), and a narrower group of peersub-advised funds (“Sub-advised Expense Group”). Broadridge selected the peer funds which were similarly situated funds underlying variable insurance products deemed to be comparable to the Portfolios. The Independent Trustees, with the assistance of JDL, also examined the JDL Report. The Board compared the fee payable to aSub-Adviser by the Adviser with respect to the Portfolio to the fee payable to theSub-Adviser by other comparable funds and other accounts, to the extent such information was available.
The Board noted that thesub-advisory fees for the Portfolios are paid by the Adviser out of the advisory fees, and that the Adviser negotiates the fees at arm’s length. The Board also considered that the Adviser had entered into expense limitation or management fee waiver agreements with certain of the Portfolios pursuant to which the Adviser had agreed to waive a portion of its advisory fee and/or reimburse certain expenses as a means of limiting a Portfolio’s total annual operating expenses.
Profitability. The Board examined the profitability to the Adviser of each Advisory Agreement, on aPortfolio-by-Portfolio basis. The Board also considered that an affiliate of the Adviser, Brighthouse Securities, LLC, serves as distributor for the Trusts, and, as such, receives Rule12b-1 payments to support the distribution of the Portfolios. The Board considered the profitability to theSub-Advisers and their affiliates as a result of their relationships with the Portfolios, to the extent available, and the Board considered the ability of the Adviser to negotiate with aSub-Adviser at arm’s length. In reviewing the profitability analyses, the Board recognized that expense allocation methodologies are inherently subjective and various expense allocation methodologies may be reasonable while producing different results.
BHFTII-36
Brighthouse Funds Trust II
MFS Total Return Portfolio
Board of Trustees’ Consideration of Advisory and Sub-Advisory Agreements—(Continued)
Economies of scale. The Board also considered each Portfolio’s fees in light of its size. The Board noted the fee schedules for the Portfolios that contain breakpoints that reduce the fee rate above specified asset levels. The Board noted those Portfolios that did not have breakpoints in their advisory fee and took into account management’s discussion of the same. The Board noted that those Portfolios with Advisory Agreements containing breakpoints generally have breakpoints in the correspondingSub-Advisory Agreement. The Board considered the effective fees under the Advisory Agreement andSub-Advisory Agreement for each Portfolio as a percentage of assets at different asset levels and possible economies of scale that may be realized if the assets of the Portfolio grow. The Board examined, among other data, the effect of a Portfolio’s growth in size, and reduction in size, on various fee schedules and the Board reviewed the Broadridge and JDL Reports, which compared fees among peers. The Board also generally noted that if a Portfolio’s assets increase over time, the Portfolio may realize other economies of scale if assets increase proportionally more than certain other fixed expenses.
Other factors. The Board considered other benefits that may be realized by the Adviser and its affiliates from their relationship with the Trusts. Among them, the Board recognized that Brighthouse Securities, LLC, as the distributor for the Trusts, receives payments pursuant to Rule12b-1 from the Portfolios to compensate for the provision of shareholder services and distribution activities, which could lead to growth in the Trusts’ assets and corresponding benefits from such growth, including economies of scale. The Board considered other benefits that may be realized by eachSub-Adviser and its affiliates from their relationship with the Trusts, including the opportunity to provide advisory services to additional portfolios of the Trusts and reputational benefits. In conjunction with these considerations, the Board noted the ongoing commitment of the Adviser to the Portfolios.
The Board requested, received, and considered information from the Adviser regarding possible conflicts of interest in the form of material benefits to the Adviser resulting from the Adviser’s affiliations and business relationships, as relevant. The Board considered the services that are provided to the Trusts by its service providers, and the manner in which any conflicts were mitigated.
* * *
MFS Total Return Portfolio. The Board also considered the following information in relation to the Agreements with the Adviser and Massachusetts Financial Services Company regarding the Portfolio:
Among other data relating specifically to the Portfolio’s performance, the Board considered that the Portfolio outperformed the median of its Performance Universe for the three-year and five-year periods ended June 30, 2018, but underperformed the median of its Performance Universe for theone-year period ended June 30, 2018. The Board also considered that the Portfolio outperformed the average of its Morningstar Category for the five-year period ended June 30, 2018, but underperformed the average of its Morningstar Category for theone-year and three-year periods ended June 30, 2018. The Board further considered that the Portfolio underperformed its blended benchmark, the S&P 500 Index (60%) and Bloomberg Barclays U.S. Aggregate Bond Index (40%), for theone-, three- and five-year periods ended September 30, 2018. The Board took into account management’s discussion of the Portfolio’s performance, including prevailing market conditions.
The Board also considered that the Portfolio’s actual management fees were equal to the Expense Group median, and below the Expense Universe median and theSub-advised Expense Universe median. The Board further noted that the Portfolio’s total expenses (exclusive of12b-l fees) were below the Expense Group median, Expense Universe median, andSub-advised Expense Universe median. The Board further noted that the Portfolio’s contractual management fees were below the asset-weighted average of comparable funds selected by Broadridge at the Portfolio’s current size. The Board also took into account that the Portfolio’s contractualsub-advisory fees were equal to the average of theSub-advised Expense Group and above the average of theSub-advised Expense Universe at the Portfolio’s current size.
BHFTII-37
Brighthouse Funds Trust II
MFS Value Portfolio
Managed by Massachusetts Financial Services Company
Portfolio Manager Commentary*
PERFORMANCE
For the 12 months ended December 31, 2018, the Class A, B, D, and E shares of the MFS Value Portfolio returned-10.05%,-10.24%,-10.06%, and-10.20%, respectively. The Portfolio’s benchmark, the Russell 1000 Value Index1, returned-8.27%.
MARKET ENVIRONMENT/CONDITIONS
During the reporting period, the U.S. Federal Reserve raised interest rates by 100 basis points, bringing the total number of rate hikes to nine since the central bank began to normalize monetary policy in late 2015. Economic growth rates in the U.S., Eurozone, and Japan remained above trend, despite a slowing in global growth, particularly toward the end of the period. Inflation remained contained, particularly outside the U.S. Late in the period, the European Central Bank halted its asset purchase program but issued forward guidance that it does not expect to raise interest rates at least until after the summer of 2019. The Bank of England (once) and the Bank of Canada (three times) each raised rates during the period. The European political backdrop became a bit more volatile, late in the period, spurred by concerns over cohesion in the eurozone after the election of an anti-establishment, Eurosceptic coalition government in Italy and widespread protests over stagnant wage growth in France.
Bond yields rose in the U.S. during most of the period but remained low by historical standards and slipped from their highs, late in the period, as market volatility increased. Yields in many developed markets fell. Outside of emerging markets, where spreads and currencies came under pressure, credit spreads remained quite tight until the end of the period, when thinner liquidity, lower oil prices, and concerns over high degrees of corporate leverage emerged. Growing concern over increasing global trade friction appeared to have weighed on business sentiment during the period’s second half, especially outside the U.S. Tighter financial conditions from rising U.S. rates and a strong dollar, combined with trade uncertainty, helped expose structural weaknesses in several emerging markets in the second half of the period.
Volatility increased at the end of the period, amid signs of slowing global economic growth and increasing trade tensions, which prompted a market setback shortly after U.S. markets set record highs in September. It was the second such equity market decline during the reporting period. The correction came despite a third consecutive quarter of strong growth in U.S. earnings per share. Strong earnings growth, combined with the market decline, brought U.S. equity valuations down from elevated levels, earlier in the period, to multiples more in line with long-term averages. While the U.S. economy held up better than most, global economic growth became less synchronized during the period, with Europe and China showing signs of a slowdown and some emerging markets coming under stress.
PORTFOLIOREVIEW/PERIOD-END POSITIONING
The Portfolio posted negative results and underperformed its benchmark, the Russell 1000 Value Index. Overall, a combination of sector allocation and stock selection led to the underperformance.
In the Consumer Staples sector, overweight positions in tobacco company Philip Morris International and global food company General Mills held back relative returns. An overweight position and stock selection in the Financialssector further hurt relative results. Within this sector, overweight positions in financial services firm Goldman Sachs Group and not owning shares of insurance and investment firm Berkshire Hathaway hindered relative performance. An underweight position in the Utilitiessector also weakened relative returns. However, there were no individual stocks within this sector that were among the Portfolio’s largest relative detractors during the period.
Stock selection in the Information Technology (“IT”) sector further hampered relative performance. Within this sector, not owning shares of network equipment company Cisco Systems and semiconductor company Intel weighed on relative results.
Stocks in other sectors that held back relative performance included an overweight position in oil field services company Schlumberger, an underweight position in telecommunications services provider Verizon Communications and holdings of global security company Northrop Grumman. Additionally, not owning shares of global media company 21st Century Fox hindered relative returns.
A combination of stock selection and an overweight position in the Health Caresector boosted relative performance. Within this sector, overweight positions in medical device maker Medtronic, life sciences supply company Thermo Fisher Scientific, pharmaceutical giant Pfizer, healthcare equipment manufacturer Danaher, and pharmaceutical and medical products maker Abbott Laboratories aided relative returns.
Stock selection in the Materials sector also helped relative returns. However, there were no individual stocks within this sector that were among the Portfolio’s largest relative contributors during the period.
Elsewhere, not owning shares of diversified industrial conglomerate General Electric and telecommunication services provider AT&T, and the Portfolio’s holdings of risk management and human capital consulting services provider Aon, bolstered relative performance. Additionally, overweight positions in power & natural gas distributor Duke Energy and global provider of banking and payment technologies Fidelity National Information Services also supported relative results.
BHFTII-1
Brighthouse Funds Trust II
MFS Value Portfolio
Managed by Massachusetts Financial Services Company
Portfolio Manager Commentary*—(Continued)
For the12-month period ended December 31, 2018, the significant changes to the Portfolio included our increased exposure to the Health Care, Utilities, and Industrials sectors with commensurate decreased exposure within Financials, Consumer Discretionary, and Consumer Staples. At the end of the period, the Portfolio’s top overweights were to Industrials, Financials, and Consumer Staples, while being most underweight Energy, Real Estate, and Consumer Discretionary. Relative sector positioning reflects the investment team’sbottom-up stock selection process rather than a reflection of anytop-down macroeconomic view.
Steven R. Gorham
Nevin P. Chitkara
Portfolio Managers
Massachusetts Financial Services Company
* This commentary may include statements that constitute “forward-looking statements” under the U.S. securities laws. Forward-looking statements include, among other things, projections, estimates, and information about possible or future results related to the Portfolio, market or regulatory developments. The views expressed above are not guarantees of future performance or economic results and involve certain risks, uncertainties and assumptions that could cause actual outcomes and results to differ materially from the views expressed herein. The views expressed above are subject to change at any time based upon economic, market, or other conditions and the subadvisory firm undertakes no obligation to update the views expressed herein. Any discussions of specific securities should not be considered a recommendation to buy or sell those securities. The views expressed above (including any forward-looking statement) may not be relied upon as investment advice or as an indication of the Portfolio’s trading intent. Information about the Portfolio’s holdings, asset allocation or country diversification is historical and is not an indication of future Portfolio composition, which may vary. Direct investment in any index is not possible. The performance of any index mentioned in this commentary has not been adjusted for ongoing management, distribution and operating expenses, and sales charges applicable to mutual fund investments. In addition, the returns do not reflect additional fees charged by separate accounts or variable insurance contracts that an investor in the Portfolio may pay. If these additional fees were reflected, performance would have been lower.
BHFTII-2
Brighthouse Funds Trust II
MFS Value Portfolio
A $10,000 INVESTMENT COMPARED TO THE RUSSELL 1000 VALUE INDEX
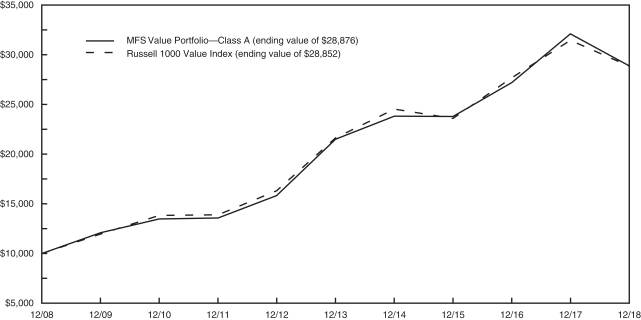
AVERAGE ANNUAL RETURNS (%) (FOR THE YEAR ENDED DECEMBER 31, 2018)
| | | | | | | | | | | | | | | | |
| | | | | |
| | | 1 Year | | | 5 Year | | | 10 Year | | | Since Inception2 | |
| MFS Value Portfolio | | | | | | | | | | | | | | | | |
Class A | | | -10.05 | | | | 6.08 | | | | 11.19 | | | | — | |
Class B | | | -10.24 | | | | 5.81 | | | | 10.92 | | | | — | |
Class D | | | -10.06 | | | | 5.98 | | | | — | | | | 8.51 | |
Class E | | | -10.20 | | | | 5.91 | | | | 11.03 | | | | — | |
| Russell 1000 Value Index | | | -8.27 | | | | 5.95 | | | | 11.18 | | | | — | |
1 The Russell 1000 Value Index is an unmanaged measure of the largest capitalized U.S. domiciled companies with a less than average growth orientation. Companies in this Index generally have a low price-to-book and price-to-earnings ratio, higher dividend yields and lower forecasted growth values.
2 Inception dates of the Class A, Class B, Class D and Class E shares are 7/20/98, 4/28/08, 4/26/13 and 4/28/08, respectively.
Portfolio performance is calculated including reinvestment of all income and capital gain distributions. Performance numbers are net of all Portfolio expenses but do not include any insurance, sales, separate account or administrative charges of variable annuity or life insurance contracts or any additional expenses that participants may bear relating to the operations of their plans. If these charges were included, the returns would be lower. The performance of any index referenced above has not been adjusted for ongoing management, distribution and operating expenses, and sales charges applicable to mutual fund investments. Direct investment in any index is not possible. The performance of Class A shares, as set forth in the line graph above, will differ from that of other classes because of the difference in expenses paid by policyholders investing in the different share classes.
This information represents past performance and is not indicative of future results. Investment return and principal value may fluctuate so that shares, upon redemption, may be worth more or less than the original cost.
PORTFOLIO COMPOSITION AS OF DECEMBER 31, 2018
Top Holdings
| | | | |
| | | % of
Net Assets | |
| JPMorgan Chase & Co. | | | 4.6 | |
| Johnson & Johnson | | | 3.8 | |
| Wells Fargo & Co. | | | 3.0 | |
| Accenture plc- Class A | | | 2.9 | |
| Medtronic plc | | | 2.9 | |
| Pfizer, Inc. | | | 2.8 | |
| Comcast Corp. - Class A | | | 2.6 | |
| Travelers Cos., Inc. (The) | | | 2.4 | |
| Philip Morris International, Inc. | | | 2.3 | |
| Chubb, Ltd. | | | 2.3 | |
Top Sectors
| | | | |
| | | % of
Net Assets | |
| Financials | | | 28.4 | |
| Health Care | | | 17.7 | |
| Industrials | | | 15.6 | |
| Consumer Staples | | | 10.1 | |
| Information Technology | | | 8.5 | |
| Communication Services | | | 5.3 | |
| Energy | | | 4.4 | |
| Utilities | | | 3.5 | |
| Materials | | | 3.4 | |
| Consumer Discretionary | | | 1.4 | |
BHFTII-3
Brighthouse Funds Trust II
MFS Value Portfolio
Understanding Your Portfolio’s Expenses
Shareholder Expense Example
As a shareholder of the Portfolio, you incur ongoing costs, including management fees; distribution and service(12b-1) fees; and other Portfolio expenses. This example is intended to help you understand your ongoing costs (in dollars) (referred to as “expenses”) of investing in the Portfolio and compare these costs with the ongoing costs of investing in other mutual funds. The example is based on an investment of $1,000 invested at the beginning of the period and held for the entire period, July 1, 2018 through December 31, 2018.
Actual Expenses
The first line for each share class of the Portfolio in the table below provides information about actual account values and actual expenses. You may use the information in this line, together with the amount you invested in the particular share class of the Portfolio, to estimate the expenses that you paid over the period. Simply divide your account value by $1,000 (for example, an $8,600 account value divided by $1,000 = 8.6), then multiply the result by the number in the first line under the heading entitled “Expenses Paid During Period” to estimate the expenses you paid on your account during this period.
Hypothetical Example for Comparison Purposes
The second line for each share class of the Portfolio in the table below provides information about hypothetical account values and hypothetical expenses based on the Portfolio’s actual expense ratio and an assumed rate of return of 5% per year before expenses, which is not the Portfolio’s actual return. The hypothetical account values and expenses may not be used to estimate the actual ending account balance or expenses you paid for the period. You may use this information to compare the ongoing costs of investing in the Portfolio and other funds. To do so, compare this 5% hypothetical example with the 5% hypothetical examples that appear in the shareholder reports of the other funds.
Please note that the expenses shown in the table are meant to highlight your ongoing costs only and do not reflect any fees or charges of your variable insurance product or any additional expenses that participants in certain eligible qualified plans may bear relating to the operations of their plan. Therefore, the second line for each share class in the table is useful in comparing ongoing costs only, and will not help you determine the relative total costs of owning different funds. In addition, if these other costs were included, your costs would have been higher.
| | | | | | | | | | | | | | | | | | |
MFS Value Portfolio | | | | Annualized
Expense
Ratio | | | Beginning
Account Value
July 1,
2018 | | | Ending
Account Value
December 31,
2018 | | | Expenses Paid
During Period**
July 1, 2018
to
December 31,
2018 | |
Class A (a) | | Actual | | | 0.57 | % | | $ | 1,000.00 | | | $ | 934.40 | | | $ | 2.78 | |
| | Hypothetical* | | | 0.57 | % | | $ | 1,000.00 | | | $ | 1,022.33 | | | $ | 2.91 | |
| | | | | |
Class B (a) | | Actual | | | 0.82 | % | | $ | 1,000.00 | | | $ | 932.90 | | | $ | 4.00 | |
| | Hypothetical* | | | 0.82 | % | | $ | 1,000.00 | | | $ | 1,021.07 | | | $ | 4.18 | |
| | | | | |
Class D (a) | | Actual | | | 0.67 | % | | $ | 1,000.00 | | | $ | 934.10 | | | $ | 3.27 | |
| | Hypothetical* | | | 0.67 | % | | $ | 1,000.00 | | | $ | 1,021.83 | | | $ | 3.41 | |
| | | | | |
Class E (a) | | Actual | | | 0.73 | % | | $ | 1,000.00 | | | $ | 933.30 | | | $ | 3.56 | |
| | Hypothetical* | | | 0.73 | % | | $ | 1,000.00 | | | $ | 1,021.53 | | | $ | 3.72 | |
| * | Hypothetical assumes a rate of return of 5% per year before expenses. |
| ** | Expenses paid are equal to the Portfolio’s annualized expense ratio for the most recent six month period, as shown above, multiplied by the average account value over the period, multiplied by the number of days (184 days) in the most recent fiscal half-year, divided by 365 (to reflect theone-half year period). |
| (a) | The annualized expense ratio shown reflects the impact of the management fee waiver as described in Note 5 of the Notes to Financial Statements. |
BHFTII-4
Brighthouse Funds Trust II
MFS Value Portfolio
Schedule of Investments as of December 31, 2018
Common Stocks—98.7% of Net Assets
| | | | | | | | |
| Security Description | | Shares | | | Value | |
|
| Aerospace & Defense—3.4% | |
Lockheed Martin Corp. | | | 71,191 | | | $ | 18,640,651 | |
Northrop Grumman Corp. | | | 213,062 | | | | 52,178,884 | |
United Technologies Corp. | | | 324,743 | | | | 34,578,635 | |
| | | | | | | | |
| | | | | | | 105,398,170 | |
| | | | | | | | |
|
| Air Freight & Logistics—0.6% | |
United Parcel Service, Inc. - Class B (a) | | | 178,400 | | | | 17,399,352 | |
| | | | | | | | |
|
| Auto Components—0.9% | |
Aptiv plc | | | 373,391 | | | | 22,989,684 | |
Lear Corp. | | | 51,553 | | | | 6,333,801 | |
| | | | | | | | |
| | | | | | | 29,323,485 | |
| | | | | | | | |
|
| Automobiles—0.1% | |
Harley-Davidson, Inc. | | | 111,440 | | | | 3,802,333 | |
| | | | | | | | |
|
| Banks—13.1% | |
Citigroup, Inc. | | | 1,121,559 | | | | 58,388,361 | |
JPMorgan Chase & Co. | | | 1,462,202 | | | | 142,740,159 | |
PNC Financial Services Group, Inc. (The) | | | 401,324 | | | | 46,918,789 | |
U.S. Bancorp | | | 1,462,518 | | | | 66,837,073 | |
Wells Fargo & Co. | | | 2,030,199 | | | | 93,551,570 | |
| | | | | | | | |
| | | | | | | 408,435,952 | |
| | | | | | | | |
|
| Beverages—1.9% | |
Diageo plc | | | 1,159,192 | | | | 41,201,761 | |
PepsiCo, Inc. | | | 153,960 | | | | 17,009,501 | |
| | | | | | | | |
| | | | | | | 58,211,262 | |
| | | | | | | | |
|
| Building Products—1.6% | |
Johnson Controls International plc | | | 1,676,691 | | | | 49,713,888 | |
| | | | | | | | |
|
| Capital Markets—7.0% | |
Bank of New York Mellon Corp. (The) (a) | | | 781,823 | | | | 36,800,409 | |
BlackRock, Inc. | | | 76,522 | | | | 30,059,372 | |
Goldman Sachs Group, Inc. (The) | | | 309,161 | | | | 51,645,345 | |
Moody’s Corp. (a) | | | 153,524 | | | | 21,499,501 | |
Nasdaq, Inc. | | | 435,323 | | | | 35,509,297 | |
State Street Corp. | | | 417,308 | | | | 26,319,616 | |
T. Rowe Price Group, Inc. (a) | | | 160,523 | | | | 14,819,483 | |
| | | | | | | | |
| | | | | | | 216,653,023 | |
| | | | | | | | |
|
| Chemicals—3.2% | |
DowDuPont, Inc. | | | 205,788 | | | | 11,005,543 | |
PPG Industries, Inc. (a) | | | 580,314 | | | | 59,325,500 | |
Sherwin-Williams Co. (The) | | | 75,100 | | | | 29,548,846 | |
| | | | | | | | |
| | | | | | | 99,879,889 | |
| | | | | | | | |
|
| Consumer Finance—0.9% | |
American Express Co. | | | 308,924 | | | | 29,446,636 | |
| | | | | | | | |
|
| Containers & Packaging—0.2% | |
Crown Holdings, Inc. (a) (b) | | | 150,511 | | | | 6,256,742 | |
| | | | | | | | |
|
| Diversified Telecommunication Services—0.7% | |
Verizon Communications, Inc. | | | 379,757 | | | | 21,349,939 | |
| | | | | | | | |
|
| Electric Utilities—3.5% | |
Duke Energy Corp. (a) | | | 706,371 | | | | 60,959,817 | |
Southern Co. (The) (a) | | | 783,615 | | | | 34,416,371 | |
Xcel Energy, Inc. (a) | | | 300,418 | | | | 14,801,595 | |
| | | | | | | | |
| | | | | | | 110,177,783 | |
| | | | | | | | |
|
| Electrical Equipment—1.0% | |
Eaton Corp. plc | | | 434,043 | | | | 29,801,392 | |
| | | | | | | | |
|
| Energy Equipment & Services—1.1% | |
Schlumberger, Ltd. | | | 966,626 | | | | 34,875,866 | |
| | | | | | | | |
|
| Equity Real Estate Investment Trusts—0.4% | |
Public Storage (a) | | | 61,953 | | | | 12,539,907 | |
| | | | | | | | |
|
| Food Products—3.9% | |
Archer-Daniels-Midland Co. | | | 389,379 | | | | 15,952,858 | |
Danone S.A. | | | 210,270 | | | | 14,819,710 | |
General Mills, Inc. (a) | | | 716,359 | | | | 27,895,020 | |
J.M. Smucker Co. (The) (a) | | | 126,627 | | | | 11,838,358 | |
Nestle S.A. | | | 611,060 | | | | 49,679,695 | |
| | | | | | | | |
| | | | | | | 120,185,641 | |
| | | | | | | | |
|
| Health Care Equipment & Supplies—5.8% | |
Abbott Laboratories (a) | | | 593,331 | | | | 42,915,631 | |
Danaher Corp. | | | 469,222 | | | | 48,386,173 | |
Medtronic plc | | | 980,138 | | | | 89,153,352 | |
| | | | | | | | |
| | | | | | | 180,455,156 | |
| | | | | | | | |
|
| Health Care Providers & Services—2.3% | |
Cigna Corp. | | | 265,281 | | | | 50,382,086 | |
McKesson Corp. | | | 189,980 | | | | 20,987,091 | |
| | | | | | | | |
| | | | | | | 71,369,177 | |
| | | | | | | | |
|
| Household Products—1.4% | |
Colgate-Palmolive Co. | | | 106,338 | | | | 6,329,238 | |
Kimberly-Clark Corp. | | | 96,822 | | | | 11,031,898 | |
Procter & Gamble Co. (The) | | | 98,078 | | | | 9,015,330 | |
Reckitt Benckiser Group plc | | | 206,782 | | | | 15,791,115 | |
| | | | | | | | |
| | | | | | | 42,167,581 | |
| | | | | | | | |
|
| Industrial Conglomerates—3.1% | |
3M Co. (a) | | | 200,157 | | | | 38,137,915 | |
Honeywell International, Inc. | | | 447,179 | | | | 59,081,289 | |
| | | | | | | | |
| | | | | | | 97,219,204 | |
| | | | | | | | |
|
| Insurance—7.3% | |
Aon plc | | | 448,316 | | | | 65,167,214 | |
Chubb, Ltd. | | | 544,977 | | | | 70,400,129 | |
Prudential Financial, Inc. | | | 210,753 | | | | 17,186,907 | |
Travelers Cos., Inc. (The) | | | 633,310 | | | | 75,838,872 | |
| | | | | | | | |
| | | | | | | 228,593,122 | |
| | | | | | | | |
See accompanying notes to financial statements.
BHFTII-5
Brighthouse Funds Trust II
MFS Value Portfolio
Schedule of Investments as of December 31, 2018
Common Stocks—(Continued)
| | | | | | | | |
| Security Description | |
Shares | | | Value | |
|
| IT Services—6.3% | |
Accenture plc - Class A | | | 636,997 | | | $ | 89,822,947 | |
Amdocs, Ltd. | | | 128,653 | | | | 7,536,493 | |
Cognizant Technology Solutions Corp. - Class A | | | 246,170 | | | | 15,626,872 | |
DXC Technology Co. | | | 219,250 | | | | 11,657,522 | |
Fidelity National Information Services, Inc. | | | 380,332 | | | | 39,003,047 | |
Fiserv, Inc. (b) | | | 452,911 | | | | 33,284,429 | |
| | | | | | | | |
| | | | | | | 196,931,310 | |
| | | | | | | | |
|
| Life Sciences Tools & Services—1.3% | |
Thermo Fisher Scientific, Inc. | | | 173,944 | | | | 38,926,928 | |
| | | | | | | | |
|
| Machinery—3.2% | |
Illinois Tool Works, Inc. (a) | | | 346,345 | | | | 43,878,448 | |
Ingersoll-Rand plc | | | 313,637 | | | | 28,613,103 | |
Stanley Black & Decker, Inc. | | | 237,640 | | | | 28,455,014 | |
| | | | | | | | |
| | | | | | | 100,946,565 | |
| | | | | | | | |
|
| Media—4.7% | |
Comcast Corp. - Class A | | | 2,351,067 | | | | 80,053,831 | |
Interpublic Group of Cos., Inc. (The) (a) | | | 1,153,537 | | | | 23,797,468 | |
Omnicom Group, Inc. (a) | | | 566,694 | | | | 41,504,669 | |
| | | | | | | | |
| | | | | | | 145,355,968 | |
| | | | | | | | |
|
| Oil, Gas & Consumable Fuels—3.2% | |
Chevron Corp. | | | 256,912 | | | | 27,949,456 | |
EOG Resources, Inc. (a) | | | 314,447 | | | | 27,422,923 | |
Exxon Mobil Corp. | | | 372,615 | | | | 25,408,617 | |
Occidental Petroleum Corp. | | | 324,758 | | | | 19,933,646 | |
| | | | | | | | |
| | | | | | | 100,714,642 | |
| | | | | | | | |
|
| Pharmaceuticals—8.4% | |
Johnson & Johnson | | | 915,682 | | | | 118,168,762 | |
Merck & Co., Inc. | | | 491,217 | | | | 37,533,891 | |
Novartis AG | | | 94,853 | | | | 8,124,006 | |
Pfizer, Inc. | | | 1,974,009 | | | | 86,165,493 | |
Roche Holding AG | | | 40,785 | | | | 10,085,080 | |
| | | | | | | | |
| | | | | | | 260,077,232 | |
| | | | | | | | |
|
| Professional Services—0.7% | |
Equifax, Inc. | | | 237,577 | | | | 22,125,546 | |
| | | | | | | | |
|
| Road & Rail—1.8% | |
Canadian National Railway Co. (a) | | | 244,061 | | | | 18,087,361 | |
Union Pacific Corp. | | | 266,633 | | | | 36,856,679 | |
| | | | | | | | |
| | | | | | | 54,944,040 | |
| | | | | | | | |
|
| Semiconductors & Semiconductor Equipment—2.2% | |
Analog Devices, Inc. (a) | | | 206,067 | | | | 17,686,731 | |
Texas Instruments, Inc. | | | 538,629 | | | | 50,900,440 | |
| | | | | | | | |
| | | | | | | 68,587,171 | |
| | | | | | | | |
| Security Description | | Shares/
Principal
Amount* | | | Value | |
|
| Textiles, Apparel & Luxury Goods—0.3% | |
Hanesbrands, Inc. | | | 754,712 | | | | 9,456,541 | |
| | | | | | | | |
|
| Tobacco—3.0% | |
Altria Group, Inc. (a) | | | 432,952 | | | | 21,383,499 | |
Philip Morris International, Inc. | | | 1,089,172 | | | | 72,713,123 | |
| | | | | | | | |
| | | | | | | 94,096,622 | |
| | | | | | | | |
|
| Trading Companies & Distributors—0.2% | |
HD Supply Holdings, Inc. (b) | | | 174,213 | | | | 6,536,472 | |
| | | | | | | | |
Total Common Stocks
(Cost $2,613,575,750) | | | | | | | 3,071,954,537 | |
| | | | | | | | |
|
| Short-Term Investment—1.1% | |
|
| Repurchase Agreement—1.1% | |
Fixed Income Clearing Corp.
Repurchase Agreement dated 12/31/18 at 1.200%, due on 01/02/19 with a maturity value of $34,273,652; collateralized by U.S. Treasury Note at 2.250%, maturing 12/31/23, with a market value of $34,958,543. | | | 34,271,367 | | | | 34,271,367 | |
| | | | | | | | |
Total Short-Term Investments
(Cost $34,271,367) | | | | | | | 34,271,367 | |
| | | | | | | | |
|
| Securities Lending Reinvestments (c)—10.2% | |
|
| Certificates of Deposit—6.1% | |
Banco Del Estado De Chile New York
2.720%, 1M LIBOR + 0.250%, 03/20/19 (d) | | | 5,000,000 | | | | 4,999,570 | |
2.820%, 1M LIBOR + 0.350%, 05/20/19 (d) | | | 5,000,000 | | | | 4,999,895 | |
Bank of Montreal (Chicago)
2.710%, 1M LIBOR + 0.330%, 08/06/19 (d) | | | 10,000,000 | | | | 9,999,750 | |
Bank of Nova Scotia
2.890%, SOFR + 0.430%, 05/16/19 (d) | | | 2,000,000 | | | | 1,999,999 | |
3.072%, 3M LIBOR + 0.280%, 03/20/19 (d) | | | 7,000,000 | | | | 7,002,793 | |
Barclays Bank plc
2.547%, 1M LIBOR + 0.200%, 02/04/19 (d) | | | 3,500,000 | | | | 3,499,667 | |
Canadian Imperial Bank of Commerce
2.740%, 1M LIBOR + 0.270%, 07/19/19 (d) | | | 3,000,000 | | | | 2,998,782 | |
China Construction Bank Corp.
2.550%, 01/07/19 | | | 4,000,000 | | | | 4,000,000 | |
Citibank N.A.
2.490%, 02/04/19 | | | 6,000,000 | | | | 5,999,166 | |
Commonwealth Bank of Australia
2.617%, 3M LIBOR + 0.140%, 04/23/19 (d) | | | 2,500,000 | | | | 2,500,007 | |
2.642%, 1M LIBOR + 0.210%, 09/13/19 (d) | | | 5,000,000 | | | | 5,000,000 | |
Cooperative Rabobank UA
2.608%, 3M LIBOR + 0.200%, 04/05/19 (d) | | | 4,000,000 | | | | 4,001,256 | |
Credit Agricole S.A.
2.500%, 02/12/19 | | | 10,000,000 | | | | 9,998,300 | |
2.799%, 1M LIBOR + 0.320%, 05/21/19 (d) | | | 4,000,000 | | | | 4,000,252 | |
Credit Suisse AG
2.620%, 04/01/19 | | | 5,000,000 | | | | 4,997,410 | |
2.890%, SOFR + 0.430%, 05/02/19 (d) | | | 5,000,000 | | | | 4,999,940 | |
See accompanying notes to financial statements.
BHFTII-6
Brighthouse Funds Trust II
MFS Value Portfolio
Schedule of Investments as of December 31, 2018
Securities Lending Reinvestments (c)—(Continued)
| | | | | | | | |
| Security Description | | Principal
Amount* | | | Value | |
|
| Certificates of Deposit—(Continued) | |
Industrial & Commercial Bank of China, Ltd.
2.850%, 02/15/19 | | | 7,000,000 | | | $ | 6,999,482 | |
Mitsubishi UFJ Trust and Banking Corp.
Zero Coupon, 01/15/19 | | | 3,969,950 | | | | 3,995,920 | |
MUFG Bank Ltd.
2.649%, 1M LIBOR + 0.300%, 05/01/19 (d) | | | 2,000,000 | | | | 2,000,012 | |
Natixis New York
2.731%, 3M LIBOR + 0.190%, 02/01/19 (d) | | | 3,000,000 | | | | 2,999,328 | |
2.810%, 1M LIBOR + 0.370%, 02/14/19 (d) | | | 4,000,000 | | | | 4,000,748 | |
Nordea Bank New York
2.608%, 3M LIBOR + 0.200%, 04/05/19 (d) | | | 4,000,000 | | | | 4,003,848 | |
Royal Bank of Canada New York
2.665%, 1M LIBOR + 0.210%, 09/17/19 (d) | | | 7,000,000 | | | | 6,992,839 | |
Skandinaviska Enskilda Banken
2.645%, 1M LIBOR + 0.190%, 04/17/19 (d) | | | 10,000,000 | | | | 9,999,180 | |
Societe Generale
2.719%, 3M LIBOR + 0.160%, 05/07/19 (d) | | | 5,000,000 | | | | 4,997,780 | |
Standard Chartered plc
2.686%, 1M LIBOR + 0.180%, 02/25/19 (d) | | | 7,000,000 | | | | 6,999,797 | |
State Street Bank and Trust
2.725%, 1M LIBOR + 0.270%, 05/15/19 (d) | | | 18,000,000 | | | | 17,999,640 | |
Sumitomo Mitsui Banking Corp.
2.590%, 1M LIBOR + 0.190%, 04/11/19 (d) | | | 8,000,000 | | | | 7,997,064 | |
2.700%, 02/25/19 | | | 5,000,000 | | | | 5,000,460 | |
Sumitomo Mitsui Banking Corp., New York
2.549%, 1M LIBOR + 0.200%, 04/03/19 (d) | | | 2,000,059 | | | | 1,999,408 | |
Sumitomo Mitsui Trust Bank, Ltd.
Zero Coupon, 02/08/19 | | | 2,974,209 | | | | 2,991,480 | |
Svenska Handelsbanken AB
2.620%, 3M LIBOR + 0.100%, 04/30/19 (d) | | | 2,000,000 | | | | 1,999,910 | |
2.799%, 1M LIBOR + 0.450%, 04/03/19 (d) | | | 5,000,000 | | | | 5,002,890 | |
2.822%, 1M LIBOR + 0.300%, 10/31/19 (d) | | | 3,500,000 | | | | 3,499,181 | |
Toronto-Dominion Bank
2.665%, 1M LIBOR + 0.210%, 09/17/19 (d) | | | 5,000,000 | | | | 4,995,240 | |
Westpac Banking Corp.
2.850%, FEDEFF PRV + 0.450%, 02/15/19 (d) | | | 4,500,000 | | | | 4,499,972 | |
| | | | | | | | |
| | | | | | | 189,970,966 | |
| | | | | | | | |
|
| Commercial Paper—1.7% | |
Alpine Securities Ltd.
2.529%, 1M LIBOR + 0.180%, 04/03/19 (d) | | | 4,000,000 | | | | 3,998,892 | |
Banco Santander S.A.
2.500%, 01/16/19 | | | 6,955,278 | | | | 6,991,572 | |
2.740%, 02/07/19 | | | 5,957,987 | | | | 5,982,528 | |
Bank of China, Ltd.
2.690%, 01/17/19 | | | 9,932,750 | | | | 9,988,260 | |
HSBC Bank plc
2.842%, 1M LIBOR + 0.320%, 07/30/19 (d) | | | 5,000,000 | | | | 5,000,000 | |
ING Funding LLC
2.707%, 1M LIBOR + 0.320%, 02/08/19 (d) | | | 10,000,000 | | | | 10,000,930 | |
UBS AG
2.779%, 1M LIBOR + 0.430%, 02/01/19 (d) | | | 12,000,000 | | | | 12,002,940 | |
| | | | | | | | |
| | | | | | | 53,965,122 | |
| | | | | | | | |
|
| Repurchase Agreements—2.2% | |
Citadel Clearing LLC
Repurchase Agreement dated 12/31/18 at 3.000%, due on 04/02/19 with a maturity value of $4,030,667; collateralized by various Common Stock with an aggregate market value of $4,400,733. | | | 4,000,000 | | | | 4,000,000 | |
Citigroup Global Markets, Inc.
Repurchase Agreement dated 12/31/18 at 2.790%, due on 02/04/19 with a maturity value of $8,021,700; collateralized by U.S. Treasury Obligations at 0.000%, maturing 02/12/19, and various Common Stock with an aggregate market value of $8,706,550. | | | 8,000,000 | | | | 8,000,000 | |
Repurchase Agreement dated 12/31/18 at 2.940%, due on 04/02/19 with a maturity value of $3,224,043; collateralized by U.S. Treasury Obligations with rates ranging from 1.125% - 2.750%, maturity dates ranging from 01/31/19 - 08/15/24, and an aggregate market value of $3,264,000. | | | 3,200,000 | | | | 3,200,000 | |
Citigroup Global Markets, Ltd.
Repurchase Agreement dated 12/31/18 at 2.490%, due on 01/02/19 with a maturity value of $1,200,166; collateralized by U.S. Treasury Obligations with rates ranging from 0.375% - 1.875%, maturity dates ranging from 12/15/20 - 01/15/27, and an aggregate market value of $1,224,001. | | | 1,200,000 | | | | 1,200,000 | |
Repurchase Agreement dated 12/31/18 at 2.490%, due on 01/02/19 with a maturity value of $1,800,249; collateralized by U.S. Treasury Obligations with rates ranging from 1.625% - 2.875%, maturity dates ranging from 06/30/20 - 11/15/46, and an aggregate market value of $1,836,000. | | | 1,800,000 | | | | 1,800,000 | |
Deutsche Bank AG, London
Repurchase Agreement dated 12/31/18 at 2.750%, due on 01/02/19 with a maturity value of $900,138; collateralized by U.S. Treasury and Foreign Obligations with rates ranging from 1.000% - 2.590%, maturity dates ranging from 03/31/19 - 12/29/26, and an aggregate market value of $918,000. | | | 900,000 | | | | 900,000 | |
Deutsche Bank Securities, Inc.
Repurchase Agreement dated 12/31/18 at 3.200%, due on 01/02/19 with a maturity value of $9,763,871; collateralized by U.S. Treasury Obligations at 0.000%, maturity dates ranging from 08/15/30 - 08/15/39, and an aggregate market value of $9,957,379. | | | 9,762,136 | | | | 9,762,136 | |
Goldman Sachs & Co.
Repurchase Agreement dated 12/31/18 at 2.900%, due on 01/02/19 with a maturity value of $1,055,745; collateralized by U.S. Treasury Obligations at 4.500%, maturing 10/20/48, and an aggregate market value of $1,076,686. | | | 1,055,575 | | | | 1,055,575 | |
Merrill Lynch, Pierce, Fenner & Smith, Inc.
Repurchase Agreement dated 12/31/18 at 2.940%, due on 04/02/19 with a maturity value of $3,627,048; collateralized by various Common Stock with an aggregate market value of $3,960,000. | | | 3,600,000 | | | | 3,600,000 | |
See accompanying notes to financial statements.
BHFTII-7
Brighthouse Funds Trust II
MFS Value Portfolio
Schedule of Investments as of December 31, 2018
Securities Lending Reinvestments (c)—(Continued)
| | | | | | | | |
| Security Description | | Principal
Amount* | | | Value | |
|
| Repurchase Agreements—(Continued) | |
Merrill Lynch, Pierce, Fenner & Smith, Inc.
Repurchase Agreement dated 12/31/18 at 2.940%, due on 04/02/19 with a maturity value of $5,037,567; collateralized by various Common Stock with an aggregate market value of $5,500,000. | | | 5,000,000 | | | $ | 5,000,000 | |
NBC Global Finance, Ltd.
Repurchase Agreement dated 12/31/18 at 2.560%, due on 01/02/19 with a maturity value of $20,002,844; collateralized by various Common Stock with an aggregate market value of $22,264,245. | | | 20,000,000 | | | | 20,000,000 | |
Repurchase Agreement dated 12/31/18 at 2.560%, due on 01/02/19 with a maturity value of $3,400,484; collateralized by various Common Stock with an aggregate market value of $3,784,922. | | | 3,400,000 | | | | 3,400,000 | |
Societe Generale
Repurchase Agreement dated 12/31/18 at 2.530%, due on 01/02/19 with a maturity value of $2,300,323; collateralized by U.S. Treasury Obligations with rates ranging from 0.750% - 8.000%, maturity dates ranging from 09/30/19 - 08/15/46, and various Common Stock with an aggregate market value of $2,519,595. | | | 2,300,000 | | | | 2,300,000 | |
Repurchase Agreement dated 12/31/18 at 2.530%, due on 01/02/19 with a maturity value of $2,544,783; collateralized by U.S. Treasury Obligations with rates ranging from 0.750% - 8.000%, maturity dates ranging from 09/30/19 - 08/15/46, and various Common Stock with an aggregate market value of $2,787,357. | | | 2,544,425 | | | | 2,544,425 | |
Repurchase Agreement dated 12/31/18 at 2.530%, due on 01/02/19 with a maturity value of $2,000,281; collateralized by U.S. Treasury Obligations with rates ranging from 0.750% - 8.000%, maturity dates ranging from 09/30/19 - 08/15/46, and various Common Stock with an aggregate market value of $2,190,952. | | | 2,000,000 | | | | 2,000,000 | |
| | | | | | | | |
| | | | | | | 68,762,136 | |
| | | | | | | | |
|
| Time Deposit—0.2% | |
Royal Bank of Canada
2.420%, 01/02/19 | | | 5,000,000 | | | | 5,000,000 | |
| | | | | | | | |
Total Securities Lending Reinvestments
(Cost $317,716,255) | | | | | | | 317,698,224 | |
| | | | | | | | |
Total Investments—110.0%
(Cost $2,965,563,372) | | | | | | | 3,423,924,128 | |
Other assets and liabilities (net)—(10.0)% | | | | | | | (312,450,170 | ) |
| | | | | | | | |
| Net Assets—100.0% | | | | | | $ | 3,111,473,958 | |
| | | | | | | | |
| |
| | | | |
| * | | Principal amount stated in U.S. dollars unless otherwise noted. |
| (a) | | All or a portion of the security was held on loan. As of December 31, 2018, the market value of securities loaned was $313,143,478 and the collateral received consisted of cash in the amount of $317,552,368. The cash collateral investments are disclosed in the Schedule of Investments and categorized as Securities Lending Reinvestments. |
| (b) | | Non-income producing security. |
| (c) | | Represents investment of cash collateral received from securities on loan as of December 31, 2018. |
| (d) | | Variable or floating rate security. The stated rate represents the rate at December 31, 2018. Maturity date shown for callable securities reflects the earliest possible call date. For securities based on a published reference index and spread, the index and spread are indicated in the description above. For certain variable rate securities, the coupon rate is determined by the issuer/agent based on current market conditions. For certain asset- and mortgage-backed securities, the coupon rate may fluctuate based on changes of the underlying collateral or prepayments of principal. These securities do not indicate a reference index and spread in their description above. |
| (FEDEFF PRV)— | | Effective Federal Funds Rate |
| (LIBOR)— | | London Interbank Offered Rate |
| (SOFR)— | | Secured Overnight Financing Rate |
See accompanying notes to financial statements.
BHFTII-8
Brighthouse Funds Trust II
MFS Value Portfolio
Schedule of Investments as of December 31, 2018
Fair Value Hierarchy
Accounting principles generally accepted in the United States of America (“GAAP”) define fair market value as the price that the Portfolio would receive to sell an asset or pay to transfer a liability in an orderly transaction between market participants at the measurement date. It establishes a fair value hierarchy that prioritizes inputs to valuation methods and requires disclosure of the fair value hierarchy, separately for each major category of assets and liabilities, that segregates fair value measurements into three levels. Levels 1, 2 and 3 of the fair value hierarchy are defined as follows:
Level 1 - unadjusted quoted prices in active markets for identical investments
Level 2 - other significant observable inputs (including, but not limited to, quoted prices for similar assets or liabilities in markets that are either active or inactive; inputs other than quoted prices that are observable such as interest rates, yield curves, volatilities, prepayment speeds, loss severities, credit risks, default rates, or other market corroborated inputs)
Level 3 - significant unobservable inputs based on the best information available in the circumstances, to the extent observable inputs are unavailable (including the Portfolio’s own assumptions used in determining the fair value of investments and derivative financial instruments)
The inputs or methodologies used for valuing investments are not necessarily an indication of the risk associated with investing in them. Changes to the inputs or methodologies used may result in transfers between levels. A reconciliation of Level 3 securities, if any, will be disclosed following the fair value hierarchy table. For more information about the Portfolio’s policy regarding the valuation of investments, please refer to the Notes to Financial Statements.
The following table summarizes the fair value hierarchy of the Portfolio’s investments as of December 31, 2018:
| | | | | | | | | | | | | | | | |
| Description | | Level 1 | | | Level 2 | | | Level 3 | | | Total | |
| Common Stocks | |
Aerospace & Defense | | $ | 105,398,170 | | | $ | — | | | $ | — | | | $ | 105,398,170 | |
Air Freight & Logistics | | | 17,399,352 | | | | — | | | | — | | | | 17,399,352 | |
Auto Components | | | 29,323,485 | | | | — | | | | — | | | | 29,323,485 | |
Automobiles | | | 3,802,333 | | | | — | | | | — | | | | 3,802,333 | |
Banks | | | 408,435,952 | | | | — | | | | — | | | | 408,435,952 | |
Beverages | | | 17,009,501 | | | | 41,201,761 | | | | — | | | | 58,211,262 | |
Building Products | | | 49,713,888 | | | | — | | | | — | | | | 49,713,888 | |
Capital Markets | | | 216,653,023 | | | | — | | | | — | | | | 216,653,023 | |
Chemicals | | | 99,879,889 | | | | — | | | | — | | | | 99,879,889 | |
Consumer Finance | | | 29,446,636 | | | | — | | | | — | | | | 29,446,636 | |
Containers & Packaging | | | 6,256,742 | | | | — | | | | — | | | | 6,256,742 | |
Diversified Telecommunication Services | | | 21,349,939 | | | | — | | | | — | | | | 21,349,939 | |
Electric Utilities | | | 110,177,783 | | | | — | | | | — | | | | 110,177,783 | |
Electrical Equipment | | | 29,801,392 | | | | — | | | | — | | | | 29,801,392 | |
Energy Equipment & Services | | | 34,875,866 | | | | — | | | | — | | | | 34,875,866 | |
Equity Real Estate Investment Trusts | | | 12,539,907 | | | | — | | | | — | | | | 12,539,907 | |
Food Products | | | 55,686,236 | | | | 64,499,405 | | | | — | | | | 120,185,641 | |
Health Care Equipment & Supplies | | | 180,455,156 | | | | — | | | | — | | | | 180,455,156 | |
Health Care Providers & Services | | | 71,369,177 | | | | — | | | | — | | | | 71,369,177 | |
Household Products | | | 26,376,466 | | | | 15,791,115 | | | | — | | | | 42,167,581 | |
Industrial Conglomerates | | | 97,219,204 | | | | — | | | | — | | | | 97,219,204 | |
Insurance | | | 228,593,122 | | | | — | | | | — | | | | 228,593,122 | |
IT Services | | | 196,931,310 | | | | — | | | | — | | | | 196,931,310 | |
Life Sciences Tools & Services | | | 38,926,928 | | | | — | | | | — | | | | 38,926,928 | |
Machinery | | | 100,946,565 | | | | — | | | | — | | | | 100,946,565 | |
Media | | | 145,355,968 | | | | — | | | | — | | | | 145,355,968 | |
Oil, Gas & Consumable Fuels | | | 100,714,642 | | | | — | | | | — | | | | 100,714,642 | |
Pharmaceuticals | | | 241,868,146 | | | | 18,209,086 | | | | — | | | | 260,077,232 | |
Professional Services | | | 22,125,546 | | | | — | | | | — | | | | 22,125,546 | |
Road & Rail | | | 54,944,040 | | | | — | | | | — | | | | 54,944,040 | |
Semiconductors & Semiconductor Equipment | | | 68,587,171 | | | | — | | | | — | | | | 68,587,171 | |
Textiles, Apparel & Luxury Goods | | | 9,456,541 | | | | — | | | | — | | | | 9,456,541 | |
Tobacco | | | 94,096,622 | | | | — | | | | — | | | | 94,096,622 | |
Trading Companies & Distributors | | | 6,536,472 | | | | — | | | | — | | | | 6,536,472 | |
Total Common Stocks | | | 2,932,253,170 | | | | 139,701,367 | | | | — | | | | 3,071,954,537 | |
Total Short-Term Investment* | | | — | | | | 34,271,367 | | | | — | | | | 34,271,367 | |
Total Securities Lending Reinvestments* | | | — | | | | 317,698,224 | | | | — | | | | 317,698,224 | |
Total Investments | | $ | 2,932,253,170 | | | $ | 491,670,958 | | | $ | — | | | $ | 3,423,924,128 | |
| | | | | | | | | | | | | | | | | |
Collateral for Securities Loaned (Liability) | | $ | — | | | $ | (317,552,368 | ) | | $ | — | | | $ | (317,552,368 | ) |
| | | | |
| * | | See Schedule of Investments for additional detailed categorizations. |
See accompanying notes to financial statements.
BHFTII-9
Brighthouse Funds Trust II
MFS Value Portfolio
Statement of Assets and Liabilities
December 31, 2018
| | | | |
Assets | |
Investments at value (a) (b) | | $ | 3,423,924,128 | |
Cash | | | 166,228 | |
Receivable for: | |
Investments sold | | | 100,099 | |
Fund shares sold | | | 286,617 | |
Dividends and interest | | | 7,926,083 | |
Prepaid expenses | | | 9,971 | |
| | | | |
Total Assets | | | 3,432,413,126 | |
Liabilities | |
Collateral for securities loaned | | | 317,552,368 | |
Payables for: | |
Fund shares redeemed | | | 950,941 | |
Accrued Expenses: | |
Management fees | | | 1,525,510 | |
Distribution and service fees | | | 200,990 | |
Deferred trustees’ fees | | | 266,117 | |
Other expenses | | | 443,242 | |
| | | | |
Total Liabilities | | | 320,939,168 | |
| | | | |
Net Assets | | $ | 3,111,473,958 | |
| | | | |
Net Assets Consist of: | |
Paid in surplus | | $ | 2,365,861,305 | |
Distributable earnings (Accumulated losses) | | | 745,612,653 | |
| | | | |
Net Assets | | $ | 3,111,473,958 | |
| | | | |
Net Assets | |
Class A | | $ | 2,144,807,145 | |
Class B | | | 840,016,909 | |
Class D | | | 10,993,566 | |
Class E | | | 115,656,338 | |
Capital Shares Outstanding* | |
Class A | | | 155,294,203 | |
Class B | | | 61,659,074 | |
Class D | | | 799,085 | |
Class E | | | 8,434,043 | |
Net Asset Value, Offering Price and Redemption Price Per Share | |
Class A | | $ | 13.81 | |
Class B | | | 13.62 | |
Class D | | | 13.76 | |
Class E | | | 13.71 | |
| | | | |
| * | | The Portfolio is authorized to issue an unlimited number of shares. |
| (a) | | Identified cost of investments was $2,965,563,372. |
| (b) | | Includes securities loaned at value of $313,143,478. |
Statement of Operations
Year Ended December 31, 2018
| | | | |
Investment Income | |
Dividends (a) | | $ | 84,802,216 | |
Interest | | | 480,897 | |
Securities lending income | | | 1,148,125 | |
| | | | |
Total investment income | | | 86,431,238 | |
Expenses | |
Management fees | | | 22,436,595 | |
Administration fees | | | 119,972 | |
Custodian and accounting fees | | | 285,379 | |
Distribution and service fees—Class B | | | 2,303,474 | |
Distribution and service fees—Class D | | | 13,581 | |
Distribution and service fees—Class E | | | 160,809 | |
Audit and tax services | | | 50,174 | |
Legal | | | 39,680 | |
Trustees’ fees and expenses | | | 37,006 | |
Shareholder reporting | | | 187,085 | |
Insurance | | | 22,174 | |
Miscellaneous | | | 38,869 | |
| | | | |
Total expenses | | | 25,694,798 | |
Less management fee waiver | | | (3,238,620 | ) |
| | | | |
Net expenses | | | 22,456,178 | |
| | | | |
Net Investment Income | | | 63,975,060 | |
| | | | |
Net Realized and Unrealized Gain (Loss) | |
| Net realized gain (loss) on: | |
Investments | | | 225,032,558 | |
Foreign currency transactions | | | (21,560 | ) |
| | | | |
Net realized gain | | | 225,010,998 | |
| | | | |
| Net change in unrealized depreciation on: | |
Investments | | | (620,868,685 | ) |
Foreign currency transactions | | | (23,979 | ) |
| | | | |
Net change in unrealized depreciation | | | (620,892,664 | ) |
| | | | |
Net realized and unrealized loss | | | (395,881,666 | ) |
| | | | |
Net Decrease in Net Assets From Operations | | $ | (331,906,606 | ) |
| | | | |
| | | | |
| (a) | | Net of foreign withholding taxes of $433,647. |
See accompanying notes to financial statements.
BHFTII-10
Brighthouse Funds Trust II
MFS Value Portfolio
Statements of Changes in Net Assets
| | | | | | | | |
| | | Year Ended
December 31,
2018 | | | Year Ended
December 31,
2017 | |
Increase (Decrease) in Net Assets: | |
From Operations | |
Net investment income | | $ | 63,975,060 | | | $ | 53,202,977 | |
Net realized gain | | | 225,010,998 | | | | 231,093,103 | |
Net change in unrealized appreciation (depreciation) | | | (620,892,664 | ) | | | 252,359,200 | |
| | | | | | | | |
Increase (decrease) in net assets from operations | | | (331,906,606 | ) | | | 536,655,280 | |
| | | | | | | | |
From Distributions to Shareholders (a) | |
Class A | | | (199,188,349 | ) | | | (190,392,577 | ) |
Class B | | | (75,747,065 | ) | | | (65,150,486 | ) |
Class D | | | (1,040,793 | ) | | | (1,164,674 | ) |
Class E | | | (8,779,919 | ) | | | (5,400,287 | ) |
| | | | | | | | |
Total distributions | | | (284,756,126 | ) | | | (262,108,024 | ) |
| | | | | | | | |
Increase in net assets from capital share transactions | | | 344,812,584 | | | | 1,106,971 | |
| | | | | | | | |
Total increase (decrease) in net assets | | | (271,850,148 | ) | | | 275,654,227 | |
|
Net Assets | |
Beginning of period | | | 3,383,324,106 | | | | 3,107,669,879 | |
| | | | | | | | |
End of period | | $ | 3,111,473,958 | | | $ | 3,383,324,106 | (b) |
| | | | | | | | |
Other Information:
Capital Shares
Transactions in capital shares were as follows:
| | | | | | | | | | | | | | | | |
| | | Year Ended
December 31, 2018 | | | Year Ended
December 31, 2017 | |
| | | Shares | | | Value | | | Shares | | | Value | |
Class A | |
Sales | | | 3,124,465 | | | $ | 49,181,762 | | | | 8,120,112 | | | $ | 130,514,081 | |
Shares issued through acquisition (c) | | | 18,481,526 | | | | 297,922,201 | | | | 0 | | | | 0 | |
Reinvestments | | | 13,217,541 | | | | 199,188,349 | | | | 12,379,231 | | | | 190,392,577 | |
Redemptions | | | (27,625,599 | ) | | | (433,593,718 | ) | | | (17,518,898 | ) | | | (279,874,097 | ) |
| | | | | | | | | | | | | | | | |
Net increase | | | 7,197,933 | | | $ | 112,698,594 | | | | 2,980,445 | | | $ | 41,032,561 | |
| | | | | | | | | | | | | | | | |
Class B | |
Sales | | | 2,225,609 | | | $ | 34,665,285 | | | | 2,012,951 | | | $ | 31,592,582 | |
Shares issued through acquisition (c) | | | 14,961,618 | | | | 238,039,342 | | | | 0 | | | | 0 | |
Reinvestments | | | 5,087,110 | | | | 75,747,065 | | | | 4,283,398 | | | | 65,150,486 | |
Redemptions | | | (11,644,783 | ) | | | (181,299,374 | ) | | | (8,399,209 | ) | | | (132,006,373 | ) |
| | | | | | | | | | | | | | | | |
Net increase (decrease) | | | 10,629,554 | | | $ | 167,152,318 | | | | (2,102,860 | ) | | $ | (35,263,305 | ) |
| | | | | | | | | | | | | | | | |
Class D | |
Sales | | | 7,677 | | | $ | 118,378 | | | | 42,587 | | | $ | 664,439 | |
Reinvestments | | | 69,294 | | | | 1,040,793 | | | | 75,974 | | | | 1,164,674 | |
Redemptions | | | (180,442 | ) | | | (2,789,514 | ) | | | (158,528 | ) | | | (2,509,083 | ) |
| | | | | | | | | | | | | | | | |
Net decrease | | | (103,471 | ) | | $ | (1,630,343 | ) | | | (39,967 | ) | | $ | (679,970 | ) |
| | | | | | | | | | | | | | | | |
Class E | |
Sales | | | 2,143,711 | | | $ | 32,230,864 | | | | 148,686 | | | $ | 2,364,771 | |
Shares issued through acquisition (c) | | | 2,867,541 | | | | 45,909,325 | | | | 0 | | | | 0 | |
Reinvestments | | | 586,109 | | | | 8,779,919 | | | | 353,191 | | | | 5,400,287 | |
Redemptions | | | (1,315,647 | ) | | | (20,328,093 | ) | | | (743,453 | ) | | | (11,747,373 | ) |
| | | | | | | | | | | | | | | | |
Net increase (decrease) | | | 4,281,714 | | | $ | 66,592,015 | | | | (241,576 | ) | | $ | (3,982,315 | ) |
| | | | | | | | | | | | | | | | |
Increase derived from capital shares transactions | | | | | | $ | 344,812,584 | | | | | | | $ | 1,106,971 | |
| | | | | | | | | | | | | | | | |
Please see following page for Statement of Changes in Net Assets footnote legend.
See accompanying notes to financial statements.
BHFTII-11
Brighthouse Funds Trust II
MFS Value Portfolio
Statements of Changes in Net Assets
| | | | | | | | |
| (a) | | Distributions from net investment income and realized gains are no longer required to be separately disclosed. The presentation for the year ended December 31, 2018 has been adjusted for this change (See Note 9). At December 31, 2017 the distributions were as follows. |
| | | | | | | | |
| | | Distributions from net
investment income: | | | Distributions from
realized capital gains: | |
Class A | | $ | (48,171,616 | ) | | $ | (142,220,961 | ) |
Class B | | | (15,050,267 | ) | | | (50,100,219 | ) |
Class D | | | (284,067 | ) | | | (880,607 | ) |
Class E | | | (1,292,093 | ) | | | (4,108,194 | ) |
| | | | | | | | |
| (b) | | As part of the update in (a), it is also no longer required to disclose the Undistributed net investment income (Accumulated losses) which was $52,698,926 as of December 31, 2017. |
| (c) | | See Note 8 of the Notes to Financial Statements. |
See accompanying notes to financial statements.
BHFTII-12
Brighthouse Funds Trust II
MFS Value Portfolio
Financial Highlights
| | | | | | | | | | | | | | | | | | | | |
| Selected per share data | |
| | | Class A | |
| | | Year Ended December 31, | |
| | | 2018 | | | 2017 | | | 2016 | | | 2015 | | | 2014 | |
Net Asset Value, Beginning of Period | | $ | 16.63 | | | $ | 15.31 | | | $ | 15.09 | | | $ | 18.38 | | | $ | 17.75 | |
| | | | | | | | | | | | | | | | | | | | |
Income (Loss) from Investment Operations | |
Net investment income (a) | | | 0.30 | | | | 0.27 | | | | 0.34 | (b) | | | 0.31 | | | | 0.43 | |
Net realized and unrealized gain (loss) | | | (1.87 | ) | | | 2.38 | | | | 1.68 | | | | (0.23 | ) | | | 1.36 | |
| | | | | | | | | | | | | | | | | | | | |
Total income (loss) from investment operations | | | (1.57 | ) | | | 2.65 | | | | 2.02 | | | | 0.08 | | | | 1.79 | |
| | | | | | | | | | | | | | | | | | | | |
Less Distributions | |
Distributions from net investment income | | | (0.24 | ) | | | (0.34 | ) | | | (0.36 | ) | | | (0.50 | ) | | | (0.31 | ) |
Distributions from net realized capital gains | | | (1.01 | ) | | | (0.99 | ) | | | (1.44 | ) | | | (2.87 | ) | | | (0.85 | ) |
| | | | | | | | | | | | | | | | | | | | |
Total distributions | | | (1.25 | ) | | | (1.33 | ) | | | (1.80 | ) | | | (3.37 | ) | | | (1.16 | ) |
| | | | | | | | | | | | | | | | | | | | |
Net Asset Value, End of Period | | $ | 13.81 | | | $ | 16.63 | | | $ | 15.31 | | | $ | 15.09 | | | $ | 18.38 | |
| | | | | | | | | | | | | | | | | | | | |
Total Return (%) (c) | | | (10.05 | ) | | | 18.00 | | | | 14.39 | | | | (0.15 | ) | | | 10.81 | |
|
Ratios/Supplemental Data | |
Gross ratio of expenses to average net assets (%) | | | 0.66 | | | | 0.72 | | | | 0.72 | | | | 0.72 | | | | 0.72 | |
Net ratio of expenses to average net assets (%) (d) | | | 0.57 | | | | 0.58 | | | | 0.58 | | | | 0.58 | | | | 0.58 | |
Ratio of net investment income to average net assets (%) | | | 1.89 | | | | 1.70 | | | | 2.25 | (b) | | | 1.87 | | | | 2.49 | |
Portfolio turnover rate (%) | | | 7 | | | | 13 | | | | 14 | | | | 12 | | | | 12 | |
Net assets, end of period (in millions) | | $ | 2,144.8 | | | $ | 2,462.2 | | | $ | 2,222.2 | | | $ | 2,218.1 | | | $ | 2,493.9 | |
| |
| | | Class B | |
| | | Year Ended December 31, | |
| | | 2018 | | | 2017 | | | 2016 | | | 2015 | | | 2014 | |
Net Asset Value, Beginning of Period | | $ | 16.41 | | | $ | 15.14 | | | $ | 14.94 | | | $ | 18.22 | | | $ | 17.61 | |
| | | | | | | | | | | | | | | | | | | | |
Income (Loss) from Investment Operations | |
Net investment income (a) | | | 0.25 | | | | 0.23 | | | | 0.30 | (b) | | | 0.27 | | | | 0.37 | |
Net realized and unrealized gain (loss) | | | (1.83 | ) | | | 2.33 | | | | 1.66 | | | | (0.23 | ) | | | 1.36 | |
| | | | | | | | | | | | | | | | | | | | |
Total income (loss) from investment operations | | | (1.58 | ) | | | 2.56 | | | | 1.96 | | | | 0.04 | | | | 1.73 | |
| | | | | | | | | | | | | | | | | | | | |
Less Distributions | |
Distributions from net investment income | | | (0.20 | ) | | | (0.30 | ) | | | (0.32 | ) | | | (0.45 | ) | | | (0.27 | ) |
Distributions from net realized capital gains | | | (1.01 | ) | | | (0.99 | ) | | | (1.44 | ) | | | (2.87 | ) | | | (0.85 | ) |
| | | | | | | | | | | | | | | | | | | | |
Total distributions | | | (1.21 | ) | | | (1.29 | ) | | | (1.76 | ) | | | (3.32 | ) | | | (1.12 | ) |
| | | | | | | | | | | | | | | | | | | | |
Net Asset Value, End of Period | | $ | 13.62 | | | $ | 16.41 | | | $ | 15.14 | | | $ | 14.94 | | | $ | 18.22 | |
| | | | | | | | | | | | | | | | | | | | |
Total Return (%) (c) | | | (10.24 | ) | | | 17.58 | | | | 14.10 | | | | (0.36 | ) | | | 10.56 | |
|
Ratios/Supplemental Data | |
Gross ratio of expenses to average net assets (%) | | | 0.91 | | | | 0.97 | | | | 0.97 | | | | 0.97 | | | | 0.97 | |
Net ratio of expenses to average net assets (%) (d) | | | 0.82 | | | | 0.83 | | | | 0.83 | | | | 0.83 | | | | 0.83 | |
Ratio of net investment income to average net assets (%) | | | 1.65 | | | | 1.45 | | | | 2.01 | (b) | | | 1.62 | | | | 2.16 | |
Portfolio turnover rate (%) | | | 7 | | | | 13 | | | | 14 | | | | 12 | | | | 12 | |
Net assets, end of period (in millions) | | $ | 840.0 | | | $ | 837.6 | | | $ | 804.2 | | | $ | 739.3 | | | $ | 798.0 | |
Please see following page for Financial Highlights footnote legend.
See accompanying notes to financial statements.
BHFTII-13
Brighthouse Funds Trust II
MFS Value Portfolio
Financial Highlights
| | | | | | | | | | | | | | | | | | | | |
| Selected per share data | |
| | | Class D | |
| | | Year Ended December 31, | |
| | | 2018 | | | 2017 | | | 2016 | | | 2015 | | | 2014 | |
Net Asset Value, Beginning of Period | | $ | 16.56 | | | $ | 15.26 | | | $ | 15.05 | | | $ | 18.33 | | | $ | 17.71 | |
| | | | | | | | | | | | | | | | | | | | |
Income (Loss) from Investment Operations | |
Net investment income (a) | | | 0.28 | | | | 0.25 | | | | 0.32 | (b) | | | 0.29 | | | | 0.41 | |
Net realized and unrealized gain (loss) | | | (1.84 | ) | | | 2.36 | | | | 1.67 | | | | (0.22 | ) | | | 1.35 | |
| | | | | | | | | | | | | | | | | | | | |
Total income (loss) from investment operations | | | (1.56 | ) | | | 2.61 | | | | 1.99 | | | | 0.07 | | | | 1.76 | |
| | | | | | | | | | | | | | | | | | | | |
Less Distributions | |
Distributions from net investment income | | | (0.23 | ) | | | (0.32 | ) | | | (0.34 | ) | | | (0.48 | ) | | | (0.29 | ) |
Distributions from net realized capital gains | | | (1.01 | ) | | | (0.99 | ) | | | (1.44 | ) | | | (2.87 | ) | | | (0.85 | ) |
| | | | | | | | | | | | | | | | | | | | |
Total distributions | | | (1.24 | ) | | | (1.31 | ) | | | (1.78 | ) | | | (3.35 | ) | | | (1.14 | ) |
| | | | | | | | | | | | | | | | | | | | |
Net Asset Value, End of Period | | $ | 13.76 | | | $ | 16.56 | | | $ | 15.26 | | | $ | 15.05 | | | $ | 18.33 | |
| | | | | | | | | | | | | | | | | | | | |
Total Return (%) (c) | | | (10.06 | ) | | | 17.81 | | | | 14.23 | | | | (0.20 | ) | | | 10.69 | |
| | | | | |
Ratios/Supplemental Data | | | | | | | | | | | | | | | | | | | | |
Gross ratio of expenses to average net assets (%) | | | 0.76 | | | | 0.82 | | | | 0.82 | | | | 0.82 | | | | 0.82 | |
Net ratio of expenses to average net assets (%) (d) | | | 0.67 | | | | 0.68 | | | | 0.68 | | | | 0.68 | | | | 0.68 | |
Ratio of net investment income to average net assets (%) | | | 1.78 | | | | 1.60 | | | | 2.15 | (b) | | | 1.77 | | | | 2.34 | |
Portfolio turnover rate (%) | | | 7 | | | | 13 | | | | 14 | | | | 12 | | | | 12 | |
Net assets, end of period (in millions) | | $ | 11.0 | | | $ | 15.0 | | | $ | 14.4 | | | $ | 14.7 | | | $ | 16.8 | |
| |
| | | Class E | |
| | | Year Ended December 31, | |
| | | 2018 | | | 2017 | | | 2016 | | | 2015 | | | 2014 | |
Net Asset Value, Beginning of Period | | $ | 16.52 | | | $ | 15.22 | | | $ | 15.01 | | | $ | 18.29 | | | $ | 17.67 | |
| | | | | | | | | | | | | | | | | | | | |
Income (Loss) from Investment Operations | |
Net investment income (a) | | | 0.27 | | | | 0.24 | | | | 0.31 | (b) | | | 0.29 | | | | 0.40 | |
Net realized and unrealized gain (loss) | | | (1.85 | ) | | | 2.36 | | | | 1.67 | | | | (0.23 | ) | | | 1.35 | |
| | | | | | | | | | | | | | | | | | | | |
Total income (loss) from investment operations | | | (1.58 | ) | | | 2.60 | | | | 1.98 | | | | 0.06 | | | | 1.75 | |
| | | | | | | | | | | | | | | | | | | | |
Less Distributions | |
Distributions from net investment income | | | (0.22 | ) | | | (0.31 | ) | | | (0.33 | ) | | | (0.47 | ) | | | (0.28 | ) |
Distributions from net realized capital gains | | | (1.01 | ) | | | (0.99 | ) | | | (1.44 | ) | | | (2.87 | ) | | | (0.85 | ) |
| | | | | | | | | | | | | | | | | | | | |
Total distributions | | | (1.23 | ) | | | (1.30 | ) | | | (1.77 | ) | | | (3.34 | ) | | | (1.13 | ) |
| | | | | | | | | | | | | | | | | | | | |
Net Asset Value, End of Period | | $ | 13.71 | | | $ | 16.52 | | | $ | 15.22 | | | $ | 15.01 | | | $ | 18.29 | |
| | | | | | | | | | | | | | | | | | | | |
Total Return (%) (c) | | | (10.20 | ) | | | 17.80 | | | | 14.20 | | | | (0.27 | ) | | | 10.63 | |
| | | | | |
Ratios/Supplemental Data | | | | | | | | | | | | | | | | | | | | |
Gross ratio of expenses to average net assets (%) | | | 0.81 | | | | 0.87 | | | | 0.87 | | | | 0.87 | | | | 0.87 | |
Net ratio of expenses to average net assets (%) (d) | | | 0.73 | | | | 0.73 | | | | 0.73 | | | | 0.73 | | | | 0.73 | |
Ratio of net investment income to average net assets (%) | | | 1.77 | | | | 1.55 | | | | 2.10 | (b) | | | 1.72 | | | | 2.28 | |
Portfolio turnover rate (%) | | | 7 | | | | 13 | | | | 14 | | | | 12 | | | | 12 | |
Net assets, end of period (in millions) | | $ | 115.7 | | | $ | 68.6 | | | $ | 66.9 | | | $ | 66.0 | | | $ | 78.0 | |
| | | | |
| (a) | | Per share amounts based on average shares outstanding during the period. |
| (b) | | Net investment income per share and the ratio of net investment income to average net assets include anon-recurring refund for overbilling of prior years’ custodianout-of-pocket fees which amounted to less than $0.01 per share and 0.01% of average net assets, respectively. |
| (c) | | Total return does not reflect any insurance, sales, separate account or administrative charges of variable annuity or life insurance contracts or any additional expenses that contract owners may bear under their variable contracts. If these charges were included, the returns would be lower. |
| (d) | | Includes the effects of management fee waivers (see Note 5 of the Notes to Financial Statements). |
See accompanying notes to financial statements.
BHFTII-14
Brighthouse Funds Trust II
MFS Value Portfolio
Notes to Financial Statements—December 31, 2018
1. Organization
Brighthouse Funds Trust II (the “Trust”) is organized as a Delaware statutory trust and registered under the Investment Company Act of 1940, as amended (the “1940 Act”), as anopen-end management investment company. The Trust, which is managed by Brighthouse Investment Advisers, LLC (“Brighthouse Investment Advisers” or the “Adviser”), currently offers twenty-nine series, each of which operates as a distinct investment vehicle of the Trust. The series included in this report is MFS Value Portfolio (the “Portfolio”), which is diversified. Shares in the Portfolio are not offered directly to the general public and are currently available only to separate accounts established by life insurance companies affiliated with the Adviser and Metropolitan Life Insurance Company (the “Insurance Companies”).
The Portfolio has registered and offers four classes of shares: Class A, B, D and E shares. Shares of each Class of the Portfolio represent an equal pro rata interest in the Portfolio and generally give the shareholder the same voting, dividend, liquidation, and other rights. Investment income, realized and unrealized capital gains and losses, the common expenses of the Portfolio, and certain Portfolio-level expense reductions, if any, are allocated on a pro rata basis to each Class based on the relative net assets of each Class to the net assets of the Portfolio. Each Class of shares differs in its respective distribution plan and such distribution expenses are allocated to the corresponding Class of shares.
2. Significant Accounting Policies
The preparation of financial statements in conformity with accounting principles generally accepted in the United States of America (“GAAP”) requires management to make estimates and assumptions that affect the reported amounts of assets and liabilities and disclosure of contingent assets and liabilities as of the date of the financial statements and the reported amounts of income and expenses during the reporting period. Actual results could differ from those estimates. In the preparation of these financial statements, management has evaluated events and transactions subsequent to December 31, 2018 through the date the financial statements were issued.
The Portfolio is an investment company and follows the accounting and reporting guidance of the Financial Accounting Standards Board (“FASB”) Accounting Standards Codification Topic946- Financial Services- Investment Companies. The following is a summary of significant accounting policies consistently followed by the Portfolio in the preparation of its financial statements.
Investment Valuation and Fair Value Measurements - The Portfolio values its portfolio investments for purposes of calculating its net asset value (“NAV”) using procedures approved by the Board of Trustees of the Trust (the “Board” or “Trustees”). Those procedures allow for a variety of methodologies to be used to value the Portfolio’s investments. The specific methodologies used for a particular investment may vary based on the market data available for a specific investment at the time the Portfolio calculates its NAV or based on other considerations. The procedures also permit a level of judgment to be used in the valuation process. The Portfolio follows the accounting and reporting guidance of FASB Accounting Standards Codification Topic820- Fair Value Measurement.
Domestic and foreign equity securities, such as common stock, exchange-traded funds, rights, warrants, and preferred stock, that are traded on a securities exchange on a valuation date are generally valued at their last quoted sale price or official closing price on the primary exchange for such security, or, if no sales occurred on that day, at the last reported bid price. Equity securities tradedover-the-counter (“OTC”) are generally valued at the last reported bid price. In the event of a major exchange closing during the trading day, the Adviser may use other market information obtained from quotation reporting systems, established market makers, or pricing services in valuing the securities. Valuation adjustments may be applied to certain foreign equity securities that are traded solely on foreign exchanges that close before the time as of which the Portfolio determines its NAV to account for the market movement between the close of the foreign exchanges and the time as of which the Portfolio determines its NAV. The Portfolio may use a systematic fair valuation model provided by a pricing service to value securities principally traded in these foreign markets in order to adjust for possible market movements or other changes that may occur between the close of the foreign exchanges and the time as of which the Portfolio determines its NAV. Foreign equity securities valued using these valuation adjustments are generally categorized as Level 2 within the fair value hierarchy. Equity securities that are actively traded, and have no valuation adjustments applied, are categorized as Level 1 within the fair value hierarchy. Other equity securities traded on inactive markets, or valued in reference to similar instruments traded on active markets, are generally categorized as Level 2 within the fair value hierarchy.
Investments in registeredopen-end management investment companies are valued at reported NAV per share on the valuation date and are categorized as Level 1 within the fair value hierarchy.
Debt securities, including corporate, convertible and municipal bonds and notes; obligations of the U.S. Treasury and U.S. government agencies; foreign sovereign issues; andnon-U.S. bonds, are generally valued on the basis of evaluated or composite bid quotations obtained from independent pricing services and/or brokers and dealers selected by the Adviser (each a “pricing service”), pursuant to the authorization of and subject to general oversight by the Board. Such pricing services may use matrix pricing, which considers observable inputs including, among other things, issuer details, maturity dates, interest rates, yield curves, rates of prepayment, credit risks/spreads, default rates, reported trades, broker-dealer quotes and quoted prices for similar assets. Short-term obligations with a remaining maturity of sixty days or less may be valued at amortized cost in the absence of market quotes, so long as the amortized cost
BHFTII-15
Brighthouse Funds Trust II
MFS Value Portfolio
Notes to Financial Statements—December 31, 2018—(Continued)
value of such short-term debt instrument is approximately the same as the fair value of the instrument as determined without the use of amortized cost valuation. Floating rate loans are generally valued on the basis of an evaluated or composite average of aggregate bid and ask quotations supplied by brokers or dealers, as obtained from the pricing service. Securities that use similar valuation techniques and inputs as described above are generally categorized as Level 2 within the fair value hierarchy.
Options, whether on securities, indices, futures contracts, or otherwise, traded on exchanges are valued at the last sale price available as of the close of business on a valuation day or, if there is no such price available, at the last reported bid price. These types of options are categorized as Level 1 within the fair value hierarchy. Futures contracts that are traded on commodity exchanges are valued at their settlement prices established by the exchanges on which they are traded as of the close of such exchanges and are categorized as Level 1 within the fair value hierarchy.
If no current market value quotation or other observable inputs are readily available or market value quotations are deemed to be unreliable for an investment, the fair value of the investment will be determined in accordance with procedures approved by, and under the general supervision of, the Board. In such a circumstance, the Board will be assisted in its responsibility to determine the fair value of an investment by the Valuation Committee (“Committee”) of Brighthouse Investment Advisers. The Committee provides general pricing oversight and fair value pricing determinations related to portfolio securities and meets on a regular basis to review reports relating to the valuation of the securities in the Portfolio. The Board has delegated to State Street Bank and Trust Company, the Trust’s custodian (“Custodian”), the responsibility for calculating the NAVs of the Trust’s Portfolios. The Committee is responsible for overseeing the calculation of the NAVs of the Portfolios by the custodian. The Committee also periodically reviews pricing services, including the pricing services providing fair value pricing for the Portfolio’s foreign securities, and is responsible for overseeing the correction of pricing errors and addressing other pricing issues that arise in the ordinary course of business, such as making real-time fair value determinations, as necessary.
No single standard for determining the fair value of an investment can be set forth because fair value depends upon the facts and circumstances with respect to each investment. Information relating to any relevant factors may be obtained by the Committee from any appropriate source, including the subadviser of the Portfolio, the custodian, a pricing service, market maker and/or broker for such security or the issuer. Appropriate methodologies for determining fair value under particular circumstances may include: matrix pricing, a discounted cash flow analysis, comparisons of securities with comparable characteristics, value based on multiples of earnings, discount from market price of similar marketable securities, or a combination of these and other methods.
Investment Transactions and Related Investment Income - Portfolio security transactions are recorded on the trade date. Dividend income is recorded on theex-dividend date or, for certain foreign securities, when notified. Interest income, which includes amortization of premium and accretion of discount on debt securities, is recorded on the accrual basis. Realized gains and losses on investments are determined on the identified cost basis, which is the same basis used for federal income tax purposes. Foreign income and foreign capital gains on some foreign securities may be subject to foreign taxes, which are accrued as applicable. These foreign taxes have been provided for in accordance with the Portfolio’s understanding of the applicable countries’ tax rules and rates.
Foreign Currency Translation -The books and records of the Portfolio are maintained in U.S. dollars. The values of securities, currencies, and other assets and liabilities denominated in currencies other than the U.S. dollar are translated into U.S. dollars based upon foreign exchange rates prevailing at the end of the period. Purchases and sales of investment securities, income, and expenses are translated on the respective dates of such transactions. Because the values of investment securities are translated at the foreign exchange rates prevailing at the end of the period, that portion of the results of operations arising from changes in exchange rates and that portion of the results of operations reflecting fluctuations arising from changes in market prices of the investment securities are not separated. Such fluctuations are included in the net realized and unrealized gain or loss on investments.
Net realized foreign exchange gains or losses arise from activity in forward foreign currency exchange contracts, sales of foreign currency, currency gains or losses realized between the trade and settlement dates on securities transactions, and the difference between the amounts of dividends, interest, and foreign withholding taxes recorded by the Portfolio and the U.S. dollar-equivalent of the amounts actually received or paid by the Portfolio. Net unrealized foreign exchange gains and losses arise from changes in the value of assets and liabilities, other than investment securities, resulting from changes in foreign exchange rates.
Dividends and Distributions to Shareholders -The Portfolio records dividends and distributions on theex-dividend date. Net realized gains from securities transactions (if any) are generally distributed annually to shareholders. The timing and characterization of certain income and capital gains distributions are determined in accordance with federal tax regulations that may differ from GAAP. Permanent book and tax basis differences relating to shareholder distributions will result in reclassification between distributable earnings (accumulated losses) andpaid-in surplus.Book-tax differences are primarily due to merger adjustments. These adjustments have no impact on net assets or the results of operations.
Income Taxes -It is the Portfolio’s policy to comply with the requirements of the Internal Revenue Code of 1986, as amended, and regulations thereunder, applicable to regulated investment companies, and to distribute, with respect to each taxable year, all of its taxable income to shareholders. Therefore, no federal income tax provision is required. The Portfolio files U.S. federal tax returns. No
BHFTII-16
Brighthouse Funds Trust II
MFS Value Portfolio
Notes to Financial Statements—December 31, 2018—(Continued)
income tax returns are currently under examination. The Portfolio’s federal tax returns for the prior three fiscal years remain subject to examination by the Internal Revenue Service. As of December 31, 2018, the Portfolio had no uncertain tax positions that would require financial statement recognition, or derecognition or disclosure.
Repurchase Agreements -The Portfolio may enter into repurchase agreements, under the terms of a Master Repurchase Agreement (“MRA”), with selected commercial banks and broker-dealers, under which the Portfolio acquires securities as collateral and agrees to resell the securities at an agreed-upon time and at an agreed-upon price. The Portfolio, through the Custodian or a subcustodian, under atri-party repurchase agreement, receives delivery of the underlying securities collateralizing any repurchase agreements. It is the Portfolio’s policy that the market value of the collateral be equal to at least 100% of the repurchase price in the case of a repurchase agreement ofone-day duration and equal to at least 102% of the repurchase price in the case of all other repurchase agreements. In the event of default or failure by a party to perform an obligation in connection with any repurchase transaction, the MRA gives thenon-defaulting party the right toset-off claims and to apply property held by it in connection with any repurchase transaction against obligations owed to it.
At December 31, 2018, the Portfolio had direct investments in repurchase agreements with a gross value of $34,271,367. Additionally, the Portfolio invested cash collateral for loans of portfolio securities in repurchase agreements with a gross value of $68,762,136. The combined value of all repurchase agreements is included as part of investments at value on the Statement of Assets and Liabilities. The value of the related collateral exceeded the value of the repurchase agreements at December 31, 2018.
Securities Lending - The Portfolio may lend its portfolio securities to certain qualified brokers who borrow securities in order to complete certain securities transactions. By lending its portfolio securities, the Portfolio attempts to increase its net investment income through the receipt of income on collateral held from securities on loan. Any gain or loss in the market price of the loaned securities that might occur and any interest earned or dividends declared during the term of the loan would accrue to the account of the Portfolio.
The Trust has entered into aNon-Custodial Securities Lending Agreement with JPMorgan Chase Bank, N.A. (the “Lending Agent”). Under the agreement, the Lending Agent is authorized to loan portfolio securities on the Portfolio’s behalf. In exchange, the Portfolio receives either cash or U.S. government securities as collateral against the loaned securities. The Portfolio receives collateral equal to at least 102% of the market value for loans secured by government securities or cash in the same currency as the loaned shares and 105% for all other loaned securities at each loan’s inception. Collateral representing at least 100% of the market value of the loaned securities is maintained for the duration of the loan. Any cash collateral received by the Portfolio is generally invested by the Lending Agent in short-term investments, which may include certificates of deposit, commercial paper, repurchase agreements, time deposits, master demand notes and money market funds. The market value of investments made with cash collateral received are disclosed in the Schedule of Investments and the valuation techniques are described in Note 2. If the market value of the collateral at the close of trading on a business day is less than 100% of the market value of the loaned securities at the close of trading on that day, the borrower is required to deliver, by the close of business on the following business day, an additional amount of collateral, so that the total amount of posted collateral is equal to at least 100% of the market value of all the loaned securities as of such preceding day. A portion of the income earned on the collateral is rebated to the borrower of the securities and the remainder is split between the Lending Agent and the Portfolio. On loans collateralized by U.S. government securities, a fee is received from the borrower and is allocated between the Portfolio and the Lending Agent.
Income received by the Portfolio in securities lending transactions during the year ended December 31, 2018 is reflected as securities lending income on the Statement of Operations. The values of any securities loaned by the Portfolio and the related collateral at December 31, 2018 are disclosed in the footnotes to the Schedule of Investments. The value of the related collateral received by the Portfolio exceeded the value of the securities out on loan at December 31, 2018.
The risks associated with lending portfolio securities include, but are not limited to, possible delays in receiving additional collateral or in the recovery of the loaned securities, possible loss of rights in the collateral should the borrower fail financially, as well as risk of loss in the value of the collateral or the value of the investments made with the collateral. The Lending Agent shall indemnify the Portfolio in the case of default of any securities borrower, subject to the terms of theNon-Custodial Securities Lending Agreement.
All securities on loan are classified as Common Stocks in the Portfolio’s Schedule of Investments as of December 31, 2018, with a contractual maturity of overnight and continuous.
3. Certain Risks
In the normal course of business, the Portfolio invests in securities and enters into transactions where risks exist. Those risks include:
Market Risk:The value of securities held by the Portfolio may decline in response to certain events, including those directly involving the issuers whose securities are owned by the Portfolio; conditions affecting the general economy; overall market changes; local, regional or global political, social or economic instability; and currency, interest rate, and price fluctuations.
BHFTII-17
Brighthouse Funds Trust II
MFS Value Portfolio
Notes to Financial Statements—December 31, 2018—(Continued)
Credit and Counterparty Risk: The Portfolio may be exposed to counterparty risk, or the risk that an entity with which the Portfolio has unsettled or open transactions may default. The potential loss could exceed the value of the financial assets and liabilities recorded in the financial statements. Financial assets that potentially expose the Portfolio to credit and counterparty risk consist principally of cash due from counterparties and investments. The Portfolio manages counterparty risk by entering into agreements only with counterparties that it believes have the financial resources to honor their obligations and by monitoring the financial stability of those counterparties. The Adviser attempts to mitigate counterparty risk by (i) periodically assessing the creditworthiness of its trading partners, (ii) monitoring and/or limiting the amount of its net exposure to each individual counterparty based on its assessment, and (iii) requiring collateral from the counterparty for certain transactions. In order to preserve certain safeguards fornon-standard settlement trades, the Portfolio restricts its exposure to credit and counterparty losses by entering into master netting agreements (“Master Agreements”) with counterparties (approved brokers) with whom it undertakes a significant volume of transactions. Master Agreements govern the terms of certain transactions, and reduce the counterparty risk associated with relevant transactions by specifying credit protection mechanisms and providing standardization that improves legal certainty. Master Agreements can also help limit counterparty risk by specifying collateral posting arrangements atpre-arranged exposure levels.
Repurchase and reverse repurchase agreements are primarily executed under Global Master Repurchase Agreements (“GMRAs”) or Master Repurchase Agreements (“MRAs”), which provide the rights toset-off. Each repurchase and reverse repurchase agreement is initially collateralized at the transaction level. In the event of default, the total market value exposure will be offset against collateral exchanged to date, which would result in a net receivable/(payable) that would be due from/to the counterparty.
Additional risks associated with each type of investment are described above within the respective security type notes. The Portfolio’s prospectus includes a discussion of the principal risks of investing in the Portfolio.
4. Investment Transactions
Aggregate cost of purchases and proceeds of sales of investment securities, excluding short-term securities, for the year ended December 31, 2018 were as follows:
| | | | | | | | | | | | |
Purchases | | | Sales | |
U.S. Government | | Non-U.S. Government | | | U.S. Government | | | Non-U.S. Government | |
| $0 | | $ | 257,412,218 | | | $ | 0 | | | $ | 710,095,806 | |
With respect to the Portfolio’s merger with MFS Value Portfolio II (see Note 8) on April 27, 2018, the Portfolio acquired long-term securities with a cost of $542,946,988 that are not included in the above purchases values.
The Portfolio engaged in security transactions with other accounts managed by Massachusetts Financial Services Company, the subadviser to the Portfolio, that amounted to $385,360 in purchases of investments and $5,016,440 in sales of investments, which are included above, and resulted in realized gains of $2,054,842.
5. Investment Management Fees and Other Transactions with Affiliates
Investment Management Agreement -Brighthouse Investment Advisers is the investment adviser to the Portfolio. The Trust has entered into an investment management agreement with (the “Adviser”) with respect to the Portfolio. For providing investment management services to the Portfolio, the Adviser receives monthly compensation at the following annual rates:
| | | | | | |
Management
Fees earned by
Brighthouse
Investment Advisers
for the year ended
December 31, 2018 | | % per annum | | | Average Daily Net Assets |
| $22,436,595 | | | 0.700 | % | | First $250 million |
| | | 0.650 | % | | Of the next $500 million |
| | | 0.600 | % | | On amounts in excess of $750 million |
Prior to April 30, 2018, the Adviser received monthly compensation at the following annual rates:
| | |
% per annum | | Average Daily Net Assets |
| 0.750% | | Of the first $250 million |
| 0.700% | | Of the next $2.25 billion |
| 0.675% | | Of the next $2.5 billion |
| 0.650% | | On amounts in excess of $5 billion |
The Adviser has entered into an investment subadvisory agreement with respect to managing the Portfolio. Massachusetts Financial Services Company (the “Subadviser”) is compensated by the Adviser to provide subadvisory services for the Portfolio.
BHFTII-18
Brighthouse Funds Trust II
MFS Value Portfolio
Notes to Financial Statements—December 31, 2018—(Continued)
Management Fee Waiver - Pursuant to a management fee waiver agreement, the Adviser has agreed, for the period April 30, 2018 to April 30, 2019, to reduce its advisory fees set out above under “Investment Management Agreement” for each class of the Portfolio as follows:
| | |
% per annum | | Average Daily Net Assets |
| 0.050% | | On the first $200 million |
| 0.075% | | On the next $50 million |
| 0.025% | | On the next $500 million |
| (0.025)% | | On the next $750 million |
| 0.100% | | On the next $1.5 billion |
| 0.125% | | On amounts in excess of $3 billion |
Prior to April 30, 2018, the Adviser had agreed, for the period September 1, 2017 to April 29, 2018, to reduce its advisory fees set out above under “Investment Management Agreement” for each class of the Portfolio as follows:
| | |
% per annum | | Average Daily Net Assets |
| 0.100% | | On the first $200 million |
| 0.125% | | On the next $50 million |
| 0.075% | | On the next $1.25 billion |
| 0.200% | | On the next $1 billion |
| 0.175% | | On the next $500 million |
| 0.200% | | On the next $2 billion |
| 0.175% | | On amounts in excess of $5 billion |
Fees waived for the year ended December 31, 2018 amounted to $3,104,568 and are included in the amount shown as a management fee waiver in the Statement of Operations.
Additionally, the Subadviser had agreed, for the period from September 1, 2017 through April 29, 2018, to waive a portion of the subadvisory fees payable to the Subadviser with respect to the Portfolio and the MFS Value Portfolio II, another series of the Trust, reflecting the difference, if any, between the aggregate subadvisory fees payable by the Adviser to the Subadviser individually with respect to the Portfolio and the MFS Value Portfolio II and the subadvisory fees that would be payable by the Adviser to the Subadviser if the assets of the Portfolio and the MFS Value Portfolio II were aggregated for purposes of calculating such advisory fees and then apportioning the resulting subadvisory fee based on average daily net assets of the two portfolios. The Adviser had agreed to reduce its management fee for the Portfolio by the amount waived by the Subadviser for the Portfolio pursuant to this voluntary subadvisory fee waiver. Fees waived for the year ended December 31, 2018 amounted to $134,052 and are included in the amount shown as a
management fee waiver in the Statement of Operations. This waiver had no impact on the net ratio of expenses to average net assets as shown in the Financial Highlights for the year ended December 31, 2018.
Certain officers and trustees of the Trust may also be officers of Brighthouse Investment Advisers; however, such officers and trustees receive no compensation from the Trust.
Transfer Agency Agreement -Brighthouse Financial, Inc. serves as the transfer agent for the Trust. Brighthouse Financial, Inc. receives no fees for its services to the Trust.
Distribution and Service Fees - The Trust has a distribution agreement with Brighthouse Securities, LLC (the “Distributor”) pursuant to which the Distributor serves as the general distributor of shares of each class (each a “Class”) of each Portfolio. The Distributor is an affiliate of the Trust. The Trust has adopted a Distribution and Services Plan (the “Plan”) relating to Class B, Class D and Class E shares of each Portfolio, under Rule 12b-1 under the 1940 Act, pursuant to which the Trust may pay the Distributor a fee (the “Service Fee”) at an annual rate not to exceed 0.25% of each such Portfolio’s average daily net assets attributable to the Class B, Class D and Class E shares of the Trust. Each Portfolio may not offer shares of each Class. The Plan also authorizes the Trust, on behalf of each of its Portfolios, may pay the Distributor a distribution Fee (the “Distribution Fee” and together with the Service Fee, the “Fees”) at an annual rate of up to 0.25% of each Portfolio’s average daily net assets attributable to the Class B, Class D and Class E shares in consideration of the services rendered in connection with the sale of such shares by the Distributor. Under the Distribution Agreement with respect to the Trust, Fees are currently paid at an annual rate of 0.25% of average daily net assets in the case of Class B shares, 0.10% of average daily net assets in the case of Class D shares and 0.15% of average daily net assets in the case of Class E shares. The Plan is known as a “compensation plan” because the Trust makes payments to the Distributor for services rendered regardless of the actual level of expenditures by the Distributor. Amounts incurred by the Portfolio for the year ended December 31, 2018 are shown as Distribution and service fees in the Statement of Operations.
Deferred Trustee Compensation -Each Trustee who is not currently an employee of the Adviser or any of its affiliates receives compensation from the Trust for his or her service to the Trust. A deferred compensation plan (the “Plan”) is available to the Trustees on a voluntary basis. Deferred amounts remain in the Trust until distributed in accordance with the provisions of the Plan. The value of a participating Trustee’s deferral account is based on theoretical investments of deferred amounts on the normal payment dates in
BHFTII-19
Brighthouse Funds Trust II
MFS Value Portfolio
Notes to Financial Statements—December 31, 2018—(Continued)
certain portfolios of the Trust or Brighthouse Funds Trust I, an affiliate of the Trust, as designated by the participating Trustee. Changes in the value of participants’ deferral accounts are reflected as Trustees’ fees and expenses in the Statement of Operations. The portion of the accrued obligations allocated to the Portfolio under the Plan is reflected as Deferred trustees’ fees in the Statement of Assets and Liabilities.
6. Contractual Obligations
Under the Trust’s organizational documents, its officers and Trustees may be indemnified against certain liabilities and expenses arising out of the performance of their duties to the Trust. Additionally, the Trust has a variety of indemnification obligations under contracts with its service providers. The Trust’s maximum exposure under these arrangements is unknown, as this would involve future claims that may be made against the Trust that have not yet occurred.
7. Income Tax Information
The cost basis of investments for federal income tax purposes at December 31, 2018 was as follows:
| | | | |
Cost basis of investments | | $ | 2,967,532,830 | |
Gross unrealized appreciation | | | 606,231,976 | |
Gross unrealized depreciation | | | (149,840,678 | ) |
| | | | |
Net unrealized appreciation (depreciation) | | $ | 456,391,298 | |
| | | | |
The tax character of distributions paid for the years ended December 31, 2018 and 2017 were as follows:
| | | | | | | | | | | | | | | | | | | | |
Ordinary Income | | | Long-Term Capital Gain | | | Total | |
2018 | | 2017 | | | 2018 | | | 2017 | | | 2018 | | | 2017 | |
| $55,302,970 | | $ | 64,798,043 | | | $ | 229,453,156 | | | $ | 197,309,981 | | | $ | 284,756,126 | | | $ | 262,108,024 | |
As of December 31, 2018, the components of distributable earnings (accumulated losses) on a federal income tax basis were as follows:
| | | | | | | | | | | | | | | | |
Undistributed
Ordinary
Income | | Undistributed
Long-Term
Capital Gain | | | Net
Unrealized
Appreciation | | | Accumulated
Capital Losses | | | Total | |
| $63,644,096 | | $ | 225,866,683 | | | $ | 456,367,993 | | | $ | — | | | $ | 745,878,772 | |
The Portfolio utilizes the provisions of the federal income tax laws that provide for the carryforward of capital losses for prior years, offsetting such losses against any future realized capital gains. Under the Regulated Investment Company Modernization Act of 2010, net capital losses recognized after December 22, 2010 may be carried forward indefinitely and their character is retained as short-term and/or long-term losses.
As of December 31, 2018, the Portfolio had no accumulated capital losses.
8. Acquisition
At the close of business on April 27, 2018, the Portfolio, with aggregate Class A, Class B, Class D and Class E net assets of $2,331,861,008, $782,456,827, $13,632,897 and $63,261,629, respectively, acquired all of the assets and liabilities of MFS Value Portfolio II, a series of the Brighthouse Funds Trust II.
The acquisition was accomplished by atax-free exchange of 18,481,526 Class A shares of the Portfolio (valued at $297,922,201) for 46,681,887 Class A shares of MFS Value Portfolio II, 14,961,618 Class B shares of the Portfolio (valued at $238,039,342) for 37,761,303 Class B shares of MFS Value Portfolio II and 2,867,541 Class E shares of the Portfolio (valued at $45,909,325) for 7,236,556 Class E shares of MFS Value Portfolio II. Each shareholder of MFS Value Portfolio II received shares of the Portfolio with the same class designation and at the respective Class NAV, as determined at the close of business on April 27, 2018. The transaction was part of a restructuring designed to eliminate the offering of overlapping portfolios in the Brighthouse Financial, Inc. family of funds with similar investment objectives and similar investment strategies that serve as funding vehicles for insurance contracts that are offered by affiliates of Brighthouse. Some of the investments held by MFS Value Portfolio II may have been purchased or sold prior to the acquisition for the purpose of complying with the anticipated investment policies or limitations of the Portfolio after the acquisition. If such purchases or sales occurred, the transaction costs were borne by MFS Value Portfolio II. All other costs associated with the merger were not borne by the shareholders of either Portfolio.
MFS Value Portfolio II’s net assets on April 27, 2018, were $297,922,201, $238,039,342 and $45,909,325 for Class A, Class B and Class E shares respectively, including investments valued at $581,700,541 with a cost basis of $544,585,228. For financial reporting purposes,
BHFTII-20
Brighthouse Funds Trust II
MFS Value Portfolio
Notes to Financial Statements—December 31, 2018—(Continued)
assets received, liabilities assumed and shares issued by the Portfolio were recorded at fair value; however, the cost basis of the investments received by the Portfolio from MFS Value Portfolio II were carried forward to align ongoing reporting of the Portfolio’s realized and unrealized gains and losses with amounts distributable to shareholders for tax purposes.
The aggregate net assets of the Portfolio immediately after the acquisition were $3,773,083,229, which included $37,115,313 of acquired unrealized appreciation on investments and foreign currency transactions.
Assuming the acquisition had been completed on January 1, 2018, the Portfolio’spro-forma results of operations for the year ended December 31, 2018 are as follows:
| | | | |
Net Investment income | | $ | 67,291,557 | (a) |
Net realized and unrealized loss on investments | | $ | (417,151,867 | )(b) |
| | | | |
Net decrease in net assets from operations | | $ | (349,860,310 | ) |
Because the combined investment portfolios have been managed as a single integrated portfolio since the acquisition was completed, it is not practicable to separate the amounts of revenue and earnings of MFS Value Portfolio II that have been included in the Portfolio’s Statement of Operations since April 30, 2018.
| | | | |
| (a) | | $63,975,060 net investment income as reported at December 31, 2018, plus $3,020,381 from MFS Value Portfolio IIpre-merger net investment income, plus $171,768 in lower net advisory fees, plus $124,348 ofpro-forma eliminated other expenses. |
| (b) | | $458,337,451 unrealized appreciation included within distributable earnings (accumulated losses) at December 31, 2018, minus $1,105,285,182pro-forma December 31, 2017 unrealized appreciation, plus $225,010,998 net realized gain as reported at December 31, 2018, plus $4,784,866 in net realized gain from MFS Value Portfolio IIpre-merger. |
9. Recent Accounting Pronouncements and SEC Update
In August 2018, the FASB issued Accounting Standards Update2018-13, Fair Value Measurement (Topic 820)—Disclosure Framework—Changes to the Disclosure Requirements for Fair Value Measurement (“ASU2018-13”) which introduces new fair value disclosure requirements as well as eliminates and modifies certain existing fair value disclosure requirements. ASU2018-13 is effective for fiscal years beginning after December 15, 2019, and interim periods within those fiscal years. Early adoption is permitted and, as such, management has elected to early adopt ASU2018-13 effective with the current reporting period. The impact of the Portfolio’s adoption was limited to changes in the Portfolio’s financial statement disclosures regarding fair value, primarily those disclosures related to transfers between levels of the fair value hierarchy.
In August 2018, the Securities and Exchange Commission released its Final Rule on Disclosure Update and Simplification (the “Final Rule”) which is intended to simplify an issuer’s disclosure compliance efforts by removing redundant or outdated disclosures requirements without significantly altering the mix of information provided to investors. Effective with the current reporting period, the Portfolio adopted the Final Rule with the most notable impacts being that the Portfolio is no longer required to present the components of distributable earnings on the Statement of Assets and Liabilities or the sources of distributions to shareholders and the amounts of undistributed net investment income on the Statements of Changes in Net Assets.
BHFTII-21
Brighthouse Funds Trust II
MFS Value Portfolio
Report of Independent Registered Public Accounting Firm
To the Shareholders of MFS Value Portfolio and the Board of Trustees of Brighthouse Funds Trust II:
Opinion on the Financial Statements and Financial Highlights
We have audited the accompanying statement of assets and liabilities, including the schedule of investments, of the MFS Value Portfolio (the “Portfolio”), one of the portfolios constituting the Brighthouse Funds Trust II, as of December 31, 2018, the related statement of operations for the year then ended, the statements of changes in net assets for each of the two years in the period then ended, the financial highlights for each of the five years in the period then ended, and the related notes. In our opinion, the financial statements and financial highlights present fairly, in all material respects, the financial position of the MFS Value Portfolio of the Brighthouse Funds Trust II as of December 31, 2018, the results of its operations for the year then ended, the changes in its net assets for each of the two years in the period then ended, and the financial highlights for each of the five years in the period then ended, in conformity with accounting principles generally accepted in the United States of America.
Basis for Opinion
These financial statements and financial highlights are the responsibility of the Portfolio’s management. Our responsibility is to express an opinion on the Portfolio’s financial statements and financial highlights based on our audits. We are a public accounting firm registered with the Public Company Accounting Oversight Board (United States) (PCAOB) and are required to be independent with respect to the Portfolio in accordance with the U.S. federal securities laws and the applicable rules and regulations of the Securities and Exchange Commission and the PCAOB.
We conducted our audits in accordance with the standards of the PCAOB. Those standards require that we plan and perform the audit to obtain reasonable assurance about whether the financial statements and financial highlights are free of material misstatement, whether due to error or fraud. The Portfolio is not required to have, nor were we engaged to perform, an audit of its internal control over financial reporting. As part of our audits we are required to obtain an understanding of internal control over financial reporting but not for the purpose of expressing an opinion on the effectiveness of the Portfolio’s internal control over financial reporting. Accordingly, we express no such opinion.
Our audits included performing procedures to assess the risks of material misstatement of the financial statements and financial highlights, whether due to error or fraud, and performing procedures that respond to those risks. Such procedures included examining, on a test basis, evidence regarding the amounts and disclosures in the financial statements and financial highlights. Our audits also included evaluating the accounting principles used and significant estimates made by management, as well as evaluating the overall presentation of the financial statements and financial highlights. Our procedures included confirmation of securities owned as of December 31, 2018, by correspondence with the custodian and brokers; when replies were not received from brokers, we performed other auditing procedures. We believe that our audits provide a reasonable basis for our opinion.
/s/ Deloitte & Touche LLP
Boston, Massachusetts
February 25, 2019
We have served as the auditor of one or more of the Brighthouse investment companies since 1983.
BHFTII-22
Brighthouse Funds Trust II
Trustees and Officers
MANAGEMENT OF THE TRUSTS
The Boards of Trustees (the “Board”) of Brighthouse Funds Trust I and Brighthouse Funds Trust II (“BHF I” and “BHF II”, respectively, and collectively the “Trusts”) supervise the Trusts and are responsible for representing the interests of shareholders. The Trustees, the Chairman of the Board and the Chairmen of each subcommittee are the same for both Trusts. The Trustees of each Trust meet periodically throughout the year to oversee the Portfolios’ activities, reviewing, among other things, each Portfolio’s performance and its contractual arrangements with various service providers. The Trustees of each Trust elect the officers of the Trust, who are responsible for administering the Trust’sday-to-day operations.
Trustees and Officers
The Trustees and executive officers of the Trusts, as well as their principal occupations during the past five years, are set forth below. Unless otherwise indicated, the business address of each is c/o Brighthouse Funds, One Financial Center, Boston, Massachusetts 02111. Each Trustee who is deemed an “interested person,” as such term is defined in the 1940 Act, is referred to as an “Interested Trustee.” Those Trustees who are not “interested persons,” as such term is defined in the 1940 Act, are referred to as “Independent Trustees.” There is no limit to the term a Trustee may serve. Trustees serve until their death, resignation or removal in accordance with the BHF I Trust’s and BHF II Trust’s respective organizational documents and policies adopted by the Boards of the respective Trusts from time to time. Officers hold office at the pleasure of each Board and serve until their removal or resignation in accordance with the Trusts’ respective organizational documents and policies adopted by the Board of each Trust from time to time.
| | | | | | | | | | |
Name and Year of Birth | | Current
Position(s)
Held with
Registrant | | Term of Office
and Length of
Time Served | | Principal Occupation(s) During the Past
5 Years(1) | | Number of
Portfolios
in Brighthouse
Funds
Complex(2)
Overseen
by Trustee | | Other Directorships Held
by Trustee During the
Past 5 Years(1) |
| Interested Trustee |
John Rosenthal* (1960) | | Trustee | | Indefinite; From
May 2016
(Trust I and
Trust II) to present | | Chief Investment Officer, Brighthouse Financial, Inc. (2017 to present); until 2017, Senior Managing Director and Head of Global Portfolio Management, MetLife, Inc. | | 72 | | None |
|
| Independent Trustees |
Dawn M. Vroegop (1966) | | Trustee and Chairman of the Board | | Indefinite; From
December 2000
(Trust I)/May
2009 (Trust II) to
present as
Trustee; From
May 2016 (Trust
I and Trust II)
until present as
Chairman | | Private Investor. | | 72 | | Trustee, Driehaus Mutual Funds.** |
| | | | | |
Stephen M. Alderman (1959) | | Trustee | | Indefinite; From
December 2000
(Trust I)/April
2012 (Trust II) to
present | | Shareholder in the law firm of Garfield and Merel, Ltd. | | 72 | | None |
| | | | | |
Robert J. Boulware (1956) | | Trustee | | Indefinite; From
March 2008
(Trust I)/April
2012 (Trust II) to
present | | Managing Director, Pilgrim Funds, LLC (private equity fund). | | 72 | | Trustee, Vertical Capital Income Fund(closed-end fund);** Director, Gainsco, Inc. (auto insurance);** Trustee, SharesPost 100 Fund(closed-end fund).** |
| | | | | |
Susan C. Gause (1952) | | Trustee | | Indefinite; From
March 2008
(Trust I)/April
2012 (Trust II) to
present | | Private Investor. | | 72 | | Trustee, HSBC Funds.** |
BHFTII-23
Brighthouse Funds Trust II
Trustees and Officers—(Continued)
| | | | | | | | | | |
Name and Year of Birth | | Current
Position(s)
Held with
Registrant | | Term of Office
and Length of
Time Served | | Principal Occupation(s) During the Past
5 Years(1) | | Number of
Portfolios
in Brighthouse
Funds
Complex(2)
Overseen
by Trustee | | Other Directorships Held
by Trustee During the
Past 5 Years(1) |
Nancy Hawthorne (1951) | | Trustee | | Indefinite; From
May 2003
(Trust II)/April
2012 (Trust I)
to present | | Partner, Hawthorne Financial Advisors, LLC (registered investment advisor); until 2014, Chief Executive Officer, Clerestory LLC (corporate advisor). | | 72 | | Director and Chairman of the Board of Directors, THL Credit, Inc.;** Director and Chairman of the Board, Avid Technology, Inc.;** Director, CRA International, Inc.** |
| | | | | |
Barbara A. Nugent (1956) | | Trustee | | Indefinite; From
January 2014
(Trust I and
Trust II) to
present | | President, True North Board Governance, LLC (consulting); until December 2013, partner in the law firm of Stradley Ronon Stevens & Young, LLP. | | 72 | | Independent Lead Trustee, BMT Investment Funds** |
| | | | | |
Christopher J. Towle (1957) | | Trustee | | Indefinite; From
April 2018
(Trust I and
Trust II) to
present | | Retired; until 2014, Partner, Portfolio Manager, Director of High Yield and Convertible Strategies, Lord Abbett & Co. | | 72 | | Trustee, Driehaus Mutual Funds** |
Officers
| | | | | | |
Name and Year of Birth | | Position(s)
Held with
Registrant | | Length of
Time Served | | Principal Occupation(s)
During the Past 5 Years(1) |
| Executive Officers | | | | | | |
Kristi Slavin (1973) | | President and Chief Executive Officer, of Trust I and Trust II | | From May
2016
(Trust I and
Trust II) to
present | | President, Brighthouse Investment Advisers, LLC (2016-present); formerly, Senior Vice President, MetLife Advisers, LLC; Vice President, MetLife, Inc.; Vice President, Trust I and Trust II(2015-2016). |
| | | |
Alan R. Otis (1971) | | Chief Financial Officer and Treasurer, of Trust I and Trust II | | From
November
2017
(Trust I and
Trust II) to
present | | Senior Vice President, Brighthouse Investment Advisers, LLC (2017-present); formerly, Vice President, Brighthouse Investment Advisers, LLC (2012-2017); Assistant Treasurer, Trust I and Trust II (2012-2017). |
| | | |
Andrew L. Gangolf (1954) | | Secretary, of Trust I and Trust II | | From May
2011
(Trust I and
Trust II) to
present | | Executive Vice President, Brighthouse Investment Advisers, LLC (2017-present); formerly, Senior Vice President, MetLife Advisers, LLC (2011-2017); until 2011, Senior Vice President & Assistant General Counsel, AllianceBernstein Investments, Inc. |
| | | |
Steven E. Hartstein (1963) | | Chief Compliance Officer (“CCO”), of Trust I and Trust II | | From
February
2014
(Trust I and
Trust II) to
present | | Senior Vice President and CCO, Brighthouse Investment Advisers, LLC (2017-present); Head of Investments Compliance, Vice President, Brighthouse Financial, Inc. (2017-present); formerly, Vice President, MetLife, Inc. (2013-2017); Senior Vice President and CCO, MetLife Advisers, LLC (2013-2017.) |
| | | |
Victor Soto (1978) | | Vice President of Trust I and Trust II | | From May
2018
(Trust I and
Trust II) to
present | | Executive Vice President, Brighthouse Investment Advisers, LLC (2016-present); Assistant Vice President, MetLife Inc. (2015-2017); Portfolio Manager, 1st Global (2013-2015). |
| * | Mr. Rosenthal is an “interested person” of the Trusts because of his position with Brighthouse Financial, Inc., the current parent company of Brighthouse Investment Advisers, LLC. |
| ** | Indicates a directorship with a registered investment company or a company subject to the reporting requirements of the Securities Exchange Act of 1934, as amended. |
| (1) | Previous positions during the past five years with the Trusts, Brighthouse Financial, Inc., MetLife, Inc. or the Manager are omitted if not materially different. |
| (2) | The Fund Complex includes 43 BHF I Portfolios and 29 BHF II Portfolios. |
BHFTII-24
Brighthouse Funds Trust II
MFS Value Portfolio
Board of Trustees’ Consideration of Advisory and Sub-Advisory Agreements
At anin-person meeting held on November6-8, 2018 (the “November Meeting”), the Boards of Trustees (the “Board”) of Brighthouse Funds Trust I and Brighthouse Funds Trust II (“BFT I” and “BFT II,” respectively, and collectively, the “Trusts”), including a majority of the Trustees who are not “interested persons” of the Trusts (the “Independent Trustees”) under the Investment Company Act of 1940 (the “1940 Act”), approved the continuation of the Trusts’ advisory agreements (each, an “Advisory Agreement”) with Brighthouse Investment Advisers, LLC (the “Adviser”) and the applicablesub-advisory agreements (each a “Sub-Advisory Agreement,” and collectively with the Advisory Agreement, the “Agreements”) between the Adviser and the investmentsub-advisers (each a “Sub-Adviser,” and collectively, the “Sub-Advisers”) for the series of the Trusts (each a “Portfolio,” and collectively, the “Portfolios”).
In making those approvals, the Board reviewed a variety of materials that were provided for the specific purpose of the annual contract renewal process. In addition, various materials provided to and discussed with the Board throughout the year informed the Board’s decision to renew the Agreements. In particular, the information for each Portfolio included, but was not limited to, investment performance reports, and reports on expenses, legal and compliance matters, asset pricing, brokerage commissions and trade execution.
The Board met in person with personnel of the Adviser on October 17, 2018 for the specific purpose of giving preliminary consideration to the proposed continuation of the Agreements (the “October Meeting”). At that meeting, the Adviser reviewed with the Board the performance and fees experienced by each Portfolio, as well as other information. During and after the October Meeting, the Independent Trustees communicatedfollow-up matters for management to address at the November Meeting. The Independent Trustees were advised by independent legal counsel throughout the contract renewal process, and met with independent legal counsel in several executive sessions outside of the presence of management.
Information furnished and reviewed specifically in connection with the renewal process included, but was not limited to, a report for each Portfolio that was prepared by Broadridge (“Broadridge”), an independent organization. In addition, the Independent Trustees reviewed a report that was prepared by JDL Consultants, LLC (“JDL”), an independent consultant to the Independent Trustees (“JDL Report”), which examined the comparative fees, expenses and performance of each Portfolio, based upon the Broadridge reports. Also, the Board reviewed the responses to wide-ranging questions from the Independent Trustees relating to the business, operations and performance of the Adviser and theSub-Advisers that the Adviser andSub-Advisers had prepared specifically for the renewal process, and reviewed aPortfolio-by-Portfolio analysis of the profitability to the Adviser of each Advisory Agreement, which was prepared by the Adviser for the renewal process.
At the November Meeting, the Board, including a majority of the Independent Trustees, concluded that the nature, extent and quality of services provided by the Adviser and eachSub-Adviser supported the renewal of the Agreements. The Board also concluded that the investment performance of each Portfolio was such that each Agreement should continue, and that the fees paid by each Portfolio to the Adviser appeared to be reasonable in light of the nature, extent and quality of the services provided by the Adviser andSub-Adviser. Further, the Board concluded that the Adviser’s profitability in providing services under the Advisory Agreements did not appear unreasonable in light of the nature, extent and quality of the services provided by the Adviser. Finally, the Board reviewed the extent to which the investment advisory fees paid by the Portfolios shared economies of scale with investors or entailed the potential to share economies of scale with investors and concluded that those considerations generally supported the renewal of each Agreement. In approving the renewal of each of the Agreements, the Board, including the Independent Trustees, gave attention to all of the information that was furnished and each Trustee placed varying degrees of importance on the various pieces of information that were provided to them. The Board evaluated the information available to it on aPortfolio-by-Portfolio basis, and its decision was made separately with respect to each Portfolio. The following paragraphs provide more information about some of the primary factors that were relevant to the Board’s decision. The Board did not identify any single factor as determinative, and the Trustees generally attributed different weights to various factors for the various Portfolios.
Nature, extent and quality of services. The Board evaluated the nature, extent and quality of the services that the Adviser and theSub-Advisers, as relevant, have provided to the Portfolios. The Board considered the Adviser’s services as investment manager to the Portfolios, including its services relating to the hiring and oversight of theSub-Advisers, trading practices and oversight of transition management (as applicable), compliance programs and personnel, and risk management, among other things. The Adviser’s services in coordinating and overseeing the activities of the Trusts’ other service providers were also considered. The Board considered information received from the Trusts’ Chief Compliance Officer (“CCO”) regarding the Portfolios’ compliance policies and procedures that were established pursuant to Rule38a-l under the 1940 Act. The Board also noted that the Adviser’s investment, compliance and legal staff conduct regular and periodic telephonic andin-person meetings with theSub-Advisers to review and assess the services that are provided to the Portfolios, and that personnel of the Adviser prepare and present reports to the Independent Trustees regarding those meetings. In addition, throughout the year, the Board considered the expertise, experience and performance of the personnel of the Adviser who performed the various services that are mentioned above.
BHFTII-25
Brighthouse Funds Trust II
MFS Value Portfolio
Board of Trustees’ Consideration of Advisory and Sub-Advisory Agreements—(Continued)
With respect to the services provided by each of theSub-Advisers, the Board considered a variety of information that the Adviser and eachSub-Adviser prepared for the Board’s review. The Board considered eachSub-Adviser’s investment process and philosophy, and the investment performance experienced by the Portfolio (as described in more detail below). The Board took into account that eachSub-Adviser’s responsibilities include the development and maintenance of an investment program for the applicable Portfolio that is consistent with the Portfolio’s investment objectives, the selection of investment securities and the placement of orders for the purchase and sale of such securities, as well as the implementation of compliance controls related to performance of these services. In particular, the Board considered, among other things, theSub-Adviser’s current level of staffing as well as its compensation program and its overall resources. The Board reviewed eachSub-Adviser’s history and investment experience, as well as information provided regarding the qualifications, background and responsibilities of theSub-Adviser’s investment and compliance personnel who provide services to the Portfolios. The Board also considered, among other things, eachSub-Adviser’s compliance program and regulatory and disciplinary history. In its review, the Board also took into account information regarding any services and/or payments provided to the Adviser by theSub-Advisers in connection with marketing activities and considered representations from the Adviser that those payments were not considered in the Adviser’s recommendation to renew any of theSub-Advisory Agreements.
Performance. The Board placed emphasis on the performance of each Portfolio in light of, among other things, its importance to investors. The Board considered the Adviser’s quarterly reviews with the Board of detailed information about each Portfolio’s investment strategies and performance results and composition, including discussions regarding the relevant effect of current market conditions. The Board reviewed and considered the reports prepared by Broadridge, which provided a statistical analysis comparing the Portfolios’ investment performance to that of comparable funds underlying variable insurance products (the “Performance Universe”). The Independent Trustees also met separately with representatives of JDL during the October Meeting to review the JDL Report. The Board also compared the performance records of the Portfolios to those of comparable funds and other accounts that were managed by the relevantSub-Adviser, to the extent such information was available. The Board considered each Portfolio’s performance for periods subsequent to the performance period covered by the Broadridge reports, and the Adviser’s discussion of the same, including the effect of current market conditions on each Portfolio’s more recent performance. The Board also noted that while it found the data provided by Broadridge generally useful, it recognized the limitations of such data, including, in particular, that notable differences may exist between a Portfolio and those of the other funds in a Broadridge category (for example, the investment objectives(s) and investment strategies) and that the results of the performance comparisons may vary depending on (i) the end dates for the performance periods that were selected and (ii) the selection of the peer groups.
The Board focused particular attention on Portfolios with less favorable performance records. The Board noted the Adviser’s focus on eachSub-Adviser’s performance and that the Adviser has been active in monitoring and responding to any performance issues with respect to the Portfolios.
Fees and Expenses. The Board gave consideration to the level and method of computing the fees payable under the Agreements. The Board considered the Broadridge report for each of the Portfolios, which included comparisons for each Portfolio of its contractual management andsub-adviser fees (at current and various asset levels), and total expenses, with those of its peers, including as those peers were divided into a broad group of peer funds (“Expense Universe”), a narrower group of peer funds (“Expense Group”), a broad group of peersub-advised funds (“Sub-advised Expense Universe”), and a narrower group of peersub-advised funds (“Sub-advised Expense Group”). Broadridge selected the peer funds which were similarly situated funds underlying variable insurance products deemed to be comparable to the Portfolios. The Independent Trustees, with the assistance of JDL, also examined the JDL Report. The Board compared the fee payable to aSub-Adviser by the Adviser with respect to the Portfolio to the fee payable to theSub-Adviser by other comparable funds and other accounts, to the extent such information was available.
The Board noted that thesub-advisory fees for the Portfolios are paid by the Adviser out of the advisory fees, and that the Adviser negotiates the fees at arm’s length. The Board also considered that the Adviser had entered into expense limitation or management fee waiver agreements with certain of the Portfolios pursuant to which the Adviser had agreed to waive a portion of its advisory fee and/or reimburse certain expenses as a means of limiting a Portfolio’s total annual operating expenses.
Profitability. The Board examined the profitability to the Adviser of each Advisory Agreement, on aPortfolio-by-Portfolio basis. The Board also considered that an affiliate of the Adviser, Brighthouse Securities, LLC, serves as distributor for the Trusts, and, as such, receives Rule12b-1 payments to support the distribution of the Portfolios. The Board considered the profitability to theSub-Advisers and their affiliates as a result of their relationships with the Portfolios, to the extent available, and the Board considered the ability of the Adviser to negotiate with aSub-Adviser at arm’s length. In reviewing the profitability analyses, the Board recognized that expense allocation methodologies are inherently subjective and various expense allocation methodologies may be reasonable while producing different results.
BHFTII-26
Brighthouse Funds Trust II
MFS Value Portfolio
Board of Trustees’ Consideration of Advisory and Sub-Advisory Agreements—(Continued)
Economies of scale. The Board also considered each Portfolio’s fees in light of its size. The Board noted the fee schedules for the Portfolios that contain breakpoints that reduce the fee rate above specified asset levels. The Board noted those Portfolios that did not have breakpoints in their advisory fee and took into account management’s discussion of the same. The Board noted that those Portfolios with Advisory Agreements containing breakpoints generally have breakpoints in the correspondingSub-Advisory Agreement. The Board considered the effective fees under the Advisory Agreement andSub-Advisory Agreement for each Portfolio as a percentage of assets at different asset levels and possible economies of scale that may be realized if the assets of the Portfolio grow. The Board examined, among other data, the effect of a Portfolio’s growth in size, and reduction in size, on various fee schedules and the Board reviewed the Broadridge and JDL Reports, which compared fees among peers. The Board also generally noted that if a Portfolio’s assets increase over time, the Portfolio may realize other economies of scale if assets increase proportionally more than certain other fixed expenses.
Other factors. The Board considered other benefits that may be realized by the Adviser and its affiliates from their relationship with the Trusts. Among them, the Board recognized that Brighthouse Securities, LLC, as the distributor for the Trusts, receives payments pursuant to Rule12b-1 from the Portfolios to compensate for the provision of shareholder services and distribution activities, which could lead to growth in the Trusts’ assets and corresponding benefits from such growth, including economies of scale. The Board considered other benefits that may be realized by eachSub-Adviser and its affiliates from their relationship with the Trusts, including the opportunity to provide advisory services to additional portfolios of the Trusts and reputational benefits. In conjunction with these considerations, the Board noted the ongoing commitment of the Adviser to the Portfolios.
The Board requested, received, and considered information from the Adviser regarding possible conflicts of interest in the form of material benefits to the Adviser resulting from the Adviser’s affiliations and business relationships, as relevant. The Board considered the services that are provided to the Trusts by its service providers, and the manner in which any conflicts were mitigated.
* * *
MFS Value Portfolio. The Board also considered the following information in relation to the Agreements with the Adviser and Massachusetts Financial Services Company regarding the Portfolio:
Among other data relating specifically to the Portfolio’s performance, the Board considered that the Portfolio outperformed the median of its Performance Universe and the average of its Morningstar Category for the three-year and five-year periods ended June 30, 2018, and underperformed the median of its Performance Universe and the average of its Morningstar Category for theone-year period ended June 30, 2018. The Board further considered that the Portfolio outperformed its benchmark, the Russell 1000 Value Index, for the five-year period ended September 30, 2018, and underperformed its benchmark for theone-year and three-year periods ended September 30, 2018.
The Board also considered that the Portfolio’s actual management fees and total expenses (exclusive of12b-l fees) were below the Expense Group median, Expense Universe median, andSub-advised Expense Universe median. The Board further noted that the Portfolio’s contractual management fees were above the asset-weighted average of comparable funds selected by Broadridge at the Portfolio’s current size. The Board took into account that the Portfolio’s contractualsub-advisory fees were below the averages of theSub-advised Expense Group and theSub-advised Expense Universe at the Portfolio’s current size.
BHFTII-27
Brighthouse Funds Trust II
Neuberger Berman Genesis Portfolio
Managed by Neuberger Berman Management LLC
Portfolio Manager Commentary*
PERFORMANCE
For the 12 months ended December 31, 2018, the Class A, B, and E shares of the Neuberger Berman Genesis Portfolio returned-6.70%,-6.98%, and-6.89%, respectively. The Portfolio’s benchmark, the Russell 2000 Value Index1, returned-12.86%.
MARKET ENVIRONMENT / CONDITIONS
The U.S. stock market generated strong results over the first nine months of the year, reaching several newall-time highs. This rally was driven by generally robust corporate earnings, partially fueled by the 2017 tax reform bill. However, the market then reversed course and experienced a broad-based decline over the last three months of 2018.
A number of issues negatively impacted investor sentiment, including moderating global growth, ongoing global trade tensions, concerns over future Federal Reserve monetary tightening, and a partial U.S. government shutdown. All told, the S&P 500 Index fell 13.52% in the fourth quarter, pushing its 2018 return to-4.38%.Small-cap stocks significantly underperformed the overall stock market over the year, as the Russell 2000 Index returned-11.01%. Investor sentiment for smaller companies plunged during the fourth quarter given rising interest rates and fears of a recession. For the year,small-cap growth and value stocks, as the measured by the Russell 2000 Growth and Value Indexes, returned-9.31% and-12.86%, respectively.
PORTFOLIO REVIEW /PERIOD-END POSITIONING
While the Portfolio posted a negative absolute return during the year, it substantially outperformed the Russell 2000 Value Index. For the year as a whole, less speculative, less cyclical, higher quality companies outperformed. This was especially true during the second half of the year. During that time, companies with higher returns on equity and less leverage were the market leaders, especially lower beta (lower risk) names. This played into our long-term investment philosophy and, against this backdrop, our relative outperformance was driven by positive stock selection.
Within the Health Care sector, the lack of traditional, speculative biotechnology companies added the most value, as these names saw their share prices fall sharply during the period. Within the Consumer Staples sector, a number of “steady-eddie” household and food product holdings outperformed. Positive relative results in the Information Technology (“IT”) sector was driven by outperformance from the Portfolio’s software companies. There were no sectors that detracted from the Portfolio’s relative returns from a stock selection perspective during the year.
Examples of individual stocks that contributed to the Portfolio’s absolute performance during the year included Exponent, Inc., Church & Dwight Co., Inc., and Haemonetics Corp. Exponent is a consulting firm that provides solutions to complex problems. The company is the dominant player in its niche, as it provides engineering and scientific work that is related to litigation, regulation and design. The stock performed well during the year, as revenue growth accelerated due to strength in emerging technology areas (e.g. consumer electronics, autonomous vehicles) as well as increased benefits from interdisciplinary efforts, which is a differentiating factor versus other consulting firms. Church & Dwight is a manufacturer of household and personal care products. The company has a durable business model with a balanced portfolio of value-oriented and premium brands. The company’s brands, led by iconic Arm & Hammer, have significant “equity” with consumers. The stock rallied over the year, as the company continued to deliver solid results, driven bybest-in-class, broad-based revenue growth. Haemonetics is a leading supplier of blood management solutions, including systems and consumables used in the collection and processing of blood into its components. The majority of its revenues are recurring in nature. Under new leadership, the company has stabilized its donor business, improved organic growth and profitability, and is investing in platforms (plasma, hemostasis management) with promising long-term growth prospects. The stock outperformed in 2018, reflecting better-than-expected results and guidance, as well as providing a generally positive update on a critical new product launch.
A number of individual holdings were negative for performance due to company-specific issues. These included Centennial Resource Development, Inc., Rogers Corp., and Eagle Materials, Inc. Centennial Resource Development is an oil and natural gas exploration and production company focused in the Delaware Basin. The company has low cost assets and is under the leadership of Mark Papa who was highly regarded during his tenure as Chief Executive Officer of EOG Resources. With a clean balance sheet and large acreage base, the company anticipates production growth well in excess of its peers in the coming years. The stock underperformed during the year due to broader weakness in the Energy sector, driven by lower oil prices. Rogers Corp. is a specialty materials company with dominant share in niche markets. The stock underperformed in 2018, as transitory issues weighed on its margins after a stretch of very strong organic growth. Additionally, broader concerns around global trade and tariffs, as well as the potential impacts on the technology supply chain, weighed on the stock. In our view, Eagle Materials is one of the lowest cost and best run building materials company levered to U.S. construction and infrastructure spending. Relatively high returns are supported by the company’s close proximity to its customers, permitting regulations for building new plants and long-termlocked-in supply of synthetic gypsum. The company’s stock underperformed in 2018 due to concerns around the U.S. housing market and earnings shortfalls due to inclement weather, higher freight costs and slower than expected infrastructure spending.
From a sector allocation perspective, having no allocation to Utilities was the largest detractor from performance. This defensive, bond-proxy area of the market significantly outperformed the benchmark during the year—especially during the fourth quarter of 2018—when interest rates moved lower amid a flight to safety. Elsewhere, within the Financials sector, having underweights to insurance and
BHFTII-1
Brighthouse Funds Trust II
Neuberger Berman Genesis Portfolio
Managed by Neuberger Berman Management LLC
Portfolio Manager Commentary*—(Continued)
mortgage real estate investment trusts companies were headwinds for returns. On the upside, an underweight to the Energy sector was the most beneficial for results.
While the Portfolio’s sector allocations are driven by stock selection, at the end of the reporting period it’s largest overweight allocations versus the benchmark were IT, Health Care, and Industrials. In contrast, the Portfolio’s largest sector underweights relative to the benchmark were Financials, Real Estate, and Utilities.
Judith M. Vale
Robert W. D’Alelio
Brett S. Reiner
Gregory G. Spiegel
Portfolio Managers
Neuberger Berman Management LLC
* This commentary may include statements that constitute “forward-looking statements” under the U.S. securities laws. Forward-looking statements include, among other things, projections, estimates, and information about possible or future results related to the Portfolio, market or regulatory developments. The views expressed above are not guarantees of future performance or economic results and involve certain risks, uncertainties and assumptions that could cause actual outcomes and results to differ materially from the views expressed herein. The views expressed above are subject to change at any time based upon economic, market, or other conditions and the subadvisory firm undertakes no obligation to update the views expressed herein. Any discussions of specific securities should not be considered a recommendation to buy or sell those securities. The views expressed above (including any forward-looking statement) may not be relied upon as investment advice or as an indication of the Portfolio’s trading intent. Information about the Portfolio’s holdings, asset allocation or country diversification is historical and is not an indication of future Portfolio composition, which may vary. Direct investment in any index is not possible. The performance of any index mentioned in this commentary has not been adjusted for ongoing management, distribution and operating expenses, and sales charges applicable to mutual fund investments. In addition, the returns do not reflect additional fees charged by separate accounts or variable insurance contracts that an investor in the Portfolio may pay. If these additional fees were reflected, performance would have been lower.
BHFTII-2
Brighthouse Funds Trust II
Neuberger Berman Genesis Portfolio
A $10,000 INVESTMENT COMPARED TO THE RUSSELL 2000 VALUE INDEX
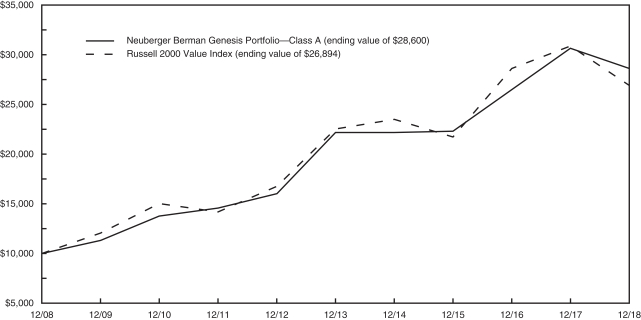
AVERAGE ANNUAL RETURNS (%) (FOR THE YEAR ENDED DECEMBER 31, 2018)
| | | | | | | | | | | | |
| | | | |
| | | 1 Year | | | 5 Year | | | 10 Year | |
| Neuberger Berman Genesis Portfolio | | | | | | | | | | | | |
Class A | | | -6.70 | | | | 5.21 | | | | 11.08 | |
Class B | | | -6.98 | | | | 4.94 | | | | 10.80 | |
Class E | | | -6.89 | | | | 5.05 | | | | 10.91 | |
| Russell 2000 Value Index | | | -12.86 | | | | 3.61 | | | | 10.40 | |
1 The Russell 2000 Value Index is an unmanaged measure of performance of those Russell 2000 companies that have lower price-to-book ratios and lower forecasted growth values.
Portfolio performance is calculated including reinvestment of all income and capital gain distributions. Performance numbers are net of all Portfolio expenses but do not include any insurance, sales, separate account or administrative charges of variable annuity or life insurance contracts or any additional expenses that participants may bear relating to the operations of their plans. If these charges were included, the returns would be lower. The performance of any index referenced above has not been adjusted for ongoing management, distribution and operating expenses, and sales charges applicable to mutual fund investments. Direct investment in any index is not possible. The performance of Class A shares, as set forth in the line graph above, will differ from that of other classes because of the difference in expenses paid by policyholders investing in the different share classes.
This information represents past performance and is not indicative of future results. Investment return and principal value may fluctuate so that shares, upon redemption, may be worth more or less than the original cost.
PORTFOLIO COMPOSITION AS OF DECEMBER 31, 2018
Top Holdings
| | | | |
| | | % of
Net Assets | |
| Pool Corp. | | | 2.6 | |
| Aspen Technology, Inc. | | | 2.1 | |
| West Pharmaceutical Services, Inc. | | | 2.0 | |
| Nexstar Media Group, Inc.- Class A | | | 1.7 | |
| Tyler Technologies, Inc. | | | 1.7 | |
| Rollins, Inc. | | | 1.7 | |
| Fair Isaac Corp. | | | 1.7 | |
| Church & Dwight Co., Inc. | | | 1.6 | |
| IDEXX Laboratories, Inc. | | | 1.6 | |
| RBC Bearings, Inc. | | | 1.6 | |
Top Sectors
| | | | |
| | | % of
Net Assets | |
| Information Technology | | | 20.4 | |
| Industrials | | | 17.8 | |
| Financials | | | 16.5 | |
| Health Care | | | 13.5 | |
| Consumer Discretionary | | | 10.6 | |
| Materials | | | 6.2 | |
| Consumer Staples | | | 6.1 | |
| Energy | | | 3.8 | |
| Communication Services | | | 3.0 | |
| Real Estate | | | 0.6 | |
BHFTII-3
Brighthouse Funds Trust II
Neuberger Berman Genesis Portfolio
Understanding Your Portfolio’s Expenses
Shareholder Expense Example
As a shareholder of the Portfolio, you incur ongoing costs, including management fees; distribution and service(12b-1) fees; and other Portfolio expenses. This example is intended to help you understand your ongoing costs (in dollars) (referred to as “expenses”) of investing in the Portfolio and compare these costs with the ongoing costs of investing in other mutual funds. The example is based on an investment of $1,000 invested at the beginning of the period and held for the entire period, July 1, 2018 through December 31, 2018.
Actual Expenses
The first line for each share class of the Portfolio in the table below provides information about actual account values and actual expenses. You may use the information in this line, together with the amount you invested in the particular share class of the Portfolio, to estimate the expenses that you paid over the period. Simply divide your account value by $1,000 (for example, an $8,600 account value divided by $1,000 = 8.6), then multiply the result by the number in the first line under the heading entitled “Expenses Paid During Period” to estimate the expenses you paid on your account during this period.
Hypothetical Example for Comparison Purposes
The second line for each share class of the Portfolio in the table below provides information about hypothetical account values and hypothetical expenses based on the Portfolio’s actual expense ratio and an assumed rate of return of 5% per year before expenses, which is not the Portfolio’s actual return. The hypothetical account values and expenses may not be used to estimate the actual ending account balance or expenses you paid for the period. You may use this information to compare the ongoing costs of investing in the Portfolio and other funds. To do so, compare this 5% hypothetical example with the 5% hypothetical examples that appear in the shareholder reports of the other funds.
Please note that the expenses shown in the table are meant to highlight your ongoing costs only and do not reflect any fees or charges of your variable insurance product or any additional expenses that participants in certain eligible qualified plans may bear relating to the operations of their plan. Therefore, the second line for each share class in the table is useful in comparing ongoing costs only, and will not help you determine the relative total costs of owning different funds. In addition, if these other costs were included, your costs would have been higher.
| | | | | | | | | | | | | | | | | | |
Neuberger Berman Genesis Portfolio
| | | | Annualized
Expense
Ratio | | | Beginning
Account Value
July 1,
2018 | | | Ending
Account Value
December 31,
2018 | | | Expenses Paid
During Period**
July 1, 2018
to
December 31,
2018 | |
Class A (a) | | Actual | | | 0.85 | % | | $ | 1,000.00 | | | $ | 892.70 | | | $ | 4.06 | |
| | Hypothetical* | | | 0.85 | % | | $ | 1,000.00 | | | $ | 1,020.92 | | | $ | 4.33 | |
| | | | | |
Class B (a) | | Actual | | | 1.10 | % | | $ | 1,000.00 | | | $ | 891.60 | | | $ | 5.24 | |
| | Hypothetical* | | | 1.10 | % | | $ | 1,000.00 | | | $ | 1,019.66 | | | $ | 5.60 | |
| | | | | |
Class E (a) | | Actual | | | 1.00 | % | | $ | 1,000.00 | | | $ | 892.20 | | | $ | 4.77 | |
| | Hypothetical* | | | 1.00 | % | | $ | 1,000.00 | | | $ | 1,020.16 | | | $ | 5.09 | |
| * | Hypothetical assumes a rate of return of 5% per year before expenses. |
| ** | Expenses paid are equal to the Portfolio’s annualized expense ratio for the most recent six month period, as shown above, multiplied by the average account value over the period, multiplied by the number of days (184 days) in the most recent fiscal half-year, divided by 365 (to reflect theone-half year period). |
| (a) | The annualized expense ratio shown reflects the impact of the management fee waiver as described in Note 5 of the Notes to Financial Statements. |
BHFTII-4
Brighthouse Funds Trust II
Neuberger Berman Genesis Portfolio
Schedule of Investments as of December 31, 2018
Common Stocks—98.5% of Net Assets
| | | | | | | | |
| Security Description | | Shares | | | Value | |
|
| Aerospace & Defense—0.3% | |
Astronics Corp. (a) | | | 107,636 | | | $ | 3,277,516 | |
| | | | | | | | |
|
| Air Freight & Logistics—0.5% | |
Forward Air Corp. | | | 92,591 | | | | 5,078,616 | |
| | | | | | | | |
|
| Airlines—0.5% | |
Allegiant Travel Co. | | | 50,430 | | | | 5,054,095 | |
| | | | | | | | |
|
| Auto Components—2.0% | |
Fox Factory Holding Corp. (a) | | | 205,780 | | | | 12,114,269 | |
LCI Industries | | | 94,950 | | | | 6,342,660 | |
| | | | | | | | |
| | | | | | | 18,456,929 | |
| | | | | | | | |
|
| Automobiles—0.2% | |
Thor Industries, Inc. | | | 39,340 | | | | 2,045,680 | |
| | | | | | | | |
|
| Banks—11.5% | |
Bank of Hawaii Corp. | | | 192,420 | | | | 12,953,714 | |
Bank OZK | | | 248,476 | | | | 5,672,707 | |
BOK Financial Corp. | | | 112,167 | | | | 8,225,206 | |
Columbia Banking System, Inc. | | | 221,410 | | | | 8,034,969 | |
Community Bank System, Inc. | | | 147,532 | | | | 8,601,116 | |
Cullen/Frost Bankers, Inc. | | | 134,368 | | | | 11,816,322 | |
CVB Financial Corp. | | | 566,665 | | | | 11,463,633 | |
First Financial Bankshares, Inc. | | | 229,645 | | | | 13,248,220 | |
First Hawaiian, Inc. | | | 373,300 | | | | 8,402,983 | |
Glacier Bancorp, Inc. | | | 164,620 | | | | 6,522,244 | |
Lakeland Financial Corp. | | | 81,435 | | | | 3,270,430 | |
LegacyTexas Financial Group, Inc. | | | 186,625 | | | | 5,988,796 | |
PacWest Bancorp | | | 73,123 | | | | 2,433,534 | |
| | | | | | | | |
| | | | | | | 106,633,874 | |
| | | | | | | | |
|
| Beverages—0.7% | |
MGP Ingredients, Inc. | | | 108,190 | | | | 6,172,240 | |
| | | | | | | | |
|
| Biotechnology—0.9% | |
Abcam plc | | | 218,430 | | | | 3,023,735 | |
Emergent BioSolutions, Inc. (a) | | | 95,375 | | | | 5,653,830 | |
| | | | | | | | |
| | | | | | | 8,677,565 | |
| | | | | | | | |
|
| Building Products—1.8% | |
A.O. Smith Corp. | | | 130,215 | | | | 5,560,181 | |
AAON, Inc. | | | 269,637 | | | | 9,453,473 | |
Patrick Industries, Inc. (a) | | | 43,472 | | | | 1,287,206 | |
| | | | | | | | |
| | | | | | | 16,300,860 | |
| | | | | | | | |
|
| Capital Markets—3.3% | |
Artisan Partners Asset Management, Inc. - Class A | | | 126,815 | | | | 2,803,880 | |
BrightSphere Investment Group plc | | | 357,560 | | | | 3,818,741 | |
FactSet Research Systems, Inc. | | | 30,365 | | | | 6,076,947 | |
Houlihan Lokey, Inc. | | | 115,820 | | | | 4,262,176 | |
MarketAxess Holdings, Inc. | | | 64,730 | | | | 13,678,096 | |
| | | | | | | | |
| | | | | | | 30,639,840 | |
| | | | | | | | |
|
| Chemicals—3.1% | |
Chase Corp. | | | 46,285 | | | | 4,630,814 | |
Ingevity Corp. (a) | | | 49,725 | | | | 4,161,485 | |
NewMarket Corp. | | | 13,112 | | | | 5,403,324 | |
Quaker Chemical Corp. | | | 51,150 | | | | 9,089,867 | |
Sensient Technologies Corp. | | | 100,645 | | | | 5,621,023 | |
| | | | | | | | |
| | | | | | | 28,906,513 | |
| | | | | | | | |
|
| Commercial Services & Supplies—3.7% | |
Healthcare Services Group, Inc. | | | 124,054 | | | | 4,984,490 | |
MSA Safety, Inc. | | | 91,230 | | | | 8,600,252 | |
Rollins, Inc. | | | 428,765 | | | | 15,478,416 | |
UniFirst Corp. | | | 36,080 | | | | 5,161,966 | |
| | | | | | | | |
| | | | | | | 34,225,124 | |
| | | | | | | | |
|
| Communications Equipment—1.0% | |
NetScout Systems, Inc. (a) | | | 391,160 | | | | 9,243,111 | |
| | | | | | | | |
|
| Construction & Engineering—0.8% | |
Valmont Industries, Inc. | | | 65,145 | | | | 7,227,838 | |
| | | | | | | | |
|
| Construction Materials—1.0% | |
Eagle Materials, Inc. | | | 145,580 | | | | 8,884,747 | |
| | | | | | | | |
|
| Containers & Packaging—1.3% | |
AptarGroup, Inc. | | | 123,754 | | | | 11,641,539 | |
| | | | | | | | |
|
| Distributors—2.6% | |
Pool Corp. | | | 159,595 | | | | 23,723,797 | |
| | | | | | | | |
|
| Diversified Consumer Services—1.2% | |
Bright Horizons Family Solutions, Inc. (a) | | | 95,975 | | | | 10,696,414 | |
| | | | | | | | |
|
| Electrical Equipment—0.6% | |
AZZ, Inc. | | | 137,080 | | | | 5,532,549 | |
| | | | | | | | |
|
| Electronic Equipment, Instruments & Components—6.1% | |
Cognex Corp. | | | 217,080 | | | | 8,394,484 | |
Littelfuse, Inc. | | | 83,700 | | | | 14,352,876 | |
Nlight, Inc. (a) | | | 94,925 | | | | 1,687,767 | |
Novanta, Inc. (a) | | | 140,140 | | | | 8,828,820 | |
Rogers Corp. (a) | | | 125,690 | | | | 12,450,851 | |
Zebra Technologies Corp. - Class A (a) | | | 66,602 | | | | 10,605,036 | |
| | | | | | | | |
| | | | | | | 56,319,834 | |
| | | | | | | | |
|
| Energy Equipment & Services—1.6% | |
Apergy Corp. (a) | | | 115,700 | | | | 3,133,156 | |
Cactus, Inc. - Class A (a) | | | 135,000 | | | | 3,700,350 | |
Computer Modelling Group, Ltd. | | | 370,905 | | | | 1,645,261 | |
Pason Systems, Inc. | | | 441,845 | | | | 5,921,739 | |
| | | | | | | | |
| | | | | | | 14,400,506 | |
| | | | | | | | |
|
| Food Products—2.7% | |
Calavo Growers, Inc. | | | 85,150 | | | | 6,212,544 | |
J&J Snack Foods Corp. | | | 42,364 | | | | 6,125,411 | |
See accompanying notes to financial statements.
BHFTII-5
Brighthouse Funds Trust II
Neuberger Berman Genesis Portfolio
Schedule of Investments as of December 31, 2018
Common Stocks—(Continued)
| | | | | | | | |
| Security Description | | Shares | | | Value | |
|
| Food Products—(Continued) | |
Lancaster Colony Corp. | | | 72,000 | | | $ | 12,733,920 | |
| | | | | | | | |
| | | | | | | 25,071,875 | |
| | | | | | | | |
|
| Health Care Equipment & Supplies—7.3% | |
Atrion Corp. | | | 9,885 | | | | 7,325,576 | |
Cantel Medical Corp. | | | 121,777 | | | | 9,066,298 | |
Haemonetics Corp. (a) | | | 104,086 | | | | 10,413,804 | |
Heska Corp. (a) | | | 41,605 | | | | 3,582,190 | |
IDEXX Laboratories, Inc. (a) | | | 80,690 | | | | 15,009,954 | |
Neogen Corp. (a) | | | 59,965 | | | | 3,418,005 | |
West Pharmaceutical Services, Inc. | | | 187,681 | | | | 18,398,368 | |
| | | | | | | | |
| | | | | | | 67,214,195 | |
| | | | | | | | |
|
| Health Care Providers & Services—3.0% | |
Chemed Corp. | | | 48,120 | | | | 13,631,433 | |
Henry Schein, Inc. (a) | | | 96,275 | | | | 7,559,513 | |
U.S. Physical Therapy, Inc. | | | 60,865 | | | | 6,229,533 | |
| | | | | | | | |
| | | | | | | 27,420,479 | |
| | | | | | | | |
|
| Hotels, Restaurants & Leisure—1.2% | |
Cheesecake Factory, Inc. (The) | | | 58,300 | | | | 2,536,633 | |
Texas Roadhouse, Inc. | | | 141,820 | | | | 8,466,654 | |
| | | | | | | | |
| | | | | | | 11,003,287 | |
| | | | | | | | |
|
| Household Durables—0.2% | |
Installed Building Products, Inc. (a) | | | 57,065 | | | | 1,922,520 | |
| | | | | | | | |
|
| Household Products—2.7% | |
Church & Dwight Co., Inc. | | | 230,130 | | | | 15,133,349 | |
WD-40 Co. | | | 52,090 | | | | 9,546,013 | |
| | | | | | | | |
| | | | | | | 24,679,362 | |
| | | | | | | | |
|
| Industrial Conglomerates—0.4% | |
Raven Industries, Inc. | | | 107,659 | | | | 3,896,179 | |
| | | | | | | | |
|
| Insurance—1.6% | |
AMERISAFE, Inc. | | | 76,715 | | | | 4,348,973 | |
RLI Corp. | | | 152,630 | | | | 10,529,944 | |
| | | | | | | | |
| | | | | | | 14,878,917 | |
| | | | | | | | |
|
| IT Services—1.4% | |
Jack Henry & Associates, Inc. | | | 100,165 | | | | 12,672,876 | |
| | | | | | | | |
|
| Life Sciences Tools & Services—2.4% | |
Bio-Techne Corp. | | | 101,725 | | | | 14,721,642 | |
ICON plc (a) | | | 55,182 | | | | 7,130,066 | |
| | | | | | | | |
| | | | | | | 21,851,708 | |
| | | | | | | | |
|
| Machinery—5.8% | |
Graco, Inc. | | | 145,265 | | | | 6,079,340 | |
Lindsay Corp. | | | 51,265 | | | | 4,934,256 | |
Middleby Corp. (The) (a) | | | 79,180 | | | | 8,134,162 | |
Nordson Corp. | | | 71,162 | | | | 8,493,185 | |
RBC Bearings, Inc. (a) | | | 112,470 | | | | 14,744,817 | |
|
| Machinery—(Continued) | |
Toro Co. (The) | | | 195,300 | | | | 10,913,364 | |
| | | | | | | | |
| | | | | | | 53,299,124 | |
| | | | | | | | |
|
| Media—3.0% | |
Cable One, Inc. | | | 7,710 | | | | 6,322,971 | |
Gray Television, Inc. (a) | | | 368,280 | | | | 5,428,447 | |
Nexstar Media Group, Inc. - Class A | | | 199,530 | | | | 15,691,039 | |
| | | | | | | | |
| | | | | | | 27,442,457 | |
| | | | | | | | |
|
| Multiline Retail—0.3% | |
Ollie’s Bargain Outlet Holdings, Inc. (a) | | | 49,130 | | | | 3,267,636 | |
| | | | | | | | |
|
| Oil, Gas & Consumable Fuels—2.3% | |
Centennial Resource Development, Inc. - Class A (a) | | | 852,975 | | | | 9,399,784 | |
Matador Resources Co. (a) | | | 356,920 | | | | 5,542,968 | |
WPX Energy, Inc. (a) | | | 528,310 | | | | 5,996,319 | |
| | | | | | | | |
| | | | | | | 20,939,071 | |
| | | | | | | | |
|
| Paper & Forest Products—0.8% | |
Stella-Jones, Inc. | | | 260,870 | | | | 7,568,899 | |
| | | | | | | | |
|
| Professional Services—1.5% | |
Exponent, Inc. | | | 278,627 | | | | 14,129,175 | |
| | | | | | | | |
|
| Real Estate Management & Development—0.6% | |
FirstService Corp. | | | 81,315 | | | | 5,568,451 | |
| | | | | | | | |
|
| Semiconductors & Semiconductor Equipment—3.0% | |
Cabot Microelectronics Corp. | | | 83,105 | | | | 7,924,062 | |
MKS Instruments, Inc. | | | 99,850 | | | | 6,451,308 | |
Power Integrations, Inc. | | | 215,910 | | | | 13,166,192 | |
| | | | | | | | |
| | | | | | | 27,541,562 | |
| | | | | | | | |
|
| Software—8.9% | |
Altair Engineering, Inc. - Class A (a) | | | 138,420 | | | | 3,817,623 | |
Aspen Technology, Inc. (a) | | | 235,340 | | | | 19,340,241 | |
Fair Isaac Corp. (a) | | | 81,760 | | | | 15,289,120 | |
Manhattan Associates, Inc. (a) | | | 337,016 | | | | 14,279,368 | |
Monotype Imaging Holdings, Inc. | | | 56,523 | | | | 877,237 | |
Qualys, Inc. (a) | | | 177,505 | | | | 13,266,724 | |
Tyler Technologies, Inc. (a) | | | 83,305 | | | | 15,479,735 | |
| | | | | | | | |
| | | | | | | 82,350,048 | |
| | | | | | | | |
|
| Specialty Retail—2.9% | |
Asbury Automotive Group, Inc. (a) | | | 64,380 | | | | 4,291,571 | |
Floor & Decor Holdings, Inc. - Class A (a) | | | 126,640 | | | | 3,279,976 | |
Lithia Motors, Inc. - Class A | | | 81,110 | | | | 6,191,126 | |
Monro, Inc. | | | 102,595 | | | | 7,053,406 | |
Tractor Supply Co. | | | 73,140 | | | | 6,102,802 | |
| | | | | | | | |
| | | | | | | 26,918,881 | |
| | | | | | | | |
|
| Trading Companies & Distributors—1.8% | |
Applied Industrial Technologies, Inc. | | | 40,336 | | | | 2,175,724 | |
Richelieu Hardware, Ltd. | | | 155,530 | | | | 2,584,951 | |
See accompanying notes to financial statements.
BHFTII-6
Brighthouse Funds Trust II
Neuberger Berman Genesis Portfolio
Schedule of Investments as of December 31, 2018
Common Stocks—(Continued)
| | | | | | | | |
| Security Description | | Shares/
Principal
Amount* | | | Value | |
|
| Trading Companies & Distributors—(Continued) | |
SiteOne Landscape Supply, Inc. (a) | | | 68,585 | | | $ | 3,790,693 | |
Watsco, Inc. | | | 58,630 | | | | 8,157,778 | |
| | | | | | | | |
| | | | | | | 16,709,146 | |
| | | | | | | | |
Total Common Stocks
(Cost $675,265,048) | | | | | | | 909,485,035 | |
| | | | | | | | |
|
| Short-Term Investment—1.5% | |
|
| Repurchase Agreement—1.5% | |
Fixed Income Clearing Corp.
Repurchase Agreement dated 12/31/18 at 1.200%, due on 01/02/19 with a maturity value of $14,218,159; collateralized by U.S. Treasury Note at 2.875%, maturing 10/31/23, with a market value of $14,506,373. | | | 14,217,211 | | | | 14,217,211 | |
| | | | | | | | |
Total Short-Term Investments
(Cost $14,217,211) | | | | | | | 14,217,211 | |
| | | | | | | | |
Total Investments—100.0%
(Cost $689,482,259) | | | | | | | 923,702,246 | |
Other assets and liabilities (net)—0.0% | | | | | | | (93,454 | ) |
| | | | | | | | |
| Net Assets—100.0% | | | | | | $ | 923,608,792 | |
| | | | | | | | |
| | | | |
| * | | Principal amount stated in U.S. dollars unless otherwise noted. |
| (a) | | Non-income producing security. |
Fair Value Hierarchy
Accounting principles generally accepted in the United States of America (“GAAP”) define fair market value as the price that the Portfolio would receive to sell an asset or pay to transfer a liability in an orderly transaction between market participants at the measurement date. It establishes a fair value hierarchy that prioritizes inputs to valuation methods and requires disclosure of the fair value hierarchy, separately for each major category of assets and liabilities, that segregates fair value measurements into three levels. Levels 1, 2 and 3 of the fair value hierarchy are defined as follows:
Level 1 - unadjusted quoted prices in active markets for identical investments
Level 2 - other significant observable inputs (including, but not limited to, quoted prices for similar assets or liabilities in markets that are either active or inactive; inputs other than quoted prices that are observable such as interest rates, yield curves, volatilities, prepayment speeds, loss severities, credit risks, default rates, or other market corroborated inputs)
Level 3 - significant unobservable inputs based on the best information available in the circumstances, to the extent observable inputs are unavailable (including the Portfolio’s own assumptions used in determining the fair value of investments and derivative financial instruments)
The inputs or methodologies used for valuing investments are not necessarily an indication of the risk associated with investing in them. Changes to the inputs or methodologies used may result in transfers between levels. A reconciliation of Level 3 securities, if any, will be disclosed following the fair value hierarchy table. For more information about the Portfolio’s policy regarding the valuation of investments, please refer to the Notes to Financial Statements.
The following table summarizes the fair value hierarchy of the Portfolio’s investments as of December 31, 2018:
| | | | | | | | | | | | | | | | |
| Description | | Level 1 | | | Level 2 | | | Level 3 | | | Total | |
| Common Stocks | |
Aerospace & Defense | | $ | 3,277,516 | | | $ | — | | | $ | — | | | $ | 3,277,516 | |
Air Freight & Logistics | | | 5,078,616 | | | | — | | | | — | | | | 5,078,616 | |
Airlines | | | 5,054,095 | | | | — | | | | — | | | | 5,054,095 | |
Auto Components | | | 18,456,929 | | | | — | | | | — | | | | 18,456,929 | |
Automobiles | | | 2,045,680 | | | | — | | | | — | | | | 2,045,680 | |
Banks | | | 106,633,874 | | | | — | | | | — | | | | 106,633,874 | |
Beverages | | | 6,172,240 | | | | — | | | | — | | | | 6,172,240 | |
See accompanying notes to financial statements.
BHFTII-7
Brighthouse Funds Trust II
Neuberger Berman Genesis Portfolio
Schedule of Investments as of December 31, 2018
Fair Value Hierarchy—(Continued)
| | | | | | | | | | | | | | | | |
| Description | | Level 1 | | | Level 2 | | | Level 3 | | | Total | |
Biotechnology | | $ | 8,677,565 | | | $ | — | | | $ | — | | | $ | 8,677,565 | |
Building Products | | | 16,300,860 | | | | — | | | | — | | | | 16,300,860 | |
Capital Markets | | | 30,639,840 | | | | — | | | | — | | | | 30,639,840 | |
Chemicals | | | 28,906,513 | | | | — | | | | — | | | | 28,906,513 | |
Commercial Services & Supplies | | | 34,225,124 | | | | — | | | | — | | | | 34,225,124 | |
Communications Equipment | | | 9,243,111 | | | | — | | | | — | | | | 9,243,111 | |
Construction & Engineering | | | 7,227,838 | | | | — | | | | — | | | | 7,227,838 | |
Construction Materials | | | 8,884,747 | | | | — | | | | — | | | | 8,884,747 | |
Containers & Packaging | | | 11,641,539 | | | | — | | | | — | | | | 11,641,539 | |
Distributors | | | 23,723,797 | | | | — | | | | — | | | | 23,723,797 | |
Diversified Consumer Services | | | 10,696,414 | | | | — | | | | — | | | | 10,696,414 | |
Electrical Equipment | | | 5,532,549 | | | | — | | | | — | | | | 5,532,549 | |
Electronic Equipment, Instruments & Components | | | 56,319,834 | | | | — | | | | — | | | | 56,319,834 | |
Energy Equipment & Services | | | 14,400,506 | | | | — | | | | — | | | | 14,400,506 | |
Food Products | | | 25,071,875 | | | | — | | | | — | | | | 25,071,875 | |
Health Care Equipment & Supplies | | | 67,214,195 | | | | — | | | | — | | | | 67,214,195 | |
Health Care Providers & Services | | | 27,420,479 | | | | — | | | | — | | | | 27,420,479 | |
Hotels, Restaurants & Leisure | | | 11,003,287 | | | | — | | | | — | | | | 11,003,287 | |
Household Durables | | | 1,922,520 | | | | — | | | | — | | | | 1,922,520 | |
Household Products | | | 24,679,362 | | | | — | | | | — | | | | 24,679,362 | |
Industrial Conglomerates | | | 3,896,179 | | | | — | | | | — | | | | 3,896,179 | |
Insurance | | | 14,878,917 | | | | — | | | | — | | | | 14,878,917 | |
IT Services | | | 12,672,876 | | | | — | | | | — | | | | 12,672,876 | |
Life Sciences Tools & Services | | | 21,851,708 | | | | — | | | | — | | | | 21,851,708 | |
Machinery | | | 53,299,124 | | | | — | | | | — | | | | 53,299,124 | |
Media | | | 27,442,457 | | | | — | | | | — | | | | 27,442,457 | |
Multiline Retail | | | 3,267,636 | | | | — | | | | — | | | | 3,267,636 | |
Oil, Gas & Consumable Fuels | | | 20,939,071 | | | | — | | | | — | | | | 20,939,071 | |
Paper & Forest Products | | | — | | | | 7,568,899 | | | | — | | | | 7,568,899 | |
Professional Services | | | 14,129,175 | | | | — | | | | — | | | | 14,129,175 | |
Real Estate Management & Development | | | 5,568,451 | | | | — | | | | — | | | | 5,568,451 | |
Semiconductors & Semiconductor Equipment | | | 27,541,562 | | | | — | | | | — | | | | 27,541,562 | |
Software | | | 82,350,048 | | | | — | | | | — | | | | 82,350,048 | |
Specialty Retail | | | 26,918,881 | | | | — | | | | — | | | | 26,918,881 | |
Trading Companies & Distributors | | | 14,124,195 | | | | 2,584,951 | | | | — | | | | 16,709,146 | |
Total Common Stocks | | | 899,331,185 | | | | 10,153,850 | | | | — | | | | 909,485,035 | |
Total Short-Term Investment* | | | — | | | | 14,217,211 | | | | — | | | | 14,217,211 | |
Total Investments | | $ | 899,331,185 | | | $ | 24,371,061 | | | $ | — | | | $ | 923,702,246 | |
| | | | | | | | | | | | | | | | | |
| | | | |
| * | | See Schedule of Investments for additional detailed categorizations. |
See accompanying notes to financial statements.
BHFTII-8
Brighthouse Funds Trust II
Neuberger Berman Genesis Portfolio
Statement of Assets and Liabilities
December 31, 2018
| | | | |
Assets | |
Investments at value (a) | | $ | 923,702,246 | |
Cash | | | 49,663 | |
Receivable for: | |
Investments sold | | | 169,383 | |
Fund shares sold | | | 893,802 | |
Dividends and interest | | | 325,582 | |
Prepaid expenses | | | 2,894 | |
| | | | |
Total Assets | | | 925,143,570 | |
Liabilities | |
Payables for: | |
Investments purchased | | | 292,275 | |
Fund shares redeemed | | | 205,630 | |
Accrued Expenses: | |
Management fees | | | 656,116 | |
Distribution and service fees | | | 69,141 | |
Deferred trustees’ fees | | | 138,370 | |
Other expenses | | | 173,246 | |
| | | | |
Total Liabilities | | | 1,534,778 | |
| | | | |
Net Assets | | $ | 923,608,792 | |
| | | | |
Net Assets Consist of: | |
Paid in surplus | | $ | 546,746,009 | |
Distributable earnings (Accumulated losses) | | | 376,862,783 | |
| | | | |
Net Assets | | $ | 923,608,792 | |
| | | | |
Net Assets | |
Class A | | $ | 577,566,359 | |
Class B | | | 271,718,657 | |
Class E | | | 74,323,776 | |
Capital Shares Outstanding* | |
Class A | | | 31,119,416 | |
Class B | | | 14,942,232 | |
Class E | | | 4,060,666 | |
Net Asset Value, Offering Price and Redemption Price Per Share | |
Class A | | $ | 18.56 | |
Class B | | | 18.18 | |
Class E | | | 18.30 | |
| | | | |
| * | | The Portfolio is authorized to issue an unlimited number of shares. |
| (a) | | Identified cost of investments was $689,482,259. |
Statement of Operations
Year Ended December 31, 2018
| | | | |
Investment Income | |
Dividends (a) | | $ | 12,178,649 | |
Interest | | | 84,699 | |
| | | | |
Total investment income | | | 12,263,348 | |
Expenses | |
Management fees | | | 9,141,695 | |
Administration fees | | | 42,162 | |
Custodian and accounting fees | | | 98,197 | |
Distribution and service fees—Class B | | | 810,236 | |
Distribution and service fees—Class E | | | 134,406 | |
Audit and tax services | | | 43,558 | |
Legal | | | 45,316 | |
Trustees’ fees and expenses | | | 33,734 | |
Shareholder reporting | | | 145,655 | |
Insurance | | | 7,274 | |
Miscellaneous | | | 21,037 | |
| | | | |
Total expenses | | | 10,523,270 | |
Less management fee waiver | | | (125,000 | ) |
Less broker commission recapture | | | (43,423 | ) |
| | | | |
Net expenses | | | 10,354,847 | |
| | | | |
Net Investment Income | | | 1,908,501 | |
| | | | |
Net Realized and Unrealized Gain (Loss) | |
| Net realized gain (loss) on: | |
Investments | | | 141,694,885 | |
Foreign currency transactions | | | (4,771 | ) |
| | | | |
Net realized gain | | | 141,690,114 | |
| | | | |
Net change in unrealized depreciation on investments | | | (200,862,363 | ) |
| | | | |
Net realized and unrealized loss | | | (59,172,249 | ) |
| | | | |
Net Decrease in Net Assets From Operations | | $ | (57,263,748 | ) |
| | | | |
| | | | |
| (a) | | Net of foreign withholding taxes of $82,110. |
See accompanying notes to financial statements.
BHFTII-9
Brighthouse Funds Trust II
Neuberger Berman Genesis Portfolio
Statements of Changes in Net Assets
| | | | | | | | |
| | | Year Ended
December 31,
2018 | | | Year Ended
December 31,
2017 | |
Increase (Decrease) in Net Assets: | |
From Operations | |
Net investment income | | $ | 1,908,501 | | | $ | 3,233,517 | |
Net realized gain | | | 141,690,114 | | | | 134,565,500 | |
Net change in unrealized appreciation (depreciation) | | | (200,862,363 | ) | | | 35,165,604 | |
| | | | | | | | |
Increase (decrease) in net assets from operations | | | (57,263,748 | ) | | | 172,964,621 | |
| | | | | | | | |
From Distributions to Shareholders (a) | |
Class A | | | (86,103,283 | ) | | | (63,931,407 | ) |
Class B | | | (40,710,795 | ) | | | (27,905,972 | ) |
Class E | | | (11,303,616 | ) | | | (7,776,023 | ) |
| | | | | | | | |
Total distributions | | | (138,117,694 | ) | | | (99,613,402 | ) |
| | | | | | | | |
Decrease in net assets from capital share transactions | | | (84,603,711 | ) | | | (60,762,640 | ) |
| | | | | | | | |
Total increase (decrease) in net assets | | | (279,985,153 | ) | | | 12,588,579 | |
|
Net Assets | |
Beginning of period | | | 1,203,593,945 | | | | 1,191,005,366 | |
| | | | | | | | |
End of period | | $ | 923,608,792 | | | $ | 1,203,593,945 | (b) |
| | | | | | | | |
Other Information:
Capital Shares
Transactions in capital shares were as follows:
| | | | | | | | | | | | | | | | |
| | | Year Ended
December 31, 2018 | | | Year Ended
December 31, 2017 | |
| | | Shares | | | Value | | | Shares | | | Value | |
Class A | |
Sales | | | 618,063 | | | $ | 12,532,116 | | | | 545,697 | | | $ | 11,693,079 | |
Reinvestments | | | 4,053,827 | | | | 86,103,283 | | | | 3,088,474 | | | | 63,931,407 | |
Redemptions | | | (7,552,333 | ) | | | (170,531,944 | ) | | | (5,394,723 | ) | | | (117,602,380 | ) |
| | | | | | | | | | | | | | | | |
Net decrease | | | (2,880,443 | ) | | $ | (71,896,545 | ) | | | (1,760,552 | ) | | $ | (41,977,894 | ) |
| | | | | | | | | | | | | | | | |
Class B | |
Sales | | | 515,822 | | | $ | 10,612,459 | | | | 507,997 | | | $ | 10,710,432 | |
Reinvestments | | | 1,953,493 | | | | 40,710,795 | | | | 1,370,628 | | | | 27,905,972 | |
Redemptions | | | (2,807,089 | ) | | | (60,981,769 | ) | | | (2,440,824 | ) | | | (51,897,130 | ) |
| | | | | | | | | | | | | | | | |
Net decrease | | | (337,774 | ) | | $ | (9,658,515 | ) | | | (562,199 | ) | | $ | (13,280,726 | ) |
| | | | | | | | | | | | | | | | |
Class E | |
Sales | | | 36,138 | | | $ | 713,830 | | | | 41,800 | | | $ | 888,318 | |
Reinvestments | | | 539,295 | | | | 11,303,616 | | | | 379,874 | | | | 7,776,023 | |
Redemptions | | | (692,542 | ) | | | (15,066,097 | ) | | | (661,383 | ) | | | (14,168,361 | ) |
| | | | | | | | | | | | | | | | |
Net decrease | | | (117,109 | ) | | $ | (3,048,651 | ) | | | (239,709 | ) | | $ | (5,504,020 | ) |
| | | | | | | | | | | | | | | | |
Decrease derived from capital shares transactions | | | | | | $ | (84,603,711 | ) | | | | | | $ | (60,762,640 | ) |
| | | | | | | | | | | | | | | | |
| | | | |
| (a) | | Distributions from net investment income and realized gains are no longer required to be separately disclosed. The presentation for the year ended December 31, 2018 has been adjusted for this change (See Note 8). At December 31, 2017 the distributions were as follows. |
| | | | | | | | |
| | | Distributions from net
investment income: | | | Distributions from realized
capital gains: | |
Class A | | $ | (3,068,174 | ) | | $ | (60,863,233 | ) |
Class B | | | (583,870 | ) | | | (27,322,102 | ) |
Class E | | | (247,513 | ) | | | (7,528,510 | ) |
| | | | |
| (b) | | As part of the update in (a), it is also no longer required to disclose the Undistributed net investment income (Accumulated losses) which was $2,967,503 as of December 31, 2017. |
See accompanying notes to financial statements.
BHFTII-10
Brighthouse Funds Trust II
Neuberger Berman Genesis Portfolio
Financial Highlights
| | | | | | | | | | | | | | | | | | | | |
| Selected per share data | |
| | | Class A | |
| | | Year Ended December 31, | |
| | | 2018 | | | 2017 | | | 2016 | | | 2015 | | | 2014 | |
Net Asset Value, Beginning of Period | | $ | 22.65 | | | $ | 21.38 | | | $ | 18.10 | | | $ | 18.07 | | | $ | 18.14 | |
| | | | | | | | | | | | | | | | | | | | |
Income (Loss) from Investment Operations | |
Net investment income (a) | | | 0.06 | | | | 0.08 | | | | 0.08 | (b) | | | 0.08 | | | | 0.08 | |
Net realized and unrealized gain (loss) | | | (1.21 | ) | | | 3.11 | | | | 3.29 | | | | 0.03 | | | | (0.08 | ) |
| | | | | | | | | | | | | | | | | | | | |
Total income (loss) from investment operations | | | (1.15 | ) | | | 3.19 | | | | 3.37 | | | | 0.11 | | | | 0.00 | |
| | | | | | | | | | | | | | | | | | | | |
Less Distributions | |
Distributions from net investment income | | | (0.08 | ) | | | (0.09 | ) | | | (0.09 | ) | | | (0.08 | ) | | | (0.07 | ) |
Distributions from net realized capital gains | | | (2.86 | ) | | | (1.83 | ) | | | 0.00 | | | | 0.00 | �� | | | 0.00 | |
| | | | | | | | | | | | | | | | | | | | |
Total distributions | | | (2.94 | ) | | | (1.92 | ) | | | (0.09 | ) | | | (0.08 | ) | | | (0.07 | ) |
| | | | | | | | | | | | | | | | | | | | |
Net Asset Value, End of Period | | $ | 18.56 | | | $ | 22.65 | | | $ | 21.38 | | | $ | 18.10 | | | $ | 18.07 | |
| | | | | | | | | | | | | | | | | | | | |
Total Return (%) (c) | | | (6.70 | ) | | | 15.75 | | | | 18.68 | | | | 0.58 | | | | 0.01 | |
|
Ratios/Supplemental Data | |
Gross ratio of expenses to average net assets (%) | | | 0.86 | | | | 0.85 | | | | 0.85 | | | | 0.84 | | | | 0.83 | |
Net ratio of expenses to average net assets (%) (d) | | | 0.84 | | | | 0.84 | | | | 0.84 | | | | 0.83 | | | | 0.83 | |
Ratio of net investment income to average net assets (%) | | | 0.25 | | | | 0.36 | | | | 0.43 | (b) | | | 0.42 | | | | 0.43 | |
Portfolio turnover rate (%) | | | 12 | | | | 17 | | | | 19 | | | | 16 | | | | 9 | |
Net assets, end of period (in millions) | | $ | 577.6 | | | $ | 770.2 | | | $ | 764.5 | | | $ | 814.6 | | | $ | 985.8 | |
| |
| | | Class B | |
| | | Year Ended December 31, | |
| | | 2018 | | | 2017 | | | 2016 | | | 2015 | | | 2014 | |
Net Asset Value, Beginning of Period | | $ | 22.25 | | | $ | 21.03 | | | $ | 17.80 | | | $ | 17.76 | | | $ | 17.85 | |
| | | | | | | | | | | | | | | | | | | | |
Income (Loss) from Investment Operations | |
Net investment income (a) | | | 0.00 | (e) | | | 0.02 | | | | 0.04 | (b) | | | 0.03 | | | | 0.03 | |
Net realized and unrealized gain (loss) | | | (1.19 | ) | | | 3.07 | | | | 3.23 | | | | 0.04 | | | | (0.08 | ) |
| | | | | | | | | | | | | | | | | | | | |
Total income (loss) from investment operations | | | (1.19 | ) | | | 3.09 | | | | 3.27 | | | | 0.07 | | | | (0.05 | ) |
| | | | | | | | | | | | | | | | | | | | |
Less Distributions | |
Distributions from net investment income | | | (0.02 | ) | | | (0.04 | ) | | | (0.04 | ) | | | (0.03 | ) | | | (0.04 | ) |
Distributions from net realized capital gains | | | (2.86 | ) | | | (1.83 | ) | | | 0.00 | | | | 0.00 | | | | 0.00 | |
| | | | | | | | | | | | | | | | | | | | |
Total distributions | | | (2.88 | ) | | | (1.87 | ) | | | (0.04 | ) | | | (0.03 | ) | | | (0.04 | ) |
| | | | | | | | | | | | | | | | | | | | |
Net Asset Value, End of Period | | $ | 18.18 | | | $ | 22.25 | | | $ | 21.03 | | | $ | 17.80 | | | $ | 17.76 | |
| | | | | | | | | | | | | | | | | | | | |
Total Return (%) (c) | | | (6.98 | ) | | | 15.49 | | | | 18.39 | | | | 0.38 | | | | (0.30 | ) |
|
Ratios/Supplemental Data | |
Gross ratio of expenses to average net assets (%) | | | 1.11 | | | | 1.10 | | | | 1.10 | | | | 1.09 | | | | 1.08 | |
Net ratio of expenses to average net assets (%) (d) | | | 1.09 | | | | 1.09 | | | | 1.09 | | | | 1.08 | | | | 1.08 | |
Ratio of net investment income to average net assets (%) | | | 0.01 | | | | 0.11 | | | | 0.19 | (b) | | | 0.17 | | | | 0.18 | |
Portfolio turnover rate (%) | | | 12 | | | | 17 | | | | 19 | | | | 16 | | | | 9 | |
Net assets, end of period (in millions) | | $ | 271.7 | | | $ | 339.9 | | | $ | 333.1 | | | $ | 321.7 | | | $ | 366.8 | |
Please see following page for Financial Highlights footnote legend.
See accompanying notes to financial statements.
BHFTII-11
Brighthouse Funds Trust II
Neuberger Berman Genesis Portfolio
Financial Highlights
| | | | | | | | | | | | | | | | | | | | |
| Selected per share data | |
| | | Class E | |
| | | Year Ended December 31, | |
| | | 2018 | | | 2017 | | | 2016 | | | 2015 | | | 2014 | |
Net Asset Value, Beginning of Period | | $ | 22.38 | | | $ | 21.14 | | | $ | 17.89 | | | $ | 17.86 | | | $ | 17.94 | |
| | | | | | | | | | | | | | | | | | | | |
Income (Loss) from Investment Operations | |
Net investment income (a) | | | 0.02 | | | | 0.04 | | | | 0.05 | (b) | | | 0.05 | | | | 0.05 | |
Net realized and unrealized gain (loss) | | | (1.19 | ) | | | 3.09 | | | | 3.26 | | | | 0.03 | | | | (0.09 | ) |
| | | | | | | | | | | | | | | | | | | | |
Total income (loss) from investment operations | | | (1.17 | ) | | | 3.13 | | | | 3.31 | | | | 0.08 | | | | (0.04 | ) |
| | | | | | | | | | | | | | | | | | | | |
Less Distributions | |
Distributions from net investment income | | | (0.05 | ) | | | (0.06 | ) | | | (0.06 | ) | | | (0.05 | ) | | | (0.04 | ) |
Distributions from net realized capital gains | | | (2.86 | ) | | | (1.83 | ) | | | 0.00 | | | | 0.00 | | | | 0.00 | |
| | | | | | | | | | | | | | | | | | | | |
Total distributions | | | (2.91 | ) | | | (1.89 | ) | | | (0.06 | ) | | | (0.05 | ) | | | (0.04 | ) |
| | | | | | | | | | | | | | | | | | | | |
Net Asset Value, End of Period | | $ | 18.30 | | | $ | 22.38 | | | $ | 21.14 | | | $ | 17.89 | | | $ | 17.86 | |
| | | | | | | | | | | | | | | | | | | | |
Total Return (%) (c) | | | (6.89 | ) | | | 15.61 | | | | 18.54 | | | | 0.43 | | | | (0.19 | ) |
|
Ratios/Supplemental Data | |
Gross ratio of expenses to average net assets (%) | | | 1.01 | | | | 1.00 | | | | 1.00 | | | | 0.99 | | | | 0.98 | |
Net ratio of expenses to average net assets (%) (d) | | | 0.99 | | | | 0.99 | | | | 0.99 | | | | 0.98 | | | | 0.98 | |
Ratio of net investment income to average net assets (%) | | | 0.11 | | | | 0.21 | | | | 0.29 | (b) | | | 0.27 | | | | 0.28 | |
Portfolio turnover rate (%) | | | 12 | | | | 17 | | | | 19 | | | | 16 | | | | 9 | |
Net assets, end of period (in millions) | | $ | 74.3 | | | $ | 93.5 | | | $ | 93.4 | | | $ | 89.3 | | | $ | 103.6 | |
| | | | |
| (a) | | Per share amounts based on average shares outstanding during the period. |
| (b) | | Net investment income per share and the ratio of net investment income to average net assets include anon-recurring refund for overbilling of prior years’ custodianout-of-pocket fees which amounted to less than $0.01 per share and 0.02% of average net assets, respectively. |
| (c) | | Total return does not reflect any insurance, sales, separate account or administrative charges of variable annuity or life insurance contracts or any additional expenses that contract owners may bear under their variable contracts. If these charges were included, the returns would be lower. |
| (d) | | Includes the effects of management fee waivers (see Note 5 of the Notes to Financial Statements). |
| (e) | | Net investment income was less than $0.01. |
See accompanying notes to financial statements.
BHFTII-12
Brighthouse Funds Trust II
Neuberger Berman Genesis Portfolio
Notes to Financial Statements—December 31, 2018
1. Organization
Brighthouse Funds Trust II (the “Trust”) is organized as a Delaware statutory trust and registered under the Investment Company Act of 1940, as amended (the “1940 Act”), as anopen-end management investment company. The Trust, which is managed by Brighthouse Investment Advisers, LLC (“Brighthouse Investment Advisers” or the “Adviser”), currently offers twenty-nine series, each of which operates as a distinct investment vehicle of the Trust. The series included in this report is Neuberger Berman Genesis Portfolio (the “Portfolio”), which is diversified. Shares in the Portfolio are not offered directly to the general public and are currently available only to separate accounts established by life insurance companies affiliated with the Adviser and Metropolitan Life Insurance Company (the “Insurance Companies”).
The Portfolio has registered and offers three classes of shares: Class A, B and E shares. Shares of each Class of the Portfolio represent an equal pro rata interest in the Portfolio and generally give the shareholder the same voting, dividend, liquidation, and other rights. Investment income, realized and unrealized capital gains and losses, the common expenses of the Portfolio, and certain Portfolio-level expense reductions, if any, are allocated on a pro rata basis to each Class based on the relative net assets of each Class to the net assets of the Portfolio. Each Class of shares differs in its respective distribution plan and such distribution expenses are allocated to the corresponding Class of shares.
2. Significant Accounting Policies
The preparation of financial statements in conformity with accounting principles generally accepted in the United States of America (“GAAP”) requires management to make estimates and assumptions that affect the reported amounts of assets and liabilities and disclosure of contingent assets and liabilities as of the date of the financial statements and the reported amounts of income and expenses during the reporting period. Actual results could differ from those estimates. In the preparation of these financial statements, management has evaluated events and transactions subsequent to December 31, 2018 through the date the financial statements were issued.
The Portfolio is an investment company and follows the accounting and reporting guidance of the Financial Accounting Standards Board (“FASB”) Accounting Standards Codification Topic946- Financial Services- Investment Companies. The following is a summary of significant accounting policies consistently followed by the Portfolio in the preparation of its financial statements.
Investment Valuation and Fair Value Measurements - The Portfolio values its portfolio investments for purposes of calculating its net asset value (“NAV”) using procedures approved by the Board of Trustees of the Trust (the “Board” or “Trustees”). Those procedures allow for a variety of methodologies to be used to value the Portfolio’s investments. The specific methodologies used for a particular investment may vary based on the market data available for a specific investment at the time the Portfolio calculates its NAV or based on other considerations. The procedures also permit a level of judgment to be used in the valuation process. The Portfolio follows the accounting and reporting guidance of FASB Accounting Standards Codification Topic820- Fair Value Measurement.
Domestic and foreign equity securities, such as common stock, exchange-traded funds, rights, warrants, and preferred stock, that are traded on a securities exchange on a valuation date are generally valued at their last quoted sale price or official closing price on the primary exchange for such security, or, if no sales occurred on that day, at the last reported bid price. Equity securities tradedover-the-counter (“OTC”) are generally valued at the last reported bid price. In the event of a major exchange closing during the trading day, the Adviser may use other market information obtained from quotation reporting systems, established market makers, or pricing services in valuing the securities. Valuation adjustments may be applied to certain foreign equity securities that are traded solely on foreign exchanges that close before the time as of which the Portfolio determines its NAV to account for the market movement between the close of the foreign exchanges and the time as of which the Portfolio determines its NAV. The Portfolio may use a systematic fair valuation model provided by a pricing service to value securities principally traded in these foreign markets in order to adjust for possible market movements or other changes that may occur between the close of the foreign exchanges and the time as of which the Portfolio determines its NAV. Foreign equity securities valued using these valuation adjustments are generally categorized as Level 2 within the fair value hierarchy. Equity securities that are actively traded, and have no valuation adjustments applied, are categorized as Level 1 within the fair value hierarchy. Other equity securities traded on inactive markets, or valued in reference to similar instruments traded on active markets, are generally categorized as Level 2 within the fair value hierarchy.
Investments in registeredopen-end management investment companies are valued at reported NAV per share on the valuation date and are categorized as Level 1 within the fair value hierarchy.
Debt securities, including corporate, convertible and municipal bonds and notes; obligations of the U.S. Treasury and U.S. government agencies; foreign sovereign issues; andnon-U.S. bonds, are generally valued on the basis of evaluated or composite bid quotations obtained from independent pricing services and/or brokers and dealers selected by the Adviser (each a “pricing service”), pursuant to the authorization of and subject to general oversight by the Board. Such pricing services may use matrix pricing, which considers observable inputs including, among other things, issuer details, maturity dates, interest rates, yield curves, rates of prepayment, credit risks/spreads, default rates, reported trades, broker-dealer quotes and quoted prices for similar assets. Short-term obligations with a
BHFTII-13
Brighthouse Funds Trust II
Neuberger Berman Genesis Portfolio
Notes to Financial Statements—December 31, 2018—(Continued)
remaining maturity of sixty days or less may be valued at amortized cost in the absence of market quotes, so long as the amortized cost value of such short-term debt instrument is approximately the same as the fair value of the instrument as determined without the use of amortized cost valuation. Floating rate loans are generally valued on the basis of an evaluated or composite average of aggregate bid and ask quotations supplied by brokers or dealers, as obtained from the pricing service. Securities that use similar valuation techniques and inputs as described above are generally categorized as Level 2 within the fair value hierarchy.
Options, whether on securities, indices, futures contracts, or otherwise, traded on exchanges are valued at the last sale price available as of the close of business on a valuation day or, if there is no such price available, at the last reported bid price. These types of options are categorized as Level 1 within the fair value hierarchy. Futures contracts that are traded on commodity exchanges are valued at their settlement prices established by the exchanges on which they are traded as of the close of such exchanges and are categorized as Level 1 within the fair value hierarchy.
If no current market value quotation or other observable inputs are readily available or market value quotations are deemed to be unreliable for an investment, the fair value of the investment will be determined in accordance with procedures approved by, and under the general supervision of, the Board. In such a circumstance, the Board will be assisted in its responsibility to determine the fair value of an investment by the Valuation Committee (“Committee”) of Brighthouse Investment Advisers. The Committee provides general pricing oversight and fair value pricing determinations related to portfolio securities and meets on a regular basis to review reports relating to the valuation of the securities in the Portfolio. The Board has delegated to State Street Bank and Trust Company, the Trust’s custodian (“Custodian”), the responsibility for calculating the NAVs of the Trust’s Portfolios. The Committee is responsible for overseeing the calculation of the NAVs of the Portfolios by the custodian. The Committee also periodically reviews pricing services, including the pricing services providing fair value pricing for the Portfolio’s foreign securities, and is responsible for overseeing the correction of pricing errors and addressing other pricing issues that arise in the ordinary course of business, such as making real-time fair value determinations, as necessary.
No single standard for determining the fair value of an investment can be set forth because fair value depends upon the facts and circumstances with respect to each investment. Information relating to any relevant factors may be obtained by the Committee from any appropriate source, including the subadviser of the Portfolio, the custodian, a pricing service, market maker and/or broker for such security or the issuer. Appropriate methodologies for determining fair value under particular circumstances may include: matrix pricing, a discounted cash flow analysis, comparisons of securities with comparable characteristics, value based on multiples of earnings, discount from market price of similar marketable securities, or a combination of these and other methods.
Investment Transactions and Related Investment Income - Portfolio security transactions are recorded on the trade date. Dividend income is recorded on theex-dividend date or, for certain foreign securities, when notified. Interest income, which includes amortization of premium and accretion of discount on debt securities, is recorded on the accrual basis. Realized gains and losses on investments are determined on the identified cost basis, which is the same basis used for federal income tax purposes. Foreign income and foreign capital gains on some foreign securities may be subject to foreign taxes, which are accrued as applicable. These foreign taxes have been provided for in accordance with the Portfolio’s understanding of the applicable countries’ tax rules and rates.
Foreign Currency Translation - The books and records of the Portfolio are maintained in U.S. dollars. The values of securities, currencies, and other assets and liabilities denominated in currencies other than the U.S. dollar are translated into U.S. dollars based upon foreign exchange rates prevailing at the end of the period. Purchases and sales of investment securities, income, and expenses are translated on the respective dates of such transactions. Because the values of investment securities are translated at the foreign exchange rates prevailing at the end of the period, that portion of the results of operations arising from changes in exchange rates and that portion of the results of operations reflecting fluctuations arising from changes in market prices of the investment securities are not separated. Such fluctuations are included in the net realized and unrealized gain or loss on investments.
Net realized foreign exchange gains or losses arise from activity in forward foreign currency exchange contracts, sales of foreign currency, currency gains or losses realized between the trade and settlement dates on securities transactions, and the difference between the amounts of dividends, interest, and foreign withholding taxes recorded by the Portfolio and the U.S. dollar-equivalent of the amounts actually received or paid by the Portfolio. Net unrealized foreign exchange gains and losses arise from changes in the value of assets and liabilities, other than investment securities, resulting from changes in foreign exchange rates.
Dividends and Distributions to Shareholders -The Portfolio records dividends and distributions on theex-dividend date. Net realized gains from securities transactions (if any) are generally distributed annually to shareholders. The timing and characterization of certain income and capital gains distributions are determined in accordance with federal tax regulations that may differ from GAAP. Permanent book and tax basis differences relating to shareholder distributions will result in reclassification between distributable earnings (accumulated losses) andpaid-in surplus. These adjustments have no impact on net assets or the results of operations.
Income Taxes -It is the Portfolio’s policy to comply with the requirements of the Internal Revenue Code of 1986, as amended, and regulations thereunder, applicable to regulated investment companies, and to distribute, with respect to each taxable year, all of its taxable income to shareholders. Therefore, no federal income tax provision is required. The Portfolio files U.S. federal tax returns. No
BHFTII-14
Brighthouse Funds Trust II
Neuberger Berman Genesis Portfolio
Notes to Financial Statements—December 31, 2018—(Continued)
income tax returns are currently under examination. The Portfolio’s federal tax returns for the prior three fiscal years remain subject to examination by the Internal Revenue Service. As of December 31, 2018, the Portfolio had no uncertain tax positions that would require financial statement recognition, or derecognition or disclosure.
Directed Brokerage Agreement - The Trust has entered into a directed brokerage arrangement with Capital Institutional Services, Inc. (“CAPIS”). Under this arrangement, the Portfolio directs certain trades to CAPIS in return for a recapture credit. CAPIS issues a cash rebate to the Portfolio. Amounts paid to the Portfolio are shown separately as broker commission recapture on the Statement of Operations of the Portfolio. Additionally, these amounts have been excluded from the calculation of the net ratio of expenses to average net assets presented in the Financial Highlights for each share class.
Repurchase Agreements -The Portfolio may enter into repurchase agreements, under the terms of a Master Repurchase Agreement (“MRA”), with selected commercial banks and broker-dealers, under which the Portfolio acquires securities as collateral and agrees to resell the securities at an agreed-upon time and at an agreed-upon price. The Portfolio, through the Custodian or a subcustodian, under atri-party repurchase agreement, receives delivery of the underlying securities collateralizing any repurchase agreements. It is the Portfolio’s policy that the market value of the collateral be equal to at least 100% of the repurchase price in the case of a repurchase agreement ofone-day duration and equal to at least 102% of the repurchase price in the case of all other repurchase agreements. In the event of default or failure by a party to perform an obligation in connection with any repurchase transaction, the MRA gives thenon-defaulting party the right toset-off claims and to apply property held by it in connection with any repurchase transaction against obligations owed to it.
At December 31, 2018, the Portfolio had investments in repurchase agreements with a gross value of $14,217,211, which is included as part of investments at value on the Statement of Assets and Liabilities. The value of the related collateral exceeded the value of the repurchase agreements at December 31, 2018.
3. Certain Risks
In the normal course of business, the Portfolio invests in securities and enters into transactions where risks exist. Those risks include:
Market Risk:The value of securities held by the Portfolio may decline in response to certain events, including those directly involving the issuers whose securities are owned by the Portfolio; conditions affecting the general economy; overall market changes; local, regional or global political, social or economic instability; and currency, interest rate, and price fluctuations.
Credit and Counterparty Risk: The Portfolio may be exposed to counterparty risk, or the risk that an entity with which the Portfolio has unsettled or open transactions may default. The potential loss could exceed the value of the financial assets and liabilities recorded in the financial statements. Financial assets that potentially expose the Portfolio to credit and counterparty risk consist principally of cash due from counterparties and investments. The Portfolio manages counterparty risk by entering into agreements only with counterparties that it believes have the financial resources to honor their obligations and by monitoring the financial stability of those counterparties. The Adviser attempts to mitigate counterparty risk by (i) periodically assessing the creditworthiness of its trading partners, (ii) monitoring and/or limiting the amount of its net exposure to each individual counterparty based on its assessment, and (iii) requiring collateral from the counterparty for certain transactions. In order to preserve certain safeguards fornon-standard settlement trades, the Portfolio restricts its exposure to credit and counterparty losses by entering into master netting agreements (“Master Agreements”) with counterparties (approved brokers) with whom it undertakes a significant volume of transactions. Master Agreements govern the terms of certain transactions, and reduce the counterparty risk associated with relevant transactions by specifying credit protection mechanisms and providing standardization that improves legal certainty. Master Agreements can also help limit counterparty risk by specifying collateral posting arrangements atpre-arranged exposure levels.
Repurchase and reverse repurchase agreements are primarily executed under Global Master Repurchase Agreements (“GMRAs”) or Master Repurchase Agreements (“MRAs”), which provide the rights toset-off. Each repurchase and reverse repurchase agreement is initially collateralized at the transaction level. In the event of default, the total market value exposure will be offset against collateral exchanged to date, which would result in a net receivable/(payable) that would be due from/to the counterparty.
Additional risks associated with each type of investment are described above within the respective security type notes. The Portfolio’s prospectus includes a discussion of the principal risks of investing in the Portfolio.
4. Investment Transactions
Aggregate cost of purchases and proceeds of sales of investment securities, excluding short-term securities, for the year ended December 31, 2018 were as follows:
| | | | | | | | | | | | |
Purchases | | | Sales | |
U.S. Government | | Non-U.S. Government | | | U.S. Government | | | Non-U.S. Government | |
| $0 | | $ | 132,105,182 | | | $ | 0 | | | $ | 353,282,032 | |
BHFTII-15
Brighthouse Funds Trust II
Neuberger Berman Genesis Portfolio
Notes to Financial Statements—December 31, 2018—(Continued)
5. Investment Management Fees and Other Transactions with Affiliates
Investment Management Agreement -Brighthouse Investment Advisers is the investment adviser to the Portfolio. The Trust has entered into an investment management agreement with Brighthouse Investment Advisers with respect to the Portfolio. For providing investment management services to the Portfolio, Brighthouse Investment Advisers receives monthly compensation at the following annual rates:
| | | | | | |
Management
Fees earned by
Brighthouse
Investment Advisers
for the year ended
December 31, 2018 | | % per annum | | | Average daily net assets |
| $9,141,695 | | | 0.850 | % | | Of the first $500 million |
| | | 0.800 | % | | Of the next $500 million |
| | | 0.750 | % | | On amounts in excess of $1 billion |
Brighthouse Investment Advisers has entered into an investment subadvisory agreement with respect to managing the Portfolio. Neuberger Berman Management LLC (the “Subadviser”) is compensated by Brighthouse Investment Advisers to provide subadvisory services for the Portfolio.
Management Fee Waiver - Pursuant to a management fee waiver agreement, Brighthouse Investment Advisers has agreed, for the period April 30, 2018 to April 30, 2019, to reduce its advisory fees set out above under “Investment Management Agreement” for each class of the Portfolio as follows:
| | | | |
% per annum | | Average daily net assets | |
| 0.025% | | First $ | 500 million | |
An identical agreement was in place for the period May 1, 2017 to April 30, 2018. Amounts waived for the year ended December 31, 2018 are shown as a management fee waiver in the Statement of Operations.
Certain officers and trustees of the Trust may also be officers of Brighthouse Investment Advisers; however, such officers and trustees receive no compensation from the Trust.
Transfer Agency Agreement -Brighthouse Financial, Inc. serves as the transfer agent for the Trust. Brighthouse Financial, Inc. receives no fees for its services to the Trust.
Distribution and Service Fees -The Trust has a distribution agreement with Brighthouse Securities, LLC (the “Distributor”) pursuant to which the Distributor serves as the general distributor of shares of each class (each a “Class”) of each Portfolio. The Distributor is an affiliate of the Trust. The Trust has adopted a Distribution and Services Plan (the “Plan”) relating to Class B and Class E shares of each Portfolio, under Rule 12b-1 under the 1940 Act, pursuant to which the Trust may pay the Distributor a fee (the “Service Fee”) at an annual rate not to exceed 0.25% of each such Portfolio’s average daily net assets attributable to the Class B and Class E shares of the Trust. Each Portfolio may not offer shares of each Class. The Plan also authorizes the Trust, on behalf of each of its Portfolios, may pay the Distributor a distribution Fee (the “Distribution Fee” and together with the Service Fee, the “Fees”) at an annual rate of up to 0.25% of each Portfolio’s average daily net assets attributable to the Class B and Class E shares in consideration of the services rendered in connection with the sale of such shares by the Distributor. Under the Distribution Agreement with respect to the Trust, Fees are currently paid at an annual rate of 0.25% of average daily net assets in the case of Class B shares and 0.15% of average daily net assets in the case of Class E shares. The Plan is known as a “compensation plan” because the Trust makes payments to the Distributor for services rendered regardless of the actual level of expenditures by the Distributor. Amounts incurred by the Portfolio for the year ended December 31, 2018 are shown as Distribution and service fees in the Statement of Operations.
Deferred Trustee Compensation -Each Trustee who is not currently an employee of the Adviser or any of its affiliates receives compensation from the Trust for his or her service to the Trust. A deferred compensation plan (the “Plan”) is available to the Trustees on a voluntary basis. Deferred amounts remain in the Trust until distributed in accordance with the provisions of the Plan. The value of a participating Trustee’s deferral account is based on theoretical investments of deferred amounts on the normal payment dates in certain portfolios of the Trust or Brighthouse Funds Trust I, an affiliate of the Trust, as designated by the participating Trustee. Changes in the value of participants’ deferral accounts are reflected as Trustees’ fees and expenses in the Statement of Operations. The portion of the accrued obligations allocated to the Portfolio under the Plan is reflected as Deferred trustees’ fees in the Statement of Assets and Liabilities.
BHFTII-16
Brighthouse Funds Trust II
Neuberger Berman Genesis Portfolio
Notes to Financial Statements—December 31, 2018—(Continued)
6. Contractual Obligations
Under the Trust’s organizational documents, its officers and Trustees may be indemnified against certain liabilities and expenses arising out of the performance of their duties to the Trust. Additionally, the Trust has a variety of indemnification obligations under contracts with its service providers. The Trust’s maximum exposure under these arrangements is unknown, as this would involve future claims that may be made against the Trust that have not yet occurred.
7. Income Tax Information
The cost basis of investments for federal income tax purposes at December 31, 2018 was as follows:
| | | | |
Cost basis of investments | | $ | 690,314,919 | |
Gross unrealized appreciation | | | 291,816,222 | |
Gross unrealized depreciation | | | (58,428,895 | ) |
| | | | |
Net unrealized appreciation (depreciation) | | $ | 233,387,327 | |
| | | | |
The tax character of distributions paid for the years ended December 31, 2018 and 2017 were as follows:
| | | | | | | | | | | | | | | | | | | | |
Ordinary Income | | | Long-Term Capital Gain | | | Total | |
2018 | | 2017 | | | 2018 | | | 2017 | | | 2018 | | | 2017 | |
| $5,033,142 | | $ | 3,899,557 | | | $ | 133,084,552 | | | $ | 95,713,845 | | | $ | 138,117,694 | | | $ | 99,613,402 | |
As of December 31, 2018, the components of distributable earnings (accumulated losses) on a federal income tax basis were as follows:
| | | | | | | | | | | | | | | | |
Undistributed
Ordinary
Income | | Undistributed
Long-Term
Capital Gain | | | Net
Unrealized
Appreciation | | | Accumulated
Capital Losses | | | Total | |
| $2,076,097 | | $ | 141,537,729 | | | $ | 233,387,327 | | | $ | — | | | $ | 377,001,153 | |
The Portfolio utilizes the provisions of the federal income tax laws that provide for the carryforward of capital losses for prior years, offsetting such losses against any future realized capital gains. Under the Regulated Investment Company Modernization Act of 2010 (the “Act”), net capital losses recognized after December 22, 2010 may be carried forward indefinitely and their character is retained as short-term and/or long-term losses.
As of December 31, 2018, the Portfolio had no accumulated capital losses.
8. Recent Accounting Pronouncements and SEC Update
In August 2018, the FASB issued Accounting Standards Update2018-13, Fair Value Measurement (Topic 820)—Disclosure Framework—Changes to the Disclosure Requirements for Fair Value Measurement (“ASU2018-13”) which introduces new fair value disclosure requirements as well as eliminates and modifies certain existing fair value disclosure requirements. ASU2018-13 is effective for fiscal years beginning after December 15, 2019, and interim periods within those fiscal years. Early adoption is permitted and, as such, management has elected to early adopt ASU2018-13 effective with the current reporting period. The impact of the Portfolio’s adoption was limited to changes in the Portfolio’s financial statement disclosures regarding fair value, primarily those disclosures related to transfers between levels of the fair value hierarchy.
In August 2018, the Securities and Exchange Commission released its Final Rule on Disclosure Update and Simplification (the “Final Rule”) which is intended to simplify an issuer’s disclosure compliance efforts by removing redundant or outdated disclosures requirements without significantly altering the mix of information provided to investors. Effective with the current reporting period, the Portfolio adopted the Final Rule with the most notable impacts being that the Portfolio is no longer required to present the components of distributable earnings on the Statement of Assets and Liabilities or the sources of distributions to shareholders and the amounts of undistributed net investment income on the Statements of Changes in Net Assets.
BHFTII-17
Brighthouse Funds Trust II
Neuberger Berman Genesis Portfolio
Report of Independent Registered Public Accounting Firm
To the Shareholders of Neuberger Berman Genesis Portfolio and the Board of Trustees of Brighthouse Funds Trust II:
Opinion on the Financial Statements and Financial Highlights
We have audited the accompanying statement of assets and liabilities, including the schedule of investments, of the Neuberger Berman Genesis Portfolio (the “Portfolio”), one of the portfolios constituting the Brighthouse Funds Trust II, as of December 31, 2018, the related statement of operations for the year then ended, the statements of changes in net assets for each of the two years in the period then ended, the financial highlights for each of the five years in the period then ended, and the related notes. In our opinion, the financial statements and financial highlights present fairly, in all material respects, the financial position of the Neuberger Berman Genesis Portfolio of the Brighthouse Funds Trust II as of December 31, 2018, the results of its operations for the year then ended, the changes in its net assets for each of the two years in the period then ended, and the financial highlights for each of the five years in the period then ended, in conformity with accounting principles generally accepted in the United States of America.
Basis for Opinion
These financial statements and financial highlights are the responsibility of the Portfolio’s management. Our responsibility is to express an opinion on the Portfolio’s financial statements and financial highlights based on our audits. We are a public accounting firm registered with the Public Company Accounting Oversight Board (United States) (PCAOB) and are required to be independent with respect to the Portfolio in accordance with the U.S. federal securities laws and the applicable rules and regulations of the Securities and Exchange Commission and the PCAOB.
We conducted our audits in accordance with the standards of the PCAOB. Those standards require that we plan and perform the audit to obtain reasonable assurance about whether the financial statements and financial highlights are free of material misstatement, whether due to error or fraud. The Portfolio is not required to have, nor were we engaged to perform, an audit of its internal control over financial reporting. As part of our audits we are required to obtain an understanding of internal control over financial reporting but not for the purpose of expressing an opinion on the effectiveness of the Portfolio’s internal control over financial reporting. Accordingly, we express no such opinion.
Our audits included performing procedures to assess the risks of material misstatement of the financial statements and financial highlights, whether due to error or fraud, and performing procedures that respond to those risks. Such procedures included examining, on a test basis, evidence regarding the amounts and disclosures in the financial statements and financial highlights. Our audits also included evaluating the accounting principles used and significant estimates made by management, as well as evaluating the overall presentation of the financial statements and financial highlights. Our procedures included confirmation of securities owned as of December 31, 2018, by correspondence with the custodian and brokers; when replies were not received from brokers, we performed other auditing procedures. We believe that our audits provide a reasonable basis for our opinion.
/s/ Deloitte & Touche LLP
Boston, Massachusetts
February 25, 2019
We have served as the auditor of one or more of the Brighthouse investment companies since 1983.
BHFTII-18
Brighthouse Funds Trust II
Trustees and Officers
MANAGEMENT OF THE TRUSTS
The Boards of Trustees (the “Board”) of Brighthouse Funds Trust I and Brighthouse Funds Trust II (“BHF I” and “BHF II”, respectively, and collectively the “Trusts”) supervise the Trusts and are responsible for representing the interests of shareholders. The Trustees, the Chairman of the Board and the Chairmen of each subcommittee are the same for both Trusts. The Trustees of each Trust meet periodically throughout the year to oversee the Portfolios’ activities, reviewing, among other things, each Portfolio’s performance and its contractual arrangements with various service providers. The Trustees of each Trust elect the officers of the Trust, who are responsible for administering the Trust’sday-to-day operations.
Trustees and Officers
The Trustees and executive officers of the Trusts, as well as their principal occupations during the past five years, are set forth below. Unless otherwise indicated, the business address of each is c/o Brighthouse Funds, One Financial Center, Boston, Massachusetts 02111. Each Trustee who is deemed an “interested person,” as such term is defined in the 1940 Act, is referred to as an “Interested Trustee.” Those Trustees who are not “interested persons,” as such term is defined in the 1940 Act, are referred to as “Independent Trustees.” There is no limit to the term a Trustee may serve. Trustees serve until their death, resignation or removal in accordance with the BHF I Trust’s and BHF II Trust’s respective organizational documents and policies adopted by the Boards of the respective Trusts from time to time. Officers hold office at the pleasure of each Board and serve until their removal or resignation in accordance with the Trusts’ respective organizational documents and policies adopted by the Board of each Trust from time to time.
| | | | | | | | | | |
Name and Year of Birth | | Current
Position(s)
Held with
Registrant | | Term of Office
and Length of
Time Served | | Principal Occupation(s) During the Past
5 Years(1) | | Number of
Portfolios
in Brighthouse
Funds
Complex(2)
Overseen
by Trustee | | Other Directorships Held
by Trustee During the
Past 5 Years(1) |
| Interested Trustee |
John Rosenthal* (1960) | | Trustee | | Indefinite; From
May 2016
(Trust I and
Trust II) to present | | Chief Investment Officer, Brighthouse Financial, Inc. (2017 to present); until 2017, Senior Managing Director and Head of Global Portfolio Management, MetLife, Inc. | | 72 | | None |
|
| Independent Trustees |
Dawn M. Vroegop (1966) | | Trustee and Chairman of the Board | | Indefinite; From
December 2000
(Trust I)/May
2009 (Trust II) to
present as
Trustee; From
May 2016 (Trust
I and Trust II)
until present as
Chairman | | Private Investor. | | 72 | | Trustee, Driehaus Mutual Funds.** |
| | | | | |
Stephen M. Alderman (1959) | | Trustee | | Indefinite; From
December 2000
(Trust I)/April
2012 (Trust II) to
present | | Shareholder in the law firm of Garfield and Merel, Ltd. | | 72 | | None |
| | | | | |
Robert J. Boulware (1956) | | Trustee | | Indefinite; From
March 2008
(Trust I)/April
2012 (Trust II) to
present | | Managing Director, Pilgrim Funds, LLC (private equity fund). | | 72 | | Trustee, Vertical Capital Income Fund(closed-end fund);** Director, Gainsco, Inc. (auto insurance);** Trustee, SharesPost 100 Fund(closed-end fund).** |
| | | | | |
Susan C. Gause (1952) | | Trustee | | Indefinite; From
March 2008
(Trust I)/April
2012 (Trust II) to
present | | Private Investor. | | 72 | | Trustee, HSBC Funds.** |
BHFTII-19
Brighthouse Funds Trust II
Trustees and Officers—(Continued)
| | | | | | | | | | |
Name and Year of Birth | | Current
Position(s)
Held with
Registrant | | Term of Office
and Length of
Time Served | | Principal Occupation(s) During the Past
5 Years(1) | | Number of
Portfolios
in Brighthouse
Funds
Complex(2)
Overseen
by Trustee | | Other Directorships Held
by Trustee During the
Past 5 Years(1) |
Nancy Hawthorne (1951) | | Trustee | | Indefinite; From
May 2003
(Trust II)/April
2012 (Trust I)
to present | | Partner, Hawthorne Financial Advisors, LLC (registered investment advisor); until 2014, Chief Executive Officer, Clerestory LLC (corporate advisor). | | 72 | | Director and Chairman of the Board of Directors, THL Credit, Inc.;** Director and Chairman of the Board, Avid Technology, Inc.;** Director, CRA International, Inc.** |
| | | | | |
Barbara A. Nugent (1956) | | Trustee | | Indefinite; From
January 2014
(Trust I and
Trust II) to
present | | President, True North Board Governance, LLC (consulting); until December 2013, partner in the law firm of Stradley Ronon Stevens & Young, LLP. | | 72 | | Independent Lead Trustee, BMT Investment Funds** |
| | | | | |
Christopher J. Towle (1957) | | Trustee | | Indefinite; From
April 2018
(Trust I and
Trust II) to
present | | Retired; until 2014, Partner, Portfolio Manager, Director of High Yield and Convertible Strategies, Lord Abbett & Co. | | 72 | | Trustee, Driehaus Mutual Funds** |
Officers
| | | | | | |
Name and Year of Birth | | Position(s)
Held with
Registrant | | Length of
Time Served | | Principal Occupation(s)
During the Past 5 Years(1) |
| Executive Officers | | | | | | |
Kristi Slavin (1973) | | President and Chief Executive Officer, of Trust I and Trust II | | From May
2016
(Trust I and
Trust II) to
present | | President, Brighthouse Investment Advisers, LLC (2016-present); formerly, Senior Vice President, MetLife Advisers, LLC; Vice President, MetLife, Inc.; Vice President, Trust I and Trust II(2015-2016). |
| | | |
Alan R. Otis (1971) | | Chief Financial Officer and Treasurer, of Trust I and Trust II | | From
November
2017
(Trust I and
Trust II) to
present | | Senior Vice President, Brighthouse Investment Advisers, LLC (2017-present); formerly, Vice President, Brighthouse Investment Advisers, LLC (2012-2017); Assistant Treasurer, Trust I and Trust II (2012-2017). |
| | | |
Andrew L. Gangolf (1954) | | Secretary, of Trust I and Trust II | | From May
2011
(Trust I and
Trust II) to
present | | Executive Vice President, Brighthouse Investment Advisers, LLC (2017-present); formerly, Senior Vice President, MetLife Advisers, LLC (2011-2017); until 2011, Senior Vice President & Assistant General Counsel, AllianceBernstein Investments, Inc. |
| | | |
Steven E. Hartstein (1963) | | Chief Compliance Officer (“CCO”), of Trust I and Trust II | | From
February
2014
(Trust I and
Trust II) to
present | | Senior Vice President and CCO, Brighthouse Investment Advisers, LLC (2017-present); Head of Investments Compliance, Vice President, Brighthouse Financial, Inc. (2017-present); formerly, Vice President, MetLife, Inc. (2013-2017); Senior Vice President and CCO, MetLife Advisers, LLC (2013-2017.) |
| | | |
Victor Soto (1978) | | Vice President of Trust I and Trust II | | From May
2018
(Trust I and
Trust II) to
present | | Executive Vice President, Brighthouse Investment Advisers, LLC (2016-present); Assistant Vice President, MetLife Inc. (2015-2017); Portfolio Manager, 1st Global (2013-2015). |
| * | Mr. Rosenthal is an “interested person” of the Trusts because of his position with Brighthouse Financial, Inc., the current parent company of Brighthouse Investment Advisers, LLC. |
| ** | Indicates a directorship with a registered investment company or a company subject to the reporting requirements of the Securities Exchange Act of 1934, as amended. |
| (1) | Previous positions during the past five years with the Trusts, Brighthouse Financial, Inc., MetLife, Inc. or the Manager are omitted if not materially different. |
| (2) | The Fund Complex includes 43 BHF I Portfolios and 29 BHF II Portfolios. |
BHFTII-20
Brighthouse Funds Trust II
Neuberger Berman Genesis Portfolio
Board of Trustees’ Consideration of Advisory and Sub-Advisory Agreements
At anin-person meeting held on November6-8, 2018 (the “November Meeting”), the Boards of Trustees (the “Board”) of Brighthouse Funds Trust I and Brighthouse Funds Trust II (“BFT I” and “BFT II,” respectively, and collectively, the “Trusts”), including a majority of the Trustees who are not “interested persons” of the Trusts (the “Independent Trustees”) under the Investment Company Act of 1940 (the “1940 Act”), approved the continuation of the Trusts’ advisory agreements (each, an “Advisory Agreement”) with Brighthouse Investment Advisers, LLC (the “Adviser”) and the applicablesub-advisory agreements (each a “Sub-Advisory Agreement,” and collectively with the Advisory Agreement, the “Agreements”) between the Adviser and the investmentsub-advisers (each a “Sub-Adviser,” and collectively, the “Sub-Advisers”) for the series of the Trusts (each a “Portfolio,” and collectively, the “Portfolios”).
In making those approvals, the Board reviewed a variety of materials that were provided for the specific purpose of the annual contract renewal process. In addition, various materials provided to and discussed with the Board throughout the year informed the Board’s decision to renew the Agreements. In particular, the information for each Portfolio included, but was not limited to, investment performance reports, and reports on expenses, legal and compliance matters, asset pricing, brokerage commissions and trade execution.
The Board met in person with personnel of the Adviser on October 17, 2018 for the specific purpose of giving preliminary consideration to the proposed continuation of the Agreements (the “October Meeting”). At that meeting, the Adviser reviewed with the Board the performance and fees experienced by each Portfolio, as well as other information. During and after the October Meeting, the Independent Trustees communicatedfollow-up matters for management to address at the November Meeting. The Independent Trustees were advised by independent legal counsel throughout the contract renewal process, and met with independent legal counsel in several executive sessions outside of the presence of management.
Information furnished and reviewed specifically in connection with the renewal process included, but was not limited to, a report for each Portfolio that was prepared by Broadridge (“Broadridge”), an independent organization. In addition, the Independent Trustees reviewed a report that was prepared by JDL Consultants, LLC (“JDL”), an independent consultant to the Independent Trustees (“JDL Report”), which examined the comparative fees, expenses and performance of each Portfolio, based upon the Broadridge reports. Also, the Board reviewed the responses to wide-ranging questions from the Independent Trustees relating to the business, operations and performance of the Adviser and theSub-Advisers that the Adviser andSub-Advisers had prepared specifically for the renewal process, and reviewed aPortfolio-by-Portfolio analysis of the profitability to the Adviser of each Advisory Agreement, which was prepared by the Adviser for the renewal process.
At the November Meeting, the Board, including a majority of the Independent Trustees, concluded that the nature, extent and quality of services provided by the Adviser and eachSub-Adviser supported the renewal of the Agreements. The Board also concluded that the investment performance of each Portfolio was such that each Agreement should continue, and that the fees paid by each Portfolio to the Adviser appeared to be reasonable in light of the nature, extent and quality of the services provided by the Adviser andSub-Adviser. Further, the Board concluded that the Adviser’s profitability in providing services under the Advisory Agreements did not appear unreasonable in light of the nature, extent and quality of the services provided by the Adviser. Finally, the Board reviewed the extent to which the investment advisory fees paid by the Portfolios shared economies of scale with investors or entailed the potential to share economies of scale with investors and concluded that those considerations generally supported the renewal of each Agreement. In approving the renewal of each of the Agreements, the Board, including the Independent Trustees, gave attention to all of the information that was furnished and each Trustee placed varying degrees of importance on the various pieces of information that were provided to them. The Board evaluated the information available to it on aPortfolio-by-Portfolio basis, and its decision was made separately with respect to each Portfolio. The following paragraphs provide more information about some of the primary factors that were relevant to the Board’s decision. The Board did not identify any single factor as determinative, and the Trustees generally attributed different weights to various factors for the various Portfolios.
Nature, extent and quality of services. The Board evaluated the nature, extent and quality of the services that the Adviser and theSub-Advisers, as relevant, have provided to the Portfolios. The Board considered the Adviser’s services as investment manager to the Portfolios, including its services relating to the hiring and oversight of theSub-Advisers, trading practices and oversight of transition management (as applicable), compliance programs and personnel, and risk management, among other things. The Adviser’s services in coordinating and overseeing the activities of the Trusts’ other service providers were also considered. The Board considered information received from the Trusts’ Chief Compliance Officer (“CCO”) regarding the Portfolios’ compliance policies and procedures that were established pursuant to Rule38a-l under the 1940 Act. The Board also noted that the Adviser’s investment, compliance and legal staff conduct regular and periodic telephonic andin-person meetings with theSub-Advisers to review and assess the services that are provided to the Portfolios, and that personnel of the Adviser prepare and present reports to the Independent Trustees regarding those meetings. In addition, throughout the year, the Board considered the expertise, experience and performance of the personnel of the Adviser who performed the various services that are mentioned above.
BHFTII-21
Brighthouse Funds Trust II
Neuberger Berman Genesis Portfolio
Board of Trustees’ Consideration of Advisory and Sub-Advisory Agreements—(Continued)
With respect to the services provided by each of theSub-Advisers, the Board considered a variety of information that the Adviser and eachSub-Adviser prepared for the Board’s review. The Board considered eachSub-Adviser’s investment process and philosophy, and the investment performance experienced by the Portfolio (as described in more detail below). The Board took into account that eachSub-Adviser’s responsibilities include the development and maintenance of an investment program for the applicable Portfolio that is consistent with the Portfolio’s investment objectives, the selection of investment securities and the placement of orders for the purchase and sale of such securities, as well as the implementation of compliance controls related to performance of these services. In particular, the Board considered, among other things, theSub-Adviser’s current level of staffing as well as its compensation program and its overall resources. The Board reviewed eachSub-Adviser’s history and investment experience, as well as information provided regarding the qualifications, background and responsibilities of theSub-Adviser’s investment and compliance personnel who provide services to the Portfolios. The Board also considered, among other things, eachSub-Adviser’s compliance program and regulatory and disciplinary history. In its review, the Board also took into account information regarding any services and/or payments provided to the Adviser by theSub-Advisers in connection with marketing activities and considered representations from the Adviser that those payments were not considered in the Adviser’s recommendation to renew any of theSub-Advisory Agreements.
Performance. The Board placed emphasis on the performance of each Portfolio in light of, among other things, its importance to investors. The Board considered the Adviser’s quarterly reviews with the Board of detailed information about each Portfolio’s investment strategies and performance results and composition, including discussions regarding the relevant effect of current market conditions. The Board reviewed and considered the reports prepared by Broadridge, which provided a statistical analysis comparing the Portfolios’ investment performance to that of comparable funds underlying variable insurance products (the “Performance Universe”). The Independent Trustees also met separately with representatives of JDL during the October Meeting to review the JDL Report. The Board also compared the performance records of the Portfolios to those of comparable funds and other accounts that were managed by the relevantSub-Adviser, to the extent such information was available. The Board considered each Portfolio’s performance for periods subsequent to the performance period covered by the Broadridge reports, and the Adviser’s discussion of the same, including the effect of current market conditions on each Portfolio’s more recent performance. The Board also noted that while it found the data provided by Broadridge generally useful, it recognized the limitations of such data, including, in particular, that notable differences may exist between a Portfolio and those of the other funds in a Broadridge category (for example, the investment objectives(s) and investment strategies) and that the results of the performance comparisons may vary depending on (i) the end dates for the performance periods that were selected and (ii) the selection of the peer groups.
The Board focused particular attention on Portfolios with less favorable performance records. The Board noted the Adviser’s focus on eachSub-Adviser’s performance and that the Adviser has been active in monitoring and responding to any performance issues with respect to the Portfolios.
Fees and Expenses. The Board gave consideration to the level and method of computing the fees payable under the Agreements. The Board considered the Broadridge report for each of the Portfolios, which included comparisons for each Portfolio of its contractual management andsub-adviser fees (at current and various asset levels), and total expenses, with those of its peers, including as those peers were divided into a broad group of peer funds (“Expense Universe”), a narrower group of peer funds (“Expense Group”), a broad group of peersub-advised funds (“Sub-advised Expense Universe”), and a narrower group of peersub-advised funds (“Sub-advised Expense Group”). Broadridge selected the peer funds which were similarly situated funds underlying variable insurance products deemed to be comparable to the Portfolios. The Independent Trustees, with the assistance of JDL, also examined the JDL Report. The Board compared the fee payable to aSub-Adviser by the Adviser with respect to the Portfolio to the fee payable to theSub-Adviser by other comparable funds and other accounts, to the extent such information was available.
The Board noted that thesub-advisory fees for the Portfolios are paid by the Adviser out of the advisory fees, and that the Adviser negotiates the fees at arm’s length. The Board also considered that the Adviser had entered into expense limitation or management fee waiver agreements with certain of the Portfolios pursuant to which the Adviser had agreed to waive a portion of its advisory fee and/or reimburse certain expenses as a means of limiting a Portfolio’s total annual operating expenses.
Profitability. The Board examined the profitability to the Adviser of each Advisory Agreement, on aPortfolio-by-Portfolio basis. The Board also considered that an affiliate of the Adviser, Brighthouse Securities, LLC, serves as distributor for the Trusts, and, as such, receives Rule12b-1 payments to support the distribution of the Portfolios. The Board considered the profitability to theSub-Advisers and their affiliates as a result of their relationships with the Portfolios, to the extent available, and the Board considered the ability of the Adviser to negotiate with aSub-Adviser at arm’s length. In reviewing the profitability analyses, the Board recognized that expense allocation methodologies are inherently subjective and various expense allocation methodologies may be reasonable while producing different results.
BHFTII-22
Brighthouse Funds Trust II
Neuberger Berman Genesis Portfolio
Board of Trustees’ Consideration of Advisory and Sub-Advisory Agreements—(Continued)
Economies of scale. The Board also considered each Portfolio’s fees in light of its size. The Board noted the fee schedules for the Portfolios that contain breakpoints that reduce the fee rate above specified asset levels. The Board noted those Portfolios that did not have breakpoints in their advisory fee and took into account management’s discussion of the same. The Board noted that those Portfolios with Advisory Agreements containing breakpoints generally have breakpoints in the correspondingSub-Advisory Agreement. The Board considered the effective fees under the Advisory Agreement andSub-Advisory Agreement for each Portfolio as a percentage of assets at different asset levels and possible economies of scale that may be realized if the assets of the Portfolio grow. The Board examined, among other data, the effect of a Portfolio’s growth in size, and reduction in size, on various fee schedules and the Board reviewed the Broadridge and JDL Reports, which compared fees among peers. The Board also generally noted that if a Portfolio’s assets increase over time, the Portfolio may realize other economies of scale if assets increase proportionally more than certain other fixed expenses.
Other factors. The Board considered other benefits that may be realized by the Adviser and its affiliates from their relationship with the Trusts. Among them, the Board recognized that Brighthouse Securities, LLC, as the distributor for the Trusts, receives payments pursuant to Rule12b-1 from the Portfolios to compensate for the provision of shareholder services and distribution activities, which could lead to growth in the Trusts’ assets and corresponding benefits from such growth, including economies of scale. The Board considered other benefits that may be realized by eachSub-Adviser and its affiliates from their relationship with the Trusts, including the opportunity to provide advisory services to additional portfolios of the Trusts and reputational benefits. In conjunction with these considerations, the Board noted the ongoing commitment of the Adviser to the Portfolios.
The Board requested, received, and considered information from the Adviser regarding possible conflicts of interest in the form of material benefits to the Adviser resulting from the Adviser’s affiliations and business relationships, as relevant. The Board considered the services that are provided to the Trusts by its service providers, and the manner in which any conflicts were mitigated.
* * *
Neuberger Berman Genesis Portfolio. The Board also considered the following information in relation to the Agreements with the Adviser and Neuberger Berman Management LLC regarding the Portfolio:
Among other data relating specifically to the Portfolio’s performance, the Board considered that the Portfolio outperformed the median of its Performance Universe and the average of its Morningstar Category for the one, three- and five-year periods ended June 30, 2018. The Board further considered that the Portfolio outperformed its benchmark, the Russell 2000 Value Index, for theone-, three-, and five-year periods ended September 30, 2018.
The Board also considered that the Portfolio’s actual management fees were equal to the Expense Group median and theSub-advised Expense Universe median, and above the Expense Universe median. The Board also noted that the Portfolio’s total expenses (exclusive of12b-1 fees) were equal to the Expense Group median and Expense Universe median, and below theSub-advised Expense Universe median. The Board further noted that the Portfolio’s contractual management fees were above the asset-weighted average of comparable funds selected by Broadridge at the Portfolio’s current size. The Board also took into account that the Portfolio’s contractualsub-advisory fees were below the averages of theSub-advised Expense Group and theSub-advised Expense Universe at the Portfolio’s current size.
BHFTII-23
Brighthouse Funds Trust II
T. Rowe Price Large Cap Growth Portfolio
Managed by T. Rowe Price Associates, Inc.
Portfolio Manager Commentary*
PERFORMANCE
For the 12 months ended December 31, 2018, the Class A, B, and E shares of the T. Rowe Price Large Cap Growth Portfolio returned-0.94%,-1.15%, and-1.05%, respectively. The Portfolio’s benchmark, the Russell 1000 Growth Index1, returned-1.51%.
MARKET ENVIRONMENT / CONDITIONS
U.S. stocks declined in 2018, which marked the worst year for the U.S. equity market since 2008. Stocks rose for much of the year, though the advance was somewhat sluggish. Market volatility was elevated throughout 2018, thanks partly to rising interest rates. The Federal Reserve (the “Fed”) continued its normalization of monetary policy, with four short-term interest rate hikes in 2018, and the10-year Treasury note yield reached a seven-year high of about 3.25% in early October. Heightened global trade tensions, especially between the U.S. and China, periodically weighed on U.S. and global equity markets throughout 2018.
While most major U.S. stock indexes reachedall-time highs around the end of the third quarter, equities plunged in the final months of the year, with several indexes in or close to bear market territory—down at least 20% from recent highs—by the end of the year. Stocks fell sharply due to factors such as expectations for additional interest rate increases from the Fed in 2019; expectations for slowing corporate earnings growth in 2019, as the tailwinds from the late-2017 tax reform that boosted corporate earnings in 2018 subside; signs of slowing economic growth in different parts of the world; and increased U.S.-China tensions. Turmoil in the Trump administration also weighed on investor sentiment.
As measured by various Russell Indices, growth stocks held up better than value stocks across all market capitalizations.
PORTFOLIO REVIEW /PERIOD-END POSITIONING
The Portfolio delivered modestly negative returns for the12-months ended December 31, 2018, but outpaced the benchmark Russell 1000 Growth Index. Overall, sector allocation was responsible for relative outperformance, as stock selection detracted slightly. Information Technology (“IT”) was the leading relative outperformer, followed by Industrials & Business Services and Materials. Consumer Discretionary and Financials were the largest relative detractors.
In IT, stock choices boosted relative results, led by a position in Red Hat. Shares gained as growing demand for hybrid cloud solutions and a record number of large deals fueled topline growth. Shares traded higher after the announcement that the company would be acquired by IBM in an effort to gain a foothold in the cloud era of enterprise technology. Below-benchmark exposure to Apple bolstered relative performance, as shares sold off due to softer-than-expected demand for the latest iPhone launch, particularly in China. Shares of Workday appreciated due to better-than-expected organic subscription revenue and billings growth, driven by momentum withmid-market customers in its financials business, as well as strength in its international Human Capital Management business.
Underweight and security section in Industrials & Business Services had a positive relative impact, due in part to above-benchmark exposure to Boeing, which benefited from continued expansion of operating margins, driven by favorable delivery volume and mix within commercial aircraft, as well as better-than-expected revenue growth from defense and services. Below-benchmark exposure to the Materials sector also aided relative performance.
In contrast, security selection within Consumer Discretionary weighed on relative returns. Investor sentiment for Alibaba Group Holding waned due to concerns over trade and regulatory uncertainty in China and the impending departure of the chairman and founder, Jack Ma. Shares came under further pressure as investments in local retail initiatives weighed on the company’s near-term outlook.
Financials also detracted on a relative basis, largely on stock choices. Shares of Morgan Stanley came under pressure due to investor concerns over decelerating transaction revenue and compression of advisory fees impacting results of the company’s wealth management division. Shares were weighed down further atyear-end as growing fears of recession in 2019 caused bank stocks to sell off.
At the end of the reporting period, the Portfolio’s most substantially overweight positions relative to the Russell 1000 Growth Index were Consumer Discretionary and Communication Services sectors. In contrast, the Portfolio’s most substantially underweight positions were Consumer Staples, IT, and Industrials & Business Services.
Joseph B. Fath
Portfolio Manager
T. Rowe Price Associates, Inc.
* This commentary may include statements that constitute “forward-looking statements” under the U.S. securities laws. Forward-looking statements include, among other things, projections, estimates, and information about possible or future results related to the Portfolio, market or regulatory developments. The views expressed above are not guarantees of future performance or economic results and involve certain risks, uncertainties and assumptions that could cause actual outcomes and results to differ materially from the views expressed herein. The views expressed above are subject to change at any time based upon economic, market, or other conditions and the subadvisory firm undertakes no obligation to update the views expressed herein. Any discussions of specific securities should not be considered a recommendation to buy or sell those securities. The views expressed above (including any forward-looking statement) may not be relied upon as investment advice or as an indication of the Portfolio’s trading intent. Information about the Portfolio’s holdings, asset allocation or country diversification is historical and is not an indication of future Portfolio composition, which may vary. Direct investment in any index is not possible. The performance of any index mentioned in this commentary has not been adjusted for ongoing management, distribution and operating expenses, and sales charges applicable to mutual fund investments. In addition, the returns do not reflect additional fees charged by separate accounts or variable insurance contracts that an investor in the Portfolio may pay. If these additional fees were reflected, performance would have been lower.
BHFTII-1
Brighthouse Funds Trust II
T. Rowe Price Large Cap Growth Portfolio
A $10,000 INVESTMENT COMPARED TO THE RUSSELL 1000 GROWTH INDEX
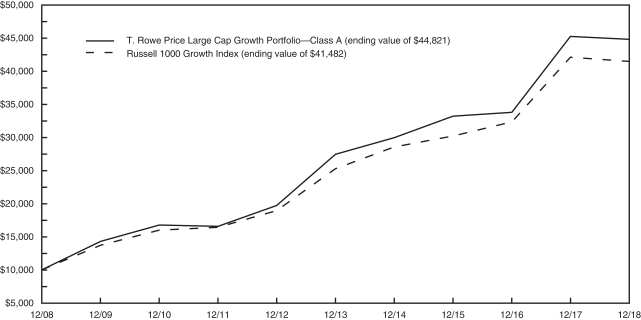
AVERAGE ANNUAL RETURNS (%) (FOR THE YEAR ENDED DECEMBER 31, 2018)
| | | | | | | | | | | | |
| | | | |
| | | 1 Year | | | 5 Year | | | 10 Year | |
| T. Rowe Price Large Cap Growth Portfolio | | | | | | | | | | | | |
Class A | | | -0.94 | | | | 10.27 | | | | 16.18 | |
Class B | | | -1.15 | | | | 10.01 | | | | 15.89 | |
Class E | | | -1.05 | | | | 10.12 | | | | 16.01 | |
| Russell 1000 Growth Index | | | -1.51 | | | | 10.41 | | | | 15.29 | |
1 The Russell 1000 Growth Index is an unmanaged measure of performance of the largest capitalized U.S. companies, within the Russell 1000 companies, that have higher price-to-book ratios and forecasted growth values.
Portfolio performance is calculated including reinvestment of all income and capital gain distributions. Performance numbers are net of all Portfolio expenses but do not include any insurance, sales, separate account or administrative charges of variable annuity or life insurance contracts or any additional expenses that participants may bear relating to the operations of their plans. If these charges were included, the returns would be lower. The performance of any index referenced above has not been adjusted for ongoing management, distribution and operating expenses, and sales charges applicable to mutual fund investments. Direct investment in any index is not possible. The performance of Class A shares, as set forth in the line graph above, will differ from that of other classes because of the difference in expenses paid by policyholders investing in the different share classes.
This information represents past performance and is not indicative of future results. Investment return and principal value may fluctuate so that shares, upon redemption, may be worth more or less than the original cost.
PORTFOLIO COMPOSITION AS OF DECEMBER 31, 2018
Top Holdings
| | | | |
| | | % of
Net Assets | |
| Amazon.com, Inc. | | | 8.6 | |
| Microsoft Corp. | | | 5.3 | |
| Facebook, Inc.- Class A | | | 3.8 | |
| Boeing Co. (The) | | | 3.5 | |
| Visa, Inc.- Class A | | | 3.4 | |
| Alphabet, Inc.- Class A | | | 3.1 | |
| Alphabet, Inc.- Class C | | | 3.1 | |
| UnitedHealth Group, Inc. | | | 2.8 | |
| MasterCard, Inc.- Class A | | | 2.8 | |
| Tencent Holdings, Ltd. | | | 2.2 | |
Top Sectors
| | | | |
| | | % of
Net Assets | |
| Information Technology | | | 27.9 | |
| Consumer Discretionary | | | 21.6 | |
| Communication Services | | | 16.7 | |
| Health Care | | | 15.5 | |
| Industrials | | | 8.7 | |
| Financials | | | 5.4 | |
| Utilities | | | 1.5 | |
| Consumer Staples | | | 1.0 | |
| Materials | | | 0.7 | |
| Real Estate | | | 0.5 | |
BHFTII-2
Brighthouse Funds Trust II
T. Rowe Price Large Cap Growth Portfolio
Understanding Your Portfolio’s Expenses
Shareholder Expense Example
As a shareholder of the Portfolio, you incur ongoing costs, including management fees; distribution and service(12b-1) fees; and other Portfolio expenses. This example is intended to help you understand your ongoing costs (in dollars) (referred to as “expenses”) of investing in the Portfolio and compare these costs with the ongoing costs of investing in other mutual funds. The example is based on an investment of $1,000 invested at the beginning of the period and held for the entire period, July 1, 2018 through December 31, 2018.
Actual Expenses
The first line for each share class of the Portfolio in the table below provides information about actual account values and actual expenses. You may use the information in this line, together with the amount you invested in the particular share class of the Portfolio, to estimate the expenses that you paid over the period. Simply divide your account value by $1,000 (for example, an $8,600 account value divided by $1,000 = 8.6), then multiply the result by the number in the first line under the heading entitled “Expenses Paid During Period” to estimate the expenses you paid on your account during this period.
Hypothetical Example for Comparison Purposes
The second line for each share class of the Portfolio in the table below provides information about hypothetical account values and hypothetical expenses based on the Portfolio’s actual expense ratio and an assumed rate of return of 5% per year before expenses, which is not the Portfolio’s actual return. The hypothetical account values and expenses may not be used to estimate the actual ending account balance or expenses you paid for the period. You may use this information to compare the ongoing costs of investing in the Portfolio and other funds. To do so, compare this 5% hypothetical example with the 5% hypothetical examples that appear in the shareholder reports of the other funds.
Please note that the expenses shown in the table are meant to highlight your ongoing costs only and do not reflect any fees or charges of your variable insurance product or any additional expenses that participants in certain eligible qualified plans may bear relating to the operations of their plan. Therefore, the second line for each share class in the table is useful in comparing ongoing costs only, and will not help you determine the relative total costs of owning different funds. In addition, if these other costs were included, your costs would have been higher.
| | | | | | | | | | | | | | | | | | |
T. Rowe Price Large Cap Growth Portfolio
| | | |
Annualized
Expense
Ratio | | | Beginning
Account Value
July 1,
2018 | | | Ending
Account Value
December 31,
2018 | | | Expenses Paid
During Period**
July 1, 2018
to
December 31,
2018 | |
Class A (a) | | Actual | | | 0.54 | % | | $ | 1,000.00 | | | $ | 902.00 | | | $ | 2.59 | |
| | Hypothetical* | | | 0.54 | % | | $ | 1,000.00 | | | $ | 1,022.48 | | | $ | 2.75 | |
| | | | | |
Class B (a) | | Actual | | | 0.79 | % | | $ | 1,000.00 | | | $ | 901.20 | | | $ | 3.79 | |
| | Hypothetical* | | | 0.79 | % | | $ | 1,000.00 | | | $ | 1,021.22 | | | $ | 4.02 | |
| | | | | |
Class E (a) | | Actual | | | 0.69 | % | | $ | 1,000.00 | | | $ | 901.80 | | | $ | 3.31 | |
| | Hypothetical* | | | 0.69 | % | | $ | 1,000.00 | | | $ | 1,021.73 | | | $ | 3.52 | |
| * | Hypothetical assumes a rate of return of 5% per year before expenses. |
| ** | Expenses paid are equal to the Portfolio’s annualized expense ratio for the most recent six month period, as shown above, multiplied by the average account value over the period, multiplied by the number of days (184 days) in the most recent fiscal half-year, divided by 365 (to reflect theone-half year period). |
| (a) | The annualized expense ratio shown reflects the impact of the management fee waiver as described in Note 5 of the Notes to Financial Statements. |
BHFTII-3
Brighthouse Funds Trust II
T. Rowe Price Large Cap Growth Portfolio
Schedule of Investments as of December 31, 2018
Common Stocks—97.4% of Net Assets
| | | | | | | | |
| Security Description | | Shares | | | Value | |
|
| Aerospace & Defense—4.4% | |
Boeing Co. (The) | | | 229,744 | | | $ | 74,092,440 | |
Northrop Grumman Corp. | | | 72,900 | | | | 17,853,210 | |
| | | | | | | | |
| | | | | | | 91,945,650 | |
| | | | | | | | |
|
| Auto Components—0.9% | |
Aptiv plc | | | 298,270 | | | | 18,364,484 | |
| | | | | | | | |
|
| Automobiles—2.0% | |
Ferrari NV | | | 112,963 | | | | 11,233,041 | |
Tesla, Inc. (a) (b) | | | 93,636 | | | | 31,162,061 | |
| | | | | | | | |
| | | | | | | 42,395,102 | |
| | | | | | | | |
|
| Banks—0.5% | |
JPMorgan Chase & Co. | | | 104,119 | | | | 10,164,097 | |
| | | | | | | | |
|
| Biotechnology—2.2% | |
Alexion Pharmaceuticals, Inc. (b) | | | 156,584 | | | | 15,245,018 | |
Vertex Pharmaceuticals, Inc. (b) | | | 191,641 | | | | 31,756,830 | |
| | | | | | | | |
| | | | | | | 47,001,848 | |
| | | | | | | | |
|
| Capital Markets—3.9% | |
Charles Schwab Corp. (The) | | | 608,354 | | | | 25,264,942 | |
Intercontinental Exchange, Inc. | | | 199,534 | | | | 15,030,896 | |
Morgan Stanley | | | 310,900 | | | | 12,327,185 | |
S&P Global, Inc. | | | 18,400 | | | | 3,126,896 | |
TD Ameritrade Holding Corp. | | | 546,523 | | | | 26,757,766 | |
| | | | | | | | |
| | | | | | | 82,507,685 | |
| | | | | | | | |
|
| Chemicals—0.7% | |
DowDuPont, Inc. | | | 276,700 | | | | 14,797,916 | |
| | | | | | | | |
|
| Electric Utilities—0.5% | |
NextEra Energy, Inc. | | | 54,700 | | | | 9,507,954 | |
| | | | | | | | |
|
| Entertainment—4.1% | |
Activision Blizzard, Inc. | | | 192,800 | | | | 8,978,696 | |
Electronic Arts, Inc. (b) | | | 223,694 | | | | 17,651,693 | |
Netflix, Inc. (b) | | | 110,909 | | | | 29,685,903 | |
Walt Disney Co. (The) (a) | | | 271,772 | | | | 29,799,800 | |
| | | | | | | | |
| | | | | | | 86,116,092 | |
| | | | | | | | |
|
| Equity Real Estate Investment Trusts—0.5% | |
Crown Castle International Corp. | | | 99,186 | | | | 10,774,575 | |
| | | | | | | | |
|
| Health Care Equipment & Supplies—5.3% | |
Becton Dickinson & Co. | | | 178,986 | | | | 40,329,126 | |
Intuitive Surgical, Inc. (b) | | | 68,238 | | | | 32,680,543 | |
Stryker Corp. | | | 246,606 | | | | 38,655,490 | |
| | | | | | | | |
| | | | | | | 111,665,159 | |
| | | | | | | | |
|
| Health Care Providers & Services—7.7% | |
Anthem, Inc. | | | 114,817 | | | | 30,154,389 | |
Centene Corp. (b) | | | 144,576 | | | | 16,669,613 | |
Cigna Corp. | | | 149,384 | | | | 28,371,009 | |
|
| Health Care Providers & Services—(Continued) | |
HCA Healthcare, Inc. | | | 43,451 | | | | 5,407,477 | |
Humana, Inc. | | | 27,600 | | | | 7,906,848 | |
UnitedHealth Group, Inc. | | | 235,986 | | | | 58,788,832 | |
WellCare Health Plans, Inc. (a) (b) | | | 57,367 | | | | 13,543,775 | |
| | | | | | | | |
| | | | | | | 160,841,943 | |
| | | | | | | | |
|
| Hotels, Restaurants & Leisure—2.8% | |
Las Vegas Sands Corp. | | | 282,400 | | | | 14,698,920 | |
McDonald’s Corp. | | | 94,300 | | | | 16,744,851 | |
MGM Resorts International | | | 373,100 | | | | 9,051,406 | |
Wynn Resorts, Ltd. | | | 179,582 | | | | 17,762,456 | |
| | | | | | | | |
| | | | | | | 58,257,633 | |
| | | | | | | | |
|
| Household Durables—0.4% | |
NVR, Inc. (b) | | | 3,450 | | | | 8,407,616 | |
| | | | | | | | |
|
| Industrial Conglomerates—1.4% | |
Honeywell International, Inc. | | | 71,599 | | | | 9,459,660 | |
Roper Technologies, Inc. (a) | | | 77,651 | | | | 20,695,544 | |
| | | | | | | | |
| | | | | | | 30,155,204 | |
| | | | | | | | |
|
| Insurance—0.8% | |
Chubb, Ltd. | | | 128,448 | | | | 16,592,913 | |
| | | | | | | | |
|
| Interactive Media & Services—12.7% | |
Alphabet, Inc. - Class A (b) | | | 62,870 | | | | 65,696,635 | |
Alphabet, Inc. - Class C (b) | | | 62,038 | | | | 64,247,173 | |
Facebook, Inc. - Class A (b) | | | 606,553 | | | | 79,513,033 | |
IAC/InterActiveCorp (b) | | | 48,700 | | | | 8,914,048 | |
Tencent Holdings, Ltd. | | | 1,186,485 | | | | 47,031,110 | |
| | | | | | | | |
| | | | | | | 265,401,999 | |
| | | | | | | | |
|
| Internet & Direct Marketing Retail—12.3% | |
Alibaba Group Holding, Ltd. (ADR) (a) (b) | | | 271,814 | | | | 37,257,545 | |
Amazon.com, Inc. (b) | | | 119,911 | | | | 180,102,725 | |
Booking Holdings, Inc. (b) | | | 23,995 | | | | 41,329,468 | |
| | | | | | | | |
| | | | | | | 258,689,738 | |
| | | | | | | | |
|
| IT Services—10.1% | |
Fidelity National Information Services, Inc. | | | 165,300 | | | | 16,951,515 | |
Fiserv, Inc. (b) | | | 219,206 | | | | 16,109,449 | |
MasterCard, Inc. - Class A | | | 307,858 | | | | 58,077,412 | |
PayPal Holdings, Inc. (b) | | | 256,296 | | | | 21,551,930 | |
Visa, Inc. - Class A (a) | | | 544,699 | | | | 71,867,586 | |
Worldpay, Inc. - Class A (b) | | | 358,290 | | | | 27,384,105 | |
| | | | | | | | |
| | | | | | | 211,941,997 | |
| | | | | | | | |
|
| Machinery—1.3% | |
Fortive Corp. (a) | | | 293,180 | | | | 19,836,559 | |
Wabtec Corp. | | | 110,657 | | | | 7,773,654 | |
| | | | | | | | |
| | | | | | | 27,610,213 | |
| | | | | | | | |
|
| Multi-Utilities—0.9% | |
Sempra Energy (a) | | | 168,991 | | | | 18,283,136 | |
| | | | | | | | |
See accompanying notes to financial statements.
BHFTII-4
Brighthouse Funds Trust II
T. Rowe Price Large Cap Growth Portfolio
Schedule of Investments as of December 31, 2018
Common Stocks—(Continued)
| | | | | | | | |
| Security Description | |
Shares | | | Value | |
|
| Multiline Retail—1.8% | |
Dollar General Corp. (a) | | | 72,043 | | | $ | 7,786,408 | |
Dollar Tree, Inc. (a) (b) | | | 228,451 | | | | 20,633,694 | |
Dollarama, Inc. | | | 437,631 | | | | 10,408,642 | |
| | | | | | | | |
| | | | | | | 38,828,744 | |
| | | | | | | | |
|
| Pharmaceuticals—0.3% | |
Eli Lilly & Co. | | | 51,300 | | | | 5,936,436 | |
| | | | | | | | |
|
| Professional Services—1.5% | |
Equifax, Inc. | | | 157,098 | | | | 14,630,537 | |
TransUnion (a) | | | 307,552 | | | | 17,468,953 | |
| | | | | | | | |
| | | | | | | 32,099,490 | |
| | | | | | | | |
|
| Real Estate Management & Development—0.0% | |
WeWork Cos., Inc. - Class A (b) (c) (d) (e) | | | 2,563 | | | | 132,789 | |
| | | | | | | | |
|
| Semiconductors & Semiconductor Equipment—1.6% | |
ASML Holding NV | | | 94,800 | | | | 14,752,776 | |
NVIDIA Corp. | | | 135,100 | | | | 18,035,850 | |
| | | | | | | | |
| | | | | | | 32,788,626 | |
| | | | | | | | |
|
| Software—13.7% | |
Intuit, Inc. | | | 143,335 | | | | 28,215,495 | |
Microsoft Corp. | | | 1,089,637 | | | | 110,674,430 | |
Red Hat, Inc. (b) | | | 164,656 | | | | 28,920,180 | |
Salesforce.com, Inc. (b) | | | 206,266 | | | | 28,252,254 | |
ServiceNow, Inc. (a) (b) | | | 71,807 | | | | 12,785,236 | |
Splunk, Inc. (a) (b) | | | 119,900 | | | | 12,571,515 | |
Symantec Corp. | | | 1,398,495 | | | | 26,424,563 | |
UBER Technologies, Inc. - Class A (b) (c) (d) (e) | | | 4,669 | | | | 227,718 | |
VMware, Inc. - Class A | | | 133,856 | | | | 18,355,673 | |
Workday, Inc. - Class A (a) (b) | | | 134,396 | | | | 21,460,353 | |
| | | | | | | | |
| | | | | | | 287,887,417 | |
| | | | | | | | |
|
| Technology Hardware, Storage & Peripherals—0.8% | |
Apple, Inc. | | | 101,898 | | | | 16,073,391 | |
| | | | | | | | |
|
| Textiles, Apparel & Luxury Goods—1.1% | |
NIKE, Inc. - Class B | | | 320,133 | | | | 23,734,661 | |
| | | | | | | | |
|
| Tobacco—1.0% | |
Philip Morris International, Inc. | | | 307,232 | | | | 20,510,808 | |
| | | | | | | | |
|
| Water Utilities—0.2% | |
American Water Works Co., Inc. | | | 44,048 | | | | 3,998,237 | |
| | | | | | | | |
Total Common Stocks
(Cost $1,668,974,874) | | | | | | | 2,043,413,553 | |
| | | | | | | | |
|
| Convertible Preferred Stocks—1.9% | |
|
| Internet & Direct Marketing Retail—1.2% | |
Airbnb, Inc. - Series D (b) (c) (d) (e) | | | 97,047 | | | | 11,718,425 | |
Airbnb, Inc. - Series E (b) (c) (d) (e) | | | 9,760 | | | | 1,178,520 | |
| Security Description | | Shares/
Principal
Amount* | | | Value | |
|
| Internet & Direct Marketing Retail—(Continued) | |
ANT International Co., Ltd. - Series C (b) (c) (d) (e) | | | 1,458,697 | | | | 8,183,290 | |
Xiaoju Kuaizhi, Inc. -Series A-17 (b) (c) (d) (e) | | | 91,053 | | | | 4,270,386 | |
| | | | | | | | |
| | | | | | | 25,350,621 | |
| | | | | | | | |
|
| Real Estate Management & Development—0.2% | |
WeWork Cos., Inc. - Series E (b) (c) (d) (e) | | | 64,744 | | | | 3,354,386 | |
| | | | | | | | |
|
| Software—0.5% | |
Magic Leap, Inc. - Series C (b) (c) (d) (e) | | | 124,428 | | | | 3,359,556 | |
Magic Leap, Inc. - Series D (b) (c) (d) (e) | | | 90,348 | | | | 2,439,396 | |
UBER Technologies, Inc. (b) (c) (d) (e) | | | 1,703 | | | | 83,059 | |
UBER Technologies, Inc. - Series A (b) (c) (d) (e) | | | 665 | | | | 32,434 | |
UBER Technologies, Inc. - Series B (b) (c) (d) (e) | | | 1,785 | | | | 87,058 | |
UBER Technologies, Inc. -Series C-1 (b) (c) (d) (e) | | | 472 | | | | 23,020 | |
UBER Technologies, Inc. -Series C-2 (b) (c) (d) (e) | | | 382 | | | | 18,631 | |
UBER Technologies, Inc. -Series C-3 (b) (c) (d) (e) | | | 5 | | | | 244 | |
UBER Technologies, Inc. - Series D (b) (c) (d) (e) | | | 424 | | | | 20,679 | |
UBER Technologies, Inc. - Series E (b) (c) (d) (e) | | | 204 | | | | 9,950 | |
UBER Technologies, Inc. - Series G (b) (c) (d) (e) | | | 98,227 | | | | 4,790,750 | |
UBER Technologies, Inc. -Series G-1 (b) (c) (d) (e) | | | 1,024 | | | | 49,943 | |
| | | | | | | | |
| | | | | | | 10,914,720 | |
| | | | | | | | |
Total Convertible Preferred Stocks
(Cost $28,001,590) | | | | | | | 39,619,727 | |
| | | | | | | | |
|
| Corporate Bonds & Notes—0.2% | |
|
| Lodging—0.2% | |
Caesars Entertainment Corp.
5.000%, 10/01/24
(Cost $5,801,535) | | | 3,089,799 | | | | 3,835,262 | |
| | | | | | | | |
|
| Short-Term Investment—0.4% | |
|
| Mutual Fund—0.4% | |
T. Rowe Price Government Reserve Fund (f) | | | 7,899,784 | | | | 7,899,784 | |
| | | | | | | | |
Total Short-Term Investments
(Cost $7,899,784) | | | | | | | 7,899,784 | |
| | | | | | | | |
|
| Securities Lending Reinvestments (g)—10.1% | |
|
| Certificates of Deposit—6.5% | |
| Banco Del Estado De Chile New York | |
2.695%, 1M LIBOR + 0.240%, 01/17/19 (h) | | | 1,000,000 | | | | 999,991 | |
2.720%, 1M LIBOR + 0.250%, 03/20/19 (h) | | | 3,000,000 | | | | 2,999,742 | |
Bank of Montreal (Chicago)
2.710%, 1M LIBOR + 0.330%, 08/06/19 (h) | | | 6,000,000 | | | | 5,999,850 | |
Bank of Nova Scotia
3.072%, 3M LIBOR + 0.280%, 03/20/19 (h) | | | 4,000,000 | | | | 4,001,596 | |
Barclays Bank plc | |
2.500%, 02/01/19 | | | 2,000,000 | | | | 1,999,742 | |
2.547%, 1M LIBOR + 0.200%, 02/04/19 (h) | | | 1,500,000 | | | | 1,499,858 | |
See accompanying notes to financial statements.
BHFTII-5
Brighthouse Funds Trust II
T. Rowe Price Large Cap Growth Portfolio
Schedule of Investments as of December 31, 2018
Securities Lending Reinvestments (g)—(Continued)
| | | | | | | | |
| Security Description | | Principal
Amount* | | | Value | |
|
| Certificates of Deposit—(Continued) | |
Canadian Imperial Bank of Commerce
2.556%, 3M LIBOR + 0.120%, 01/14/19 (h) | | | 2,500,000 | | | $ | 2,499,680 | |
China Construction Bank Corp.
| |
2.550%, 01/07/19 | | | 2,000,000 | | | | 2,000,000 | |
Citibank N.A.
2.490%, 02/04/19 | | | 3,000,000 | | | | 2,999,583 | |
| Commonwealth Bank of Australia | |
2.617%, 3M LIBOR + 0.140%, 04/23/19 (h) | | | 2,000,000 | | | | 2,000,006 | |
2.642%, 1M LIBOR + 0.210%, 09/13/19 (h) | | | 2,000,000 | | | | 2,000,000 | |
Cooperative Rabobank UA
2.608%, 3M LIBOR + 0.200%, 04/05/19 (h) | | | 2,000,000 | | | | 2,000,628 | |
Credit Agricole S.A.
2.500%, 02/12/19 | | | 5,000,000 | | | | 4,999,150 | |
Credit Industriel et Commercial
Zero Coupon, 01/25/19 | | | 6,342,941 | | | | 6,414,077 | |
| Credit Suisse AG | |
2.620%, 04/01/19 | | | 3,000,000 | | | | 2,998,446 | |
2.890%, SOFR + 0.430%, 05/02/19 (h) | | | 1,000,000 | | | | 999,988 | |
Industrial & Commercial Bank of China, Ltd.
2.850%, 02/15/19 | | | 3,000,000 | | | | 2,999,778 | |
Mitsubishi UFJ Trust and Banking Corp.
Zero Coupon, 01/15/19 | | | 3,969,950 | | | | 3,995,920 | |
MUFG Bank Ltd.
2.649%, 1M LIBOR + 0.300%, 05/01/19 (h) | | | 2,000,000 | | | | 2,000,012 | |
| Natixis New York | |
2.705%, 3M LIBOR + 0.090%, 05/10/19 (h) | | | 2,500,000 | | | | 2,498,425 | |
2.731%, 3M LIBOR + 0.190%, 02/01/19 (h) | | | 3,000,000 | | | | 2,999,328 | |
| Royal Bank of Canada New York | |
2.650%, 1M LIBOR + 0.250%, 01/11/19 (h) | | | 6,000,000 | | | | 6,000,048 | |
2.665%, 1M LIBOR + 0.210%, 09/17/19 (h) | | | 7,000,000 | | | | 6,992,839 | |
Skandinaviska Enskilda Banken
2.645%, 1M LIBOR + 0.190%, 04/17/19 (h) | | | 6,000,000 | | | | 5,999,508 | |
Societe Generale
2.719%, 3M LIBOR + 0.160%, 05/07/19 (h) | | | 2,000,000 | | | | 1,999,112 | |
Standard Chartered plc
2.686%, 1M LIBOR + 0.180%, 02/25/19 (h) | | | 6,000,000 | | | | 5,999,826 | |
State Street Bank and Trust
2.725%, 1M LIBOR + 0.270%, 05/15/19 (h) | | | 7,000,000 | | | | 6,999,860 | |
Sumitomo Mitsui Banking Corp.
2.590%, 1M LIBOR + 0.190%, 04/11/19 (h) | | | 4,000,000 | | | | 3,998,532 | |
| Sumitomo Mitsui Banking Corp., New York | |
2.549%, 1M LIBOR + 0.200%, 04/03/19 (h) | | | 2,000,059 | | | | 1,999,408 | |
2.559%, 1M LIBOR + 0.180%, 03/05/19 (h) | | | 3,000,000 | | | | 2,999,289 | |
2.665%, 1M LIBOR + 0.210%, 05/17/19 (h) | | | 4,000,000 | | | | 3,998,320 | |
Sumitomo Mitsui Trust Bank, Ltd.
Zero Coupon, 02/08/19 | | | 3,965,612 | | | | 3,988,640 | |
| Svenska Handelsbanken AB | |
2.620%, 3M LIBOR + 0.100%, 04/30/19 (h) | | | 2,000,000 | | | | 1,999,910 | |
2.822%, 1M LIBOR + 0.300%, 10/31/19 (h) | | | 2,000,000 | | | | 1,999,532 | |
Toronto-Dominion Bank
2.665%, 1M LIBOR + 0.210%, 09/17/19 (h) | | | 5,000,000 | | | | 4,995,240 | |
U.S. Bank N.A.
2.764%, 1M LIBOR + 0.260%, 07/23/19 (h) | | | 1,000,000 | | | | 1,000,000 | |
Wells Fargo Bank N.A.
2.560%, 3M LIBOR + 0.140%, 07/11/19 (h) | | | 9,000,000 | | | | 9,007,807 | |
|
| Certificates of Deposit—(Continued) | |
Westpac Banking Corp.
2.850%, FEDEFF PRV + 0.450%, 02/15/19 (h) | | | 5,500,000 | | | | 5,499,965 | |
| | | | | | | | |
| | | | | | | 136,383,636 | |
| | | | | | | | |
|
| Commercial Paper—1.6% | |
Alpine Securities Ltd.
2.529%, 1M LIBOR + 0.180%, 04/03/19 (h) | | | 4,000,000 | | | | 3,998,892 | |
Banco Santander S.A.
| |
2.740%, 02/07/19 | | | 4,964,989 | | | | 4,985,440 | |
| ING Funding LLC | |
2.707%, 1M LIBOR + 0.320%, 02/08/19 (h) | | | 8,000,000 | | | | 8,000,744 | |
2.725%, 3M LIBOR + 0.110%, 05/10/19 (h) | | | 2,000,000 | | | | 1,999,764 | |
Matchpoint Finance plc
2.890%, 05/08/19 | | | 4,927,349 | | | | 4,946,265 | |
Sheffield Receivables Co.
2.930%, SOFR + 0.470%, 05/30/19 (h) | | | 1,000,000 | | | | 999,984 | |
UBS AG
2.779%, 1M LIBOR + 0.430%, 02/01/19 (h) | | | 5,000,000 | | | | 5,001,225 | |
Westpac Banking Corp.
2.784%, 1M LIBOR + 0.280%, 05/24/19 (h) | | | 3,000,000 | | | | 2,999,880 | |
| | | | | | | | |
| | | | | | | 32,932,194 | |
| | | | | | | | |
|
| Repurchase Agreements — 2.0% | |
Citadel Clearing LLC
Repurchase Agreement dated 12/31/18 at 3.000%, due on 04/02/19 with a maturity value of $10,076,667; collateralized by various Common Stock with an aggregate market value of $11,001,834. | | | 10,000,000 | | | | 10,000,000 | |
Citigroup Global Markets, Inc.
Repurchase Agreement dated 12/31/18 at 2.790%, due on 02/04/19 with a maturity value of $3,509,494; collateralized by U.S. Treasury Obligations at 0.000%, maturing 02/12/19, and various Common Stock with an aggregate market value of $3,809,115. | | | 3,500,000 | | | | 3,500,000 | |
Repurchase Agreement dated 12/31/18 at 2.940%, due on 04/02/19 with a maturity value of $1,511,270; collateralized by U.S. Treasury Obligations with rates ranging from 1.125% - 2.750%, maturity dates ranging from 01/31/19 - 08/15/24, and an aggregate market value of $1,530,000. | | | 1,500,000 | | | | 1,500,000 | |
Deutsche Bank Securities, Inc.
Repurchase Agreement dated 12/31/18 at 3.200%, due on 01/02/19 with a maturity value of $7,110,320; collateralized by U.S. Treasury Obligations at 0.000%, maturity dates ranging from 08/15/30 - 08/15/39, and an aggregate market value of $7,251,237. | | | 7,109,056 | | | | 7,109,056 | |
Merrill Lynch, Pierce, Fenner & Smith, Inc.
Repurchase Agreement dated 12/31/18 at 2.940%, due on 04/02/19 with a maturity value of $7,556,350; collateralized by various Common Stock with an aggregate market value of $8,250,000. | | | 7,500,000 | | | | 7,500,000 | |
See accompanying notes to financial statements.
BHFTII-6
Brighthouse Funds Trust II
T. Rowe Price Large Cap Growth Portfolio
Schedule of Investments as of December 31, 2018
Securities Lending Reinvestments (g)—(Continued)
| | | | | | | | |
| Security Description | | Principal
Amount* | | | Value | |
|
| Repurchase Agreements —(Continued) | |
NBC Global Finance, Ltd.
Repurchase Agreement dated 12/31/18 at 2.560%, due on 01/02/19 with a maturity value of $12,001,707; collateralized by various Common Stock with an aggregate market value of $13,358,547. | | | 12,000,000 | | | $ | 12,000,000 | |
| | | | | | | | |
| | | | | | | 41,609,056 | |
| | | | | | | | |
Total Securities Lending Reinvestments
(Cost $210,945,413) | | | | | | | 210,924,886 | |
| | | | | | | | |
Total Investments—110.0%
(Cost $1,921,623,196) | | | | | | | 2,305,693,212 | |
Other assets and liabilities (net)—(10.0)% | | | | | | | (208,692,366 | ) |
| | | | | | | | |
| Net Assets—100.0% | | | | | | $ | 2,097,000,846 | |
| | | | | | | | |
| | | | |
| | | | |
| * | | Principal amount stated in U.S. dollars unless otherwise noted. |
| (a) | | All or a portion of the security was held on loan. As of December 31, 2018, the market value of securities loaned was $207,227,983 and the collateral received consisted of cash in the amount of $210,779,955. The cash collateral investments are disclosed in the Schedule of Investments and categorized as Securities Lending Reinvestments. |
| (b) | | Non-income producing security. |
| (c) | | Security was valued in good faith under procedures approved by the Board of Trustees. As of December 31, 2018, these securities represent 1.9% of net assets. |
| (d) | | Restricted securities are not registered under the Securities Act of 1933 and are subject to legal restrictions on resale. These securities generally may be resold in transactions exempt from registration or to the public if the securities are subsequently registered. Disposal of these securities may involve time-consuming negotiations and prompt sale at an acceptable price may be difficult. As of December 31, 2018, the market value of restricted securities was $39,980,234, which is 1.9% of net assets. See details shown in the Restricted Securities table that follows. |
| (e) | | Significant unobservable inputs were used in the valuation of this portfolio security; i.e. Level 3. |
| (f) | | Affiliated Issuer. (See Note 6 of the Notes to Financial Statements for a summary of transactions in securities of affiliated issuers.) |
| (g) | | Represents investment of cash collateral received from securities on loan as of December 31, 2018. |
| (h) | | Variable or floating rate security. The stated rate represents the rate at December 31, 2018. Maturity date shown for callable securities reflects the earliest possible call date. For securities based on a published reference index and spread, the index and spread are indicated in the description above. For certain variable rate securities, the coupon rate is determined by the issuer/agent based on current market conditions. For certain asset- and mortgage-backed securities, the coupon rate may fluctuate based on changes of the underlying collateral or prepayments of principal. These securities do not indicate a reference index and spread in their description above. |
| (ADR)— | | American Depositary Receipt |
| (FEDEFF PRV)— | | Effective Federal Funds Rate |
| (LIBOR)— | | London Interbank Offered Rate |
| (SOFR)— | | Secured Overnight Financing Rate |
| | | | | | | | | | | | | | | | |
Restricted Securities | | Acquisition
Date | | | Shares | | | Cost | | | Value | |
ANT International Co., Ltd. - Series C | | | 06/07/18 | | | | 1,458,697 | | | $ | 8,183,290 | | | $ | 8,183,290 | |
Airbnb, Inc. - Series D | | | 04/16/14 | | | | 97,047 | | | | 3,951,078 | | | | 11,718,425 | |
Airbnb, Inc. - Series E | | | 01/28/16 | | | | 9,760 | | | | 908,601 | | | | 1,178,520 | |
Magic Leap, Inc. - Series C | | | 01/20/16 | | | | 124,428 | | | | 2,865,950 | | | | 3,359,556 | |
Magic Leap, Inc. - Series D | | | 10/12/17 | | | | 90,348 | | | | 2,439,396 | | | | 2,439,396 | |
UBER Technologies, Inc. | | | 01/16/18 | | | | 1,703 | | | | 56,146 | | | | 83,059 | |
UBER Technologies, Inc. - Class A | | | 01/16/18 | | | | 4,669 | | | | 153,932 | | | | 227,718 | |
UBER Technologies, Inc. - Series A | | | 01/16/18 | | | | 665 | | | | 21,924 | | | | 32,434 | |
UBER Technologies, Inc. - Series B | | | 01/16/18 | | | | 1,785 | | | | 58,850 | | | | 87,058 | |
UBER Technologies, Inc. -Series C-1 | | | 01/16/18 | | | | 472 | | | | 15,561 | | | | 23,020 | |
UBER Technologies, Inc. -Series C-2 | | | 01/16/18 | | | | 382 | | | | 12,594 | | | | 18,631 | |
UBER Technologies, Inc. -Series C-3 | | | 01/16/18 | | | | 5 | | | | 165 | | | | 244 | |
UBER Technologies, Inc. - Series D | | | 01/16/18 | | | | 424 | | | | 13,979 | | | | 20,679 | |
UBER Technologies, Inc. - Series E | | | 01/16/18 | | | | 204 | | | | 6,726 | | | | 9,950 | |
UBER Technologies, Inc. - Series G | | | 12/03/15 | | | | 98,227 | | | | 4,790,747 | | | | 4,790,750 | |
UBER Technologies, Inc. -Series G-1 | | | 01/16/18 | | | | 1,024 | | | | 49,943 | | | | 49,943 | |
WeWork Cos., Inc. - Class A | | | 06/23/15 | | | | 2,563 | | | | 84,296 | | | | 132,789 | |
WeWork Cos., Inc. - Series E | | | 06/23/15 | | | | 64,744 | | | | 2,129,402 | | | | 3,354,386 | |
Xiaoju Kuaizhi, Inc. -Series A-17 | | | 10/19/15 | | | | 91,053 | | | | 2,497,238 | | | | 4,270,386 | |
| | | | | | | | | | | | | | | | |
| | | | | | | | | | | | | | $ | 39,980,234 | |
| | | | | | | | | | | | | | | | |
| |
See accompanying notes to financial statements.
BHFTII-7
Brighthouse Funds Trust II
T. Rowe Price Large Cap Growth Portfolio
Schedule of Investments as of December 31, 2018
Fair Value Hierarchy
Accounting principles generally accepted in the United States of America (“GAAP”) define fair market value as the price that the Portfolio would receive to sell an asset or pay to transfer a liability in an orderly transaction between market participants at the measurement date. It establishes a fair value hierarchy that prioritizes inputs to valuation methods and requires disclosure of the fair value hierarchy, separately for each major category of assets and liabilities, that segregates fair value measurements into three levels. Levels 1, 2 and 3 of the fair value hierarchy are defined as follows:
Level 1 - unadjusted quoted prices in active markets for identical investments
Level 2 - other significant observable inputs (including, but not limited to, quoted prices for similar assets or liabilities in markets that are either active or inactive; inputs other than quoted prices that are observable such as interest rates, yield curves, volatilities, prepayment speeds, loss severities, credit risks, default rates, or other market corroborated inputs)
Level 3 - significant unobservable inputs based on the best information available in the circumstances, to the extent observable inputs are unavailable (including the Portfolio’s own assumptions used in determining the fair value of investments and derivative financial instruments)
The inputs or methodologies used for valuing investments are not necessarily an indication of the risk associated with investing in them. Changes to the inputs or methodologies used may result in transfers between levels. A reconciliation of Level 3 securities, if any, will be disclosed following the fair value hierarchy table. For more information about the Portfolio’s policy regarding the valuation of investments, please refer to the Notes to Financial Statements.
The following table summarizes the fair value hierarchy of the Portfolio’s investments as of December 31, 2018:
| | | | | | | | | | | | | | | | |
| Description | | Level 1 | | | Level 2 | | | Level 3 | | | Total | |
| Common Stocks | |
Aerospace & Defense | | $ | 91,945,650 | | | $ | — | | | $ | — | | | $ | 91,945,650 | |
Auto Components | | | 18,364,484 | | | | — | | | | — | | | | 18,364,484 | |
Automobiles | | | 42,395,102 | | | | — | | | | — | | | | 42,395,102 | |
Banks | | | 10,164,097 | | | | — | | | | — | | | | 10,164,097 | |
Biotechnology | | | 47,001,848 | | | | — | | | | — | | | | 47,001,848 | |
Capital Markets | | | 82,507,685 | | | | — | | | | — | | | | 82,507,685 | |
Chemicals | | | 14,797,916 | | | | — | | | | — | | | | 14,797,916 | |
Electric Utilities | | | 9,507,954 | | | | — | | | | — | | | | 9,507,954 | |
Entertainment | | | 86,116,092 | | | | — | | | | — | | | | 86,116,092 | |
Equity Real Estate Investment Trusts | | | 10,774,575 | | | | — | | | | — | | | | 10,774,575 | |
Health Care Equipment & Supplies | | | 111,665,159 | | | | — | | | | — | | | | 111,665,159 | |
Health Care Providers & Services | | | 160,841,943 | | | | — | | | | — | | | | 160,841,943 | |
Hotels, Restaurants & Leisure | | | 58,257,633 | | | | — | | | | — | | | | 58,257,633 | |
Household Durables | | | 8,407,616 | | | | — | | | | — | | | | 8,407,616 | |
Industrial Conglomerates | | | 30,155,204 | | | | — | | | | — | | | | 30,155,204 | |
Insurance | | | 16,592,913 | | | | — | | | | — | | | | 16,592,913 | |
Interactive Media & Services | | | 218,370,889 | | | | 47,031,110 | | | | — | | | | 265,401,999 | |
Internet & Direct Marketing Retail | | | 258,689,738 | | | | — | | | | — | | | | 258,689,738 | |
IT Services | | | 211,941,997 | | | | — | | | | — | | | | 211,941,997 | |
Machinery | | | 27,610,213 | | | | — | | | | — | | | | 27,610,213 | |
Multi-Utilities | | | 18,283,136 | | | | — | | | | — | | | | 18,283,136 | |
Multiline Retail | | | 38,828,744 | | | | — | | | | — | | | | 38,828,744 | |
Pharmaceuticals | | | 5,936,436 | | | | — | | | | — | | | | 5,936,436 | |
Professional Services | | | 32,099,490 | | | | — | | | | — | | | | 32,099,490 | |
Real Estate Management & Development | | | — | | | | — | | | | 132,789 | | | | 132,789 | |
Semiconductors & Semiconductor Equipment | | | 32,788,626 | | | | — | | | | — | | | | 32,788,626 | |
Software | | | 287,659,699 | | | | — | | | | 227,718 | | | | 287,887,417 | |
Technology Hardware, Storage & Peripherals | | | 16,073,391 | | | | — | | | | — | | | | 16,073,391 | |
Textiles, Apparel & Luxury Goods | | | 23,734,661 | | | | — | | | | — | | | | 23,734,661 | |
Tobacco | | | 20,510,808 | | | | — | | | | — | | | | 20,510,808 | |
Water Utilities | | | 3,998,237 | | | | — | | | | — | | | | 3,998,237 | |
Total Common Stocks | | | 1,996,021,936 | | | | 47,031,110 | | | | 360,507 | | | | 2,043,413,553 | |
Total Convertible Preferred Stocks* | | | — | | | | — | | | | 39,619,727 | | | | 39,619,727 | |
Total Corporate Bonds & Notes* | | | — | | | | 3,835,262 | | | | — | | | | 3,835,262 | |
Total Short-Term Investment* | | | 7,899,784 | | | | — | | | | — | | | | 7,899,784 | |
Total Securities Lending Reinvestments* | | | — | | | | 210,924,886 | | | | — | | | | 210,924,886 | |
Total Investments | | $ | 2,003,921,720 | | | $ | 261,791,258 | | | $ | 39,980,234 | | | $ | 2,305,693,212 | |
| | | | | | | | | | | | | | | | | |
Collateral for Securities Loaned (Liability) | | $ | — | | | $ | (210,779,955 | ) | | $ | — | | | $ | (210,779,955 | ) |
| * | See Schedule of Investments for additional detailed categorizations. |
During the year ended December 31, 2018, transfers out of Level 3 into Level 2 in the amount of $2,514,875 were due to the initiation of trading activity which resulted in the availability of significant observable inputs.
See accompanying notes to financial statements.
BHFTII-8
Brighthouse Funds Trust II
T. Rowe Price Large Cap Growth Portfolio
Schedule of Investments as of December 31, 2018
Following is a reconciliation of Level 3 assets for which significant unobservable inputs were used to determine fair value:
| | | | | | | | | | | | | | | | | | | | | | | | |
Investments in Securities | | Balance as of
December 31,
2017 | | | Change in
Unrealized
Appreciation | | | Purchases | | | Transfers Out | | | Balance as of
December 31,
2018 | | | Change in
Unrealized
Appreciation
from Investments
Held at
December 31,
2018 | |
| Common Stocks | | | | | | | | | | | | | | | | | | | | | | | | |
Internet Software & Services | | $ | 2,514,875 | | | $ | — | | | $ | — | | | $ | (2,514,875 | ) | | $ | — | | | $ | — | |
Real Estate Management & Development | | | 117,514 | | | | 15,275 | | | | — | | | | — | | | | 132,789 | | |
| 15,275
|
|
Software | | | — | | | | 73,786 | | | | 153,932 | | | | — | | | | 227,718 | | | | 73,786 | |
| Convertible Preferred Stocks | | | | | | | | | | | | | | | | | | | | | | | | |
Internet & Direct Retail Marketing | | | 15,962,267 | | | | 1,205,065 | | | | 8,183,289 | | | | — | | | | 25,350,621 | | | | 1,205,065 | |
Real Estate Management & Development | | | 2,968,512 | | | | 385,874 | | | | — | | | | — | | | | 3,354,386 | | | | 385,874 | |
Software | | | 9,185,564 | | | | 1,493,269 | | | | 235,887 | | | | — | | | | 10,914,720 | | | | 1,493,269 | |
| | | | | | | | | | | | | | | | | | | | | | | | |
| | $ | 30,748,732 | | | $ | 3,173,269 | | | $ | 8,573,108 | | | $ | (2,514,875 | ) | | $ | 39,980,234 | | | $ | 3,173,269 | |
| | | | | | | | | | | | | | | | | | | | | | | | |
| | | | | | | | | | | | | | | | | | | | | | | | | | | | |
| | | Fair Value at
December 31,
2018 | | | Valuation Technique(s) | | | Unobservable Input | | | Range | | | Weighted
Average | | | Relationship Between
Fair Value and Input;
if input value
increases then
Fair Value: | |
| Common Stock | | | | | | | | | | | | | | | | | | | | | | | | | | | | |
Real Estate Management & Development | | $ | 132,789 | | | | Market Transaction Method | | | | Precedent Transaction | | | $ | 51.81 | | | $ | 51.81 | | | $ | 51.81 | | | | Increase | |
Software | | | 227,718 | | | | Market Transaction Method | | | | Precedent Transaction | | | $ | 48.77 | | | $ | 48.77 | | | $ | 48.77 | | | | Increase | |
| Convertible Preferred Stocks | | | | | | | | | | | | | | | | | | | | | | | | | | | | |
Internet & Direct Marketing Retail | | | 12,896,945 | | | | Discounted Cash Flow | | | | Weighted Average Cost of Capital | | | | 14.00 | % | | | 16.00 | % | | | 15.00 | % | | | Decrease | |
| | | | | | | | | | | Perpetual Growth Rate | | | | 3.00 | % | | | 4.00 | % | | | 3.50 | % | | | Increase | |
| | | | | | | Comparable Company Analysis | | | | Enterprise Value/Revenue | | | | 8.7x | | | | 8.7x | | | | 8.7x | | | | Increase | |
| | | | | | | | | |
| Discount for Lack of
Marketability |
| | | 15.00 | % | | | 15.00 | % | | | 15.00 | % | | | Decrease | |
| | | 8,183,290 | | | | Market Transaction Method | | | | Precedent Transaction | | | $ | 5.61 | | | $ | 5.61 | | | $ | 5.61 | | | | Increase | |
| | | 4,270,386 | | | | Market Transaction Method | | | | Secondary Market Transaction | | | $ | 46.90 | | | $ | 46.90 | | | $ | 46.90 | | | | Increase | |
Real Estate Management & Development | | | 3,354,386 | | | | Market Transaction Method | | | | Precedent Transaction | | | $ | 51.81 | | | $ | 51.81 | | | $ | 51.81 | | | | Increase | |
Software | | | 5,798,952 | | | | Market Transaction Method | | | | Precedent Transaction | | | $ | 27.00 | | | $ | 27.00 | | | $ | 27.00 | | | | Increase | |
| | | 5,115,768 | | | | Market Transaction Method | | | | Precedent Transaction | | | $ | 48.77 | | | $ | 48.77 | | | $ | 48.77 | | | | Increase | |
See accompanying notes to financial statements.
BHFTII-9
Brighthouse Funds Trust II
T. Rowe Price Large Cap Growth Portfolio
Statement of Assets and Liabilities
December 31, 2018
| | | | |
Assets | |
Investments at value (a) (b) | | $ | 2,297,793,428 | |
Affiliated investments at value (c) | | | 7,899,784 | |
Cash | | | 3,588,679 | |
Receivable for: | |
Fund shares sold | | | 433,721 | |
Dividends and interest | | | 933,128 | |
Dividends on affiliated investments | | | 14,799 | |
Prepaid expenses | | | 6,558 | |
| | | | |
Total Assets | | | 2,310,670,097 | |
Liabilities | |
Collateral for securities loaned | | | 210,779,955 | |
Payables for: | |
Affiliated investments purchased | | | 13,983 | |
Fund shares redeemed | | | 1,327,095 | |
Accrued Expenses: | |
Management fees | | | 961,927 | |
Distribution and service fees | | | 180,242 | |
Deferred trustees’ fees | | | 138,370 | |
Other expenses | | | 267,679 | |
| | | | |
Total Liabilities | | | 213,669,251 | |
| | | | |
Net Assets | | $ | 2,097,000,846 | |
| | | | |
Net Assets Consist of: | |
Paid in surplus | | $ | 1,359,557,733 | |
Distributable earnings (Accumulated losses) | | | 737,443,113 | |
| | | | |
Net Assets | | $ | 2,097,000,846 | |
| | | | |
Net Assets | |
Class A | | $ | 1,259,681,646 | |
Class B | | | 801,546,314 | |
Class E | | | 35,772,886 | |
Capital Shares Outstanding* | |
Class A | | | 60,813,327 | |
Class B | | | 39,586,954 | |
Class E | | | 1,746,219 | |
Net Asset Value, Offering Price and Redemption Price Per Share | |
Class A | | $ | 20.71 | |
Class B | | | 20.25 | |
Class E | | | 20.49 | |
| | | | |
| * | | The Portfolio is authorized to issue an unlimited number of shares. |
| (a) | | Identified cost of investments, excluding affiliated investments, was $1,913,723,412. |
| (b) | | Includes securities loaned at value of $207,227,983. |
| (c) | | Identified cost of affiliated investments was $7,899,784. |
Statement of Operations
Year Ended December 31, 2018
| | | | |
Investment Income | |
Dividends (a) | | $ | 22,661,263 | |
Dividends from affiliated investments | | | 242,918 | |
Securities lending income | | | 1,656,728 | |
| | | | |
Total investment income | | | 24,560,909 | |
Expenses | |
Management fees | | | 14,739,113 | |
Administration fees | | | 85,967 | |
Custodian and accounting fees | | | 177,654 | |
Distribution and service fees—Class B | | | 2,261,941 | |
Distribution and service fees—Class E | | | 63,775 | |
Audit and tax services | | | 49,450 | |
Legal | | | 45,316 | |
Trustees’ fees and expenses | | | 33,734 | |
Shareholder reporting | | | 144,095 | |
Insurance | | | 15,803 | |
Miscellaneous | | | 32,319 | |
| | | | |
Total expenses | | | 17,649,167 | |
Less management fee waiver | | | (1,868,828 | ) |
| | | | |
Net expenses | | | 15,780,339 | |
| | | | |
Net Investment Income | | | 8,780,570 | |
| | | | |
Net Realized and Unrealized Gain (Loss) | |
| Net realized gain on: | |
Investments | | | 349,015,336 | |
Foreign currency transactions | | | 49,691 | |
| | | | |
Net realized gain | | | 349,065,027 | |
| | | | |
| Net change in unrealized depreciation on: | |
Investments | | | (345,001,691 | ) |
Foreign currency transactions | | | (514 | ) |
| | | | |
Net change in unrealized depreciation | | | (345,002,205 | ) |
| | | | |
Net realized and unrealized gain | | | 4,062,822 | |
| | | | |
Net Increase in Net Assets From Operations | | $ | 12,843,392 | |
| | | | |
| | | | |
| (a) | | Net of foreign withholding taxes of $37,263. |
See accompanying notes to financial statements.
BHFTII-10
Brighthouse Funds Trust II
T. Rowe Price Large Cap Growth Portfolio
Statements of Changes in Net Assets
| | | | | | | | |
| | | Year Ended
December 31,
2018 | | | Year Ended
December 31,
2017 | |
Increase (Decrease) in Net Assets: | |
From Operations | |
Net investment income | | $ | 8,780,570 | | | $ | 8,104,959 | |
Net realized gain | | | 349,065,027 | | | | 438,536,537 | |
Net change in unrealized appreciation (depreciation) | | | (345,002,205 | ) | | | 249,571,128 | |
| | | | | | | | |
Increase in net assets from operations | | | 12,843,392 | | | | 696,212,624 | |
| | | | | | | | |
From Distributions to Shareholders(a) | |
Class A | | | (271,386,065 | ) | | | (97,483,508 | ) |
Class B | | | (166,263,941 | ) | | | (49,676,108 | ) |
Class E | | | (7,721,716 | ) | | | (2,482,284 | ) |
| | | | | | | | |
Total distributions | | | (445,371,722 | ) | | | (149,641,900 | ) |
| | | | | | | | |
Increase (decrease) in net assets from capital share transactions | | | 17,870,692 | | | | (255,810,822 | ) |
| | | | | | | | |
Total increase (decrease) in net assets | | | (414,657,638 | ) | | | 290,759,902 | |
|
Net Assets | |
Beginning of period | | | 2,511,658,484 | | | | 2,220,898,582 | |
| | | | | | | | |
End of period | | $ | 2,097,000,846 | | | $ | 2,511,658,484 | (b) |
| | | | | | | | |
Other Information:
Capital Shares
Transactions in capital shares were as follows:
| | | | | | | | | | | | | | | | |
| | | Year Ended
December 31, 2018 | | | Year Ended
December 31, 2017 | |
| | | Shares | | | Value | | | Shares | | | Value | |
Class A | |
Sales | | | 1,071,438 | | | $ | 25,857,156 | | | | 1,123,384 | | | $ | 26,033,368 | |
Reinvestments | | | 11,572,967 | | | | 271,386,065 | | | | 4,315,339 | | | | 97,483,508 | |
Redemptions | | | (14,768,688 | ) | | | (378,968,481 | ) | | | (15,467,076 | ) | | | (358,976,021 | ) |
| | | | | | | | | | | | | | | | |
Net decrease | | | (2,124,283 | ) | | $ | (81,725,260 | ) | | | (10,028,353 | ) | | $ | (235,459,145 | ) |
| | | | | | | | | | | | | | | | |
Class B | |
Sales | | | 4,128,655 | | | $ | 99,633,158 | | | | 3,239,197 | | | $ | 74,238,132 | |
Reinvestments | | | 7,241,461 | | | | 166,263,941 | | | | 2,236,655 | | | | 49,676,108 | |
Redemptions | | | (6,964,316 | ) | | | (167,472,503 | ) | | | (6,233,618 | ) | | | (142,249,231 | ) |
| | | | | | | | | | | | | | | | |
Net increase (decrease) | | | 4,405,800 | | | $ | 98,424,596 | | | | (757,766 | ) | | $ | (18,334,991 | ) |
| | | | | | | | | | | | | | | | |
Class E | |
Sales | | | 142,194 | | | $ | 3,592,923 | | | | 120,859 | | | $ | 2,766,535 | |
Reinvestments | | | 332,689 | | | | 7,721,716 | | | | 110,767 | | | | 2,482,284 | |
Redemptions | | | (410,066 | ) | | | (10,143,283 | ) | | | (311,052 | ) | | | (7,265,505 | ) |
| | | | | | | | | | | | | | | | |
Net increase (decrease) | | | 64,817 | | | $ | 1,171,356 | | | | (79,426 | ) | | $ | (2,016,686 | ) |
| | | | | | | | | | | | | | | | |
Increase (decrease) derived from capital shares transactions | | | | | | $ | 17,870,692 | | | | | | | $ | (255,810,822 | ) |
| | | | | | | | | | | | | | | | |
| | | | |
| (a) | | Distributions from net investment income and realized gains are no longer required to be separately disclosed. The presentation for the year ended December 31, 2018 has been adjusted for this change (See Note 9). At December 31, 2017 the distributions were as follows. |
| | | | | | | | |
| | | Distributions from net
investment income: | | | Distributions from realized
capital gains: | |
Class A | | $ | (4,707,453 | ) | | $ | (92,776,055 | ) |
Class B | | | (690,425 | ) | | | (48,985,683 | ) |
Class E | | | (68,054 | ) | | | (2,414,230 | ) |
| | | | |
| (b) | | As part of the update in (a), it is also no longer required to disclose the Undistributed net investment income (Accumulated losses) which was $7,648,501 as of December 31, 2017. |
See accompanying notes to financial statements.
BHFTII-11
Brighthouse Funds Trust II
T. Rowe Price Large Cap Growth Portfolio
Financial Highlights
| | | | | | | | | | | | | | | | | | | | |
| Selected per share data | |
| | | Class A | |
| | | Year Ended December 31, | |
| | | 2018 | | | 2017 | | | 2016 | | | 2015 | | | 2014 | |
Net Asset Value, Beginning of Period | | $ | 25.34 | | | $ | 20.18 | | | $ | 22.70 | | | $ | 24.76 | | | $ | 24.51 | |
| | | | | | | | | | | | | | | | | | | | |
Income (Loss) from Investment Operations | |
Net investment income (a) | | | 0.11 | | | | 0.10 | | | | 0.07 | (b) | | | 0.04 | | | | 0.04 | |
Net realized and unrealized gain | | | 0.23 | | | | 6.55 | | | | 0.13 | | | | 2.55 | | | | 1.94 | |
| | | | | | | | | | | | | | | | | | | | |
Total income (loss) from investment operations | | | 0.34 | | | | 6.65 | | | | 0.20 | | | | 2.59 | | | | 1.98 | |
| | | | | | | | | | | | | | | | | | | | |
Less Distributions | |
Distributions from net investment income | | | (0.11 | ) | | | (0.07 | ) | | | (0.01 | ) | | | (0.04 | ) | | | (0.02 | ) |
Distributions from net realized capital gains | | | (4.86 | ) | | | (1.42 | ) | | | (2.71 | ) | | | (4.61 | ) | | | (1.71 | ) |
| | | | | | | | | | | | | | | | | | | | |
Total distributions | | | (4.97 | ) | | | (1.49 | ) | | | (2.72 | ) | | | (4.65 | ) | | | (1.73 | ) |
| | | | | | | | | | | | | | | | | | | | |
Net Asset Value, End of Period | | $ | 20.71 | | | $ | 25.34 | | | $ | 20.18 | | | $ | 22.70 | | | $ | 24.76 | |
| | | | | | | | | | | | | | | | | | | | |
Total Return (%) (c) | | | (0.94 | ) | | | 33.86 | | | | 1.76 | | | | 10.78 | | | | 9.09 | |
|
Ratios/Supplemental Data | |
Gross ratio of expenses to average net assets (%) | | | 0.62 | | | | 0.63 | | | | 0.62 | | | | 0.62 | | | | 0.63 | |
Net ratio of expenses to average net assets (%) (d)(e) | | | 0.55 | | | | 0.56 | | | | 0.58 | | | | 0.58 | | | | 0.58 | |
Ratio of net investment income to average net assets (%) | | | 0.45 | | | | 0.42 | | | | 0.34 | (b) | | | 0.16 | | | | 0.15 | |
Portfolio turnover rate (%) | | | 39 | | | | 49 | | | | 42 | | | | 35 | | | | 34 | |
Net assets, end of period (in millions) | | $ | 1,259.7 | | | $ | 1,594.6 | | | $ | 1,472.7 | | | $ | 1,540.8 | | | $ | 1,710.2 | |
| |
| | | Class B | |
| | | Year Ended December 31, | |
| | | 2018 | | | 2017 | | | 2016 | | | 2015 | | | 2014 | |
Net Asset Value, Beginning of Period | | $ | 24.87 | | | $ | 19.84 | | | $ | 22.40 | | | $ | 24.51 | | | $ | 24.32 | |
| | | | | | | | | | | | | | | | | | | | |
Income (Loss) from Investment Operations | |
Net investment income (loss) (a) | | | 0.05 | | | | 0.04 | | | | 0.02 | (b) | | | (0.02 | ) | | | (0.02 | ) |
Net realized and unrealized gain | | | 0.24 | | | | 6.43 | | | | 0.13 | | | | 2.52 | | | | 1.92 | |
| | | | | | | | | | | | | | | | | | | | |
Total income (loss) from investment operations | | | 0.29 | | | | 6.47 | | | | 0.15 | | | | 2.50 | | | | 1.90 | |
| | | | | | | | | | | | | | | | | | | | |
Less Distributions | |
Distributions from net investment income | | | (0.05 | ) | | | (0.02 | ) | | | 0.00 | | | | 0.00 | | | | 0.00 | |
Distributions from net realized capital gains | | | (4.86 | ) | | | (1.42 | ) | | | (2.71 | ) | | | (4.61 | ) | | | (1.71 | ) |
| | | | | | | | | | | | | | | | | | | | |
Total distributions | | | (4.91 | ) | | | (1.44 | ) | | | (2.71 | ) | | | (4.61 | ) | | | (1.71 | ) |
| | | | | | | | | | | | | | | | | | | | |
Net Asset Value, End of Period | | $ | 20.25 | | | $ | 24.87 | | | $ | 19.84 | | | $ | 22.40 | | | $ | 24.51 | |
| | | | | | | | | | | | | | | | | | | | |
Total Return (%) (c) | | | (1.15 | ) | | | 33.47 | | | | 1.53 | | | | 10.51 | | | | 8.83 | |
|
Ratios/Supplemental Data | |
Gross ratio of expenses to average net assets (%) | | | 0.87 | | | | 0.88 | | | | 0.87 | | | | 0.87 | | | | 0.88 | |
Net ratio of expenses to average net assets (%) (d)(e) | | | 0.80 | | | | 0.81 | | | | 0.83 | | | | 0.83 | | | | 0.83 | |
Ratio of net investment income (loss) to average net assets (%) | | | 0.21 | | | | 0.17 | | | | 0.09 | (b) | | | (0.09 | ) | | | (0.09 | ) |
Portfolio turnover rate (%) | | | 39 | | | | 49 | | | | 42 | | | | 35 | | | | 34 | |
Net assets, end of period (in millions) | | $ | 801.5 | | | $ | 874.9 | | | $ | 712.9 | | | $ | 751.5 | | | $ | 642.4 | |
Please see following page for Financial Highlights footnote legend.
See accompanying notes to financial statements.
BHFTII-12
Brighthouse Funds Trust II
T. Rowe Price Large Cap Growth Portfolio
Financial Highlights
| | | | | | | | | | | | | | | | | | | | |
| Selected per share data | |
| | | Class E | |
| | | Year Ended December 31, | |
| | | 2018 | | | 2017 | | | 2016 | | | 2015 | | | 2014 | |
Net Asset Value, Beginning of Period | | $ | 25.11 | | | $ | 20.01 | | | $ | 22.55 | | | $ | 24.62 | | | $ | 24.40 | |
| | | | | | | | | | | | | | | | | | | | |
Income (Loss) from Investment Operations | |
Net investment income (a) | | | 0.07 | | | | 0.06 | | | | 0.04 | (b) | | | 0.00 | (f) | | | 0.00 | (f) |
Net realized and unrealized gain | | | 0.25 | | | | 6.50 | | | | 0.13 | | | | 2.54 | | | | 1.93 | |
| | | | | | | | | | | | | | | | | | | | |
Total income (loss) from investment operations | | | 0.32 | | | | 6.56 | | | | 0.17 | | | | 2.54 | | | | 1.93 | |
| | | | | | | | | | | | | | | | | | | | |
Less Distributions | |
Distributions from net investment income | | | (0.08 | ) | | | (0.04 | ) | | | 0.00 | | | | 0.00 | | | | 0.00 | |
Distributions from net realized capital gains | | | (4.86 | ) | | | (1.42 | ) | | | (2.71 | ) | | | (4.61 | ) | | | (1.71 | ) |
| | | | | | | | | | | | | | | | | | | | |
Total distributions | | | (4.94 | ) | | | (1.46 | ) | | | (2.71 | ) | | | (4.61 | ) | | | (1.71 | ) |
| | | | | | | | | | | | | | | | | | | | |
Net Asset Value, End of Period | | $ | 20.49 | | | $ | 25.11 | | | $ | 20.01 | | | $ | 22.55 | | | $ | 24.62 | |
| | | | | | | | | | | | | | | | | | | | |
Total Return (%) (c) | | | (1.05 | ) | | | 33.66 | | | | 1.61 | | | | 10.63 | | | | 8.93 | |
|
Ratios/Supplemental Data | |
Gross ratio of expenses to average net assets (%) | | | 0.77 | | | | 0.78 | | | | 0.77 | | | | 0.77 | | | | 0.78 | |
Net ratio of expenses to average net assets (%) (d)(e) | | | 0.70 | | | | 0.71 | | | | 0.73 | | | | 0.73 | | | | 0.73 | |
Ratio of net investment income to average net assets (%) | | | 0.30 | | | | 0.27 | | | | 0.19 | (b) | | | 0.01 | | | | 0.00 | (g) |
Portfolio turnover rate (%) | | | 39 | | | | 49 | | | | 42 | | | | 35 | | | | 34 | |
Net assets, end of period (in millions) | | $ | 35.8 | | | $ | 42.2 | | | $ | 35.2 | | | $ | 39.5 | | | $ | 38.1 | |
| | | | |
| (a) | | Per share amounts based on average shares outstanding during the period. |
| (b) | | Net investment income per share and the ratio of net investment income to average net assets include anon-recurring refund for overbilling of prior years’ custodianout-of-pocket fees which amounted to less than $0.01 per share and 0.02% of average net assets, respectively. |
| (c) | | Total return does not reflect any insurance, sales, separate account or administrative charges of variable annuity or life insurance contracts or any additional expenses that contract owners may bear under their variable contracts. If these charges were included, the returns would be lower. |
| (d) | | The effect of the voluntary portion of the waiver on the net ratio of expenses to average net assets was 0.02% for the year ended December 31, 2018 and 0.03% for each of the years ended December 31, 2017 through 2014 (see Note 5 of the Notes to Financial Statements). |
| (e) | | Includes the effects of management fee waivers (see Note 5 of the Notes to Financial Statements). |
| (f) | | Net investment income (loss) was less than $0.01. |
| (g) | | Ratio of net investment income (loss) to average net assets was less than 0.01%. |
See accompanying notes to financial statements.
BHFTII-13
Brighthouse Funds Trust II
T. Rowe Price Large Cap Growth Portfolio
Notes to Financial Statements—December 31, 2018
1. Organization
Brighthouse Funds Trust II (the “Trust”) is organized as a Delaware statutory trust and registered under the Investment Company Act of 1940, as amended (the “1940 Act”), as anopen-end management investment company. The Trust, which is managed by Brighthouse Investment Advisers, LLC (“Brighthouse Investment Advisers” or the “Adviser”), currently offers twenty-nine series, each of which operates as a distinct investment vehicle of the Trust. The series included in this report is T. Rowe Price Large Cap Growth Portfolio (the “Portfolio”), which is diversified. Shares in the Portfolio are not offered directly to the general public and are currently available only to separate accounts established by life insurance companies affiliated with the Adviser and Metropolitan Life Insurance Company (the “Insurance Companies”).
The Portfolio has registered and offers three classes of shares: Class A, B and E shares. Shares of each Class of the Portfolio represent an equal pro rata interest in the Portfolio and generally give the shareholder the same voting, dividend, liquidation, and other rights. Investment income, realized and unrealized capital gains and losses, the common expenses of the Portfolio, and certain Portfolio-level expense reductions, if any, are allocated on a pro rata basis to each Class based on the relative net assets of each Class to the net assets of the Portfolio. Each Class of shares differs in its respective distribution plan and such distribution expenses are allocated to the corresponding Class of shares.
2. Significant Accounting Policies
The preparation of financial statements in conformity with accounting principles generally accepted in the United States of America (“GAAP”) requires management to make estimates and assumptions that affect the reported amounts of assets and liabilities and disclosure of contingent assets and liabilities as of the date of the financial statements and the reported amounts of income and expenses during the reporting period. Actual results could differ from those estimates. In the preparation of these financial statements, management has evaluated events and transactions subsequent to December 31, 2018 through the date the financial statements were issued.
The Portfolio is an investment company and follows the accounting and reporting guidance of the Financial Accounting Standards Board (“FASB”) Accounting Standards Codification Topic 946—Financial Services—Investment Companies. The following is a summary of significant accounting policies consistently followed by the Portfolio in the preparation of its financial statements.
Investment Valuation and Fair Value Measurements - The Portfolio values its portfolio investments for purposes of calculating its net asset value (“NAV”) using procedures approved by the Board of Trustees of the Trust (the “Board” or “Trustees”). Those procedures allow for a variety of methodologies to be used to value the Portfolio’s investments. The specific methodologies used for a particular investment may vary based on the market data available for a specific investment at the time the Portfolio calculates its NAV or based on other considerations. The procedures also permit a level of judgment to be used in the valuation process. The Portfolio follows the accounting and reporting guidance of FASB Accounting Standards Codification Topic 820—Fair Value Measurement.
Domestic and foreign equity securities, such as common stock, exchange-traded funds, rights, warrants, and preferred stock, that are traded on a securities exchange on a valuation date are generally valued at their last quoted sale price or official closing price on the primary exchange for such security, or, if no sales occurred on that day, at the last reported bid price. Equity securities tradedover-the-counter (“OTC”) are generally valued at the last reported bid price. In the event of a major exchange closing during the trading day, the Adviser may use other market information obtained from quotation reporting systems, established market makers, or pricing services in valuing the securities. Valuation adjustments may be applied to certain foreign equity securities that are traded solely on foreign exchanges that close before the time as of which the Portfolio determines its NAV to account for the market movement between the close of the foreign exchanges and the time as of which the Portfolio determines its NAV. The Portfolio may use a systematic fair valuation model provided by a pricing service to value securities principally traded in these foreign markets in order to adjust for possible market movements or other changes that may occur between the close of the foreign exchanges and the time as of which the Portfolio determines its NAV. Foreign equity securities valued using these valuation adjustments are generally categorized as Level 2 within the fair value hierarchy. Equity securities that are actively traded, and have no valuation adjustments applied, are categorized as Level 1 within the fair value hierarchy. Other equity securities traded on inactive markets, or valued in reference to similar instruments traded on active markets, are generally categorized as Level 2 within the fair value hierarchy.
Investments in registeredopen-end management investment companies are valued at reported NAV per share on the valuation date and are categorized as Level 1 within the fair value hierarchy.
Debt securities, including corporate, convertible and municipal bonds and notes; obligations of the U.S. Treasury and U.S. government agencies; foreign sovereign issues; andnon-U.S. bonds, are generally valued on the basis of evaluated or composite bid quotations obtained from independent pricing services and/or brokers and dealers selected by the Adviser (each a “pricing service”), pursuant to the authorization of and subject to general oversight by the Board. Such pricing services may use matrix pricing, which considers observable inputs including, among other things, issuer details, maturity dates, interest rates, yield curves, rates of prepayment, credit risks/spreads, default rates, reported trades, broker-dealer quotes and quoted prices for similar assets. Short-term obligations with a
BHFTII-14
Brighthouse Funds Trust II
T. Rowe Price Large Cap Growth Portfolio
Notes to Financial Statements—December 31, 2018—(Continued)
remaining maturity of sixty days or less may be valued at amortized cost in the absence of market quotes, so long as the amortized cost value of such short-term debt instrument is approximately the same as the fair value of the instrument as determined without the use of amortized cost valuation. Floating rate loans are generally valued on the basis of an evaluated or composite average of aggregate bid and ask quotations supplied by brokers or dealers, as obtained from the pricing service. Securities that use similar valuation techniques and inputs as described above are generally categorized as Level 2 within the fair value hierarchy.
Options, whether on securities, indices, futures contracts, or otherwise, traded on exchanges are valued at the last sale price available as of the close of business on a valuation day or, if there is no such price available, at the last reported bid price. These types of options are categorized as Level 1 within the fair value hierarchy. Futures contracts that are traded on commodity exchanges are valued at their settlement prices established by the exchanges on which they are traded as of the close of such exchanges and are categorized as Level 1 within the fair value hierarchy.
If no current market value quotation or other observable inputs are readily available or market value quotations are deemed to be unreliable for an investment, the fair value of the investment will be determined in accordance with procedures approved by, and under the general supervision of, the Board. In such a circumstance, the Board will be assisted in its responsibility to determine the fair value of an investment by the Valuation Committee (“Committee”) of Brighthouse Investment Advisers. The Committee provides general pricing oversight and fair value pricing determinations related to portfolio securities and meets on a regular basis to review reports relating to the valuation of the securities in the Portfolio. The Board has delegated to State Street Bank and Trust Company, the Trust’s custodian (“Custodian”), the responsibility for calculating the NAVs of the Trust’s Portfolios. The Committee is responsible for overseeing the calculation of the NAVs of the Portfolios by the custodian. The Committee also periodically reviews pricing services, including the pricing services providing fair value pricing for the Portfolio’s foreign securities, and is responsible for overseeing the correction of pricing errors and addressing other pricing issues that arise in the ordinary course of business, such as making real-time fair value determinations, as necessary.
No single standard for determining the fair value of an investment can be set forth because fair value depends upon the facts and circumstances with respect to each investment. Information relating to any relevant factors may be obtained by the Committee from any appropriate source, including the subadviser of the Portfolio, the custodian, a pricing service, market maker and/or broker for such security or the issuer. Appropriate methodologies for determining fair value under particular circumstances may include: matrix pricing, a discounted cash flow analysis, comparisons of securities with comparable characteristics, value based on multiples of earnings, discount from market price of similar marketable securities, or a combination of these and other methods.
Investment Transactions and Related Investment Income - Portfolio security transactions are recorded on the trade date. Dividend income is recorded on theex-dividend date or, for certain foreign securities, when notified. Interest income, which includes amortization of premium and accretion of discount on debt securities, is recorded on the accrual basis. Realized gains and losses on investments are determined on the identified cost basis, which is the same basis used for federal income tax purposes. Foreign income and foreign capital gains on some foreign securities may be subject to foreign taxes, which are accrued as applicable. These foreign taxes have been provided for in accordance with the Portfolio’s understanding of the applicable countries’ tax rules and rates.
Foreign Currency Translation - The books and records of the Portfolio are maintained in U.S. dollars. The values of securities, currencies, and other assets and liabilities denominated in currencies other than the U.S. dollar are translated into U.S. dollars based upon foreign exchange rates prevailing at the end of the period. Purchases and sales of investment securities, income, and expenses are translated on the respective dates of such transactions. Because the values of investment securities are translated at the foreign exchange rates prevailing at the end of the period, that portion of the results of operations arising from changes in exchange rates and that portion of the results of operations reflecting fluctuations arising from changes in market prices of the investment securities are not separated. Such fluctuations are included in the net realized and unrealized gain or loss on investments.
Net realized foreign exchange gains or losses arise from activity in forward foreign currency exchange contracts, sales of foreign currency, currency gains or losses realized between the trade and settlement dates on securities transactions, and the difference between the amounts of dividends, interest, and foreign withholding taxes recorded by the Portfolio and the U.S. dollar-equivalent of the amounts actually received or paid by the Portfolio. Net unrealized foreign exchange gains and losses arise from changes in the value of assets and liabilities, other than investment securities, resulting from changes in foreign exchange rates.
Dividends and Distributions to Shareholders -The Portfolio records dividends and distributions on theex-dividend date. Net realized gains from securities transactions (if any) are generally distributed annually to shareholders. The timing and characterization of certain income and capital gains distributions are determined in accordance with federal tax regulations that may differ from GAAP. Permanent book and tax basis differences relating to shareholder distributions will result in reclassification between distributable earnings (accumulated losses) andpaid-in surplus. These adjustments have no impact on net assets or the results of operations.
Income Taxes - It is the Portfolio’s policy to comply with the requirements of the Internal Revenue Code of 1986, as amended, and regulations thereunder, applicable to regulated investment companies, and to distribute, with respect to each taxable year, all of its taxable income to shareholders. Therefore, no federal income tax provision is required. The Portfolio files U.S. federal tax returns. No
BHFTII-15
Brighthouse Funds Trust II
T. Rowe Price Large Cap Growth Portfolio
Notes to Financial Statements—December 31, 2018—(Continued)
income tax returns are currently under examination. The Portfolio’s federal tax returns for the prior three fiscal years remain subject to examination by the Internal Revenue Service. As of December 31, 2018, the Portfolio had no uncertain tax positions that would require financial statement recognition, or derecognition or disclosure.
Repurchase Agreements -The Portfolio may enter into repurchase agreements, under the terms of a Master Repurchase Agreement (“MRA”), with selected commercial banks and broker-dealers, under which the Portfolio acquires securities as collateral and agrees to resell the securities at an agreed-upon time and at an agreed-upon price. The Portfolio, through the Custodian or a subcustodian, under atri-party repurchase agreement, receives delivery of the underlying securities collateralizing any repurchase agreements. It is the Portfolio’s policy that the market value of the collateral be equal to at least 100% of the repurchase price in the case of a repurchase agreement ofone-day duration and equal to at least 102% of the repurchase price in the case of all other repurchase agreements. In the event of default or failure by a party to perform an obligation in connection with any repurchase transaction, the MRA gives thenon-defaulting party the right toset-off claims and to apply property held by it in connection with any repurchase transaction against obligations owed to it.
At December 31, 2018, the Portfolio invested cash collateral for loans of portfolio securities in repurchase agreements with a gross value of $41,609,056. The combined value of all repurchase agreements is included as part of investments at value on the Statement of Assets and Liabilities. The value of the related collateral exceeded the value of the repurchase agreements at December 31, 2018.
Securities Lending - The Portfolio may lend its portfolio securities to certain qualified brokers who borrow securities in order to complete certain securities transactions. By lending its portfolio securities, the Portfolio attempts to increase its net investment income through the receipt of income on collateral held from securities on loan. Any gain or loss in the market price of the loaned securities that might occur and any interest earned or dividends declared during the term of the loan would accrue to the account of the Portfolio.
The Trust has entered into aNon-Custodial Securities Lending Agreement with JPMorgan Chase Bank, N.A. (the “Lending Agent”). Under the agreement, the Lending Agent is authorized to loan portfolio securities on the Portfolio’s behalf. In exchange, the Portfolio receives either cash or U.S. government securities as collateral against the loaned securities. The Portfolio receives collateral equal to at least 102% of the market value for loans secured by government securities or cash in the same currency as the loaned shares and 105% for all other loaned securities at each loan’s inception. Collateral representing at least 100% of the market value of the loaned securities is maintained for the duration of the loan. Any cash collateral received by the Portfolio is generally invested by the Lending Agent in short-term investments, which may include certificates of deposit, commercial paper, repurchase agreements, time deposits, master demand notes and money market funds. The market value of investments made with cash collateral received are disclosed in the Schedule of Investments and the valuation techniques are described in Note 2. If the market value of the collateral at the close of trading on a business day is less than 100% of the market value of the loaned securities at the close of trading on that day, the borrower is required to deliver, by the close of business on the following business day, an additional amount of collateral, so that the total amount of posted collateral is equal to at least 100% of the market value of all the loaned securities as of such preceding day. A portion of the income earned on the collateral is rebated to the borrower of the securities and the remainder is split between the Lending Agent and the Portfolio. On loans collateralized by U.S. government securities, a fee is received from the borrower and is allocated between the Portfolio and the Lending Agent.
Income received by the Portfolio in securities lending transactions during the year ended December 31, 2018 is reflected as securities lending income on the Statement of Operations. The values of any securities loaned by the Portfolio and the related collateral at December 31, 2018 are disclosed in the footnotes to the Schedule of Investments. The value of the related collateral received by the Portfolio exceeded the value of the securities out on loan at December 31, 2018.
The risks associated with lending portfolio securities include, but are not limited to, possible delays in receiving additional collateral or in the recovery of the loaned securities, possible loss of rights in the collateral should the borrower fail financially, as well as risk of loss in the value of the collateral or the value of the investments made with the collateral. The Lending Agent shall indemnify the Portfolio in the case of default of any securities borrower, subject to the terms of theNon-Custodial Securities Lending Agreement.
All securities on loan are classified as Common Stocks in the Portfolio’s Schedule of Investments as of December 31, 2018, with a contractual maturity of overnight and continuous.
3. Certain Risks
In the normal course of business, the Portfolio invests in securities and enters into transactions where risks exist. Those risks include:
Market Risk:The value of securities held by the Portfolio may decline in response to certain events, including those directly involving the issuers whose securities are owned by the Portfolio; conditions affecting the general economy; overall market changes; local, regional or global political, social or economic instability; and currency, interest rate, and price fluctuations.
Credit and Counterparty Risk: The Portfolio may be exposed to counterparty risk, or the risk that an entity with which the Portfolio has unsettled or open transactions may default. The potential loss could exceed the value of the financial assets and liabilities
BHFTII-16
Brighthouse Funds Trust II
T. Rowe Price Large Cap Growth Portfolio
Notes to Financial Statements—December 31, 2018—(Continued)
recorded in the financial statements. Financial assets that potentially expose the Portfolio to credit and counterparty risk consist principally of cash due from counterparties and investments. The Portfolio manages counterparty risk by entering into agreements only with counterparties that it believes have the financial resources to honor their obligations and by monitoring the financial stability of those counterparties. The Adviser attempts to mitigate counterparty risk by (i) periodically assessing the creditworthiness of its trading partners, (ii) monitoring and/or limiting the amount of its net exposure to each individual counterparty based on its assessment, and (iii) requiring collateral from the counterparty for certain transactions. In order to preserve certain safeguards fornon-standard settlement trades, the Portfolio restricts its exposure to credit and counterparty losses by entering into master netting agreements (“Master Agreements”) with counterparties (approved brokers) with whom it undertakes a significant volume of transactions. Master Agreements govern the terms of certain transactions, and reduce the counterparty risk associated with relevant transactions by specifying credit protection mechanisms and providing standardization that improves legal certainty. Master Agreements can also help limit counterparty risk by specifying collateral posting arrangements atpre-arranged exposure levels.
Repurchase and reverse repurchase agreements are primarily executed under Global Master Repurchase Agreements (“GMRAs”) or Master Repurchase Agreements (“MRAs”), which provide the rights toset-off. Each repurchase and reverse repurchase agreement is initially collateralized at the transaction level. In the event of default, the total market value exposure will be offset against collateral exchanged to date, which would result in a net receivable/(payable) that would be due from/to the counterparty.
Additional risks associated with each type of investment are described above within the respective security type notes. The Portfolio’s prospectus includes a discussion of the principal risks of investing in the Portfolio.
4. Investment Transactions
Aggregate cost of purchases and proceeds of sales of investment securities, excluding short-term securities, for the year ended December 31, 2018 were as follows:
| | | | | | | | | | | | |
Purchases | | | Sales | |
U.S. Government | | Non-U.S. Government | | | U.S. Government | | | Non-U.S. Government | |
| $0 | | $ | 959,830,834 | | | $ | 0 | | | $ | 1,374,555,811 | |
The Portfolio engaged in security transactions with other accounts managed by T. Rowe Price Associates, Inc., the subadviser to the Portfolio, that amounted to $2,214,848 in purchases and $11,384,866 in sales of investments, which are included above, and resulted in realized gains of $3,973,477.
5. Investment Management Fees and Other Transactions with Affiliates
Investment Management Agreement -Brighthouse Investment Advisers is the investment adviser to the Portfolio. The Trust has entered into an investment management agreement with Brighthouse Investment Advisers with respect to the Portfolio. For providing investment management services to the Portfolio, Brighthouse Investment Advisers receives monthly compensation at the following annual rates:
| | | | | | |
Management
Fees earned by
Brighthouse
Investment Advisers
for the year ended
December 31, 2018 | | % per annum | | | Average Daily Net Assets |
| $14,739,113 | | | 0.650 | % | | Of the first $50 million |
| | | 0.600 | % | | On amounts in excess of $50 million |
Brighthouse Investment Advisers has entered into an investment subadvisory agreement with respect to managing the Portfolio. T. Rowe Price Associates, Inc. (“T. Rowe Price”) is compensated by Brighthouse Investment Advisers to provide subadvisory services for the Portfolio.
Management Fee Waivers -Pursuant to an expense agreement, Brighthouse Investment Advisers has agreed, for the period April 30, 2018 to April 30, 2019, to reduce its advisory fees set out above under “Investment Management Agreement” for each class of the Portfolio as follows provided the Portfolio’s assets exceed $1 billion:
| | |
% per annum | | Average Daily Net Assets |
| 0.080% | | On the first $50 million |
| 0.050% | | Of the next $50 million |
| 0.060% | | Of the next $900 million |
| 0.035% | | Of the next $500 million |
| 0.050% | | On amounts in excess of $1.5 billion |
BHFTII-17
Brighthouse Funds Trust II
T. Rowe Price Large Cap Growth Portfolio
Notes to Financial Statements—December 31, 2018—(Continued)
An identical agreement was in place for the period June 1, 2017 to April 30, 2018. Amounts waived for the year ended December 31, 2018 amounted to $1,256,178 and are included in the total amounts shown as management fee waivers in the Statement of Operations.
T. Rowe Price agreed to a voluntary subadvisory fee waiver that applies if (i) assets under management by T. Rowe Price for the Trust and Brighthouse Funds Trust I (“BHFTI), an affiliate of the Trust, in the aggregate, exceed $750 million, (ii) T. Rowe Price subadvises three or more portfolios of the Trust and BHFTI in the aggregate, and (iii) at least one of those portfolios is a large cap domestic equity portfolio.
If the aforementioned conditions are met, the Subadviser will waive its subadvisory fee paid by Brighthouse Investment Advisers by 5% for combined Trust and BHFTI average daily net assets over $750 million, 7.5% for the next $1.5 billion of combined assets, and 10% for amounts over $3 billion. Brighthouse Investment Advisers has voluntarily agreed to reduce its advisory fee for the Portfolio by the amount waived (if any) by T. Rowe Price for the Portfolio pursuant to this voluntary subadvisory fee waiver. Because these fee waivers are voluntary, and not contractual, they may be discontinued by T. Rowe Price and Brighthouse Investment Advisers at any time. Amounts voluntarily waived by Brighthouse Investment Advisers for the year ended December 31, 2018 amounted to $612,650 and are included in the total amounts shown as management fee waivers in the Statement of Operations.
Certain officers and trustees of the Trust may also be officers of Brighthouse Investment Advisers however, such officers and trustees receive no compensation from the Trust.
Transfer Agency Agreement - Brighthouse Financial, Inc. serves as the transfer agent for the Trust. Brighthouse Financial, Inc. receives no fees for its services to the Trust.
Distribution and Service Fees -The Trust has a distribution agreement with Brighthouse Securities, LLC (the “Distributor”) pursuant to which the Distributor serves as the general distributor of shares of each class (each a “Class”) of each Portfolio. The Distributor is an affiliate of the Trust. The Trust has adopted a Distribution and Services Plan (the “Plan”) relating to Class B and Class E shares of each Portfolio, under Rule 12b-1 under the 1940 Act, pursuant to which the Trust may pay the Distributor a fee (the “Service Fee”) at an annual rate not to exceed 0.25% of each such Portfolio’s average daily net assets attributable to the Class B and Class E shares of the Trust. Each Portfolio may not offer shares of each Class. The Plan also authorizes the Trust, on behalf of each of its Portfolios, may pay the Distributor a distribution Fee (the “Distribution Fee” and together with the Service Fee, the “Fees”) at an annual rate of up to 0.25% of each Portfolio’s average daily net assets attributable to the Class B and Class E shares in consideration of the services rendered in connection with the sale of such shares by the Distributor. Under the Distribution Agreement with respect to the Trust, Fees are currently paid at an annual rate of 0.25% of average daily net assets in the case of Class B shares and 0.15% of average daily net assets in the case of Class E shares. The Plan is known as a “compensation plan” because the Trust makes payments to the Distributor for services rendered regardless of the actual level of expenditures by the Distributor. Amounts incurred by the Portfolio for the year ended December 31, 2018 are shown as Distribution and service fees in the Statement of Operations.
Deferred Trustee Compensation - Each Trustee who is not currently an employee of the Adviser or any of its affiliates receives compensation from the Trust for his or her service to the Trust. A deferred compensation plan (the “Plan”) is available to the Trustees on a voluntary basis. Deferred amounts remain in the Trust until distributed in accordance with the provisions of the Plan. The value of a participating Trustee’s deferral account is based on theoretical investments of deferred amounts on the normal payment dates in certain portfolios of the Trust or Brighthouse Funds Trust I, an affiliate of the Trust, as designated by the participating Trustee. Changes in the value of participants’ deferral accounts are reflected as Trustees’ fees and expenses in the Statement of Operations. The portion of the accrued obligations allocated to the Portfolio under the Plan is reflected as Deferred trustees’ fees in the Statement of Assets and Liabilities.
6. Transactions in Securities of Affiliated Issuers
A summary of the Portfolio’s transactions in the securities of affiliated issuers during the year ended December 31, 2018 is as follows:
| | | | | | | | | | | | | | | | | | | | | | | | |
Security Description | | Market Value
December 31, 2017 | | | Purchases | | | Sales | | | Ending
Value as of
December 31, 2018 | | | Income earned
from affiliates
during the period | | | Number of
shares held at
December 31, 2018 | |
T. Rowe Price Government Reserve Fund | | $ | 13,044,598 | | | $ | 415,354,803 | | | $ | (420,499,617 | ) | | $ | 7,899,784 | | | $ | 242,918 | | | | 7,899,784 | |
7. Contractual Obligations
Under the Trust’s organizational documents, its officers and Trustees may be indemnified against certain liabilities and expenses arising out of the performance of their duties to the Trust. Additionally, the Trust has a variety of indemnification obligations under contracts with its service providers. The Trust’s maximum exposure under these arrangements is unknown, as this would involve future claims that may be made against the Trust that have not yet occurred.
BHFTII-18
Brighthouse Funds Trust II
T. Rowe Price Large Cap Growth Portfolio
Notes to Financial Statements—December 31, 2018—(Continued)
8. Income Tax Information
The cost basis of investments for federal income tax purposes at December 31, 2018 was as follows:
| | | | |
Cost basis of investments | | $ | 1,927,566,860 | |
Gross unrealized appreciation | | | 503,936,418 | |
Gross unrealized depreciation | | | (125,810,066 | ) |
| | | | |
Net unrealized appreciation (depreciation) | | $ | 378,126,352 | |
| | | | |
The tax character of distributions paid for the years ended December 31, 2018 and 2017 were as follows:
| | | | | | | | | | | | | | | | | | | | |
Ordinary Income | | | Long-Term Capital Gain | | | Total | |
2018 | | 2017 | | | 2018 | | | 2017 | | | 2018 | | | 2017 | |
| $17,613,767 | | $ | 5,465,932 | | | $ | 427,757,955 | | | $ | 144,175,968 | | | $ | 445,371,722 | | | $ | 149,641,900 | |
As of December 31, 2018, the components of distributable earnings (accumulated losses) on a federal income tax basis were as follows:
| | | | | | | | | | | | | | | | |
Undistributed
Ordinary
Income | | Undistributed
Long-Term
Capital Gain | | | Net
Unrealized
Appreciation | | | Accumulated
Capital Losses | | | Total | |
| $8,558,039 | | $ | 350,897,151 | | | $ | 378,126,293 | | | $ | — | | | $ | 737,581,483 | |
The Portfolio utilizes the provisions of the federal income tax laws that provide for the carryforward of capital losses for prior years, offsetting such losses against any future realized capital gains. Under the Regulated Investment Company Modernization Act of 2010, net capital losses recognized after December 22, 2010 may be carried forward indefinitely and their character is retained as short-term and/or long-term losses.
As of December 31, 2018, the Portfolio had no accumulated capital losses.
9. Recent Accounting Pronouncements and SEC Update
In August 2018, the FASB issued Accounting Standards Update2018-13, Fair Value Measurement (Topic 820)—Disclosure Framework—Changes to the Disclosure Requirements for Fair Value Measurement (“ASU2018-13”) which introduces new fair value disclosure requirements as well as eliminates and modifies certain existing fair value disclosure requirements. ASU2018-13 is effective for fiscal years beginning after December 15, 2019, and interim periods within those fiscal years. Early adoption is permitted and, as such, management has elected to early adopt ASU2018-13 effective with the current reporting period. The impact of the Portfolio’s adoption was limited to changes in the Portfolio’s financial statement disclosures regarding fair value, primarily those disclosures related to transfers between levels of the fair value hierarchy.
In August 2018, the Securities and Exchange Commission released its Final Rule on Disclosure Update and Simplification (the “Final Rule”) which is intended to simplify an issuer’s disclosure compliance efforts by removing redundant or outdated disclosures requirements without significantly altering the mix of information provided to investors. Effective with the current reporting period, the Portfolio adopted the Final Rule with the most notable impacts being that the Portfolio is no longer required to present the components of distributable earnings on the Statement of Assets and Liabilities or the sources of distributions to shareholders and the amounts of undistributed net investment income on the Statements of Changes in Net Assets.
BHFTII-19
Brighthouse Funds Trust II
T. Rowe Price Large Cap Growth Portfolio
Report of Independent Registered Public Accounting Firm
To the Shareholders of T. Rowe Price Large Cap Growth Portfolio and the Board of Trustees of Brighthouse Funds Trust II:
Opinion on the Financial Statements and Financial Highlights
We have audited the accompanying statement of assets and liabilities, including the schedule of investments, of the T. Rowe Price Large Cap Growth Portfolio (the “Portfolio”), one of the portfolios constituting the Brighthouse Funds Trust II, as of December 31, 2018, the related statement of operations for the year then ended, the statements of changes in net assets for each of the two years in the period then ended, the financial highlights for each of the five years in the period then ended, and the related notes. In our opinion, the financial statements and financial highlights present fairly, in all material respects, the financial position of the T. Rowe Price Large Cap Growth Portfolio of the Brighthouse Funds Trust II as of December 31, 2018, the results of its operations for the year then ended, the changes in its net assets for each of the two years in the period then ended, and the financial highlights for each of the five years in the period then ended, in conformity with accounting principles generally accepted in the United States of America.
Basis for Opinion
These financial statements and financial highlights are the responsibility of the Portfolio’s management. Our responsibility is to express an opinion on the Portfolio’s financial statements and financial highlights based on our audits. We are a public accounting firm registered with the Public Company Accounting Oversight Board (United States) (PCAOB) and are required to be independent with respect to the Portfolio in accordance with the U.S. federal securities laws and the applicable rules and regulations of the Securities and Exchange Commission and the PCAOB.
We conducted our audits in accordance with the standards of the PCAOB. Those standards require that we plan and perform the audit to obtain reasonable assurance about whether the financial statements and financial highlights are free of material misstatement, whether due to error or fraud. The Portfolio is not required to have, nor were we engaged to perform, an audit of its internal control over financial reporting. As part of our audits we are required to obtain an understanding of internal control over financial reporting but not for the purpose of expressing an opinion on the effectiveness of the Portfolio’s internal control over financial reporting. Accordingly, we express no such opinion.
Our audits included performing procedures to assess the risks of material misstatement of the financial statements and financial highlights, whether due to error or fraud, and performing procedures that respond to those risks. Such procedures included examining, on a test basis, evidence regarding the amounts and disclosures in the financial statements and financial highlights. Our audits also included evaluating the accounting principles used and significant estimates made by management, as well as evaluating the overall presentation of the financial statements and financial highlights. Our procedures included confirmation of securities owned as of December 31, 2018, by correspondence with the custodian and brokers; when replies were not received from brokers, we performed other auditing procedures. We believe that our audits provide a reasonable basis for our opinion.
/s/ Deloitte & Touche LLP
Boston, Massachusetts
February 25, 2019
We have served as the auditor of one or more of the Brighthouse investment companies since 1983.
BHFTII-20
Brighthouse Funds Trust II
Trustees and Officers
MANAGEMENT OF THE TRUSTS
The Boards of Trustees (the “Board”) of Brighthouse Funds Trust I and Brighthouse Funds Trust II (“BHF I” and “BHF II”, respectively, and collectively the “Trusts”) supervise the Trusts and are responsible for representing the interests of shareholders. The Trustees, the Chairman of the Board and the Chairmen of each subcommittee are the same for both Trusts. The Trustees of each Trust meet periodically throughout the year to oversee the Portfolios’ activities, reviewing, among other things, each Portfolio’s performance and its contractual arrangements with various service providers. The Trustees of each Trust elect the officers of the Trust, who are responsible for administering the Trust’sday-to-day operations.
Trustees and Officers
The Trustees and executive officers of the Trusts, as well as their principal occupations during the past five years, are set forth below. Unless otherwise indicated, the business address of each is c/o Brighthouse Funds, One Financial Center, Boston, Massachusetts 02111. Each Trustee who is deemed an “interested person,” as such term is defined in the 1940 Act, is referred to as an “Interested Trustee.” Those Trustees who are not “interested persons,” as such term is defined in the 1940 Act, are referred to as “Independent Trustees.” There is no limit to the term a Trustee may serve. Trustees serve until their death, resignation or removal in accordance with the BHF I Trust’s and BHF II Trust’s respective organizational documents and policies adopted by the Boards of the respective Trusts from time to time. Officers hold office at the pleasure of each Board and serve until their removal or resignation in accordance with the Trusts’ respective organizational documents and policies adopted by the Board of each Trust from time to time.
| | | | | | | | | | |
Name and Year of Birth | | Current
Position(s)
Held with
Registrant | | Term of Office
and Length of
Time Served | | Principal Occupation(s) During the Past
5 Years(1) | | Number of
Portfolios
in Brighthouse
Funds
Complex(2)
Overseen
by Trustee | | Other Directorships Held
by Trustee During the
Past 5 Years(1) |
| Interested Trustee |
John Rosenthal* (1960) | | Trustee | | Indefinite; From
May 2016
(Trust I and
Trust II) to present | | Chief Investment Officer, Brighthouse Financial, Inc. (2017 to present); until 2017, Senior Managing Director and Head of Global Portfolio Management, MetLife, Inc. | | 72 | | None |
|
| Independent Trustees |
Dawn M. Vroegop (1966) | | Trustee and Chairman of the Board | | Indefinite; From
December 2000
(Trust I)/May
2009 (Trust II) to
present as
Trustee; From
May 2016 (Trust
I and Trust II)
until present as
Chairman | | Private Investor. | | 72 | | Trustee, Driehaus Mutual Funds.** |
| | | | | |
Stephen M. Alderman (1959) | | Trustee | | Indefinite; From
December 2000
(Trust I)/April
2012 (Trust II) to
present | | Shareholder in the law firm of Garfield and Merel, Ltd. | | 72 | | None |
| | | | | |
Robert J. Boulware (1956) | | Trustee | | Indefinite; From
March 2008
(Trust I)/April
2012 (Trust II) to
present | | Managing Director, Pilgrim Funds, LLC (private equity fund). | | 72 | | Trustee, Vertical Capital Income Fund(closed-end fund);** Director, Gainsco, Inc. (auto insurance);** Trustee, SharesPost 100 Fund(closed-end fund).** |
| | | | | |
Susan C. Gause (1952) | | Trustee | | Indefinite; From
March 2008
(Trust I)/April
2012 (Trust II) to
present | | Private Investor. | | 72 | | Trustee, HSBC Funds.** |
BHFTII-21
Brighthouse Funds Trust II
Trustees and Officers—(Continued)
| | | | | | | | | | |
Name and Year of Birth | | Current
Position(s)
Held with
Registrant | | Term of Office
and Length of
Time Served | | Principal Occupation(s) During the Past
5 Years(1) | | Number of
Portfolios
in Brighthouse
Funds
Complex(2)
Overseen
by Trustee | | Other Directorships Held
by Trustee During the
Past 5 Years(1) |
Nancy Hawthorne (1951) | | Trustee | | Indefinite; From
May 2003
(Trust II)/April
2012 (Trust I)
to present | | Partner, Hawthorne Financial Advisors, LLC (registered investment advisor); until 2014, Chief Executive Officer, Clerestory LLC (corporate advisor). | | 72 | | Director and Chairman of the Board of Directors, THL Credit, Inc.;** Director and Chairman of the Board, Avid Technology, Inc.;** Director, CRA International, Inc.** |
| | | | | |
Barbara A. Nugent (1956) | | Trustee | | Indefinite; From
January 2014
(Trust I and
Trust II) to
present | | President, True North Board Governance, LLC (consulting); until December 2013, partner in the law firm of Stradley Ronon Stevens & Young, LLP. | | 72 | | Independent Lead Trustee, BMT Investment Funds** |
| | | | | |
Christopher J. Towle (1957) | | Trustee | | Indefinite; From
April 2018
(Trust I and
Trust II) to
present | | Retired; until 2014, Partner, Portfolio Manager, Director of High Yield and Convertible Strategies, Lord Abbett & Co. | | 72 | | Trustee, Driehaus Mutual Funds** |
Officers
| | | | | | |
Name and Year of Birth | | Position(s)
Held with
Registrant | | Length of
Time Served | | Principal Occupation(s)
During the Past 5 Years(1) |
| Executive Officers | | | | | | |
Kristi Slavin (1973) | | President and Chief Executive Officer, of Trust I and Trust II | | From May
2016
(Trust I and
Trust II) to
present | | President, Brighthouse Investment Advisers, LLC (2016-present); formerly, Senior Vice President, MetLife Advisers, LLC; Vice President, MetLife, Inc.; Vice President, Trust I and Trust II(2015-2016). |
| | | |
Alan R. Otis (1971) | | Chief Financial Officer and Treasurer, of Trust I and Trust II | | From
November
2017
(Trust I and
Trust II) to
present | | Senior Vice President, Brighthouse Investment Advisers, LLC (2017-present); formerly, Vice President, Brighthouse Investment Advisers, LLC (2012-2017); Assistant Treasurer, Trust I and Trust II (2012-2017). |
| | | |
Andrew L. Gangolf (1954) | | Secretary, of Trust I and Trust II | | From May
2011
(Trust I and
Trust II) to
present | | Executive Vice President, Brighthouse Investment Advisers, LLC (2017-present); formerly, Senior Vice President, MetLife Advisers, LLC (2011-2017); until 2011, Senior Vice President & Assistant General Counsel, AllianceBernstein Investments, Inc. |
| | | |
Steven E. Hartstein (1963) | | Chief Compliance Officer (“CCO”), of Trust I and Trust II | | From
February
2014
(Trust I and
Trust II) to
present | | Senior Vice President and CCO, Brighthouse Investment Advisers, LLC (2017-present); Head of Investments Compliance, Vice President, Brighthouse Financial, Inc. (2017-present); formerly, Vice President, MetLife, Inc. (2013-2017); Senior Vice President and CCO, MetLife Advisers, LLC (2013-2017.) |
| | | |
Victor Soto (1978) | | Vice President of Trust I and Trust II | | From May
2018
(Trust I and
Trust II) to
present | | Executive Vice President, Brighthouse Investment Advisers, LLC (2016-present); Assistant Vice President, MetLife Inc. (2015-2017); Portfolio Manager, 1st Global (2013-2015). |
| * | Mr. Rosenthal is an “interested person” of the Trusts because of his position with Brighthouse Financial, Inc., the current parent company of Brighthouse Investment Advisers, LLC. |
| ** | Indicates a directorship with a registered investment company or a company subject to the reporting requirements of the Securities Exchange Act of 1934, as amended. |
| (1) | Previous positions during the past five years with the Trusts, Brighthouse Financial, Inc., MetLife, Inc. or the Manager are omitted if not materially different. |
| (2) | The Fund Complex includes 43 BHF I Portfolios and 29 BHF II Portfolios. |
BHFTII-22
Brighthouse Funds Trust II
T. Rowe Price Large Cap Growth Portfolio
Board of Trustees’ Consideration of Advisory and Sub-Advisory Agreements
At anin-person meeting held on November6-8, 2018 (the “November Meeting”), the Boards of Trustees (the “Board”) of Brighthouse Funds Trust I and Brighthouse Funds Trust II (“BFT I” and “BFT II,” respectively, and collectively, the “Trusts”), including a majority of the Trustees who are not “interested persons” of the Trusts (the “Independent Trustees”) under the Investment Company Act of 1940 (the “1940 Act”), approved the continuation of the Trusts’ advisory agreements (each, an “Advisory Agreement”) with Brighthouse Investment Advisers, LLC (the “Adviser”) and the applicablesub-advisory agreements (each a “Sub-Advisory Agreement,” and collectively with the Advisory Agreement, the “Agreements”) between the Adviser and the investmentsub-advisers (each a “Sub-Adviser,” and collectively, the “Sub-Advisers”) for the series of the Trusts (each a “Portfolio,” and collectively, the “Portfolios”).
In making those approvals, the Board reviewed a variety of materials that were provided for the specific purpose of the annual contract renewal process. In addition, various materials provided to and discussed with the Board throughout the year informed the Board’s decision to renew the Agreements. In particular, the information for each Portfolio included, but was not limited to, investment performance reports, and reports on expenses, legal and compliance matters, asset pricing, brokerage commissions and trade execution.
The Board met in person with personnel of the Adviser on October 17, 2018 for the specific purpose of giving preliminary consideration to the proposed continuation of the Agreements (the “October Meeting”). At that meeting, the Adviser reviewed with the Board the performance and fees experienced by each Portfolio, as well as other information. During and after the October Meeting, the Independent Trustees communicatedfollow-up matters for management to address at the November Meeting. The Independent Trustees were advised by independent legal counsel throughout the contract renewal process, and met with independent legal counsel in several executive sessions outside of the presence of management.
Information furnished and reviewed specifically in connection with the renewal process included, but was not limited to, a report for each Portfolio that was prepared by Broadridge (“Broadridge”), an independent organization. In addition, the Independent Trustees reviewed a report that was prepared by JDL Consultants, LLC (“JDL”), an independent consultant to the Independent Trustees (“JDL Report”), which examined the comparative fees, expenses and performance of each Portfolio, based upon the Broadridge reports. Also, the Board reviewed the responses to wide-ranging questions from the Independent Trustees relating to the business, operations and performance of the Adviser and theSub-Advisers that the Adviser andSub-Advisers had prepared specifically for the renewal process, and reviewed aPortfolio-by-Portfolio analysis of the profitability to the Adviser of each Advisory Agreement, which was prepared by the Adviser for the renewal process.
At the November Meeting, the Board, including a majority of the Independent Trustees, concluded that the nature, extent and quality of services provided by the Adviser and eachSub-Adviser supported the renewal of the Agreements. The Board also concluded that the investment performance of each Portfolio was such that each Agreement should continue, and that the fees paid by each Portfolio to the Adviser appeared to be reasonable in light of the nature, extent and quality of the services provided by the Adviser andSub-Adviser. Further, the Board concluded that the Adviser’s profitability in providing services under the Advisory Agreements did not appear unreasonable in light of the nature, extent and quality of the services provided by the Adviser. Finally, the Board reviewed the extent to which the investment advisory fees paid by the Portfolios shared economies of scale with investors or entailed the potential to share economies of scale with investors and concluded that those considerations generally supported the renewal of each Agreement. In approving the renewal of each of the Agreements, the Board, including the Independent Trustees, gave attention to all of the information that was furnished and each Trustee placed varying degrees of importance on the various pieces of information that were provided to them. The Board evaluated the information available to it on aPortfolio-by-Portfolio basis, and its decision was made separately with respect to each Portfolio. The following paragraphs provide more information about some of the primary factors that were relevant to the Board’s decision. The Board did not identify any single factor as determinative, and the Trustees generally attributed different weights to various factors for the various Portfolios.
Nature, extent and quality of services. The Board evaluated the nature, extent and quality of the services that the Adviser and theSub-Advisers, as relevant, have provided to the Portfolios. The Board considered the Adviser’s services as investment manager to the Portfolios, including its services relating to the hiring and oversight of theSub-Advisers, trading practices and oversight of transition management (as applicable), compliance programs and personnel, and risk management, among other things. The Adviser’s services in coordinating and overseeing the activities of the Trusts’ other service providers were also considered. The Board considered information received from the Trusts’ Chief Compliance Officer (“CCO”) regarding the Portfolios’ compliance policies and procedures that were established pursuant to Rule38a-l under the 1940 Act. The Board also noted that the Adviser’s investment, compliance and legal staff conduct regular and periodic telephonic andin-person meetings with theSub-Advisers to review and assess the services that are provided to the Portfolios, and that personnel of the Adviser prepare and present reports to the Independent Trustees regarding those meetings. In addition, throughout the year, the Board considered the expertise, experience and performance of the personnel of the Adviser who performed the various services that are mentioned above.
BHFTII-23
Brighthouse Funds Trust II
T. Rowe Price Large Cap Growth Portfolio
Board of Trustees’ Consideration of Advisory and Sub-Advisory Agreements—(Continued)
With respect to the services provided by each of theSub-Advisers, the Board considered a variety of information that the Adviser and eachSub-Adviser prepared for the Board’s review. The Board considered eachSub-Adviser’s investment process and philosophy, and the investment performance experienced by the Portfolio (as described in more detail below). The Board took into account that eachSub-Adviser’s responsibilities include the development and maintenance of an investment program for the applicable Portfolio that is consistent with the Portfolio’s investment objectives, the selection of investment securities and the placement of orders for the purchase and sale of such securities, as well as the implementation of compliance controls related to performance of these services. In particular, the Board considered, among other things, theSub-Adviser’s current level of staffing as well as its compensation program and its overall resources. The Board reviewed eachSub-Adviser’s history and investment experience, as well as information provided regarding the qualifications, background and responsibilities of theSub-Adviser’s investment and compliance personnel who provide services to the Portfolios. The Board also considered, among other things, eachSub-Adviser’s compliance program and regulatory and disciplinary history. In its review, the Board also took into account information regarding any services and/or payments provided to the Adviser by theSub-Advisers in connection with marketing activities and considered representations from the Adviser that those payments were not considered in the Adviser’s recommendation to renew any of theSub-Advisory Agreements.
Performance. The Board placed emphasis on the performance of each Portfolio in light of, among other things, its importance to investors. The Board considered the Adviser’s quarterly reviews with the Board of detailed information about each Portfolio’s investment strategies and performance results and composition, including discussions regarding the relevant effect of current market conditions. The Board reviewed and considered the reports prepared by Broadridge, which provided a statistical analysis comparing the Portfolios’ investment performance to that of comparable funds underlying variable insurance products (the “Performance Universe”). The Independent Trustees also met separately with representatives of JDL during the October Meeting to review the JDL Report. The Board also compared the performance records of the Portfolios to those of comparable funds and other accounts that were managed by the relevantSub-Adviser, to the extent such information was available. The Board considered each Portfolio’s performance for periods subsequent to the performance period covered by the Broadridge reports, and the Adviser’s discussion of the same, including the effect of current market conditions on each Portfolio’s more recent performance. The Board also noted that while it found the data provided by Broadridge generally useful, it recognized the limitations of such data, including, in particular, that notable differences may exist between a Portfolio and those of the other funds in a Broadridge category (for example, the investment objectives(s) and investment strategies) and that the results of the performance comparisons may vary depending on (i) the end dates for the performance periods that were selected and (ii) the selection of the peer groups.
The Board focused particular attention on Portfolios with less favorable performance records. The Board noted the Adviser’s focus on eachSub-Adviser’s performance and that the Adviser has been active in monitoring and responding to any performance issues with respect to the Portfolios.
Fees and Expenses. The Board gave consideration to the level and method of computing the fees payable under the Agreements. The Board considered the Broadridge report for each of the Portfolios, which included comparisons for each Portfolio of its contractual management andsub-adviser fees (at current and various asset levels), and total expenses, with those of its peers, including as those peers were divided into a broad group of peer funds (“Expense Universe”), a narrower group of peer funds (“Expense Group”), a broad group of peersub-advised funds (“Sub-advised Expense Universe”), and a narrower group of peersub-advised funds (“Sub-advised Expense Group”). Broadridge selected the peer funds which were similarly situated funds underlying variable insurance products deemed to be comparable to the Portfolios. The Independent Trustees, with the assistance of JDL, also examined the JDL Report. The Board compared the fee payable to aSub-Adviser by the Adviser with respect to the Portfolio to the fee payable to theSub-Adviser by other comparable funds and other accounts, to the extent such information was available.
The Board noted that thesub-advisory fees for the Portfolios are paid by the Adviser out of the advisory fees, and that the Adviser negotiates the fees at arm’s length. The Board also considered that the Adviser had entered into expense limitation or management fee waiver agreements with certain of the Portfolios pursuant to which the Adviser had agreed to waive a portion of its advisory fee and/or reimburse certain expenses as a means of limiting a Portfolio’s total annual operating expenses.
Profitability. The Board examined the profitability to the Adviser of each Advisory Agreement, on aPortfolio-by-Portfolio basis. The Board also considered that an affiliate of the Adviser, Brighthouse Securities, LLC, serves as distributor for the Trusts, and, as such, receives Rule12b-1 payments to support the distribution of the Portfolios. The Board considered the profitability to theSub-Advisers and their affiliates as a result of their relationships with the Portfolios, to the extent available, and the Board considered the ability of the Adviser to negotiate with aSub-Adviser at arm’s length. In reviewing the profitability analyses, the Board recognized that expense allocation methodologies are inherently subjective and various expense allocation methodologies may be reasonable while producing different results.
BHFTII-24
Brighthouse Funds Trust II
T. Rowe Price Large Cap Growth Portfolio
Board of Trustees’ Consideration of Advisory and Sub-Advisory Agreements—(Continued)
Economies of scale. The Board also considered each Portfolio’s fees in light of its size. The Board noted the fee schedules for the Portfolios that contain breakpoints that reduce the fee rate above specified asset levels. The Board noted those Portfolios that did not have breakpoints in their advisory fee and took into account management’s discussion of the same. The Board noted that those Portfolios with Advisory Agreements containing breakpoints generally have breakpoints in the correspondingSub-Advisory Agreement. The Board considered the effective fees under the Advisory Agreement andSub-Advisory Agreement for each Portfolio as a percentage of assets at different asset levels and possible economies of scale that may be realized if the assets of the Portfolio grow. The Board examined, among other data, the effect of a Portfolio’s growth in size, and reduction in size, on various fee schedules and the Board reviewed the Broadridge and JDL Reports, which compared fees among peers. The Board also generally noted that if a Portfolio’s assets increase over time, the Portfolio may realize other economies of scale if assets increase proportionally more than certain other fixed expenses.
Other factors. The Board considered other benefits that may be realized by the Adviser and its affiliates from their relationship with the Trusts. Among them, the Board recognized that Brighthouse Securities, LLC, as the distributor for the Trusts, receives payments pursuant to Rule12b-1 from the Portfolios to compensate for the provision of shareholder services and distribution activities, which could lead to growth in the Trusts’ assets and corresponding benefits from such growth, including economies of scale. The Board considered other benefits that may be realized by eachSub-Adviser and its affiliates from their relationship with the Trusts, including the opportunity to provide advisory services to additional portfolios of the Trusts and reputational benefits. In conjunction with these considerations, the Board noted the ongoing commitment of the Adviser to the Portfolios.
The Board requested, received, and considered information from the Adviser regarding possible conflicts of interest in the form of material benefits to the Adviser resulting from the Adviser’s affiliations and business relationships, as relevant. The Board considered the services that are provided to the Trusts by its service providers, and the manner in which any conflicts were mitigated.
* * *
T. Rowe Price Large Cap Growth Portfolio. The Board also considered the following information in relation to the Agreements with the Adviser and T. Rowe Price Associates, Inc. regarding the Portfolio:
Among other data relating specifically to the Portfolio’s performance, the Board considered that the Portfolio outperformed the median of its Performance Universe and the average of its Morningstar Category for theone-, three- and five-year periods ended June 30, 2018. The Board also considered that the Portfolio underperformed its benchmark, the Russell 1000 Growth Index, for theone-, three- and five-year periods ended September 30, 2018.
The Board also considered that the Portfolio’s actual management fees and total expenses (exclusive of12b-1 fees) were below the median of the Expense Group, Expense Universe, andSub-advised Expense Universe. The Board further noted that the Portfolio’s contractual management fees were above the asset-weighted average of comparable funds selected by Broadridge at the Portfolio’s current size. The Board also noted that the Portfolio’s contractualsub-advisory fees were above the averages of theSub-advised Expense Group and theSub-advised Expense Universe at the Portfolio’s current size.
BHFTII-25
Brighthouse Funds Trust II
T. Rowe Price Small Cap Growth Portfolio
Managed by T. Rowe Price Associates, Inc.
Portfolio Manager Commentary*
PERFORMANCE
For the 12 months ended December 31, 2018, the Class A, B, E, and G shares of the T. Rowe Price Small Cap Growth Portfolio returned-6.55%,-6.78%,-6.67%, and-6.84%, respectively. The Portfolio’s benchmark, the MSCI U.S. Small Cap Growth Index1, returned-9.03%.
MARKET ENVIRONMENT / CONDITIONS
U.S. stocks declined in 2018, which marked the worst year for the U.S. equity market since 2008. Stocks rose for much of the year, though the advance was somewhat sluggish. Market volatility was elevated throughout 2018, thanks partly to rising interest rates. The Federal Reserve (the “Fed”) continued its normalization of monetary policy, with four short-term interest rate hikes in 2018, and the10-year Treasury note yield reached a seven-year high of about 3.25% in early October. Heightened global trade tensions, especially between the U.S. and China, periodically weighed on U.S. and global equity markets throughout 2018.
While most major U.S. stock indexes reachedall-time highs around the end of the third quarter, equities plunged in the final months of the year, with several indexes in or close to bear market territory—down at least 20% from recent highs—by the end of the year. Stocks fell sharply due to factors such as expectations for additional interest rate increases from the Fed in 2019; expectations for slowing corporate earnings growth in 2019, as the tailwinds from the late-2017 tax reform that boosted corporate earnings in 2018 subside; signs of slowing economic growth in different parts of the world; and increased U.S.-China tensions. Turmoil in the Trump administration also weighed on investor sentiment.
As measured by various Russell Indexes, growth stocks held up better than value stocks across all market capitalizations.
PORTFOLIO REVIEW /PERIOD-END POSITIONING
The Portfolio outpaced the benchmark MSCI U.S. Small Cap Growth Index for the12-month period ended December 31, 2018, with both the Portfolio and benchmark index posting negative returns. Broadly speaking, stock selection accounted for relative outperformance.
The top relative contributor for the period was Industrials & Business Services, due to strong stock selection. HEICO, a notable holding for the period, is the world’s largest manufacturer ofFAA-approved, reverse-engineered aircraft replacement parts. Shares traded higher after the company reported a series of strong quarterly results highlighted by higher revenues in the Electronic and Flight Support segments, solid margins, and an improving outlook guided by the company. Teledyne Technologies, an industrial conglomerate manufacturer that provides critical components tohigher-end industrial products, added value through its recent acquisition of e2v Technologies.
Materials also contributed to relative performance, because of strong stock choices. One notable holding was Ingevity, which provides specialty chemicals and high-performance carbon materials and technologies. Shares traded higher as the company exhibited strong execution and solid earnings results throughout the year.
Additionally, the Health Care sector was a source of relative strength, due to stock selection. Veeva Systems, a cloud-based software company in the sector, was a holding that performed well.
Stock selection within the Consumer Discretionary sector benefited relative performance. Burlington Stores shares outperformed in 2018. The company was in the early innings of refining its business model and was on the right side of a secular trend in retailing towardoff-price retailers that offer bargain-hunting opportunities for consumers.
Finally, Real Estate was a relative contributor due to strong stock choices. A notable holding was Equity LifeStyle Properties, which traded higher during the period.
The Information Technology sector was an area of relative weakness, due to stock selection. Coherent is a leading manufacturer of specialty laser diodes and equipment. Negative sentiment surrounding the likelihood of organic LED adoption, due to weaker-than-anticipated iPhone X sales, put shares under pressure over the period. Shares of Cognex, which designs and assemblesend-to-end machine vision systems for factory automation and logistics applications, traded lower during the period as weaker-than-expected guidance attributable to macro factors, most notably China, weighed on demand outlook.
Utilities was also a detractor for the period, as a result of poor stock choices and a slight overweight allocation. A notable holding was Ormat Technologies, which designs, builds, acquires, owns, and operates geothermal power plants and develops innovative power systems. Shares traded lower during the period as lava flows from Hawaii’s Kilauea volcano disrupted operations of the Puna plant earlier this year and extended operational maintenance at three newly acquired facilities contributed to lost revenue and weaker margins.
The Portfolio is structured to be sector neutral to provide alpha from security selection. However, relative sector weights may fluctuate from time to time. At the end of the reporting period, the Portfolio’s most substantially overweight position relative to the MSCI U.S.
BHFTII-1
Brighthouse Funds Trust II
T. Rowe Price Small Cap Growth Portfolio
Managed by T. Rowe Price Associates, Inc.
Portfolio Manager Commentary*—(Continued)
Small Cap Growth Index was Industrials & Business Services. In contrast, the Portfolio’s most substantially underweight position was in Information Technology.
Sudhir Nanda
Portfolio Manager
T. Rowe Price Associates, Inc.
* This commentary may include statements that constitute “forward-looking statements” under the U.S. securities laws. Forward-looking statements include, among other things, projections, estimates, and information about possible or future results related to the Portfolio, market or regulatory developments. The views expressed above are not guarantees of future performance or economic results and involve certain risks, uncertainties and assumptions that could cause actual outcomes and results to differ materially from the views expressed herein. The views expressed above are subject to change at any time based upon economic, market, or other conditions and the subadvisory firm undertakes no obligation to update the views expressed herein. Any discussions of specific securities should not be considered a recommendation to buy or sell those securities. The views expressed above (including any forward-looking statement) may not be relied upon as investment advice or as an indication of the Portfolio’s trading intent. Information about the Portfolio’s holdings, asset allocation or country diversification is historical and is not an indication of future Portfolio composition, which may vary. Direct investment in any index is not possible. The performance of any index mentioned in this commentary has not been adjusted for ongoing management, distribution and operating expenses, and sales charges applicable to mutual fund investments. In addition, the returns do not reflect additional fees charged by separate accounts or variable insurance contracts that an investor in the Portfolio may pay. If these additional fees were reflected, performance would have been lower.
BHFTII-2
Brighthouse Funds Trust II
T. Rowe Price Small Cap Growth Portfolio
A $10,000 INVESTMENT COMPARED TO THE MSCI U.S. SMALL CAP GROWTH INDEX
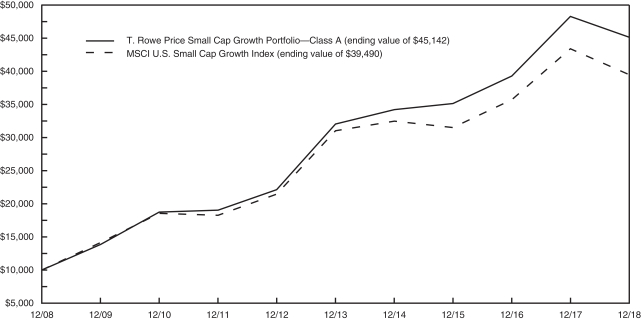
AVERAGE ANNUAL RETURNS (%) (FOR THE YEAR ENDED DECEMBER 31, 2018)
| | | | | | | | | | | | | | | | |
| | | | | |
| | | 1 Year | | | 5 Year | | | 10 Year | | | Since Inception2 | |
| T. Rowe Price Small Cap Growth Portfolio | | | | | | | | | | | | | | | | |
Class A | | | -6.55 | | | | 7.10 | | | | 16.27 | | | | — | |
Class B | | | -6.78 | | | | 6.83 | | | | 15.98 | | | | — | |
Class E | | | -6.67 | | | | 6.94 | | | | 16.09 | | | | — | |
Class G | | | -6.84 | | | | — | | | | — | | | | 6.89 | |
| MSCI U.S. Small Cap Growth Index | | | -9.03 | | | | 4.93 | | | | 14.73 | | | | — | |
1 The MSCI U.S. Small Cap Growth Index represents the growth companies of the MSCI U.S. Small Cap 1750 Index. (The MSCI U.S. Small Cap 1750 Index represents the universe of small capitalization companies in the U.S. equity market).
2 Inception dates of the Class A, Class B, Class E and Class G shares are 3/3/97, 7/30/02, 5/1/01 and 11/12/14, respectively.
Portfolio performance is calculated including reinvestment of all income and capital gain distributions. Performance numbers are net of all Portfolio expenses but do not include any insurance, sales, separate account or administrative charges of variable annuity or life insurance contracts or any additional expenses that participants may bear relating to the operations of their plans. If these charges were included, the returns would be lower. The performance of any index referenced above has not been adjusted for ongoing management, distribution and operating expenses, and sales charges applicable to mutual fund investments. Direct investment in any index is not possible. The performance of Class A shares, as set forth in the line graph above, will differ from that of other classes because of the difference in expenses paid by policyholders investing in the different share classes.
This information represents past performance and is not indicative of future results. Investment return and principal value may fluctuate so that shares, upon redemption, may be worth more or less than the original cost.
PORTFOLIO COMPOSITION AS OF DECEMBER 31, 2018
Top Holdings
| | | | |
| | | % of
Net Assets | |
| Burlington Stores, Inc. | | | 1.1 | |
| Teledyne Technologies, Inc. | | | 1.0 | |
| HEICO Corp.- Class A | | | 1.0 | |
| Bright Horizons Family Solutions, Inc. | | | 1.0 | |
| Molina Healthcare, Inc. | | | 0.9 | |
| Fair Isaac Corp. | | | 0.9 | |
| Cable One, Inc. | | | 0.8 | |
| Euronet Worldwide, Inc. | | | 0.8 | |
| ICU Medical, Inc. | | | 0.8 | |
| Pool Corp. | | | 0.8 | |
Top Sectors
| | | | |
| | | % of
Net Assets | |
| Health Care | | | 23.2 | |
| Information Technology | | | 21.8 | |
| Industrials | | | 16.9 | |
| Consumer Discretionary | | | 14.4 | |
| Financials | | | 5.9 | |
| Materials | | | 4.2 | |
| Consumer Staples | | | 3.9 | |
| Communication Services | | | 3.2 | |
| Real Estate | | | 3.0 | |
| Energy | | | 2.5 | |
BHFTII-3
Brighthouse Funds Trust II
T. Rowe Price Small Cap Growth Portfolio
Understanding Your Portfolio’s Expenses
Shareholder Expense Example
As a shareholder of the Portfolio, you incur ongoing costs, including management fees; distribution and service(12b-1) fees; and other Portfolio expenses. This example is intended to help you understand your ongoing costs (in dollars) (referred to as “expenses”) of investing in the Portfolio and compare these costs with the ongoing costs of investing in other mutual funds. The example is based on an investment of $1,000 invested at the beginning of the period and held for the entire period, July 1, 2018 through December 31, 2018.
Actual Expenses
The first line for each share class of the Portfolio in the table below provides information about actual account values and actual expenses. You may use the information in this line, together with the amount you invested in the particular share class of the Portfolio, to estimate the expenses that you paid over the period. Simply divide your account value by $1,000 (for example, an $8,600 account value divided by $1,000 = 8.6), then multiply the result by the number in the first line under the heading entitled “Expenses Paid During Period” to estimate the expenses you paid on your account during this period.
Hypothetical Example for Comparison Purposes
The second line for each share class of the Portfolio in the table below provides information about hypothetical account values and hypothetical expenses based on the Portfolio’s actual expense ratio and an assumed rate of return of 5% per year before expenses, which is not the Portfolio’s actual return. The hypothetical account values and expenses may not be used to estimate the actual ending account balance or expenses you paid for the period. You may use this information to compare the ongoing costs of investing in the Portfolio and other funds. To do so, compare this 5% hypothetical example with the 5% hypothetical examples that appear in the shareholder reports of the other funds.
Please note that the expenses shown in the table are meant to highlight your ongoing costs only and do not reflect any fees or charges of your variable insurance product or any additional expenses that participants in certain eligible qualified plans may bear relating to the operations of their plan. Therefore, the second line for each share class in the table is useful in comparing ongoing costs only, and will not help you determine the relative total costs of owning different funds. In addition, if these other costs were included, your costs would have been higher.
| | | | | | | | | | | | | | | | | | |
T. Rowe Price Small Cap Growth Portfolio
| | | | Annualized
Expense
Ratio | | | Beginning
Account Value
July 1,
2018 | | | Ending
Account Value
December 31,
2018 | | | Expenses Paid
During Period**
July 1, 2018
to
December 31,
2018 | |
Class A (a) | | Actual | | | 0.47 | % | | $ | 1,000.00 | | | $ | 866.90 | | | $ | 2.21 | |
| | Hypothetical* | | | 0.47 | % | | $ | 1,000.00 | | | $ | 1,022.84 | | | $ | 2.40 | |
| | | | | |
Class B (a) | | Actual | | | 0.72 | % | | $ | 1,000.00 | | | $ | 865.60 | | | $ | 3.39 | |
| | Hypothetical* | | | 0.72 | % | | $ | 1,000.00 | | | $ | 1,021.58 | | | $ | 3.67 | |
| | | | | |
Class E (a) | | Actual | | | 0.62 | % | | $ | 1,000.00 | | | $ | 866.30 | | | $ | 2.92 | |
| | Hypothetical* | | | 0.62 | % | | $ | 1,000.00 | | | $ | 1,022.08 | | | $ | 3.16 | |
| | | | | |
Class G (a) | | Actual | | | 0.77 | % | | $ | 1,000.00 | | | $ | 865.50 | | | $ | 3.62 | |
| | Hypothetical* | | | 0.77 | % | | $ | 1,000.00 | | | $ | 1,021.32 | | | $ | 3.92 | |
| * | Hypothetical assumes a rate of return of 5% per year before expenses. |
| ** | Expenses paid are equal to the Portfolio’s annualized expense ratio for the most recent six month period, as shown above, multiplied by the average account value over the period, multiplied by the number of days (184 days) in the most recent fiscal half-year, divided by 365 (to reflect theone-half year period). |
| (a) | The annualized expense ratio shown reflects the impact of the management fee waiver as described in Note 5 of the Notes to Financial Statements. |
BHFTII-4
Brighthouse Funds Trust II
T. Rowe Price Small Cap Growth Portfolio
Schedule of Investments as of December 31, 2018
Common Stocks—99.4% of Net Assets
| | | | | | | | |
| Security Description | | Shares | | | Value | |
|
| Aerospace & Defense—4.6% | |
Aerojet Rocketdyne Holdings, Inc. (a) (b) | | | 233,706 | | | $ | 8,233,462 | |
BWX Technologies, Inc. (b) | | | 113,933 | | | | 4,355,659 | |
Curtiss-Wright Corp. | | | 61,659 | | | | 6,296,617 | |
HEICO Corp. - Class A | | | 186,807 | | | | 11,768,841 | |
Hexcel Corp. (b) | | | 107,570 | | | | 6,168,064 | |
Moog, Inc. - Class A | | | 79,463 | | | | 6,156,793 | |
Teledyne Technologies, Inc. (a) | | | 60,846 | | | | 12,599,381 | |
| | | | | | | | |
| | | | | | | 55,578,817 | |
| | | | | | | | |
|
| Air Freight & Logistics—0.4% | |
XPO Logistics, Inc. (a) (b) | | | 83,421 | | | | 4,758,334 | |
| | | | | | | | |
|
| Airlines—0.1% | |
Hawaiian Holdings, Inc. (b) | | | 42,700 | | | | 1,127,707 | |
| | | | | | | | |
|
| Auto Components—0.7% | |
Cooper-Standard Holdings, Inc. (a) | | | 34,397 | | | | 2,136,742 | |
LCI Industries | | | 37,290 | | | | 2,490,972 | |
Visteon Corp. (a) (b) | | | 56,000 | | | | 3,375,680 | |
| | | | | | | | |
| | | | | | | 8,003,394 | |
| | | | | | | | |
|
| Banks—1.7% | |
Ameris Bancorp (b) | | | 106,793 | | | | 3,382,134 | |
Carolina Financial Corp. | | | 100,219 | | | | 2,965,480 | |
CenterState Bank Corp. | | | 196,728 | | | | 4,139,157 | |
First Bancorp | | | 136,100 | | | | 4,445,026 | |
Signature Bank | | | 25,369 | | | | 2,608,187 | |
SVB Financial Group (a) | | | 14,091 | | | | 2,676,163 | |
| | | | | | | | |
| | | | | | | 20,216,147 | |
| | | | | | | | |
|
| Beverages—0.6% | |
Boston Beer Co., Inc. (The) - Class A (a) | | | 18,666 | | | | 4,495,519 | |
Coca-Cola Bottling Co. Consolidated | | | 16,900 | | | | 2,997,722 | |
| | | | | | | | |
| | | | | | | 7,493,241 | |
| | | | | | | | |
|
| Biotechnology—7.8% | |
Abeona Therapeutics, Inc. (a) (b) | | | 28,300 | | | | 202,062 | |
ACADIA Pharmaceuticals, Inc. (a) (b) | | | 132,288 | | | | 2,139,097 | |
Acceleron Pharma, Inc. (a) (b) | | | 51,167 | | | | 2,228,323 | |
Agios Pharmaceuticals, Inc. (a) (b) | | | 63,543 | | | | 2,929,968 | |
Aimmune Therapeutics, Inc. (a) (b) | | | 58,994 | | | | 1,411,137 | |
Alkermes plc (a) | | | 44,085 | | | | 1,300,948 | |
Alnylam Pharmaceuticals, Inc. (a) (b) | | | 7,584 | | | | 552,949 | |
AMAG Pharmaceuticals, Inc. (a) (b) | | | 59,984 | | | | 911,157 | |
Amicus Therapeutics, Inc. (a) (b) | | | 110,300 | | | | 1,056,674 | |
Array BioPharma, Inc. (a) (b) | | | 226,600 | | | | 3,229,050 | |
Bluebird Bio, Inc. (a) (b) | | | 21,567 | | | | 2,139,446 | |
Blueprint Medicines Corp. (a) (b) | | | 44,117 | | | | 2,378,347 | |
CRISPR Therapeutics AG (a) (b) | | | 28,900 | | | | 825,673 | |
Emergent BioSolutions, Inc. (a) | | | 99,400 | | | | 5,892,432 | |
Enanta Pharmaceuticals, Inc. (a) (b) | | | 14,200 | | | | 1,005,786 | |
Exact Sciences Corp. (a) (b) | | | 132,700 | | | | 8,373,370 | |
Exelixis, Inc. (a) | | | 47,067 | | | | 925,808 | |
FibroGen, Inc. (a) | | | 71,400 | | | | 3,304,392 | |
Genomic Health, Inc. (a) | | | 55,300 | | | | 3,561,873 | |
Global Blood Therapeutics, Inc. (a) (b) | | | 40,387 | | | | 1,657,886 | |
|
| Biotechnology—(Continued) | |
GlycoMimetics, Inc. (a) | | | 51,900 | | | | 491,493 | |
Immunomedics, Inc. (a) (b) | | | 116,095 | | | | 1,656,676 | |
Insmed, Inc. (a) (b) | | | 123,284 | | | | 1,617,486 | |
Ionis Pharmaceuticals, Inc. (a) | | | 26,886 | | | | 1,453,457 | |
Ironwood Pharmaceuticals, Inc. (a) | | | 129,080 | | | | 1,337,269 | |
Ligand Pharmaceuticals, Inc. (a) (b) | | | 42,568 | | | | 5,776,478 | |
Loxo Oncology, Inc. (a) | | | 26,900 | | | | 3,767,883 | |
Madrigal Pharmaceuticals, Inc. (a) (b) | | | 5,100 | | | | 574,872 | |
Neurocrine Biosciences, Inc. (a) | | | 53,742 | | | | 3,837,716 | |
Repligen Corp. (a) (b) | | | 75,734 | | | | 3,994,211 | |
Sage Therapeutics, Inc. (a) | | | 49,238 | | | | 4,716,508 | |
Sarepta Therapeutics, Inc. (a) (b) | | | 67,700 | | | | 7,388,101 | |
Seattle Genetics, Inc. (a) | | | 34,312 | | | | 1,944,118 | |
Spark Therapeutics, Inc. (a) (b) | | | 40,118 | | | | 1,570,219 | |
TESARO, Inc. (a) (b) | | | 32,095 | | | | 2,383,054 | |
Ultragenyx Pharmaceutical, Inc. (a) (b) | | | 48,196 | | | | 2,095,562 | |
uniQure NV (a) (b) | | | 32,900 | | | | 948,178 | |
Xencor, Inc. (a) | | | 74,100 | | | | 2,679,456 | |
| | | | | | | | |
| | | | | | | 94,259,115 | |
| | | | | | | | |
|
| Building Products—1.0% | |
AAON, Inc. (b) | | | 35,508 | | | | 1,244,910 | |
Lennox International, Inc. | | | 36,082 | | | | 7,896,907 | |
Patrick Industries, Inc. (a) | | | 104,635 | | | | 3,098,242 | |
| | | | | | | | |
| | | | | | | 12,240,059 | |
| | | | | | | | |
|
| Capital Markets—2.3% | |
Cboe Global Markets, Inc. | | | 73,416 | | | | 7,182,287 | |
E*Trade Financial Corp. | | | 70,165 | | | | 3,078,840 | |
FactSet Research Systems, Inc. | | | 11,482 | | | | 2,297,893 | |
MarketAxess Holdings, Inc. | | | 40,895 | | | | 8,641,522 | |
MSCI, Inc. | | | 46,116 | | | | 6,798,882 | |
| | | | | | | | |
| | | | | | | 27,999,424 | |
| | | | | | | | |
|
| Chemicals—3.1% | |
AdvanSix, Inc. (a) | | | 90,708 | | | | 2,207,833 | |
Chase Corp. | | | 48,305 | | | | 4,832,915 | |
Ingevity Corp. (a) | | | 99,168 | | | | 8,299,370 | |
Innospec, Inc. | | | 76,578 | | | | 4,729,457 | |
Minerals Technologies, Inc. | | | 44,431 | | | | 2,281,088 | |
NewMarket Corp. (b) | | | 7,791 | | | | 3,210,593 | |
PolyOne Corp. | | | 121,629 | | | | 3,478,589 | |
Quaker Chemical Corp. | | | 16,300 | | | | 2,896,673 | |
ScottsMiracle-Gro Co. (The) (b) | | | 48,700 | | | | 2,993,102 | |
Stepan Co. | | | 24,600 | | | | 1,820,400 | |
| | | | | | | | |
| | | | | | | 36,750,020 | |
| | | | | | | | |
|
| Commercial Services & Supplies—2.5% | |
Advanced Disposal Services, Inc. (a) | | | 166,348 | | | | 3,982,371 | |
Casella Waste Systems, Inc. - Class A (a) | | | 250,200 | | | | 7,128,198 | |
Healthcare Services Group, Inc. (b) | | | 77,512 | | | | 3,114,432 | |
Rollins, Inc. (b) | | | 212,549 | | | | 7,673,019 | |
U.S. Ecology, Inc. | | | 68,114 | | | | 4,289,820 | |
UniFirst Corp. | | | 24,900 | | | | 3,562,443 | |
| | | | | | | | |
| | | | | | | 29,750,283 | |
| | | | | | | | |
See accompanying notes to financial statements.
BHFTII-5
Brighthouse Funds Trust II
T. Rowe Price Small Cap Growth Portfolio
Schedule of Investments as of December 31, 2018
Common Stocks—(Continued)
| | | | | | | | |
| Security Description | | Shares | | | Value | |
|
| Communications Equipment—0.6% | |
ARRIS International plc (a) | | | 77,607 | | | $ | 2,372,446 | |
EchoStar Corp. - Class A (a) | | | 41,262 | | | | 1,515,141 | |
NetScout Systems, Inc. (a) (b) | | | 68,269 | | | | 1,613,196 | |
Plantronics, Inc. | | | 58,862 | | | | 1,948,332 | |
| | | | | | | | |
| | | | | | | 7,449,115 | |
| | | | | | | | |
|
| Construction Materials—0.2% | |
Eagle Materials, Inc. | | | 42,500 | | | | 2,593,775 | |
| | | | | | | | |
|
| Consumer Finance—0.4% | |
PRA Group, Inc. (a) (b) | | | 74,787 | | | | 1,822,559 | |
SLM Corp. (a) (b) | | | 337,800 | | | | 2,807,118 | |
| | | | | | | | |
| | | | | | | 4,629,677 | |
| | | | | | | | |
|
| Containers & Packaging—0.8% | |
Berry Global Group, Inc. (a) | | | 161,697 | | | | 7,685,459 | |
Graphic Packaging Holding Co. (b) | | | 214,719 | | | | 2,284,610 | |
| | | | | | | | |
| | | | | | | 9,970,069 | |
| | | | | | | | |
|
| Distributors—0.8% | |
Pool Corp. | | | 63,785 | | | | 9,481,640 | |
| | | | | | | | |
|
| Diversified Consumer Services—3.4% | |
Bright Horizons Family Solutions, Inc. (a) | | | 103,154 | | | | 11,496,513 | |
frontdoor, Inc. (a) | | | 77,753 | | | | 2,069,007 | |
Grand Canyon Education, Inc. (a) | | | 62,856 | | | | 6,042,976 | |
Service Corp. International | | | 211,732 | | | | 8,524,330 | |
ServiceMaster Global Holdings, Inc. (a) | | | 179,113 | | | | 6,580,612 | |
Sotheby’s (a) | | | 43,709 | | | | 1,736,996 | |
Strategic Education, Inc. | | | 24,725 | | | | 2,804,310 | |
Weight Watchers International, Inc. (a) | | | 47,300 | | | | 1,823,415 | |
| | | | | | | | |
| | | | | | | 41,078,159 | |
| | | | | | | | |
|
| Electrical Equipment—0.6% | |
Atkore International Group, Inc. (a) | | | 174,270 | | | | 3,457,517 | |
Generac Holdings, Inc. (a) | | | 67,002 | | | | 3,329,999 | |
| | | | | | | | |
| | | | | | | 6,787,516 | |
| | | | | | | | |
|
| Electronic Equipment, Instruments & Components—3.0% | |
Cognex Corp. (b) | | | 99,490 | | | | 3,847,278 | |
Coherent, Inc. (a) (b) | | | 43,443 | | | | 4,592,360 | |
ePlus, Inc. (a) | | | 12,600 | | | | 896,742 | |
Littelfuse, Inc. | | | 36,400 | | | | 6,241,872 | |
Novanta, Inc. (a) | | | 103,600 | | | | 6,526,800 | |
OSI Systems, Inc. (a) | | | 50,254 | | | | 3,683,618 | |
Tech Data Corp. (a) | | | 26,800 | | | | 2,192,508 | |
Zebra Technologies Corp. - Class A (a) | | | 53,200 | | | | 8,471,036 | |
| | | | | | | | |
| | | | | | | 36,452,214 | |
| | | | | | | | |
|
| Energy Equipment & Services—0.7% | |
Apergy Corp. (a) | | | 121,700 | | | | 3,295,636 | |
Computer Modelling Group, Ltd. | | | 54,725 | | | | 244,122 | |
Dril-Quip, Inc. (a) | | | 28,032 | | | | 841,801 | |
Exterran Corp. (a) | | | 97,600 | | | | 1,727,520 | |
|
| Energy Equipment & Services—(Continued) | |
Oceaneering International, Inc. (a) | | | 59,673 | | | | 722,043 | |
RPC, Inc. (b) | | | 116,100 | | | | 1,145,907 | |
| | | | | | | | |
| | | | | | | 7,977,029 | |
| | | | | | | | |
|
| Entertainment—1.5% | |
Lions Gate Entertainment Corp. - Class B | | | 100,533 | | | | 1,495,931 | |
Live Nation Entertainment, Inc. (a) (b) | | | 157,336 | | | | 7,748,798 | |
Take-Two Interactive Software, Inc. (a) | | | 89,416 | | | | 9,204,483 | |
| | | | | | | | |
| | | | | | | 18,449,212 | |
| | | | | | | | |
|
| Equity Real Estate Investment Trusts—2.9% | |
CoreSite Realty Corp. (b) | | | 63,170 | | | | 5,510,319 | |
CubeSmart | | | 116,671 | | | | 3,347,291 | |
CyrusOne, Inc. (b) | | | 111,255 | | | | 5,883,164 | |
Empire State Realty Trust, Inc. - Class A | | | 112,138 | | | | 1,595,724 | |
Equity Lifestyle Properties, Inc. | | | 57,744 | | | | 5,608,675 | |
First Industrial Realty Trust, Inc. | | | 164,050 | | | | 4,734,483 | |
Pebblebrook Hotel Trust | | | 26,203 | | | | 741,807 | |
PS Business Parks, Inc. | | | 24,111 | | | | 3,158,541 | |
Terreno Realty Corp. | | | 109,417 | | | | 3,848,196 | |
| | | | | | | | |
| | | | | | | 34,428,200 | |
| | | | | | | | |
|
| Food & Staples Retailing—1.7% | |
Casey’s General Stores, Inc. | | | 66,172 | | | | 8,479,280 | |
Performance Food Group Co. (a) | | | 213,600 | | | | 6,892,872 | |
Sprouts Farmers Market, Inc. (a) | | | 209,100 | | | | 4,915,941 | |
| | | | | | | | |
| | | | | | | 20,288,093 | |
| | | | | | | | |
|
| Food Products—1.4% | |
J&J Snack Foods Corp. | | | 41,332 | | | | 5,976,194 | |
John B Sanfilippo & Son, Inc. | | | 32,995 | | | | 1,836,502 | |
Post Holdings, Inc. (a) (b) | | | 67,025 | | | | 5,973,938 | |
TreeHouse Foods, Inc. (a) (b) | | | 55,344 | | | | 2,806,494 | |
| | | | | | | | |
| | | | | | | 16,593,128 | |
| | | | | | | | |
|
| Health Care Equipment & Supplies—5.4% | |
Avanos Medical, Inc. (a) | | | 53,988 | | | | 2,418,123 | |
Cantel Medical Corp. | | | 77,996 | | | | 5,806,802 | |
Cooper Cos., Inc. (The) | | | 16,502 | | | | 4,199,759 | |
Globus Medical, Inc. - Class A (a) | | | 93,500 | | | | 4,046,680 | |
Haemonetics Corp. (a) | | | 56,269 | | | | 5,629,713 | |
ICU Medical, Inc. (a) | | | 42,480 | | | | 9,754,682 | |
Inogen, Inc. (a) | | | 35,334 | | | | 4,387,423 | |
LivaNova plc (a) | | | 57,400 | | | | 5,250,378 | |
Masimo Corp. (a) | | | 68,885 | | | | 7,396,183 | |
Natus Medical, Inc. (a) (b) | | | 46,072 | | | | 1,567,830 | |
NuVasive, Inc. (a) | | | 79,685 | | | | 3,949,189 | |
Penumbra, Inc. (a) (b) | | | 37,169 | | | | 4,542,052 | |
West Pharmaceutical Services, Inc. | | | 65,274 | | | | 6,398,810 | |
| | | | | | | | |
| | | | | | | 65,347,624 | |
| | | | | | | | |
|
| Health Care Providers & Services—4.3% | |
Addus HomeCare Corp. (a) | | | 59,716 | | | | 4,053,522 | |
BioTelemetry, Inc. (a) | | | 71,877 | | | | 4,292,495 | |
See accompanying notes to financial statements.
BHFTII-6
Brighthouse Funds Trust II
T. Rowe Price Small Cap Growth Portfolio
Schedule of Investments as of December 31, 2018
Common Stocks—(Continued)
| | | | | | | | |
| Security Description | | Shares | | | Value | |
|
| Health Care Providers & Services—(Continued) | |
Chemed Corp. | | | 27,500 | | | $ | 7,790,200 | |
Corvel Corp. (a) | | | 31,449 | | | | 1,941,032 | |
Encompass Health Corp. | | | 80,509 | | | | 4,967,405 | |
Ensign Group, Inc. (The) (b) | | | 139,900 | | | | 5,426,721 | |
Molina Healthcare, Inc. (a) | | | 98,200 | | | | 11,412,804 | |
U.S. Physical Therapy, Inc. | | | 47,758 | | | | 4,888,031 | |
WellCare Health Plans, Inc. (a) | | | 27,199 | | | | 6,421,412 | |
| | | | | | | | |
| | | | | | | 51,193,622 | |
| | | | | | | | |
|
| Health Care Technology—1.0% | |
Omnicell, Inc. (a) | | | 85,722 | | | | 5,249,615 | |
Tabula Rasa HealthCare, Inc. (a) | | | 34,700 | | | | 2,212,472 | |
Veeva Systems, Inc. - Class A (a) | | | 50,162 | | | | 4,480,470 | |
| | | | | | | | |
| | | | | | | 11,942,557 | |
| | | | | | | | |
|
| Hotels, Restaurants & Leisure—5.2% | |
Boyd Gaming Corp. (b) | | | 181,500 | | | | 3,771,570 | |
Cheesecake Factory, Inc. (The) (b) | | | 54,949 | | | | 2,390,831 | |
Choice Hotels International, Inc. (b) | | | 40,368 | | | | 2,889,542 | |
Churchill Downs, Inc. | | | 34,319 | | | | 8,371,777 | |
Denny’s Corp. (a) | | | 285,219 | | | | 4,623,400 | |
Domino’s Pizza, Inc. | | | 24,062 | | | | 5,967,135 | |
Hilton Grand Vacations, Inc. (a) | | | 135,683 | | | | 3,580,674 | |
Marriott Vacations Worldwide Corp. | | | 19,512 | | | | 1,375,791 | |
Papa John’s International, Inc. (b) | | | 86,600 | | | | 3,447,546 | |
Penn National Gaming, Inc. (a) (b) | | | 122,665 | | | | 2,309,782 | |
Ruth’s Hospitality Group, Inc. | | | 163,300 | | | | 3,711,809 | |
Six Flags Entertainment Corp. (b) | | | 59,859 | | | | 3,329,956 | |
Texas Roadhouse, Inc. | | | 119,600 | | | | 7,140,120 | |
Vail Resorts, Inc. (b) | | | 43,681 | | | | 9,208,829 | |
| | | | | | | | |
| | | | | | | 62,118,762 | |
| | | | | | | | |
|
| Household Durables—0.6% | |
Helen of Troy, Ltd. (a) | | | 58,876 | | | | 7,723,354 | |
| | | | | | | | |
|
| Independent Power and Renewable Electricity Producers—0.4% | |
Ormat Technologies, Inc. (b) | | | 87,290 | | | | 4,565,267 | |
| | | | | | | | |
|
| Insurance—1.1% | |
Heritage Insurance Holdings, Inc. | | | 57,817 | | | | 851,066 | |
Primerica, Inc. | | | 89,409 | | | | 8,736,154 | |
Universal Insurance Holdings, Inc. | | | 87,300 | | | | 3,310,416 | |
| | | | | | | | |
| | | | | | | 12,897,636 | |
| | | | | | | | |
|
| Internet & Direct Marketing Retail—0.8% | |
Liberty Expedia Holdings, Inc. - Class A (a) | | | 73,875 | | | | 2,889,251 | |
Shutterfly, Inc. (a) | | | 42,261 | | | | 1,701,428 | |
Stamps.com, Inc. (a) | | | 35,476 | | | | 5,521,485 | |
| | | | | | | | |
| | | | | | | 10,112,164 | |
| | | | | | | | |
|
| IT Services—5.4% | |
Booz Allen Hamilton Holding Corp. | | | 204,745 | | | | 9,227,857 | |
Broadridge Financial Solutions, Inc. | | | 66,563 | | | | 6,406,689 | |
Cardtronics plc - Class A (a) | | | 107,572 | | | | 2,796,872 | |
CoreLogic, Inc. (a) | | | 131,330 | | | | 4,389,049 | |
|
| IT Services—(Continued) | |
Euronet Worldwide, Inc. (a) (b) | | | 96,598 | | | | 9,889,703 | |
Gartner, Inc. (a) (b) | | | 33,161 | | | | 4,239,302 | |
GTT Communications, Inc. (a) (b) | | | 71,900 | | | | 1,701,154 | |
Jack Henry & Associates, Inc. | | | 22,262 | | | | 2,816,588 | |
MAXIMUS, Inc. | | | 129,134 | | | | 8,405,332 | |
Science Applications International Corp. | | | 80,300 | | | | 5,115,110 | |
Travelport Worldwide, Ltd. | | | 193,289 | | | | 3,019,174 | |
WEX, Inc. (a) | | | 47,974 | | | | 6,719,239 | |
| | | | | | | | |
| | | | | | | 64,726,069 | |
| | | | | | | | |
|
| Leisure Products—0.3% | |
Brunswick Corp. | | | 88,146 | | | | 4,094,382 | |
| | | | | | | | |
|
| Life Sciences Tools & Services—2.3% | |
Bio-Rad Laboratories, Inc. - Class A (a) | | | 20,289 | | | | 4,711,512 | |
Bruker Corp. (b) | | | 55,000 | | | | 1,637,350 | |
Cambrex Corp. (a) (b) | | | 80,963 | | | | 3,057,163 | |
Charles River Laboratories International, Inc. (a) | | | 70,297 | | | | 7,956,214 | |
PRA Health Sciences, Inc. (a) | | | 92,362 | | | | 8,493,610 | |
Syneos Health, Inc. (a) | | | 45,886 | | | | 1,805,614 | |
| | | | | | | | |
| | | | | | | 27,661,463 | |
| | | | | | | | |
|
| Machinery—3.5% | |
Chart Industries, Inc. (a) | | | 32,062 | | | | 2,084,992 | |
Douglas Dynamics, Inc. (b) | | | 93,500 | | | | 3,355,715 | |
Graco, Inc. | | | 139,277 | | | | 5,828,742 | |
IDEX Corp. | | | 22,573 | | | | 2,850,067 | |
John Bean Technologies Corp. | | | 56,661 | | | | 4,068,826 | |
Lincoln Electric Holdings, Inc. (b) | | | 32,772 | | | | 2,584,072 | |
Lydall, Inc. (a) | | | 85,808 | | | | 1,742,760 | |
Middleby Corp. (The) (a) (b) | | | 19,998 | | | | 2,054,395 | |
Nordson Corp. | | | 34,294 | | | | 4,092,989 | |
Standex International Corp. | | | 15,402 | | | | 1,034,706 | |
Toro Co. (The) | | | 133,085 | | | | 7,436,790 | |
Woodward, Inc. | | | 59,857 | | | | 4,446,777 | |
| | | | | | | | |
| | | | | | | 41,580,831 | |
| | | | | | | | |
|
| Marine—0.1% | |
Matson, Inc. | | | 26,460 | | | | 847,249 | |
| | | | | | | | |
|
| Media—1.7% | |
Cable One, Inc. | | | 12,100 | | | | 9,923,210 | |
GCI Liberty, Inc. - Class A (a) (b) | | | 102,114 | | | | 4,203,012 | |
Gray Television, Inc. (a) (b) | | | 171,054 | | | | 2,521,336 | |
MSG Networks, Inc. - Class A (a) (b) | | | 174,682 | | | | 4,115,508 | |
| | | | | | | | |
| | | | | | | 20,763,066 | |
| | | | | | | | |
|
| Metals & Mining—0.2% | |
Worthington Industries, Inc. | | | 54,116 | | | | 1,885,401 | |
| | | | | | | | |
|
| Multiline Retail—0.1% | |
Big Lots, Inc. | | | 26,358 | | | | 762,273 | |
| | | | | | | | |
|
| Oil, Gas & Consumable Fuels—1.8% | |
Carrizo Oil & Gas, Inc. (a) | | | 55,028 | | | | 621,266 | |
See accompanying notes to financial statements.
BHFTII-7
Brighthouse Funds Trust II
T. Rowe Price Small Cap Growth Portfolio
Schedule of Investments as of December 31, 2018
Common Stocks—(Continued)
| | | | | | | | |
| Security Description | | Shares | | | Value | |
|
| Oil, Gas & Consumable Fuels—(Continued) | |
Centennial Resource Development, Inc. - Class A (a) (b) | | | 245,627 | | | $ | 2,706,810 | |
Matador Resources Co. (a) (b) | | | 254,134 | | | | 3,946,701 | |
PBF Energy, Inc. - Class A (b) | | | 144,300 | | | | 4,714,281 | |
PDC Energy, Inc. (a) | | | 107,178 | | | | 3,189,617 | |
WPX Energy, Inc. (a) (b) | | | 585,858 | | | | 6,649,488 | |
| | | | | | | | |
| | | | | | | 21,828,163 | |
| | | | | | | | |
|
| Personal Products—0.2% | |
Nu Skin Enterprises, Inc. - Class A | | | 36,802 | | | | 2,257,067 | |
| | | | | | | | |
|
| Pharmaceuticals—2.4% | |
Aerie Pharmaceuticals, Inc. (a) | | | 47,112 | | | | 1,700,743 | |
Assertio Therapeutics, Inc. (a) | | | 150,974 | | | | 545,016 | |
Catalent, Inc. (a) | | | 167,570 | | | | 5,224,833 | |
Innoviva, Inc. (a) | | | 77,730 | | | | 1,356,389 | |
Jazz Pharmaceuticals plc (a) | | | 11,791 | | | | 1,461,612 | |
MyoKardia, Inc. (a) | | | 39,037 | | | | 1,907,348 | |
Nektar Therapeutics (a) | | | 64,244 | | | | 2,111,700 | |
Pacira Pharmaceuticals, Inc. (a) | | | 33,107 | | | | 1,424,263 | |
Phibro Animal Health Corp. - Class A | | | 77,841 | | | | 2,503,367 | |
Prestige Consumer Healthcare, Inc. (a) (b) | | | 131,778 | | | | 4,069,305 | |
Supernus Pharmaceuticals, Inc. (a) | | | 98,334 | | | | 3,266,656 | |
TherapeuticsMD, Inc. (a) (b) | | | 238,610 | | | | 909,104 | |
Theravance Biopharma, Inc. (a) (b) | | | 61,814 | | | | 1,581,820 | |
WAVE Life Sciences, Ltd. (a) (b) | | | 21,287 | | | | 894,905 | |
| | | | | | | | |
| | | | | | | 28,957,061 | |
| | | | | | | | |
|
| Professional Services—2.5% | |
ASGN, Inc. (a) | | | 104,100 | | | | 5,673,450 | |
Dun & Bradstreet Corp. (The) | | | 26,463 | | | | 3,777,329 | |
Exponent, Inc. | | | 138,764 | | | | 7,036,722 | |
Insperity, Inc. | | | 78,964 | | | | 7,372,079 | |
TransUnion | | | 112,661 | | | | 6,399,145 | |
| | | | | | | | |
| | | | | | | 30,258,725 | |
| | | | | | | | |
|
| Real Estate Management & Development—0.1% | |
Kennedy-Wilson Holdings, Inc. (b) | | | 65,953 | | | | 1,198,366 | |
| | | | | | | | |
|
| Road & Rail—0.9% | |
Landstar System, Inc. | | | 55,965 | | | | 5,354,172 | |
Old Dominion Freight Line, Inc. (b) | | | 49,246 | | | | 6,081,388 | |
| | | | | | | | |
| | | | | | | 11,435,560 | |
| | | | | | | | |
|
| Semiconductors & Semiconductor Equipment—4.0% | |
Advanced Energy Industries, Inc. (a) | | | 67,844 | | | | 2,912,543 | |
Cabot Microelectronics Corp. | | | 33,683 | | | | 3,211,674 | |
Cirrus Logic, Inc. (a) (b) | | | 114,374 | | | | 3,794,929 | |
Entegris, Inc. (b) | | | 142,200 | | | | 3,966,669 | |
Ichor Holdings, Ltd. (a) (b) | | | 57,300 | | | | 933,990 | |
Integrated Device Technology, Inc. (a) | | | 184,872 | | | | 8,953,351 | |
MaxLinear, Inc. (a) (b) | | | 222,689 | | | | 3,919,326 | |
Mellanox Technologies, Ltd. (a) | | | 92,100 | | | | 8,508,198 | |
MKS Instruments, Inc. | | | 83,100 | | | | 5,369,091 | |
Nanometrics, Inc. (a) | | | 91,863 | | | | 2,510,616 | |
Versum Materials, Inc. | | | 148,309 | | | | 4,111,126 | |
| | | | | | | | |
| | | | | | | 48,191,513 | |
| | | | | | | | |
|
| Software—8.5% | |
ACI Worldwide, Inc. (a) | | | 150,669 | | | | 4,169,011 | |
Aspen Technology, Inc. (a) | | | 91,968 | | | | 7,557,930 | |
Blackbaud, Inc. (b) | | | 86,224 | | | | 5,423,490 | |
CommVault Systems, Inc. (a) (b) | | | 78,971 | | | | 4,666,396 | |
Descartes Systems Group, Inc. (The) (a) | | | 75,558 | | | | 1,999,265 | |
Ellie Mae, Inc. (a) (b) | | | 28,581 | | | | 1,795,744 | |
Envestnet, Inc. (a) (b) | | | 117,635 | | | | 5,786,466 | |
Fair Isaac Corp. (a) | | | 60,368 | | | | 11,288,816 | |
Fortinet, Inc. (a) | | | 56,233 | | | | 3,960,490 | |
j2 Global, Inc. (b) | | | 46,991 | | | | 3,260,235 | |
LogMeIn, Inc. | | | 33,682 | | | | 2,747,441 | |
Manhattan Associates, Inc. (a) | | | 85,623 | | | | 3,627,846 | |
Pegasystems, Inc. (b) | | | 101,995 | | | | 4,878,421 | |
Proofpoint, Inc. (a) | | | 59,401 | | | | 4,978,398 | |
PTC, Inc. (a) (b) | | | 67,668 | | | | 5,609,677 | |
Qualys, Inc. (a) | | | 78,200 | | | | 5,844,668 | |
RealPage, Inc. (a) (b) | | | 122,763 | | | | 5,915,949 | |
SS&C Technologies Holdings, Inc. | | | 157,680 | | | | 7,112,945 | |
Tyler Technologies, Inc. (a) | | | 35,251 | | | | 6,550,341 | |
Ultimate Software Group, Inc. (The) (a) | | | 22,924 | | | | 5,613,400 | |
| | | | | | | | |
| | | | | | | 102,786,929 | |
| | | | | | | | |
|
| Specialty Retail—1.8% | |
Aaron’s, Inc. | | | 27,861 | | | | 1,171,555 | |
Burlington Stores, Inc. (a) | | | 84,066 | | | | 13,675,016 | |
Children’s Place, Inc. (The) (b) | | | 21,892 | | | | 1,972,250 | |
Murphy USA, Inc. (a) | | | 61,120 | | | | 4,684,237 | |
| | | | | | | | |
| | | | | | | 21,503,058 | |
| | | | | | | | |
|
| Technology Hardware, Storage & Peripherals—0.2% | |
NCR Corp. (a) (b) | | | 111,550 | | | | 2,574,574 | |
| | | | | | | | |
|
| Textiles, Apparel & Luxury Goods—0.7% | |
Carter’s, Inc. | | | 41,172 | | | | 3,360,459 | |
Steven Madden, Ltd. (b) | | | 182,992 | | | | 5,537,338 | |
| | | | | | | | |
| | | | | | | 8,897,797 | |
| | | | | | | | |
|
| Thrifts & Mortgage Finance—0.4% | |
MGIC Investment Corp. (a) | | | 264,583 | | | | 2,767,538 | |
Radian Group, Inc. | | | 148,182 | | | | 2,424,258 | |
| | | | | | | | |
| | | | | | | 5,191,796 | |
| | | | | | | | |
|
| Trading Companies & Distributors—0.7% | |
Beacon Roofing Supply, Inc. (a) | | | 69,750 | | | | 2,212,470 | |
Univar, Inc. (a) | | | 132,508 | | | | 2,350,692 | |
Watsco, Inc. | | | 31,571 | | | | 4,392,789 | |
| | | | | | | | |
| | | | | | | 8,955,951 | |
| | | | | | | | |
Total Common Stocks
(Cost $1,016,923,758) | | | | | | | 1,196,612,648 | |
| | | | | | | | |
|
| Short-Term Investment—0.8% | |
|
| Mutual Fund—0.8% | |
T. Rowe Price Government Reserve Fund (c) | | | 9,355,566 | | | | 9,355,566 | |
| | | | | | | | |
Total Short-Term Investments
(Cost $9,355,566) | | | | | | | 9,355,566 | |
| | | | | | | | |
See accompanying notes to financial statements.
BHFTII-8
Brighthouse Funds Trust II
T. Rowe Price Small Cap Growth Portfolio
Schedule of Investments as of December 31, 2018
Securities Lending Reinvestments (d)—18.6%
| | | | | | | | |
| Security Description | | Principal
Amount* | | | Value | |
|
| Certificates of Deposit— 9.0% | |
Banco Del Estado De Chile New York | | | | | | | | |
2.720%, 1M LIBOR + 0.250%, 03/20/19 (e) | | | 5,000,000 | | | $ | 4,999,570 | |
2.820%, 1M LIBOR + 0.350%, 05/20/19 (e) | | | 2,000,000 | | | | 1,999,958 | |
Bank of Montreal (Chicago)
2.710%, 1M LIBOR + 0.330%, 08/06/19 (e) | | | 4,000,000 | | | | 3,999,900 | |
Bank of Nova Scotia | | | | | | | | |
2.890%, SOFR + 0.430%, 05/16/19 (e) | | | 7,000,000 | | | | 6,999,995 | |
3.072%, 3M LIBOR + 0.280%, 03/20/19 (e) | | | 1,500,000 | | | | 1,500,598 | |
Barclays Bank plc
| | | | | | | | |
2.547%, 1M LIBOR + 0.200%, 02/04/19 (e) | | | 2,000,000 | | | | 1,999,810 | |
Canadian Imperial Bank of Commerce
2.740%, 1M LIBOR + 0.270%, 07/19/19 (e) | | | 4,000,000 | | | | 3,998,376 | |
China Construction Bank Corp.
2.550%, 01/07/19 | | | 3,000,000 | | | | 3,000,000 | |
Citibank N.A.
2.490%, 02/04/19 | | | 2,000,000 | | | | 1,999,722 | |
Commonwealth Bank of Australia | | | | | | | | |
2.617%, 3M LIBOR + 0.140%, 04/23/19 (e) | | | 500,000 | | | | 500,002 | |
2.642%, 1M LIBOR + 0.210%, 09/13/19 (e) | | | 4,000,000 | | | | 4,000,000 | |
Credit Agricole S.A. | | | | | | | | |
2.500%, 02/12/19 | | | 4,000,000 | | | | 3,999,320 | |
2.799%, 1M LIBOR + 0.320%, 05/21/19 (e) | | | 4,000,000 | | | | 4,000,252 | |
Credit Suisse AG
2.620%, 04/01/19 | | | 10,000,000 | | | | 9,994,820 | |
Industrial & Commercial Bank of China, Ltd.
2.850%, 02/15/19 | | | 2,000,000 | | | | 1,999,852 | |
Mitsubishi UFJ Trust and Banking Corp.
Zero Coupon, 01/15/19 | | | 5,954,925 | | | | 5,993,880 | |
Mizuho Bank, Ltd., New York
2.649%, 1M LIBOR + 0.300%, 05/01/19 (e) | | | 2,000,000 | | | | 2,000,012 | |
Natixis New York | | | | | | | | |
2.705%, 3M LIBOR + 0.090%, 05/10/19 (e) | | | 3,000,000 | | | | 2,998,110 | |
2.731%, 3M LIBOR + 0.190%, 02/01/19 (e) | | | 1,000,000 | | | | 999,776 | |
Royal Bank of Canada New York | | | | | | | | |
2.650%, 1M LIBOR + 0.250%, 01/11/19 (e) | | | 1,500,000 | | | | 1,500,012 | |
2.665%, 1M LIBOR + 0.210%, 09/17/19 (e) | | | 5,000,000 | | | | 4,994,885 | |
Skandinaviska Enskilda Banken
2.645%, 1M LIBOR + 0.190%, 04/17/19 (e) | | | 3,000,000 | | | | 2,999,754 | |
Societe Generale
2.719%, 3M LIBOR + 0.160%, 05/07/19 (e) | | | 4,000,000 | | | | 3,998,224 | |
Standard Chartered plc
2.686%, 1M LIBOR + 0.180%, 02/25/19 (e) | | | 4,000,000 | | | | 3,999,884 | |
State Street Bank and Trust
2.725%, 1M LIBOR + 0.270%, 05/15/19 (e) | | | 8,000,000 | | | | 7,999,840 | |
Sumitomo Mitsui Banking Corp.
| | | | | | | | |
2.590%, 1M LIBOR + 0.190%, 04/11/19 (e) | | | 3,000,000 | | | | 2,998,899 | |
2.700%, 02/25/19 | | | 2,000,000 | | | | 2,000,184 | |
Sumitomo Mitsui Banking Corp., New York
2.559%, 1M LIBOR + 0.180%, 03/05/19 (e) | | | 2,000,000 | | | | 1,999,526 | |
Sumitomo Mitsui Trust Bank, Ltd.
Zero Coupon, 03/12/19 | | | 3,971,110 | | | | 3,978,280 | |
Svenska Handelsbanken AB
2.767%, 1M LIBOR + 0.380%, 12/10/19 (e) | | | 2,000,000 | | | | 1,999,934 | |
Wells Fargo Bank N.A.
2.730%, 3M LIBOR + 0.210%, 10/25/19 (e) | | | 1,500,000 | | | | 1,500,000 | |
|
| Certificates of Deposit—(Continued) | |
Westpac Banking Corp.
2.850%, FEDEFF PRV + 0.450%, 02/15/19 (e) | | | 1,500,000 | | | | 1,499,991 | |
| | | | | | | | |
| | | | | | | 108,453,366 | |
| | | | | | | | |
|
| Commercial Paper—2.9% | |
Alpine Securities Ltd.
2.529%, 1M LIBOR + 0.180%, 04/03/19 (e) | | | 4,000,000 | | | | 3,998,892 | |
Banco Santander S.A.
2.740%, 02/07/19 | | | 2,978,993 | | | | 2,991,264 | |
Bank of China, Ltd.
2.690%, 01/17/19 | | | 2,979,825 | | | | 2,996,478 | �� |
HSBC Bank plc
2.842%, 1M LIBOR + 0.320%, 07/30/19 (e) | | | 2,000,000 | | | | 2,000,000 | |
ING Funding LLC
| |
2.707%, 1M LIBOR + 0.320%, 02/08/19* (e) | | | 4,000,000 | | | | 4,000,372 | |
Matchpoint Finance plc
2.890%, 05/08/19 | | | 3,941,879 | | | | 3,957,012 | |
Sheffield Receivables Co.
2.930%, SOFR + 0.470%, 05/30/19 (e) | | | 5,000,000 | | | | 4,999,920 | |
Toronto-Dominion Bank
2.729%, 11/05/19 (e) | | | 7,000,000 | | | | 6,999,230 | |
UBS AG
2.779%, 1M LIBOR + 0.430%, 02/01/19 (e) | | | 2,000,000 | | | | 2,000,490 | |
Westpac Banking Corp.
2.659%, 3M LIBOR + 0.070%, 08/07/19 (e) | | | 1,000,000 | | | | 999,343 | |
| | | | | | | | |
| | | | | | | 34,943,001 | |
| | | | | | | | |
|
| Repurchase Agreements—6.7% | |
Citadel Clearing LLC
Repurchase Agreement dated 12/31/18 at 3.000%, due on 04/02/19 with a maturity value of $7,557,500; collateralized by various Common Stock with an aggregate market value of $8,251,375. | | | 7,500,000 | | | | 7,500,000 | |
Citigroup Global Markets, Inc. | | | | | | | | |
Repurchase Agreement dated 12/31/18 at 2.660%, due on 01/07/19 with a maturity value of $5,502,845; collateralized by U.S. Treasury Obligations with rates ranging from 0.625% - 3.125%, maturity dates ranging from 02/15/42 - 02/15/46, and various Common Stock with an aggregate market value of $5,798,573. | | | 5,500,000 | | | | 5,500,000 | |
Repurchase Agreement dated 12/31/18 at 2.790%, due on 02/04/19 with a maturity value of $501,356; collateralized by U.S. Treasury Obligations at 0.000%, maturing 02/12/19, and various Common Stock with an aggregate market value of $544,159. | | | 500,000 | | | | 500,000 | |
Repurchase Agreement dated 12/31/18 at 2.940%, due on 04/02/19 with a maturity value of $1,007,513; collateralized by U.S. Treasury Obligations with rates ranging from 1.125% - 2.750%, maturity dates ranging from 01/31/19 - 08/15/24, and an aggregate market value of $1,020,000. | | | 1,000,000 | | | | 1,000,000 | |
Deutsche Bank Securities, Inc.
Repurchase Agreement dated 12/31/18 at 3.200%, due on 01/02/19 with a maturity value of $7,341,919; collateralized by U.S. Treasury Obligations at 0.000%, maturity dates ranging from 08/15/30 - 08/15/39, and an aggregate market value of $7,487,426. | | | 7,340,614 | | | | 7,340,614 | |
See accompanying notes to financial statements.
BHFTII-9
Brighthouse Funds Trust II
T. Rowe Price Small Cap Growth Portfolio
Schedule of Investments as of December 31, 2018
Securities Lending Reinvestments (d)—(Continued)
| | | | | | | | |
| Security Description | | Principal
Amount* | | | Value | |
|
| Repurchase Agreements—(Continued) | |
Merrill Lynch, Pierce, Fenner & Smith, Inc.
Repurchase Agreement dated 12/31/18 at 2.940%, due on 04/02/19 with a maturity value of $4,634,561; collateralized by various Common Stock with an aggregate market value of $5,060,000. | | | 4,600,000 | | | $ | 4,600,000 | |
NBC Global Finance, Ltd. | | | | | | | | |
Repurchase Agreement dated 12/31/18 at 2.560%, due on 01/02/19 with a maturity value of $20,002,844; collateralized by various Common Stock with an aggregate market value of $22,264,245. | | | 20,000,000 | | | | 20,000,000 | |
Repurchase Agreement dated 12/31/18 at 2.560%, due on 01/02/19 with a maturity value of $4,000,569; collateralized by various Common Stock with an aggregate market value of $4,452,849. | | | 4,000,000 | | | | 4,000,000 | |
Repurchase Agreement dated 12/31/18 at 2.590%, due on 01/07/19 with a maturity value of $2,001,007; collateralized by various Common Stock with an aggregate market value of $2,226,644. | | | 2,000,000 | | | | 2,000,000 | |
Repurchase Agreement dated 12/31/18 at 2.590%, due on 01/07/19 with a maturity value of $1,500,755; collateralized by various Common Stock with an aggregate market value of $1,669,983. | | | 1,500,000 | | | | 1,500,000 | |
Societe Generale | | | | | | | | |
Repurchase Agreement dated 12/31/18 at 2.530%, due on 01/02/19 with a maturity value of $3,000,422; collateralized by U.S. Treasury Obligations with rates ranging from 0.750% - 8.000%, maturity dates ranging from 09/30/19 - 08/15/46, and various Common Stock with an aggregate market value of $3,286,428. | | | 3,000,000 | | | | 3,000,000 | |
Repurchase Agreement dated 12/31/18 at 2.530%, due on 01/02/19 with a maturity value of $3,500,492; collateralized by U.S. Treasury Obligations with rates ranging from 0.750% - 8.000%, maturity dates ranging from 09/30/19 - 08/15/46, and various Common Stock with an aggregate market value of $3,834,166. | | | 3,500,000 | | | | 3,500,000 | |
Repurchase Agreement dated 12/31/18 at 2.530%, due on 01/02/19 with a maturity value of $5,000,703; collateralized by U.S. Treasury Obligations with rates ranging from 0.750% - 8.000%, maturity dates ranging from 09/30/19 - 08/15/46, and various Common Stock with an aggregate market value of $5,477,379. | | | 5,000,000 | | | | 5,000,000 | |
Repurchase Agreement dated 12/31/18 at 2.560%, due on 01/07/19 with a maturity value of $11,705,824; collateralized by U.S. Treasury Obligations with rates ranging from 0.750% - 8.000%, maturity dates ranging from 09/30/19 - 08/15/46, and various Common Stock with an aggregate market value of $12,817,068. | | | 11,700,000 | | | | 11,700,000 | |
Repurchase Agreement dated 12/31/18 at 2.560%, due on 01/07/19 with a maturity value of $1,000,498; collateralized by U.S. Treasury Obligations with rates ranging from 0.750% - 8.000%, maturity dates ranging from 09/30/19 - 08/15/46, and various Common Stock with an aggregate market value of $1,095,476. | | | 1,000,000 | | | | 1,000,000 | |
|
| Repurchase Agreements—(Continued) | |
Societe Generale | |
Repurchase Agreement dated 12/31/18 at 2.560%, due on 01/07/19 with a maturity value of $2,201,095; collateralized by U.S. Treasury Obligations with rates ranging from 0.750% - 8.000%, maturity dates ranging from 09/30/19 - 08/15/46, and various Common Stock with an aggregate market value of $2,410,047. | | | 2,200,000 | | | | 2,200,000 | |
| | | | | | | | |
| | | | | | | 80,340,614 | |
| | | | | | | | |
|
| Time Deposit—0.0% | |
Royal Bank of Canada
2.420%, 01/02/19 | | | 600,000 | | | | 600,000 | |
| | | | | | | | |
Total Securities Lending Reinvestments
(Cost $224,361,046) | | | | | | | 224,336,981 | |
| | | | | | | | |
Total Investments—118.8%
(Cost $1,250,640,370) | | | | | | | 1,430,305,195 | |
Other assets and liabilities (net)—(18.8)% | | | | | | | (226,212,510 | ) |
| | | | | | | | |
| Net Assets—100.0% | | | | | | $ | 1,204,092,685 | |
| | | | | | | | |
| | | | |
| * | | Principal amount stated in U.S. dollars unless otherwise noted. |
| (a) | | Non-income producing security. |
| (b) | | All or a portion of the security was held on loan. As of December 31, 2018, the market value of securities loaned was $220,744,967 and the collateral received consisted of cash in the amount of $224,267,346 andnon-cash collateral with a value of $640,982. The cash collateral investments are disclosed in the Schedule of Investments and categorized as Securities Lending Reinvestments. Thenon-cash collateral received consists of U.S. government securities that are held in safe- keeping by the lending agent, or a third-party custodian, cannot be sold or repledged by the Portfolio. As such, this collateral is excluded from the Statement of Assets and Liabilities. |
| (c) | | Affiliated Issuer. (See Note 6 of the Notes to Financial Statements for a summary of transactions in securities of affiliated issuers.) |
| (d) | | Represents investment of cash collateral received from securities on loan as of December 31, 2018. |
| (e) | | Variable or floating rate security. The stated rate represents the rate at December 31, 2018. Maturity date shown for callable securities reflects the earliest possible call date. For securities based on a published reference index and spread, the index and spread are indicated in the description above. For certain variable rate securities, the coupon rate is determined by the issuer/agent based on current market conditions. For certain asset- and mortgage-backed securities, the coupon rate may fluctuate based on changes of the underlying collateral or prepayments of principal. These securities do not indicate a reference index and spread in their description above. |
| (FEDEFF PRV)— | | Effective Federal Funds Rate |
| (LIBOR)— | | London Interbank Offered Rate |
| (SOFR)— | | Secured Overnight Financing Rate |
See accompanying notes to financial statements.
BHFTII-10
Brighthouse Funds Trust II
T. Rowe Price Small Cap Growth Portfolio
Schedule of Investments as of December 31, 2018
Fair Value Hierarchy
Accounting principles generally accepted in the United States of America (“GAAP”) define fair market value as the price that the Portfolio would receive to sell an asset or pay to transfer a liability in an orderly transaction between market participants at the measurement date. It establishes a fair value hierarchy that prioritizes inputs to valuation methods and requires disclosure of the fair value hierarchy, separately for each major category of assets and liabilities, that segregates fair value measurements into three levels. Levels 1, 2 and 3 of the fair value hierarchy are defined as follows:
Level 1 - unadjusted quoted prices in active markets for identical investments
Level 2 - other significant observable inputs (including, but not limited to, quoted prices for similar assets or liabilities in markets that are either active or inactive; inputs other than quoted prices that are observable such as interest rates, yield curves, volatilities, prepayment speeds, loss severities, credit risks, default rates, or other market corroborated inputs)
Level 3 - significant unobservable inputs based on the best information available in the circumstances, to the extent observable inputs are unavailable (including the Portfolio’s own assumptions used in determining the fair value of investments and derivative financial instruments)
The inputs or methodologies used for valuing investments are not necessarily an indication of the risk associated with investing in them. Changes to the inputs or methodologies used may result in transfers between levels. A reconciliation of Level 3 securities, if any, will be disclosed following the fair value hierarchy table. For more information about the Portfolio’s policy regarding the valuation of investments, please refer to the Notes to Financial Statements.
The following table summarizes the fair value hierarchy of the Portfolio’s investments as of December 31, 2018:
| | | | | | | | | | | | | | | | |
| Description | | Level 1 | | | Level 2 | | | Level 3 | | | Total | |
Total Common Stocks* | | $ | 1,196,612,648 | | | $ | — | | | $ | — | | | $ | 1,196,612,648 | |
Total Short-Term Investment* | | | 9,355,566 | | | | — | | | | — | | | | 9,355,566 | |
Total Securities Lending Reinvestments* | | | — | | | | 224,336,981 | | | | — | | | | 224,336,981 | |
Total Investments | | $ | 1,205,968,214 | | | $ | 224,336,981 | | | $ | — | | | $ | 1,430,305,195 | |
| | | | | | | | | | | | | | | | | |
Collateral for Securities Loaned (Liability) | | $ | — | | | $ | (224,267,346 | ) | | $ | — | | | $ | (224,267,346 | ) |
| | | | |
| * | | See Schedule of Investments for additional detailed categorizations. |
See accompanying notes to financial statements.
BHFTII-11
Brighthouse Funds Trust II
T. Rowe Price Small Cap Growth Portfolio
Statement of Assets and Liabilities
December 31, 2018
| | | | |
Assets | |
Investments at value (a) (b) | | $ | 1,420,949,629 | |
Affiliated investments at value (c) | | | 9,355,566 | |
Cash denominated in foreign currencies (d) | | | 3,407 | |
Receivable for: | |
Investments sold | | | 95,549 | |
Fund shares sold | | | 610,863 | |
Dividends | | | 603,989 | |
Dividends on affiliated investments | | | 23,217 | |
Prepaid expenses | | | 3,946 | |
| | | | |
Total Assets | | | 1,431,646,166 | |
Liabilities | |
Due to custodian | | | 95,549 | |
Collateral for securities loaned | | | 224,267,346 | |
Payables for: | |
Affiliated investments purchased | | | 22,773 | |
Investments purchased | | | 2,085,181 | |
Fund shares redeemed | | | 230,396 | |
Accrued Expenses: | |
Management fees | | | 473,382 | |
Distribution and service fees | | | 80,041 | |
Deferred trustees’ fees | | | 111,915 | |
Other expenses | | | 186,898 | |
| | | | |
Total Liabilities | | | 227,553,481 | |
| | | | |
Net Assets | | $ | 1,204,092,685 | |
| | | | |
Net Assets Consist of: | |
Paid in surplus | | $ | 834,965,244 | |
Distributable earnings (Accumulated losses) | | | 369,127,441 | |
| | | | |
Net Assets | | $ | 1,204,092,685 | |
| | | | |
Net Assets | |
Class A | | $ | 834,281,822 | |
Class B | | | 352,266,765 | |
Class E | | | 14,031,556 | |
Class G | | | 3,512,542 | |
Capital Shares Outstanding* | |
Class A | | | 39,300,277 | |
Class B | | | 17,871,499 | |
Class E | | | 694,092 | |
Class G | | | 184,933 | |
Net Asset Value, Offering Price and Redemption Price Per Share | |
Class A | | $ | 21.23 | |
Class B | | | 19.71 | |
Class E | | | 20.22 | |
Class G | | | 18.99 | |
| | | | |
| * | | The Portfolio is authorized to issue an unlimited number of shares. |
| (a) | | Identified cost of investments, excluding affiliated investments, was $1,241,284,804. |
| (b) | | Includes securities loaned at value of $220,744,967. |
| (c) | | Identified cost of affiliated investments was $9,355,566. |
| (d) | | Identified cost of cash denominated in foreign currencies was $3,484. |
Statement of Operations
Year Ended December 31, 2018
| | | | |
Investment Income | |
Dividends (a) | | $ | 8,179,545 | |
Dividends from affiliated investments | | | 204,748 | |
Securities lending income | | | 575,100 | |
| | | | |
Total investment income | | | 8,959,393 | |
Expenses | |
Management fees | | | 6,727,995 | |
Administration fees | | | 53,660 | |
Custodian and accounting fees | | | 103,985 | |
Distribution and service fees—Class B | | | 1,054,051 | |
Distribution and service fees—Class E | | | 26,553 | |
Distribution and service fees—Class G | | | 12,099 | |
Audit and tax services | | | 44,663 | |
Legal | | | 45,316 | |
Trustees’ fees and expenses | | | 33,733 | |
Shareholder reporting | | | 124,744 | |
Insurance | | | 9,216 | |
Miscellaneous | | | 24,807 | |
| | | | |
Total expenses | | | 8,260,822 | |
Less management fee waiver | | | (320,470 | ) |
Less broker commission recapture | | | (1,672 | ) |
| | | | |
Net expenses | | | 7,938,680 | |
| | | | |
Net Investment Income | | | 1,020,713 | |
| | | | |
Net Realized and Unrealized Gain (Loss) | |
| Net realized gain on: | |
Investments | | | 190,773,840 | |
Foreign currency transactions | | | 73 | |
| | | | |
Net realized gain | | | 190,773,913 | |
| | | | |
| Net change in unrealized depreciation on: | |
Investments | | | (264,044,607 | ) |
Foreign currency transactions | | | (155 | ) |
| | | | |
Net change in unrealized depreciation | | | (264,044,762 | ) |
| | | | |
Net realized and unrealized loss | | | (73,270,849 | ) |
| | | | |
Net Decrease in Net Assets From Operations | | $ | (72,250,136 | ) |
| | | | |
| | | | |
| (a) | | Net of foreign withholding taxes of $8,660. |
See accompanying notes to financial statements.
BHFTII-12
Brighthouse Funds Trust II
T. Rowe Price Small Cap Growth Portfolio
Statements of Changes in Net Assets
| | | | | | | | |
| | | Year Ended
December 31,
2018 | | | Year Ended
December 31,
2017 | |
Increase (Decrease) in Net Assets: | |
From Operations | |
Net investment income | | $ | 1,020,713 | | | $ | 1,768,261 | |
Net realized gain | | | 190,773,913 | | | | 120,975,147 | |
Net change in unrealized appreciation (depreciation) | | | (264,044,762 | ) | | | 160,653,464 | |
| | | | | | | | |
Increase (decrease) in net assets from operations | | | (72,250,136 | ) | | | 283,396,872 | |
| | | | | | | | |
From Distributions to Shareholders (a) | |
Class A | | | (83,516,803 | ) | | | (60,151,464 | ) |
Class B | | | (36,922,286 | ) | | | (25,824,286 | ) |
Class E | | | (1,510,258 | ) | | | (1,075,511 | ) |
Class G | | | (364,458 | ) | | | (212,766 | ) |
| | | | | | | | |
Total distributions | | | (122,313,805 | ) | | | (87,264,027 | ) |
| | | | | | | | |
Decrease in net assets from capital share transactions | | | (60,639,608 | ) | | | (21,037,249 | ) |
| | | | | | | | |
Total increase (decrease) in net assets | | | (255,203,549 | ) | | | 175,095,596 | |
|
Net Assets | |
Beginning of period | | | 1,459,296,234 | | | | 1,284,200,638 | |
| | | | | | | | |
End of period | | $ | 1,204,092,685 | | | $ | 1,459,296,234 | (b) |
| | | | | | | | |
Other Information:
Capital Shares
Transactions in capital shares were as follows:
| | | | | | | | | | | | | | | | |
| | | Year Ended
December 31, 2018 | | | Year Ended
December 31, 2017 | |
| | | Shares | | | Value | | | Shares | | | Value | |
Class A | |
Sales | | | 1,520,096 | | | $ | 38,258,742 | | | | 3,152,629 | | | $ | 73,254,051 | |
Reinvestments | | | 3,352,742 | | | | 83,516,803 | | | | 2,702,222 | | | | 60,151,464 | |
Redemptions | | | (6,558,135 | ) | | | (167,183,822 | ) | | | (5,999,204 | ) | | | (138,365,134 | ) |
| | | | | | | | | | | | | | | | |
Net decrease | | | (1,685,297 | ) | | $ | (45,408,277 | ) | | | (144,353 | ) | | $ | (4,959,619 | ) |
| | | | | | | | | | | | | | | | |
Class B | |
Sales | | | 1,005,380 | | | $ | 22,853,336 | | | | 1,199,386 | | | $ | 25,662,257 | |
Reinvestments | | | 1,594,227 | | | | 36,922,286 | | | | 1,238,575 | | | | 25,824,286 | |
Redemptions | | | (3,168,692 | ) | | | (74,061,481 | ) | | | (3,128,573 | ) | | | (67,558,402 | ) |
| | | | | | | | | | | | | | | | |
Net decrease | | | (569,085 | ) | | $ | (14,285,859 | ) | | | (690,612 | ) | | $ | (16,071,859 | ) |
| | | | | | | | | | | | | | | | |
Class E | |
Sales | | | 71,866 | | | $ | 1,741,672 | | | | 77,072 | | | $ | 1,676,736 | |
Reinvestments | | | 63,617 | | | | 1,510,258 | | | | 50,493 | | | | 1,075,511 | |
Redemptions | | | (197,031 | ) | | | (4,658,868 | ) | | | (143,297 | ) | | | (3,150,668 | ) |
| | | | | | | | | | | | | | | | |
Net decrease | | | (61,548 | ) | | $ | (1,406,938 | ) | | | (15,732 | ) | | $ | (398,421 | ) |
| | | | | | | | | | | | | | | | |
Class G | |
Sales | | | 36,386 | | | $ | 837,282 | | | | 25,130 | | | $ | 520,617 | |
Reinvestments | | | 16,321 | | | | 364,458 | | | | 10,549 | | | | 212,766 | |
Redemptions | | | (33,293 | ) | | | (740,274 | ) | | | (16,462 | ) | | | (340,733 | ) |
| | | | | | | | | | | | | | | | |
Net increase | | | 19,414 | | | $ | 461,466 | | | | 19,217 | | | $ | 392,650 | |
| | | | | | | | | | | | | | | | |
Decrease derived from capital shares transactions | | | | | | $ | (60,639,608 | ) | | | | | | $ | (21,037,249 | ) |
| | | | | | | | | | | | | | | | |
| | | | |
| (a) | | Distributions from net investment income and realized gains are no longer required to be separately disclosed. The presentation for the year ended December 31, 2018 has been adjusted for this change (See Note 9). At December 31, 2017 the distributions were as follows. |
| | | | | | | | |
| | | Distributions from net
investment income: | | | Distributions from
realized capital gains: | |
Class A | | $ | (3,089,972 | ) | | $ | (57,061,492 | ) |
Class B | | | (294,924 | ) | | | (25,529,362 | ) |
Class E | | | (30,190 | ) | | | (1,045,321 | ) |
Class G | | | (613 | ) | | | (212,153 | ) |
| | | | |
| (b) | | As part of the update in (a), it is also no longer required to disclose the Undistributed net investment income (Accumulated losses) which was $1,173,859 as of December 31, 2017. |
See accompanying notes to financial statements.
BHFTII-13
Brighthouse Funds Trust II
T. Rowe Price Small Cap Growth Portfolio
Financial Highlights
| | | | | | | | | | | | | | | | | | | | |
| Selected per share data | |
| | | Class A | |
| | | Year Ended December 31, | |
| | | 2018 | | | 2017 | | | 2016 | | | 2015 | | | 2014 | |
Net Asset Value, Beginning of Period | | $ | 24.69 | | | $ | 21.41 | | | $ | 22.01 | | | $ | 23.40 | | | $ | 23.77 | |
| | | | | | | | | | | | | | | | | | | | |
Income (Loss) from Investment Operations | |
Net investment income (a) | | | 0.04 | | | | 0.05 | | | | 0.07 | (b) | | | 0.07 | | | | 0.06 | |
Net realized and unrealized gain (loss) | | | (1.34 | ) | | | 4.70 | | | | 2.20 | | | | 0.71 | | | | 1.35 | |
| | | | | | | | | | | | | | | | | | | | |
Total income (loss) from investment operations | | | (1.30 | ) | | | 4.75 | | | | 2.27 | | | | 0.78 | | | | 1.41 | |
| | | | | | | | | | | | | | | | | | | | |
Less Distributions | |
Distributions from net investment income | | | (0.03 | ) | | | (0.08 | ) | | | (0.06 | ) | | | (0.03 | ) | | | (0.00 | )(c) |
Distributions from net realized capital gains | | | (2.13 | ) | | | (1.39 | ) | | | (2.81 | ) | | | (2.14 | ) | | | (1.78 | ) |
| | | | | | | | | | | | | | | | | | | | |
Total distributions | | | (2.16 | ) | | | (1.47 | ) | | | (2.87 | ) | | | (2.17 | ) | | | (1.78 | ) |
| | | | | | | | | | | | | | | | | | | | |
Net Asset Value, End of Period | | $ | 21.23 | | | $ | 24.69 | | | $ | 21.41 | | | $ | 22.01 | | | $ | 23.40 | |
| | | | | | | | | | | | | | | | | | | | |
Total Return (%) (d) | | | (6.55 | ) | | | 22.88 | | | | 11.74 | | | | 2.71 | | | | 6.91 | |
|
Ratios/Supplemental Data | |
Gross ratio of expenses to average net assets (%) | | | 0.50 | | | | 0.50 | | | | 0.50 | | | | 0.50 | | | | 0.51 | |
Net ratio of expenses to average net assets (%) (e) | | | 0.48 | | | | 0.48 | | | | 0.48 | | | | 0.48 | | | | 0.48 | |
Ratio of net investment income to average net assets (%) | | | 0.15 | | | | 0.20 | | | | 0.36 | (b) | | | 0.28 | | | | 0.25 | |
Portfolio turnover rate (%) | | | 21 | | | | 22 | | | | 22 | | | | 27 | | | | 25 | |
Net assets, end of period (in millions) | | $ | 834.3 | | | $ | 1,011.9 | | | $ | 880.8 | | | $ | 863.6 | | | $ | 938.5 | |
| |
| | | Class B | |
| | | Year Ended December 31, | |
| | | 2018 | | | 2017 | | | 2016 | | | 2015 | | | 2014 | |
Net Asset Value, Beginning of Period | | $ | 23.09 | | | $ | 20.11 | | | $ | 20.84 | | | $ | 22.28 | | | $ | 22.77 | |
| | | | | | | | | | | | | | | | | | | | |
Income (Loss) from Investment Operations | |
Net investment income (loss) (a) | | | (0.02 | ) | | | (0.01 | ) | | | 0.02 | (b) | | | 0.01 | | | | (0.00 | )(f) |
Net realized and unrealized gain (loss) | | | (1.23 | ) | | | 4.40 | | | | 2.07 | | | | 0.69 | | | | 1.29 | |
| | | | | | | | | | | | | | | | | | | | |
Total income (loss) from investment operations | | | (1.25 | ) | | | 4.39 | | | | 2.09 | | | | 0.70 | | | | 1.29 | |
| | | | | | | | | | | | | | | | | | | | |
Less Distributions | |
Distributions from net investment income | | | 0.00 | | | | (0.02 | ) | | | (0.01 | ) | | | 0.00 | | | | 0.00 | |
Distributions from net realized capital gains | | | (2.13 | ) | | | (1.39 | ) | | | (2.81 | ) | | | (2.14 | ) | | | (1.78 | ) |
| | | | | | | | | | | | | | | | | | | | |
Total distributions | | | (2.13 | ) | | | (1.41 | ) | | | (2.82 | ) | | | (2.14 | ) | | | (1.78 | ) |
| | | | | | | | | | | | | | | | | | | | |
Net Asset Value, End of Period | | $ | 19.71 | | | $ | 23.09 | | | $ | 20.11 | | | $ | 20.84 | | | $ | 22.28 | |
| | | | | | | | | | | | | | | | | | | | |
Total Return (%) (d) | | | (6.78 | ) | | | 22.53 | | | | 11.48 | | | | 2.46 | | | | 6.65 | |
|
Ratios/Supplemental Data | |
Gross ratio of expenses to average net assets (%) | | | 0.75 | | | | 0.75 | | | | 0.75 | | | | 0.75 | | | | 0.76 | |
Net ratio of expenses to average net assets (%) (e) | | | 0.73 | | | | 0.73 | | | | 0.73 | | | | 0.73 | | | | 0.73 | |
Ratio of net investment income (loss) to average net assets (%) | | | (0.10 | ) | | | (0.05 | ) | | | 0.11 | (b) | | | 0.03 | | | | (0.01 | ) |
Portfolio turnover rate (%) | | | 21 | | | | 22 | | | | 22 | | | | 27 | | | | 25 | |
Net assets, end of period (in millions) | | $ | 352.3 | | | $ | 425.8 | | | $ | 384.7 | | | $ | 373.4 | | | $ | 369.6 | |
Please see following page for Financial Highlights footnote legend.
See accompanying notes to financial statements.
BHFTII-14
Brighthouse Funds Trust II
T. Rowe Price Small Cap Growth Portfolio
Financial Highlights
| | | | | | | | | | | | | | | | | | | | |
| Selected per share data | |
| | | Class E | |
| | | Year Ended December 31, | |
| | | 2018 | | | 2017 | | | 2016 | | | 2015 | | | 2014 | |
Net Asset Value, Beginning of Period | | $ | 23.61 | | | $ | 20.54 | | | $ | 21.23 | | | $ | 22.63 | | | $ | 23.09 | |
| | | | | | | | | | | | | | | | | | | | |
Income (Loss) from Investment Operations | |
Net investment income (loss) (a) | | | (0.00 | ) (f) | | | 0.01 | | | | 0.04 | (b) | | | 0.03 | | | | 0.02 | |
Net realized and unrealized gain (loss) | | | (1.26 | ) | | | 4.49 | | | | 2.11 | | | | 0.71 | | | | 1.30 | |
| | | | | | | | | | | | | | | | | | | | |
Total income (loss) from investment operations | | | (1.26 | ) | | | 4.50 | | | | 2.15 | | | | 0.74 | | | | 1.32 | |
| | | | | | | | | | | | | | | | | | | | |
Less Distributions | |
Distributions from net investment income | | | 0.00 | | | | (0.04 | ) | | | (0.03 | ) | | | 0.00 | | | | 0.00 | |
Distributions from net realized capital gains | | | (2.13 | ) | | | (1.39 | ) | | | (2.81 | ) | | | (2.14 | ) | | | (1.78 | ) |
| | | | | | | | | | | | | | | | | | | | |
Total distributions | | | (2.13 | ) | | | (1.43 | ) | | | (2.84 | ) | | | (2.14 | ) | | | (1.78 | ) |
| | | | | | | | | | | | | | | | | | | | |
Net Asset Value, End of Period | | $ | 20.22 | | | $ | 23.61 | | | $ | 20.54 | | | $ | 21.23 | | | $ | 22.63 | |
| | | | | | | | | | | | | | | | | | | | |
Total Return (%) (d) | | | (6.67 | ) | | | 22.70 | | | | 11.55 | | | | 2.61 | | | | 6.69 | |
|
Ratios/Supplemental Data | |
Gross ratio of expenses to average net assets (%) | | | 0.65 | | | | 0.65 | | | | 0.65 | | | | 0.65 | | | | 0.66 | |
Net ratio of expenses to average net assets (%) (e) | | | 0.63 | | | | 0.63 | | | | 0.63 | | | | 0.63 | | | | 0.63 | |
Ratio of net investment income to average net assets (%) | | | (0.00 | ) (g) | | | 0.05 | | | | 0.21 | (b) | | | 0.12 | | | | 0.09 | |
Portfolio turnover rate (%) | | | 21 | | | | 22 | | | | 22 | | | | 27 | | | | 25 | |
Net assets, end of period (in millions) | | $ | 14.0 | | | $ | 17.8 | | | $ | 15.8 | | | $ | 16.9 | | | $ | 17.1 | |
| |
| | | Class G | |
| | | Year Ended December 31, | |
| | | 2018 | | | 2017 | | | 2016 | | | 2015 | | | 2014(h) | |
Net Asset Value, Beginning of Period | | $ | 22.33 | | | $ | 19.49 | | | $ | 20.34 | | | $ | 21.78 | | | $ | 21.49 | |
| | | | | | | | | | | | | | | | | | | | |
Income (Loss) from Investment Operations | |
Net investment income (loss) (a) | | | (0.03 | ) | | | (0.02 | ) | | | 0.02 | (b) | | | (0.01 | ) | | | 0.01 | |
Net realized and unrealized gain (loss) | | | (1.18 | ) | | | 4.25 | | | | 1.94 | | | | 0.71 | | | | 0.28 | |
| | | | | | | | | | | | | | | | | | | | |
Total income (loss) from investment operations | | | (1.21 | ) | | | 4.23 | | | | 1.96 | | | | 0.70 | | | | 0.29 | |
| | | | | | | | | | | | | | | | | | | | |
Less Distributions | |
Distributions from net investment income | | | 0.00 | | | | (0.00 | )(c) | | | 0.00 | | | | 0.00 | | | | 0.00 | |
Distributions from net realized capital gains | | | (2.13 | ) | | | (1.39 | ) | | | (2.81 | ) | | | (2.14 | ) | | | 0.00 | |
| | | | | | | | | | | | | | | | | | | | |
Total distributions | | | (2.13 | ) | | | (1.39 | ) | | | (2.81 | ) | | | (2.14 | ) | | | 0.00 | |
| | | | | | | | | | | | | | | | | | | | |
Net Asset Value, End of Period | | $ | 18.99 | | | $ | 22.33 | | | $ | 19.49 | | | $ | 20.34 | | | $ | 21.78 | |
| | | | | | | | | | | | | | | | | | | | |
Total Return (%) (d) | | | (6.84 | ) | | | 22.46 | | | | 11.14 | | | | 2.51 | | | | 1.35 | (i) |
|
Ratios/Supplemental Data | |
Gross ratio of expenses to average net assets (%) | | | 0.80 | | | | 0.80 | | | | 0.80 | | | | 0.80 | | | | 0.83 | (j) |
Net ratio of expenses to average net assets (%) (e) | | | 0.78 | | | | 0.78 | | | | 0.78 | | | | 0.78 | | | | 0.81 | (j) |
Ratio of net investment income (loss) to average net assets (%) | | | (0.15 | ) | | | (0.10 | ) | | | 0.08 | (b) | | | (0.06 | ) | | | 0.40 | (j) |
Portfolio turnover rate (%) | | | 21 | | | | 22 | | | | 22 | | | | 27 | | | | 25 | |
Net assets, end of period (in millions) | | $ | 3.5 | | | $ | 3.7 | | | $ | 2.9 | | | $ | 1.2 | | | $ | 0.0 | (k) |
| | | | |
| (a) | | Per share amounts based on average shares outstanding during the period. |
| (b) | | Net investment income per share and the ratio of net investment income to average net assets include anon-recurring refund for overbilling of prior years’ custodianout-of-pocket fees which amounted to less than $0.01 per share and 0.02% of average net assets, respectively. |
| (c) | | Distributions from net investment income were less than $0.01. |
| (d) | | Total return does not reflect any insurance, sales, separate account or administrative charges of variable annuity or life insurance contracts or any additional expenses that contract owners may bear under their variable contracts. If these charges were included, the returns would be lower. |
| (e) | | Includes the effects of management fee waivers (see Note 5 of the Notes to Financial Statements). |
| (f) | | Net investment income (loss) was less than $0.01. |
| (g) | | Ratio of net investment loss to average net assets was less than 0.01%. |
| (h) | | Commencement of operations was November 12, 2014. |
| (i) | | Periods less than one year are not computed on an annualized basis. |
| (j) | | Computed on an annualized basis. |
| (k) | | Net assets, end of period rounds to less than $0.1 million. |
See accompanying notes to financial statements.
BHFTII-15
Brighthouse Funds Trust II
T. Rowe Price Small Cap Growth Portfolio
Notes to Financial Statements—December 31, 2018
1. Organization
Brighthouse Funds Trust II (the “Trust”) is organized as a Delaware statutory trust and registered under the Investment Company Act of 1940, as amended (the “1940 Act”), as anopen-end management investment company. The Trust, which is managed by Brighthouse Investment Advisers, LLC (“Brighthouse Investment Advisers” or the “Adviser”), currently offers twenty-nine series, each of which operates as a distinct investment vehicle of the Trust. The series included in this report is T. Rowe Price Small Cap Growth Portfolio (the “Portfolio”), which is diversified. Shares in the Portfolio are not offered directly to the general public and are currently available only to separate accounts established by life insurance companies affiliated with the Adviser and Metropolitan Life Insurance Company (the “Insurance Companies”).
The Portfolio has registered and offers four classes of shares: Class A, B, E and G shares. Shares of each Class of the Portfolio represent an equal pro rata interest in the Portfolio and generally give the shareholder the same voting, dividend, liquidation, and other rights. Investment income, realized and unrealized capital gains and losses, the common expenses of the Portfolio, and certain Portfolio-level expense reductions, if any, are allocated on a pro rata basis to each Class based on the relative net assets of each Class to the net assets of the Portfolio. Each Class of shares differs in its respective distribution plan and such distribution expenses are allocated to the corresponding Class of shares.
2. Significant Accounting Policies
The preparation of financial statements in conformity with accounting principles generally accepted in the United States of America (“GAAP”) requires management to make estimates and assumptions that affect the reported amounts of assets and liabilities and disclosure of contingent assets and liabilities as of the date of the financial statements and the reported amounts of income and expenses during the reporting period. Actual results could differ from those estimates. In the preparation of these financial statements, management has evaluated events and transactions subsequent to December 31, 2018 through the date the financial statements were issued.
The Portfolio is an investment company and follows the accounting and reporting guidance of the Financial Accounting Standards Board (“FASB”) Accounting Standards Codification Topic946- Financial Services- Investment Companies. The following is a summary of significant accounting policies consistently followed by the Portfolio in the preparation of its financial statements.
Investment Valuation and Fair Value Measurements - The Portfolio values its portfolio investments for purposes of calculating its net asset value (“NAV”) using procedures approved by the Board of Trustees of the Trust (the “Board” or “Trustees”). Those procedures allow for a variety of methodologies to be used to value the Portfolio’s investments. The specific methodologies used for a particular investment may vary based on the market data available for a specific investment at the time the Portfolio calculates its NAV or based on other considerations. The procedures also permit a level of judgment to be used in the valuation process. The Portfolio follows the accounting and reporting guidance of FASB Accounting Standards Codification Topic820- Fair Value Measurement.
Domestic and foreign equity securities, such as common stock, exchange-traded funds, rights, warrants, and preferred stock, that are traded on a securities exchange on a valuation date are generally valued at their last quoted sale price or official closing price on the primary exchange for such security, or, if no sales occurred on that day, at the last reported bid price. Equity securities tradedover-the-counter (“OTC”) are generally valued at the last reported bid price. In the event of a major exchange closing during the trading day, the Adviser may use other market information obtained from quotation reporting systems, established market makers, or pricing services in valuing the securities. Valuation adjustments may be applied to certain foreign equity securities that are traded solely on foreign exchanges that close before the time as of which the Portfolio determines its NAV to account for the market movement between the close of the foreign exchanges and the time as of which the Portfolio determines its NAV. The Portfolio may use a systematic fair valuation model provided by a pricing service to value securities principally traded in these foreign markets in order to adjust for possible market movements or other changes that may occur between the close of the foreign exchanges and the time as of which the Portfolio determines its NAV. Foreign equity securities valued using these valuation adjustments are generally categorized as Level 2 within the fair value hierarchy. Equity securities that are actively traded, and have no valuation adjustments applied, are categorized as Level 1 within the fair value hierarchy. Other equity securities traded on inactive markets, or valued in reference to similar instruments traded on active markets, are generally categorized as Level 2 within the fair value hierarchy.
Investments in registeredopen-end management investment companies are valued at reported NAV per share on the valuation date and are categorized as Level 1 within the fair value hierarchy.
Debt securities, including corporate, convertible and municipal bonds and notes; obligations of the U.S. Treasury and U.S. government agencies; foreign sovereign issues; andnon-U.S. bonds, are generally valued on the basis of evaluated or composite bid quotations obtained from independent pricing services and/or brokers and dealers selected by the Adviser (each a “pricing service”), pursuant to the authorization of and subject to general oversight by the Board. Such pricing services may use matrix pricing, which considers observable inputs including, among other things, issuer details, maturity dates, interest rates, yield curves, rates of prepayment, credit risks/spreads, default rates, reported trades, broker-dealer quotes and quoted prices for similar assets. Short-term obligations with a
BHFTII-16
Brighthouse Funds Trust II
T. Rowe Price Small Cap Growth Portfolio
Notes to Financial Statements—December 31, 2018—(Continued)
remaining maturity of sixty days or less may be valued at amortized cost in the absence of market quotes, so long as the amortized cost value of such short-term debt instrument is approximately the same as the fair value of the instrument as determined without the use of amortized cost valuation. Floating rate loans are generally valued on the basis of an evaluated or composite average of aggregate bid and ask quotations supplied by brokers or dealers, as obtained from the pricing service. Securities that use similar valuation techniques and inputs as described above are generally categorized as Level 2 within the fair value hierarchy.
Options, whether on securities, indices, futures contracts, or otherwise, traded on exchanges are valued at the last sale price available as of the close of business on a valuation day or, if there is no such price available, at the last reported bid price. These types of options are categorized as Level 1 within the fair value hierarchy. Futures contracts that are traded on commodity exchanges are valued at their settlement prices established by the exchanges on which they are traded as of the close of such exchanges and are categorized as Level 1 within the fair value hierarchy.
If no current market value quotation or other observable inputs are readily available or market value quotations are deemed to be unreliable for an investment, the fair value of the investment will be determined in accordance with procedures approved by, and under the general supervision of, the Board. In such a circumstance, the Board will be assisted in its responsibility to determine the fair value of an investment by the Valuation Committee (“Committee”) of Brighthouse Investment Advisers. The Committee provides general pricing oversight and fair value pricing determinations related to portfolio securities and meets on a regular basis to review reports relating to the valuation of the securities in the Portfolio. The Board has delegated to State Street Bank and Trust Company, the Trust’s custodian (“Custodian”), the responsibility for calculating the NAVs of the Trust’s Portfolios. The Committee is responsible for overseeing the calculation of the NAVs of the Portfolios by the custodian. The Committee also periodically reviews pricing services, including the pricing services providing fair value pricing for the Portfolio’s foreign securities, and is responsible for overseeing the correction of pricing errors and addressing other pricing issues that arise in the ordinary course of business, such as making real-time fair value determinations, as necessary.
No single standard for determining the fair value of an investment can be set forth because fair value depends upon the facts and circumstances with respect to each investment. Information relating to any relevant factors may be obtained by the Committee from any appropriate source, including the subadviser of the Portfolio, the custodian, a pricing service, market maker and/or broker for such security or the issuer. Appropriate methodologies for determining fair value under particular circumstances may include: matrix pricing, a discounted cash flow analysis, comparisons of securities with comparable characteristics, value based on multiples of earnings, discount from market price of similar marketable securities, or a combination of these and other methods.
Investment Transactions and Related Investment Income - Portfolio security transactions are recorded on the trade date. Dividend income is recorded on theex-dividend date or, for certain foreign securities, when notified. Interest income, which includes amortization of premium and accretion of discount on debt securities, is recorded on the accrual basis. Realized gains and losses on investments are determined on the identified cost basis, which is the same basis used for federal income tax purposes. Foreign income and foreign capital gains on some foreign securities may be subject to foreign taxes, which are accrued as applicable. These foreign taxes have been provided for in accordance with the Portfolio’s understanding of the applicable countries’ tax rules and rates.
Foreign Currency Translation - The books and records of the Portfolio are maintained in U.S. dollars. The values of securities, currencies, and other assets and liabilities denominated in currencies other than the U.S. dollar are translated into U.S. dollars based upon foreign exchange rates prevailing at the end of the period. Purchases and sales of investment securities, income, and expenses are translated on the respective dates of such transactions. Because the values of investment securities are translated at the foreign exchange rates prevailing at the end of the period, that portion of the results of operations arising from changes in exchange rates and that portion of the results of operations reflecting fluctuations arising from changes in market prices of the investment securities are not separated. Such fluctuations are included in the net realized and unrealized gain or loss on investments.
Net realized foreign exchange gains or losses arise from activity in forward foreign currency exchange contracts, sales of foreign currency, currency gains or losses realized between the trade and settlement dates on securities transactions, and the difference between the amounts of dividends, interest, and foreign withholding taxes recorded by the Portfolio and the U.S. dollar-equivalent of the amounts actually received or paid by the Portfolio. Net unrealized foreign exchange gains and losses arise from changes in the value of assets and liabilities, other than investment securities, resulting from changes in foreign exchange rates.
Dividends and Distributions to Shareholders - The Portfolio records dividends and distributions on theex-dividend date. Net realized gains from securities transactions (if any) are generally distributed annually to shareholders. The timing and characterization of certain income and capital gains distributions are determined in accordance with federal tax regulations that may differ from GAAP. Permanent book and tax basis differences relating to shareholder distributions will result in reclassification between distributable earnings (accumulated losses) andpaid-in surplus. These adjustments have no impact on net assets or the results of operations.
Income Taxes - It is the Portfolio’s policy to comply with the requirements of the Internal Revenue Code of 1986, as amended, and regulations thereunder, applicable to regulated investment companies, and to distribute, with respect to each taxable year, all of its taxable income to shareholders. Therefore, no federal income tax provision is required. The Portfolio files U.S. federal tax returns. No
BHFTII-17
Brighthouse Funds Trust II
T. Rowe Price Small Cap Growth Portfolio
Notes to Financial Statements—December 31, 2018—(Continued)
income tax returns are currently under examination. The Portfolio’s federal tax returns for the prior three fiscal years remain subject to examination by the Internal Revenue Service. As of December 31, 2018, the Portfolio had no uncertain tax positions that would require financial statement recognition, or derecognition or disclosure.
Due to Custodian - Pursuant to the custodian agreement, the Custodian may, in its discretion, advance funds to the Portfolio to make properly authorized payments. When such payments result in an overdraft, the Portfolio is obligated to repay the Custodian at the current rate of interest charged by the Custodian for secured loans (currently, the federal funds rate plus 2%). This obligation is payable on demand to the Custodian. The Custodian has a lien on the Portfolio’s assets to the extent of any overdraft. At December 31, 2018, the Portfolio had a payment of $95,549 due to the Custodian pursuant to the foregoing arrangement. Based on the short-term nature of these payments and the variable interest rate, the carrying value of the overdraft advances approximated its fair value at December 31, 2018. If measured at fair value, overdraft advances would have been considered as Level 2 in the fair value hierarchy at December 31, 2018. The Portfolio’s average overdraft advances during the year ended December 31, 2018 were not significant.
Directed Brokerage Agreement -The Trust has entered into a directed brokerage arrangement with Capital Institutional Services, Inc. (“CAPIS”). Under this arrangement, the Portfolio directs certain trades to CAPIS in return for a recapture credit. CAPIS issues a cash rebate to the Portfolio. Amounts paid to the Portfolio are shown separately as broker commission recapture on the Statement of Operations of the Portfolio. Additionally, these amounts have been excluded from the calculation of the net ratio of expenses to average net assets presented in the Financial Highlights for each share class.
Repurchase Agreements -The Portfolio may enter into repurchase agreements, under the terms of a Master Repurchase Agreement (“MRA”), with selected commercial banks and broker-dealers, under which the Portfolio acquires securities as collateral and agrees to resell the securities at an agreed-upon time and at an agreed-upon price. The Portfolio, through the Custodian or a subcustodian, under atri-party repurchase agreement, receives delivery of the underlying securities collateralizing any repurchase agreements. It is the Portfolio’s policy that the market value of the collateral be equal to at least 100% of the repurchase price in the case of a repurchase agreement ofone-day duration and equal to at least 102% of the repurchase price in the case of all other repurchase agreements. In the event of default or failure by a party to perform an obligation in connection with any repurchase transaction, the MRA gives thenon-defaulting party the right toset-off claims and to apply property held by it in connection with any repurchase transaction against obligations owed to it.
At December 31, 2018, the Portfolio invested cash collateral for loans of portfolio securities in repurchase agreements with a gross value of $80,340,614. The combined value of all repurchase agreements is included as part of investments at value on the Statement of Assets and Liabilities. The value of the related collateral exceeded the value of the repurchase agreements at December 31, 2018.
Securities Lending - The Portfolio may lend its portfolio securities to certain qualified brokers who borrow securities in order to complete certain securities transactions. By lending its portfolio securities, the Portfolio attempts to increase its net investment income through the receipt of income on collateral held from securities on loan. Any gain or loss in the market price of the loaned securities that might occur and any interest earned or dividends declared during the term of the loan would accrue to the account of the Portfolio.
The Trust has entered into aNon-Custodial Securities Lending Agreement with JPMorgan Chase Bank, N.A. (the “Lending Agent”). Under the agreement, the Lending Agent is authorized to loan portfolio securities on the Portfolio’s behalf. In exchange, the Portfolio receives either cash or U.S. government securities as collateral against the loaned securities. The Portfolio receives collateral equal to at least 102% of the market value for loans secured by government securities or cash in the same currency as the loaned shares and 105% for all other loaned securities at each loan’s inception. Collateral representing at least 100% of the market value of the loaned securities is maintained for the duration of the loan. Any cash collateral received by the Portfolio is generally invested by the Lending Agent in short-term investments, which may include certificates of deposit, commercial paper, repurchase agreements, time deposits, master demand notes and money market funds. The market value of investments made with cash collateral received are disclosed in the Schedule of Investments and the valuation techniques are described in Note 2. If the market value of the collateral at the close of trading on a business day is less than 100% of the market value of the loaned securities at the close of trading on that day, the borrower is required to deliver, by the close of business on the following business day, an additional amount of collateral, so that the total amount of posted collateral is equal to at least 100% of the market value of all the loaned securities as of such preceding day. A portion of the income earned on the collateral is rebated to the borrower of the securities and the remainder is split between the Lending Agent and the Portfolio. On loans collateralized by U.S. government securities, a fee is received from the borrower and is allocated between the Portfolio and the Lending Agent.
Income received by the Portfolio in securities lending transactions during the year ended December 31, 2018 is reflected as securities lending income on the Statement of Operations. The values of any securities loaned by the Portfolio and the related collateral at December 31, 2018 are disclosed in the footnotes to the Schedule of Investments. The value of the related collateral received by the Portfolio exceeded the value of the securities out on loan at December 31, 2018.
BHFTII-18
Brighthouse Funds Trust II
T. Rowe Price Small Cap Growth Portfolio
Notes to Financial Statements—December 31, 2018—(Continued)
The risks associated with lending portfolio securities include, but are not limited to, possible delays in receiving additional collateral or in the recovery of the loaned securities, possible loss of rights in the collateral should the borrower fail financially, as well as risk of loss in the value of the collateral or the value of the investments made with the collateral. The Lending Agent shall indemnify the Portfolio in the case of default of any securities borrower, subject to the terms of theNon-Custodial Securities Lending Agreement.
All securities on loan are classified as Common Stocks in the Portfolio’s Schedule of Investments as of December 31, 2018, with a contractual maturity of overnight and continuous.
3. Certain Risks
In the normal course of business, the Portfolio invests in securities and enters into transactions where risks exist. Those risks include:
Market Risk:The value of securities held by the Portfolio may decline in response to certain events, including those directly involving the issuers whose securities are owned by the Portfolio; conditions affecting the general economy; overall market changes; local, regional or global political, social or economic instability; and currency, interest rate, and price fluctuations.
Credit and Counterparty Risk: The Portfolio may be exposed to counterparty risk, or the risk that an entity with which the Portfolio has unsettled or open transactions may default. The potential loss could exceed the value of the financial assets and liabilities recorded in the financial statements. Financial assets that potentially expose the Portfolio to credit and counterparty risk consist principally of cash due from counterparties and investments. The Portfolio manages counterparty risk by entering into agreements only with counterparties that it believes have the financial resources to honor their obligations and by monitoring the financial stability of those counterparties. The Adviser attempts to mitigate counterparty risk by (i) periodically assessing the creditworthiness of its trading partners, (ii) monitoring and/or limiting the amount of its net exposure to each individual counterparty based on its assessment, and (iii) requiring collateral from the counterparty for certain transactions. In order to preserve certain safeguards fornon-standard settlement trades, the Portfolio restricts its exposure to credit and counterparty losses by entering into master netting agreements (“Master Agreements”) with counterparties (approved brokers) with whom it undertakes a significant volume of transactions. Master Agreements govern the terms of certain transactions, and reduce the counterparty risk associated with relevant transactions by specifying credit protection mechanisms and providing standardization that improves legal certainty. Master Agreements can also help limit counterparty risk by specifying collateral posting arrangements atpre-arranged exposure levels.
Repurchase and reverse repurchase agreements are primarily executed under Global Master Repurchase Agreements (“GMRAs”) or Master Repurchase Agreements (“MRAs”), which provide the rights toset-off. Each repurchase and reverse repurchase agreement is initially collateralized at the transaction level. In the event of default, the total market value exposure will be offset against collateral exchanged to date, which would result in a net receivable/(payable) that would be due from/to the counterparty.
Additional risks associated with each type of investment are described above within the respective security type notes. The Portfolio’s prospectus includes a discussion of the principal risks of investing in the Portfolio.
4. Investment Transactions
Aggregate cost of purchases and proceeds of sales of investment securities, excluding short-term securities, for the year ended December 31, 2018 were as follows:
| | | | | | | | | | | | |
Purchases | | | Sales | |
U.S. Government | | Non-U.S. Government | | | U.S. Government | | | Non-U.S. Government | |
| $0 | | $ | 299,788,408 | | | $ | 0 | | | $ | 479,980,338 | |
The Portfolio engaged in security transactions with other accounts managed by T. Rowe Price Associates, Inc., the subadviser to the Portfolio, that amounted to $151,734 in sales of investments, which are included above, and resulted in realized losses of $88,828.
5. Investment Management Fees and Other Transactions with Affiliates
Investment Management Agreement -Brighthouse Investment Advisers is the investment adviser to the Portfolio. The Trust has entered into an investment management agreement with Brighthouse Investment Advisers with respect to the Portfolio. For providing investment management services to the Portfolio, Brighthouse Investment Advisers receives monthly compensation at the following annual rates:
| | | | | | |
Management
Fees earned by
Brighthouse
Investment Advisers
for the year ended
December 31, 2018 | | % per annum | | | Average Daily Net Assets |
| $6,727,995 | | | 0.550 | % | | Of the first $100 million |
| | | 0.500 | % | | Of the next $300 million |
| | | 0.450 | % | | On amounts in excess of $400 million |
BHFTII-19
Brighthouse Funds Trust II
T. Rowe Price Small Cap Growth Portfolio
Notes to Financial Statements—December 31, 2018—(Continued)
Brighthouse Investment Advisers has entered into an investment subadvisory agreement with respect to managing the Portfolio. T. Rowe Price Associates, Inc. (“T. Rowe Price”) is compensated by Brighthouse Investment Advisers to provide subadvisory services for the Portfolio.
Management Fee Waivers - T. Rowe Price agreed to a voluntary subadvisory fee waiver that applies if (i) assets under management by T. Rowe Price for the Trust and Brighthouse Funds Trust I (“BHFTI”), an affiliate of the Trust, in the aggregate, exceed $750 million (ii) T. Rowe Price subadvises three or more portfolios of the Trust and BHFTI in the aggregate, and (iii) at least one of those portfolios is a large cap domestic equity portfolio.
If the aforementioned conditions are met, the Subadviser will waive its subadvisory fee paid by Brighthouse Investment Advisers by 5% for combined Trust and BHFTI average daily net assets over $750 million, 7.5% for the next $1.5 billion of combined assets, and 10% for amounts over $3 billion. Brighthouse Investment Advisers has voluntarily agreed to reduce its advisory fee for the Portfolio by the amount waived (if any) by T. Rowe Price for the Portfolio pursuant to this voluntary subadvisory fee waiver. Because these fee waivers are voluntary, and not contractual, they may be discontinued by T. Rowe Price and Brighthouse Investment Advisers at any time. Amounts waived for the year ended December 31, 2018 are shown as management fee waivers in the Statement of Operations.
Certain officers and trustees of the Trust may also be officers of Brighthouse Investment Advisers; however, such officers and trustees receive no compensation from the Trust.
Transfer Agency Agreement -Brighthouse Financial, Inc. serves as the transfer agent for the Trust. Brighthouse Financial, Inc. receives no fees for its services to the Trust.
Distribution and Service Fees - The Trust has a distribution agreement with Brighthouse Securities, LLC (the “Distributor”) pursuant to which the Distributor serves as the general distributor of shares of each class (each a “Class”) of each Portfolio. The Distributor is an affiliate of the Trust. The Trust has adopted a Distribution and Services Plan (the “Plan”) relating to Class B, Class E and Class G shares of each Portfolio, under Rule 12b-1 under the 1940 Act, pursuant to which the Trust may pay the Distributor a fee (the “Service Fee”) at an annual rate not to exceed 0.25% of each such Portfolio’s average daily net assets attributable to the Class B, Class E and Class G shares of the Trust. Each Portfolio may not offer shares of each Class. The Plan also authorizes the Trust, on behalf of each of its Portfolios, may pay the Distributor a distribution Fee (the “Distribution Fee” and together with the Service Fee, the “Fees”) at an annual rate of up to 0.25% of each Portfolio’s average daily net assets attributable to the Class B, Class E and Class G shares in consideration of the services rendered in connection with the sale of such shares by the Distributor. Under the Distribution Agreement with respect to the Trust, Fees are currently paid at an annual rate of 0.25% of average daily net assets in the case of Class B shares, 0.15% of average daily net assets in the case of Class E shares and 0.30% of average daily net assets in the case of Class G shares. The Plan is known as a “compensation plan” because the Trust makes payments to the Distributor for services rendered regardless of the actual level of expenditures by the Distributor. Amounts incurred by the Portfolio for the year ended December 31, 2018 are shown as Distribution and service fees in the Statement of Operations.
Deferred Trustee Compensation -Each Trustee who is not currently an employee of the Adviser or any of its affiliates receives compensation from the Trust for his or her service to the Trust. A deferred compensation plan (the “Plan”) is available to the Trustees on a voluntary basis. Deferred amounts remain in the Trust until distributed in accordance with the provisions of the Plan. The value of a participating Trustee’s deferral account is based on theoretical investments of deferred amounts on the normal payment dates in certain portfolios of the Trust or Brighthouse Funds Trust I, an affiliate of the Trust, as designated by the participating Trustee. Changes in the value of participants’ deferral accounts are reflected as Trustees’ fees and expenses in the Statement of Operations. The portion of the accrued obligations allocated to the Portfolio under the Plan is reflected as Deferred trustees’ fees in the Statement of Assets and Liabilities.
6. Transactions in Securities of Affiliated Issuers
A summary of the Portfolio’s transactions in the securities of affiliated issuers during the year ended December 31, 2018 is as follows:
| | | | | | | | | | | | | | | | | | | | | | | | |
Security Description | | Market Value
December 31,
2017 | | | Purchases | | | Sales | | | Ending
Value as of
December 31,
2018 | | | Income
earned from
affiliates
during
the period | | | Number of
shares held
at December 31,
2018 | |
T. Rowe Price Government Reserve Fund | | $ | 4,409,313 | | | $ | 204,505,186 | | | $ | (199,558,933 | ) | | $ | 9,355,566 | | | $ | 204,748 | | | | 9,355,566 | |
7. Contractual Obligations
Under the Trust’s organizational documents, its officers and Trustees may be indemnified against certain liabilities and expenses arising out of the performance of their duties to the Trust. Additionally, the Trust has a variety of indemnification obligations under contracts with its service providers. The Trust’s maximum exposure under these arrangements is unknown, as this would involve future claims that may be made against the Trust that have not yet occurred.
BHFTII-20
Brighthouse Funds Trust II
T. Rowe Price Small Cap Growth Portfolio
Notes to Financial Statements—December 31, 2018—(Continued)
8. Income Tax Information
The cost basis of investments for federal income tax purposes at December 31, 2018 was as follows:
| | | | |
Cost basis of investments | | $ | 1,251,817,168 | |
Gross unrealized appreciation | | | 293,571,394 | |
Gross unrealized depreciation | | | (115,083,367 | ) |
| | | | |
Net unrealized appreciation (depreciation) | | $ | 178,488,027 | |
| | | | |
The tax character of distributions paid for the years ended December 31, 2018 and 2017 were as follows:
| | | | | | | | | | | | | | | | | | | | |
Ordinary Income | | | Long-Term Capital Gain | | | Total | |
2018 | | 2017 | | | 2018 | | | 2017 | | | 2018 | | | 2017 | |
| $8,411,704 | | $ | 3,415,699 | | | $ | 113,902,101 | | | $ | 83,848,328 | | | $ | 122,313,805 | | | $ | 87,264,027 | |
As of December 31, 2018, the components of distributable earnings (accumulated losses) on a federal income tax basis were as follows:
| | | | | | | | | | | | | | | | |
Undistributed
Ordinary
Income | | Undistributed
Long-Term
Capital Gain | | | Net
Unrealized
Appreciation | | | Accumulated
Capital Losses | | | Total | |
| $4,856,293 | | $ | 185,895,114 | | | $ | 178,487,950 | | | $ | — | | | $ | 369,239,357 | |
The Portfolio utilizes the provisions of the federal income tax laws that provide for the carryforward of capital losses for prior years, offsetting such losses against any future realized capital gains. Under the Regulated Investment Company Modernization Act of 2010, net capital losses recognized after December 22, 2010 may be carried forward indefinitely and their character is retained as short-term and/or long-term losses.
As of December 31, 2018, the Portfolio had no accumulated capital losses.
9. Recent Accounting Pronouncements and SEC Update
In August 2018, the FASB issued Accounting Standards Update2018-13, Fair Value Measurement (Topic 820)—Disclosure Framework—Changes to the Disclosure Requirements for Fair Value Measurement (“ASU2018-13”) which introduces new fair value disclosure requirements as well as eliminates and modifies certain existing fair value disclosure requirements. ASU2018-13 is effective for fiscal years beginning after December 15, 2019, and interim periods within those fiscal years. Early adoption is permitted and, as such, management has elected to early adopt ASU2018-13 effective with the current reporting period. The impact of the Portfolio’s adoption was limited to changes in the Portfolio’s financial statement disclosures regarding fair value, primarily those disclosures related to transfers between levels of the fair value hierarchy.
In August 2018, the Securities and Exchange Commission released its Final Rule on Disclosure Update and Simplification (the “Final Rule”) which is intended to simplify an issuer’s disclosure compliance efforts by removing redundant or outdated disclosures requirements without significantly altering the mix of information provided to investors. Effective with the current reporting period, the Portfolio adopted the Final Rule with the most notable impacts being that the Portfolio is no longer required to present the components of distributable earnings on the Statement of Assets and Liabilities or the sources of distributions to shareholders and the amounts of undistributed net investment income on the Statements of Changes in Net Assets.
BHFTII-21
Brighthouse Funds Trust II
T. Rowe Price Small Cap Growth Portfolio
Report of Independent Registered Public Accounting Firm
To the Shareholders of T. Rowe Price Small Cap Growth Portfolio and the Board of Trustees of Brighthouse Funds Trust II:
Opinion on the Financial Statements and Financial Highlights
We have audited the accompanying statement of assets and liabilities, including the schedule of investments, of the T. Rowe Price Small Cap Growth Portfolio (the “Portfolio”), one of the portfolios constituting the Brighthouse Funds Trust II, as of December 31, 2018, the related statement of operations for the year then ended, the statements of changes in net assets for each of the two years in the period then ended, the financial highlights for each of the five years in the period then ended, and the related notes. In our opinion, the financial statements and financial highlights present fairly, in all material respects, the financial position of the T. Rowe Price Small Cap Growth Portfolio of the Brighthouse Funds Trust II as of December 31, 2018, the results of its operations for the year then ended, the changes in its net assets for each of the two years in the period then ended, and the financial highlights for each of the five years in the period then ended, in conformity with accounting principles generally accepted in the United States of America.
Basis for Opinion
These financial statements and financial highlights are the responsibility of the Portfolio’s management. Our responsibility is to express an opinion on the Portfolio’s financial statements and financial highlights based on our audits. We are a public accounting firm registered with the Public Company Accounting Oversight Board (United States) (PCAOB) and are required to be independent with respect to the Portfolio in accordance with the U.S. federal securities laws and the applicable rules and regulations of the Securities and Exchange Commission and the PCAOB.
We conducted our audits in accordance with the standards of the PCAOB. Those standards require that we plan and perform the audit to obtain reasonable assurance about whether the financial statements and financial highlights are free of material misstatement, whether due to error or fraud. The Portfolio is not required to have, nor were we engaged to perform, an audit of its internal control over financial reporting. As part of our audits we are required to obtain an understanding of internal control over financial reporting but not for the purpose of expressing an opinion on the effectiveness of the Portfolio’s internal control over financial reporting. Accordingly, we express no such opinion.
Our audits included performing procedures to assess the risks of material misstatement of the financial statements and financial highlights, whether due to error or fraud, and performing procedures that respond to those risks. Such procedures included examining, on a test basis, evidence regarding the amounts and disclosures in the financial statements and financial highlights. Our audits also included evaluating the accounting principles used and significant estimates made by management, as well as evaluating the overall presentation of the financial statements and financial highlights. Our procedures included confirmation of securities owned as of December 31, 2018, by correspondence with the custodian and brokers; when replies were not received from brokers, we performed other auditing procedures. We believe that our audits provide a reasonable basis for our opinion.
/s/ Deloitte & Touche LLP
Boston, Massachusetts
February 25, 2019
We have served as the auditor of one or more of the Brighthouse investment companies since 1983.
BHFTII-22
Brighthouse Funds Trust II
Trustees and Officers
MANAGEMENT OF THE TRUSTS
The Boards of Trustees (the “Board”) of Brighthouse Funds Trust I and Brighthouse Funds Trust II (“BHF I” and “BHF II”, respectively, and collectively the “Trusts”) supervise the Trusts and are responsible for representing the interests of shareholders. The Trustees, the Chairman of the Board and the Chairmen of each subcommittee are the same for both Trusts. The Trustees of each Trust meet periodically throughout the year to oversee the Portfolios’ activities, reviewing, among other things, each Portfolio’s performance and its contractual arrangements with various service providers. The Trustees of each Trust elect the officers of the Trust, who are responsible for administering the Trust’sday-to-day operations.
Trustees and Officers
The Trustees and executive officers of the Trusts, as well as their principal occupations during the past five years, are set forth below. Unless otherwise indicated, the business address of each is c/o Brighthouse Funds, One Financial Center, Boston, Massachusetts 02111. Each Trustee who is deemed an “interested person,” as such term is defined in the 1940 Act, is referred to as an “Interested Trustee.” Those Trustees who are not “interested persons,” as such term is defined in the 1940 Act, are referred to as “Independent Trustees.” There is no limit to the term a Trustee may serve. Trustees serve until their death, resignation or removal in accordance with the BHF I Trust’s and BHF II Trust’s respective organizational documents and policies adopted by the Boards of the respective Trusts from time to time. Officers hold office at the pleasure of each Board and serve until their removal or resignation in accordance with the Trusts’ respective organizational documents and policies adopted by the Board of each Trust from time to time.
| | | | | | | | | | |
Name and Year of Birth | | Current
Position(s)
Held with
Registrant | | Term of Office
and Length of
Time Served | | Principal Occupation(s) During the Past
5 Years(1) | | Number of
Portfolios
in Brighthouse
Funds
Complex(2)
Overseen
by Trustee | | Other Directorships Held
by Trustee During the
Past 5 Years(1) |
| Interested Trustee |
John Rosenthal* (1960) | | Trustee | | Indefinite; From
May 2016
(Trust I and
Trust II) to present | | Chief Investment Officer, Brighthouse Financial, Inc. (2017 to present); until 2017, Senior Managing Director and Head of Global Portfolio Management, MetLife, Inc. | | 72 | | None |
|
| Independent Trustees |
Dawn M. Vroegop (1966) | | Trustee and Chairman of the Board | | Indefinite; From
December 2000
(Trust I)/May
2009 (Trust II) to
present as
Trustee; From
May 2016 (Trust
I and Trust II)
until present as
Chairman | | Private Investor. | | 72 | | Trustee, Driehaus Mutual Funds.** |
| | | | | |
Stephen M. Alderman (1959) | | Trustee | | Indefinite; From
December 2000
(Trust I)/April
2012 (Trust II) to
present | | Shareholder in the law firm of Garfield and Merel, Ltd. | | 72 | | None |
| | | | | |
Robert J. Boulware (1956) | | Trustee | | Indefinite; From
March 2008
(Trust I)/April
2012 (Trust II) to
present | | Managing Director, Pilgrim Funds, LLC (private equity fund). | | 72 | | Trustee, Vertical Capital Income Fund(closed-end fund);** Director, Gainsco, Inc. (auto insurance);** Trustee, SharesPost 100 Fund(closed-end fund).** |
| | | | | |
Susan C. Gause (1952) | | Trustee | | Indefinite; From
March 2008
(Trust I)/April
2012 (Trust II) to
present | | Private Investor. | | 72 | | Trustee, HSBC Funds.** |
BHFTII-23
Brighthouse Funds Trust II
Trustees and Officers—(Continued)
| | | | | | | | | | |
Name and Year of Birth | | Current
Position(s)
Held with
Registrant | | Term of Office
and Length of
Time Served | | Principal Occupation(s) During the Past
5 Years(1) | | Number of
Portfolios
in Brighthouse
Funds
Complex(2)
Overseen
by Trustee | | Other Directorships Held
by Trustee During the
Past 5 Years(1) |
Nancy Hawthorne (1951) | | Trustee | | Indefinite; From
May 2003
(Trust II)/April
2012 (Trust I)
to present | | Partner, Hawthorne Financial Advisors, LLC (registered investment advisor); until 2014, Chief Executive Officer, Clerestory LLC (corporate advisor). | | 72 | | Director and Chairman of the Board of Directors, THL Credit, Inc.;** Director and Chairman of the Board, Avid Technology, Inc.;** Director, CRA International, Inc.** |
| | | | | |
Barbara A. Nugent (1956) | | Trustee | | Indefinite; From
January 2014
(Trust I and
Trust II) to
present | | President, True North Board Governance, LLC (consulting); until December 2013, partner in the law firm of Stradley Ronon Stevens & Young, LLP. | | 72 | | Independent Lead Trustee, BMT Investment Funds** |
| | | | | |
Christopher J. Towle (1957) | | Trustee | | Indefinite; From
April 2018
(Trust I and
Trust II) to
present | | Retired; until 2014, Partner, Portfolio Manager, Director of High Yield and Convertible Strategies, Lord Abbett & Co. | | 72 | | Trustee, Driehaus Mutual Funds** |
Officers
| | | | | | |
Name and Year of Birth | | Position(s)
Held with
Registrant | | Length of
Time Served | | Principal Occupation(s)
During the Past 5 Years(1) |
| Executive Officers | | | | | | |
Kristi Slavin (1973) | | President and Chief Executive Officer, of Trust I and Trust II | | From May
2016
(Trust I and
Trust II) to
present | | President, Brighthouse Investment Advisers, LLC (2016-present); formerly, Senior Vice President, MetLife Advisers, LLC; Vice President, MetLife, Inc.; Vice President, Trust I and Trust II(2015-2016). |
| | | |
Alan R. Otis (1971) | | Chief Financial Officer and Treasurer, of Trust I and Trust II | | From
November
2017
(Trust I and
Trust II) to
present | | Senior Vice President, Brighthouse Investment Advisers, LLC (2017-present); formerly, Vice President, Brighthouse Investment Advisers, LLC (2012-2017); Assistant Treasurer, Trust I and Trust II (2012-2017). |
| | | |
Andrew L. Gangolf (1954) | | Secretary, of Trust I and Trust II | | From May
2011
(Trust I and
Trust II) to
present | | Executive Vice President, Brighthouse Investment Advisers, LLC (2017-present); formerly, Senior Vice President, MetLife Advisers, LLC (2011-2017); until 2011, Senior Vice President & Assistant General Counsel, AllianceBernstein Investments, Inc. |
| | | |
Steven E. Hartstein (1963) | | Chief Compliance Officer (“CCO”), of Trust I and Trust II | | From
February
2014
(Trust I and
Trust II) to
present | | Senior Vice President and CCO, Brighthouse Investment Advisers, LLC (2017-present); Head of Investments Compliance, Vice President, Brighthouse Financial, Inc. (2017-present); formerly, Vice President, MetLife, Inc. (2013-2017); Senior Vice President and CCO, MetLife Advisers, LLC (2013-2017.) |
| | | |
Victor Soto (1978) | | Vice President of Trust I and Trust II | | From May
2018
(Trust I and
Trust II) to
present | | Executive Vice President, Brighthouse Investment Advisers, LLC (2016-present); Assistant Vice President, MetLife Inc. (2015-2017); Portfolio Manager, 1st Global (2013-2015). |
| * | Mr. Rosenthal is an “interested person” of the Trusts because of his position with Brighthouse Financial, Inc., the current parent company of Brighthouse Investment Advisers, LLC. |
| ** | Indicates a directorship with a registered investment company or a company subject to the reporting requirements of the Securities Exchange Act of 1934, as amended. |
| (1) | Previous positions during the past five years with the Trusts, Brighthouse Financial, Inc., MetLife, Inc. or the Manager are omitted if not materially different. |
| (2) | The Fund Complex includes 43 BHF I Portfolios and 29 BHF II Portfolios. |
BHFTII-24
Brighthouse Funds Trust II
T. Rowe Price Small Cap Growth Portfolio
Board of Trustees’ Consideration of Advisory and Sub-Advisory Agreements
At anin-person meeting held on November6-8, 2018 (the “November Meeting”), the Boards of Trustees (the “Board”) of Brighthouse Funds Trust I and Brighthouse Funds Trust II (“BFT I” and “BFT II,” respectively, and collectively, the “Trusts”), including a majority of the Trustees who are not “interested persons” of the Trusts (the “Independent Trustees”) under the Investment Company Act of 1940 (the “1940 Act”), approved the continuation of the Trusts’ advisory agreements (each, an “Advisory Agreement”) with Brighthouse Investment Advisers, LLC (the “Adviser”) and the applicablesub-advisory agreements (each a “Sub-Advisory Agreement,” and collectively with the Advisory Agreement, the “Agreements”) between the Adviser and the investmentsub-advisers (each a “Sub-Adviser,” and collectively, the “Sub-Advisers”) for the series of the Trusts (each a “Portfolio,” and collectively, the “Portfolios”).
In making those approvals, the Board reviewed a variety of materials that were provided for the specific purpose of the annual contract renewal process. In addition, various materials provided to and discussed with the Board throughout the year informed the Board’s decision to renew the Agreements. In particular, the information for each Portfolio included, but was not limited to, investment performance reports, and reports on expenses, legal and compliance matters, asset pricing, brokerage commissions and trade execution.
The Board met in person with personnel of the Adviser on October 17, 2018 for the specific purpose of giving preliminary consideration to the proposed continuation of the Agreements (the “October Meeting”). At that meeting, the Adviser reviewed with the Board the performance and fees experienced by each Portfolio, as well as other information. During and after the October Meeting, the Independent Trustees communicatedfollow-up matters for management to address at the November Meeting. The Independent Trustees were advised by independent legal counsel throughout the contract renewal process, and met with independent legal counsel in several executive sessions outside of the presence of management.
Information furnished and reviewed specifically in connection with the renewal process included, but was not limited to, a report for each Portfolio that was prepared by Broadridge (“Broadridge”), an independent organization. In addition, the Independent Trustees reviewed a report that was prepared by JDL Consultants, LLC (“JDL”), an independent consultant to the Independent Trustees (“JDL Report”), which examined the comparative fees, expenses and performance of each Portfolio, based upon the Broadridge reports. Also, the Board reviewed the responses to wide-ranging questions from the Independent Trustees relating to the business, operations and performance of the Adviser and theSub-Advisers that the Adviser andSub-Advisers had prepared specifically for the renewal process, and reviewed aPortfolio-by-Portfolio analysis of the profitability to the Adviser of each Advisory Agreement, which was prepared by the Adviser for the renewal process.
At the November Meeting, the Board, including a majority of the Independent Trustees, concluded that the nature, extent and quality of services provided by the Adviser and eachSub-Adviser supported the renewal of the Agreements. The Board also concluded that the investment performance of each Portfolio was such that each Agreement should continue, and that the fees paid by each Portfolio to the Adviser appeared to be reasonable in light of the nature, extent and quality of the services provided by the Adviser andSub-Adviser. Further, the Board concluded that the Adviser’s profitability in providing services under the Advisory Agreements did not appear unreasonable in light of the nature, extent and quality of the services provided by the Adviser. Finally, the Board reviewed the extent to which the investment advisory fees paid by the Portfolios shared economies of scale with investors or entailed the potential to share economies of scale with investors and concluded that those considerations generally supported the renewal of each Agreement. In approving the renewal of each of the Agreements, the Board, including the Independent Trustees, gave attention to all of the information that was furnished and each Trustee placed varying degrees of importance on the various pieces of information that were provided to them. The Board evaluated the information available to it on aPortfolio-by-Portfolio basis, and its decision was made separately with respect to each Portfolio. The following paragraphs provide more information about some of the primary factors that were relevant to the Board’s decision. The Board did not identify any single factor as determinative, and the Trustees generally attributed different weights to various factors for the various Portfolios.
Nature, extent and quality of services. The Board evaluated the nature, extent and quality of the services that the Adviser and theSub-Advisers, as relevant, have provided to the Portfolios. The Board considered the Adviser’s services as investment manager to the Portfolios, including its services relating to the hiring and oversight of theSub-Advisers, trading practices and oversight of transition management (as applicable), compliance programs and personnel, and risk management, among other things. The Adviser’s services in coordinating and overseeing the activities of the Trusts’ other service providers were also considered. The Board considered information received from the Trusts’ Chief Compliance Officer (“CCO”) regarding the Portfolios’ compliance policies and procedures that were established pursuant to Rule38a-l under the 1940 Act. The Board also noted that the Adviser’s investment, compliance and legal staff conduct regular and periodic telephonic andin-person meetings with theSub-Advisers to review and assess the services that are provided to the Portfolios, and that personnel of the Adviser prepare and present reports to the Independent Trustees regarding those meetings. In addition, throughout the year, the Board considered the expertise, experience and performance of the personnel of the Adviser who performed the various services that are mentioned above.
BHFTII-25
Brighthouse Funds Trust II
T. Rowe Price Small Cap Growth Portfolio
Board of Trustees’ Consideration of Advisory and Sub-Advisory Agreements—(Continued)
With respect to the services provided by each of theSub-Advisers, the Board considered a variety of information that the Adviser and eachSub-Adviser prepared for the Board’s review. The Board considered eachSub-Adviser’s investment process and philosophy, and the investment performance experienced by the Portfolio (as described in more detail below). The Board took into account that eachSub-Adviser’s responsibilities include the development and maintenance of an investment program for the applicable Portfolio that is consistent with the Portfolio’s investment objectives, the selection of investment securities and the placement of orders for the purchase and sale of such securities, as well as the implementation of compliance controls related to performance of these services. In particular, the Board considered, among other things, theSub-Adviser’s current level of staffing as well as its compensation program and its overall resources. The Board reviewed eachSub-Adviser’s history and investment experience, as well as information provided regarding the qualifications, background and responsibilities of theSub-Adviser’s investment and compliance personnel who provide services to the Portfolios. The Board also considered, among other things, eachSub-Adviser’s compliance program and regulatory and disciplinary history. In its review, the Board also took into account information regarding any services and/or payments provided to the Adviser by theSub-Advisers in connection with marketing activities and considered representations from the Adviser that those payments were not considered in the Adviser’s recommendation to renew any of theSub-Advisory Agreements.
Performance. The Board placed emphasis on the performance of each Portfolio in light of, among other things, its importance to investors. The Board considered the Adviser’s quarterly reviews with the Board of detailed information about each Portfolio’s investment strategies and performance results and composition, including discussions regarding the relevant effect of current market conditions. The Board reviewed and considered the reports prepared by Broadridge, which provided a statistical analysis comparing the Portfolios’ investment performance to that of comparable funds underlying variable insurance products (the “Performance Universe”). The Independent Trustees also met separately with representatives of JDL during the October Meeting to review the JDL Report. The Board also compared the performance records of the Portfolios to those of comparable funds and other accounts that were managed by the relevantSub-Adviser, to the extent such information was available. The Board considered each Portfolio’s performance for periods subsequent to the performance period covered by the Broadridge reports, and the Adviser’s discussion of the same, including the effect of current market conditions on each Portfolio’s more recent performance. The Board also noted that while it found the data provided by Broadridge generally useful, it recognized the limitations of such data, including, in particular, that notable differences may exist between a Portfolio and those of the other funds in a Broadridge category (for example, the investment objectives(s) and investment strategies) and that the results of the performance comparisons may vary depending on (i) the end dates for the performance periods that were selected and (ii) the selection of the peer groups.
The Board focused particular attention on Portfolios with less favorable performance records. The Board noted the Adviser’s focus on eachSub-Adviser’s performance and that the Adviser has been active in monitoring and responding to any performance issues with respect to the Portfolios.
Fees and Expenses. The Board gave consideration to the level and method of computing the fees payable under the Agreements. The Board considered the Broadridge report for each of the Portfolios, which included comparisons for each Portfolio of its contractual management andsub-adviser fees (at current and various asset levels), and total expenses, with those of its peers, including as those peers were divided into a broad group of peer funds (“Expense Universe”), a narrower group of peer funds (“Expense Group”), a broad group of peersub-advised funds (“Sub-advised Expense Universe”), and a narrower group of peersub-advised funds (“Sub-advised Expense Group”). Broadridge selected the peer funds which were similarly situated funds underlying variable insurance products deemed to be comparable to the Portfolios. The Independent Trustees, with the assistance of JDL, also examined the JDL Report. The Board compared the fee payable to aSub-Adviser by the Adviser with respect to the Portfolio to the fee payable to theSub-Adviser by other comparable funds and other accounts, to the extent such information was available.
The Board noted that thesub-advisory fees for the Portfolios are paid by the Adviser out of the advisory fees, and that the Adviser negotiates the fees at arm’s length. The Board also considered that the Adviser had entered into expense limitation or management fee waiver agreements with certain of the Portfolios pursuant to which the Adviser had agreed to waive a portion of its advisory fee and/or reimburse certain expenses as a means of limiting a Portfolio’s total annual operating expenses.
Profitability. The Board examined the profitability to the Adviser of each Advisory Agreement, on aPortfolio-by-Portfolio basis. The Board also considered that an affiliate of the Adviser, Brighthouse Securities, LLC, serves as distributor for the Trusts, and, as such, receives Rule12b-1 payments to support the distribution of the Portfolios. The Board considered the profitability to theSub-Advisers and their affiliates as a result of their relationships with the Portfolios, to the extent available, and the Board considered the ability of the Adviser to negotiate with aSub-Adviser at arm’s length. In reviewing the profitability analyses, the Board recognized that expense allocation methodologies are inherently subjective and various expense allocation methodologies may be reasonable while producing different results.
BHFTII-26
Brighthouse Funds Trust II
T. Rowe Price Small Cap Growth Portfolio
Board of Trustees’ Consideration of Advisory and Sub-Advisory Agreements—(Continued)
Economies of scale. The Board also considered each Portfolio’s fees in light of its size. The Board noted the fee schedules for the Portfolios that contain breakpoints that reduce the fee rate above specified asset levels. The Board noted those Portfolios that did not have breakpoints in their advisory fee and took into account management’s discussion of the same. The Board noted that those Portfolios with Advisory Agreements containing breakpoints generally have breakpoints in the correspondingSub-Advisory Agreement. The Board considered the effective fees under the Advisory Agreement andSub-Advisory Agreement for each Portfolio as a percentage of assets at different asset levels and possible economies of scale that may be realized if the assets of the Portfolio grow. The Board examined, among other data, the effect of a Portfolio’s growth in size, and reduction in size, on various fee schedules and the Board reviewed the Broadridge and JDL Reports, which compared fees among peers. The Board also generally noted that if a Portfolio’s assets increase over time, the Portfolio may realize other economies of scale if assets increase proportionally more than certain other fixed expenses.
Other factors. The Board considered other benefits that may be realized by the Adviser and its affiliates from their relationship with the Trusts. Among them, the Board recognized that Brighthouse Securities, LLC, as the distributor for the Trusts, receives payments pursuant to Rule12b-1 from the Portfolios to compensate for the provision of shareholder services and distribution activities, which could lead to growth in the Trusts’ assets and corresponding benefits from such growth, including economies of scale. The Board considered other benefits that may be realized by eachSub-Adviser and its affiliates from their relationship with the Trusts, including the opportunity to provide advisory services to additional portfolios of the Trusts and reputational benefits. In conjunction with these considerations, the Board noted the ongoing commitment of the Adviser to the Portfolios.
The Board requested, received, and considered information from the Adviser regarding possible conflicts of interest in the form of material benefits to the Adviser resulting from the Adviser’s affiliations and business relationships, as relevant. The Board considered the services that are provided to the Trusts by its service providers, and the manner in which any conflicts were mitigated.
* * *
T. Rowe Price Small Cap Growth Portfolio. The Board also considered the following information in relation to the Agreements with the Adviser and T. Rowe Price Associates, Inc. regarding the Portfolio:
Among other data relating specifically to the Portfolio’s performance, the Board considered that the Portfolio outperformed the median of its Performance Universe and the average of its Morningstar Category for the three-year and five-year periods ended June 30, 2018, and underperformed the median of its Performance Universe and the average of its Morningstar Category for theone-year period ended June 30, 2018. The Board also considered that the Portfolio outperformed its benchmark, the MSCI U.S. Small Cap Growth Index, for theone-, three- and five-year periods ended September 30, 2018.
The Board also considered that the Portfolio’s actual management fees and total expenses (exclusive of12b-1 fees) were below the median of the Expense Group, Expense Universe, andSub-advised Expense Universe, and were the lowest in the Expense Group and theSub-advised Expense Universe. The Board further noted that the Portfolio’s contractual management fees were below the asset-weighted average of comparable funds selected by Broadridge at the Portfolio’s current size. The Board also noted that the Portfolio’s contractualsub-advisory fees were below the averages of theSub-advised Expense Group and theSub-advised Expense Universe at the Portfolio’s current size.
BHFTII-27
Brighthouse Funds Trust II
Van Eck Global Natural Resources Portfolio
Managed by VanEck Associates Corporation
Portfolio Manager Commentary*
PERFORMANCE
For the 12 months ended December 31, 2018, the Class A and B shares of the Van Eck Global Natural Resources Portfolio returned-28.64% and-28.85%, respectively. The Portfolio’s benchmark, the Standard & Poor’s (“S&P”) North American Natural Resources Sector Index1, returned-21.07%.
MARKET ENVIRONMENT / CONDITIONS
During the reporting period, the most significant impact on the natural resources market and the Portfolio came from the combination of the escalating global trade disputes and the specter of rising of interest rates by the U.S. Federal Reserve (the “Fed”).
At the start of 2018, the prospects for both the natural resources market and the Portfolio looked encouraging. The benefits (for example from tax cuts and lower regulation) from the first two years of President Trump’s administration were continuing to flow through and, while maybe not constituting a strong tailwind, they were certainly positive. Natural resources stocks looked cheap on a relative basis, and, in many cases, also an absolute basis. Expectations were that commodity prices were going to be “OK” to “good” and, at minimum, there were going to be upward earnings revisions based on these.
Most exceptionally, natural resources companies accelerated their focus on returns and margins. In our opinion, industry fundamentals were excellent: balance sheets were strong and returns were improving, as was the visibility and extent of both free cash flow generation and its return to shareholders.
By year end, however, all such hopes had been thoroughly confounded, killed by the twin “evils” of trade disputes and Fed policy. Concerns around trade had started first with the North American Free Trade Agreement (“NAFTA”), then touched on Europe, and, finally, moved to China, where things became really bad. Matters were only compounded by the Fed raising rates and, consequently, the U.S. dollar strengthening. The result for the two growth engines of the world economy was: 1) the market started to price in slower U.S. growth (a result of the Fed’s actions); and 2) trade tariffs started to slow down growth in China.
Although crude oil prices had been pretty resilient for most of the year, in its last six weeks or so, in a confluence of events, the bottom fell totally out of the market. These events included continuing exhortations by President Trump for Saudi Arabia to pump more oil, the egregious demise of Jamal Khashoggi, the continued liquidation (after February 2018) of massive speculative long positions in oil and, not least, crude oil production by the U.S., Saudi Arabia, and Russia, the three largest producers in the world, reachingall-time highs.
During the year, the Fed’s interest rate hikes and a strengthening U.S. dollar resulted in weaker gold prices, with gold equities following suit. In the last quarter of the year, however, as the equity markets experienced increasing turmoil, investors rediscovered gold’s safe haven identity and the metal ended the year down only some 1.6%.
Trade concerns, together with fears around Chinese growth prospects and the impact on ultimate consumption (China remains the world’s largest consumer of base metals), hurt mining companies. While bulks (coal and iron ore) did not suffer as badly, base metals were negatively impacted, with copper falling approximately 20%.
Grains—soybeans and corn in particular—were also hit hard by trade fears. And while fertilizer stocks held up until close to the end of the year, they, too, rolled over when the market started throwing every other natural resource stock out.
PORTFOLIO REVIEW /PERIOD-END POSITIONING
Several of the key aspects that contributed to underperformance of the Portfolio relative to its primary benchmark were overweight positions and underperformance in the oil & gas exploration & production and oil & gas drillingsub-industries. The absence of any allocation to integrated oil & gas stocks led to underperformance relative to the benchmark over the reporting period.
The three weakest-contributingsub-industries to the Portfolio’s performance relative to the benchmark were oil & gas exploration & production, oil & gas drilling, and diversified metals & mining. The Portfolio’s three weakest-contributing companies were oil & gas exploration & production company Parsley Energy, Inc., oil & gas drilling companyPatterson-UTI Energy, Inc., and copper mining company First Quantum Minerals, Ltd. Parsley Energy andPatterson-UTI Energy both suffered from concerns about Permian Basin takeaway capacity bottlenecks and subsequent fears of lower drilling and oil field service activity. First Quantum Minerals was a victim of concerns around potential changes in mining royalty taxation in Zambia.
The Portfolio’s three strongest positive-contributing individual positions were oil & gas exploration & production company RSP Permian, Inc., now part of Concho Resources, Inc., solar energy company Sunrun, Inc. (electrical components & equipmentsub-industry) and gold mining company Barrick Gold Corp. As part of the continuing theme of consolidation amongst oil & gas exploration & production companies, RSP Permian was acquired by Concho. In the energy space, residential solar continues to mature as an asset base, and 2018 was a pivotal year in securitizing these lower-risk, longer-dated assets. Sunrun continued to be a leader in securing an attractive cost of capital amidst higher interest rates, and its outperformance this year was a reflection of this continued execution as well as achieving installation growth above market. Barrick Gold benefitted both from its merger deal with Randgold and the rise in gold prices during the last quarter of the year.
BHFTII-1
Brighthouse Funds Trust II
Van Eck Global Natural Resources Portfolio
Managed by VanEck Associates Corporation
Portfolio Manager Commentary*—(Continued)
The Portfolio’s largest purchases established new positions in steel company Vale S.A. and increased its position in oil & gas exploration & production company Concho Resources, Inc. On both an absolute and relative basis, the Portfolio increased its weightings to both the steel and fertilizers & agricultural chemicalssub-industries.
The Portfolio’s largest sales during the reporting period were the reductions of its positions in oil & gas equipment & services companies Schlumberger, Ltd. and Halliburton Co. On both an absolute and relative basis, the Portfolio decreased its weightings to both the oil & gas equipment & services and oil & gas drillingsub-industries.
As of December 31, 2018, the Portfolio had no allocation to the integrated oil & gassub-industry, making thatsub-industry a substantially underweight position relative to the benchmark. As of the same date, the Portfolio’s next most substantially underweight position was in the oil & gas storage & transportationsub-industry. The Portfolio also had an underweight position in the oil & gas refining & marketingsub-industry.
As of December 31, 2018, the Portfolio’s most substantially overweight positions relative to the benchmark were in the diversified metals & mining, fertilizers & agricultural chemicalssub-industries, and oil & gas exploration & production.
Shawn Reynolds
Charles Cameron
Portfolio Managers
Van Eck Associates Corporation
* This commentary may include statements that constitute “forward-looking statements” under the U.S. securities laws. Forward-looking statements include, among other things, projections, estimates, and information about possible or future results related to the Portfolio, market or regulatory developments. The views expressed above are not guarantees of future performance or economic results and involve certain risks, uncertainties and assumptions that could cause actual outcomes and results to differ materially from the views expressed herein. The views expressed above are subject to change at any time based upon economic, market, or other conditions and the subadvisory firm undertakes no obligation to update the views expressed herein. Any discussions of specific securities should not be considered a recommendation to buy or sell those securities. The views expressed above (including any forward-looking statement) may not be relied upon as investment advice or as an indication of the Portfolio’s trading intent. Information about the Portfolio’s holdings, asset allocation or country diversification is historical and is not an indication of future Portfolio composition, which may vary. Direct investment in any index is not possible. The performance of any index mentioned in this commentary has not been adjusted for ongoing management, distribution and operating expenses, and sales charges applicable to mutual fund investments. In addition, the returns do not reflect additional fees charged by separate accounts or variable insurance contracts that an investor in the Portfolio may pay. If these additional fees were reflected, performance would have been lower.
BHFTII-2
Brighthouse Funds Trust II
Van Eck Global Natural Resources Portfolio
A $10,000 INVESTMENT COMPARED TO THE S&P NORTH AMERICAN NATURAL RESOURCES SECTOR INDEX
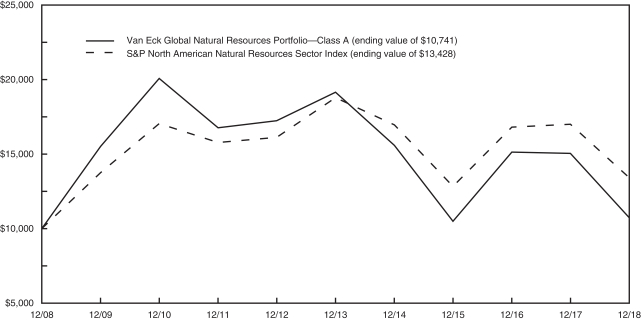
AVERAGE ANNUAL RETURNS (%) (FOR THE YEAR ENDED DECEMBER 31, 2018)
| | | | | | | | | | | | | | | | |
| | | | | |
| | | 1 Year | | | 5 Year | | | 10 Year | | | Since Inception2 | |
| Van Eck Global Natural Resources Portfolio | | | | | | | | | | | | | | | | |
Class A | | | -28.64 | | | | -10.92 | | | | 0.72 | | | | — | |
Class B | | | -28.85 | | | | -11.14 | | | | — | | | | -0.43 | |
| S&P North American Natural Resources Sector Index | | | -21.07 | | | | -6.50 | | | | 2.99 | | | | — | |
1 The S&P North American Natural Resources Sector Index was developed as an equity benchmark for U.S. traded natural resource related stocks.
2 Inception dates of the Class A and Class B shares are 10/31/08 and 4/28/09, respectively.
Portfolio performance is calculated including reinvestment of all income and capital gain distributions. Performance numbers are net of all Portfolio expenses but do not include any insurance, sales, separate account or administrative charges of variable annuity or life insurance contracts or any additional expenses that participants may bear relating to the operations of their plans. If these charges were included, the returns would be lower. The performance of any index referenced above has not been adjusted for ongoing management, distribution and operating expenses, and sales charges applicable to mutual fund investments. Direct investment in any index is not possible. The performance of Class A shares, as set forth in the line graph above, will differ from that of other classes because of the difference in expenses paid by policyholders investing in the different share classes.
This information represents past performance and is not indicative of future results. Investment return and principal value may fluctuate so that shares, upon redemption, may be worth more or less than the original cost.
PORTFOLIO COMPOSITION AS OF DECEMBER 31, 2018
Top Holdings
| | | | |
| | | % of
Net Assets | |
| Teck Resources, Ltd.- Class B | | | 5.2 | |
| Diamondback Energy, Inc. | | | 5.1 | |
| Glencore plc | | | 4.7 | |
| Concho Resources, Inc. | | | 4.5 | |
| EOG Resources, Inc. | | | 4.4 | |
| Pioneer Natural Resources Co. | | | 4.3 | |
| CF Industries Holdings, Inc. | | | 3.9 | |
| Nutrien, Ltd. | | | 3.7 | |
| First Quantum Minerals, Ltd. | | | 3.4 | |
| Parsley Energy, Inc.- Class A | | | 3.0 | |
Top Sectors
| | | | |
| | | % of
Net Assets | |
| Energy | | | 43.3 | |
| Materials | | | 42.9 | |
| Consumer Staples | | | 2.9 | |
| Industrials | | | 2.6 | |
| Real Estate | | | 1.4 | |
| Information Technology | | | 1.4 | |
| Utilities | | | 0.6 | |
BHFTII-3
Brighthouse Funds Trust II
Van Eck Global Natural Resources Portfolio
Understanding Your Portfolio’s Expenses
Shareholder Expense Example
As a shareholder of the Portfolio, you incur ongoing costs, including management fees; distribution and service(12b-1) fees; and other Portfolio expenses. This example is intended to help you understand your ongoing costs (in dollars) (referred to as “expenses”) of investing in the Portfolio and compare these costs with the ongoing costs of investing in other mutual funds. The example is based on an investment of $1,000 invested at the beginning of the period and held for the entire period, July 1, 2018 through December 31, 2018.
Actual Expenses
The first line for each share class of the Portfolio in the table below provides information about actual account values and actual expenses. You may use the information in this line, together with the amount you invested in the particular share class of the Portfolio, to estimate the expenses that you paid over the period. Simply divide your account value by $1,000 (for example, an $8,600 account value divided by $1,000 = 8.6), then multiply the result by the number in the first line under the heading entitled “Expenses Paid During Period” to estimate the expenses you paid on your account during this period.
Hypothetical Example for Comparison Purposes
The second line for each share class of the Portfolio in the table below provides information about hypothetical account values and hypothetical expenses based on the Portfolio’s actual expense ratio and an assumed rate of return of 5% per year before expenses, which is not the Portfolio’s actual return. The hypothetical account values and expenses may not be used to estimate the actual ending account balance or expenses you paid for the period. You may use this information to compare the ongoing costs of investing in the Portfolio and other funds. To do so, compare this 5% hypothetical example with the 5% hypothetical examples that appear in the shareholder reports of the other funds.
Please note that the expenses shown in the table are meant to highlight your ongoing costs only and do not reflect any fees or charges of your variable insurance product or any additional expenses that participants in certain eligible qualified plans may bear relating to the operations of their plan. Therefore, the second line for each share class in the table is useful in comparing ongoing costs only, and will not help you determine the relative total costs of owning different funds. In addition, if these other costs were included, your costs would have been higher.
| | | | | | | | | | | | | | | | | | |
Van Eck Global Natural Resources Portfolio
| | | |
Annualized
Expense
Ratio | | | Beginning
Account Value
July 1,
2018 | | | Ending
Account Value
December 31,
2018 | | | Expenses Paid
During Period**
July 1, 2018
to
December 31,
2018 | |
Class A (a) | | Actual | | | 0.80 | % | | $ | 1,000.00 | | | $ | 718.40 | | | $ | 3.47 | |
| | Hypothetical* | | | 0.80 | % | | $ | 1,000.00 | | | $ | 1,021.17 | | | $ | 4.08 | |
| | | | | |
Class B (a) | | Actual | | | 1.05 | % | | $ | 1,000.00 | | | $ | 718.20 | | | $ | 4.55 | |
| | Hypothetical* | | | 1.05 | % | | $ | 1,000.00 | | | $ | 1,019.91 | | | $ | 5.35 | |
| * | Hypothetical assumes a rate of return of 5% per year before expenses. |
| ** | Expenses paid are equal to the Portfolio’s annualized expense ratio for the most recent six month period, as shown above, multiplied by the average account value over the period, multiplied by the number of days (184 days) in the most recent fiscal half-year, divided by 365 (to reflect theone-half year period). |
| (a) | The annualized expense ratio shown reflects the impact of the management fee waiver as described in Note 5 of the Notes to Financial Statements. |
BHFTII-4
Brighthouse Funds Trust II
Van Eck Global Natural Resources Portfolio
Schedule of Investments as of December 31, 2018
Common Stocks—95.1% of Net Assets
| | | | | | | | |
| Security Description | |
Shares | | | Value | |
|
| Chemicals—7.6% | |
CF Industries Holdings, Inc. | | | 832,100 | | | $ | 36,204,671 | |
Nutrien, Ltd. | | | 725,423 | | | | 34,094,881 | |
| | | | | | | | |
| | | | | | | 70,299,552 | |
| | | | | | | | |
|
| Electrical Equipment—0.9% | |
Sunrun, Inc. (a) (b) | | | 770,200 | | | | 8,387,478 | |
| | | | | | | | |
|
| Energy Equipment & Services—7.0% | |
Halliburton Co. (b) | | | 305,500 | | | | 8,120,190 | |
Nabors Industries, Ltd. (b) | | | 1,926,200 | | | | 3,852,400 | |
Patterson-UTI Energy, Inc. (b) | | | 1,676,000 | | | | 17,346,600 | |
ProPetro Holding Corp. (a) (b) | | | 1,320,700 | | | | 16,271,024 | |
Schlumberger, Ltd. | | | 187,300 | | | | 6,757,784 | |
Superior Energy Services, Inc. (a) (b) | | | 814,200 | | | | 2,727,570 | |
Transocean, Ltd. (a) (b) | | | 1,017,300 | | | | 7,060,062 | |
Weatherford International plc (a) (b) | | | 5,005,800 | | | | 2,798,242 | |
| | | | | | | | |
| | | | | | | 64,933,872 | |
| | | | | | | | |
|
| Equity Real Estate Investment Trusts—1.4% | |
Hannon Armstrong Sustainable Infrastructure Capital, Inc. | | | 674,543 | | | | 12,850,044 | |
| | | | | | | | |
|
| Food Products—2.9% | |
Bunge, Ltd. | | | 172,100 | | | | 9,197,024 | |
Tyson Foods, Inc. - Class A | | | 338,700 | | | | 18,086,580 | |
| | | | | | | | |
| | | | | | | 27,283,604 | |
| | | | | | | | |
|
| Independent Power and Renewable Electricity Producers—0.6% | |
Ormat Technologies, Inc. (b) | | | 98,800 | | | | 5,167,240 | |
| | | | | | | | |
|
| Marine—1.7% | |
Kirby Corp. (a) (b) | | | 236,631 | | | | 15,939,464 | |
| | | | | | | | |
|
| Metals & Mining—34.3% | |
Agnico Eagle Mines, Ltd. (U.S. Listed Shares) | | | 674,333 | | | | 27,243,053 | |
Barrick Gold Corp. (b) | | | 1,911,700 | | | | 25,884,418 | |
First Quantum Minerals, Ltd. | | | 3,895,200 | | | | 31,499,420 | |
Glencore plc | | | 11,827,157 | | | | 43,622,817 | |
Goldcorp, Inc. | | | 540,500 | | | | 5,296,900 | |
IAMGOLD Corp. (a) | | | 1,531,500 | | | | 5,635,920 | |
KAZ Minerals plc (b) | | | 1,256,486 | | | | 8,521,594 | |
Kinross Gold Corp. (a) (b) | | | 3,252,500 | | | | 10,538,100 | |
Newmont Mining Corp. (b) | | | 805,900 | | | | 27,924,435 | |
Randgold Resources, Ltd. (ADR) | | | 202,500 | | | | 17,346,782 | |
Rio Tinto plc (ADR) (b) | | | 508,000 | | | | 24,627,840 | |
Steel Dynamics, Inc. | | | 562,600 | | | | 16,900,504 | |
Teck Resources, Ltd. - Class B | | | 2,249,600 | | | | 48,456,384 | |
Vale S.A. (ADR) (b) | | | 1,871,600 | | | | 24,686,404 | |
| | | | | | | | |
| | | | | | | 318,184,571 | |
| | | | | | | | |
|
| Oil, Gas & Consumable Fuels—36.3% | |
Anadarko Petroleum Corp. | | | 192,800 | | | | 8,452,352 | |
Cimarex Energy Co. (b) | | | 345,600 | | | | 21,306,240 | |
CNX Resources Corp. (a) (b) | | | 1,601,300 | | | | 18,286,846 | |
|
| Oil, Gas & Consumable Fuels—(Continued) | |
Concho Resources, Inc. (a) | | | 402,629 | | | | 41,386,235 | |
Diamondback Energy, Inc. | | | 513,206 | | | | 47,574,196 | |
Encana Corp. | | | 1,272,400 | | | | 7,354,472 | |
EOG Resources, Inc. (b) | | | 465,100 | | | | 40,561,371 | |
Golar LNG, Ltd. (b) | | | 963,400 | | | | 20,963,584 | |
Green Plains, Inc. (b) | | | 984,900 | | | | 12,912,039 | |
Newfield Exploration Co. (a) | | | 795,500 | | | | 11,662,030 | |
Parsley Energy, Inc. - Class A (a) | | | 1,762,400 | | | | 28,163,152 | |
PBF Energy, Inc. - Class A (b) | | | 213,600 | | | | 6,978,312 | |
PDC Energy, Inc. (a) | | | 548,800 | | | | 16,332,288 | |
Pioneer Natural Resources Co. | | | 304,100 | | | | 39,995,232 | |
Scorpio Tankers, Inc. | | | 2,103,800 | | | | 3,702,688 | |
WPX Energy, Inc. (a) (b) | | | 1,014,600 | | | | 11,515,710 | |
| | | | | | | | |
| | | | | | | 337,146,747 | |
| | | | | | | | |
|
| Paper & Forest Products—1.0% | |
Louisiana-Pacific Corp. | | | 434,700 | | | | 9,659,034 | |
| | | | | | | | |
|
| Semiconductors & Semiconductor Equipment—1.4% | |
SolarEdge Technologies, Inc. (a) (b) | | | 365,600 | | | | 12,832,560 | |
| | | | | | | | |
Total Common Stocks
(Cost $1,067,136,966) | | | | | | | 882,684,166 | |
| | | | | | | | |
|
| Short-Term Investment—4.8% | |
|
| Mutual Fund—4.8% | |
AIM STIT-STIC Prime Portfolio | | | 44,814,921 | | | | 44,814,921 | |
| | | | | | | | |
Total Short-Term Investments
(Cost $44,814,921) | | | | | | | 44,814,921 | |
| | | | | | | | |
|
| Securities Lending Reinvestments (c)—19.6% | |
|
| Certificates of Deposit—12.9% | |
Banco Del Estado De Chile New York
2.720%, 1M LIBOR + 0.250%, 03/20/19 (d) | | | 2,000,000 | | | | 1,999,828 | |
Bank of Montreal (Chicago)
2.710%, 1M LIBOR + 0.330%, 08/06/19 (d) | | | 5,000,000 | | | | 4,999,875 | |
Bank of Nova Scotia
2.890%, SOFR + 0.430%, 05/16/19 (d) | | | 3,000,000 | | | | 2,999,998 | |
| Barclays Bank plc | |
2.500%, 02/01/19 | | | 1,000,000 | | | | 999,871 | |
2.547%, 1M LIBOR + 0.200%, 02/04/19 (d) | | | 2,500,000 | | | | 2,499,762 | |
| Canadian Imperial Bank of Commerce | |
2.556%, 3M LIBOR + 0.120%, 01/14/19 (d) | | | 2,000,000 | | | | 1,999,744 | |
2.740%, 1M LIBOR + 0.270%, 07/19/19 (d) | | | 3,000,000 | | | | 2,998,782 | |
China Construction Bank Corp.
2.550%, 01/07/19 | | | 2,000,000 | | | | 2,000,000 | |
Citibank N.A.
2.490%, 02/04/19 | | | 4,000,000 | | | | 3,999,444 | |
| Commonwealth Bank of Australia | |
2.617%, 3M LIBOR + 0.140%, 04/23/19 (d) | | | 2,000,000 | | | | 2,000,006 | |
2.642%, 1M LIBOR + 0.210%, 09/13/19 (d) | | | 4,000,000 | | | | 4,000,000 | |
See accompanying notes to financial statements.
BHFTII-5
Brighthouse Funds Trust II
Van Eck Global Natural Resources Portfolio
Schedule of Investments as of December 31, 2018
Securities Lending Reinvestments (c)—(Continued)
| | | | | | | | |
| Security Description | | Principal
Amount* | | | Value | |
|
| Certificates of Deposit—(Continued) | |
Cooperative Rabobank UA
2.608%, 3M LIBOR + 0.200%, 04/05/19 (d) | | | 1,000,000 | | | $ | 1,000,314 | |
Credit Agricole S.A.
2.500%, 02/12/19 | | | 6,000,000 | | | | 5,998,980 | |
Credit Industriel et Commercial
Zero Coupon, 01/25/19 | | | 6,342,941 | | | | 6,414,077 | |
Industrial & Commercial Bank of China, Ltd.
2.850%, 02/15/19 | | | 2,000,000 | | | | 1,999,852 | |
Mitsubishi UFJ Trust and Banking Corp.
| |
Zero Coupon, 01/15/19 | | | 1,984,975 | | | | 1,997,960 | |
Mizuho Bank, Ltd., New York
2.649%, 1M LIBOR + 0.300%, 05/01/19 (d) | | | 2,000,000 | | | | 2,000,012 | |
Natixis New York | |
2.731%, 3M LIBOR + 0.190%, 02/01/19 (d) | | | 2,500,000 | | | | 2,499,440 | |
2.810%, 1M LIBOR + 0.370%, 02/14/19 (d) | | | 3,000,000 | | | | 3,000,561 | |
Royal Bank of Canada New York | |
2.650%, 1M LIBOR + 0.250%, 01/11/19 (d) | | | 5,500,000 | | | | 5,500,044 | |
2.665%, 1M LIBOR + 0.210%, 09/17/19 (d) | | | 5,000,000 | | | | 4,994,885 | |
Skandinaviska Enskilda Banken
2.645%, 1M LIBOR + 0.190%, 04/17/19 (d) | | | 6,000,000 | | | | 5,999,508 | |
Societe Generale
2.719%, 3M LIBOR + 0.160%, 05/07/19 (d) | | | 2,000,000 | | | | 1,999,112 | |
Standard Chartered plc
2.686%, 1M LIBOR + 0.180%, 02/25/19 (d) | | | 7,000,000 | | | | 6,999,797 | |
State Street Bank and Trust
2.725%, 1M LIBOR + 0.270%, 05/15/19 (d) | | | 5,000,000 | | | | 4,999,900 | |
Sumitomo Mitsui Banking Corp.
2.590%, 1M LIBOR + 0.190%, 04/11/19 (d) | | | 6,000,000 | | | | 5,997,798 | |
Sumitomo Mitsui Banking Corp., New York | |
2.559%, 1M LIBOR + 0.180%, 03/05/19 (d) | | | 2,000,000 | | | | 1,999,526 | |
2.665%, 1M LIBOR + 0.210%, 05/17/19 (d) | | | 4,000,000 | | | | 3,998,320 | |
Svenska Handelsbanken AB | |
2.620%, 3M LIBOR + 0.100%, 04/30/19 (d) | | | 1,500,000 | | | | 1,499,933 | |
2.822%, 1M LIBOR + 0.300%, 10/31/19 (d) | | | 2,000,000 | | | | 1,999,532 | |
Toronto-Dominion Bank
2.665%, 1M LIBOR + 0.210%, 09/17/19 (d) | | | 2,000,000 | | | | 1,998,096 | |
U.S. Bank N.A.
2.764%, 1M LIBOR + 0.260%, 07/23/19 (d) | | | 1,000,000 | | | | 1,000,000 | |
Wells Fargo Bank N.A. | |
2.560%, 3M LIBOR + 0.140%, 07/11/19 (d) | | | 8,500,000 | | | | 8,507,373 | |
2.730%, 3M LIBOR + 0.210%, 10/25/19 (d) | | | 3,000,000 | | | | 3,000,000 | |
Westpac Banking Corp.
2.850%, FEDEFF PRV + 0.450%, 02/15/19 (d) | | | 3,500,000 | | | | 3,499,978 | |
| | | | | | | | |
| | | | | | | 119,402,308 | |
| | | | | | | | |
|
| Commercial Paper—3.8% | |
Alpine Securities Ltd.
2.529%, 1M LIBOR + 0.180%, 04/03/19 (d) | | | 2,000,000 | | | | 1,999,446 | |
Banco Santander S.A.
2.740%, 02/07/19 | | | 2,978,993 | | | | 2,991,264 | |
Bank of China, Ltd.
2.690%, 01/17/19 | | | 4,966,375 | | | | 4,994,130 | |
ING Funding LLC
2.707%, 1M LIBOR + 0.320%, 02/08/19 (d) | | | 7,000,000 | | | | 7,000,651 | |
|
| Commercial Paper—(Continued) | |
Matchpoint Finance plc
2.890%, 05/08/19 | | | 2,956,409 | | | | 2,967,759 | |
Toronto-Dominion Bank
2.729%, 1M LIBOR + 0.350%, 11/05/19 (d) | | | 5,000,000 | | | | 4,999,450 | |
UBS AG
2.779%, 1M LIBOR + 0.430%, 02/01/19 (d) | | | 5,000,000 | | | | 5,001,225 | |
Westpac Banking Corp.
2.784%, 1M LIBOR + 0.280%, 05/24/19 (d) | | | 5,000,000 | | | | 4,999,800 | |
| | | | | | | | |
| | | | | | | 34,953,725 | |
| | | | | | | | |
|
| Repurchase Agreements—2.9% | |
Citadel Clearing LLC
Repurchase Agreement dated 12/31/18 at 3.000%, due on 04/02/19 with a maturity value of $10,076,667; collateralized by various Common Stock with an aggregate market value of $11,001,834. | | | 10,000,000 | | | | 10,000,000 | |
Citigroup Global Markets, Inc.
Repurchase Agreement dated 12/31/18 at 2.790%, due on 02/04/19 with a maturity value of $2,005,425; collateralized by U.S. Treasury Obligations at 0.000%, maturing 02/12/19, and various Common Stock with an aggregate market value of $2,176,637. | | | 2,000,000 | | | $ | 2,000,000 | |
Repurchase Agreement dated 12/31/18 at 2.940%, due on 04/02/19 with a maturity value of $1,007,513; collateralized by U.S. Treasury Obligations with rates ranging from 1.125% - 2.750%, maturity dates ranging from 01/31/19 - 08/15/24, and an aggregate market value of $1,020,000. | | | 1,000,000 | | | | 1,000,000 | |
Deutsche Bank Securities, Inc.
Repurchase Agreement dated 12/31/18 at 3.200%, due on 01/02/19 with a maturity value of $4,051,922; collateralized by U.S. Treasury Obligations at 0.000%, maturity dates ranging from 08/15/30 - 08/15/39, and an aggregate market value of $4,132,226. | | | 4,051,202 | | | | 4,051,202 | |
Merrill Lynch, Pierce, Fenner & Smith, Inc.
Repurchase Agreement dated 12/31/18 at 2.940%, due on 04/02/19 with a maturity value of $806,011; collateralized by various Common Stock with an aggregate market value of $880,000. | | | 800,000 | | | | 800,000 | |
Repurchase Agreement dated 12/31/18 at 2.940%, due on 04/02/19 with a maturity value of $4,030,053; collateralized by various Common Stock with an aggregate market value of $4,400,000. | | | 4,000,000 | | | | 4,000,000 | |
NBC Global Finance, Ltd.
Repurchase Agreement dated 12/31/18 at 2.560%, due on 01/02/19 with a maturity value of $5,000,711; collateralized by various Common Stock with an aggregate market value of $5,566,061. | | | 5,000,000 | | | | 5,000,000 | |
| | | | | | | | |
| | | | | | | 26,851,202 | |
| | | | | | | | |
Total Securities Lending Reinvestments
(Cost $181,219,929) | | | | | | | 181,207,235 | |
| | | | | | | | |
Total Investments—119.5%
(Cost $1,293,171,816) | | | | | | | 1,108,706,322 | |
Other assets and liabilities (net)—(19.5)% | | | | | | | (180,563,203 | ) |
| | | | | | | | |
| Net Assets—100.0% | | | | | | $ | 928,143,119 | |
| | | | | | | | |
See accompanying notes to financial statements.
BHFTII-6
Brighthouse Funds Trust II
Van Eck Global Natural Resources Portfolio
Schedule of Investments as of December 31, 2018
| | | | |
| * | | Principal amount stated in U.S. dollars unless otherwise noted. |
| (a) | | Non-income producing security. |
| (b) | | All or a portion of the security was held on loan. As of December 31, 2018, the market value of securities loaned was $179,368,198 and the collateral received consisted of cash in the amount of $181,080,895 andnon-cash collateral with a value of $1,373,206. The cash collateral investments are disclosed in the Schedule of Investments and categorized as Securities Lending Reinvestments. Thenon-cash collateral received consists of U.S. government securities that are held in safe-keeping by the lending agent, or a third-party custodian, cannot be sold or repledged by the Portfolio. As such, this collateral is excluded from the Statement of Assets and Liabilities. |
| (c) | | Represents investment of cash collateral received from securities on loan as of December 31, 2018. |
| (d) | | Variable or floating rate security. The stated rate represents the rate at December 31, 2018. Maturity date shown for callable securities reflects the earliest possible call date. For securities based on a published reference index and spread, the index and spread are indicated in the description above. For certain variable rate securities, the coupon rate is determined by the issuer/agent based on current market conditions. For certain asset- and mortgage-backed securities, the coupon rate may fluctuate based on changes of the underlying collateral or prepayments of principal. These securities do not indicate a reference index and spread in their description above. |
| (ADR)— | | American Depositary Receipt |
| (FEDEFF PRV)— | | Effective Federal Funds Rate |
| (LIBOR)— | | London Interbank Offered Rate |
| (SOFR)— | | Secured Overnight Financing Rate |
Fair Value Hierarchy
Accounting principles generally accepted in the United States of America (“GAAP”) define fair market value as the price that the Portfolio would receive to sell an asset or pay to transfer a liability in an orderly transaction between market participants at the measurement date. It establishes a fair value hierarchy that prioritizes inputs to valuation methods and requires disclosure of the fair value hierarchy, separately for each major category of assets and liabilities, that segregates fair value measurements into three levels. Levels 1, 2 and 3 of the fair value hierarchy are defined as follows:
Level 1 - unadjusted quoted prices in active markets for identical investments
Level 2 - other significant observable inputs (including, but not limited to, quoted prices for similar assets or liabilities in markets that are either active or inactive; inputs other than quoted prices that are observable such as interest rates, yield curves, volatilities, prepayment speeds, loss severities, credit risks, default rates, or other market corroborated inputs)
Level 3 - significant unobservable inputs based on the best information available in the circumstances, to the extent observable inputs are unavailable (including the Portfolio’s own assumptions used in determining the fair value of investments and derivative financial instruments)
The inputs or methodologies used for valuing investments are not necessarily an indication of the risk associated with investing in them. Changes to the inputs or methodologies used may result in transfers between levels. A reconciliation of Level 3 securities, if any, will be disclosed following the fair value hierarchy table. For more information about the Portfolio’s policy regarding the valuation of investments, please refer to the Notes to Financial Statements.
The following table summarizes the fair value hierarchy of the Portfolio’s investments as of December 31, 2018:
| | | | | | | | | | | | | | | | |
| Description | | Level 1 | | | Level 2 | | | Level 3 | | | Total | |
| Common Stocks | |
Chemicals | | $ | 70,299,552 | | | $ | — | | | $ | — | | | $ | 70,299,552 | |
Electrical Equipment | | | 8,387,478 | | | | — | | | | — | | | | 8,387,478 | |
Energy Equipment & Services | | | 64,933,872 | | | | — | | | | — | | | | 64,933,872 | |
Equity Real Estate Investment Trusts | | | 12,850,044 | | | | — | | | | — | | | | 12,850,044 | |
Food Products | | | 27,283,604 | | | | — | | | | — | | | | 27,283,604 | |
Independent Power and Renewable Electricity Producers | | | 5,167,240 | | | | — | | | | — | | | | 5,167,240 | |
Marine | | | 15,939,464 | | | | — | | | | — | | | | 15,939,464 | |
Metals & Mining | | | 266,040,160 | | | | 52,144,411 | | | | — | | | | 318,184,571 | |
Oil, Gas & Consumable Fuels | | | 337,146,747 | | | | — | | | | — | | | | 337,146,747 | |
Paper & Forest Products | | | 9,659,034 | | | | — | | | | — | | | | 9,659,034 | |
Semiconductors & Semiconductor Equipment | | | 12,832,560 | | | | — | | | | — | | | | 12,832,560 | |
Total Common Stocks | | | 830,539,755 | | | | 52,144,411 | | | | — | | | | 882,684,166 | |
Total Short-Term Investment* | | | 44,814,921 | | | | — | | | | — | | | | 44,814,921 | |
Total Securities Lending Reinvestments* | | | — | | | | 181,207,235 | | | | — | | | | 181,207,235 | |
Total Investments | | $ | 875,354,676 | | | $ | 233,351,646 | | | $ | — | | | $ | 1,108,706,322 | |
| | | | | | | | | | | | | | | | | |
Collateral for Securities Loaned (Liability) | | $ | — | | | $ | (181,080,895 | ) | | $ | — | | | $ | (181,080,895 | ) |
| | | | |
| * | | See Schedule of Investments for additional detailed categorizations. |
See accompanying notes to financial statements.
BHFTII-7
Brighthouse Funds Trust II
Van Eck Global Natural Resources Portfolio
Statement of Assets and Liabilities
December 31, 2018
| | | | |
Assets | |
Investments at value (a) (b) | | $ | 1,108,706,322 | |
Cash | | | 226,302 | |
Receivable for: | |
Fund shares sold | | | 242,077 | |
Dividends | | | 1,010,758 | |
Prepaid expenses | | | 3,508 | |
| | | | |
Total Assets | | | 1,110,188,967 | |
Liabilities | |
Collateral for securities loaned | | | 181,080,895 | |
Payables for: | |
Fund shares redeemed | | | 67,258 | |
Accrued Expenses: | |
Management fees | | | 626,816 | |
Distribution and service fees | | | 19,507 | |
Deferred trustees’ fees | | | 110,571 | |
Other expenses | | | 140,801 | |
| | | | |
Total Liabilities | | | 182,045,848 | |
| | | | |
Net Assets | | $ | 928,143,119 | |
| | | | |
Net Assets Consist of: | |
Paid in surplus | | $ | 1,405,833,308 | |
Distributable earnings (Accumulated losses) | | | (477,690,189 | ) |
| | | | |
Net Assets | | $ | 928,143,119 | |
| | | | |
Net Assets | |
Class A | | $ | 837,846,836 | |
Class B | | | 90,296,283 | |
Capital Shares Outstanding* | |
Class A | | | 109,018,898 | |
Class B | | | 11,844,024 | |
Net Asset Value, Offering Price and Redemption Price Per Share | |
Class A | | $ | 7.69 | |
Class B | | | 7.62 | |
| | | | |
| * | | The Portfolio is authorized to issue an unlimited number of shares. |
| (a) | | Identified cost of investments was $1,293,171,816. |
| (b) | | Includes securities loaned at value of $179,368,198. |
Statement of Operations
Year Ended December 31, 2018
| | | | |
Investment Income | |
Dividends (a) | | $ | 14,872,600 | |
Securities lending income | | | 1,058,372 | |
| | | | |
Total investment income | | | 15,930,972 | |
Expenses | |
Management fees | | | 8,748,613 | |
Administration fees | | | 43,633 | |
Custodian and accounting fees | | | 87,040 | |
Distribution and service fees—Class B | | | 288,128 | |
Audit and tax services | | | 54,287 | |
Legal | | | 45,317 | |
Trustees’ fees and expenses | | | 33,734 | |
Shareholder reporting | | | 39,550 | |
Insurance | | | 7,001 | |
Miscellaneous | | | 22,623 | |
| | | | |
Total expenses | | | 9,369,926 | |
Less management fee waiver | | | (124,002 | ) |
Less broker commission recapture | | | (16,260 | ) |
| | | | |
Net expenses | | | 9,229,664 | |
| | | | |
Net Investment Income | | | 6,701,308 | |
| | | | |
Net Realized and Unrealized Loss | |
| Net realized gain (loss) on: | |
Investments | | | (16,814,891 | ) |
Foreign currency transactions | | | 79,346 | |
| | | | |
Net realized loss | | | (16,735,545 | ) |
| | | | |
| Net change in unrealized appreciation (depreciation) on: | |
Investments | | | (357,973,840 | ) |
Foreign currency transactions | | | 344 | |
| | | | |
Net change in unrealized depreciation | | | (357,973,496 | ) |
| | | | |
Net realized and unrealized loss | | | (374,709,041 | ) |
| | | | |
Net Decrease in Net Assets From Operations | | $ | (368,007,733 | ) |
| | | | |
| | | | |
| (a) | | Net of foreign withholding taxes of $433,154. |
See accompanying notes to financial statements.
BHFTII-8
Brighthouse Funds Trust II
Van Eck Global Natural Resources Portfolio
Statements of Changes in Net Assets
| | | | | | | | |
| | | Year Ended
December 31,
2018 | | | Year Ended
December 31,
2017 | |
Increase (Decrease) in Net Assets: | |
From Operations | |
Net investment income | | $ | 6,701,308 | | | $ | 1,817,448 | |
Net realized loss | | | (16,735,545 | ) | | | (11,881,461 | ) |
Net change in unrealized appreciation (depreciation) | | | (357,973,496 | ) | | | 23,318,938 | |
| | | | | | | | |
Increase (decrease) in net assets from operations | | | (368,007,733 | ) | | | 13,254,925 | |
| | | | | | | | |
From Distributions to Shareholders (a) | |
Class A | | | (1,880,391 | ) | | | (973,863 | ) |
| | | | | | | | |
Total distributions | | | (1,880,391 | ) | | | (973,863 | ) |
| | | | | | | | |
Increase in net assets from capital share transactions | | | 171,892,775 | | | | 65,486,891 | |
| | | | | | | | |
Total increase (decrease) in net assets | | | (197,995,349 | ) | | | 77,767,953 | |
|
Net Assets | |
Beginning of period | | | 1,126,138,468 | | | | 1,048,370,515 | |
| | | | | | | | |
End of period | | $ | 928,143,119 | | | $ | 1,126,138,468 | (b) |
| | | | | | | | |
Other Information:
Capital Shares
Transactions in capital shares were as follows:
| | | | | | | | | | | | | | | | |
| | | Year Ended
December 31, 2018 | | | Year Ended
December 31, 2017 | |
| | | Shares | | | Value | | | Shares | | | Value | |
Class A | |
Sales | | | 23,910,325 | | | $ | 256,984,733 | | | | 16,577,609 | | | $ | 159,198,096 | |
Reinvestments | | | 172,989 | | | | 1,880,391 | | | | 108,448 | | | | 973,863 | |
Redemptions | | | (7,021,786 | ) | | | (77,293,969 | ) | | | (9,125,652 | ) | | | (96,618,555 | ) |
| | | | | | | | | | | | | | | | |
Net increase | | | 17,061,528 | | | $ | 181,571,155 | | | | 7,560,405 | | | $ | 63,553,404 | |
| | | | | | | | | | | | | | | | |
Class B | |
Sales | | | 1,564,092 | | | $ | 14,328,102 | | | | 2,671,393 | | | $ | 25,673,875 | |
Redemptions | | | (2,277,179 | ) | | | (24,006,482 | ) | | | (2,365,074 | ) | | | (23,740,388 | ) |
| | | | | | | | | | | | | | | | |
Net increase (decrease) | | | (713,087 | ) | | $ | (9,678,380 | ) | | | 306,319 | | | $ | 1,933,487 | |
| | | | | | | | | | | | | | | | |
Increase derived from capital shares transactions | | | | | | $ | 171,892,775 | | | | | | | $ | 65,486,891 | |
| | | | | | | | | | | | | | | | |
| | | | |
| (a) | | Distributions from net investment income and realized gains are no longer required to be separately disclosed. The presentation for the year ended December 31, 2018 has been adjusted for this change (See Note 8). At December 31, 2017 the distributions were from net investment income. |
| (b) | | As part of the update in (a), it is also no longer required to disclose the Undistributed net investment income (Accumulated losses) which was $1,429,586 as of December 31, 2017. |
See accompanying notes to financial statements.
BHFTII-9
Brighthouse Funds Trust II
Van Eck Global Natural Resources Portfolio
Financial Highlights
| | | | | | | | | | | | | | | | | | | | |
| Selected per share data | |
| | | Class A | |
| | | Year Ended December 31, | |
| | | 2018 | | | 2017 | | | 2016 | | | 2015 | | | 2014 | |
Net Asset Value, Beginning of Period | | $ | 10.78 | | | $ | 10.86 | | | $ | 7.59 | | | $ | 11.32 | | | $ | 14.21 | |
| | | | | | | | | | | | | | | | | | | | |
Income (Loss) from Investment Operations | |
Net investment income (a) | | | 0.06 | | | | 0.02 | | | | 0.01 | | | | 0.08 | | | | 0.08 | |
Net realized and unrealized gain (loss) | | | (3.13 | ) | | | (0.09 | ) | | | 3.34 | | | | (3.76 | ) | | | (2.66 | ) |
| | | | | | | | | | | | | | | | | | | | |
Total income (loss) from investment operations | | | (3.07 | ) | | | (0.07 | ) | | | 3.35 | | | | (3.68 | ) | | | (2.58 | ) |
| | | | | | | | | | | | | | | | | | | | |
Less Distributions | |
Distributions from net investment income | | | (0.02 | ) | | | (0.01 | ) | | | (0.08 | ) | | | (0.05 | ) | | | (0.08 | ) |
Distributions from net realized capital gains | | | 0.00 | | | | 0.00 | | | | 0.00 | | | | 0.00 | | | | (0.23 | ) |
| | | | | | | | | | | | | | | | | | | | |
Total distributions | | | (0.02 | ) | | | (0.01 | ) | | | (0.08 | ) | | | (0.05 | ) | | | (0.31 | ) |
| | | | | | | | | | | | | | | | | | | | |
Net Asset Value, End of Period | | $ | 7.69 | | | $ | 10.78 | | | $ | 10.86 | | | $ | 7.59 | | | $ | 11.32 | |
| | | | | | | | | | | | | | | | | | | | |
Total Return (%) (b) | | | (28.64 | ) | | | (0.62 | ) | | | 44.26 | | | | (32.64 | ) | | | (18.63 | ) |
|
Ratios/Supplemental Data | |
Gross ratio of expenses to average net assets (%) | | | 0.81 | | | | 0.81 | | | | 0.81 | | | | 0.81 | | | | 0.81 | |
Net ratio of expenses to average net assets (%) (c) | | | 0.80 | | | | 0.80 | | | | 0.80 | | | | 0.80 | | | | 0.80 | |
Ratio of net investment income to average net assets (%) | | | 0.62 | | | | 0.21 | | | | 0.14 | | | | 0.82 | | | | 0.56 | |
Portfolio turnover rate (%) | | | 24 | | | | 23 | | | | 49 | | | | 25 | | | | 39 | |
Net assets, end of period (in millions) | | $ | 837.8 | | | $ | 991.7 | | | $ | 916.2 | | | $ | 752.1 | | | $ | 841.0 | |
| |
| | | Class B | |
| | | Year Ended December 31, | |
| | | 2018 | | | 2017 | | | 2016 | | | 2015 | | | 2014 | |
Net Asset Value, Beginning of Period | | $ | 10.71 | | | $ | 10.79 | | | $ | 7.55 | | | $ | 11.25 | | | $ | 14.12 | |
| | | | | | | | | | | | | | | | | | | | |
Income (Loss) from Investment Operations | |
Net investment income (loss) (a) | | | 0.04 | | | | (0.01 | ) | | | (0.01 | ) | | | 0.06 | | | | 0.04 | |
Net realized and unrealized gain (loss) | | | (3.13 | ) | | | (0.07 | ) | | | 3.31 | | | | (3.74 | ) | | | (2.64 | ) |
| | | | | | | | | | | | | | | | | | | | |
Total income (loss) from investment operations | | | (3.09 | ) | | | (0.08 | ) | | | 3.30 | | | | (3.68 | ) | | | (2.60 | ) |
| | | | | | | | | | | | | | | | | | | | |
Less Distributions | |
Distributions from net investment income | | | 0.00 | | | | 0.00 | | | | (0.06 | ) | | | (0.02 | ) | | | (0.04 | ) |
Distributions from net realized capital gains | | | 0.00 | | | | 0.00 | | | | 0.00 | | | | 0.00 | | | | (0.23 | ) |
| | | | | | | | | | | | | | | | | | | | |
Total distributions | | | 0.00 | | | | 0.00 | | | | (0.06 | ) | | | (0.02 | ) | | | (0.27 | ) |
| | | | | | | | | | | | | | | | | | | | |
Net Asset Value, End of Period | | $ | 7.62 | | | $ | 10.71 | | | $ | 10.79 | | | $ | 7.55 | | | $ | 11.25 | |
| | | | | | | | | | | | | | | | | | | | |
Total Return (%) (b) | | | (28.85 | ) | | | (0.74 | ) | | | 43.74 | | | | (32.76 | ) | | | (18.82 | ) |
|
Ratios/Supplemental Data | |
Gross ratio of expenses to average net assets (%) | | | 1.06 | | | | 1.06 | | | | 1.06 | | | | 1.06 | | | | 1.06 | |
Net ratio of expenses to average net assets (%) (c) | | | 1.05 | | | | 1.05 | | | | 1.05 | | | | 1.05 | | | | 1.05 | |
Ratio of net investment income (loss) to average net assets (%) | | | 0.36 | | | | (0.05 | ) | | | (0.12 | ) | | | 0.56 | | | | 0.31 | |
Portfolio turnover rate (%) | | | 24 | | | | 23 | | | | 49 | | | | 25 | | | | 39 | |
Net assets, end of period (in millions) | | $ | 90.3 | | | $ | 134.4 | | | $ | 132.2 | | | $ | 114.2 | | | $ | 135.3 | |
| | | | |
| (a) | | Per share amounts based on average shares outstanding during the period. |
| (b) | | Total return does not reflect any insurance, sales, separate account or administrative charges of variable annuity or life insurance contracts or any additional expenses that contract owners may bear under their variable contracts. If these charges were included, the returns would be lower. |
| (c) | | Includes the effects of management fee waivers (see Note 5 of the Notes to Financial Statements). |
See accompanying notes to financial statements.
BHFTII-10
Brighthouse Funds Trust II
Van Eck Global Natural Resources Portfolio
Notes to Financial Statements—December 31, 2018
1. Organization
Brighthouse Funds Trust II (the “Trust”) is organized as a Delaware statutory trust and registered under the Investment Company Act of 1940, as amended (the “1940 Act”), as anopen-end management investment company. The Trust, which is managed by Brighthouse Investment Advisers, LLC (“Brighthouse Investment Advisers” or the “Adviser”), currently offers twenty-nine series, each of which operates as a distinct investment vehicle of the Trust. The series included in this report is Van Eck Global Natural Resources Portfolio (the “Portfolio”), which is diversified. Shares in the Portfolio are not offered directly to the general public and are currently available only to separate accounts established by life insurance companies affiliated with the Adviser and Metropolitan Life Insurance Company (the “Insurance Companies”).
The Portfolio has registered and offers two classes of shares: Class A and B shares. Shares of each Class of the Portfolio represent an equal pro rata interest in the Portfolio and generally give the shareholder the same voting, dividend, liquidation, and other rights. Investment income, realized and unrealized capital gains and losses, the common expenses of the Portfolio, and certain Portfolio-level expense reductions, if any, are allocated on a pro rata basis to each Class based on the relative net assets of each Class to the net assets of the Portfolio. Each Class of shares differs in its respective distribution plan and such distribution expenses are allocated to the corresponding Class of shares.
2. Significant Accounting Policies
The preparation of financial statements in conformity with accounting principles generally accepted in the United States of America (“GAAP”) requires management to make estimates and assumptions that affect the reported amounts of assets and liabilities and disclosure of contingent assets and liabilities as of the date of the financial statements and the reported amounts of income and expenses during the reporting period. Actual results could differ from those estimates. In the preparation of these financial statements, management has evaluated events and transactions subsequent to December 31, 2018 through the date the financial statements were issued.
The Portfolio is an investment company and follows the accounting and reporting guidance of the Financial Accounting Standards Board (“FASB”) Accounting Standards Codification Topic 946—Financial Services—Investment Companies. The following is a summary of significant accounting policies consistently followed by the Portfolio in the preparation of its financial statements.
Investment Valuation and Fair Value Measurements - The Portfolio values its portfolio investments for purposes of calculating its net asset value (“NAV”) using procedures approved by the Board of Trustees of the Trust (the “Board” or “Trustees”). Those procedures allow for a variety of methodologies to be used to value the Portfolio’s investments. The specific methodologies used for a particular investment may vary based on the market data available for a specific investment at the time the Portfolio calculates its NAV or based on other considerations. The procedures also permit a level of judgment to be used in the valuation process. The Portfolio follows the accounting and reporting guidance of FASB Accounting Standards Codification Topic 820—Fair Value Measurement.
Domestic and foreign equity securities, such as common stock, exchange-traded funds, rights, warrants, and preferred stock, that are traded on a securities exchange on a valuation date are generally valued at their last quoted sale price or official closing price on the primary exchange for such security, or, if no sales occurred on that day, at the last reported bid price. Equity securities tradedover-the-counter (“OTC”) are generally valued at the last reported bid price. In the event of a major exchange closing during the trading day, the Adviser may use other market information obtained from quotation reporting systems, established market makers, or pricing services in valuing the securities. Valuation adjustments may be applied to certain foreign equity securities that are traded solely on foreign exchanges that close before the time as of which the Portfolio determines its NAV to account for the market movement between the close of the foreign exchanges and the time as of which the Portfolio determines its NAV. The Portfolio may use a systematic fair valuation model provided by a pricing service to value securities principally traded in these foreign markets in order to adjust for possible market movements or other changes that may occur between the close of the foreign exchanges and the time as of which the Portfolio determines its NAV. Foreign equity securities valued using these valuation adjustments are generally categorized as Level 2 within the fair value hierarchy. Equity securities that are actively traded, and have no valuation adjustments applied, are categorized as Level 1 within the fair value hierarchy. Other equity securities traded on inactive markets, or valued in reference to similar instruments traded on active markets, are generally categorized as Level 2 within the fair value hierarchy.
Investments in registeredopen-end management investment companies are valued at reported NAV per share on the valuation date and are categorized as Level 1 within the fair value hierarchy.
Debt securities, including corporate, convertible and municipal bonds and notes; obligations of the U.S. Treasury and U.S. government agencies; foreign sovereign issues; andnon-U.S. bonds, are generally valued on the basis of evaluated or composite bid quotations obtained from independent pricing services and/or brokers and dealers selected by the Adviser (each a “pricing service”), pursuant to the authorization of and subject to general oversight by the Board. Such pricing services may use matrix pricing, which considers observable inputs including, among other things, issuer details, maturity dates, interest rates, yield curves, rates of prepayment, credit risks/spreads, default rates, reported trades, broker-dealer quotes and quoted prices for similar assets. Short-term obligations with a
BHFTII-11
Brighthouse Funds Trust II
Van Eck Global Natural Resources Portfolio
Notes to Financial Statements—December 31, 2018—(Continued)
remaining maturity of sixty days or less may be valued at amortized cost in the absence of market quotes, so long as the amortized cost value of such short-term debt instrument is approximately the same as the fair value of the instrument as determined without the use of amortized cost valuation. Floating rate loans are generally valued on the basis of an evaluated or composite average of aggregate bid and ask quotations supplied by brokers or dealers, as obtained from the pricing service. Securities that use similar valuation techniques and inputs as described above are generally categorized as Level 2 within the fair value hierarchy.
Options, whether on securities, indices, futures contracts, or otherwise, traded on exchanges are valued at the last sale price available as of the close of business on a valuation day or, if there is no such price available, at the last reported bid price. These types of options are categorized as Level 1 within the fair value hierarchy. Futures contracts that are traded on commodity exchanges are valued at their settlement prices established by the exchanges on which they are traded as of the close of such exchanges and are categorized as Level 1 within the fair value hierarchy.
If no current market value quotation or other observable inputs are readily available or market value quotations are deemed to be unreliable for an investment, the fair value of the investment will be determined in accordance with procedures approved by, and under the general supervision of, the Board. In such a circumstance, the Board will be assisted in its responsibility to determine the fair value of an investment by the Valuation Committee (“Committee”) of Brighthouse Investment Advisers. The Committee provides general pricing oversight and fair value pricing determinations related to portfolio securities and meets on a regular basis to review reports relating to the valuation of the securities in the Portfolio. The Board has delegated to State Street Bank and Trust Company, the Trust’s custodian (“Custodian”), the responsibility for calculating the NAVs of the Trust’s Portfolios. The Committee is responsible for overseeing the calculation of the NAVs of the Portfolios by the custodian. The Committee also periodically reviews pricing services, including the pricing services providing fair value pricing for the Portfolio’s foreign securities, and is responsible for overseeing the correction of pricing errors and addressing other pricing issues that arise in the ordinary course of business, such as making real-time fair value determinations, as necessary.
No single standard for determining the fair value of an investment can be set forth because fair value depends upon the facts and circumstances with respect to each investment. Information relating to any relevant factors may be obtained by the Committee from any appropriate source, including the subadviser of the Portfolio, the custodian, a pricing service, market maker and/or broker for such security or the issuer. Appropriate methodologies for determining fair value under particular circumstances may include: matrix pricing, a discounted cash flow analysis, comparisons of securities with comparable characteristics, value based on multiples of earnings, discount from market price of similar marketable securities, or a combination of these and other methods.
Investment Transactions and Related Investment Income - Portfolio security transactions are recorded on the trade date. Dividend income is recorded on theex-dividend date or, for certain foreign securities, when notified. Interest income, which includes amortization of premium and accretion of discount on debt securities, is recorded on the accrual basis. Realized gains and losses on investments are determined on the identified cost basis, which is the same basis used for federal income tax purposes. Foreign income and foreign capital gains on some foreign securities may be subject to foreign taxes, which are accrued as applicable. These foreign taxes have been provided for in accordance with the Portfolio’s understanding of the applicable countries’ tax rules and rates.
Foreign Currency Translation -The books and records of the Portfolio are maintained in U.S. dollars. The values of securities, currencies, and other assets and liabilities denominated in currencies other than the U.S. dollar are translated into U.S. dollars based upon foreign exchange rates prevailing at the end of the period. Purchases and sales of investment securities, income, and expenses are translated on the respective dates of such transactions. Because the values of investment securities are translated at the foreign exchange rates prevailing at the end of the period, that portion of the results of operations arising from changes in exchange rates and that portion of the results of operations reflecting fluctuations arising from changes in market prices of the investment securities are not separated. Such fluctuations are included in the net realized and unrealized gain or loss on investments.
Net realized foreign exchange gains or losses arise from activity in forward foreign currency exchange contracts, sales of foreign currency, currency gains or losses realized between the trade and settlement dates on securities transactions, and the difference between the amounts of dividends, interest, and foreign withholding taxes recorded by the Portfolio and the U.S. dollar-equivalent of the amounts actually received or paid by the Portfolio. Net unrealized foreign exchange gains and losses arise from changes in the value of assets and liabilities, other than investment securities, resulting from changes in foreign exchange rates.
Dividends and Distributions to Shareholders -The Portfolio records dividends and distributions on theex-dividend date. Net realized gains from securities transactions (if any) are generally distributed annually to shareholders. The timing and characterization of certain income and capital gains distributions are determined in accordance with federal tax regulations that may differ from GAAP. Permanent book and tax basis differences relating to shareholder distributions will result in reclassification between distributable earnings (accumulated losses) andpaid-in surplus. These adjustments have no impact on net assets or the results of operations.
Income Taxes -It is the Portfolio’s policy to comply with the requirements of the Internal Revenue Code of 1986, as amended, and regulations thereunder, applicable to regulated investment companies, and to distribute, with respect to each taxable year, all of its taxable income to shareholders. Therefore, no federal income tax provision is required. The Portfolio files U.S. federal tax returns. No
BHFTII-12
Brighthouse Funds Trust II
Van Eck Global Natural Resources Portfolio
Notes to Financial Statements—December 31, 2018—(Continued)
income tax returns are currently under examination. The Portfolio’s federal tax returns for the prior three fiscal years remain subject to examination by the Internal Revenue Service. As of December 31, 2018, the Portfolio had no uncertain tax positions that would require financial statement recognition, or derecognition or disclosure.
Directed Brokerage Agreement -The Trust has entered into a directed brokerage arrangement with Capital Institutional Services, Inc. (“CAPIS”). Under this arrangement, the Portfolio directs certain trades to CAPIS in return for a recapture credit. CAPIS issues a cash rebate to the Portfolio. Amounts paid to the Portfolio are shown separately as broker commission recapture on the Statement of Operations of the Portfolio. Additionally, these amounts have been excluded from the calculation of the net ratio of expenses to average net assets presented in the Financial Highlights for each share class.
Repurchase Agreements -The Portfolio may enter into repurchase agreements, under the terms of a Master Repurchase Agreement (“MRA”), with selected commercial banks and broker-dealers, under which the Portfolio acquires securities as collateral and agrees to resell the securities at an agreed-upon time and at an agreed-upon price. The Portfolio, through the Custodian or a subcustodian, under atri-party repurchase agreement, receives delivery of the underlying securities collateralizing any repurchase agreements. It is the Portfolio’s policy that the market value of the collateral be equal to at least 100% of the repurchase price in the case of a repurchase agreement ofone-day duration and equal to at least 102% of the repurchase price in the case of all other repurchase agreements. In the event of default or failure by a party to perform an obligation in connection with any repurchase transaction, the MRA gives thenon-defaulting party the right toset-off claims and to apply property held by it in connection with any repurchase transaction against obligations owed to it.
At December 31, 2018, the Portfolio invested cash collateral for loans of portfolio securities in repurchase agreements with a gross value of $26,851,202. The combined value of all repurchase agreements is included as part of investments at value on the Statement of Assets and Liabilities. The value of the related collateral exceeded the value of the repurchase agreements at December 31, 2018.
Securities Lending - The Portfolio may lend its portfolio securities to certain qualified brokers who borrow securities in order to complete certain securities transactions. By lending its portfolio securities, the Portfolio attempts to increase its net investment income through the receipt of income on collateral held from securities on loan. Any gain or loss in the market price of the loaned securities that might occur and any interest earned or dividends declared during the term of the loan would accrue to the account of the Portfolio.
The Trust has entered into aNon-Custodial Securities Lending Agreement with JPMorgan Chase Bank, N.A. (the “Lending Agent”). Under the agreement, the Lending Agent is authorized to loan portfolio securities on the Portfolio’s behalf. In exchange, the Portfolio receives either cash or U.S. government securities as collateral against the loaned securities. The Portfolio receives collateral equal to at least 102% of the market value for loans secured by government securities or cash in the same currency as the loaned shares and 105% for all other loaned securities at each loan’s inception. Collateral representing at least 100% of the market value of the loaned securities is maintained for the duration of the loan. Any cash collateral received by the Portfolio is generally invested by the Lending Agent in short-term investments, which may include certificates of deposit, commercial paper, repurchase agreements, time deposits, master demand notes and money market funds. The market value of investments made with cash collateral received are disclosed in the Schedule of Investments and the valuation techniques are described in Note 2. If the market value of the collateral at the close of trading on a business day is less than 100% of the market value of the loaned securities at the close of trading on that day, the borrower is required to deliver, by the close of business on the following business day, an additional amount of collateral, so that the total amount of posted collateral is equal to at least 100% of the market value of all the loaned securities as of such preceding day. A portion of the income earned on the collateral is rebated to the borrower of the securities and the remainder is split between the Lending Agent and the Portfolio. On loans collateralized by U.S. government securities, a fee is received from the borrower and is allocated between the Portfolio and the Lending Agent.
Income received by the Portfolio in securities lending transactions during the year ended December 31, 2018 is reflected as securities lending income on the Statement of Operations. The values of any securities loaned by the Portfolio and the related collateral at December 31, 2018 are disclosed in the footnotes to the Schedule of Investments. The value of the related collateral received by the Portfolio exceeded the value of the securities out on loan at December 31, 2018.
The risks associated with lending portfolio securities include, but are not limited to, possible delays in receiving additional collateral or in the recovery of the loaned securities, possible loss of rights in the collateral should the borrower fail financially, as well as risk of loss in the value of the collateral or the value of the investments made with the collateral. The Lending Agent shall indemnify the Portfolio in the case of default of any securities borrower, subject to the terms of theNon-Custodial Securities Lending Agreement.
All securities on loan are classified as Common Stocks in the Portfolio’s Schedule of Investments as of December 31, 2018, with a contractual maturity of overnight and continuous.
BHFTII-13
Brighthouse Funds Trust II
Van Eck Global Natural Resources Portfolio
Notes to Financial Statements—December 31, 2018—(Continued)
3. Certain Risks
In the normal course of business, the Portfolio invests in securities and enters into transactions where risks exist. Those risks include:
Market Risk:The value of securities held by the Portfolio may decline in response to certain events, including those directly involving the issuers whose securities are owned by the Portfolio; conditions affecting the general economy; overall market changes; local, regional or global political, social or economic instability; and currency, interest rate, and price fluctuations.
Credit and Counterparty Risk: The Portfolio may be exposed to counterparty risk, or the risk that an entity with which the Portfolio has unsettled or open transactions may default. The potential loss could exceed the value of the financial assets and liabilities recorded in the financial statements. Financial assets that potentially expose the Portfolio to credit and counterparty risk consist principally of cash due from counterparties and investments. The Portfolio manages counterparty risk by entering into agreements only with counterparties that it believes have the financial resources to honor their obligations and by monitoring the financial stability of those counterparties. The Adviser attempts to mitigate counterparty risk by (i) periodically assessing the creditworthiness of its trading partners, (ii) monitoring and/or limiting the amount of its net exposure to each individual counterparty based on its assessment, and (iii) requiring collateral from the counterparty for certain transactions. In order to preserve certain safeguards fornon-standard settlement trades, the Portfolio restricts its exposure to credit and counterparty losses by entering into master netting agreements (“Master Agreements”) with counterparties (approved brokers) with whom it undertakes a significant volume of transactions. Master Agreements govern the terms of certain transactions, and reduce the counterparty risk associated with relevant transactions by specifying credit protection mechanisms and providing standardization that improves legal certainty. Master Agreements can also help limit counterparty risk by specifying collateral posting arrangements atpre-arranged exposure levels.
Repurchase and reverse repurchase agreements are primarily executed under Global Master Repurchase Agreements (“GMRAs”) or Master Repurchase Agreements (“MRAs”), which provide the rights toset-off. Each repurchase and reverse repurchase agreement is initially collateralized at the transaction level. In the event of default, the total market value exposure will be offset against collateral exchanged to date, which would result in a net receivable/(payable) that would be due from/to the counterparty.
Natural Resource and Foreign Investment Risk:The Portfolio may concentrate its investments in companies which are significantly engaged in the exploration, development, production and distribution of gold and other natural resources such as strategic and other metals, minerals, forest products, oil, natural gas and coal and by investing in gold bullion and coins. Since the Portfolio may concentrate its investments, it may be subject to greater risks and market fluctuations than other more diversified portfolios. The production and marketing of gold and other natural resources may be affected by actions and changes in governments. In addition, gold and natural resources may be cyclical in nature. In addition, the investments by the Portfolio in foreign securities may involve risks not present in domestic investments. Since securities may be denominated in foreign currencies, may require settlement in foreign currencies and pay interest or dividends in foreign currencies, changes in the relationship of these foreign currencies to the U.S. dollar can significantly affect the value of the investments and earnings of the Portfolio. Foreign investments may also subject the Portfolio to foreign government exchange restrictions, expropriation, taxation or other political, social or economic developments, all of which could affect the market and/or credit risk of the investments. In addition to the risks described above, risks may arise from forward foreign currency contracts with respect to the potential inability of counterparties to meet the terms of their contracts.
Additional risks associated with each type of investment are described above within the respective security type notes. The Portfolio’s prospectus includes a discussion of the principal risks of investing in the Portfolio.
4. Investment Transactions
Aggregate cost of purchases and proceeds of sales of investment securities, excluding short-term securities, for the year ended December 31, 2018 were as follows:
| | | | | | | | | | | | |
Purchases | | | Sales | |
U.S. Government | | Non-U.S. Government | | | U.S. Government | | | Non-U.S. Government | |
| $0 | | $ | 400,103,797 | | | $ | 0 | | | $ | 257,759,139 | |
During the year ended December 31, 2018, the Portfolio engaged in security transactions with other affiliated portfolios. These amounted to $8,668,014 in purchases of investments, which are included above.
BHFTII-14
Brighthouse Funds Trust II
Van Eck Global Natural Resources Portfolio
Notes to Financial Statements—December 31, 2018—(Continued)
5. Investment Management Fees and Other Transactions with Affiliates
Investment Management Agreement -Brighthouse Investment Advisers is the investment adviser to the Portfolio. The Trust has entered into an investment management agreement with Brighthouse Investment Advisers with respect to the Portfolio. For providing investment management services to the Portfolio, Brighthouse Investment Advisers receives monthly compensation at the following annual rates:
| | | | | | |
Management
Fees earned by
Brighthouse
Investment Advisers
for the year ended
December 31, 2018 | | % per annum | | | Average Daily Net Assets |
| $8,748,613 | | | 0.800 | % | | Of the first $250 million |
| | | 0.775 | % | | Of the next $750 million |
| | | 0.750 | % | | On amounts in excess of $1 billion |
Certain officers and trustees of the Trust may also be officers of Brighthouse Investment Advisers; however, such officers and trustees receive no compensation from the Trust.
Brighthouse Investment Advisers has entered into an investment subadvisory agreement with respect to managing the Portfolio. Van Eck Associates Corporation (the “Subadviser”) is compensated by Brighthouse Investment Advisers to provide subadvisory services for the Portfolio.
Management Fee Waiver - Pursuant to a management fee waiver agreement, the Adviser has agreed, for the period April 30, 2018 to April 30, 2019, to reduce its advisory fees set out above under “Investment Management Agreement” for each class of the Portfolio as follows:
| | | | |
% per annum | | Average Daily Net Assets | |
| 0.025% | | | On amounts over $500 million and under $1 billion | |
An identical agreement was in place for the period May 1, 2017 to April 30, 2018. Amounts waived for the year ended December 31, 2018 are shown as a management fee waiver in the Statement of Operations.
Transfer Agency Agreement -Brighthouse Financial, Inc. serves as the transfer agent for the Trust. Brighthouse Financial, Inc. receives no fees for its services to the Trust.
Distribution and Service Fees -The Trust has a distribution agreement with Brighthouse Securities, LLC (the “Distributor”) pursuant to which the Distributor serves as the general distributor of shares of each class (each a “Class”) of each Portfolio. The Distributor is an affiliate of the Trust. The Trust has adopted a Distribution and Services Plan (the “Plan”) relating to Class B shares of each Portfolio, under Rule 12b-1 under the 1940 Act, pursuant to which the Trust may pay the Distributor a fee (the “Service Fee”) at an annual rate not to exceed 0.25% of each such Portfolio’s average daily net assets attributable to the Class B shares of the Trust. Each Portfolio may not offer shares of each Class. The Plan also authorizes the Trust, on behalf of each of its Portfolios, may pay the Distributor a distribution Fee (the “Distribution Fee” and together with the Service Fee, the “Fees”) at an annual rate of up to 0.25% of each Portfolio’s average daily net assets attributable to the Class B in consideration of the services rendered in connection with the sale of such shares by the Distributor. Under the Distribution Agreement with respect to the Trust, Fees are currently paid at an annual rate of 0.25% of average daily net assets in the case of Class B shares. The Plan is known as a “compensation plan” because the Trust makes payments to the Distributor for services rendered regardless of the actual level of expenditures by the Distributor. Amounts incurred by the Portfolio for the year ended December 31, 2018 are shown as Distribution and service fees in the Statement of Operations.
Deferred Trustee Compensation -Each Trustee who is not currently an employee of the Adviser or any of its affiliates receives compensation from the Trust for his or her service to the Trust. A deferred compensation plan (the “Plan”) is available to the Trustees on a voluntary basis. Deferred amounts remain in the Trust until distributed in accordance with the provisions of the Plan. The value of a participating Trustee’s deferral account is based on theoretical investments of deferred amounts on the normal payment dates in certain portfolios of the Trust or Brighthouse Funds Trust I, an affiliate of the Trust, as designated by the participating Trustee. Changes in the value of participants’ deferral accounts are reflected as Trustees’ fees and expenses in the Statement of Operations. The portion of the accrued obligations allocated to the Portfolio under the Plan is reflected as Deferred trustees’ fees in the Statement of Assets and Liabilities.
6. Contractual Obligations
Under the Trust’s organizational documents, its officers and Trustees may be indemnified against certain liabilities and expenses arising out of the performance of their duties to the Trust. Additionally, the Trust has a variety of indemnification obligations under contracts with its service providers. The Trust’s maximum exposure under these arrangements is unknown, as this would involve future claims that may be made against the Trust that have not yet occurred.
BHFTII-15
Brighthouse Funds Trust II
Van Eck Global Natural Resources Portfolio
Notes to Financial Statements—December 31, 2018—(Continued)
7. Income Tax Information
The cost basis of investments for federal income tax purposes at December 31, 2018 was as follows:
| | | | |
Cost basis of investments | | $ | 1,302,134,318 | |
Gross unrealized appreciation | | | 39,550,530 | |
Gross unrealized depreciation | | | (232,978,526 | ) |
| | | | |
Net unrealized appreciation (depreciation) | | $ | (193,427,996 | ) |
| | | | |
The tax character of distributions paid for the years ended December 31, 2018 and 2017 were as follows:
| | | | | | | | | | | | | | | | | | | | |
Ordinary Income | | | Long-Term Capital Gain | | | Total | |
2018 | | 2017 | | | 2018 | | | 2017 | | | 2018 | | | 2017 | |
| $1,880,391 | | $ | 973,863 | | | $ | — | | | $ | — | | | $ | 1,880,391 | | | $ | 973,863 | |
As of December 31, 2018, the components of distributable earnings (accumulated losses) on a federal income tax basis were as follows:
| | | | | | | | | | | | | | | | |
Undistributed
Ordinary
Income | | Undistributed
Long-Term
Capital Gain | | | Net
Unrealized
Depreciation | | | Accumulated
Capital
Losses | | | Total | |
| $6,407,032 | | $ | — | | | $ | (193,427,996 | ) | | $ | (290,558,537 | ) | | $ | (477,579,501 | ) |
The Portfolio utilizes the provisions of the federal income tax laws that provide for the carryforward of capital losses for prior years, offsetting such losses against any future realized capital gains. Under the Regulated Investment Company Modernization Act of 2010, net capital losses recognized after December 22, 2010 may be carried forward indefinitely and their character is retained as short-term and/or long-term losses.
As of December 31, 2018, the Portfolio had accumulated short-term capital losses of $22,085,499, and accumulated long-term capital losses of $268,473,038.
8. Recent Accounting Pronouncements and SEC Update
In August 2018, the FASB issued Accounting Standards Update2018-13, Fair Value Measurement (Topic 820)—Disclosure Framework—Changes to the Disclosure Requirements for Fair Value Measurement (“ASU2018-13”) which introduces new fair value disclosure requirements as well as eliminates and modifies certain existing fair value disclosure requirements. ASU2018-13 is effective for fiscal years beginning after December 15, 2019, and interim periods within those fiscal years. Early adoption is permitted and, as such, management has elected to early adopt ASU2018-13 effective with the current reporting period. The impact of the Portfolio’s adoption was limited to changes in the Portfolio’s financial statement disclosures regarding fair value, primarily those disclosures related to transfers between levels of the fair value hierarchy.
In August 2018, the Securities and Exchange Commission released its Final Rule on Disclosure Update and Simplification (the “Final Rule”) which is intended to simplify an issuer’s disclosure compliance efforts by removing redundant or outdated disclosures requirements without significantly altering the mix of information provided to investors. Effective with the current reporting period, the Portfolio adopted the Final Rule with the most notable impacts being that the Portfolio is no longer required to present the components of distributable earnings on the Statement of Assets and Liabilities or the sources of distributions to shareholders and the amounts of undistributed net investment income on the Statements of Changes in Net Assets.
BHFTII-16
Brighthouse Funds Trust II
Van Eck Global Natural Resources Portfolio
Report of Independent Registered Public Accounting Firm
To the Shareholders of Van Eck Global Natural Resources Portfolio and the Board of Trustees of Brighthouse Funds Trust II:
Opinion on the Financial Statements and Financial Highlights
We have audited the accompanying statement of assets and liabilities, including the schedule of investments, of the Van Eck Global Natural Resources Portfolio (the “Portfolio”), one of the portfolios constituting the Brighthouse Funds Trust II, as of December 31, 2018, the related statement of operations for the year then ended, the statements of changes in net assets for each of the two years in the period then ended, the financial highlights for each of the five years in the period then ended, and the related notes. In our opinion, the financial statements and financial highlights present fairly, in all material respects, the financial position of the Van Eck Global Natural Resources Portfolio of the Brighthouse Funds Trust II as of December 31, 2018, the results of its operations for the year then ended, the changes in its net assets for each of the two years in the period then ended, and the financial highlights for each of the five years in the period then ended, in conformity with accounting principles generally accepted in the United States of America.
Basis for Opinion
These financial statements and financial highlights are the responsibility of the Portfolio’s management. Our responsibility is to express an opinion on the Portfolio’s financial statements and financial highlights based on our audits. We are a public accounting firm registered with the Public Company Accounting Oversight Board (United States) (PCAOB) and are required to be independent with respect to the Portfolio in accordance with the U.S. federal securities laws and the applicable rules and regulations of the Securities and Exchange Commission and the PCAOB.
We conducted our audits in accordance with the standards of the PCAOB. Those standards require that we plan and perform the audit to obtain reasonable assurance about whether the financial statements and financial highlights are free of material misstatement, whether due to error or fraud. The Portfolio is not required to have, nor were we engaged to perform, an audit of its internal control over financial reporting. As part of our audits we are required to obtain an understanding of internal control over financial reporting but not for the purpose of expressing an opinion on the effectiveness of the Portfolio’s internal control over financial reporting. Accordingly, we express no such opinion.
Our audits included performing procedures to assess the risks of material misstatement of the financial statements and financial highlights, whether due to error or fraud, and performing procedures that respond to those risks. Such procedures included examining, on a test basis, evidence regarding the amounts and disclosures in the financial statements and financial highlights. Our audits also included evaluating the accounting principles used and significant estimates made by management, as well as evaluating the overall presentation of the financial statements and financial highlights. Our procedures included confirmation of securities owned as of December 31, 2018, by correspondence with the custodian and brokers; when replies were not received from brokers, we performed other auditing procedures. We believe that our audits provide a reasonable basis for our opinion.
/s/ Deloitte & Touche LLP
Boston, Massachusetts
February 25, 2019
We have served as the auditor of one or more of the Brighthouse investment companies since 1983.
BHFTII-17
Brighthouse Funds Trust II
Trustees and Officers
MANAGEMENT OF THE TRUSTS
The Boards of Trustees (the “Board”) of Brighthouse Funds Trust I and Brighthouse Funds Trust II (“BHF I” and “BHF II”, respectively, and collectively the “Trusts”) supervise the Trusts and are responsible for representing the interests of shareholders. The Trustees, the Chairman of the Board and the Chairmen of each subcommittee are the same for both Trusts. The Trustees of each Trust meet periodically throughout the year to oversee the Portfolios’ activities, reviewing, among other things, each Portfolio’s performance and its contractual arrangements with various service providers. The Trustees of each Trust elect the officers of the Trust, who are responsible for administering the Trust’sday-to-day operations.
Trustees and Officers
The Trustees and executive officers of the Trusts, as well as their principal occupations during the past five years, are set forth below. Unless otherwise indicated, the business address of each is c/o Brighthouse Funds, One Financial Center, Boston, Massachusetts 02111. Each Trustee who is deemed an “interested person,” as such term is defined in the 1940 Act, is referred to as an “Interested Trustee.” Those Trustees who are not “interested persons,” as such term is defined in the 1940 Act, are referred to as “Independent Trustees.” There is no limit to the term a Trustee may serve. Trustees serve until their death, resignation or removal in accordance with the BHF I Trust’s and BHF II Trust’s respective organizational documents and policies adopted by the Boards of the respective Trusts from time to time. Officers hold office at the pleasure of each Board and serve until their removal or resignation in accordance with the Trusts’ respective organizational documents and policies adopted by the Board of each Trust from time to time.
| | | | | | | | | | |
Name and Year of Birth | | Current
Position(s)
Held with
Registrant | | Term of Office
and Length of
Time Served | | Principal Occupation(s) During the Past
5 Years(1) | | Number of
Portfolios
in Brighthouse
Funds
Complex(2)
Overseen
by Trustee | | Other Directorships Held
by Trustee During the
Past 5 Years(1) |
| Interested Trustee |
John Rosenthal* (1960) | | Trustee | | Indefinite; From
May 2016
(Trust I and
Trust II) to present | | Chief Investment Officer, Brighthouse Financial, Inc. (2017 to present); until 2017, Senior Managing Director and Head of Global Portfolio Management, MetLife, Inc. | | 72 | | None |
|
| Independent Trustees |
Dawn M. Vroegop (1966) | | Trustee and Chairman of the Board | | Indefinite; From
December 2000
(Trust I)/May
2009 (Trust II) to
present as
Trustee; From
May 2016 (Trust
I and Trust II)
until present as
Chairman | | Private Investor. | | 72 | | Trustee, Driehaus Mutual Funds.** |
| | | | | |
Stephen M. Alderman (1959) | | Trustee | | Indefinite; From
December 2000
(Trust I)/April
2012 (Trust II) to
present | | Shareholder in the law firm of Garfield and Merel, Ltd. | | 72 | | None |
| | | | | |
Robert J. Boulware (1956) | | Trustee | | Indefinite; From
March 2008
(Trust I)/April
2012 (Trust II) to
present | | Managing Director, Pilgrim Funds, LLC (private equity fund). | | 72 | | Trustee, Vertical Capital Income Fund(closed-end fund);** Director, Gainsco, Inc. (auto insurance);** Trustee, SharesPost 100 Fund(closed-end fund).** |
| | | | | |
Susan C. Gause (1952) | | Trustee | | Indefinite; From
March 2008
(Trust I)/April
2012 (Trust II) to
present | | Private Investor. | | 72 | | Trustee, HSBC Funds.** |
BHFTII-18
Brighthouse Funds Trust II
Trustees and Officers—(Continued)
| | | | | | | | | | |
Name and Year of Birth | | Current
Position(s)
Held with
Registrant | | Term of Office
and Length of
Time Served | | Principal Occupation(s) During the Past
5 Years(1) | | Number of
Portfolios
in Brighthouse
Funds
Complex(2)
Overseen
by Trustee | | Other Directorships Held
by Trustee During the
Past 5 Years(1) |
Nancy Hawthorne (1951) | | Trustee | | Indefinite; From
May 2003
(Trust II)/April
2012 (Trust I)
to present | | Partner, Hawthorne Financial Advisors, LLC (registered investment advisor); until 2014, Chief Executive Officer, Clerestory LLC (corporate advisor). | | 72 | | Director and Chairman of the Board of Directors, THL Credit, Inc.;** Director and Chairman of the Board, Avid Technology, Inc.;** Director, CRA International, Inc.** |
| | | | | |
Barbara A. Nugent (1956) | | Trustee | | Indefinite; From
January 2014
(Trust I and
Trust II) to
present | | President, True North Board Governance, LLC (consulting); until December 2013, partner in the law firm of Stradley Ronon Stevens & Young, LLP. | | 72 | | Independent Lead Trustee, BMT Investment Funds** |
| | | | | |
Christopher J. Towle (1957) | | Trustee | | Indefinite; From
April 2018
(Trust I and
Trust II) to
present | | Retired; until 2014, Partner, Portfolio Manager, Director of High Yield and Convertible Strategies, Lord Abbett & Co. | | 72 | | Trustee, Driehaus Mutual Funds** |
Officers
| | | | | | |
Name and Year of Birth | | Position(s)
Held with
Registrant | | Length of
Time Served | | Principal Occupation(s)
During the Past 5 Years(1) |
| Executive Officers | | | | | | |
Kristi Slavin (1973) | | President and Chief Executive Officer, of Trust I and Trust II | | From May
2016
(Trust I and
Trust II) to
present | | President, Brighthouse Investment Advisers, LLC (2016-present); formerly, Senior Vice President, MetLife Advisers, LLC; Vice President, MetLife, Inc.; Vice President, Trust I and Trust II(2015-2016). |
| | | |
Alan R. Otis (1971) | | Chief Financial Officer and Treasurer, of Trust I and Trust II | | From
November
2017
(Trust I and
Trust II) to
present | | Senior Vice President, Brighthouse Investment Advisers, LLC (2017-present); formerly, Vice President, Brighthouse Investment Advisers, LLC (2012-2017); Assistant Treasurer, Trust I and Trust II (2012-2017). |
| | | |
Andrew L. Gangolf (1954) | | Secretary, of Trust I and Trust II | | From May
2011
(Trust I and
Trust II) to
present | | Executive Vice President, Brighthouse Investment Advisers, LLC (2017-present); formerly, Senior Vice President, MetLife Advisers, LLC (2011-2017); until 2011, Senior Vice President & Assistant General Counsel, AllianceBernstein Investments, Inc. |
| | | |
Steven E. Hartstein (1963) | | Chief Compliance Officer (“CCO”), of Trust I and Trust II | | From
February
2014
(Trust I and
Trust II) to
present | | Senior Vice President and CCO, Brighthouse Investment Advisers, LLC (2017-present); Head of Investments Compliance, Vice President, Brighthouse Financial, Inc. (2017-present); formerly, Vice President, MetLife, Inc. (2013-2017); Senior Vice President and CCO, MetLife Advisers, LLC (2013-2017.) |
| | | |
Victor Soto (1978) | | Vice President of Trust I and Trust II | | From May
2018
(Trust I and
Trust II) to
present | | Executive Vice President, Brighthouse Investment Advisers, LLC (2016-present); Assistant Vice President, MetLife Inc. (2015-2017); Portfolio Manager, 1st Global (2013-2015). |
| * | Mr. Rosenthal is an “interested person” of the Trusts because of his position with Brighthouse Financial, Inc., the current parent company of Brighthouse Investment Advisers, LLC. |
| ** | Indicates a directorship with a registered investment company or a company subject to the reporting requirements of the Securities Exchange Act of 1934, as amended. |
| (1) | Previous positions during the past five years with the Trusts, Brighthouse Financial, Inc., MetLife, Inc. or the Manager are omitted if not materially different. |
| (2) | The Fund Complex includes 43 BHF I Portfolios and 29 BHF II Portfolios. |
BHFTII-19
Brighthouse Funds Trust II
Van Eck Global Natural Resources Portfolio
Board of Trustees’ Consideration of Advisory and Sub-Advisory Agreements
At anin-person meeting held on November6-8, 2018 (the “November Meeting”), the Boards of Trustees (the “Board”) of Brighthouse Funds Trust I and Brighthouse Funds Trust II (“BFT I” and “BFT II,” respectively, and collectively, the “Trusts”), including a majority of the Trustees who are not “interested persons” of the Trusts (the “Independent Trustees”) under the Investment Company Act of 1940 (the “1940 Act”), approved the continuation of the Trusts’ advisory agreements (each, an “Advisory Agreement”) with Brighthouse Investment Advisers, LLC (the “Adviser”) and the applicablesub-advisory agreements (each a “Sub-Advisory Agreement,” and collectively with the Advisory Agreement, the “Agreements”) between the Adviser and the investmentsub-advisers (each a “Sub-Adviser,” and collectively, the “Sub-Advisers”) for the series of the Trusts (each a “Portfolio,” and collectively, the “Portfolios”).
In making those approvals, the Board reviewed a variety of materials that were provided for the specific purpose of the annual contract renewal process. In addition, various materials provided to and discussed with the Board throughout the year informed the Board’s decision to renew the Agreements. In particular, the information for each Portfolio included, but was not limited to, investment performance reports, and reports on expenses, legal and compliance matters, asset pricing, brokerage commissions and trade execution.
The Board met in person with personnel of the Adviser on October 17, 2018 for the specific purpose of giving preliminary consideration to the proposed continuation of the Agreements (the “October Meeting”). At that meeting, the Adviser reviewed with the Board the performance and fees experienced by each Portfolio, as well as other information. During and after the October Meeting, the Independent Trustees communicatedfollow-up matters for management to address at the November Meeting. The Independent Trustees were advised by independent legal counsel throughout the contract renewal process, and met with independent legal counsel in several executive sessions outside of the presence of management.
Information furnished and reviewed specifically in connection with the renewal process included, but was not limited to, a report for each Portfolio that was prepared by Broadridge (“Broadridge”), an independent organization. In addition, the Independent Trustees reviewed a report that was prepared by JDL Consultants, LLC (“JDL”), an independent consultant to the Independent Trustees (“JDL Report”), which examined the comparative fees, expenses and performance of each Portfolio, based upon the Broadridge reports. Also, the Board reviewed the responses to wide-ranging questions from the Independent Trustees relating to the business, operations and performance of the Adviser and theSub-Advisers that the Adviser andSub-Advisers had prepared specifically for the renewal process, and reviewed aPortfolio-by-Portfolio analysis of the profitability to the Adviser of each Advisory Agreement, which was prepared by the Adviser for the renewal process.
At the November Meeting, the Board, including a majority of the Independent Trustees, concluded that the nature, extent and quality of services provided by the Adviser and eachSub-Adviser supported the renewal of the Agreements. The Board also concluded that the investment performance of each Portfolio was such that each Agreement should continue, and that the fees paid by each Portfolio to the Adviser appeared to be reasonable in light of the nature, extent and quality of the services provided by the Adviser andSub-Adviser. Further, the Board concluded that the Adviser’s profitability in providing services under the Advisory Agreements did not appear unreasonable in light of the nature, extent and quality of the services provided by the Adviser. Finally, the Board reviewed the extent to which the investment advisory fees paid by the Portfolios shared economies of scale with investors or entailed the potential to share economies of scale with investors and concluded that those considerations generally supported the renewal of each Agreement. In approving the renewal of each of the Agreements, the Board, including the Independent Trustees, gave attention to all of the information that was furnished and each Trustee placed varying degrees of importance on the various pieces of information that were provided to them. The Board evaluated the information available to it on aPortfolio-by-Portfolio basis, and its decision was made separately with respect to each Portfolio. The following paragraphs provide more information about some of the primary factors that were relevant to the Board’s decision. The Board did not identify any single factor as determinative, and the Trustees generally attributed different weights to various factors for the various Portfolios.
Nature, extent and quality of services. The Board evaluated the nature, extent and quality of the services that the Adviser and theSub-Advisers, as relevant, have provided to the Portfolios. The Board considered the Adviser’s services as investment manager to the Portfolios, including its services relating to the hiring and oversight of theSub-Advisers, trading practices and oversight of transition management (as applicable), compliance programs and personnel, and risk management, among other things. The Adviser’s services in coordinating and overseeing the activities of the Trusts’ other service providers were also considered. The Board considered information received from the Trusts’ Chief Compliance Officer (“CCO”) regarding the Portfolios’ compliance policies and procedures that were established pursuant to Rule38a-l under the 1940 Act. The Board also noted that the Adviser’s investment, compliance and legal staff conduct regular and periodic telephonic andin-person meetings with theSub-Advisers to review and assess the services that are provided to the Portfolios, and that personnel of the Adviser prepare and present reports to the Independent Trustees regarding those meetings. In addition, throughout the year, the Board considered the expertise, experience and performance of the personnel of the Adviser who performed the various services that are mentioned above.
BHFTII-20
Brighthouse Funds Trust II
Van Eck Global Natural Resources Portfolio
Board of Trustees’ Consideration of Advisory and Sub-Advisory Agreements—(Continued)
With respect to the services provided by each of theSub-Advisers, the Board considered a variety of information that the Adviser and eachSub-Adviser prepared for the Board’s review. The Board considered eachSub-Adviser’s investment process and philosophy, and the investment performance experienced by the Portfolio (as described in more detail below). The Board took into account that eachSub-Adviser’s responsibilities include the development and maintenance of an investment program for the applicable Portfolio that is consistent with the Portfolio’s investment objectives, the selection of investment securities and the placement of orders for the purchase and sale of such securities, as well as the implementation of compliance controls related to performance of these services. In particular, the Board considered, among other things, theSub-Adviser’s current level of staffing as well as its compensation program and its overall resources. The Board reviewed eachSub-Adviser’s history and investment experience, as well as information provided regarding the qualifications, background and responsibilities of theSub-Adviser’s investment and compliance personnel who provide services to the Portfolios. The Board also considered, among other things, eachSub-Adviser’s compliance program and regulatory and disciplinary history. In its review, the Board also took into account information regarding any services and/or payments provided to the Adviser by theSub-Advisers in connection with marketing activities and considered representations from the Adviser that those payments were not considered in the Adviser’s recommendation to renew any of theSub-Advisory Agreements.
Performance. The Board placed emphasis on the performance of each Portfolio in light of, among other things, its importance to investors. The Board considered the Adviser’s quarterly reviews with the Board of detailed information about each Portfolio’s investment strategies and performance results and composition, including discussions regarding the relevant effect of current market conditions. The Board reviewed and considered the reports prepared by Broadridge, which provided a statistical analysis comparing the Portfolios’ investment performance to that of comparable funds underlying variable insurance products (the “Performance Universe”). The Independent Trustees also met separately with representatives of JDL during the October Meeting to review the JDL Report. The Board also compared the performance records of the Portfolios to those of comparable funds and other accounts that were managed by the relevantSub-Adviser, to the extent such information was available. The Board considered each Portfolio’s performance for periods subsequent to the performance period covered by the Broadridge reports, and the Adviser’s discussion of the same, including the effect of current market conditions on each Portfolio’s more recent performance. The Board also noted that while it found the data provided by Broadridge generally useful, it recognized the limitations of such data, including, in particular, that notable differences may exist between a Portfolio and those of the other funds in a Broadridge category (for example, the investment objectives(s) and investment strategies) and that the results of the performance comparisons may vary depending on (i) the end dates for the performance periods that were selected and (ii) the selection of the peer groups.
The Board focused particular attention on Portfolios with less favorable performance records. The Board noted the Adviser’s focus on eachSub-Adviser’s performance and that the Adviser has been active in monitoring and responding to any performance issues with respect to the Portfolios.
Fees and Expenses. The Board gave consideration to the level and method of computing the fees payable under the Agreements. The Board considered the Broadridge report for each of the Portfolios, which included comparisons for each Portfolio of its contractual management andsub-adviser fees (at current and various asset levels), and total expenses, with those of its peers, including as those peers were divided into a broad group of peer funds (“Expense Universe”), a narrower group of peer funds (“Expense Group”), a broad group of peersub-advised funds (“Sub-advised Expense Universe”), and a narrower group of peersub-advised funds (“Sub-advised Expense Group”). Broadridge selected the peer funds which were similarly situated funds underlying variable insurance products deemed to be comparable to the Portfolios. The Independent Trustees, with the assistance of JDL, also examined the JDL Report. The Board compared the fee payable to aSub-Adviser by the Adviser with respect to the Portfolio to the fee payable to theSub-Adviser by other comparable funds and other accounts, to the extent such information was available.
The Board noted that thesub-advisory fees for the Portfolios are paid by the Adviser out of the advisory fees, and that the Adviser negotiates the fees at arm’s length. The Board also considered that the Adviser had entered into expense limitation or management fee waiver agreements with certain of the Portfolios pursuant to which the Adviser had agreed to waive a portion of its advisory fee and/or reimburse certain expenses as a means of limiting a Portfolio’s total annual operating expenses.
Profitability. The Board examined the profitability to the Adviser of each Advisory Agreement, on aPortfolio-by-Portfolio basis. The Board also considered that an affiliate of the Adviser, Brighthouse Securities, LLC, serves as distributor for the Trusts, and, as such, receives Rule12b-1 payments to support the distribution of the Portfolios. The Board considered the profitability to theSub-Advisers and their affiliates as a result of their relationships with the Portfolios, to the extent available, and the Board considered the ability of the Adviser to negotiate with aSub-Adviser at arm’s length. In reviewing the profitability analyses, the Board recognized that expense allocation methodologies are inherently subjective and various expense allocation methodologies may be reasonable while producing different results.
BHFTII-21
Brighthouse Funds Trust II
Van Eck Global Natural Resources Portfolio
Board of Trustees’ Consideration of Advisory and Sub-Advisory Agreements—(Continued)
Economies of scale. The Board also considered each Portfolio’s fees in light of its size. The Board noted the fee schedules for the Portfolios that contain breakpoints that reduce the fee rate above specified asset levels. The Board noted those Portfolios that did not have breakpoints in their advisory fee and took into account management’s discussion of the same. The Board noted that those Portfolios with Advisory Agreements containing breakpoints generally have breakpoints in the correspondingSub-Advisory Agreement. The Board considered the effective fees under the Advisory Agreement andSub-Advisory Agreement for each Portfolio as a percentage of assets at different asset levels and possible economies of scale that may be realized if the assets of the Portfolio grow. The Board examined, among other data, the effect of a Portfolio’s growth in size, and reduction in size, on various fee schedules and the Board reviewed the Broadridge and JDL Reports, which compared fees among peers. The Board also generally noted that if a Portfolio’s assets increase over time, the Portfolio may realize other economies of scale if assets increase proportionally more than certain other fixed expenses.
Other factors. The Board considered other benefits that may be realized by the Adviser and its affiliates from their relationship with the Trusts. Among them, the Board recognized that Brighthouse Securities, LLC, as the distributor for the Trusts, receives payments pursuant to Rule12b-1 from the Portfolios to compensate for the provision of shareholder services and distribution activities, which could lead to growth in the Trusts’ assets and corresponding benefits from such growth, including economies of scale. The Board considered other benefits that may be realized by eachSub-Adviser and its affiliates from their relationship with the Trusts, including the opportunity to provide advisory services to additional portfolios of the Trusts and reputational benefits. In conjunction with these considerations, the Board noted the ongoing commitment of the Adviser to the Portfolios.
The Board requested, received, and considered information from the Adviser regarding possible conflicts of interest in the form of material benefits to the Adviser resulting from the Adviser’s affiliations and business relationships, as relevant. The Board considered the services that are provided to the Trusts by its service providers, and the manner in which any conflicts were mitigated.
* * *
Van Eck Global Natural Resources Portfolio. The Board also considered the following information in relation to the Agreements with the Adviser and Van Eck Associates Corporation regarding the Portfolio:
Among other data relating specifically to the Portfolio’s performance, the Board considered that the Portfolio outperformed the median of Performance Universe and the average of its Morningstar Category for theone-year period ended June 30, 2018, and underperformed the median of its Performance Universe and the average of its Morningstar Category for the three-year and five-year periods ended June 30, 2018. The Board also considered that the Portfolio underperformed its benchmark, the S&P North American Natural Resources Sector Index, for theone-, three- and five-year periods ended September 30, 2018. The Board took into account management’s discussion of the Portfolio’s performance, including prevailing market conditions.
The Board also considered that the Portfolio’s actual management fees were equal to the Expense Group median, and above theSub-advised Expense Universe median and the Expense Universe median. The Board further considered that the Portfolio’s total expenses (exclusive of12b-1 fees) were below the Expense Group median,Sub-advised Expense Universe median, and Expense Universe median. The Board further noted that the Portfolio’s contractual management fees were above the asset-weighted average of comparable funds selected by Broadridge at the Portfolio’s current size. The Board also noted that the Portfolio’s contractualsub-advisory fees were above the averages of theSub-advised Expense Group and theSub-advised Expense Universe at the Portfolio’s current size.
BHFTII-22
Brighthouse Funds Trust II
Western Asset Management Strategic Bond Opportunities Portfolio
Managed by Western Asset Management Company
Portfolio Manager Commentary*
PERFORMANCE
For the 12 months ended December 31, 2018, the Class A, B, and E shares of the Western Asset Management Strategic Bond Opportunities Portfolio returned-3.80%,-4.02%, and-3.92%, respectively. The Portfolio’s benchmark, the Bloomberg Barclays U.S. Aggregate Bond Index1, returned 0.01%.
MARKET ENVIRONMENT / CONDITIONS
Fixed income markets, in general, posted weak results over the twelve months ended December 31, 2018. Higher U.S. growth and inflation expectations caused U.S. Treasury yields to rise for most of the year, but muted inflation coupled with global slowdown and recession fears caused yields to fall during the final months. Spread sectors were similarly impacted by periods of elevated volatility as they performed well early in the year with initial solid economic growth forecasts and later saw spreads widen towards year end.
After hitting a high-water mark of 4.2% in the second quarter, the U.S. economy’s annualized gross domestic product (“GDP”) growth ticked down to 3.5% in the third quarter. The deceleration in GDP growth reflected a downturn in exports and decelerations in nonresidential fixed investment and personal consumption expenditures. The manufacturing sector continued to expand throughout the year, but the pace also moderated during the fourth quarter. The U.S. labor market remained tight throughout the year; the unemployment rate reached 3.7% in October and November, which equaled the lowest unemployment rate since 1969.
In December, the Federal Reserve (the “Fed”) raised interest rates for the fourth time in 2018, as was widely expected, to a target range between 2.25% and 2.50%. This increase marked the Fed’s ninth rate hike since December 2015. In a post-meeting statement, however, the Fed surprised market participants by retaining its forward guidance for “some further gradual increases” and only lowering its prediction from three hikes to two hikes in 2019. This messaging stood in contrast to the dovish approach that had seemingly been advocated by previous remarks from Fed Chair Jerome Powell and other members. Concerns over a potential Fed policy error added to the heightened market volatility experienced towards year end.
PORTFOLIO REVIEW /PERIOD-END POSITIONING
The Western Asset Management Strategic Bond Opportunities Portfolio underperformed its benchmark over the reporting period.
The Portfolio’s performance was negatively impacted by its U.S. duration and yield curve positioning, as well as currency and emerging markets (“EM”) positions. U.S. Treasury yields fluctuated throughout the year, but ultimately ended the year higher across the curve. The Portfolio’s modest bias to long U.S. duration exposure had an overall significant negative impact on performance; however, the Portfolio’s tactical yield curve positioning, which included an underweight to the short end of the curve early in the year, had only a slight negative impact on performance.
Within currencies, the Portfolio was negatively impacted by its outright exposures to select EM currencies including the Argentine peso which declined 50.6% over the year; the Turkish lira, down 28.2% for the year; and the Brazilian real, which declined 14.6% over the year. However, the Portfolio did benefit from its meaningful euro short, which contributed positively to performance as the euro declined 4.5% over the year.
Over the course of the year, spread sectors experienced heightened levels of volatility, especially during the final months as the broader market witnessed a flight to quality. Corporate credit spreads widened from the beginning of the year to the end of year. The Portfolio’s overweight positioning to investment grade corporate credit bonds were negative contributors to relative performance in the period. While investment grade credit saw spreads trend wider for most of the year, by contrast, high yield bonds saw spreads tighten earlier in the year. For reference, the option adjusted spread of the Bloomberg Barclays U.S. Corporate High Yield Index moved from 343 basis points (“bps”) as of December 31, 2017 to 316 bps by the end of September 2018. Up until the fourth quarter, the Portfolio’s high yield corporate credit positions had a significant positive impact on performance. The dramatic spread widening witnessed in the fourth quarter led the Portfolio to give up nearly all of its positive performance from high yield. For the full12-month period, the Portfolio’s high yield corporate credit positions had a positive, but ultimately negligible, impact on performance.
Elsewhere, the Portfolio’s overweight exposures to structured product, were largely positive for performance as overall fundamentals for the sector remained solid throughout the year. Only late in the fourth quarter did some signs of softening in the U.S. housing market begin to have an impact on overall spread levels. In particular, the Portfolio’s legacynon-Agency Residential Mortgage-Backed Securities (“RMBS”) as well as single asset-single borrower Commercial Mortgage-Backed Securities (“CMBS”) performed relatively well in the period.
At period end, the Portfolio held overweight positions relative to the benchmark in both high yield and investment grade credits. During the year, the Portfolio’s exposure to investment grade credits
BHFTII-1
Brighthouse Funds Trust II
Western Asset Management Strategic Bond Opportunities Portfolio
Managed by Western Asset Management Company
Portfolio Manager Commentary*—(Continued)
increased, which reflected our fundamental view of a persistent economic recovery and growth stabilization. In addition, the Portfolio maintained overweight positions tonon-Agency RMBS, CMBS, and EM. Conversely, the Portfolio was underweight U.S Treasuries and Agency MBS. By year end, the Portfolio’s overall duration was 0.2 years short to the benchmark, with an underweight held at the10-year segment of the curve.
S. Kenneth Leech
Carl L. Eichsteadt
Mark S. Lindbloom
Michael Buchanan
Annabel Rudebeck
Portfolio Managers
Western Asset Management Company
* This commentary may include statements that constitute “forward-looking statements” under the U.S. securities laws. Forward-looking statements include, among other things, projections, estimates, and information about possible or future results related to the Portfolio, market or regulatory developments. The views expressed above are not guarantees of future performance or economic results and involve certain risks, uncertainties and assumptions that could cause actual outcomes and results to differ materially from the views expressed herein. The views expressed above are subject to change at any time based upon economic, market, or other conditions and the subadvisory firm undertakes no obligation to update the views expressed herein. Any discussions of specific securities should not be considered a recommendation to buy or sell those securities. The views expressed above (including any forward-looking statement) may not be relied upon as investment advice or as an indication of the Portfolio’s trading intent. Information about the Portfolio’s holdings, asset allocation or country diversification is historical and is not an indication of future Portfolio composition, which may vary. Direct investment in any index is not possible. The performance of any index mentioned in this commentary has not been adjusted for ongoing management, distribution and operating expenses, and sales charges applicable to mutual fund investments. In addition, the returns do not reflect additional fees charged by separate accounts or variable insurance contracts that an investor in the Portfolio may pay. If these additional fees were reflected, performance would have been lower.
BHFTII-2
Brighthouse Funds Trust II
Western Asset Management Strategic Bond Opportunities Portfolio
A $10,000 INVESTMENT COMPARED TO THE BLOOMBERG BARCLAYS U.S. AGGREGATE BOND INDEX
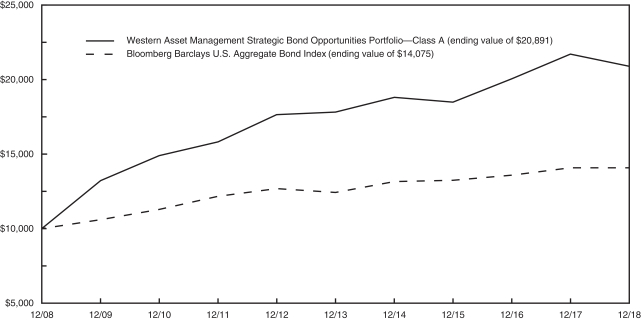
AVERAGE ANNUAL RETURNS (%) (FOR THE YEAR ENDED DECEMBER 31, 2018)
| | | | | | | | | | | | |
| | | | |
| | | 1 Year | | | 5 Year | | | 10 Year | |
| Western Asset Management Strategic Bond Opportunities Portfolio | | | | | | | | | | | | |
Class A | | | -3.80 | | | | 3.22 | | | | 7.65 | |
Class B | | | -4.02 | | | | 2.97 | | | | 7.38 | |
Class E | | | -3.92 | | | | 3.08 | | | | 7.49 | |
| Bloomberg Barclays U.S. Aggregate Bond Index | | | 0.01 | | | | 2.52 | | | | 3.48 | |
1 The Bloomberg Barclays U.S. Aggregate Bond Index is a broad based benchmark that measures the investment grade, U.S. dollar-denominated, fixed-rate taxable bond market, including Treasuries, government-related and corporate securities, mortgage-backed securities, asset-backed securities, and commercial mortgage-backed securities.
Portfolio performance is calculated including reinvestment of all income and capital gain distributions. Performance numbers are net of all Portfolio expenses but do not include any insurance, sales, separate account or administrative charges of variable annuity or life insurance contracts or any additional expenses that participants may bear relating to the operations of their plans. If these charges were included, the returns would be lower. The performance of any index referenced above has not been adjusted for ongoing management, distribution and operating expenses, and sales charges applicable to mutual fund investments. Direct investment in any index is not possible. The performance of Class A shares, as set forth in the line graph above, will differ from that of other classes because of the difference in expenses paid by policyholders investing in the different share classes.
This information represents past performance and is not indicative of future results. Investment return and principal value may fluctuate so that shares, upon redemption, may be worth more or less than the original cost.
PORTFOLIO COMPOSITION AS OF DECEMBER 31, 2018
| | | | |
Top Sectors | |
| | | % of
Net Assets | |
| Corporate Bonds & Notes | | | 58.8 | |
| Mortgage-Backed Securities | | | 9.0 | |
| Floating Rate Loans | | | 8.6 | |
| Foreign Government | | | 8.2 | |
| U.S. Treasury & Government Agencies | | | 6.0 | |
| Asset-Backed Securities | | | 5.3 | |
| Convertible Bonds | | | 1.0 | |
| Purchased Options | | | 0.5 | |
| Convertible Preferred Stocks | | | 0.2 | |
| Municipals | | | 0.1 | |
BHFTII-3
Brighthouse Funds Trust II
Western Asset Management Strategic Bond Opportunities Portfolio
Understanding Your Portfolio’s Expenses
Shareholder Expense Example
As a shareholder of the Portfolio, you incur ongoing costs, including management fees; distribution and service(12b-1) fees; and other Portfolio expenses. This example is intended to help you understand your ongoing costs (in dollars) (referred to as “expenses”) of investing in the Portfolio and compare these costs with the ongoing costs of investing in other mutual funds. The example is based on an investment of $1,000 invested at the beginning of the period and held for the entire period, July 1, 2018 through December 31, 2018.
Actual Expenses
The first line for each share class of the Portfolio in the table below provides information about actual account values and actual expenses. You may use the information in this line, together with the amount you invested in the particular share class of the Portfolio, to estimate the expenses that you paid over the period. Simply divide your account value by $1,000 (for example, an $8,600 account value divided by $1,000 = 8.6), then multiply the result by the number in the first line under the heading entitled “Expenses Paid During Period” to estimate the expenses you paid on your account during this period.
Hypothetical Example for Comparison Purposes
The second line for each share class of the Portfolio in the table below provides information about hypothetical account values and hypothetical expenses based on the Portfolio’s actual expense ratio and an assumed rate of return of 5% per year before expenses, which is not the Portfolio’s actual return. The hypothetical account values and expenses may not be used to estimate the actual ending account balance or expenses you paid for the period. You may use this information to compare the ongoing costs of investing in the Portfolio and other funds. To do so, compare this 5% hypothetical example with the 5% hypothetical examples that appear in the shareholder reports of the other funds.
Please note that the expenses shown in the table are meant to highlight your ongoing costs only and do not reflect any fees or charges of your variable insurance product or any additional expenses that participants in certain eligible qualified plans may bear relating to the operations of their plan. Therefore, the second line for each share class in the table is useful in comparing ongoing costs only, and will not help you determine the relative total costs of owning different funds. In addition, if these other costs were included, your costs would have been higher.
| | | | | | | | | | | | | | | | | | |
Western Asset Management Strategic Bond Opportunities Portfolio | | | | Annualized
Expense
Ratio | | | Beginning
Account Value
July 1,
2018 | | | Ending
Account Value
December 31,
2018 | | | Expenses Paid
During Period**
July 1, 2018
to
December 31,
2018 | |
Class A (a) | | Actual | | | 0.54 | % | | $ | 1,000.00 | | | $ | 991.40 | | | $ | 2.71 | |
| | Hypothetical* | | | 0.54 | % | | $ | 1,000.00 | | | $ | 1,022.48 | | | $ | 2.75 | |
| | | | | |
Class B (a) | | Actual | | | 0.79 | % | | $ | 1,000.00 | | | $ | 989.80 | | | $ | 3.96 | |
| | Hypothetical* | | | 0.79 | % | | $ | 1,000.00 | | | $ | 1,021.22 | | | $ | 4.02 | |
| | | | | |
Class E (a) | | Actual | | | 0.69 | % | | $ | 1,000.00 | | | $ | 990.60 | | | $ | 3.46 | |
| | Hypothetical* | | | 0.69 | % | | $ | 1,000.00 | | | $ | 1,021.73 | | | $ | 3.52 | |
| * | Hypothetical assumes a rate of return of 5% per year before expenses. |
| ** | Expenses paid are equal to the Portfolio’s annualized expense ratio for the most recent six month period, as shown above, multiplied by the average account value over the period, multiplied by the number of days (184 days) in the most recent fiscal half-year, divided by 365 (to reflect theone-half year period). |
| (a) | The annualized expense ratio shown reflects the impact of the management fee waiver as described in Note 6 of the Notes to Financial Statements. |
BHFTII-4
Brighthouse Funds Trust II
Western Asset Management Strategic Bond Opportunities Portfolio
Schedule of Investments as of December 31, 2018
Corporate Bonds & Notes—58.8% of Net Assets
| | | | | | | | |
| Security Description | | Principal
Amount* | | | Value | |
|
| Aerospace/Defense—0.7% | |
Harris Corp. | |
4.854%, 04/27/35 | | | 350,000 | | | $ | 347,587 | |
5.054%, 04/27/45 | | | 1,089,000 | | | | 1,121,664 | |
Northrop Grumman Corp. | |
2.930%, 01/15/25 | | | 13,360,000 | | | | 12,682,517 | |
3.200%, 02/01/27 | | | 3,560,000 | | | | 3,340,025 | |
Raytheon Co.
3.125%, 10/15/20 (a) | | | 30,000 | | | | 30,088 | |
United Technologies Corp. | |
4.125%, 11/16/28 | | | 4,700,000 | | | | 4,666,941 | |
4.500%, 06/01/42 | | | 290,000 | | | | 273,580 | |
| | | | | | | | |
| | | | | | | 22,462,402 | |
| | | | | | | | |
|
| Agriculture—0.1% | |
Altria Group, Inc.
5.375%, 01/31/44 | | | 649,000 | | | | 605,635 | |
Reynolds American, Inc.
4.850%, 09/15/23 | | | 2,640,000 | | | | 2,671,434 | |
| | | | | | | | |
| | | | | | | 3,277,069 | |
| | | | | | | | |
|
| Airlines—0.1% | |
Air Canada Pass-Through Trust
4.125%, 05/15/25 (144A) | | | 628,261 | | | | 622,544 | |
American Airlines Pass-Through Trust
5.600%, 07/15/20 (144A) | | | 978,908 | | | | 986,250 | |
Delta Air Lines Pass-Through Trust
4.950%, 05/23/19 | | | 73,513 | | | | 73,917 | |
Northwest Airlines Pass-Through Trust
7.575%, 03/01/19 | | | 1,531 | | | | 1,516 | |
| | | | | | | | |
| | | | | | | 1,684,227 | |
| | | | | | | | |
|
| Apparel—0.5% | |
Hanesbrands, Inc.
4.875%, 05/15/26 (144A) (a) | | | 14,688,000 | | | | 13,237,560 | |
Levi Strauss & Co.
5.000%, 05/01/25 (a) | | | 2,345,000 | | | | 2,292,237 | |
| | | | | | | | |
| | | | | | | 15,529,797 | |
| | | | | | | | |
|
| Auto Manufacturers—0.9% | |
Allison Transmission, Inc. | |
4.750%, 10/01/27 (144A) | | | 3,650,000 | | | | 3,248,500 | |
5.000%, 10/01/24 (144A) | | | 4,790,000 | | | | 4,598,400 | |
General Motors Co.
6.600%, 04/01/36 (a) | | | 5,134,000 | | | | 5,002,187 | |
Jaguar Land Rover Automotive plc
4.500%, 10/01/27 (144A) (a) | | | 8,860,000 | | | | 6,600,700 | |
JB Poindexter & Co., Inc.
7.125%, 04/15/26 (144A) | | | 8,691,000 | | | | 8,126,085 | |
| | | | | | | | |
| | | | | | | 27,575,872 | |
| | | | | | | | |
|
| Auto Parts & Equipment—0.3% | |
Adient Global Holdings, Ltd.
4.875%, 08/15/26 (144A) | | | 200,000 | | | | 153,000 | |
|
| Auto Parts & Equipment—(Continued) | |
Delphi Technologies plc
| |
5.000%, 10/01/25 (144A) | | | 4,210,000 | | | | 3,543,725 | |
IHO Verwaltungs GmbH | |
4.125%, PIK, 09/15/21 (144A) (a) (b) | | | 1,840,000 | | | | 1,748,000 | |
4.500%, PIK, 09/15/23 (144A) (a) (b) | | | 1,050,000 | | | | 960,750 | |
ZF North America Capital, Inc.
4.750%, 04/29/25 (144A) | | | 4,153,000 | | | | 3,866,677 | |
| | | | | | | | |
| | | | | | | 10,272,152 | |
| | | | | | | | |
|
| Banks—9.5% | |
ABN AMRO Bank NV
4.750%, 07/28/25 (144A) | | | 321,000 | | | | 319,376 | |
Banco Bilbao Vizcaya Argentaria S.A.
7.000%, 5Y EUR Swap + 6.155%, 02/19/19 (EUR) (c) | | | 8,800,000 | | | | 10,055,334 | |
Banco Mercantil del Norte S.A.
6.875%, 5Y CMT + 5.035%, 07/06/22 (144A) (c) | | | 800,000 | | | | 774,008 | |
7.625%, 10Y CMT + 5.353%, 01/10/28 (144A) (c) | | | 800,000 | | | | 774,008 | |
Banco Santander S.A.
3.800%, 02/23/28 | | | 400,000 | | | | 355,998 | |
3.848%, 04/12/23 | | | 9,800,000 | | | | 9,521,747 | |
Bank of America Corp.
4.000%, 01/22/25 | | | 16,110,000 | | | | 15,700,015 | |
4.250%, 10/22/26 | | | 7,628,000 | | | | 7,422,787 | |
Barclays Bank plc
7.625%, 11/21/22 | | | 16,450,000 | | | | 17,046,312 | |
Barclays plc
4.972%, 3M LIBOR + 1.902%, 05/16/29 (c) | | | 4,990,000 | | | | 4,814,020 | |
7.750%, 5Y USD Swap + 4.842%, 09/15/23 (c) | | | 3,650,000 | | | | 3,511,008 | |
BBVA Bancomer S.A.
5.125%, 5Y CMT + 2.650%, 01/18/33 (144A) (a) (c) | | | 16,480,000 | | | | 14,296,565 | |
BNP Paribas S.A.
4.375%, 05/12/26 (144A) | | | 7,680,000 | | | | 7,394,235 | |
7.625%, 5Y USD Swap + 6.314%, 03/30/21 (144A) (c) | | | 2,850,000 | | | | 2,903,437 | |
BPCE S.A.
4.875%, 04/01/26 (144A) (a) | | | 12,000,000 | | | | 11,826,994 | |
5.150%, 07/21/24 (144A) | | | 420,000 | | | | 421,710 | |
CIT Group, Inc.
6.125%, 03/09/28 (a) | | | 1,760,000 | | | | 1,751,200 | |
Citigroup, Inc.
4.050%, 07/30/22 | | | 110,000 | | | | 110,495 | |
4.450%, 09/29/27 | | | 11,094,000 | | | | 10,697,315 | |
Cooperative Rabobank UA
3.750%, 07/21/26 | | | 4,210,000 | | | | 3,947,338 | |
4.375%, 08/04/25 | | | 1,470,000 | | | | 1,444,414 | |
4.625%, 12/01/23 | | | 5,870,000 | | | | 5,951,380 | |
11.000%, 3M LIBOR + 10.868%, 06/30/19 (144A) (c) | | | 415,000 | | | | 428,488 | |
Credit Agricole S.A.
7.875%, 5Y USD Swap + 4.898%, 01/23/24 (144A) (a) (c) | | | 1,750,000 | | | | 1,747,715 | |
8.125%, 5Y USD Swap + 6.185%, 12/23/25 (144A) (a) (c) | | | 7,050,000 | | | | 7,243,875 | |
8.375%, 3M LIBOR + 6.982%, 10/13/19 (144A) (c) | | | 640,000 | | | | 654,400 | |
See accompanying notes to financial statements.
BHFTII-5
Brighthouse Funds Trust II
Western Asset Management Strategic Bond Opportunities Portfolio
Schedule of Investments as of December 31, 2018
Corporate Bonds & Notes—(Continued)
| | | | | | | | |
| Security Description | | Principal
Amount* | | | Value | |
|
| Banks—(Continued) | |
Credit Suisse Group AG
7.250%, 5Y USD Swap + 4.332%, 09/12/25 (144A) (c) | | | 650,000 | | | $ | 613,178 | |
7.500%, 5Y USD Swap + 4.600%, 07/17/23 (144A) (c) | | | 3,390,000 | | | | 3,305,250 | |
7.500%, 5Y USD Swap + 4.598%, 12/11/23 (144A) (a) (c) | | | 4,365,000 | | | | 4,437,022 | |
Goldman Sachs Group, Inc. (The)
3.500%, 11/16/26 | | | 2,920,000 | | | | 2,698,485 | |
4.000%, 03/03/24 | | | 1,510,000 | | | | 1,489,925 | |
4.250%, 10/21/25 | | | 8,890,000 | | | | 8,517,147 | |
5.250%, 07/27/21 | | | 1,330,000 | | | | 1,380,608 | |
6.750%, 10/01/37 | | | 2,000,000 | | | | 2,260,783 | |
HSBC Holdings plc
3.900%, 05/25/26 | | | 10,850,000 | | | | 10,401,674 | |
4.583%, 3M LIBOR + 1.535%, 06/19/29 (c) | | | 2,650,000 | | | | 2,628,343 | |
6.000%, 5Y USD ICE Swap +
3.746%, 05/22/27 (a) (c) | | | 4,430,000 | | | | 3,989,126 | |
6.250%, 5Y USD ICE Swap + 3.453%, 03/23/23 (c) | | | 3,770,000 | | | | 3,534,375 | |
6.500%, 5Y USD ICE Swap + 3.606%, 03/23/28 (c) | | | 3,770,000 | | | | 3,425,987 | |
Intesa Sanpaolo S.p.A.
3.125%, 07/14/22 (144A) | | | 1,970,000 | | | | 1,821,397 | |
3.375%, 01/12/23 (144A) | | | 1,900,000 | | | | 1,759,970 | |
3.875%, 07/14/27 (144A) | | | 8,790,000 | | | | 7,565,119 | |
5.017%, 06/26/24 (144A) | | | 2,440,000 | | | | 2,207,852 | |
5.710%, 01/15/26 (144A) (a) | | | 19,740,000 | | | | 18,103,180 | |
6.500%, 02/24/21 (144A) | | | 1,175,000 | | | | 1,204,547 | |
JPMorgan Chase & Co.
3.625%, 12/01/27 | | | 6,430,000 | | | | 5,987,049 | |
3.875%, 09/10/24 | | | 2,722,000 | | | | 2,683,462 | |
Lloyds Banking Group plc
4.582%, 12/10/25 | | | 3,011,000 | | | | 2,851,823 | |
4.650%, 03/24/26 | | | 3,920,000 | | | | 3,687,275 | |
7.500%, 5Y USD Swap + 4.760%, 06/27/24 (c) | | | 3,580,000 | | | | 3,453,984 | |
Macquarie Group, Ltd.
6.000%, 01/14/20 (144A) | | | 3,200,000 | | | | 3,284,532 | |
6.250%, 01/14/21 (144A) | | | 400,000 | | | | 419,630 | |
Morgan Stanley
4.000%, 07/23/25 | | | 1,165,000 | | | | 1,149,844 | |
4.100%, 05/22/23 | | | 1,000,000 | | | | 1,001,384 | |
4.875%, 11/01/22 | | | 250,000 | | | | 257,610 | |
Royal Bank of Scotland Group plc
4.800%, 04/05/26 | | | 400,000 | | | | 389,806 | |
5.125%, 05/28/24 | | | 2,870,000 | | | | 2,782,461 | |
6.000%, 12/19/23 | | | 875,000 | | | | 885,534 | |
6.100%, 06/10/23 | | | 780,000 | | | | 792,272 | |
8.625%, 5Y USD Swap + 7.598%, 08/15/21 (c) | | | 2,890,000 | | | | 2,991,150 | |
Santander Holdings USA, Inc.
4.500%, 07/17/25 | | | 570,000 | | | | 564,608 | |
Santander UK Group Holdings plc
4.750%, 09/15/25 (144A) | | | 10,031,000 | | | | 9,431,186 | |
7.375%, 5Y GBP Swap + 5.543%, 06/24/22 (GBP) (c) | | | 2,620,000 | | | | 3,347,600 | |
Santander UK plc
7.950%, 10/26/29 (a) | | | 272,000 | | | | 318,955 | |
|
| Banks—(Continued) | |
| Standard Chartered plc | |
3.950%, 01/11/23 (144A) | | | 2,425,000 | | | | 2,365,589 | |
5.700%, 03/26/44 (144A) (a) | | | 600,000 | | | | 601,114 | |
UBS AG
7.625%, 08/17/22 | | | 2,850,000 | | | | 3,035,250 | |
UBS Group Funding Switzerland AG
4.253%, 03/23/28 (144A) | | | 2,950,000 | | | | 2,910,379 | |
Wells Fargo & Co.
4.300%, 07/22/27 | | | 10,990,000 | | | | 10,816,465 | |
Wells Fargo Capital X
5.950%, 12/01/86 | | | 90,000 | | | | 92,925 | |
| | | | | | | | |
| | | | | | | 288,560,029 | |
| | | | | | | | |
|
| Beverages—0.2% | |
Constellation Brands, Inc.
4.750%, 12/01/25 | | | 140,000 | | | | 143,045 | |
Cott Holdings, Inc.
5.500%, 04/01/25 (144A) | | | 5,530,000 | | | | 5,212,025 | |
| | | | | | | | |
| | | | | | | 5,355,070 | |
| | | | | | | | |
|
| Biotechnology—0.2% | |
Celgene Corp.
3.875%, 08/15/25 | | | 1,120,000 | | | | 1,078,668 | |
5.000%, 08/15/45 | | | 800,000 | | | | 740,672 | |
Gilead Sciences, Inc.
2.550%, 09/01/20 | | | 1,675,000 | | | | 1,661,161 | |
3.500%, 02/01/25 | | | 1,795,000 | | | | 1,772,033 | |
4.600%, 09/01/35 | | | 1,800,000 | | | | 1,819,184 | |
| | | | | | | | |
| | | | | | | 7,071,718 | |
| | | | | | | | |
|
| Building Materials—0.3% | |
Standard Industries, Inc.
5.375%, 11/15/24 (144A) | | | 8,710,000 | | | | 8,176,513 | |
6.000%, 10/15/25 (144A) | | | 1,790,000 | | | | 1,716,789 | |
| | | | | | | | |
| | | | | | | 9,893,302 | |
| | | | | | | | |
|
| Chemicals—0.2% | |
Monitchem HoldCo 2 S.A.
6.875%, 06/15/22 (EUR) (a) | | | 3,104,000 | | | | 2,843,205 | |
Olin Corp.
5.000%, 02/01/30 (a) | | | 3,250,000 | | | | 2,847,813 | |
| | | | | | | | |
| | | | | | | 5,691,018 | |
| | | | | | | | |
|
| Commercial Services—1.4% | |
Ashtead Capital, Inc.
4.375%, 08/15/27 (144A) (a) | | | 5,320,000 | | | | 4,788,000 | |
Brink’s Co. (The)
4.625%, 10/15/27 (144A) (a) | | | 3,420,000 | | | | 3,121,536 | |
Carriage Services, Inc.
6.625%, 06/01/26 (144A) | | | 5,500,000 | | | | 5,390,000 | |
FTI Consulting, Inc.
2.000%, 08/15/23 (144A) | | | 4,190,000 | | | | 3,993,594 | |
Hertz Corp. (The)
5.875%, 10/15/20 | | | 4,760,000 | | | | 4,617,200 | |
See accompanying notes to financial statements.
BHFTII-6
Brighthouse Funds Trust II
Western Asset Management Strategic Bond Opportunities Portfolio
Schedule of Investments as of December 31, 2018
Corporate Bonds & Notes—(Continued)
| | | | | | | | |
| Security Description | | Principal
Amount* | | | Value | |
|
| Commercial Services—(Continued) | |
Metropolitan Museum of Art (The)
3.400%, 07/01/45 | | | 2,025,000 | | | $ | 1,911,498 | |
Prime Security Services Borrower LLC / Prime Finance, Inc.
9.250%, 05/15/23 (144A) (a) | | | 4,143,000 | | | | 4,272,469 | |
UBM plc
5.750%, 11/03/20 (144A) | | | 50,000 | | | | 51,197 | |
United Rentals North America, Inc.
4.625%, 07/15/23 (a) | | | 1,341,000 | | | | 1,315,856 | |
4.625%, 10/15/25 | | | 760,000 | | | | 678,300 | |
4.875%, 01/15/28 (a) | | | 5,230,000 | | | | 4,589,325 | |
5.875%, 09/15/26 (a) | | | 5,000,000 | | | | 4,712,500 | |
6.500%, 12/15/26 (a) | | | 1,940,000 | | | | 1,910,900 | |
| | | | | | | | |
| | | | | | | 41,352,375 | |
| | | | | | | | |
|
| Computers—0.4% | |
Dell International LLC / EMC Corp.
3.480%, 06/01/19 (144A) | | | 1,000,000 | | | | 997,048 | |
4.420%, 06/15/21 (144A) | | | 12,010,000 | | | | 11,997,651 | |
| | | | | | | | |
| | | | | | | 12,994,699 | |
| | | | | | | | |
|
| Diversified Financial Services—2.1% | |
AerCap Ireland Capital DAC / AerCap Global Aviation Trust
4.625%, 10/30/20 | | | 1,060,000 | | | | 1,067,195 | |
5.000%, 10/01/21 | | | 15,056,000 | | | | 15,292,080 | |
Ally Financial, Inc.
8.000%, 11/01/31 | | | 525,000 | | | | 582,750 | |
ASP AMC Merger Sub, Inc.
8.000%, 05/15/25 (144A) (a) | | | 9,420,000 | | | | 4,992,600 | |
Carlyle Holdings II Finance LLC
5.625%, 03/30/43 (144A) | | | 3,370,000 | | | | 3,338,726 | |
International Lease Finance Corp. | |
8.250%, 12/15/20 | | | 2,613,000 | | | | 2,810,468 | |
8.625%, 01/15/22 | | | 2,500,000 | | | | 2,779,275 | |
Jerrold Finco plc
6.125%, 01/15/24 (144A) (GBP) | | | 1,780,000 | | | | 2,178,195 | |
KKR Group Finance Co. II LLC
5.500%, 02/01/43 (144A) | | | 130,000 | | | | 132,324 | |
Lions Gate Capital Holdings LLC
5.875%, 11/01/24 (144A) | | | 3,880,000 | | | | 3,831,500 | |
Navient Corp.
5.000%, 10/26/20 (a) | | | 5,811,000 | | | | 5,564,032 | |
Quicken Loans, Inc. | |
5.250%, 01/15/28 (144A) (a) | | | 1,050,000 | | | | 929,250 | |
5.750%, 05/01/25 (144A) | | | 15,600,000 | | | | 14,586,000 | |
Travelport Corporate Finance plc
6.000%, 03/15/26 (144A) | | | 3,238,000 | | | | 3,270,380 | |
Visa, Inc.
3.150%, 12/14/25 | | | 850,000 | | | | 835,691 | |
| | | | | | | | |
| | | | | | | 62,190,466 | |
| | | | | | | | |
|
| Electric—1.6% | |
Enel S.p.A.
7.750%, 5Y GBP Swap + 5.662%, 09/10/75 (GBP) (c) | | | 2,450,000 | | | | 3,295,215 | |
|
| Electric—(Continued) | |
Exelon Corp.
3.497%, 06/01/22 | | | 4,800,000 | | | | 4,690,315 | |
FirstEnergy Corp.
3.900%, 07/15/27 | | | 6,480,000 | | | | 6,279,622 | |
4.250%, 03/15/23 | | | 1,560,000 | | | | 1,584,872 | |
7.375%, 11/15/31 | | | 3,550,000 | | | | 4,488,706 | |
NSG Holdings LLC / NSG Holdings, Inc.
7.750%, 12/15/25 (144A) (d) (e) | | | 2,419,311 | | | | 2,552,373 | |
Pacific Gas & Electric Co.
2.950%, 03/01/26 (a) | | | 1,020,000 | | | | 839,039 | |
3.250%, 09/15/21 (a) | | | 4,853,000 | | | | 4,469,694 | |
3.250%, 06/15/23 (a) | | | 730,000 | | | | 645,760 | |
3.500%, 10/01/20 (a) | | | 8,840,000 | | | | 8,421,960 | |
Panoche Energy Center LLC
6.885%, 07/31/29 (144A) | | | 642,184 | | | | 662,922 | |
Perusahaan Listrik Negara PT
5.500%, 11/22/21 | | | 9,750,000 | | | | 10,054,687 | |
Southern California Edison Co.
3.900%, 03/15/43 | | | 1,217,000 | | | | 1,107,381 | |
| | | | | | | | |
| | | | | | | 49,092,546 | |
| | | | | | | | |
|
| Energy-Alternate Sources—0.1% | |
Alta Wind Holdings LLC
7.000%, 06/30/35 (144A) (d) (e) | | | 1,268,181 | | | | 1,377,360 | |
| | | | | | | | |
|
| Entertainment—0.7% | |
Downstream Development Authority of the Quapaw Tribe of Oklahoma
10.500%, 02/15/23 (144A) | | | 985,000 | | | | 970,225 | |
Live Nation Entertainment, Inc.
2.500%, 03/15/23 (144A) | | | 570,000 | | | | 580,395 | |
Scientific Games International, Inc.
10.000%, 12/01/22 (a) | | | 14,360,000 | | | | 14,539,356 | |
Speedway Motorsports, Inc.
5.125%, 02/01/23 (a) | | | 1,147,000 | | | | 1,124,060 | |
Vue International Bidco plc
7.875%, 07/15/20 (GBP) | | | 2,510,000 | | | | 3,147,258 | |
| | | | | | | | |
| | | | | | | 20,361,294 | |
| | | | | | | | |
|
| Environmental Control—0.0% | |
Waste Management, Inc.
3.500%, 05/15/24 | | | 890,000 | | | | 889,081 | |
4.600%, 03/01/21 | | | 180,000 | | | | 185,534 | |
7.375%, 05/15/29 | | | 190,000 | | | | 234,920 | |
| | | | | | | | |
| | | | | | | 1,309,535 | |
| | | | | | | | |
|
| Food—0.3% | |
Kraft Heinz Foods Co.
3.000%, 06/01/26 (a) | | | 340,000 | | | | 303,462 | |
3.950%, 07/15/25 | | | 60,000 | | | | 58,091 | |
5.000%, 07/15/35 | | | 250,000 | | | | 235,026 | |
5.000%, 06/04/42 | | | 130,000 | | | | 116,391 | |
5.200%, 07/15/45 | | | 390,000 | | | | 356,809 | |
See accompanying notes to financial statements.
BHFTII-7
Brighthouse Funds Trust II
Western Asset Management Strategic Bond Opportunities Portfolio
Schedule of Investments as of December 31, 2018
Corporate Bonds & Notes—(Continued)
| | | | | | | | |
| Security Description | | Principal
Amount* | | | Value | |
|
| Food—(Continued) | |
Lamb Weston Holdings, Inc.
4.625%, 11/01/24 (144A) (a) | | | 3,710,000 | | | $ | 3,607,975 | |
4.875%, 11/01/26 (144A) (a) | | | 4,870,000 | | | | 4,675,200 | |
| | | | | | | | |
| | | | | | | 9,352,954 | |
| | | | | | | | |
|
| Forest Products & Paper—0.1% | |
Suzano Austria GmbH
5.750%, 07/14/26 | | | 4,200,000 | | | | 4,284,000 | |
| | | | | | | | |
|
| Healthcare-Products—0.6% | |
Becton Dickinson & Co.
3.700%, 06/06/27 | | | 8,580,000 | | | | 8,111,339 | |
Immucor, Inc.
11.125%, 02/15/22 (144A) (a) | | | 7,080,000 | | | | 7,080,000 | |
Medtronic, Inc.
3.150%, 03/15/22 (a) | | | 1,393,000 | | | | 1,389,091 | |
3.500%, 03/15/25 (a) | | | 1,730,000 | | | | 1,723,911 | |
| | | | | | | | |
| | | | | | | 18,304,341 | |
| | | | | | | | |
|
| Healthcare-Services—1.7% | |
Centene Corp.
5.375%, 06/01/26 (144A) | | | 7,280,000 | | | | 7,079,800 | |
6.125%, 02/15/24 | | | 4,413,000 | | | | 4,517,809 | |
DaVita, Inc.
5.125%, 07/15/24 (a) | | | 500,000 | | | | 468,750 | |
Fresenius Medical Care U.S. Finance II, Inc.
4.750%, 10/15/24 (144A) | | | 700,000 | | | | 712,810 | |
HCA, Inc.
5.375%, 02/01/25 (a) | | | 6,010,000 | | | | 5,859,750 | |
5.500%, 06/15/47 (a) | | | 12,780,000 | | | | 12,109,050 | |
5.625%, 09/01/28 (a) | | | 9,460,000 | | | | 9,128,900 | |
Humana, Inc.
4.800%, 03/15/47 | | | 800,000 | | | | 801,711 | |
RegionalCare Hospital Partners Holdings, Inc.
8.250%, 05/01/23 (144A) | | | 4,513,000 | | | | 4,558,130 | |
Tenet Healthcare Corp.
7.500%, 01/01/22 (144A) (a) | | | 2,490,000 | | | | 2,527,350 | |
8.125%, 04/01/22 (a) | | | 4,255,000 | | | | 4,265,637 | |
| | | | | | | | |
| | | | | | | 52,029,697 | |
| | | | | | | | |
|
| Holding Companies-Diversified—0.1% | |
Co-operative Group Holdings, Ltd.
7.500%, 07/08/26 (GBP) (f) | | | 2,410,000 | | | | 3,388,179 | |
| | | | | | | | |
|
| Home Builders—0.5% | |
Lennar Corp.
4.500%, 04/30/24 | | | 4,180,000 | | | | 3,950,100 | |
4.750%, 11/29/27 (a) | | | 5,730,000 | | | | 5,171,325 | |
Taylor Morrison Communities, Inc. / Taylor Morrison Holdings II, Inc.
5.625%, 03/01/24 (144A) (a) | | | 6,000,000 | | | | 5,700,000 | |
5.875%, 04/15/23 (144A) (a) | | | 780,000 | | | | 752,700 | |
| | | | | | | | |
| | | | | | | 15,574,125 | |
| | | | | | | | |
|
| Housewares—0.1% | |
Newell Brands, Inc.
3.850%, 04/01/23 (a) | | | 1,750,000 | | | | 1,724,254 | |
| | | | | | | | |
|
| Insurance—0.8% | |
Ambac Assurance Corp.
5.100%, 06/07/20 (144A) | | | 20,207 | | | | 26,875 | |
Ambac LSNI LLC
7.803%, 3M LIBOR + 5.000%, 02/12/23 (144A) (c) | | | 87,492 | | | | 87,602 | |
American International Group, Inc.
3.750%, 07/10/25 | | | 770,000 | | | | 737,591 | |
6.250%, 3M LIBOR + 2.056%, 03/15/87 | | | 453,000 | | | | 437,145 | |
AXA S.A.
8.600%, 12/15/30 | | | 1,320,000 | | | | 1,632,959 | |
Delphi Financial Group, Inc.
7.875%, 01/31/20 | | | 2,190,000 | | | | 2,291,945 | |
Fidelity & Guaranty Life Holdings, Inc.
5.500%, 05/01/25 (144A) | | | 6,120,000 | | | | 5,846,436 | |
Liberty Mutual Insurance Co.
7.697%, 10/15/97 (144A) | | | 2,600,000 | | | | 3,514,570 | |
Massachusetts Mutual Life Insurance Co.
4.900%, 04/01/77 (144A) | | | 6,285,000 | | | | 6,278,130 | |
Prudential Financial, Inc.
5.625%, 3M LIBOR + 3.920%, 06/15/43 (c) | | | 550,000 | | | | 538,631 | |
5.875%, 3M LIBOR + 4.175%, 09/15/42 (c) | | | 1,200,000 | | | | 1,212,000 | |
Teachers Insurance & Annuity Association of America
4.900%, 09/15/44 (144A) | | | 1,771,000 | | | | 1,838,785 | |
6.850%, 12/16/39 (144A) | | | 216,000 | | | | 281,153 | |
| | | | | | | | |
| | | | | | | 24,723,822 | |
| | | | | | | | |
|
| Internet—0.9% | |
Booking Holdings, Inc.
3.650%, 03/15/25 | | | 1,625,000 | | | | 1,583,132 | |
Cogent Communications Group, Inc.
5.375%, 03/01/22 (144A) (a) | | | 6,333,000 | | | | 6,285,502 | |
Match Group, Inc.
5.000%, 12/15/27 (144A) (a) | | | 920,000 | | | | 844,100 | |
6.375%, 06/01/24 | | | 4,725,000 | | | | 4,807,688 | |
Netflix, Inc.
6.375%, 05/15/29 (144A) (a) | | | 6,500,000 | | | | 6,410,625 | |
Tencent Holdings, Ltd.
3.595%, 01/19/28 (144A) | | | 8,110,000 | | | | 7,624,375 | |
| | | | | | | | |
| | | | | | | 27,555,422 | |
| | | | | | | | |
|
| Iron/Steel—0.5% | |
Vale Overseas, Ltd.
6.250%, 08/10/26 | | | 3,990,000 | | | | 4,309,200 | |
6.875%, 11/10/39 (a) | | | 7,980,000 | | | | 9,216,900 | |
| | | | | | | | |
| | | | | | | 13,526,100 | |
| | | | | | | | |
|
| Leisure Time—0.9% | |
NCL Corp., Ltd.
4.750%, 12/15/21 (144A) | | | 5,262,000 | | | | 5,222,535 | |
Silversea Cruise Finance, Ltd.
7.250%, 02/01/25 (144A) | | | 5,285,000 | | | | 5,587,302 | |
See accompanying notes to financial statements.
BHFTII-8
Brighthouse Funds Trust II
Western Asset Management Strategic Bond Opportunities Portfolio
Schedule of Investments as of December 31, 2018
Corporate Bonds & Notes—(Continued)
| | | | | | | | |
| Security Description | | Principal
Amount* | | | Value | |
|
| Leisure Time—(Continued) | |
Viking Cruises, Ltd.
5.875%, 09/15/27 (144A) (a) | | | 11,372,000 | | | $ | 10,604,390 | |
VOC Escrow, Ltd.
5.000%, 02/15/28 (144A) | | | 6,000,000 | | | | 5,535,000 | |
| | | | | | | | |
| | | | | | | 26,949,227 | |
| | | | | | | | |
|
| Lodging—0.9% | |
Hilton Worldwide Finance LLC / Hilton Worldwide Finance Corp.
4.625%, 04/01/25 (a) | | | 1,250,000 | | | | 1,184,375 | |
4.875%, 04/01/27 | | | 11,970,000 | | | | 11,221,875 | |
Jack Ohio Finance LLC / Jack Ohio Finance 1 Corp.
10.250%, 11/15/22 (144A) | | | 7,468,000 | | | | 7,916,080 | |
Sands China, Ltd.
5.125%, 08/08/25 (144A) | | | 6,800,000 | | | | 6,736,159 | |
| | | | | | | | |
| | | | | | | 27,058,489 | |
| | | | | | | | |
|
| Machinery-Diversified—0.2% | |
Cleaver-Brooks, Inc.
7.875%, 03/01/23 (144A) | | | 4,350,000 | | | | 4,197,750 | |
MAI Holdings, Inc.
9.500%, 06/01/23 | | | 2,550,000 | | | | 2,448,000 | |
| | | | | | | | |
| | | | | | | 6,645,750 | |
| | | | | | | | |
|
| Media—5.0% | |
Altice France S.A.
7.375%, 05/01/26 (144A) | | | 16,085,000 | | | | 14,757,987 | |
Altice France S.A.
8.125%, 02/01/27 (144A) | | | 5,930,000 | | | | 5,589,025 | |
Altice Luxembourg S.A.
7.750%, 05/15/22 (144A) | | | 12,770,000 | | | | 11,620,700 | |
American Media LLC
5.500%, 09/01/21 (144A) (d) (e) | | | 5,350,000 | | | | 5,343,313 | |
10.500%, 12/31/26 (144A) | | | 8,006,316 | | | | 7,606,000 | |
CCO Holdings LLC / CCO Holdings Capital Corp.
5.000%, 02/01/28 (144A) | | | 3,960,000 | | | | 3,643,200 | |
5.125%, 05/01/27 (144A) (a) | | | 5,260,000 | | | | 4,899,164 | |
5.375%, 05/01/25 (144A) | | | 880,000 | | | | 843,700 | |
Charter Communications Operating LLC / Charter Communications Operating Capital Corp.
4.200%, 03/15/28 (a) | | | 8,160,000 | | | | 7,645,733 | |
4.908%, 07/23/25 | | | 9,064,000 | | | | 9,008,769 | |
5.375%, 04/01/38 (a) | | | 2,050,000 | | | | 1,910,558 | |
Comcast Corp.
4.700%, 10/15/48 | | | 11,430,000 | | | | 11,629,832 | |
CSC Holdings LLC
6.625%, 10/15/25 (144A) (a) | | | 2,680,000 | | | | 2,713,500 | |
10.125%, 01/15/23 (144A) (a) | | | 1,125,000 | | | | 1,210,230 | |
10.875%, 10/15/25 (144A) (a) | | | 5,667,000 | | | | 6,363,588 | |
DISH DBS Corp.
7.750%, 07/01/26 (a) | | | 13,290,000 | | | | 10,997,475 | |
EW Scripps Co. (The)
5.125%, 05/15/25 (144A) | | | 5,810,000 | | | | 5,330,675 | |
Meredith Corp.
6.875%, 02/01/26 (144A) (a) | | | 3,620,000 | | | | 3,538,550 | |
|
| Media—(Continued) | |
Time Warner Cable LLC
5.875%, 11/15/40 | | | 1,942,000 | | | | 1,832,423 | |
Univision Communications, Inc.
5.125%, 05/15/23 (144A) (a) | | | 2,540,000 | | | | 2,279,650 | |
5.125%, 02/15/25 (144A) (a) | | | 7,890,000 | | | | 6,923,475 | |
6.750%, 09/15/22 (144A) | | | 1,530,000 | | | | 1,541,093 | |
UPC Holding B.V.
5.500%, 01/15/28 (144A) (a) | | | 6,110,000 | | | | 5,529,550 | |
UPCB Finance IV, Ltd.
5.375%, 01/15/25 (144A) (a) | | | 2,296,000 | | | | 2,147,036 | |
Urban One, Inc.
7.375%, 04/15/22 (144A) (a) | | | 8,670,000 | | | | 8,193,150 | |
Virgin Media Secured Finance plc
5.500%, 01/15/25 (GBP) | | | 2,619,000 | | | | 3,311,471 | |
5.500%, 08/15/26 (144A) (a) | | | 5,985,000 | | | | 5,535,227 | |
| | | | | | | | |
| | | | | | | 151,945,074 | |
| | | | | | | | |
|
| Mining — 3.1% | |
Alcoa Nederland Holding B.V.
6.125%, 05/15/28 (144A) (a) | | | 12,052,000 | | | | 11,539,790 | |
Anglo American Capital plc
4.000%, 09/11/27 (144A) | | | 3,540,000 | | | | 3,198,705 | |
Barrick Gold Corp.
5.250%, 04/01/42 | | | 2,520,000 | | | | 2,521,467 | |
Barrick North America Finance LLC
5.750%, 05/01/43 | | | 11,289,000 | | | | 11,914,072 | |
BHP Billiton Finance USA, Ltd.
2.875%, 02/24/22 | | | 79,000 | | | | 78,402 | |
6.250%, 5Y USD Swap + 4.971%, 10/19/75 (144A) (c) | | | 2,392,000 | | | | 2,444,792 | |
6.750%, 5Y USD Swap + 5.093%, 10/19/75 (144A) (c) | | | 8,191,000 | | | | 8,518,640 | |
First Quantum Minerals, Ltd.
6.500%, 03/01/24 (144A) (a) | | | 2,740,000 | | | | 2,274,200 | |
7.000%, 02/15/21 (144A) (a) | | | 8,250,000 | | | | 7,920,000 | |
7.250%, 04/01/23 (144A) | | | 3,360,000 | | | | 2,956,800 | |
7.500%, 04/01/25 (144A) | | | 1,730,000 | | | | 1,427,250 | |
Freeport-McMoRan, Inc.
5.400%, 11/14/34 | | | 860,000 | | | | 677,250 | |
5.450%, 03/15/43 (a) | | | 16,860,000 | | | | 12,834,675 | |
Glencore Finance Canada, Ltd.
4.250%, 10/25/22 (144A) | | | 788,000 | | | | 785,506 | |
5.550%, 10/25/42 (144A) (a) | | | 1,000,000 | | | | 900,120 | |
Glencore Funding LLC
4.000%, 04/16/25 (144A) (a) | | | 6,580,000 | | | | 6,194,480 | |
HudBay Minerals, Inc.
7.250%, 01/15/23 (144A) | | | 3,770,000 | | | | 3,722,875 | |
7.625%, 01/15/25 (144A) (a) | | | 2,460,000 | | | | 2,404,650 | |
Midwest Vanadium Pty, Ltd.
11.500%, 02/15/18 (144A) (d) (e) (g) | | | 932,290 | | | | 93 | |
Northwest Acquisitions ULC / Dominion Finco, Inc.
7.125%, 11/01/22 (144A) | | | 4,210,000 | | | | 4,161,711 | |
Yamana Gold, Inc.
4.950%, 07/15/24 | | | 9,130,000 | | | | 8,974,001 | |
| | | | | | | | |
| | | | | | | 95,449,479 | |
| | | | | | | | |
See accompanying notes to financial statements.
BHFTII-9
Brighthouse Funds Trust II
Western Asset Management Strategic Bond Opportunities Portfolio
Schedule of Investments as of December 31, 2018
Corporate Bonds & Notes—(Continued)
| | | | | | | | |
| Security Description | | Principal
Amount* | | | Value | |
|
| Miscellaneous Manufacturing—0.4% | |
General Electric Co.
6.875%, 01/10/39 | | | 11,678,000 | | | $ | 12,227,141 | |
| | | | | | | | |
|
| Oil & Gas—5.9% | |
Anadarko Finance Co.
7.500%, 05/01/31 | | | 80,000 | | | | 94,666 | |
Anadarko Petroleum Corp.
4.500%, 07/15/44 | | | 800,000 | | | | 678,767 | |
5.550%, 03/15/26 | | | 2,250,000 | | | | 2,357,574 | |
6.450%, 09/15/36 | | | 220,000 | | | | 237,826 | |
Apache Corp.
3.250%, 04/15/22 | | | 452,000 | | | | 442,465 | |
4.250%, 01/15/44 | | | 260,000 | | | | 209,599 | |
4.750%, 04/15/43 | | | 7,000,000 | | | | 6,009,828 | |
Berry Petroleum Co. LLC
7.000%, 02/15/26 (144A) | | | 4,030,000 | | | | 3,627,000 | |
BP Capital Markets America, Inc.
3.119%, 05/04/26 (a) | | | 3,580,000 | | | | 3,408,198 | |
Cenovus Energy, Inc.
5.250%, 06/15/37 | | | 410,000 | | | | 361,565 | |
Centennial Resource Production LLC
5.375%, 01/15/26 (144A) | | | 1,490,000 | | | | 1,385,700 | |
Chesapeake Energy Corp.
8.000%, 01/15/25 (a) | | | 2,970,000 | | | | 2,621,025 | |
8.000%, 06/15/27 | | | 5,960,000 | | | | 5,006,400 | |
ConocoPhillips Holding Co.
6.950%, 04/15/29 | | | 375,000 | | | | 463,969 | |
Covey Park Energy LLC / Covey Park Finance Corp.
7.500%, 05/15/25 (144A) (a) | | | 12,790,000 | | | | 10,999,400 | |
Devon Energy Corp.
3.250%, 05/15/22 | | | 2,035,000 | | | | 1,982,912 | |
5.600%, 07/15/41 | | | 110,000 | | | | 104,417 | |
5.850%, 12/15/25 | | | 970,000 | | | | 1,029,261 | |
Diamondback Energy, Inc.
4.750%, 11/01/24 (a) | | | 9,328,000 | | | | 9,001,520 | |
5.375%, 05/31/25 (a) | | | 4,670,000 | | | | 4,553,250 | |
Eclipse Resources Corp.
8.875%, 07/15/23 | | | 2,715,000 | | | | 2,328,112 | |
Endeavor Energy Resources L.P. / EER Finance, Inc.
5.500%, 01/30/26 (144A) | | | 1,350,000 | | | | 1,383,750 | |
5.750%, 01/30/28 (144A) | | | 2,180,000 | | | | 2,224,036 | |
Ensco plc
7.750%, 02/01/26 (a) | | | 1,600,000 | | | | 1,184,000 | |
EOG Resources, Inc.
4.150%, 01/15/26 (a) | | | 1,665,000 | | | | 1,709,700 | |
EP Energy LLC / Everest Acquisition Finance, Inc.
6.375%, 06/15/23 (a) | | | 3,800,000 | | | | 1,197,000 | |
8.000%, 02/15/25 (144A) (a) | | | 2,660,000 | | | | 1,097,250 | |
9.375%, 05/01/24 (144A) (a) | | | 5,280,000 | | | | 2,349,600 | |
Extraction Oil & Gas, Inc.
5.625%, 02/01/26 (144A) (a) | | | 4,170,000 | | | | 3,044,100 | |
7.375%, 05/15/24 (144A) (a) | | | 5,030,000 | | | | 4,149,750 | |
Gazprom OAO Via Gaz Capital S.A.
4.950%, 03/23/27 (144A) | | | 10,470,000 | | | | 9,964,173 | |
KazMunayGas National Co. JSC
5.375%, 04/24/30 (144A) | | | 300,000 | | | | 294,457 | |
|
| Oil & Gas—(Continued) | |
KazMunayGas National Co. JSC
6.375%, 10/24/48 (144A) | | | 1,060,000 | | | | 1,066,360 | |
Kerr-McGee Corp.
6.950%, 07/01/24 | | | 290,000 | | | | 323,287 | |
7.875%, 09/15/31 | | | 285,000 | | | | 341,527 | |
MEG Energy Corp.
6.375%, 01/30/23 (144A) (a) | | | 5,000,000 | | | | 4,725,000 | |
7.000%, 03/31/24 (144A) (a) | | | 11,409,000 | | | | 10,895,595 | |
Noble Energy, Inc.
3.850%, 01/15/28 (a) | | | 1,910,000 | | | | 1,729,232 | |
6.000%, 03/01/41 | | | 10,200,000 | | | | 9,966,804 | |
Occidental Petroleum Corp.
3.125%, 02/15/22 | | | 110,000 | | | | 109,378 | |
3.500%, 06/15/25 | | | 1,850,000 | | | | 1,831,373 | |
4.625%, 06/15/45 | | | 230,000 | | | | 228,657 | |
Petrobras Global Finance B.V.
5.750%, 02/01/29 | | | 9,670,000 | | | | 8,944,750 | |
6.850%, 06/05/15 (a) | | | 12,700,000 | | | | 11,347,450 | |
QEP Resources, Inc.
5.250%, 05/01/23 (a) | | | 2,650,000 | | | | 2,345,250 | |
5.625%, 03/01/26 (a) | | | 5,060,000 | | | | 4,199,800 | |
6.875%, 03/01/21 | | | 1,050,000 | | | | 1,057,875 | |
Range Resources Corp.
4.875%, 05/15/25 | | | 1,945,000 | | | | 1,594,900 | |
5.000%, 03/15/23 (a) | | | 2,916,000 | | | | 2,566,080 | |
5.875%, 07/01/22 | | | 850,000 | | | | 786,250 | |
Shelf Drilling Holdings, Ltd.
8.250%, 02/15/25 (144A) | | | 8,350,000 | | | | 7,139,250 | |
Shell International Finance B.V.
2.875%, 05/10/26 (a) | | | 2,840,000 | | | | 2,721,232 | |
3.250%, 05/11/25 | | | 1,773,000 | | | | 1,749,026 | |
4.000%, 05/10/46 | | | 360,000 | | | | 348,142 | |
WPX Energy, Inc.
5.750%, 06/01/26 | | | 4,521,000 | | | | 4,091,505 | |
8.250%, 08/01/23 | | | 5,720,000 | | | | 5,977,400 | |
YPF S.A.
8.500%, 03/23/21 | | | 8,000,000 | | | | 7,900,000 | |
| | | | | | | | |
| | | | | | | 179,487,393 | |
| | | | | | | | |
|
| Oil & Gas Services—0.1% | |
KCA Deutag UK Finance plc
9.875%, 04/01/22 (144A) (a) | | | 3,750,000 | | | | 3,075,000 | |
| | | | | | | | |
|
| Packaging & Containers—0.7% | |
ARD Securities Finance SARL
8.750%, PIK, 01/31/23 (144A) (b) | | | 2,656,063 | | | | 2,244,373 | |
Ardagh Packaging Finance plc / Ardagh Holdings USA, Inc.
4.625%, 05/15/23 (144A) | | | 660,000 | | | | 625,211 | |
6.000%, 02/15/25 (144A) (a) | | | 5,200,000 | | | | 4,800,224 | |
7.250%, 05/15/24 (144A) | | | 4,860,000 | | | | 4,847,850 | |
Pactiv LLC
8.375%, 04/15/27 | | | 7,435,000 | | | | 7,360,650 | |
WestRock RKT Co.
4.000%, 03/01/23 | | | 140,000 | | | | 139,927 | |
| | | | | | | | |
| | | | | | | 20,018,235 | |
| | | | | | | | |
See accompanying notes to financial statements.
BHFTII-10
Brighthouse Funds Trust II
Western Asset Management Strategic Bond Opportunities Portfolio
Schedule of Investments as of December 31, 2018
Corporate Bonds & Notes—(Continued)
| | | | | | | | |
| Security Description | | Principal
Amount* | | | Value | |
|
| Pharmaceuticals—3.9% | |
| Allergan Funding SCS | |
3.450%, 03/15/22 | | | 450,000 | | | $ | 443,096 | |
4.550%, 03/15/35 | | | 3,400,000 | | | | 3,228,435 | |
4.750%, 03/15/45 (a) | | | 2,645,000 | | | | 2,514,084 | |
Bausch Health Cos., Inc.
5.500%, 11/01/25 (144A) | | | 5,070,000 | | | | 4,727,775 | |
5.625%, 12/01/21 (144A) | | | 2,740,000 | | | | 2,698,900 | |
BioScrip, Inc.
Zero Coupon, 08/15/20 (c) (e) (h) (i) | | | 17,830,000 | | | | 18,677,327 | |
8.875%, 02/15/21 (a) | | | 4,952,000 | | | | 4,617,740 | |
Cigna Corp.
4.800%, 08/15/38 (144A) | | | 8,120,000 | | | | 8,051,774 | |
CVS Health Corp.
3.875%, 07/20/25 (a) | | | 496,000 | | | | 483,568 | |
4.100%, 03/25/25 | | | 38,960,000 | | | | 38,618,079 | |
4.780%, 03/25/38 | | | 17,110,000 | | | | 16,413,639 | |
5.125%, 07/20/45 | | | 1,440,000 | | | | 1,403,478 | |
Mead Johnson Nutrition Co.
4.125%, 11/15/25 | | | 1,653,000 | | | | 1,696,570 | |
Teva Pharmaceutical Finance Netherlands III B.V.
2.800%, 07/21/23 (a) | | | 4,760,000 | | | | 4,099,273 | |
Valeant Pharmaceuticals International
9.250%, 04/01/26 (144A) | | | 11,675,000 | | | | 11,675,000 | |
| | | | | | | | |
| | | | | | | 119,348,738 | |
| | | | | | | | |
|
| Pipelines—4.0% | |
Andeavor Logistics L.P. / Tesoro Logistics Finance Corp.
5.500%, 10/15/19 | | | 600,000 | | | | 605,059 | |
Blue Racer Midstream LLC / Blue Racer Finance Corp.
6.125%, 11/15/22 (144A) | | | 1,825,000 | | | | 1,761,125 | |
6.625%, 07/15/26 (144A) | | | 2,910,000 | | | | 2,706,300 | |
DCP Midstream Operating L.P.
4.950%, 04/01/22 (a) | | | 1,620,000 | | | | 1,603,800 | |
6.750%, 09/15/37 (144A) | | | 3,480,000 | | | | 3,427,800 | |
El Paso Natural Gas Co. LLC
7.500%, 11/15/26 (a) | | | 4,250,000 | | | | 4,948,717 | |
8.375%, 06/15/32 | | | 190,000 | | | | 229,851 | |
Energy Transfer L.P.
5.500%, 06/01/27 | | | 1,376,000 | | | | 1,341,600 | |
5.875%, 01/15/24 | | | 1,638,000 | | | | 1,672,201 | |
Energy Transfer Partners L.P. / Regency Energy Finance Corp.
5.875%, 03/01/22 (a) | | | 780,000 | | | | 811,534 | |
Enterprise Products Operating LLC
3.700%, 02/15/26 | | | 1,072,000 | | | | 1,056,746 | |
3.750%, 02/15/25 | | | 2,100,000 | | | | 2,078,740 | |
3.900%, 02/15/24 | | | 225,000 | | | | 226,331 | |
5.375%, 3M LIBOR + 2.570%, 02/15/78 (c) | | | 13,090,000 | | | | 10,837,845 | |
Genesis Energy L.P. / Genesis Energy Finance Corp.
5.625%, 06/15/24 (a) | | | 1,060,000 | | | | 908,950 | |
6.000%, 05/15/23 (a) | | | 6,046,000 | | | | 5,592,550 | |
IFM U.S. Colonial Pipeline 2 LLC
6.450%, 05/01/21 (144A) | | | 2,500,000 | | | | 2,610,225 | |
Kinder Morgan, Inc.
4.300%, 06/01/25 (a) | | | 1,240,000 | | | | 1,233,839 | |
7.800%, 08/01/31 (a) | | | 67,000 | | | | 80,454 | |
|
| Pipelines—(Continued) | |
MPLX L.P.
4.875%, 12/01/24 | | | 4,500,000 | | | | 4,580,351 | |
NGPL PipeCo LLC
7.768%, 12/15/37 (144A) (a) | | | 4,180,000 | | | | 4,765,200 | |
Northwest Pipeline LLC
4.000%, 04/01/27 (a) | | | 14,460,000 | | | | 14,062,292 | |
Rockies Express Pipeline LLC
6.875%, 04/15/40 (144A) | | | 4,875,000 | | | | 5,094,375 | |
7.500%, 07/15/38 (144A) | | | 4,485,000 | | | | 5,068,050 | |
Southern Natural Gas Co. LLC
8.000%, 03/01/32 | | | 25,000 | | | | 31,869 | |
Targa Resources Partners L.P. / Targa Resources Partners Finance Corp.
5.125%, 02/01/25 | | | 4,791,000 | | | | 4,491,563 | |
5.375%, 02/01/27 (a) | | | 2,770,000 | | | | 2,596,875 | |
Williams Cos., Inc. (The)
8.750%, 03/15/32 | | | 28,712,000 | | | | 37,377,978 | |
| | | | | | | | |
| | | | | | | 121,802,220 | |
| | | | | | | | |
|
| Real Estate—0.3% | |
Hunt Cos., Inc.
6.250%, 02/15/26 (144A) | | | 5,160,000 | | | | 4,408,704 | |
Newmark Group, Inc.
6.125%, 11/15/23 (144A) | | | 4,900,000 | | | | 4,824,640 | |
| | | | | | | | |
| | | | | | | 9,233,344 | |
| | | | | | | | |
|
| Real Estate Investment Trusts—0.8% | |
CoreCivic, Inc.
4.625%, 05/01/23 | | | 820,000 | | | | 758,500 | |
5.000%, 10/15/22 (a) | | | 5,400,000 | | | | 5,170,500 | |
CTR Partnership L.P. / CareTrust Capital Corp.
5.250%, 06/01/25 | | | 6,560,000 | | | | 6,314,000 | |
GLP Capital L.P. / GLP Financing II, Inc.
5.375%, 04/15/26 | | | 10,000 | | | | 9,890 | |
5.750%, 06/01/28 | | | 4,400,000 | | | | 4,444,000 | |
MPT Operating Partnership L.P. / MPT Finance Corp.
5.000%, 10/15/27 | | | 7,770,000 | | | | 7,104,694 | |
| | | | | | | | |
| | | | | | | 23,801,584 | |
| | | | | | | | |
|
| Retail—1.1% | |
1011778 BC ULC / New Red Finance, Inc.
5.000%, 10/15/25 (144A) (a) | | | 3,770,000 | | | | 3,468,400 | |
AutoZone, Inc.
2.500%, 04/15/21 | | | 800,000 | | | | 782,266 | |
Golden Nugget, Inc.
8.750%, 10/01/25 (144A) (a) | | | 9,210,000 | | | | 8,864,625 | |
L Brands, Inc.
5.250%, 02/01/28 | | | 8,932,000 | | | | 7,636,860 | |
5.625%, 10/15/23 (a) | | | 4,550,000 | | | | 4,464,688 | |
McDonald’s Corp.
3.350%, 04/01/23 | | | 441,000 | | | | 438,744 | |
3.700%, 01/30/26 | | | 1,047,000 | | | | 1,026,859 | |
Sally Holdings LLC / Sally Capital, Inc.
5.625%, 12/01/25 | | | 1,660,000 | | | | 1,527,200 | |
See accompanying notes to financial statements.
BHFTII-11
Brighthouse Funds Trust II
Western Asset Management Strategic Bond Opportunities Portfolio
Schedule of Investments as of December 31, 2018
Corporate Bonds & Notes—(Continued)
| | | | | | | | |
| Security Description | | Principal
Amount* | | | Value | |
|
| Retail—(Continued) | |
| Tendam Brands S.A.U. | |
5.000%, 09/15/24 (144A) (EUR) | | | 1,350,000 | | | $ | 1,415,225 | |
5.250%, 3M EURIBOR + 5.250%, 09/15/24
(144A) (EUR) (c) | | | 3,750,000 | | | | 3,995,286 | |
| | | | | | | | |
| | | | | | | 33,620,153 | |
| | | | | | | | |
|
| Savings & Loans—0.3% | |
Nationwide Building Society
4.363%, 3M LIBOR + 1.392%, 08/01/24 (144A) (c) | | | 9,910,000 | | | | 9,708,511 | |
| | | | | | | | |
|
| Semiconductors—0.1% | |
Advanced Micro Devices, Inc.
7.000%, 07/01/24 (a) | | | 3,180,000 | | | | 3,267,450 | |
Broadcom Corp. / Broadcom Cayman Finance, Ltd.
3.125%, 01/15/25 | | | 280,000 | | | | 252,880 | |
3.875%, 01/15/27 | | | 750,000 | | | | 673,271 | |
| | | | | | | | |
| | | | | | | 4,193,601 | |
| | | | | | | | |
|
| Software—0.5% | |
j2 Cloud Services LLC / j2 GlobalCo-Obligor, Inc.
6.000%, 07/15/25 (144A) | | | 3,930,000 | | | | 3,841,575 | |
Microsoft Corp.
3.300%, 02/06/27 | | | 9,800,000 | | | | 9,712,272 | |
| | | | | | | | |
| | | | | | | 13,553,847 | |
| | | | | | | | |
|
| Telecommunications—3.7% | |
AT&T, Inc.
4.450%, 04/01/24 | | | 3,330,000 | | | | 3,385,028 | |
British Telecommunications plc
4.500%, 12/04/23 | | | 3,520,000 | | | | 3,567,468 | |
9.625%, 12/15/30 | | | 4,915,000 | | | | 6,647,409 | |
CommScope Technologies LLC
5.000%, 03/15/27 (144A) (a) | | | 2,510,000 | | | | 2,033,100 | |
6.000%, 06/15/25 (144A) (a) | | | 2,200,000 | | | | 2,002,000 | |
Deutsche Telekom International Finance B.V.
2.485%, 09/19/23 (144A) | | | 10,717,000 | | | | 10,119,115 | |
Intelsat Jackson Holdings S.A.
5.500%, 08/01/23 | | | 5,400,000 | | | | 4,698,000 | |
Millicom International Cellular S.A.
6.625%, 10/15/26 (144A) (a) | | | 4,290,000 | | | | 4,344,054 | |
Sprint Capital Corp.
8.750%, 03/15/32 | | | 9,850,000 | | | | 10,391,750 | |
Sprint Communications, Inc.
11.500%, 11/15/21 (a) | | | 1,313,000 | | | | 1,486,972 | |
Sprint Corp.
7.125%, 06/15/24 | | | 3,510,000 | | | | 3,478,621 | |
7.250%, 09/15/21 | | | 1,390,000 | | | | 1,422,665 | |
7.625%, 03/01/26 (a) | | | 2,330,000 | | | | 2,300,875 | |
7.875%, 09/15/23 | | | 5,700,000 | | | | 5,849,625 | |
T-Mobile USA, Inc.
4.750%, 02/01/28 (a) | | | 4,590,000 | | | | 4,153,950 | |
6.500%, 01/15/24 (a) | | | 803,000 | | | | 825,227 | |
Telecom Italia S.p.A.
5.303%, 05/30/24 (144A) (a) | | | 14,640,000 | | | | 13,908,000 | |
|
| Telecommunications—(Continued) | |
Telefonica Emisiones S.A.
4.103%, 03/08/27 | | | 5,600,000 | | | | 5,399,745 | |
Verizon Communications, Inc.
2.625%, 08/15/26 | | | 820,000 | | | | 743,832 | |
3.850%, 11/01/42 | | | 5,210,000 | | | | 4,512,013 | |
4.522%, 09/15/48 | | | 1,200,000 | | | | 1,125,772 | |
5.250%, 03/16/37 | | | 660,000 | | | | 688,218 | |
Vodafone Group plc
4.375%, 05/30/28 (a) | | | 8,080,000 | | | | 7,842,820 | |
5.250%, 05/30/48 | | | 1,680,000 | | | | 1,579,263 | |
Windstream Services LLC / Windstream Finance Corp.
10.500%, 06/30/24 (144A) | | | 12,215,000 | | | | 9,283,400 | |
| | | | | | | | |
| | | | | | | 111,788,922 | |
| | | | | | | | |
|
| Transportation—1.3% | |
Navios Maritime Acquisition Corp. / Navios Acquisition Finance U.S., Inc.
8.125%, 11/15/21 (144A) (a) | | | 4,670,000 | | | | 3,502,500 | |
Neovia Logistics Services LLC / SPL Logistics Finance Corp.
8.875%, 08/01/20 (144A) (a) | | | 8,000,000 | | | | 6,960,000 | |
Union Pacific Corp.
4.375%, 09/10/38 | | | 2,835,000 | | | | 2,805,726 | |
4.500%, 09/10/48 | | | 7,420,000 | | | | 7,326,965 | |
XPO CNW, Inc.
6.700%, 05/01/34 | | | 20,323,000 | | | | 17,274,550 | |
| | | | | | | | |
| | | | | | | 37,869,741 | |
| | | | | | | | |
|
| Trucking & Leasing—0.6% | |
DAE Funding LLC
4.500%, 08/01/22 (144A) | | | 80,000 | | | | 76,800 | |
5.750%, 11/15/23 (144A) | | | 10,100,000 | | | | 9,999,000 | |
Park Aerospace Holdings, Ltd.
4.500%, 03/15/23 (144A) | | | 3,800,000 | | | | 3,553,000 | |
5.250%, 08/15/22 (144A) | | | 5,120,000 | | | | 4,953,600 | |
| | | | | | | | |
| | | | | | | 18,582,400 | |
| | | | | | | | |
|
| Water—0.1% | |
Anglian Water Osprey Financing plc
5.000%, 04/30/23 (GBP) | | | 2,650,000 | | | | 3,312,770 | |
| | | | | | | | |
Total Corporate Bonds & Notes
(Cost $1,874,410,491) | | | | | | | 1,786,185,444 | |
| | | | | | | | |
|
| Mortgage-Backed Securities—9.0% | |
|
| Collateralized Mortgage Obligations—5.3% | |
Banc of America Funding Corp.
2.445%, 02/27/37 (144A) (c) | | | 15,965,174 | | | | 12,954,458 | |
Banc of America Funding Trust
2.918%, 03/27/36 (144A) (c) | | | 5,993,151 | | | | 5,175,011 | |
3.006%, 1M LIBOR + 0.165%, 09/29/36 (144A) (c) | | | 40,262,005 | | | | 30,225,557 | |
11.028%, 01/27/30 (144A) (c) | | | 15,380,119 | | | | 6,694,397 | |
Banc of America Mortgage Trust
4.363%, 09/25/35 (c) | | | 63,185 | | | | 60,857 | |
See accompanying notes to financial statements.
BHFTII-12
Brighthouse Funds Trust II
Western Asset Management Strategic Bond Opportunities Portfolio
Schedule of Investments as of December 31, 2018
Mortgage-Backed Securities—(Continued)
| | | | | | | | |
| Security Description | | Principal
Amount* | | | Value | |
|
| Collateralized Mortgage Obligations—(Continued) | |
BCAP LLC Trust
1.912%, 10/28/36 (144A) (c) | | | 1,530,630 | | | $ | 1,499,411 | |
3.961%, 05/26/47 (144A) (c) | | | 8,012,357 | | | | 7,737,701 | |
Bear Stearns Asset-Backed Securities Trust
22.723%,-1x 1M LIBOR + 33.583%, 07/25/36 (c) | | | 424,962 | | | | 633,935 | |
Countrywide Alternative Loan Trust
3.146%, 1M LIBOR + 0.640%, 07/25/35 (c) | | | 912,875 | | | | 892,290 | |
5.750%, 01/25/37 | | | 2,277,091 | | | | 1,886,873 | |
6.000%, 01/25/37 | | | 2,294,868 | | | | 2,080,294 | |
11.426%,-1x 1M LIBOR + 16.940%, 06/25/35 (c) | | | 1,573,517 | | | | 1,766,317 | |
15.281%,-1x 1M LIBOR + 22.800%, 02/25/36 (c) | | | 1,466,656 | | | | 1,486,202 | |
18.575%,-1x 1M LIBOR + 28.600%, 07/25/36 (c) | | | 2,561,411 | | | | 3,664,337 | |
23.963%,-1x 1M LIBOR + 39.000%, 08/25/37 (c) | | | 1,230,256 | | | | 1,900,547 | |
Countrywide Alternative Loan Trust Resecuritization
7.648%, 08/25/37 (c) | | | 3,108,279 | | | | 2,187,604 | |
Countrywide Home Loan Reperforming Loan REMIC Trust
3.881%, 03/25/35 (144A) (c) (d) (e) (j) | | | 5,316,367 | | | | 556,172 | |
Credit Suisse Mortgage Trust
2.515%, 1M LIBOR + 0.200%, 06/27/46 (144A) (c) | | | 1,064,653 | | | | 1,057,281 | |
16.741%, 1M LIBOR + 30.525%, 02/25/36 (c) | | | 1,232,614 | | | | 1,529,726 | |
Flagstar Mortgage Trust
3.500%, 04/25/48 (144A) (c) | | | 12,869,893 | | | | 12,608,801 | |
GreenPoint MTA Trust
2.946%, 1M LIBOR + 0.440%, 06/25/45 (c) | | | 1,288,442 | | | | 1,228,599 | |
GSMPS Mortgage Loan Trust
2.906%, 1M LIBOR + 0.400%, 04/25/36 (144A) (c) | | | 720,544 | | | | 602,867 | |
HarborView Mortgage Loan Trust
3.506%, 1M LIBOR + 1.000%, 10/25/37 (c) | | | 1,289,825 | | | | 1,281,867 | |
IndyMac INDX Mortgage Loan Trust
3.226%, 1M LIBOR + 0.720%, 01/25/35 (c) | | | 927,251 | | | | 801,796 | |
JPMorgan Mortgage Trust
2.500%, 03/25/43 (144A) (c) | | | 9,594 | | | | 9,254 | |
3.500%, 10/25/48 (144A) (c) | | | 9,269,918 | | | | 9,077,435 | |
6.500%, 01/25/36 | | | 96,145 | | | | 74,815 | |
JPMorgan Resecuritization Trust
2.525%, 1M LIBOR + 0.210%, 07/27/46 (144A) (c) | | | 2,060,849 | | | | 2,048,876 | |
Lehman XS Trust
2.666%, 1M LIBOR + 0.160%, 03/25/47 (c) | | | 1,516,061 | | | | 1,486,585 | |
2.706%, 1M LIBOR + 0.200%, 08/25/46 (c) | | | 2,139,319 | | | | 2,017,591 | |
MASTR Seasoned Securitization Trust
3.949%, 10/25/32 (c) | | | 127,994 | | | | 129,407 | |
Merrill Lynch Mortgage Investors Trust
4.311%, 05/25/34 (c) | | | 37,025 | | | | 36,593 | |
4.558%, 08/25/33 (c) | | | 588,476 | | | | 552,643 | |
Morgan Stanley Mortgage Loan Trust
2.826%, 1M LIBOR + 0.320%, 01/25/35 (c) | | | 616,197 | | | | 600,093 | |
New Residential Mortgage Loan Trust
4.250%, 09/25/56 (144A) (c) | | | 7,621,389 | | | | 7,748,411 | |
Nomura Resecuritization Trust
2.575%, 1M LIBOR + 0.260%, 02/26/46 (144A) (c) | | | 4,868,000 | | | | 4,702,282 | |
NovaStar Mortgage Funding Trust
2.696%, 1M LIBOR + 0.190%, 09/25/46 (c) | | | 723,454 | | | | 657,751 | |
Prime Mortgage Trust
5.500%, 05/25/35 (144A) | | | 305,765 | | | | 279,331 | |
6.000%, 05/25/35 (144A) | | | 2,231,701 | | | | 1,766,080 | |
|
| Collateralized Mortgage Obligations—(Continued) | |
RBSGC Mortgage Loan Trust
2.956%, 1M LIBOR + 0.450%, 01/25/37 (c) | | | 623,752 | | | | 407,402 | |
Residential Accredit Loans, Inc. Trust
3.405%, 11/25/37 (c) | | | 3,671,368 | | | | 3,257,788 | |
Residential Asset Securitization Trust
5.750%, 02/25/36 | | | 1,825,969 | | | | 1,797,397 | |
Sequoia Mortgage Trust
3.543%, 6M LIBOR + 0.680%, 06/20/33 (c) | | | 104,232 | | | | 103,445 | |
3.715%, 07/25/45 (144A) (c) | | | 10,053 | | | | 10,012 | |
Structured Adjustable Rate Mortgage Loan Trust
3.849%, 1M LIBOR + 1.500%, 09/25/37 (c) | | | 3,822,538 | | | | 3,726,962 | |
4.233%, 01/25/35 (c) | | | 381,181 | | | | 373,343 | |
4.267%, 09/25/35 (c) | | | 652,454 | | | | 516,169 | |
Structured Asset Mortgage Investments Trust
2.716%, 1M LIBOR + 0.210%, 05/25/46 (c) | | | 200,573 | | | | 168,722 | |
2.786%, 1M LIBOR + 0.280%, 02/25/36 (c) | | | 3,628,313 | | | | 3,408,429 | |
Structured Asset Securities Corp. Trust
2.856%, 1M LIBOR + 0.350%, 03/25/35 (c) | | | 1,412,676 | | | | 1,162,831 | |
WaMu Mortgage Pass-Through Certificates Trust
2.329%, COFI + 1.250%, 03/25/47 (c) | | | 1,687,337 | | | | 1,587,446 | |
2.776%, 1M LIBOR + 0.270%, 12/25/45 (c) | | | 436,055 | | | | 431,543 | |
2.986%, 1M LIBOR + 0.480%, 12/25/45 (c) | | | 13,106,689 | | | | 7,813,808 | |
3.657%, 09/25/36 (c) | | | 653,325 | | | | 598,572 | |
4.174%, 1M LIBOR + 6.680%, 04/25/37 (c) (e) (j) | | | 11,142,633 | | | | 2,670,553 | |
4.184%, 10/25/34 (c) | | | 542,944 | | | | 542,447 | |
4.239%, 08/25/33 (c) | | | 1,199,303 | | | | 1,183,830 | |
Wells Fargo Mortgage-Backed Securities Trust
4.425%, 06/25/35 (c) | | | 36,574 | | | | 37,574 | |
4.476%, 10/25/35 (c) | | | 32,696 | | | | 33,033 | |
| | | | | | | | |
| | | | | | | 161,531,353 | |
| | | | | | | | |
|
| Commercial Mortgage-Backed Securities—3.7% | |
BAMLLRe-REMIC Trust
5.780%, 08/10/45 (144A) (c) | | | 11,727,532 | | | | 8,538,816 | |
Banc of America Commercial Mortgage Trust
5.672%, 04/10/49 (c) | | | 1,616,129 | | | | 969,008 | |
Bayview Commercial Asset Trust
Zero Coupon, 07/25/37 (144A) (d) (e) (f) (j) | | | 2,731,482 | | | | 0 | |
BX Trust
7.955%, 1M LIBOR + 5.500%, 10/15/32 (144A) (c) | | | 26,480,000 | | | | 26,479,952 | |
Credit Suisse Commercial Mortgage Trust
5.373%, 12/15/39 | | | 550,353 | | | | 366,465 | |
5.869%, 09/15/40 (c) | | | 4,100,209 | | | | 3,966,680 | |
6.482%, 06/15/38 (c) | | | 584,059 | | | | 317,706 | |
10.075%, 1M LIBOR + 7.620%, 07/15/32 (144A) (c) | | | 26,600,000 | | | | 26,459,015 | |
Credit Suisse Mortgage Capital LLC
4.373%, 09/15/37 (144A) | | | 6,620,000 | | | | 5,925,668 | |
DBUBS Mortgage Trust
3.750%, 08/10/44 (144A) | | | 5,180,000 | | | | 3,332,916 | |
GE Business Loan Trust
2.875%, 1M LIBOR + 0.420%, 05/15/34 (144A) (c) | | | 419,945 | | | | 392,802 | |
GE Commercial Mortgage Corp. Trust
5.677%, 12/10/49 (c) | | | 220,000 | | | | 55,000 | |
See accompanying notes to financial statements.
BHFTII-13
Brighthouse Funds Trust II
Western Asset Management Strategic Bond Opportunities Portfolio
Schedule of Investments as of December 31, 2018
Mortgage-Backed Securities—(Continued)
| | | | | | | | |
| Security Description | | Principal
Amount* | | | Value | |
|
| Commercial Mortgage-Backed Securities—(Continued) | |
GMAC Commercial Mortgage Securities, Inc.
5.349%, 11/10/45 (c) | | | 1,037,309 | | | $ | 957,717 | |
GS Mortgage Securities Trust
5.622%, 11/10/39 | | | 1,879,481 | | | | 1,609,211 | |
JPMorgan Chase Commercial Mortgage Securities Trust
5.386%, 05/15/47 (c) | | | 2,280,000 | | | | 950,053 | |
5.502%, 06/12/47 (a) (c) | | | 5,220,000 | | | | 4,268,237 | |
5.503%, 01/15/49 (c) | | | 7,780,000 | | | | 1,595,756 | |
6.206%, 02/15/51 (c) | | | 193,728 | | | | 179,683 | |
Lone Star Portfolio Trust
9.605%, 1M LIBOR + 7.150%, 09/15/28 (144A) (c) | | | 5,545,947 | | | | 5,559,535 | |
9.673%, 1M LIBOR + 7.218%, 09/15/20 (144A) (c) | | | 2,942,635 | | | | 2,933,243 | |
ML-CFC Commercial Mortgage Trust
5.450%, 08/12/48 (c) | | | 525,878 | | | | 380,577 | |
5.450%, 08/12/48 (144A) (c) | | | 60,169 | | | | 43,544 | |
6.086%, 09/12/49 (c) | | | 3,203,634 | | | | 1,900,060 | |
Morgan Stanley Capital Trust
5.399%, 12/15/43 | | | 1,138,959 | | | | 859,330 | |
Multifamily Trust
10.442%, 04/25/46 (144A) (c) | | | 9,830,233 | | | | 10,343,823 | |
UBS-Barclays Commercial Mortgage Trust
4.892%, 05/10/63 (144A) (c) | | | 4,530,000 | | | | 2,807,312 | |
Waterfall Commercial Mortgage Trust
4.104%, 09/14/22 (144A) (c) | | | 1,526,061 | | | | 1,532,834 | |
| | | | | | | | |
| | | | | | | 112,724,943 | |
| | | | | | | | |
Total Mortgage-Backed Securities
(Cost $265,396,356) | | | | | | | 274,256,296 | |
| | | | | | | | |
|
| Floating Rate Loans (k)—8.6% | |
|
| Auto Components—0.2% | |
American Axle & Manufacturing, Inc.
Term Loan B, 4.750%, 1M LIBOR +
2.250%, 04/06/24 | | | 8,264,051 | | | | 7,869,442 | |
| | | | | | | | |
|
| Building Materials—0.3% | |
Quikrete Holdings, Inc.
1st Lien Term Loan, 5.272%, 1M LIBOR +
2.750%, 11/15/23 | | | 8,528,173 | | | | 8,139,075 | |
| | | | | | | | |
|
| Commercial Services—0.9% | |
Albany Molecular Research, Inc.
| |
1st Lien Term Loan, 5.772%, 1M LIBOR +
3.250%, 08/30/24 | | | 7,129,750 | | | | 6,773,262 | |
Jaguar Holding Co. II
Term Loan, 5.022%, 1M LIBOR + 2.500%, 08/18/22 | | | 6,199,028 | | | | 5,903,712 | |
Parexel International Corp.
Term Loan B, 5.272%, 1M LIBOR +
2.750%, 09/27/24 | | | 6,497,750 | | | | 5,921,075 | |
Prime Security Services Borrower LLC
1st Lien Term Loan, 5.272%, 1M LIBOR +
2.750%, 05/02/22 | | | 8,145,236 | | | | 7,829,608 | |
| | | | | | | | |
| | | | | | | 26,427,657 | |
| | | | | | | | |
|
| Distributors—0.3% | |
American Builders & Contractors Supply Co., Inc.
Term Loan B, 4.522%, 1M LIBOR +
2.000%, 10/31/23 | | | 8,508,897 | | | | 8,119,921 | |
| | | | | | | | |
|
| Entertainment—0.2% | |
Scientific Games International, Inc.
Term Loan B5, 5.250%, 3M LIBOR +
2.750%, 08/14/24 | | | 5,545,916 | | | | 5,221,480 | |
| | | | | | | | |
|
| Food—0.3% | |
Albertson’s LLC
Term Loan B6, 5.691%, 3M LIBOR +
3.000%, 06/22/23 | | | 6,801,125 | | | | 6,500,175 | |
Post Holdings, Inc.
Incremental Term Loan, 4.510%, 1M LIBOR +
2.000%, 05/24/24 | | | 1,824,390 | | | | 1,767,377 | |
| | | | | | | | |
| | | | | | | 8,267,552 | |
| | | | | | | | |
|
| Healthcare-Services—0.4% | |
MPH Acquisition Holdings LLC
Term Loan B, 5.553%, 3M LIBOR +
2.750%, 06/07/23 | | | 7,266,220 | | | | 6,872,027 | |
RadNet, Inc.
Term Loan, 6.190%, 3M LIBOR +
3.750%, 06/30/23 | | | 4,933,117 | | | | 4,883,786 | |
| | | | | | | | |
| | | | | | | 11,755,813 | |
| | | | | | | | |
|
| Hotels, Restaurants & Leisure—0.3% | |
CEC Entertainment, Inc.
Term Loan B, 5.772%, 1M LIBOR +
3.250%, 02/14/21 | | | 8,648,783 | | | | 8,058,503 | |
| | | | | | | | |
|
| Insurance—0.3% | |
UFC Holdings LLC
1st Lien Term Loan, 5.780%, 1M LIBOR +
3.250%, 08/18/23 | | | 8,298,975 | | | | 8,121,136 | |
| | | | | | | | |
|
| Internet—0.2% | |
Ancestry.com Operations, Inc.
1st Lien Term Loan, 5.780%, 1M LIBOR +
3.250%, 10/19/23 | | | 5,868,926 | | | | 5,612,160 | |
| | | | | | | | |
|
| Internet Software & Services—0.1% | |
Travelport Finance (Luxembourg) S.a.r.l.
Term Loan B, 1M LIBOR + 2.500%, 03/17/25 | | | 3,850,000 | | | | 3,792,250 | |
| | | | | | | | |
|
| Leisure Time—0.1% | |
Intrawest Resorts Holdings, Inc.
Term Loan B1, 5.522%, 1M LIBOR +
3.000%, 07/31/24 | | | 3,049,200 | | | | 2,945,018 | |
| | | | | | | | |
|
| Lodging—0.5% | |
Boyd Gaming Corp.
Term Loan B3, 4.666%, 1W LIBOR +
2.250%, 09/15/23 | | | 4,181,107 | | | | 4,003,410 | |
See accompanying notes to financial statements.
BHFTII-14
Brighthouse Funds Trust II
Western Asset Management Strategic Bond Opportunities Portfolio
Schedule of Investments as of December 31, 2018
Floating Rate Loans (k)—(Continued)
| | | | | | | | |
| Security Description | | Principal
Amount* | | | Value | |
|
| Lodging—(Continued) | |
Caesars Resort Collection LLC
1st Lien Term Loan B, 5.272%, 1M LIBOR +
2.750%, 12/22/24 | | | 8,712,000 | | | $ | 8,363,520 | |
MGM Growth Properties Operating Partnership L.P.
Term Loan B, 4.522%, 1M LIBOR +
2.000%, 4/23/23 | | | 2,451,104 | | | | 2,348,464 | |
| | | | | | | | |
| | | | | | | 14,715,394 | |
| | | | | | | | |
|
| Media—1.1% | |
Advantage Sales & Marketing, Inc.
1st Lien Term Loan, 5.772%, 1M LIBOR +
3.250%, 07/23/21 | | | 6,959,149 | | | | 6,176,245 | |
American Media, Inc.
Bridge Term Loan, 10.522%, 3M LIBOR + 8.000%, 01/07/19 (e) | | | 8,470,000 | | | | 8,470,000 | |
CBS Radio, Inc.
Term Loan B, 5.256%, 1M LIBOR +
2.750%, 11/18/24 | | | 8,550,471 | | | | 8,048,131 | |
Lions Gate Capital Holdings LLC
Term Loan B, 4.772%, 1M LIBOR +
2.250%, 03/24/25 | | | 3,675,501 | | | | 3,540,732 | |
Unitymedia Finance LLC
Term Loan B, 4.705%, 1M LIBOR +
2.250%, 09/30/25 | | | 130,000 | | | | 125,816 | |
Univision Communications, Inc.
Term Loan C5, 5.272%, 1M LIBOR +
2.750%, 03/15/24 | | | 8,683,480 | | | | 7,893,283 | |
| | | | | | | | |
| | | | | | | 34,254,207 | |
| | | | | | | | |
|
| Packaging & Containers—0.9% | |
Berry Global, Inc.
Term Loan Q, 4.387%, 3M LIBOR +
2.000%, 10/01/22 | | | 8,435,786 | | | | 8,230,164 | |
BWAY Holding Co.
Term Loan B, 5.658%, 3M LIBOR +
3.250%, 04/03/24 | | | 6,402,500 | | | | 6,046,361 | |
Flex Acquisition Co., Inc.
1st Lien Term Loan, 5.349%, 1M LIBOR +
3.000%, 12/29/23 | | | 5,276,947 | | | | 4,983,416 | |
Reynolds Group Holdings, Inc.
Term Loan, 5.272%, 1M LIBOR + 2.750%, 02/05/23 | | | 7,932,703 | | | | 7,595,563 | |
| | | | | | | | |
| | | | | | | 26,855,504 | |
| | | | | | | | |
|
| Pharmaceuticals—0.1% | |
Change Healthcare Holdings LLC
Term Loan B, 5.272%, 1M LIBOR +
2.750%, 03/01/24 | | | 2,589,938 | | | | 2,467,455 | |
| | | | | | | | |
|
| Professional Services—0.0% | |
Trans Union LLC
Term Loan B3, 4.522%, 1M LIBOR +
2.000%, 04/10/23 | | | 1,033,775 | | | | 998,369 | |
| | | | | | | | |
|
| Retail—1.2% | |
Academy, Ltd.
Term Loan B, 6.349%, 1M LIBOR +
4.000%, 07/01/22 | | | 9,671,166 | | | | 6,515,948 | |
CWGS Group LLC
Term Loan, 5.130%, 1M LIBOR + 2.750%, 11/08/23 | | | 1,303,400 | | | | 1,182,021 | |
Michaels Stores, Inc.
Term Loan B, 5.010%, 1M LIBOR +
2.500%, 01/30/23 | | | 6,572,633 | | | | 6,301,512 | |
Party City Holdings, Inc.
Term Loan B, 5.030%, 6M LIBOR +
2.500%, 08/19/22 | | | 3,444,549 | | | | 3,347,240 | |
Petco Animal Supplies, Inc.
Term Loan B, 5.777%, 3M LIBOR +
3.250%, 01/26/23 | | | 4,947,997 | | | | 3,682,136 | |
PetSmart, Inc.
Term Loan B2, 5.380%, 1M LIBOR +
3.000%, 03/11/22 | | | 21,004,735 | | | | 16,646,253 | |
| | | | | | | | |
| | | | | | | 37,675,110 | |
| | | | | | | | |
|
| Software—0.4% | |
Almonde, Inc.
1st Lien Term Loan, 6.303%, 3M LIBOR +
3.500%, 06/13/24 | | | 4,205,817 | | | | 3,934,542 | |
First Data Corp.
Term Loan, 4.504%, 1M LIBOR +
2.000%, 04/26/24 | | | 5,599,274 | | | | 5,364,805 | |
MA FinanceCo. LLC
Term Loan B3, 5.022%, 1M LIBOR +
2.500%, 06/21/24 | | | 467,240 | | | | 436,869 | |
Seattle Spinco, Inc.
Term Loan B3, 5.022%, 1M LIBOR +
2.500%, 06/21/24 | | | 3,155,385 | | | | 2,950,285 | |
| | | | | | | | |
| | | | | | | 12,686,501 | |
| | | | | | | | |
|
| Telecommunications—0.5% | |
Level 3 Financing, Inc.
Term Loan B, 4.754%, 1M LIBOR +
2.250%, 02/22/24 | | | 6,960,000 | | | | 6,594,600 | |
UPC Financing Partnership
Term Loan AR, 4.955%, 1M LIBOR +
2.500%, 01/15/26 | | | 7,362,937 | | | | 7,027,003 | |
Virgin Media Bristol LLC
Term Loan K, 4.955%, 1M LIBOR +
2.500%, 01/15/26 | | | 2,865,395 | | | | 2,724,274 | |
| | | | | | | | |
| | | | | | | 16,345,877 | |
| | | | | | | | |
|
| Trucking & Leasing—0.3% | |
Avolon TLB Borrower 1 (U.S.) LLC
Term Loan B3, 4.470%, 1M LIBOR +
2.000%, 01/15/25 | | | 10,720,421 | | | | 10,347,640 | |
| | | | | | | | |
Total Floating Rate Loans
(Cost $278,816,426) | | | | | | | 260,676,064 | |
| | | | | | | | |
See accompanying notes to financial statements.
BHFTII-15
Brighthouse Funds Trust II
Western Asset Management Strategic Bond Opportunities Portfolio
Schedule of Investments as of December 31, 2018
Foreign Government—8.2%
| | | | | | | | |
| Security Description | | Principal
Amount* | | | Value | |
|
| Regional Government—1.0% | |
Japan Finance Organization for Municipalities
4.000%, 01/13/21 | | | 1,900,000 | | | $ | 1,940,910 | |
Provincia de Buenos Aires
6.500%, 02/15/23 (144A) (a) (l) | | | 27,940,000 | | | | 22,491,700 | |
7.875%, 06/15/27 (144A) (l) | | | 3,990,000 | | | | 2,872,840 | |
9.125%, 03/16/24 (144A) (l) | | | 2,660,000 | | | | 2,201,150 | |
| | | | | | | | |
| | | | | | | 29,506,600 | |
| | | | | | | | |
|
| Sovereign—7.2% | |
Abu Dhabi Government International Bond
4.125%, 10/11/47 (144A) | | | 11,190,000 | | | | 10,714,425 | |
Argentina POM Politica Monetaria
59.257%, 06/21/20 (ARS) (c) | | | 307,940,000 | | | | 8,994,530 | |
Argentine Republic Government International Bonds
4.625%, 01/11/23 | | | 10,080,000 | | | | 7,963,200 | |
5.625%, 01/26/22 | | | 3,620,000 | | | | 3,054,375 | |
5.875%, 01/11/28 (a) | | | 5,700,000 | | | | 4,096,875 | |
7.500%, 04/22/26 | | | 13,580,000 | | | | 10,880,975 | |
7.625%, 04/22/46 | | | 1,170,000 | | | | 847,665 | |
Bahamas Government International Bond
5.750%, 01/16/24 (144A) | | | 1,500,000 | | | | 1,516,875 | |
Bermuda Government International Bond
4.138%, 01/03/23 (144A) | | | 2,000,000 | | | | 2,022,340 | |
Bonos de la Nacion Argentina con Ajuste por CER
4.000%, 03/06/20 (ARS) (l) | | | 95,160,000 | | | | 3,183,792 | |
Brazil Notas do Tesouro Nacional
10.000%, 01/01/21 (BRL) | | | 26,217,000 | | | | 7,075,549 | |
10.000%, 01/01/27 (BRL) | | | 46,432,000 | | | | 12,533,567 | |
Brazilian Government International Bond
6.000%, 04/07/26 (a) | | | 6,470,000 | | | | 6,910,931 | |
Ecuador Government International Bonds
8.750%, 06/02/23 (144A) (a) | | | 1,740,000 | | | | 1,622,550 | |
10.750%, 03/28/22 (144A) | | | 8,450,000 | | | | 8,523,937 | |
Ghana Government International Bonds
7.625%, 05/16/29 (144A) | | | 10,140,000 | | | | 9,082,601 | |
8.125%, 01/18/26 (l) | | | 4,200,000 | | | | 4,005,792 | |
Honduras Government International Bond
6.250%, 01/19/27 | | | 4,140,000 | | | | 4,088,664 | |
Indonesia Government International Bonds
5.125%, 01/15/45 | | | 3,000,000 | | | | 2,949,474 | |
5.250%, 01/17/42 (a) | | | 15,090,000 | | | | 15,145,275 | |
Indonesia Treasury Bonds
7.000%, 05/15/22 (IDR) | | | 9,560,000,000 | | | | 646,794 | |
7.000%, 05/15/27 (IDR) | | | 382,929,000,000 | | | | 24,925,003 | |
8.375%, 09/15/26 (IDR) | | | 66,608,000,000 | | | | 4,709,524 | |
Kuwait International Government Bond
3.500%, 03/20/27 (144A) | | | 11,030,000 | | | | 10,967,614 | |
Mexico Government International Bond
4.125%, 01/21/26 | | | 8,170,000 | | | | 7,986,175 | |
Qatar Government International Bond
5.103%, 04/23/48 (144A) | | | 10,100,000 | | | | 10,607,525 | |
Russian Federal Bond - OFZ
7.050%, 01/19/28 (RUB) | | | 1,755,525,000 | | | | 22,915,680 | |
|
| Sovereign—(Continued) | |
Senegal Government International Bonds
6.250%, 05/23/33 (144A) (l) | | | 8,720,000 | | | | 7,496,584 | |
6.750%, 03/13/48 (144A) (l) | | | 4,470,000 | | | | 3,696,690 | |
| | | | | | | | |
| | | | | | | 219,164,981 | |
| | | | | | | | |
Total Foreign Government
(Cost $284,163,033) | | | | | | | 248,671,581 | |
| | | | | | | | |
|
| U.S. Treasury & Government Agencies—6.0% | |
|
| Agency Sponsored Mortgage - Backed—3.9% | |
Fannie Mae 15 Yr. Pool
3.000%, TBA (m) | | | 100,000 | | | | 99,785 | |
5.000%, 12/01/21 | | | 6,570 | | | | 6,678 | |
Fannie Mae 20 Yr. Pool
3.000%, 12/01/37 | | | 1,958,308 | | | | 1,939,383 | |
8.500%, 08/01/19 | | | 577 | | | | 576 | |
Fannie Mae 30 Yr. Pool
3.000%, 11/01/46 | | | 3,386,219 | | | | 3,306,246 | |
3.000%, 11/01/48 | | | 800,000 | | | | 780,955 | |
4.000%, TBA (m) | | | 1,700,000 | | | | 1,733,504 | |
5.000%, 01/01/39 | | | 260,004 | | | | 275,475 | |
5.000%, 06/01/40 | | | 151,260 | | | | 160,619 | |
5.000%, 07/01/40 | | | 105,330 | | | | 111,848 | |
5.000%, 11/01/48 | | | 589,688 | | | | 619,490 | |
5.000%, TBA (m) | | | 100,000 | | | | 104,779 | |
6.000%, 07/01/38 | | | 14,776 | | | | 15,858 | |
6.500%, 08/01/31 | | | 282 | | | | 303 | |
6.500%, 12/01/36 | | | 1,001 | | | | 1,147 | |
6.500%, 06/01/37 | | | 15,718 | | | | 16,869 | |
6.500%, 10/01/37 | | | 15,954 | | | | 17,823 | |
7.000%, 05/01/26 | | | 1,118 | | | | 1,158 | |
7.000%, 07/01/30 | | | 248 | | | | 251 | |
7.000%, 01/01/31 | | | 257 | | | | 272 | |
7.000%, 07/01/31 | | | 1,167 | | | | 1,227 | |
7.000%, 09/01/31 | | | 2,487 | | | | 2,696 | |
7.000%, 10/01/31 | | | 2,370 | | | | 2,637 | |
7.000%, 11/01/31 | | | 17,097 | | | | 17,854 | |
7.000%, 01/01/32 | | | 5,420 | | | | 5,495 | |
7.000%, 02/01/32 | | | 2,423 | | | | 2,428 | |
7.500%, 12/01/29 | | | 437 | | | | 440 | |
7.500%, 01/01/30 | | | 405 | | | | 469 | |
7.500%, 02/01/30 | | | 304 | | | | 306 | |
7.500%, 06/01/30 | | | 177 | | | | 177 | |
7.500%, 08/01/30 | | | 78 | | | | 79 | |
7.500%, 09/01/30 | | | 514 | | | | 569 | |
7.500%, 10/01/30 | | | 39 | | | | 41 | |
7.500%, 11/01/30 | | | 9,427 | | | | 9,777 | |
7.500%, 02/01/31 | | | 1,103 | | | | 1,111 | |
8.000%, 08/01/27 | | | 181 | | | | 185 | |
8.000%, 07/01/30 | | | 468 | | | | 550 | |
8.000%, 09/01/30 | | | 376 | | | | 388 | |
Fannie Mae REMICS (CMO)
2.856%, 1M LIBOR + 0.350%, 05/25/34 (c) | | | 98,878 | | | | 98,943 | |
4.500%, 06/25/29 | | | 188,453 | | | | 193,472 | |
9.750%, 08/25/19 | | | 51 | | | | 51 | |
See accompanying notes to financial statements.
BHFTII-16
Brighthouse Funds Trust II
Western Asset Management Strategic Bond Opportunities Portfolio
Schedule of Investments as of December 31, 2018
U.S. Treasury & Government Agencies—(Continued)
| | | | | | | | |
| Security Description | | Principal
Amount* | | | Value | |
|
| Agency Sponsored Mortgage - Backed—(Continued) | |
Freddie Mac 20 Yr. Gold Pool
3.000%, 02/01/38 | | | 2,268,969 | | | $ | 2,233,259 | |
3.000%, 04/01/38 | | | 1,990,174 | | | | 1,960,441 | |
Freddie Mac 30 Yr. Gold Pool
3.000%, 04/01/47 | | | 1,553,312 | | | | 1,515,209 | |
3.000%, TBA (m) | | | 6,500,000 | | | | 6,335,373 | |
4.000%, 09/01/48 | | | 2,258,877 | | | | 2,303,333 | |
4.000%, TBA (m) | | | 3,200,000 | | | | 3,262,174 | |
5.000%, 08/01/48 | | | 599,998 | | | | 628,185 | |
5.000%, 11/01/48 | | | 99,645 | | | | 104,586 | |
6.000%, 12/01/36 | | | 14,834 | | | | 16,182 | |
6.000%, 02/01/37 | | | 11,250 | | | | 12,171 | |
7.000%, 03/01/39 | | | 94,274 | | | | 106,909 | |
Freddie Mac Multifamily Structured Pass-Through Certificates (CMO)
1.330%, 08/25/42 (c) (j) | | | 70,400,000 | | | | 2,980,201 | |
Freddie Mac REMICS (CMO)
1,156.500%, 06/15/21 (j) | | | 2 | | | | 8 | |
Freddie Mac Structured Agency Credit Risk Debt Notes (CMO)
5.756%, 1M LIBOR + 3.250%, 07/25/29 (c) | | | 11,730,000 | | | | 12,337,368 | |
5.956%, 1M LIBOR + 3.450%, 10/25/29 (c) | | | 17,780,000 | | | | 18,814,677 | |
6.956%, 1M LIBOR + 4.450%, 03/25/30 (c) | | | 8,840,000 | | | | 9,353,439 | |
7.006%, 1M LIBOR + 4.500%, 02/25/24 (c) | | | 2,210,000 | | | | 2,477,843 | |
7.656%, 1M LIBOR + 5.150%, 10/25/29 (c) | | | 10,500,000 | | | | 11,764,486 | |
13.506%, 1M LIBOR + 11.000%, 10/25/48 (144A) (c) | | | 6,500,000 | | | | 6,644,134 | |
Ginnie Mae I 30 Yr. Pool
3.500%, 06/15/48 | | | 4,205,909 | | | | 4,251,491 | |
5.000%, 04/15/35 | | | 9,362 | | | | 9,961 | |
5.500%, 01/15/34 | | | 43,216 | | | | 46,733 | |
5.500%, 04/15/34 | | | 12,546 | | | | 13,571 | |
5.500%, 07/15/34 | | | 74,009 | | | | 80,098 | |
5.500%, 10/15/34 | | | 45,050 | | | | 48,229 | |
5.750%, 10/15/38 | | | 95,027 | | | | 102,154 | |
6.000%, 02/15/33 | | | 1,304 | | | | 1,420 | |
6.000%, 03/15/33 | | | 4,134 | | | | 4,470 | |
6.000%, 06/15/33 | | | 3,820 | | | | 4,158 | |
6.000%, 07/15/33 | | | 6,219 | | | | 6,783 | |
6.000%, 09/15/33 | | | 5,036 | | | | 5,405 | |
6.000%, 10/15/33 | | | 2,697 | | | | 2,923 | |
6.000%, 08/15/34 | | | 13,888 | | | | 14,905 | |
6.500%, 03/15/29 | | | 786 | | | | 847 | |
6.500%, 02/15/32 | | | 734 | | | | 837 | |
6.500%, 03/15/32 | | | 860 | | | | 983 | |
6.500%, 11/15/32 | | | 3,757 | | | | 4,123 | |
7.000%, 03/15/31 | | | 93 | | | | 94 | |
Ginnie Mae II 30 Yr. Pool
3.000%, 09/20/47 | | | 735,001 | | | | 723,470 | |
3.000%, 11/20/47 | | | 2,952,836 | | | | 2,906,227 | |
3.500%, 06/20/44 | | | 1,871,513 | | | | 1,892,093 | |
3.500%, TBA (m) | | | 5,400,000 | | | | 5,436,826 | |
5.000%, 08/20/34 | | | 45,298 | | | | 48,077 | |
5.000%, 08/20/48 | | | 197,862 | | | | 206,205 | |
5.000%, 11/20/48 | | | 99,820 | | | | 104,012 | |
5.000%, TBA (m) | | | 4,600,000 | | | | 4,785,531 | |
|
| Agency Sponsored Mortgage - Backed—(Continued) | |
Ginnie Mae II 30 Yr. Pool
5.500%, 03/20/34 | | | 6,611 | | | | 7,061 | |
6.000%, 05/20/32 | | | 8,812 | | | | 9,545 | |
6.000%, 11/20/33 | | | 10,653 | | | | 11,559 | |
Ginnie Mae II ARM Pool
4.030%, 1Y CMT + 1.440%, 01/20/60 (c) | | | 644,307 | | | | 661,828 | |
4.345%, 1Y CMT, 05/20/60 (c) | | | 458,824 | | | | 471,883 | |
Government National Mortgage Association (CMO)
0.414%, 03/16/47 (c) (j) | | | 6,703,237 | | | | 91,318 | |
0.462%, 04/16/52 (c) (j) | | | 10,641,010 | | | | 151,346 | |
2.614%, 1M LIBOR + 0.300%, 05/20/68 (c) | | | 3,069,453 | | | | 3,060,047 | |
3.000%, 04/20/41 | | | 451,325 | | | | 450,020 | |
| | | | | | | | |
| | | | | | | 117,998,125 | |
| | | | | | | | |
|
| Federal Agencies—0.1% | |
Tennessee Valley Authority
5.980%, 04/01/36 | | | 1,760,000 | | | | 2,314,057 | |
| | | | | | | | |
|
| U.S. Treasury—2.0% | |
U.S. Treasury Bond
3.125%, 05/15/48
| | | 830,000 | | | | 847,215 | |
U.S. Treasury Notes
1.250%, 03/31/19 (a) | | | 40,060,000 | | | | 39,945,631 | |
1.250%, 08/31/19 | | | 15,290,000 | | | | 15,152,032 | |
2.750%, 09/30/20 | | | 470,000 | | | | 471,696 | |
2.875%, 10/15/21 | | | 60,000 | | | | 60,628 | |
2.875%, 11/30/25 | | | 1,790,000 | | | | 1,822,931 | |
2.875%, 05/15/28 | | | 1,100,000 | | | | 1,117,690 | |
2.875%, 08/15/28 | | | 3,120,000 | | | | 3,170,467 | |
| | | | | | | | |
| | | | | | | 62,588,290 | |
| | | | | | | | |
Total U.S. Treasury & Government Agencies
(Cost $183,244,906) | | | | | | | 182,900,472 | |
| | | | | | | | |
|
| Asset-Backed Securities—5.3% | |
|
| Asset-Backed - Credit Card—0.2% | |
CreditShop Credit Card Co. LLC
10.307%, 1M LIBOR + 8.000%, 10/15/22 (144A) (c) | | | 4,732,650 | | | | 4,768,145 | |
| | | | | | | | |
|
| Asset-Backed - Home Equity—0.3% | |
Asset-Backed Securities Corp. Home Equity Loan Trust
5.305%, 1M LIBOR + 2.850%, 04/15/33 (c) | | | 390 | | | | 392 | |
Bear Stearns Asset-Backed Securities Trust
3.246%, 1M LIBOR + 0.740%, 01/25/34 (c) | | | 12,298 | | | | 11,740 | |
EMC Mortgage Loan Trust
3.406%, 1M LIBOR + 0.900%, 05/25/43 (144A) (c) | | | 178,674 | | | | 176,860 | |
Structured Asset Securities Corp. Mortgage Loan Trust
2.726%, 1M LIBOR + 0.220%, 02/25/36 (144A) (c) | | | 2,602,771 | | | | 128,451 | |
WaMu Asset-Backed Certificates Trust
2.676%, 1M LIBOR + 0.170%, 07/25/47 (c) | | | 9,739,919 | | | | 7,538,164 | |
| | | | | | | | |
| | | | | | | 7,855,607 | |
| | | | | | | | |
See accompanying notes to financial statements.
BHFTII-17
Brighthouse Funds Trust II
Western Asset Management Strategic Bond Opportunities Portfolio
Schedule of Investments as of December 31, 2018
Asset-Backed Securities—(Continued)
| | | | | | | | |
| Security Description | | Principal
Amount* | | | Value | |
|
| Asset-Backed - Manufactured Housing—0.2% | |
Origen Manufactured Housing Contract Trust
4.043%, 10/15/37 (c) | | | 1,118,097 | | | $ | 1,066,582 | |
4.755%, 04/15/37 (c) | | | 1,120,974 | | | | 1,076,322 | |
UCFC Manufactured Housing Contract
7.095%, 04/15/29 (c) | | | 3,631,641 | | | | 3,475,061 | |
| | | | | | | | |
| | | | | | | 5,617,965 | |
| | | | | | | | |
|
| Asset-Backed - Other—4.6% | |
AIMCO CLO
6.149%, 3M LIBOR + 3.680%, 07/20/29 (144A) (c) | | | 6,750,000 | | | | 6,550,328 | |
Ammc CLO, Ltd.
8.259%, 3M LIBOR + 5.810%, 04/17/29 (144A) (c) | | | 6,600,000 | | | | 6,123,790 | |
Amortizing Residential Collateral Trust
4.306%, 1M LIBOR + 1.800%, 08/25/32 (c) | | | 23,169 | | | | 20,952 | |
Applebee’s Funding LLC / IHOP Funding LLC
4.277%, 09/05/44 (144A) | | | 5,144,875 | | | | 5,131,827 | |
Ares CLO, Ltd.
8.986%, 3M LIBOR + 6.550%, 10/15/29 (144A) (c) | | | 9,300,000 | | | | 8,893,553 | |
Avery Point VI CLO, Ltd.
5.532%, 3M LIBOR + 2.950%, 08/05/27 (144A) (c) | | | 2,280,000 | | | | 2,150,170 | |
Barings CLO, Ltd.
9.895%, 3M LIBOR + 7.450%, 07/18/29 (144A) (c) | | | 1,700,000 | | | | 1,523,465 | |
Bear Stearns Asset-Backed Securities Trust
6.000%, 10/25/36 | | | 1,620,981 | | | | 1,218,106 | |
BlueMountain CLO, Ltd.
8.395%, 3M LIBOR + 5.750%, 11/20/28 (144A) (c) | | | 2,500,000 | | | | 2,335,335 | |
Carlyle U.S. CLO, Ltd.
6.169%, 3M LIBOR + 3.700%, 07/20/31 (144A) (c) | | | 9,500,000 | | | | 9,286,554 | |
Catskill Park CLO, Ltd.
8.469%, 3M LIBOR + 6.000%, 04/20/29 (144A) (c) | | | 7,600,000 | | | | 7,049,008 | |
Cent CLO 24, Ltd.
5.586%, 3M LIBOR + 3.150%, 10/15/26 (144A) (c) | | | 5,240,000 | | | | 4,969,585 | |
Countrywide Asset-Backed Certificates Trust
4.381%, 1M LIBOR + 1.875%, 06/25/34 (c) | | | 114,427 | | | | 106,774 | |
Countrywide Revolving Home Equity Loan Resecuritization Trust
2.755%, 1M LIBOR + 0.300%, 12/15/33 (144A) (c) | | | 142,991 | | | | 133,674 | |
Countrywide Revolving Home Equity Loan Trust
2.595%, 1M LIBOR + 0.140%, 07/15/36 (c) | | | 256,037 | | | | 242,036 | |
CVP CLO, Ltd.
5.119%, 3M LIBOR + 2.650%, 01/20/31 (144A) (c) | | | 4,500,000 | | | | 4,063,860 | |
First Horizon Asset-Backed Trust
2.666%, 1M LIBOR + 0.160%, 10/25/34 (c) | | | 340 | | | | 338 | |
Greenwood Park CLO, Ltd.
7.386%, 3M LIBOR + 4.950%, 04/15/31 (144A) (c) | | | 7,380,000 | | | | 6,427,840 | |
LCM XXII, Ltd.
8.002%, 3M LIBOR + 5.500%, 10/20/28 (144A) (c) | | | 5,000,000 | | | | 4,657,125 | |
Long Beach Mortgage Loan Trust
2.999%, 1M LIBOR + 0.520%, 01/21/31 (c) | | | 15,554 | | | | 15,148 | |
Midocean Credit CLO VII
6.316%, 3M LIBOR + 3.880%, 07/15/29 (144A) (c) | | | 4,000,000 | | | | 3,867,516 | |
Oaktree CLO, Ltd.
7.669%, 3M LIBOR + 5.200%, 10/20/27 (144A) (c) | | | 5,500,000 | | | | 4,967,160 | |
Ocean Trails CLO
10.186%, 3M LIBOR + 7.750%, 07/15/28 (144A) (c) | | | 5,120,000 | | | | 5,119,524 | |
|
| Asset-Backed - Other—(Continued) | |
Ratchet Trading, Ltd.
15.190%, 01/26/27 (144A) (c) | | | 1,831,243 | | | | 1,849,823 | |
SACO I Trust
2.846%, 1M LIBOR + 0.340%, 03/25/36 (c) | | | 47,693 | | | | 46,510 | |
Saranac CLO III, Ltd.
6.074%, 3M LIBOR + 3.250%, 06/22/30 (144A) (c) | | | 4,652,500 | | | | 4,397,180 | |
SBA Small Business Investment Cos.
2.845%, 03/10/27 | | | 4,075,805 | | | | 4,077,923 | |
SoFi Consumer Loan Program LLC
3.280%, 01/26/26 (144A) | | | 2,298,935 | | | | 2,297,789 | |
TCI-Symphony CLO, Ltd.
5.436%, 3M LIBOR + 3.000%, 10/13/29 (144A) (c) | | | 1,700,000 | | | | 1,600,681 | |
7.936%, 3M LIBOR + 5.500%, 10/13/29 (144A) (c) | | | 5,150,000 | | | | 4,799,630 | |
Thayer Park CLO, Ltd.
8.569%, 3M LIBOR + 6.100%, 04/20/29 (144A) (c) | | | 8,400,000 | | | | 7,842,030 | |
Treman Park CLO, Ltd.
5.115%, 3M LIBOR + 2.650%, 10/20/28 (144A) (c) | | | 1,250,000 | | | | 1,179,917 | |
7.965%, 3M LIBOR + 5.500%, 10/20/28 (144A) (c) | | | 1,750,000 | | | | 1,592,922 | |
Upgrade Pass-Through Trust
5.339%, 10/15/24 (144A) | | | 1,776,096 | | | | 1,790,715 | |
12.075%, 09/15/24 (144A) | | | 2,026,752 | | | | 2,047,938 | |
14.960%, 12/27/27 (144A) (c) | | | 2,246,865 | | | | 2,267,399 | |
15.309%, 08/15/24 (144A) | | | 2,392,375 | | | | 2,417,370 | |
15.498%, 06/15/24 (144A) | | | 2,163,584 | | | | 2,186,137 | |
16.537%, 05/15/24 (144A) | | | 2,068,492 | | | | 2,090,006 | |
Venture CLO, Ltd.
8.176%, 3M LIBOR + 5.740%, 04/15/27 (144A) (c) | | | 4,000,000 | | | | 3,670,472 | |
Voya CLO, Ltd.
8.456%, 3M LIBOR + 6.020%, 06/07/30 (144A) (c) | | | 3,500,000 | | | | 3,245,550 | |
WhiteHorse, Ltd.
6.076%, 3M LIBOR + 3.650%, 10/15/31 (144A) (c) | | | 6,180,000 | | | | 5,832,122 | |
| | | | | | | | |
| | | | | | | 140,085,782 | |
| | | | | | | | |
|
| Asset-Backed - Student Loan—0.0% | |
SoFi Professional Loan Program LLC
Zero Coupon, 08/25/36 (144A) | | | 500 | | | | 1,064,323 | |
| | | | | | | | |
Total Asset-Backed Securities
(Cost $166,338,121) | | | | | | | 159,391,822 | |
| | | | | | | | |
|
| Convertible Bonds—1.0% | |
|
| Computers—0.0% | |
Western Digital Corp.
1.500%, 02/01/24 | | | 1,820,000 | | | | 1,474,930 | |
| | | | | | | | |
|
| Internet—0.0% | |
Twitter, Inc.
1.000%, 09/15/21 | | | 1,170,000 | | | | 1,067,076 | |
| | | | | | | | |
|
| Media—0.8% | |
DISH Network Corp. | |
2.375%, 03/15/24 | | | 5,890,000 | | | | 4,689,418 | |
3.375%, 08/15/26 (a) | | | 3,090,000 | | | | 2,495,224 | |
See accompanying notes to financial statements.
BHFTII-18
Brighthouse Funds Trust II
Western Asset Management Strategic Bond Opportunities Portfolio
Schedule of Investments as of December 31, 2018
Convertible Bonds—(Continued)
| | | | | | | | |
| Security Description | | Principal
Amount*/
Shares | | | Value | |
|
| Media—(Continued) | |
Liberty Interactive LLC
1.750%, 09/30/46 | | | 2,590,000 | | | $ | 2,648,146 | |
Liberty Media Corp.
2.125%, 03/31/48 (144A) | | | 7,700,000 | | | | 7,200,424 | |
2.250%, 12/01/48 (144A) | | | 6,030,000 | | | | 5,951,387 | |
| | | | | | | | |
| | | | | | | 22,984,599 | |
| | | | | | | | |
|
| Oil & Gas—0.1% | |
Chesapeake Energy Corp.
5.500%, 09/15/26 (a) | | | 4,120,000 | | | | 3,316,031 | |
| | | | | | | | |
|
| Pipelines—0.0% | |
Cheniere Energy, Inc.
4.250%, 03/15/45 | | | 2,020,000 | | | | 1,405,112 | |
| | | | | | | | |
|
| Telecommunications—0.1% | |
GCI Liberty, Inc.
1.750%, 09/30/46 | | | 1,520,000 | | | | 1,480,068 | |
| | | | | | | | |
Total Convertible Bonds
(Cost $35,273,222) | | | | | | | 31,727,816 | |
| | | | | | | | |
|
| Convertible Preferred Stock—0.2% | |
|
| Banks—0.2% | |
Wells Fargo & Co., Series L
7.500%
(Cost $5,598,292) | | | 4,965 | | | | 6,265,681 | |
| | | | | | | | |
|
| Municipals—0.1% | |
Massachusetts State Development Finance Agency, Board Institute, Revenue Bond
5.375%, 04/01/41 | | | 400,000 | | | | 431,216 | |
Texas Municipal Gas Acquisition & Supply Corp. III, Revenue Bonds
5.000%, 12/15/30 | | | 750,000 | | | | 809,243 | |
5.000%, 12/15/31 | | | 1,550,000 | | | | 1,669,427 | |
Virginia Housing Development Authority
6.000%, 06/25/34 | | | 622,953 | | | | 644,644 | |
| | | | | | | | |
Total Municipals
(Cost $3,503,109) | | | | | | | 3,554,530 | |
| | | | | | | | |
|
| Preferred Stocks—0.1% | |
|
| Banks—0.0% | |
Citigroup Capital
8.890%, 3M LIBOR + 6.370%, 10/30/40 (c) | | | 51,160 | | | | 1,352,159 | |
| | | | | | | | |
|
| Capital Markets—0.1% | |
B. Riley Financial, Inc.
6.875%, 09/30/23 (a) | | | 64,075 | | | | 1,478,851 | |
| | | | | | | | |
|
| Marine—0.0% | |
Tricer Tracking Preferred Equity
Certificates (e) (h) (i) (n) | | | 10,446,300 | | | | 8,946 | |
| | | | | | | | |
Total Preferred Stocks
(Cost $3,776,699) | | | | | | | 2,839,956 | |
| | | | | | | | |
|
| Common Stocks—0.1% | |
|
| Air Freight & Logistics—0.0% | |
Ceva Logistics AG (n) | | | 12,627 | | | | 384,339 | |
| | | | | | | | |
|
| Diversified Consumer Services—0.0% | |
Ascent CNR Corp. - Class A (e) (n) | | | 1,399,556 | | | | 27,991 | |
| | | | | | | | |
|
| Marine—0.0% | |
Tricer Holdco SCA (e) (h) (i) (n) | | | 211,536 | | | | 26 | |
| | | | | | | | |
|
| Media—0.0% | |
Cengage Learning, Inc. (n) | | | 10,995 | | | | 43,980 | |
ION Media Networks, Inc. (h) (n) | | | 785 | | | | 412,392 | |
| | | | | | | | |
| | | | | | | 456,372 | |
| | | | | | | | |
|
| Oil, Gas & Consumable Fuels—0.1% | |
Berry Petroleum Corp. (a) | | | 166,055 | | | | 1,452,981 | |
| | | | | | | | |
Total Common Stocks
(Cost $6,058,023) | | | | | | | 2,321,709 | |
| | | | | | | | |
|
| Escrow Shares—0.0% | |
|
| Energy Equipment & Services—0.0% | |
Hercules Offshore, Inc. (e) (h) (i) | | | 10,611 | | | | 9,622 | |
| | | | | | | | |
|
| Forest Products & Paper—0.0% | |
Sino-Forest Corp. (i) | | | 1,246,000 | | | | 0 | |
Sino-Forest Corp. (i) | | | 500,000 | | | | 0 | |
| | | | | | | | |
| | | | | | | 0 | |
| | | | | | | | |
|
| Oil & Gas—0.0% | |
Berry Petroleum Co. LLC (e) (g) (h) (i) | | | 850,000 | | | | 0 | |
Berry Petroleum Co. LLC (e) (g) (h) (i) | | | 1,040,000 | | | | 0 | |
| | | | | | | | |
| | | | | | | 0 | |
| | | | | | | | |
Total Escrow Shares
(Cost $463,409) | | | | | | | 9,622 | |
| | | | | | | | |
See accompanying notes to financial statements.
BHFTII-19
Brighthouse Funds Trust II
Western Asset Management Strategic Bond Opportunities Portfolio
Schedule of Investments as of December 31, 2018
Short-Term Investment—0.1%
| | | | | | | | |
| Security Description | | Principal
Amount* | | | Value | |
|
| Repurchase Agreement—0.1% | |
Fixed Income Clearing Corp.
Repurchase Agreement dated 12/31/18 at 1.200%, due on 01/02/19 with a maturity value of $3,167,377; collateralized by U.S. Treasury Note at 2.125%, maturing 11/30/23, with a market value of $3,232,201. | | | 3,167,166 | | | $ | 3,167,166 | |
| | | | | | | | |
Total Short-Term Investments
(Cost $3,167,166) | | | | | | | 3,167,166 | |
| | | | | | | | |
|
| Securities Lending Reinvestments (o)—10.2% | |
|
| Certificates of Deposit—6.4% | |
Banco Del Estado De Chile New York
2.695%, 1M LIBOR + 0.240%, 01/17/19 (c) | | | 4,000,000 | | | | 3,999,964 | |
Bank of Montreal (Chicago)
2.710%, 1M LIBOR + 0.330%, 08/06/19 (c) | | | 5,000,000 | | | | 4,999,875 | |
Bank of Nova Scotia
2.890%, SOFR + 0.430%, 05/16/19 (c) | | | 5,000,000 | | | | 4,999,996 | |
3.072%, 3M LIBOR + 0.280%, 03/20/19 (c) | | | 10,000,000 | | | | 10,003,990 | |
Barclays Bank plc
2.500%, 02/01/19 | | | 3,000,000 | | | | 2,999,613 | |
2.547%, 1M LIBOR + 0.200%, 02/04/19 (c) | | | 10,000,000 | | | | 9,999,050 | |
Canadian Imperial Bank of Commerce
2.556%, 3M LIBOR + 0.120%, 01/14/19 (c) | | | 5,000,000 | | | | 4,999,360 | |
2.740%, 1M LIBOR + 0.270%, 07/19/19 (c) | | | 7,000,000 | | | | 6,997,158 | |
China Construction Bank Corp.
2.550%, 01/07/19 | | | 2,500,000 | | | | 2,500,000 | |
Citibank N.A.
2.490%, 02/04/19 | | | 5,000,000 | | | | 4,999,305 | |
Commonwealth Bank of Australia
2.617%, 3M LIBOR + 0.140%, 04/23/19 (c) | | | 3,500,000 | | | | 3,500,011 | |
Credit Agricole S.A.
2.500%, 02/12/19 | | | 7,000,000 | | | | 6,998,810 | |
2.799%, 1M LIBOR + 0.320%, 05/21/19 (c) | | | 5,000,000 | | | | 5,000,315 | |
Credit Industriel et Commercial
Zero Coupon, 01/25/19 | | | 3,948,913 | | | | 3,993,200 | |
Credit Industriel et Commercial (NY)
2.629%, 1M LIBOR + 0.250%, 02/05/19 (c) | | | 5,000,000 | | | | 5,000,125 | |
Credit Suisse AG
2.620%, 04/01/19 | | | 5,000,000 | | | | 4,997,410 | |
2.890%, SOFR + 0.430%, 05/02/19 (c) | | | 2,000,000 | | | | 1,999,976 | |
Industrial & Commercial Bank of China, Ltd.
2.850%, 02/15/19 | | | 2,500,000 | | | | 2,499,815 | |
Mizuho Bank, Ltd., New York
2.649%, 1M LIBOR + 0.300%, 05/01/19 (c) | | | 2,000,000 | | | | 2,000,012 | |
MUFG Bank Ltd.
2.649%, 1M LIBOR + 0.300%, 05/01/19 (c) | | | 2,000,000 | | | | 2,000,012 | |
Natixis New York
2.705%, 3M LIBOR + 0.090%, 05/10/19 (c) | | | 4,000,000 | | | | 3,997,480 | |
Royal Bank of Canada New York
2.665%, 1M LIBOR + 0.210%, 09/17/19 (c) | | | 8,000,000 | | | | 7,991,816 | |
Skandinaviska Enskilda Banken
2.645%, 1M LIBOR + 0.190%, 04/17/19 (c) | | | 7,000,000 | | | | 6,999,426 | |
Societe Generale
2.719%, 3M LIBOR + 0.160%, 05/07/19 (c) | | | 4,000,000 | | | | 3,998,224 | |
|
| Certificates of Deposit—(Continued) | |
Standard Chartered plc
2.686%, 1M LIBOR + 0.180%, 02/25/19 (c) | | | 8,000,000 | | | | 7,999,768 | |
2.717%, 3M LIBOR + 0.230%, 04/24/19 (c) | | | 5,000,000 | | | | 4,998,910 | |
State Street Bank and Trust
2.725%, 1M LIBOR + 0.270%, 05/15/19 (c) | | | 7,000,000 | | | | 6,999,860 | |
Sumitomo Mitsui Banking Corp.
2.590%, 1M LIBOR + 0.190%, 04/11/19 (c) | | | 10,000,000 | | | | 9,996,330 | |
Sumitomo Mitsui Banking Corp., New York
2.549%, 1M LIBOR + 0.200%, 04/03/19 (c) | | | 2,000,059 | | | | 1,999,408 | |
Svenska Handelsbanken AB
2.620%, 3M LIBOR + 0.100%, 04/30/19 (c) | | | 5,000,000 | | | | 4,999,775 | |
2.822%, 1M LIBOR + 0.300%, 10/31/19 (c) | | | 2,000,000 | | | | 1,999,532 | |
Toronto-Dominion Bank
2.665%, 1M LIBOR + 0.210%, 09/17/19 (c) | | | 6,000,000 | | | | 5,994,288 | |
U.S. Bank N.A.
2.764%, 1M LIBOR + 0.260%, 07/23/19 (c) | | | 6,000,000 | | | | 6,000,000 | |
Wells Fargo Bank N.A.
2.560%, 3M LIBOR + 0.140%, 07/11/19 (c) | | | 8,000,000 | | | | 8,006,939 | |
2.730%, 3M LIBOR + 0.210%, 10/25/19 (c) | | | 4,000,000 | | | | 4,000,000 | |
Westpac Banking Corp.
2.850%, FEDEFF PRV + 0.450%, 02/15/19 (c) | | | 12,500,000 | | | | 12,499,921 | |
| | | | | | | | |
| | | | | | | 192,969,674 | |
| | | | | | | | |
|
| Commercial Paper—1.9% | |
Alpine Securities Ltd.
2.529%, 1M LIBOR + 0.180%, 04/03/19 (c) | | | 4,000,000 | | | | 3,998,892 | |
Banco Santander S.A.
2.740%, 02/07/19 | | | 5,957,987 | | | | 5,982,528 | |
Bank of China, Ltd.
2.690%, 01/17/19 | | | 5,959,650 | | | | 5,992,956 | |
HSBC Bank plc
2.842%, 1M LIBOR + 0.320%, 07/30/19 (c) | | | 3,000,000 | | | | 3,000,000 | |
ING Funding LLC
2.725%, 3M LIBOR + 0.110%, 05/10/19 (c) | | | 10,000,000 | | | | 9,998,820 | |
Matchpoint Finance plc
2.890%, 05/08/19 | | | 4,927,349 | | | | 4,946,265 | |
Sheffield Receivables Co.
2.930%, SOFR + 0.470%, 05/30/19 (c) | | | 5,000,000 | | | | 4,999,920 | |
Toronto-Dominion Bank
2.729%, 1M LIBOR + 0.350%, 11/05/19 (c) | | | 7,000,000 | | | | 6,999,230 | |
UBS AG
2.779%, 1M LIBOR + 0.430%, 02/01/19 (c) | | | 11,000,000 | | | | 11,002,695 | |
Westpac Banking Corp.
2.784%, 1M LIBOR + 0.280%, 05/24/19 (c) | | | 2,000,000 | | | | 1,999,920 | |
| | | | | | | | |
| | | | | | | 58,921,226 | |
| | | | | | | | |
|
| Master Demand Notes—0.3% | |
Natixis Financial Products LLC
2.640%, OBFR + 0.250%, 01/02/19 (c) | | | 10,000,000 | | | | 10,000,000 | |
| | | | | | | | |
|
| Repurchase Agreements—1.6% | |
Citadel Clearing LLC
Repurchase Agreement dated 12/31/18 at 3.000%, due on 04/02/19 with a maturity value of $8,061,333; collateralized by various Common Stock with an aggregate market value of $8,801,467. | | | 8,000,000 | | | | 8,000,000 | |
See accompanying notes to financial statements.
BHFTII-20
Brighthouse Funds Trust II
Western Asset Management Strategic Bond Opportunities Portfolio
Schedule of Investments as of December 31, 2018
Securities Lending Reinvestments (o)—(Continued)
| | | | | | | | |
| Security Description | | Principal
Amount* | | | Value | |
|
| Repurchase Agreements—(Continued) | |
Citigroup Global Markets, Inc.
Repurchase Agreement dated 12/31/18 at 2.790%, due on 02/04/19 with a maturity value of $5,013,563; collateralized by U.S. Treasury Obligations at 0.000%, maturing 02/12/19, and various Common Stock with an aggregate market value of $5,441,594. | | | 5,000,000 | | | $ | 5,000,000 | |
Repurchase Agreement dated 12/31/18 at 2.940%, due on 04/02/19 with a maturity value of $2,015,027; collateralized by U.S. Treasury Obligations with rates ranging from 1.125% - 2.750%, maturity dates ranging from 01/31/19 - 08/15/24, and an aggregate market value of $2,040,000. | | | 2,000,000 | | | | 2,000,000 | |
Citigroup Global Markets, Ltd.
Repurchase Agreement dated 12/31/18 at 2.490%, due on 01/02/19 with a maturity value of $200,028; collateralized by U.S. Treasury Obligations with rates ranging from 0.375% - 1.875%, maturity dates ranging from 12/15/20 - 01/15/27, and an aggregate market value of $204,000. | | | 200,000 | | | | 200,000 | |
Repurchase Agreement dated 12/31/18 at 2.490%, due on 01/02/19 with a maturity value of $300,042; collateralized by U.S. Treasury Obligations with rates ranging from 1.625% - 2.875%, maturity dates ranging from 06/30/20 - 11/15/46, and an aggregate market value of $306,000. | | | 300,000 | | | | 300,000 | |
Deutsche Bank Securities, Inc.
Repurchase Agreement dated 12/31/18 at 3.200%, due on 01/02/19 with a maturity value of $3,658,471; collateralized by U.S. Treasury Obligations at 0.000%, maturity dates ranging from 08/15/30 - 08/15/39, and an aggregate market value of $3,730,977. | | | 3,657,820 | | | | 3,657,820 | |
Merrill Lynch, Pierce, Fenner & Smith, Inc.
Repurchase Agreement dated 12/31/18 at 2.940%, due on 04/02/19 with a maturity value of $12,593,917; collateralized by various Common Stock with an aggregate market value of $13,750,000. | | | 12,500,000 | | | | 12,500,000 | |
NBC Global Finance, Ltd.
Repurchase Agreement dated 12/31/18 at 2.560%, due on 01/02/19 with a maturity value of $2,000,284; collateralized by various Common Stock with an aggregate market value of $2,226,425. | | | 2,000,000 | | | | 2,000,000 | |
Repurchase Agreement dated 12/31/18 at 2.560%, due on 01/02/19 with a maturity value of $1,000,142; collateralized by various Common Stock with an aggregate market value of $1,113,212. | | | 1,000,000 | | | | 1,000,000 | |
Societe Generale
Repurchase Agreement dated 12/31/18 at 2.560%, due on 01/07/19 with a maturity value of $10,705,326; collateralized by U.S. Treasury Obligations with rates ranging from 0.750% - 8.000%, maturity dates ranging from 09/30/19 - 08/15/46, and various Common Stock with an aggregate market value of $11,721,592. | | | 10,700,000 | | | | 10,700,000 | |
|
| Repurchase Agreements—(Continued) | |
Societe Generale
Repurchase Agreement dated 12/31/18 at 2.560%, due on 01/07/19 with a maturity value of $3,001,493; collateralized by U.S. Treasury Obligations with rates ranging from 0.750% - 8.000%, maturity dates ranging from 09/30/19 - 08/15/46, and various Common Stock with an aggregate market value of $3,286,428. | | | 3,000,000 | | | | 3,000,000 | |
| | | | | | | | |
| | | | | | | 48,357,820 | |
| | | | | | | | |
Total Securities Lending Reinvestments
(Cost $310,277,707) | | | | | | | 310,248,720 | |
| | | | | | | | |
Total Purchased Options—0.5% (p)
(Cost $18,598,798) | | | | | | | 14,891,942 | |
| | | | | | | | |
Total Investments—108.2%
(Cost $3,439,085,758) | | | | | | | 3,287,108,821 | |
Other assets and liabilities (net)—(8.2)% | | | | | | | (249,631,069 | ) |
| | | | | | | | |
| Net Assets—100.0% | | | | | | $ | 3,037,477,752 | |
| | | | | | | | |
| | | | |
| * | | Principal and notional amounts stated in U.S. dollars unless otherwise noted. |
| (a) | | All or a portion of the security was held on loan. As of December 31, 2018, the market value of securities loaned was $337,359,259 and the collateral received consisted of cash in the amount of $310,151,778 andnon-cash collateral with a value of $40,824,067. The cash collateral investments are disclosed in the Schedule of Investments and categorized as Securities Lending Reinvestments. Thenon-cash collateral received consists of U.S. government securities that are held in safe-keeping by the lending agent, or a third-party custodian, and cannot be sold or repledged by the Portfolio. As such, this non-cash collateral is excluded from the Statement of Assets and Liabilities. |
| (b) | | Payment-in-kind security for which part of the income earned may be paid as additional principal. |
| (c) | | Variable or floating rate security. The stated rate represents the rate at December 31, 2018. Maturity date shown for callable securities reflects the earliest possible call date. For securities based on a published reference index and spread, the index and spread are indicated in the description above. For certain variable rate securities, the coupon rate is determined by the issuer/agent based on current market conditions. For certain asset- and mortgage-backed securities, the coupon rate may fluctuate based on changes of the underlying collateral or prepayments of principal. These securities do not indicate a reference index and spread in their description above. |
| (d) | | Restricted securities are not registered under the Securities Act of 1933 and are subject to legal restrictions on resale. These securities generally may be resold in transactions exempt from registration or to the public if the securities are subsequently registered. Disposal of these securities may involve time-consuming negotiations and prompt sale at an acceptable price may be difficult. As of December 31, 2018, the market value of restricted securities was $9,829,311, which is 0.3% of net assets. See details shown in the Restricted Securities table that follows. |
| (e) | | Illiquid security. As of December 31, 2018, these securities represent 1.3% of net assets. |
| (f) | | Security is a“step-up” bond where coupon increases or steps up at a predetermined date. Rate shown is current coupon rate. |
| (g) | | Non-income producing; security is in default and/or issuer is in bankruptcy. |
| (h) | | Security was valued in good faith under procedures approved by the Board of Trustees. As of December 31, 2018, these securities represent 0.6% of net assets. |
| (i) | | Significant unobservable inputs were used in the valuation of this portfolio security; i.e. Level 3. |
| (j) | | Interest only security. |
See accompanying notes to financial statements.
BHFTII-21
Brighthouse Funds Trust II
Western Asset Management Strategic Bond Opportunities Portfolio
Schedule of Investments as of December 31, 2018
| | | | |
| (k) | | Floating rate loans (“Senior Loans”) often require prepayments from excess cash flows or permit the borrowers to repay at their election. The degree to which borrowers repay, whether as a contractual requirement or at their election, cannot be predicted with accuracy. As a result, the actual remaining maturity may be substantially less than the stated maturities shown. However, Senior Loans will have an expected average life of approximately two to four years. The stated interest rate represents the weighted average interest rate of all contracts within the senior loan facility and includes commitment fees on unfunded loan commitments, if any. Senior Loans typically have rates of interest which are determined either daily, monthly, quarterly or semi-annually by reference to a base lending rate, plus a premium. These base rates are primarily the London Interbank Offered Rate (“LIBOR”) and secondarily, the prime rate offered by one or more major United States banks (the “Prime Rate”) and the certificate of deposit (“CD”) rate or other base lending rates used by commercial lenders. |
| (l) | | Principal amount of security is adjusted for inflation. |
| (m) | | TBA (To Be Announced) Securities are purchased on a forward commitment basis with an approximate principal amount and no defined maturity date. The actual principal and maturity date will be determined upon settlement date. |
| (n) | | Non-income producing security. |
| (o) | | Represents investment of cash collateral received from securities on loan as of December 31, 2018. |
| (p) | | For a breakout of open positions, see details shown in the Purchased Options table that follows. |
| (144A)— | | Securities exempt from registration under Rule 144A of the Securities Act of 1933. These securities may be resold in transactions exempt from registration, normally to qualified institutional buyers. As of December 31, 2018, the market value of 144A securities was $1,233,816,407, which is 40.6% of net assets. |
| | | | | | | | | | | | | | | | |
Restricted Securities | | Acquisition
Date | | | Principal
Amount | | | Cost | | | Value | |
| Alta Wind Holdings LLC, 7.000%, 06/30/35 | | | 07/14/10 | | | $ | 1,268,181 | | | $ | 1,268,181 | | | $ | 1,377,360 | |
| American Media LLC, 5.500%, 09/01/21 | | | 05/01/18 | | | | 5,350,000 | | | | 5,010,125 | | | | 5,343,313 | |
| Bayview Commercial Asset Trust, Zero Coupon, 07/25/37 | | | 11/23/10 | | | | 2,731,482 | | | | 260,344 | | | | 0 | |
| Countrywide Home Loan Reperforming Loan REMIC Trust, 3.881%, 03/25/35 | | | 01/08/15 | | | | 5,316,367 | | | | 774,196 | | | | 556,172 | |
| Midwest Vanadium Pty, Ltd., 11.500%, 02/15/18 | | | 05/05/11-05/24/11 | | | | 932,290 | | | | 961,424 | | | | 93 | |
| NSG Holdings LLC / NSG Holdings, Inc., 7.750%, 12/15/25 | | | 01/25/13 | | | | 2,419,311 | | | | 2,558,374 | | | | 2,552,373 | |
| | | | | | | | | | | | | | | | |
| | | | | | | | | | | | | | $ | 9,829,311 | |
| | | | | | | | | | | | | | | | |
| |
Forward Foreign Currency Exchange Contracts
| | | | | | | | | | | | | | | | | | | | | | |
Contracts to Buy | | | Counterparty | | Settlement
Date | | | In Exchange
for | | | Unrealized
Appreciation/
(Depreciation) | |
| ARS | | | 232,614,000 | | | CBNA | | | 01/28/19 | | | | USD | | | | 7,104,887 | | | $ | (1,138,609 | ) |
| AUD | | | 10,662,040 | | | CBNA | | | 01/10/19 | | | | USD | | | | 7,695,008 | | | | (184,028 | ) |
| AUD | | | 10,160,000 | | | CBNA | | | 01/18/19 | | | | USD | | | | 7,280,798 | | | | (122,349 | ) |
| AUD | | | 11,285,688 | | | CBNA | | | 01/18/19 | | | | USD | | | | 8,037,611 | | | | (86,033 | ) |
| BRL | | | 4,549,893 | | | BBP | | | 01/18/19 | | | | USD | | | | 1,210,948 | | | | (38,211 | ) |
| BRL | | | 14,740,000 | | | BBP | | | 01/18/19 | | | | USD | | | | 3,892,201 | | | | (92,962 | ) |
| BRL | | | 8,290,000 | | | JPMC | | | 01/18/19 | | | | USD | | | | 2,188,201 | | | | (51,451 | ) |
| CAD | | | 61,620,000 | | | JPMC | | | 01/18/19 | | | | USD | | | | 45,207,837 | | | | (52,702 | ) |
| EUR | | | 8,792,500 | | | JPMC | | | 01/15/19 | | | | USD | | | | 10,255,572 | | | | (171,552 | ) |
| EUR | | | 1,800,000 | | | CBNA | | | 01/18/19 | | | | USD | | | | 2,062,370 | | | | 2,548 | |
| EUR | | | 1,850,000 | | | CBNA | | | 01/18/19 | | | | USD | | | | 2,125,838 | | | | (3,561 | ) |
| EUR | | | 2,000,000 | | | CBNA | | | 01/18/19 | | | | USD | | | | 2,268,016 | | | | 26,337 | |
| EUR | | | 5,570,000 | | | CBNA | | | 01/18/19 | | | | USD | | | | 6,315,728 | | | | 74,045 | |
| EUR | | | 9,230,000 | | | CBNA | | | 01/18/19 | | | | USD | | | | 10,500,933 | | | | 87,507 | |
| EUR | | | 33,890,000 | | | JPMC | | | 01/18/19 | | | | USD | | | | 38,371,105 | | | | 506,709 | |
| EUR | | | 17,470,000 | | | JPMC | | | 02/11/19 | | | | USD | | | | 20,239,432 | | | | (157,999 | ) |
| IDR | | | 232,661,355,000 | | | JPMC | | | 01/18/19 | | | | USD | | | | 15,868,323 | | | | 286,853 | |
| INR | | | 491,838,000 | | | BBP | | | 01/18/19 | | | | USD | | | | 6,598,929 | | | | 434,120 | |
| JPY | | | 578,830,000 | | | CBNA | | | 01/18/19 | | | | USD | | | | 5,173,160 | | | | 112,554 | |
| JPY | | | 4,200,275,811 | | | CBNA | | | 01/18/19 | | | | USD | | | | 37,757,257 | | | | 598,484 | |
| MXN | | | 32,000,000 | | | BBP | | | 01/18/19 | | | | USD | | | | 1,592,234 | | | | 32,628 | |
| MXN | | | 36,000,000 | | | BBP | | | 01/18/19 | | | | USD | | | | 1,772,316 | | | | 55,654 | |
| MXN | | | 31,000,000 | | | CBNA | | | 01/18/19 | | | | USD | | | | 1,558,964 | | | | 15,121 | |
| MXN | | | 186,472,303 | | | CBNA | | | 01/18/19 | | | | USD | | | | 9,776,000 | | | | (307,506 | ) |
| MXN | | | 404,448,000 | | | CBNA | | | 01/18/19 | | | | USD | | | | 19,683,725 | | | | 852,909 | |
| MXN | | | 35,000,000 | | | JPMC | | | 01/18/19 | | | | USD | | | | 1,715,678 | | | | 61,515 | |
| PLN | | | 63,703,719 | | | BBP | | | 01/18/19 | | | | USD | | | | 17,147,242 | | | | (120,882 | ) |
| RUB | | | 13,134,950 | | | CBNA | | | 01/18/19 | | | | USD | | | | 198,942 | | | | (10,659 | ) |
| TWD | | | 7,361,600 | | | BBP | | | 01/18/19 | | | | USD | | | | 238,765 | | | | 1,048 | |
See accompanying notes to financial statements.
BHFTII-22
Brighthouse Funds Trust II
Western Asset Management Strategic Bond Opportunities Portfolio
Schedule of Investments as of December 31, 2018
Forward Foreign Currency Exchange Contracts—(Continued)
| | | | | | | | | | | | | | | | | | | | | | |
Contracts to Deliver | | | Counterparty | | Settlement
Date | | | In Exchange
for | | | Unrealized
Appreciation/
(Depreciation) | |
| ARS | | | 307,962,000 | | | BBP | | | 02/15/19 | | | | USD | | | | 7,581,536 | | | $ | (136,395 | ) |
| ARS | | | 303,380,000 | | | CBNA | | | 02/15/19 | | | | USD | | | | 7,459,094 | | | | (144,006 | ) |
| AUD | | | 22,550,000 | | | CBNA | | | 01/18/19 | | | | USD | | | | 16,626,994 | | | | 738,900 | |
| CAD | | | 22,368,407 | | | CBNA | | | 01/18/19 | | | | USD | | | | 17,257,576 | | | | 866,008 | |
| EUR | | | 9,230,000 | | | JPMC | | | 01/15/19 | | | | USD | | | | 10,499,587 | | | | (86,198 | ) |
| EUR | | | 1,900,000 | | | BBP | | | 01/18/19 | | | | USD | | | | 2,194,870 | | | | 15,235 | |
| EUR | | | 30,140,000 | | | CBNA | | | 01/18/19 | | | | USD | | | | 35,135,102 | | | | 559,200 | |
| EUR | | | 21,350,000 | | | CBNA | | | 01/18/19 | | | | USD | | | | 24,672,338 | | | | 180,118 | |
| EUR | | | 6,750,000 | | | CBNA | | | 01/18/19 | | | | USD | | | | 7,750,397 | | | | 6,955 | |
| EUR | | | 3,200,000 | | | CBNA | | | 01/18/19 | | | | USD | | | | 3,655,568 | | | | (15,397 | ) |
| EUR | | | 2,300,000 | | | CBNA | | | 01/18/19 | | | | USD | | | | 2,626,336 | | | | (12,170 | ) |
| EUR | | | 1,900,000 | | | CBNA | | | 01/18/19 | | | | USD | | | | 2,189,806 | | | | 10,170 | |
| EUR | | | 1,800,000 | | | CBNA | | | 01/18/19 | | | | USD | | | | 2,066,967 | | | | 2,049 | |
| EUR | | | 50,925,734 | | | JPMC | | | 01/18/19 | | | | USD | | | | 59,547,537 | | | | 1,126,728 | |
| EUR | | | 19,537,000 | | | CBNA | | | 02/11/19 | | | | USD | | | | 22,159,061 | | | | (298,349 | ) |
| GBP | | | 19,671,833 | | | CBNA | | | 01/18/19 | | | | USD | | | | 26,115,735 | | | | 1,023,428 | |
| IDR | | | 118,086,649,172 | | | BBP | | | 01/18/19 | | | | USD | | | | 7,754,574 | | | | (444,943 | ) |
| JPY | | | 1,661,259,000 | | | CBNA | | | 01/18/19 | | | | USD | | | | 14,663,904 | | | | (506,248 | ) |
| MXN | | | 56,000,000 | | | BBP | | | 01/18/19 | | | | USD | | | | 2,763,140 | | | | (80,369 | ) |
| MXN | | | 54,000,000 | | | CBNA | | | 01/18/19 | | | | USD | | | | 2,807,018 | | | | 65,062 | |
| MXN | | | 53,000,000 | | | CBNA | | | 01/18/19 | | | | USD | | | | 2,578,962 | | | | (112,216 | ) |
| MXN | | | 52,000,000 | | | CBNA | | | 01/18/19 | | | | USD | | | | 2,636,930 | | | | (3,471 | ) |
| MXN | | | 32,000,000 | | | CBNA | | | 01/18/19 | | | | USD | | | | 1,569,820 | | | | (55,042 | ) |
| MXN | | | 41,000,000 | | | JPMC | | | 01/18/19 | | | | USD | | | | 1,995,649 | | | | (86,206 | ) |
| MXN | | | 30,000,000 | | | JPMC | | | 01/18/19 | | | | USD | | | | 1,506,493 | | | | (16,815 | ) |
| MXN | | �� | 406,695,420 | | | CBNA | | | 02/05/19 | | | | USD | | | | 19,720,000 | | | | (870,818 | ) |
| NZD | | | 7,900,000 | | | JPMC | | | 01/18/19 | | | | USD | | | | 5,209,481 | | | | (94,377 | ) |
| PHP | | | 903,278,000 | | | BBP | | | 01/18/19 | | | | USD | | | | 16,454,350 | | | | (698,604 | ) |
| PHP | | | 724,945,494 | | | DBAG | | | 02/15/19 | | | | USD | | | | 13,346,444 | | | | (385,674 | ) |
| PHP | | | 360,669,400 | | | DBAG | | | 02/15/19 | | | | USD | | | | 6,626,298 | | | | (205,602 | ) |
| PHP | | | 360,669,400 | | | DBAG | | | 02/15/19 | | | | USD | | | | 6,616,573 | | | | (215,326 | ) |
| PHP | | | 357,062,706 | | | DBAG | | | 02/15/19 | | | | USD | | | | 6,539,610 | | | | (223,971 | ) |
| PLN | | | 63,700,000 | | | CBNA | | | 01/18/19 | | | | USD | | | | 16,936,084 | | | | (89,282 | ) |
| SEK | | | 48,435,647 | | | CBNA | | | 01/18/19 | | | | USD | | | | 5,431,144 | | | | (40,643 | ) |
| TRY | | | 2,193,900 | | | CBNA | | | 01/18/19 | | | | USD | | | | 340,826 | | | | (70,060 | ) |
| ZAR | | | 198,594 | | | CBNA | | | 01/18/19 | | | | USD | | | | 13,264 | | | | (515 | ) |
| | | | | |
Net Unrealized Appreciation | | | $ | 310,684 | |
| | | | | |
Futures Contracts
| | | | | | | | | | | | | | | | | | | | |
Futures Contracts—Long | | Expiration
Date | | | Number of
Contracts | | | Notional
Value | | | Value/
Unrealized
Appreciation/
(Depreciation) | |
90 Day Eurodollar Futures | | | 12/16/19 | | | | 1,244 | | | | USD | | | | 302,758,500 | | | $ | 362,235 | |
90 Day Eurodollar Futures | | | 06/15/20 | | | | 3,478 | | | | USD | | | | 847,805,975 | | | | 1,211,039 | |
Euro-BTP Futures | | | 03/07/19 | | | | 141 | | | | EUR | | | | 18,022,620 | | | | 1,366,685 | |
U.S. Treasury Note 10 Year Futures | | | 03/20/19 | | | | 6,085 | | | | USD | | | | 742,465,078 | | | | 18,158,157 | |
U.S. Treasury Note 2 Year Futures | | | 03/29/19 | | | | 221 | | | | USD | | | | 46,921,063 | | | | 320,008 | |
U.S. Treasury Note Ultra 10 Year Futures | | | 03/20/19 | | | | 97 | | | | USD | | | | 12,617,578 | | | | 402,013 | |
U.S. Treasury Ultra Long Bond Futures | | | 03/20/19 | | | | 1,263 | | | | USD | | | | 202,908,844 | | | | 10,034,119 | |
|
Futures Contracts—Short | |
Euro-Bund Futures | | | 03/07/19 | | | | (3,127 | ) | | | EUR | | | | (511,389,580 | ) | | | (8,075,223 | ) |
Euro-Buxl 30 Year Bond Futures | | | 03/07/19 | | | | (28 | ) | | | EUR | | | | (5,057,360 | ) | | | (80,882 | ) |
See accompanying notes to financial statements.
BHFTII-23
Brighthouse Funds Trust II
Western Asset Management Strategic Bond Opportunities Portfolio
Schedule of Investments as of December 31, 2018
Futures Contracts—(Continued)
| | | | | | | | | | | | | | | | | | | | |
Futures Contracts—Short | | Expiration
Date | | | Number of
Contracts | | | Notional
Value | | | Value/
Unrealized
Appreciation/
(Depreciation) | |
U.S. Treasury Long Bond Futures | | | 03/20/19 | | | | (318 | ) | | | USD | | | | (46,428,000 | ) | | $ | (1,986,611 | ) |
U.S. Treasury Note 5 Year Futures | | | 03/29/19 | | | | (1,985 | ) | | | USD | | | | (227,654,688 | ) | | | (3,930,088 | ) |
| | | | | | | | | | | | | | | | | | | | |
Net Unrealized Appreciation | | | $ | 17,781,452 | |
| | | | | | | | | | | | | | | | | | | | |
Purchased Options
| | | | | | | | | | | | | | | | | | | | | | | | | | | | | | | | | | | | | | |
Foreign Currency Options | | Strike
Price | | | Counterparty | | Expiration
Date | | | Number of
Contracts | | | Notional
Amount | | | Premiums
Paid | | | Market
Value | | | Unrealized
Appreciation/
(Depreciation) | |
USD Call/AUD Put | | | AUD | | | | 0.722 | | | CBNA | | | 01/08/19 | | | | 16,450,000 | | | | USD | | | | 16,450,000 | | | $ | 172,890 | | | $ | 392,119 | | | $ | 219,229 | |
USD Call/EUR Put | | | EUR | | | | 1.148 | | | JPMC | | | 01/11/19 | | | | 35,170,000 | | | | USD | | | | 35,170,000 | | | | 311,753 | | | | 194,807 | | | | (116,946 | ) |
USD Call/EUR Put | | | EUR | | | | 1.140 | | | JPMC | | | 02/07/19 | | | | 68,960,000 | | | | USD | | | | 68,960,000 | | | | 583,953 | | | | 411,898 | | | | (172,055 | ) |
USD Put/GBP Call | | | GBP | | | | 1.317 | | | CBNA | | | 01/28/19 | | | | 24,700,000 | | | | USD | | | | 24,700,000 | | | | 251,199 | | | | 86,203 | | | | (164,996 | ) |
USD Put/MXN Call | | | MXN | | | | 20.000 | | | CBNA | | | 01/31/19 | | | | 31,960,000 | | | | USD | | | | 31,960,000 | | | | 516,473 | | | | 739,458 | | | | 222,985 | |
| | | | | | | | | | | | | | | | | | | | | | | | | | | | | | | | | | | | | | |
Totals | | | $ | 1,836,268 | | | $ | 1,824,485 | | | $ | (11,783 | ) |
| | | | | | | | | | | | | | | | | | | | | | | | | | | | | | | | | | | | | | |
| | | | | | | | | | | | | | | | | | | | | | | | | | | | | | | | | | | | | | | | |
Interest Rate Swaptions | | Strike
Rate | | | Counterparty | | Floating Rate
Index | | Pay/
Receive
Floating
Rate | | | Expiration
Date | | | Number of
Contracts | | | Notional
Amount | | | Premiums
Paid | | | Market
Value | | | Unrealized
Depreciation | |
Put - OTC - 5 Year Interest Rate Swap | | | 3.150 | % | | BOA | | 3M LIBOR | | | Receive | | | | 02/02/23 | | | | 271,800,000 | | | | USD | | | | 271,800,000 | | | $ | 13,943,340 | | | $ | 10,554,834 | | | $ | (3,388,506 | ) |
| | | | | | | | | | | | | | | | | | | | | | | | | | | | | | | | | | | | | | | | |
| | | | | | | | | | | | | | | | | | | | | | | | | | | | | | | | | | | | |
Options on Exchange-Traded Future Contracts | | Strike
Price | | | Expiration
Date | | | Number of
Contracts | | | Notional
Amount | | | Premiums
Paid | | | Market
Value | | | Unrealized
Appreciation/
(Depreciation) | |
Put - S&P 500 IndexE-Mini Futures | | | USD | | | | 2,400.000 | | | | 01/18/19 | | | | 1,240 | | | | USD | | | | 62,000 | | | $ | 1,248,554 | | | $ | 1,441,500 | | | $ | 192,946 | |
Put - S&P 500 IndexE-Mini Futures | | | USD | | | | 2,450.000 | | | | 01/18/19 | | | | 273 | | | | USD | | | | 13,650 | | | | 331,586 | | | | 477,750 | | | | 146,164 | |
Put - S&P 500 IndexE-Mini Futures | | | USD | | | | 2,300.000 | | | | 02/15/19 | | | | 391 | | | | USD | | | | 19,550 | | | | 959,909 | | | | 493,637 | | | | (466,272 | ) |
Put - U.S. Treasury Note 5 Year Futures | | | USD | | | | 113.000 | | | | 01/25/19 | | | | 503 | | | | USD | | | | 503,000 | | | | 71,605 | | | | 11,790 | | | | (59,815 | ) |
Put - U.S. Treasury Note 5 Year Futures | | | USD | | | | 112.000 | | | | 01/25/19 | | | | 257 | | | | USD | | | | 257,000 | | | | 42,609 | | | | 2,008 | | | | (40,601 | ) |
Put - U.S. Treasury Note 10 Year Futures | | | USD | | | | 121.000 | | | | 01/25/19 | | | | 500 | | | | USD | | | | 500,000 | | | | 164,927 | | | | 85,938 | | | | (78,989 | ) |
| | | | | | | | | | | | | | | | | | | | | | | | | | | | | | | | | | | | |
Totals | | | $ | 2,819,190 | | | $ | 2,512,623 | | | $ | (306,567 | ) |
| | | | | | | | | | | | | | | | | | | | | | | | | | | | | | | | | | | | |
Written Options
| | | | | | | | | | | | | | | | | | | | | | | | | | | | | | | | | | | | | | |
Foreign Currency Options | | Strike
Price | | | Counterparty | | Expiration
Date | | | Number of
Contracts | | | Notional
Amount | | | Premiums
Received | | | Market
Value | | | Unrealized
Appreciation | |
USD Call/EUR Put | | | USD | | | | 1.127 | | | JPMC | | | 01/11/19 | | | | (33,564,000 | ) | | | USD | | | | (33,564,000 | ) | | $ | (153,958 | ) | | $ | (18,796 | ) | | $ | 135,162 | |
USD Call/EUR Put | | | USD | | | | 1.121 | | | CBNA | | | 02/07/19 | | | | (68,960,000 | ) | | | USD | | | | (68,960,000 | ) | | | (434,448 | ) | | | (135,231 | ) | | | 299,217 | |
USD Call/MXN Put | | | USD | | | | 21.500 | | | CBNA | | | 01/31/19 | | | | (31,960,000 | ) | | | USD | | | | (31,960,000 | ) | | | (555,145 | ) | | | (33,366 | ) | | | 521,779 | |
| | | | | | | | | | | | | | | | | | | | | | | | | | | | | | | | | | | | | | |
Totals | | | $ | (1,143,551 | ) | | $ | (187,393 | ) | | $ | 956,158 | |
| | | | | | | | | | | | | | | | | | | | | | | | | | | | | | | | | | | | | | |
| |
| | | | | | | | | | | | | | | | | | | | | | | | | | | | | | | | |
Options on Exchange-Traded Futures Contracts | | Strike
Price | | | Expiration
Date | | | Number of
Contracts | | | Notional
Amount | | | Premiums
Received | | | Market
Value | | | Unrealized
Appreciation/
(Depreciation) | |
Call - U.S. Treasury Note5-Year Futures | | | USD 114.250 | | | | 01/25/19 | | | | (503 | ) | | | USD | | | | (503,000 | ) | | $ | (69,864 | ) | | $ | (298,656 | ) | | $ | (228,792 | ) |
Put - S&P 500 IndexE-Mini Futures | | | USD 2,300.000 | | | | 01/18/19 | | | | (40 | ) | | | USD | | | | (2,000 | ) | | | (9,916 | ) | | | (19,500 | ) | | | (9,584 | ) |
Put - S&P 500 IndexE-Mini Futures | | | USD 2,100.000 | | | | 02/15/19 | | | | (391 | ) | | | USD | | | | (19,550 | ) | | | (348,966 | ) | | | (151,513 | ) | | | 197,453 | |
| | | | | | | | | | | | | | | | | | | | | | | | | | | | | | | | |
Totals | | | $ | (428,746 | ) | | $ | (469,669 | ) | | $ | (40,923 | ) |
| | | | | | | | | | | | | | | | | | | | | | | | | | | | | | | | |
See accompanying notes to financial statements.
BHFTII-24
Brighthouse Funds Trust II
Western Asset Management Strategic Bond Opportunities Portfolio
Schedule of Investments as of December 31, 2018
Swap Agreements
Centrally Cleared Interest Rate Basis Swaps
| | | | | | | | | | | | | | | | | | | | | | | | | | |
Floating Rate Index Paid | | Payment
Frequency | | Floating Rate
Index Received | | | Payment
Frequency | | Maturity
Date | | Notional
Amount | | | Market
Value | | | Upfront
Premium
Received | | | Unrealized
Appreciation | |
3M LIBOR | | Quarterly | | | FEDL01 + 0.310 | % | | Quarterly | | 03/20/24 | | | USD 334,344,000 | | | $ | 779,302 | | | $ | 10,448 | | | $ | 768,854 | |
| | | | | | | | | | | | | | | | | | | | | | | | | | |
Centrally Cleared Interest Rate Swaps
| | | | | | | | | | | | | | | | | | | | | | | | | | | | | | | | | | |
Pay/Receive
Floating Rate | | Floating
Rate Index | | Payment
Frequency | | Fixed
Rate | | | Payment
Frequency | | Maturity
Date | | | Notional
Amount | | | Market
Value | | | Upfront
Premiums
Paid/(Received) | | | Unrealized
Appreciation/
(Depreciation) | |
Pay | | 1M TIIE | | Monthly | | | 7.330 | % | | Monthly | | | 04/06/22 | | | | MXN | | | | 3,542,500,000 | | | $ | (6,485,262 | ) | | $ | (85,736 | ) | | $ | (6,399,526 | ) |
Pay | | 1M TIIE | | Monthly | | | 7.351 | % | | Monthly | | | 04/05/21 | | | | MXN | | | | 5,174,130,000 | | | | (6,870,175 | ) | | | (40,305 | ) | | | (6,829,870 | ) |
Pay | | 3M LIBOR | | Quarterly | | | 3.150 | % | | Semi-Annually | | | 02/06/33 | | | | USD | | | | 119,590,000 | | | | 1,942,454 | | | | — | | | | 1,942,454 | |
Pay | | 3M LIBOR | | Quarterly | | | 3.230 | % | | Semi-Annually | | | 12/18/21 | | | | USD | | | | 120,386,000 | | | | 1,600,165 | | | | 186,517 | | | | 1,413,648 | |
Receive | | 3M LIBOR | | Annually | | | 1.385 | % | | Annually | | | 10/30/21 | | | | GBP | | | | 158,777,000 | | | | (239,821 | ) | | | (54,499 | ) | | | (185,322 | ) |
Receive | | 3M LIBOR | | Semi-Annually | | | 3.300 | % | | Quarterly | | | 12/18/29 | | | | USD | | | | 26,563,000 | | | | (1,228,893 | ) | | | (134,643 | ) | | | (1,094,250 | ) |
Receive | | 6M EURIBOR | | Annually | | | 1.498 | % | | Semi-Annually | | | 08/23/47 | | | | EUR | | | | 4,537,500 | | | | (146,983 | ) | | | (5,233 | ) | | | (141,750 | ) |
Receive | | 6M LIBOR | | Semi-Annually | | | 1.271 | % | | Semi-Annually | | | 10/26/21 | | | | GBP | | | | 32,768,000 | | | | (3,921 | ) | | | 14,998 | | | | (18,919 | ) |
| | | | | | | | | | | | | | | | | | | | | | | | | | | | | | | | | | |
Totals | | | $ | (11,432,436 | ) | | $ | (118,901 | ) | | $ | (11,313,535 | ) |
| | | | | | | | | | | | | | | | | | | | | | | | | | | | | | | | | | |
Centrally Cleared Credit Default Swaps on Credit Indices—Buy Protection (a)
| | | | | | | | | | | | | | | | | | | | | | | | | | | | | | | | | | | | |
Reference Obligation | | Fixed Deal
(Pay) Rate | | | Payment
Frequency | | | Maturity
Date | | | Implied
Credit Spread at
December 31,
2018(b) | | | Notional
Amount(c) | | | Market
Value | | | Upfront
Premiums
Received | | | Unrealized
Appreciation | |
CDX.NA.HY.31 | | | (5.000 | %) | | | Quarterly | | | | 12/20/23 | | | | 0.000 | % | | | USD | | | | 56,330,000 | | | $ | (1,122,826 | ) | | $ | (3,896,488 | ) | | $ | 2,773,662 | |
| | | | | | | | | | | | | | | | | | | | | | | | | | | | | | | | | | | | |
Centrally Cleared Credit Default Swaps on Credit Indices—Sell Protection (d)
| | | | | | | | | | | | | | | | | | | | | | | | | | | | | | | | | | | | |
Reference Obligation | | Fixed Deal
Receive Rate | | | Payment
Frequency | | | Maturity
Date | | | Implied
Credit Spread at
December 31,
2018(b) | | | Notional
Amount(c) | | | Market
Value | | | Upfront
Premiums
Paid | | | Unrealized
Depreciation | |
CDX.NA.IG.31 | | | 1.000 | % | | | Quarterly | | | | 12/20/23 | | | | 0.000 | % | | | USD | | | | 239,100,000 | | | $ | 1,327,244 | | | $ | 2,283,366 | | | $ | (956,122 | ) |
| | | | | | | | | | | | | | | | | | | | | | | | | | | | | | | | | | | | |
OTC Credit Default Swaps on Sovereign Issues—Buy Protection (a)
| | | | | | | | | | | | | | | | | | | | | | | | | | | | | | | | | | | | | | | | |
Reference Obligation | | Fixed Deal
(Pay) Rate | | | Payment
Frequency | | | Maturity
Date | | | Counterparty | | | Implied
Credit Spread at
December 31,
2018(b) | | | Notional
Amount(c) | | | Market
Value | | | Upfront
Premium
(Received) | | | Unrealized
Appreciation | |
Australia Government International Bond 4.750%, due 04/27/21 | | | (1.000 | %) | | | Quarterly | | | | 06/20/23 | | | | DBAG | | | | 0.224 | % | | | USD | | | | 32,280,000 | | | $ | (1,061,993 | ) | | $ | (1,289,612 | ) | | $ | 227,619 | |
| | | | | | | | | | | | | | | | | | | | | | | | | | | | | | | | | | | | | | | | |
Securities in amount of $11,849,227 have been received at the custodian bank as collateral for foreign currency contracts and OTC swap contracts.
| | | | |
| (a) | | If the Portfolio is a buyer of protection and a credit event occurs, as defined under the terms of that particular swap agreement, the Portfolio will either (i) receive from the seller of protection an amount equal to the notional amount of the swap and deliver the referenced obligation or underlying securities comprising the referenced index or (ii) receive a net settlement amount in the form of cash or securities equal to the notional amount of the swap less the recovery value of the referenced obligation or underlying securities comprising the referenced index. |
See accompanying notes to financial statements.
BHFTII-25
Brighthouse Funds Trust II
Western Asset Management Strategic Bond Opportunities Portfolio
Schedule of Investments as of December 31, 2018
| | | | |
| (b) | | Implied credit spreads, represented in absolute terms, utilized in determining the market value of credit default swap agreements on corporate issues or indices as of period end serve as an indicator of the current status of the payment/performance risk and represent the likelihood or risk of default for the credit derivative. The implied credit spread of a particular referenced entity reflects the cost of buying/selling protection and may include upfront payments required to be made to enter into the agreement. Wider credit spreads represent a deterioration of the referenced entity’s credit soundness and a greater likelihood or risk of default or other credit event occurring as defined under the terms of the agreement. A credit spread identified as “Defaulted” indicates a credit event has occurred for the referenced entity or obligation. |
| (c) | | The maximum potential amount of future undiscounted payments that the Portfolio could be required to make under a credit default swap contract would be the notional amount of the contract. These potential amounts would be partially offset by any recovery values of the referenced debt obligation or net amounts received from the settlement of purchased protection credit default swap contracts entered into by the Portfolio for the same referenced debt obligation. |
| (d) | | If the Portfolio is a seller of protection and a credit event occurs, as defined under the terms of that particular swap agreement, the Portfolio will either (i) pay to the buyer of protection an amount equal to the notional amount of the swap and take delivery of the referenced obligation or underlying securities comprising the referenced index or (ii) pay a net settlement amount in the form of cash or securities equal to the notional amount of the swap less the recovery value of the referenced obligation or underlying securities comprising the referenced index. |
Glossary of Abbreviations
Counterparties
| | | | |
| (BOA)— | | Bank of America N.A. |
| (BBP)— | | Barclays Bank plc |
| (CBNA)— | | Citibank N.A. |
| (DBAG)— | | Deutsche Bank AG |
| (JPMC)— | | JPMorgan Chase Bank N.A. |
Currencies
| | | | |
| (ARS)— | | | | Argentine Peso |
| (AUD)— | | | | Australian Dollar |
| (BRL)— | | | | Brazilian Real |
| (CAD)— | | | | Canadian Dollar |
| (EUR)— | | | | Euro |
| (GBP)— | | | | British Pound |
| (IDR)— | | | | Indonesian Rupiah |
| (INR)— | | | | Indian Rupee |
| (JPY)— | | | | Japanese Yen |
| (MXN)— | | | | Mexican Peso |
| (NZD)— | | | | New Zealand Dollar |
| (PHP)— | | | | Philippine Peso |
| (PLN)— | | | | Polish Zloty |
| (RUB)— | | | | Russian Ruble |
| (SEK)— | | | | Swedish Krona |
| (TRY)— | | | | Turkish Lira |
| (TWD)— | | | | Taiwanese Dollar |
| (USD)— | | | | United States Dollar |
| (ZAR)— | | | | South African Rand |
Index Abbreviations
| | | | |
| (CDX.NA.HY)— | | | | Markit North America High Yield CDS Index |
| (CDX.NA.IG)— | | | | Markit North America Investment Grade CDS Index |
| (CMT)— | | | | U.S. Treasury Yield Curve Rate T-Note Constant Maturity Index |
| (COFI)— | | | | 11th District Cost of Funds Index |
| (EURIBOR)— | | | | Euro InterBank Offered Rate |
| (FEDEFF PRV)— | | | | Effective Federal Funds Rate |
| (FEDL01)— | | Federal Funds Rate |
| (ICE)— | | Intercontinental Exchange, Inc. |
| (LIBOR)— | | London Interbank Offered Rate |
| (OBFR)— | | U.S. Overnight Bank Funding Rate |
| (SOFR)— | | Secured Overnight Financing Rate |
| (TIIE)— | | Mexican Interbank Equilibrium Interest Rate |
Other Abbreviations
| | | | |
| (ARM)— | | Adjustable-Rate Mortgage |
| (CLO)— | | Collateralized Loan Obligation |
| (CMO)— | | Collateralized Mortgage Obligation |
| (CDS)— | | Credit Default Swap |
| (REMIC)— | | Real Estate Mortgage Investment Conduit |
See accompanying notes to financial statements.
BHFTII-26
Brighthouse Funds Trust II
Western Asset Management Strategic Bond Opportunities Portfolio
Schedule of Investments as of December 31, 2018
Fair Value Hierarchy
Accounting principles generally accepted in the United States of America (“GAAP”) define fair market value as the price that the Portfolio would receive to sell an asset or pay to transfer a liability in an orderly transaction between market participants at the measurement date. It establishes a fair value hierarchy that prioritizes inputs to valuation methods and requires disclosure of the fair value hierarchy, separately for each major category of assets and liabilities, that segregates fair value measurements into three levels. Levels 1, 2 and 3 of the fair value hierarchy are defined as follows:
Level 1 - unadjusted quoted prices in active markets for identical investments
Level 2 - other significant observable inputs (including, but not limited to, quoted prices for similar assets or liabilities in markets that are either active or inactive; inputs other than quoted prices that are observable such as interest rates, yield curves, volatilities, prepayment speeds, loss severities, credit risks, default rates, or other market corroborated inputs)
Level 3 - significant unobservable inputs based on the best information available in the circumstances, to the extent observable inputs are unavailable (including the Portfolio’s own assumptions used in determining the fair value of investments and derivative financial instruments)
The inputs or methodologies used for valuing investments are not necessarily an indication of the risk associated with investing in them. Changes to the inputs or methodologies used may result in transfers between levels. A reconciliation of Level 3 securities, if any, will be disclosed following the fair value hierarchy table. For more information about the Portfolio’s policy regarding the valuation of investments, please refer to the Notes to Financial Statements.
The following table summarizes the fair value hierarchy of the Portfolio’s investments as of December 31, 2018:
| | | | | | | | | | | | | | | | |
| Description | | Level 1 | | | Level 2 | | | Level 3 | | | Total | |
| Corporate Bonds & Notes | |
Aerospace/Defense | | $ | — | | | $ | 22,462,402 | | | $ | — | | | $ | 22,462,402 | |
Agriculture | | | — | | | | 3,277,069 | | | | — | | | | 3,277,069 | |
Airlines | | | — | | | | 1,684,227 | | | | — | | | | 1,684,227 | |
Apparel | | | — | | | | 15,529,797 | | | | — | | | | 15,529,797 | |
Auto Manufacturers | | | — | | | | 27,575,872 | | | | — | | | | 27,575,872 | |
Auto Parts & Equipment | | | — | | | | 10,272,152 | | | | — | | | | 10,272,152 | |
Banks | | | — | | | | 288,560,029 | | | | — | | | | 288,560,029 | |
Beverages | | | — | | | | 5,355,070 | | | | — | | | | 5,355,070 | |
Biotechnology | | | — | | | | 7,071,718 | | | | — | | | | 7,071,718 | |
Building Materials | | | — | | | | 9,893,302 | | | | — | | | | 9,893,302 | |
Chemicals | | | — | | | | 5,691,018 | | | | — | | | | 5,691,018 | |
Commercial Services | | | — | | | | 41,352,375 | | | | — | | | | 41,352,375 | |
Computers | | | — | | | | 12,994,699 | | | | — | | | | 12,994,699 | |
Diversified Financial Services | | | — | | | | 62,190,466 | | | | — | | | | 62,190,466 | |
Electric | | | — | | | | 49,092,546 | | | | — | | | | 49,092,546 | |
Energy-Alternate Sources | | | — | | | | 1,377,360 | | | | — | | | | 1,377,360 | |
Entertainment | | | — | | | | 20,361,294 | | | | — | | | | 20,361,294 | |
Environmental Control | | | — | | | | 1,309,535 | | | | — | | | | 1,309,535 | |
Food | | | — | | | | 9,352,954 | | | | — | | | | 9,352,954 | |
Forest Products & Paper | | | — | | | | 4,284,000 | | | | — | | | | 4,284,000 | |
Healthcare-Products | | | — | | | | 18,304,341 | | | | — | | | | 18,304,341 | |
Healthcare-Services | | | — | | | | 52,029,697 | | | | — | | | | 52,029,697 | |
Holding Companies-Diversified | | | — | | | | 3,388,179 | | | | — | | | | 3,388,179 | |
Home Builders | | | — | | | | 15,574,125 | | | | — | | | | 15,574,125 | |
Housewares | | | — | | | | 1,724,254 | | | | — | | | | 1,724,254 | |
Insurance | | | — | | | | 24,723,822 | | | | — | | | | 24,723,822 | |
Internet | | | — | | | | 27,555,422 | | | | — | | | | 27,555,422 | |
Iron/Steel | | | — | | | | 13,526,100 | | | | — | | | | 13,526,100 | |
Leisure Time | | | — | | | | 26,949,227 | | | | — | | | | 26,949,227 | |
Lodging | | | — | | | | 27,058,489 | | | | — | | | | 27,058,489 | |
Machinery-Diversified | | | — | | | | 6,645,750 | | | | — | | | | 6,645,750 | |
Media | | | — | | | | 151,945,074 | | | | — | | | | 151,945,074 | |
Mining | | | — | | | | 95,449,479 | | | | — | | | | 95,449,479 | |
Miscellaneous Manufacturing | | | — | | | | 12,227,141 | | | | — | | | | 12,227,141 | |
Oil & Gas | | | — | | | | 179,487,393 | | | | — | | | | 179,487,393 | |
Oil & Gas Services | | | — | | | | 3,075,000 | | | | — | | | | 3,075,000 | |
Packaging & Containers | | | — | | | | 20,018,235 | | | | — | | | | 20,018,235 | |
Pharmaceuticals | | | — | | | | 100,671,411 | | | | 18,677,327 | | | | 119,348,738 | |
Pipelines | | | — | | | | 121,802,220 | | | | — | | | | 121,802,220 | |
Real Estate | | | — | | | | 9,233,344 | | | | — | | | | 9,233,344 | |
Real Estate Investment Trusts | | | — | | | | 23,801,584 | | | | — | | | | 23,801,584 | |
See accompanying notes to financial statements.
BHFTII-27
Brighthouse Funds Trust II
Western Asset Management Strategic Bond Opportunities Portfolio
Schedule of Investments as of December 31, 2018
Fair Value Hierarchy—(Continued)
| | | | | | | | | | | | | | | | |
| Description | | Level 1 | | | Level 2 | | | Level 3 | | | Total | |
Retail | | $ | — | | | $ | 33,620,153 | | | $ | — | | | $ | 33,620,153 | |
Savings & Loans | | | — | | | | 9,708,511 | | | | — | | | | 9,708,511 | |
Semiconductors | | | — | | | | 4,193,601 | | | | — | | | | 4,193,601 | |
Software | | | — | | | | 13,553,847 | | | | — | | | | 13,553,847 | |
Telecommunications | | | — | | | | 111,788,922 | | | | — | | | | 111,788,922 | |
Transportation | | | — | | | | 37,869,741 | | | | — | | | | 37,869,741 | |
Trucking & Leasing | | | — | | | | 18,582,400 | | | | — | | | | 18,582,400 | |
Water | | | — | | | | 3,312,770 | | | | — | | | | 3,312,770 | |
Total Corporate Bonds & Notes | | | — | | | | 1,767,508,117 | | | | 18,677,327 | | | | 1,786,185,444 | |
Total Mortgage-Backed Securities* | | | — | | | | 274,256,296 | | | | — | | | | 274,256,296 | |
Total Floating Rate Loans* | | | — | | | | 260,676,064 | | | | — | | | | 260,676,064 | |
Total Foreign Government* | | | — | | | | 248,671,581 | | | | — | | | | 248,671,581 | |
Total U.S. Treasury & Government Agencies* | | | — | | | | 182,900,472 | | | | — | | | | 182,900,472 | |
Total Asset-Backed Securities* | | | — | | | | 159,391,822 | | | | — | | | | 159,391,822 | |
Total Convertible Bonds* | | | — | | | | 31,727,816 | | | | — | | | | 31,727,816 | |
Total Convertible Preferred Stock* | | | 6,265,681 | | | | — | | | | — | | | | 6,265,681 | |
Total Municipals | | | — | | | | 3,554,530 | | | | — | | | | 3,554,530 | |
| Preferred Stocks | |
Banks | | | 1,352,159 | | | | — | | | | — | | | | 1,352,159 | |
Capital Markets | | | 1,478,851 | | | | — | | | | — | | | | 1,478,851 | |
Marine | | | — | | | | — | | | | 8,946 | | | | 8,946 | |
Total Preferred Stocks | | | 2,831,010 | | | | — | | | | 8,946 | | | | 2,839,956 | |
| Common Stocks | |
Air Freight & Logistics | | | 384,339 | | | | — | | | | — | | | | 384,339 | |
Diversified Consumer Services | | | — | | | | 27,991 | | | | — | | | | 27,991 | |
Marine | | | — | | | | — | | | | 26 | | | | 26 | |
Media | | | — | | | | 456,372 | | | | — | | | | 456,372 | |
Oil, Gas & Consumable Fuels | | | 1,452,981 | | | | — | | | | — | | | | 1,452,981 | |
Total Common Stocks | | | 1,837,320 | | | | 484,363 | | | | 26 | | | | 2,321,709 | |
Total Escrow Shares* | | | — | | | | — | | | | 9,622 | | | | 9,622 | |
Total Short-Term Investment* | | | — | | | | 3,167,166 | | | | — | | | | 3,167,166 | |
Total Securities Lending Reinvestments* | | | — | | | | 310,248,720 | | | | — | | | | 310,248,720 | |
| Purchased Options | |
Foreign Currency Options at Value | | | — | | | | 1,824,485 | | | | — | | | | 1,824,485 | |
Interest Rate Swaptions at Value | | | — | | | | 10,554,834 | | | | — | | | | 10,554,834 | |
Options on Exchange-Traded Futures Contracts at Value | | | 2,512,623 | | | | — | | | | — | | | | 2,512,623 | |
Total Purchased Options | | | 2,512,623 | | | | 12,379,319 | | | | — | | | | 14,891,942 | |
Total Investments | | $ | 13,446,634 | | | $ | 3,254,966,266 | | | $ | 18,695,921 | | | $ | 3,287,108,821 | |
| | | | | | | | | | | | | | | | | |
Collateral for Securities Loaned (Liability) | | $ | — | | | $ | (310,151,778 | ) | | $ | — | | | $ | (310,151,778 | ) |
| Forward Contracts | |
Forward Foreign Currency Exchange Contracts (Unrealized Appreciation) | | $ | — | | | $ | 7,741,885 | | | $ | — | | | $ | 7,741,885 | |
Forward Foreign Currency Exchange Contracts (Unrealized Depreciation) | | | — | | | | (7,431,201 | ) | | | — | | | | (7,431,201 | ) |
Total Forward Contracts | | $ | — | | | $ | 310,684 | | | $ | — | | | $ | 310,684 | |
| Futures Contracts | |
Futures Contracts (Unrealized Appreciation) | | $ | 31,854,256 | | | $ | — | | | $ | — | | | $ | 31,854,256 | |
Futures Contracts (Unrealized Depreciation) | | | (14,072,804 | ) | | | — | | | | — | | | | (14,072,804 | ) |
Total Futures Contracts | | $ | 17,781,452 | | | $ | — | | | $ | — | | | $ | 17,781,452 | |
| Written Options | |
Foreign Currency Options at Value | | $ | — | | | $ | (187,393 | ) | | $ | — | | | $ | (187,393 | ) |
Options on Exchange-Traded Futures Contracts at Value | | | (469,669 | ) | | | — | | | | — | | | | (469,669 | ) |
Total Written Options | | $ | (469,669 | ) | | $ | (187,393 | ) | | $ | — | | | $ | (657,062 | ) |
See accompanying notes to financial statements.
BHFTII-28
Brighthouse Funds Trust II
Western Asset Management Strategic Bond Opportunities Portfolio
Schedule of Investments as of December 31, 2018
Fair Value Hierarchy—(Continued)
| | | | | | | | | | | | | | | | |
| Description | | Level 1 | | | Level 2 | | | Level 3 | | | Total | |
| Centrally Cleared Swap Contracts | |
Centrally Cleared Swap Contracts (Unrealized Appreciation) | | $ | — | | | $ | 6,898,618 | | | $ | — | | | $ | 6,898,618 | |
Centrally Cleared Swap Contracts (Unrealized Depreciation) | | | — | | | | (15,625,759 | ) | | | — | | | | (15,625,759 | ) |
Total Centrally Cleared Swap Contracts | | $ | — | | | $ | (8,727,141 | ) | | $ | — | | | $ | (8,727,141 | ) |
| OTC Swap Contracts | |
OTC Swap Contracts at Value (Liabilities) | | $ | — | | | $ | (1,061,993 | ) | | $ | — | | | $ | (1,061,993 | ) |
Total OTC Swap Contracts | | $ | — | | | $ | (1,061,993 | ) | | $ | — | | | $ | (1,061,993 | ) |
| | | | |
| * | | See Schedule of Investments for additional detailed categorizations. |
Level 3 investments at the beginning and/or end of the period in relation to net assets were not significant and accordingly, a reconciliation of Level 3 assets for the year ended December 31, 2018 is not presented.
Transfers from Level 3 to Level 2 in the amount of $3,908,914 were due to the initiation of a vendor or broker providing prices based on market indications which have been determined to be significant observable inputs.
See accompanying notes to financial statements.
BHFTII-29
Brighthouse Funds Trust II
Western Asset Management Strategic Bond Opportunities Portfolio
Statement of Assets and Liabilities
December 31, 2018
| | | | |
Assets | |
Investments at value (a) (b) | | $ | 3,287,108,821 | |
Cash | | | 1,115,427 | |
Cash denominated in foreign currencies (c) | | | 22,022,900 | |
Cash collateral (d) | | | 34,804,415 | |
Unrealized appreciation on forward foreign currency exchange contracts | | | 7,741,885 | |
Receivable for: | |
Investments sold | | | 1,535,750 | |
Fund shares sold | | | 26,273 | |
Principal paydowns | | | 10,229 | |
Dividends and interest | | | 37,411,563 | |
Variation margin on futures contracts | | | 4,465,947 | |
Variation margin on centrally cleared swap contracts | | | 405,457 | |
Prepaid expenses | | | 8,715 | |
Other assets | | | 5,620 | |
| | | | |
Total Assets | | | 3,396,663,002 | |
Liabilities | |
Written options at value (e) | | | 657,062 | |
OTC swap contracts at market value (f) | | | 1,061,993 | |
Cash collateral for centrally cleared swap contracts | | | 1,967 | |
Unrealized depreciation on forward foreign currency exchange contracts | | | 7,431,201 | |
Collateral for securities loaned | | | 310,151,778 | |
Payables for: | |
Investments purchased | | | 11,407,975 | |
TBA securities purchased | | | 21,570,938 | |
Fund shares redeemed | | | 4,475,843 | |
Interest on OTC swap contracts | | | 10,760 | |
Accrued Expenses: | |
Management fees | | | 1,334,158 | |
Distribution and service fees | | | 201,714 | |
Deferred trustees’ fees | | | 267,134 | |
Other expenses | | | 612,727 | |
| | | | |
Total Liabilities | | | 359,185,250 | |
| | | | |
Net Assets | | $ | 3,037,477,752 | |
| | | | |
Net Assets Consist of: | |
Paid in surplus | | $ | 3,201,494,764 | |
Distributable earnings (Accumulated losses) | | | (164,017,012 | ) |
| | | | |
Net Assets | | $ | 3,037,477,752 | |
| | | | |
Net Assets | |
Class A | | $ | 2,006,843,596 | |
Class B | | | 802,588,974 | |
Class E | | | 228,045,182 | |
Capital Shares Outstanding* | |
Class A | | | 158,246,600 | |
Class B | | | 63,845,769 | |
Class E | | | 18,080,608 | |
Net Asset Value, Offering Price and Redemption Price Per Share | |
Class A | | $ | 12.68 | |
Class B | | | 12.57 | |
Class E | | | 12.61 | |
| | | | |
| * | | The Portfolio is authorized to issue an unlimited number of shares. |
| (a) | | Identified cost of investments was $3,439,085,758. |
| (b) | | Includes securities loaned at value of $337,359,259. |
| (c) | | Identified cost of cash denominated in foreign currencies was $21,865,442. |
| (d) | | Includes collateral of $20,330,339 for futures contracts, $3,070,000 for OTC swap, options and forward foreign currency contracts and $11,404,076 for centrally cleared swap contracts. |
| (e) | | Premiums received on written options were $1,572,297. |
| (f) | | Net premium received on OTC swap contracts was $1,289,612. |
Statement of Operations
Year Ended December 31, 2018
| | | | |
Investment Income | |
Dividends | | $ | 1,295,393 | |
Interest (a) | | | 190,376,053 | |
Securities lending income | | | 2,047,457 | |
| | | | |
Total investment income | | | 193,718,903 | |
Expenses | |
Management fees | | | 18,654,367 | |
Administration fees | | | 116,356 | |
Custodian and accounting fees | | | 460,025 | |
Distribution and service fees—Class B | | | 2,174,108 | |
Distribution and service fees—Class E | | | 375,478 | |
Audit and tax services | | | 102,406 | |
Legal | | | 45,116 | |
Trustees’ fees and expenses | | | 33,732 | |
Shareholder reporting | | | 280,397 | |
Insurance | | | 21,620 | |
Miscellaneous | | | 43,384 | |
| | | | |
Total expenses | | | 22,306,989 | |
Less management fee waiver | | | (1,875,595 | ) |
| | | | |
Net expenses | | | 20,431,394 | |
| | | | |
Net Investment Income | | | 173,287,509 | |
| | | | |
Net Realized and Unrealized Loss | |
| Net realized gain (loss) on: | |
Investments | | | (48,240,104 | ) |
Purchased options | | | (18,863,939 | ) |
Futures contracts | | | (37,355,741 | ) |
Written options | | | 6,677,262 | |
Swap contracts | | | 8,835,920 | |
Foreign currency transactions | | | (3,784,934 | ) |
Forward foreign currency transactions | | | (7,100,656 | ) |
| | | | |
Net realized loss | | | (99,832,192 | ) |
| | | | |
| Net change in unrealized appreciation (depreciation) on: | |
Investments | | | (210,171,379 | ) |
Purchased options | | | (3,713,470 | ) |
Futures contracts | | | 16,462,177 | |
Written options | | | 507,260 | |
Swap contracts | | | (12,203,817 | ) |
Foreign currency transactions | | | 521,003 | |
Forward foreign currency transactions | | | 4,641,751 | |
| | | | |
Net change in unrealized depreciation | | | (203,956,475 | ) |
| | | | |
Net realized and unrealized loss | | | (303,788,667 | ) |
| | | | |
Net Decrease in Net Assets From Operations | | $ | (130,501,158 | ) |
| | | | |
| | | | |
| (a) | | Net of foreign withholding taxes of $423,086. |
See accompanying notes to financial statements.
BHFTII-30
Brighthouse Funds Trust II
Western Asset Management Strategic Bond Opportunities Portfolio
Statements of Changes in Net Assets
| | | | | | | | |
| | | Year Ended
December 31,
2018 | | | Year Ended
December 31,
2017 | |
Increase (Decrease) in Net Assets: | |
From Operations | |
Net investment income | | $ | 173,287,509 | | | $ | 168,174,305 | |
Net realized gain (loss) | | | (99,832,192 | ) | | | 75,706,129 | |
Net change in unrealized appreciation (depreciation) | | | (203,956,475 | ) | | | 27,894,144 | |
| | | | | | | | |
Increase (decrease) in net assets from operations | | | (130,501,158 | ) | | | 271,774,578 | |
| | | | | | | | |
From Distributions to Shareholders (a) | |
Class A | | | (117,171,030 | ) | | | (89,784,446 | ) |
Class B | | | (44,827,471 | ) | | | (34,541,744 | ) |
Class E | | | (13,064,427 | ) | | | (10,698,139 | ) |
| | | | | | | | |
Total distributions | | | (175,062,928 | ) | | | (135,024,329 | ) |
| | | | | | | | |
Decrease in net assets from capital share transactions | | | (150,812,214 | ) | | | (83,242,812 | ) |
| | | | | | | | |
Total increase (decrease) in net assets | | | (456,376,300 | ) | | | 53,507,437 | |
|
Net Assets | |
Beginning of period | | | 3,493,854,052 | | | | 3,440,346,615 | |
| | | | | | | | |
End of period | | $ | 3,037,477,752 | | | $ | 3,493,854,052 | (b) |
| | | | | | | | |
Other Information:
Capital Shares
Transactions in capital shares were as follows:
| | | | | | | | | | | | | | | | |
| | | Year Ended
December 31, 2018 | | | Year Ended
December 31, 2017 | |
| | | Shares | | | Value | | | Shares | | | Value | |
Class A | |
Sales | | | 3,007,055 | | | $ | 40,426,096 | | | | 4,556,098 | | | $ | 62,834,363 | |
Reinvestments | | | 9,139,706 | | | | 117,171,030 | | | | 6,616,393 | | | | 89,784,446 | |
Redemptions | | | (19,372,540 | ) | | | (254,024,698 | ) | | | (12,851,341 | ) | | | (176,839,518 | ) |
| | | | | | | | | | | | | | | | |
Net decrease | | | (7,225,779 | ) | | $ | (96,427,572 | ) | | | (1,678,850 | ) | | $ | (24,220,709 | ) |
| | | | | | | | | | | | | | | | |
Class B | |
Sales | | | 4,583,773 | | | $ | 60,367,407 | | | | 3,747,478 | | | $ | 51,151,945 | |
Reinvestments | | | 3,521,404 | | | | 44,827,471 | | | | 2,564,346 | | | | 34,541,744 | |
Redemptions | | | (10,807,184 | ) | | | (140,943,216 | ) | | | (8,345,194 | ) | | | (113,982,456 | ) |
| | | | | | | | | | | | | | | | |
Net decrease | | | (2,702,007 | ) | | $ | (35,748,338 | ) | | | (2,033,370 | ) | | $ | (28,288,767 | ) |
| | | | | | | | | | | | | | | | |
Class E | |
Sales | | | 1,048,477 | | | $ | 13,822,436 | | | | 741,587 | | | $ | 10,138,146 | |
Reinvestments | | | 1,023,858 | | | | 13,064,427 | | | | 791,868 | | | | 10,698,139 | |
Redemptions | | | (3,468,938 | ) | | | (45,523,167 | ) | | | (3,766,714 | ) | | | (51,569,621 | ) |
| | | | | | | | | | | | | | | | |
Net decrease | | | (1,396,603 | ) | | $ | (18,636,304 | ) | | | (2,233,259 | ) | | $ | (30,733,336 | ) |
| | | | | | | | | | | | | | | | |
Decrease derived from capital shares transactions | | | | | | $ | (150,812,214 | ) | | | | | | $ | (83,242,812 | ) |
| | | | | | | | | | | | | | | | |
| | | | |
| (a) | | Distributions from net investment income and realized gains are no longer required to be separately disclosed. The presentation for the year ended December 31, 2018 has been adjusted for this change (See Note 9). At December 31, 2017 the distributions were from net investment income. |
| (b) | | As part of the update in (a), it is also no longer required to disclose the Undistributed net investment income (Accumulated losses) which was $175,786,467 as of December 31, 2017. |
See accompanying notes to financial statements.
BHFTII-31
Brighthouse Funds Trust II
Western Asset Management Strategic Bond Opportunities Portfolio
Financial Highlights
| | | | | | | | | | | | | | | | | | | | |
| Selected per share data | |
| | | Class A | |
| | | Year Ended December 31, | |
| | | 2018 | | | 2017 | | | 2016 | | | 2015 | | | 2014 | |
Net Asset Value, Beginning of Period | | $ | 13.93 | | | $ | 13.40 | | | $ | 12.53 | | | $ | 13.43 | | | $ | 13.45 | |
| | | | | | | | | | | | | | | | | | | | |
Income (Loss) from Investment Operations | |
Net investment income (a) | | | 0.71 | | | | 0.67 | | | | 0.62 | (b) | | | 0.59 | | | | 0.64 | |
Net realized and unrealized gain (loss) | | | (1.23 | ) | | | 0.41 | | | | 0.45 | | | | (0.80 | ) | | | 0.09 | |
| | | | | | | | | | | | | | | | | | | | |
Total income (loss) from investment operations | | | (0.52 | ) | | | 1.08 | | | | 1.07 | | | | (0.21 | ) | | | 0.73 | |
| | | | | | | | | | | | | | | | | | | | |
Less Distributions | |
Distributions from net investment income | | | (0.73 | ) | | | (0.55 | ) | | | (0.20 | ) | | | (0.69 | ) | | | (0.75 | ) |
| | | | | | | | | | | | | | | | | | | | |
Total distributions | | | (0.73 | ) | | | (0.55 | ) | | | (0.20 | ) | | | (0.69 | ) | | | (0.75 | ) |
| | | | | | | | | | | | | | | | | | | | |
Net Asset Value, End of Period | | $ | 12.68 | | | $ | 13.93 | | | $ | 13.40 | | | $ | 12.53 | | | $ | 13.43 | |
| | | | | | | | | | | | | | | | | | | | |
Total Return (%) (c) | | | (3.80 | ) | | | 8.23 | | | | 8.55 | | | | (1.72 | ) | | | 5.47 | |
|
Ratios/Supplemental Data | |
Gross ratio of expenses to average net assets (%) | | | 0.60 | | | | 0.59 | | | | 0.60 | | | | 0.63 | | | | 0.65 | |
Net ratio of expenses to average net assets (%) (d) | | | 0.54 | | | | 0.54 | | | | 0.54 | | | | 0.59 | | | | 0.61 | |
Ratio of net investment income to average net assets (%) | | | 5.33 | | | | 4.88 | | | | 4.74 | (b) | | | 4.51 | | | | 4.77 | |
Portfolio turnover rate (%) | | | 90 | (e) | | | 139 | (e) | | | 86 | | | | 99 | (e) | | | 98 | (e) |
Net assets, end of period (in millions) | | $ | 2,006.8 | | | $ | 2,305.0 | | | $ | 2,239.2 | | | $ | 1,070.0 | | | $ | 982.6 | |
| |
| | | Class B | |
| | | Year Ended December 31, | |
| | | 2018 | | | 2017 | | | 2016 | | | 2015 | | | 2014 | |
Net Asset Value, Beginning of Period | | $ | 13.81 | | | $ | 13.29 | | | $ | 12.46 | | | $ | 13.35 | | | $ | 13.37 | |
| | | | | | | | | | | | | | | | | | | | |
Income (Loss) from Investment Operations | |
Net investment income (a) | | | 0.67 | | | | 0.63 | | | | 0.58 | (b) | | | 0.56 | | | | 0.61 | |
Net realized and unrealized gain (loss) | | | (1.22 | ) | | | 0.41 | | | | 0.45 | | | | (0.80 | ) | | | 0.08 | |
| | | | | | | | | | | | | | | | | | | | |
Total income (loss) from investment operations | | | (0.55 | ) | | | 1.04 | | | | 1.03 | | | | (0.24 | ) | | | 0.69 | |
| | | | | | | | | | | | | | | | | | | | |
Less Distributions | |
Distributions from net investment income | | | (0.69 | ) | | | (0.52 | ) | | | (0.20 | ) | | | (0.65 | ) | | | (0.71 | ) |
| | | | | | | | | | | | | | | | | | | | |
Total distributions | | | (0.69 | ) | | | (0.52 | ) | | | (0.20 | ) | | | (0.65 | ) | | | (0.71 | ) |
| | | | | | | | | | | | | | | | | | | | |
Net Asset Value, End of Period | | $ | 12.57 | | | $ | 13.81 | | | $ | 13.29 | | | $ | 12.46 | | | $ | 13.35 | |
| | | | | | | | | | | | | | | | | | | | |
Total Return (%) (c) | | | (4.02 | ) | | | 7.93 | | | | 8.30 | | | | (2.00 | ) | | | 5.29 | |
|
Ratios/Supplemental Data | |
Gross ratio of expenses to average net assets (%) | | | 0.85 | | | | 0.85 | | | | 0.85 | | | | 0.88 | | | | 0.90 | |
Net ratio of expenses to average net assets (%) (d) | | | 0.79 | | | | 0.79 | | | | 0.79 | | | | 0.84 | | | | 0.86 | |
Ratio of net investment income to average net assets (%) | | | 5.08 | | | | 4.63 | | | | 4.43 | (b) | | | 4.25 | | | | 4.53 | |
Portfolio turnover rate (%) | | | 90 | (e) | | | 139 | (e) | | | 86 | | | | 99 | (e) | | | 98 | (e) |
Net assets, end of period (in millions) | | $ | 802.6 | | | $ | 919.1 | | | $ | 911.7 | | | $ | 189.9 | | | $ | 220.7 | |
Please see following page for Financial Highlights footnote legend.
See accompanying notes to financial statements.
BHFTII-32
Brighthouse Funds Trust II
Western Asset Management Strategic Bond Opportunities Portfolio
Financial Highlights
| | | | | | | | | | | | | | | | | | | | |
| Selected per share data | |
| | | Class E | |
| | | Year Ended December 31, | |
| | | 2018 | | | 2017 | | | 2016 | | | 2015 | | | 2014 | |
Net Asset Value, Beginning of Period | | $ | 13.85 | | | $ | 13.33 | | | $ | 12.48 | | | $ | 13.38 | | | $ | 13.39 | |
| | | | | | | | | | | | | | | | | | | | |
Income (Loss) from Investment Operations | |
Net investment income (a) | | | 0.68 | | | | 0.65 | | | | 0.59 | (b) | | | 0.57 | | | | 0.62 | |
Net realized and unrealized gain (loss) | | | (1.21 | ) | | | 0.40 | | | | 0.46 | | | | (0.81 | ) | | | 0.09 | |
| | | | | | | | | | | | | | | | | | | | |
Total income (loss) from investment operations | | | (0.53 | ) | | | 1.05 | | | | 1.05 | | | | (0.24 | ) | | | 0.71 | |
| | | | | | | | | | | | | | | | | | | | |
Less Distributions | |
Distributions from net investment income | | | (0.71 | ) | | | (0.53 | ) | | | (0.20 | ) | | | (0.66 | ) | | | (0.72 | ) |
| | | | | | | | | | | | | | | | | | | | |
Total distributions | | | (0.71 | ) | | | (0.53 | ) | | | (0.20 | ) | | | (0.66 | ) | | | (0.72 | ) |
| | | | | | | | | | | | | | | | | | | | |
Net Asset Value, End of Period | | $ | 12.61 | | | $ | 13.85 | | | $ | 13.33 | | | $ | 12.48 | | | $ | 13.38 | |
| | | | | | | | | | | | | | | | | | | | |
Total Return (%) (c) | | | (3.92 | ) | | | 7.98 | | | | 8.47 | | | | (1.90 | ) | | | 5.40 | |
|
Ratios/Supplemental Data | |
Gross ratio of expenses to average net assets (%) | | | 0.75 | | | | 0.75 | | | | 0.75 | | | | 0.78 | | | | 0.80 | |
Net ratio of expenses to average net assets (%) (d) | | | 0.69 | | | | 0.69 | | | | 0.69 | | | | 0.74 | | | | 0.76 | |
Ratio of net investment income to average net assets (%) | | | 5.18 | | | | 4.73 | | | | 4.52 | (b) | | | 4.35 | | | | 4.63 | |
Portfolio turnover rate (%) | | | 90 | (e) | | | 139 | (e) | | | 86 | | | | 99 | (e) | | | 98 | (e) |
Net assets, end of period (in millions) | | $ | 228.0 | | | $ | 269.8 | | | $ | 289.4 | | | $ | 50.8 | | | $ | 59.5 | |
| | | | |
| (a) | | Per share amounts based on average shares outstanding during the period. |
| (b) | | Net investment income per share and the ratio of net investment income to average net assets include anon-recurring refund for overbilling of prior years’ custodianout-of-pocket fees which amounted to less than $0.01 per share and 0.02% of average net assets, respectively. |
| (c) | | Total return does not reflect any insurance, sales, separate account or administrative charges of variable annuity or life insurance contracts or any additional expenses that contract owners may bear under their variable contracts. If these charges were included, the returns would be lower. |
| (d) | | Includes the effects of management fee waivers (see Note 6 of the Notes to Financial Statements). |
| (e) | | Includes mortgage dollar roll and TBA transactions; excluding these transactions the portfolio turnover rates would have been 56%, 79%, 71%, 57% and 62% for the years ended December 31, 2018, 2017, 2016, 2015 and 2014, respectively. |
See accompanying notes to financial statements.
BHFTII-33
Brighthouse Funds Trust II
Western Asset Management Strategic Bond Opportunities Portfolio
Notes to Financial Statements—December 31, 2018
1. Organization
Brighthouse Funds Trust II (the “Trust”) is organized as a Delaware statutory trust and registered under the Investment Company Act of 1940, as amended (the “1940 Act”), as anopen-end management investment company. The Trust, which is managed by Brighthouse Investment Advisers, LLC (“Brighthouse Investment Advisers” or the “Adviser”), currently offers twenty-nine series, each of which operates as a distinct investment vehicle of the Trust. The series included in this report is Western Asset Management Strategic Bond Opportunities Portfolio (the “Portfolio”), which is diversified. Shares of the Portfolio are not offered directly to the general public and are currently available only to separate accounts of insurance companies, including insurance companies affiliated with the Adviser (together, the “Insurance Companies”).
The Portfolio has registered and offers three classes of shares: Class A, B and E shares. Shares of each Class of the Portfolio represent an equal pro rata interest in the Portfolio and generally give the shareholder the same voting, dividend, liquidation, and other rights. Investment income, realized and unrealized capital gains and losses, the common expenses of the Portfolio, and certain Portfolio-level expense reductions, if any, are allocated on a pro rata basis to each Class based on the relative net assets of each Class to the net assets of the Portfolio. Each Class of shares differs in its respective distribution plan and such distribution expenses are allocated to the corresponding Class of shares.
2. Significant Accounting Policies
The preparation of financial statements in conformity with accounting principles generally accepted in the United States of America (“GAAP”) requires management to make estimates and assumptions that affect the reported amounts of assets and liabilities and disclosure of contingent assets and liabilities as of the date of the financial statements and the reported amounts of income and expenses during the reporting period. Actual results could differ from those estimates. In the preparation of these financial statements, management has evaluated events and transactions subsequent to December 31, 2018 through the date the financial statements were issued.
The Portfolio is an investment company and follows the accounting and reporting guidance of the Financial Accounting Standards Board (“FASB”) Accounting Standards Codification Topic 946—Financial Services—investment Companies. The following is a summary of significant accounting policies consistently followed by the Portfolio in the preparation of its financial statements.
Investment Valuation and Fair Value Measurements - The Portfolio values its portfolio investments for purposes of calculating its net asset value (“NAV”) using procedures approved by the Board of Trustees of the Trust (the “Board” or “Trustees”). Those procedures allow for a variety of methodologies to be used to value the Portfolio’s investments. The specific methodologies used for a particular investment may vary based on the market data available for a specific investment at the time the Portfolio calculates its NAV or based on other considerations. The procedures also permit a level of judgment to be used in the valuation process. The Portfolio follows the accounting and reporting guidance of FASB Accounting Standards Codification Topic 820—Fair Value Measurement.
Debt securities, including corporate, convertible and municipal bonds and notes; obligations of the U.S. Treasury and U.S. government agencies; foreign sovereign issues; andnon-U.S. bonds, are generally valued on the basis of evaluated or composite bid quotations obtained from independent pricing services and/or brokers and dealers selected by the Adviser (each a “pricing service”), pursuant to the authorization of and subject to general oversight by the Board. Such pricing services may use matrix pricing, which considers observable inputs including, among other things, issuer details, maturity dates, interest rates, yield curves, rates of prepayment, credit risks/spreads, default rates, reported trades, broker-dealer quotes and quoted prices for similar assets. Short-term obligations with a remaining maturity of sixty days or less may be valued at amortized cost in the absence of market quotes, so long as the amortized cost value of such short-term debt instrument is approximately the same as the fair value of the instrument as determined without the use of amortized cost valuation. Floating rate loans are generally valued on the basis of an evaluated or composite average of aggregate bid and ask quotations supplied by brokers or dealers, as obtained from the pricing service. Securities that use similar valuation techniques and inputs as described above are generally categorized as Level 2 within the fair value hierarchy.
Mortgage- and asset-backed securities are generally valued on the basis of evaluated or composite bid quotations obtained from pricing services selected by the Adviser pursuant to authorization of and subject to general oversight by the Board. These securities are usually issued as separate tranches, or classes, of securities within each deal. The pricing models for these securities usually consider tranche-level attributes, current market data, estimated cash flows and market-based yield spreads for each tranche and incorporate deal collateral performance, as available. Mortgage- and asset-backed securities that use similar valuation techniques and inputs as described above are generally categorized as Level 2 within the fair value hierarchy.
Domestic and foreign equity securities, such as common stock, exchange-traded funds, rights, warrants, and preferred stock, that are traded on a securities exchange on a valuation date are generally valued at their last quoted sale price or official closing price on the primary exchange for such security, or, if no sales occurred on that day, at the last reported bid price. Equity securities tradedover-the-counter (“OTC”) are generally valued at the last reported bid price. In the event of a major exchange closing during the trading day, the Adviser may use other market information obtained from quotation reporting systems, established market makers, or
BHFTII-34
Brighthouse Funds Trust II
Western Asset Management Strategic Bond Opportunities Portfolio
Notes to Financial Statements—December 31, 2018—(Continued)
pricing services in valuing the securities. Valuation adjustments may be applied to certain foreign equity securities that are traded solely on foreign exchanges that close before the time as of which the Portfolio determines its NAV to account for the market movement between the close of the foreign exchanges and the time as of which the Portfolio determines its NAV. The Portfolio may use a systematic fair valuation model provided by a pricing service to value securities principally traded in these foreign markets in order to adjust for possible market movements or other changes that may occur between the close of the foreign exchanges and the time as of which the Portfolio determines its NAV. Foreign equity securities valued using these valuation adjustments are generally categorized as Level 2 within the fair value hierarchy. Equity securities that are actively traded, and have no valuation adjustments applied, are categorized as Level 1 within the fair value hierarchy. Other equity securities traded on inactive markets, or valued in reference to similar instruments traded on active markets, are generally categorized as Level 2 within the fair value hierarchy.
Investments in registeredopen-end management investment companies are valued at reported NAV per share on the valuation date and are categorized as Level 1 within the fair value hierarchy.
Foreign currency forward contracts are valued through an independent pricing service by interpolating between forward and spot currency rates in the London foreign exchange markets as of a designated hour on a valuation day. These contracts are generally categorized as Level 2 within the fair value hierarchy.
Options, whether on securities, indices, futures contracts, or otherwise, traded on exchanges are valued at the last sale price available as of the close of business on a valuation day or, if there is no such price available, at the last reported bid price. These types of options are categorized as Level 1 within the fair value hierarchy. Futures contracts that are traded on commodity exchanges are valued at their settlement prices established by the exchanges on which they are traded as of the close of such exchanges and are categorized as Level 1 within the fair value hierarchy.
Options, including options on swaps (“swaptions”), currencies, and futures contracts that are traded OTC are generally valued on the basis of interdealer bid and ask prices or prices provided by pricing service providers who use a series of techniques, including simulation pricing models, to determine the value of the contracts. The pricing models use inputs that are observed from actively quoted markets such as issuer details, indices, spreads, interest rates, yield curves, credit curves, measures of volatility and exchange rates. These contracts are generally categorized as Level 2 within the fair value hierarchy.
Swap contracts (other than centrally cleared swaps) aremarked-to-market daily based on quotations and prices supplied by market makers, broker-dealers and other pricing services. Such quotations and prices are derived utilizing observable data, including the underlying reference securities or indices, credit spread quotations and expected default recovery rates determined by the pricing service. These contracts are generally categorized as Level 2 within the fair value hierarchy.
Centrally cleared swaps listed or traded on a multilateral or trade facility platform, such as a registered exchange, are valued at the daily settlement price determined by the respective exchange or a pricing service when the exchange price is not available. For centrally cleared credit default swaps, the clearing facility requires its members to provide actionable price levels across complete term structures. These levels along with external third-party prices are used to produce daily settlement prices. These securities are categorized as Level 2 within the fair value hierarchy. Centrally cleared interest rate swaps are valued using a pricing model that references the underlying rates, including the overnight index swap rate and London Interbank Offered Rate (“LIBOR”) forward rate to produce the daily settlement price. These securities are categorized as Level 2 within the fair value hierarchy.
If no current market value quotation or other observable inputs are readily available or market value quotations are deemed to be unreliable for an investment, the fair value of the investment will be determined in accordance with procedures approved by, and under the general supervision of, the Board. In such a circumstance, the Board will be assisted in its responsibility to determine the fair value of an investment by the Valuation Committee (“Committee”) of Brighthouse Investment Advisers. The Committee provides general pricing oversight and fair value pricing determinations related to portfolio securities and meets on a regular basis to review reports relating to the valuation of the securities in the Portfolio. The Board has delegated to State Street Bank and Trust Company, the Trust’s Custodian (“Custodian”), the responsibility for calculating the NAVs of the Trust’s Portfolios. The Committee is responsible for overseeing the calculation of the NAVs of the Portfolios by the Custodian. The Committee also periodically reviews pricing services, including the pricing services providing fair value pricing for the Portfolio’s foreign securities, and is responsible for overseeing the correction of pricing errors and addressing other pricing issues that arise in the ordinary course of business, such as making real-time fair value determinations, as necessary.
No single standard for determining the fair value of an investment can be set forth because fair value depends upon the facts and circumstances with respect to each investment. Information relating to any relevant factors may be obtained by the Committee from any appropriate source, including the subadviser of the Portfolio, the Custodian, a pricing service, market maker and/or broker for such security or the issuer. Appropriate methodologies for determining fair value under particular circumstances may include: matrix pricing, a discounted cash flow analysis, comparisons of securities with comparable characteristics, value based on multiples of earnings, discount from market price of similar marketable securities, or a combination of these and other methods.
BHFTII-35
Brighthouse Funds Trust II
Western Asset Management Strategic Bond Opportunities Portfolio
Notes to Financial Statements—December 31, 2018—(Continued)
Investment Transactions and Related Investment Income - Portfolio security transactions are recorded on the trade date. Dividend income is recorded on theex-dividend date or, for certain foreign securities, when notified. Interest income, which includes amortization of premium and accretion of discount on debt securities, is recorded on the accrual basis. Realized gains and losses on investments are determined on the identified cost basis, which is the same basis used for federal income tax purposes. Foreign income and foreign capital gains on some foreign securities may be subject to foreign taxes, which are accrued as applicable. These foreign taxes have been provided for in accordance with the Portfolio’s understanding of the applicable countries’ tax rules and rates.
Foreign Currency Translation -The books and records of the Portfolio are maintained in U.S. dollars. The values of securities, currencies, and other assets and liabilities denominated in currencies other than the U.S. dollar are translated into U.S. dollars based upon foreign exchange rates prevailing at the end of the period. Purchases and sales of investment securities, income, and expenses are translated on the respective dates of such transactions. Because the values of investment securities are translated at the foreign exchange rates prevailing at the end of the period, that portion of the results of operations arising from changes in exchange rates and that portion of the results of operations reflecting fluctuations arising from changes in market prices of the investment securities are not separated. Such fluctuations are included in the net realized and unrealized gain or loss on investments.
Net realized foreign exchange gains or losses arise from activity in forward foreign currency exchange contracts, sales of foreign currency, currency gains or losses realized between the trade and settlement dates on securities transactions, and the difference between the amounts of dividends, interest, and foreign withholding taxes recorded by the Portfolio and the U.S. dollar-equivalent of the amounts actually received or paid by the Portfolio. Net unrealized foreign exchange gains and losses arise from changes in the value of assets and liabilities, other than investment securities, resulting from changes in foreign exchange rates.
Dividends and Distributions to Shareholders -The Portfolio records dividends and distributions on theex-dividend date. Net realized gains from securities transactions (if any) are generally distributed annually to shareholders. The timing and characterization of certain income and capital gains distributions are determined in accordance with federal tax regulations that may differ from GAAP. Permanent book and tax basis differences relating to shareholder distributions will result in reclassification between distributable earnings (accumulated losses) andpaid-in surplus.Book-tax differences are primarily due to expired capital loss carryforward. These adjustments have no impact on net assets or the results of operations.
Income Taxes -It is the Portfolio’s policy to comply with the requirements of the Internal Revenue Code of 1986, as amended, and regulations thereunder, applicable to regulated investment companies, and to distribute, with respect to each taxable year, all of its taxable income to shareholders. Therefore, no federal income tax provision is required. The Portfolio files U.S. federal tax returns. No income tax returns are currently under examination. The Portfolio’s federal tax returns for the prior three fiscal years remain subject to examination by the Internal Revenue Service. As of December 31, 2018, the Portfolio had no uncertain tax positions that would require financial statement recognition, or derecognition or disclosure.
Mortgage Dollar Rolls- The Portfolio may enter into mortgage “dollar rolls” in which a Portfolio sellsto-be-announced (“TBA”) mortgage-backed securities for delivery in the current month and simultaneously contracts to repurchase substantially similar (same type, coupon, and maturity) securities on a specified future date. For the duration of the transaction, or roll period, the Portfolio foregoes principal (including prepayments of principal) and interest paid on the securities sold. Dollar rolls are accounted for as purchase and sale transactions; gain or loss is recognized at the commencement of the term of the dollar roll and each time the mortgage-backed security is rolled.
Mortgage dollar roll transactions involve the risk that the market value of the securities that the Portfolio is required to reacquire may be less than the agreed-upon repurchase price of those securities and that the investment performance of securities purchased with proceeds from these transactions does not exceed the income, capital appreciation and gain or loss that would have been realized on the securities transferred or sold, as applicable, as part of the treasury or mortgage dollar roll.
Mortgage-Related and Other Asset-Backed Securities - The Portfolio may invest in mortgage-related or other asset-backed securities. These securities may include mortgage pass-through securities, collateralized mortgage obligations (“CMOs”), commercial mortgage-backed securities, CMO residuals, stripped mortgage-backed securities (“SMBS”), and other securities that directly or indirectly represent a participation in, or are secured by or payable from, mortgage loans on real property or other receivables. The value of some mortgage- or asset-backed securities may be particularly sensitive to changes in prevailing interest rates. Early repayment of principal on some mortgage-related securities may expose the Portfolio to a lower rate of return upon reinvestment of principal. The value of these securities may fluctuate in response to the market’s perception of the creditworthiness of the issuers. Additionally, although mortgages and mortgage-related securities are generally supported by some form of government or private guarantee and/or insurance, there is no assurance that private guarantors or insurers will meet their obligations.
In one type of SMBS, one class receives all of the interest from the mortgage assets (the interest-only or “IO” class), while the other class will receive all of the principal (the principal-only or “PO” class). Because principal will not be received at the maturity of an IO, adjustments are made to the book value of the security until maturity. These adjustments are netted against payments received for the
BHFTII-36
Brighthouse Funds Trust II
Western Asset Management Strategic Bond Opportunities Portfolio
Notes to Financial Statements—December 31, 2018—(Continued)
IOs and the net amount is included in interest income on the Statement of Operations of the Portfolio. Payments received for POs are treated as reductions to the cost and par value of the securities. Details of mortgage-related and other asset-backed securities held by the Portfolio are included in the Portfolio’s Schedule of Investments.
The Portfolio may invest a significant portion of its assets in securities of issuers that hold mortgage- and asset-backed securities and direct investments in securities backed by commercial and residential mortgage loans and other financial assets. The value and related income of these securities are sensitive to changes in economic conditions, including delinquencies and/or defaults, and may be negatively impacted by increased volatility of market prices and periods of illiquidity.
TBA Purchase and Forward Sale Commitments -The Portfolio may enter into TBA commitments to purchase or sell securities for a fixed price at a future date. TBA commitments are considered securities in themselves, and involve a risk of loss if the value of the security to be purchased or sold declines or increases prior to the settlement date, which is in addition to the risk of decline in the value of the Portfolio’s other assets. TBA forward sale commitments are valued at the current market value of the underlying securities, according to the procedures described under “Investment Valuation and Fair Value Measurements”.
When-Issued and Delayed-Delivery Securities- The Portfolio may purchase securities on a when-issued or delayed-delivery basis. Settlement of such transactions will occur beyond the customary settlement period. The Portfolio may purchase securities under such conditions only with the intention of actually acquiring them, but may enter into a separate agreement to sell the securities before the settlement date. Since the value of securities purchased may fluctuate prior to settlement, the Portfolio may be required to pay more at settlement than the security is worth. In addition, the Portfolio is not entitled to any of the interest earned prior to settlement.
Upon making a commitment to purchase a security on a when-issued or delayed-delivery basis, the Portfolio will hold liquid assets in a segregated account with the Portfolio’s Custodian, or set aside liquid assets in the Portfolio’s records, worth at least the equivalent of the amount due. The liquid assets will be monitored on a daily basis and adjusted as necessary to maintain the necessary value.
High-Yield Debt Securities - The Portfolio may invest in high-yield debt securities, or “junk bonds,” which are securities that are rated below “investment grade” or, if not rated, are of equivalent quality. A portfolio with high-yield debt securities generally will be exposed to greater market risk and credit risk than a portfolio that invests only in investment grade debt securities because issuers of high-yield debt securities are generally less secure financially, are more likely to default on their obligations, and their securities are more sensitive to interest rate changes and downturns in the economy. In addition, the secondary market for lower-rated debt securities may not be as liquid as that for more highly rated debt securities. As a result, the Portfolio’s subadviser may find it more difficult to value lower-rated debt securities or sell them and may have to sell them at prices significantly lower than the values assigned to them by the Portfolio.
Floating Rate Loans - The Portfolio may invest in loans arranged through private negotiation between one or more financial institutions. The Portfolio’s investment in any such loan may be in the form of a participation in or an assignment of the loan. In connection with purchasing participations, the Portfolio generally will have no right to enforce compliance by the borrower with the terms of the loan agreement relating to the loan, nor any rights ofset-off against the borrower. The Portfolio may not benefit directly from any collateral supporting the loan in which it has purchased the participation or assignment. The purchase of assignments will typically result in the Portfolio having a direct contractual relationship with the borrower, and the Portfolio may enforce compliance by the borrower with the terms of the loan agreement.
The Portfolio may invest in multiple series or tranches of a loan, which may have varying terms and carry different associated risks. When the Portfolio purchases assignments, it acquires direct rights against the borrower of the loan. These loans may include participations in bridge loans, which are loans taken out by borrowers for a short period (typically less than one year) pending arrangement of more permanent financing.
The Portfolio will assume the credit risk of both the borrower and the lender that is selling the participation. In the event of the insolvency of the lender selling the participation, the Portfolio may be treated as a general creditor of the lender and may not benefit from anyset-off between the lender and the borrower.
Repurchase Agreements -The Portfolio may enter into repurchase agreements, under the terms of a Master Repurchase Agreement (“MRA”), with selected commercial banks and broker-dealers, under which the Portfolio acquires securities as collateral and agrees to resell the securities at an agreed-upon time and at an agreed-upon price. The Portfolio, through the Custodian or a subcustodian, under atri-party repurchase agreement, receives delivery of the underlying securities collateralizing any repurchase agreements. It is the Portfolio’s policy that the market value of the collateral be equal to at least 100% of the repurchase price in the case of a repurchase agreement ofone-day duration and equal to at least 102% of the repurchase price in the case of all other repurchase agreements. In the event of default or failure by a party to perform an obligation in connection with any repurchase transaction, the MRA gives thenon-defaulting party the right toset-off claims and to apply property held by it in connection with any repurchase transaction against obligations owed to it.
BHFTII-37
Brighthouse Funds Trust II
Western Asset Management Strategic Bond Opportunities Portfolio
Notes to Financial Statements—December 31, 2018—(Continued)
At December 31, 2018, the Portfolio had direct investments in repurchase agreements with a gross value of $3,167,166. Additionally, the Portfolio invested cash collateral for loans of portfolio securities in repurchase agreements with a gross value of $48,357,820. The combined value of all repurchase agreements is included as part of investments at value on the Statement of Assets and Liabilities. The value of the related collateral exceeded the value of the repurchase agreements at December 31, 2018.
Securities Lending - The Portfolio may lend its portfolio securities to certain qualified brokers who borrow securities in order to complete certain securities transactions. By lending its portfolio securities, the Portfolio attempts to increase its net investment income through the receipt of income on collateral held from securities on loan. Any gain or loss in the market price of the loaned securities that might occur and any interest earned or dividends declared during the term of the loan would accrue to the account of the Portfolio.
The Trust has entered into aNon-Custodial Securities Lending Agreement with JPMorgan Chase Bank, N.A. (the “Lending Agent”). Under the agreement, the Lending Agent is authorized to loan portfolio securities on the Portfolio’s behalf. In exchange, the Portfolio receives either cash or U.S. government securities as collateral against the loaned securities. The Portfolio receives collateral equal to at least 102% of the market value for loans secured by government securities or cash in the same currency as the loaned shares and 105% for all other loaned securities at each loan’s inception. Collateral representing at least 100% of the market value of the loaned securities is maintained for the duration of the loan. Any cash collateral received by the Portfolio is generally invested by the Lending Agent in short-term investments, which may include certificates of deposit, commercial paper, repurchase agreements, time deposits, master demand notes and money market funds. The market value of investments made with cash collateral received are disclosed in the Schedule of Investments and the valuation techniques are described in Note 2. If the market value of the collateral at the close of trading on a business day is less than 100% of the market value of the loaned securities at the close of trading on that day, the borrower is required to deliver, by the close of business on the following business day, an additional amount of collateral, so that the total amount of posted collateral is equal to at least 100% of the market value of all the loaned securities as of such preceding day. A portion of the income earned on the collateral is rebated to the borrower of the securities and the remainder is split between the Lending Agent and the Portfolio. On loans collateralized by U.S. government securities, a fee is received from the borrower and is allocated between the Portfolio and the Lending Agent.
Income received by the Portfolio in securities lending transactions during the year ended December 31, 2018 is reflected as securities lending income on the Statement of Operations. The values of any securities loaned by the Portfolio and the related collateral at December 31, 2018 are disclosed in the footnotes to the Schedule of Investments. The value of the related collateral received by the Portfolio exceeded the value of the securities out on loan at December 31, 2018.
The risks associated with lending portfolio securities include, but are not limited to, possible delays in receiving additional collateral or in the recovery of the loaned securities, possible loss of rights in the collateral should the borrower fail financially, as well as risk of loss in the value of the collateral or the value of the investments made with the collateral. The Lending Agent shall indemnify the Portfolio in the case of default of any securities borrower, subject to the terms of theNon-Custodial Securities Lending Agreement.
The following table provides a breakdown of transactions accounted for as secured borrowings, the gross obligations by the type of collateral pledged, and the remaining contractual maturities of those transactions.
| | | | | | | | | | | | | | | | | | | | |
| | | Remaining Contractual Maturity of the Agreements
As of December 31, 2018 | |
| | | Overnight and
Continuous | | | Up to
30 Days | | | 31 - 90
Days | | | Greater than
90 days | | | Total | |
| Securities Lending Transactions | |
Common Stocks | | $ | (689,579 | ) | | $ | — | | | $ | — | | | $ | — | | | $ | (689,579 | ) |
Convertible Bonds | | | (1,109,440 | ) | | | — | | | | — | | | | — | | | | (1,109,440 | ) |
Corporate Bonds & Notes | | | (280,260,646 | ) | | | — | | | | — | | | | — | | | | (280,260,646 | ) |
Foreign Government | | | (23,614,811 | ) | | | — | | | | — | | | | — | | | | (23,614,811 | ) |
Mortgage-Backed Securities | | | (4,446,019 | ) | | | — | | | | — | | | | — | | | | (4,446,019 | ) |
Preferred Stocks | | | (31,283 | ) | | | — | | | | — | | | | — | | | | (31,283 | ) |
Total | | $ | (310,151,778 | ) | | $ | — | | | $ | — | | | $ | — | | | $ | (310,151,778 | ) |
Total Borrowings | | $ | (310,151,778 | ) | | $ | — | | | $ | — | | | $ | — | | | $ | (310,151,778 | ) |
Gross amount of recognized liabilities for securities lending transactions | | | $ | (310,151,778 | ) |
| | | | | | | | | | | | | | | | | | | | |
3. Investments in Derivative Instruments
Forward Foreign Currency Exchange Contracts - The Portfolio may enter into forward foreign currency exchange contracts to obtain investment exposure, enhance return or hedge or protect its portfolio holdings against the risk of future movements in certain foreign currency exchange rates. When entering into these contracts, the Portfolio agrees to receive or deliver a fixed quantity of foreign
BHFTII-38
Brighthouse Funds Trust II
Western Asset Management Strategic Bond Opportunities Portfolio
Notes to Financial Statements—December 31, 2018—(Continued)
currency for an agreed-upon price on an agreed-upon future date. These contracts are valued daily and the Portfolio’s net equity therein, representing unrealized gain or loss on the contracts as measured by the difference between the forward foreign exchange rates at the dates of entry into the contracts and the forward foreign exchange rates at the valuation date, is included in the Statement of Assets and Liabilities. When a contract is closed, the Portfolio recognizes a realized gain or loss equal to the difference between the value of the contract at the time it was opened and the value at the time it was closed.
Realized and unrealized gains and losses on forward foreign currency exchange contracts are included in the Statement of Operations. These contracts involve market and/or credit risk in excess of the amount recognized in the Statement of Assets and Liabilities. The use of forward foreign currency exchange contracts does not eliminate fluctuations in the underlying prices of the securities of the Portfolio, but it does establish a rate of exchange that can be achieved in the future. Although forward foreign currency exchange contracts may limit the risk of loss due to a decline in the value of the currency holdings, they also limit any potential gain that might result should the value of the currency increase. In addition, the Portfolio could be exposed to losses if the counterparties to the contracts are unable to meet the terms of the contracts. The Portfolio may also experience losses even when such contracts are used for hedging purposes. The Portfolio’s maximum potential loss from such contracts is the aggregate face value in U.S. dollars at the time the contract was opened.
Futures Contracts -The Portfolio may buy and sell futures contracts as a hedge, to maintain investment exposure to a target asset class or to enhance return. The Portfolio may be subject to fluctuations in equity prices, interest rates, commodity prices, and foreign currency exchange rates in the normal course of pursuing its investment objective. Futures contracts are standardized agreements to buy or sell a security, or deliver a final cash settlement price in connection with an index, interest rate, currency, or other asset. The Portfolio must deposit an amount (“initial margin”) equal to a certain percentage of the face value of the futures contract. The initial margin may be in the form of cash or securities, which is returned when the Portfolio’s obligations under the contract have been satisfied. If cash is deposited as the initial margin, it is shown as cash collateral on the Statement of Assets and Liabilities. Futures contracts aremarked-to-market daily and subsequent payments (“variation margin”) are made or received by the Portfolio depending on whether unrealized gains or losses are incurred. These amounts are reflected as receivables or payables on the Statement of Assets and Liabilities and as a component of net change in unrealized appreciation/depreciation on the Statement of Operations. When the contract is closed or expires, the Portfolio records a realized gain or loss equal to the difference between the value of the contract at the time it was opened and the value at the time it was closed. Risks of entering into futures contracts (and related options) include the possibility that the market for these instruments may be illiquid and that a change in the value of the contract or option may not correlate perfectly with changes in the value of the underlying instrument. If futures contracts areexchange-traded, the exchange’s clearinghouse, as counterparty to all exchange-traded futures, guarantees the futures contracts against default. For OTC futures, the Portfolio’s ability to terminate the positions may be more limited than in the case of exchange-traded positions and may also involve the risk that securities dealers participating in such transactions would fail to meet their obligations to the Portfolio.
Options Contracts -An option contract purchased by the Portfolio gives the Portfolio the right, but not the obligation, to buy (call) or sell (put) an underlying instrument at a fixed exercise price during a specified period. Call options written by the Portfolio give the holder the right to buy the underlying instrument from the Portfolio at a fixed exercise price; put options written by the Portfolio give the holder the right to sell the underlying instrument to the Portfolio at a fixed exercise price.
The Portfolio may use options to hedge against changes in values of securities the Portfolio owns or expects to purchase, to maintain investment exposure to a target asset class or to enhance return. Writing puts or buying calls tend to increase the Portfolio’s exposure to the underlying instrument and writing calls or buying puts tends to decrease the Portfolio’s exposure to the underlying instrument, and can be used to hedge other Portfolio investments. For options used to hedge the Portfolio’s investments, the potential risk to the Portfolio is that the change in value of options contracts may not correspond perfectly to the change in value of the hedged instruments. The Portfolio also bears the risk of an unfavorable change in the value of the underlying instrument or the risk that the Portfolio may not be able to enter into a closing transaction due to an illiquid market. The Portfolio’s maximum risk of loss from counterparty credit risk, as opposed to investment and other types of risk, in respect of purchased options is typically the premium initially paid for the option plus any unrealized gains.
The main risk associated with purchasing an option is that the option expires without being exercised. In this case, the option is worthless when it expires and the premium paid for the option is considered a realized loss. The risk associated with writing a call option is that the Portfolio may forgo the opportunity for a profit if the market value of the underlying instrument increases and the option is exercised, requiring the Portfolio to sell the underlying instrument at a price below its market value. When the Portfolio writes a call option on a security it does not own, its exposure on such an option is theoretically unlimited. The risk in writing a put option is that the Portfolio may incur a loss if the market value of the underlying instrument decreases and the option is exercised, requiring the Portfolio to purchase the underlying instrument at a price above its market value. In addition, the Portfolio risks not being able to enter into a closing transaction for the written option as the result of an illiquid market for the option.
Purchases of put and call options are recorded as investments, the value of which aremarked-to-market daily. When the Portfolio enters into a closing sale transaction, the Portfolio will realize a gain or loss depending on whether the sales proceeds from the closing
BHFTII-39
Brighthouse Funds Trust II
Western Asset Management Strategic Bond Opportunities Portfolio
Notes to Financial Statements—December 31, 2018—(Continued)
sale transaction are greater or less than the premium initially paid for the option. When the Portfolio exercises a put option, it will realize a gain or loss from the sale of the underlying instrument and the proceeds from such sale will be decreased by the premium originally paid for the put option. When the Portfolio exercises a call option, the cost of the security which the Portfolio purchases upon exercise will be increased by the premium originally paid for the call option.
The premium received by the Portfolio for a written option is recorded as an asset and an equivalent liability. The liability is subsequentlymarked-to-market to reflect the current value of the option written. When a written option expires without being exercised or the Portfolio enters into a closing purchase transaction, the Portfolio realizes a gain (or loss if the cost of the closing purchase transaction exceeds the premium received when the option was sold) without regard to any unrealized gain or loss on the underlying instrument and the liability related to such option is eliminated. When a written call option is exercised, the Portfolio realizes a gain or loss, as adjusted for the premium received, from the sale of the underlying instrument. When a written put option is exercised, the premium received by the Portfolio is offset against the amount paid for the purchase of the underlying instrument.
Options on Exchange-Traded Futures Contract (“Futures Option”) is an option contract in which the underlying instrument is a single futures contract.
The purpose of inflation-capped options is to protect the buyer from inflation, above a specified rate, eroding the value of investments in inflation-linked products with a given notional exposure. Inflation-capped options are used to give downside protection to investments in inflation-linked products by establishing a floor on the value of such products.
Swaptions are similar to options on securities except that instead of selling or purchasing the right to buy or sell a security, the writer or purchaser of the swaptions is granting or buying the right to enter into a previously agreed upon interest rate or credit default swap agreement at any time before the expiration of the option.
Swap Agreements - The Portfolio may enter into swap agreements in which the Portfolio and a counterparty agree to either make periodic net payments on a specified notional amount or net payment upon termination. Swap agreements are either privately negotiated in the OTC market (“OTC swaps”) or executed in a multilateral or other trade facility platform, such as a registered commodities exchange (“centrally cleared swaps”). The Portfolio may enter into swap agreements for the purposes of managing exposure to interest rate, credit or market risk, or for other purposes. In connection with these agreements, securities or cash may be paid or received, as applicable, by the Portfolio as collateral or margin in accordance with the terms of the respective swap agreements to provide assets of value and recourse in the event of default or bankruptcy/insolvency. Securities posted by the Portfolio as collateral for swap contracts are identified in the Schedule of Investments and restricted cash, if any, is reflected on the Statement of Assets and Liabilities.
Centrally Cleared Swaps:Clearinghouses currently offer clearing derivative transactions which include interest rate and credit derivatives. In a cleared derivative transaction, a Portfolio typically enters into the transaction with a financial institution counterparty, and performance of the transaction is effectively guaranteed by a central clearinghouse, thereby reducing or eliminating the Portfolio’s exposure to the credit risk of the original counterparty. The Portfolio typically will be required to post specified levels of margin with the clearinghouse or at the instruction of the clearinghouse; the margin required by a clearinghouse may be greater than the margin the Portfolio would be required to post in an uncleared derivative transaction.
Swap agreements aremarked-to-market daily. The fair value of an OTC swap is reflected on the Statement of Assets and Liabilities. The changes in value, if any, are reflected as a component of net change in unrealized appreciation/depreciation on the Statement of Operations. Daily changes in valuation of centrally cleared swaps, if any, are recorded as a receivable or payable for variation margin on the Statement of Assets and Liabilities and as a component of unrealized appreciation/depreciation on the Statement of Operations. Upfront payments paid or received upon entering into the swap agreement compensate for differences between the stated terms of the swap agreement and prevailing market conditions (such as credit spreads, currency exchange rates, interest rates, and other relevant factors). Upon termination or maturity of the swap, upfront premiums are recorded as realized gains or losses on the Statement of Operations. A liquidation payment received or made at the termination of the swap is recorded as realized gain or loss on the Statement of Operations. Net periodic payments received or paid by the Portfolio are included as part of realized gains or losses on the Statement of Operations.
Swap transactions involve, to varying degrees, elements of interest rate, credit, and market risk in excess of the amounts recognized in the Statement of Assets and Liabilities. Such risks involve the possibility that there will be no liquid market for these agreements, that the counterparty to the agreements may default on its obligation to perform, or that there may be unfavorable changes in market conditions or interest rates. In addition, entering into swap agreements involves documentation risk resulting from the possibility that the parties to a swap agreement may disagree as to the meaning of contractual terms in the agreement. The Portfolio may enter into swap transactions with counterparties in accordance with guidelines established by the Board. These guidelines provide for a minimum credit rating for each counterparty and various credit enhancement techniques (for example, collateralization of amounts due from counterparties) to limit exposure to counterparties that have lower credit ratings. A Portfolio’s maximum risk of loss from counterparty credit risk is the discounted value of the net cash flows to be received from the counterparty over the contract’s
BHFTII-40
Brighthouse Funds Trust II
Western Asset Management Strategic Bond Opportunities Portfolio
Notes to Financial Statements—December 31, 2018—(Continued)
remaining life, to the extent that amount is positive, or the fair value of the contract. The risk may be mitigated by having a master netting arrangement between the Portfolio and the counterparty and by the posting of collateral by the counterparty to cover the Portfolio’s exposure to the counterparty. Counterparty risk related to centrally cleared swaps is mitigated due to the protection against defaults provided by the exchange on which these contracts trade.
Credit Default Swaps: The Portfolio is subject to credit risk in the normal course of pursuing its investment objectives. The Portfolio may enter into credit default swaps to manage its exposure to the market or certain sectors of the market, to reduce its risk exposure to defaults of corporate and/or sovereign issuers, or to create exposure to corporate and/or sovereign issuers to which they are not otherwise exposed. Credit default swaps involve one party making a stream of payments (referred to as the buyer of protection) to another party (referred to as the seller of protection) in exchange for the right to receive a specified return if a credit event occurs for the referenced entity, obligation or index. A credit event is defined under the terms of each swap agreement and may include, but is not limited to, underlying entity default, bankruptcy, write-down, principal shortfall or interest shortfall. As the seller of protection, if an underlying credit event occurs, the Portfolio will either pay the buyer an amount equal to the notional amount of the swap and take delivery of the referenced obligation (or underlying securities comprising the referenced index), or pay a net settlement amount in the form of cash or securities equal to the notional amount of the swap less the recovery value of the referenced obligation (or underlying securities comprising the referenced index). In return, the Portfolio would receive from the counterparty an upfront or periodic stream of payments throughout the life of the credit default swap agreement provided that no credit event has occurred. As the seller of protection, the Portfolio will effectively add leverage to its portfolio because, in addition to its total net assets, the Portfolio would be subject to investment exposure on the notional amount of the credit default swap.
The Portfolio may also purchase credit default swap contracts in order to hedge against the risk of default of debt securities held in its portfolio. This would involve the risk that the investment may be worthless when it expires and would only generate income in the event of an actual default by the issuer of the underlying obligation (as opposed to a credit downgrade or other indication of financial instability). It would also involve credit risk, whereby the seller may fail to satisfy its payment obligations to the Portfolio in the event of a default. As the buyer of protection, if an underlying credit event occurs, the Portfolio will either receive from the seller of protection an amount equal to the notional amount of the swap and deliver the referenced obligation (or underlying securities comprising the referenced index), or receive a net settlement amount in the form of cash or securities equal to the notional amount of the swap less the recovery value of the referenced obligation (or underlying securities comprising the referenced index). If no credit event occurs and the Portfolio is a buyer of protection, the Portfolio will typically recover nothing under the credit default swap agreement, but it will have had to pay the required upfront payment or stream of continuing payments under the credit default swap agreement. Recovery values are at times established through the credit event auction process in which market participants are ensured that a transparent price has been set for the defaulted obligation.
Credit default swap agreements on credit indices involve one party making a stream of payments to another party in exchange for the right to receive a specified return in the event of a write-down, principal shortfall, interest shortfall or default of all or part of the referenced entities comprising the credit index. A credit index is a basket of credit instruments or exposures designed to be representative of some part of the credit market as a whole. An index credit default swap references all the names in the index, and if there is a credit event involving an entity in the index, the credit event is settled based on that entity’s weight in the index. A Portfolio may use credit default swaps on credit indices as a hedge for credit default swaps or bonds held in the portfolio, which is less expensive than it would be to buy many individual credit default swaps to achieve similar effect. Credit default swaps on indices are benchmarks for protecting investors owning bonds against default, and may be used to speculate on changes in credit quality.
Implied credit spreads, represented in absolute terms, utilized in determining the market value of credit default swap agreements on a credit index or corporate or sovereign issuer, serve as some indication of the status of the payment/performance risk and the likelihood or risk of default for the credit derivative. The implied credit spread of a particular referenced entity or index also reflects the cost of buying/selling protection and may reflect upfront payments required to be made to enter into the agreement. Wider credit spreads generally represent a deterioration of the referenced entity’s credit soundness and a greater likelihood or risk of default or other credit event occurring as defined under the terms of the particular swap agreement. When no implied credit spread is available for a credit default swap, the current unrealized appreciation/depreciation on the position may be used as an indicator of the current status of the payment/performance risk.
The maximum potential amount of future payments (undiscounted) that the Portfolio as a seller of protection could be required to make under a credit default swap agreement equals the notional amount of the agreement. Notional amounts of all credit default swap agreements outstanding as of December 31, 2018, for which the Portfolio is the seller of protection, are disclosed in the Schedule of Investments. These potential amounts would be partially offset by any recovery values of the respective referenced obligations, upfront payments received upon entering into the agreement or net amounts received from the settlement of buy protection credit default swap agreements entered into by the Portfolio for the same referenced entity or entities.
Currency Swaps: The Portfolio may enter into currency swap agreements to gain or mitigate exposure to currency risk. A currency swap is an agreement to exchange cash flows on a notional amount of two or more currencies based on the relative value differential
BHFTII-41
Brighthouse Funds Trust II
Western Asset Management Strategic Bond Opportunities Portfolio
Notes to Financial Statements—December 31, 2018—(Continued)
among them. Such swaps may involve initial and final exchanges that correspond to the agreed upon notional amount. Currency swaps usually involve the delivery of the entire principal value of one designated currency in exchange for the other designated currency. Therefore, the entire principal value of a currency swap is subject to the risk that the other party to the swap will default on its contractual delivery obligations. If there is a default by the counterparty, the Portfolio may have contractual remedies pursuant to the agreements related to the transaction.
Interest Rate Swaps: The Portfolio may enter into interest rate swaps to manage its exposure to interest rates or to protect against currency fluctuations, to adjust its interest rate sensitivity (duration), to preserve a return or spread on a particular investment, or otherwise as a substitute for a direct investment in debt securities. The Portfolio is subject to interest rate risk exposure in the normal course of pursuing its investment objectives. Because the Portfolio holds fixed rate bonds, the value of these bonds may decrease if interest rates rise. To help hedge against this risk and to maintain its ability to generate income at prevailing market rates, the Portfolio may enter into interest rate swap agreements. Interest rate swaps are agreements in which one party pays a stream of interest payments, either fixed or floating rate, for another party’s stream of interest payments, either fixed or floating, on the same notional amount for a specified period of time. Other forms of interest rate swap agreements may include: (1) interest rate caps, under which, in return for a premium, one party agrees to make payments to the other to the extent that interest rates exceed a specified rate, or “cap”; (2) interest rate floors, under which, in return for a premium, one party agrees to make payments to the other to the extent that interest rates fall below a specified rate, or “floor”; and (3) interest rate collars, under which a party sells a cap and purchases a floor or vice versa in an attempt to protect itself against interest rate movements exceeding given minimum or maximum levels; and (4) basis swaps, under which two parties can exchange variable interest rates based on different segments of money markets. The Portfolio’s maximum risk of loss from counterparty credit risk, as opposed to investment and other types of risk, in respect of interest rate swaps is typically the discounted net value of the cash flows to be received from the counterparty over the contract’s remaining life, to the extent that amount is positive.
The following table summarizes the fair value of derivatives held by the Portfolio at December 31, 2018 by category of risk exposure:
| | | | | | | | | | | | |
| | | Asset Derivatives | | | Liability Derivatives | |
Risk Exposure | | Statement of Assets &
Liabilities Location | | Fair Value | | | Statement of Assets &
Liabilities Location | | Fair Value | |
Interest Rate | | Investments at market value (a) (f) | | $ | 10,654,570 | | | | | | | |
| | Unrealized appreciation on centrally cleared swap contracts (b) (c) | | | 4,124,956 | | | Unrealized depreciation on centrally cleared swap contracts (b) (c) | | $ | 14,669,637 | |
| | Unrealized appreciation on futures contracts (c) (d) | | | 31,854,256 | | | Unrealized depreciation on futures contracts (c) (d) | | | 14,072,804 | |
| | | | | | | | Written options at value (c) | | | 298,656 | |
Credit | | | | | | | | OTC swap contracts at market value (e) | | | 1,061,993 | |
| | Unrealized appreciation on centrally cleared swap contracts (b) (c) | | | 2,773,662 | | | Unrealized depreciation on centrally cleared swap contracts (b) (c) | | | 956,122 | |
Equity | | Investments at market value (a) (c) | | | 2,412,887 | | | | | | | |
| | | | | | | | Written options at value (c) | | | 171,013 | |
Foreign Exchange | | Investments at market value (a) | | | 1,824,485 | | | | | | | |
| | Unrealized appreciation on forward foreign currency exchange contracts | | | 7,741,885 | | | Unrealized depreciation on forward foreign currency exchange contracts | | | 7,431,201 | |
| | | | | | | | Written options at value | | | 187,393 | |
| | | | | | | | | | | | |
| Total | | | | $ | 61,386,701 | | | | | $ | 38,848,819 | |
| | | | | | | | | | | | |
| | | | |
| (a) | | | | Represents purchased options which are part of investments at value as shown in the Statement of Assets and Liabilities. |
| (b) | | | | Represents the unrealized appreciation/depreciation of centrally cleared swaps as reported in the Schedule of Investments. Only the variation margin is reported within the Statement of Assets and Liabilities. |
| (c) | | | | Financial instrument not subject to a master netting agreement. |
| (d) | | | | Includes cumulative appreciation/depreciation of futures contracts as reported in the Schedule of Investments. Only the current day’s variation margin is reported within the Statement of Assets and Liabilities. |
| (e) | | | | Excludes OTC swap interest payable of $10,760. |
| (f) | | | | Includes exchange-traded purchased options with a value of $99,736 that are not subject to a master netting agreement. |
The Portfolio is required to disclose the impact of offsetting assets and liabilities represented in the Statement of Assets and Liabilities to enable users of the financial statements to evaluate the effect or potential effect of netting arrangements on its financial position for recognized assets and liabilities.
BHFTII-42
Brighthouse Funds Trust II
Western Asset Management Strategic Bond Opportunities Portfolio
Notes to Financial Statements—December 31, 2018—(Continued)
The following table presents the Portfolio’s derivative assets by counterparty net of amounts available for offset under a master netting agreement (“MNA”) (see Note 4), or similar agreement, and net of the related collateral received by the Portfolio as of December 31, 2018.
| | | | | | | | | | | | | | | | |
Counterparty | | Derivative Assets
subject to an MNA
by Counterparty | | | Financial
Instruments
available for offset | | | Collateral
Received† | | | Net
Amount* | |
Bank of America N.A. | | $ | 10,554,834 | | | $ | — | | | $ | (10,554,834 | ) | | $ | — | |
Barclays Bank plc | | | 538,685 | | | | (538,685 | ) | | | — | | | | — | |
Citibank N.A. | | | 6,439,175 | | | | (4,239,558 | ) | | | — | | | | 2,199,617 | |
JPMorgan Chase Bank N.A. | | | 2,588,510 | | | | (736,097 | ) | | | (757,199 | ) | | | 1,095,214 | |
| | | | | | | | | | | | | | | | |
| | $ | 20,121,204 | | | $ | (5,514,340 | ) | | $ | (11,312,033 | ) | �� | $ | 3,294,831 | |
| | | | | | | | | | | | | | | | |
The following table presents the Portfolio’s derivative liabilities by counterparty net of amounts available for offset under an MNA, or similar agreement, and net of the related collateral pledged by the Portfolio as of December 31, 2018.
| | | | | | | | | | | | | | | | |
Counterparty | | Derivative Liabilities
subject to an MNA
by Counterparty | | | Financial
Instruments
available for offset | | | Collateral
Pledged† | | | Net
Amount** | |
Barclays Bank plc | | $ | 1,612,366 | | | $ | (538,685 | ) | | $ | (770,000 | ) | | $ | 303,681 | |
Citibank N.A. | | | 4,239,558 | | | | (4,239,558 | ) | | | — | | | | — | |
Deutsche Bank AG | | | 2,092,566 | | | | — | | | | (2,080,000 | ) | | | 12,566 | |
JPMorgan Chase Bank N.A. | | | 736,097 | | | | (736,097 | ) | | | — | | | | — | |
| | | | | | | | | | | | | | | | |
| | $ | 8,680,587 | | | $ | (5,514,340 | ) | | $ | (2,850,000 | ) | | $ | 316,247 | |
| | | | | | | | | | | | | | | | |
| | | | |
| * | | Net amount represents the net amount receivable from the counterparty in the event of default. |
| ** | | Net amount represents the net amount payable due to the counterparty in the event of default. |
| † | | In some instances, the actual collateral received and/or pledged may be more than the amount shown here due to overcollateralization. |
The following tables summarize the effect of derivative instruments on the Statement of Operations, classified by derivative type and category of risk exposure, for the year ended December 31, 2018:
| | | | | | | | | | | | | | | | | | | | |
Statement of Operations Location—Net
Realized Gain (Loss) | | Interest Rate | | | Credit | | | Equity | | | Foreign
Exchange | | | Total | |
Purchased options | | $ | (5,685,960 | ) | | $ | (161,194 | ) | | $ | (9,451,369 | ) | | $ | (3,565,416 | ) | | $ | (18,863,939 | ) |
Forward foreign currency transactions | | | — | | | | — | | | | — | | | | (7,100,656 | ) | | | (7,100,656 | ) |
Swap contracts | | | 11,307,258 | | | | (2,471,338 | ) | | | — | | | | — | | | | 8,835,920 | |
Futures contracts | | | (37,355,741 | ) | | | — | | | | — | | | | — | | | | (37,355,741 | ) |
Written options | | | 1,720,941 | | | | — | | | | 2,583,463 | | | | 2,372,858 | | | | 6,677,262 | |
| | | | | | | | | | | | | | | | | | | | |
| | $ | (30,013,502 | ) | | $ | (2,632,532 | ) | | $ | (6,867,906 | ) | | $ | (8,293,214 | ) | | $ | (47,807,154 | ) |
| | | | | | | | | | | | | | | | | | | | |
| | | | | |
Statement of Operations Location—Net
Change in Unrealized Appreciation (Depreciation) | | Interest Rate | | | Credit | | | Equity | | | Foreign
Exchange | | | Total | |
Purchased options | | $ | (3,312,605 | ) | | $ | — | | | $ | (127,161 | ) | | $ | (273,704 | ) | | $ | (3,713,470 | ) |
Forward foreign currency transactions | | | — | | | | — | | | | — | | | | 4,641,751 | | | | 4,641,751 | |
Futures contracts | | | 16,462,177 | | | | — | | | | — | | | | — | | | | 16,462,177 | |
Swap contracts | | | (14,396,006 | ) | | | 2,192,189 | | | | — | | | | — | | | | (12,203,817 | ) |
Written options | | | (228,792 | ) | | | — | | | | 187,869 | | | | 548,183 | | | | 507,260 | |
| | | | | | | | | | | | | | | | | | | | |
| | $ | (1,475,226 | ) | | $ | 2,192,189 | | | $ | 60,708 | | | $ | 4,916,230 | | | $ | 5,693,901 | |
| | | | | | | | | | | | | | | | | | | | |
BHFTII-43
Brighthouse Funds Trust II
Western Asset Management Strategic Bond Opportunities Portfolio
Notes to Financial Statements—December 31, 2018—(Continued)
For the year ended December 31, 2018, the average notional par or face amount outstanding for each derivative type was as follows:
| | | | |
Derivative Description | | Average
Notional Par or
Face Amount‡ | |
Purchased options | | $ | 447,014,238 | |
Forward foreign currency transactions | | | 507,691,817 | |
Futures contracts long | | | 2,274,158,691 | |
Futures contracts short | | | (1,274,395,604 | ) |
Swap contracts | | | 2,136,913,265 | |
Written options | | | (68,492,902 | ) |
| | | | |
| ‡ | | Averages are based on activity levels during the period for which the amounts are outstanding. |
4. Certain Risks
In the normal course of business, the Portfolio invests in securities and enters into transactions where risks exist. Those risks include:
Market Risk:The value of securities held by the Portfolio may decline in response to certain events, including those directly involving the issuers whose securities are owned by the Portfolio; conditions affecting the general economy; overall market changes; local, regional or global political, social or economic instability; and currency, interest rate, and price fluctuations.
Credit and Counterparty Risk: The Portfolio may be exposed to counterparty risk, or the risk that an entity with which the Portfolio has unsettled or open transactions may default. The potential loss could exceed the value of the financial assets and liabilities recorded in the financial statements. Financial assets that potentially expose the Portfolio to credit and counterparty risk consist principally of cash due from counterparties and investments. The Portfolio manages counterparty risk by entering into agreements only with counterparties that it believes have the financial resources to honor their obligations and by monitoring the financial stability of those counterparties. The Adviser attempts to mitigate counterparty risk by (i) periodically assessing the creditworthiness of its trading partners, (ii) monitoring and/or limiting the amount of its net exposure to each individual counterparty based on its assessment, and (iii) requiring collateral from the counterparty for certain transactions. In order to preserve certain safeguards fornon-standard settlement trades, the Portfolio restricts its exposure to credit and counterparty losses by entering into master netting agreements (“Master Agreements”) with counterparties (approved brokers) with whom it undertakes a significant volume of transactions. Master Agreements govern the terms of certain transactions, and reduce the counterparty risk associated with relevant transactions by specifying credit protection mechanisms and providing standardization that improves legal certainty. Master Agreements can also help limit counterparty risk by specifying collateral posting arrangements atpre-arranged exposure levels. Collateral requirements may differ by type of derivative or investment, as applicable. Collateral or margin requirements are set by the broker or exchange clearing house for exchange-traded derivatives (e.g., futures contracts and exchange-traded options), while collateral terms are contract specific for OTC traded derivatives (e.g., forward foreign currency exchange contracts, swap agreements and OTC options).
For derivatives traded under an International Swaps and Derivatives Association, Inc. Master Agreement (“ISDA Master Agreement”) or similar master agreement, the collateral requirements are netted across all transactions traded under such agreement and one amount is posted from one party to the other to collateralize such obligations. The ISDA Master Agreement gives each party to the agreement the right to terminate all transactions traded under such agreement if there is a certain deterioration in the credit quality of the other party. The ISDA Master Agreement gives the Portfolio the right, upon an event of default by the applicable counterparty or a termination of the agreement, to close out all transactions traded under such agreement and to net amounts owed under each transaction to one net amount payable by one party to the other. This right to close out and net payments across all transactions traded under the ISDA Master Agreement could result in a reduction of the Portfolio’s credit risk to such counterparty equal to any amounts payable by the Portfolio under the applicable transactions, if any. However, absent an event of default by the counterparty or a termination of the agreement, the ISDA Master Agreement does not result in an offset of reported amounts of assets and liabilities in the Statement of Assets and Liabilities across transactions between the Portfolio and the applicable counterparty. The enforceability of the right to offset may vary by jurisdiction. Cash collateral that has been pledged to cover obligations of the Portfolio under derivative contracts, if any, will be reported separately in the Statement of Assets and Liabilities. Securities pledged as collateral, if any, for the same purpose are noted in the Schedule of Investments.
Foreign Investment Risk:The investments by the Portfolio in foreign securities may involve risks not present in domestic investments. Because securities may be denominated in foreign currencies, may require settlement in foreign currencies and may pay interest or dividends in foreign currencies, changes in the relationship of these foreign currencies to the U.S. dollar can significantly affect the value of the investments and earnings of the Portfolio. Foreign investments may also subject the Portfolio to foreign government exchange restrictions, expropriation, taxation or other political, social or economic developments, all of which could affect the market and/or credit risk of the investments. In addition to the risks described above, risks may arise from forward foreign currency contracts with respect to the potential inability of counterparties to meet the terms of their contracts.
BHFTII-44
Brighthouse Funds Trust II
Western Asset Management Strategic Bond Opportunities Portfolio
Notes to Financial Statements—December 31, 2018—(Continued)
Repurchase and reverse repurchase agreements are primarily executed under Global Master Repurchase Agreements (“GMRAs”) or Master Repurchase Agreements (“MRAs”), which provide the rights toset-off. Each repurchase and reverse repurchase agreement is initially collateralized at the transaction level. In the event of default, the total market value exposure will be offset against collateral exchanged to date, which would result in a net receivable/(payable) that would be due from/to the counterparty.
Master Securities Forward Transaction Agreements (“MSFTA”) govern the considerations and factors surrounding the settlement of certain forward settling transactions, such as TBA securities and delayed-delivery or secured borrowings transactions by and between the Portfolio and select counterparties. The MSFTA maintain provisions for, among other things, initiation and confirmation, payment and transfer, events of default, termination, and maintenance of collateral.
Customer Account Agreements and related addenda govern cleared derivatives transactions such as futures, options on futures, and cleared OTC derivatives. Cleared derivative transactions require posting of initial margin as determined by each relevant clearing agency, which is segregated at a broker account registered with the Commodities Futures Trading Commission (“CFTC”), or the applicable regulator. In the U.S., counterparty risk is significantly reduced as creditors of the futures broker do not have claim to portfolio assets in the segregated account. Additionally, portability of exposure in the event of default further reduces risk to the Portfolio. Variation margin, or changes in market value, are exchanged daily, but may not be netted between futures and cleared OTC derivatives.
Additional risks associated with each type of investment are described above within the respective security type notes. The Portfolio’s prospectus includes a discussion of the principal risks of investing in the Portfolio.
5. Investment Transactions
Aggregate cost of purchases and proceeds of sales of investment securities, including mortgage dollar rolls and TBA transactions, and excluding short-term securities, for the year ended December 31, 2018 were as follows:
| | | | | | | | | | | | |
Purchases | | | Sales | |
U.S. Government | | Non-U.S. Government | | | U.S. Government | | | Non-U.S. Government | |
| $ 1,498,194,274 | | $ | 1,358,821,736 | | | $ | 1,665,989,541 | | | $ | 1,435,591,298 | |
Purchases and sales of mortgage dollar rolls and TBA transactions for the year ended December 31, 2018 were as follows:
| | | | |
Purchases | | Sales | |
| $ 1,126,008,960 | | $ | 1,261,003,324 | |
6. Investment Management Fees and Other Transactions with Affiliates
Investment Management Agreement - Brighthouse Investment Advisers is the investment adviser to the Portfolio. The Trust has entered into an investment management agreement with Brighthouse Investment Advisers with respect to the Portfolio. For providing investment management services to the Portfolio, Brighthouse Investment Advisers receives monthly compensation at the following annual rates:
| | | | | | |
Management
Fees earned by
Brighthouse
Investment Advisers
for the year ended
December 31, 2018 | | % per annum | | | Average Daily Net Assets |
| $18,654,367 | | | 0.650 | % | | Of the first $500 million |
| | | 0.550 | % | | On amounts in excess of $500 million |
Brighthouse Investment Advisers has entered into an investment subadvisory agreement with respect to managing the Portfolio. Western Asset Management Company (the “Subadviser”) is compensated by Brighthouse Investment Advisers to provide subadvisory services for the Portfolio.
Management Fee Waiver -Pursuant to a management fee waiver agreement, Brighthouse Investment Advisers has agreed, for the period April 30, 2018 to April 30, 2019, to reduce its advisory fees set out above under “Investment Management Agreement” for each class of the Portfolio as follows:
| | |
% per annum | | Average Daily Net Assets |
| 0.055% | | On the first $500 million |
| 0.025% | | On the next $500 million |
| 0.050% | | On the next $1 billion |
| 0.075% | | On amounts in excess of $2 billion |
BHFTII-45
Brighthouse Funds Trust II
Western Asset Management Strategic Bond Opportunities Portfolio
Notes to Financial Statements—December 31, 2018—(Continued)
An identical agreement was in place for the period May 1, 2017 to April 30, 2018. Amounts waived for the year ended December 31, 2018 are shown as a management fee waiver in the Statement of Operations.
Certain officers and trustees of the Trust may also be officers of Brighthouse Investment Advisers; however, such officers and trustees receive no compensation from the Trust.
Transfer Agency Agreement -Brighthouse Financial, Inc. serves as the transfer agent for the Trust. Brighthouse Financial, Inc. receives no fees for its services to the Trust.
Distribution and Service Fees -The Trust has a distribution agreement with Brighthouse Securities, LLC (the “Distributor”) pursuant to which the Distributor serves as the general distributor of shares of each class (each a “Class”) of each Portfolio. The Distributor is an affiliate of the Trust. The Trust has adopted a Distribution and Services Plan (the “Plan”) relating to Class B and Class E shares of each Portfolio, under Rule 12b-1 under the 1940 Act, pursuant to which the Trust may pay the Distributor a fee (the “Service Fee”) at an annual rate not to exceed 0.25% of each such Portfolio’s average daily net assets attributable to the Class B and Class E shares of the Trust. Each Portfolio may not offer shares of each Class. The Plan also authorizes the Trust, on behalf of each of its Portfolios, may pay the Distributor a distribution Fee (the “Distribution Fee” and together with the Service Fee, the “Fees”) at an annual rate of up to 0.25% of each Portfolio’s average daily net assets attributable to the Class B and Class E shares in consideration of the services rendered in connection with the sale of such shares by the Distributor. Under the Distribution Agreement with respect to the Trust, Fees are currently paid at an annual rate of 0.25% of average daily net assets in the case of Class B shares and 0.15% of average daily net assets in the case of Class E shares. The Plan is known as a “compensation plan” because the Trust makes payments to the Distributor for services rendered regardless of the actual level of expenditures by the Distributor. Amounts incurred by the Portfolio for the year ended December 31, 2018 are shown as Distribution and service fees in the Statement of Operations.
Deferred Trustee Compensation -Each Trustee who is not currently an employee of the Adviser or any of its affiliates receives compensation from the Trust for his or her service to the Trust. A deferred compensation plan (the “Plan”) is available to the Trustees on a voluntary basis. Deferred amounts remain in the Trust until distributed in accordance with the provisions of the Plan. The value of a participating Trustee’s deferral account is based on theoretical investments of deferred amounts on the normal payment dates in certain portfolios of the Trust or Brighthouse Funds Trust I, an affiliate of the Trust, as designated by the participating Trustee. Changes in the value of participants’ deferral accounts are reflected as Trustees’ fees and expenses in the Statement of Operations. The portion of the accrued obligations allocated to the Portfolio under the Plan is reflected as Deferred trustees’ fees in the Statement of Assets and Liabilities.
7. Contractual Obligations
Under the Trust’s organizational documents, its officers and Trustees may be indemnified against certain liabilities and expenses arising out of the performance of their duties to the Trust. Additionally, the Trust has a variety of indemnification obligations under contracts with its service providers. The Trust’s maximum exposure under these arrangements is unknown, as this would involve future claims that may be made against the Trust that have not yet occurred.
8. Income Tax Information
The cost basis of investments for federal income tax purposes at December 31, 2018 was as follows:
| | | | |
Cost basis of investments | | $ | 3,453,352,582 | |
| | | | |
Gross unrealized appreciation | | | 105,483,069 | |
Gross unrealized depreciation | | | (278,450,549 | ) |
| | | | |
Net unrealized appreciation (depreciation) | | $ | (172,967,480 | ) |
| | | | |
The tax character of distributions paid for the years ended December 31, 2018 and 2017 were as follows:
| | | | | | | | | | | | | | | | | | | | |
Ordinary Income | | | Long-Term Capital Gain | | | Total | |
2018 | | 2017 | | | 2018 | | | 2017 | | | 2018 | | | 2017 | |
| $175,062,928 | | $ | 135,024,329 | | | $ | — | | | $ | — | | | $ | 175,062,928 | | | $ | 135,024,329 | |
As of December 31, 2018, the components of distributable earnings (accumulated losses) on a federal income tax basis were as follows:
| | | | | | | | | | | | | | | | |
Undistributed
Ordinary
Income | | Undistributed
Long-Term
Capital Gain | | | Net
Unrealized
Depreciation | | | Accumulated
Capital Losses | | | Total | |
| $149,097,462 | | $ | — | | | $ | (172,363,755 | ) | | $ | (140,483,589 | ) | | $ | (163,749,882 | ) |
BHFTII-46
Brighthouse Funds Trust II
Western Asset Management Strategic Bond Opportunities Portfolio
Notes to Financial Statements—December 31, 2018—(Continued)
The Portfolio utilizes the provisions of the federal income tax laws that provide for the carryforward of capital losses for prior years, offsetting such losses against any future realized capital gains. Under the Regulated Investment Company Modernization Act of 2010, net capital losses recognized after December 22, 2010 may be carried forward indefinitely and their character is retained as short-term and/or long-term losses.
During the year ended December 31, 2018, the Portfolio had expired capital loss carryforwards of $2,454,113.
As of December 31, 2018, the Portfolio had accumulated short-term capital losses of $44,762,356 and accumulated long-term capital losses of $95,721,233.
9. Recent Accounting Pronouncements and SEC Update
In March 2017, FASB issued Accounting Standards Update No. 2017-08, Receivables—Nonrefundable Fees and Other Costs (Subtopic 310-20)—Premium Amortization on Purchased Callable Debt Securities (“ASU 2017-08”) which amends the amortization period for certain purchased callable debt securities. Under the standards update, the premium amortization of purchased callable debt securities that have explicit, non-contingent call features and are callable at fixed prices will be amortized to the earliest call date. The guidance will be applied on a modified retrospective basis and is effective for fiscal years, and their interim periods, beginning after December 15, 2018. Management is currently evaluating the impact of this standards update to the Portfolio.
In August 2018, the FASB issued Accounting Standards Update 2018-13, Fair Value Measurement (Topic 820)—Disclosure Framework—Changes to the Disclosure Requirements for Fair Value Measurement (“ASU 2018-13”) which introduces new fair value disclosure requirements as well as eliminates and modifies certain existing fair value disclosure requirements. ASU 2018-13 is effective for fiscal years beginning after December 15, 2019, and interim periods within those fiscal years. Early adoption is permitted and, as such, management has elected to early adopt ASU 2018-13 effective with the current reporting period. The impact of the Portfolio’s adoption was limited to changes in the Portfolio’s financial statement disclosures regarding fair value, primarily those disclosures related to transfers between levels of the fair value hierarchy.
In August 2018, the Securities and Exchange Commission released its Final Rule on Disclosure Update and Simplification (the “Final Rule”) which is intended to simplify an issuer’s disclosure compliance efforts by removing redundant or outdated disclosures requirements without significantly altering the mix of information provided to investors. Effective with the current reporting period, the Portfolio adopted the Final Rule with the most notable impacts being that the Portfolio is no longer required to present the components of distributable earnings on the Statement of Assets and Liabilities or the sources of distributions to shareholders and the amounts of undistributed net investment income on the Statements of Changes in Net Assets.
BHFTII-47
Brighthouse Funds Trust II
Western Asset Management Strategic Bond Opportunities Portfolio
Report of Independent Registered Public Accounting Firm
To the Shareholders of Western Asset Management Strategic Bond Opportunities Portfolio and the Board of Trustees of Brighthouse Funds Trust II:
Opinion on the Financial Statements and Financial Highlights
We have audited the accompanying statement of assets and liabilities, including the schedule of investments, of the Western Asset Management Strategic Bond Opportunities Portfolio (the “Portfolio”), one of the portfolios constituting the Brighthouse Funds Trust II, as of December 31, 2018, the related statement of operations for the year then ended, the statements of changes in net assets for each of the two years in the period then ended, the financial highlights for each of the five years in the period then ended, and the related notes. In our opinion, the financial statements and financial highlights present fairly, in all material respects, the financial position of the Western Asset Management Strategic Bond Opportunities Portfolio of the Brighthouse Funds Trust II as of December 31, 2018, the results of its operations for the year then ended, the changes in its net assets for each of the two years in the period then ended, and the financial highlights for each of the five years in the period then ended, in conformity with accounting principles generally accepted in the United States of America.
Basis for Opinion
These financial statements and financial highlights are the responsibility of the Portfolio’s management. Our responsibility is to express an opinion on the Portfolio’s financial statements and financial highlights based on our audits. We are a public accounting firm registered with the Public Company Accounting Oversight Board (United States) (PCAOB) and are required to be independent with respect to the Portfolio in accordance with the U.S. federal securities laws and the applicable rules and regulations of the Securities and Exchange Commission and the PCAOB.
We conducted our audits in accordance with the standards of the PCAOB. Those standards require that we plan and perform the audit to obtain reasonable assurance about whether the financial statements and financial highlights are free of material misstatement, whether due to error or fraud. The Portfolio is not required to have, nor were we engaged to perform, an audit of its internal control over financial reporting. As part of our audits we are required to obtain an understanding of internal control over financial reporting but not for the purpose of expressing an opinion on the effectiveness of the Portfolio’s internal control over financial reporting. Accordingly, we express no such opinion.
Our audits included performing procedures to assess the risks of material misstatement of the financial statements and financial highlights, whether due to error or fraud, and performing procedures that respond to those risks. Such procedures included examining, on a test basis, evidence regarding the amounts and disclosures in the financial statements and financial highlights. Our audits also included evaluating the accounting principles used and significant estimates made by management, as well as evaluating the overall presentation of the financial statements and financial highlights. Our procedures included confirmation of securities owned as of December 31, 2018, by correspondence with the custodian, brokers, and agent banks; when replies were not received from brokers or agent banks, we performed other auditing procedures. We believe that our audits provide a reasonable basis for our opinion.
/s/ Deloitte & Touche LLP
Boston, Massachusetts
February 25, 2019
We have served as the auditor of one or more of the Brighthouse investment companies since 1983.
BHFTII-48
Brighthouse Funds Trust II
Trustees and Officers
MANAGEMENT OF THE TRUSTS
The Boards of Trustees (the “Board”) of Brighthouse Funds Trust I and Brighthouse Funds Trust II (“BHF I” and “BHF II”, respectively, and collectively the “Trusts”) supervise the Trusts and are responsible for representing the interests of shareholders. The Trustees, the Chairman of the Board and the Chairmen of each subcommittee are the same for both Trusts. The Trustees of each Trust meet periodically throughout the year to oversee the Portfolios’ activities, reviewing, among other things, each Portfolio’s performance and its contractual arrangements with various service providers. The Trustees of each Trust elect the officers of the Trust, who are responsible for administering the Trust’sday-to-day operations.
Trustees and Officers
The Trustees and executive officers of the Trusts, as well as their principal occupations during the past five years, are set forth below. Unless otherwise indicated, the business address of each is c/o Brighthouse Funds, One Financial Center, Boston, Massachusetts 02111. Each Trustee who is deemed an “interested person,” as such term is defined in the 1940 Act, is referred to as an “Interested Trustee.” Those Trustees who are not “interested persons,” as such term is defined in the 1940 Act, are referred to as “Independent Trustees.” There is no limit to the term a Trustee may serve. Trustees serve until their death, resignation or removal in accordance with the BHF I Trust’s and BHF II Trust’s respective organizational documents and policies adopted by the Boards of the respective Trusts from time to time. Officers hold office at the pleasure of each Board and serve until their removal or resignation in accordance with the Trusts’ respective organizational documents and policies adopted by the Board of each Trust from time to time.
| | | | | | | | | | |
Name and Year of Birth | | Current
Position(s)
Held with
Registrant | | Term of Office
and Length of
Time Served | | Principal Occupation(s) During the Past 5 Years(1) | | Number of
Portfolios in
Brighthouse Funds
Complex(2)
Overseen
by Trustee | | Other Directorships Held
by Trustee During
the Past 5 Years(1) |
| Interested Trustee |
John Rosenthal* (1960) | | Trustee | | Indefinite;
From
May
2016
(Trust I
and
Trust II) to
present | | Chief Investment Officer, Brighthouse Financial, Inc. (2017 to present); until 2017, Senior Managing Director and Head of Global Portfolio Management, MetLife, Inc. | | 72 | | None |
|
| Independent Trustees |
Dawn M. Vroegop (1966) | | Trustee and Chairman of the Board | | Indefinite;
From
December
2000
(Trust I)/
May
2009
(Trust II)
to present
as
Trustee;
From
May
2016
(Trust I
and
Trust II)
until
present as
Chairman | | Private Investor. | | 72 | | Trustee, Driehaus Mutual Funds.** |
BHFTII-49
Brighthouse Funds Trust II
Trustees and Officers—(Continued)
| | | | | | | | | | |
Name and Year of Birth | | Current
Position(s)
Held with
Registrant | | Term of Office
and Length of
Time Served | | Principal Occupation(s) During the Past 5 Years(1) | | Number of
Portfolios in
Brighthouse Funds
Complex(2)
Overseen
by Trustee | | Other Directorships Held
by Trustee During
the Past 5 Years(1) |
Stephen M. Alderman (1959) | | Trustee | | Indefinite;
From
December
2000
(Trust I)/
April
2012
(Trust II)
to present | | Shareholder in the law firm of Garfield and Merel, Ltd. | | 72 | | None |
| | | | | |
Robert J. Boulware (1956) | | Trustee | | Indefinite;
From
March
2008
(Trust I)/
April
2012
(Trust II)
to present | | Managing Director, Pilgrim Funds, LLC (private equity fund). | | 72 | | Trustee, Vertical Capital Income Fund(closed-end fund);** Director, Gainsco, Inc. (auto insurance);** Trustee, SharesPost 100 Fund(closed-end fund).** |
| | | | | |
Susan C. Gause (1952) | | Trustee | | Indefinite;
From
March
2008
(Trust I)/
April
2012
(Trust II)
to present | | Private Investor. | | 72 | | Trustee, HSBC Funds.** |
| | | | | |
Nancy Hawthorne (1951) | | Trustee | | Indefinite;
From
May
2003
(Trust II)/
April
2012
(Trust I) to
present | | Partner, Hawthorne Financial Advisors, LLC (registered investment advisor); until 2014, Chief Executive Officer, Clerestory LLC (corporate advisor). | | 72 | | Director and Chairman of the Board of Directors, THL Credit, Inc.;** Director and Chairman of the Board, Avid Technology, Inc.;** Director, CRA International, Inc.** |
| | | | | |
Barbara A. Nugent (1956) | | Trustee | | Indefinite;
From
January
2014
(Trust I
and
Trust II) to
present | | President, True North Board Governance, LLC (consulting); until December 2013, partner in the law firm of Stradley Ronon Stevens & Young, LLP. | | 72 | | Independent Lead Trustee, BMT Investment Funds** |
| | | | | |
Christopher J. Towle (1957) | | Trustee | | Indefinite;
From
April
2018
(Trust I
and
Trust II) to
present | | Retired; until 2014, Partner, Portfolio Manager, Director of High Yield and Convertible Strategies, Lord Abbett & Co. | | 72 | | Trustee, Driehaus Mutual Funds** |
BHFTII-50
Brighthouse Funds Trust II
Trustees and Officers—(Continued)
Officers
| | | | | | |
Name and Year of Birth | | Position(s)
Held with
Registrant | | Length of
Time Served | | Principal Occupation(s)
During the Past 5 Years(1) |
| Executive Officers | | | | | | |
Kristi Slavin (1973) | | President and Chief Executive Officer, of Trust I and Trust II | | From May
2016
(Trust I
and
Trust II) to
present | | President, Brighthouse Investment Advisers, LLC (2016-present); formerly, Senior Vice President, MetLife Advisers, LLC; Vice President, MetLife, Inc.; Vice President, Trust I and Trust II(2015-2016). |
| | | |
Alan R. Otis (1971) | | Chief Financial Officer and Treasurer, of Trust I and Trust II | | From
November
2017
(Trust I
and
Trust II) to
present | | Senior Vice President, Brighthouse Investment Advisers, LLC (2017-present); formerly, Vice President, Brighthouse Investment Advisers, LLC (2012-2017); Assistant Treasurer, Trust I and Trust II(2012-2017). |
| | | |
Andrew L. Gangolf (1954) | | Secretary, of Trust I and Trust II | | From May
2011
(Trust I
and
Trust II) to
present | | Executive Vice President, Brighthouse Investment Advisers, LLC (2017-present); formerly, Senior Vice President, MetLife Advisers, LLC (2011-2017); until 2011, Senior Vice President & Assistant General Counsel, AllianceBernstein Investments, Inc. |
| | | |
Steven E. Hartstein (1963) | | Chief Compliance Officer (“CCO”), of Trust I and Trust II | | From
February
2014
(Trust I
and
Trust II) to
present | | Senior Vice President and CCO, Brighthouse Investment Advisers, LLC (2017-present); Head of Investments Compliance, Vice President, Brighthouse Financial, Inc. (2017-present); formerly, Vice President, MetLife, Inc. (2013-2017); Senior Vice President and CCO, MetLife Advisers, LLC (2013-2017.) |
| | | |
Victor Soto (1978) | | Vice President of Trust I and Trust II | | From May
2018
(Trust I
and
Trust II) to
present | | Executive Vice President, Brighthouse Investment Advisers, LLC (2016-present); Assistant Vice President, MetLife Inc. (2015-2017); Portfolio Manager, 1st Global (2013-2015). |
| * | Mr. Rosenthal is an “interested person” of the Trusts because of his position with Brighthouse Financial, Inc., the current parent company of Brighthouse Investment Advisers, LLC. |
| ** | Indicates a directorship with a registered investment company or a company subject to the reporting requirements of the Securities Exchange Act of 1934, as amended. |
| (1) | Previous positions during the past five years with the Trusts, Brighthouse Financial, Inc., MetLife, Inc. or the Manager are omitted if not materially different. |
| (2) | The Fund Complex includes 43 BHF I Portfolios and 29 BHF II Portfolios. |
BHFTII-51
Brighthouse Funds Trust II
Western Asset Management Strategic Bond Opportunities Portfolio
Board of Trustees’ Consideration of Advisory and Sub-Advisory Agreements
At anin-person meeting held on November6-8, 2018 (the “November Meeting”), the Boards of Trustees (the “Board”) of Brighthouse Funds Trust I and Brighthouse Funds Trust II (“BFT I” and “BFT II,” respectively, and collectively, the “Trusts”), including a majority of the Trustees who are not “interested persons” of the Trusts (the “Independent Trustees”) under the Investment Company Act of 1940 (the “1940 Act”), approved the continuation of the Trusts’ advisory agreements (each, an “Advisory Agreement”) with Brighthouse Investment Advisers, LLC (the “Adviser”) and the applicablesub-advisory agreements (each a “Sub-Advisory Agreement,” and collectively with the Advisory Agreement, the “Agreements”) between the Adviser and the investmentsub-advisers (each a “Sub-Adviser,” and collectively, the “Sub-Advisers”) for the series of the Trusts (each a “Portfolio,” and collectively, the “Portfolios”).
In making those approvals, the Board reviewed a variety of materials that were provided for the specific purpose of the annual contract renewal process. In addition, various materials provided to and discussed with the Board throughout the year informed the Board’s decision to renew the Agreements. In particular, the information for each Portfolio included, but was not limited to, investment performance reports, and reports on expenses, legal and compliance matters, asset pricing, brokerage commissions and trade execution.
The Board met in person with personnel of the Adviser on October 17, 2018 for the specific purpose of giving preliminary consideration to the proposed continuation of the Agreements (the “October Meeting”). At that meeting, the Adviser reviewed with the Board the performance and fees experienced by each Portfolio, as well as other information. During and after the October Meeting, the Independent Trustees communicatedfollow-up matters for management to address at the November Meeting. The Independent Trustees were advised by independent legal counsel throughout the contract renewal process, and met with independent legal counsel in several executive sessions outside of the presence of management.
Information furnished and reviewed specifically in connection with the renewal process included, but was not limited to, a report for each Portfolio that was prepared by Broadridge (“Broadridge”), an independent organization. In addition, the Independent Trustees reviewed a report that was prepared by JDL Consultants, LLC (“JDL”), an independent consultant to the Independent Trustees (“JDL Report”), which examined the comparative fees, expenses and performance of each Portfolio, based upon the Broadridge reports. Also, the Board reviewed the responses to wide-ranging questions from the Independent Trustees relating to the business, operations and performance of the Adviser and theSub-Advisers that the Adviser andSub-Advisers had prepared specifically for the renewal process, and reviewed aPortfolio-by-Portfolio analysis of the profitability to the Adviser of each Advisory Agreement, which was prepared by the Adviser for the renewal process.
At the November Meeting, the Board, including a majority of the Independent Trustees, concluded that the nature, extent and quality of services provided by the Adviser and eachSub-Adviser supported the renewal of the Agreements. The Board also concluded that the investment performance of each Portfolio was such that each Agreement should continue, and that the fees paid by each Portfolio to the Adviser appeared to be reasonable in light of the nature, extent and quality of the services provided by the Adviser andSub-Adviser. Further, the Board concluded that the Adviser’s profitability in providing services under the Advisory Agreements did not appear unreasonable in light of the nature, extent and quality of the services provided by the Adviser. Finally, the Board reviewed the extent to which the investment advisory fees paid by the Portfolios shared economies of scale with investors or entailed the potential to share economies of scale with investors and concluded that those considerations generally supported the renewal of each Agreement. In approving the renewal of each of the Agreements, the Board, including the Independent Trustees, gave attention to all of the information that was furnished and each Trustee placed varying degrees of importance on the various pieces of information that were provided to them. The Board evaluated the information available to it on aPortfolio-by-Portfolio basis, and its decision was made separately with respect to each Portfolio. The following paragraphs provide more information about some of the primary factors that were relevant to the Board’s decision. The Board did not identify any single factor as determinative, and the Trustees generally attributed different weights to various factors for the various Portfolios.
Nature, extent and quality of services. The Board evaluated the nature, extent and quality of the services that the Adviser and theSub-Advisers, as relevant, have provided to the Portfolios. The Board considered the Adviser’s services as investment manager to the Portfolios, including its services relating to the hiring and oversight of theSub-Advisers, trading practices and oversight of transition management (as applicable), compliance programs and personnel, and risk management, among other things. The Adviser’s services in coordinating and overseeing the activities of the Trusts’ other service providers were also considered. The Board considered information received from the Trusts’ Chief Compliance Officer (“CCO”) regarding the Portfolios’ compliance policies and procedures that were established pursuant to Rule38a-l under the 1940 Act. The Board also noted that the Adviser’s investment, compliance and legal staff conduct regular and periodic telephonic andin-person meetings with theSub-Advisers to review and assess the services that are provided to the Portfolios, and that personnel of the Adviser prepare and present reports to the Independent Trustees regarding those meetings. In addition, throughout the year, the Board considered the expertise, experience and performance of the personnel of the Adviser who performed the various services that are mentioned above.
BHFTII-52
Brighthouse Funds Trust II
Western Asset Management Strategic Bond Opportunities Portfolio
Board of Trustees’ Consideration of Advisory and Sub-Advisory Agreements—(Continued)
With respect to the services provided by each of theSub-Advisers, the Board considered a variety of information that the Adviser and eachSub-Adviser prepared for the Board’s review. The Board considered eachSub-Adviser’s investment process and philosophy, and the investment performance experienced by the Portfolio (as described in more detail below). The Board took into account that eachSub-Adviser’s responsibilities include the development and maintenance of an investment program for the applicable Portfolio that is consistent with the Portfolio’s investment objectives, the selection of investment securities and the placement of orders for the purchase and sale of such securities, as well as the implementation of compliance controls related to performance of these services. In particular, the Board considered, among other things, theSub-Adviser’s current level of staffing as well as its compensation program and its overall resources. The Board reviewed eachSub-Adviser’s history and investment experience, as well as information provided regarding the qualifications, background and responsibilities of theSub-Adviser’s investment and compliance personnel who provide services to the Portfolios. The Board also considered, among other things, eachSub-Adviser’s compliance program and regulatory and disciplinary history. In its review, the Board also took into account information regarding any services and/or payments provided to the Adviser by theSub-Advisers in connection with marketing activities and considered representations from the Adviser that those payments were not considered in the Adviser’s recommendation to renew any of theSub-Advisory Agreements.
Performance. The Board placed emphasis on the performance of each Portfolio in light of, among other things, its importance to investors. The Board considered the Adviser’s quarterly reviews with the Board of detailed information about each Portfolio’s investment strategies and performance results and composition, including discussions regarding the relevant effect of current market conditions. The Board reviewed and considered the reports prepared by Broadridge, which provided a statistical analysis comparing the Portfolios’ investment performance to that of comparable funds underlying variable insurance products (the “Performance Universe”). The Independent Trustees also met separately with representatives of JDL during the October Meeting to review the JDL Report. The Board also compared the performance records of the Portfolios to those of comparable funds and other accounts that were managed by the relevantSub-Adviser, to the extent such information was available. The Board considered each Portfolio’s performance for periods subsequent to the performance period covered by the Broadridge reports, and the Adviser’s discussion of the same, including the effect of current market conditions on each Portfolio’s more recent performance. The Board also noted that while it found the data provided by Broadridge generally useful, it recognized the limitations of such data, including, in particular, that notable differences may exist between a Portfolio and those of the other funds in a Broadridge category (for example, the investment objectives(s) and investment strategies) and that the results of the performance comparisons may vary depending on (i) the end dates for the performance periods that were selected and (ii) the selection of the peer groups.
The Board focused particular attention on Portfolios with less favorable performance records. The Board noted the Adviser’s focus on eachSub-Adviser’s performance and that the Adviser has been active in monitoring and responding to any performance issues with respect to the Portfolios.
Fees and Expenses. The Board gave consideration to the level and method of computing the fees payable under the Agreements. The Board considered the Broadridge report for each of the Portfolios, which included comparisons for each Portfolio of its contractual management andsub-adviser fees (at current and various asset levels), and total expenses, with those of its peers, including as those peers were divided into a broad group of peer funds (“Expense Universe”), a narrower group of peer funds (“Expense Group”), a broad group of peersub-advised funds (“Sub-advised Expense Universe”), and a narrower group of peersub-advised funds (“Sub-advised Expense Group”). Broadridge selected the peer funds which were similarly situated funds underlying variable insurance products deemed to be comparable to the Portfolios. The Independent Trustees, with the assistance of JDL, also examined the JDL Report. The Board compared the fee payable to aSub-Adviser by the Adviser with respect to the Portfolio to the fee payable to theSub-Adviser by other comparable funds and other accounts, to the extent such information was available.
The Board noted that thesub-advisory fees for the Portfolios are paid by the Adviser out of the advisory fees, and that the Adviser negotiates the fees at arm’s length. The Board also considered that the Adviser had entered into expense limitation or management fee waiver agreements with certain of the Portfolios pursuant to which the Adviser had agreed to waive a portion of its advisory fee and/or reimburse certain expenses as a means of limiting a Portfolio’s total annual operating expenses.
Profitability. The Board examined the profitability to the Adviser of each Advisory Agreement, on aPortfolio-by-Portfolio basis. The Board also considered that an affiliate of the Adviser, Brighthouse Securities, LLC, serves as distributor for the Trusts, and, as such, receives Rule12b-1 payments to support the distribution of the Portfolios. The Board considered the profitability to theSub-Advisers and their affiliates as a result of their relationships with the Portfolios, to the extent available, and the Board considered the ability of the Adviser to negotiate with aSub-Adviser at arm’s length. In reviewing the profitability analyses, the Board recognized that expense allocation methodologies are inherently subjective and various expense allocation methodologies may be reasonable while producing different results.
BHFTII-53
Brighthouse Funds Trust II
Western Asset Management Strategic Bond Opportunities Portfolio
Board of Trustees’ Consideration of Advisory and Sub-Advisory Agreements—(Continued)
Economies of scale. The Board also considered each Portfolio’s fees in light of its size. The Board noted the fee schedules for the Portfolios that contain breakpoints that reduce the fee rate above specified asset levels. The Board noted those Portfolios that did not have breakpoints in their advisory fee and took into account management’s discussion of the same. The Board noted that those Portfolios with Advisory Agreements containing breakpoints generally have breakpoints in the correspondingSub-Advisory Agreement. The Board considered the effective fees under the Advisory Agreement andSub-Advisory Agreement for each Portfolio as a percentage of assets at different asset levels and possible economies of scale that may be realized if the assets of the Portfolio grow. The Board examined, among other data, the effect of a Portfolio’s growth in size, and reduction in size, on various fee schedules and the Board reviewed the Broadridge and JDL Reports, which compared fees among peers. The Board also generally noted that if a Portfolio’s assets increase over time, the Portfolio may realize other economies of scale if assets increase proportionally more than certain other fixed expenses.
Other factors. The Board considered other benefits that may be realized by the Adviser and its affiliates from their relationship with the Trusts. Among them, the Board recognized that Brighthouse Securities, LLC, as the distributor for the Trusts, receives payments pursuant to Rule12b-1 from the Portfolios to compensate for the provision of shareholder services and distribution activities, which could lead to growth in the Trusts’ assets and corresponding benefits from such growth, including economies of scale. The Board considered other benefits that may be realized by eachSub-Adviser and its affiliates from their relationship with the Trusts, including the opportunity to provide advisory services to additional portfolios of the Trusts and reputational benefits. In conjunction with these considerations, the Board noted the ongoing commitment of the Adviser to the Portfolios.
The Board requested, received, and considered information from the Adviser regarding possible conflicts of interest in the form of material benefits to the Adviser resulting from the Adviser’s affiliations and business relationships, as relevant. The Board considered the services that are provided to the Trusts by its service providers, and the manner in which any conflicts were mitigated.
* * *
Western Asset Management Strategic Bond Opportunities Portfolio. The Board also considered the following information in relation to the Agreements with the Adviser and Western Asset Management Company regarding the Portfolio:
Among other data relating specifically to the Portfolio’s performance, the Board considered that the Portfolio outperformed the median of its Performance Universe and the average of its Morningstar Category for the three-year and five-year periods ended June 30, 2018, and underperformed the median of its Performance Universe and the average of its Morningstar Category for theone-year period ended June 30, 2018. The Board further considered that the Portfolio outperformed its benchmark, the Bloomberg Barclays U.S. Aggregate Bond Index, and its blended benchmark for the three-year and five-year periods ended September 30, 2018, and underperformed its benchmark and its blended benchmark for theone-year period ended September 30, 2018.
The Board also considered that the Portfolio’s actual management fees and total expenses (exclusive of12b-1 fees) were below the Expense Group median, Expense Universe median, and theSub-advised Expense Universe median, and were the lowest in the Expense Group and theSub-advised Expense Universe. The Board further noted that the Portfolio’s contractual management fees were above the asset-weighted average of comparable funds selected by Broadridge at the Portfolio’s current size. The Board also noted that the Portfolio’s contractualsub-advisory fees were below the averages of theSub-advised Expense Group and theSub-advised Expense Universe at the Portfolio’s current size.
BHFTII-54
Brighthouse Funds Trust II
Western Asset Management U.S. Government Portfolio
Managed by Western Asset Management Company
Portfolio Manager Commentary*
PERFORMANCE
For the 12 months ended December 31, 2018, the Class A, B, and E shares of the Western Asset Management U.S. Government Portfolio returned 0.97%, 0.70%, and 0.80%, respectively. The Portfolio’s benchmark, the Bloomberg Barclays U.S. Intermediate Government Bond Index1, returned 1.43%.
MARKET ENVIRONMENT / CONDITIONS
Fixed income markets, in general, posted weak results over the twelve months ended December 31, 2018. Higher U.S. growth and inflation expectations caused U.S. Treasury yields to rise for most of the year but muted inflation coupled with global slowdown and recession fears caused yields to fall in the final months of the year. Spread sectors were similarly impacted by periods of elevated volatility as they performed well early in the year with initial solid economic growth forecasts and later saw spreads widen towards year end.
After hitting a high-water mark of 4.2% in the second quarter, the U.S. economy’s annualized gross domestic product (“GDP”) growth ticked down to 3.5% in the third quarter. The deceleration in GDP growth reflected a downturn in exports and decelerations in nonresidential fixed investment and personal consumption expenditures. The manufacturing sector continued to expand throughout the year, but the pace also moderated during the fourth quarter. The U.S. labor market remained tight throughout the year; the unemployment rate reached 3.7% in October and November, which equaled the lowest unemployment rate since 1969.
In December, the Federal Reserve (the “Fed”) raised interest rates for the fourth time in 2018, as was widely expected, to a target range between 2.25% and 2.50%. This increase marked the Fed’s ninth rate hike since December 2015. In a post-meeting statement, however, the Fed surprised market participants by retaining its forward guidance for “some further gradual increases” and only lowering its prediction from three hikes to two hikes in 2019. This messaging stood in contrast to the dovish approach that had seemingly been advocated by previous remarks from Fed Chair Jerome Powell and other members. Concerns over a potential Fed policy error added to the heightened market volatility experienced towards year end.
PORTFOLIO REVIEW /PERIOD-END POSITIONING
The Western Asset Management U.S. Government Portfolio underperformed its benchmark during the period. Among the largest detractors to performance were the Portfolio’s exposures to Agency Mortgage-Backed Securities (“MBS”), Agency debt, and Emerging Markets Debt as spreads generally widened in all three sectors. During a year in which spread sectors experienced heightened levels of volatility, especially during the final months as the broader market witnessed a flight to quality, overall spread sector performance was mixed. The largest positive contributor to the Portfolio’s performance was its tactical duration positioning, which helped mute downside volatility duringrisk-off periods. The Portfolio’s yield curve positioning had a negligible impact on performance.Non-Agency MBS, Commercial Mortgage-Backed Securities, and Asset-Backed Securities exposures all provided small positive contributions to performance as fundamentals remained solid throughout the majority of the year.
The Portfolio’s exposure to Treasury Inflation-Protected Securities (“TIPS”) was a detractor to performance as break-even inflation rates (expectations of future inflation) across the curve declined on the year as energy prices fell.
At period end, the Portfolio’s exposure tonon-U.S. sovereign paper remained focused on Latin American U.S. dollar-denominated bonds issued by Colombia and Brazil, with modest additional exposure tooil-producing Asian economies. Spreads in these positions widened dramatically over the period, reducing relative returns. Additionally, we increased the Portfolio’s exposure to TIPS to a still-modest 3% in the fourth quarter as real yields rose even as nominal yields declined. While headline inflation will rise modestly as energy prices stabilize, we expect overall inflation will continue at fairly low levels through the first half of 2019. Finally, we added to Agency MBS exposure as spreads remained at multi-year wides, bringing total Agency MBS exposure to about 39%. At year end, we expected the additional yield of Agency MBS would prove more than sufficient compensation in this high quality sector as mortgage rates peaked at 4.6% in November and should stabilize nearyear-end levels.
Fredrick Marki
S. Kenneth Leech
Mark S. Lindbloom
Portfolio Managers
Western Asset Management Company
* This commentary may include statements that constitute “forward-looking statements” under the U.S. securities laws. Forward-looking statements include, among other things, projections, estimates, and information about possible or future results related to the Portfolio, market or regulatory developments. The views expressed above are not guarantees of future performance or economic results and involve certain risks, uncertainties and assumptions that could cause actual outcomes and results to differ materially from the views expressed herein. The views expressed above are subject to change at any time based upon economic, market, or other conditions and the subadvisory firm undertakes no obligation to update the views expressed herein. Any discussions of specific securities should not be considered a recommendation to buy or sell those securities. The views expressed above (including any forward-looking statement) may not be relied upon as investment advice or as an indication of the Portfolio’s trading intent. Information about the Portfolio’s holdings, asset allocation or country diversification is historical and is not an indication of future Portfolio composition, which may vary. Direct investment in any index is not possible. The performance of any index mentioned in this commentary has not been adjusted for ongoing management, distribution and operating expenses, and sales charges applicable to mutual fund investments. In addition, the returns do not reflect additional fees charged by separate accounts or variable insurance contracts that an investor in the Portfolio may pay. If these additional fees were reflected, performance would have been lower.
BHFTII-1
Brighthouse Funds Trust II
Western Asset Management U.S. Government Portfolio
A $10,000 INVESTMENT COMPARED TO THE BLOOMBERG BARCLAYS U.S. INTERMEDIATE GOVERNMENT BOND INDEX
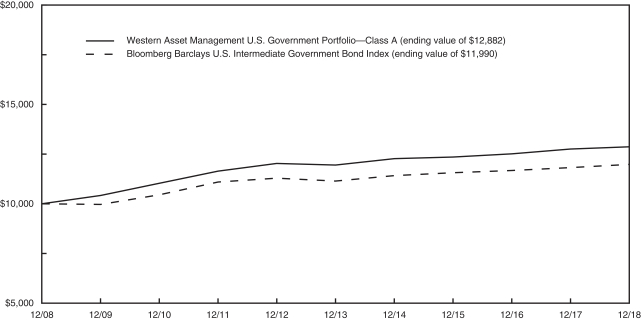
AVERAGE ANNUAL RETURNS (%) (FOR THE YEAR ENDED DECEMBER 31, 2018)
| | | | | | | | | | | | |
| | | | |
| | | 1 Year | | | 5 Year | | | 10 Year | |
| Western Asset Management U.S. Government Portfolio | | | | | | | | | | | | |
Class A | | | 0.97 | | | | 1.51 | | | | 2.56 | |
Class B | | | 0.70 | | | | 1.25 | | | | 2.30 | |
Class E | | | 0.80 | | | | 1.34 | | | | 2.41 | |
| Bloomberg Barclays U.S. Intermediate Government Bond Index | | | 1.43 | | | | 1.46 | | | | 1.83 | |
1 The Bloomberg Barclays U.S. Intermediate Government Bond Index includes most obligations of the U.S. Treasury, agencies and quasi-federal corporations having maturities between one and ten years.
Portfolio performance is calculated including reinvestment of all income and capital gain distributions. Performance numbers are net of all Portfolio expenses but do not include any insurance, sales, separate account or administrative charges of variable annuity or life insurance contracts or any additional expenses that participants may bear relating to the operations of their plans. If these charges were included, the returns would be lower. The performance of any index referenced above has not been adjusted for ongoing management, distribution and operating expenses, and sales charges applicable to mutual fund investments. Direct investment in any index is not possible. The performance of Class A shares, as set forth in the line graph above, will differ from that of other classes because of the difference in expenses paid by policyholders investing in the different share classes.
This information represents past performance and is not indicative of future results. Investment return and principal value may fluctuate so that shares, upon redemption, may be worth more or less than the original cost.
PORTFOLIO COMPOSITION AS OF DECEMBER 31, 2018
Top Sectors
| | | | |
| | | % of
Net Assets | |
| U.S. Treasury & Government Agencies | | | 91.1 | |
| Corporate Bonds & Notes | | | 8.6 | |
| Foreign Government | | | 8.6 | |
| Mortgage-Backed Securities | | | 2.6 | |
| Asset-Backed Securities | | | 1.2 | |
BHFTII-2
Brighthouse Funds Trust II
Western Asset Management U.S. Government Portfolio
Understanding Your Portfolio’s Expenses
Shareholder Expense Example
As a shareholder of the Portfolio, you incur ongoing costs, including management fees; distribution and service(12b-1) fees; and other Portfolio expenses. This example is intended to help you understand your ongoing costs (in dollars) (referred to as “expenses”) of investing in the Portfolio and compare these costs with the ongoing costs of investing in other mutual funds. The example is based on an investment of $1,000 invested at the beginning of the period and held for the entire period, July 1, 2018 through December 31, 2018.
Actual Expenses
The first line for each share class of the Portfolio in the table below provides information about actual account values and actual expenses. You may use the information in this line, together with the amount you invested in the particular share class of the Portfolio, to estimate the expenses that you paid over the period. Simply divide your account value by $1,000 (for example, an $8,600 account value divided by $1,000 = 8.6), then multiply the result by the number in the first line under the heading entitled “Expenses Paid During Period” to estimate the expenses you paid on your account during this period.
Hypothetical Example for Comparison Purposes
The second line for each share class of the Portfolio in the table below provides information about hypothetical account values and hypothetical expenses based on the Portfolio’s actual expense ratio and an assumed rate of return of 5% per year before expenses, which is not the Portfolio’s actual return. The hypothetical account values and expenses may not be used to estimate the actual ending account balance or expenses you paid for the period. You may use this information to compare the ongoing costs of investing in the Portfolio and other funds. To do so, compare this 5% hypothetical example with the 5% hypothetical examples that appear in the shareholder reports of the other funds.
Please note that the expenses shown in the table are meant to highlight your ongoing costs only and do not reflect any fees or charges of your variable insurance product or any additional expenses that participants in certain eligible qualified plans may bear relating to the operations of their plan. Therefore, the second line for each share class in the table is useful in comparing ongoing costs only, and will not help you determine the relative total costs of owning different funds. In addition, if these other costs were included, your costs would have been higher.
| | | | | | | | | | | | | | | | | | |
Western Asset Management U.S. Government Portfolio
| | | | Annualized
Expense
Ratio | | | Beginning
Account Value
July 1,
2018 | | | Ending
Account Value
December 31,
2018 | | | Expenses Paid
During Period**
July 1, 2018
to
December 31,
2018 | |
Class A (a) | | Actual | | | 0.49 | % | | $ | 1,000.00 | | | $ | 1,016.80 | | | $ | 2.49 | |
| | Hypothetical* | | | 0.49 | % | | $ | 1,000.00 | | | $ | 1,022.74 | | | $ | 2.50 | |
| | | | | |
Class B (a) | | Actual | | | 0.74 | % | | $ | 1,000.00 | | | $ | 1,016.00 | | | $ | 3.76 | |
| | Hypothetical* | | | 0.74 | % | | $ | 1,000.00 | | | $ | 1,021.48 | | | $ | 3.77 | |
| | | | | |
Class E (a) | | Actual | | | 0.64 | % | | $ | 1,000.00 | | | $ | 1,016.00 | | | $ | 3.25 | |
| | Hypothetical* | | | 0.64 | % | | $ | 1,000.00 | | | $ | 1,021.98 | | | $ | 3.26 | |
| * | Hypothetical assumes a rate of return of 5% per year before expenses. |
| ** | Expenses paid are equal to the Portfolio’s annualized expense ratio for the most recent six month period, as shown above, multiplied by the average account value over the period, multiplied by the number of days (184 days) in the most recent fiscal half-year, divided by 365 (to reflect theone-half year period). |
| (a) | The annualized expense ratio shown reflects the impact of the management fee waiver as described in Note 6 of the Notes to Financial Statements. |
BHFTII-3
Brighthouse Funds Trust II
Western Asset Management U.S. Government Portfolio
Schedule of Investments as of December 31, 2018
U.S. Treasury & Government Agencies—91.1% of Net Assets
| | | | | | | | |
| Security Description | | Principal
Amount* | | | Value | |
|
| Agency Sponsored Mortgage - Backed—41.5% | |
Fannie Mae 15 Yr. Pool
2.500%, TBA (a) | | | 3,600,000 | | | $ | 3,515,875 | |
3.000%, TBA (a) | | | 17,100,000 | | | | 17,059,657 | |
3.500%, TBA (a) | | | 30,000,000 | | | | 30,365,924 | |
4.500%, 03/01/20 | | | 15,065 | | | | 15,336 | |
Fannie Mae 20 Yr. Pool
3.000%, 12/01/37 | | | 1,585,297 | | | | 1,569,977 | |
4.500%, 11/01/31 | | | 607,562 | | | | 635,484 | |
4.500%, 12/01/31 | | | 848,639 | | | | 887,307 | |
Fannie Mae 30 Yr. Pool
3.000%, 09/01/42 | | | 7,734,682 | | | | 7,617,191 | |
3.000%, 11/01/46 | | | 23,210,754 | | | | 22,662,634 | |
3.000%, 01/01/48 | | | 263,317 | | | �� | 257,016 | |
3.000%, 11/01/48 | | | 4,186,681 | | | | 4,087,013 | |
3.500%, 10/01/47 | | | 18,239,773 | | | | 18,250,421 | |
3.500%, 12/01/47 | | | 1,797,372 | | | | 1,801,670 | |
3.500%, 01/01/48 | | | 345,607 | | | | 345,741 | |
3.500%, 03/01/48 | | | 14,818,859 | | | | 14,826,260 | |
3.500%, TBA (a) | | | 93,948,000 | | | | 93,961,051 | |
4.000%, 02/01/40 | | | 595,133 | | | | 611,670 | |
4.000%, 06/01/42 | | | 5,559,530 | | | | 5,744,841 | |
4.000%, 07/01/42 | | | 2,484,018 | | | | 2,555,021 | |
4.000%, 05/01/43 | | | 13,970,895 | | | | 14,411,912 | |
4.000%, 10/01/43 | | | 7,475,680 | | | | 7,711,708 | |
4.000%, 04/01/47 | | | 7,955,366 | | | | 8,141,453 | |
4.000%, 05/01/47 | | | 3,510,787 | | | | 3,588,672 | |
4.000%, 08/01/47 | | | 38,486,838 | | | | 39,256,715 | |
4.000%, 05/01/48 | | | 13,904,028 | | | | 14,250,163 | |
4.000%, TBA (a) | | | 350,000 | | | | 356,898 | |
4.500%, 04/01/41 | | | 7,792,459 | | | | 8,166,011 | |
4.500%, 10/01/41 | | | 4,782,312 | | | | 5,003,397 | |
4.500%, 07/01/44 | | | 205,238 | | | | 215,351 | |
4.500%, 10/01/44 | | | 1,252,095 | | | | 1,313,206 | |
4.500%, 01/01/45 | | | 116,255 | | | | 122,463 | |
4.500%, 01/01/47 | | | 782,284 | | | | 811,163 | |
4.500%, 06/01/47 | | | 255,779 | | | | 265,196 | |
4.500%, 07/01/47 | | | 1,328,163 | | | | 1,386,626 | |
4.500%, 08/01/47 | | | 1,734,709 | | | | 1,811,069 | |
5.000%, 07/01/33 | | | 189,506 | | | | 201,269 | |
5.000%, 09/01/33 | | | 232,318 | | | | 246,745 | |
5.000%, 10/01/35 | | | 654,434 | | | | 695,131 | |
5.000%, 03/01/36 | | | 1,040,552 | | | | 1,105,440 | |
5.000%, 01/01/39 | | | 8,133 | | | | 8,647 | |
5.000%, 12/01/39 | | | 15,545 | | | | 16,545 | |
5.000%, 05/01/40 | | | 49,538 | | | | 52,416 | |
5.000%, 07/01/40 | | | 32,045 | | | | 34,099 | |
5.000%, 11/01/40 | | | 778,097 | | | | 827,251 | |
5.000%, 01/01/41 | | | 60,207 | | | | 63,998 | |
5.000%, 02/01/41 | | | 46,645 | | | | 48,883 | |
5.000%, 04/01/41 | | | 82,083 | | | | 86,744 | |
5.000%, 05/01/41 | | | 1,828,603 | | | | 1,945,351 | |
5.000%, 06/01/41 | | | 167,964 | | | | 178,707 | |
5.000%, 07/01/41 | | | 1,567,792 | | | | 1,659,518 | |
5.000%, 10/01/48 | | | 1,763,253 | | | | 1,848,276 | |
5.000%, 11/01/48 | | | 4,520,938 | | | | 4,749,423 | |
5.000%, TBA (a) | | | 500,000 | | | | 523,893 | |
|
| Agency Sponsored Mortgage - Backed—(Continued) | |
Fannie Mae 30 Yr. Pool
6.000%, 04/01/33 | | | 64,465 | | | | 70,309 | |
6.000%, 02/01/34 | | | 12,552 | | | | 13,690 | |
6.000%, 11/01/35 | | | 125,821 | | | | 137,255 | |
6.000%, 08/01/37 | | | 273,503 | | | | 298,391 | |
6.500%, 03/01/26 | | | 573 | | | | 615 | |
6.500%, 04/01/29 | | | 56,523 | | | | 60,664 | |
7.000%, 11/01/28 | | | 1,677 | | | | 1,737 | |
7.000%, 02/01/29 | | | 563 | | | | 563 | |
7.000%, 01/01/30 | | | 1,980 | | | | 2,005 | |
7.000%, 10/01/37 | | | 6,671 | | | | 7,215 | |
7.000%, 11/01/37 | | | 20,097 | | | | 21,770 | |
7.000%, 12/01/37 | | | 19,961 | | | | 22,864 | |
7.000%, 02/01/38 | | | 10,303 | | | | 10,966 | |
7.000%, 11/01/38 | | | 88,624 | | | | 100,643 | |
7.000%, 02/01/39 | | | 858,724 | | | | 976,427 | |
7.500%, 04/01/32 | | | 12,369 | | | | 12,512 | |
8.000%, 05/01/28 | | | 1,459 | | | | 1,588 | |
8.000%, 07/01/32 | | | 819 | | | | 870 | |
Fannie Mae Balloon Pool
3.770%, 01/01/29 | | | 1,011,000 | | | | 1,039,891 | |
Fannie Mae Connecticut Avenue Securities (CMO)
3.186%, 1M LIBOR + 0.680%, 10/25/30 (b) | | | 5,023,684 | | | | 5,010,878 | |
3.956%, 1M LIBOR + 1.450%, 01/25/29 (b) | | | 166,944 | | | | 167,561 | |
Fannie Mae Interest Strip (CMO)
3.500%, 11/25/41 (c) | | | 2,188,642 | | | | 422,781 | |
4.000%, 04/25/42 (c) | | | 2,946,751 | | | | 576,572 | |
4.500%, 11/25/39 (c) | | | 1,538,958 | | | | 340,521 | |
Fannie Mae Pool
3.500%, 08/01/42 | | | 9,323,910 | | | | 9,381,952 | |
3.500%, 09/01/42 | | | 637,941 | | | | 641,913 | |
3.500%, 10/01/42 | | | 4,510,231 | | | | 4,538,309 | |
3.740%, 11/01/28 | | | 1,490,000 | | | | 1,506,760 | |
4.000%, 10/01/42 | | | 2,719,047 | | | | 2,789,799 | |
4.000%, 11/01/42 | | | 1,792,935 | | | | 1,839,495 | |
4.000%, 07/01/43 | | | 57,857 | | | | 59,357 | |
4.000%, 08/01/43 | | | 1,292,965 | | | | 1,326,536 | |
6.500%, 12/01/27 | | | 3,687 | | | | 3,693 | |
6.500%, 05/01/32 | | | 13,161 | | | | 14,632 | |
Fannie Mae REMIC Trust Whole Loan (CMO)
4.497%, 01/25/43 (b) | | | 257,577 | | | | 268,276 | |
Fannie Mae REMICS (CMO)
Zero Coupon, 03/25/42 (d) | | | 409,893 | | | | 364,161 | |
3.644%,-1x 1M LIBOR + 6.150%, 03/25/42 (b) (c) | | | 6,667,587 | | | | 802,720 | |
3.644%,-1x 1M LIBOR + 6.150%, 12/25/42 (b) (c) | | | 758,777 | | | | 129,408 | |
4.024%,-1x 1M LIBOR + 6.530%, 01/25/41 (b) (c) | | | 1,063,355 | | | | 154,871 | |
4.044%,-1x 1M LIBOR + 6.550%, 10/25/41 (b) (c) | | | 4,110,887 | | | | 611,459 | |
4.144%,-1x 1M LIBOR + 6.650%, 02/25/41 (b) (c) | | | 512,276 | | | | 56,423 | |
4.144%,-1x 1M LIBOR + 6.650%, 03/25/42 (b) (c) | | | 1,612,244 | | | | 194,133 | |
5.500%, 07/25/41 | | | 7,186,059 | | | | 7,856,057 | |
5.500%, 04/25/42 | | | 1,700,551 | | | | 1,850,226 | |
6.000%, 05/25/42 | | | 1,032,094 | | | | 1,110,907 | |
6.500%, 06/25/39 | | | 140,818 | | | | 150,253 | |
6.500%, 07/25/42 | | | 1,906,332 | | | | 2,161,762 | |
9.750%, 08/25/19 | | | 187 | | | | 188 | |
See accompanying notes to financial statements.
BHFTII-4
Brighthouse Funds Trust II
Western Asset Management U.S. Government Portfolio
Schedule of Investments as of December 31, 2018
U.S. Treasury & Government Agencies—(Continued)
| | | | | | | | |
| Security Description | | Principal
Amount* | | | Value | |
|
| Agency Sponsored Mortgage - Backed—(Continued) | |
FannieMae-ACES (CMO)
2.037%, 09/25/26 | | | 2,331,534 | | | $ | 2,262,282 | |
Freddie Mac 15 Yr. Gold Pool
2.500%, 10/01/31 | | | 2,999,998 | | | | 2,927,515 | |
2.500%, 04/01/33 | | | 12,085,760 | | | | 11,793,755 | |
2.500%, 06/01/33 | | | 4,582,696 | | | | 4,471,973 | |
2.500%, 09/01/33 | | | 331,536 | | | | 323,526 | |
Freddie Mac 20 Yr. Gold Pool
3.000%, 02/01/38 | | | 1,890,807 | | | | 1,861,049 | |
3.000%, 04/01/38 | | | 1,611,093 | | | | 1,587,024 | |
Freddie Mac 30 Yr. Gold Pool
3.000%, 04/01/47 | | | 1,359,148 | | | | 1,325,807 | |
3.000%, TBA (a) | | | 5,700,000 | | | | 5,555,635 | |
3.500%, 08/01/48 | | | 219,036 | | | | 219,034 | |
3.500%, 09/01/48 | | | 670,845 | | | | 670,841 | |
3.500%, 10/01/48 | | | 16,807,670 | | | | 16,807,405 | |
4.000%, 07/01/43 | | | 3,974,262 | | | | 4,091,585 | |
4.000%, 08/01/43 | | | 3,451,409 | | | | 3,553,300 | |
4.000%, 07/01/47 | | | 7,425,450 | | | | 7,580,590 | |
4.000%, 12/01/47 | | | 821,830 | | | | 839,217 | |
4.000%, 04/01/48 | | | 476,749 | | | | 486,192 | |
4.000%, 05/01/48 | | | 2,500,769 | | | | 2,550,238 | |
4.000%, 09/01/48 | | | 10,705,115 | | | | 10,915,797 | |
4.000%, TBA (a) | | | 22,700,000 | | | | 23,141,047 | |
4.500%, 06/01/38 | | | 1,363,846 | | | | 1,418,476 | |
4.500%, 02/01/47 | | | 721,052 | | | | 747,266 | |
4.500%, 03/01/47 | | | 61,077 | | | | 63,293 | |
4.500%, 04/01/47 | | | 1,173,409 | | | | 1,216,068 | |
4.500%, 05/01/47 | | | 556,555 | | | | 576,468 | |
4.500%, 06/01/47 | | | 2,152,255 | | | | 2,230,810 | |
4.500%, 07/01/47 | | | 49,258 | | | | 51,025 | |
4.500%, 06/01/48 | | | 17,157,954 | | | | 17,773,198 | |
5.000%, 08/01/33 | | | 17,852 | | | | 18,945 | |
5.000%, 01/01/36 | | | 29,751 | | | | 31,567 | |
5.000%, 01/01/40 | | | 26,389 | | | | 27,939 | |
5.000%, 04/01/41 | | | 26,328 | | | | 27,876 | |
5.000%, 06/01/41 | | | 3,919,820 | | | | 4,162,425 | |
5.000%, 04/01/44 | | | 30,776 | | | | 32,493 | |
5.000%, 07/01/48 | | | 100,000 | | | | 104,700 | |
5.000%, 08/01/48 | | | 5,279,890 | | | | 5,528,664 | |
5.000%, 09/01/48 | | | 582,421 | | | | 611,257 | |
5.000%, 10/01/48 | | | 1,079,628 | | | | 1,131,160 | |
5.000%, 11/01/48 | | | 797,161 | | | | 836,686 | |
5.000%, TBA (a) | | | 4,200,000 | | | | 4,396,596 | |
6.000%, 10/01/36 | | | 702,193 | | | | 766,726 | |
6.500%, 09/01/39 | | | 249,094 | | | | 282,506 | |
8.000%, 09/01/30 | | | 3,192 | | | | 3,641 | |
Freddie Mac 30 Yr.Non-Gold Pool
8.000%, 07/01/20 | | | 1 | | | | 1 | |
Freddie Mac Gold Pool
3.500%, 10/01/42 | | | 975,302 | | | | 980,965 | |
3.500%, 02/01/44 | | | 441,653 | | | | 444,214 | |
4.000%, 04/01/43 | | | 1,421,347 | | | | 1,458,290 | |
4.000%, 08/01/43 | | | 862,330 | | | | 884,950 | |
Freddie Mac Multifamily Structured Pass-Through Certificates (CMO)
3.291%, 03/25/27 | | | 4,670,000 | | | | 4,698,299 | |
|
| Agency Sponsored Mortgage - Backed—(Continued) | |
Freddie Mac REMICS (CMO)
4.500%, 04/15/32 | | | 276,345 | | | | 290,687 | |
6.000%, 05/15/36 | | | 461,630 | | | | 513,992 | |
8.500%, 06/15/21 | | | 3,289 | | | | 3,363 | |
Freddie Mac Structured Agency Credit Risk Debt Notes (CMO)
3.706%, 1M LIBOR + 1.200%, 07/25/29 (b) | | | 4,975,905 | | | | 4,998,407 | |
4.706%, 1M LIBOR + 2.200%, 09/25/24 (b) | | | 5,444,962 | | | | 5,558,935 | |
Ginnie Mae I 30 Yr. Pool
3.500%, 06/15/48 | | 5,926,509 | | | 5,990,737 | |
5.500%, 06/15/36 | | | 400,223 | | | | 433,277 | |
6.000%, 03/15/33 | | | 707,262 | | | | 777,572 | |
6.500%, 06/15/31 | | | 2,739 | | | | 2,949 | |
6.500%, 08/15/34 | | | 179,377 | | | | 193,846 | |
7.500%, 09/15/29 | | | 1,526 | | | | 1,664 | |
8.500%, 06/15/25 | | | 16,496 | | | | 18,137 | |
Ginnie Mae II 30 Yr. Pool | | | | | | | | |
3.000%, 09/20/47 | | | 7,809,382 | | | | 7,686,868 | |
3.000%, 11/20/47 | | | 18,908,999 | | | | 18,610,530 | |
3.000%, 12/20/47 | | | 30,262,661 | | | | 29,783,474 | |
3.500%, 06/20/44 | | | 2,483,354 | | | | 2,510,662 | |
3.500%, TBA (a) | | | 7,200,000 | | | | 7,249,102 | |
4.000%, 09/20/45 | | | 1,262,077 | | | | 1,299,741 | |
4.000%, 11/20/45 | | | 8,603,425 | | | | 8,856,162 | |
4.500%, 01/20/40 | | | 596,894 | | | | 626,338 | |
4.500%, 05/20/40 | | | 786,570 | | | | 825,378 | |
4.500%, 09/20/40 | | | 16,502 | | | | 17,315 | |
4.500%, 01/20/41 | | | 130,124 | | | | 136,550 | |
4.500%, 07/20/41 | | | 870,774 | | | | 913,539 | |
4.500%, 06/20/48 | | | 7,824,929 | | | | 8,105,170 | |
4.500%, 09/20/48 | | | 494,847 | | | | 512,495 | |
4.500%, TBA (a) | | | 35,300,000 | | | | 36,527,548 | |
5.000%, 07/20/40 | | | 598,426 | | | | 638,166 | |
5.000%, 08/20/48 | | | 3,264,731 | | | | 3,402,389 | |
5.000%, 11/20/48 | | | 1,657,004 | | | | 1,726,603 | |
5.000%, 01/20/49 | | | 400,000 | | | | 416,859 | |
5.000%, TBA (a) | | | 36,000,000 | | | | 37,450,855 | |
6.000%, 11/20/34 | | | 1,303 | | | | 1,414 | |
6.000%, 06/20/35 | | | 2,057 | | | | 2,233 | |
6.000%, 07/20/36 | | | 116,199 | | | | 126,179 | |
6.000%, 09/20/36 | | | 5,694 | | | | 6,174 | |
6.000%, 07/20/38 | | | 296,857 | | | | 324,513 | |
6.000%, 09/20/38 | | | 766,948 | | | | 827,777 | |
6.000%, 06/20/39 | | | 3,796 | | | | 4,081 | |
6.000%, 05/20/40 | | | 68,631 | | | | 74,463 | |
6.000%, 06/20/40 | | | 197,004 | | | | 213,548 | |
6.000%, 08/20/40 | | | 106,671 | | | | 113,680 | |
6.000%, 09/20/40 | | | 237,568 | | | | 252,946 | |
6.000%, 10/20/40 | | | 160,205 | | | | 173,895 | |
6.000%, 11/20/40 | | | 219,377 | | | | 237,922 | |
6.000%, 01/20/41 | | | 159,099 | | | | 172,447 | |
6.000%, 03/20/41 | | | 808,440 | | | | 861,134 | |
6.000%, 07/20/41 | | | 163,318 | | | | 177,215 | |
6.000%, 12/20/41 | | | 116,615 | | | | 126,227 | |
6.500%, 10/20/37 | | | 255,871 | | | | 294,341 | |
See accompanying notes to financial statements.
BHFTII-5
Brighthouse Funds Trust II
Western Asset Management U.S. Government Portfolio
Schedule of Investments as of December 31, 2018
U.S. Treasury & Government Agencies—(Continued)
| | | | | | | | |
| Security Description | | Principal
Amount* | | | Value | |
|
| Agency Sponsored Mortgage - Backed—(Continued) | |
Government National Mortgage Association (CMO)
0.253%, 02/16/48 (b) (c) | | | 5,068,241 | | | $ | 116,555 | |
0.277%, 02/16/53 (b) (c) | | | 12,867,551 | | | | 254,990 | |
0.326%, 09/16/46 (b) (c) | | | 25,837,357 | | | | 259,345 | |
0.422%, 05/16/54 (b) (c) | | | 16,683,992 | | | | 362,388 | |
0.436%, 03/16/49 (b) (c) | | | 8,095,882 | | | | 111,037 | |
0.521%, 10/16/54 (b) (c) | | | 31,563,297 | | | | 884,309 | |
0.691%, 03/16/60 (b) (c) | | | 7,232,492 | | | | 433,448 | |
0.741%, 05/16/54 (b) (c) | | | 16,212,081 | | | | 654,328 | |
0.768%, 12/16/59 (b) (c) | | | 72,769,874 | | | | 5,092,057 | |
0.841%, 09/16/55 (b) (c) | | | 18,451,328 | | | | 985,157 | |
0.954%, 12/16/56 (b) (c) | | | 43,620,967 | | | | 3,314,295 | |
1.067%, 09/16/44 (b) (c) | | | 14,707,650 | | | | 713,481 | |
1.160%, 02/16/46 (b) (c) | | | 20,934,346 | | | | 997,524 | |
2.694%, 1M LIBOR + 0.380%, 12/20/60 (b) | | | 15,477,008 | | | | 15,468,807 | |
2.714%, 1M LIBOR + 0.400%, 12/20/60 (b) | | | 4,594,098 | | | | 4,593,856 | |
2.744%, 1M LIBOR + 0.430%, 10/20/64 (b) | | | 6,328,177 | | | | 6,334,815 | |
2.794%, 1M LIBOR + 0.480%, 03/20/61 (b) | | | 4,129,390 | | | | 4,136,979 | |
2.814%, 1M LIBOR + 0.500%, 12/20/60 (b) | | | 36,684,696 | | | | 36,781,716 | |
3.250%, 12M LIBOR + 0.250%, 10/20/68 (b) | | | 2,982,649 | | | | 2,998,055 | |
3.645%,-1x 1M LIBOR + 6.100%, 08/16/42 (b) (c) | | | 970,525 | | | | 152,118 | |
4.030%,-1x 1M LIBOR + 6.500%, 03/20/39 (b) (c) | | | 147,769 | | | | 4,469 | |
4.180%,-1x 1M LIBOR + 6.650%, 01/20/40 (b) (c) | | | 603,921 | | | | 52,215 | |
| | | | | | | | |
| | | | | | | 823,227,765 | |
| | | | | | | | |
|
| Federal Agencies—36.7% | |
Federal Agricultural Mortgage Corp.
2.600%, 03/29/21 | | | 20,000,000 | | | | 20,021,620 | |
Federal Farm Credit Bank
1.250%, 01/17/19 | | | 25,000,000 | | | | 24,987,900 | |
1.750%, 10/26/20 | | | 15,000,000 | | | | 14,773,950 | |
1.900%, 11/27/20 | | | 20,000,000 | | | | 19,740,920 | |
1.950%, 01/10/20 | | | 10,000,000 | | | | 9,942,300 | |
2.240%, 01/06/25 | | | 12,305,000 | | | | 11,686,858 | |
2.240%, 07/06/27 | | | 10,000,000 | | | | 9,346,190 | |
2.300%, 06/11/19 | | | 10,000,000 | | | | 9,987,040 | |
2.550%, 06/11/20 | | | 10,000,000 | | | | 9,999,540 | |
2.750%, 04/25/22 | | | 20,000,000 | | | | 20,081,520 | |
Federal Home Loan Bank
1.375%, 09/28/20 | | | 10,000,000 | | | | 9,795,980 | |
1.875%, 11/29/21 | | | 49,000,000 | | | | 48,113,100 | |
2.125%, 06/09/23 | | | 17,700,000 | | | | 17,305,715 | |
2.375%, 12/13/19 (e) | | | 20,000,000 | | | | 19,943,800 | |
2.375%, 03/30/20 | | | 8,000,000 | | | | 7,981,512 | |
2.625%, 05/28/20 | | | 20,000,000 | | | | 20,025,860 | |
3.250%, 11/16/28 | | | 20,000,000 | | | | 20,327,080 | |
5.250%, 12/11/20 | | | 12,000,000 | | | | 12,600,000 | |
Federal Home Loan Mortgage Corp.
Zero Coupon, 11/29/19 | | | 10,200,000 | | | | 9,935,604 | |
1.125%, 04/15/19 | | | 30,000,000 | | | | 29,882,520 | |
1.500%, 01/17/20 | | | 10,000,000 | | | | 9,886,720 | |
2.750%, 06/19/23 | | | 20,000,000 | | | | 20,124,940 | |
Federal National Mortgage Association
Zero Coupon, 10/09/19 | | | 50,000,000 | | | | 48,927,040 | |
2.125%, 04/24/26 | | | 10,000,000 | | | | 9,530,020 | |
2.625%, 09/06/24 | | | 22,000,000 | | | | 21,921,658 | |
|
| Federal Agencies—(Continued) | |
Financing Corp. Fico
Zero Coupon, 04/05/19 | | | 1,245,000 | | | | 1,236,172 | |
Zero Coupon, 06/06/19 | | | 26,414,000 | | | | 26,103,011 | |
Zero Coupon, 09/26/19 | | | 14,535,000 | | | | 14,239,160 | |
National Archives Facility Trust
8.500%, 09/01/19 | | | 878,880 | | | | 899,179 | |
New Valley Generation II
5.572%, 05/01/20 | | | 3,097,560 | | | | 3,163,383 | |
Overseas Private Investment Corp.
Zero Coupon, 11/13/19 | | | 3,306,787 | | | | 3,607,193 | |
Zero Coupon, 07/01/21 | | | 6,750,000 | | | | 6,809,420 | |
Zero Coupon, 07/17/21 | | | 7,763,000 | | | | 7,837,640 | |
2.310%, 11/15/30 | | | 7,511,618 | | | | 7,165,435 | |
3.330%, 05/15/33 | | | 6,512,177 | | | | 6,523,415 | |
3.490%, 12/20/29 | | | 10,705,157 | | | | 10,970,863 | |
3.540%, 06/15/30 | | | 13,529,556 | | | | 13,900,253 | |
Residual Funding Corp. Principal Strip
Zero Coupon, 10/15/19 | | | 10,642,000 | | | | 10,414,877 | |
Zero Coupon, 07/15/20 | | | 14,864,000 | | | | 14,274,701 | |
Zero Coupon, 10/15/20 | | | 38,159,000 | | | | 36,408,310 | |
Zero Coupon, 01/15/21 | | | 20,000,000 | | | | 18,955,656 | |
Zero Coupon, 01/15/30 | | | 25,000,000 | | | | 17,641,040 | |
Zero Coupon, 04/15/30 | | | 20,000,000 | | | | 13,991,155 | |
Tennessee Valley Authority
2.250%, 03/15/20 | | | 20,000,000 | | | | 19,929,500 | |
3.875%, 02/15/21 | | | 35,000,000 | | | | 35,919,135 | |
| | | | | | | | |
| | | | | | | 726,858,885 | |
| | | | | | | | |
|
| U.S. Treasury—12.9% | |
U.S. Treasury Bond
3.750%, 11/15/43 | | | 8,000,000 | | | | 9,050,843 | |
U.S. Treasury Inflation Indexed Bonds | |
0.625%, 02/15/43 (f) | | | 3,739,524 | | | | 3,277,953 | |
1.375%, 02/15/44 (f) | | | 27,016,749 | | | | 27,897,963 | |
U.S. Treasury Inflation Indexed Notes
0.625%, 04/15/23 (f) | | | 22,478,102 | | | | 22,105,821 | |
U.S. Treasury Notes | |
1.375%, 05/31/21 | | | 28,600,000 | | | | 27,860,371 | |
1.875%, 01/31/22 | | | 54,000,000 | | | | 53,036,421 | |
2.000%, 06/30/24 | | | 20,000,000 | | | | 19,448,639 | |
2.000%, 02/15/25 | | | 96,000,000 | | | | 92,875,509 | |
| | | | | | | | |
| | | | | | | 255,553,520 | |
| | | | | | | | |
Total U.S. Treasury & Government Agencies
(Cost $1,810,690,218) | | | | | | | 1,805,640,170 | |
| | | | | | | | |
|
| Corporate Bonds & Notes—8.6% | |
|
| Chemicals—0.1% | |
Equate Petrochemical B.V.
4.250%, 11/03/26 (144A) | | | 1,540,000 | | | | 1,489,319 | |
| | | | | | | | |
|
| Diversified Financial Services—3.4% | |
COP I LLC
3.650%, 12/05/21 | | | 4,232,556 | | | | 4,287,611 | |
See accompanying notes to financial statements.
BHFTII-6
Brighthouse Funds Trust II
Western Asset Management U.S. Government Portfolio
Schedule of Investments as of December 31, 2018
Corporate Bonds & Notes—(Continued)
| | | | | | | | |
| Security Description | | Principal
Amount* | | | Value | |
|
| Diversified Financial Services—(Continued) | |
Postal Square L.P.
6.500%, 06/15/22 | | | 4,380,480 | | | $ | 4,574,718 | |
| Private Export Funding Corp. | |
2.250%, 03/15/20 | | | 11,950,000 | | | | 11,890,752 | |
2.300%, 09/15/20 | | | 28,000,000 | | | | 27,782,748 | |
2.650%, 02/16/21 (144A) | | | 20,000,000 | | | | 20,015,280 | |
| | | | | | | | |
| | | | | | | 68,551,109 | |
| | | | | | | | |
|
| Electric—0.4% | |
Enel Chile S.A.
4.875%, 06/12/28 | | | 4,000,000 | | | | 3,990,000 | |
Perusahaan Listrik Negara PT
5.450%, 05/21/28 (144A) | | | 4,000,000 | | | | 4,046,076 | |
| | | | | | | | |
| | | | | | | 8,036,076 | |
| | | | | | | | |
|
| Iron/Steel—1.0% | |
Vale Overseas, Ltd.
6.250%, 08/10/26 | | | 17,875,000 | | | | 19,305,000 | |
| | | | | | | | |
|
| Oil & Gas—0.4% | |
Ecopetrol S.A.
5.375%, 06/26/26 | | | 4,260,000 | | | | 4,286,625 | |
Petroleos Mexicanos
6.375%, 01/23/45 | | | 3,610,000 | | | | 2,906,050 | |
| | | | | | | | |
| | | | | | | 7,192,675 | |
| | | | | | | | |
|
| Sovereign—3.3% | |
| National Credit Union Administration Guaranteed Notes Trust | |
3.000%, 06/12/19 | | | 19,650,000 | | | | 19,675,742 | |
3.450%, 06/12/21 | | | 45,000,000 | | | | 45,828,900 | |
| | | | | | | | |
| | | | | | | 65,504,642 | |
| | | | | | | | |
Total Corporate Bonds & Notes
(Cost $173,895,821) | | | | | | | 170,078,821 | |
| | | | | | | | |
|
| Foreign Government—8.6% | |
|
| Sovereign—8.6% | |
Colombia Government International Bonds | |
5.000%, 06/15/45 (e) | | | 37,000,000 | | | | 35,224,000 | |
5.625%, 02/26/44 | | | 4,840,000 | | | | 4,990,040 | |
Indonesia Government International Bonds | |
3.750%, 04/25/22 (144A) | | | 410,000 | | | | 405,870 | |
3.750%, 04/25/22 | | | 1,900,000 | | | | 1,880,861 | |
4.875%, 05/05/21 | | | 2,957,000 | | | | 3,020,534 | |
5.875%, 03/13/20 | | | 310,000 | | | | 318,675 | |
5.875%, 01/15/24 (144A) (e) | | | 1,060,000 | | | | 1,130,068 | |
Israel Government AID Bonds | |
5.500%, 12/04/23 | | | 24,290,000 | | | | 27,324,423 | |
5.500%, 04/26/24 | | | 20,950,000 | | | | 23,818,702 | |
Panama Government International Bond
4.500%, 05/15/47 | | | 3,200,000 | | | | 3,108,000 | |
Peruvian Government International Bonds | |
5.625%, 11/18/50 | | | 350,000 | | | | 410,900 | |
6.550%, 03/14/37 | | | 4,210,000 | | | | 5,315,125 | |
|
| Sovereign—(Continued) | |
Poland Government International Bond
4.000%, 01/22/24 | | | 7,870,000 | | | | 8,051,041 | |
Qatar Government International Bond
5.103%, 04/23/48 (144A) | | | 7,300,000 | | | | 7,666,825 | |
Ukraine Government AID Bonds | |
1.471%, 09/29/21 | | | 20,000,000 | | | | 19,331,420 | |
1.844%, 05/16/19 | | | 25,000,000 | | | | 24,932,350 | |
Uruguay Government International Bond
5.100%, 06/18/50 | | | 3,200,000 | | | | 3,140,800 | |
| | | | | | | | |
Total Foreign Government
(Cost $174,338,892) | | | | | | | 170,069,634 | |
| | | | | | | | |
|
| Mortgage-Backed Securities—2.6% | |
|
| Collateralized Mortgage Obligations—2.6% | |
Banc of America Funding Corp.
2.465%, 1M LIBOR + 0.150%, 02/27/37 (144A) (b) | | | 6,857,858 | | | | 6,603,723 | |
Banc of America Funding Trust
2.509%, COFI + 1.430%, 06/20/35 (b) | | | 194,642 | | | | 138,945 | |
Banc of America Mortgage Trust
4.239%, 07/25/35 (b) | | | 42,108 | | | | 38,910 | |
BCAP LLC Trust
3.534%, 1M LIBOR + 0.150%, 11/27/36 (144A) (b) | | | 10,602,289 | | | | 9,993,223 | |
Citigroup Mortgage Loan Trust
4.820%, 1Y H15 + 2.400%, 10/25/35 (b) | | | 81,643 | | | | 82,456 | |
Countrywide Alternative Loan Trust | |
2.670%, 1M LIBOR + 0.200%, 07/20/46 (b) | | | 1,892,795 | | | | 1,430,617 | |
3.086%, 1M LIBOR + 0.580%, 05/25/34 (b) | | | 697,577 | | | | 692,247 | |
Countrywide Home Loan Reperforming Loan REMIC Trust
2.926%, 1M LIBOR + 0.420%, 07/25/36 (144A) (b) | | | 473,025 | | | | 452,874 | |
GMAC Mortgage Corp. Loan Trust
4.638%, 11/19/35 (b) | | | 234,857 | | | | 226,463 | |
GS Mortgage-Backed Securities Trust
3.750%, 10/25/57 (144A) | | | 4,950,052 | | | | 4,966,852 | |
JPMorgan Mortgage Trust | |
3.500%, 10/25/48 (144A) (b) | | | 3,982,618 | | | | 3,904,212 | |
4.145%, 06/25/34 (b) | | | 109,431 | | | | 109,587 | |
MASTR Adjustable Rate Mortgages Trust | |
2.706%, 1M LIBOR + 0.200%, 05/25/47 (b) | | | 4,136,277 | | | | 3,430,872 | |
3.465%, 02/25/34 (b) | | | 145,093 | | | | 137,429 | |
MASTR Reperforming Loan Trust | |
2.856%, 1M LIBOR + 0.350%, 05/25/35 (144A) (b) | | | 249,240 | | | | 196,913 | |
4.026%, 05/25/35 (144A) (b) | | | 3,257,733 | | | | 2,508,650 | |
7.000%, 08/25/34 (144A) | | | 310,394 | | | | 309,410 | |
Morgan Stanley Mortgage Loan Trust | |
2.646%, 1M LIBOR + 0.140%, 06/25/36 (b) | | | 545,060 | | | | 205,930 | |
3.683%, 07/25/35 (b) | | | 146,277 | | | | 127,722 | |
New Residential Mortgage Loan Trust | |
3.250%, 09/25/56 (144A) (b) | | | 3,390,547 | | | | 3,343,017 | |
4.000%, 02/25/57 (144A) (b) | | | 2,883,329 | | | | 2,900,207 | |
4.000%, 05/25/57 (144A) (b) | | | 5,085,059 | | | | 5,128,320 | |
NovaStar Mortgage Funding Trust
2.696%, 1M LIBOR + 0.190%, 09/25/46 (b) | | | 1,421,962 | | | | 1,292,821 | |
Provident Funding Mortgage Loan Trust | |
3.694%, 05/25/35 (b) | | | 173,335 | | | | 173,253 | |
4.214%, 10/25/35 (b) | | | 40,885 | | | | 40,311 | |
See accompanying notes to financial statements.
BHFTII-7
Brighthouse Funds Trust II
Western Asset Management U.S. Government Portfolio
Schedule of Investments as of December 31, 2018
Mortgage-Backed Securities—(Continued)
| | | | | | | | |
| Security Description | | Principal
Amount* | | | Value | |
|
| Collateralized Mortgage Obligations—(Continued) | |
SACO I Trust
9.030%, 06/25/21 (144A) (b) | | | 444,882 | | | $ | 433,716 | |
Structured Asset Mortgage Investments II Trust
2.686%, 1M LIBOR + 0.180%, 07/25/46 (b) | | | 168,807 | | | | 155,037 | |
Structured Asset Securities Corp. | |
2.856%, 1M LIBOR + 0.350%, 04/25/35 (144A) (b) | | | 2,024,093 | | | | 1,891,482 | |
4.113%, 06/25/35 (144A) (b) | | | 112,858 | | | | 104,399 | |
| | | | | | | | |
Total Mortgage-Backed Securities
(Cost $51,818,908) | | | | | | | 51,019,598 | |
| | | | | | | | |
|
| Asset-Backed Securities—1.2% | |
|
| Asset-Backed - Automobile—0.2% | |
Hertz Vehicle Financing II LP
3.290%, 02/25/24 (144A) | | | 4,880,000 | | | | 4,837,267 | |
| | | | | | | | |
|
| Asset-Backed - Home Equity—0.1% | |
EMC Mortgage Loan Trust
2.956%, 1M LIBOR + 0.450%, 12/25/42 (144A) (b) | | | 2,635 | | | | 2,628 | |
Home Equity Mortgage Loan Asset-Backed Trust
2.766%, 1M LIBOR + 0.260%, 06/25/36 (b) | | | 3,726,904 | | | | 471,716 | |
Morgan Stanley Mortgage Loan Trust | |
2.596%, 1M LIBOR + 0.090%, 12/25/36 (b) | | | 195,081 | | | | 117,304 | |
2.806%, 1M LIBOR + 0.300%, 03/25/36 (b) | | | 407,581 | | | | 407,139 | |
Structured Asset Securities Corp. Mortgage Loan Trust
2.726%, 1M LIBOR + 0.220%, 02/25/36 (144A) (b) | | | 4,667,037 | | | | 230,326 | |
| | | | | | | | |
| | | | | | | 1,229,113 | |
| | | | | | | | |
|
| Asset-Backed - Other—0.5% | |
Countrywide Revolving Home Equity Loan Trust
2.595%, 1M LIBOR + 0.140%, 07/15/36 (b) | | | 507,659 | | | | 479,898 | |
Towd Point Mortgage Trust | |
2.250%, 04/25/56 (144A) (b) | | | 6,131,684 | | | | 5,990,757 | |
2.750%, 06/25/57 (144A) (b) | | | 4,198,880 | | | | 4,084,341 | |
| | | | | | | | |
| | | | | | | 10,554,996 | |
| | | | | | | | |
|
| Asset-Backed - Student Loan—0.4% | |
National Credit Union Administration Guaranteed Notes Trust
2.737%, 1M LIBOR + 0.350%, 12/07/20 (b) | | | 3,161,941 | | | | 3,164,226 | |
Nelnet Student Loan Trust
4.327%, 3M LIBOR + 1.650%, 11/25/24 (b) | | | 4,045,179 | | | | 4,073,530 | |
SLM Student Loan Trust
2.530%, 3M LIBOR + 0.040%, 01/25/19 (b) | | | 922,265 | | | | 921,998 | |
| | | | | | | | |
| | | | | | | 8,159,754 | |
| | | | | | | | |
Total Asset-Backed Securities
(Cost $33,626,029) | | | | | | | 24,781,130 | |
| | | | | | | | |
| Short-Term Investments—0.6% | |
| Security Description | | Principal
Amount* | | | Value | |
|
| Repurchase Agreements—0.6% | |
Fixed Income Clearing Corp.
Repurchase Agreement dated 12/31/18 at 1.200%, due on 01/02/19 with a maturity value of $1,284,717; collateralized by U.S. Treasury Note at 2.875%, maturing 10/31/23, with a market value of $1,314,131. | | | 1,284,632 | | | | 1,284,632 | |
Merrill Lynch, Pierce, Fenner & Smith, Inc.
Repurchase Agreement dated 12/31/18 at 2.950%, due on 1/02/19 with a maturity value of $11,401,868; collateralized by U.S. Treasury Note at 2.625%, maturing 12/31/23, with a market value of $11,652,866. | | | 11,400,000 | | | | 11,400,000 | |
| | | | | | | | |
Total Short-Term Investments
(Cost $12,684,632) | | | | | | | 12,684,632 | |
| | | | | | | | |
|
| Securities Lending Reinvestments (g)—0.8% | |
|
| Repurchase Agreements—0.8% | |
| Citigroup Global Markets, Ltd. | |
Repurchase Agreement dated 12/31/18 at 2.490%, due on 01/02/19 with a maturity value of $400,055; collateralized by U.S. Treasury Obligations with rates ranging from 0.375% - 1.875%, maturity dates ranging from 12/15/20 - 01/15/27, and an aggregate market value of $408,000. | | | 400,000 | | | | 400,000 | |
Repurchase Agreement dated 12/31/18 at 2.490%, due on 01/02/19 with a maturity value of $1,500,208; collateralized by U.S. Treasury Obligations with rates ranging from 1.625% - 2.875%, maturity dates ranging from 06/30/20 - 11/15/46, and an aggregate market value of $1,530,000. | | | 1,500,000 | | | | 1,500,000 | |
Deutsche Bank AG, London
Repurchase Agreement dated 12/31/18 at 2.750%, due on 01/02/19 with a maturity value of $300,046; collateralized by U.S. Treasury and Foreign Obligations with rates ranging from 1.000% - 2.590%, maturity dates ranging from 03/31/19 - 12/29/26, and an aggregate market value of $306,000. | | | 300,000 | | | | 300,000 | |
Deutsche Bank Securities, Inc.
Repurchase Agreement dated 12/31/18 at 3.200%, due on 01/02/19 with a maturity value of $3,299,769; collateralized by U.S. Treasury Obligations at 0.000%, maturity dates ranging from 08/15/30 - 08/15/39, and an aggregate market value of $3,365,166. | | | 3,299,183 | | | | 3,299,183 | |
| NBC Global Finance, Ltd. | |
Repurchase Agreement dated 12/31/18 at 2.560%, due on 01/02/19 with a maturity value of $1,000,142; collateralized by various Common Stock with an aggregate market value of $1,113,212. | | | 1,000,000 | | | | 1,000,000 | |
Repurchase Agreement dated 12/31/18 at 2.560%, due on 01/02/19 with a maturity value of $1,100,156; collateralized by various Common Stock with an aggregate market value of $1,224,533. | | | 1,100,000 | | | | 1,100,000 | |
Repurchase Agreement dated 12/31/18 at 2.560%, due on 01/02/19 with a maturity value of $1,100,156; collateralized by various Common Stock with an aggregate market value of $1,224,533. | | | 1,100,000 | | | | 1,100,000 | |
See accompanying notes to financial statements.
BHFTII-8
Brighthouse Funds Trust II
Western Asset Management U.S. Government Portfolio
Schedule of Investments as of December 31, 2018
Securities Lending Reinvestments (g)—(Continued)
| | | | | | | | |
| Security Description | | Principal
Amount* | | | Value | |
|
| Repurchase Agreements—(Continued) | |
Nomura Securities International, Inc.
Repurchase Agreement dated 12/31/18 at 2.950%, due on 01/02/19 with a maturity value of $3,000,492; collateralized by U.S. Treasury Obligations with rates ranging from 0.000% - 6.500%, maturity dates ranging from 02/15/19 - 08/15/48, and an aggregate market value of $3,060,000. | | | 3,000,000 | | | $ | 3,000,000 | |
| Societe Generale | |
Repurchase Agreement dated 12/31/18 at 2.530%, due on 01/02/19 with a maturity value of $700,098; collateralized by U.S. Treasury Obligations with rates ranging from 0.750% - 8.000%, maturity dates ranging from 09/30/19 - 08/15/46, and various Common Stock with an aggregate market value of $766,833. | | | 700,000 | | | | 700,000 | |
Repurchase Agreement dated 12/31/18 at 2.530%, due on 01/02/19 with a maturity value of $1,242,277; collateralized by U.S. Treasury Obligations with rates ranging from 0.750% - 8.000%, maturity dates ranging from 09/30/19 - 08/15/46, and various Common Stock with an aggregate market value of $1,360,693. | | | 1,242,102 | | | | 1,242,102 | |
Repurchase Agreement dated 12/31/18 at 2.530%, due on 01/02/19 with a maturity value of $1,300,183; collateralized by U.S. Treasury Obligations with rates ranging from 0.750% - 8.000%, maturity dates ranging from 09/30/19 - 08/15/46, and various Common Stock with an aggregate market value of $1,424,119. | | | 1,300,000 | | | | 1,300,000 | |
Repurchase Agreement dated 12/31/18 at 2.560%, due on 01/07/19 with a maturity value of $55,027; collateralized by U.S. Treasury Obligations with rates ranging from 0.750% - 8.000%, maturity dates ranging from 09/30/19 - 08/15/46, and various Common Stock with an aggregate market value of $60,251. | | | 55,000 | | | | 55,000 | |
| | | | | | | | |
| | | | | | | 14,996,285 | |
| | | | | | | | |
Total Securities Lending Reinvestments
(Cost $14,996,285) | | | | | | | 14,996,285 | |
| | | | | | | | |
Total Investments—113.5%
(Cost $2,272,050,785) | | | | | | | 2,249,270,270 | |
Other assets and liabilities (net)—(13.5)% | | | | | | | (268,396,960 | ) |
| | | | | | | | |
| Net Assets—100.0% | | | | | | $ | 1,980,873,310 | |
| | | | | | | | |
| | | | |
| | | | |
| * | | Principal amount stated in U.S. dollars unless otherwise noted. |
| (a) | | TBA (To Be Announced) Securities are purchased on a forward commitment basis with an approximate principal amount and no defined maturity date. The actual principal and maturity date will be determined upon settlement date. |
| (b) | | Variable or floating rate security. The stated rate represents the rate at December 31, 2018. Maturity date shown for callable securities reflects the earliest possible call date. For securities based on a published reference index and spread, the index and spread are indicated in the description above. For certain variable rate securities, the coupon rate is determined by the issuer/agent based on current market conditions. For certain asset- and mortgage-backed securities, the coupon rate may fluctuate based on changes of the underlying collateral or prepayments of principal. These securities do not indicate a reference index and spread in their description above. |
| (c) | | Interest only security. |
| (d) | | Principal only security. |
| (e) | | All or a portion of the security was held on loan. As of December 31, 2018, the market value of securities loaned was $14,638,907 and the collateral received consisted of cash in the amount of $14,996,285. The cash collateral investments are disclosed in the Schedule of Investments and categorized as Securities Lending Reinvestments. |
| (f) | | Principal amount of security is adjusted for inflation. |
| (g) | | Represents investment of cash collateral received from securities on loan as of December 31, 2018. |
| (144A)— | | Securities exempt from registration under Rule 144A of the Securities Act of 1933. These securities may be resold in transactions exempt from registration, normally to qualified institutional buyers. As of December 31, 2018, the market value of 144A securities was $92,635,755, which is 4.7% of net assets. |
Futures Contracts
| | | | | | | | | | | | | | | | | | | | |
Futures Contracts—Short | | Expiration
Date | | | Number of
Contracts | | | Notional Value | | | Value/
Unrealized
Depreciation | |
U.S. Treasury Long Bond Futures | | | 03/20/19 | | | | (538 | ) | | | USD | | | | (78,548,000 | ) | | $ | (3,544,998 | ) |
U.S. Treasury Note 10 Year Futures | | | 03/20/19 | | | | (26 | ) | | | USD | | | | (3,172,406 | ) | | | (68,983 | ) |
| | | | | | | | | | | | | | | | | | | | |
Net Unrealized Depreciation | | | $ | (3,613,981 | ) |
| | | | | | | | | | | | | | | | | |
See accompanying notes to financial statements.
BHFTII-9
Brighthouse Funds Trust II
Western Asset Management U.S. Government Portfolio
Schedule of Investments as of December 31, 2018
Glossary of Abbreviations
Currencies
| | | | |
| (USD)— | | United States Dollar |
Index Abbreviations
| | | | |
| (H15)— | | U.S. Treasury Yield Curve Rate T-Note Constant Maturity Index |
| (COFI)— | | 11th District Cost of Funds Index |
| (LIBOR)— | | London Interbank Offered Rate |
Other Abbreviations
| | | | |
| (ACES)— | | Alternative Credit Enhancement Securities |
| (CMO)— | | Collateralized Mortgage Obligation |
| (REMIC)— | | Real Estate Mortgage Investment Conduit |
Fair Value Hierarchy
Accounting principles generally accepted in the United States of America (“GAAP”) define fair market value as the price that the Portfolio would receive to sell an asset or pay to transfer a liability in an orderly transaction between market participants at the measurement date. It establishes a fair value hierarchy that prioritizes inputs to valuation methods and requires disclosure of the fair value hierarchy, separately for each major category of assets and liabilities, that segregates fair value measurements into three levels. Levels 1, 2 and 3 of the fair value hierarchy are defined as follows:
Level 1 - unadjusted quoted prices in active markets for identical investments
Level 2 - other significant observable inputs (including, but not limited to, quoted prices for similar assets or liabilities in markets that are either active or inactive; inputs other than quoted prices that are observable such as interest rates, yield curves, volatilities, prepayment speeds, loss severities, credit risks, default rates, or other market corroborated inputs)
Level 3 - significant unobservable inputs based on the best information available in the circumstances, to the extent observable inputs are unavailable (including the Portfolio’s own assumptions used in determining the fair value of investments and derivative financial instruments)
The inputs or methodologies used for valuing investments are not necessarily an indication of the risk associated with investing in them. Changes to the inputs or methodologies used may result in transfers between levels. A reconciliation of Level 3 securities, if any, will be disclosed following the fair value hierarchy table. For more information about the Portfolio’s policy regarding the valuation of investments, please refer to the Notes to Financial Statements.
The following table summarizes the fair value hierarchy of the Portfolio’s investments as of December 31, 2018:
| | | | | | | | | | | | | | | | |
| Description | | Level 1 | | | Level 2 | | | Level 3 | | | Total | |
Total U.S. Treasury & Government Agencies* | | $ | — | | | $ | 1,805,640,170 | | | $ | — | | | $ | 1,805,640,170 | |
Total Corporate Bonds & Notes* | | | — | | | | 170,078,821 | | | | — | | | | 170,078,821 | |
Total Foreign Government* | | | — | | | | 170,069,634 | | | | — | | | | 170,069,634 | |
Total Mortgage-Backed Securities* | | | — | | | | 51,019,598 | | | | — | | | | 51,019,598 | |
Total Asset-Backed Securities* | | | — | | | | 24,781,130 | | | | — | | | | 24,781,130 | |
Total Short-Term Investments* | | | — | | | | 12,684,632 | | | | — | | | | 12,684,632 | |
Total Securities Lending Reinvestments* | | | — | | | | 14,996,285 | | | | — | | | | 14,996,285 | |
Total Investments | | $ | — | | | $ | 2,249,270,270 | | | $ | — | | | $ | 2,249,270,270 | |
| | | | | | | | | | | | | | | | | |
Collateral for Securities Loaned (Liability) | | $ | — | | | $ | (14,996,285 | ) | | $ | — | | | $ | (14,996,285 | ) |
| Futures Contracts | |
Futures Contracts (Unrealized Depreciation) | | $ | (3,613,981 | ) | | $ | — | | | $ | — | | | $ | (3,613,981 | ) |
| | | | |
| * | | See Schedule of Investments for additional detailed categorizations. |
See accompanying notes to financial statements.
BHFTII-10
Brighthouse Funds Trust II
Western Asset Management U.S. Government Portfolio
Statement of Assets and Liabilities
December 31, 2018
| | | | |
Assets | |
Investments at value (a) (b) | | $ | 2,249,270,270 | |
Cash | | | 24 | |
Cash collateral for futures contracts | | | 1,404,130 | |
Receivable for: | |
TBA securities sold | | | 20,895,758 | |
Fund shares sold | | | 25,249 | |
Principal paydowns | | | 52,660 | |
Interest | | | 7,783,099 | |
Prepaid expenses | | | 5,596 | |
Other assets | | | 6,325 | |
| | | | |
Total Assets | | | 2,279,443,111 | |
Liabilities | |
Collateral for securities loaned | | | 14,996,285 | |
Payables for: | |
Investments purchased | | | 1,429,745 | |
TBA securities purchased | | | 278,432,858 | |
Fund shares redeemed | | | 2,225,803 | |
Variation margin on futures contracts | | | 262,362 | |
Accrued Expenses: | |
Management fees | | | 781,629 | |
Distribution and service fees | | | 83,068 | |
Deferred trustees’ fees | | | 111,793 | |
Other expenses | | | 246,258 | |
| | | | |
Total Liabilities | | | 298,569,801 | |
| | | | |
Net Assets | | $ | 1,980,873,310 | |
| | | | |
Net Assets Consist of: | |
Paid in surplus | | $ | 2,084,089,314 | |
Distributable earnings (Accumulated losses) | | | (103,216,004 | ) |
| | | | |
Net Assets | | $ | 1,980,873,310 | |
| | | | |
Net Assets | |
Class A | | $ | 1,581,889,947 | |
Class B | | | 378,103,077 | |
Class E | | | 20,880,286 | |
Capital Shares Outstanding* | |
Class A | | | 137,706,897 | |
Class B | | | 33,082,780 | |
Class E | | | 1,823,943 | |
Net Asset Value, Offering Price and Redemption Price Per Share | |
Class A | | $ | 11.49 | |
Class B | | | 11.43 | |
Class E | | | 11.45 | |
| | | | |
| * | | The Portfolio is authorized to issue an unlimited number of shares. |
| (a) | | Identified cost of investments was $2,272,050,785. |
| (b) | | Includes securities loaned at value of $14,638,907. |
Statement of Operations
Year Ended December 31, 2018
| | | | |
Investment Income | |
Interest | | $ | 56,195,621 | |
Securities lending income | | | 13,115 | |
| | | | |
Total investment income | | | 56,208,736 | |
Expenses | |
Management fees | | | 9,949,483 | |
Administration fees | | | 76,507 | |
Custodian and accounting fees | | | 153,976 | |
Distribution and service fees—Class B | | | 991,724 | |
Distribution and service fees—Class E | | | 33,179 | |
Audit and tax services | | | 71,838 | |
Legal | | | 45,317 | |
Trustees’ fees and expenses | | | 33,734 | |
Shareholder reporting | | | 106,275 | |
Insurance | | | 13,765 | |
Miscellaneous | | | 23,706 | |
| | | | |
Total expenses | | | 11,499,504 | |
Less management fee waiver | | | (270,070 | ) |
| | | | |
Net expenses | | | 11,229,434 | |
| | | | |
Net Investment Income | | | 44,979,302 | |
| | | | |
Net Realized and Unrealized Loss | |
| Net realized gain (loss) on: | |
Investments | | | (17,568,654 | ) |
Futures contracts | | | 7,732,383 | |
| | | | |
Net realized loss | | | (9,836,271 | ) |
| | | | |
| Net change in unrealized depreciation on: | |
Investments | | | (15,111,530 | ) |
Futures contracts | | | (3,737,685 | ) |
| | | | |
Net change in unrealized depreciation | | | (18,849,215 | ) |
| | | | |
Net realized and unrealized loss | | | (28,685,486 | ) |
| | | | |
Net Increase in Net Assets From Operations | | $ | 16,293,816 | |
| | | | |
See accompanying notes to financial statements.
BHFTII-11
Brighthouse Funds Trust II
Western Asset Management U.S. Government Portfolio
Statements of Changes in Net Assets
| | | | | | | | |
| | | Year Ended
December 31,
2018 | | | Year Ended
December 31,
2017 | |
Increase (Decrease) in Net Assets: | |
From Operations | |
Net investment income | | $ | 44,979,302 | | | $ | 36,619,286 | |
Net realized loss | | | (9,836,271 | ) | | | (1,320,608 | ) |
Net change in unrealized appreciation (depreciation) | | | (18,849,215 | ) | | | 4,773,349 | |
| | | | | | | | |
Increase in net assets from operations | | | 16,293,816 | | | | 40,072,027 | |
| | | | | | | | |
From Distributions to Shareholders (a) | | | | | |
Class A | | | (39,246,145 | ) | | | (46,214,806 | ) |
Class B | | | (8,163,581 | ) | | | (10,310,280 | ) |
Class E | | | (475,567 | ) | | | (608,683 | ) |
| | | | | | | | |
Total distributions | | | (47,885,293 | ) | | | (57,133,769 | ) |
| | | | | | | | |
Increase (decrease) in net assets from capital share transactions | | | (170,359,733 | ) | | | 7,266,461 | |
| | | | | | | | |
Total decrease in net assets | | | (201,951,210 | ) | | | (9,795,281 | ) |
| |
Net Assets | | | | | |
Beginning of period | | | 2,182,824,520 | | | | 2,192,619,801 | |
| | | | | | | | |
End of period | | $ | 1,980,873,310 | | | $ | 2,182,824,520 | (b) |
| | | | | | | | |
Other Information:
Capital Shares
Transactions in capital shares were as follows:
| | | | | | | | | | | | | | | | |
| | | Year Ended
December 31, 2018 | | | Year Ended
December 31, 2017 | |
| | | Shares | | | Value | | | Shares | | | Value | |
Class A | |
Sales | | | 3,985,785 | | | $ | 45,776,677 | | | | 4,720,322 | | | $ | 55,294,938 | |
Reinvestments | | | 3,491,650 | | | | 39,246,145 | | | | 3,980,604 | | | | 46,214,806 | |
Redemptions | | | (19,382,485 | ) | | | (220,545,585 | ) | | | (6,859,130 | ) | | | (80,502,507 | ) |
| | | | | | | | | | | | | | | | |
Net increase (decrease) | | | (11,905,050 | ) | | $ | (135,522,763 | ) | | | 1,841,796 | | | $ | 21,007,237 | |
| | | | | | | | | | | | | | | | |
Class B | |
Sales | | | 3,078,724 | | | $ | 34,969,508 | | | | 2,724,063 | | | $ | 31,769,477 | |
Reinvestments | | | 728,891 | | | | 8,163,581 | | | | 891,893 | | | | 10,310,280 | |
Redemptions | | | (6,716,432 | ) | | | (76,232,741 | ) | | | (4,609,499 | ) | | | (53,754,525 | ) |
| | | | | | | | | | | | | | | | |
Net decrease | | | (2,908,817 | ) | | $ | (33,099,652 | ) | | | (993,543 | ) | | $ | (11,674,768 | ) |
| | | | | | | | | | | | | | | | |
Class E | |
Sales | | | 208,146 | | | $ | 2,379,679 | | | | 108,846 | | | $ | 1,270,561 | |
Reinvestments | | | 42,423 | | | | 475,567 | | | | 52,609 | | | | 608,683 | |
Redemptions | | | (403,406 | ) | | | (4,592,564 | ) | | | (337,676 | ) | | | (3,945,252 | ) |
| | | | | | | | | | | | | | | | |
Net decrease | | | (152,837 | ) | | $ | (1,737,318 | ) | | | (176,221 | ) | | $ | (2,066,008 | ) |
| | | | | | | | | | | | | | | | |
Increase (decrease) derived from capital shares transactions | | | | | | $ | (170,359,733 | ) | | | | | | $ | 7,266,461 | |
| | | | | | | | | | | | | | | | |
| | | | |
| (a) | | Distributions from net investment income and realized gains are no longer required to be separately disclosed. The presentation for the year ended December 31, 2018 has been adjusted for this change (See Note 9). At December 31, 2017 the distributions were from net investment income. |
| (b) | | As part of the update in (a), it is also no longer required to disclose the Undistributed net investment income (Accumulated losses) which was $47,552,814 as of December 31, 2017. |
See accompanying notes to financial statements.
BHFTII-12
Brighthouse Funds Trust II
Western Asset Management U.S. Government Portfolio
Financial Highlights
| | | | | | | | | | | | | | | | | | | | |
| Selected per share data | |
| | | Class A | |
| | | Year Ended December 31, | |
| | | 2018 | | | 2017 | | | 2016 | | | 2015 | | | 2014 | |
Net Asset Value, Beginning of Period | | $ | 11.65 | | | $ | 11.74 | | | $ | 11.90 | | | $ | 12.11 | | | $ | 12.01 | |
| | | | | | | | | | | | | | | | | | | | |
Income (Loss) from Investment Operations | |
Net investment income (a) | | | 0.25 | | | | 0.20 | | | | 0.21 | | | | 0.17 | | | | 0.16 | |
Net realized and unrealized gain (loss) | | | (0.14 | ) | | | 0.03 | | | | (0.05 | ) | | | (0.10 | ) | | | 0.17 | |
| | | | | | | | | | | | | | | | | | | | |
Total income (loss) from investment operations | | | 0.11 | | | | 0.23 | | | | 0.16 | | | | 0.07 | | | | 0.33 | |
| | | | | | | | | | | | | | | | | | | | |
Less Distributions | |
Distributions from net investment income | | | (0.27 | ) | | | (0.32 | ) | | | (0.32 | ) | | | (0.28 | ) | | | (0.23 | ) |
| | | | | | | | | | | | | | | | | | | | |
Total distributions | | | (0.27 | ) | | | (0.32 | ) | | | (0.32 | ) | | | (0.28 | ) | | | (0.23 | ) |
| | | | | | | | | | | | | | | | | | | | |
Net Asset Value, End of Period | | $ | 11.49 | | | $ | 11.65 | | | $ | 11.74 | | | $ | 11.90 | | | $ | 12.11 | |
| | | | | | | | | | | | | | | | | | | | |
Total Return (%) (b) | | | 0.97 | | | | 1.93 | | | | 1.28 | | | | 0.57 | | | | 2.81 | |
|
Ratios/Supplemental Data | |
Gross ratio of expenses to average net assets (%) | | | 0.50 | | | | 0.50 | | | | 0.50 | | | | 0.49 | | | | 0.49 | |
Net ratio of expenses to average net assets (%) (c) | | | 0.49 | | | | 0.48 | | | | 0.48 | | | | 0.48 | | | | 0.48 | |
Ratio of net investment income to average net assets (%) | | | 2.19 | | | | 1.72 | | | | 1.77 | | | | 1.44 | | | | 1.35 | |
Portfolio turnover rate (%) | | | 255 | (d) | | | 208 | (d) | | | 199 | (d) | | | 215 | (d) | | | 194 | (d) |
Net assets, end of period (in millions) | | $ | 1,581.9 | | | $ | 1,742.8 | | | $ | 1,735.3 | | | $ | 1,830.7 | | | $ | 2,263.8 | |
| |
| | | Class B | |
| | | Year Ended December 31, | |
| | | 2018 | | | 2017 | | | 2016 | | | 2015 | | | 2014 | |
Net Asset Value, Beginning of Period | | $ | 11.59 | | | $ | 11.68 | | | $ | 11.84 | | | $ | 12.04 | | | $ | 11.95 | |
| | | | | | | | | | | | | | | | | | | | |
Income (Loss) from Investment Operations | |
Net investment income (a) | | | 0.22 | | | | 0.17 | | | | 0.18 | | | | 0.14 | | | | 0.13 | |
Net realized and unrealized gain (loss) | | | (0.14 | ) | | | 0.03 | | | | (0.05 | ) | | | (0.09 | ) | | | 0.16 | |
| | | | | | | | | | | | | | | | | | | | |
Total income (loss) from investment operations | | | 0.08 | | | | 0.20 | | | | 0.13 | | | | 0.05 | | | | 0.29 | |
| | | | | | | | | | | | | | | | | | | | |
Less Distributions | |
Distributions from net investment income | | | (0.24 | ) | | | (0.29 | ) | | | (0.29 | ) | | | (0.25 | ) | | | (0.20 | ) |
| | | | | | | | | | | | | | | | | | | | |
Total distributions | | | (0.24 | ) | | | (0.29 | ) | | | (0.29 | ) | | | (0.25 | ) | | | (0.20 | ) |
| | | | | | | | | | | | | | | | | | | | |
Net Asset Value, End of Period | | $ | 11.43 | | | $ | 11.59 | | | $ | 11.68 | | | $ | 11.84 | | | $ | 12.04 | |
| | | | | | | | | | | | | | | | | | | | |
Total Return (%) (b) | | | 0.70 | | | | 1.68 | | | | 1.02 | | | | 0.31 | | | | 2.55 | |
|
Ratios/Supplemental Data | |
Gross ratio of expenses to average net assets (%) | | | 0.75 | | | | 0.75 | | | | 0.75 | | | | 0.74 | | | | 0.74 | |
Net ratio of expenses to average net assets (%) (c) | | | 0.74 | | | | 0.73 | | | | 0.73 | | | | 0.73 | | | | 0.73 | |
Ratio of net investment income to average net assets (%) | | | 1.94 | | | | 1.47 | | | | 1.52 | | | | 1.20 | | | | 1.10 | |
Portfolio turnover rate (%) | | | 255 | (d) | | | 208 | (d) | | | 199 | (d) | | | 215 | (d) | | | 194 | (d) |
Net assets, end of period (in millions) | | $ | 378.1 | | | $ | 417.1 | | | $ | 432.1 | | | $ | 463.5 | | | $ | 493.2 | |
Please see following page for Financial Highlights footnote legend.
See accompanying notes to financial statements.
BHFTII-13
Brighthouse Funds Trust II
Western Asset Management U.S. Government Portfolio
Financial Highlights
| | | | | | | | | | | | | | | | | | | | |
| | | Class E | |
| | | Year Ended December 31, | |
| | | 2018 | | | 2017 | | | 2016 | | | 2015 | | | 2014 | |
Net Asset Value, Beginning of Period | | $ | 11.61 | | | $ | 11.70 | | | $ | 11.85 | | | $ | 12.06 | | | $ | 11.97 | |
| | | | | | | | | | | | | | | | | | | | |
Income (Loss) from Investment Operations | |
Net investment income (a) | | | 0.23 | | | | 0.18 | | | | 0.19 | | | | 0.16 | | | | 0.14 | |
Net realized and unrealized gain (loss) | | | (0.14 | ) | | | 0.03 | | | | (0.04 | ) | | | (0.11 | ) | | | 0.16 | |
| | | | | | | | | | | | | | | | | | | | |
Total income (loss) from investment operations | | | 0.09 | | | | 0.21 | | | | 0.15 | | | | 0.05 | | | | 0.30 | |
| | | | | | | | | | | | | | | | | | | | |
Less Distributions | |
Distributions from net investment income | | | (0.25 | ) | | | (0.30 | ) | | | (0.30 | ) | | | (0.26 | ) | | | (0.21 | ) |
| | | | | | | | | | | | | | | | | | | | |
Total distributions | | | (0.25 | ) | | | (0.30 | ) | | | (0.30 | ) | | | (0.26 | ) | | | (0.21 | ) |
| | | | | | | | | | | | | | | | | | | | |
Net Asset Value, End of Period | | $ | 11.45 | | | $ | 11.61 | | | $ | 11.70 | | | $ | 11.85 | | | $ | 12.06 | |
| | | | | | | | | | | | | | | | | | | | |
Total Return (%) (b) | | | 0.80 | | | | 1.77 | | | | 1.20 | | | | 0.40 | | | | 2.56 | |
|
Ratios/Supplemental Data | |
Gross ratio of expenses to average net assets (%) | | | 0.65 | | | | 0.65 | | | | 0.65 | | | | 0.64 | | | | 0.64 | |
Net ratio of expenses to average net assets (%) (c) | | | 0.64 | | | | 0.63 | | | | 0.63 | | | | 0.63 | | | | 0.63 | |
Ratio of net investment income to average net assets (%) | | | 2.04 | | | | 1.57 | | | | 1.62 | | | | 1.30 | | | | 1.20 | |
Portfolio turnover rate (%) | | | 255 | (d) | | | 208 | (d) | | | 199 | (d) | | | 215 | (d) | | | 194 | (d) |
Net assets, end of period (in millions) | | $ | 20.9 | | | $ | 22.9 | | | $ | 25.2 | | | $ | 28.1 | | | $ | 33.0 | |
| | | | |
| (a) | | Per share amounts based on average shares outstanding during the period. |
| (b) | | Total return does not reflect any insurance, sales, separate account or administrative charges of variable annuity or life insurance contracts or any additional expenses that contract owners may bear under their variable contracts. If these charges were included, the returns would be lower. |
| (c) | | Includes the effects of management fee waivers (see Note 6 of the Notes to Financial Statements). |
| (d) | | Includes mortgage dollar roll and TBA transactions; excluding these transactions the portfolio turnover rates would have been 79%, 57%, 86%, 87% and 68% for the years ended December 31, 2018, 2017, 2016, 2015 and 2014, respectively. |
See accompanying notes to financial statements.
BHFTII-14
Brighthouse Funds Trust II
Western Asset Management U.S. Government Portfolio
Notes to Financial Statements—December 31, 2018
1. Organization
Brighthouse Funds Trust II (the “Trust”) is organized as a Delaware statutory trust and registered under the Investment Company Act of 1940, as amended (the “1940 Act”), as anopen-end management investment company. The Trust, which is managed by Brighthouse Investment Advisers, LLC (“Brighthouse Investment Advisers” or the “Adviser”), currently offers twenty-nine series, each of which operates as a distinct investment vehicle of the Trust. The series included in this report is Western Asset Management U.S. Government Portfolio (the “Portfolio”), which is diversified. Shares in the Portfolio are not offered directly to the general public and are currently available only to separate accounts established by life insurance companies affiliated with the Adviser and Metropolitan Life Insurance Company (the “Insurance Companies”).
The Portfolio has registered and offers three classes of shares: Class A, B and E shares. Shares of each Class of the Portfolio represent an equal pro rata interest in the Portfolio and generally give the shareholder the same voting, dividend, liquidation, and other rights. Investment income, realized and unrealized capital gains and losses, the common expenses of the Portfolio, and certain Portfolio-level expense reductions, if any, are allocated on a pro rata basis to each Class based on the relative net assets of each Class to the net assets of the Portfolio. Each Class of shares differs in its respective distribution plan and such distribution expenses are allocated to the corresponding Class of shares.
2. Significant Accounting Policies
The preparation of financial statements in conformity with accounting principles generally accepted in the United States of America (“GAAP”) requires management to make estimates and assumptions that affect the reported amounts of assets and liabilities and disclosure of contingent assets and liabilities as of the date of the financial statements and the reported amounts of income and expenses during the reporting period. Actual results could differ from those estimates. In the preparation of these financial statements, management has evaluated events and transactions subsequent to December 31, 2018 through the date the financial statements were issued.
The Portfolio is an investment company and follows the accounting and reporting guidance of the Financial Accounting Standards Board (“FASB”) Accounting Standards Codification Topic946- Financial Services- Investment Companies. The following is a summary of significant accounting policies consistently followed by the Portfolio in the preparation of its financial statements.
Investment Valuation and Fair Value Measurements - The Portfolio values its portfolio investments for purposes of calculating its net asset value (“NAV”) using procedures approved by the Board of Trustees of the Trust (the “Board” or “Trustees”). Those procedures allow for a variety of methodologies to be used to value the Portfolio’s investments. The specific methodologies used for a particular investment may vary based on the market data available for a specific investment at the time the Portfolio calculates its NAV or based on other considerations. The procedures also permit a level of judgment to be used in the valuation process. The Portfolio follows the accounting and reporting guidance of FASB Accounting Standards Codification Topic820- Fair Value Measurement.
Debt securities, including corporate, convertible and municipal bonds and notes; obligations of the U.S. Treasury and U.S. government agencies; foreign sovereign issues; andnon-U.S. bonds, are generally valued on the basis of evaluated or composite bid quotations obtained from independent pricing services and/or brokers and dealers selected by the Adviser (each a “pricing service”), pursuant to authorization of and subject to general oversight by the Board. Such pricing services may use matrix pricing, which considers observable inputs including, among other things, issuer details, maturity dates, interest rates, yield curves, rates of prepayment, credit risks/spreads, default rates, reported trades, broker-dealer quotes and quoted prices for similar assets. Short-term obligations with a remaining maturity of sixty days or less may be valued at amortized cost in the absence of market quotes, so long as the amortized cost value of such short-term debt instrument is approximately the same as the fair value of the instrument as determined without the use of amortized cost valuation. Floating rate loans are generally valued on the basis of an evaluated or composite average of aggregate bid and ask quotations supplied by brokers or dealers, as obtained from the pricing service. Securities that use similar valuation techniques and inputs as described above are generally categorized as Level 2 within the fair value hierarchy.
Mortgage- and asset-backed securities are generally valued on the basis of evaluated or composite bid quotations obtained from pricing services selected by the Adviser pursuant to the authorization of and subject to general oversight by the Board. These securities are usually issued as separate tranches, or classes, of securities within each deal. The pricing models for these securities usually consider tranche-level attributes, current market data, estimated cash flows and market-based yield spreads for each tranche and incorporate deal collateral performance, as available. Mortgage- and asset-backed securities that use similar valuation techniques and inputs as described above are generally categorized as Level 2 within the fair value hierarchy.
Domestic and foreign equity securities, such as common stock, exchange-traded funds, rights, warrants, and preferred stock, that are traded on a securities exchange on a valuation date are generally valued at their last quoted sale price or official closing price on the primary exchange for such security, or, if no sales occurred on that day, at the last reported bid price. Equity securities tradedover-the-counter (“OTC”) are generally valued at the last reported bid price. In the event of a major exchange closing during the trading day, the Adviser may use other market information obtained from quotation reporting systems, established market makers, or
BHFTII-15
Brighthouse Funds Trust II
Western Asset Management U.S. Government Portfolio
Notes to Financial Statements—December 31, 2018—(Continued)
pricing services in valuing the securities. Valuation adjustments may be applied to certain foreign equity securities that are traded solely on foreign exchanges that close before the time as of which the Portfolio determines its NAV to account for the market movement between the close of the foreign exchanges and the time as of which the Portfolio determines its NAV. The Portfolio may use a systematic fair valuation model provided by a pricing service to value securities principally traded in these foreign markets in order to adjust for possible market movements or other changes that may occur between the close of the foreign exchanges and the time as of which the Portfolio determines its NAV. Foreign equity securities valued using these valuation adjustments are generally categorized as Level 2 within the fair value hierarchy. Equity securities that are actively traded, and have no valuation adjustments applied, are categorized as Level 1 within the fair value hierarchy. Other equity securities traded on inactive markets, or valued in reference to similar instruments traded on active markets, are generally categorized as Level 2 within the fair value hierarchy.
Investments in registeredopen-end management investment companies are valued at reported NAV per share on the valuation date and are categorized as Level 1 within the fair value hierarchy.
Futures contracts that are traded on commodity exchanges are valued at their closing prices as of the close of such exchanges and are categorized as Level 1 within the fair value hierarchy.
If no current market value quotation or other observable inputs are readily available or market value quotations are deemed to be unreliable for an investment, the fair value of the investment will be determined in accordance with procedures approved by, and under the general supervision of, the Board. In such a circumstance, the Board will be assisted in its responsibility to determine the fair value of an investment by the Valuation Committee (“Committee”) of Brighthouse Investment Advisers. The Committee provides general pricing oversight and fair value pricing determinations related to portfolio securities and meets on a regular basis to review reports relating to the valuation of the securities in the Portfolio. The Board has delegated to State Street Bank and Trust Company, the Trust’s custodian (“Custodian”), the responsibility for calculating the NAVs of the Trust’s Portfolios. The Committee is responsible for overseeing the calculation of the NAVs of the Portfolios by the custodian. The Committee also periodically reviews pricing services, including the pricing services providing fair value pricing for the Portfolio’s foreign securities, and is responsible for overseeing the correction of pricing errors and addressing other pricing issues that arise in the ordinary course of business, such as making real-time fair value determinations, as necessary.
No single standard for determining the fair value of an investment can be set forth because fair value depends upon the facts and circumstances with respect to each investment. Information relating to any relevant factors may be obtained by the Committee from any appropriate source, including the subadviser of the Portfolio, the custodian, a pricing service, market maker and/or broker for such security or the issuer. Appropriate methodologies for determining fair value under particular circumstances may include: matrix pricing, a discounted cash flow analysis, comparisons of securities with comparable characteristics, value based on multiples of earnings, discount from market price of similar marketable securities, or a combination of these and other methods.
Investment Transactions and Related Investment Income - Portfolio security transactions are recorded on the trade date. Dividend income is recorded on theex-dividend date or, for certain foreign securities, when notified. Interest income, which includes amortization of premium and accretion of discount on debt securities, is recorded on the accrual basis. Realized gains and losses on investments are determined on the identified cost basis, which is the same basis used for federal income tax purposes. Foreign income and foreign capital gains on some foreign securities may be subject to foreign taxes, which are accrued as applicable. These foreign taxes have been provided for in accordance with the Portfolio’s understanding of the applicable countries’ tax rules and rates.
Foreign Currency Translation- The books and records of the Portfolio are maintained in U.S. dollars. The values of securities, currencies, and other assets and liabilities denominated in currencies other than the U.S. dollar are translated into U.S. dollars based upon foreign exchange rates prevailing at the end of the period. Purchases and sales of investment securities, income, and expenses are translated on the respective dates of such transactions. Because the values of investment securities are translated at the foreign exchange rates prevailing at the end of the period, that portion of the results of operations arising from changes in exchange rates and that portion of the results of operations reflecting fluctuations arising from changes in market prices of the investment securities are not separated. Such fluctuations are included in the net realized and unrealized gain or loss on investments.
Net realized foreign exchange gains or losses arise from activity in forward foreign currency exchange contracts, sales of foreign currency, currency gains or losses realized between the trade and settlement dates on securities transactions, and the difference between the amounts of dividends, interest, and foreign withholding taxes recorded by the Portfolio and the U.S. dollar-equivalent of the amounts actually received or paid by the Portfolio. Net unrealized foreign exchange gains and losses arise from changes in the value of assets and liabilities, other than investment securities, resulting from changes in foreign exchange rates.
Dividends and Distributions to Shareholders- The Portfolio records dividends and distributions on theex-dividend date. Net realized gains from securities transactions (if any) are generally distributed annually to shareholders. The timing and characterization of certain income and capital gains distributions are determined in accordance with federal tax regulations that may differ from GAAP. Permanent book and tax basis differences relating to shareholder distributions will result in reclassification between distributable earnings (accumulated losses) andpaid-in surplus. These adjustments have no impact on net assets or the results of operations.
BHFTII-16
Brighthouse Funds Trust II
Western Asset Management U.S. Government Portfolio
Notes to Financial Statements—December 31, 2018—(Continued)
Income Taxes- It is the Portfolio’s policy to comply with the requirements of the Internal Revenue Code of 1986, as amended, and regulations thereunder, applicable to regulated investment companies, and to distribute, with respect to each taxable year, all of its taxable income to shareholders. Therefore, no federal income tax provision is required. The Portfolio files U.S. federal tax returns. No income tax returns are currently under examination. The Portfolio’s federal tax returns for the prior three fiscal years remain subject to examination by the Internal Revenue Service. As of December 31, 2018, the Portfolio had no uncertain tax positions that would require financial statement recognition, or derecognition or disclosure.
Mortgage Dollar Rolls- The Portfolio may enter into mortgage “dollar rolls” in which a Portfolio sellsto-be-announced (“TBA”) mortgage-backed securities for delivery in the current month and simultaneously contracts to repurchase substantially similar (same type, coupon, and maturity) securities on a specified future date. For the duration of the transaction, or roll period, the Portfolio foregoes principal (including prepayments of principal) and interest paid on the securities sold. Dollar rolls are accounted for as purchase and sale transactions; gain or loss is recognized at the commencement of the term of the dollar roll and each time the mortgage-backed security is rolled.
Mortgage dollar roll transactions involve the risk that the market value of the securities that the Portfolio is required to reacquire may be less than the agreed-upon repurchase price of those securities and that the investment performance of securities purchased with proceeds from these transactions does not exceed the income, capital appreciation and gain or loss that would have been realized on the securities transferred or sold, as applicable, as part of the treasury or mortgage dollar roll.
Mortgage-Related and Other Asset-Backed Securities - The Portfolio may invest in mortgage-related or other asset-backed securities. These securities may include mortgage pass-through securities, collateralized mortgage obligations (“CMOs”), commercial mortgage-backed securities, CMO residuals, stripped mortgage-backed securities (“SMBS”), and other securities that directly or indirectly represent a participation in, or are secured by or payable from, mortgage loans on real property or other receivables. The value of some mortgage- or asset-backed securities may be particularly sensitive to changes in prevailing interest rates. Early repayment of principal on some mortgage-related securities may expose the Portfolio to a lower rate of return upon reinvestment of principal. The value of these securities may fluctuate in response to the market’s perception of the creditworthiness of the issuers. Additionally, although mortgages and mortgage-related securities are generally supported by some form of government or private guarantee and/or insurance, there is no assurance that private guarantors or insurers will meet their obligations.
In one type of SMBS, one class receives all of the interest from the mortgage assets (the interest-only or “IO” class), while the other class will receive all of the principal (the principal-only or “PO” class). Because principal will not be received at the maturity of an IO, adjustments are made to the book value of the security until maturity. These adjustments are netted against payments received for the IOs and the net amount is included in interest income on the Statement of Operations of the Portfolio. Payments received for POs are treated as reductions to the cost and par value of the securities. Details of mortgage-related and other asset-backed securities held by the Portfolio are included in the Portfolio’s Schedule of Investments.
The Portfolio may invest a significant portion of its assets in securities of issuers that hold mortgage- and asset-backed securities and direct investments in securities backed by commercial and residential mortgage loans and other financial assets. The value and related income of these securities are sensitive to changes in economic conditions, including delinquencies and/or defaults, and may be negatively impacted by increased volatility of market prices and periods of illiquidity.
TBA Purchase and Forward Sale Commitments- The Portfolio may enter into TBA commitments to purchase or sell securities for a fixed price at a future date. TBA commitments are considered securities in themselves, and involve a risk of loss if the value of the security to be purchased or sold declines or increases prior to the settlement date, which is in addition to the risk of decline in the value of the Portfolio’s other assets. TBA forward sale commitments are valued at the current market value of the underlying securities, according to the procedures described under “Investment Valuation and Fair Value Measurements”.
When-Issued and Delayed-Delivery Securities- The Portfolio may purchase securities on a when-issued or delayed-delivery basis. Settlement of such transactions will occur beyond the customary settlement period. The Portfolio may purchase securities under such conditions only with the intention of actually acquiring them, but may enter into a separate agreement to sell the securities before the settlement date. Since the value of securities purchased may fluctuate prior to settlement, the Portfolio may be required to pay more at settlement than the security is worth. In addition, the Portfolio is not entitled to any of the interest earned prior to settlement.
Upon making a commitment to purchase a security on a when-issued or delayed-delivery basis, the Portfolio will hold liquid assets in a segregated account with the Portfolio’s Custodian, or set aside liquid assets in the Portfolio’s records, worth at least the equivalent of the amount due. The liquid assets will be monitored on a daily basis and adjusted as necessary to maintain the necessary value.
Repurchase Agreements- The Portfolio may enter into repurchase agreements, under the terms of a Master Repurchase Agreement (“MRA”), with selected commercial banks and broker-dealers, under which the Portfolio acquires securities as collateral and agrees to resell the securities at an agreed-upon time and at an agreed-upon price. The Portfolio, through the Custodian or a subcustodian, under atri-party repurchase agreement, receives delivery of the underlying securities collateralizing any repurchase agreements. It is the Portfolio’s policy that the market value of the collateral be equal to at least 100% of the repurchase price in the case of a
BHFTII-17
Brighthouse Funds Trust II
Western Asset Management U.S. Government Portfolio
Notes to Financial Statements—December 31, 2018—(Continued)
repurchase agreement ofone-day duration and equal to at least 102% of the repurchase price in the case of all other repurchase agreements. In the event of default or failure by a party to perform an obligation in connection with any repurchase transaction, the MRA gives thenon-defaulting party the right toset-off claims and to apply property held by it in connection with any repurchase transaction against obligations owed to it.
At December 31, 2018, the Portfolio had direct investments in repurchase agreements with a gross value of $12,684,632. Additionally, the Portfolio invested cash collateral for loans of portfolio securities in repurchase agreements with a gross value of $14,996,285. The combined value of all repurchase agreements is included as part of investments at value on the Statement of Assets and Liabilities. The value of the related collateral exceeded the value of the repurchase agreements at December 31, 2018.
Securities Lending - The Portfolio may lend its portfolio securities to certain qualified brokers who borrow securities in order to complete certain securities transactions. By lending its portfolio securities, the Portfolio attempts to increase its net investment income through the receipt of income on collateral held from securities on loan. Any gain or loss in the market price of the loaned securities that might occur and any interest earned or dividends declared during the term of the loan would accrue to the account of the Portfolio.
The Trust has entered into aNon-Custodial Securities Lending Agreement with JPMorgan Chase Bank, N.A. (the “Lending Agent”). Under the agreement, the Lending Agent is authorized to loan portfolio securities on the Portfolio’s behalf. In exchange, the Portfolio receives either cash or U.S. government securities as collateral against the loaned securities. The Portfolio receives collateral equal to at least 102% of the market value for loans secured by government securities or cash in the same currency as the loaned shares and 105% for all other loaned securities at each loan’s inception. Collateral representing at least 100% of the market value of the loaned securities is maintained for the duration of the loan. Any cash collateral received by the Portfolio is generally invested by the Lending Agent in short-term investments, which may include certificates of deposit, commercial paper, repurchase agreements, time deposits, master demand notes and money market funds. The market value of investments made with cash collateral received are disclosed in the Schedule of Investments and the valuation techniques are described in Note 2. If the market value of the collateral at the close of trading on a business day is less than 100% of the market value of the loaned securities at the close of trading on that day, the borrower is required to deliver, by the close of business on the following business day, an additional amount of collateral, so that the total amount of posted collateral is equal to at least 100% of the market value of all the loaned securities as of such preceding day. A portion of the income earned on the collateral is rebated to the borrower of the securities and the remainder is split between the Lending Agent and the Portfolio. On loans collateralized by U.S. government securities, a fee is received from the borrower and is allocated between the Portfolio and the Lending Agent.
Income received by the Portfolio in securities lending transactions during the year ended December 31, 2018 is reflected as securities lending income on the Statement of Operations. The values of any securities loaned by the Portfolio and the related collateral at December 31, 2018 are disclosed in the footnotes to the Schedule of Investments. The value of the related collateral received by the Portfolio exceeded the value of the securities out on loan at December 31, 2018.
The risks associated with lending portfolio securities include, but are not limited to, possible delays in receiving additional collateral or in the recovery of the loaned securities, possible loss of rights in the collateral should the borrower fail financially, as well as risk of loss in the value of the collateral or the value of the investments made with the collateral. The Lending Agent shall indemnify the Portfolio in the case of default of any securities borrower, subject to the terms of theNon-Custodial Securities Lending Agreement.
The following table provides a breakdown of transactions accounted for as secured borrowings, the gross obligations by the type of collateral pledged, and the remaining contractual maturities of those transactions.
| | | | | | | | | | | | | | | | | | | | |
| | | Remaining Contractual Maturity of the Agreements
As of December 31, 2018 | |
| | | Overnight and
Continuous | | | Up to
30 Days | | | 31 - 90
Days | | | Greater than
90 days | | | Total | |
| Securities Lending Transactions | |
Foreign Government | | $ | (9,377,810 | ) | | $ | — | | | $ | — | | | $ | — | | | $ | (9,377,810 | ) |
U.S. Treasury & Government Agencies | | | (5,618,475 | ) | | | — | | | | — | | | | — | | | | (5,618,475 | ) |
Total | | $ | (14,996,285 | ) | | $ | — | | | $ | — | | | $ | — | | | $ | (14,996,285 | ) |
Total Borrowings | | $ | (14,996,285 | ) | | $ | — | | | $ | — | | | $ | — | | | $ | (14,996,285 | ) |
Gross amount of recognized liabilities for securities lending transactions | | | $ | (14,996,285 | ) |
| | | | | | | | | | | | | | | | | | | | |
BHFTII-18
Brighthouse Funds Trust II
Western Asset Management U.S. Government Portfolio
Notes to Financial Statements—December 31, 2018—(Continued)
3. Investments in Derivative Instruments
Futures Contracts -The Portfolio may buy and sell futures contracts as a hedge, to maintain investment exposure to a target asset class or to enhance return. The Portfolio may be subject to fluctuations in equity prices, interest rates, commodity prices, and foreign currency exchange rates in the normal course of pursuing its investment objective. Futures contracts are standardized agreements to buy or sell a security, or deliver a final cash settlement price in connection with an index, interest rate, currency, or other asset. The Portfolio must deposit an amount (“initial margin”) equal to a certain percentage of the face value of the futures contract. The initial margin may be in the form of cash or securities, which is returned when the Portfolio’s obligations under the contract have been satisfied. If cash is deposited as the initial margin, it is shown as cash collateral on the Statement of Assets and Liabilities. Futures contracts aremarked-to-market daily and subsequent payments (“variation margin”) are made or received by the Portfolio depending on whether unrealized gains or losses are incurred. These amounts are reflected as receivables or payables on the Statement of Assets and Liabilities and as a component of net change in unrealized appreciation/depreciation on the Statement of Operations. When the contract is closed or expires, the Portfolio records a realized gain or loss equal to the difference between the value of the contract at the time it was opened and the value at the time it was closed. Risks of entering into futures contracts (and related options) include the possibility that the market for these instruments may be illiquid and that a change in the value of the contract or option may not correlate perfectly with changes in the value of the underlying instrument. If futures contracts areexchange-traded, the exchange’s clearinghouse, as counterparty to all exchange-traded futures, guarantees the futures contracts against default. For OTC futures, the Portfolio’s ability to terminate the positions may be more limited than in the case of exchange-traded positions and may also involve the risk that securities dealers participating in such transactions would fail to meet their obligations to the Portfolio.
The following table summarizes the fair value of derivatives held by the Portfolio at December 31, 2018 by category of risk exposure:
| | | | | | |
| | | Liability Derivatives | |
Risk Exposure | | Statement of Assets &
Liabilities Location | | Fair Value | |
Interest Rate | | Unrealized depreciation on futures contracts (a) | | $ | 3,613,981 | |
| | | | | | |
| | | | |
| (a) | | Includes cumulative appreciation/depreciation of futures contracts as reported in the Schedule of Investments. Only the current day’s variation margin is reported within the Statement of Assets and Liabilities. |
The following tables summarize the effect of derivative instruments on the Statement of Operations, classified by derivative type and category of risk exposure, for the year ended December 31, 2018:
| | | | |
Statement of Operations Location—Net Realized Gain (Loss) | | Interest Rate | |
Futures contracts | | $ | 7,732,383 | |
| | | | |
| |
Statement of Operations Location—Net Change in Unrealized Appreciation (Depreciation) | | Interest Rate | |
Futures contracts | | $ | (3,737,685 | ) |
| | | | |
For the year ended December 31, 2018, the average notional par or face amount outstanding for each derivative type was as follows:
| | | | |
Derivative Description | | Average
Notional Par or
Face Amount‡ | |
Futures contracts long | | $ | 336,500,000 | |
Futures contracts short | | | (259,675,000 | ) |
| | | | |
| ‡ | | Averages are based on activity levels during the period for which the amounts are outstanding. |
4. Certain Risks
In the normal course of business, the Portfolio invests in securities and enters into transactions where risks exist. Those risks include:
Market Risk:The value of securities held by the Portfolio may decline in response to certain events, including those directly involving the issuers whose securities are owned by the Portfolio; conditions affecting the general economy; overall market changes; local, regional or global political, social or economic instability; and currency, interest rate, and price fluctuations.
Credit and Counterparty Risk: The Portfolio may be exposed to counterparty risk, or the risk that an entity with which the Portfolio has unsettled or open transactions may default. The potential loss could exceed the value of the financial assets and liabilities recorded in the financial statements. Financial assets that potentially expose the Portfolio to credit and counterparty risk consist principally of cash due from counterparties and investments. The Portfolio manages counterparty risk by entering into agreements
BHFTII-19
Brighthouse Funds Trust II
Western Asset Management U.S. Government Portfolio
Notes to Financial Statements—December 31, 2018—(Continued)
only with counterparties that it believes have the financial resources to honor their obligations and by monitoring the financial stability of those counterparties. The Adviser attempts to mitigate counterparty risk by (i) periodically assessing the creditworthiness of its trading partners, (ii) monitoring and/or limiting the amount of its net exposure to each individual counterparty based on its assessment, and (iii) requiring collateral from the counterparty for certain transactions. In order to preserve certain safeguards fornon-standard settlement trades, the Portfolio restricts its exposure to credit and counterparty losses by entering into master netting agreements (“Master Agreements”) with counterparties (approved brokers) with whom it undertakes a significant volume of transactions. Master Agreements govern the terms of certain transactions, and reduce the counterparty risk associated with relevant transactions by specifying credit protection mechanisms and providing standardization that improves legal certainty. Master Agreements can also help limit counterparty risk by specifying collateral posting arrangements atpre-arranged exposure levels.
Repurchase and reverse repurchase agreements are primarily executed under Global Master Repurchase Agreements (“GMRAs”) or Master Repurchase Agreements (“MRAs”), which provide the rights toset-off. Each repurchase and reverse repurchase agreement is initially collateralized at the transaction level. In the event of default, the total market value exposure will be offset against collateral exchanged to date, which would result in a net receivable/(payable) that would be due from/to the counterparty.
Master Securities Forward Transaction Agreements (“MSFTA”) govern the considerations and factors surrounding the settlement of certain forward settling transactions, such as TBA securities and delayed-delivery or secured borrowings transactions by and between the Portfolio and select counterparties. The MSFTA maintain provisions for, among other things, initiation and confirmation, payment and transfer, events of default, termination, and maintenance of collateral.
Customer Account Agreements and related addenda govern cleared derivatives transactions such as futures, options on futures, and cleared OTC derivatives. Cleared derivative transactions require posting of initial margin as determined by each relevant clearing agency, which is segregated at a broker account registered with the Commodities Futures Trading Commission (“CFTC”), or the applicable regulator. In the U.S., counterparty risk is significantly reduced as creditors of the futures broker do not have claim to portfolio assets in the segregated account. Additionally, portability of exposure in the event of default further reduces risk to the Portfolio. Variation margin, or changes in market value, are exchanged daily, but may not be netted between futures and cleared OTC derivatives.
Additional risks associated with each type of investment are described above within the respective security type notes. The Portfolio’s prospectus includes a discussion of the principal risks of investing in the Portfolio.
5. Investment Transactions
Aggregate cost of purchases and proceeds of sales of investment securities, including mortgage dollar roll and TBA transactions but excluding short-term securities, for the year ended December 31, 2018 were as follows:
| | | | | | | | | | | | |
Purchases | | | Sales | |
U.S. Government | | Non-U.S. Government | | | U.S. Government | | | Non-U.S. Government | |
| $5,794,315,095 | | $ | 171,982,601 | | | $ | 5,926,092,374 | | | $ | 203,593,167 | |
Purchases and sales of mortgage dollar rolls and TBA transactions for the year ended December 31, 2018 were as follows:
| | | | |
Purchases | | Sales | |
| $4,345,922,659 | | $ | 4,354,802,282 | |
6. Investment Management Fees and Other Transactions with Affiliates
Investment Management Agreement -Brighthouse Investment Advisers is the investment adviser to the Portfolio. The Trust has entered into an investment management agreement with Brighthouse Investment Advisers with respect to the Portfolio. For providing investment management services to the Portfolio, Brighthouse Investment Advisers receives monthly compensation at the following annual rates:
| | | | | | |
Management
Fees earned by
Brighthouse Investment Advisers
for the year ended
December 31, 2018 | | % per annum | | | Average Daily Net Assets |
| $9,949,483 | | | 0.550 | % | | Of the first $500 million |
| | | 0.450 | % | | On amounts in excess of $500 million |
BHFTII-20
Brighthouse Funds Trust II
Western Asset Management U.S. Government Portfolio
Notes to Financial Statements—December 31, 2018—(Continued)
Brighthouse Investment Advisers has entered into an investment subadvisory agreement with respect to managing the Portfolio. Western Asset Management Company (the “Subadviser”) is compensated by Brighthouse Investment Advisers to provide subadvisory services for the Portfolio.
Management Fee Waiver - Pursuant to a management fee waiver agreement, Brighthouse Investment Advisers has agreed, for the period April 30, 2018 to April 30, 2019, to reduce its advisory fees set out above under “Investment Management Agreement” for each class of the Portfolio as follows:
| | |
% per annum | | Average Daily Net Assets |
| 0.050% | | On amounts over $200 million and under $500 million |
| 0.010% | | On amounts over $1 billion and under $2 billion |
| 0.020% | | On amounts in excess of $2 billion |
An identical agreement was in place for the period May 1, 2017 to April 30, 2018. Amounts waived for the year ended December 31, 2018 are shown as a management fee waiver in the Statement of Operations.
Certain officers and trustees of the Trust may also be officers of Brighthouse Investment Advisers; however, such officers and trustees receive no compensation from the Trust.
Transfer Agency Agreement -Brighthouse Financial, Inc. serves as the transfer agent for the Trust. Brighthouse Financial, Inc. receives no fees for its services to the Trust.
Distribution and Service Fees - The Trust has a distribution agreement with Brighthouse Securities, LLC (the “Distributor”) pursuant to which the Distributor serves as the general distributor of shares of each class (each a “Class”) of each Portfolio. The Distributor is an affiliate of the Trust. The Trust has adopted a Distribution and Services Plan (the “Plan”) relating to Class B and Class E shares of each Portfolio, under Rule 12b-1 under the 1940 Act, pursuant to which the Trust may pay the Distributor a fee (the “Service Fee”) at an annual rate not to exceed 0.25% of each such Portfolio’s average daily net assets attributable to the Class B and Class E shares of the Trust. Each Portfolio may not offer shares of each Class. The Plan also authorizes the Trust, on behalf of each of its Portfolios, may pay the Distributor a distribution Fee (the “Distribution Fee” and together with the Service Fee, the “Fees”) at an annual rate of up to 0.25% of each Portfolio’s average daily net assets attributable to the Class B and Class E shares in consideration of the services rendered in connection with the sale of such shares by the Distributor. Under the Distribution Agreement with respect to the Trust, Fees are currently paid at an annual rate of 0.25% of average daily net assets in the case of Class B shares and 0.15% of average daily net assets in the case of Class E shares. The Plan is known as a “compensation plan” because the Trust makes payments to the Distributor for services rendered regardless of the actual level of expenditures by the Distributor. Amounts incurred by the Portfolio for the year ended December 31, 2018 are shown as Distribution and service fees in the Statement of Operations.
Deferred Trustee Compensation -Each Trustee who is not currently an employee of the Adviser or any of its affiliates receives compensation from the Trust for his or her service to the Trust. A deferred compensation plan (the “Plan”) is available to the Trustees on a voluntary basis. Deferred amounts remain in the Trust until distributed in accordance with the provisions of the Plan. The value of a participating Trustee’s deferral account is based on theoretical investments of deferred amounts on the normal payment dates in certain portfolios of the Trust or Brighthouse Funds Trust I, an affiliate of the Trust, as designated by the participating Trustee. Changes in the value of participants’ deferral accounts are reflected as Trustees’ fees and expenses in the Statement of Operations. The portion of the accrued obligations allocated to the Portfolio under the Plan is reflected as Deferred trustees’ fees in the Statement of Assets and Liabilities.
7. Contractual Obligations
Under the Trust’s organizational documents, its officers and Trustees may be indemnified against certain liabilities and expenses arising out of the performance of their duties to the Trust. Additionally, the Trust has a variety of indemnification obligations under contracts with its service providers. The Trust’s maximum exposure under these arrangements is unknown, as this would involve future claims that may be made against the Trust that have not yet occurred.
8. Income Tax Information
The cost basis of investments for federal income tax purposes at December 31, 2018 was as follows:
| | | | |
Cost basis of investments | | $ | 2,280,238,474 | |
Gross unrealized appreciation | | | 11,844,830 | |
Gross unrealized depreciation | | | (42,806,710 | ) |
| | | | |
Net unrealized appreciation (depreciation) | | $ | (30,961,880 | ) |
| | | | |
BHFTII-21
Brighthouse Funds Trust II
Western Asset Management U.S. Government Portfolio
Notes to Financial Statements—December 31, 2018—(Continued)
The tax character of distributions paid for the years ended December 31, 2018 and 2017 were as follows:
| | | | | | | | | | | | | | | | | | | | |
Ordinary Income | | | Long-Term Capital Gain | | | Total | |
2018 | | 2017 | | | 2018 | | | 2017 | | | 2018 | | | 2017 | |
| $47,885,293 | | $ | 57,133,769 | | | $ | — | | | $ | — | | | $ | 47,885,293 | | | $ | 57,133,769 | |
As of December 31, 2018, the components of distributable earnings (accumulated losses) on a federal income tax basis were as follows:
| | | | | | | | | | | | | | | | |
Undistributed
Ordinary
Income | | Undistributed
Long-Term
Capital Gain | | | Net
Unrealized
Depreciation | | | Accumulated
Capital Losses | | | Total | |
| $52,510,375 | | $ | — | | | $ | (30,961,880 | ) | | $ | (124,652,705 | ) | | $ | (103,104,210 | ) |
The Portfolio utilizes the provisions of the federal income tax laws that provide for the carryforward of capital losses for prior years, offsetting such losses against any future realized capital gains. Under the Regulated Investment Company Modernization Act of 2010, net capital losses recognized after December 22, 2010 may be carried forward indefinitely and their character is retained as short-term and/or long-term losses.
As of December 31, 2018, the Portfolio had short-term accumulated capital losses in the amount of $14,124,177 and long-term accumulated capital losses in the amount of $110,528,528.
9. Recent Accounting Pronouncements and SEC Update
In March 2017, FASB issued Accounting Standards UpdateNo. 2017-08 “Premium Amortization of Purchased Callable Debt Securities”, which amends the amortization period for certain purchased callable debt securities. Under the standards update, the premium amortization of purchased callable debt securities that have explicit,non-contingent call features and are callable at fixed prices will be amortized to the earliest call date. The guidance will be applied on a modified retrospective basis and is effective for fiscal years, and their interim periods, beginning after December 15, 2018. Management is currently assessing the impact of ASU 2017-08, but does not believe the adoption will have a material impact on the Portfolios’ financial statements.
In August 2018, the FASB issued Accounting Standards Update2018-13, Fair Value Measurement (Topic 820)—Disclosure Framework—Changes to the Disclosure Requirements for Fair Value Measurement (“ASU2018-13”) which introduces new fair value disclosure requirements as well as eliminates and modifies certain existing fair value disclosure requirements. ASU2018-13 is effective for fiscal years beginning after December 15, 2019, and interim periods within those fiscal years. Early adoption is permitted and, as such, management has elected to early adopt ASU2018-13 effective with the current reporting period. The impact of the Portfolio’s adoption was limited to changes in the Portfolio’s financial statement disclosures regarding fair value, primarily those disclosures related to transfers between levels of the fair value hierarchy.
In August 2018, the Securities and Exchange Commission released its Final Rule on Disclosure Update and Simplification (the “Final Rule”) which is intended to simplify an issuer’s disclosure compliance efforts by removing redundant or outdated disclosures requirements without significantly altering the mix of information provided to investors. Effective with the current reporting period, the Portfolio adopted the Final Rule with the most notable impacts being that the Portfolio is no longer required to present the components of distributable earnings on the Statement of Assets and Liabilities or the sources of distributions to shareholders and the amounts of undistributed net investment income on the Statements of Changes in Net Assets.
BHFTII-22
Brighthouse Funds Trust II
Western Asset Management U.S. Government Portfolio
Report of Independent Registered Public Accounting Firm
To the Shareholders of Western Asset Management U.S. Government Portfolio and the Board of Trustees of Brighthouse Funds Trust II:
Opinion on the Financial Statements and Financial Highlights
We have audited the accompanying statement of assets and liabilities, including the schedule of investments, of the Western Asset Management U.S. Government Portfolio (the “Portfolio”), one of the portfolios constituting the Brighthouse Funds Trust II, as of December 31, 2018, the related statement of operations for the year then ended, the statements of changes in net assets for each of the two years in the period then ended, the financial highlights for each of the five years in the period then ended, and the related notes. In our opinion, the financial statements and financial highlights present fairly, in all material respects, the financial position of the Western Asset Management U.S. Government Portfolio of the Brighthouse Funds Trust II as of December 31, 2018, the results of its operations the year then ended, the changes in its net assets for each of the two years in the period then ended, and the financial highlights for each of the five years in the period then ended, in conformity with accounting principles generally accepted in the United States of America.
Basis for Opinion
These financial statements and financial highlights are the responsibility of the Portfolio’s management. Our responsibility is to express an opinion on the Portfolio’s financial statements and financial highlights based on our audits. We are a public accounting firm registered with the Public Company Accounting Oversight Board (United States) (PCAOB) and are required to be independent with respect to the Portfolio in accordance with the U.S. federal securities laws and the applicable rules and regulations of the Securities and Exchange Commission and the PCAOB.
We conducted our audits in accordance with the standards of the PCAOB. Those standards require that we plan and perform the audit to obtain reasonable assurance about whether the financial statements and financial highlights are free of material misstatement, whether due to error or fraud. The Portfolio is not required to have, nor were we engaged to perform, an audit of its internal control over financial reporting. As part of our audits we are required to obtain an understanding of internal control over financial reporting but not for the purpose of expressing an opinion on the effectiveness of the Portfolio’s internal control over financial reporting. Accordingly, we express no such opinion.
Our audits included performing procedures to assess the risks of material misstatement of the financial statements and financial highlights, whether due to error or fraud, and performing procedures that respond to those risks. Such procedures included examining, on a test basis, evidence regarding the amounts and disclosures in the financial statements and financial highlights. Our audits also included evaluating the accounting principles used and significant estimates made by management, as well as evaluating the overall presentation of the financial statements and financial highlights. Our procedures included confirmation of securities owned as of December 31, 2018, by correspondence with the custodian and brokers; when replies were not received from brokers, we performed other auditing procedures. We believe that our audits provide a reasonable basis for our opinion.
/s/ Deloitte & Touche LLP
Boston, Massachusetts
February 25, 2019
We have served as the auditor of one or more of the Brighthouse investment companies since 1983.
BHFTII-23
Brighthouse Funds Trust II
Trustees and Officers
MANAGEMENT OF THE TRUSTS
The Boards of Trustees (the “Board”) of Brighthouse Funds Trust I and Brighthouse Funds Trust II (“BHF I” and “BHF II”, respectively, and collectively the “Trusts”) supervise the Trusts and are responsible for representing the interests of shareholders. The Trustees, the Chairman of the Board and the Chairmen of each subcommittee are the same for both Trusts. The Trustees of each Trust meet periodically throughout the year to oversee the Portfolios’ activities, reviewing, among other things, each Portfolio’s performance and its contractual arrangements with various service providers. The Trustees of each Trust elect the officers of the Trust, who are responsible for administering the Trust’sday-to-day operations.
Trustees and Officers
The Trustees and executive officers of the Trusts, as well as their principal occupations during the past five years, are set forth below. Unless otherwise indicated, the business address of each is c/o Brighthouse Funds, One Financial Center, Boston, Massachusetts 02111. Each Trustee who is deemed an “interested person,” as such term is defined in the 1940 Act, is referred to as an “Interested Trustee.” Those Trustees who are not “interested persons,” as such term is defined in the 1940 Act, are referred to as “Independent Trustees.” There is no limit to the term a Trustee may serve. Trustees serve until their death, resignation or removal in accordance with the BHF I Trust’s and BHF II Trust’s respective organizational documents and policies adopted by the Boards of the respective Trusts from time to time. Officers hold office at the pleasure of each Board and serve until their removal or resignation in accordance with the Trusts’ respective organizational documents and policies adopted by the Board of each Trust from time to time.
| | | | | | | | | | |
Name and Year of Birth | | Current
Position(s)
Held with
Registrant | | Term of Office
and Length of
Time Served | | Principal Occupation(s) During the Past
5 Years(1) | | Number of
Portfolios
in Brighthouse
Funds
Complex(2)
Overseen
by Trustee | | Other Directorships Held
by Trustee During the
Past 5 Years(1) |
| Interested Trustee |
John Rosenthal* (1960) | | Trustee | | Indefinite; From
May 2016
(Trust I and
Trust II) to present | | Chief Investment Officer, Brighthouse Financial, Inc. (2017 to present); until 2017, Senior Managing Director and Head of Global Portfolio Management, MetLife, Inc. | | 72 | | None |
|
| Independent Trustees |
Dawn M. Vroegop (1966) | | Trustee and Chairman of the Board | | Indefinite; From
December 2000
(Trust I)/May
2009 (Trust II) to
present as
Trustee; From
May 2016 (Trust
I and Trust II)
until present as
Chairman | | Private Investor. | | 72 | | Trustee, Driehaus Mutual Funds.** |
| | | | | |
Stephen M. Alderman (1959) | | Trustee | | Indefinite; From
December 2000
(Trust I)/April
2012 (Trust II) to
present | | Shareholder in the law firm of Garfield and Merel, Ltd. | | 72 | | None |
| | | | | |
Robert J. Boulware (1956) | | Trustee | | Indefinite; From
March 2008
(Trust I)/April
2012 (Trust II) to
present | | Managing Director, Pilgrim Funds, LLC (private equity fund). | | 72 | | Trustee, Vertical Capital Income Fund(closed-end fund);** Director, Gainsco, Inc. (auto insurance);** Trustee, SharesPost 100 Fund(closed-end fund).** |
| | | | | |
Susan C. Gause (1952) | | Trustee | | Indefinite; From
March 2008
(Trust I)/April
2012 (Trust II) to
present | | Private Investor. | | 72 | | Trustee, HSBC Funds.** |
BHFTII-24
Brighthouse Funds Trust II
Trustees and Officers—(Continued)
| | | | | | | | | | |
Name and Year of Birth | | Current
Position(s)
Held with
Registrant | | Term of Office
and Length of
Time Served | | Principal Occupation(s) During the Past
5 Years(1) | | Number of
Portfolios
in Brighthouse
Funds
Complex(2)
Overseen
by Trustee | | Other Directorships Held
by Trustee During the
Past 5 Years(1) |
Nancy Hawthorne (1951) | | Trustee | | Indefinite; From
May 2003
(Trust II)/April
2012 (Trust I)
to present | | Partner, Hawthorne Financial Advisors, LLC (registered investment advisor); until 2014, Chief Executive Officer, Clerestory LLC (corporate advisor). | | 72 | | Director and Chairman of the Board of Directors, THL Credit, Inc.;** Director and Chairman of the Board, Avid Technology, Inc.;** Director, CRA International, Inc.** |
| | | | | |
Barbara A. Nugent (1956) | | Trustee | | Indefinite; From
January 2014
(Trust I and
Trust II) to
present | | President, True North Board Governance, LLC (consulting); until December 2013, partner in the law firm of Stradley Ronon Stevens & Young, LLP. | | 72 | | Independent Lead Trustee, BMT Investment Funds** |
| | | | | |
Christopher J. Towle (1957) | | Trustee | | Indefinite; From
April 2018
(Trust I and
Trust II) to
present | | Retired; until 2014, Partner, Portfolio Manager, Director of High Yield and Convertible Strategies, Lord Abbett & Co. | | 72 | | Trustee, Driehaus Mutual Funds** |
Officers
| | | | | | |
Name and Year of Birth | | Position(s)
Held with
Registrant | | Length of
Time Served | | Principal Occupation(s)
During the Past 5 Years(1) |
| Executive Officers | | | | | | |
Kristi Slavin (1973) | | President and Chief Executive Officer, of Trust I and Trust II | | From May
2016
(Trust I and
Trust II) to
present | | President, Brighthouse Investment Advisers, LLC (2016-present); formerly, Senior Vice President, MetLife Advisers, LLC; Vice President, MetLife, Inc.; Vice President, Trust I and Trust II(2015-2016). |
| | | |
Alan R. Otis (1971) | | Chief Financial Officer and Treasurer, of Trust I and Trust II | | From
November
2017
(Trust I and
Trust II) to
present | | Senior Vice President, Brighthouse Investment Advisers, LLC (2017-present); formerly, Vice President, Brighthouse Investment Advisers, LLC (2012-2017); Assistant Treasurer, Trust I and Trust II (2012-2017). |
| | | |
Andrew L. Gangolf (1954) | | Secretary, of Trust I and Trust II | | From May
2011
(Trust I and
Trust II) to
present | | Executive Vice President, Brighthouse Investment Advisers, LLC (2017-present); formerly, Senior Vice President, MetLife Advisers, LLC (2011-2017); until 2011, Senior Vice President & Assistant General Counsel, AllianceBernstein Investments, Inc. |
| | | |
Steven E. Hartstein (1963) | | Chief Compliance Officer (“CCO”), of Trust I and Trust II | | From
February
2014
(Trust I and
Trust II) to
present | | Senior Vice President and CCO, Brighthouse Investment Advisers, LLC (2017-present); Head of Investments Compliance, Vice President, Brighthouse Financial, Inc. (2017-present); formerly, Vice President, MetLife, Inc. (2013-2017); Senior Vice President and CCO, MetLife Advisers, LLC (2013-2017.) |
| | | |
Victor Soto (1978) | | Vice President of Trust I and Trust II | | From May
2018
(Trust I and
Trust II) to
present | | Executive Vice President, Brighthouse Investment Advisers, LLC (2016-present); Assistant Vice President, MetLife Inc. (2015-2017); Portfolio Manager, 1st Global (2013-2015). |
| * | Mr. Rosenthal is an “interested person” of the Trusts because of his position with Brighthouse Financial, Inc., the current parent company of Brighthouse Investment Advisers, LLC. |
| ** | Indicates a directorship with a registered investment company or a company subject to the reporting requirements of the Securities Exchange Act of 1934, as amended. |
| (1) | Previous positions during the past five years with the Trusts, Brighthouse Financial, Inc., MetLife, Inc. or the Manager are omitted if not materially different. |
| (2) | The Fund Complex includes 43 BHF I Portfolios and 29 BHF II Portfolios. |
BHFTII-25
Brighthouse Funds Trust II
Western Asset Management U.S. Government Portfolio
Board of Trustees’ Consideration of Advisory and Sub-Advisory Agreements
At anin-person meeting held on November6-8, 2018 (the “November Meeting”), the Boards of Trustees (the “Board”) of Brighthouse Funds Trust I and Brighthouse Funds Trust II (“BFT I” and “BFT II,” respectively, and collectively, the “Trusts”), including a majority of the Trustees who are not “interested persons” of the Trusts (the “Independent Trustees”) under the Investment Company Act of 1940 (the “1940 Act”), approved the continuation of the Trusts’ advisory agreements (each, an “Advisory Agreement”) with Brighthouse Investment Advisers, LLC (the “Adviser”) and the applicablesub-advisory agreements (each a “Sub-Advisory Agreement,” and collectively with the Advisory Agreement, the “Agreements”) between the Adviser and the investmentsub-advisers (each a “Sub-Adviser,” and collectively, the “Sub-Advisers”) for the series of the Trusts (each a “Portfolio,” and collectively, the “Portfolios”).
In making those approvals, the Board reviewed a variety of materials that were provided for the specific purpose of the annual contract renewal process. In addition, various materials provided to and discussed with the Board throughout the year informed the Board’s decision to renew the Agreements. In particular, the information for each Portfolio included, but was not limited to, investment performance reports, and reports on expenses, legal and compliance matters, asset pricing, brokerage commissions and trade execution.
The Board met in person with personnel of the Adviser on October 17, 2018 for the specific purpose of giving preliminary consideration to the proposed continuation of the Agreements (the “October Meeting”). At that meeting, the Adviser reviewed with the Board the performance and fees experienced by each Portfolio, as well as other information. During and after the October Meeting, the Independent Trustees communicatedfollow-up matters for management to address at the November Meeting. The Independent Trustees were advised by independent legal counsel throughout the contract renewal process, and met with independent legal counsel in several executive sessions outside of the presence of management.
Information furnished and reviewed specifically in connection with the renewal process included, but was not limited to, a report for each Portfolio that was prepared by Broadridge (“Broadridge”), an independent organization. In addition, the Independent Trustees reviewed a report that was prepared by JDL Consultants, LLC (“JDL”), an independent consultant to the Independent Trustees (“JDL Report”), which examined the comparative fees, expenses and performance of each Portfolio, based upon the Broadridge reports. Also, the Board reviewed the responses to wide-ranging questions from the Independent Trustees relating to the business, operations and performance of the Adviser and theSub-Advisers that the Adviser andSub-Advisers had prepared specifically for the renewal process, and reviewed aPortfolio-by-Portfolio analysis of the profitability to the Adviser of each Advisory Agreement, which was prepared by the Adviser for the renewal process.
At the November Meeting, the Board, including a majority of the Independent Trustees, concluded that the nature, extent and quality of services provided by the Adviser and eachSub-Adviser supported the renewal of the Agreements. The Board also concluded that the investment performance of each Portfolio was such that each Agreement should continue, and that the fees paid by each Portfolio to the Adviser appeared to be reasonable in light of the nature, extent and quality of the services provided by the Adviser andSub-Adviser. Further, the Board concluded that the Adviser’s profitability in providing services under the Advisory Agreements did not appear unreasonable in light of the nature, extent and quality of the services provided by the Adviser. Finally, the Board reviewed the extent to which the investment advisory fees paid by the Portfolios shared economies of scale with investors or entailed the potential to share economies of scale with investors and concluded that those considerations generally supported the renewal of each Agreement. In approving the renewal of each of the Agreements, the Board, including the Independent Trustees, gave attention to all of the information that was furnished and each Trustee placed varying degrees of importance on the various pieces of information that were provided to them. The Board evaluated the information available to it on aPortfolio-by-Portfolio basis, and its decision was made separately with respect to each Portfolio. The following paragraphs provide more information about some of the primary factors that were relevant to the Board’s decision. The Board did not identify any single factor as determinative, and the Trustees generally attributed different weights to various factors for the various Portfolios.
Nature, extent and quality of services. The Board evaluated the nature, extent and quality of the services that the Adviser and theSub-Advisers, as relevant, have provided to the Portfolios. The Board considered the Adviser’s services as investment manager to the Portfolios, including its services relating to the hiring and oversight of theSub-Advisers, trading practices and oversight of transition management (as applicable), compliance programs and personnel, and risk management, among other things. The Adviser’s services in coordinating and overseeing the activities of the Trusts’ other service providers were also considered. The Board considered information received from the Trusts’ Chief Compliance Officer (“CCO”) regarding the Portfolios’ compliance policies and procedures that were established pursuant to Rule38a-l under the 1940 Act. The Board also noted that the Adviser’s investment, compliance and legal staff conduct regular and periodic telephonic andin-person meetings with theSub-Advisers to review and assess the services that are provided to the Portfolios, and that personnel of the Adviser prepare and present reports to the Independent Trustees regarding those meetings. In addition, throughout the year, the Board considered the expertise, experience and performance of the personnel of the Adviser who performed the various services that are mentioned above.
BHFTII-26
Brighthouse Funds Trust II
Western Asset Management U.S. Government Portfolio
Board of Trustees’ Consideration of Advisory and Sub-Advisory Agreements—(Continued)
With respect to the services provided by each of theSub-Advisers, the Board considered a variety of information that the Adviser and eachSub-Adviser prepared for the Board’s review. The Board considered eachSub-Adviser’s investment process and philosophy, and the investment performance experienced by the Portfolio (as described in more detail below). The Board took into account that eachSub-Adviser’s responsibilities include the development and maintenance of an investment program for the applicable Portfolio that is consistent with the Portfolio’s investment objectives, the selection of investment securities and the placement of orders for the purchase and sale of such securities, as well as the implementation of compliance controls related to performance of these services. In particular, the Board considered, among other things, theSub-Adviser’s current level of staffing as well as its compensation program and its overall resources. The Board reviewed eachSub-Adviser’s history and investment experience, as well as information provided regarding the qualifications, background and responsibilities of theSub-Adviser’s investment and compliance personnel who provide services to the Portfolios. The Board also considered, among other things, eachSub-Adviser’s compliance program and regulatory and disciplinary history. In its review, the Board also took into account information regarding any services and/or payments provided to the Adviser by theSub-Advisers in connection with marketing activities and considered representations from the Adviser that those payments were not considered in the Adviser’s recommendation to renew any of theSub-Advisory Agreements.
Performance. The Board placed emphasis on the performance of each Portfolio in light of, among other things, its importance to investors. The Board considered the Adviser’s quarterly reviews with the Board of detailed information about each Portfolio’s investment strategies and performance results and composition, including discussions regarding the relevant effect of current market conditions. The Board reviewed and considered the reports prepared by Broadridge, which provided a statistical analysis comparing the Portfolios’ investment performance to that of comparable funds underlying variable insurance products (the “Performance Universe”). The Independent Trustees also met separately with representatives of JDL during the October Meeting to review the JDL Report. The Board also compared the performance records of the Portfolios to those of comparable funds and other accounts that were managed by the relevantSub-Adviser, to the extent such information was available. The Board considered each Portfolio’s performance for periods subsequent to the performance period covered by the Broadridge reports, and the Adviser’s discussion of the same, including the effect of current market conditions on each Portfolio’s more recent performance. The Board also noted that while it found the data provided by Broadridge generally useful, it recognized the limitations of such data, including, in particular, that notable differences may exist between a Portfolio and those of the other funds in a Broadridge category (for example, the investment objectives(s) and investment strategies) and that the results of the performance comparisons may vary depending on (i) the end dates for the performance periods that were selected and (ii) the selection of the peer groups.
The Board focused particular attention on Portfolios with less favorable performance records. The Board noted the Adviser’s focus on eachSub-Adviser’s performance and that the Adviser has been active in monitoring and responding to any performance issues with respect to the Portfolios.
Fees and Expenses. The Board gave consideration to the level and method of computing the fees payable under the Agreements. The Board considered the Broadridge report for each of the Portfolios, which included comparisons for each Portfolio of its contractual management andsub-adviser fees (at current and various asset levels), and total expenses, with those of its peers, including as those peers were divided into a broad group of peer funds (“Expense Universe”), a narrower group of peer funds (“Expense Group”), a broad group of peersub-advised funds (“Sub-advised Expense Universe”), and a narrower group of peersub-advised funds (“Sub-advised Expense Group”). Broadridge selected the peer funds which were similarly situated funds underlying variable insurance products deemed to be comparable to the Portfolios. The Independent Trustees, with the assistance of JDL, also examined the JDL Report. The Board compared the fee payable to aSub-Adviser by the Adviser with respect to the Portfolio to the fee payable to theSub-Adviser by other comparable funds and other accounts, to the extent such information was available.
The Board noted that thesub-advisory fees for the Portfolios are paid by the Adviser out of the advisory fees, and that the Adviser negotiates the fees at arm’s length. The Board also considered that the Adviser had entered into expense limitation or management fee waiver agreements with certain of the Portfolios pursuant to which the Adviser had agreed to waive a portion of its advisory fee and/or reimburse certain expenses as a means of limiting a Portfolio’s total annual operating expenses.
Profitability. The Board examined the profitability to the Adviser of each Advisory Agreement, on aPortfolio-by-Portfolio basis. The Board also considered that an affiliate of the Adviser, Brighthouse Securities, LLC, serves as distributor for the Trusts, and, as such, receives Rule12b-1 payments to support the distribution of the Portfolios. The Board considered the profitability to theSub-Advisers and their affiliates as a result of their relationships with the Portfolios, to the extent available, and the Board considered the ability of the Adviser to negotiate with aSub-Adviser at arm’s length. In reviewing the profitability analyses, the Board recognized that expense allocation methodologies are inherently subjective and various expense allocation methodologies may be reasonable while producing different results.
BHFTII-27
Brighthouse Funds Trust II
Western Asset Management U.S. Government Portfolio
Board of Trustees’ Consideration of Advisory and Sub-Advisory Agreements—(Continued)
Economies of scale. The Board also considered each Portfolio’s fees in light of its size. The Board noted the fee schedules for the Portfolios that contain breakpoints that reduce the fee rate above specified asset levels. The Board noted those Portfolios that did not have breakpoints in their advisory fee and took into account management’s discussion of the same. The Board noted that those Portfolios with Advisory Agreements containing breakpoints generally have breakpoints in the correspondingSub-Advisory Agreement. The Board considered the effective fees under the Advisory Agreement andSub-Advisory Agreement for each Portfolio as a percentage of assets at different asset levels and possible economies of scale that may be realized if the assets of the Portfolio grow. The Board examined, among other data, the effect of a Portfolio’s growth in size, and reduction in size, on various fee schedules and the Board reviewed the Broadridge and JDL Reports, which compared fees among peers. The Board also generally noted that if a Portfolio’s assets increase over time, the Portfolio may realize other economies of scale if assets increase proportionally more than certain other fixed expenses.
Other factors. The Board considered other benefits that may be realized by the Adviser and its affiliates from their relationship with the Trusts. Among them, the Board recognized that Brighthouse Securities, LLC, as the distributor for the Trusts, receives payments pursuant to Rule12b-1 from the Portfolios to compensate for the provision of shareholder services and distribution activities, which could lead to growth in the Trusts’ assets and corresponding benefits from such growth, including economies of scale. The Board considered other benefits that may be realized by eachSub-Adviser and its affiliates from their relationship with the Trusts, including the opportunity to provide advisory services to additional portfolios of the Trusts and reputational benefits. In conjunction with these considerations, the Board noted the ongoing commitment of the Adviser to the Portfolios.
The Board requested, received, and considered information from the Adviser regarding possible conflicts of interest in the form of material benefits to the Adviser resulting from the Adviser’s affiliations and business relationships, as relevant. The Board considered the services that are provided to the Trusts by its service providers, and the manner in which any conflicts were mitigated.
* * *
Western Asset Management U.S. Government Portfolio. The Board also considered the following information in relation to the Agreements with the Adviser and Western Asset Management Company regarding the Portfolio:
Among other data relating specifically to the Portfolio’s performance, the Board considered that the Portfolio outperformed the median of its Performance Universe and the average of its Morningstar Category for theone-year period ended June 30, 2018, and underperformed the median of its Performance Universe and the average of its Morningstar Category for the three-year and five-year periods ended June 30, 2018. The Board further considered that the Portfolio outperformed its benchmark, the Bloomberg Barclays U.S. Intermediate Government Bond Index, for theone-, three-, and five-year periods ended September 30, 2018. The Board also noted that the Portfolio outperformed its blended benchmark for theone-year and three-year periods ended September 30, 2018, and underperformed its blended benchmark for the five-year period ended September 30, 2018. The Board took into account management’s discussion of the Portfolio’s performance, including prevailing market conditions.
The Board also considered that the Portfolio’s actual management fees were below the Expense Group median and Expense Universe median, and above theSub-advised Expense Universe median. The Board considered that the Portfolio’s total expenses (exclusive of 12b 1 fees) were below the Expense Group median, Expense Universe median, andSub-advised Expense Universe median. The Board further noted that the Portfolio’s contractual management fees were equal to the asset-weighted average of comparable funds selected by Broadridge at the Portfolio’s current size. The Board also noted that the Portfolio’s contractualsub-advisory fees were below the averages of theSub-advised Expense Group and theSub-advised Expense Universe at the Portfolio’s current size.
BHFTII-28
Item 2. Code of Ethics.
As of the end of the period covered by this report, the registrant has adopted a code of ethics that applies to the registrant’s principal executive officer, principal financial officer, principal accounting officer, or persons performing similar functions (the “Code of Ethics”). During the period covered by this report, no material amendments were made to the provisions of the Code of Ethics, nor did the registrant grant any waivers, including any implicit waivers, from any provision of the Code of Ethics.
Item 3. Audit Committee Financial Expert.
The registrant’s Board of Trustees has determined that the registrant has at least one “audit committee financial expert” (as defined in Item 3 ofForm N-CSR) serving on its audit committee. Robert J. Boulware, Susan C. Gause, Nancy Hawthorne, and Dawn M. Vroegop have each been determined to be an “audit committee financial expert” and each is “independent” (as each term is defined in Item 3 ofForm N-CSR).
Item 4. Principal Accountant Fees and Services.
Information provided in response to Item 4 includes amounts billed during the applicable time period for services rendered by Deloitte & Touche LLP (“Deloitte”), the registrant’s principal accountant.
(a) Audit Fees
The aggregate fees billed for professional services rendered by Deloitte for the audit of the registrant’s annual financial statements and for services that are normally provided by Deloitte in connection with statutory and regulatory filings for the fiscal years ended December 31, 2017 and December 31, 2018 were $1,399,518 and $1,399,020, respectively.
(b) Audit-Related Fees
During the fiscal years ended December 31, 2017 and December 31, 2018, Deloitte billed $0 and $5,510, respectively, for assurance and related services that relate directly to the operations and financial reporting of the registrant, the registrant’s investment adviser or any other entity controlling, controlled by, or under common control with the registrant’s investment adviser that provides ongoing services to the registrant. Represent fees for services rendered to the registrant related to reorganizations involving certain portfolios of the registrant for fiscal year ended December 31, 2018.
(c) Tax Fees
The aggregate fees billed for professional services rendered by Deloitte for tax compliance, tax advice and tax planning in the form of preparation of excise filings and income tax returns for the fiscal years ended December 31, 2017 and December 31, 2018 were $203,424 and $198,884, respectively. Represent fees for services rendered to the registrant for review of tax returns for the year end December 31, 2017 and for the fiscal year end December 31, 2018.
During the fiscal years ended December 31, 2017 and December 31, 2018, no fees for tax compliance, tax advice or tax planning services that relate directly to the operations and financial reporting of the registrant were billed by Deloitte to the registrant’s investment adviser or any other entity controlling,
3
controlled by, or under common control with the registrant’s investment adviser that provides ongoing services to the registrant.
(d) All Other Fees
The registrant was not billed for any other products or services provided by Deloitte for the fiscal years ended December 31, 2017 and December 31, 2018 other than the services reported in paragraphs (a) through (c) above.
During the fiscal years ended December 31, 2017 and December 31, 2018, no fees for other products or services that relate directly to the operations and financial reporting of the registrant, other than the services reported in paragraphs (a) through (c) above, were billed by Deloitte to the registrant’s investment adviser or any other entity controlling, controlled by, or under common control with the registrant’s investment adviser that provides ongoing services to the registrant.
(e)(1) The registrant’s Audit Committee has establishedpre-approval procedures pursuant to paragraph (c)(7)(i)(B) of Rule2-01 of RegulationS-X, which include regularpre-approval procedures and interimpre-approval procedures. Under the regularpre-approval procedures, the Audit Committeepre-approves at its regularly scheduled meetings audit andnon-audit services that are required to bepre-approved under paragraph (c)(7) of Rule2-01 of RegulationS-X. Under the interimpre-approval procedures, any member of the Audit Committee who is an independent Trustee is authorized topre-approve proposed services that arise between regularly scheduled Audit Committee meetings and that need to commence prior to the next regularly scheduled Audit Committee meeting. Such Audit Committee member must report to the Audit Committee at its next regularly scheduled meeting on thepre-approval decision.
(2) Not applicable.
(f) Not applicable.
(g) The aggregate fees billed for the most recent fiscal year and the preceding fiscal year by the registrant’s principal accountant fornon-audit services rendered to the registrant, its investment adviser, and adviser affiliates that provide ongoing services to the registrant for 2017 and 2018 were $38,803 and $48,438, respectively.
(h) The Audit Committee of the registrant’s Board of Trustees considered the provision ofnon-audit services that were rendered to the registrant’s investment adviser (not including any subadviser whose role is primarily portfolio management and is subcontracted with or overseen by another investment adviser), and any entity controlling, controlled by or under common control with the investment adviser that provides ongoing services to the registrant that were notpre-approved pursuant to paragraph (c)(7)(ii) of Rule2-01 of RegulationS-X and concluded that such services are compatible with maintaining the principal accountant’s independence.
Item 5. Audit Committee of Listed Registrants.
Not applicable.
Item 6. Investments.
(a) Schedule of Investments is included as a part of the report to shareholders included under Item 1 of thisForm N-CSR.
4
(b) Not applicable.
Item 7. Disclosure of Proxy Voting Policies and Procedures forClosed-End Management Investment Companies.
Not applicable.
Item 8. Portfolio Managers ofClosed-End Management Investment Companies.
Not applicable.
Item 9. Purchases of Equity Securities byClosed-End Management Investment Company and Affiliated Purchasers.
Not applicable.
Item 10. Submission of Matters to a Vote of Security Holders.
The registrant does not have procedures by which shareholders may recommend nominees to the registrant’s Board of Trustees.
Item 11. Controls and Procedures.
(a) The President and Treasurer of the registrant have concluded, based on their evaluation of the effectiveness of the registrant’s disclosure controls and procedures (as defined in Rule30a-3(c) under the Act) as of a date within 90 days of the filing date of this report on FormN-CSR, that the design and operation of such procedures provide reasonable assurance that information required to be disclosed by the registrant in this report on FormN-CSR is recorded, processed, summarized, and reported within the time periods specified in the Securities and Exchange Commission’s rules and forms.
(b) There were no significant changes in the registrant’s internal control over financial reporting (as defined in Rule30a-3(d) under the 1940 Act) that occurred during the registrant’s second fiscal quarter of the period covered by this report that have materially affected, or are reasonably likely to materially affect, the registrant’s internal control over financial reporting.
Item 12. Disclosure of Securities Lending Activities for Closed-End Management Investment Companies.
(a) Not applicable.
(b) Not applicable.
Item 13. Exhibits
(a)(1) Code of Ethics is attached hereto.
(a)(2) The certifications required by Rule30a-2(a) under the 1940 Act are attached hereto.
(a)(3) Not applicable.
(a)(4) Not applicable.
5
(b) The certifications required by Rule30a-2(b) under the 1940 Act and Section 906 of the Sarbanes-Oxley Act of 2002 are attached hereto.
6
SIGNATURES
Pursuant to the requirements of the Securities Exchange Act of 1934 and the Investment Company Act of 1940, the registrant has duly caused this report to be signed on its behalf by the undersigned, thereunto duly authorized.
BRIGHTHOUSE FUNDS TRUST II
| | |
| |
| By: | | /s/ Kristi Slavin |
| | Kristi Slavin |
| | President and Chief Executive Officer |
| |
| Date: | | March 8, 2019 |
Pursuant to the requirements of the Securities Exchange Act of 1934 and the Investment Company Act of 1940, this report has been signed below by the following persons on behalf of the registrant and in the capacities and on the dates indicated.
| | |
| |
| By: | | /s/ Kristi Slavin |
| | Kristi Slavin |
| | President and Chief Executive Officer |
| |
| Date: | | March 8, 2019 |
| | |
| |
| By: | | /s/ Alan R. Otis |
| | Alan R. Otis |
| | Chief Financial Officer and Treasurer |
| |
| Date: | | March 8, 2019 |
7