OMB APPROVAL
OMB Number: 3235-0570
Expires: September 30, 2007
Estimated average burden hours per response...19.4
UNITED STATES SECURITIES AND EXCHANGE COMMISSION
Washington, DC 20549
FORM N-CSR
CERTIFIED SHAREHOLDER REPORT OF REGISTERED
MANAGEMENT INVESTMENT COMPANIES
Investment Company Act file number 811-3615
Mosaic Equity Trust
(Exact name of registrant as specified in charter)
550 Science Drive, Madison, WI 53711
(Address of principal executive offices)(Zip code)
W. Richard Mason
Madison/Mosaic Legal and Compliance Department
8777 N. Gainey Center Drive, Suite 220
Scottsdale, AZ 85258
(Name and address of agent for service)
Registrant's telephone number, including area code: 608-274-0300
Date of fiscal year end: December 31
Date of reporting period: June 30, 2006
Form N-CSR is to be used by management investment companies to file reports with the Commission not later than 10 days after the transmission to stockholders of any report that is required to be transmitted to stockholders under Rule 30e-1 under the Investment Company Act of 1940 (17 CFR 270.30e-1). The Commission may use the information provided on Form N-CSR in its regulatory, disclosure review, inspoection, and policymaking roles.
A registrant is required to disclose the information specified by Form N-CSR, and the Commission will make this information public. A registrant is not required to respond to the collection of information contained in Form N-CSR unless the Form displays a currently valid Office of Management and Budget ("OMB") control number. Please direct comments concerning the accuracy of the information collection burden estimate and any suggestions for reducing the burden to Secretary, Securities and Exchange Commission, 450 Fifth Street, NW, Washington, DC 20549-0609. The OMB has reviewed this collection of information under the clearance requirements of 44 U.S.C. s 3507.
Semi-Annual Report (unaudited)
June 30, 2006
Mosaic Equity Trust
- Mosaic Investors Fund
- Mosaic Balanced Fund
- Mosaic Mid-Cap Fund
- Mosaic Foresight Fund
Mosaic Funds
www.mosaicfunds.com
Contents
| Portfolio Manager Review | |
| Review of Period | 1 |
| Market in Review | 1 |
| Outlook | 1 |
| Interview with lead equity manager Jay Sekelsky | 2 |
| Mosaic Investors | 2 |
| Mosaic Balanced | 4 |
| Mosaic Mid-Cap | 6 |
| Mosaic Foresight | 8 |
| Portfolio of Investments | |
| Investors Fund | 10 |
| Balanced Fund | 11 |
| Mid-Cap Fund | 13 |
| Foresight Fund | 14 |
| Statements of Assets and Liabilities | 16 |
| Statements of Operations | 17 |
| Statements of Changes in Net Assets | 18 |
| Financial Highlights | 20 |
| Notes to Financial Statements | 22 |
Mosaic Equity Trust June 30, 2006
Portfolio Manager Review
The six-month period ended June 30, 2006 showed gains for all four funds in Equity Trust. Mosaic Investors advanced 2.92% for the six-month period, Mid-Cap was up 3.42%; Balanced 1.75%; and Foresight gained 2.85%. Over the same period, the S&P 500 Index rose 2.71%. However, the six months were hardly a smooth ride. The S&P 500 worked its way to a peak in early May, at which point the Index was showing a 6.8% gain for the year, and then dropping more than 7% to hit a low in mid-June before recovering some ground by the period end.
The market gyrations described above were a result of numerous economic uncertainties. While the economy continued to expand and corporate profits remained strong, there were strong headwinds from the Federal Reserve's rate hikes, the continued high cost of energy and associated inflationary pressures, and no shortage of negative news from the Mideast and other hotspots around the globe.
The market began 2006 with a strong first quarter, as the S&P 500 Index returned 4.21%, sandwiching a lackluster February with solid January and March results. It marked the strongest first quarter for the index since 1999, and its best individual quarter since the fourth quarter of 2004.
Many of the same themes from 2005 carried over into 2006, as cyclical sectors drove market performance, and the Fed continued to raise short-term interest rates. After Alan Greenspan raised rates in his final meeting at the end of January, new Fed Reserve Chairman Ben Bernanke continued the tightening cycle with the fifteenth straight interest rate hike in late March.
The second quarter of 2006 began with a continuation of the strong first quarter, but in early May the markets reversed course. The belief by investors that the Fed was done raising interest rates proved to be short lived as fears of rising inflation and a slower economy took hold shortly after the Fed raised rates for the sixteenth consecutive time in early May. This drove the markets into negative territory for the year. However by the end of June the market had recovered some of its losses as once again investors believed the end to the tightening cycle was in sight.
During the market downturn the less cyclical and higher-quality stocks were able to weather the storm better than their more speculative counterparts, perhaps signaling a shift in market leadership. Also noticeable during the market slide was the outperformance of large capitalization stocks relative to small cap securities, growth slightly outpaced value, both reversing trends of the past few years.
As we move into the second half of 2006, our outlook for the economy remains positive. We believe the market will settle into a more stable growth pattern. Higher interest rates, higher energy costs, and a slowdown in certain segments of the housing sector should act as a damper on growth. In our opinion, the higher-than-expected GDP growth for the first quarter of 2006 was a slingshot result following the hurricane-suppressed fourth quarter number, and we expect a return to a more moderate level for the remainder of the year. The case
Mosaic Equity Trust 1
Portfolio Manager Review (continued)
for decelerating corporate earnings remains intact. Historically during similar periods the market has favored the types of high-quality companies in which we invest.
Over the last several years investors' appetite for high-risk securities has increased as evidenced by impressive returns for domestic cyclical and speculative issues and, on a global scale, the run-up in emerging markets. As has historically been the case, we believe this trend will eventually correct itself. The outperformance of lower-quality stocks over the last few years marks the longest stretch of outperformance in the last two decades. Although many of the hardest hit stocks during the May-June market slide recovered some of those losses towards quarter-end, we believe the volatility will continue and at the very least the outperformance of riskier asset classes should moderate going forward.
Looking ahead we are encouraged by early signs of a possible change in market leadership. We anticipate a slowing in the rate of corporate profit growth, yet still a record level of earnings. Corporate balance sheets remain strong, and valuations appear attractive, both positive signals for the market. Many of the headwinds of the market should diminish as the Fed nears the end of their tightening cycle and energy prices stabilize. We continue to adhere to our bottom-up investment philosophy of analyzing and investing in high-quality companies with strong business models and management teams, purchasing stakes in them only when valuations are attractive.
Interview with lead equity manager Jay Sekelsky (photo of Jay Sekelsky)
Can you summarize the performance of the funds in Equity Trust for the first six months of 2006?
We were quite pleased with the positive performance of the four funds in Equity Trust, as our pure equity funds outperformed the broader market as measured by the S&P 500. This was particularly gratifying since the market still favored cyclicals, particularly energy, a sector not represented in Mosaic Investors, Balanced or Mid-Cap. We also were pleased at how well the funds held up during the market drop in May, which certainly validates our overall goal of seeking to protect capital in down markets.
How did the fund perform for the first six months of 2006?
Mosaic Investors advanced 2.92% for the period ended June 30, 2005. This return beat the broader market as measured by the S&P 500, which was up 2.71%. It also was superior to its peer group, represented by the Lipper Large-Cap Core Index, which rose 2.17%.
Have you made any significant changes to the portfolio since December 31, 2005?
We seek to buy a select group of companies that we can hold for long periods. Our last audited report (December 31, 2005) noted that our turnover rate for the fund in 2005 was 41%, well below the average for all
2 Semi-annual Report • June 30, 2006
Portfolio Manager Review (continued)
domestic equity funds. Over the course of the first six months of 2006 we sold seven holdings and added six new ones, which is a relatively active period for us. This reflects some significant market swings which affected valuations, as well as a series of company-specific situations.
We added Amgen, Apollo Group, Home Depot, Linear Technology Corporation, Marsh & McLennan, and United Healthcare Corporation. We sold all shares of Check Point Software, Costco Wholesale, First Data, Health Management Association, Liz Claiborne, Mohawk Industries and Waste Management Inc.
Like many of our sales, Costco was sold primarily on valuation. As we took profits, we also took into account the potential that consumer spending could weaken after numerous years of strength, and this was a means of lightening our exposure to this possible trend. We still consider it one of the best-managed companies in the market, and we would consider buying it back at a lower price, should the market present that opportunity.
We may also sell a stock due to a change in the industry or competitive environment. For example, while we continue to believe Checkpoint has an excellent management team and has a leadership position in a vibrant industry, we were not pleased with the cancellation of the acquisition of SourceFire. Combined with the company's pre-announcement that existing product revenue was weaker than expected, we decided to exit the position. We sold Liz Claiborne primarily due to pressures on the apparel industry and potential management uncertainty. Despite a great job by the company's management, from a macro standpoint apparel is largely a slow to no growth commodity business that is impacted by fashion trends and increasing competition. We sold Health Management Association due to concerns over deteriorating business conditions in the hospital industry. The hospital industry has faced increased costs from providing health care for those without health insurance, and as this component of patient volume has grown, it has reached a size where it has impaired our growth prospects for the hospital business model.
An example of our purchasing strategy can be seen in our addition of Amgen. Amgen is the world's second largest biotechnology company, and has evolved from the narrow product line that characterizes many biotechs into a broader-based pharmaceutical. The company has three blockbuster drugs for 1) supportive care in chemotherapy, 2) supportive care in dialysis, and 3) arthritis. These drugs have grown extremely well historically, and continue to perform well while also retaining patent protection past 2010 in the United States. The company's pipeline has emerged as one of the best of the biotechnology and pharmaceutical industries with potential blockbuster drugs in late phase testing. We believe that as their new drugs come to market, the stock should outperform the market.
Mosaic Equity Trust 3
Portfolio Manager Review (continued)
TOP TEN STOCK HOLDINGS AS OF JUNE 30, 2006 FOR MOSAIC INVESTORS
% of net assets | |
| Johnson & Johnson | 4.96% |
| Wal-Mart Stores Inc. | 4.75% |
| Citigroup Inc. | 4.43% |
| Berkshire Hathaway - Class B | 4.34% |
| Morgan Stanley | 4.33% |
| Comcast Corp. - Special Class A | 4.21% |
| Dover Corp | 4.15% |
| Wells Fargo & Co. | 4.00% |
| Microsoft Corp. | 3.97% |
| Novartis AG - ADR | 3.91% |
What holdings were the strongest contributors to fund performance?
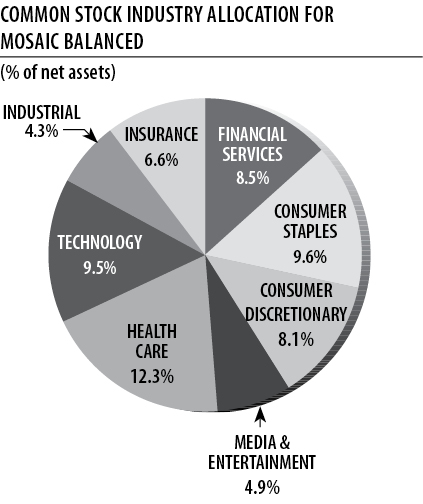
We saw positive returns from our holdings in the Industrial, Consumer Discretionary, Consumer Staples, and Financial Sectors. Information Technology was the worst performing S&P Sector, but our holdings did considerably better than the sector as a whole, boosting our relative performance. In fact, our stock picks outperformed each of their corresponding sectors for the six months. The best performing individual security was Comcast, followed by Cisco Systems, Dover Corporation, Fiserv and pharmaceutical giant Novartis.

What holdings were the largest constraints on performance?
The leading sector in the market was energy, and our lack of holdings in this cyclical area was a relative negative. We also did not have participation in the Telecom Services Sector, which had a nice run. Fortunately, we saw losses of less than 1% from our holdings in Information Technology and Heath Care, far less than the S&P Sector losses of -6.2% and -4.2%, respectively.
On an individual security basis, our worst performer was Check Point Software, which was sold during the period, followed by Linear Technology, Microsoft and financial conglomerate Marsh & McClennan.
How did Mosaic Balanced perform for the six-month period?
Mosaic Balanced advanced 1.75% for the six months, with positive results from the stock holdings dampened by flat returns from the bonds. As with our Investors Fund, we did fight the headwind of having no holdings in the top-performing Energy Sector. During the course of the six months, Lipper reformulated the index (Lipper Balanced Fund Index) that included Mosaic Balanced, and placed the fund in a new index group called Lipper Mixed Asset Allocation Growth.
4 Semi-annual Report • June 30, 2006
Portfolio Manager Review (continued)
This index showed a 3.04% return for the six months.
Have you made any significant changes to the portfolio since December 31, 2005?
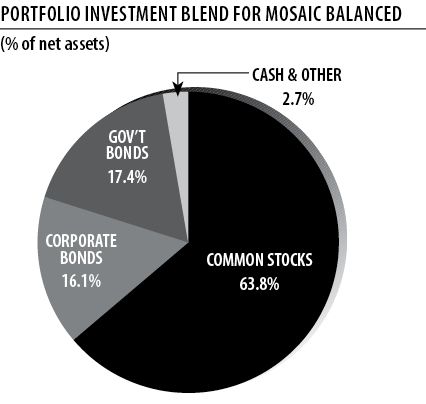
The stock holdings of Balanced mirror the holdings of Mosaic Investors, as discussed above. These holdings continue to focus on solid, well-established domestic companies that have proven their earning ability through difficult times. One of the factors in our management of Balanced is the mix of stocks and bonds, with 70% being the highest allowable percentage of stocks. We began the period holding 64.4% stocks and finished the period at virtually the same level, with 63.8% in stocks. On the bond side, we have been gradually increasing the percentage of government issued bonds, and decreasing the weighting in corporate bonds, based on our assessment of relative values. We have also increased the duration of the bonds slightly, from 2.95 years at the beginning of the period to 3.20 years at the end.
TOP FIVE STOCK AND FIXED INCOME HOLDINGS AS OF JUNE 30, 2006 FOR MOSAIC BALANCED
% of net assets | |
| Top Five Stock Holdings(63.8% of net assets in stocks) | |
| Wal-Mart Stores Inc. | 3.08% |
| Johnson & Johnson | 3.08% |
| Morgan Stanley | 2.91% |
| Citigroup Inc. | 2.91% |
| Berkshire Hathaway - Class B | 2.89% |
% of net assets | |
| Top Five Fixed Income Holdings(33.5% of net assets in fixed income) | |
| US Treasury Note, 4%, 3/15/2010 | 2.74% |
| Fannie Mae, 3.25%, 8/15/2008 | 2.42% |
| Freddie Mac, 3.5%, 9/15/2007 | 2.29% |
| US Treasury Note, 4.25%, 8/15/2014 | 1.85% |
| US Treasury Note, 5%, 8/15/2011 | 1.83% |
How did the stock holdings in Balanced contribute to overall performance?
The stock holdings in Balanced were positive for the period. The holdings mirror the stocks held in Mosaic Investors, discussed at some length above.
How did the bond holdings in Balanced contribute to overall performance?
Bond valuations fell in the first quarter of 2006 and then rebounded mildly in the second quarter, producing a net result that was basically flat. We have kept the bond holdings in Mosaic Balanced quite conservative, but did some repositioning of the holdings which lengthened duration slightly. We foresee additional Fed tightening ahead, but feel we are getting closer to an inflection point for bonds. Since we believe in active bond management for the Balanced Fund, we are carefully following economic reports and Fed posture to prepare for what we believe will be an eventual shift in the direction of rates.
Mosaic Equity Trust 5
Portfolio Manager Review (continued)
(photo of Rich Eisinger)
An interview with Rich Eisinger, co-manager of Mosaic Mid-Cap.
How would you characterize the performance of Mosaic Mid-Cap so far in 2006?
Mosaic Mid-Cap returned 3.42% for the first half of 2006, which outpaced the overall market, as measured by the S&P 500's 2.71%, but underperformed our benchmark, the Russell Midcap Index, which advanced 4.84%. We also trailed our peer group, as represented by the Lipper Mid-Cap Core Index, which advanced 4.31%. Our underperformance against our benchmark and peers was in large part due to sector allocation, as the stocks in the cyclical sectors such as Energy and Materials that do not typically meet our criteria had a very strong period.
Have you made any significant additions to the portfolio since December 31, 2005?
Our latest audited turnover ratio (December 31. 2005) was 46%, which translates into an average holding period of close to two years. Trading during the first six months of 2006 was relatively active, as our June 30, 2006 holdings show 10 new names, and 11 sold positions since the start of the year.
We sell a position for one of three main reasons: valuation appears full, a better opportunity exists elsewhere, or our original thesis for holding the stock is no longer intact. A number of our long-term holdings were sold due to valuation, including Jacobs Engineering, Expeditors International of Washington and Liberty Media. In other cases, shifts in the competitive environment caused us to reevaluate our holdings. For instance, Del Monte has been hurt by a rise in raw material and energy costs, but has not been able to offset these costs with pricing. Education Management was sold after it was announced that the company would be purchased for an attractive price by a private equity concern. Liz Claiborne, a very profitable long-term investment for us, was sold due to competition in the apparel industry and potential management uncertainty.
We were able to add a number of excellent companies to the portfolio, aided later in the period by the market dip, which took the S&P 500 below its starting point for
6 Semi-annual Report • June 30, 2006
Portfolio Manager Review (continued)
2006. Among the additions was Foot Locker, a leading retailer of athletic footwear and clothing. It has an industry best 20% share of the domestic athletic footwear market and it operates a broad portfolio of businesses. The company maintains a healthy balance sheet with a large cash position. We also found strong companies selling at reasonable valuations in the Technology Sector, including FLIR Systems, which manufactures infrared cameras for use in detecting heat abnormalities and for allowing users to see through obscurants like smoke, haze, and darkness. The company benefits by selling products that help with energy conservation and security, which are two end markets that are benefiting from strong secular trends. Linear Technology designs, manufactures and markets a broad line of standard high performance linear integrated circuits. The company has a successful business model and the analog and mixed signal semiconductor chip segments have longer product cycles, less chance to be commoditized, and generate consistently high margins. The company has substantial free cash flow, a clean balance sheet, and strong growth prospects.
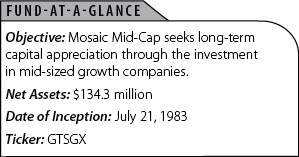
TOP TEN STOCK HOLDINGS AS OF JUNE 30, 2006 FOR MOSAIC MID-CAP
% of net assets | |
| Dover Corp | 4.88% |
| Markel Corp. | 4.65% |
| White Mountains Insurance GP | 3.77% |
| Fiserv Inc. | 3.65% |
| Clorox Company | 3.62% |
| Synovus Financial Corp. | 3.51% |
| Intl Game Technology | 3.32% |
| Mercury General Corp. | 3.26% |
| SEI Investments Co. | 3.26% |
| Foot Locker Inc | 3.10% |
What holdings were the strongest contributors to fund performance?
In terms of sectors, we saw our best returns from our Industrial and Consumer holdings. The individual holding that had the strongest impact on our returns was CarMax, followed by International Game Technology, SEI Investments, and Laboratory Corporation of America.
What holdings were the largest constraints on performance?
Our underweighting in the leading Energy and Materials sectors hurt us this period, as cyclicals continued their strong performance, although they showed considerable volatility in the May-June market pullback. We tend to avoid cyclical stocks, because few of them can demonstrate the predictable cash flow we require. Individual holdings which had disappointing six-month results included Hewitt Associates, White Mountains Insurance, and Gannett, which we sold in May.
Mosaic Equity Trust 7
Portfolio Manager Review (continued)
An interview with Foresight co-manager and Madison Investment Advisors' Founder and President, Frank Burgess. (Photo of Frank Burgess)
How would you characterize the performance of Foresight for the period?
We were pleased to show a positive return of 2.85% for the period, just ahead of our S&P 500 benchmark, which was up 2.71%. We lagged our peer group slightly, as the Lipper Flexible Portfolio Fund Index was up 3.07%. With our portfolio currently allocated across S&P 500 sectors, the positive results against the S&P 500 were largely a function of our stock selection, while members of the Lipper Index may have benefited from an allocation to higher-performing smaller capitalization stocks or heavier exposure to the leading cyclicals.
Have you made any significant changes to the portfolio since December 31, 2005?
Over the past six months we've solidified our holdings into what is now a fully invested, sector-diversified stock strategy. As in the past, our equity positions are concentrated in large-cap companies which retain a leadership position in their industries and have shown the ability to produce predictable earnings over time. As we've repositioned the fund over the past year, our turnover increased temporarily, but has settled back to historic ranges over the past six months. Trading activity was relatively heavy for the first six months of 2006, with 12 new securities in the portfolio as of June 30, and 15 securities sold.
Among the notable additions to the portfolio are EBAY, money manager Janus Capital, financial conglomerate Marsh & McLennan, software producer Symantec, and the international telecommunications firm Vodofone Group. We were able to take profits from some of our energy and utility positions, including Valero, Texas Utility Company, and Occidental Petroleum.
What holdings had the largest impact on this period's performance?
Energy, materials and telecommunications were the strongest sectors, while technology was the weakest. In terms of individual holdings, we had strong results from industrial holding Dover Corp., Comcast, and Waters Company. Companies which had negative results for the six months include Target, Tyco, Cintas and Marsh & McClennan.
8 Semi-annual Report • June 30, 2006
Portfolio Manager Review (concluded)
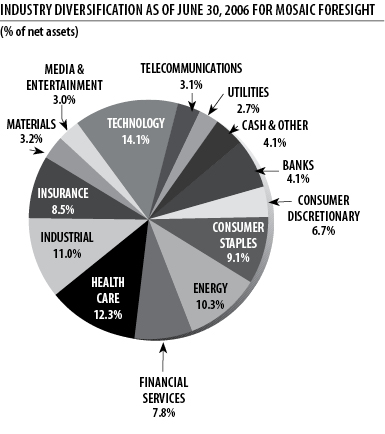
TOP TEN STOCK HOLDINGS AS OF JUNE 30, 2006 FOR MOSAIC FORESIGHT
% of net assets | |
| Wal-Mart Stores Inc. | 3.01% |
| General Electric Co. | 2.84% |
| Schlumberger LTD | 2.71% |
| Dover Corp | 2.61% |
| Chevron Corp. | 2.57% |
| Transocean Inc. | 2.56% |
| Sysco Corp. | 2.54% |
| Johnson & Johnson | 2.49% |
| Amgen Inc. | 2.44% |
| Citigroup Inc. | 2.44% |
Mosaic Equity Trust 9
Mosaic Equity Trust June 30, 2006
Investors Fund - Portfolio of Investments (unaudited)
NUMBER OF SHARES | VALUE | |
| COMMON STOCKS: 97.8% of net assets | ||
| CONSUMER DISCRETIONARY: 12.1% | ||
| Apollo Group - CL A* | 50,300 | $2,599,001 |
| Harley-Davidson Inc. | 60,605 | 3,326,608 |
| Home Depot, Inc. | 81,735 | 2,925,296 |
| McDonald's Corp. | 94,880 | 3,187,968 |
| Target Corp. | 60,040 | 2,934,155 |
| CONSUMER STAPLES: 15.5% | ||
| The Coca Cola Co. | 90,000 | 3,871,800 |
| Estee Lauder Co. - CL A | 73,790 | 2,853,459 |
| Sysco Corp. | 132,035 | 4,034,990 |
| Walgreen Co. | 55,235 | 2,476,738 |
| Wal-Mart Stores Inc. | 121,825 | 5,868,310 |
| FINANCIAL SERVICES: 12.8% | ||
| Citigroup Inc. | 113,560 | 5,478,134 |
| Morgan Stanley | 84,595 | 5,347,250 |
| Wells Fargo & Co. | 73,745 | 4,946,815 |
| HEALTH CARE: 18.6% | ||
| Amgen, Inc.* | 63,425 | 4,137,213 |
| Charles River Laboratories* | 71,800 | 2,642,240 |
| Johnson & Johnson | 102,220 | 6,125,022 |
| Novartis AG - ADR | 89,585 | 4,830,423 |
| Stryker Corp. | 57,060 | 2,402,797 |
| United Healthcare Group | 64,810 | 2,902,192 |
| INDUSTRIAL: 6.5% | ||
| Dover Corp. | 103,610 | 5,121,442 |
| United Parcel Service - CL B | 34,695 | 2,856,439 |
| INSURANCE: 9.9% | ||
| Berkshire Hathaway - CL B* | 1,760 | 5,355,680 |
| MGIC Investment Corp. | 54,780 | 3,560,700 |
| Marsh & McLennan Co. | 125,390 | 3,371,737 |
| MEDIA & ENTERTAINMENT: 8.0% | ||
| Comcast Corp. - Special CL A* | 158,835 | 5,206,611 |
| Liberty Media Interactive - CL A* | 133,852 | 2,310,286 |
| Viacom Inc. - CL B * | 65,017 | 2,330,209 |
| TECHNOLOGY: 14.4% | ||
| Cisco Systems Inc.* | 182,150 | 3,557,389 |
| Fiserv, Inc.* | 73,940 | 3,353,918 |
| Linear Technology Corp. | 90,045 | 3,015,607 |
| Microsoft Corp. | 210,335 | 4,900,806 |
| Symantec Corp.* | 194,090 | 3,016,159 |
| TOTAL COMMON STOCKS (Cost $113,303,691) | $120,847,394 | |
| REPURCHASE AGREEMENT: 1.8% of net assets With Morgan Stanley and Company issued 6/30/06 at 4.40%, due 7/3/06, collateralized by $2,219,646 in United States Treasury Notes due 2/29/08. Proceeds at maturity are $2,165,794 (Cost $2,165,000). | 2,165,000 | |
| TOTAL INVESTMENTS: 99.6% of net assets (Cost $115,468,691) | $123,012,394 | |
| CASH AND RECEIVABLES LESS LIABILITIES: 0.4% of net assets | 516,566 | |
| NET ASSETS: 100% | $123,528,960 | |
*Non-income producing
The Notes to Financial Statements are an integral part of these statements.
10 Semi-annual Report • June 30, 2006
Mosaic Equity Trust June 30, 2006
Balanced Fund - Portfolio of Investments (unaudited)
NUMBER OF SHARES | VALUE | |
| COMMON STOCKS: 63.8% of net assets | ||
| CONSUMER DISCRETIONARY: 8.1% | ||
| Apollo Group - CL A* | 4,290 | $221,664 |
| Harley-Davidson Inc. | 5,410 | 296,955 |
| Home Depot, Inc. | 7,135 | 255,361 |
| McDonald's Corp. | 7,600 | 255,360 |
| Target Corp. | 5,050 | 246,794 |
| CONSUMER STAPLES: 9.6% | ||
| The Coca Cola Co. | 7,745 | 333,190 |
| Estee Lauder Co. - CL A | 3,625 | 140,179 |
| Sysco Corp. | 11,530 | 352,357 |
| Walgreen Co. | 4,700 | 210,748 |
| Wal-Mart Stores Inc. | 10,105 | 486,758 |
| FINANCIAL SERVICES: 8.5% | ||
| Citigroup Inc. | 9,520 | 459,245 |
| Morgan Stanley | 7,270 | 459,537 |
| Wells Fargo & Co. | 6,215 | 416,902 |
| HEALTH CARE: 12.3% | ||
| Amgen, Inc.* | 5,315 | 346,697 |
| Charles River Laboratories* | 6,070 | 223,376 |
| Johnson & Johnson | 8,120 | 486,550 |
| Novartis AG - ADR | 7,500 | 404,400 |
| Stryker Corp. | 5,535 | 233,079 |
| United Healthcare Group | 5,450 | 244,051 |
| INDUSTRIAL: 4.3% | ||
| Dover Corp. | 8,500 | 420,155 |
| United Parcel Service - CL B | 3,070 | 252,753 |
| INSURANCE: 6.6% | ||
| Berkshire Hathaway - CL B* | 150 | 456,450 |
| MGIC Investment Corp. | 4,750 | 308,750 |
| Marsh & McLennan Co. | 10,505 | 282,479 |
| MEDIA & ENTERTAINMENT: 4.9% | ||
| Comcast Corp. - Special CL A* | 12,200 | 399,916 |
| Liberty Media Interactive - CL A* | 11,465 | 197,886 |
| Viacom Inc. - CL B* | 5,125 | 183,680 |
| TECHNOLOGY: 9.5% | ||
| Cisco Systems Inc.* | 15,250 | 297,832 |
| Fiserv, Inc.* | 6,075 | 275,562 |
| Linear Technology Corp. | 7,555 | 253,017 |
| Microsoft Corp. | 17,575 | 409,498 |
| Symantec Corp.* | 16,770 | 260,606 |
| TOTAL COMMON STOCKS (Cost $9,334,019) | $10,071,787 | |
PRINCIPAL AMOUNT | VALUE | |
| DEBT INSTRUMENTS: 33.5% of net assets | ||
| CORPORATE OBLIGATIONS: 16.1% | ||
| CONSUMER GOODS: 1.2% | ||
| Wal-Mart Stores, 4.75%, 8/15/10 | $200,000 | $193,961 |
| CONSUMER STAPLES: 0.6% | ||
| Kraft Foods, Inc., 5.625%, 11/1/11 | 100,000 | 98,609 |
| FINANCIALS: 5.0% | ||
| Countrywide Home Loan, 5.625%, 5/15/07 | 210,000 | 209,802 |
| Goldman Sachs, 7.35%, 10/1/09 | 180,000 | 188,741 |
| International Lease Finance, 4.875%, 9/1/10 | 200,000 | 193,620 |
| MGIC Investment Corp., 6%, 3/15/07 | 200,000 | 199,961 |
| HEALTH CARE: 1.2% | ||
| United Healthcare Group, 5%, 8/15/14 | 200,000 | 187,355 |
| MEDIA & ENTERTAINMENT: 1.3% | ||
| Comcast Cable, 6.2%, 11/15/08 | 200,000 | 202,090 |
| OIL: 1.3% | ||
| Marathon Oil Corp., 5.375%, 6/1/07 | 200,000 | 199,430 |
| TECHNOLOGY: 1.9% | ||
| Cisco Systems, Inc., 5.25%, 2/22/11 | 100,000 | 98,245 |
| Hewlett-Packard Co., 5.5%, 7/1/07 | 200,000 | 199,652 |
| TELECOMMUNICATIONS: 3.6% | ||
| AT & T Broadband, 8.375%, 3/15/13 | 200,000 | 222,416 |
| Sprint Capital Corp., 6.125%, 11/15/08 | 200,000 | 201,676 |
| Verizon New England, 6.5%, 9/15/11 | 150,000 | 150,210 |
| US TREASURY & AGENCY OBLIGATIONS: 17.4% | ||
| Fannie Mae, 3.25%, 8/15/08 | 400,000 | 382,692 |
| Fannie Mae, 4.625%, 10/15/13 | 125,000 | 118,628 |
| Federal Home Loan Bank, 4.375% 9/17/10 | 300,000 | 288,227 |
| Freddie Mac, 3.5%, 9/15/07 | 370,000 | 361,780 |
| US Treasury Note, 4.375%, 12/31/07 | 150,000 | 148,260 |
| US Treasury Note, 3.625%, 7/15/09 | 150,000 | 143,783 |
| US Treasury Note, 4%, 3/15/10 | 450,000 | 433,459 |
| US Treasury Note, 5%, 8/15/11 | 290,000 | 289,218 |
| US Treasury Note, 4.875%, 2/15/12 | 150,000 | 148,406 |
| US Treasury Note, 4%, 2/15/14 | 150,000 | 139,395 |
| US Treasury Note, 4.25%, 8/15/14 | 310,000 | 292,042 |
| TOTAL DEBT INSTRUMENTS (Cost $5,439,041) | $5,291,658 | |
| REPURCHASE AGREEMENT: 2.1% of net assets With Morgan Stanley and Company issued 6/30/06 at 4.40%, due 7/3/06, collateralized by $347,557 in United States Treasury Notes due 2/29/08. Proceeds at maturity are $339,124 (Cost $339,000). | $339,000 | |
| TOTAL INVESTMENTS: 99.4% of net assets (Cost $15,112,060) | $15,702,445 | |
| CASH AND RECEIVABLES LESS LIABILITIES: 0.6% of net assets | 91,458 | |
| NET ASSETS: 100% | $15,793,903 |
*Non-income producing
The Notes to Financial Statements are an integral part of these statements.
12 Semi-annual Report • June 30, 2006
Mosaic Equity Trust June 30, 2006
Mid-Cap Fund - Portfolio of Investments (unaudited)
NUMBER OF SHARES | VALUE | |
| COMMON STOCKS: 96.6% of net assets | ||
| BANKS: 3.5% | ||
| Synovus Financial Corp. | 175,970 | $4,712,477 |
| CONSUMER DISCRETIONARY: 17.9% | ||
| Apollo Group - CL A* | 64,710 | 3,343,566 |
| Cabela's Inc. - CL A* | 184,845 | 3,560,115 |
| CarMax Inc.* | 113,995 | 4,042,263 |
| Discovery Holding Co. - CL A* | 213,803 | 3,127,938 |
| Foot Locker, Inc. | 169,845 | 4,159,504 |
| Mohawk Industries Inc.* | 53,505 | 3,764,077 |
| Tiffany & Company | 59,980 | 1,980,540 |
| CONSUMER STAPLES: 8.2% | ||
| Clorox Company | 79,730 | 4,861,138 |
| Estee Lauder Co. - CL A | 69,520 | 2,688,338 |
| Sysco Corp. | 112,385 | 3,434,486 |
| FINANCIAL SERVICES: 5.3% | ||
| Janus Capital Group | 154,060 | 2,757,674 |
| SEI Investments Co. | 89,555 | 4,377,448 |
| HEALTH CARE: 11.2% | ||
| Charles River Laboratories* | 107,690 | 3,962,992 |
| Laboratory Corp of America* | 66,835 | 4,159,142 |
| Patterson Companies, Inc.* | 100,930 | 3,525,485 |
| Waters Corp.* | 77,325 | 3,433,230 |
| INDUSTRIAL: 13.3% | ||
| Autoliv Inc. | 65,915 | 3,728,812 |
| Cintas Corp. | 97,820 | 3,889,323 |
| Dover Corp. | 132,515 | 6,550,216 |
| Waste Management Inc. | 103,740 | 3,722,191 |
| INSURANCE: 14.2% | ||
| Markel Corp.* | 17,997 | 6,244,959 |
| Mercury General Corp. | 77,770 | 4,383,895 |
| Odyssey Reinsurance Holdings Corp. | 125,695 | 3,312,063 |
| White Mountains Insurance GP | 10,398 | 5,063,826 |
| MEDIA & ENTERTAINMENT: 9.3% | ||
| EW Scripps, Co. - CL A | 74,875 | 3,230,107 |
| International Game Technology | 117,600 | 4,461,744 |
| Liberty Global Inc. - CL C* | 114,876 | 2,362,999 |
| Valassis Communications Inc.* | 101,475 | 2,393,795 |
| TECHNOLOGY: 13.7% | ||
| Fiserv, Inc.* | 108,180 | 4,907,045 |
| FLIR Systems, Inc.* | 147,815 | 3,384,964 |
| Hewitt Associates Inc.* | 175,905 | 3,954,344 |
| Linear Technology Corp. | 100,935 | 3,380,313 |
| Zebra Technology Corp. - CL A* | 82,910 | 2,832,206 |
| TOTAL COMMON STOCKS (Cost $121,242,886) | $129,693,215 | |
| REPURCHASE AGREEMENT: 3.1% of net assets With Morgan Stanley and Company issued 6/30/06 at 4.40%, due 7/3/06, collateralized by $4,300,885 in United States Treasury Notes due 2/29/08. Proceeds at maturity are $4,196,538 (Cost $4,195,000). | 4,195,000 | |
| TOTAL INVESTMENTS: 99.7% of net assets (Cost $125,437,886) | $133,888,215 | |
| CASH AND RECEIVABLES LESS LIABILITIES: 0.3% of net assets | 435,031 | |
| NET ASSETS: 100% | $134,323,246 |
*Non-income producing
The Notes to Financial Statements are an integral part of these statements.
Mosaic Equity Trust 13
Mosaic Equity Trust June 30, 2006
Foresight Fund - Portfolio of Investments (unaudited)
NUMBER OF SHARES | VALUE | |
| COMMON STOCKS: 95.9% of net assets | ||
| BANKS 4.1% | ||
| Bank of New York Co. | 1,650 | $53,130 |
| Capital One Financial Corp. | 500 | 42,725 |
| Synovus Financial Corp. | 2,000 | 53,560 |
| CONSUMER DISCRETIONARY: 6.7% | ||
| Apollo Group - CL A* | 745 | 38,494 |
| Harley-Davidson Inc. | 1,035 | 56,811 |
| Home Depot, Inc. | 1,750 | 62,632 |
| McDonald's Corp. | 1,015 | 34,104 |
| Target Corp. | 1,010 | 49,359 |
| CONSUMER STAPLES: 9.1% | ||
| Clorox Co. | 550 | 33,533 |
| The Coca Cola Co. | 1,345 | 57,862 |
| Sysco Corp. | 3,000 | 91,680 |
| Walgreen Co. | 815 | 36,545 |
| Wal-Mart Stores Inc. | 2,255 | 108,623 |
| ENERGY: 10.3% | ||
| Chevron Corp. | 1,495 | 92,780 |
| Exxon Mobil Corp. | 1,420 | 87,117 |
| Schlumberger LTD | 1,500 | 97,665 |
| Transocean Inc.* | 1,150 | 92,368 |
| FINANCIAL SERVICES: 7.8% | ||
| Citigroup Inc. | 1,825 | 88,038 |
| Janus Capital Group | 3,100 | 55,490 |
| Morgan Stanley | 950 | 60,049 |
| Wells Fargo & Co. | 1,130 | 75,800 |
| HEALTH CARE: 12.3% | ||
| Amgen, Inc.* | 1,350 | 88,061 |
| Charles River Laboratories* | 1,730 | 63,664 |
| Johnson & Johnson | 1,500 | 89,880 |
| Novartis AG - ADR | 1,000 | 53,920 |
| Stryker Corp. | 1,195 | 50,321 |
| United Healthcare Group | 1,150 | 51,497 |
| Waters Corp.* | 1,000 | 44,400 |
| INDUSTRIAL: 11.0% | ||
| Cintas Corp. | 1,300 | 51,688 |
| Dover Corp. | 1,900 | 93,917 |
| General Electric Co. | 3,100 | 102,176 |
| Tyco International LTD | 2,500 | &68,750 |
| United Parcel Service - CL B | 950 | 78,214 |
| INSURANCE: 8.5% | ||
| American International Group | 825 | 48,716 |
| Berkshire Hathaway - CL B* | 25 | 76,075 |
| MGIC Investment Corp. | 830 | 53,950 |
| Markel Corp.* | 175 | 60,725 |
| Marsh & McLennan Co. | 2,500 | 67,225 |
| MATERIALS: 3.2% | ||
| Ball Corp. | 1,900 | 70,376 |
| Sigman-Aldrich | 600 | 43,584 |
| MEDIA & ENTERTAINMENT: 3.0% | ||
| Comcast Corp. - Special CL A* | 1,390 | 45,564 |
| Liberty Media Interactive - CL A* | 1,866 | 32,207 |
| Viacom Inc. - CL B | 900 | 32,256 |
| TECHNOLOGY: 14.1% | ||
| Cisco Systems, Inc.* | 1,675 | 32,713 |
| eBay Inc. | 1,800 | 52,722 |
| Fiserv Inc.* | 1,400 | 63,504 |
| FLIR Systems, Inc* | 2,350 | 53,815 |
| Intel Corp. | 2,925 | 55,429 |
| International Business Machines Corp. | 750 | 57,615 |
| Linear Technology Corp. | 1,575 | 52,747 |
| Microsoft Corp. | 3,730 | 86,909 |
| Symantec Corp* | 3,400 | 52,836 |
| TELECOMMUNICATIONS: 3.1% | ||
| Mobile Telesystems-SP ADR | 1,150 | 33,856 |
| Verizon Communications Inc. | 1,185 | &39,686 |
| Vodafone Group, ADR | 1,850 | 39,405 |
| UTILITIES: 2.7% | ||
| Exelon Corp. | 925 | 52,568 |
| FPL Group, Inc. | 1,100 | 45,518 |
| TOTAL COMMON STOCKS (Cost $3,422,289) | $3,454,854 | |
| REPURCHASE AGREEMENT: 4.2% of net assets With Morgan Stanley and Company issued 6/30/06 at 4.40%, due 7/3/06, collateralized by $156,862 in United States Treasury Notes due 2/29/08. Proceeds at maturity are $153,056 (Cost $153,000). |
| 153,000 |
| TOTAL INVESTMENTS: 100% of net assets (Cost $3,575,289) | $3,607,854 | |
| LIABILITIES LESS CASH AND RECEIVABLES: (0.1)% of net assets |
| (4,568) |
| NET ASSETS: 100% | $3,603,286 |
*Non-income producing
The Notes to Financial Statements are an integral part of these statements.
Mosaic Equity Trust 15
Mosaic Equity Trust June 30, 2006
Statements of Assets and Liabilities (unaudited)
June 30, 2006
Investors Fund | Balanced Fund | Mid-Cap | Foresight Fund | |
| ASSETS | ||||
| Investments, at value (Notes 1 and 2) | ||||
| Investment securities | $120,847,394 | $15,363,445 | $129,693,215 | $3,454,854 |
| Repurchase agreements | 2,165,000 | 339,000 | 4,195,000 | 153,000 |
| Total investments* | 123,012,394 | 15,702,445 | 133,888,215 | 3,607,854 |
| Cash | 274 | 940 | 192 | 236 |
| Receivables | ||||
| Investment securities sold | 1,171,991 | 97,967 | 1,258,542 | -- |
| Dividends and interest | 28,164 | 78,518 | 55,524 | 3,799 |
| Capital shares sold | 86,081 | 165 | 384,262 | -- |
| Total assets | 124,298,904 | 15,880,035 | 135,586,735 | 3,611,889 |
| LIABILITIES | ||||
| Payables | ||||
| Investment securities purchased | 687,873 | 56,081 | 227,480 | 6,499 |
| Dividends | -- | 3,538 | -- | -- |
| Capital shares redeemed | 70,446 | 22,678 | 1,023,151 | -- |
| Independent trustee and auditor fees | 11,625 | 3,835 | 12,858 | 2,104 |
| Total liabilities | 769,944 | 86,132 | 1,263,489 | 8,603 |
| NET ASSETS | $123,528,960 | $15,793,903 | $134,323,246 | $3,603,286 |
| Net assets consists of: | ||||
| Paid in capital | 108,784,154 | 14,695,830 | 116,086,673 | 3,421,202 |
| Undistributed net investment income (loss) | 243,213 | -- | (168,738) | 8,709 |
| Accumulated net realized gains | 6,957,890 | 507,688 | 9,954,982 | 140,810 |
| Net unrealized appreciation on investments | 7,543,703 | 590,385 | 8,450,329 | 32,565 |
| Net Assets | $123,528,960 | $15,793,903 | $134,323,246 | $3,603,286 |
| CAPITAL SHARES OUTSTANDING | ||||
| An unlimited number of capital shares, without par value, are authorized (Note 7) | 6,382,198 | 897,225 | 10,828,221 | 277,849 |
| NET ASSETS VALUE PER SHARE | $19.36 | $17.60 | $12.40 | $12.97 |
| *INVESTMENT SECURITIES, AT COST | $115,468,691 | $15,112,060 | $125,437,886 | $3,575,289 |
The Notes to Financial Statements are an integral part of these statements.
16 Semi-annual Report • June 30, 2006
Mosaic Equity Trust June 30, 2006
Statements of Operations (unaudited)
For the six-months ended June 30, 2006
Investors Fund | Balanced Fund | Mid-Cap Fund | Foresight Fund | |
| INVESTMENT INCOME (Note 1) | ||||
| Interest income | $70,160 | $131,773 | $123,564 | $3,561 |
| Dividend income | 754,297 | 65,837 | 606,743 | 28,605 |
| Total investment income | 824,457 | 197,610 | 730,307 | 32,166 |
| EXPENSES (Notes 3 and 5) | ||||
| Investment advisory fees | 460,300 | 62,267 | 537,777 | 13,801 |
| Other expenses | ||||
| Service agreement fees | 143,515 | 34,039 | 344,160 | 7,177 |
| Independent trustee and auditor fees | 15,125 | 4,710 | 17,108 | 2,479 |
| Total other expenses | 158,640 | 38,749 | 361,268 | 9,656 |
| Total expenses | 618,940 | 101,016 | 899,045 | 23,457 |
| NET INVESTMENT INCOME (LOSS) | 205,517 | 96,594 | (168,738) | 8,709 |
| REALIZED AND UNREALIZED GAIN (LOSS) ON INVESTMENTS | ||||
| Net realized gain on investments | 4,655,099 | 398,341 | 5,500,392 | 105,827 |
| Change in net unrealized depreciation of investments | (986,191) | (175,628) | (53,408) | (648) |
| NET GAIN ON INVESTMENTS | 3,668,908 | 222,713 | 5,446,984 | 105,179 |
| TOTAL INCREASE IN NET ASSETS RESULTING FROM OPERATIONS | $3,874,425 | $319,307 | $5,278,246 | $113,888 |
The Notes to Financial Statements are an integral part of these statements.
Mosaic Equity Trust 17
Mosaic Equity Trust June 30, 2006
Statements of Changes in Net Assets
For the period indicated
Investors Fund | Balanced Fund | |||
(unaudited) Six-Months Ended | Year | (unaudited) Six-Months Ended | Year | |
| INCREASE (DECREASE) IN NET ASSETS RESULTING FROM OPERATIONS | ||||
| Net investment income | $205,517 | $437,696 | $96,594 | $193,338 |
| Net realized gain on investments | 4,655,099 | 13,769,312 | 398,341 | 1,847,257 |
| Net unrealized depreciation on investments | (986,191) | (18,745,361) | (175,628) | (2,641,040) |
| Total increase (decrease) in net assets resulting from operations | 3,874,425 | (4,538,353) | 319,307 | (600,445) |
| DISTRIBUTIONS TO SHAREHOLDERS | ||||
| From net investment income | -- | (400,000) | (96,594) | (193,338) |
| From net capital gains | -- | (9,212,618) | -- | (1,402,398) |
| Total distributions | -- | (9,612,618) | (96,594) | (1,595,736) |
| CAPITAL SHARE TRANSACTIONS (Note 7) | (10,684,597) | (19,630,796) | (1,942,880) | (6,687,441) |
| TOTAL INCREASE (DECREASE) IN NET ASSETS | (6,810,172) | (33,781,767) | (1,720,167) | (8,883,622) |
| NET ASSETS | ||||
| Beginning of period | $130,339,132 | $164,120,899 | $17,514,070 | $26,397,692 |
| End of period | $123,528,960 | $130,339,132 | $15,793,903 | $17,514,070 |
The Notes to Financial Statements are an integral part of these statements.
18 Semi-annual Report • June 30, 2006
Mid-Cap Fund | Foresight Fund | |||
(unaudited) Six-Months Ended | Year | (unaudited) Six-Months Ended | Year | |
| INCREASE (DECREASE) IN NET ASSETS RESULTING FROM OPERATIONS | ||||
| Net investment income (loss) | $(168,738) | $(517,222) | $8,709 | $11,531 |
| Net realized gain on investments | 5,500,392 | 11,440,485 | 105,827 | 356,922 |
| Net unrealized appreciation (depreciation) on investments | (53,408) | (9,442,220) | (648) | (484,540) |
| Total increase (decrease) in net assets resulting from operations | 5,278,246 | 1,481,043 | 113,888 | (116,087) |
| DISTRIBUTIONS TO SHAREHOLDERS | ||||
| From net investment income | -- | -- | -- | (11,531) |
| From net capital gains | -- | (7,235,848) | -- | (149,798) |
| Total distributions | -- | (7,235,848) | -- | (161,329) |
| CAPITAL SHARE TRANSACTIONS (Note 7) | (17,220,964) | 36,212,109 | (118,960) | (903,553) |
| TOTAL INCREASE (DECREASE) IN NET ASSETS | (11,942,718) | 30,457,304 | (5,072) | (1,180,969) |
| NET ASSETS | ||||
| Beginning of period | $146,265,964 | $115,808,660 | $3,608,358 | $4,789,327 |
| End of period | $134,323,246 | $146,265,964 | $3,603,286 | $3,608,358 |
The Notes to Financial Statements are an integral part of these statements.
Mosaic Equity Trust 19
Mosaic Equity Trust
Selected data for a share outstanding for the periods indicated.
INVESTORS FUND
(unaudited) | Year Ended December 31, | ||||
2006 | 2005 | 2004 | 2003 | 2002 | |
| Net asset value, beginning of year | $18.81 | $20.82 | $18.79 | $15.42 | $18.61 |
| Investment operations: | |||||
| Net investment income | 0.03 | 0.06 | 0.13 | 0.04 | 0.04 |
| Net realized and unrealized gain (loss) on investments | 0.52 | (0.62) | 2.03 | 3.37 | (3.19) |
| Total from investment operations | 0.55 | (0.56) | 2.16 | 3.41 | (3.15) |
| Less distributions: | |||||
| From net investment income | -- | (0.06) | (0.13) | (0.04) | (0.04) |
| From net capital gains | -- | (1.39) | -- | -- | -- |
| Total distributions | -- | (1.45) | (0.13) | (0.04) | (0.04) |
| Net asset value, end of year | $19.36 | $18.81 | $20.82 | $18.79 | $15.42 |
| Total return (%) | 2.92 | (2.81) | 11.49 | 22.14 | (16.94) |
| Ratios and supplemental data | |||||
| Net assets, end of year (in thousands) | $123,529 | $130,339 | $164,121 | $124,963 | $95,219 |
| Ratio of expenses to average net assets (%) | 0.951 | 0.94 | 0.88 | 0.88 | 0.99 |
| Ratio of net investment income to average net assets (%) | 0.321 | 0.29 | 0.70 | 0.27 | 0.44 |
| Portfolio turnover (%) | 21 | 41 | 40 | 29 | 88 |
BALANCED FUND
(unaudited) | Year Ended December 31, | ||||
2006 | 2005 | 2004 | 2003 | 2002 | |
| Net asset value, beginning of year | $17.40 | $19.51 | $18.22 | $15.98 | $17.87 |
| Investment operations: | |||||
| Net investment income | 0.11 | 0.18 | 0.20 | 0.19 | 0.26 |
| Net realized and unrealized gain (loss) on investments | 0.20 | (0.60) | 1.29 | 2.24 | (1.89) |
| Total from investment operations | 0.31 | (0.42) | 1.49 | 2.43 | (1.63) |
| Less distributions: | |||||
| From net investment income | (0.11) | (0.18) | (0.20) | (0.19) | (0.26) |
| From net capital gains | -- | (1.51) | -- | -- | -- |
| Total distributions | (0.11) | (1.69) | (0.20) | (0.19) | (0.26) |
| Net asset value, end of year | $17.60 | $17.40 | $19.51 | $18.22 | $15.98 |
| Total return (%) | 1.75 | (2.16) | 8.19 | 15.29 | (9.13) |
| Ratios and supplemental data | |||||
| Net assets, end of year (in thousands) | $15,794 | $17,514 | $26,398 | $24,411 | $20,886 |
| Ratio of expenses to average net assets (%) | 1.211 | 1.21 | 1.20 | 1.20 | 1.20 |
| Ratio of net investment income to average net assets (%) | 1.151 | 0.88 | 1.06 | 1.01 | 1.56 |
| Portfolio turnover (%) | 22 | 34 | 38 | 43 | 37 |
1Annualized.
The Notes to Financial Statements are an integral part of these statements.
20 Semi-annual Report • June 30, 2006
MID-CAP FUND
(unaudited) | Year Ended December 31, | ||||
2006 | 2005 | 2004 | 2003 | 2002 | |
| Net asset value beginning of year | $11.99 | $12.52 | $11.06 | $8.69 | $10.04 |
| Investment operations: | |||||
| Net investment income (loss) | (0.01) | (0.05) | (0.01) | (0.03) | (0.03) |
| Net realized and unrealized gain (loss) on investments | 0.42 | 0.12 | 2.10 | 2.51 | (1.26) |
| Total from investment operations | 0.41 | 0.07 | 2.09 | 2.48 | (1.29) |
| Less distributions: | |||||
| From net investment income | -- | -- | -- | -- | -- |
| From net capital gains | -- | (0.60) | (0.63) | (0.11) | (0.06) |
| Total distributions | -- | (0.60) | (0.63) | (0.11) | (0.06) |
| Net asset value, end of year | $12.40 | $11.99 | $12.52 | $11.06 | $8.69 |
| Total return (%) | 3.42 | 0.55 | 18.90 | 28.53 | (12.87) |
| Ratios and supplemental data | |||||
| Net assets, end of year (in thousands) | $134,323 | $146,266 | $115,809 | $54,675 | $26,202 |
| Ratio of expenses to average net assets (%) | 1.241 | 1.25 | 1.24 | 1.25 | 1.24 |
| Ratio of net investment income (loss) to average net assets (%) | (0.23)1 | (0.37) | (0.09) | (0.44) | (0.42) |
| Portfolio turnover (%) | 31 | 46 | 38 | 25 | 35 |
FORESIGHT FUND
(unaudited) | Year Ended December 31, | ||||
2006 | 2005 | 2004 | 2003 | 2002 | |
| Net asset value beginning of year | $12.61 | $13.38 | $12.59 | $10.79 | $12.60 |
| Investment operations: | |||||
| Net investment income | 0.03 | 0.03 | 0.07 | 0.01 | 0.02 |
| Net realized and unrealized gain (loss) on investments | 0.33 | (0.35) | 0.79 | 1.80 | (1.81) |
| Total from investment operations | 0.36 | (0.32) | 0.86 | 1.81 | (1.79) |
| Less distributions: | |||||
| From net investment income | -- | (0.03) | (0.07) | (0.01) | (0.02) |
| From net capital gains | -- | (0.42) | -- | -- | -- |
| Total distributions | -- | (0.45) | (0.07) | (0.01) | (0.02) |
| Net asset value, end of year | $12.97 | $12.61 | $13.38 | $12.59 | $10.79 |
| Total return (%) | 2.85 | (2.34) | 6.83 | 16.73 | (14.17) |
| Ratios and supplemental data | |||||
| Net assets, end of year (in thousands) | $3,603 | $3,608 | $4,789 | $4,741 | $3,925 |
| Ratio of expenses to average net assets (%) | 1.271 | 1.25 | 1.25 | 1.25 | 1.25 |
| Ratio of net investment income to average net assets (%) | 0.471 | 0.24 | 0.54 | 0.04 | 0.21 |
| Portfolio turnover (%) | 39 | 122 | 39 | 7 | 8 |
1Annualized.
The Notes to Financial Statements are an integral part of these statements.
Mosaic Equity Trust 21
Mosaic Equity Trust June 30, 2006
1. Summary of Significant Accounting Policies. Mosaic Equity Trust (the "Trust") is registered with the Securities and Exchange Commission under the Investment Company Act of 1940 as an open-end, investment management company. This report contains information about four separate funds (the "Funds"): the Investors Fund, Balanced Fund, Mid-Cap Fund and Foresight Fund whose objectives and strategies are described in the Trust's prospectus for the Funds. A fifth Mosaic Equity Trust portfolio, available to certain institutional investors (as defined in the portfolio's prospectus) presents its financial information in a separate report.
Securities Valuation: Securities traded on a national securities exchange are valued at their closing sale price. Repurchase agreements and other securities having maturities of 60 days or less are valued at amortized cost, which approximates market value. Securities having longer maturities, for which quotations are readily available, are valued at the mean between their closing bid and ask prices. Securities for which market quotations are not readily available are valued at their fair value as determined in good faith under procedures approved by the Board of Trustees.
Investment Transactions: Investment transactions are recorded on a trade date basis. The cost of investments sold is determined on the identified cost basis for financial statement and federal income tax purposes.
Investment Income: Interest income is recorded on an accrual basis. Bond premium is amortized and original issue discount and market discount are accreted over the expected life of each applicable security using the effective interest method. Dividend income is recorded net of applicable withholding taxes on the ex-dividend date. Other income is accrued as earned.
Distribution of Income and Gains: Distributions are recorded on the ex-dividend date. Net investment income, determined as gross investment income less total expenses, is declared as a regular dividend and distributed to shareholders at year-end for the Investors, Mid-Cap and Foresight Funds. The Trust intends to declare and pay regular dividends quarterly on the Balanced Fund. Capital gain distributions, if any, are declared and paid annually at year-end.
The tax character of distributions paid during 2005 and 2004 were as follows:
2005 | 2004 | |
| Investors Fund: | ||
| Distributions paid from: | ||
| Ordinary income | $400,000 | $1,015,133 |
| Long-term capital gains | 9,212,618 | -- |
| Balanced Fund: | ||
| Distributions paid from: | ||
| Ordinary income | $193,338 | $266,061 |
| Long-term capital gains | 1,402,398 | -- |
| Mid-Cap Fund: | ||
| Distributions paid from: | ||
| Short-term capital gains | $1,330,354 | $1,278,809 |
| Long-term capital gains | 5,905,494 | 4,269,314 |
| Foresight Fund: | ||
| Distributions paid from: | ||
| Ordinary income | $11,531 | $25,039 |
| Long-term capital gains | 149,798 | -- |
The Investors Fund, Balanced Fund, Mid-Cap Fund and Foresight Fund designate 100%, 79%, 40% and 100%, respectively, of dividends declared from net investment income and short-term capital gains during the fiscal year ended December 31, 2005 as qualified income under the Jobs and Growth Tax Relief Reconciliation Act of 2003.
22 Semi-annual Report • June 30, 2006
Notes to Financial Statements (continued)
As of June 30, 2006, the components of distributable earnings on a tax basis were as follows (unaudited):
| Investors Fund: | |
| Undistributed net investment income | $243,213 |
| Accumulated net realized gains | 6,957,890 |
| Net unrealized appreciation on investments | 7,543,703 |
$14,744,806 | |
| Balanced Fund: | |
| Accumulated net realized gains | $507,688 |
| Net unrealized appreciation on investments | 590,385 |
$1,098,073 | |
| Mid-Cap Fund: | |
| Accumulated net realized gains | $9,786,244 |
| Net unrealized appreciation on investments | 8,450,329 |
$18,236,573 | |
| Foresight Fund: | |
| Undistributed net investment income | $8,709 |
| Accumulated net realized gains | 140,810 |
| Net unrealized appreciation on investments | 32,565 |
$182,084 |
Net realized gains or losses may differ for financial and tax reporting purposes as a result of loss deferrals related to wash sales and post-October transactions.
Income Tax: No provision is made for federal income taxes since it is the intention of the Funds to comply with the provisions of the Internal Revenue Code available to investment companies and to make the requisite distribution to shareholders of taxable income which will be sufficient to relieve it from all or substantially all income taxes. As of December 31, 2005, capital loss carryovers available to offset future capital gains for federal income tax purposes is $316,107 for the Investors Fund expiring December 31, 2010.
This loss was acquired through its merger with Mosaic Focus Fund on July 1, 2002 and is subject to certain limitations.
Use of Estimates: The preparation of the financial statements in conformity with accounting principles generally accepted in the United States of America requires management to make estimates and assumptions. Such estimates affect the reported amounts of assets and liabilities and reported amounts of increases and decreases in net assets from operations during the reporting period. Actual results could differ from those estimates.
2. Investments in Repurchase Agreements. When the Funds purchase securities under agreements to resell, the securities are held for safekeeping by the custodian bank as collateral. Should the market value of the securities purchased under such an agreement decrease below the principal amount to be received at the termination of the agreement plus accrued interest, the counterparty is required to place an equivalent amount of additional securities in safekeeping with the Trust's custodian bank. Pursuant to an Exemptive Order issued by the Securities and Exchange Commission, the Funds, along with other registered investment companies having Advisory and Services Agreements with the same advisor, transfers uninvested cash balances into a joint trading account. The aggregate balance in this joint trading account is invested in one or more consolidated repurchase agreements whose underlying securities are U.S. Treasury or federal agency obligations. On the date of this report, the Investors Fund had approximately a 18.5% interest, the Balanced Fund approximately a 2.9% interest, the Mid-Cap Fund approximately a 35.8% interest and the Foresight Fund approximately a 1.3% interest in the consolidated repurchase agreement of $11,732,000 collateralized by $12,028,124 in United States Treasury Notes. Proceeds at maturity were $11,736,302.
3. Investment Advisory Fees and Other Transactions with Affiliates. The investment advisor to the Trust, Madison Mosaic, LLC, a wholly owned subsidiary of Madison Investment Advisors, Inc. (collectively "the Advisor"), earns an advisory fee equal to 0.75% per annum of the average net assets of the Balanced, Mid-Cap and Foresight Funds and the first $100 million
Mosaic Equity Trust 23
Notes to Financial Statements (continued)
in the Investors Fund. The advisory fee paid by the Investors Fund is reduced to 0.60% per annum on assets over $100 million. The fees are accrued daily and are paid monthly.
4. Investment Transactions. Purchases and sales of securities (excluding short-term securities) for the six-months ended June 30, 2006 were as follows:
Purchases | Sales | |
| Investors Fund: | ||
| U. S. Gov't Securities | -- | -- |
| Other | $26,189,853 | $35,836,127 |
| Balanced Fund: | ||
| U. S. Gov't Securities | $819,505 | $563,488 |
| Other | $2,726,900 | $4,972,272 |
| Mid-Cap Fund: | ||
| U. S. Gov't Securities | -- | -- |
| Other | $42,232,546 | $61,725,310 |
| Foresight Fund: | ||
| U. S. Gov't Securities | -- | -- |
| Other | $1,388,686 | $1,473,816 |
5. Other Expenses. Under a separate Services Agreement, the Advisor will provide or arrange for each fund to have all other necessary operational and support services for a fee based on a percentage of average net assets. These fees are accrued daily and paid monthly. This percentage is 0.41% for the Balanced Fund and 0.39% for the Foresight Fund. For the Investors Fund, this fee is 0.23% on the first $100 million and 0.20% on all assets greater than $100 million. For the Mid-Cap Fund, this fee is 0.48% on the first $150 million and 0.45% on all assets greater than $150 million.
The Funds also pay the expenses of the Fund's Independent Trustees and auditors directly. For the six-months ended June 30, 2006, these fees amounted to $15,125, $4,710, $17,108 and $2,479 for the Investors, Balanced, Mid-Cap and Foresight Funds, respectively.
6. Aggregate Cost and Unrealized Appreciation (Depreciation). The aggregate cost for federal income tax purposes and the net unrealized appreciation (depreciation) are as follows as of June 30, 2006 (unaudited):
Investors Fund | Balanced Fund | |
| Aggregate Cost | $115,468,691 | $15,112,060 |
| Gross unrealized appreciation | 11,135,032 | 1,060,241 |
| Gross unrealized depreciation | (3,591,329) | (469,856) |
| Net unrealized appreciation | $7,543,703 | $590,385 |
Mid-Cap Fund | Foresight Fund | |
| Aggregate Cost | $125,437,886 | $3,575,289 |
| Gross unrealized appreciation | 12,956,463 | 162,116 |
| Gross unrealized depreciation | (4,506,134) | (129,551) |
| Net unrealized appreciation | $8,450,329 | $32,565 |
7. Capital Share Transactions. An unlimited number of capital shares, without par value, are authorized. Transactions in capital shares were as follows:
(unaudited) | Year Ended December 31, | |
| Investors Fund | 2006 | 2005 |
| In Dollars | ||
| Shares sold | $9,442,563 | $31,050,574 |
| Shares issued in reinvestment of dividends | -- | 6,784,683 |
| Total shares issued | 9,442,563 | 37,835,257 |
| Shares redeemed | (20,127,160) | (57,466,053) |
| Net decrease | $(10,684,597) | $(19,630,796) |
| In Shares | ||
| Shares sold | 486,994 | 1,534,905 |
| Shares issued in reinvestment of dividends | -- | 355,219 |
| Total shares issued | 486,994 | 1,890,124 |
| Shares redeemed | (1,035,447) | (2,843,374) |
| Net decrease | (548,453) | (953,250) |
24 Semi-annual Report • June 30, 2006
Notes to Financial Statements (continued)
(unaudited) | Year Ended December 31, | |
| Balanced Fund | 2006 | 2005 |
| In Dollars | ||
| Shares sold | $374,606 | $2,025,363 |
| Shares issued in reinvestment of dividends | 89,553 | 1,501,715 |
| Total shares issued | 464,159 | 3,527,078 |
| Shares redeemed | (2,407,039) | (10,214,519) |
| Net decrease | $(1,942,880) | $(6,687,441) |
| In Shares | ||
| Shares sold | 21,105 | 105,991 |
| Shares issued in reinvestment of dividends | 5,056 | 85,679 |
| Total shares issued | 26,161 | 191,670 |
| Shares redeemed | (135,435) | (538,007) |
| Net decrease | (109,274) | (346,337) |
(unaudited) | Year Ended December 31, | |
| Mid-Cap Fund | 2006 | 2005 |
| In Dollars | ||
| Shares sold | $19,196,166 | $66,567,902 |
| Shares issued in reinvestment of dividends | -- | 7,071,259 |
| Total shares issued | 19,196,166 | 73,639,161 |
| Shares redeemed | (36,417,130) | (37,427,052) |
| Net increase (decrease) | $(17,220,964) | $36,212,109 |
| In Shares | ||
| Shares sold | 1,543,294 | 5,386,599 |
| Shares issued in reinvestment of dividends | -- | 586,340 |
| Total shares issued | 1,543,294 | 5,972,939 |
| Shares redeemed | (2,917,858) | (3,022,565) |
| Net increase (decrease) | (1,374,564) | 2,950,374 |
(unaudited) | Year Ended December 31, | |
| Foresight Fund | 2006 | 2005 |
| In Dollars | ||
| Shares sold | $572,645 | |
| Shares issued in reinvestment of dividends | -- | 159,506 |
| Total shares issued | 440,338 | 732,151 |
| Shares redeemed | (559,298) | (1,635,704) |
| Net decrease | $(118,960) | $(903,553) |
| In Shares | ||
| Shares sold | 34,192 | 43,865 |
| Shares issued in reinvestment of dividends | -- | 12,649 |
| Total shares issued | 34,192 | 56,514 |
| Shares redeemed | (42,630) | (128,294) |
| Net decrease | (8,438) | (71,780) |
Mosaic Equity Trust 25
Notes to Financial Statements (continued)
Fund Expenses (unaudited)
Example: As a shareholder of one of the Funds, you incur two types of costs: (1) transaction costs and (2) ongoing costs, including Investment advisory fees and Other expenses. This Example is intended to help you understand your ongoing costs (in dollars) of investing in any Fund and to compare these costs with the ongoing costs of investing in other mutual funds. See footnotes 3 and 5 above for an explanation of the types of costs charged by the Funds. This Example is based on an investment of $1,000 invested on January 1, 2006 and held for the six-months ended June 30, 2006.
Actual Expenses
The table below titled "Based on Actual Total Return" provides information about actual account values and actual expenses. You may use the information provided in this table, together with the amount you invested, to estimate the expenses that you paid over the period. To estimate the expenses you paid on your account, divide your ending account value by $1,000 (for example, an $8,500 ending account valued divided by $1,000 = 8.5), then multiply the result by the number under the heading entitled "Expenses Paid During the Period."
| Based on Actual Total Return1 | |||||
Actual Total Return2 | Beginning Account Value | Ending Account Value | Annualized Expense Ratio3 | Expenses Paid During the Period3 | |
| Investors Fund | 2.92% | $1,000.00 | $1,029.24 | 0.95% | $4.88 |
| Balanced Fund | 1.75% | $1,000.00 | $1,017.53 | 1.21% | $6.10 |
| Mid-Cap Fund | 3.42% | $1,000.00 | $1,034.20 | 1.24% | $6.41 |
| Foresight Fund | 2.85% | $1,000.00 | $1,028.55 | 1.27% | $6.47 |
| 1For the six months ended June 30, 2006. 2Assumes reinvestment of all dividends and capital gains distributions, if any, at net asset value. 3Expenses are equal to the Fund's annualized expense ratio multiplied by the average account value over the period, multiplied by the number of days in the most recent fiscal half-year, then divided by 365. | |||||
Hypothetical Example for Comparison Purposes
The table below titled "Based on Hypothetical Total Return" provides information about hypothetical account values and hypothetical expenses based on the actual expense ratio and an assumed rate of return of 5.00% per year before expenses, which is not any fund's actual return. The hypothetical account values and expenses may not be used to estimate the actual ending account balance or expenses you paid for the period. You may use the information provided in this table to compare the ongoing costs of investing in a fund offered by the Trust and other funds. To do so, compare the 5.00% hypothetical example relating to the applicable Fund with the 5.00% hypothetical examples that appear in the shareholder reports of the other funds.
26 Semi-annual Report • June 30, 2006
Notes to Financial Statements (concluded)
| Based on Hypothetical Total Return1 | |||||
Hypothetical Annualized Total Return | Beginning Account Value | Ending Account Value | Annualized Expense Ratio2 | Expenses Paid During the Period2 | |
| Investors Fund | 5.00% | $1,000.00 | $1,025.05 | 0.95% | $4.79 |
| Balanced Fund | 5.00% | $1,000.00 | $1,025.05 | 1.21% | $6.06 |
| Mid-Cap Fund | 5.00% | $1,000.00 | $1,025.05 | 1.24% | $6.25 |
| Foresight Fund | 5.00% | $1,000.00 | $1,025.05 | 1.27% | $6.36 |
| 1For the six months ended June 30, 2006. 2Expenses are equal to the Fund's annualized expense ratio multiplied by the average account value over the period, multiplied by the number of days in the most recent fiscal half-year, then divided by 365. | |||||
Forward-Looking Statement Disclosure. One of our most important responsibilities as mutual fund managers is to communicate with shareholders in an open and direct manner. Some of our comments in our letters to shareholders are based on current management expectations and are considered "forward-looking statements." Actual future results, however, may prove to be different from our expectations. You can identify forward-looking statements by words such as "estimate," "may," "will," "expect," "believe," "plan" and other similar terms. We cannot promise future returns. Our opinions are a reflection of our best judgment at the time this report is compiled, and we disclaim any obligation to update or alter forward-looking statements as a result of new information, future events, or otherwise.
Proxy Voting Information. The Trust adopted policies that provide guidance and set forth parameters for the voting of proxies relating to securities held in the Trust's portfolios. Additionally, information regarding how the Trust voted proxies related to portfolio securities for the period ended June 30, 2006 is available. These policies and voting information are available to you upon request and free of charge by writing to Mosaic Funds, 550 Science Drive, Madison, WI 53711 or by calling toll-free at 1-800-368-3195. The Trust's proxy voting policies and voting information may also be obtained by visiting the Securities and Exchange Commission web site at www.sec.gov. The Trust will respond to shareholder requests for copies of our policies and voting information within two business days of request by first-class mail or other means designed to ensure prompt delivery.
N-Q Disclosure. The Trust files its complete schedule of portfolio holdings with the U.S. Securities and Exchange Commission (the "Commission") for the first and third quarters of each fiscal year on Form N-Q. The Trust's Forms N-Q are available on the Commission's website. The Trust's Forms N-Q may be reviewed and copied at the Commission's Public Reference Room in Washington, DC. Information about the operation of the Public Reference Room may be obtained by calling the Commission at 1-202-942-8090. Form N-Q and other information about the Trust are available on the EDGAR Database on the Commission's Internet site at http://www.sec.gov. Copies of this information may also be obtained, upon payment of a duplicating fee, by electronic request at the following email address: publicinfo@sec.gov, or by writing the Commission's Public Reference Section, Washington, DC 20549-0102. Finally, you may call Mosaic at 800-368-3195 if you would like a copy of Form N-Q and we will mail one to you at no charge.
Mosaic Equity Trust 27
This page was left blank intentionally.
28 Semi-annual Report • June 30, 2006
The Mosaic Family of Mutual Funds
Mosaic Equity Trust
Mosaic Investors Fund
Mosaic Balanced Fund
Mosaic Mid-Cap Fund
Mosaic Foresight Fund
Madison Institutional Equity Option Fund
Mosaic Income Trust
Mosaic Government Fund
Mosaic Intermediate Income Fund
Mosaic Institutional Bond Fund
Mosaic Tax-Free Trust
Mosaic Virginia Tax-Free Fund
Mosaic Tax-Free National Fund
Mosaic Government Money Market
For more complete information on any Mosaic fund, including charges and expenses, request a prospectus by calling 1-800-368-3195. Read it carefully before you invest or send money. This document does not constitute an offering by the distributor in any jurisdiction in which such offering may not be lawfully made. Mosaic Funds Distributor, LLC.
TRANSER AGENT
Mosaic Funds
c/o US Bancorp Fund Services, LLC
P.O. Box 701
Milwaukee, WI 53201-0701
TELEPHONE NUMBERS
Shareholder Service
Toll-free nationwide: 888-670-3600
Mosaic Tiles (24 hour automated information)
Toll-free nationwide: 800-336-3600
550 Science Drive
Madison, Wisconsin 53711
Mosaic Funds
www.mosaicfunds.com
SEC File Number 811-03615
Semi-Annual Report (unaudited)
June 30, 2006
Madison Institutional Equity Option Fund (MADOX)
Active Equity Management combined with a Covered Call Option Strategy
Madison Investment Advisors, Inc.
www.madisonfunds.com
MADOX | Madison Institutional Equity Option Fund
Table of Contents
| Portfolio Manager Review | 1 |
| Portfolio of Investments | 2 |
| Statement of Assets and Liabilities | 5 |
| Statement of Operations | 6 |
| Statement of Changes in Net Assets | 7 |
| Financial Highlights | 8 |
| Notes to Financial Statements | 9 |
MADOX | Madison Institutional Equity Option Fund
Madison Institutional Equity Option Fund (the "Fund") commenced operations on March 31, 2006, offering institutional options writing management and personal service previously only available in closed end funds. The Fund's objective is to achieve consistent long-term returns that compare favorably with stock market averages, but with downside protection, meaningful income production, and considerably less volatility.
Early Performance
The Fund started at a clearly disadvantageous time, as stocks generally tumbled in the second quarter. However, in the Fund's early days, substantial cash balances were present during the "invest up" stage which conveniently helped defend against the broad decline. Consumer stocks have suffered in recent months, owing to fears that the economy was entering a slowdown, in part due to rising interest rates and oil prices. The Fund was also affected by the significant decline in the Nasdaq index, which declined almost 12% from the first week of May through mid-July.
Outlook
Much of the income and return provided by the Fund will come from option premiums. Option premium return is earned over time and, thus, most of the options written will generate income later in 2006 and especially in 2007. We currently expect a decent year-end stock market rally, assuming a stable economy and the long rise in interest rates by the Fed coming to an end. This should result in a bounceback from the recent decline.
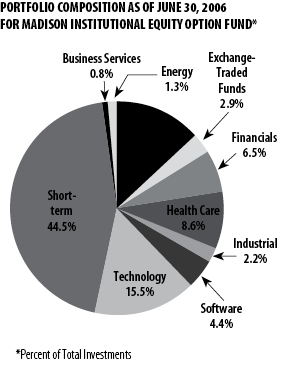
TOP TEN HOLDINGS AS OF JUNE 30, 2006
FOR MADISON INSTITUTIONAL EQUITY OPTION FUND
% of net assets | |
| Nasdaq-100 Index Tracking Stock | 3.23% |
| Amgen Inc. | 3.10% |
| Home Depot Inc. | 2.98% |
| Lowe's Cos Inc. | 2.89% |
| Altera Corp. | 2.71% |
| Bed Bath & Beyond Inc. | 2.56% |
| Merrill Lynch & Co. | 2.48% |
| Apache Corp. | 2.44% |
| Linear Technology Co. | 2.39% |
| Target Corp. | 2.32% |
Semi-annual Report | June 30, 2006 | 1
MADOX | Madison Institutional Equity Option Fund
Portfolio of Investments | June 30, 2006 | unaudited
Number of Shares | Value | |
| Common Stocks - 61.8% | ||
| Business Services - 1.0% | ||
2,000 | Cintas Corp. | $79,520 |
| Consumer Discretionary - 14.8% | ||
1,500 | Abercrombie & Fitch Co. - CL A | 83,145 |
1,000 | American Eagle Outfitters* | 34,040 |
6,500 | Bed Bath & Beyond Inc.* | 215,605 |
3,500 | Coach Inc.* | 104,650 |
2,200 | Harley-Davidson Inc. | 120,758 |
7,000 | Home Depot Inc. | 250,530 |
4,000 | Lowe's Cos Inc. | 242,680 |
4,000 | Target Corp. | 195,480 |
| Energy - 1.4% | ||
1,500 | Transocean Inc.* | 120,480 |
| Exchange-Traded Funds - 3.2% | ||
7,000 | Nasdaq-100 Index Tracking Stock | 271,320 |
| Financials - 7.2% | ||
1,700 | Capital One Financial Corp | 145,265 |
4,000 | Countrywide Financial Corp. | 152,320 |
3,000 | Merrill Lynch & Co. | 208,680 |
1,600 | Morgan Stanley | 101,136 |
| Health Care - 9.6% | ||
4,000 | Amgen Inc.* | 260,920 |
1,300 | Biogen Idec Inc.* | 60,229 |
3,000 | Biomet Inc. | 93,870 |
2,400 | Boston Scientific Corp.* | 40,416 |
2,000 | Community Health Systems Inc.* | 73,500 |
1,500 | Medtronic Inc. | 70,380 |
2,300 | Stryker Corp. | 96,853 |
1,900 | Zimmer Holdings Inc.* | 107,768 |
| Industrial - 2.4% | ||
3,000 | Apache Corp. | 204,750 |
| Software - 4.9% | ||
6,000 | Check Point Software Technologies Ltd.* | 105,480 |
7,000 | Microsoft Corp. | 163,100 |
9,500 | Symantec Corp.* | 147,630 |
| Technology - 17.3% | ||
13,000 | Altera Corp.* | 228,150 |
6,000 | Applied Materials Inc. | 97,680 |
2,500 | Dell Inc.* | 61,150 |
5,000 | eBay Inc.* | 146,450 |
1,000 | Fiserv Inc.* | 45,360 |
13,000 | Flextronics International Ltd.* | 138,060 |
3,000 | FLIR Systems Inc.* | 68,700 |
4,000 | Hewlett-Packard Co. | 126,720 |
6,000 | Intel Corp. | 113,700 |
6,000 | Linear Technology Corp. | 200,940 |
2,400 | Maxim Integrated Products Inc. | 77,064 |
2,200 | Xilinx Inc. | 49,830 |
3,000 | Yahoo! Inc.* | 99,000 |
| Total Long-Term Investments (Cost $5,289,612) | 5,203,309 | |
| Short-Term Investments - 49.6% | ||
| Repurchase Agreement - Morgan Stanley issued 6/30/06 at 4.40%, due 7/3/06, collateralized by $4,273,203 in United States Treasury Notes due 2/29/08. Proceeds at maturity are $4,169,528 (Cost $4,168,000). | 4,168,000 |
| (Total Investments - 111.4% Cost $9,457,612) | 9,371,309 | |
| Liabilities less cash and other assets - (7.5%) | (632,573) | |
| Total Call Options Written - (3.9%) | (330,710) | |
| Net Assets - 100% | $8,408,026 |
*Non-income producing.
See notes to financial statements
2 | Semi-annual Report | June 30, 2006
MADOX | Madison Institutional Equity Option Fund | Portfolio of Investments | unaudited | continued
Contracts (100 shares per contract) | Call Options Written | ExpirationDate | Exercise Price | Market Value |
15 | Abercrombie & Fitch Co - CL A | November 2006 | 57.50 | $6,000 |
14 | Altera Corp. | September 2006 | 22.50 | 105 |
60 | Altera Corp. | January 2007 | 17.50 | 11,700 |
56 | Altera Corp. | January 2007 | 20.00 | 6,160 |
10 | American Eagle Outfitters | August 2006 | 30.00 | 4,800 |
6 | Amgen Inc. | October 2006 | 70.00 | 1,095 |
9 | Amgen Inc. | October 2006 | 75.00 | 585 |
15 | Amgen Inc. | January 2007 | 65.00 | 8,850 |
10 | Amgen Inc. | January 2007 | 75.00 | 1,750 |
24 | Apache Corp. | October 2006 | 60.00 | 25,680 |
6 | Apache Corp. | October 2006 | 70.00 | 2,760 |
20 | Applied Materials Inc. | July 2006 | 18.00 | 100 |
20 | Applied Materials Inc. | January 2007 | 17.50 | 2,200 |
20 | Applied Materials Inc. | October 2006 | 19.00 | 550 |
33 | Bed Bath & Beyond Inc. | November 2006 | 37.50 | 2,640 |
17 | Bed Bath & Beyond Inc. | November 2006 | 40.00 | 595 |
13 | Biogen Idec Inc. | January 2007 | 50.00 | 4,420 |
12 | Biomet Inc. | January 2007 | 37.50 | 990 |
18 | Biomet Inc. | January 2008 | 40.00 | 3,195 |
20 | Boston Scientific Corp. | November 2006 | 25.00 | 250 |
10 | Capital One Financial Corp. | September 2006 | 85.00 | 4,300 |
60 | Check Point Software Technologies Ltd. | January 2007 | 20.00 | 4,350 |
20 | Cintas | November 2006 | 40.00 | 4,700 |
35 | Coach Inc. | November 2006 | 30.00 | 9,362 |
20 | Community Health Systems Inc | December 2006 | 35.00 | 7,500 |
20 | Countrywide Financial Corp. | January 2007 | 37.50 | 7,700 |
20 | Countrywide Financial Corp. | January 2007 | 40.00 | 5,150 |
15 | Dell Inc. | November 2006 | 27.50 | 1,050 |
10 | Dell Inc. | November 2006 | 30.00 | 275 |
20 | eBay Inc. | January 2007 | 30.00 | 7,100 |
14 | eBay Inc. | January 2007 | 35.00 | 2,275 |
10 | eBay Inc. | January 2007 | 40.00 | 650 |
10 | Fiserv Inc. | September 2006 | 45.00 | 2,275 |
25 | Flextronics International Ltd. | October 2006 | 10.00 | 3,125 |
55 | Flextronics International Ltd. | January 2007 | 10.00 | 8,800 |
50 | Flextronics International Ltd. | January 2007 | 12.50 | 2,750 |
30 | FLIR Systems Inc. | January 2007 | 27.50 | 2,775 |
11 | Harley-Davidson Inc. | November 2006 | 50.00 | 8,030 |
11 | Harley-Davidson Inc. | November 2006 | 52.50 | 6,050 |
40 | Hewlett-Packard Co. | January 2007 | 30.00 | 16,800 |
20 | Intel Corp. | July 2006 | 20.00 | 350 |
40 | Intel Corp. | January 2007 | 17.50 | 10,200 |
47 | Linear Technology Corp. | November 2006 | $35.00 | 7,285 |
13 | Linear Technology Corp. | January 2007 | 32.50 | 4,550 |
16 | Lowe's Cos Inc. | October 2006 | 65.00 | 2,600 |
24 | Lowe's Cos Inc. | January 2007 | 62.50 | 10,080 |
24 | Maxim Integrated Products Inc. | January 2007 | 35.00 | 5,100 |
15 | Medtronic Inc. | November 2006 | 52.50 | 938 |
20 | Merrill Lynch & Co. Inc. | October 2006 | 67.50 | 10,300 |
10 | Merrill Lynch & Co. Inc. | January 2007 | 70.00 | 5,100 |
70 | Microsoft Corp. | January 2007 | 22.50 | 15,925 |
33 | Nasdaq-100 Index Tracking Stock | September 2006 | 38.00 | 7,122 |
37 | Nasdaq-100 Index Tracking Stock | July 2006 | 40.00 | 578 |
23 | Stryker Corp. | September 2006 | 45.00 | 2,702 |
20 | Symantec Corp. | July 2006 | 17.50 | 100 |
5 | Symantec Corp. | October 2006 | 17.50 | 225 |
20 | Symantec Corp. | January 2007 | 15.00 | 10,250 |
50 | Symantec Corp. | January 2007 | 17.50 | 1,800 |
10 | Target Corp. | October 2006 | 52.50 | 1,200 |
30 | Target Corp. | January 2007 | 50.00 | 10,050 |
15 | Transocean Inc. | November 2006 | 75.00 | 16,350 |
10 | Xilinx Inc. | September 2006 | 27.50 | 225 |
30 | Yahoo! Inc. | January 2007 | 30.00 | 15,900 |
5 | Zimmer Holdings Inc. | September 2006 | 70.00 | 63 |
14 | Zimmer Holdings Inc. | December 2006 | 65.00 | 2,275 |
| Total Call Options Written (Premiums Received $369,933) | $330,710 |
See notes to financial statements.
4 | Semi-annual Report | June 30, 2006
MADOX | Madison Institutional Equity Option Fund
Statement of Assets and Liabilities | June 30, 2006 | unaudited
| ASSETS | |
| Investments, at value (Notes 1 and 2) | |
| Investment securities | $5,203,309 |
| Repurchase agreements | 4,168,000 |
| Total investments (cost $9,457,612) | 9,371,309 |
| Cash | 470 |
| Receivables | |
| Investment securities sold | 49,499 |
| Dividends and interest | 1,076 |
| Total assets | 9,422,354 |
| LIABILITIES | |
| Options written, at value (premiums received of $369,933) | 330,710 |
| Payables | |
| Investment securities purchased | 682,634 |
| Independent trustee and auditor fees | 984 |
| Total liabilities | 1,014,328 |
| NET ASSETS | $8,408,026 |
| Net assets consists of: | |
| Paid in capital | 8,433,443 |
| Undistributed net investment income (loss) | 11,757 |
| Accumulated net realized gain on investments and options transactions | 9,906 |
| Net unrealized depreciation on investments and options transactions | (47,080) |
| Net Assets | $8,408,026 |
| CAPITAL SHARES ISSUED AND OUTSTANDING | |
| An unlimited number of capital shares authorized, without par value per share, are authorized (Note 7) | 427,597 |
| NET ASSETS VALUE PER SHARE | $19.66 |
See notes to financial statements.
Semi-annual Report | June 30, 2006 | 5
MADOX | Madison Institutional Equity Option Fund
Statement of Operations | For the period March 31, 2006* through June 30, 2006 | unaudited
| INVESTMENT INCOME (Note 1) | |
| Interest income | $17,184 |
| Dividend income | 2,506 |
| Total investment income | 19,690 |
| EXPENSES (Notes 3 and 5) | |
| Investment advisory | 6,263 |
| Independent trustee and auditor | 1,670 |
| Total expenses | 7,933 |
| NET INVESTMENT INCOME | 11,757 |
| REALIZED AND UNREALIZED GAIN (LOSS) ON INVESTMENTS | |
| Net realized gain on: | |
| Investments | -- |
| Options | 9,906 |
| Net unrealized appreciation (depreciation) on: | |
| Investments | (86,303) |
| Options | 39,223 |
| NET LOSS ON INVESTMENTS AND OPTIONS TRANSACTIONS | (37,174) |
| TOTAL DECREASE IN NET ASSETS RESULTING FROM OPERATIONS | $(25,417) |
* Commencement of operations.
See notes to financial statements.
6 | Semi-annual Report | June 30, 2006
MADOX | Madison Institutional Equity Option Fund
Statement of Changes in Net Assets | unaudited
For the period March 31, 2006* through June 30, 2006
| INCREASE (DECREASE) IN NET ASSETS RESULTING FROM OPERATIONS | |
| Net investment income | $11,757 |
| Net realized gain on investments and options transactions | 9,906 |
| Net unrealized depreciation on investments and options transactions | (47,080) |
| Total decrease in net assets resulting from operations | (25,417) |
| CAPITAL SHARE TRANSACTIONS | |
| Proceeds from issuance of common shares | 8,433,443 |
| TOTAL INCREASE IN NET ASSETS | 8,408,026 |
| NET ASSETS | |
| Beginning of period | $-- |
| End of period | $8,408,026 |
* Commencement of operations.
See notes to financial statements.
Semi-annual Report | June 30, 2006 | 7
MADOX | Madison Institutional Equity Option Fund
Financial Highlights | For the period March 31, 2006* through June 30, 2006
Per Share Operating Performance for One Share Outstanding Throughout the Period
| Net Asset Value, Beginning of Period | $20.00 |
| Investment Operations | |
| Net investment income | 0.07 |
| Net realized and unrealized loss on investments and options transactions | (0.41) |
| Total from investment operations | (0.34) |
| Less distributions from: | |
| Net investment income | -- |
| Capital gains | -- |
| Total distributions | -- |
| Net Asset Value, End of Period | $19.66 |
| Total Investment Return (%) | (1.70) |
| Ratios and Supplemental Data | |
| Net assets, end of period (thousands) | $8,408 |
| Ratio of expenses to average net assets (%)1 | 0.92 |
| Ratio of net investment Income to average net assets (%)1 | 1.37 |
| Portfolio turnover (%) | -- |
* Commencement of operations.
1 Annualized.
See notes to financial statements.
8 | Semi-annual Report | June 30, 2006
MADOX | Madison Institutional Equity Option Fund
Notes to Financial Statements | June 30, 2006
Note 1 – Summary of Significant Accounting Policies.
Mosaic Equity Trust (the "Trust") is registered with the Securities and Exchange Commission under the Investment Company Act of 1940 as an open-end, investment management company. The Trust currently offers five portfolios, each of which is a diversified mutual fund. This report contains information about one of these portfolios, the Madison Institutional Equity Option Fund (the "Fund"), which commenced operations March 31, 2006. Its objectives and strategies are detailed in its prospectus. The remaining four Trust portfolios present their financial information in a separate report.
Securities Valuation: Securities traded on a national securities exchange are valued at their closing sale price. Repurchase agreements and other securities having maturities of 60 days or less are valued at amortized cost, which approximates market value. Securities having longer maturities, for which quotations are readily available, are valued at the mean between their closing bid and ask prices. Securities for which market quotations are not readily available are valued at their fair value as determined in good faith under procedures approved by the Board of Trustees. Exchange-traded options are valued at the mean of the best bid and best ask prices across all option exchanges.
Investment Transactions: Investment transactions are recorded on a trade date basis. The cost of investments sold is determined on the identified cost basis for financial statement and federal income tax purposes.
Investment Income: Interest income is recorded on an accrual basis. Bond premium is amortized and original issue discount and market discount are accreted over the expected life of each applicable security using the effective interest method. Dividend income is recorded net of applicable withholding taxes on the ex-dividend date. Other income is accrued as earned.
Distribution of Income and Gains: Distributions are recorded on the ex-dividend date. Net investment income, determined as gross investment income less total expenses, is declared as a regular dividend and distributed to shareholders at year-end for the Fund. Capital gain distributions, if any, are declared and paid annually at year-end.
As of June 30, 2006, the components of distributable earnings on a tax basis were as follows (unaudited):
| Undistributed net investment income | $11,757 |
| Accumulated net realized gains | 9,906 |
| Net unrealized depreciation on investments | (47,080) |
$(25,417) |
Net realized gains or losses may differ for financial and tax reporting purposes as a result of loss deferrals related to wash sales and post-October transactions.
Income Tax: No provision is made for federal income taxes since it is the intention of the Fund to comply with the provisions of the Internal Revenue Code available to investment companies and to make the requisite distribu-tion to shareholders of taxable income which will be sufficient to relieve it from all or substantially all income taxes.
Information on the tax components of capital, excluding option contracts, as of June 30, 2006 is as follows (unaudited):
| Aggregate Cost | $9,457,612 |
| Gross unrealized appreciation | 85,422 |
| Gross unrealized depreciation | (171,725) |
| Net unrealized depreciation | $(86,303) |
Use of Estimates: The preparation of the financial statements in conformity with accounting principles generally accepted in the United States of America requires management to make estimates and assumptions. Such estimates affect the reported amounts of assets and liabilities and reported amounts of increases and decreases in net assets from operations during the reporting period. Actual results could differ from those estimates.
Note 2 – Investments in Repurchase Agreements:
When the Fund purchases securities under agree-ments to resell, the securities are held for safekeeping by the custodian bank as collateral. Should the market value of the securities purchased under such an agreement decrease below the principal amount to be received at the termination of the agreement plus accrued interest, the counterparty is required to place an equivalent amount of additional securities in safekeeping with the Trust's custodian bank. Pursuant to an Exemptive Order issued by the Securities and Exchange Commission, the Fund, along with other registered investment companies having Advisory and Services Agreements with the same advisor, transfers uninvested cash balances into a joint trading account. The aggregate balance in this joint trading account is invested in one or more consolidated repurchase agreements whose underlying securities are U.S. Treasury or federal agency obligations. On the date of this
Semi-annual Report | June 30, 2006 | 9
MADOX | Madison Institutional Equity Option Fund | Notes to Financial Statements | continued
report, the Fund had approximately a 35.5% interest in the consolidated repurchase agreement of $11,732,000 collateralized by $12,028,124 in United States Treasury Notes. Proceeds at maturity were $11,736,302.
Note 3 – Investment Advisory Fees and Other Transactions with Affiliates:
The investment advisor to the Fund, Madison Asset Management, LLC, a wholly owned subsidiary of Madison Investment Advisors, Inc. (collectively "the Advisor"), earns an advisory fee equal to 0.75% per annum of the average net assets of the Fund. After one year of operations, a fulcrum fee will be added/deleted based on certain performance criteria. The fee is accrued daily and is paid monthly.
Note 4 – Investment Transaction:
Purchases and sales, excluding short-term investments for the six-months ended June 30, 2006 were $5,289,612 and $0, respectively. No U.S. Government securities were purchased or sold during the period.
Note 5 – Other Expenses:
Under a separate Services Agreement, the Advisor will provide or arrange for the Fund to have all other necessary operational and support services for a fee based on a percentage of average net assets. These fees are accrued daily and paid monthly. This percentage is 0.20%. The Fund also pays the expenses of the Fund's Independent Trustees and auditors directly. For the six-months ended June 30, 2006, these fees amounted to $1,670. The Services Agreement fees paid to the Advisor were reduced by this amount.
Note 6 – Covered Call Options:
The Fund will pursue its primary objective by employing an option strategy of writing (selling) covered call options on common stocks. The number of call options the Fund can write (sell) is limited by the amount of equity securities the Fund holds in its portfolio. The Fund will not write (sell) "naked" or uncovered call options. The Fund seeks to produce a high level of current income and gains generated from option writing premiums and, to a lesser extent, from dividends.
An option on a security is a contract that gives the holder of the option, in return for a premium, the right to buy from (in the case of a call) or sell to (in the case of a put) the writer of the option the security underlying the option at a specified exercise or "strike" price. The writer of an option on a security has the obligation upon exercise of the option to deliver the underlying security upon payment of the exercise price (in the case of a call) or to pay the exercise price upon delivery of the underlying security (in the case of a put).
There are several risks associated with transactions in options on securities. As the writer of a covered call option, the Fund forgoes, during the option's life, the opportunity to profit from increases in the market value of the security covering the call option above the sum of the premium and the strike price of the call but has retained the risk of loss should the price of the underlying security decline. The writer of an option has no control over the time when it may be required to fulfill its obligation as writer of the option. Once an option writer has received an exercise notice, it cannot effect a closing purchase transaction in order to terminate its obligation under the option and must deliver the underlying security at the exercise price.
Transactions in option contracts during the six-months ended June 30, 2006 were as follows (unaudited):
Number of Contracts | Premiums | |
| Options written | 1,559 | $383,964 |
| Options expired | (34) | (3,101) |
| Options closed | (40) | (10,930) |
| Options assigned | -- | -- |
| Options outstanding at end of period | 1,485 | $369,933 |
Note 7 – Capital Share Transactions:
| In Dollars | |
| Shares sold | $8,433,443 |
| Shares issued in reinvestment of dividends | -- |
| Total shares issued | 8,433,443 |
| Shares redeemed | -- |
| Net increase | $8,433,443 |
| In Shares | |
| Shares sold | 427,597 |
| Shares issued in reinvestment of dividends | -- |
| Total shares issued | 427,597 |
| Shares redeemed | -- |
| Net increase | 427,597 |
10 | Semi-annual Report | June 30, 2006
MADOX | Madison Institutional Equity Option Fund | Notes to Financial Statements | continued
Fund Expenses (unaudited)
Example: As a shareholder of the Fund, you incur two types of costs: (1) transaction costs and (2) ongoing costs, including Investment advisory fees and Other expenses. This Example is intended to help you understand your ongoing costs (in dollars) of investing in the Fund and to compare these costs with the ongoing costs of investing in other mutual funds. See footnotes 3 and 5 above for an explanation of the types of costs charged by the Fund. This Example is based on an investment of $1,000 invested on March 31, 2006 (inception of Fund) and held for the three-months ended June 30, 2006.
Actual Expenses
The table below titled "Based on Actual Total Return" provides information about actual account values and actual expenses. You may use the information provided in this table, together with the amount you invested, to estimate the expenses that you paid over the period. To estimate the expenses you paid on your account, divide your ending account value by $1,000 (for example, an $8,500 ending account valued divided by $1,000 = 8.5), then multiply the result by the number under the heading entitled "Expenses Paid During the Period."
| Based on Actual Total Return1 | |||||
Actual Total Return2 | Beginning Account Value | Ending Account Value | Annualized Expense Ratio3 | Expenses Paid During the Period3 | |
| Madison Institutional Equity Option Fund | -1.70% | $1,000.00 | $983.00 | 0.92% | $2.29 |
| 1For the three months ended June 30, 2006. 2Assumes reinvestment of all dividends and capital gains distributions, if any, at net asset value. 3Expenses are equal to the Fund's annualized expense ratio multiplied by the average account value over the period, multiplied by the number of days in the most recent fiscal half-year, then divided by 365. | |||||
Hypothetical Example for Comparison Purposes
The table below titled "Based on Hypothetical Total Return" provides information about hypothetical account values and hypothetical expenses based on the actual expense ratio and an assumed rate of return of 5.00% per year before expenses, which is not any fund's actual return. The hypothetical account values and expenses may not be used to estimate the actual ending account balance or expenses you paid for the period. You may use the information provided in this table to compare the ongoing costs of investing in a fund offered by the Trust and other funds. To do so, compare the 5.00% hypothetical example relating to the Fund with the 5.00% hypothetical examples that appear in the shareholder reports of the other funds.
| Based on Hypothetical Total Return1 | |||||
Hypothetical Annualize Total Return | Beginning Account Value | Ending Account Value | Annualized Expense Ratio2 | Expenses Paid During the Period2 | |
| Madison Institutional Equity Option Fund | 5.00% | $1,000.00 | $1,012.52 | 0.92% | $2.32 |
| 1For the three months ended June 30, 2006. 2Expenses are equal to the Fund's annualized expense ratio multiplied by the average account value over the period, multiplied by the number of days in the most recent fiscal half-year, then divided by 365. | |||||
Semi-annual Report | June 30, 2006 | 11
MADOX | Madison Institutional Equity Option Fund | Notes to Financial Statements | concluded
Forward-Looking Statement Disclosure.
One of our most important responsibilities as investment company managers is to communicate with shareholders in an open and direct manner. Some of our comments in our letters to shareholders are based on current management expectations and are considered "forward-looking statements." Actual future results, however, may prove to be different from our expectations. You can identify forward-looking statements by words such as "estimate," "may," "will," "expect," "believe," "plan" and other similar terms. We cannot promise future returns. Our opinions are a reflection of our best judgment at the time this report is compiled, and we disclaim any obligation to update or alter forward-looking statements as a result of new information, future events, or otherwise.
Proxy Voting Information.
The Fund adopted policies that provide guidance and set forth parameters for the voting of proxies relating to securities held in the Fund. Additionally, information regarding how the Fund voted proxies related to portfolio securities, if applicable, during the period ended June 30, 2006 is available to you upon request and free of charge, by writing to Madison Institutional Equity Option Fund, 550 Science Drive, Madison, WI 53711 or by calling toll-free at 1-800-368-3195. The Fund's proxy voting policies and voting information may also be obtained by visiting the Securities and Exchange Commission web site at www.sec.gov. The Fund will respond to shareholder requests for copies of our policies and voting information within two business days of request by first-class mail or other means designed to ensure prompt delivery.
N-Q Disclosure.
The Fund files its complete schedule of portfolio holdings with the U.S. Securities and Exchange Commission (the "Commission") for the first and third quarters of each fiscal year on Form N-Q. The Fund's Forms N-Q are available on the Commission's website. The Fund's Forms N-Q may be reviewed and copied at the Commission's Public Reference Room in Washington, DC. Information about the operation of the Public Reference Room may be obtained by calling the Commission at 1-202-942-8090. Form N-Q and other information about the Fund are available on the EDGAR Database on the Commission's Internet site at http://www.sec.gov. Copies of this information may also be obtained, upon payment of a duplicating fee, by electronic request at the following email address: publicinfo@sec.gov, or by writing the Commission's Public Reference Section, Washington, DC 20549-0102. Finally, you may call the Fund at 800-368-3195 if you would like a copy of Form N-Q and we will mail one to you at no charge.
12 | Semi-annual Report | June 30, 2006
Madison Investment Advisors, Inc.
550 SCIENCE DRIVE
MADISON, WI 53711
1-800-767-0300
www.madisonfunds.com
SEC File # 811-03615
Item 2. Code of Ethics.
Not applicable in semi-annual report.
Item 3. Audit Committee Financial Expert.
Not applicable in semi-annual report.
Item 4. Principal Accountant Fees and Services.
Not applicable in semi-annual report.
Item 5. Audit Committee of Listed Registrants.
Not applicable.
Item 6. Schedule of Investments
Included in report to shareholders (Item 1) above.
Item 7. Disclosure of Proxy Voting Policies and Procedures for Closed-End Management Investment Companies.
Not applicable.
Item 8. Portfolio Managers of Closed-End Management Investment Companies.
Not applicable.
Item 9. Purchases of Equity Securities by Closed-End Management Investment Company and Affiliated Purchasers
Not applicable.
Item 10. Submission of Matters to a Vote of Security Holders.
During the period covered by this report, the registrant adopted written procedures by which shareholders may recommend nominees to the registrant’s Board of Trustees.
Item 11. Controls and Procedures.
(a) The Trust’s principal executive officer and principal financial officer determined that the Trust’s disclosure controls and procedures are effective, based on their evaluation of these controls and procedures within 90 days of the date of this report. There were no significant changes in the Trust’s internal controls or in other factors that could significantly affect these controls subsequent to the date of their evaluation. The officers identified no significant deficiencies or material weaknesses.
(b) There have been no changes in the registrant's internal control over financial reporting that occurred during the second fiscal quarter of the period covered by this report that has materially affected, or is reasonably likely to materially affect, the registrant's internal control over financial reporting.
Item 12. Exhibits.
(a)(1) Not applicable to semi-annual report.
(a)(2) Certifications of principal executive and principal financial officers as required by Rule 30a-2(a) under the Investment Company Act of 1940.
(a)(3) None (not applicable to open-end funds).
(b) Certification of principal executive and principal financial officers as required by Rule 30a-2(b) under the Investment Company Act of 1940.
SIGNATURES
Pursuant to the requirements of the Securities Exchange Act of 1934 and the Investment Company Act of 1940, the Registrant has duly caused this Report to be signed on its behalf by the undersigned, thereunto duly authorized.
Mosaic Equity Trust
By: (signature)
W. Richard Mason, Secretary
Date: August 8, 2006
Pursuant to the requirements of the Securities Exchange Act of 1934 and the Investment Company Act of 1940, this Report has been signed below by the following persons on behalf of the Registrant and in the capacities and on the dates indicated.
By: (signature)
Katherine L. Frank, Chief Executive Officer
Date: August 8, 2006
By: (signature)
Greg Hoppe, Chief Financial Officer
Date: August 8, 2006