OMB APPROVAL
OMB Number: 3235-0570
Expires: September 30, 2007
Estimated average burden hours per response...19.4
UNITED STATES SECURITIES AND EXCHANGE COMMISSION
Washington, DC 20549
FORM N-CSR
CERTIFIED SHAREHOLDER REPORT OF REGISTERED
MANAGEMENT INVESTMENT COMPANIES
Investment Company Act file number 811-3616
Mosaic Income Trust
(Exact name of registrant as specified in charter)
550 Science Drive, Madison, WI 53711
(Address of principal executive offices)(Zip code)
W. Richard Mason
Madison/Mosaic Legal and Compliance Department
8777 N. Gainey Center Drive, Suite 220
Scottsdale, AZ 85258
(Name and address of agent for service)
Registrant's telephone number, including area code: 608-274-0300
Date of fiscal year end: December 31
Date of reporting period: June 30, 2006
Form N-CSR is to be used by management investment companies to file reports with the Commission not later than 10 days after the transmission to stockholders of any report that is required to be transmitted to stockholders under Rule 30e-1 under the Investment Company Act of 1940 (17 CFR 270.30e-1). The Commission may use the information provided on Form N-CSR in its regulatory, disclosure review, inspoection, and policymaking roles.
A registrant is required to disclose the information specified by Form N-CSR, and the Commission will make this information public. A registrant is not required to respond to the collection of information contained in Form N-CSR unless the Form displays a currently valid Office of Management and Budget ("OMB") control number. Please direct comments concerning the accuracy of the information collection burden estimate and any suggestions for reducing the burden to Secretary, Securities and Exchange Commission, 450 Fifth Street, NW, Washington, DC 20549-0609. The OMB has reviewed this collection of information under the clearance requirements of 44 U.S.C. s 3507.
SEMI-ANNUAL REPORT
(Unaudited)
June 30, 2006
Mosaic Income Trust
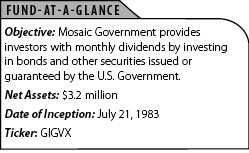
Mosaic Government Fund
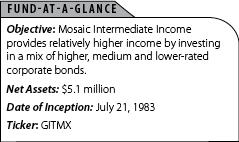
Mosaic Intermediate Income Fund
Mosaic Funds
www.mosaicfunds.com
Contents
| Portfolio Manager Review | |
| Market Review | 1 |
| Fund Positioning | 1 |
| Outlook | 1 |
| Fund Overview | 2 |
| Portfolio of Investments | |
| Government Fund | 4 |
| Intermediate Income Fund | 5 |
| Statements of Assets and Liabilities | 7 |
| Statements of Operations | 8 |
| Statements of Changes in Net Assets | 9 |
| Financial Highlights | 10 |
| Notes to Financial Statements | 11 |
Mosaic Income Trust June 30, 2006
Market Review
The first months of 2006 showed surprisingly strong economic growth, as the economy expanded at a 5.6% rate in the first quarter. While some of this initial 2006 growth can be attributed to a snap-back from the hurricane depressed levels seen in the fourth quarter of 2005, the economy was still showing signs of strength at the end of the second quarter.
In addition, inflation pressures continued to build. Industrial commodity prices rose across the board, with inputs such as zinc and copper reaching new highs. Capacity utilization, which is basically a measure of how much slack exists in industrial production, moved above 80%, a level that has traditionally been inflationary. Rising input prices, higher capacity utilization and tighter labor markets are all classic signs of a maturing economic expansion.
One of the notable events of the period was the retirement of long-time Federal Reserve Chairman Alan Greenspan, and the beginning of the Bernanke era. Rates were raised twice in the first quarter under Greenspan. Under new Fed Chairman, Ben Bernanke, the Federal Reserve raised short-term rates twice more during the second quarter of 2006, bringing the period-end rate to 5.25%. This was the 17th consecutive quarter-point rate increase over the past three years, and shows the Fed's resolve to dampen economic expansion and control inflation.
Fund Positioning
Since the generational lows in interest rates during the summer of 2003, we've consistently managed the funds in Income Trust with a cautious, conservative bent, keeping interest rate risk at low levels relative to the market. The artificially low level of yields offered scant income to protect against the price erosion of higher interest rates. As rates have moved higher during the six months, Mosaic Government and Intermediate Income Funds have benefited from this positioning, showing only very small negative returns as the valuation of bonds has been depressed.
We believe that the Fed's tightening campaign may be nearing an end. The Fed Funds Rate is now pushing above what is widely considered a "neutral" level, and entering territory where it should dampen economic expansion, which we've already witnessed in the housing market. As economic growth downshifts, the Fed's tightening cycle will likely end.
As active managers we are closely monitoring key economic indicators which should begin to signal an inflection point in interest rates sometime in the coming year. We have already made some portfolio adjustments to take advantage should long-term rates rise, while short-term rates hold or begin to drop, a scenario which is typical of this stage of the economic cycle.
Outlook
Looking forward, we believe there is reason to be optimistic. The surge in rates we've seen over the last few years is finally restoring more balance to the risk/return equation. With the funds showing a 30-day SEC yield in excess of 4% at period end, there is a meaningful income cushion to offset any further erosion in prices from higher interest rates. And with the Fed in the final innings of this rising-rate cycle, yields look much more attractive.
Mosaic Income Trust 1
Portfolio Manager Review (continued)
Mosaic Government Fund
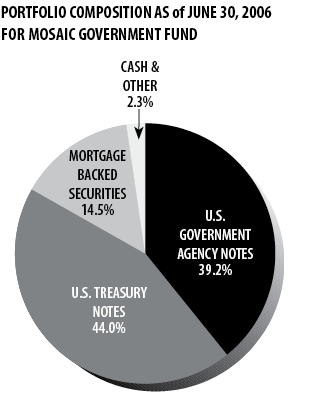
Mosaic Government Fund returned -0.14% for the semi-annual period ended June 30, 2006. This return was superior to the fund's peers, as the Lipper Intermediate Government Fund Index fell -0.45%. This return difference largely reflects management's defensive positioning of the portfolio. When interest rates rise, bond valuations fall, and shorter-term bonds typically retain their value far better than longer-term bonds. The Fund's 30-day SEC yield at period end was 4.08%, with an effective duration of 2.88 years. Mosaic Government held 44.0% in Treasuries, 39.2% in government agency notes, with the remainder in mortgage-backed securities and a small cash position. The fund's largest positions during this six-month period were short to intermediate duration bonds issued by the U.S. Treasury, Fannie Mae and Freddie Mac.
TOP TEN HOLDINGS AS OF JUNE 30, 2006
FOR MOSAIC GOVERNMENT FUND
% of net assets | |
| Freddie Mac, 5.5%, 9/15/11 | 9.50% |
| US Treasury Note, 4.375%, 12/31/07 | 9.38% |
| US Treasury Note, 4.75%, 11/15/08 | 8.63% |
| Freddie Mac, 5.125%, 10/15/08 | 7.86% |
| Fannie Mae, 4.2%, 3/24/08 | 7.74% |
| US Treasury Note, 4.25%, 8/15/14 | 7.01% |
| US Treasury Note, 4%, 6/15/09 | 6.90% |
| US Treasury Note, 4%, 3/15/10 | 6.86% |
| Fed Home Loan Bank, 4.1%, 6/13/08 | 6.17% |
| US Treasury Note, 5%, 8/15/11 | 5.21% |
Mosaic Intermediate Income Fund
Mosaic Intermediate Income Fund fell -0.18% for the six months ended June 30, 2006. Over the same period, the Lipper Intermediate Investment Grade Index slipped -0.69%. The performance gap was largely a duration story, as the fund's shorter maturity was a positive for the period. At period end, the fund's duration was 3.12 years, while its 30-day SEC yield was 4.51%. The yield of the fund rose during the period, from a starting point of 4.06%, while duration was extended a bit over the period as rates rose.
2 Semi-annual Report • June 30, 2006
Portfolio Manager Review (concluded)
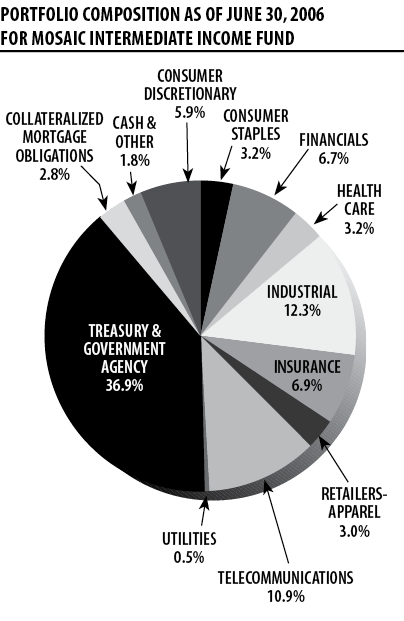
The fund began the period with 59.9% invested in corporate bonds. Over the course of the six months this was reduced to 49.6%, while the government bond exposure increased from 37.3% to 48.4%. This move reflects our belief that corporate bonds are fully priced, and are likely to lose ground relative to government bonds going forward.
Intermediate Income can invest as much as 35% in lower-rated securities. Although high-yield bonds outperformed higher-grade bonds over the past six months, we trimmed our exposure, in line with our general move from corporates to governments. The fund began the period with 6.9% in Ba-rated bonds (the top range of the high-yield spectrum) and ended the period with no Ba or lower rated bonds. This reduction reflects our cautious outlook for corporate bonds in general.
Looking forward, we continue to believe that the Federal Reserve is not yet done raising rates, although we feel we are in the final innings of that cycle. As a result, we are carefully monitoring the indicators and are prepared to reposition the portfolio further should conditions warrant.
TOP TEN HOLDINGS AS OF JUNE 30, 2006
FOR MOSAIC INTERMEDIATE INCOME FUND
% of net assets | |
| Fed Home Loan Bank, 4.1%, 6/13/08 | 9.58% |
| US Treasury Note, 4%, 3/15/10 | 8.52% |
| US Treasury Note, 4.25%, 8/15/14 | 5.64% |
| Freddie Mac, 5.5%, 9/15/11 | 4.62% |
| Sprint Capital Corp., 6.125%, 11/15/08 | 3.96% |
| AT&T Broadband, 8.375%, 3/15/13 | 3.95% |
| MGIC Investment Corp., 6%, 3/15/07 | 3.93% |
| US Treasury Note, 3.375%, 2/15/08 | 3.82% |
| Int'l Lease Finance, 4.875%, 9/1/10 | 3.80% |
| American Standard, 7.375%, 2/1/08 | 3.50% |
Mosaic Income Trust 3
Mosaic Income Trust June 30, 2006
Government Fund - Portfolio of Investments (unaudited)
| CREDIT RATING* | PRINCIPAL AMOUNT | VALUE | ||
| MOODY'S | S&P | |||
| U.S. GOVERNMENT & AGENCY OBLIGATIONS: 97.7% of net assets | ||||
| U.S. GOVERNMENT AGENCY NOTES: 39.2% | ||||
| Aaa | AAA | Federal Home Loan Bank, 4.1%, 6/13/08 | $200,000 | $195,085 |
| Aaa | AAA | Fannie Mae, 4.2%, 3/24/08 | 250,000 | 244,498 |
| Aaa | AAA | Freddie Mac, 3.5%, 9/15/07 | 100,000 | 97,778 |
| Aaa | AAA | Freddie Mac, 5.125%, 10/15/08 | 250,000 | 248,376 |
| Aaa | AAA | Freddie Mac, 5%, 10/18/10 | 155,000 | 151,878 |
| Aaa | AAA | Freddie Mac, 5.5%, 9/15/11 | 300,000 | 300,309 |
| U.S. TREASURY NOTES: 44.0% | ||||
| Aaa | AAA | US Treasury Notes, 4.375%, 12/31/07 | 300,000 | 296,520 |
| Aaa | AAA | US Treasury Notes, 4.75%, 11/15/08 | 275,000 | 272,626 |
| Aaa | AAA | US Treasury Notes, 4%, 6/15/09 | 225,000 | 218,153 |
| Aaa | AAA | US Treasury Notes, 4%, 3/15/10 | 225,000 | 216,730 |
| Aaa | AAA | US Treasury Notes, 5%, 8/15/11 | 165,000 | 164,555 |
| Aaa | AAA | US Treasury Notes, 4.25%, 8/15/14 | 235,000 | 221,387 |
| MORTGAGE BACKED SECURITIES: 14.5% | ||||
| Aaa | AAA | Fannie Mae, Mortgage Pool #555345, 5.5%, 2/1/18 | 80,550 | 79,229 |
| Aaa | AAA | Fannie Mae, Mortgage Pool #555545, 5%, 6/1/18 | 128,352 | 123,933 |
| Aaa | AAA | Fannie Mae, Mortgage Pool #636758, 6.5%, 5/1/32 | 35,043 | 35,363 |
| Aaa | AAA | Fannie Mae, Mortgage Pool #254346, 6.5%, 6/1/32 | 29,077 | 29,342 |
| Aaa | AAA | Fannie Mae, Mortgage Pool #254405, 6%, 8/1/32 | 55,652 | 54,999 |
| Aaa | AAA | Freddie Mac, Mortgage Pool, Gold Pass Through Certificates #E57247, 6.5%, 3/1/09 | 26,452 | 26,656 |
| Aaa | AAA | Freddie Mac, Mortgage Pool, Gold Pass Through Certificates #E90778, 5.5%, 8/1/17 | 58,267 | 57,288 |
| Aaa | AAA | Freddie Mac, Mortgage Pool, Gold Pass Through Certificates #C01364, 6.5%, 6/1/32 | 32,441 | 32,756 |
| Aaa | AAA | Ginnie Mae, Guaranteed Pass Through Certificates #2483, 7%, 9/20/27 | 17,016 | 17,466 |
| TOTAL U.S. GOVERNMENT & AGENCY OBLIGATIONS (Cost $3,187,171) | $3,084,927 | |||
| REPURCHASE AGREEMENT: 1.6% of net assets With Morgan Stanley and Company issued 6/30/06 at 4.4%, due 7/3/06, collateralized by $52,287 in United States Treasury Notes due 2/29/08. Proceeds at maturity are $51,019 (Cost $51,000). | $51,000 | |||
| TOTAL INVESTMENTS: 99.3% of net assets (Cost $3,238,171) | $3,135,927 | |||
| CASH AND RECEIVABLES LESS LIABILITIES: 0.7% of net assets | 24,288 | |||
| NET ASSETS: 100% | $3,160,215 | |||
The Notes to Financial Statements are an integral part of these statements.
4 Semi-annual Report • June 30, 2006
Mosaic Income Trust June 30, 2006
Intermediate Income Fund - Portfolio of Investments (unaudited)
| CREDIT RATING* | PRINCIPAL AMOUNT | VALUE | ||
| MOODY'S | S&P | |||
| CORPORATE DEBT SECURITIES: 49.6% of net assets | ||||
| CONSUMER DISCRETIONARY: 2.9% | ||||
| Aa2 | AA | Wal-Mart Stores Inc, 4.75%, 8/15/10 | $150,000 | $145,471 |
| CONSUMER STAPLES: 3.2% | ||||
| A2 | A | Coca-Cola Enterprise, 5.75%, 11/1/08 | 160,000 | 160,588 |
| FINANCIALS: 6.7% | ||||
| A3 | A | Countrywide Home Loan, 5.625% 5/15/07 | 150,000 | 149,859 |
| A1 | AA- | International Lease Finance, 4.875%, 9/1/10 | 200,000 | 193,620 |
| HEALTH CARE: 3.2% | ||||
| A2 | A | United Healthcare Group, 5%, 8/15/14 | 175,000 | 163,935 |
| INDUSTRIAL: 12.3% | ||||
| Baa3 | BBB- | American Standard, 7.375%, 2/1/08 | 175,000 | 178,317 |
| A2 | A | CIT Group Inc, 5.75%, 9/25/07 | 150,000 | 149,959 |
| Baa3 | BBB- | Lubrizol Corp, 4.625%, 10/1/09 | 150,000 | 144,532 |
| Baa2 | BBB | YUM! Brands Inc, 7.65%, 5/15/08 | 150,000 | 154,653 |
| INSURANCE: 6.9% | ||||
| Baa3 | BBB- | Markel Corp, 6.8%, 2/15/13 | 150,000 | 151,460 |
| A1 | A | MGIC Investment Corp, 6.0%, 3/15/07 | 200,000 | 199,961 |
| RETAILERS-APPAREL: 3.0% | ||||
| Baa3 | BBB- | Gap Inc, 6.9%, 9/15/07 | 150,000 | 150,962 |
| TELECOMMUNICATIONS: 10.9% | ||||
| Baa2 | BBB+ | AT&T Broadband, 8.375%, 3/15/13 | 181,000 | 201,286 |
| Baa2 | BBB+ | Sprint Capital Corp, 6.125%, 11/15/08 | 200,000 | 201,676 |
| Baa1 | A | Verizon New England, 6.5%, 9/15/11 | 150,000 | 150,210 |
| UTILITIES: 0.5% | ||||
| A2 | A- | Wisconsin Power & Light, 7.625%, 3/1/10 | 25,000 | 26,366 |
| TOTAL CORPORATE DEBT SECURITIES (Cost $2,556,353) | $2,522,855 | |||
| COLLATERALIZED MORTGAGE OBLIGATIONS: 2.8% of net assets | ||||
| Aaa | AAA | Fannie Mae, Mortgage Pool #636758, 6.5%, 5/1/32 | $46,724 | 47,151 |
| Aaa | AAA | Fannie Mae, Mortgage Pool #725341, 5%, 2/1/19 | 101,394 | 97,903 |
| TOTAL COLLATERALIZED MORTGAGE OBLIGATIONS (Cost $149,596) | $145,054 | |||
| U.S. GOVERNMENT & AGENCY OBLIGATIONS: 45.6% of net assets | ||||
| Aaa | AAA | Fannie Mae, 4.625% 10/15/13 | 100,000 | 94,902 |
| Aaa | AAA | Federal Home Loan Bank, 4.1%, 6/13/08 | 500,000 | 487,711 |
| Aaa | AAA | Freddie Mac, 4.875%, 3/15/07 | 150,000 | 149,322 |
| Aaa | AAA | Freddie Mac, 5%, 10/18/10 | 150,000 | 146,979 |
| Aaa | AAA | Freddie Mac, 5.5%, 9/15/11 | 235,000 | 235,242 |
| Aaa | AAA | US Treasury Note, 3.375%, 2/15/08 | 200,000 | 194,453 |
| Aaa | AAA | US Treasury Note, 4.0%, 3/15/10 | 450,000 | 433,459 |
| Aaa | AAA | US Treasury Note, 5.0%, 8/15/11 | 150,000 | 149,596 |
| Aaa | AAA | US Treasury Note, 4.25%, 8/15/14 | 305,000 | 287,332 |
| Aaa | AAA | U.S. Treasury Note, 4.5%, 2/15/16 | 150,000 | 142,758 |
| TOTAL U.S. GOVERNMENT & AGENCY OBLIGATIONS (Cost $2,373,628) | $2,321,754 | |||
| REPURCHASE AGREEMENT: 0.7% of net assets | ||||
| With Morgan Stanley and Company issued 6/30/06 at 4.4%, due 7/3/06, collateralized by $35,883 in United States Treasury Notes due 2/29/08. Proceeds at maturity are $35,013 (Cost $35,000). | 35,000 | |||
| TOTAL INVESTMENTS: 98.7% of net assets (Cost $5,114,577) | $5,024,663 | |||
| LIABILITIES LESS CASH AND RECEIVABLES: 1.3% of net assets | 65,647 | |||
| NET ASSETS: 100% | $5,090,310 | |||
Notes to the Portfolio of Investments:
* – Unaudited; Moody's – Moody's Investor Services, Inc.; S&P – Standard & Poor's Corporation
The Notes to Financial Statements are an integral part of these statements.
6 Semi-annual Report • June 30, 2006
Mosaic Income Trust June 30, 2006
Statements of Assets and Liabilities (unaudited)
Government | Intermediate | |
| ASSETS | ||
| Investments, at value (Note 1 and 2) | ||
| Investment securities | $3,084,927 | $4,989,663 |
| Repurchase agreements | 51,000 | 35,000 |
| Total investments* | 3,135,927 | 5,024,663 |
| Cash | 106 | 734 |
| Interest receivable | 27,241 | 70,907 |
| Total assets | 3,163,274 | 5,096,304 |
| LIABILITIES | ||
| Payables | ||
| Dividends | 977 | 1,988 |
| Capital shares redeemed | 101 | 1,529 |
| Independent trustee and auditor fees | 1,981 | 2,477 |
| Total liabilities | 3,059 | 5,994 |
| NET ASSETS | $3,160,215 | $5,090,310 |
| Net assets consists of: | ||
| Paid in capital | $3,316,617 | $6,209,926 |
| Accumulated net realized losses | (54,158) | (1,029,702) |
| Net unrealized depreciation on investments | (102,244) | (89,914) |
| Net Assets | $3,160,215 | $5,090,310 |
| CAPITAL SHARES OUTSTANDING An unlimited number of capital shares, without par value, are authorized (Note 7) | 322,962 | 804,340 |
| NET ASSETS VALUE PER SHARE | $9.79 | $6.33 |
| *INVESTMENT SECURITIES, AT COST | $3,238,171 | $5,114,577 |
The Notes to Financial Statements are an integral part of these statements.
Mosaic Income Trust 7
Statements of Operations (unaudited)
For the six-months ended June 30, 2006
Government | Intermediate | |
| INVESTMENT INCOME (Note 1) | ||
| Interest income | $66,259 | $127,712 |
| EXPENSES (Notes 3 and 5) | ||
| Investment advisory fees | 9,908 | 16,668 |
| Other expenses: | ||
| Service agreement fees | 6,738 | 9,734 |
| Independent trustee and auditor fees | 2,231 | 2,727 |
| Total other expenses | 8,969 | 12,461 |
| Total expenses | 18,877 | 29,129 |
| NET INVESTMENT INCOME | 47,382 | 98,583 |
| REALIZED AND UNREALIZED GAIN (LOSS) ON INVESTMENTS | ||
| Net realized loss on investments | (3,310) | (23,809) |
| Change in net unrealized depreciation of investments | (48,840) | (81,810) |
| NET LOSS ON INVESTMENTS | (52,150) | (105,619) |
| TOTAL DECREASE IN NET ASSETS RESULTING FROM OPERATIONS | $(4,768) | $(7,036) |
The Notes to Financial Statements are an integral part of these statements.
8 Semi-annual Report • June 30, 2006
Statements of Changes in Net Assets
For the period indicated
Government Fund | Intermediate Income Fund | |||
(unaudited) | Year Ended December 31, | (unaudited) | Year Ended December 31, | |
2006 | 2005 | 2006 | 2005 | |
| INCREASE (DECREASE) IN NET ASSETS RESULTING FROM OPERATIONS | ||||
| Net investment income | $47,382 | $104,422 | $98,583 | $205,476 |
| Net realized loss on investments | (3,310) | (33,374) | (23,809) | (19,269) |
| Net unrealized depreciation on investments | (48,840) | (60,384) | (81,810) | (144,338) |
| Total increase (decrease) in net assets resulting from operations | (4,768) | 10,664 | (7,036) | 41,869 |
| DISTRIBUTION TO SHAREHOLDERS FROM NET INVESTMENT INCOME | (47,382) | (104,422) | (98,583) | (205,476) |
| CAPITAL SHARE TRANSACTIONS (Note 7) | (35,540) | (1,790,351) | (406,030) | (275,711) |
| TOTAL DECREASE IN NET ASSETS | (87,690) | (1,884,109) | (511,649) | (439,318) |
| NET ASSETS | ||||
| Beginning of period | $3,247,905 | $5,132,014 | $5,601,959 | $6,041,277 |
| End of period | $3,160,215 | $3,247,905 | $5,090,310 | $5,601,959 |
The Notes to Financial Statements are an integral part of these statements.
Mosaic Income Trust 9
Selected data for a share outstanding for the periods indicated
GOVERNMENT FUND
(unaudited) | Year Ended December 31, | ||||
2006 | 2005 | 2004 | 2003 | 2002 | |
| Net asset value, beginning of year | $9.95 | $10.16 | $10.36 | $10.58 | $10.24 |
| Investment operations: | |||||
| Net investment income | 0.15 | 0.28 | 0.29 | 0.35 | 0.41 |
| Net realized and unrealized gain (loss) on investments | (0.16) | (0.21) | (0.20) | (0.22) | 0.34 |
| Total from investment operations | (0.01) | 0.07 | 0.09 | 0.13 | 0.75 |
| Less distributions from net investment income | (0.15) | (0.28) | (0.29) | (0.35) | (0.41) |
| Net asset value, end of year | $9.79 | $9.95 | $10.16 | $10.36 | $10.58 |
| Total return (%) | (0.14) | 0.69 | 0.89 | 1.24 | 7.45 |
| Ratios and supplemental data | |||||
| Net assets, end of year (in thousands) | $3,160 | $3,248 | $5,132 | $5,356 | $5,939 |
| Ratio of expenses to average net assets (%) | 1.181 | 1.19 | 1.15 | 1.15 | 1.14 |
| Ratio of net investment income to average net assets (%) | 2.961 | 2.75 | 2.83 | 3.32 | 3.92 |
| Portfolio turnover (%) | 14 | 43 | 55 | 31 | 44 |
INTERMEDIATE INCOME FUND
(unaudited) | Year Ended December 31, | ||||
2006 | 2005 | 2004 | 2003 | 2002 | |
| Net asset value, beginning of year | $6.46 | $6.64 | $6.71 | $6.66 | $6.67 |
| Investment operations: | |||||
| Net investment income | 0.12 | 0.23 | 0.22 | 0.25 | 0.30 |
| Net realized and unrealized gain (loss) on investments | (0.13) | (0.18) | (0.07) | 0.05 | (0.01) |
| Total from investment operations | (0.01) | 0.05 | 0.15 | 0.30 | 0.29 |
| Less distributions from net investment income | (0.12) | (0.23) | (0.22) | (0.25) | (0.30) |
| Net asset value, end of year | $6.33 | $6.46 | $6.64 | $6.71 | $6.66 |
| Total return (%) | (0.18) | 0.77 | 2.30 | 4.63 | 4.56 |
| Ratios and supplemental data | |||||
| Net assets, end of year (in thousands) | $5,090 | $5,602 | $6,041 | $6,428 | $6,839 |
| Ratio of expenses to average net assets (%) | 1.081 | 1.08 | 1.07 | 1.08 | 1.07 |
| Ratio of net investment income to average net assets (%) | 3.671 | 3.49 | 3.32 | 3.76 | 4.61 |
| Portfolio turnover (%) | 22 | 60 | 46 | 36 | 54 |
1Annualized.
The Notes to Financial Statements are an integral part of these statements.
10 Semi-annual Report • June 30, 2006
Mosaic Income Trust
1. Summary of Significant Accounting Policies. Mosaic Income Trust (the "Trust") is registered with the Securities and Exchange Commission under the Investment Company Act of 1940 as an open-end, diversified investment management company. This report contains information about two separate funds (the "Funds") whose objective is to receive and distribute bond income. The Government Fund invests in securities of the U.S. Government and its agencies. The Intermediate Income Fund invests in investment grade corporate, government and government agency fixed income securities. The Intermediate Income Fund may also invest a portion of its assets in securities rated as low as "B" by Moody's Investors Service, Inc. or Standard & Poor's Corporation. A third Mosaic Income Trust portfolio, available to certain institutional investors (as defined in the fund's prospectus) presents its financial information in a separate report.
Securities Valuation: Repurchase agreements and other securities having maturities of 60 days or less are valued at amortized cost, which approximates market value. Securities having longer maturities, for which market quotations are readily available, are valued at the mean between their closing bid and ask prices. Securities for which market quotations are not readily available are valued at their fair value as determined in good faith under procedures approved by the Board of Trustees.
Investment Transactions: Investment transactions are recorded on a trade date basis. The cost of investments sold is determined on the identified cost basis for financial statement and federal income tax purposes.
Investment Income: Interest income is recorded on an accrual basis. Bond premium is amortized and original issue discount and market discount are accreted over the expected life of each applicable security using the effective interest method. Other income is accrued as earned.
Distribution of Income and Gains: Distributions are recorded on the ex-dividend date. Net invest-ment income, determined as gross investment income less total expenses, is declared as a regular dividend and distributed to shareholders monthly. Capital gain distributions, if any, are declared and paid annually at year-end.
The tax character of distributions paid during 2005 and 2004 were as follows:
2005 | 2004 | |
| Government Fund: | ||
| Distributions paid from ordinary income | $104,422 | $149,215 |
| Intermediate Income Fund: | ||
| Distributions paid from ordinary income | $205,476 | $203,903 |
As of June 30, 2006, the components of distributable earnings on a tax basis were as follows (unaudited):
| Government Fund: | |
| Accumulated net realized losses | $(54,158) |
| Net unrealized depreciation on investments | (102,244) |
$(156,402) | |
| Intermediate Income Fund: | |
| Accumulated net realized losses | $(1,029,702) |
| Net unrealized depreciation on investments | (89,914) |
$(1,119,616) |
Net realized gains or losses may differ for financial and tax reporting purposes as a result of loss deferrals related to wash sales and post-October transactions.
Income Tax: No provision is made for federal income taxes since it is the intention of the Trust to comply with the provisions of the Internal Revenue Code available to investment companies and to make the requisite distribution to shareholders of taxable income which will be sufficient to relieve it from all or substantially all federal income taxes. As of December 31, 2005, the Funds had available for
Mosaic Income Trust 11
Notes to Financial Statements (continued)
federal income tax purposes the following unused capital loss carryovers:
| Expiration Date | Government | Intermediate |
| December 31, 2006 | $-- | $153,185 |
| December 31, 2007 | 9,847 | 486,268 |
| December 31, 2008 | 5,458 | 89,747 |
| December 31, 2009 | -- | 12,901 |
| December 31, 2010 | -- | 243,364 |
| December 31, 2013 | 33,544 | 20,428 |
Use of Estimates: The preparation of the financial statements in conformity with accounting principles generally accepted in the United States of America requires management to make estimates and assumptions. Such estimates affect the reported amounts of assets and liabilities and reported amounts of increases and decreases in net assets from operations during the reporting period. Actual results could differ from those estimates.
2. Investments in Repurchase Agreements. When the Trust purchases securities under agreements to resell, the securities are held for safekeeping by the Trust's custodian bank as collateral. Should the market value of the securities purchased under such an agreement decrease below the principal amount to be received at the termination of the agreement plus accrued interest, the counterparty is required to place an equivalent amount of additional securities in safekeeping with the Trust's custodian bank. Pursuant to an Exemptive Order issued by the Securities and Exchange Commission, the Trust, along with other registered investment companies having Advisory and Services Agreements with the same advisor, transfers uninvested cash balances into a joint trading account. The aggregate balance in this joint trading account is invested in one or more consolidated repurchase agreements whose underlying securities are U.S. Treasury or federal agency obligations. As of the date of this report, the Government Fund had approximately a 0.4% interest and the Intermediate Income Fund had approximately a 0.3% interest in the consolidated repurchase agreement of $11,732,000 collateralized by $12,028,124 in United States Treasury Notes. Proceeds at maturity were $11,736,302.
3. Investment Advisory Fees and Other Transactions with Affiliates. The investment advisor to the Trust, Madison Mosaic, LLC, a wholly owned subsidiary of Madison Investment Advisors, Inc. (collectively "the Advisor"), earns an advisory fee equal to 0.625% per annum of the average net assets of the Funds. The fees are accrued daily and are paid monthly.
4. Investment Transactions. Purchases and sales of securities (excluding short-term securities) for the six-months ended June 30, 2006 were as follows:
Purchases | Sales | |
| Government Fund: | ||
| U.S. Gov't securities | $514,505 | $407,086 |
| Other | -- | -- |
| Intermediate Income Fund: | ||
| U.S. Gov't securities | $974,761 | $547,455 |
| Other | 175,105 | 936,727 |
5. Other Expenses. Under a separate Services Agreement, the Advisor will provide or arrange for each Fund to have all other necessary operational and support services for a fee based on a percentage of average net assets. These fees are accrued daily and paid monthly. This percentage is 0.425% for the Government Fund and 0.365% for the Intermediate Income Fund.
The Funds also pay the expenses of the Funds' Independent Trustees and auditors directly. For the six-months ended June 30, 2006 these fees amounted to $2,231 and $2,727 for the Government and Intermediate Income Funds, respectively.
12 Semi-annual Report • June 30, 2006
Notes to Financial Statements (continued)
6. Aggregate Cost and Unrealized Appreciation (Depreciation). The aggregate cost for federal income tax purposes and the net unrealized appreciation (depreciation) are stated as follows as of June 30, 2006 (unaudited):
Government Fund | Intermediate Income Fund | |
| Aggregate Cost | $3,238,171 | $5,114,577 |
| Gross unrealized appreciation | 951 | 32,552 |
| Gross unrealized depreciation | (103,195) | (122,466) |
| Net unrealized depreciation | $(102,244) | $(89,914) |
7. Capital Share Transactions. An unlimited number of capital shares, without par value, are authorized. Transactions in capital shares for the following periods were:
(unaudited) Six-Months Ended | Year Ended Dec. 31, | |
| Government Fund | 2006 | 2005 |
| In Dollars | ||
| Shares sold | $56,755 | $304,015 |
| Shares issued in reinvestment of dividends | 41,893 | 90,429 |
| Total shares issued | 98,648 | 394,444 |
| Shares redeemed | (134,188) | (2,184,795) |
| Net decrease | $(35,540) | $(1,790,351) |
| In Shares | ||
| Shares sold | 5,753 | 30,261 |
| Shares issued in reinvestment of dividends | 4,252 | 9,007 |
| Total shares issued | 10,005 | 39,268 |
| Shares redeemed | (13,593) | (217,768) |
| Net decrease | (3,588) | (178,500) |
| Intermediate Income Fund | (unaudited) Six-Months Ended | Year Ended Dec. 31, |
2006 | 2005 | |
| In Dollars | ||
| Shares sold | $90,300 | $935,307 |
| Shares issued in reinvestment of dividends | 86,739 | 182,309 |
| Total shares issued | 177,039 | 1,117,616 |
| Shares redeemed | (583,069) | (1,393,327) |
| Net decrease | $(406,030) | $(275,711) |
| In Shares | ||
| Shares sold | 14,109 | 142,185 |
| Shares issued in reinvestment of dividends | 13,597 | 27,906 |
| Total shares issued | 27,706 | 170,091 |
| Shares redeemed | (91,208) | (212,454) |
| Net decrease | (63,502) | (42,363) |
Fund Expenses (unaudited)
Example: As a shareholder of the Funds, you incur two types of costs: (1) transaction costs and (2) ongoing costs, including Investment advisory fees and Other expenses. This Example is intended to help you understand your ongoing costs (in dollars) of investing in the Funds and to compare these costs with the ongoing costs of investing in other mutual funds. See footnotes 3 and 5 above for an explanation of the types of costs charged by the Funds. This Example is based on an investment of $1,000 invested on January 1, 2006 and held for the six-months ended June 30, 2006.
Actual Expenses
The table on the next page titled "Based on Actual Total Return" provides information about actual account values and actual expenses. You may use the information provided in this table, together with the amount you invested, to estimate the expenses that you paid over the period. To estimate the expenses you paid on your account, divide your ending
Mosaic Income Trust 13
Notes to Financial Statements (concluded)
account value by $1,000 (for example, an $8,500 ending account valued divided by $1,000 = 8.5), then multiply the result by the number under the heading entitled "Expenses Paid During the Period."
| Based on Actual Total Return1 | |||||
Actual | Beginning Account | Ending Account Value | Annualized Expense Ratio3 | Expenses Paid During the Period3 | |
| Government Fund | -0.14% | $1,000.00 | $998.65 | 1.18% | $5.85 |
| Intermediate Income Fund | -0.18% | $1,000.00 | $998.22 | 1.08% | $5.37 |
| 1For the six months ended June 30, 2006. 2Assumes reinvestment of all dividends and capital gains distributions, if any, at net asset value. 3Expenses are equal to the Funds' annualized expense ratio multiplied by the average account value over the period, multiplied by the number of days in the most recent fiscal half-year, then divided by 365. | |||||
Hypothetical Example for Comparison Purposes
The table below titled "Based on Hypothetical Total Return" provides information about hypothetical account values and hypothetical expenses based on the actual expense ratio and an assumed rate of return of 5.00% per year before expenses, which is not either Fund's actual return. The hypothetical account values and expenses may not be used to estimate the actual ending account balance or expenses you paid for the period. You may use the information provided in this table to compare the ongoing costs of investing in either Fund and other funds. To do so, compare the 5.00% hypothetical example relating to the Fund with the 5.00% hypothetical examples that appear in the shareholder reports of the other funds.
| Based on Hypothetical Total Return1 | |||||
Hypothetical Annualized Total Return | Beginning Account Value | Ending Account Value | Annualized Expense Ratio2 | Expenses Paid During the Period2 | |
| Government Fund | 5.00% | $1,000.00 | $1,025.05 | 1.18% | $5.93 |
| Intermediate Income Fund | 5.00% | $1,000.00 | $1,025.05 | 1.08% | $5.44 |
| 1For the six months ended June 30, 2006.
| |||||
| 2Expenses are equal to the Funds' annualized expense ratio multiplied by the average account value over the period, multiplied by the number of days in the most recent fiscal half-year, then divided by 365. | |||||
14 Semi-annual Report • June 30, 2006
Forward-Looking Statement Disclosure. One of our most important responsibilities as mutual fund managers is to communicate with shareholders in an open and direct manner. Some of our comments in our letters to shareholders are based on current management expectations and are considered "forward-looking statements." Actual future results, however, may prove to be different from our expectations. You can identify forward-looking statements by words such as "estimate," "may," "will," "expect," "believe," "plan" and other similar terms. We cannot promise future returns. Our opinions are a reflection of our best judgment at the time this report is compiled, and we disclaim any obligation to update or alter forward-looking statements as a result of new information, future events, or otherwise.
Proxy Voting Information. The Trust only invests in non-voting securities. Nevertheless, the Trust adopted policies that provide guidance and set forth parameters for the voting of proxies relating to securities held in the Trust's portfolios. Additionally, information regarding how the Trust voted proxies related to portfolio securities for the period ended June 30, 2006 is available. These policies and voting information are available to you upon request and free of charge by writing to Mosaic Funds, 550 Science Drive, Madison, WI 53711 or by calling toll-free at 1-800-368-3195. The Trust's proxy voting policies and voting information may also be obtained by visiting the Securities and Exchange Commission web site at www.sec.gov. The Trust will respond to shareholder requests for copies of our policies and voting information within two business days of request by first-class mail or other means designed to ensure prompt delivery.
N-Q Disclosure. The Trust files its complete schedule of portfolio holdings with the U.S. Securities and Exchange Commission (the "Commission") for the first and third quarters of each fiscal year on Form N-Q. The Trust's Forms N-Q are available on the Commission's website. The Trust's Forms N-Q may be reviewed and copied at the Commission's Public Reference Room in Washington, DC. Information about the operation of the Public Reference Room may be obtained by calling the Commission at 1-202-942-8090. Form N-Q and other information about the Trust are available on the EDGAR Database on the Commission's Internet site at http://www.sec.gov. Copies of this information may also be obtained, upon payment of a duplicating fee, by electronic request at the following email address: publicinfo@sec.gov, or by writing the Commission's Public Reference Section, Washington, DC 20549-0102. Finally, you may call Mosaic at 800-368-3195 if you would like a copy of Form N-Q and we will mail one to you at no charge.
Mosaic Income Trust 15
This page was left blank intentionally.
16 Semi-annual Report • June 30, 2006
The Mosaic Family of Mutual Funds
Mosaic Equity Trust
Mosaic Investors Fund
Mosaic Balanced Fund
Mosaic Mid-Cap Fund
Mosaic Foresight Fund
Madison Institutional Equity Option Fund
Mosaic Income Trust
Mosaic Government Fund
Mosaic Intermediate Income Fund
Mosaic Institutional Bond Fund
Mosaic Tax-Free Trust
Mosaic Virginia Tax-Free Fund
Mosaic Tax-Free National Fund
Mosaic Government Money Market
For more complete information on any Mosaic fund, including charges and expenses, request a prospectus by calling 1-800-368-3195. Read it carefully before you invest or send money. This document does not constitute an offering by the distributor in any jurisdiction in which such offering may not be lawfully made. Mosaic Funds Distributor, LLC.
TRANSER AGENT
Mosaic Funds
c/o US Bancorp Fund Services, LLC
P.O. Box 701
Milwaukee, WI 53201-0701
TELEPHONE NUMBERS
Shareholder Service
Toll-free nationwide: 888-670-3600
Mosaic Tiles (24 hour automated information)
Toll-free nationwide: 800-336-3600
550 Science Drive
Madison, Wisconsin 53711
Mosaic Funds
www.mosaicfunds.com
SEC File Number 811-3616
SEMI-ANNUAL REPORT
(Unaudited)
June 30, 2006
Mosaic Income Trust
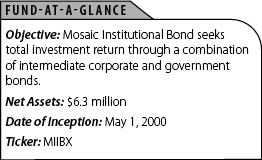
Mosaic Institutional Bond Fund
Mosaic Funds
www.mosaicfunds.com
Contents
| Portfolio Manager Review |
|
| Market Review | 1 |
| Fund Positioning | 1 |
| Outlook | 1 |
| Fund Overview | 1 |
| Portfolio of Investments | 3 |
| Statement of Assets and Liabilities | 4 |
| Statement of Operations | 5 |
| Statements of Changes in Net Assets | 5 |
| Financial Highlights | 6 |
| Notes to Financial Statements | 7 |
Mosaic Institutional Bond Fund June 30, 2006
Portfolio Manager Review
The first months of 2006 showed surprisingly strong economic growth, as the economy expanded at a 5.6% rate in the first quarter. While some of this initial 2006 growth can be attributed to a snap-back from the hurricane depressed levels seen in the fourth quarter of 2005, the economy was still showing signs of strength at the end of the second quarter.
In addition, inflation pressures continued to build. Industrial commodity prices rose across the board, with inputs such as zinc and copper reaching new highs. Capacity utilization, which is basically a measure of how much slack exists in industrial production, moved above 80%, a level that has traditionally been inflationary. Rising input prices, higher capacity utilization and tighter labor markets are all classic signs of a maturing economic expansion.
One of the notable events of the period was the retirement of long-time Federal Reserve Chairman Alan Greenspan, and the beginning of the Bernanke era. Rates were raised twice in the first quarter under Greenspan. Under new Fed Chairman, Ben Bernanke, the Federal Reserve raised short-term rates twice more during the second quarter of 2006, bringing the period-end rate to 5.25%. This was the 17th consecutive quarter-point rate increase over the past three years, and shows the Fed's resolve to dampen economic expansion and control inflation.
Since the generational lows in interest rates during the summer of 2003, we've consistently managed Institutional Bond Fund (the "Fund") with a cautious, conservative bent, keeping interest rate risk at low levels relative to the market. The artificially low level of yields offered scant income to protect against the price erosion of higher interest rates. As rates have moved higher during the six months, the Fund has benefited from this positioning, showing a positive return even as the valuation of bonds have been depressed.
We believe that the Fed's tightening campaign may be nearing an end. The Fed Funds Rate is now pushing above what is widely considered a "neutral" level, and entering territory where it should dampen economic expansion, which we've already witnessed in the housing market. As economic growth downshifts, the Fed's tightening cycle will likely end.
As active managers we are closely monitoring key economic indicators which should begin to signal an inflection point in interest rates sometime in the coming year. We have already made some portfolio adjustments to take advantage should long-term rates rise, while short-term rates hold or begin to drop, a scenario which is typical of this stage of the economic cycle.
Looking forward we believe there is reason to be optimistic. The surge in rates we've seen over the last few years is finally restoring more balance to the risk/return equation. With the Fund showing a 30-day SEC yield of 4.8% at period end, there is a meaningful income cushion to offset any further erosion in prices from higher interest rates. And with the Fed in the final innings of this rising-rate cycle, yields look much more attractive.
Fund Overview
Institutional Bond Fund returned 0.11% for the semi-annual period ended June 30, 2006. This return was superior to the fund's peers, as the Lipper Intermediate Investment Grade Index slipped -0.69%. This return difference largely reflects management's defensive positioning of the
Mosaic Institutional Bond Fund 1
Portfolio Manager Review (concluded)
portfolio. When interest rates rise, bond valuations fall, and shorter-term bonds typically retain their value far better than longer-term bonds. The Fund's 30-day SEC yield at period end was 4.82%, with an effective duration of 3.15 years.
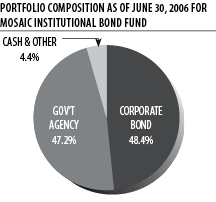
At period end, Institutional Bond Fund held 29.7% in Treasuries, 17.5% in government agency notes, and 48.4% in high-quality corporate bonds, plus a 4.4% position in cash and other assets. The fund's largest positions during this six-month period were short to intermediate duration bonds issued by the U.S. Treasury, Fannie Mae and Freddie Mac.
TOP TEN HOLDINGS AS OF JUNE 30, 2006
FOR MOSAIC INSTITUTIONAL BOND FUND
% of net assets | |
| US Treasury Note, 3.625%, 1/15/10 | 10.52% |
| Freddie Mac, 4.5%, 7/15/13 | 8.18% |
| US Treasury Note, 4.25%, 8/15/14 | 7.66% |
| Fannie Mae, 5.25%, 4/15/07 | 6.30% |
| US Treasury Note, 4.5%, 2/15/16 | 4.51% |
| US Treasury Note, 4.75%, 11/15/08 | 3.91% |
| MGIC Investment Corp., 6%, 3/15/07 | 3.16% |
| US Treasury Note, 4.875%, 2/15/12 | 3.12% |
| Freddie Mac, 3.625%, 9/15/08 | 3.04% |
| Countrywide Home Loan, 5.625%, 5/15/07 | 2.76% |
2 Semi-annual Report • June 30, 2006
Mosaic Institutional Bond Fund June 30, 2006
Portfolio of Investments (unaudited)
| CREDIT RATING* | PRINCIPAL AMOUNT | VALUE | ||
| MOODY'S | S&P | |||
| DEBT INSTRUMENTS: 95.6% of net assets | ||||
| Corporate Obligations: 48.4% | ||||
| A1 | A+ | American Express, 5.50%, 9/12/06 | $155,000 | $155,029 |
| Aa2 | AA- | Bank of America, 4.875%, 9/15/12 | 150,000 | 143,102 |
| Aa3 | A | Bank One Corp, 6.875%, 8/1/06 | 150,000 | 150,471 |
| Aa1 | AA- | Citigroup Inc, 4.25%, 7/29/09 | 150,000 | 144,427 |
| A3 | A- | CONOCO Inc, 6.35%, 10/15/11 | 150,000 | 154,495 |
| A3 | A | Countrywide Home Loan, 5.625%, 5/15/07 | 175,000 | 174,835 |
| Aaa | AAA | General Electric Capital Corp, 4.25%, 6/15/12 | 150,000 | 138,998 |
| Aa3 | A+ | Goldman Sachs, 6.65%, 5/15/09 | 150,000 | 153,944 |
| A3 | A- | Hewlett-Packard Co, 5.5%, 7/1/07 | 150,000 | 149,738 |
| A1 | A | Household Finance Co, 7.875%, 3/1/07 | 150,000 | 152,126 |
| A1 | A+ | IBM Corp, 4.75%, 11/29/12 | 150,000 | 142,339 |
| A1 | AA- | International Lease Finance, 4.875%, 9/1/10 | 150,000 | 145,215 |
| Aa3 | NA | Merrill Lynch, 7%, 1/15/07 | 150,000 | 151,139 |
| A1 | A | MGIC Investment Corp, 6.0%, 3/15/07 | 200,000 | 199,961 |
| Aa3 | A+ | Morgan Stanley Dean Witter, 3.625%, 4/1/08 | 170,000 | 164,590 |
| Aa3 | A | Nationsbank Corp, 7.5%, 9/15/06 | 150,000 | 150,553 |
| Aa3 | AA | Texaco Capital Inc, 5.5%, 1/15/09 | 150,000 | 150,374 |
| Aa3 | A+ | US Bancorp, 5.1%, 7/15/07 | 150,000 | 149,073 |
| Aa2 | AA | Wal-Mart Stores, 4.55%, 5/1/13 | 150,000 | 140,340 |
| A1 | A | WPS Resources Corp, 7%, 11/1/09 | 150,000 | 155,645 |
| U.S. Government & Agency Obligations: 47.2% | ||||
| Aaa | AAA | Fannie Mae, 5.25%, 4/15/07 | 400,000 | 399,133 |
| Aaa | AAA | Freddie Mac, 3.625%, 9/15/08 | 200,000 | 192,587 |
| Aaa | AAA | Freddie Mac, 4.50%, 7/15/13 | 550,000 | 518,470 |
| Aaa | AAA | US Treasury Notes, 4.75%,11/15/08 | 250,000 | 247,842 |
| Aaa | AAA | US Treasury Notes, 3.625%, 1/15/10 | 700,000 | 666,695 |
| Aaa | AAA | US Treasury Notes, 4.875%, 2/15/12 | 200,000 | 197,875 |
| Aaa | AAA | US Treasury Notes, 4.25%, 8/15/14 | 515,000 | 485,167 |
| Aaa | AAA | US Treasury Note, 4.25%, 2/15/16 | 300,000 | 285,516 |
| TOTAL DEBT INSTRUMENTS (Cost $6,209,225) | $6,059,679 | |||
| REPURCHASE AGREEMENT: 2.9% of net assetsWith Morgan Stanley and Company issued 6/30/06 at 4.40%, due 7/3/06, collateralized by $184,543 in United States Treasury Notes due 2/29/08. Proceeds at maturity are $180,066 (Cost $180,000). |
| 180,000 | ||
| TOTAL INVESTMENTS: 98.5% of net assets (Cost $6,389,225) | $6,239,679 | |||
| LIABILITIES LESS CASH AND RECEIVABLES: 1.5% of net assets | 97,554 | |||
| NET ASSETS: 100% | $6,337,233 | |||
Notes to the Portfolio of Investments:
* – Unaudited; Moody's – Moody's Investor Services, Inc.; S&P – Standard & Poor's Corporation
The Notes to Financial Statements are an integral part of these statements.
Mosaic Institutional Bond Fund 3
Mosaic Institutional Bond Fund June 30, 2006
Statement of Assets and Liabilities (unaudited)
| ASSETS | |
| Investments, at value (Note 1 and 2) | |
| Investment securities | $6,059,679 |
| Repurchase agreements | 180,000 |
| Total investments* | 6,239,679 |
| Cash | 844 |
| Interest receivable | 99,187 |
| Total assets | 6,339,710 |
| LIABILITIES | |
| Independent trustee and auditor fees | 2,477 |
| Total liabilities | 2,477 |
| NET ASSETS | $6,337,233 |
| Net assets consists of: | |
| Paid in capital | $6,566,663 |
| Accumulated net realized losses | (79,884) |
| Net unrealized depreciation on investments | (149,546) |
| Net Assets | $6,337,233 |
| CAPITAL SHARES OUTSTANDING An unlimited number of capital shares, without par value, are authorized (Note 7) | 639,272 |
| NET ASSETS VALUE PER SHARE | $9.91 |
| *INVESTMENT SECURITIES, AT COST | $6,389,225 |
The Notes to Financial Statements are an integral part of these statements.
4 Semi-annual Report • June 30, 2006
Statement of Operations (unaudited)
For the six-months ended June 30, 2006
| INVESTMENT INCOME (Note 1) | |
| Interest income | $162,461 |
| EXPENSES (Notes 3 and 5) | |
| Investment advisory fees | 11,210 |
| Other expenses: | |
| Service agreement fees | 2,990 |
| Independent trustee and auditor fees | 2,727 |
| Total other expenses | 5,717 |
| Total Expenses | 16,927 |
| NET INVESTMENT INCOME | 145,534 |
| REALIZED AND UNREALIZED LOSS ON INVESTMENTS | |
| Net realized loss on investments | (69,950) |
| Change in net unrealized depreciation of investments | (66,842) |
| NET LOSS ON INVESTMENTS | (136,792) |
| TOTAL INCREASE IN NET ASSETS RESULTING FROM OPERATIONS | $8,742 |
Statements of Changes in Net Assets
(unaudited) | Year Ended | |
2006 | 2005 | |
| INCREASE IN NET ASSETS RESULTING FROM OPERATIONS | ||
| Net investment income | $145,534 | $266,275 |
| Net realized loss on investments | (69,950) | (1,669) |
| Net unrealized depreciation on investments | (166,842) | (166,002) |
| Total increase in net assets resulting from operations | 8,742 | 98,604 |
| DISTRIBUTIONS TO SHAREHOLDERS FROM NET INVESTMENT INCOME | (145,534) | (266,275) |
| CAPITAL SHARE TRANSACTIONS (Note 7) | (1,198,375) | 332,519 |
| TOTAL INCREASE (DECREASE) IN NET ASSETS | (1,335,167) | 164,848 |
| NET ASSETS | ||
| Beginning of period | $7,672,400 | $7,507,552 |
| End of period | $6,337,233 | $7,672,400 |
The Notes to Financial Statements are an integral part of these statements.
Mosaic Institutional Bond Fund 5
Mosaic Institutional Bond Fund
Financial Highlights
Selected data for a share outstanding throughout each period indicated
(unaudited) | Year Ended December 31, | ||||
2006 | 2005 | 2004 | 2003 | 2002 | |
| Net asset value, beginning of period | $10.11 | $10.34 | $10.50 | $10.54 | $10.54 |
| Investment operations: | |||||
| Net investment income | 0.21 | 0.36 | 0.35 | 0.37 | 0.45 |
| Net realized and unrealized gain (loss) on investments | (0.20) | (0.23) | (0.16) | (0.04) | 0.04 |
| Total from investment operations | 0.01 | 0.13 | 0.19 | 0.33 | 0.49 |
| Less distributions: | |||||
| From net investment income | (0.21) | (0.36) | (0.35) | (0.37) | (0.45) |
| From net capital gains | -- | -- | -- | -- | (0.04) |
| Total distributions | (0.21) | (0.36) | (0.35) | (0.37) | (0.49) |
| Net asset value, end of period | $9.91 | $10.11 | $10.34 | $10.50 | $10.54 |
| Total return (%) | 0.11 | 1.24 | 1.84 | 3.18 | 4.79 |
| Ratios and supplemental data | |||||
| Net assets, end of period (in thousands) | $6,337 | $7,672 | $7,508 | $7,488 | $6,998 |
| Ratio of expenses to average net assets (%) | 0.451 | 0.45 | 0.45 | 0.45 | 0.45 |
| Ratio of net investment income to average net assets (%) | 3.871 | 3.48 | 3.35 | 3.53 | 4.28 |
| Portfolio turnover (%) | 20 | 39 | 24 | 38 | 30 |
1Annualized.
The Notes to Financial Statements are an integral part of these statements.
6 Semi-annual Report • June 30, 2006
Mosaic Institutional Bond Fund
Notes to Financial Statements
1. Summary of Significant Accounting Policies. Mosaic Income Trust (the "Trust") is registered with the Securities and Exchange Commission under the Investment Company Act of 1940 as an open-end, diversified investment manage-ment company. The Trust currently offers three portfolios, each of which is a diversified mutual fund. This report contains information about one of these portfolios, the Mosaic Institutional Bond Fund (the "Fund"), which commenced operations May 1, 2000. Its objectives and strategies are detailed in its prospectus. The remaining two Trust portfolios present their financial information in a separate report.
Securities Valuation: Repurchase agreements and other securities having maturities of 60 days or less are valued at amortized cost, which approximates market value. Securities having longer maturities, for which quotations are readily available, are valued at the mean between their closing bid and ask prices. Securities for which current market quotations are not readily available are valued at their fair value as determined in good faith under procedures approved by the Board of Trustees.
Investment Transactions: Investment transactions are recorded on a trade date basis. The cost of investments sold is determined on the identified cost basis for financial statement and federal income tax purposes.
Investment Income: Interest income is recorded on an accrual basis. Bond premium is amortized and original issue discount and market discount are accreted over the expected life of each applicable security using the effective interest method. Other income is accrued as earned.
Distribution of Income and Gains: Distributions are recorded on the ex-dividend date. Net investment income, determined as gross investment income less total expenses, is declared as a regular dividend and distributed to shareholders quarterly. Capital gain distributions, if any, are declared and paid annually at year-end.
The tax character of distributions paid during 2005 and 2004 were as follows:
2005 | 2004 | |
| Distributions paid from ordinary Income | $266,275 | $248,516 |
As of June 30, 2006, the components of distributable earnings on a tax basis were
as follows (unaudited):
| Accumulated net realized losses | $(79,884) |
| Net unrealized appreciation on investments | (149,546) |
$(229,430) |
Net realized gains or losses may differ for financial and tax reporting purposes as a result of loss deferrals related to wash sales and post-October transactions.
Income Tax: No provision is made for federal income taxes since it is the intention of the Fund to comply with the provisions of the Internal Revenue Code available to investment companies and to make the requisite distribution to shareholders of taxable income which will be sufficient to relieve it from all or substantially all federal income taxes. As of December 31, 2005, the Fund had available for federal income tax purposes an unused capital loss carryover of $3,426 which expires on December 31, 2010.
Use of Estimates: The preparation of financial statements in conformity with accounting principles generally accepted in the United States of America requires management to make estimates and assumptions. Such estimates affect the reported amounts of assets and liabilities and reported amounts of increases and decreases in net assets from
Mosaic Institutional Bond Fund 7
Notes to Financial Statements (continued)
operations during the reporting period. Actual results could differ from those estimates.
2. Investments in Repurchase Agreements. When the Fund purchases securities under agreements to resell, the securities are held for safekeeping by the Fund's custodian bank as collateral. Should the market value of the securities purchased under such an agreement decrease below the principal amount to be received at the termination of the agreement plus accrued interest, the counterparty is required to place an equivalent amount of additional securities in safekeeping with the Fund's custodian bank. Pursuant to an Exemptive Order issued by the Securities and Exchange Commission, the Fund, along with other registered investment companies having Advisory and Services Agreements with the same Advisor, transfers uninvested cash balances into a joint trading account. The aggregate balance in this joint trading account is invested in one or more consolidated repurchase agreements whose underlying securities are U.S. Treasury or federal agency obligations. As of the date of this report, the Fund had approximately a 1.5% interest in the consolidated repurchase agreement of $11,732,000 collateralized by$12,028,124 in United States Treasury Notes. Proceeds at maturity were $11,736,302.
3. Investment Advisory Fees and Other Transactions with Affiliates. The investment advisor to the Fund, Madison Mosaic, LLC, a wholly owned subsidiary of Madison Investment Advisors, Inc., (collectively "the Advisor"), earns an advisory fee equal to 0.30% per annum of the average net assets of the Fund. The fees are accrued daily and are paid monthly.
4. Investment Transactions. Purchases and sales of securities (excluding short-term securities) for the six-months ended June 30, 2006 were as follows:
Purchases | Sales | |
| U. S. Gov't Securities | $1,208,487 | $1,660,079 |
| Other | 198,696 | 891,019 |
5. Other Expenses. Under a separate Services Agreement, the Advisor will provide or arrange for the Fund to have all other necessary operational and support services for a fee based on a percentage of average net assets. These fees are accrued daily and paid monthly. This percentage is 0.08%.
The Fund also pays the expenses of the Fund's Independent Trustees and auditors directly. For the six-months ended June 30, 2006, these fees amounted to $2,727.
6. Aggregate Cost and Unrealized Appreciation (Depreciation). The aggregate cost for federal income tax purposes and the net unrealized appreciation (depreciation) are as follows as of June 30, 2006 (unaudited):
| Aggregate Cost | $6,389,225 |
| Gross unrealized appreciation | 9,738 |
| Gross unrealized depreciation | (159,284) |
| Net unrealized depreciation | $(149,546) |
8 Semi-annual Report • June 30, 2006
Notes to Financial Statements (continued)
7. Capital Share Transactions. An unlimited number of capital shares, without par value, are authorized. Transactions in capital shares were as follows:
(unaudited) | Year Ended December 31, | |
2006 | 2005 | |
| In Dollars | ||
| Shares sold | $92,612 | $190,271 |
| Shares issued in reinvestment of dividends | 145,534 | 266,275 |
| Total shares issued | 238,146 | 456,546 |
| Shares redeemed | (1,436,521) | (124,027) |
| Net increase (decrease) | $(1,198,375) | $332,519 |
| In Shares | ||
| Shares sold | 9,179 | 18,420 |
| Shares issued in reinvestment of dividends | 14,627 | 26,156 |
| Total shares issued | 23,806 | 44,576 |
| Shares redeemed | (143,328) | (12,097) |
| Net increase (decrease) | (119,522) | 32,479 |
Fund Expenses (unaudited)
Example: As a shareholder of the Fund, you incur two types of costs: (1) transaction costs and (2) ongoing costs, including Investment advisory fees and Other expenses. This Example is intended to help you understand your ongoing costs (in dollars) of investing in the Fund and to compare these costs with the ongoing costs of investing in other mutual funds. See footnotes 3 and 5 above for an explanation of the types of costs charged by the Fund.
This Example is based on an investment of $1,000 invested on January 1, 2006 and held for the six months ended June 30, 2006.
Actual Expenses
The table on the next page titled "Based on Actual Total Return" provides information about actual account values and actual expenses. You may use the information provided in this table, together with the amount you invested, to estimate the expenses that you paid over the period. To estimate the expenses you paid on your account, divide your ending account value by $1,000 (for example, an $8,500 ending account valued divided by $1,000 = 8.5), then multiply the result by the number under the heading entitled "Expenses Paid During the Period."
Mosaic Institutional Bond Fund 9
Notes to Financial Statements (concluded)
| Based on Actual Total Return1 | |||||
Actual Total Return2 | Beginning Account Value | Ending Account Value | Annualized Expense Ratio3 | Expenses Paid During the Period3 | |
| Institutional Bond Fund | 0.11% | $1,000.00 | $1,001.09 | 0.45% | $2.23 |
| 1For the six months ended June 30, 2006. 2Assumes reinvestment of all dividends and capital gains distributions, if any, at net asset value. 3Expenses are equal to the Fund's annualized expense ratio multiplied by the average account value over the period, multiplied by the number of days in the most recent fiscal half-year, then divided by 365. | |||||
Hypothetical Example for Comparison Purposes
The table below titled "Based on Hypothetical Total Return" provides information about hypothetical account values and hypothetical expenses based on the actual expense ratio and an assumed rate of return of 5.00% per year before expenses, which is not the Fund's actual return. The hypothetical account values and expenses may not be used to estimate the actual ending account balance or expenses you paid for the period. You may use the information provided in this table to compare the ongoing costs of investing in the Fund and other funds. To do so, compare the 5.00% hypothetical example relating to the Fund with the 5.00% hypothetical examples that appear in the shareholder reports of the other funds.
| Based on Hypothetical Total Return1 | |||||
Hypothetical Annualized Total Return | Beginning Account | Ending Account | Annualized Expense Ratio2 | Expenses Paid During the Period2 | |
| Institutional Bond Fund | 5.00% | $1,000.00 | $1,025.05 | 0.45% | $2.26 |
| 1For the six months ended June 30, 2006. 2Expenses are equal to the Fund's annualized expense ratio multiplied by the average account value over the period, multiplied by the number of days in the most recent fiscal half-year, then divided by 365. | |||||
10 Semi-annual Report • June 30, 2006
Forward-Looking Statement Disclosure. One of our most important responsibilities as mutual fund managers is to communicate with shareholders in an open and direct manner. Some of our comments in our letters to shareholders are based on current management expectations and are considered "forward-looking statements." Actual future results, however, may prove to be different from our expectations. You can identify forward-looking statements by words such as "estimate," "may," "will," "expect," "believe," "plan" and other similar terms. We cannot promise future returns. Our opinions are a reflection of our best judgment at the time this report is compiled, and we disclaim any obligation to update or alter forward-looking statements as a result of new information, future events, or otherwise.
Proxy Voting Information. The Trust only invests in non-voting securities. Nevertheless, the Trust adopted policies that provide guidance and set forth parameters for the voting of proxies relating to securities held in the Trust's portfolios. Additionally, information regarding how the Trust voted proxies related to portfolio securities for the period ended June 30, 2006 is available. These policies and voting information are available to you upon request and free of charge by writing to Mosaic Funds, 550 Science Drive, Madison, WI 53711 or by calling toll-free at 1-800-368-3195. The Trust's proxy voting policies and voting information may also be obtained by visiting the Securities and Exchange Commission web site at www.sec.gov. The Trust will respond to shareholder requests for copies of our policies and voting information within two business days of request by first-class mail or other means designed to ensure prompt delivery.
N-Q Disclosure. The Trust files its complete schedule of portfolio holdings with the U.S. Securities and Exchange Commission (the "Commission") for the first and third quarters of each fiscal year on Form N-Q. The Trust's Forms N-Q are available on the Commission's website. The Trust's Forms N-Q may be reviewed and copied at the Commission's Public Reference Room in Washington, DC. Information about the operation of the Public Reference Room may be obtained by calling the Commission at 1-202-942-8090. Form N-Q and other information about the Trust are available on the EDGAR Database on the Commission's Internet site at http://www.sec.gov. Copies of this information may also be obtained, upon payment of a duplicating fee, by electronic request at the following email address: publicinfo@sec.gov, or by writing the Commission's Public Reference Section, Washington, DC 20549-0102. Finally, you may call Mosaic at 800-368-3195 if you would like a copy of Form N-Q and we will mail one to you at no charge.
Mosaic Institutional Bond Fund 11
This page was left blank intentionally.
12 Semi-annual Report • June 30, 2006
The Mosaic Family of Mutual Funds
Mosaic Equity Trust
Mosaic Investors Fund
Mosaic Balanced Fund
Mosaic Mid-Cap Fund
Mosaic Foresight Fund
Madison Institutional Equity Option Fund
Mosaic Income Trust
Mosaic Government Fund
Mosaic Intermediate Income Fund
Mosaic Institutional Bond Fund
Mosaic Tax-Free Trust
Mosaic Virginia Tax-Free Fund
Mosaic Tax-Free National Fund
Mosaic Government Money Market
For more complete information on any Mosaic fund, including charges and expenses, request a prospectus by calling 1-800-368-3195. Read it carefully before you invest or send money. This document does not constitute an offering by the distributor in any jurisdiction in which such offering may not be lawfully made. Mosaic Funds Distributor, LLC.
TRANSER AGENT
Mosaic Funds
c/o US Bancorp Fund Services, LLC
P.O. Box 701
Milwaukee, WI 53201-0701
TELEPHONE NUMBERS
Shareholder Service
Toll-free nationwide: 888-670-3600
Mosaic Tiles (24 hour automated information)
Toll-free nationwide: 800-336-3600
550 Science Drive
Madison, Wisconsin 53711
Mosaic Funds
www.mosaicfunds.com
SEC File Number 811-3616
Item 2. Code of Ethics.
Not applicable in semi-annual report.
Item 3. Audit Committee Financial Expert.
Not applicable in semi-annual report.
Item 4. Principal Accountant Fees and Services.
Not applicable in semi-annual report.
Item 5. Audit Committee of Listed Registrants.
Not applicable.
Item 6. Schedule of Investments
Included in report to shareholders (Item 1) above.
Item 7. Disclosure of Proxy Voting Policies and Procedures for Closed-End Management Investment Companies.
Not applicable.
Item 8. Portfolio Managers of Closed-End Management Investment Companies.
Not applicable.
Item 9. Purchases of Equity Securities by Closed-End Management Investment Company and Affiliated Purchasers
Not applicable.
Item 10. Submission of Matters to a Vote of Security Holders.
During the period covered by this report, the registrant adopted written procedures by which shareholders may recommend nominees to the registrant’s Board of Trustees.
Item 11. Controls and Procedures.
(a) The Trust’s principal executive officer and principal financial officer determined that the Trust’s disclosure controls and procedures are effective, based on their evaluation of these controls and procedures within 90 days of the date of this report. There were no significant changes in the Trust’s internal controls or in other factors that could significantly affect these controls subsequent to the date of their evaluation. The officers identified no significant deficiencies or material weaknesses.
(b) There have been no changes in the registrant's internal control over financial reporting that occurred during the second fiscal quarter of the period covered by this report that has materially affected, or is reasonably likely to materially affect, the registrant's internal control over financial reporting.
Item 12. Exhibits.
(a)(1) Not applicable to semi-annual report.
(a)(2) Certifications of principal executive and principal financial officers as required by Rule 30a-2(a) under the Investment Company Act of 1940.
(a)(3) None (not applicable to open-end fund).
(b) Certification of principal executive and principal financial officers as required by Rule 30a-2(b) under the Investment Company Act of 1940.
SIGNATURES
Pursuant to the requirements of the Securities Exchange Act of 1934 and the Investment Company Act of 1940, the Registrant has duly caused this Report to be signed on its behalf by the undersigned, thereunto duly authorized.
Mosaic Income Trust
By: (signature)
W. Richard Mason, Secretary
Date: August 8, 2006
Pursuant to the requirements of the Securities Exchange Act of 1934 and the Investment Company Act of 1940, this Report has been signed below by the following persons on behalf of the Registrant and in the capacities and on the dates indicated.
By: (signature)
Katherine L. Frank, Chief Executive Officer
Date: August 8, 2006
By: (signature)
Greg Hoppe, Chief Financial Officer
Date: August 8, 2006