UNITED STATES
SECURITIES AND EXCHANGE COMMISSION
Washington, D.C. 20549
FORM N-CSR
CERTIFIED SHAREHOLDER REPORT OF REGISTERED MANAGEMENT INVESTMENT COMPANIES
Investment Company Act file number 811-03651
___________________Touchstone Strategic Trust-March Funds___________________
(Exact name of registrant as specified in charter)
303 Broadway, Suite 1100
___________________Cincinnati, Ohio 45202-4203___________________
(Address of principal executive offices) (Zip code)
E. Blake Moore, Jr.
303 Broadway, Suite 1100
___________________Cincinnati, Ohio 45202-4203___________________
(Name and address of agent for service)
Registrant’s telephone number, including area code: 800-638-8194
Date of fiscal year end: March 31
Date of reporting period: March 31, 2023
Form N-CSR is to be used by management investment companies to file reports with the Commission not later than 10 days after the transmission to stockholders of any report that is required to be transmitted to stockholders under Rule 30e-1 under the Investment Company Act of 1940 (17 CFR 270.30e-1). The Commission may use the information provided on Form N-CSR in its regulatory, disclosure review, inspection, and policymaking roles.
A registrant is required to disclose the information specified by Form N-CSR, and the Commission will make this information public. A registrant is not required to respond to the collection of information contained in Form N-CSR unless the Form displays a currently valid Office of Management and Budget (“OMB”) control number. Please direct comments concerning the accuracy of the information collection burden estimate and any suggestions for reducing the burden to Secretary, Securities and Exchange Commission, 450 Fifth Street, NW, Washington, DC 20549-0609. The OMB has reviewed this collection of information under the clearance requirements of 44 U.S.C. § 3507.
Item 1. Reports to Stockholders.
| (a) | The Report to Shareholders is attached herewith. |
| Touchstone Strategic Trust |
| Touchstone Flexible Income Fund |
| Touchstone Focused Fund |
| Touchstone Growth Opportunities Fund |
| Touchstone Mid Cap Growth Fund |
| Touchstone Non-US ESG Equity Fund (formerly Touchstone Global ESG Equity Fund) |
| Touchstone Sands Capital Emerging Markets Growth Fund |
| Touchstone Strategic Income Opportunities Fund |


President
Touchstone Strategic Trust
| Average Annual Total Returns** | |||
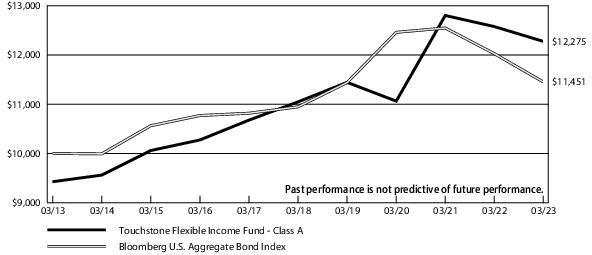
| Touchstone Flexible Income Fund | 1 Year | 5 Years | 10 Years |
| Class A | -5.60% | 0.93% | 2.07% |
| Class C | -4.09% | 1.35% | 2.07% |
| Class Y | -2.14% | 2.36% | 2.93% |
| Institutional Class | -2.04% | 2.49% | 3.04% |
| Bloomberg U.S. Aggregate Bond Index | -4.78% | 0.91% | 1.36% |
| * | The chart above represents performance of Class A shares only, which will vary from the performance of Class C shares, Class Y shares and Institutional Class shares based on the differences in sales loads and fees paid by shareholders in the different classes. |
| ** | The average annual total returns shown above are adjusted for maximum sales loads and fees, if applicable. The maximum offering price per share of Class A shares is equal to the net asset value (“NAV”) per share plus a sales load equal to 3.36% of the NAV (or 3.25% of the offering price). Class C shares are subject to a contingent deferred sales charge (“CDSC”) of 1.00%. The CDSC will be assessed on an amount |
| equal to the lesser of (1) the NAV at the time of purchase of the shares being redeemed or (2) the NAV of such shares being redeemed, if redeemed within a one-year period from the date of purchase. Class Y shares and Institutional Class shares are not subject to sales charges. |
| Average Annual Total Returns** | |||
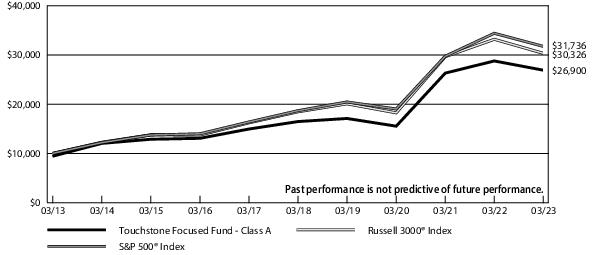
| Touchstone Focused Fund | 1 Year | 5 Years | 10 Years |
| Class A | -11.20% | 9.02% | 10.40% |
| Class C | -8.15% | 9.48% | 10.40% |
| Class Y | -6.26% | 10.65% | 11.37% |
| Institutional Class | -6.21% | 10.71% | 11.47% |
| Russell 3000® Index | -8.58% | 10.45% | 11.73% |
| S&P 500® Index | -7.73% | 11.19% | 12.24% |
| * | The chart above represents performance of Class A shares only, which will vary from the performance of Class C shares, Class Y shares and Institutional Class shares based on the differences in sales loads and fees paid by shareholders in the different classes. |
| ** | The average annual total returns shown above are adjusted for maximum sales loads and fees, if applicable. The maximum offering price per share of Class A shares is equal to the net asset value (“NAV”) per share plus a sales load equal to 5.26% of the NAV (or 5.00% of the offering price). Class C shares are subject to a contingent deferred sales charge (“CDSC”) of 1.00%. The CDSC will be assessed on an amount equal to the lesser of (1) the NAV at the time of purchase of the shares being redeemed or (2) the NAV of such shares being redeemed, if redeemed within a one-year period from the date of purchase. Class Y shares and Institutional Class shares are not subject to sales charges. |
| Average Annual Total Returns** | |||
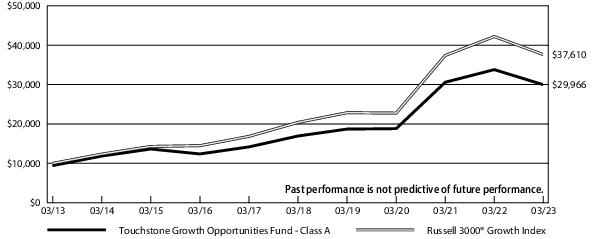
| Touchstone Growth Opportunities Fund | 1 Year | 5 Years | 10 Years |
| Class A | -15.77% | 10.76% | 11.60% |
| Class C | -12.85% | 11.24% | 11.59% |
| Class Y | -11.13% | 12.36% | 12.55% |
| Institutional Class | -11.02% | 12.48% | 12.66% |
| Russell 3000® Growth Index | -10.88% | 13.02% | 14.16% |
| * | The chart above represents performance of Class A shares only, which will vary from the performance of Class C shares, Class Y shares and Institutional Class shares based on the differences in sales loads and fees paid by shareholders in the different classes. |
| ** | The average annual total returns shown above are adjusted for maximum sales loads and fees, if applicable. The maximum offering price per share of Class A shares is equal to the net asset value (“NAV”) per share plus a sales load equal to 5.26% of the NAV (or 5.00% of the offering price). Class C shares are subject to a contingent deferred sales charge (“CDSC”) of 1.00%. The CDSC will be assessed on an amount equal to the lesser of (1) the NAV at the time of purchase of the shares being redeemed or (2) the NAV of such shares being redeemed, if redeemed within a one-year period from the date of purchase. Class Y shares and Institutional Class shares are not subject to sales charges. |
| Average Annual Total Returns** | |||
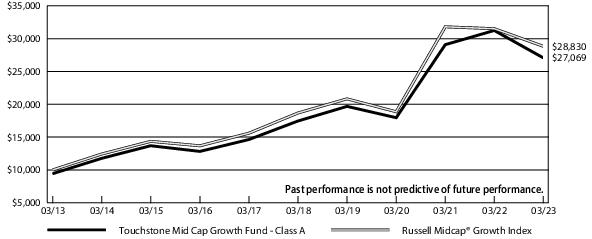
| Touchstone Mid Cap Growth Fund | 1 Year | 5 Years | 10 Years |
| Class A | -17.69% | 7.89% | 10.47% |
| Class C | -14.90% | 8.28% | 10.45% |
| Class Y | -13.15% | 9.43% | 11.41% |
| Institutional Class | -13.03% | 9.53% | 11.50% |
| Class R6* | -12.93% | 9.59% | 11.53% |
| Russell Midcap® Growth Index | -8.52% | 9.07% | 11.17% |
| * | The chart above represents performance of Class A shares only, which will vary from the performance of Class C shares, Class Y shares, Class R6 shares and Institutional Class shares based on the differences in sales loads and fees paid by shareholders in the different classes. The inception date of Class R6 shares was February 10, 2020. Class R6 shares performance information was calculated using the historical performance of Institutional Class shares for periods prior to February 10, 2020. The returns have been restated for fees applicable to Class R6 shares. |
| ** | The average annual total returns shown above are adjusted for maximum sales loads and fees, if applicable. The maximum offering price per share of Class A shares is equal to the net asset value (“NAV”) per share plus a sales load equal to 5.26% of the NAV (or 5.00% of the offering price). Class C shares are subject to a contingent deferred sales charge (“CDSC”) of 1.00%. The CDSC will be assessed on an amount equal to the lesser of (1) the NAV at the time of purchase of the shares being redeemed or (2) the NAV of such shares being redeemed, if redeemed within a one-year period from the date of purchase. Class Y shares, Class R6 shares and Institutional Class shares are not subject to sales charges. |
| Average Annual Total Returns** | |||
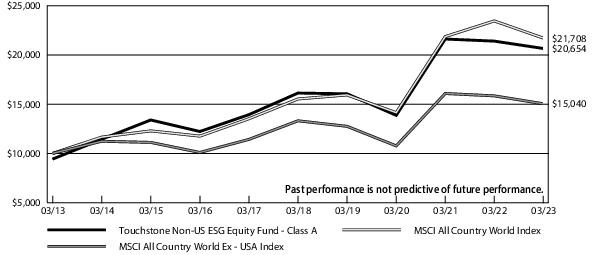
| Touchstone Non-US ESG Equity Fund | 1 Year | 5 Years | 10 Years |
| Class A | -8.31% | 3.84% | 7.52% |
| Class C | -5.16% | 4.20% | 7.48% |
| Class Y | -3.27% | 5.34% | 8.43% |
| Institutional Class* | -3.31% | 5.33% | 8.45% |
| MSCI All Country World Index | -7.44% | 6.93% | 8.06% |
| MSCI All Country World Ex - USA Index | -5.07% | 2.47% | 4.17% |
| * | The chart above represents performance of Class A shares only, which will vary from the performance of Class C shares, Class Y shares and Institutional Class shares based on the differences in sales loads and fees paid by shareholders in the different classes. The inception date of Institutional Class shares was May 4, 2015. Institutional Class shares performance information was calculated using the historical performance of Class A shares for periods prior to May 4, 2015. The returns have been restated for sales loads and fees applicable to Institutional Class shares. |
| ** | The average annual total returns shown above are adjusted for maximum sales loads and fees, if applicable. The maximum offering price per share of Class A shares is equal to the net asset value (“NAV”) per share plus a sales load equal to 5.26% of the NAV (or 5.00% of the offering price). Class C shares are subject to a contingent deferred sales charge (“CDSC”) of 1.00%. The CDSC will be assessed on an amount equal to the lesser of (1) the NAV at the time of purchase of the shares being redeemed or (2) the NAV of such shares being redeemed, if redeemed within a one-year period from the date of purchase. Class Y shares and Institutional Class shares are not subject to sales charges. |
| Average Annual Total Returns** | |||
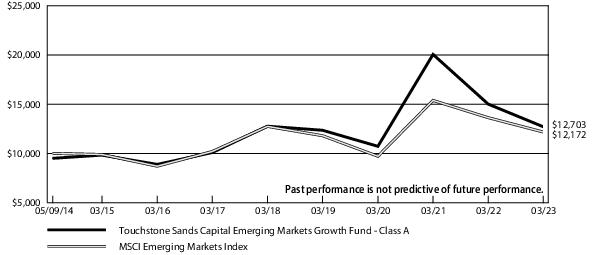
| Touchstone Sands Capital Emerging Markets Growth Fund | 1 Year | 5 Years | Since Inception* |
| Class A | -19.56% | -1.11% | 2.73% |
| Class C | -16.91% | -0.85% | 2.55% |
| Class Y | -15.13% | 0.19% | 3.60% |
| Institutional Class | -15.11% | 0.27% | 3.68% |
| Class R6 | -15.03% | 0.23% | 3.63% |
| MSCI Emerging Markets Index | -10.70% | -0.91% | 2.24% |
| * | The chart above represents performance of Class A shares only, which will vary from the performance of Class C shares, Class Y shares, Class R6 shares and Institutional Class shares based on the differences in sales loads and fees paid by shareholders in the different classes. The inception date of Class A shares, Class C shares, Class Y shares, Class R6 shares and Institutional Class shares was November 16, 2018, November 16, 2018, May 9, 2014, April 26, 2021 and May 9, 2014, respectively. Class A shares and Class C shares performance information was calculated using the historical performance of Class Y shares for periods prior to November 16, 2018. Class R6 shares performance information was calculated using the historical performance of Class Y shares for periods prior to April 26, 2021. The returns have been restated for sales loads and fees applicable to Class A shares, Class C shares and Class R6 shares. The returns of the index listed above are based on the inception date of the Fund. |
| ** | The average annual total returns shown above are adjusted for maximum sales loads and fees, if applicable. The maximum offering price per share of Class A shares is equal to the net asset value (“NAV”) per share plus a sales load equal to 5.26% of the NAV (or 5.00% of the offering price). Class C shares are subject to a contingent deferred sales charge (“CDSC”) of 1.00%. The CDSC will be assessed on an amount equal to the lesser of (1) the NAV at the time of purchase of the shares being redeemed or (2) the NAV of such shares being redeemed, if redeemed within a one-year period from the date of purchase. Class Y shares, Class R6 shares and Institutional Class shares are not subject to sales charges. |

| Average Annual Total Returns** | ||||
| Touchstone Strategic Income Opportunities Fund | 1 Year | 5 Years | 10 Years | Since Inception |
| Class A | -6.58% | 0.55% | 1.50% | 5.14% |
| Class C | -5.05% | 0.82% | 1.31% | 4.88% |
| Class Y* | -3.19% | 1.78% | — | 2.13% |
| Institutional Class* | -3.35% | — | — | -4.87% |
| Bloomberg U.S. Aggregate Bond Index | -4.78% | 0.91% | 1.36% | 4.42% |
| * | The chart above represents performance of Class A shares only, which will vary from the performance of Class C shares, Class Y shares and Institutional Class shares based on the differences in sales loads and fees paid by shareholders in the different classes. The inception date of Class Y shares and Institutional Class shares was January 29, 2015 and July 19, 2021, respectively. The returns of the Index are based on the inception date of the AIG Strategic Bond Fund (the "Predecessor Fund") which merged into the Touchstone Strategic Income Opportunities Fund effective July 17, 2021. |
| ** | The average annual total returns shown above are adjusted for maximum sales loads and fees, if applicable. The maximum offering price per share of Class A shares is equal to the net assets value (“NAV”) per share plus a sales load equal to 3.36% of the NAV (or 3.25% of the offering price). Class C shares are subject to a contingent deferred sales charge (“CDSC”) of 1.00%. The CDSC will be assessed on an amount equal to the lesser of (1) the NAV at the time of purchase of the shares being redeemed or (2) the NAV of such shares being redeemed, if redeemed within a one-year period from the date of purchase. Class Y shares and Institutional Class shares are not subject to sales charges. |
| Credit Quality*(% of Fixed Income Securities) | |
| A/A | 1.9% |
| BBB/Baa | 69.6 |
| BB/Ba | 15.4 |
| Not Rated | 13.1 |
| Total | 100.0% |
| Credit Quality*(% of Preferred Stocks) | |
| AAA/Aaa | 46.3% |
| AA/Aa | 1.5 |
| A/A | 4.2 |
| BBB/Baa | 5.9 |
| BB/Ba | 7.2 |
| B/B | 0.2 |
| Cash Equivalents | 34.7 |
| Total | 100.0% |
| Sector Allocation**(% of Net Assets) | |
| Fixed Income Securities | 53.4% |
| Preferred Stocks | |
| Financials | 5.6 |
| Utilities | 1.1 |
| Energy | 0.3 |
| Investment Funds | 5.8 |
| Short-Term U.S. Treasury Obligations | 29.4 |
| Short-Term Investment Funds | 7.2 |
| Other Assets/Liabilities (Net) | (2.8) |
| Total | 100.0% |
| Sector Allocation**(% of Net Assets) | |
| Information Technology | 22.6% |
| Health Care | 15.4 |
| Financials | 14.2 |
| Consumer Discretionary | 10.3 |
| Communication Services | 10.2 |
| Industrials | 8.4 |
| Consumer Staples | 6.6 |
| Energy | 2.6 |
| Real Estate | 2.2 |
| Materials | 1.5 |
| Short-Term Investment Fund | 6.0 |
| Other Assets/Liabilities (Net) | (0.0) |
| Total | 100.0% |
| Sector Allocation**(% of Net Assets) | |
| Information Technology | 37.0% |
| Health Care | 15.1 |
| Consumer Discretionary | 13.4 |
| Communication Services | 8.1 |
| Industrials | 7.5 |
| Financials | 6.6 |
| Consumer Staples | 4.3 |
| Materials | 2.5 |
| Energy | 1.3 |
| Real Estate | 0.9 |
| Short-Term Investment Funds | 4.8 |
| Other Assets/Liabilities (Net) | (1.5) |
| Total | 100.0% |
| Sector Allocation**(% of Net Assets) | |
| Information Technology | 26.1% |
| Industrials | 20.0 |
| Health Care | 18.8 |
| Consumer Discretionary | 14.9 |
| Financials | 7.6 |
| Materials | 3.2 |
| Energy | 3.0 |
| Consumer Staples | 1.7 |
| Communication Services | 1.2 |
| Real Estate | 1.0 |
| Short-Term Investment Fund | 3.7 |
| Other Assets/Liabilities (Net) | (1.2) |
| Total | 100.0% |
| Geographic Allocation(% of Net Assets) | |
| Common Stocks | |
| France | 18.6% |
| Japan | 15.0 |
| United Kingdom | 13.9 |
| Sweden | 7.3 |
| Germany | 6.3 |
| Switzerland | 4.7 |
| Singapore | 3.8 |
| India | 3.7 |
| South Korea | 3.7 |
| Taiwan | 3.7 |
| United States | 3.2 |
| Spain | 2.6 |
| Hong Kong | 2.0 |
| Canada | 1.9 |
| Ireland | 1.7 |
| Netherlands | 1.7 |
| Denmark | 1.5 |
| Thailand | 0.9 |
| Preferred Stocks | 2.2 |
| Short-Term Investment Funds | 6.7 |
| Other Assets/Liabilities (Net) | (5.1) |
| Total | 100.0% |
| Geographic Allocation(% of Net Assets) | |
| Common Stocks | |
| India | 29.1% |
| China | 20.9 |
| Brazil | 16.6 |
| Taiwan | 5.7 |
| Singapore | 5.6 |
| Hong Kong | 4.0 |
| South Korea | 3.5 |
| Indonesia | 3.2 |
| United States | 2.4 |
| Argentina | 2.3 |
| Kazakhstan | 1.7 |
| Thailand | 1.6 |
| Rights | 0.0 |
| Short-Term Investment Funds | 4.0 |
| Other Assets/Liabilities (Net) | (0.6) |
| Total | 100.0% |
| Credit Quality*(% of Fixed Income Securities) | |
| AAA/Aaa | 16.9% |
| AA/Aa | 2.3 |
| A/A | 15.1 |
| BBB/Baa | 39.8 |
| BB/Ba | 14.7 |
| B/B | 8.8 |
| CCC | 1.7 |
| CC | 0.2 |
| Not Rated | 0.5 |
| Total | 100.0% |
| Sector Allocation**(% of Net Assets) | |
| Corporate Bonds | 49.6% |
| Asset-Backed Securities | 16.5 |
| U.S. Treasury Obligations | 15.8 |
| Common Stocks | |
| Financials | 1.4 |
| Information Technology | 0.8 |
| Industrials | 0.8 |
| Materials | 0.6 |
| Energy | 0.4 |
| Consumer Staples | 0.4 |
| Health Care | 0.4 |
| Communication Services | 0.4 |
| Commercial Mortgage-Backed Securities | 4.0 |
| Sovereign Government Obligations | 3.1 |
| Non-Agency Collateralized Mortgage Obligations | 3.0 |
| Agency Collateralized Mortgage Obligations | 0.5 |
| Preferred Stocks | |
| Financials | 0.2 |
| Rights | 0.0 |
| Short-Term Investment Funds | 1.3 |
| Other Assets/Liabilities (Net) | 0.8 |
| Total | 100.0% |
| Principal Amount | Market Value | |||
| Agency Collateralized Mortgage Obligations — 25.2% | ||||
| $ 47,209,195 | FHLMC Multifamily Structured Pass Through Certificates, Ser K109, Class X1, 1.582%, 4/25/30(A)(B)(C) | $ 4,068,111 | ||
| 34,452,932 | FHLMC Multifamily Structured Pass Through Certificates, Ser K110, Class X1, 1.697%, 4/25/30(A)(B)(C) | 3,128,943 | ||
| 7,005,157 | FHLMC Multifamily Structured Pass Through Certificates, Ser K110, Class X3, 3.404%, 6/25/48(A)(B)(C) | 1,279,491 | ||
| 28,800,000 | FHLMC Multifamily Structured Pass Through Certificates, Ser K110, Class XAM, 1.868%, 4/25/30(A)(B)(C) | 3,069,158 | ||
| 34,631,602 | FHLMC Multifamily Structured Pass Through Certificates, Ser K111, Class X1, 1.571%, 5/25/30(A)(B)(C) | 3,029,008 | ||
| 19,436,545 | FHLMC Multifamily Structured Pass Through Certificates, Ser K111, Class X3, 3.178%, 4/25/48(A)(B)(C) | 3,377,282 | ||
| 35,663,000 | FHLMC Multifamily Structured Pass Through Certificates, Ser K111, Class XAM, 1.798%, 5/25/30(A)(B)(C) | 3,759,932 | ||
| 66,738,811 | FHLMC Multifamily Structured Pass Through Certificates, Ser K112, Class X1, 1.434%, 5/25/30(A)(B)(C) | 5,386,990 | ||
| 15,300,000 | FHLMC Multifamily Structured Pass Through Certificates, Ser K112, Class X3, 3.004%, 7/25/48(A)(B)(C) | 2,513,769 | ||
| 10,630,000 | FHLMC Multifamily Structured Pass Through Certificates, Ser K112, Class XAM, 1.665%, 5/25/30(A)(B)(C) | 1,041,676 | ||
| 10,743,000 | FHLMC Multifamily Structured Pass Through Certificates, Ser K113, Class XAM, 1.585%, 6/25/30(A)(B)(C) | 1,005,797 | ||
| 19,500,000 | FHLMC Multifamily Structured Pass Through Certificates, Ser K114, Class X3, 2.736%, 8/25/48(A)(B)(C) | 2,903,698 | ||
| 21,702,896 | FHLMC Multifamily Structured Pass Through Certificates, Ser K115, Class X3, 2.958%, 9/25/48(A)(B)(C) | 3,524,333 | ||
| 26,000,000 | FHLMC Multifamily Structured Pass Through Certificates, Ser K116, Class X3, 3.021%, 9/25/47(A)(B)(C) | 4,365,569 | ||
| 39,700,000 | FHLMC Multifamily Structured Pass Through Certificates, Ser K117, Class XAM, 1.433%, 9/25/30(A)(B)(C) | 3,440,426 | ||
| 24,368,853 | FHLMC Multifamily Structured Pass Through Certificates, Ser K118, Class X3, 2.693%, 10/25/48(A)(B)(C) | 3,672,674 | ||
| 4,900,000 | FHLMC Multifamily Structured Pass Through Certificates, Ser K119, Class X3, 2.728%, 9/25/48(A)(B)(C) | 755,646 | ||
| 11,576,808 | FHLMC Multifamily Structured Pass Through Certificates, Ser K120, Class X3, 2.740%, 11/25/48(A)(B)(C) | 1,761,217 | ||
| 16,073,000 | FHLMC Multifamily Structured Pass Through Certificates, Ser K121, Class X3, 2.772%, 11/25/48(A)(B)(C) | 2,528,206 | ||
| 9,700,000 | FHLMC Multifamily Structured Pass Through Certificates, Ser K122, Class X3, 2.631%, 1/25/49(A)(B)(C) | 1,439,413 | ||
| 7,569,056 | FHLMC Multifamily Structured Pass Through Certificates, Ser K123, Class X3, 2.628%, 2/25/49(A)(B)(C) | 1,143,812 | ||
| Principal Amount | Market Value | |||
| Agency Collateralized Mortgage Obligations — 25.2% (Continued) | ||||
| $ 9,255,000 | FHLMC Multifamily Structured Pass Through Certificates, Ser K124, Class X3, 2.620%, 2/25/49(A)(B)(C) | $ 1,382,843 | ||
| 16,150,000 | FHLMC Multifamily Structured Pass Through Certificates, Ser K125, Class X3, 2.653%, 2/25/49(A)(B)(C) | 2,448,374 | ||
| 38,058,448 | FHLMC Multifamily Structured Pass Through Certificates, Ser K127, Class X3, 2.653%, 3/25/49(A)(B)(C) | 5,853,907 | ||
| 18,230,000 | FHLMC Multifamily Structured Pass Through Certificates, Ser K128, Class X3, 2.781%, 4/25/31(A)(B)(C) | 2,943,642 | ||
| 10,595,456 | FHLMC Multifamily Structured Pass Through Certificates, Ser K130, Class X3, 3.097%, 8/25/48(A)(B)(C) | 2,009,692 | ||
| 41,864,611 | FHLMC Multifamily Structured Pass Through Certificates, Ser K130, Class XAM, 1.215%, 7/25/31(A)(B)(C) | 3,439,529 | ||
| 10,451,281 | FHLMC Multifamily Structured Pass Through Certificates, Ser K131, Class X3, 2.947%, 9/25/31(A)(B)(C) | 1,888,725 | ||
| 29,501,666 | FHLMC Multifamily Structured Pass Through Certificates, Ser K132, Class X3, 2.888%, 8/25/31(A)(B)(C) | 5,264,062 | ||
| 9,413,138 | FHLMC Multifamily Structured Pass Through Certificates, Ser K134, Class X3, 2.660%, 10/25/49(A)(B)(C) | 1,561,884 | ||
| 219,708,581 | FHLMC Multifamily Structured Pass Through Certificates, Ser K136, Class X1, 0.398%, 12/25/31(A)(B)(C) | 5,493,725 | ||
| 21,000,000 | FHLMC Multifamily Structured Pass Through Certificates, Ser K136, Class X3, 2.826%, 12/25/31(A)(B)(C) | 3,744,306 | ||
| 96,839,687 | FHLMC Multifamily Structured Pass Through Certificates, Ser K136, Class XAM, 0.568%, 12/25/31(A)(B)(C) | 3,822,727 | ||
| 19,801,000 | FHLMC Multifamily Structured Pass Through Certificates, Ser K137, Class X3, 2.879%, 1/25/49(A)(B)(C) | 3,593,664 | ||
| 31,585,759 | FHLMC Multifamily Structured Pass Through Certificates, Ser K139, Class X3, 3.036%, 2/25/49(A)(B)(C) | 6,093,070 | ||
| 97,300,000 | FHLMC Multifamily Structured Pass Through Certificates, Ser K139, Class XAM, 0.767%, 2/25/32(A)(B)(C) | 5,378,666 | ||
| 31,370,856 | FHLMC Multifamily Structured Pass Through Certificates, Ser K140, Class X3, 2.945%, 3/25/49(A)(B)(C) | 5,863,960 | ||
| 10,400,000 | FHLMC Multifamily Structured Pass Through Certificates, Ser K143, Class X3, 3.140%, 4/25/50(A)(B)(C) | 2,071,883 | ||
| 5,835,659 | FHLMC Multifamily Structured Pass Through Certificates, Ser K-1515, Class X3, 3.680%, 3/25/38(A)(B)(C) | 1,631,599 | ||
| 18,435,033 | FHLMC Multifamily Structured Pass Through Certificates, Ser K-1516, Class X3, 3.457%, 10/25/38(A)(B)(C) | 4,643,276 | ||
| 34,242,500 | FHLMC Multifamily Structured Pass Through Certificates, Ser K-1517, Class X1, 1.324%, 7/25/35(A)(B)(C) | 3,774,859 | ||
| 52,485,811 | FHLMC Multifamily Structured Pass Through Certificates, Ser K-1517, Class X3, 3.284%, 8/25/38(A)(B)(C) | 13,603,063 | ||
| Principal Amount | Market Value | |||
| Agency Collateralized Mortgage Obligations — 25.2% (Continued) | ||||
| $ 11,201,391 | FHLMC Multifamily Structured Pass Through Certificates, Ser K-1519, Class X3, 2.800%, 12/25/38(A)(B)(C) | $ 2,569,136 | ||
| 54,863,818 | FHLMC Multifamily Structured Pass Through Certificates, Ser K-1520, Class X1, 0.472%, 2/25/36(A)(B)(C) | 2,234,603 | ||
| 5,000,000 | FHLMC Multifamily Structured Pass Through Certificates, Ser K-1520, Class X3, 3.092%, 4/25/39(A)(B)(C) | 1,265,070 | ||
| 53,917,146 | FHLMC Multifamily Structured Pass Through Certificates, Ser K-1521, Class X1, 0.980%, 8/25/36(A)(B)(C) | 4,659,218 | ||
| 15,100,238 | FHLMC Multifamily Structured Pass Through Certificates, Ser K739, Class X3, 2.807%, 11/25/48(A)(B)(C) | 1,539,734 | ||
| 16,196,664 | FHLMC Multifamily Structured Pass Through Certificates, Ser K741, Class X3, 2.448%, 3/25/49(A)(B)(C) | 1,507,498 | ||
| 16,000,000 | FHLMC Multifamily Structured Pass Through Certificates, Ser K742, Class X3, 2.595%, 4/25/28(A)(B)(C) | 1,665,131 | ||
| 9,500,000 | FHLMC Multifamily Structured Pass Through Certificates, Ser K743, Class X3, 2.954%, 6/25/49(A)(B)(C) | 1,156,645 | ||
| 39,018,396 | FHLMC Multifamily Structured Pass Through Certificates, Ser K744, Class X3, 2.967%, 8/25/49(A)(B)(C) | 4,990,933 | ||
| 47,774,075 | FHLMC Multifamily Structured Pass Through Certificates, Ser K745, Class X3, 2.674%, 9/25/49(A)(B)(C) | 5,660,898 | ||
| 146,903,000 | FHLMC Multifamily Structured Pass Through Certificates, Ser K745, Class XAM, 1.011%, 9/25/28(A)(B)(C) | 6,839,040 | ||
| 155,000,000 | FHLMC Multifamily Structured Pass Through Certificates, Ser K746, Class XAM, 0.586%, 10/25/28(A)(B)(C) | 4,326,965 | ||
| 52,159,495 | FHLMC Multifamily Structured Pass Through Certificates, Ser K747, Class X3, 2.549%, 12/25/49(A)(B)(C) | 6,130,493 | ||
| 30,283,347 | FRESB Mortgage Trust, Ser 2020-SB79, Class X1, 1.088%, 7/25/40(A)(B)(C) | 1,180,430 | ||
| 42,609,123 | FRESB Mortgage Trust, Ser 2020-SB81, Class X1, 1.039%, 10/25/40(A)(B)(C) | 1,733,441 | ||
| 35,412,860 | FRESB Mortgage Trust, Ser 2021-SB82, Class X1, 1.074%, 10/25/40(A)(B)(C) | 1,186,395 | ||
| 50,895,371 | FRESB Mortgage Trust, Ser 2021-SB83, Class X1, 0.867%, 1/25/41(A)(B)(C) | 1,730,733 | ||
| 28,696,375 | FRESB Mortgage Trust, Ser 2021-SB84, Class X1, 0.505%, 1/25/41(A)(B)(C) | 663,489 | ||
| 70,449,270 | FRESB Mortgage Trust, Ser 2021-SB85, Class X1, 0.392%, 3/25/41(A)(B)(C) | 1,629,893 | ||
| 81,753,194 | FRESB Mortgage Trust, Ser 2021-SB87, Class X1, 0.649%, 4/25/41(A)(B)(C) | 2,326,630 | ||
| 82,435,466 | FRESB Mortgage Trust, Ser 2021-SB88, Class X1, 0.714%, 5/25/41(A)(B)(C) | 2,497,407 | ||
| 130,797,082 | FRESB Mortgage Trust, Ser 2022-SB94, Class X1, 0.057%, 11/25/41(A)(B)(C) | 2,345,388 | ||
| 137,685,881 | FRESB Multifamily Structured Pass Through Certificates, Ser 2021-SB86, Class X1, 0.336%, 3/25/41(A)(B)(C) | 2,944,426 | ||
| 63,769,569 | FRESB Multifamily Structured Pass Through Certificates, Ser 2021-SB89, Class X1, 0.596%, 6/25/41(A)(B)(C) | 1,713,342 | ||
| Principal Amount | Market Value | |||
| Agency Collateralized Mortgage Obligations — 25.2% (Continued) | ||||
| $ 3,826,553 | GNMA, Ser 2012-147, Class IO, 0.550%, 4/16/54(A)(B)(C) | $ 48,634 | ||
| 9,393,367 | GNMA, Ser 2016-110, Class IO, 0.923%, 5/16/58(A)(B)(C) | 379,868 | ||
| 19,868,270 | GNMA, Ser 2016-158, Class IO, 0.758%, 6/16/58(A)(B)(C) | 681,599 | ||
| 12,335,494 | GNMA, Ser 2016-52, Class IO, 0.766%, 3/16/58(A)(B)(C) | 408,437 | ||
| 15,200,790 | GNMA, Ser 2017-76, Class IO, 0.791%, 12/16/56(A)(B)(C) | 631,786 | ||
| 16,026,868 | GNMA, Ser 2017-94, Class IO, 0.586%, 2/16/59(A)(B)(C) | 548,133 | ||
| Total Agency Collateralized Mortgage Obligations | $210,898,002 | |||
| Corporate Bonds — 24.9% | ||||
| Financials — 11.6% | ||||
| 6,406,000 | Ally Financial, Inc., Ser B, 4.700%(D) | 4,596,305 | ||
| 16,454,000 | Ally Financial, Inc., Ser C, 4.700%(D) | 10,900,775 | ||
| 3,410,000 | Bank of America Corp., 6.250%(D) | 3,329,013 | ||
| 3,340,000 | Bank of New York Mellon Corp. (The), Ser G, 4.700%(D) | 3,160,539 | ||
| 20,570,000 | Charles Schwab Corp. (The), Ser G, 5.375%(D) | 19,490,075 | ||
| 2,585,000 | Citigroup, Inc., 5.000%(D) | 2,416,975 | ||
| 6,809,000 | Citigroup, Inc., 7.375%(D) | 6,704,141 | ||
| 4,388,000 | Citigroup, Inc., Ser W, 4.000%(D) | 3,836,560 | ||
| 12,054,000 | Citizens Financial Group, Inc., Ser F, 5.650%(D) | 10,402,163 | ||
| 6,244,000 | Fifth Third Bancorp, Ser L, 4.500%(D) | 5,414,399 | ||
| 6,667,000 | JPMorgan Chase & Co., 3.220%, 3/1/25 | 6,522,620 | ||
| 8,316,000 | Lincoln National Corp., Ser C, 9.250%(D) | 8,295,210 | ||
| 13,737,000 | Regions Financial Corp., Ser D, 5.750%(D) | 12,483,045 | ||
| 97,551,820 | ||||
| Utilities — 5.1% | ||||
| 15,184,000 | Edison International, Ser A, 5.375%(D) | 13,428,465 | ||
| 21,000 | NextEra Energy Capital Holdings, Inc., 4.255%, 9/1/24 | 20,795 | ||
| 25,846,000 | Sempra Energy, 4.875%(D) | 24,205,025 | ||
| 4,569,000 | System Energy Resources, Inc., 6.000%, 4/15/28 | 4,689,286 | ||
| 42,343,571 | ||||
| Energy — 4.3% | ||||
| 26,673,000 | BP Capital Markets PLC (United Kingdom), 4.875%(D) | 24,239,089 | ||
| 4,068,000 | Enbridge, Inc. (Canada), 2.150%, 2/16/24 | 3,949,120 | ||
| 6,180,000 | Energy Transfer LP, (3M LIBOR +3.018%), 7.831%, 11/1/66(B) | 4,480,500 | ||
| 3,749,000 | Energy Transfer LP, Ser G, 7.125%(D) | 3,152,909 | ||
| 35,821,618 | ||||
| Consumer Discretionary — 2.2% | ||||
| 4,853,000 | General Motors Financial Co., Inc., 6.050%, 10/10/25 | 4,929,469 | ||
| 3,304,000 | Magallanes, Inc., 144a, 3.428%, 3/15/24 | 3,228,020 | ||
| 10,436,000 | NCL Corp. Ltd., 144a, 8.375%, 2/1/28 | 10,471,769 | ||
| 18,629,258 | ||||
| Industrials — 1.5% | ||||
| 13,047,000 | Neptune Bidco US, Inc., 144a, 9.290%, 4/15/29 | 12,095,874 | ||
| Consumer Staples — 0.2% | ||||
| 3,078,000 | Macy's Retail Holdings LLC, 4.300%, 2/15/43 | 1,895,300 | ||
| Information Technology — 0.0% | ||||
| 483,000 | Micron Technology, Inc., 3.477%, 11/1/51 | 313,562 | ||
| Total Corporate Bonds | $208,651,003 | |||
| Shares | MarketValue | |||
| Preferred Stocks — 7.0% | ||||
| Financials — 5.6% | ||||
| 620,694 | AGNC Investment Corp. REIT, Ser F, 6.125%(D) | $ 12,109,740 | ||
| 425,955 | Annaly Capital Management, Inc. REIT, Ser I, 6.750%(D) | 9,562,690 | ||
| 512 | Athene Holding Ltd., Ser E, 7.750%(D) | 12,232 | ||
| 293,475 | Lincoln National Corp., Ser D, 9.000%(D)† | 7,483,612 | ||
| 25,511 | Morgan Stanley, Ser E, 7.125%(D) | 640,326 | ||
| 67,047 | National Rural Utilities Cooperative Finance Corp., Ser US, 5.500%, 5/15/64† | 1,567,559 | ||
| 130,237 | Reinsurance Group of America, Inc., 7.125%, 10/15/52 | 3,425,233 | ||
| 290,000 | Rithm Capital Corp. REIT, Ser D, 7.000%(D) | 5,713,000 | ||
| 135,574 | Stifel Financial Corp., 5.200%, 10/15/47† | 2,796,892 | ||
| 184,063 | Virtus Convertible & Income Fund, Ser A, 5.625%(D) | 3,972,079 | ||
| 47,283,363 | ||||
| Utilities — 1.1% | ||||
| 316,505 | Brookfield Renewable Partners LP (Canada), Ser 17, 5.250%(D) | 6,247,809 | ||
| 128,895 | Entergy Louisiana LLC, 4.875%, 9/1/66 | 3,014,854 | ||
| 1,065 | Entergy Mississippi LLC, 4.900%, 10/1/66 | 24,580 | ||
| 9,287,243 | ||||
| Energy — 0.3% | ||||
| 87,656 | Enbridge, Inc. (Canada), Ser 5, 5.375%(D) | 1,796,948 | ||
| 32,865 | Enbridge, Inc. (Canada), Ser L, 5.858%(D) | 663,216 | ||
| 2,460,164 | ||||
| Total Preferred Stocks | $59,030,770 | |||
| Investment Funds — 5.8% | ||||
| 241,449 | Allspring Income Opportunities± | 1,528,372 | ||
| 626,101 | BlackRock Corporate High Yield Fund, Inc.±† | 5,459,601 | ||
| 67,704 | BlackRock Credit Allocation Income Trust± | 696,674 | ||
| 90,324 | BlackRock Ltd. Duration Income Trust± | 1,184,148 | ||
| 163,469 | BlackRock MuniHoldings Fund, Inc.± | 1,969,801 | ||
| 514,851 | BlackRock MuniVest Fund, Inc.± | 3,562,769 | ||
| 181,932 | BlackRock MuniYield Quality Fund III, Inc.± | 2,063,109 | ||
| 18,216 | Cohen & Steers Ltd. Duration Preferred & Income Fund, Inc.± | 324,973 | ||
| 198,382 | Eaton Vance Municipal Bond Fund± | 2,063,173 | ||
| 89,857 | First Trust High Income Long/Short Fund±† | 1,019,877 | ||
| 518,862 | Invesco Municipal Opportunity Trust± | 5,090,036 | ||
| 247,810 | Invesco Municipal Trust± | 2,458,275 | ||
| 411,219 | Invesco Trust for Investment Grade Municipals± | 4,087,517 | ||
| 625,723 | Nuveen AMT-Free Quality Municipal Income Fund± | 6,958,040 | ||
| 147,366 | Nuveen Preferred & Income Opportunities Fund± | 969,668 | ||
| 392,798 | Nuveen Quality Municipal Income Fund±† | 4,528,961 | ||
| 875,943 | Western Asset High Income Opportunity Fund, Inc.± | 3,337,343 | ||
| 122,046 | Western Asset High Yield Defined Opportunity Fund, Inc.±† | 1,462,111 | ||
| Total Investment Funds | $48,764,448 | |||
| Principal Amount | ||||
| Non-Agency Collateralized Mortgage Obligations — 1.9% | ||||
| $ 54,043 | Bear Stearns Asset Backed Securities Trust, Ser 2003-AC7, Class A2, 5.750%, 1/25/34(B)(C) | 45,704 | ||
| 15,867,868 | LSTAR Securities Investment Ltd., Ser 2023-1, Class A1, 144a, (SOFR +3.500%), 8.320%, 1/1/28(B) | 15,867,868 | ||
| 4,805 | Merrill Lynch Mortgage Investors Trust, Ser 2003-A1, Class 2A, (12M LIBOR +1.625%), 7.316%, 12/25/32(B) | 4,457 | ||
| Principal Amount | MarketValue | |||
| Non-Agency Collateralized Mortgage Obligations — 1.9% (Continued) | ||||
| $ 101,561 | Morgan Stanley Mortgage Loan Trust, Ser 2004-7AR, Class 2A6, 4.587%, 9/25/34(B)(C) | $ 97,886 | ||
| 9,742 | RALI Series Trust, Ser 2004-QS6, Class A1, 5.000%, 5/25/19 | 9,061 | ||
| Total Non-Agency Collateralized Mortgage Obligations | $16,024,976 | |||
| Asset-Backed Securities — 1.2% | ||||
| 340,386 | Carmax Auto Owner Trust, Ser 2021-1, Class A3, 0.340%, 12/15/25 | 329,062 | ||
| 1,561 | Flagship Credit Auto Trust, Ser 2021-1, Class A, 144a, 0.310%, 6/16/25 | 1,558 | ||
| 705,000 | GLS Auto Receivables Issuer Trust, Ser 2021-2A, Class C, 144a, 1.080%, 6/15/26 | 677,504 | ||
| 198,833 | Mid-State Capital Corp. Trust, Ser 2005-1, Class M2, 7.079%, 1/15/40 | 197,542 | ||
| 3,121,516 | Mountain View CLO X Ltd. (Cayman Islands), Ser 2015-10A, Class AR, 144a, (3M LIBOR +0.820%), 5.635%, 10/13/27(B) | 3,120,040 | ||
| 750,000 | Palmer Square Loan Funding Ltd. (Cayman Islands), Ser 2021-1A, Class B, 144a, (3M LIBOR +1.800%), 6.608%, 4/20/29(B) | 722,479 | ||
| 3,000,000 | Palmer Square Loan Funding Ltd. (Cayman Islands), Ser 2021-1A, Class D, 144a, (3M LIBOR +6.000%), 10.808%, 4/20/29(B) | 2,756,079 | ||
| 468,503 | Palmer Square Loan Funding Ltd. (Cayman Islands), Ser 2021-3A, Class A1, 144a, (3M LIBOR +0.800%), 5.608%, 7/20/29(B) | 463,078 | ||
| 135,015 | Verizon Owner Trust, Ser 2020-A, Class A1A, 1.850%, 7/22/24 | 134,768 | ||
| 560,716 | Welk Resorts LLC, Ser 2017-AA, Class A, 144a, 2.820%, 6/15/33 | 553,010 | ||
| 643,693 | Westlake Automobile Receivables Trust, Ser 2021-2A, Class A2A, 144a, 0.320%, 4/15/25 | 639,383 | ||
| Total Asset-Backed Securities | $9,594,503 | |||
| Commercial Mortgage-Backed Securities — 0.2% | ||||
| 29,557,012 | BANK, Ser 2020-BN26, Class XA, 1.223%, 3/15/63(A)(B)(C) | 1,805,440 | ||
| Short-Term U.S. Treasury Obligations — 29.4% | ||||
| 40,000,000 | U.S. Treasury Bills, 0.000%, 8/1/23# | 39,365,774 | ||
| 10,000,000 | U.S. Treasury Bills, 4.667%, 6/6/23# | 9,919,307 | ||
| 25,000,000 | U.S. Treasury Bills, 4.676%, 5/23/23# | 24,840,191 | ||
| 15,000,000 | U.S. Treasury Bills, 4.690%, 5/30/23# | 14,890,275 | ||
| 20,000,000 | U.S. Treasury Bills, 4.906%, 6/27/23# | 19,783,604 | ||
| 50,000,000 | U.S. Treasury Bills, 5.037%, 8/24/23# | 49,059,576 | ||
| 40,000,000 | U.S. Treasury Bills, 5.095%, 9/7/23# | 39,186,435 | ||
| 50,000,000 | U.S. Treasury Bills, 5.131%, 7/11/23# | 49,353,521 | ||
| Total Short-Term U.S. Treasury Obligations | $246,398,683 | |||
| Shares | MarketValue | |||
| Short-Term Investment Funds — 7.2% | ||||
| 58,105,006 | Dreyfus Government Cash Management, Institutional Shares, 4.71%∞Ω | $ 58,105,006 | ||
| 2,276,706 | Invesco Government & Agency Portfolio, Institutional Class, 4.73%∞Ω** | 2,276,706 | ||
| Total Short-Term Investment Funds | $60,381,712 | |||
| Total Short-Term Securities | $306,780,395 | |||
| Total Investment Securities—102.8% (Cost $944,749,519) | $861,549,537 | |||
| Liabilities in Excess of Other Assets — (2.8%) | (23,254,629) | |||
| Net Assets — 100.0% | $838,294,908 | |||
| (A) | Interest only security - This type of security represents the right to receive the monthly interest payments on an underlying pool of mortgages. Payments of principal on the pool reduce the value of the “interest only” holding. |
| (B) | Variable rate security - Rate reflected is the rate in effect as of March 31, 2023. |
| (C) | Certain variable rate securities are not based on a published reference rate and spread but are determined by the issuer or agent and are based on current market conditions. These securities do not indicate a reference rate and spread in their description. |
| (D) | Perpetual Bond - A bond or preferred stock with no definite maturity date. |
| ± | Closed-end Fund. |
| ** | Represents collateral for securities loaned. |
| † | All or a portion of the security is on loan. The total market value of the securities on loan as of March 31, 2023 was $2,239,195. |
| # | Zero coupon bond - Rate shown reflects effective yield to maturity at time of purchase. |
| ∞ | Open-End Fund. |
| Ω | Represents the 7-Day SEC yield as of March 31, 2023. |
| Portfolio Abbreviations: |
| CLO – Collateralized Loan Obligation |
| FHLMC – Federal Home Loan Mortgage Corporation |
| FRESB – Freddie Mac Multifamily Securitization Small Balance Loan |
| GNMA – Government National Mortgage Association |
| ICE – Intercontinental Exchange, Inc. |
| IO – Interest Only |
| LIBOR – London Interbank Offered Rate |
| LLC – Limited Liability Company |
| LP – Limited Partnership |
| PLC – Public Limited Company |
| REIT – Real Estate Investment Trust |
| SOFR – Secured Overnight Financing Rate |
| 144a - This is a restricted security that was sold in a transaction qualifying for the exemption under Rule 144a of the Securities Act of 1933. This security may be sold in transactions exempt from registration, normally to qualified institutional buyers. At March 31, 2023, these securities were valued at $50,596,662 or 6.0% of net assets. These securities were deemed liquid pursuant to procedures approved by the Board of Trustees. |
| Valuation Inputs at Reporting Date: | ||||
| Description | Level 1 | Level 2 | Level 3 | Total |
| Assets: | ||||
| Agency Collateralized Mortgage Obligations | $— | $210,898,002 | $— | $210,898,002 |
| Corporate Bonds | — | 208,651,003 | — | 208,651,003 |
| Preferred Stocks | 59,030,770 | — | — | 59,030,770 |
| Investment Funds | 48,764,448 | — | — | 48,764,448 |
| Non-Agency Collateralized Mortgage Obligations | — | 16,024,976 | — | 16,024,976 |
| Asset-Backed Securities | — | 9,594,503 | — | 9,594,503 |
| Commercial Mortgage-Backed Securities | — | 1,805,440 | — | 1,805,440 |
| Short-Term U.S. Treasury Obligations | — | 246,398,683 | — | 246,398,683 |
| Short-Term Investment Funds | 60,381,712 | — | — | 60,381,712 |
| Total Assets | $168,176,930 | $693,372,607 | $— | $861,549,537 |
| Liabilities: | ||||
| Other Financial Instruments | ||||
| Swap Agreements | ||||
| Credit contracts | $— | $(642,669) | $— | $(642,669) |
| Total Liabilities | $— | $(642,669) | $— | $(642,669) |
| Total | $168,176,930 | $692,729,938 | $— | $860,906,868 |
| Counterparty | Termination Date | Notional Amount(2) | Pay Fixed Rate | Clearinghouse | Underlying Bond | Value(3) | Premiums Paid/ (Received) | Unrealized Depreciation |
| Buy Protection: | ||||||||
| Wells Fargo | 6/20/27 | $49,500,000 | 5.000% | ICE | Markit CDX North America High Yield Series 38 5Y Index | $(1,147,531) | $(753,015) | $(394,516) |
| Wells Fargo | 12/20/27 | $20,000,000 | 5.000% | ICE | Markit CDX North America High Yield Series 39 5Y Index | $(236,032) | $12,121 | $(248,153) |
| $(642,669) |
| (1) | If the Fund is a buyer of protection and a credit event occurs, as defined under the terms of that particular swap agreement, the Fund will either (i) receive from the seller of protection an amount equal to the notional amount of the swap and deliver the referenced obligation or underlying investments comprising the referenced index or (ii) receive a net settlement amount in the form of cash or investments equal to the notional amount of the swap less the recovery value of the referenced obligation or underlying investments comprising the referenced index. |
| (2) | The maximum potential amount the Fund could be required to pay as a seller of credit protection or receive as a buyer of credit protection if a credit event occurs as defined under the terms of that particular swap agreement. |
| (3) | The quoted market prices and resulting values for credit default swap agreements on the underlying bond serve as an indicator of the current status of the payment/performance risk and represent the likelihood of an expected liability (or profit) for the credit derivative had the notional amount of the swap agreement been closed/sold as of the period end. Decreasing market values (sell protection) or increasing market values (buy protection) when compared to the notional amount of the swap, represent a deterioration of the referenced entity's credit soundness and a greater likelihood or risk of default or other credit event occurring as defined under the terms of the agreement. |
| Shares | Market Value | |||
| Common Stocks — 94.0% | ||||
| Information Technology — 22.6% | ||||
| 432,791 | Apple, Inc. | $ 71,367,236 | ||
| 287,560 | Microsoft Corp. | 82,903,548 | ||
| 257,624 | Oracle Corp. | 23,938,422 | ||
| 129,288 | Salesforce, Inc.* | 25,829,157 | ||
| 114,131 | Texas Instruments, Inc. | 21,229,507 | ||
| 67,768 | Workday, Inc. - Class A* | 13,996,803 | ||
| 239,264,673 | ||||
| Health Care — 15.4% | ||||
| 136,341 | AmerisourceBergen Corp. | 21,829,558 | ||
| 196,209 | BioMarin Pharmaceutical, Inc.* | 19,079,363 | ||
| 277,881 | Bristol-Myers Squibb Co. | 19,259,932 | ||
| 86,671 | HCA Healthcare, Inc. | 22,853,409 | ||
| 191,981 | Johnson & Johnson | 29,757,055 | ||
| 228,400 | Medtronic PLC | 18,413,608 | ||
| 67,427 | UnitedHealth Group, Inc. | 31,865,326 | ||
| 163,058,251 | ||||
| Financials — 14.2% | ||||
| 748,902 | Bank of America Corp. | 21,418,597 | ||
| 150,861 | Berkshire Hathaway, Inc. - Class B* | 46,581,351 | ||
| 77,076 | Goldman Sachs Group, Inc. (The) | 25,212,330 | ||
| 35,430 | LPL Financial Holdings, Inc. | 7,171,032 | ||
| 13,475 | Markel Corp.* | 17,213,100 | ||
| 134,732 | PayPal Holdings, Inc.* | 10,231,548 | ||
| 100,160 | Visa, Inc. - Class A | 22,582,074 | ||
| 150,410,032 | ||||
| Consumer Discretionary — 10.3% | ||||
| 88,487 | Airbnb, Inc. - Class A* | 11,007,783 | ||
| 72,279 | Alibaba Group Holding Ltd. (China) ADR* | 7,385,468 | ||
| 315,140 | Amazon.com, Inc.* | 32,550,811 | ||
| 206,190 | Choice Hotels International, Inc. | 24,163,406 | ||
| 101,262 | Cracker Barrel Old Country Store, Inc. | 11,503,363 | ||
| 99,985 | Floor & Decor Holdings, Inc. - Class A* | 9,820,527 | ||
| 230,591 | Frontdoor, Inc.* | 6,428,877 | ||
| 48,188 | Hilton Worldwide Holdings, Inc. | 6,788,243 | ||
| 109,648,478 | ||||
| Communication Services — 10.2% | ||||
| 441,078 | Alphabet, Inc. - Class C* | 45,872,112 | ||
| 415,250 | Comcast Corp. - Class A | 15,742,128 | ||
| 114,411 | Fox Corp. - Class A | 3,895,695 | ||
| 143,614 | Meta Platforms, Inc. - Class A* | 30,437,551 | ||
| 33,905 | Netflix, Inc.* | 11,713,499 | ||
| 107,660,985 | ||||
| Industrials — 8.4% | ||||
| 134,971 | Allegiant Travel Co.* | 12,414,632 | ||
| 79,697 | Boeing Co. (The)* | 16,930,034 | ||
| 3,690 | Deere & Co. | 1,523,527 | ||
| 74,874 | Hubbell, Inc. | 18,217,593 | ||
| 237,661 | Raytheon Technologies Corp. | 23,274,142 | ||
| Shares | Market Value | |||
| Industrials — (Continued) | ||||
| 183,412 | SS&C Technologies Holdings, Inc. | $ 10,357,276 | ||
| 75,631 | Stanley Black & Decker, Inc. | 6,094,346 | ||
| 88,811,550 | ||||
| Consumer Staples — 6.6% | ||||
| 326,549 | Coca-Cola Femsa SAB de CV (Mexico) ADR | 26,277,398 | ||
| 424,306 | Monster Beverage Corp.* | 22,916,767 | ||
| 213,062 | Philip Morris International, Inc. | 20,720,279 | ||
| 69,914,444 | ||||
| Energy — 2.6% | ||||
| 251,542 | Exxon Mobil Corp. | 27,584,096 | ||
| Real Estate — 2.2% | ||||
| 460,165 | Americold Realty Trust, Inc. REIT | 13,091,694 | ||
| 70,700 | Jones Lang LaSalle, Inc.* | 10,286,143 | ||
| 23,377,837 | ||||
| Materials — 1.5% | ||||
| 227,014 | DuPont de Nemours, Inc. | 16,292,795 | ||
| Total Common Stocks | $996,023,141 | |||
| Short-Term Investment Fund — 6.0% | ||||
| 63,261,726 | Dreyfus Government Cash Management, Institutional Shares, 4.71%∞Ω | 63,261,726 | ||
| Total Investment Securities—100.0% (Cost $645,304,725) | $1,059,284,867 | |||
| Liabilities in Excess of Other Assets — (0.0%) | (507,908) | |||
| Net Assets — 100.0% | $1,058,776,959 | |||
| * | Non-income producing security. |
| ∞ | Open-End Fund. |
| Ω | Represents the 7-Day SEC yield as of March 31, 2023. |
| Portfolio Abbreviations: |
| ADR – American Depositary Receipt |
| PLC – Public Limited Company |
| REIT – Real Estate Investment Trust |
| Valuation Inputs at Reporting Date: | ||||
| Description | Level 1 | Level 2 | Level 3 | Total |
| Common Stocks | $996,023,141 | $— | $— | $996,023,141 |
| Short-Term Investment Fund | 63,261,726 | — | — | 63,261,726 |
| Total | $1,059,284,867 | $— | $— | $1,059,284,867 |
| Shares | Market Value | |||
| Common Stocks — 96.7% | ||||
| Information Technology — 37.0% | ||||
| 71,394 | Apple, Inc. | $ 11,772,871 | ||
| 11,131 | Atlassian Corp. - Class A* | 1,905,293 | ||
| 23,984 | Ceridian HCM Holding, Inc.* | 1,756,108 | ||
| 30,255 | Fortinet, Inc.* | 2,010,747 | ||
| 3,372 | HubSpot, Inc.* | 1,445,745 | ||
| 41,244 | Marvell Technology, Inc. | 1,785,865 | ||
| 29,252 | Microsoft Corp. | 8,433,352 | ||
| 17,981 | NetApp, Inc. | 1,148,087 | ||
| 11,239 | NVIDIA Corp. | 3,121,857 | ||
| 20,502 | Okta, Inc.* | 1,768,092 | ||
| 17,397 | QUALCOMM, Inc. | 2,219,509 | ||
| 13,797 | Salesforce, Inc.* | 2,756,365 | ||
| 6,164 | ServiceNow, Inc.* | 2,864,534 | ||
| 13,260 | Splunk, Inc.* | 1,271,369 | ||
| 11,614 | Workday, Inc. - Class A* | 2,398,756 | ||
| 46,658,550 | ||||
| Health Care — 15.1% | ||||
| 86,996 | Alkermes PLC* | 2,452,417 | ||
| 26,358 | Ascendis Pharma A/S (Denmark) ADR* | 2,826,105 | ||
| 4,182 | Bio-Rad Laboratories, Inc. - Class A* | 2,003,262 | ||
| 8,962 | Eli Lilly & Co. | 3,077,730 | ||
| 10,716 | ICON PLC* | 2,288,831 | ||
| 2,909 | Thermo Fisher Scientific, Inc. | 1,676,660 | ||
| 9,924 | UnitedHealth Group, Inc. | 4,689,983 | ||
| 19,014,988 | ||||
| Consumer Discretionary — 13.4% | ||||
| 53,169 | Amazon.com, Inc.* | 5,491,826 | ||
| 1,435 | Chipotle Mexican Grill, Inc.* | 2,451,396 | ||
| 9,784 | Home Depot, Inc. (The) | 2,887,454 | ||
| 4,793 | Lululemon Athletica, Inc.* | 1,745,563 | ||
| 43,068 | MGM Resorts International | 1,913,081 | ||
| 11,853 | Tesla, Inc.* | 2,459,023 | ||
| 16,948,343 | ||||
| Communication Services — 8.1% | ||||
| 87,173 | Alphabet, Inc. - Class A* | 9,042,455 | ||
| 5,890 | Meta Platforms, Inc. - Class A* | 1,248,327 | ||
| 10,290,782 | ||||
| Industrials — 7.5% | ||||
| 14,852 | AMETEK, Inc. | 2,158,441 | ||
| 23,220 | ITT, Inc. | 2,003,886 | ||
| 4,428 | TransDigm Group, Inc. | 3,263,658 | ||
| 10,162 | Union Pacific Corp. | 2,045,204 | ||
| 9,471,189 | ||||
| Financials — 6.6% | ||||
| 11,305 | Arthur J Gallagher & Co. | 2,162,760 | ||
| 20,033 | Global Payments, Inc. | 2,108,273 | ||
| 17,988 | Visa, Inc. - Class A | 4,055,574 | ||
| 8,326,607 | ||||
| Shares | Market Value | |||
| Consumer Staples — 4.3% | ||||
| 6,412 | Costco Wholesale Corp. | $ 3,185,931 | ||
| 12,269 | Diageo PLC (United Kingdom) ADR† | 2,222,897 | ||
| 5,408,828 | ||||
| Materials — 2.5% | ||||
| 11,615 | Celanese Corp. | 1,264,757 | ||
| 11,336 | Vulcan Materials Co. | 1,944,804 | ||
| 3,209,561 | ||||
| Energy — 1.3% | ||||
| 31,869 | Devon Energy Corp. | 1,612,890 | ||
| Real Estate — 0.9% | ||||
| 28,593 | Spirit Realty Capital, Inc. REIT | 1,139,145 | ||
| Total Common Stocks | $122,080,883 | |||
| Short-Term Investment Funds — 4.8% | ||||
| 4,280,178 | Dreyfus Government Cash Management, Institutional Shares, 4.71%∞Ω | 4,280,178 | ||
| 1,750,375 | Invesco Government & Agency Portfolio, Institutional Class, 4.73%∞Ω** | 1,750,375 | ||
| Total Short-Term Investment Funds | $6,030,553 | |||
| Total Investment Securities—101.5% (Cost $88,583,661) | $128,111,436 | |||
| Liabilities in Excess of Other Assets — (1.5%) | (1,877,751) | |||
| Net Assets — 100.0% | $126,233,685 | |||
| * | Non-income producing security. |
| ** | Represents collateral for securities loaned. |
| † | All or a portion of the security is on loan. The total market value of the securities on loan as of March 31, 2023 was $1,721,210. |
| ∞ | Open-End Fund. |
| Ω | Represents the 7-Day SEC yield as of March 31, 2023. |
| Portfolio Abbreviations: |
| ADR – American Depositary Receipt |
| PLC – Public Limited Company |
| REIT – Real Estate Investment Trust |
| Valuation Inputs at Reporting Date: | ||||
| Description | Level 1 | Level 2 | Level 3 | Total |
| Common Stocks | $122,080,883 | $— | $— | $122,080,883 |
| Short-Term Investment Funds | 6,030,553 | — | — | 6,030,553 |
| Total | $128,111,436 | $— | $— | $128,111,436 |
| Shares | Market Value | |||
| Common Stocks — 97.5% | ||||
| Information Technology — 26.1% | ||||
| 106,168 | Cadence Design Systems, Inc.* | $ 22,304,835 | ||
| 98,190 | CDW Corp. | 19,136,249 | ||
| 283,961 | Ceridian HCM Holding, Inc.* | 20,791,624 | ||
| 64,542 | EPAM Systems, Inc.* | 19,298,058 | ||
| 449,260 | Fortinet, Inc.* | 29,857,820 | ||
| 44,937 | HubSpot, Inc.* | 19,266,739 | ||
| 393,960 | Marvell Technology, Inc. | 17,058,468 | ||
| 259,539 | Microchip Technology, Inc. | 21,744,177 | ||
| 58,798 | MongoDB, Inc.* | 13,706,990 | ||
| 259,702 | NetApp, Inc. | 16,581,973 | ||
| 81,407 | Nice Ltd. (Israel) ADR* | 18,633,248 | ||
| 172,263 | Palo Alto Networks, Inc.* | 34,407,812 | ||
| 189,753 | Splunk, Inc.* | 18,193,518 | ||
| 39,265 | Teledyne Technologies, Inc.* | 17,565,590 | ||
| 288,547,101 | ||||
| Industrials — 20.0% | ||||
| 156,085 | AMETEK, Inc. | 22,683,833 | ||
| 294,218 | Copart, Inc. * | 22,128,136 | ||
| 260,039 | CoStar Group, Inc.* | 17,903,685 | ||
| 390,328 | Genpact Ltd. | 18,040,960 | ||
| 116,062 | JB Hunt Transport Services, Inc. | 20,364,238 | ||
| 102,724 | Rockwell Automation, Inc. | 30,144,358 | ||
| 42,711 | TransDigm Group, Inc. | 31,480,143 | ||
| 125,959 | Waste Connections, Inc. | 17,517,118 | ||
| 51,199 | Watsco, Inc. | 16,289,474 | ||
| 160,505 | WESCO International, Inc. | 24,804,443 | ||
| 221,356,388 | ||||
| Health Care — 18.8% | ||||
| 257,515 | Ascendis Pharma A/S (Denmark) ADR* | 27,610,758 | ||
| 835,209 | Avantor, Inc.* | 17,656,318 | ||
| 57,533 | Cooper Cos., Inc. (The) | 21,480,521 | ||
| 282,835 | DexCom, Inc.* | 32,859,770 | ||
| 153,522 | ICON PLC* | 32,790,764 | ||
| 42,092 | IDEXX Laboratories, Inc.* | 21,049,368 | ||
| 66,468 | Insulet Corp.* | 21,200,633 | ||
| 101,394 | Quest Diagnostics, Inc. | 14,345,223 | ||
| 131,754 | Sarepta Therapeutics, Inc.* | 18,159,654 | ||
| 207,153,009 | ||||
| Consumer Discretionary — 14.9% | ||||
| 160,887 | Aptiv PLC* | 18,049,912 | ||
| 20,165 | Chipotle Mexican Grill, Inc.* | 34,447,668 | ||
| 124,805 | Etsy, Inc.* | 13,894,541 | ||
| 203,197 | Hilton Worldwide Holdings, Inc. | 28,624,361 | ||
| 94,551 | Lululemon Athletica, Inc.* | 34,434,529 | ||
| 484,845 | Tapestry, Inc. | 20,901,668 | ||
| 62,776 | Vail Resorts, Inc. | 14,669,496 | ||
| 165,022,175 | ||||
| Financials — 7.6% | ||||
| 111,048 | Arthur J Gallagher & Co. | 21,244,593 | ||
| 173,873 | Global Payments, Inc. | 18,298,395 | ||
| Shares | Market Value | |||
| Financials — (Continued) | ||||
| 88,671 | LPL Financial Holdings, Inc. | $ 17,947,010 | ||
| 47,644 | MSCI, Inc. | 26,665,870 | ||
| 84,155,868 | ||||
| Materials — 3.2% | ||||
| 156,588 | Celanese Corp. | 17,050,867 | ||
| 105,446 | Vulcan Materials Co. | 18,090,316 | ||
| 35,141,183 | ||||
| Energy — 3.0% | ||||
| 498,047 | Devon Energy Corp. | 25,206,158 | ||
| 255,767 | Halliburton Co. | 8,092,468 | ||
| 33,298,626 | ||||
| Consumer Staples — 1.7% | ||||
| 84,194 | Constellation Brands, Inc. - Class A | 19,018,583 | ||
| Communication Services — 1.2% | ||||
| 188,609 | Live Nation Entertainment, Inc.* | 13,202,630 | ||
| Real Estate — 1.0% | ||||
| 51,097 | Essex Property Trust, Inc. REIT | 10,686,426 | ||
| Total Common Stocks | $1,077,581,989 | |||
| Short-Term Investment Fund — 3.7% | ||||
| 41,218,646 | Dreyfus Government Cash Management, Institutional Shares, 4.71%∞Ω | 41,218,646 | ||
| Total Investment Securities—101.2% (Cost $921,323,103) | $1,118,800,635 | |||
| Liabilities in Excess of Other Assets — (1.2%) | (13,023,432) | |||
| Net Assets — 100.0% | $1,105,777,203 | |||
| * | Non-income producing security. |
| ∞ | Open-End Fund. |
| Ω | Represents the 7-Day SEC yield as of March 31, 2023. |
| Portfolio Abbreviations: |
| ADR – American Depositary Receipt |
| PLC – Public Limited Company |
| REIT – Real Estate Investment Trust |
| Valuation Inputs at Reporting Date: | ||||
| Description | Level 1 | Level 2 | Level 3 | Total |
| Common Stocks | $1,077,581,989 | $— | $— | $1,077,581,989 |
| Short-Term Investment Fund | 41,218,646 | — | — | 41,218,646 |
| Total | $1,118,800,635 | $— | $— | $1,118,800,635 |
| Shares | Market Value | |||
| Common Stocks — 96.2% | ||||
| France — 18.6% | ||||
| Energy — 6.2% | ||||
| 549,660 | TotalEnergies SE ADR | $ 32,457,423 | ||
| Financials — 2.1% | ||||
| 189,548 | BNP Paribas SA | 11,319,349 | ||
| Industrials — 6.7% | ||||
| 292,590 | Cie de Saint-Gobain | 16,631,871 | ||
| 112,964 | Schneider Electric SE | 18,878,987 | ||
| Materials — 3.6% | ||||
| 113,162 | Air Liquide SA | 18,942,044 | ||
| Total France | 98,229,674 | |||
| Japan — 15.0% | ||||
| Communication Services — 2.0% | ||||
| 270,000 | Nintendo Co. Ltd. | 10,487,232 | ||
| Consumer Discretionary — 6.1% | ||||
| 182,300 | Denso Corp. | 10,290,370 | ||
| 242,300 | Sony Group Corp. | 22,069,503 | ||
| Industrials — 4.3% | ||||
| 323,600 | Hitachi Ltd. | 17,785,279 | ||
| 326,500 | Kubota Corp. | 4,950,175 | ||
| Information Technology — 2.6% | ||||
| 113,100 | Tokyo Electron Ltd. | 13,816,985 | ||
| Total Japan | 79,399,544 | |||
| United Kingdom — 13.9% | ||||
| Financials — 6.6% | ||||
| 33,647,158 | Lloyds Banking Group PLC | 19,782,798 | ||
| 153,082 | London Stock Exchange Group PLC | 14,868,816 | ||
| Industrials — 7.3% | ||||
| 172,930 | Ashtead Group PLC | 10,618,755 | ||
| 489,813 | RELX PLC | 15,863,540 | ||
| 1,693,200 | Rentokil Initial PLC | 12,374,832 | ||
| Total United Kingdom | 73,508,741 | |||
| Sweden — 7.3% | ||||
| Financials — 5.3% | ||||
| 1,360,587 | Svenska Handelsbanken AB - Class A† | 11,783,859 | ||
| 989,787 | Swedbank AB - Class A† | 16,276,674 | ||
| Industrials — 2.0% | ||||
| 517,128 | Epiroc AB - Class A | 10,265,003 | ||
| Total Sweden | 38,325,536 | |||
| Germany — 6.3% | ||||
| Communication Services — 2.9% | ||||
| 634,066 | Deutsche Telekom AG | 15,364,876 | ||
| Industrials — 3.4% | ||||
| 385,567 | Deutsche Post AG | 18,058,280 | ||
| Total Germany | 33,423,156 | |||
| Switzerland — 4.7% | ||||
| Health Care — 2.1% | ||||
| 38,174 | Roche Holding AG | 10,907,938 | ||
| Industrials — 2.6% | ||||
| 403,414 | ABB Ltd. ADR | 13,837,100 | ||
| Total Switzerland | 24,745,038 | |||
| Singapore — 3.8% | ||||
| Financials — 2.9% | ||||
| 1,633,500 | Oversea-Chinese Banking Corp. Ltd. | 15,227,140 | ||
| Shares | Market Value | |||
| Singapore — (Continued) | ||||
| Real Estate — 0.9% | ||||
| 3,405,700 | CapitaLand Integrated Commercial Trust REIT | $ 5,079,366 | ||
| Total Singapore | 20,306,506 | |||
| India — 3.7% | ||||
| Financials — 3.7% | ||||
| 906,007 | ICICI Bank Ltd. ADR | 19,551,631 | ||
| South Korea — 3.7% | ||||
| Communication Services — 2.9% | ||||
| 431,999 | KT Corp. ADR*† | 4,898,869 | ||
| 452,638 | KT Corp. | 10,233,993 | ||
| Information Technology — 0.8% | ||||
| 7,463 | Samsung SDI Co. Ltd. | 4,239,274 | ||
| Total South Korea | 19,372,136 | |||
| Taiwan — 3.7% | ||||
| Information Technology — 3.7% | ||||
| 208,029 | Taiwan Semiconductor Manufacturing Co. Ltd. ADR | 19,350,858 | ||
| United States — 3.2% | ||||
| Financials — 0.5% | ||||
| 10,586 | Visa, Inc. - Class A | 2,386,720 | ||
| Information Technology — 2.7% | ||||
| 22,489 | Apple, Inc. | 3,708,436 | ||
| 24,361 | Applied Materials, Inc. | 2,992,262 | ||
| 26,718 | Microsoft Corp. | 7,702,799 | ||
| Total United States | 16,790,217 | |||
| Spain — 2.6% | ||||
| Consumer Discretionary — 2.6% | ||||
| 204,386 | Amadeus IT Group SA* | 13,710,940 | ||
| Hong Kong — 2.0% | ||||
| Financials — 2.0% | ||||
| 1,001,800 | AIA Group Ltd. | 10,506,235 | ||
| Canada — 1.9% | ||||
| Financials — 0.9% | ||||
| 32,334 | Intact Financial Corp. | 4,627,482 | ||
| Industrials — 1.0% | ||||
| 129,951 | ATS Corp.* | 5,441,308 | ||
| Total Canada | 10,068,790 | |||
| Ireland — 1.7% | ||||
| Industrials — 1.7% | ||||
| 163,748 | AerCap Holdings N.V.* | 9,207,550 | ||
| Netherlands — 1.7% | ||||
| Health Care — 1.7% | ||||
| 477,977 | Koninklijke Philips NV | 8,778,954 | ||
| Denmark — 1.5% | ||||
| Industrials — 1.5% | ||||
| 262,919 | Vestas Wind Systems A/S | 7,662,621 | ||
| Thailand — 0.9% | ||||
| Industrials — 0.9% | ||||
| 2,342,300 | Airports of Thailand PCL* | 4,867,568 | ||
| Total Common Stocks | $507,805,695 | |||
| Shares | Market Value | |||
| Preferred Stocks — 2.2% | ||||
| Germany — 2.2% | ||||
| Consumer Discretionary — 2.2% | ||||
| 86,451 | Volkswagen AG, 5.796%(A) | $ 11,798,171 | ||
| Short-Term Investment Funds — 6.7% | ||||
| 6,224,544 | Dreyfus Government Cash Management, Institutional Shares, 4.71%∞Ω | 6,224,544 | ||
| 29,054,036 | Invesco Government & Agency Portfolio, Institutional Class, 4.73%∞Ω** | 29,054,036 | ||
| Total Short-Term Investment Funds | $35,278,580 | |||
| Total Investment Securities — 105.1% (Cost $483,693,013) | $554,882,446 | |||
| Liabilities in Excess of Other Assets — (5.1)% | (27,084,973) | |||
| Net Assets — 100.0% | $527,797,473 | |||
| (A) | Perpetual Bond - A bond or preferred stock with no definite maturity date. |
| * | Non-income producing security. |
| ** | Represents collateral for securities loaned. |
| † | All or a portion of the security is on loan. The total market value of the securities on loan as of March 31, 2023 was $26,774,292. |
| ∞ | Open-End Fund. |
| Ω | Represents the 7-Day SEC yield as of March 31, 2023. |
| Portfolio Abbreviations: |
| ADR – American Depositary Receipt |
| PCL – Public Company Limited |
| PLC – Public Limited Company |
| REIT – Real Estate Investment Trust |
| Valuation inputs at Reporting Date: | ||||
| Description | Level 1 | Level 2 | Level 3 | Total |
| Common Stocks | ||||
| France | $32,457,423 | $65,772,251 | $— | $98,229,674 |
| Japan | — | 79,399,544 | — | 79,399,544 |
| United Kingdom | — | 73,508,741 | — | 73,508,741 |
| Sweden | — | 38,325,536 | — | 38,325,536 |
| Germany | — | 33,423,156 | — | 33,423,156 |
| Switzerland | 13,837,100 | 10,907,938 | — | 24,745,038 |
| Singapore | — | 20,306,506 | — | 20,306,506 |
| India | 19,551,631 | — | — | 19,551,631 |
| South Korea | 4,898,869 | 14,473,267 | — | 19,372,136 |
| Taiwan | 19,350,858 | — | — | 19,350,858 |
| United States | 16,790,217 | — | — | 16,790,217 |
| Spain | — | 13,710,940 | — | 13,710,940 |
| Hong Kong | — | 10,506,235 | — | 10,506,235 |
| Canada | 10,068,790 | — | — | 10,068,790 |
| Ireland | 9,207,550 | — | — | 9,207,550 |
| Netherlands | — | 8,778,954 | — | 8,778,954 |
| Denmark | — | 7,662,621 | — | 7,662,621 |
| Thailand | — | 4,867,568 | — | 4,867,568 |
| Preferred Stocks | — | 11,798,171 | — | 11,798,171 |
| Short-Term Investment Funds | 35,278,580 | — | — | 35,278,580 |
| Total | $161,441,018 | $393,441,428 | $— | $554,882,446 |
| Shares | Market Value | |||
| Common Stocks — 96.6% | ||||
| India — 29.1% | ||||
| Consumer Discretionary — 4.6% | ||||
| 7,270,097 | Jubilant Foodworks Ltd. | $ 39,048,649 | ||
| 2,140,409 | Titan Co. Ltd. | 65,741,027 | ||
| Consumer Staples — 3.7% | ||||
| 1,582,746 | Britannia Industries Ltd. | 83,427,121 | ||
| Energy — 2.6% | ||||
| 2,030,474 | Reliance Industries Ltd. | 57,735,695 | ||
| Financials — 11.7% | ||||
| 1,455,707 | Bajaj Finance Ltd. | 99,882,872 | ||
| 8,528,327 | Bandhan Bank Ltd., 144a* | 20,389,159 | ||
| 5,120,125 | HDFC Bank Ltd. | 100,706,935 | ||
| 8,327,587 | ICICI Prudential Life Insurance Co. Ltd., 144a | 44,251,944 | ||
| Health Care — 3.8% | ||||
| 1,635,069 | Apollo Hospitals Enterprise Ltd. | 85,989,420 | ||
| Information Technology — 0.8% | ||||
| 491,837 | Tata Consultancy Services Ltd. | 19,278,952 | ||
| Materials — 1.9% | ||||
| 1,250,128 | Asian Paints Ltd. | 42,118,912 | ||
| Total India | 658,570,686 | |||
| China — 20.9% | ||||
| Communication Services — 5.8% | ||||
| 1,516,470 | Kanzhun Ltd. ADR* | 28,858,424 | ||
| 2,076,642 | Tencent Holdings Ltd. | 101,484,090 | ||
| Consumer Discretionary — 7.8% | ||||
| 3,547,174 | Alibaba Group Holding Ltd.* | 44,926,718 | ||
| 6,592,723 | ANTA Sports Products Ltd. | 95,720,520 | ||
| 12,968,000 | Haidilao International Holding Ltd., 144a* | 35,145,740 | ||
| Consumer Staples — 3.5% | ||||
| 6,117,306 | Foshan Haitian Flavouring & Food Co. Ltd. - Class A | 68,127,709 | ||
| 1,675,269 | JD Health International, Inc., 144a* | 12,422,062 | ||
| Health Care — 3.1% | ||||
| 4,368,942 | Hangzhou Tigermed Consulting Co. Ltd. Class H, 144a | 41,162,905 | ||
| 4,593,510 | Wuxi Biologics Cayman, Inc., 144a* | 28,305,033 | ||
| Industrials — 0.7% | ||||
| 265,719 | Contemporary Amperex Technology Co. Ltd. - Class A | 15,728,323 | ||
| Total China | 471,881,524 | |||
| Brazil — 16.6% | ||||
| Consumer Discretionary — 8.3% | ||||
| 142,116 | MercadoLibre, Inc.* | 187,317,415 | ||
| Consumer Staples — 1.9% | ||||
| 9,195,900 | Raia Drogasil SA | 44,251,793 | ||
| Financials — 3.7% | ||||
| 9,957,142 | NU Holdings Ltd. - Class A* | 47,395,996 | ||
| 2,999,407 | XP, Inc. - Class A*† | 35,602,961 | ||
| Industrials — 2.7% | ||||
| 4,195,715 | Localiza Rent a Car SA | 44,080,897 | ||
| 2,250,500 | WEG SA | 17,982,865 | ||
| Total Brazil | 376,631,927 | |||
| Taiwan — 5.7% | ||||
| Information Technology — 5.7% | ||||
| 1,392,470 | Taiwan Semiconductor Manufacturing Co. Ltd. ADR | 129,527,559 | ||
| Shares | Market Value | |||
| Singapore — 5.6% | ||||
| Communication Services — 5.6% | ||||
| 1,471,686 | Sea Ltd. ADR* | $ 127,374,423 | ||
| Hong Kong — 4.0% | ||||
| Financials — 4.0% | ||||
| 8,582,731 | AIA Group Ltd. | 90,010,175 | ||
| South Korea — 3.5% | ||||
| Communication Services — 0.7% | ||||
| 94,294 | NAVER Corp. | 14,775,023 | ||
| Consumer Discretionary — 1.5% | ||||
| 2,081,784 | Coupang, Inc.* | 33,308,544 | ||
| Information Technology — 1.3% | ||||
| 52,886 | Samsung SDI Co. Ltd. | 30,041,305 | ||
| Total South Korea | 78,124,872 | |||
| Indonesia — 3.2% | ||||
| Financials — 3.2% | ||||
| 123,053,800 | Bank Central Asia Tbk PT | 71,991,900 | ||
| United States — 2.4% | ||||
| Information Technology — 2.4% | ||||
| 103,296 | Lam Research Corp. | 54,759,276 | ||
| Argentina — 2.3% | ||||
| Information Technology — 2.3% | ||||
| 317,202 | Globant SA* | 52,024,300 | ||
| Kazakhstan — 1.7% | ||||
| Financials — 1.7% | ||||
| 508,716 | Kaspi.KZ JSC GDR | 38,408,058 | ||
| Thailand — 1.6% | ||||
| Consumer Staples — 1.6% | ||||
| 20,231,600 | CP ALL PCL | 36,735,609 | ||
| Total Common Stocks | $2,186,040,309 | |||
| Number of Rights | ||||
| Rights — 0.0% | ||||
| Brazil — 0.0% | ||||
| Industrials — 0.0% | ||||
| 18,670 | Localiza Rent a Car SA* | 48,365 | ||
| Total Rights | $48,365 | |||
| Shares | ||||
| Short-Term Investment Funds — 4.0% | ||||
| 87,485,841 | Dreyfus Government Cash Management, Institutional Shares, 4.71%∞Ω | 87,485,841 | ||
| 1,792,110 | Invesco Government & Agency Portfolio, Institutional Class, 4.73%∞Ω** | 1,792,110 | ||
| Total Short-Term Investment Funds | $89,277,951 | |||
| Total Investment Securities — 100.6% (Cost $1,950,325,629) | $2,275,366,625 | |||
| Liabilities in Excess of Other Assets — (0.6)% | (13,211,352) | |||
| Net Assets — 100.0% | $2,262,155,273 | |||
| * | Non-income producing security. |
| ** | Represents collateral for securities loaned. |
| † | All or a portion of the security is on loan. The total market value of the securities on loan as of March 31, 2023 was $1,729,459. |
| ∞ | Open-End Fund. |
| Ω | Represents the 7-Day SEC yield as of March 31, 2023. |
| Portfolio Abbreviations: |
| ADR – American Depositary Receipt |
| GDR – Global Depositary Receipt |
| JSC – Joint Stock Company |
| PCL – Public Company Limited |
| 144a - This is a restricted security that was sold in a transaction qualifying for the exemption under Rule 144a of the Securities Act of 1933. This security may be sold in transactions exempt from registration, normally to qualified institutional buyers. At March 31, 2023, these securities were valued at $181,676,843 or 8.0% of net assets. These securities were deemed liquid pursuant to procedures approved by the Board of Trustees. |
| Valuation inputs at Reporting Date: | ||||
| Description | Level 1 | Level 2 | Level 3 | Total |
| Common Stocks | ||||
| India | $— | $658,570,686 | $— | $658,570,686 |
| China | 28,858,424 | 443,023,100 | — | 471,881,524 |
| Brazil | 376,631,927 | — | — | 376,631,927 |
| Taiwan | 129,527,559 | — | — | 129,527,559 |
| Singapore | 127,374,423 | — | — | 127,374,423 |
| Hong Kong | — | 90,010,175 | — | 90,010,175 |
| South Korea | 33,308,544 | 44,816,328 | — | 78,124,872 |
| Indonesia | — | 71,991,900 | — | 71,991,900 |
| United States | 54,759,276 | — | — | 54,759,276 |
| Argentina | 52,024,300 | — | — | 52,024,300 |
| Kazakhstan | 38,408,058 | — | — | 38,408,058 |
| Thailand | — | 36,735,609 | — | 36,735,609 |
| Rights | 48,365 | — | — | 48,365 |
| Short-Term Investment Funds | 89,277,951 | — | — | 89,277,951 |
| Total | $930,218,827 | $1,345,147,798 | $— | $2,275,366,625 |
| Principal Amount | Market Value | |||
| Corporate Bonds — 49.6% | ||||
| Financials — 10.8% | ||||
| $ 1,847,000 | Allstate Corp. (The), Ser B, 5.750%, 8/15/53 | $ 1,798,568 | ||
| 1,657,000 | Bank of Nova Scotia (The) (Canada), 3.625%, 10/27/81 | 1,213,649 | ||
| 1,971,000 | Barclays PLC (United Kingdom), 2.894%, 11/24/32 | 1,579,331 | ||
| 818,000 | Charles Schwab Corp. (The), Ser H, 4.000%(A) | 639,079 | ||
| 1,421,000 | Citigroup, Inc., Ser W, 4.000%(A) | 1,242,423 | ||
| 1,656,000 | Corestates Capital III, 144a, (3M LIBOR +0.570%), 5.434%, 2/15/27(B) | 1,548,855 | ||
| 860,000 | Credit Acceptance Corp., 6.625%, 3/15/26 | 802,265 | ||
| 1,199,000 | First Maryland Capital II, (3M LIBOR +0.850%), 5.664%, 2/1/27(B) | 1,098,310 | ||
| 343,000 | FirstCash, Inc., 144a, 4.625%, 9/1/28 | 304,511 | ||
| 995,000 | goeasy Ltd. (Canada), 144a, 5.375%, 12/1/24 | 937,489 | ||
| 1,930,000 | Golub Capital BDC, Inc., 2.050%, 2/15/27 | 1,580,254 | ||
| 1,014,000 | Icahn Enterprises LP / Icahn Enterprises Finance Corp., 5.250%, 5/15/27 | 951,446 | ||
| 1,420,000 | Morgan Stanley, 5.297%, 4/20/37 | 1,337,241 | ||
| 1,882,000 | PNC Capital Trust, (3M LIBOR +0.570%), 5.532%, 6/1/28(B) | 1,694,486 | ||
| 1,363,000 | Prudential Financial, Inc., 5.125%, 3/1/52 | 1,200,927 | ||
| 890,000 | Sabra Health Care LP REIT, 3.900%, 10/15/29 | 735,171 | ||
| 1,824,000 | Sixth Street Specialty Lending, Inc., 2.500%, 8/1/26 | 1,602,351 | ||
| 802,000 | Springleaf Finance Corp., 6.875%, 3/15/25 | 773,062 | ||
| 1,678,000 | STORE Capital Corp. REIT, 2.750%, 11/18/30 | 1,235,632 | ||
| 1,824,000 | Truist Bank, Ser A, (3M LIBOR +0.670%), 5.530%, 5/15/27(B) | 1,658,868 | ||
| 23,933,918 | ||||
| Consumer Discretionary — 7.4% | ||||
| 1,895,000 | Brunswick Corp., 4.400%, 9/15/32 | 1,647,960 | ||
| 938,000 | Carriage Services, Inc., 144a, 4.250%, 5/15/29 | 772,579 | ||
| 1,636,000 | Ferguson Finance PLC, 144a, 4.650%, 4/20/32 | 1,552,984 | ||
| 315,000 | Ford Motor Co., 4.750%, 1/15/43 | 241,552 | ||
| 460,000 | Ford Motor Credit Co. LLC, 4.125%, 8/17/27 | 421,130 | ||
| 730,000 | GEMS MENASA Cayman Ltd. / GEMS Education Delaware LLC (United Arab Emirates), 7.125%, 7/31/26 | 710,829 | ||
| 2,794,000 | General Motors Financial Co., Inc., 3.100%, 1/12/32 | 2,274,812 | ||
| 1,665,000 | GENM Capital Labuan Ltd. (Malaysia), 144a, 3.882%, 4/19/31 | 1,292,858 | ||
| 1,781,000 | Imperial Brands Finance PLC (United Kingdom), 144a, 3.500%, 7/26/26 | 1,666,797 | ||
| 983,000 | Royal Caribbean Cruises Ltd., 144a, 5.375%, 7/15/27 | 880,596 | ||
| 1,000,000 | Speedway Motorsports LLC / Speedway Funding II, Inc., 144a, 4.875%, 11/1/27 | 916,998 | ||
| 1,629,000 | Toll Brothers Finance Corp., 3.800%, 11/1/29 | 1,461,332 | ||
| 355,000 | Warnermedia Holdings, Inc., 144a, 4.279%, 3/15/32 | 316,422 | ||
| 1,636,000 | Warnermedia Holdings, Inc., 144a, 5.141%, 3/15/52 | 1,320,910 | ||
| 1,076,000 | Wynn Macau Ltd. (Macao), 144a, 4.875%, 10/1/24 | 1,043,720 | ||
| 16,521,479 | ||||
| Energy — 6.4% | ||||
| 911,000 | Callon Petroleum Co., 6.375%, 7/1/26 | 865,450 | ||
| 1,222,000 | Cenovus Energy, Inc. (Canada), 5.250%, 6/15/37 | 1,153,237 | ||
| 1,010,000 | CQP Holdco LP / BIP-V Chinook Holdco LLC, 144a, 5.500%, 6/15/31 | 907,838 | ||
| 1,200,000 | DCP Midstream Operating LP, 144a, 5.850%, 5/21/43 | 1,172,135 | ||
| 171,000 | Genesis Energy LP / Genesis Energy Finance Corp., 6.500%, 10/1/25 | 165,656 | ||
| 201,000 | Genesis Energy LP / Genesis Energy Finance Corp., 8.000%, 1/15/27 | 198,297 | ||
| 149,000 | Hilcorp Energy I LP / Hilcorp Finance Co., 144a, 5.750%, 2/1/29 | 137,157 | ||
| Principal Amount | Market Value | |||
| Energy — (Continued) | ||||
| $ 903,000 | Hilcorp Energy I LP / Hilcorp Finance Co., 144a, 6.000%, 2/1/31 | $ 831,393 | ||
| 1,086,067 | MC Brazil Downstream Trading SARL (Brazil), 144a, 7.250%, 6/30/31 | 850,510 | ||
| 405,000 | Mesquite Energy, Inc., 7.250%, 2/15/24 | 2,531 | ||
| 853,000 | Midwest Connector Capital Co. LLC, 144a, 4.625%, 4/1/29 | 798,688 | ||
| 1,310,000 | Murphy Oil Corp., 6.375%, 7/15/28 | 1,289,836 | ||
| 1,605,000 | NGPL PipeCo LLC, 144a, 7.768%, 12/15/37 | 1,767,038 | ||
| 784,000 | Parkland Corp. (Canada), 144a, 4.500%, 10/1/29 | 696,615 | ||
| 350,000 | Petroleos Mexicanos (Mexico), 6.375%, 1/23/45 | 220,986 | ||
| 750,000 | Petroleos Mexicanos (Mexico), 6.625%, 6/15/35 | 547,056 | ||
| 1,219,000 | Plains All American Pipeline LP, (3M LIBOR +4.110%), 8.974%(A)(B) | 1,079,034 | ||
| 1,110,000 | Precision Drilling Corp. (Canada), 144a, 6.875%, 1/15/29 | 1,007,325 | ||
| 540,000 | YPF SA (Argentina), 9.000%, 2/12/26 | 523,638 | ||
| 14,214,420 | ||||
| Industrials — 6.2% | ||||
| 345,000 | Adani Ports & Special Economic Zone Ltd. (India), 3.375%, 7/24/24 | 319,298 | ||
| 1,051,000 | American Axle & Manufacturing, Inc., 6.500%, 4/1/27 | 966,920 | ||
| 1,056,000 | Amsted Industries, Inc., 144a, 4.625%, 5/15/30 | 948,790 | ||
| 773,000 | Boeing Co. (The), 5.805%, 5/1/50 | 775,283 | ||
| 948,000 | Canpack SA / Canpack US LLC (Poland), 144a, 3.125%, 11/1/25 | 861,523 | ||
| 1,190,000 | Cemex SAB de CV (Mexico), 144a, 5.125%(A) | 1,065,586 | ||
| 1,236,000 | Cimpress PLC (Ireland), 7.000%, 6/15/26 | 1,009,911 | ||
| 910,000 | Fortress Transportation & Infrastructure Investors LLC, 144a, 6.500%, 10/1/25 | 910,605 | ||
| 2,046,000 | Mohawk Industries, Inc., 3.625%, 5/15/30 | 1,853,504 | ||
| 1,269,000 | Pactiv Evergreen Group Issuer, Inc. / Pactiv Evergreen Group Issuer LLC, 144a, 4.000%, 10/15/27 | 1,139,562 | ||
| 869,000 | Stericycle, Inc., 144a, 3.875%, 1/15/29 | 758,622 | ||
| 812,000 | TK Elevator Holdco GmbH (Germany), 144a, 7.625%, 7/15/28 | 713,679 | ||
| 813,000 | TransDigm, Inc., 144a, 6.250%, 3/15/26 | 814,939 | ||
| 1,716,000 | Weir Group PLC (The) (United Kingdom), 144a, 2.200%, 5/13/26 | 1,544,650 | ||
| 13,682,872 | ||||
| Utilities — 4.8% | ||||
| 1,636,000 | CMS Energy Corp., 4.750%, 6/1/50 | 1,413,471 | ||
| 1,155,000 | Edison International, 4.125%, 3/15/28 | 1,095,797 | ||
| 1,075,000 | Edison International, Ser B, 5.000%(A) | 890,909 | ||
| 600,000 | Eskom Holdings SOC Ltd. (South Africa), 144a, 8.450%, 8/10/28 | 581,256 | ||
| 554,000 | FirstEnergy Transmission LLC, 144a, 5.450%, 7/15/44 | 529,237 | ||
| 1,750,000 | Minejesa Capital BV (Indonesia), 4.625%, 8/10/30 | 1,537,528 | ||
| 1,395,000 | NextEra Energy Capital Holdings, Inc., (3M LIBOR +2.125%), 6.991%, 6/15/67(B) | 1,190,725 | ||
| 1,155,000 | Pacific Gas & Electric Co., 2.500%, 2/1/31 | 935,112 | ||
| 1,110,000 | PPL Capital Funding, Inc., Ser A, (3M LIBOR +2.665%), 7.828%, 3/30/67(B) | 960,154 | ||
| 2,049,000 | WEC Energy Group, Inc., (3M LIBOR +2.112%), 6.976%, 5/15/67(B) | 1,646,705 | ||
| 10,780,894 | ||||
| Communication Services — 4.0% | ||||
| 945,000 | Arches Buyer, Inc., 144a, 4.250%, 6/1/28 | 789,784 | ||
| 473,000 | Belo Corp., 7.750%, 6/1/27 | 453,186 | ||
| 1,023,000 | British Telecommunications PLC (United Kingdom), 5.125%, 12/4/28 | 1,031,756 | ||
| Principal Amount | Market Value | |||
| Corporate Bonds — 49.6% (Continued) | ||||
| Communication Services — (Continued) | ||||
| $ 809,000 | British Telecommunications PLC (United Kingdom), 144a, 3.250%, 11/8/29 | $ 729,066 | ||
| 1,820,000 | CCO Holdings LLC / CCO Holdings Capital Corp., 144a, 4.250%, 2/1/31 | 1,509,781 | ||
| 1,417,000 | Charter Communications Operating LLC / Charter Communications Operating Capital, 6.484%, 10/23/45 | 1,340,682 | ||
| 1,038,000 | CSC Holdings LLC, 144a, 4.625%, 12/1/30 | 511,838 | ||
| 1,056,000 | Gray Escrow II, Inc., 144a, 5.375%, 11/15/31 | 701,184 | ||
| 1,279,000 | Paramount Global, 4.200%, 5/19/32 | 1,097,657 | ||
| 814,000 | Stagwell Global, 144a, 5.625%, 8/15/29 | 713,827 | ||
| 8,878,761 | ||||
| Consumer Staples — 2.6% | ||||
| 950,000 | Coruripe Netherlands BV (Brazil), 144a, 10.000%, 2/10/27 | 665,000 | ||
| 1,319,000 | JBS USA LUX SA / JBS USA Food Co. / JBS USA Finance, Inc., 144a, 6.500%, 12/1/52 | 1,252,579 | ||
| 1,002,000 | QVC, Inc., 4.375%, 9/1/28 | 405,810 | ||
| 1,127,000 | Turning Point Brands, Inc., 144a, 5.625%, 2/15/26 | 1,020,610 | ||
| 1,500,000 | Ulker Biskuvi Sanayi AS (Turkey), 144a, 6.950%, 10/30/25 | 1,301,370 | ||
| 1,252,000 | United Rentals North America, Inc., 3.750%, 1/15/32 | 1,078,285 | ||
| 5,723,654 | ||||
| Materials — 2.2% | ||||
| 1,236,000 | Braskem Netherlands Finance BV (Brazil), 144a, 5.875%, 1/31/50 | 927,909 | ||
| 1,502,000 | Celanese US Holdings LLC, 6.165%, 7/15/27 | 1,515,857 | ||
| 1,700,000 | Freeport Indonesia PT (Indonesia), 144a, 5.315%, 4/14/32 | 1,582,855 | ||
| 228,000 | Hudbay Minerals, Inc. (Canada), 144a, 4.500%, 4/1/26 | 212,006 | ||
| 850,000 | OCP SA (Morocco), 3.750%, 6/23/31 | 691,730 | ||
| 4,930,357 | ||||
| Health Care — 2.2% | ||||
| 1,259,000 | CVS Health Corp., 5.050%, 3/25/48 | 1,174,328 | ||
| 860,000 | Medline Borrower LP, 144a, 3.875%, 4/1/29 | 745,130 | ||
| 862,000 | MEDNAX, Inc., 144a, 5.375%, 2/15/30† | 780,110 | ||
| 1,401,000 | Mylan, Inc., 4.550%, 4/15/28 | 1,341,522 | ||
| 860,000 | US Acute Care Solutions LLC, 144a, 6.375%, 3/1/26 | 765,770 | ||
| 4,806,860 | ||||
| Real Estate — 1.5% | ||||
| 860,000 | Iron Mountain, Inc. REIT, 144a, 4.875%, 9/15/27 | 812,872 | ||
| 434,000 | Kilroy Realty LP REIT, 2.650%, 11/15/33 | 269,765 | ||
| 992,000 | RHP Hotel Properties LP / RHP Finance Corp. REIT, 144a, 4.500%, 2/15/29 | 896,054 | ||
| 1,370,000 | SBA Tower Trust REIT, 144a, 6.599%, 1/15/28 | 1,444,641 | ||
| 3,423,332 | ||||
| Information Technology — 1.5% | ||||
| 904,000 | Clarivate Science Holdings Corp., 144a, 4.875%, 7/1/29 | 817,550 | ||
| 1,326,000 | Micron Technology, Inc., 2.703%, 4/15/32 | 1,061,157 | ||
| 586,000 | Micron Technology, Inc., 6.750%, 11/1/29 | 622,571 | ||
| 806,000 | Xerox Holdings Corp., 144a, 5.000%, 8/15/25 | 758,748 | ||
| 3,260,026 | ||||
| Total Corporate Bonds | $110,156,573 | |||
| Asset-Backed Securities — 16.5% | ||||
| 2,000,000 | AB BSL CLO 3, Ltd. (Cayman Islands), Ser 2021-3A, Class D, 144a, (3M LIBOR +3.200%), 8.008%, 10/20/34(B) | 1,789,676 | ||
| 4,267,750 | AB Issuer LLC, Ser 2021-1, Class A2, 144a, 3.734%, 7/30/51 | 3,515,657 | ||
| Principal Amount | Market Value | |||
| Asset-Backed Securities — 16.5% (Continued) | ||||
| $ 3,750,000 | Birch Grove CLO 2, Ltd. (Cayman Islands), Ser 2021-2A, Class C, 144a, (3M LIBOR +2.250%), 7.048%, 10/19/34(B) | $ 3,498,746 | ||
| 3,930,000 | Hardee's Funding LLC, Ser 2021-1A, Class A2, 144a, 2.865%, 6/20/51 | 3,168,299 | ||
| 2,100,000 | Medalist Partners Corporate Finance CLO VI, Ltd. (Cayman Islands), Ser 2020-1A, Class B, 144a, (3M LIBOR +2.700%), 7.492%, 4/17/33(B) | 1,987,994 | ||
| 3,750,000 | Mill City Mortgage Loan Trust, Ser 2017-2, Class B2, 144a, 4.035%, 7/25/59(B)(C) | 3,117,390 | ||
| 4,912,500 | Neighborly Issuer LLC, Ser 2021-1A, Class A2, 144a, 3.584%, 4/30/51 | 4,166,832 | ||
| 3,750,000 | New Mountain CLO 3, Ltd. (Cayman Islands), Ser CLO-3A, Class C, 144a, (3M LIBOR +2.100%), 6.908%, 10/20/34(B) | 3,455,340 | ||
| 2,250,000 | Palmer Square CLO, Ltd. (Cayman Islands), Ser 2021-4A, Class D, 144a, (3M LIBOR +2.950%), 7.742%, 10/15/34(B) | 2,110,075 | ||
| 3,717,000 | STWD, Ltd. (Cayman Islands), Ser 2021-FL2, Class D, 144a, (1M LIBOR +2.800%), 7.509%, 4/18/38(B) | 3,139,071 | ||
| 3,300,000 | TRTX Issuer, Ltd. (Cayman Islands), Ser 2019-FL3, Class C, 144a, (SOFR30A +2.214%), 6.958%, 10/15/34(B) | 3,143,777 | ||
| 3,750,000 | Whitebox CLO I, Ltd. (Cayman Islands), Ser 2019-1A, Class BR, 144a, (3M LIBOR +2.050%), 6.866%, 7/24/32(B) | 3,529,013 | ||
| Total Asset-Backed Securities | $36,621,870 | |||
| U.S. Treasury Obligations — 15.8% | ||||
| 9,110,000 | U.S. Treasury Bond, 2.375%, 2/15/42 | 7,312,910 | ||
| 4,539,090 | U.S. Treasury Inflation Indexed Notes, 1.500%, 2/15/53 | 4,603,984 | ||
| 280,000 | U.S. Treasury Note, 0.500%, 11/30/23 | 272,278 | ||
| 8,260,000 | U.S. Treasury Note, 2.750%, 8/15/32 | 7,765,691 | ||
| 7,565,000 | U.S. Treasury Note, 3.500%, 2/15/33 | 7,570,910 | ||
| 7,415,000 | U.S. Treasury Note, 4.000%, 2/29/28 | 7,541,866 | ||
| Total U.S. Treasury Obligations | $35,067,639 | |||
| Shares | ||||
| Common Stocks — 5.2% | ||||
| Financials — 1.4% | ||||
| 25,150 | Bank of America Corp. | 719,290 | ||
| 2,465 | Goldman Sachs Group, Inc. (The) | 806,326 | ||
| 44 | Hi-Crush, Inc.(D) | 1,662,191 | ||
| 3,187,807 | ||||
| Information Technology — 0.8% | ||||
| 6,349 | International Business Machines Corp. | 832,291 | ||
| 5,215 | Texas Instruments, Inc. | 970,042 | ||
| 1,802,333 | ||||
| Industrials — 0.8% | ||||
| 1,850 | Lockheed Martin Corp. | 874,551 | ||
| 8,825 | Raytheon Technologies Corp. | 864,232 | ||
| 1,738,783 | ||||
| Materials — 0.6% | ||||
| 39,560 | Covia | 524,170 | ||
| 12,120 | DuPont de Nemours, Inc. | 869,852 | ||
| 1,394,022 | ||||
| Energy — 0.4% | ||||
| 8,050 | Exxon Mobil Corp. | 882,763 | ||
| Consumer Staples — 0.4% | ||||
| 8,861 | Philip Morris International, Inc. | 861,732 | ||
| Shares | MarketValue | |||
| Common Stocks — 5.2% (Continued) | ||||
| Health Care — 0.4% | ||||
| 5,552 | Johnson & Johnson | $ 860,560 | ||
| Communication Services — 0.4% | ||||
| 41,944 | AT&T, Inc. | 807,422 | ||
| Total Common Stocks | $11,535,422 | |||
| Principal Amount | ||||
| Commercial Mortgage-Backed Securities — 4.0% | ||||
| $ 4,500,000 | BX Commercial Mortgage Trust, Ser 2020-VIV2, Class C, 144a, 3.542%, 3/9/44(B)(C) | 3,646,670 | ||
| 5,000,000 | CGMS Commercial Mortgage Trust, Ser 2017-B1, Class D, 144a, 3.000%, 8/15/50 | 3,246,479 | ||
| 2,202,000 | GS Mortgage Securities Corp. Trust, Ser 2017-SLP, Class E, 144a, 4.599%, 10/10/32(B)(C) | 2,053,446 | ||
| Total Commercial Mortgage-Backed Securities | $8,946,595 | |||
| Sovereign Government Obligations — 3.1% | ||||
| 850,000 | Angolan Government International Bond, 144a, 8.000%, 11/26/29 | 727,515 | ||
| 697,000 | Bahamas Government International Bond, 144a, 6.000%, 11/21/28 | 523,193 | ||
| 320,000 | Colombia Government International Bond, 10.375%, 1/28/33 | 364,205 | ||
| 1,350,000 | Dominican Republic International Bond, 4.875%, 9/23/32 | 1,144,470 | ||
| 785,000 | Ecuador Government International Bond, 144a, 2.500%, 7/31/35 | 260,836 | ||
| 657,000 | Ecuador Government International Bond, 144a, 5.500%, 7/31/30 | 305,401 | ||
| 1,000,000 | Egypt Government International Bond, 8.500%, 1/31/47 | 578,138 | ||
| 705,000 | Gabon Government International Bond, 144a, 6.625%, 2/6/31 | 536,434 | ||
| 1,350,000 | Ghana Government International Bond, 144a, 8.627%, 6/16/49 | 445,500 | ||
| 700,000 | Nigeria Government International Bond, 144a, 7.625%, 11/28/47 | 443,765 | ||
| 650,000 | Republic of Uzbekistan International Bond, 144a, 3.700%, 11/25/30 | 521,084 | ||
| 900,000 | Serbia International Bond, 2.125%, 12/1/30 | 680,625 | ||
| 200,000 | Ukraine Government International Bond, 144a, 7.253%, 3/15/35 | 34,000 | ||
| 1,020,000 | Ukraine Government International Bond, 7.253%, 3/15/35 | 173,400 | ||
| Total Sovereign Government Obligations | $6,738,566 | |||
| Non-Agency Collateralized Mortgage Obligations — 3.0% | ||||
| 1,405,000 | Connecticut Avenue Securities Trust, Ser 2022-R04, Class 1M2, 144a, (SOFR30A +3.100%), 7.660%, 3/25/42(B) | 1,391,676 | ||
| 3,250,000 | Freddie Mac STACR REMIC Trust, Ser 2022-DNA3, Class M1B, 144a, (SOFR30A +2.900%), 7.460%, 4/25/42(B) | 3,225,682 | ||
| 2,375,000 | Towd Point Mortgage Trust, Ser 2015-2, Class 1B3, 144a, 3.531%, 11/25/60(B)(C) | 2,005,586 | ||
| Total Non-Agency Collateralized Mortgage Obligations | $6,622,944 | |||
| Agency Collateralized Mortgage Obligations — 0.5% | ||||
| 24,634,044 | FRESB Mortgage Trust, Ser 2020-SB78, Class X1, 1.132%, 6/25/40(B)(C)(E) | 1,033,886 | ||
| Shares | MarketValue | |||
| Preferred Stocks — 0.2% | ||||
| Financials — 0.2% | ||||
| 95,203 | First Republic Bank, Ser K, 4.125%(A) | $ 507,432 | ||
| Number of Rights | ||||
| Rights — 0.0% | ||||
| Energy — 0.0% | ||||
| 27,942 | Vistra Energy Corp. Tax Return Rights, 12/6/26* | 32,832 | ||
| Shares | ||||
| Short-Term Investment Funds — 1.3% | ||||
| 2,676,839 | Dreyfus Government Cash Management, Institutional Shares, 4.71%∞Ω | 2,676,839 | ||
| 214,830 | Invesco Government & Agency Portfolio, Institutional Class, 4.73%∞Ω** | 214,830 | ||
| Total Short-Term Investment Funds | $2,891,669 | |||
| Total Investment Securities—99.2% (Cost $245,924,610) | $220,155,428 | |||
| Other Assets in Excess of Liabilities — 0.8% | 1,880,841 | |||
| Net Assets — 100.0% | $222,036,269 | |||
| (A) | Perpetual Bond - A bond or preferred stock with no definite maturity date. |
| (B) | Variable rate security - Rate reflected is the rate in effect as of March 31, 2023. |
| (C) | Certain variable rate securities are not based on a published reference rate and spread but are determined by the issuer or agent and are based on current market conditions. These securities do not indicate a reference rate and spread in their description. |
| (D) | Level 3- For more information on valuation inputs, and their aggregation into the levels used in the table below, please refer to the security valuation section in the accompanying Notes to Financial Statements. Level 3 securities were not considered significant to the Fund. |
| (E) | Interest only security - This type of security represents the right to receive the monthly interest payments on an underlying pool of mortgages. Payments of principal on the pool reduce the value of the “interest only” holding. |
| * | Non-income producing security. |
| ** | Represents collateral for securities loaned. |
| † | All or a portion of the security is on loan. The total market value of the securities on loan as of March 31, 2023 was $209,055. |
| ∞ | Open-End Fund. |
| Ω | Represents the 7-Day SEC yield as of March 31, 2023. |
| Portfolio Abbreviations: |
| CLO – Collateralized Loan Obligation |
| FRESB – Freddie Mac Multifamily Securitization Small Balance Loan |
| ICE – Intercontinental Exchange, Inc. |
| LIBOR – London Interbank Offered Rate |
| LLC – Limited Liability Company |
| LP – Limited Partnership |
| PLC – Public Limited Company |
| REIT – Real Estate Investment Trust |
| REMIC – Real Estate Mortgage Investment Conduit |
| SOC – State-Owned Company |
| SOFR30A – Secured Overnight Financing Rate 30 Day Average |
| 144a - This is a restricted security that was sold in a transaction qualifying for the exemption under Rule 144a of the Securities Act of 1933. This security may be sold in transactions exempt from registration, normally to qualified institutional buyers. At March 31, 2023, these securities were valued at $105,519,688 or 47.5% of net assets. These securities were deemed liquid pursuant to procedures approved by the Board of Trustees. |
| Valuation Inputs at Reporting Date: | ||||
| Description | Level 1 | Level 2 | Level 3 | Total |
| Assets: | ||||
| Corporate Bonds | $— | $110,156,573 | $— | $110,156,573 |
| Asset-Backed Securities | — | 36,621,870 | — | 36,621,870 |
| U.S. Treasury Obligations | — | 35,067,639 | — | 35,067,639 |
| Common Stocks | 9,349,061 | 524,170 | 1,662,191 | 11,535,422 |
| Commercial Mortgage-Backed Securities | — | 8,946,595 | — | 8,946,595 |
| Sovereign Government Obligations | — | 6,738,566 | — | 6,738,566 |
| Non-Agency Collateralized Mortgage Obligations | — | 6,622,944 | — | 6,622,944 |
| Agency Collateralized Mortgage Obligations | — | 1,033,886 | — | 1,033,886 |
| Preferred Stocks | 507,432 | — | — | 507,432 |
| Rights | — | 32,832 | — | 32,832 |
| Short-Term Investment Funds | 2,891,669 | — | — | 2,891,669 |
| Other Financial Instruments | ||||
| Swap Agreements | ||||
| Credit contracts | — | 92,810 | — | 92,810 |
| Total Assets | $12,748,162 | $205,837,885 | $1,662,191 | $220,248,238 |
| Liabilities: | ||||
| Other Financial Instruments | ||||
| Futures | ||||
| Interest rate contracts | $(96,512) | $— | $— | $(96,512) |
| Total Liabilities | $(96,512) | $— | $— | $(96,512) |
| Total | $12,651,650 | $205,837,885 | $1,662,191 | $220,151,726 |
| Measurements Using Unobservable Inputs (Level 3) | |
| Assets | Common Stocks |
| Beginning balance, March 31, 2022 | $22,379 |
| Change in unrealized appreciation (depreciation) | 1,639,812 |
| Ending balance, March 31, 2023 | $1,662,191 |
| Net Change in Unrealized Appreciation/Depreciation for Investments in Securities still held at March 31, 2023 | $1,639,812 |
| Common Stocks | Fair Value | Valuation Technique | Unobservable Input | Value or range of input | Impact to valuation from an increase to the input |
| Hi-Crush, Inc. | $1,662,191 | Market Approach | Transaction Price | $47,500 | N/A |
| Description | Expiration Date | Number of Contracts | Notional Value | Unrealized Depreciation |
| Short Futures: | ||||
| 10-Year U.S. Ultra Long Term Treasury Bond | 6/21/2023 | 86 | $10,418,094 | $(61,665) |
| Long Futures: | ||||
| 2-Year U.S. Treasury Note | 6/30/2023 | 209 | 43,148,703 | (34,847) |
| $(96,512) |
| Counterparty | Termination Date | Notional Amount(2) | Pay Fixed Rate | Clearinghouse | Underlying Bond | Value(3) | Premiums Paid/ (Received) | Unrealized Appreciation |
| Buy Protection: | ||||||||
| Wells Fargo | 12/20/27 | $9,345,000 | 5.000% | ICE | Markit CDX North America High Yield Series 39 5Y Index | $(110,286) | $(203,096) | $92,810 |
| (1) | If the Fund is a buyer of protection and a credit event occurs, as defined under the terms of that particular swap agreement, the Fund will either (i) receive from the seller of protection an amount equal to the notional amount of the swap and deliver the referenced obligation or underlying investments comprising the referenced index or (ii) receive a net settlement amount in the form of cash or investments equal to the notional amount of the swap less the recovery value of the referenced obligation or underlying investments comprising the referenced index. |
| (2) | The maximum potential amount the Fund could be required to pay as a seller of credit protection or receive as a buyer of credit protection if a credit event occurs as defined under the terms of that particular swap agreement. |
| (3) | The quoted market prices and resulting values for credit default swap agreements on the underlying bond serve as an indicator of the current status of the payment/performance risk and represent the likelihood of an expected liability (or profit) for the credit derivative had the notional amount of the swap agreement been closed/sold as of the period end. Decreasing market values (sell protection) or increasing market values (buy protection) when compared to the notional amount of the swap, represent a deterioration of the referenced entity's credit soundness and a greater likelihood or risk of default or other credit event occurring as defined under the terms of the agreement. |
| Touchstone Flexible Income Fund | Touchstone Focused Fund | Touchstone Growth Opportunities Fund | Touchstone Mid Cap Growth Fund | Touchstone Non-US ESG Equity Fund | Touchstone Sands Capital Emerging Markets Growth Fund | Touchstone Strategic Income Opportunities Fund | |
| Assets | |||||||
| Investments, at cost | $944,749,519 | $645,304,725 | $88,583,661 | $921,323,103 | $483,693,013 | $1,950,325,629 | $245,924,610 |
| Investments, at market value * | $861,549,537 | $1,059,284,867 | $128,111,436 | $1,118,800,635 | $554,882,446 | $2,275,366,625 | $220,155,428 |
| Cash | 1,752,055 | — | — | — | — | 227,431 | — |
| Cash deposits held at prime broker (A) | 10,731,459 | — | — | — | — | — | 944,392 |
| Foreign currency † | 2 | — | — | — | 27,844 | 7,074,631 | 115 |
| Dividends and interest receivable | 6,297,212 | 593,108 | 27,200 | 363,447 | 2,617,381 | 2,310,221 | 2,144,595 |
| Receivable for capital shares sold | 3,579,997 | 126,839 | 171,405 | 1,248,497 | 67,158 | 4,875,287 | 43,148 |
| Receivable for investments sold | 1,488,769 | 682,067 | — | — | — | — | — |
| Receivable for securities lending income | 8,256 | 147 | 184 | — | 36,681 | 6,008 | 125 |
| Tax reclaim receivable | — | — | — | — | 443,767 | 19,070 | 5,095 |
| Other assets | 28,951 | 28,242 | 15,765 | 32,665 | 20,836 | 65,986 | 13,362 |
| Total Assets | 885,436,238 | 1,060,715,270 | 128,325,990 | 1,120,445,244 | 558,096,113 | 2,289,945,259 | 223,306,260 |
| Liabilities | |||||||
| Due to custodian | — | — | — | — | — | — | 25,021 |
| Payable for return of collateral for securities on loan | 2,276,706 | — | 1,750,375 | — | 29,054,036 | 1,792,110 | 214,830 |
| Deferred foreign capital gains tax | — | — | — | — | — | 3,862,762 | — |
| Payable for capital shares redeemed | 2,771,790 | 499,752 | 162,146 | 3,794,656 | 488,680 | 7,803,615 | 270,862 |
| Payable for investments purchased | 39,726,375 | 264,516 | — | 9,385,437 | — | 11,452,239 | 274,992 |
| Payable to Investment Adviser | 347,255 | 546,129 | 68,399 | 635,674 | 285,912 | 1,874,759 | 103,218 |
| Payable to other affiliates | 132,565 | 145,043 | 19,010 | 192,996 | 175,347 | 267,037 | 53,245 |
| Payable to Trustees | 13,060 | 13,060 | 13,060 | 13,060 | 13,060 | 13,060 | 13,060 |
| Payable for professional services | 38,134 | 31,223 | 24,333 | 33,255 | 31,951 | 51,300 | 35,273 |
| Payable for reports to shareholders | 15,320 | 17,783 | 3,445 | 53,218 | 9,281 | 41,459 | 8,077 |
| Payable for transfer agent services | 308,513 | 400,683 | 46,055 | 528,981 | 223,114 | 564,884 | 120,165 |
| Payable for variation margin on futures contracts | — | — | — | — | — | — | 17,641 |
| Payable for variation margin on swap agreements | 1,383,564 | — | — | — | — | — | 110,286 |
| Other accrued expenses and liabilities | 128,048 | 20,122 | 5,482 | 30,764 | 17,259 | 66,761 | 23,321 |
| Total Liabilities | 47,141,330 | 1,938,311 | 2,092,305 | 14,668,041 | 30,298,640 | 27,789,986 | 1,269,991 |
| Net Assets | $838,294,908 | $1,058,776,959 | $126,233,685 | $1,105,777,203 | $527,797,473 | $2,262,155,273 | $222,036,269 |
| Net assets consist of: | |||||||
| Paid-in capital | 924,959,712 | 630,495,530 | 87,850,100 | 1,000,337,270 | 467,035,365 | 2,945,996,739 | 314,448,159 |
| Distributable earnings (deficit) | (86,664,804) | 428,281,429 | 38,383,585 | 105,439,933 | 60,762,108 | (683,841,466) | (92,411,890) |
| Net Assets | $838,294,908 | $1,058,776,959 | $126,233,685 | $1,105,777,203 | $527,797,473 | $2,262,155,273 | $222,036,269 |
| *Includes market value of securities on loan of: | $2,239,195 | $— | $1,721,210 | $— | $26,774,292 | $1,729,459 | $209,055 |
| †Cost of foreign currency: | $3 | $— | $— | $— | $27,850 | $7,065,581 | $124 |
| (A) | Represents segregated cash for futures contracts, swap agreements and/or securities sold short. |
| Touchstone Flexible Income Fund | Touchstone Focused Fund | Touchstone Growth Opportunities Fund^ | Touchstone Mid Cap Growth Fund^ | Touchstone Non-US ESG Equity Fund^ | Touchstone Sands Capital Emerging Markets Growth Fund | Touchstone Strategic Income Opportunities Fund | |
| Pricing of Class A Shares | |||||||
| Net assets applicable to Class A shares | $104,049,715 | $45,751,303 | $48,229,121 | $234,325,231 | $406,505,529 | $16,202,983 | $138,096,456 |
| Shares of beneficial interest outstanding (unlimited number of shares authorized, no par value) | 10,543,063 | 836,296 | 1,441,088 | 8,041,023 | 19,559,369 | 1,224,519 | 45,793,135 |
| Net asset value price per share* | $9.87 | $54.71 | $33.47 | $29.14 | $20.78 | $13.23 | $3.02 |
| Maximum sales charge - Class A shares | 3.25% | 5.00% | 5.00% | 5.00% | 5.00% | 5.00% | 3.25% |
| Maximum offering price per share (100%/(100%-maximum sales charge) of net asset value adjusted to the nearest cent) - Class A shares | $10.20 | $57.59 | $35.23 | $30.67 | $21.87 | $13.93 | $3.12 |
| Pricing of Class C Shares | |||||||
| Net assets applicable to Class C shares | $30,157,592 | $12,936,819 | $1,485,165 | $13,709,183 | $3,552,732 | $6,153,687 | $24,451,007 |
| Shares of beneficial interest outstanding (unlimited number of shares authorized, no par value) | 3,108,317 | 262,044 | 44,576 | 472,749 | 169,562 | 477,028 | 8,074,834 |
| Net asset value and offering price per share** | $9.70 | $49.37 | $33.32 | $29.00 | $20.95 | $12.90 | $3.03 |
| Pricing of Class Y Shares | |||||||
| Net assets applicable to Class Y shares | $668,603,503 | $978,944,139 | $26,580,502 | $548,506,928 | $109,721,706 | $611,637,048 | $59,268,784 |
| Shares of beneficial interest outstanding (unlimited number of shares authorized, no par value) | 67,508,889 | 17,611,953 | 747,592 | 17,622,369 | 5,042,007 | 45,824,395 | 19,711,365 |
| Net asset value, offering price and redemption price per share | $9.90 | $55.58 | $35.55 | $31.13 | $21.76 | $13.35 | $3.01 |
| Pricing of Institutional Class Shares | |||||||
| Net assets applicable to Institutional Class shares | $35,484,098 | $21,144,698 | $49,938,897 | $209,280,331 | $8,017,506 | $931,523,186 | $220,022 |
| Shares of beneficial interest outstanding (unlimited number of shares authorized, no par value) | 3,583,821 | 378,272 | 1,372,074 | 6,609,374 | 368,114 | 69,361,832 | 73,283 |
| Net asset value, offering price and redemption price per share | $9.90 | $55.90 | $36.40 | $31.66 | $21.78 | $13.43 | $3.00 |
| Pricing of Class R6 Shares | |||||||
| Net assets applicable to Class R6 shares | $— | $— | $— | $99,955,530 | $— | $696,638,369 | $— |
| Shares of beneficial interest outstanding (unlimited number of shares authorized, no par value) | — | — | — | 3,148,278 | — | 51,853,557 | — |
| Net asset value, offering price and redemption price per share | $— | $— | $— | $31.75 | $— | $13.43 | $— |
| * | There is no sales load on subscriptions of $1 million or more for all funds except for Flexible Income Fund and Strategic Income Opportunities Fund. There is no sales load on subscriptions of $500,000 or more for Flexible Income Fund and Strategic Income Opportunities Fund. Redemptions that were part of a $500,000 or $1 million or more subscription, as applicable, may be subject to a contingent deferred sales load if redeemed within a one-year period from the date of purchase. |
| ** | Redemption price per share varies by length of time shares are held due to the terms of the contingent deferred sales charge. |
| ^ | The Shares of beneficial interest outstanding and Net asset value and offering price per share were updated to reflect the effect of a 1 for 0.670946, 1 for 0.466797 and 1 for 0.801806 reverse stock split for Class C shares of the Growth Opportunities Fund, the Mid Cap Growth Fund and the Non-US ESG Equity Fund, respectively, on October 14, 2022 (See Note 9 in the Notes to Financial Statements). |
| Touchstone Flexible Income Fund | Touchstone Focused Fund | Touchstone Growth Opportunities Fund | Touchstone Mid Cap Growth Fund | Touchstone Non-US ESG Equity Fund | Touchstone Sands Capital Emerging Markets Growth Fund | Touchstone Strategic Income Opportunities Fund | |
| Investment Income | |||||||
| Dividends* | $10,835,202 | $13,836,063 | $1,267,121 | $10,805,474 | $13,740,442 | $26,495,673 | $827,664 |
| Interest** | 23,935,778 | — | — | — | — | — | 12,123,504 |
| Income from securities loaned | 169,318 | 3,748 | 481 | 5,394 | 131,030 | 1,207,330 | 1,199 |
| Total Investment Income | 34,940,298 | 13,839,811 | 1,267,602 | 10,810,868 | 13,871,472 | 27,703,003 | 12,952,367 |
| Expenses | |||||||
| Investment advisory fees | 4,424,385 | 6,506,853 | 961,312 | 8,142,009 | 3,431,772 | 25,218,062 | 1,413,720 |
| Administration fees | 1,079,611 | 1,422,537 | 176,172 | 1,564,851 | 725,853 | 3,464,100 | 355,449 |
| Compliance fees and expenses | 3,451 | 3,451 | 3,451 | 3,451 | 3,451 | 3,451 | 3,451 |
| Custody fees | 101,522 | 15,644 | 9,944 | 23,353 | 58,217 | 663,019 | 33,283 |
| Professional fees | 59,186 | 51,156 | 30,112 | 56,561 | 66,903 | 129,464 | 41,005 |
| Transfer Agent fees, Class A | 88,836 | 34,762 | 41,643 | 252,732 | 307,095 | 17,834 | 142,489 |
| Transfer Agent fees, Class C | 20,859 | 11,270 | 1,448 | 12,121 | 3,956 | 10,957 | 24,648 |
| Transfer Agent fees, Class Y | 495,000 | 670,666 | 18,017 | 636,244 | 78,896 | 755,000 | 61,537 |
| Transfer Agent fees, Institutional Class | 14,488 | 5,476 | 19,492 | 99,722 | 1,806 | 455,000 | 54 |
| Transfer Agent fees, Class R6 | — | — | — | 468 | — | 945 | — |
| Registration fees, Class A | 16,988 | 13,539 | 15,036 | 21,333 | 22,821 | 16,305 | 19,688 |
| Registration fees, Class C | 12,818 | 10,349 | 9,575 | 13,243 | 11,477 | 12,639 | 15,524 |
| Registration fees, Class Y | 55,252 | 29,826 | 14,200 | 35,737 | 16,529 | 60,667 | 23,371 |
| Registration fees, Institutional Class | 8,558 | 9,697 | 15,249 | 21,389 | 9,071 | 36,291 | 4,891 |
| Registration fees, Class R6 | — | — | — | 14,057 | — | 12,921 | — |
| Interest expense on securities sold short | 132,970 | — | — | — | — | — | — |
| Reports to Shareholders, Class A | 11,514 | 4,408 | 4,740 | 19,043 | 20,452 | 3,871 | 13,453 |
| Reports to Shareholders, Class C | 3,781 | 2,486 | 1,941 | 3,580 | 2,578 | 2,953 | 3,521 |
| Reports to Shareholders, Class Y | 30,660 | 42,124 | 2,411 | 96,029 | 12,349 | 81,238 | 6,279 |
| Reports to Shareholders, Institutional Class | 3,498 | 2,066 | 2,444 | 29,032 | 2,384 | 11,708 | 1,812 |
| Reports to Shareholders, Class R6 | — | — | — | 7,112 | — | 29,320 | — |
| Distribution and shareholder servicing expenses, Class A | 268,904 | 109,449 | 122,335 | 627,600 | 912,265 | 41,592 | 377,388 |
| Distribution and shareholder servicing expenses, Class C | 310,423 | 152,389 | 14,959 | 139,536 | 41,881 | 69,097 | 303,114 |
| Trustee fees | 26,690 | 26,690 | 26,690 | 26,690 | 26,690 | 26,690 | 26,690 |
| Other expenses | 72,748 | 311,426 | 69,810 | 297,652 | 227,113 | 120,733 | 77,006 |
| Total Expenses | 7,242,142 | 9,436,264 | 1,560,981 | 12,143,545 | 5,983,559 | 31,243,857 | 2,948,373 |
| Fees waived and/or reimbursed by the Adviser and/or Affiliates(A) | (364,735) | (11,908) | (180,651) | (293,346) | (57,971) | (23,294) | (340,283) |
| Net Expenses | 6,877,407 | 9,424,356 | 1,380,330 | 11,850,199 | 5,925,588 | 31,220,563 | 2,608,090 |
| Net Investment Income (Loss) | 28,062,891 | 4,415,455 | (112,728) | (1,039,331) | 7,945,884 | (3,517,560) | 10,344,277 |
| Realized and Unrealized Gains (Losses) on Investments | |||||||
| Net realized gains (losses) on investments(B)(C) | (10,023,702) | 39,975,992 | 9,372,877 | (58,474,330) | 25,342,525 | (640,219,453) | (21,177,572) |
| Net realized gains on securities sold short | 13,686,575 | — | — | — | — | — | — |
| Net realized gains on written options | 541,634 | — | — | — | — | — | — |
| Net realized gains (losses) on futures contracts | (122,038) | — | — | — | — | — | 390,539 |
| Net realized gains on swap agreements | 1,093,824 | — | — | — | — | — | 58,911 |
| Net realized gains (losses) on foreign currency transactions | — | — | — | 120 | (14,347) | (211,102) | — |
| Net change in unrealized appreciation (depreciation) on investments† | (52,985,589) | (123,057,445) | (28,742,333) | (116,074,744) | (61,547,767) | 95,815,559 | (4,144,734) |
| Net change in unrealized appreciation (depreciation) on securities sold short | 764,636 | — | — | — | — | — | — |
| Net change in unrealized appreciation (depreciation) on futures contracts | — | — | — | — | — | — | 111,149 |
| Net change in unrealized appreciation (depreciation) on swap agreements | (642,669) | — | — | — | — | — | 92,810 |
| Net change in unrealized appreciation (depreciation) on foreign currency transactions | (1) | — | — | — | 5,549 | (4,666) | (14) |
| Net Realized and Unrealized Gains (Losses) on Investments | (47,687,330) | (83,081,453) | (19,369,456) | (174,548,954) | (36,214,040) | (544,619,662) | (24,668,911) |
| Touchstone Flexible Income Fund | Touchstone Focused Fund | Touchstone Growth Opportunities Fund | Touchstone Mid Cap Growth Fund | Touchstone Non-US ESG Equity Fund | Touchstone Sands Capital Emerging Markets Growth Fund | Touchstone Strategic Income Opportunities Fund | |
| Change in Net Assets Resulting from Operations | $(19,624,439) | $(78,665,998) | $(19,482,184) | $(175,588,285) | $(28,268,156) | $(548,137,222) | $(14,324,634) |
| *Net of foreign tax withholding of: | $26,481 | $45,225 | $2,060 | $19,532 | $1,797,365 | $2,718,177 | $— |
| **Net of foreign tax withholding of: | $— | $— | $— | $— | $— | $— | $15,470 |
| †Includes decrease in deferred foreign capital gains tax of: | $— | $— | $— | $— | $— | $22,378,221 | $— |
| (A) | See Note 4 in Notes to Financial Statements. |
| (B) | Includes foreign capital gains taxes paid of $14,928,252 for the Sands Capital Emerging Markets Growth Fund. |
| (C) | Net realized gains (losses) on investments includes the realized gains of $25,585,133, $9,473,861, $33,655,665, $33,811,543 and $5,766,929 for the Focused Fund, the Growth Opportunities Fund, the Mid Cap Growth Fund, the Non-US ESG Equity Fund and the Sands Capital Emerging Markets Growth Fund, respectively, for redemption-in-kind activity, which will not be recognized by the Fund for tax purposes. |
| Touchstone Flexible Income Fund | Touchstone Focused Fund | Touchstone Growth Opportunities Fund | ||||
| For the Year Ended March 31, 2023 | For the Year Ended March 31, 2022 | For the Year Ended March 31, 2023 | For the Year Ended March 31, 2022 | For the Year Ended March 31, 2023 | For the Year Ended March 31, 2022 | |
| From Operations | ||||||
| Net investment income (loss) | $28,062,891 | $27,793,766 | $4,415,455 | $1,134,595 | $(112,728) | $(496,055) |
| Net realized gains (losses) on investments, securities sold short, written options, futures contracts, swap agreements, forward foreign currency contracts, foreign currency transactions and capital gain distributions received | 5,176,293 | 5,078,799 | 39,975,992 | 105,788,449 | 9,372,877 | 19,382,164 |
| Net change in unrealized appreciation (depreciation) on investments, securities sold short, futures contracts, swap agreements, forward foreign currency contracts and foreign currency transactions | (52,863,623) | (49,986,963) | (123,057,445) | 6,341,938 | (28,742,333) | (1,297,245) |
| Change in Net Assets from Operations | (19,624,439) | (17,114,398) | (78,665,998) | 113,264,982 | (19,482,184) | 17,588,864 |
| Distributions to Shareholders: | ||||||
| Distributed earnings, Class A | (4,717,917) | (3,914,740) | (1,323,048) | (2,981,004) | (1,052,167) | (10,095,137) |
| Distributed earnings, Class B | — | — | — | — | — | — |
| Distributed earnings, Class C | (1,135,312) | (1,030,204) | (479,642) | (1,434,791) | (31,591) | (389,665) |
| Distributed earnings, Class Y | (28,330,515) | (22,656,138) | (29,342,137) | (65,864,852) | (445,615) | (4,474,202) |
| Distributed earnings, Institutional Class | (1,678,942) | (1,622,568) | (460,302) | (1,697,569) | (1,065,373) | (11,185,510) |
| Distributed earnings, Class R6 | — | — | — | — | — | — |
| Return of capital, Class A | — | — | — | — | — | — |
| Return of capital, Class C | — | — | — | — | — | — |
| Return of capital, Class Y | — | — | — | — | — | — |
| Return of capital, Institutional Class | — | — | — | — | — | — |
| Total Distributions | (35,862,686) | (29,223,650) | (31,605,129) | (71,978,216) | (2,594,746) | (26,144,514) |
| Change in Net Assets from Share Transactions(A) | 47,371,465 | 103,096,464 | (31,834,824) | 11,900,180 | (13,939,394) | 9,872,785 |
| Total Increase (Decrease) in Net Assets | (8,115,660) | 56,758,416 | (142,105,951) | 53,186,946 | (36,016,324) | 1,317,135 |
| Net Assets | ||||||
| Beginning of period | 846,410,568 | 789,652,152 | 1,200,882,910 | 1,147,695,964 | 162,250,009 | 160,932,874 |
| End of period | $838,294,908 | $846,410,568 | $1,058,776,959 | $1,200,882,910 | $126,233,685 | $162,250,009 |
| (A) | For details on share transactions by class, see Statements of Changes in Net Assets - Capital Stock Activity. |
| Touchstone Mid Cap Growth Fund | Touchstone Non-US ESG Equity Fund | Touchstone Sands Capital Emerging Markets Growth Fund | Touchstone Strategic Income Opportunities Fund | ||||
| For the Year Ended March 31, 2023 | For the Year Ended March 31, 2022 | For the Year Ended March 31, 2023 | For the Year Ended March 31, 2022 | For the Year Ended March 31, 2023 | For the Year Ended March 31, 2022 | For the Year Ended March 31, 2023 | For the Year Ended March 31, 2022 |
| $(1,039,331) | $(6,572,899) | $7,945,884 | $5,424,800 | $(3,517,560) | $(30,231,867) | $10,344,277 | $9,102,699 |
| (58,474,210) | 231,808,914 | 25,328,178 | 60,595,989 | (640,430,555) | (237,979,435) | (20,728,122) | 8,067,439 |
| (116,074,744) | (115,521,773) | (61,542,218) | (68,893,052) | 95,810,893 | (970,965,235) | (3,940,789) | (29,107,246) |
| (175,588,285) | 109,714,242 | (28,268,156) | (2,872,263) | (548,137,222) | (1,239,176,537) | (14,324,634) | (11,937,108) |
| (6,220,488) | (48,088,579) | (26,255,264) | (55,428,678) | — | (393,240) | (6,312,333) | (5,076,894) |
| — | — | — | — | — | — | — | (92,062) |
| (345,866) | (5,041,824) | (213,268) | (801,994) | — | (119,388) | (1,030,344) | (846,395) |
| (13,426,881) | (98,678,809) | (6,972,747) | (18,663,839) | — | (29,163,383) | (3,314,078) | (3,939,569) |
| (4,640,652) | (50,376,807) | (560,443) | (1,214,241) | — | (41,115,494) | (9,886) | (4,036) |
| (2,316,913) | (5,039,178) | — | — | (81,972) | (13,193,519) | — | — |
| — | — | — | — | — | — | (270,472) | — |
| — | — | — | — | — | — | (44,149) | — |
| — | — | — | — | — | — | (142,003) | — |
| — | — | — | — | — | — | (424) | — |
| (26,950,800) | (207,225,197) | (34,001,722) | (76,108,752) | (81,972) | (83,985,024) | (11,123,689) | (9,958,956) |
| (7,136,305) | 44,308,317 | (38,659,439) | 7,273,709 | (767,650,282) | 543,334,433 | (79,047,952) | (18,679,977) |
| (209,675,390) | (53,202,638) | (100,929,317) | (71,707,306) | (1,315,869,476) | (779,827,128) | (104,496,275) | (40,576,041) |
| 1,315,452,593 | 1,368,655,231 | 628,726,790 | 700,434,096 | 3,578,024,749 | 4,357,851,877 | 326,532,544 | 367,108,585 |
| $1,105,777,203 | $1,315,452,593 | $527,797,473 | $628,726,790 | $2,262,155,273 | $3,578,024,749 | $222,036,269 | $326,532,544 |
| Touchstone Flexible Income Fund | Touchstone Focused Fund | |||||||
| For the Year Ended March 31, 2023 | For the Year Ended March 31, 2022 | For the Year Ended March 31, 2023 | For the Year Ended March 31, 2022 | |||||
| Shares | Dollars | Shares | Dollars | Shares | Dollars | Shares | Dollars | |
| Class A | ||||||||
| Proceeds from Shares issued | 1,949,261 | $19,635,751 | 1,667,801 | $18,708,179 | 128,846 | $6,894,157 | 251,214 | $15,729,509 |
| Reinvestment of distributions | 388,079 | 3,870,207 | 287,086 | 3,194,417 | 21,704 | 1,109,299 | 40,130 | 2,514,954 |
| Cost of Shares redeemed | (2,571,462) | (25,778,622) | (2,092,760) | (23,321,227) | (192,440) | (10,429,070) | (241,848) | (15,316,752) |
| Change from Class A Share Transactions | (234,122) | (2,272,664) | (137,873) | (1,418,631) | (41,890) | (2,425,614) | 49,496 | 2,927,711 |
| Class C | ||||||||
| Proceeds from Shares issued | 686,751 | 6,717,462 | 570,123 | 6,275,318 | 12,087 | 566,150 | 13,299 | 768,119 |
| Reinvestment of distributions | 105,930 | 1,038,338 | 84,578 | 926,694 | 10,085 | 466,230 | 24,476 | 1,402,008 |
| Cost of Shares redeemed | (1,251,828) | (12,380,274) | (1,144,286) | (12,561,013) | (125,785) | (6,107,575) | (139,769) | (8,043,500) |
| Change from Class C Share Transactions | (459,147) | (4,624,474) | (489,585) | (5,359,001) | (103,613) | (5,075,195) | (101,994) | (5,873,373) |
| Class Y | ||||||||
| Proceeds from Shares issued | 36,287,791 | 364,040,727 | 22,477,042 | 252,114,312 | 255,735 | 13,694,394 | 491,672 | 30,921,050 |
| Reinvestment of distributions | 2,639,690 | 26,420,909 | 1,864,466 | 20,791,361 | 545,270 | 28,289,601 | 998,513 | 63,493,935 |
| Cost of Shares redeemed | (33,787,591) | (340,046,806) | (14,691,501) | (163,062,234) | (1,303,244) | (70,122,989) | (1,290,574) | (81,764,429) |
| Change from Class Y Share Transactions | 5,139,890 | 50,414,830 | 9,650,007 | 109,843,439 | (502,239) | (28,138,994) | 199,611 | 12,650,556 |
| Institutional Class | ||||||||
| Proceeds from Shares issued | 1,696,154 | 17,228,989 | 4,586,557 | 51,827,041 | 1,175,646 | 63,746,078 | 1,139,671 | 73,216,877 |
| Reinvestment of distributions | 103,315 | 1,033,361 | 102,953 | 1,154,181 | 8,766 | 457,231 | 26,163 | 1,671,930 |
| Cost of Shares redeemed | (1,439,864) | (14,408,577) | (4,708,529) | (52,950,565) | (1,112,049) | (60,398,330) | (1,117,980) | (72,693,521) |
| Change from Institutional Class Share Transactions | 359,605 | 3,853,773 | (19,019) | 30,657 | 72,363 | 3,804,979 | 47,854 | 2,195,286 |
| Class R6 | ||||||||
| Proceeds from Shares issued | — | — | — | — | — | — | — | — |
| Reinvestment of distributions | — | — | — | — | — | — | — | — |
| Cost of Shares redeemed | — | — | — | — | — | — | — | — |
| Change from Class R6 Share Transactions | — | — | — | — | — | — | — | — |
| Change from Share Transactions | 4,806,226 | $47,371,465 | 9,003,530 | $103,096,464 | (575,379) | $(31,834,824) | 194,967 | $11,900,180 |
| ^ | The March 31, 2023 and March 31, 2022 Class C share amounts relating to Proceeds from Shares issued, Reinvestment of distributions, Cost of Shares redeemed, and Change from Class C Share Transactions as well as Change from Share transactions were updated to reflect the effect of a 1 for 0.670946 and 1 for 0.466797 reverse stock split for Class C shares of the Growth Opportunities Fund and the Mid Cap Growth Fund, respectively, on October 14, 2022 (See Note 9 in the Notes to Financial Statements). |
| Touchstone Growth Opportunities Fund^ | Touchstone Mid Cap Growth Fund^ | ||||||
| For the Year Ended March 31, 2023 | For the Year Ended March 31, 2022 | For the Year Ended March 31, 2023 | For the Year Ended March 31, 2022 | ||||
| Shares | Dollars | Shares | Dollars | Shares | Dollars | Shares | Dollars |
| 49,105 | $1,557,953 | 116,102 | $5,145,067 | 1,149,040 | $33,283,073 | 609,620 | $22,987,724 |
| 33,762 | 1,012,824 | 235,351 | 9,694,083 | 206,106 | 5,674,174 | 1,172,612 | 43,046,572 |
| (220,816) | (6,887,557) | (157,163) | (6,656,749) | (1,999,047) | (57,232,400) | (1,648,188) | (65,483,714) |
| (137,949) | (4,316,780) | 194,290 | 8,182,401 | (643,901) | (18,275,153) | 134,044 | 550,582 |
| 8,088 | 201,498 | 3,751 | 158,216 | 119,268 | 2,468,397 | 119,599 | 4,681,124 |
| 1,042 | 31,195 | 9,197 | 380,795 | 12,265 | 336,791 | 133,006 | 4,912,253 |
| (32,602) | (269,142) | (8,953) | (417,551) | (766,920) | (4,121,217) | (160,628) | (6,896,222) |
| (23,472) | (36,449) | 3,995 | 121,460 | (635,387) | (1,316,029) | 91,977 | 2,697,155 |
| 295,225 | 10,151,873 | 62,537 | 2,694,760 | 5,400,605 | 167,527,333 | 3,105,793 | 124,588,934 |
| 13,728 | 436,070 | 100,436 | 4,383,031 | 437,185 | 12,844,496 | 2,372,638 | 92,627,783 |
| (192,365) | (6,432,763) | (245,530) | (10,959,478) | (6,112,004) | (187,858,638) | (3,743,224) | (153,939,239) |
| 116,588 | 4,155,180 | (82,557) | (3,881,687) | (274,214) | (7,486,809) | 1,735,207 | 63,277,478 |
| 557,663 | 19,561,366 | 418,535 | 18,866,379 | 5,821,988 | 178,438,935 | 5,904,177 | 248,082,533 |
| 32,188 | 1,046,156 | 250,571 | 11,185,510 | 147,352 | 4,401,399 | 946,844 | 37,513,952 |
| (974,175) | (34,348,867) | (540,597) | (24,601,278) | (5,502,276) | (168,175,053) | (10,207,590) | (421,663,326) |
| (384,324) | (13,741,345) | 128,509 | 5,450,611 | 467,064 | 14,665,281 | (3,356,569) | (136,066,841) |
| — | — | — | — | 1,424,522 | 44,665,985 | 3,279,068 | 128,766,328 |
| — | — | — | — | 37,637 | 1,127,220 | 103,297 | 4,098,831 |
| — | — | — | — | (1,300,742) | (40,516,800) | (510,052) | (19,015,216) |
| — | — | — | — | 161,417 | 5,276,405 | 2,872,313 | 113,849,943 |
| (429,157) | $(13,939,394) | 244,237 | $9,872,785 | (925,021) | $(7,136,305) | 1,476,972 | $44,308,317 |
| Touchstone Non-US ESG Equity Fund^ | Touchstone Sands Capital Emerging Markets Growth Fund | |||||||
| For the Year Ended March 31, 2023 | For the Year Ended March 31, 2022 | For the Year Ended March 31, 2023 | For the Year Ended March 31, 2022(A) | |||||
| Shares | Dollars | Shares | Dollars | Shares | Dollars | Shares | Dollars | |
| Class A(C) | ||||||||
| Proceeds from Shares issued | 324,540 | $6,648,919 | 432,087 | $11,322,133 | 727,212 | $9,594,478 | 932,246 | $19,378,943 |
| Proceeds from Shares issued in connection with reorganization | — | — | — | — | — | — | — | — |
| Reinvestment of distributions | 1,274,364 | 25,088,883 | 2,136,876 | 52,709,823 | — | — | 18,043 | 338,842 |
| Cost of Shares redeemed | (1,887,005) | (38,297,224) | (1,705,650) | (44,459,413) | (760,944) | (9,905,638) | (650,702) | (13,094,200) |
| Change from Class A Share Transactions | (288,101) | (6,559,422) | 863,313 | 19,572,543 | (33,732) | (311,160) | 299,587 | 6,623,585 |
| Class C | ||||||||
| Proceeds from Shares issued | 11,764 | 217,496 | 19,427 | 516,469 | 65,982 | 866,191 | 247,366 | 5,076,527 |
| Proceeds from Shares issued in connection with reorganization | — | — | — | — | — | — | — | — |
| Reinvestment of distributions | 10,065 | 199,178 | 30,652 | 754,402 | — | — | 5,585 | 103,264 |
| Cost of Shares redeemed | (152,377) | (1,851,951) | (98,401) | (2,672,085) | (181,352) | (2,307,945) | (121,471) | (2,287,859) |
| Change from Class C Share Transactions | (130,548) | (1,435,277) | (48,322) | (1,401,214) | (115,370) | (1,441,754) | 131,480 | 2,891,932 |
| Class Y(D) | ||||||||
| Proceeds from Shares issued | 1,077,190 | 22,970,937 | 1,119,047 | 30,099,850 | 27,441,714 | 368,247,321 | 48,172,669 | 986,485,910 |
| Proceeds from Shares issued in connection with reorganization | — | — | — | — | — | — | — | — |
| Reinvestment of distributions | 314,912 | 6,488,402 | 684,123 | 17,627,865 | — | — | 1,333,117 | 25,169,244 |
| Cost of Shares redeemed | (2,818,208) | (59,019,649) | (2,065,129) | (56,169,100) | (57,040,810) | (754,544,913) | (42,471,629) | (813,009,608) |
| Change from Class Y Share Transactions | (1,426,106) | (29,560,310) | (261,959) | (8,441,385) | (29,599,096) | (386,297,592) | 7,034,157 | 198,645,546 |
| Institutional Class | ||||||||
| Proceeds from Shares issued | 2,540,392 | 52,559,863 | 55,768 | 1,586,151 | 22,896,832 | 306,059,299 | 43,802,336 | 910,162,747 |
| Reinvestment of distributions | 17,720 | 366,206 | 36,893 | 951,899 | — | — | 1,433,905 | 27,215,524 |
| Cost of Shares redeemed | (2,594,322) | (54,030,499) | (176,204) | (4,994,285) | (32,673,214) | (436,893,504) | (99,672,313) | (2,063,656,334) |
| Change from Institutional Class Share Transactions | (36,210) | (1,104,430) | (83,543) | (2,456,235) | (9,776,382) | (130,834,205) | (54,436,072) | (1,126,278,063) |
| Class R6 | ||||||||
| Proceeds from Shares issued | — | — | — | — | 21,261,334 | 288,130,511 | 81,005,724 | 1,661,844,627 |
| Reinvestment of distributions | — | — | — | — | 1,757 | 21,984 | 131,400 | 2,492,653 |
| Cost of Shares redeemed | — | — | — | — | (39,532,909) | (536,918,066) | (11,013,749) | (202,885,847) |
| Change from Class R6 Share Transactions | — | — | — | — | (18,269,818) | (248,765,571) | 70,123,375 | 1,461,451,433 |
| Change from Share Transactions | (1,880,965) | $(38,659,439) | 469,489 | $7,273,709 | (57,794,398) | $(767,650,282) | 23,152,527 | $543,334,433 |
| ^ | The March 31, 2023 and March 31, 2022 Class C share amounts relating to Proceeds from Shares issued, Reinvestment of distributions, Cost of Shares redeemed, and Change from Class C Share Transactions as well as Change from Share transactions were updated to reflect the effect of a 1 for 0.801806 reverse stock split for Class C shares of the Non-US ESG Equity Fund on October 14, 2022 (See Note 9 in the Notes to Financial Statements). |
| (A) | Represents the period from commencement of operations (April 26, 2021) through March 31, 2022 for Class R6. |
| (B) | Represents the period from commencement of operations (July 19, 2021) through March 31, 2022 for Institutional Class. |
| (C) | Effective July 16, 2021, Class B shares of the AIG Strategic Bond Fund were reorganized into Class A shares of the Touchstone Strategic Income Opportunities Fund. |
| (D) | Effective July 16, 2021, Class W shares of the AIG Strategic Bond Fund were reorganized into Class Y shares of the Fund. |
| Touchstone Strategic Income Opportunities Fund | |||
| For the Year Ended March 31, 2023 | For the Year Ended March 31, 2022(B) | ||
| Shares | Dollars | Shares | Dollars |
| 2,958,390 | $9,038,439 | 4,815,857 | $16,755,101 |
| — | — | 26,968,139 | 94,970,590 |
| 1,820,338 | 5,484,016 | 1,239,383 | 4,277,504 |
| (13,275,414) | (40,112,375) | (28,766,399) | (100,196,298) |
| (8,496,686) | (25,589,920) | 4,256,980 | 15,806,897 |
| 160,837 | 495,264 | 394,276 | 1,380,604 |
| — | — | 9,310,842 | 32,869,573 |
| 297,549 | 900,381 | 183,496 | 634,467 |
| (5,189,258) | (15,898,080) | (8,410,971) | (29,216,271) |
| (4,730,872) | (14,502,435) | 1,477,643 | 5,668,373 |
| 2,194,753 | 6,670,411 | 7,611,638 | 26,407,679 |
| — | — | 26,820,573 | 94,266,176 |
| 800,549 | 2,409,677 | 794,450 | 2,740,342 |
| (15,971,682) | (48,014,829) | (42,985,020) | (149,585,379) |
| (12,976,380) | (38,934,741) | (7,758,359) | (26,171,182) |
| 13,071 | 40,000 | 84,145 | 293,419 |
| 3,431 | 10,310 | 1,194 | 4,036 |
| (23,909) | (71,166) | (4,649) | (15,982) |
| (7,407) | (20,856) | 80,690 | 281,473 |
| — | — | — | — |
| — | — | — | — |
| — | — | — | — |
| — | — | — | — |
| (26,211,345) | $(79,047,952) | (6,002,430) | $(18,679,977) |
| Touchstone Flexible Income Fund | ||||||||||||||||||||||||||||
| Period ended | Net asset value at beginning of period | Net investment income | Net realized and unrealized gains (losses) on investments | Total from investment operations | Distributions from net investment income | Distributions from realized capital gains | Total distributions | Net asset value at end of period | Total return(1) | Net assets at end of period (000's) | Ratio of net expenses to average net assets(2) | Ratio of gross expenses to average net assets(3) | Ratio of net investment income (loss) to average net assets | Portfolio turnover rate | ||||||||||||||
| Class A | ||||||||||||||||||||||||||||
| 03/31/19 | $10.81 | $0.39 | $(0.01) | $0.38 | $(0.38) | $ (0.06) | $(0.44) | $10.75 | 3.59% | $110,460 | 1.04% | 1.11% | 3.50% | 171% | ||||||||||||||
| 03/31/20 | 10.75 | 0.34 | (0.68) | (0.34) | (0.36) | — | (0.36) | 10.05 | (3.33) | 99,460 | 1.05 | 1.14 | 3.12 | 136 | ||||||||||||||
| 03/31/21 | 10.05 | 0.41 | 1.16 | 1.57 | (0.41) | (0.10) | (0.51) | 11.11 | 15.72 | 121,317 | 1.04 | 1.09 | 3.79 | 103 | ||||||||||||||
| 03/31/22 | 11.11 | 0.34 | (0.52) | (0.18) | (0.36) | — | (0.36) | 10.57 | (1.76) | 113,880 | 1.09 | 1.11 | 3.05 | 61 | ||||||||||||||
| 03/31/23 | 10.57 | 0.34 | (0.60) | (0.26) | (0.32) | (0.12) | (0.44) | 9.87 | (2.39) | 104,050 | 1.06 | 1.11 | 3.39 | 52 | ||||||||||||||
| Class C | ||||||||||||||||||||||||||||
| 03/31/19 | $10.67 | $0.30 | $(0.01) | $0.29 | $(0.30) | $ (0.06) | $(0.36) | $10.60 | 2.77% | $66,926 | 1.79% | 1.86% | 2.75% | 171% | ||||||||||||||
| 03/31/20 | 10.60 | 0.24 | (0.66) | (0.42) | (0.28) | — | (0.28) | 9.90 | (4.09) | 50,767 | 1.80 | 1.91 | 2.37 | 136 | ||||||||||||||
| 03/31/21 | 9.90 | 0.32 | 1.15 | 1.47 | (0.33) | (0.10) | (0.43) | 10.94 | 14.89 | 44,389 | 1.79 | 1.85 | 3.04 | 103 | ||||||||||||||
| 03/31/22 | 10.94 | 0.25 | (0.51) | (0.26) | (0.28) | — | (0.28) | 10.40 | (2.52) | 37,087 | 1.84 | 1.87 | 2.30 | 61 | ||||||||||||||
| 03/31/23 | 10.40 | 0.26 | (0.60) | (0.34) | (0.24) | (0.12) | (0.36) | 9.70 | (3.16) | 30,158 | 1.81 | 1.88 | 2.64 | 52 | ||||||||||||||
| Class Y | ||||||||||||||||||||||||||||
| 03/31/19 | $10.85 | $0.42 | $(0.02) | $0.40 | $(0.41) | $ (0.06) | $(0.47) | $10.78 | 3.75% | $459,861 | 0.79% | 0.84% | 3.75% | 171% | ||||||||||||||
| 03/31/20 | 10.78 | 0.37 | (0.68) | (0.31) | (0.39) | — | (0.39) | 10.08 | (3.07) | 464,910 | 0.80 | 0.87 | 3.37 | 136 | ||||||||||||||
| 03/31/21 | 10.08 | 0.44 | 1.17 | 1.61 | (0.44) | (0.10) | (0.54) | 11.15 | 16.07 | 587,810 | 0.79 | 0.83 | 4.04 | 103 | ||||||||||||||
| 03/31/22 | 11.15 | 0.36 | (0.53) | (0.17) | (0.38) | — | (0.38) | 10.60 | (1.61) | 661,266 | 0.84 | 0.85 | 3.30 | 61 | ||||||||||||||
| 03/31/23 | 10.60 | 0.36 | (0.60) | (0.24) | (0.34) | (0.12) | (0.46) | 9.90 | (2.14) | 668,604 | 0.81 | 0.85 | 3.64 | 52 | ||||||||||||||
| Institutional Class | ||||||||||||||||||||||||||||
| 03/31/19 | $10.84 | $0.44 | $(0.02) | $0.42 | $(0.42) | $ (0.06) | $(0.48) | $10.78 | 3.95% | $59,138 | 0.69% | 0.82% | 3.85% | 171% | ||||||||||||||
| 03/31/20 | 10.78 | 0.40 | (0.70) | (0.30) | (0.40) | — | (0.40) | 10.08 | (3.02) | 25,798 | 0.70 | 0.88 | 3.47 | 136 | ||||||||||||||
| 03/31/21 | 10.08 | 0.45 | 1.16 | 1.61 | (0.45) | (0.10) | (0.55) | 11.14 | 16.19 | 36,136 | 0.69 | 0.84 | 4.14 | 103 | ||||||||||||||
| 03/31/22 | 11.14 | 0.37 | (0.52) | (0.15) | (0.39) | — | (0.39) | 10.60 | (1.45) | 34,177 | 0.74 | 0.84 | 3.40 | 61 | ||||||||||||||
| 03/31/23 | 10.60 | 0.37 | (0.60) | (0.23) | (0.35) | (0.12) | (0.47) | 9.90 | (2.04) | 35,484 | 0.71 | 0.83 | 3.74 | 52 | ||||||||||||||
| (1) | Total returns shown exclude the effect of applicable sales loads and fees. If these charges were included, the returns would be lower. |
| (2) | The ratio of net expenses to average net assets excluding dividend and interest expense on securities sold short for Class A was 1.04%, 1.04% and 1.04%, for Class C was 1.79%, 1.79% and 1.79%, for Class Y was 0.79%, 0.79% and 0.79% and for Institutional Class was 0.69%, 0.69% and 0.69% for the years ended March 31, 2023, 2022 and 2020, respectively. |
| (3) | The ratio of gross expenses to average net assets excluding dividend and interest expense on securities sold short for Class A was 1.09%, 1.06% and 1.13%, for Class C was 1.86%, 1.82% and 1.90%, for Class Y was 0.83%, 0.80% and 0.86% and for Institutional Class was 0.81%, 0.79% and 0.87% for the years ended March 31, 2023, 2022 and 2020, respectively. |
| Touchstone Focused Fund | ||||||||||||||||||||||||||||
| Period ended | Net asset value at beginning of period | Net investment income (loss)(1) | Net realized and unrealized gains (losses) on investments | Total from investment operations | Distributions from net investment income | Distributions from realized capital gains | Total distributions | Net asset value at end of period | Total return(2) | Net assets at end of period (000's) | Ratio of net expenses to average net assets(3) | Ratio of gross expenses to average net assets(4) | Ratio of net investment income (loss) to average net assets | Portfolio turnover rate | ||||||||||||||
| Class A | ||||||||||||||||||||||||||||
| 03/31/19 | $42.93 | $0.14 | $1.39 | $1.53 | $(0.01) | $ (1.77) | $(1.78) | $42.68 | 3.82% | $55,399 | 1.20% | 1.32% | 0.32% | 12% | ||||||||||||||
| 03/31/20 | 42.68 | 0.14 | (3.56) | (3.42) | (0.10) | (2.71) | (2.81) | 36.45 | (9.14) | 27,889 | 1.20(5) | 1.19 | 0.31 | 13 | ||||||||||||||
| 03/31/21 | 36.45 | (0.02) | 24.92 | 24.90 | — | (2.92) | (2.92) | 58.43 | 69.38 | 48,419 | 1.22 | 1.22 | (0.05) | 18(6) | ||||||||||||||
| 03/31/22 | 58.43 | (0.10) | 5.72 | 5.62 | (0.03) | (3.64) | (3.67) | 60.38 | 9.38 | 53,028 | 1.15 | 1.15 | (0.17) | 14(6) | ||||||||||||||
| 03/31/23 | 60.38 | 0.09 | (4.14) | (4.05) | — | (1.62) | (1.62) | 54.71 | (6.52) | 45,751 | 1.17 | 1.17 | 0.16 | 5(6) | ||||||||||||||
| Class C | ||||||||||||||||||||||||||||
| 03/31/19 | $40.89 | $(0.18) | $1.32 | $1.14 | $— | $ (1.77) | $(1.77) | $40.26 | 3.03% | $33,875 | 1.95% | 1.95% | (0.43)% | 12% | ||||||||||||||
| 03/31/20 | 40.26 | (0.18) | (3.31) | (3.49) | — | (2.71) | (2.71) | 34.06 | (9.80) | 21,961 | 1.95 | 1.98 | (0.44) | 13 | ||||||||||||||
| 03/31/21 | 34.06 | (0.36) | 23.19 | 22.83 | — | (2.92) | (2.92) | 53.97 | 68.10 | 25,241 | 1.96 | 1.96 | (0.79) | 18(6) | ||||||||||||||
| 03/31/22 | 53.97 | (0.53) | 5.30 | 4.77 | — | (3.64) | (3.64) | 55.10 | 8.58 | 20,147 | 1.91 | 1.91 | (0.92) | 14(6) | ||||||||||||||
| 03/31/23 | 55.10 | (0.30) | (3.81) | (4.11) | — | (1.62) | (1.62) | 49.37 | (7.26) | 12,937 | 1.96 | 1.96 | (0.62) | 5(6) | ||||||||||||||
| Class Y | ||||||||||||||||||||||||||||
| 03/31/19 | $43.50 | $0.27 | $1.39 | $1.66 | $(0.27) | $ (1.77) | $(2.04) | $43.12 | 4.13% | $879,704 | 0.91% | 0.91% | 0.61% | 12% | ||||||||||||||
| 03/31/20 | 43.12 | 0.26 | (3.58) | (3.32) | (0.27) | (2.71) | (2.98) | 36.82 | (8.86) | 680,934 | 0.91 | 0.91 | 0.60 | 13 | ||||||||||||||
| 03/31/21 | 36.82 | 0.13 | 25.21 | 25.34 | (0.14) | (2.92) | (3.06) | 59.10 | 69.89 | 1,058,713 | 0.91 | 0.91 | 0.27 | 18(6) | ||||||||||||||
| 03/31/22 | 59.10 | 0.08 | 5.80 | 5.88 | (0.12) | (3.64) | (3.76) | 61.22 | 9.71 | 1,108,883 | 0.86 | 0.86 | 0.12 | 14(6) | ||||||||||||||
| 03/31/23 | 61.22 | 0.25 | (4.21) | (3.96) | (0.06) | (1.62) | (1.68) | 55.58 | (6.26) | 978,944 | 0.88 | 0.88 | 0.45 | 5(6) | ||||||||||||||
| Institutional Class | ||||||||||||||||||||||||||||
| 03/31/19 | $43.68 | $0.30 | $1.39 | $1.69 | $(0.30) | $ (1.77) | $(2.07) | $43.30 | 4.20% | $29,382 | 0.83% | 0.92% | 0.69% | 12% | ||||||||||||||
| 03/31/20 | 43.30 | 0.30 | (3.60) | (3.30) | (0.31) | (2.71) | (3.02) | 36.98 | (8.79) | 15,267 | 0.83 | 0.92 | 0.68 | 13 | ||||||||||||||
| 03/31/21 | 36.98 | 0.16 | 25.33 | 25.49 | (0.17) | (2.92) | (3.09) | 59.38 | 70.00 | 15,323 | 0.85 | 0.94 | 0.32 | 18(6) | ||||||||||||||
| 03/31/22 | 59.38 | 0.09 | 5.84 | 5.93 | (0.13) | (3.64) | (3.77) | 61.54 | 9.75 | 18,825 | 0.84 | 0.88 | 0.15 | 14(6) | ||||||||||||||
| 03/31/23 | 61.54 | 0.27 | (4.22) | (3.95) | (0.07) | (1.62) | (1.69) | 55.90 | (6.21) | 21,145 | 0.84 | 0.91 | 0.50 | 5(6) | ||||||||||||||
| (1) | The net investment income (loss) per share was based on average shares outstanding for the period. |
| (2) | Total returns shown exclude the effect of applicable sales loads and fees. If these charges were included, the returns would be lower. |
| (3) | The ratio of net expenses to average net assets excluding liquidity provider expenses for Class A was 1.16%, 1.14% and 1.20% and for Class C was 1.95%, 1.90% and 1.94%, for Class Y was 0.87%, 0.85% and 0.89% and for Institutional Class was 0.83%, 0.83% and 0.83% for the years ended March 31, 2023, 2022 and 2021, respectively. |
| (4) | The ratio of gross expenses to average net assets excluding liquidity provider expenses for Class A was 1.16%, 1.14% and 1.20% and for Class C was 1.95%, 1.90% and 1.94%, for Class Y was 0.87%, 0.85% and 0.89% and for Institutional Class was 0.90%, 0.87% and 0.92%for the years ended March 31, 2023, 2022 and 2021, respectively. |
| (5) | Net expenses include amounts recouped by the Adviser. |
| (6) | Portfolio turnover excludes securities delivered from processing redemptions-in-kind. |
| Touchstone Growth Opportunities Fund | ||||||||||||||||||||||||||||
| Period ended | Net asset value at beginning of period | Net investment income (loss) | Net realized and unrealized gains (losses) on investments | Total from investment operations | Distributions from net investment income | Distributions from realized capital gains | Total distributions | Net asset value at end of period | Total return(1) | Net assets at end of period (000's) | Ratio of net expenses to average net assets(2) | Ratio of gross expenses to average net assets(3) | Ratio of net investment income (loss) to average net assets | Portfolio turnover rate | ||||||||||||||
| Class A | ||||||||||||||||||||||||||||
| 03/31/19 | $32.79 | $(0.05) | $3.10 | $3.05 | $— | $ (3.13) | $(3.13) | $32.71 | 10.40% | $42,404 | 1.24% | 1.37% | (0.17)% | 94%(4) | ||||||||||||||
| 03/31/20 | 32.71 | (0.04) | 0.99 | 0.95 | — | (5.72) | (5.72) | 27.94 | 0.63 | 37,150 | 1.25 | 1.41 | (0.12) | 101(4) | ||||||||||||||
| 03/31/21 | 27.94 | (0.20) | 17.44 | 17.24 | — | (4.11) | (4.11) | 41.07 | 62.56 | 56,877 | 1.24 | 1.34 | (0.55) | 65 | ||||||||||||||
| 03/31/22 | 41.07 | (0.21)(5) | 4.97 | 4.76 | — | (7.19) | (7.19) | 38.64 | 10.48 | 61,006 | 1.25 | 1.31 | (0.48) | 47(4) | ||||||||||||||
| 03/31/23 | 38.64 | (0.09)(5) | (4.39) | (4.48) | —(6) | (0.69) | (0.69) | 33.47 | (11.34) | 48,229 | 1.26 | 1.37 | (0.27) | 55(4) | ||||||||||||||
| Class C | ||||||||||||||||||||||||||||
| 03/31/19^ | $40.37 | $(0.73) | $4.05 | $3.32 | $— | $ (4.67) | $(4.67) | $39.02 | 9.54% | $3,863 | 1.99% | 2.32% | (0.92)% | 94%(4) | ||||||||||||||
| 03/31/20^ | 39.02 | (0.34) | 1.43 | 1.09 | — | (8.53) | (8.53) | 31.58 | (0.09) | 2,724 | 2.00 | 2.61 | (0.87) | 101(4) | ||||||||||||||
| 03/31/21^ | 31.58 | (1.15) | 20.17 | 19.02 | — | (6.13) | (6.13) | 44.47 | 61.29 | 1,853 | 1.99 | 2.70 | (1.30) | 65 | ||||||||||||||
| 03/31/22^ | 44.47 | (0.57)(5) | 5.57 | 5.00 | — | (10.72) | (10.72) | 38.75 | 9.64 | 1,769 | 2.00 | 2.64 | (1.23) | 47(4) | ||||||||||||||
| 03/31/23^ | 38.75 | (0.26)(5) | (4.48) | (4.74) | — | (0.69) | (0.69) | 33.32 | (11.99) | 1,485 | 2.01 | 2.86 | (1.02) | 55(4) | ||||||||||||||
| Class Y | ||||||||||||||||||||||||||||
| 03/31/19 | $33.69 | $0.03 | $3.19 | $3.22 | $— | $ (3.13) | $(3.13) | $33.78 | 10.67% | $43,703 | 0.99% | 1.08% | 0.08% | 94%(4) | ||||||||||||||
| 03/31/20 | 33.78 | 0.04 | 1.01 | 1.05 | — | (5.72) | (5.72) | 29.11 | 0.92 | 26,610 | 1.00 | 1.14 | 0.13 | 101(4) | ||||||||||||||
| 03/31/21 | 29.11 | (0.12) | 18.20 | 18.08 | — | (4.11) | (4.11) | 43.08 | 62.93 | 30,742 | 0.99 | 1.13 | (0.30) | 65 | ||||||||||||||
| 03/31/22 | 43.08 | (0.11)(5) | 5.19 | 5.08 | — | (7.19) | (7.19) | 40.97 | 10.75 | 25,851 | 1.00 | 1.10 | (0.23) | 47(4) | ||||||||||||||
| 03/31/23 | 40.97 | (0.01)(5) | (4.65) | (4.66) | (0.07) | (0.69) | (0.76) | 35.55 | (11.13) | 26,581 | 1.01 | 1.15 | (0.02) | 55(4) | ||||||||||||||
| Institutional Class | ||||||||||||||||||||||||||||
| 03/31/19 | $34.08 | $0.09 | $3.21 | $3.30 | $(0.03) | $ (3.13) | $(3.16) | $34.22 | 10.79% | $71,406 | 0.89% | 1.01% | 0.18% | 94%(4) | ||||||||||||||
| 03/31/20 | 34.22 | 0.06 | 1.02 | 1.08 | — | (5.72) | (5.72) | 29.58 | 1.00 | 96,361 | 0.90 | 1.05 | 0.23 | 101(4) | ||||||||||||||
| 03/31/21 | 29.58 | (0.06) | 18.49 | 18.43 | — | (4.11) | (4.11) | 43.90 | 63.13 | 71,461 | 0.89 | 1.03 | (0.20) | 65 | ||||||||||||||
| 03/31/22 | 43.90 | (0.06)(5) | 5.27 | 5.21 | — | (7.19) | (7.19) | 41.92 | 10.84 | 73,624 | 0.90 | 1.02 | (0.13) | 47(4) | ||||||||||||||
| 03/31/23 | 41.92 | 0.03(5) | (4.76) | (4.73) | (0.10) | (0.69) | (0.79) | 36.40 | (11.02) | 49,939 | 0.91 | 1.06 | 0.08 | 55(4) | ||||||||||||||
| ^ | Updated to reflect the effect of a 1 for 0.670946 reverse stock split for Class C shares on October 14, 2022. All historical per share information has been retroactively adjusted to reflect this reverse stock split. |
| (1) | Total returns shown exclude the effect of applicable sales loads and fees. If these charges were included, the returns would be lower. |
| (2) | The ratio of net expenses to average net assets excluding liquidity provider expenses for Class A was 1.24%, 1.24% and 1.24%, for Class C was 1.99%, 1.99% and 1.99%, for Class Y was 0.99%, 0.99% and 0.99% and for Institutional Class was 0.89%, 0.89% and 0.89% for the years ended March 31, 2023, 2022 and 2020, respectively. |
| (3) | The ratio of gross expenses to average net assets excluding liquidity provider expenses for Class A was 1.35%, 1.30% and 1.40%, for Class C was 2.84%, 2.63% and 2.60%, for Class Y was 1.13%,1.09% and 1.13% and for Institutional Class was 1.04% 1.01% and 1.04% for the years ended March 31, 2023, 2022 and 2020, respectively. |
| (4) | Portfolio turnover excludes securities delivered from processing redemptions-in-kind. |
| (5) | The net investment income (loss) per share was based on average shares outstanding for the period. |
| (6) | Less than $0.005 per share. |
| Touchstone Mid Cap Growth Fund | ||||||||||||||||||||||||||||
| Period ended | Net asset value at beginning of period | Net investment income (loss) | Net realized and unrealized gains (losses) on investments | Total from investment operations | Distributions from net investment income | Distributions from realized capital gains | Total distributions | Net asset value at end of period | Total return(1) | Net assets at end of period (000's) | Ratio of net expenses to average net assets(2) | Ratio of gross expenses to average net assets(3) | Ratio of net investment income (loss) to average net assets | Portfolio turnover rate | ||||||||||||||
| Class A | ||||||||||||||||||||||||||||
| 03/31/19 | $28.05 | $(0.09) | $3.36 | $3.27 | $— | $ (2.06) | $(2.06) | $29.26 | 12.77% | $262,492 | 1.27% | 1.27% | (0.35)% | 71% | ||||||||||||||
| 03/31/20 | 29.26 | (0.07) | (2.06) | (2.13) | (0.01) | (2.23) | (2.24) | 24.89 | (8.78) | 234,307 | 1.25 | 1.25 | (0.24) | 82 | ||||||||||||||
| 03/31/21 | 24.89 | (0.28) | 15.64 | 15.36 | — | (2.54) | (2.54) | 37.71 | 61.98 | 322,432 | 1.23 | 1.23 | (0.75) | 65(4) | ||||||||||||||
| 03/31/22 | 37.71 | (0.26)(5) | 3.44 | 3.18 | — | (6.37) | (6.37) | 34.52 | 7.43 | 299,763 | 1.21 | 1.21 | (0.65) | 60(4) | ||||||||||||||
| 03/31/23 | 34.52 | (0.09)(5) | (4.56) | (4.65) | — | (0.73) | (0.73) | 29.14 | (13.36) | 234,325 | 1.26 | 1.26 | (0.31) | 56(4) | ||||||||||||||
| Class C | ||||||||||||||||||||||||||||
| 03/31/19^ | $39.14 | $(1.05) | $5.06 | $4.01 | $— | $ (4.41) | $(4.41) | $38.74 | 11.91% | $32,831 | 2.04% | 2.04% | (1.12)% | 71% | ||||||||||||||
| 03/31/20^ | 38.74 | (0.69) | (2.08) | (2.77) | — | (4.78) | (4.78) | 31.19 | (9.55) | 20,918 | 2.07 | 2.07 | (1.06) | 82 | ||||||||||||||
| 03/31/21^ | 31.19 | (1.67) | 20.46 | 18.79 | — | (5.44) | (5.44) | 44.54 | 60.65 | 18,939 | 2.07 | 2.07 | (1.59) | 65(4) | ||||||||||||||
| 03/31/22^ | 44.54 | (0.64)(5) | 4.39 | 3.75 | — | (13.65) | (13.65) | 34.64 | 6.53 | 17,918 | 2.04 | 2.04 | (1.48) | 60(4) | ||||||||||||||
| 03/31/23^ | 34.64 | (0.20)(5) | (4.71) | (4.91) | — | (0.73) | (0.73) | 29.00 | (14.07) | 13,709 | 2.10 | 2.10 | (1.15) | 56(4) | ||||||||||||||
| Class Y | ||||||||||||||||||||||||||||
| 03/31/19 | $29.07 | $(0.03) | $3.52 | $3.49 | $— | $ (2.06) | $(2.06) | $30.50 | 13.05% | $452,407 | 1.02% | 1.02% | (0.10)% | 71% | ||||||||||||||
| 03/31/20 | 30.50 | (—)(6) | (2.17) | (2.17) | (0.06) | (2.23) | (2.29) | 26.04 | (8.58) | 424,403 | 1.01 | 1.01 | (—)(6) | 82 | ||||||||||||||
| 03/31/21 | 26.04 | (0.18) | 16.36 | 16.18 | — | (2.54) | (2.54) | 39.68 | 62.40 | 641,218 | 0.99 | 0.99 | (0.52) | 65(4) | ||||||||||||||
| 03/31/22 | 39.68 | (0.18)(5) | 3.59 | 3.41 | — | (6.37) | (6.37) | 36.72 | 7.65 | 657,182 | 0.99 | 0.99 | (0.43) | 60(4) | ||||||||||||||
| 03/31/23 | 36.72 | (0.02)(5) | (4.84) | (4.86) | — | (0.73) | (0.73) | 31.13 | (13.15) | 548,507 | 1.03 | 1.03 | (0.07) | 56(4) | ||||||||||||||
| Institutional Class | ||||||||||||||||||||||||||||
| 03/31/19 | $29.32 | $(0.01) | $3.54 | $3.53 | $— | $ (2.06) | $(2.06) | $30.79 | 13.10% | $349,865 | 0.97%(7) | 0.97% | (0.06)% | 71% | ||||||||||||||
| 03/31/20 | 30.79 | 0.01 | (2.18) | (2.17) | (0.07) | (2.23) | (2.30) | 26.32 | (8.49) | 357,769 | 0.94 | 0.94 | 0.06 | 82 | ||||||||||||||
| 03/31/21 | 26.32 | (0.20) | 16.58 | 16.38 | — | (2.54) | (2.54) | 40.16 | 62.50 | 381,463 | 0.91 | 0.92 | (0.44) | 65(4) | ||||||||||||||
| 03/31/22 | 40.16 | (0.14)(5) | 3.64 | 3.50 | — | (6.37) | (6.37) | 37.29 | 7.79 | 229,028 | 0.88 | 0.91 | (0.32) | 60(4) | ||||||||||||||
| 03/31/23 | 37.29 | 0.02(5) | (4.92) | (4.90) | — | (0.73) | (0.73) | 31.66 | (13.03) | 209,280 | 0.88 | 0.96 | 0.07 | 56(4) | ||||||||||||||
| Class R6 | ||||||||||||||||||||||||||||
| 03/31/20(8) | $35.72(9) | $(—)(6) | $(9.40) | $(9.40) | $— | $ — | $— | $26.32 | (26.32)%(10) | $2 | 0.89%(11) | 1,279.20%(11) | (0.02)%(11) | 82% | ||||||||||||||
| 03/31/21 | 26.32 | (0.11) | 16.51 | 16.40 | — | (2.54) | (2.54) | 40.18 | 62.58 | 4,603 | 0.85 | 1.47 | (0.37) | 65(4) | ||||||||||||||
| 03/31/22 | 40.18 | (0.09)(5) | 3.63 | 3.54 | — | (6.37) | (6.37) | 37.35 | 7.89 | 111,561 | 0.79 | 0.88 | (0.23) | 60(4) | ||||||||||||||
| 03/31/23 | 37.35 | 0.05(5) | (4.92) | (4.87) | — | (0.73) | (0.73) | 31.75 | (12.93) | 99,956 | 0.79 | 0.91 | 0.16 | 56(4) | ||||||||||||||
| ^ | Updated to reflect the effect of a 1 for 0.466797 reverse stock split for Class C shares on October 14, 2022. All historical per share information has been retroactively adjusted to reflect this reverse stock split. |
| (1) | Total returns shown exclude the effect of applicable sales loads and fees. If these charges were included, the returns would be lower. |
| (2) | The ratio of net expenses to average net assets excluding liquidity provider expenses for Class A were 1.24%, 1.19% and 1.22%, for Class C were 2.08%, 2.02% and 2.06%, for Class Y were 1.01%, 0.97% and 0.98% and for Institutional Class were 0.86%, 0.86% and 0.90% for Class R6 were 0.77%, 0.77% and 0.84%, for the years ended March 31, 2023, 2022 and 2021. |
| (3) | The ratio of gross expenses to average net assets excluding liquidity provider expenses for Class A were 1.24%, 1.19% and 1.22%, for Class C were 2.08%, 2.02% and 2.06%, for Class Y were 1.01%, 0.97% and 0.98% and for Institutional Class were 0.94%, 0.89% and 0.91%, for Class R6 were 0.89%, 0.86% and 1.46% for the years ended March 31, 2023, 2022 and 2021. |
| (4) | Portfolio turnover excludes securities delivered from processing redemptions-in-kind. |
| (5) | The net investment income (loss) per share was based on average shares outstanding for the period. |
| (6) | Less than $0.005 per share or 0.005%. |
| (7) | Net expenses include amounts recouped by the Adviser. |
| (8) | Represents the period from commencement of operations (February 10, 2020) through March 31, 2020. |
| (9) | Net asset value at the beginning of period is based on the net asset value of Institutional Class shares on February 10, 2020. |
| (10) | Not annualized. |
| (11) | Annualized. |
| Touchstone Non-US ESG Equity Fund | ||||||||||||||||||||||||||||
| Period ended | Net asset value at beginning of period | Net investment income (loss) | Net realized and unrealized gains (losses) on investments | Total from investment operations | Distributions from net investment income | Distributions from realized capital gains | Total distributions | Net asset value at end of period | Total return(1) | Net assets at end of period (000's) | Ratio of net expenses to average net assets(2) | Ratio of gross expenses to average net assets(3) | Ratio of net investment income (loss) to average net assets | Portfolio turnover rate | ||||||||||||||
| Class A | ||||||||||||||||||||||||||||
| 03/31/19 | $22.01 | $0.15 | $(0.29) | $(0.14) | $(0.17) | $ (1.76) | $(1.93) | $19.94 | (0.37)% | $445,608 | 1.17% | 1.17% | 0.70% | 40% | ||||||||||||||
| 03/31/20 | 19.94 | 0.17(4) | (2.78) | (2.61) | (0.15) | (0.34) | (0.49) | 16.84 | 13.61 | 347,021 | 1.17 | 1.18 | 0.84 | 60 | ||||||||||||||
| 03/31/21 | 16.84 | 0.14(4) | 9.26 | 9.40 | (0.08) | — | (0.08) | 26.16 | 55.86 | 496,574 | 1.12 | 1.12 | 0.63 | 62 | ||||||||||||||
| 03/31/22 | 26.16 | 0.18 | (0.27) | (0.09) | (0.23) | (2.78) | (3.01) | 23.06 | (0.98) | 457,750 | 1.09 | 1.09 | 0.74 | 32 | ||||||||||||||
| 03/31/23 | 23.06 | 0.29 | (1.19) | (0.90) | (0.26) | (1.12) | (1.38) | 20.78 | (3.50) | 406,506 | 1.18 | 1.18 | 1.45 | 110(5) | ||||||||||||||
| Class C | ||||||||||||||||||||||||||||
| 03/31/19^ | $23.30 | $(0.07) | $(0.26) | $(0.33) | $— | $ (2.20) | $(2.20) | $20.77 | (1.18)% | $14,926 | 1.99% | 2.03% | (0.12)% | 40% | ||||||||||||||
| 03/31/20^ | 20.77 | —(4)(6) | (2.88) | (2.88) | (0.05) | (0.42) | (0.47) | 17.42 | (14.34) | 8,099 | 1.99 | 2.14 | 0.02 | 60 | ||||||||||||||
| 03/31/21^ | 17.42 | (0.05)(4) | 9.56 | 9.51 | — | — | — | 26.93 | 54.55 | 7,782 | 1.99 | 2.14 | (0.24) | 62 | ||||||||||||||
| 03/31/22^ | 26.93 | (0.04) | (0.25) | (0.29) | (0.05) | (3.47) | (3.52) | 23.13 | (1.85) | 5,565 | 1.99 | 2.10 | (0.16) | 32 | ||||||||||||||
| 03/31/23^ | 23.13 | 0.19 | (1.25) | (1.06) | — | (1.12) | (1.12) | 20.95 | (4.26) | 3,553 | 1.99 | 2.29 | 0.64 | 110(5) | ||||||||||||||
| Class Y | ||||||||||||||||||||||||||||
| 03/31/19 | $22.75 | $0.21 | $(0.31) | $(0.10) | $(0.23) | $ (1.76) | $(1.99) | $20.66 | (0.09)% | $207,080 | 0.90% | 0.93% | 0.97% | 40% | ||||||||||||||
| 03/31/20 | 20.66 | 0.24(4) | (2.88) | (2.64) | (0.20) | (0.34) | (0.54) | 17.48 | (13.37) | 136,239 | 0.90 | 0.94 | 1.11 | 60 | ||||||||||||||
| 03/31/21 | 17.48 | 0.20(4) | 9.62 | 9.82 | (0.14) | — | (0.14) | 27.16 | 56.22 | 182,806 | 0.90 | 0.93 | 0.85 | 62 | ||||||||||||||
| 03/31/22 | 27.16 | 0.25 | (0.28) | (0.03) | (0.28) | (2.78) | (3.06) | 24.07 | (0.74) | 155,664 | 0.90 | 0.90 | 0.93 | 32 | ||||||||||||||
| 03/31/23 | 24.07 | 0.42 | (1.31) | (0.89) | (0.30) | (1.12) | (1.42) | 21.76 | (3.27) | 109,722 | 0.92 | 0.95 | 1.71 | 110(5) | ||||||||||||||
| Institutional Class | ||||||||||||||||||||||||||||
| 03/31/19 | $22.77 | $0.22 | $(0.32) | $(0.10) | $(0.23) | $ (1.76) | $(1.99) | $20.68 | (0.10)% | $44,382 | 0.89% | 0.93% | 0.98% | 40% | ||||||||||||||
| 03/31/20 | 20.68 | 0.24(4) | (2.88) | (2.64) | (0.20) | (0.34) | (0.54) | 17.50 | (13.35) | 21,739 | 0.89 | 0.95 | 1.12 | 60 | ||||||||||||||
| 03/31/21 | 17.50 | 0.19(4) | 9.64 | 9.83 | (0.13) | — | (0.13) | 27.20 | 56.21 | 13,271 | 0.89 | 0.97 | 0.86 | 62 | ||||||||||||||
| 03/31/22 | 27.20 | 0.29 | (0.32) | (0.03) | (0.28) | (2.78) | (3.06) | 24.11 | (0.74) | 9,747 | 0.89 | 0.94 | 0.94 | 32 | ||||||||||||||
| 03/31/23 | 24.11 | 0.24 | (1.14) | (0.90) | (0.31) | (1.12) | (1.43) | 21.78 | (3.31) | 8,018 | 0.91 | 1.01 | 1.72 | 110(5) | ||||||||||||||
| ^ | Updated to reflect the effect of a 1 for 0.801806 reverse stock split for Class C shares on October 14, 2022. All historical per share information has been retroactively adjusted to reflect this reverse stock split. |
| (1) | Total returns shown exclude the effect of applicable sales loads and fees. If these charges were included, the returns would be lower. |
| (2) | The ratio of net expenses to average net assets excluding liquidity provider expenses for Class A was 1.16%, for Class C was 1.97%, for Class Y was 0.90% and for Institutional Class was 0.89% for the year ended March 31, 2023. |
| (3) | The ratio of gross expenses to average net assets excluding liquidity provider expenses for Class A was 1.16%, for Class C was 2.27%, for Class Y was 0.93% and for Institutional Class was 0.99% for the year ended March 31, 2023. |
| (4) | The net investment income (loss) per share was based on average shares outstanding for the period. |
| (5) | Portfolio turnover excludes securities delivered from processing redemptions-in-kind. |
| (6) | Less than $0.005 per share. |
| Touchstone Sands Capital Emerging Markets Growth Fund | ||||||||||||||||||||||||||
| Period ended | Net asset value at beginning of period | Net investment income (loss) | Net realized and unrealized gains (losses) on investments | Total from investment operations | Distributions from net investment income | Total distributions | Net asset value at end of period | Total return(1) | Net assets at end of period (000's) | Ratio of net expenses to average net assets | Ratio of gross expenses to average net assets | Ratio of net investment income (loss) to average net assets | Portfolio turnover rate | |||||||||||||
| Class A | ||||||||||||||||||||||||||
| 03/31/19(2) | $11.21(3) | $(0.01) | $1.95 | $1.94 | $— | $— | $13.15 | 17.31%(4) | $1,349 | 1.60%(5) | 4.89%(5) | (0.94)%(5) | 31% | |||||||||||||
| 03/31/20 | 13.15 | 0.05(6) | (1.77) | (1.72) | (0.07) | (0.07) | 11.36 | (13.19) | 2,897 | 1.60 | 2.62 | 0.35 | 20 | |||||||||||||
| 03/31/21 | 11.36 | (0.13) | 10.02 | 9.89 | — | — | 21.25 | 87.06 | 20,369 | 1.60 | 1.77 | (1.22) | 27 | |||||||||||||
| 03/31/22 | 21.25 | (0.21) | (5.07) | (5.28) | (0.32) | (0.32) | 15.65 | (25.16) | 19,694 | 1.60 | 1.60 | (1.03) | 28(7) | |||||||||||||
| 03/31/23 | 15.65 | (0.07)(6) | (2.35) | (2.42) | — | — | 13.23 | (15.35) | 16,203 | 1.60 | 1.65 | (0.50) | 30(7) | |||||||||||||
| Class C | ||||||||||||||||||||||||||
| 03/31/19(2) | $11.21(3) | $(0.04) | $1.94 | $1.90 | $— | $— | $13.11 | 16.95%(4) | $59 | 2.35%(5) | 57.88%(5) | (1.69)%(5) | 31% | |||||||||||||
| 03/31/20 | 13.11 | (0.05)(6) | (1.75) | (1.80) | (0.05) | (0.05) | 11.26 | (13.81) | 1,135 | 2.35 | 5.24 | (0.40) | 20 | |||||||||||||
| 03/31/21 | 11.26 | (0.14) | 9.79 | 9.65 | — | — | 20.91 | 85.70 | 9,637 | 2.35 | 2.82 | (1.97) | 27 | |||||||||||||
| 03/31/22 | 20.91 | (0.35) | (4.99) | (5.34) | (0.20) | (0.20) | 15.37 | (25.69) | 9,107 | 2.35 | 2.46 | (1.78) | 28(7) | |||||||||||||
| 03/31/23 | 15.37 | (0.16)(6) | (2.31) | (2.47) | — | — | 12.90 | (16.07) | 6,154 | 2.35 | 2.56 | (1.25) | 30(7) | |||||||||||||
| Class Y | ||||||||||||||||||||||||||
| 03/31/19 | $13.56 | $(0.03) | $(0.37) | $(0.40) | $— | $— | $13.16 | (3.02)% | $318,093 | 1.35%(8) | 1.35% | (0.45)% | 31% | |||||||||||||
| 03/31/20 | 13.16 | 0.08(6) | (1.77) | (1.69) | (0.09) | (0.09) | 11.38 | (12.96) | 423,992 | 1.33(8) | 1.31 | 0.62 | 20 | |||||||||||||
| 03/31/21 | 11.38 | (0.11) | 10.09 | 9.98 | — | — | 21.36 | 87.71 | 1,460,473 | 1.26 | 1.26 | (0.88) | 27 | |||||||||||||
| 03/31/22 | 21.36 | (0.17) | (5.08) | (5.25) | (0.37) | (0.37) | 15.74 | (24.89) | 1,186,957 | 1.29 | 1.29 | (0.71) | 28(7) | |||||||||||||
| 03/31/23 | 15.74 | (0.03)(6) | (2.36) | (2.39) | — | — | 13.35 | (15.13) | 611,637 | 1.29 | 1.29 | (0.19) | 30(7) | |||||||||||||
| Institutional Class | ||||||||||||||||||||||||||
| 03/31/19 | $13.61 | $(0.03) | $(0.37) | $(0.40) | $— | $— | $13.21 | (2.94)% | $524,670 | 1.25% | 1.27% | (0.35)% | 31% | |||||||||||||
| 03/31/20 | 13.21 | 0.09(6) | (1.77) | (1.68) | (0.10) | (0.10) | 11.43 | (12.87) | 883,508 | 1.25(8) | 1.24 | 0.70 | 20 | |||||||||||||
| 03/31/21 | 11.43 | (0.11) | 10.15 | 10.04 | — | — | 21.47 | 87.79 | 2,867,373 | 1.21(8) | 1.20 | (0.83) | 27 | |||||||||||||
| 03/31/22 | 21.47 | (0.29) | (4.97) | (5.26) | (0.38) | (0.38) | 15.83 | (24.81) | 1,252,461 | 1.20 | 1.20 | (0.62) | 28(7) | |||||||||||||
| 03/31/23 | 15.83 | (0.02)(6) | (2.38) | (2.40) | — | — | 13.43 | (15.11) | 931,523 | 1.23 | 1.23 | (0.13) | 30(7) | |||||||||||||
| Class R6 | ||||||||||||||||||||||||||
| 03/31/22(9) | $22.37 | $0.15 | $(6.31) | $(6.16) | $(0.38) | $(0.38) | $15.83 | (27.85)%(4) | $1,109,805 | 1.17%(5) | 1.17%(5) | (0.59)%(5) | 28%(7) | |||||||||||||
| 03/31/23 | 15.83 | (0.01)(6) | (2.39) | (2.40) | — (10) | — (10) | 13.43 | (15.03) | 696,638 | 1.18 | 1.18 | (0.08) | 30(7) | |||||||||||||
| (1) | Total returns shown exclude the effect of applicable sales loads and fees. If these charges were included, the returns would be lower. |
| (2) | Represents the period from commencement of operations (November 16, 2018) through March 31, 2019. |
| (3) | Net asset value at the beginning of period is based on the net asset value of Class Y shares on November 16, 2018. |
| (4) | Not annualized. |
| (5) | Annualized. |
| (6) | The net investment income (loss) per share was based on average shares outstanding for the period. |
| (7) | Portfolio turnover excludes securities delivered from processing redemptions-in-kind. |
| (8) | Net expenses include amounts recouped by the Adviser. |
| (9) | Represents the period from commencement of operations (April 26, 2021) through March 31, 2022. |
| (10) | Less than $0.005 per share. |
| Touchstone Strategic Income Opportunities Fund | ||||||||||||||||||||||||||||
| Period ended | Net asset value at beginning of period | Net investment income(1) | Net realized and unrealized gains (losses) on investments | Total from investment operations | Distributions from net investment income | Return of capital | Total distributions | Net asset value at end of period | Total return(2) | Net assets at end of period (000's) | Ratio of net expenses to average net assets | Ratio of gross expenses to average net assets | Ratio of net investment income (loss) to average net assets | Portfolio turnover rate | ||||||||||||||
| Class A | ||||||||||||||||||||||||||||
| 03/31/19 | $3.38 | $0.13 | $(0.04) | $0.09 | $(0.16) | $ — | $(0.16) | $3.31 | 2.86% | $153,979 | 1.14% | 1.37% | 3.89% | 123% | ||||||||||||||
| 03/31/20 | 3.31 | 0.11 | (0.15) | (0.04) | (0.12) | — | (0.12) | 3.15 | (1.37) | 143,815 | 1.10 | 1.37 | 3.14 | 85 | ||||||||||||||
| 03/31/21 | 3.15 | 0.10 | 0.33 | 0.43 | (0.11) | — | (0.11) | 3.47 | 13.87 | 173,600 | 1.10 | 1.37 | 2.91 | 111 | ||||||||||||||
| 03/31/22 | 3.47 | 0.08 | (0.19) | (0.11) | (0.09) | — | (0.09) | 3.27 | (3.22) | 177,574 | 1.03 | 1.14 | 2.38 | 155(3) | ||||||||||||||
| 03/31/23 | 3.27 | 0.12 | (0.24) | (0.12) | (0.12) | (0.01) | (0.13) | 3.02 | (3.44) | 138,096 | 1.00 | 1.12 | 4.01 | 78 | ||||||||||||||
| Class C | ||||||||||||||||||||||||||||
| 03/31/19 | $3.39 | $0.11 | $(0.04) | $0.07 | $(0.14) | $ — | $(0.14) | $3.32 | 2.18% | $52,782 | 1.81% | 2.04% | 3.22% | 123% | ||||||||||||||
| 03/31/20 | 3.32 | 0.08 | (0.14) | (0.06) | (0.10) | — | (0.10) | 3.16 | (2.04) | 49,730 | 1.78 | 2.05 | 2.47 | 85 | ||||||||||||||
| 03/31/21 | 3.16 | 0.08 | 0.33 | 0.41 | (0.09) | — | (0.09) | 3.48 | 13.11 | 39,402 | 1.78 | 2.05 | 2.26 | 111 | ||||||||||||||
| 03/31/22 | 3.48 | 0.06 | (0.20) | (0.14) | (0.06) | — | (0.06) | 3.28 | (4.03) | 42,046 | 1.74 | 1.88 | 1.62 | 155(3) | ||||||||||||||
| 03/31/23 | 3.28 | 0.10 | (0.24) | (0.14) | (0.11) | — (4) | (0.11) | 3.03 | (4.12) | 24,451 | 1.71 | 1.90 | 3.30 | 78 | ||||||||||||||
| Class Y | ||||||||||||||||||||||||||||
| 03/31/19 | $3.37 | $0.14 | $(0.03) | $0.11 | $(0.17) | $ — | $(0.17) | $3.31 | 3.38% | $52,676 | 0.94% | 1.17% | 4.06% | 123% | ||||||||||||||
| 03/31/20 | 3.31 | 0.11 | (0.14) | (0.03) | (0.13) | — | (0.13) | 3.15 | (1.16) | 89,806 | 0.91 | 1.18 | 3.28 | 85 | ||||||||||||||
| 03/31/21 | 3.15 | 0.10 | 0.33 | 0.43 | (0.12) | — | (0.12) | 3.46 | 13.77 | 140,047 | 0.90 | 1.17 | 3.08 | 111 | ||||||||||||||
| 03/31/22(5) | 3.46 | 0.09 | (0.19) | (0.10) | (0.10) | — | (0.10) | 3.26 | (2.97) | 106,650 | 0.79 | 0.91 | 2.62 | 155(3) | ||||||||||||||
| 03/31/23 | 3.26 | 0.13 | (0.24) | (0.11) | (0.13) | (0.01) | (0.14) | 3.01 | (3.19) | 59,269 | 0.75 | 0.87 | 4.26 | 78 | ||||||||||||||
| Institutional Class | ||||||||||||||||||||||||||||
| 03/31/22(6) | $3.50 | $0.06 | $(0.23) | $(0.17) | $(0.07) | $ — | $(0.07) | $3.26 | (4.94)%(7) | $263 | 0.65%(8) | 3.91%(8) | 2.56%(8) | 155%(3) | ||||||||||||||
| 03/31/23 | 3.26 | 0.13 | (0.24) | (0.11) | (0.14) | (0.01) | (0.15) | 3.00 | (3.35) | 220 | 0.65 | 3.89 | 4.36 | 78 | ||||||||||||||
| (1) | The net investment income per share was based on average shares outstanding for the period. |
| (2) | Total returns shown exclude the effect of applicable sales loads and fees. If these charges were included, the returns would be lower. |
| (3) | Portfolio turnover excludes the purchases and sales of securities of the AIG Flexible Credit Fund acquired on July 16, 2021. If these transactions were included, portfolio turnover would have been higher. |
| (4) | Less than $0.005 per share. |
| (5) | Effective July 16, 2021, Class W shares of the AIG Strategic Bond Fund were reorganized into Class Y shares of the Fund. |
| (6) | Represents the period from commencement of operations (July 19, 2021) through March 31, 2022 for Institutional Class. |
| (7) | Not annualized. |
| (8) | Annualized. |
| Touchstone Flexible Income Fund ("Flexible Income Fund”) |
| Touchstone Focused Fund ("Focused Fund”) |
| Touchstone Growth Opportunities Fund ("Growth Opportunities Fund”) |
| Touchstone Mid Cap Growth Fund ("Mid Cap Growth Fund”) |
| Touchstone Non-US ESG Equity Fund (formerly Touchstone Global ESG Equity Fund) ("Non-US ESG Equity Fund”) |
| Touchstone Sands Capital Emerging Markets Growth Fund ("Sands Capital Emerging Markets Growth Fund”) |
| Touchstone Strategic Income Opportunities Fund ("Strategic Income Opportunities Fund”) |
| Class A | Class C | Class Y | Institutional Class | Class R6 | |
| Flexible Income Fund | X | X | X | X | |
| Focused Fund | X | X | X | X | |
| Growth Opportunities Fund | X | X | X | X | |
| Mid Cap Growth Fund | X | X | X | X | X |
| Non-US ESG Equity Fund | X | X | X | X | |
| Sands Capital Emerging Markets Growth Fund | X | X | X | X | X |
| Strategic Income Opportunities Fund | X | X | X | X |
| (1) | market value of investment securities, assets and liabilities at the current rate of exchange on the valuation date; and |
| (2) | purchases and sales of investment securities, income, and expenses at the relevant rates of exchange prevailing on the respective dates of such transactions. |
| Fund | Derivatives not accounted for as hedging instruments under ASC 815 | Asset Derivatives | Liability Derivatives |
| Flexible Income Fund | Swap Agreements - Credit Contracts* | $— | $642,669 |
| Strategic Income Opportunities Fund | Swap Agreements - Credit Contracts* | 92,810 | — |
| Futures Contracts - Interest Rate Contracts** | — | 96,512 |
| * | Statements of Assets and Liabilities Location: Receivable for variation margin on swap agreements. Variation margin reported in the Portfolio of Investments and other tables in the Notes to the Financial Statements is the cumulative unrealized appreciation (depreciation). |
| ** | Statements of Assets and Liabilities Location: Payable for variation margin on futures contracts. Only current day’s variation margin is reported within the payable/receivable on the Statement of Assets and Liabilities. Includes cumulative appreciation/(depreciation) on futures contracts as reported on the Portfolio of Investments and within the components of net assets section of the Statement of Assets and Liabilities. |
| Fund | Derivatives not accounted for as hedging instruments under ASC 815 | Realized Gains (Losses) on Derivatives | Change in Unrealized Appreciation (Depreciation) on Derivatives |
| Flexible Income Fund | Futures - Interest Rate Contracts* | $(122,038) | $— |
| Purchased Options - Equity Contracts** | 2,535,906 | — | |
| Written Options - Equity Contracts*** | 541,634 | — | |
| Swap Agreements - Credit Contracts**** | 1,093,824 | (642,669) | |
| Strategic Income Opportunities Fund | Futures - Interest Rate Contracts* | 390,539 | 111,149 |
| Swap Agreements - Credit Contracts**** | 58,911 | 92,810 |
| * | Statements of Operations Location: Net realized gains (losses) on futures contracts and net change in unrealized appreciation (depreciation) on futures contracts, respectively. |
| ** | Statements of Operations Location: Net realized gains (losses) on investments. |
| *** | Statements of Operations Location: Net realized gains on written options. |
| **** | Statements of Operations Location: Net realized gains (losses) on swap agreements and net change in unrealized appreciation (depreciation) on swap agreements, respectively. |
| Flexible Income Fund | Strategic Income Opportunities Fund | |
| Equity Contracts: | ||
| Purchased Options - Cost | $90,126 | $— |
| Written Options - Premiums received | —* | — |
| Credit Contracts: | ||
| Credit Default Swaps (buy protection) - Notional value | 13,900,000 | 1,869,000 |
| Interest Rate Contracts: | ||
| Futures Contracts (long) - Notional Value | —* | 29,976,015 |
| Futures Contracts (short) - Notional Value | — | 8,723,031 |
| * | The balance at each quarter end was zero. |
| Fund | Security Type | Market Value of Securities Loaned* | Market Value of Collateral Received** | Net Amount*** |
| Flexible Income Fund | Corporate Bonds | $897,750 | $913,500 | $15,750 |
| Investment Funds | 861,619 | 880,432 | 18,813 | |
| Preferred Stocks | 479,826 | 482,774 | 2,948 | |
| Total Flexible Income Fund | 2,239,195 | 2,276,706 | 37,511 | |
| Growth Opportunities Fund | Common Stocks | 1,721,210 | 1,750,375 | 29,165 |
| Non-US ESG Equity Fund | Common Stocks | 26,774,292 | 29,054,036 | 2,279,744 |
| Sands Capital Emerging Markets Growth Fund | Common Stocks | 1,729,459 | 1,792,110 | 62,651 |
| Strategic Income Opportunities Fund | Corporate Bonds | 209,055 | 214,830 | 5,775 |
| * | The remaining contractual maturity is overnight for all securities. |
| ** | Gross amount of recognized liabilities for securities lending included in the Statements of Assets and Liabilities. |
| *** | Net amount represents the net amount payable due to the borrower in the event of default. |
| Flexible Income Fund | Focused Fund* | Growth Opportunities Fund* | Mid Cap Growth Fund* | Non-US ESG Equity Fund* | Sands Capital Emerging Markets Growth Fund* | Strategic Income Opportunities Fund | |
| Purchases of investment securities | $273,309,767 | $47,976,436 | $74,189,020 | $712,544,065 | $574,029,721 | $737,836,702 | $56,514,287 |
| Proceeds from sales and maturities | $310,917,909 | $84,999,406 | $70,064,069 | $634,629,696 | $593,525,780 | $1,424,433,698 | $142,879,491 |
| * | The Focused Fund, the Growth Opportunities Fund, the Mid Cap Growth Fund, the Non-US ESG Equity Fund and the Sands Capital Emerging Markets Growth Fund had redemption-in-kinds out of the Fund of $52,913,217, $23,415,364, $112,989,735, $45,586,792 and $11,031,468, respectively, which are excluded from the proceeds from sales and maturities. |
| Flexible Income Fund | 0.60% on the first $500 million 0.50% on such assets in excess of $500 million |
| Focused Fund | 0.70% on the first $100 million 0.65% on the next $400 million 0.60% on such assets in excess of $500 million |
| Growth Opportunities Fund | 0.75% on the first $500 million 0.70% on the next $500 million 0.65% on such assets in excess of $1 billion |
| Mid Cap Growth Fund | 0.75% on the first $500 million 0.70% on the next $500 million 0.65% on the next $200 million 0.60% on such assets in excess of $1.2 billion |
| Non-US ESG Equity Fund | 0.65% on the first $1 billion 0.60% on such assets in excess of $1 billion |
| Sands Capital Emerging Markets Growth Fund | 1.00% |
| Strategic Income Opportunities Fund | 0.55% on the first $250 million 0.50% on the next $250 million 0.45% on such assets in excess $500 million |
| Bramshill Investments, LLC | Sands Capital Management, LLC |
| Flexible Income Fund | Sands Capital Emerging Markets Growth Fund |
| Fort Washington Investment Advisors, Inc.* | Westfield Capital Management Company, L.P. |
| Focused Fund | Growth Opportunities Fund |
| Strategic Income Opportunities Fund | Mid Cap Growth Fund |
| Rockefeller & Co., LLC | |
| Non-US ESG Equity Fund |
| * | Affiliate of the Advisor and wholly-owned subsidiary of Western & Southern. |
| Class A | Class C | Class Y | Institutional Class | Class R6 | Termination Date | |
| Flexible Income Fund | 1.04% | 1.79% | 0.79% | 0.69% | — | July 29, 2023 |
| Focused Fund | 1.20% | 1.95% | 0.95% | 0.83% | — | July 29, 2023 |
| Growth Opportunities Fund | 1.24% | 1.99% | 0.99% | 0.89% | — | July 29, 2023 |
| Mid Cap Growth Fund | 1.39% | 2.14% | 1.14% | 0.86% | 0.77% | July 29, 2023 |
| Non-US ESG Equity Fund* | 1.17% | 1.95% | 0.90% | 0.89% | — | July 29, 2023 |
| Sands Capital Emerging Markets Growth Fund | 1.60% | 2.35% | 1.35% | 1.25% | 1.19% | July 29, 2023 |
| Strategic Income Opportunities Fund | 1.00% | 1.71% | 0.75% | 0.65% | — | July 29, 2023 |
| * | Prior to July 29, 2022, the expense limitation for Class C was 1.99%. |
| Fund | Investment Advisory Fees Waived | Administration Fees Waived | Other Operating Expenses Reimbursed/ Waived | Total |
| Flexible Income Fund | $— | $15,885 | $348,850 | $364,735 |
| Focused Fund | — | — | 11,908 | 11,908 |
| Growth Opportunities Fund | — | 46,687 | 133,964 | 180,651 |
| Mid Cap Growth Fund | — | 121,567 | 171,779 | 293,346 |
| Non-US ESG Equity Fund | — | — | 57,971 | 57,971 |
| Sands Capital Emerging Markets Growth Fund | — | — | 23,294 | 23,294 |
| Strategic Income Opportunities Fund | — | 3,412 | 336,871 | 340,283 |
| Fund | Expires on or before March 31, 2024 | Expires on or before March 31, 2025 | Expires on or before March 31, 2026 | Total |
| Flexible Income Fund | $298,950 | $140,862 | $286,441 | $726,253 |
| Focused Fund | 15,681 | 10,171 | 11,518 | 37,370 |
| Growth Opportunities Fund | 167,127 | 122,533 | 114,846 | 404,506 |
| Mid Cap Growth Fund | 38,995 | 155,930 | 293,346 | 488,271 |
| Non-US ESG Equity Fund | 59,632 | 12,644 | 45,205 | 117,481 |
| Sands Capital Emerging Markets Growth Fund | 3,514 | — | — | 3,514 |
| Strategic Income Opportunities Fund | — | 62,969 | 101,355 | 164,324 |
| Fund | Amount |
| Flexible Income Fund | $ 5,353 |
| Focused Fund | 4,764 |
| Growth Opportunities Fund | 3,518 |
| Mid Cap Growth Fund | 24,509 |
| Non-US ESG Equity Fund | 10,475 |
| Sands Capital Emerging Markets Growth Fund | 829 |
| Strategic Income Opportunities Fund | 1,754 |
| Fund | Class A | Class C |
| Flexible Income Fund | $ 85 | $ 354 |
| Focused Fund | — | 25 |
| Growth Opportunities Fund | — | 12 |
| Non-US ESG Equity Fund | 4 | — |
| Strategic Income Opportunities Fund | — | 433 |
| Fund | Shares ReFlow Subscribed to | Redemptions-in-kind |
| Focused Fund | 1,110,382 | $ 52,913,217 |
| Growth Opportunities Fund | 435,278 | 12,613,219 |
| Mid Cap Growth Fund | 3,482,366 | 76,179,287 |
| Non-US ESG Equity Fund | 2,508,331 | 45,586,792 |
| Fund | Daily Average Amount Borrowed | Weighted Average Interest Rate | Interest Expense* |
| Non-US ESG Equity Fund | $ 6,110 | 2.08% | $ 129 |
| * | Included in Other expenses in the Statements of Operations. |
| Flexible Income Fund | Focused Fund | Growth Opportunities Fund | ||||
| Year Ended March 31, 2023 | Year Ended March 31, 2022 | Year Ended March 31, 2023 | Year Ended March 31, 2022 | Year Ended March 31, 2023 | Year Ended March 31, 2022 | |
| From ordinary income | $34,918,465 | $29,223,650 | $1,277,618 | $8,186,308 | $1,038,217 | $10,829,312 |
| From long-term capital gains | 944,221 | — | 30,327,511 | 63,791,908 | 1,556,529 | 15,315,202 |
| Total distributions | $35,862,686 | $29,223,650 | $31,605,129 | $71,978,216 | $2,594,746 | $26,144,514 |
| Mid Cap Growth Fund | Non-US ESG Equity Fund | Sands Capital Emerging Markets Growth Fund | ||||
| Year Ended March 31, 2023 | Year Ended March 31, 2022 | Year Ended March 31, 2023 | Year Ended March 31, 2022 | Year Ended March 31, 2023 | Year Ended March 31, 2022 | |
| From ordinary income | $7,444,034 | $63,548,224 | $6,761,704 | $13,578,798 | $81,972 | $83,985,024 |
| From long-term capital gains | 19,506,766 | 143,676,973 | 27,240,018 | 62,529,954 | — | — |
| Total distributions | $26,950,800 | $207,225,197 | $34,001,722 | $76,108,752 | $81,972 | $83,985,024 |
| Strategic Income Opportunities Fund | ||
| Year Ended March 31, 2023 | Year Ended March 31, 2022 | |
| From ordinary income | $10,666,641 | $9,958,956 |
| From return of capital | 457,048 | — |
| Total distributions | $11,123,689 | $9,958,956 |
| Flexible Income Fund | Focused Fund | Growth Opportunities Fund | |
| Tax cost of portfolio investments | $945,545,571 | $645,304,725 | $89,094,751 |
| Gross unrealized appreciation on investments | 1,323,233 | 446,236,965 | 42,588,908 |
| Gross unrealized depreciation on investments | (85,319,267) | (32,256,823) | (3,572,223) |
| Net unrealized appreciation (depreciation) on investments | (83,996,034) | 413,980,142 | 39,016,685 |
| Gross unrealized depreciation on derivatives and foreign currency transactions | (1) | (1) | — |
| Net unrealized appreciation (depreciation) on derivatives and foreign currency transactions | (1) | (1) | — |
| Qualified late year losses | (4,027,992) | — | (633,100) |
| Undistributed ordinary income | 1,564,068 | 4,415,446 | — |
| Undistributed capital gains | — | 9,885,842 | — |
| Other temporary differences | (204,845) | — | — |
| Accumulated earnings (deficit) | $(86,664,804) | $428,281,429 | $38,383,585 |
| Mid Cap Growth Fund | Non-US ESG Equity Fund | Sands Capital Emerging Markets Growth Fund | Strategic Income Opportunities Fund | |
| Tax cost of portfolio investments | $927,437,977 | $487,173,421 | $2,022,016,595 | $245,655,368 |
| Gross unrealized appreciation on investments | 247,883,501 | 85,735,347 | 536,406,219 | 4,428,719 |
| Gross unrealized depreciation on investments | (56,520,843) | (18,026,322) | (283,056,189) | (29,928,659) |
| Net unrealized appreciation (depreciation) on investments | 191,362,658 | 67,709,025 | 253,350,030 | (25,499,940) |
| Gross unrealized appreciation on foreign currency transactions | — | — | 20,375 | — |
| Gross unrealized depreciation on derivatives, foreign currency transactions and deferred foreign capital gains tax | — | (17,492) | (3,862,762) | (9) |
| Net unrealized appreciation (depreciation) on derivatives, foreign currency transactions and deferred foreign capital gains tax | — | (17,492) | (3,842,387) | (9) |
| Capital loss carryforwards | (85,568,308) | — | (915,847,471) | (66,375,824) |
| Qualified late year losses | (354,417) | (9,234,255) | (17,501,638) | — |
| Undistributed ordinary income | — | 2,304,830 | — | — |
| Other temporary differences | — | — | — | (536,117) |
| Accumulated earnings (deficit) | $105,439,933 | $60,762,108 | $(683,841,466) | $(92,411,890) |
| Fund | No Expiration Short Term | No Expiration Long Term | Total |
| Mid Cap Growth Fund | $ 85,568,308 | $ — | $ 85,568,308 |
| Sands Capital Emerging Markets Growth Fund | 468,193,078 | 447,654,393 | 915,847,471 |
| Strategic Income Opportunities Fund* | 6,475,725 | 59,900,099 | 66,375,824 |
| * | Future utilization may be limited under current tax laws. |
| Fund | Realized Capital Losses | Ordinary Losses | Total |
| Flexible Income Fund | $ 4,027,992 | $ — | $ 4,027,992 |
| Growth Opportunities Fund | 572,423 | 60,677 | 633,100 |
| Mid Cap Growth Fund | — | 354,417 | 354,417 |
| Non-US ESG Equity Fund | 9,234,255 | — | 9,234,255 |
| Sands Capital Emerging Markets Growth Fund | — | 17,501,638 | 17,501,638 |
| Fund | Paid-In Capital | Distributable Earnings |
| Focused Fund | $ 30,090,100 | $ (30,090,100) |
| Growth Opportunities Fund | 9,094,944 | (9,094,944) |
| Mid Cap Growth Fund | 30,010,269 | (30,010,269) |
| Non-US ESG Equity Fund | 33,811,543 | (33,811,543) |
| Sands Capital Emerging Markets Growth Fund | (56,447,622) | 56,447,622 |
| Strategic Income Opportunities Fund | 28,246 | (28,246) |
| Individual fund constituting the Touchstone Strategic Trust | Statement of operations | Statements of changes in net assets | Financial highlights |
| Touchstone Flexible Income Fund Touchstone Focused Fund Touchstone Growth Opportunities Fund Touchstone Mid Cap Growth Fund Touchstone Non-US ESG Equity Fund (formerly Touchstone Global ESG Equity Fund) Touchstone Sands Capital Emerging Markets Growth Fund | For the year ended March 31, 2023 | For each of the two years in the period ended March 31, 2023 | For each of the five years in the period ended March 31, 2023 |
| Touchstone Strategic Income Opportunities Fund | For the year ended March 31, 2023 |

| Flexible Income Fund | 5.94 % |
| Focused Fund | 100.00 % |
| Non-US ESG Equity Fund | 100.00 % |
| Strategic Income Opportunities Fund | 9.59 % |
| Flexible Income Fund | 3.48 % |
| Focused Fund | 100.00 % |
| Non-US ESG Equity Fund | 15.38 % |
| Strategic Income Opportunities Fund | 5.75 % |
| Flexible Income Fund | $ 944,221 |
| Focused Fund | $ 34,832,477 |
| Growth Opportunities Fund | $ 1,556,529 |
| Mid Cap Growth Fund | $ 19,506,766 |
| Non-US ESG Equity Fund | $ 27,240,018 |
| Net Expense Ratio Annualized March 31, 2023 | Beginning Account Value October 1, 2022 | Ending Account Value March 31, 2023 | Expenses Paid During the Six Months Ended March 31, 2023* | ||
| Flexible Income Fund | |||||
| Class A | Actual | 1.00% | $1,000.00 | $1,025.90 | $5.05** |
| Class A | Hypothetical | 1.00% | $1,000.00 | $1,019.95 | $5.04** |
| Class C | Actual | 1.74% | $1,000.00 | $1,021.50 | $8.77** |
| Class C | Hypothetical | 1.74% | $1,000.00 | $1,016.26 | $8.75** |
| Class Y | Actual | 0.75% | $1,000.00 | $1,026.10 | $3.79** |
| Class Y | Hypothetical | 0.75% | $1,000.00 | $1,021.19 | $3.78** |
| Institutional Class | Actual | 0.65% | $1,000.00 | $1,027.60 | $3.29** |
| Institutional Class | Hypothetical | 0.65% | $1,000.00 | $1,021.69 | $3.28** |
| Focused Fund | |||||
| Class A | Actual | 1.17% | $1,000.00 | $1,166.70 | $6.32 |
| Class A | Hypothetical | 1.17% | $1,000.00 | $1,019.10 | $5.89 |
| Class C | Actual | 1.96% | $1,000.00 | $1,161.90 | $10.56 |
| Class C | Hypothetical | 1.96% | $1,000.00 | $1,015.16 | $9.85 |
| Class Y | Actual | 0.88% | $1,000.00 | $1,168.20 | $4.76 |
| Class Y | Hypothetical | 0.88% | $1,000.00 | $1,020.54 | $4.43 |
| Institutional Class | Actual | 0.84% | $1,000.00 | $1,168.50 | $4.54 |
| Institutional Class | Hypothetical | 0.84% | $1,000.00 | $1,020.74 | $4.23 |
| Growth Opportunities Fund | |||||
| Class A | Actual | 1.26% | $1,000.00 | $1,155.50 | $6.77*** |
| Class A | Hypothetical | 1.26% | $1,000.00 | $1,018.65 | $6.34*** |
| Class C | Actual | 2.01% | $1,000.00 | $1,151.20 | $10.78*** |
| Class C | Hypothetical | 2.01% | $1,000.00 | $1,014.91 | $10.10*** |
| Class Y | Actual | 1.01% | $1,000.00 | $1,156.70 | $5.43*** |
| Class Y | Hypothetical | 1.01% | $1,000.00 | $1,019.90 | $5.09*** |
| Institutional Class | Actual | 0.91% | $1,000.00 | $1,157.70 | $4.90*** |
| Institutional Class | Hypothetical | 0.91% | $1,000.00 | $1,020.39 | $4.58*** |
| Mid Cap Growth Fund | |||||
| Class A | Actual | 1.27% | $1,000.00 | $1,151.30 | $6.81**** |
| Class A | Hypothetical | 1.27% | $1,000.00 | $1,018.60 | $6.39**** |
| Class C | Actual | 2.10% | $1,000.00 | $1,146.50 | $11.24**** |
| Class C | Hypothetical | 2.10% | $1,000.00 | $1,014.46 | $10.55**** |
| Class Y | Actual | 1.03% | $1,000.00 | $1,152.50 | $5.53**** |
| Class Y | Hypothetical | 1.03% | $1,000.00 | $1,019.80 | $5.19**** |
| Institutional Class | Actual | 0.88% | $1,000.00 | $1,153.30 | $4.72**** |
| Net Expense Ratio Annualized March 31, 2023 | Beginning Account Value October 1, 2022 | Ending Account Value March 31, 2023 | Expenses Paid During the Six Months Ended March 31, 2023* | ||
| Institutional Class | Hypothetical | 0.88% | $1,000.00 | $1,020.54 | $4.43**** |
| Class R6 | Actual | 0.79% | $1,000.00 | $1,154.00 | $4.24**** |
| Class R6 | Hypothetical | 0.79% | $1,000.00 | $1,020.99 | $3.98**** |
| Non-US ESG Equity Fund | |||||
| Class A | Actual | 1.19% | $1,000.00 | $1,251.60 | $6.68***** |
| Class A | Hypothetical | 1.19% | $1,000.00 | $1,019.00 | $5.99***** |
| Class C | Actual | 1.98% | $1,000.00 | $1,246.60 | $11.09***** |
| Class C | Hypothetical | 1.98% | $1,000.00 | $1,015.06 | $9.95***** |
| Class Y | Actual | 0.93% | $1,000.00 | $1,253.10 | $5.22***** |
| Class Y | Hypothetical | 0.93% | $1,000.00 | $1,020.29 | $4.68***** |
| Institutional Class | Actual | 0.92% | $1,000.00 | $1,252.70 | $5.17***** |
| Institutional Class | Hypothetical | 0.92% | $1,000.00 | $1,020.34 | $4.63***** |
| Sands Capital Emerging Markets Growth Fund | |||||
| Class A | Actual | 1.60% | $1,000.00 | $1,087.90 | $8.33 |
| Class A | Hypothetical | 1.60% | $1,000.00 | $1,016.95 | $8.05 |
| Class C | Actual | 2.35% | $1,000.00 | $1,083.10 | $12.20 |
| Class C | Hypothetical | 2.35% | $1,000.00 | $1,013.21 | $11.80 |
| Class Y | Actual | 1.23% | $1,000.00 | $1,089.80 | $6.41 |
| Class Y | Hypothetical | 1.23% | $1,000.00 | $1,018.80 | $6.19 |
| Institutional Class | Actual | 1.21% | $1,000.00 | $1,089.20 | $6.30 |
| Institutional Class | Hypothetical | 1.21% | $1,000.00 | $1,018.90 | $6.09 |
| Class R6 | Actual | 1.18% | $1,000.00 | $1,090.20 | $6.15 |
| Class R6 | Hypothetical | 1.18% | $1,000.00 | $1,019.05 | $5.94 |
| Strategic Income Opportunities Fund | |||||
| Class A | Actual | 1.00% | $1,000.00 | $1,083.40 | $5.19 |
| Class A | Hypothetical | 1.00% | $1,000.00 | $1,019.95 | $5.04 |
| Class C | Actual | 1.71% | $1,000.00 | $1,079.20 | $8.86 |
| Class C | Hypothetical | 1.71% | $1,000.00 | $1,016.40 | $8.60 |
| Class Y | Actual | 0.75% | $1,000.00 | $1,085.00 | $3.90 |
| Class Y | Hypothetical | 0.75% | $1,000.00 | $1,021.19 | $3.78 |
| Institutional Class | Actual | 0.65% | $1,000.00 | $1,082.00 | $3.37 |
| Institutional Class | Hypothetical | 0.65% | $1,000.00 | $1,021.69 | $3.28 |
| * | Expenses are equal to the Fund’s annualized expense ratio, multiplied by the average account value over the period, multiplied by 182/365 (to reflect one-half year period). |
| ** | Excluding dividend and interest expense on securities sold short, your actual cost of investment in Class A, Class C, Class Y and Institutional Class would be $4.85, $8.57, $3.59 and $3.09, respectively, and your hypothetical cost of investment in Class A, Class C, Class Y and Institutional Class would be $4.84, $8.55, $3.58 and $3.08, respectively. |
| *** | Excluding liquidity provider expenses, your actual cost of investment in Class A, Class C, Class Y and Institutional Class would be $6.66, $10.67, $5.32 and $4.79, respectively, and your hypothetical cost of investment in Class A, Class C, Class Y and Institutional Class would be $6.24, $10.00, $4.99 and $4.48, respectively. |
| **** | Excluding liquidity provider expenses, your actual cost of investment in Class A, Class C, Class Y, Institutional Class and R6 would be $6.70, $11.13, $5.42, $4.62 and $4.14, respectively, and your hypothetical cost of investment in Class A, Class C, Class Y, Institutional Class and R6 would be $6.29, $10.45, $5.09, $4.33, and $3.88, respectively. |
| ***** | Excluding liquidity provider expenses, your actual cost of investment in Class A, Class C, Class Y and Institutional Class would be $6.57, $10.92, $5.06 and $5.00, respectively, and your hypothetical cost of investment in Class A, Class C, Class Y and Institutional Class would be $5.89, $9.80, $4.53 and $4.48, respectively. |
| Interested Trustees1: | |||||
| Name Address Year of Birth | Position Held with Trust | Term of Office And Length of Time Served | Principal Occupation(s) During Past 5 Years | Number of Funds Overseen in the Touchstone Fund Complex2 | Other Directorships Held During Past 5 Years3 |
| Jill T. McGruder Touchstone Advisors, Inc. 303 Broadway Suite 1100 Cincinnati, Ohio 45202 Year of Birth: 1955 | Trustee | Until retirement at age 75 or until she resigns or is removed Trustee since 1999 | President of Touchstone Funds from 1999 to 2020; Director and CEO of IFS Financial Services, Inc. (a holding company) since 1999; and Senior Vice President and Chief Marketing Officer of Western & Southern Financial Group, Inc. (a financial services company) since 2016. | 39 | Director, Integrity Life Insurance Co. and National Integrity Life Insurance Co. since 2005; Director, Touchstone Securities (the Distributor) since 1999; Director, Touchstone Advisors (the Advisor) since 1999; Director, W&S Brokerage Services, Inc. since 1999; Director, W&S Financial Group Distributors, Inc. since 1999; Director, Insurance Profillment Solutions LLC since 2014; Director, Columbus Life Insurance Co. since 2016; Director, The Lafayette Life Insurance Co. since 2016; Director, Gerber Life Insurance Company since 2019; Director, Western & Southern Agency, Inc. since 2018; and Director, LL Global, Inc. (not-for-profit trade organization with operating divisions LIMRA and LOMA) since 2016. |
| E. Blake Moore, Jr. Touchstone Advisors, Inc. 303 Broadway Suite 1100 Cincinnati, Ohio 45202 Year of Birth: 1958 | President and Trustee | Until retirement at age 75 or until he resigns or is removed Trustee since 2021 | President, Touchstone Funds since 2021; Chief Executive Officer of Touchstone Advisors, Inc. and Touchstone Securities, Inc. since 2020; President, Foresters Investment Management Company, Inc. from 2018 to 2020; President, North American Asset Management at Foresters Financial from 2018 to 2020; Managing Director, Head of Americas at UBS Asset Management from 2015 to 2017; and Executive Vice President, Head of Distribution at Mackenzie Investments from 2011 to 2014. | 39 | Trustee, College of Wooster since 2008; and Director, UBS Funds from 2015 to 2017. |
| Independent Trustees: | |||||
| Karen Carnahan c/o Touchstone Advisors, Inc. 303 Broadway Suite 1100 Cincinnati, Ohio 45202 Year of Birth: 1954 | Trustee | Until retirement at age 75 or until she resigns or is removed Trustee since 2019 | Retired; formerly Chief Operating Officer of Shred-it (a business services company) from 2014 to 2015; formerly President & Chief Operating Officer of the document management division of Cintas Corporation (a business services company) from 2008 to 2014. | 39 | Director, Cintas Corporation since 2019; Director, Boys & Girls Club of West Chester/Liberty from 2016 to 2022; and Board of Advisors, Best Upon Request from 2020 to 2021. |
| William C. Gale c/o Touchstone Advisors, Inc. 303 Broadway Suite 1100 Cincinnati, Ohio 45202 Year of Birth: 1952 | Trustee | Until retirement at age 75 or until he resigns or is removed Trustee since 2013 | Retired; formerly Senior Vice President and Chief Financial Officer of Cintas Corporation (a business services company) from 1995 to 2015. | 39 | None. |
| Independent Trustees (Continued): | |||||
| Name Address Year of Birth | Position Held with Trust | Term of Office And Length of Time Served | Principal Occupation(s) During Past 5 Years | Number of Funds Overseen in the Touchstone Fund Complex2 | Other Directorships Held During Past 5 Years3 |
| Susan M. King c/o Touchstone Advisors, Inc. 303 Broadway Suite 1100 Cincinnati, Ohio 45202 Year of Birth: 1963 | Trustee | Until retirement at age 75 or until she resigns or is removed Trustee since 2021 | Formerly, Partner of ID Fund LLC (2020 to 2021); formerly, Senior Vice President, Head of Product and Marketing Strategy of Foresters Financial (2018 to 2020); formerly, Managing Director, Head of Sales Strategy and Marketing, Americas of UBS Asset Management (2015 to 2017); formerly, Director, Allianz Funds, Allianz Funds Multi-Strategy Trust and AllianzGI Institutional Multi-Series Trust (2014 to 2015); and formerly, Director, Alliance Capital Cash Management Offshore Funds (2003 to 2005). | 39 | Trustee, Claremont McKenna College since 2017; Trustee, Israel Cancer Research Fund since 2019; and Board Member of WHAM! (Women's Health Access Matters) since 2021. |
| Kevin A. Robie c/o Touchstone Advisors, Inc. 303 Broadway Suite 1100 Cincinnati, Ohio 45202 Year of Birth: 1956 | Trustee | Until retirement at age 75 or until he resigns or is removed Trustee since 2013 | Retired; formerly Vice President of Portfolio Management at Soin LLC (private multinational holding company and family office) from 2004 to 2020. | 39 | Director, SaverSystems, Inc. since 2015; Director, Buckeye EcoCare, Inc. from 2013 to 2018; Director, Turner Property Services Group, Inc. since 2017; Trustee, Dayton Region New Market Fund, LLC (private fund) since 2010; and Trustee, Entrepreneurs Center, Inc. (business incubator) since 2006. |
| Sally J. Staley4 c/o Touchstone Advisors, Inc. 303 Broadway Suite 1100 Cincinnati, Ohio 45202 Year of Birth: 1956 | Trustee | Until retirement at age 75 or until she resigns or is removed Trustee since 2023 | Independent Consultant to Institutional Asset Owners since 2017; formerly Chief Investment Officer and Corporate Officer for Case Western Reserve University from 2006 to 2017; formerly Advisor to Fairport Asset Management LLC/Luma Wealth Advisors from 2011 to 2019. | 39 | Trustee, College of Wooster since 2006 (Chair since 2021); Trustee, Great Lakes Theater Festival since 2005; and Member of Advisory Committee, Certified Investment Fund Director Institute from 2015 to 2020. |
| William H. Zimmer III c/o Touchstone Advisors, Inc. 303 Broadway Suite 1100 Cincinnati, Ohio 45202 Year of Birth: 1953 | Trustee | Until retirement at age 75 or until he resigns or is removed Trustee since 2019 | Independent Treasury Consultant since 2014. | 39 | Director, Deaconess Associations, Inc. (healthcare) since 2001; Trustee, Huntington Funds (mutual funds) from 2006 to 2015; and Director, National Association of Corporate Treasurers from 2011 to 2015. |
| Principal Officers: | |||
| Name Address Year of Birth | Position(s) Held with Trust1 | Term of Office And Length of Time Served | Principal Occupation(s) During Past 5 Years |
| E. Blake Moore, Jr. Touchstone Advisors, Inc. 303 Broadway Suite 1100 Cincinnati, Ohio 45202 Year of Birth: 1958 | President and Trustee | Until resignation, removal or disqualification President since January 2021 | See biography above. |
| Timothy D. Paulin Touchstone Advisors, Inc. 303 Broadway Suite 1100 Cincinnati, Ohio 45202 Year of Birth: 1963 | Vice President | Until resignation, removal or disqualification Vice President since 2010 | Senior Vice President of Investment Research and Product Management of Touchstone Advisors, Inc. |
| Timothy S. Stearns Touchstone Advisors, Inc. 303 Broadway Suite 1100 Cincinnati, Ohio 45202 Year of Birth: 1963 | Chief Compliance Officer | Until resignation, removal or disqualification Chief Compliance Officer since 2013 | Chief Compliance Officer of Touchstone Advisors, Inc. and Touchstone Securities, Inc. |
| Terrie A. Wiedenheft Touchstone Advisors, Inc. 303 Broadway Suite 1100 Cincinnati, Ohio 45202 Year of Birth: 1962 | Controller and Treasurer | Until resignation, removal or disqualification Controller and Treasurer since 2006 | Senior Vice President and Chief Administration Officer within the Office of the Chief Marketing Officer of Western & Southern Financial Group (since 2021); and Senior Vice President, Chief Financial Officer, and Chief Operations Officer of IFS Financial Services, Inc. (a holding company). |
| Meredyth A. Whitford-Schultz Western & Southern Financial Group 400 Broadway Cincinnati, Ohio 45202 Year of Birth: 1981 | Secretary | Until resignation, removal or disqualification Secretary since 2018 | Senior Counsel - Securities/Mutual Funds of Western & Southern Financial Group (2015 to present); Associate at Morgan Lewis & Bockius LLP (law firm) (2014 to 2015); Associate at Bingham McCutchen LLP (law firm) (2008 to 2014). |


303 Broadway
Cincinnati, Ohio 45202-4203
800.638.8194
www.touchstoneinvestments.com
303 Broadway
Cincinnati, Ohio 45202-4203
4400 Computer Drive
Westborough, Massachusetts 01581
| (b) | Not applicable. |
Item 2. Code of Ethics.
| (a) | The registrant, as of the end of the period covered by this report, has adopted a code of ethics that applies to the registrant’s principal executive officer, principal financial officer, principal accounting officer or controller, or persons performing similar functions, regardless of whether these individuals are employed by the registrant or a third party. |
| (c) | There have been no amendments, during the period covered by this report, to a provision of the code of ethics that applies to the registrant’s principal executive officer, principal financial officer, principal accounting officer or controller, or persons performing similar functions, regardless of whether these individuals are employed by the registrant or a third party, and that relates to any element of the code of ethics description. |
| (d) | The registrant has not granted any waivers, including an implicit waiver, from a provision of the code of ethics that applies to the registrant’s principal executive officer, principal financial officer, principal accounting officer or controller, or persons performing similar functions, regardless of whether these individuals are employed by the registrant or a third party, that relates to one or more of the items set forth in paragraph (b) of this item’s instructions. |
| (e) | Not applicable. |
| (f) | A copy of the code of ethics is attached hereto as Exhibit 13(a)(1). |
Item 3. Audit Committee Financial Expert.
The registrant’s Board of Trustees has determined that the registrant has at least one audit committee financial expert serving on its audit committee. Ms. Karen Carnahan is the registrant’s audit committee financial expert and is an independent trustee within the meaning of the Investment Company Act of 1940, as amended (the “1940 Act”).
Item 4. Principal Accountant Fees and Services.
Audit Fees
| (a) | Audit fees for Touchstone Strategic Trust (March Funds) totaled $142,100 and $141,100 for the fiscal years ended March 31, 2023 and March 31, 2022, respectively, including fees associated with the annual audits and filings of Form N-1A and Form N-CEN. |
Audit-Related Fees
| (b) | The aggregate fees billed in each of the last two fiscal years for assurance and related services by the principal accountant that are reasonably related to the performance of the audit of the registrant’s financial statements and are not reported under paragraph (a) of this Item are $4,900 and $6,800 for the fiscal years ended March 31, 2023 and March 31, 2022, respectively. The fees for 2023 relate to additional fees for valuation procedures and the fees for 2022 relate to the review of Form N-1A filings. |
Tax Fees
| (c) | The aggregate fees billed in each of the last two fiscal years for professional services rendered by the principal accountant for tax compliance, tax advice, and tax planning were $84,973 and $78,690 for the fiscal years ended March 31, 2023 and March 31, 2022, respectively. The fees relate to the preparation of federal income and excise tax returns, review of capital gains distribution calculations and tax agent services. |
All Other Fees
| (d) | The aggregate fees billed in each of the last two fiscal years for products and services provided by the principal accountant, other than the services reported in paragraphs (a) through (c) of this Item are $14,781 and $38,186 for the fiscal years ended March 31, 2023 and March 31, 2022, respectively. The fees relate to tax research and the PFIC analyzer and Global Withholding Tax Reporter subscriptions. |
| (e)(1) | Disclose the audit committee’s pre-approval policies and procedures described in paragraph (c)(7) of Rule 2-01 of Regulation S-X. |
The Audit Committee’s pre-approval policies describe the types of audit, audit-related, tax and other services that have the general pre-approval of the Audit Committee. The pre-approval policies provide that annual audit service fees, tax services not specifically granted pre-approval, services exceeding pre-approved cost levels and other services that have not received general pre-approval will be subject to specific pre-approval by the Audit Committee. The pre-approval policies further provide that the Committee may grant general pre-approval to other audit services (statutory audits and services associated with SEC registration statements, periodic reports and other documents filed with the SEC or other documents issued in connection with securities offerings), audit-related services (accounting consultations related to accounting, financial reporting or disclosure matters not classified as “audit services,” assistance with understanding and implementing new accounting and financial reporting guidance from rulemaking authorities, agreed-upon or expanded audit procedures related to accounting and/or billing records required to respond to or comply with financial, accounting or regulatory reporting matters and assistance with internal control reporting requirements under Form N-CSR), tax services that have historically been provided by the auditor that the Committee believes would not impair the independence of the auditor and are consistent with the SEC’s rules on auditor independence and permissible non-audit services classified as “all other services” that are routine and recurring services.
| (e)(2) | All of the services described in paragraphs (b) through (d) of Item 4 were approved by the Audit Committee. |
| (f) | The percentage of hours expended on the principal accountant’s engagement to audit the registrant’s financial statements for the most recent fiscal year that were attributed to work performed by persons other than the principal accountant’s full-time, permanent employees was less than fifty percent. |
| (g) | The aggregate non-audit fees for Touchstone Strategic Trust (March Funds) and certain entities*, totaled approximately $1,219,210 and $568,578 for the fiscal years ended March 31, 2023 and March 31, 2022, respectively. |
* These include the advisors (excluding non-affiliated sub-advisors) and any entity controlling, controlled by or under common control with the advisors that provides ongoing services to the registrant (Funds).
| (h) | The registrant’s audit committee of the Board of Trustees has considered whether the provision of non-audit services that were rendered to the registrant’s investment adviser (not including any sub-adviser whose role is primarily portfolio management and is subcontracted with or overseen by another investment adviser), and any entity controlling, controlled by, or under common control with the investment adviser that provides ongoing services to the registrant that were not pre-approved pursuant to paragraph (c)(7)(ii) of Rule 2-01 of Regulation S-X is compatible with maintaining the principal accountant’s independence. |
| (i) | Not applicable. |
| (j) | Not applicable. |
Item 5. Audit Committee of Listed Registrants.
Not applicable.
Item 6. Investments.
| (a) | Schedule of Investments in securities of unaffiliated issuers as of the close of the reporting period is included as part of the report to shareholders filed under Item 1(a) of this form. |
| (b) | Not applicable. |
Item 7. Disclosure of Proxy Voting Policies and Procedures for Closed-End Management Investment Companies.
Not applicable.
Item 8. Portfolio Managers of Closed-End Management Investment Companies.
Not applicable.
Item 9. Purchases of Equity Securities by Closed-End Management Investment Company and Affiliated Purchasers.
Not applicable.
Item 10. Submission of Matters to a Vote of Security Holders.
There have been no material changes to the procedures by which the shareholders may recommend nominees to the registrant’s board of trustees, where those changes were implemented after the registrant last provided disclosure in response to the requirements of Item 407(c)(2)(iv) of Regulation S-K (17 CFR 229.407) (as required by Item 22(b)(15) of Schedule 14A (17 CFR 240.14a-101)), or this Item.
Item 11. Controls and Procedures.
| (a) | The registrant’s principal executive and principal financial officers, or persons performing similar functions, have concluded that the registrant’s disclosure controls and procedures (as defined in Rule 30a-3(c) under the 1940 Act (17 CFR 270.30a-3(c))) are effective, as of a date within 90 days of the filing date of the report that includes the disclosure required by this paragraph, based on their evaluation of these controls and procedures required by Rule 30a-3(b) under the 1940 Act (17 CFR 270.30a-3(b)) and Rules 13a-15(b) or 15d-15(b) under the Securities Exchange Act of 1934, as amended (17 CFR 240.13a-15(b) or 240.15d-15(b)). |
| (b) | There were no changes in the registrant’s internal control over financial reporting (as defined in Rule 30a-3(d) under the 1940 Act (17 CFR 270.30a-3(d))) that occurred during the period covered by this report that has materially affected, or is reasonably likely to materially affect, the registrant’s internal control over financial reporting. |
Item 12. Disclosure of Securities Lending Activities for Closed-End Management Investment Companies.
Not applicable.
Item 13. Exhibits.
| (a)(1) | Code of ethics, and any amendment thereto, that is the subject of disclosure required by Item 2 is attached hereto. |
| (a)(2) | Certifications pursuant to Rule 30a-2(a) under the 1940 Act and Section 302 of the Sarbanes-Oxley Act of 2002 are attached hereto. |
(a)(2)(1) Not applicable.
(a)(2)(2) Not applicable.
| (b) | Certifications pursuant to Rule 30a-2(b) under the 1940 Act and Section 906 of the Sarbanes-Oxley Act of 2002 are attached hereto. |
SIGNATURES
Pursuant to the requirements of the Securities Exchange Act of 1934 and the Investment Company Act of 1940, the registrant has duly caused this report to be signed on its behalf by the undersigned, thereunto duly authorized.
| (Registrant) | Touchstone Strategic Trust |
| By (Signature and Title)* | /s/ E. Blake Moore, Jr. | |
| E. Blake Moore, Jr., President | ||
| (principal executive officer) | ||
| Date: | 5/31/2023 |
Pursuant to the requirements of the Securities Exchange Act of 1934 and the Investment Company Act of 1940, this report has been signed below by the following persons on behalf of the registrant and in the capacities and on the dates indicated.
| By (Signature and Title)* | /s/ E. Blake Moore, Jr. | |
| E. Blake Moore, Jr., President | ||
| (principal executive officer) | ||
| Date: | 5/31/2023 |
| By (Signature and Title)* | /s/ Terrie A. Wiedenheft | |
| Terrie A. Wiedenheft, Controller and Treasurer | ||
| (principal financial officer) | ||
| Date: | 5/31/2023 |
* Print the name and title of each signing officer under his or her signature.