SEMI-ANNUAL REPORT
JUNE 30, 2017
This report is intended for shareholders of the
Greenspring Fund, Incorporated and may not be
used as sales literature unless preceded or
accompanied by a current prospectus.
August 2017
Dear Fellow Shareholders:
During the second quarter of 2017, Greenspring Fund generated a gain of 1.4%, building on the positive performance achieved during the first quarter and bringing the year-to-date gain to 2.5%. The major equity market indices also advanced during the quarter and growth-oriented large capitalization stocks once again led the market as evidenced by the strong gains achieved by the NASDAQ relative to the Russell 2000 Value Index, which represents smaller, value-oriented companies. Interest rates on U.S. Treasury securities followed a pattern similar to the first quarter. The interest rate on the 1-year Treasury security increased from 1.03% to 1.24%, whereas the yield on the 10-year Treasury security fell from 2.40% to 2.31%, as the yield curve continued to flatten.
The performances of the various equity market indices were more balanced during the second quarter versus the first quarter, although larger capitalization companies, particularly technology companies, still captured the dominant share of investors’ interest. Equity market valuations were supported by strong first quarter corporate earnings combined with an optimistic outlook that this trend would continue. The strength in corporate earnings was augmented by a low unemployment rate, stable and low interest rates, tame inflation and a generally healthy consumer.
Despite the strength in corporate earnings, equity investors were hard pressed to find evidence that the economy was accelerating and, in fact, many feared that it may continue to trudge along at the slow pace of the last few years. This mixed economic outlook, combined with uncertainty over the Trump administration’s ability to move forward with its various proposals intended to accelerate the economic growth rate, contributed to the disparity in performance between growth and value stocks. Amidst this uncertainty, many investors moved towards large capitalization growth stocks as their prospects for growth were more highly valued by investors who feared the overall economy may be slowing.
| | Greenspring Fund | |
| | Performance for the | |
| | Periods Ended June 30, 2017 | |
| | Quarter | 1.36% | |
| | Year to Date | 2.54% | |
| | 1 Year | 15.83% | |
| | 3 Years* | 3.29% | |
| | 5 Years* | 7.30% | |
| | 10 Years* | 4.91% | |
| | 15 Years* | 7.05% | |
| | 20 Years* | 6.25% | |
| | Since inception on 7/1/83* | 9.35% | |
| | Expense Ratio** | 1.03% | |
| | | | | | |
| | * | | Annualized. | |
| | ** | | As stated in Prospectus dated 5-1-17. See note on last page of letter. | |
| | | | | | |
| | Performance data quoted represents past performance; past performance does not guarantee future results. The investment return and principal value of an investment will fluctuate so that an investor’s shares, when redeemed, may be worth more or less than their original cost. Current performance of the Fund may be lower or higher than the performance quoted. Performance data current to the most recent month end may be obtained by calling 1-800-366-3863 or by visiting www.greenspringfund.com. The Fund imposes a 2.00% redemption fee for shares held 60 days or less. Performance data does not reflect the redemption fee. If reflected, total returns would be reduced. | |
Within the fixed income markets, the movement of short-term interest rates is heavily influenced by the monetary policy conducted by the Federal Reserve (“Fed”). In June, for the second time this year, the Fed raised the target range for the federal funds rate by one quarter of one percent. The yield on short-term Treasury securities moved higher, quickly reflecting the Fed’s actions. Despite
the increase in short-term rates, yields on longer-term Treasury securities moved incrementally lower during the quarter, reflecting mixed economic data, a lack of clear policy coming out of Washington and subdued inflation expectations. In commentary following the June rate increase, the Fed signaled that further rate increases are likely during the second half of the year, if various economic indicators continue to exhibit positive momentum. The Fed also indicated that, after purchasing approximately $4 trillion of bonds over the last several years through its various quantitative easing programs, it plans to unwind a portion of these purchases by systematically reducing the size of its balance sheet. Further hikes in short-term interest rates, combined with the unprecedented and unknown potential consequences of shrinking the Fed’s balance sheet, will certainly keep bond investors focused on their strategic approach to protecting principal while attempting to generate an attractive return.
INFLUENCES on FUND PERFORMANCE
The majority of the Fund’s holdings contributed to the positive performance realized during the second quarter. Although two-thirds of the equity holdings in the portfolio generated gains during the quarter, many of the holdings advanced only modestly, reflecting the relative underperformance of value stocks. The fixed income securities performed as expected, with steady positive performance achieved throughout the quarter although the contribution to overall Fund performance continues to be muted by the current ultra-low interest rate environment. The individual securities that had the greatest influence on the Fund’s performance during the quarter, in order of magnitude, were the common stock holdings in Novanta, MasTec, AMC Entertainment, Gramercy Property Trust and MYR Group. Novanta, MasTec and Gramercy Property Trust contributed positively while AMC Entertainment and MYR Group had negative returns.
Novanta, a niche manufacturer of laser, vision and precision motion components and subsystems used by industrial and healthcare equipment manufacturers, was the largest contributor to second quarter performance. Novanta’s first quarter earnings, driven by strong organic revenue growth and the robust performance of recently acquired operations, exceeded Wall Street expectations. The Company also expressed confidence that this strong earnings momentum would continue, pushing future earnings expectations still higher. As the second quarter progressed, Novanta announced another acquisition that will add an additional component to its healthcare equipment business. This acquisition further bolstered the outlook for earnings during the balance of 2017 and 2018. Given the significant increase in the valuation of Novanta shares during the quarter, we continued to reduce the size of the Fund’s holdings in the shares.
MasTec, which builds, installs and maintains infrastructure projects for the energy, communication and utility industries, reported better than expected first quarter earnings and raised its earnings expectations for the full year. Within several of its business lines, MasTec saw revenues increase, driven by healthy end markets with particularly strong revenue and profit growth coming from the oil and gas pipeline segment that has benefited from work on several large pipeline construction projects. In addition, to supplement its growth and further diversify
| | | | % of Net |
| | Greenspring Fund | | Assets |
| | Top 10 Holdings | | as of |
| | | | 6/30/17 |
| | Republic Services, Inc. | | 4.9% |
| | MasTec, Inc. | | 4.2% |
| | Southern National Bancorp of Virginia | | 3.2% |
| | Discover Financial Services | | 3.1% |
| | EMCOR Group, Inc. | | 2.9% |
| | CSRA, Inc. | | 2.5% |
| | MYR Group, Inc. | | 2.5% |
| | New York REIT, Inc. | | 2.5% |
| | Johnson Controls International plc | | 2.4% |
| | Six Flags Entertainment Corp. | | 2.3% |
its geographic reach and customer base, MasTec completed a relatively small acquisition in the communications segment of the business. As the outlook for 2018 begins to unfold, we continue to believe that MasTec is well-positioned to benefit from increased spending on oil and gas pipelines, electric transmission and distribution lines, and wireless, wireline and fiber optic projects as these industries undertake capital expenditure programs to expand, improve and modernize the ability to deliver fuel, electricity and telecommunication services to the public.
AMC Entertainment (“AMC”) is the largest movie theater chain in the world. It operates over 11,000 screens in more than 1,000 theaters across 15 countries. Recently, AMC has pursued growth both organically and through acquisitions. Organically, AMC has increased the profitability of its existing theatre locations by installing more comfortable reclining seats, improving food and beverage offerings and enhancing its customer loyalty/rewards program. At the same time, AMC completed several acquisitions to boost growth and generate operational and cost synergies. Despite these strategic initiatives, AMC’s stock price declined during the quarter as several recent movies had relatively poor box office receipts, disappointing the investment community. Complicating matters for AMC, the box office slump came while the Company was carrying somewhat elevated leverage resulting from the recent acquisitions. Further, investors grappled with recent press reports that suggested certain movie studios want to adopt a premium video on demand service. This service would allow customers to view a movie at home, although at a premium price, only a few weeks after it was released to the theatre. If this were to occur, it could result in lower theater attendance; however, AMC would likely be compensated by receiving some portion of the video on demand fee. We believe that AMC’s industry-leading scale bolsters its negotiating power with studios, and that any impacts from changes to the theatrical window would be relatively neutral.
While recent box office receipts have been weak, we expect the movie slate to improve as the year progresses and for revenue to return to the low single digit historical growth rate. We also believe that AMC will generate strong cash flow from operations, allowing it to fund improvements to the theater experience, reduce debt, and pay a meaningful dividend to shareholders. We purchased additional shares of AMC during the quarter.
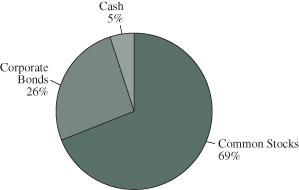
| Greenspring Fund |
| Portfolio Allocation |
| as of June 30, 2017 |
| |
 |
| |
PORTFOLIO ACTIVITY
We did not initiate any new equity positions during the second quarter but we did add to several of the existing portfolio holdings. The most significant additional equity purchases included common shares in AMC Entertainment, MYR Group, New York REIT and Six Flags Entertainment. We sold all the Fund’s shares in Kroger and CVS Health as we were concerned that developments in their respective industries could prove disruptive enough to derail the trajectory of earnings growth. We also sold the Fund’s remaining holdings in CA, Inc. and M/I Homes Series A Preferred as these holdings reached our estimate of fair value. Throughout the quarter, we took advantage of market prices to reduce the Fund’s holdings in Gramercy Property Trust, Lumos Networks, Mohawk Industries and Novanta.
OUTLOOK
Recently, we have seen and heard much discussion concerning active versus passive investing. In many cases, the discussion seems to be focused primarily on costs and returns with less emphasis on portfolio construction or the tolerance for volatility and risk. Greenspring Fund’s portfolio is not designed to mirror or reflect any particular equity or bond market index. Equity investments typically include small, mid and large capitalization value-oriented stocks that we believe have promising future prospects. At times, we choose to invest in companies that may be facing short-term challenges providing the Fund with the opportunity to purchase shares at what we believe are very attractive valuations. If our research and analysis proves to be correct, the Fund stands to earn attractive returns as these companies move beyond their challenges and begin to exhibit more visible and attractive future prospects.
Greenspring Fund also invests in fixed income securities which adds an additional dimension to the portfolio and influences the expected total return. At the time of purchase, the expected return from a fixed income investment is mathematically based and includes a defined exit strategy that does not rely on selling the security to another investor at a higher price in the future. Fixed income securities tend to be less volatile than equity investments and the investment returns may not be correlated with equity returns during any given period of time. We believe that one of the great benefits of including fixed income securities in the portfolio is their potential to reduce the overall variability of the Fund’s returns. While this is likely to help buffer the portfolio during periods of severe equity market stress, which we view as an extremely important element, it is also likely to restrain gains during a sharp equity market advance.
Passive strategies that include investing in broadly diversified indices have the potential to be quite rewarding during a market advance. However, when investing in a fund that tracks an index, the investor must also accept the concept of losing money when the index goes down. While it is easy to “stay the course” while achieving gains, many investors become uncomfortable as losses mount during market downturns and may decide to sell. At this point, the investor is faced with the challenge of deciding when to re-enter the market. This desire to time the market typically results in the failure to realize the long-term overall returns that the passive strategy was designed to achieve.
We will continue to do our best to achieve the goal of providing an attractive total return in a less volatile manner and add value by helping Fund shareholders stay invested during both good markets and bad so that they realize the gains earned over a market cycle.
We appreciate your interest and your investment in Greenspring Fund and look forward to providing you with an update on the Fund’s performance after the end of the third quarter.
Respectfully,
 |  |
| Charles vK. Carlson | Michael J. Fusting |
| Portfolio Manager and Co-Chief Investment Officer | Co-Chief Investment Officer |
**Total Annual Fund Operating Expenses for the Fund will not correlate to the Ratio of Expenses to Average Net Assets shown in the Fund’s most recent Annual Report and in the Financial Highlights section of the Prospectus, which reflects the operating expenses of the Fund and does not include acquired fund fees and expenses.
Mutual fund investing involves risk. Principal loss is possible. Small and mid-capitalization companies tend to have limited liquidity and greater price volatility than large-capitalization companies. Investments by the Fund in lower-rated and non-rated securities present a greater risk of loss to principal and interest than higher-rated securities. Investments in debt securities typically decrease in value when interest rates rise. This risk is usually greater for longer-term debt securities.
Opinions expressed are subject to change, are not guaranteed and should not be considered recommendations to buy or sell any security. Fund holdings and/or sector allocations are subject to change at any time and are not recommendations to buy or sell any security. Current and future portfolio holdings are subject to risk.
The Nasdaq stock market comprises two separate markets, namely the Nasdaq National Market, which trades large, active securities and the Nasdaq Smallcap market that trades emerging growth companies. It is not possible to invest directly in an index. The Russell 2000 Value Index is composed of small-capitalization U.S. equities that exhibit value characteristics such as lower price-to-book ratios and lower future and historical growth than its peers. It is not possible to invest directly in an index.
Cash flow measures the cash generating capability of a company by adding non-cash charges (e.g. depreciation) and interest expense to pre-tax income.
Earnings growth is not a measure of a Fund’s future performance.
Distributed by Quasar Distributors, LLC
EXPENSE EXAMPLE For the Six Months Ended June 30, 2017 (Unaudited) |
As a shareholder of Greenspring Fund, Incorporated, you incur two types of costs: (1) transaction costs, including redemption fees, and (2) ongoing costs, including management fees, and other fund specific expenses. The expense example is intended to help the shareholder understand ongoing costs (in dollars) of investing in a fund and to compare these costs with the ongoing costs of investing in other mutual funds. The example is based on an investment of $1,000 invested at the beginning of the period and held for the most recent six-month period.
The Actual Expenses comparison provides information about actual account values and actual expenses. A shareholder may use the information in this line, together with the amount invested, to estimate the expenses paid over the period. A shareholder may divide his/her account value by $1,000 (e.g., an $8,600 account value divided by $1,000 = 8.6), then multiply the result by the number in the first line under the heading entitled “Expenses Paid During Period” to estimate the expenses paid on his/her account during this period.
The Hypothetical Example for Comparison Purposes provides information about hypothetical account values and hypothetical expenses based on the Fund’s actual expense ratio and an assumed rate of return of 5% per year before expenses, which is not the Fund’s actual return. The hypothetical account values and expenses may not be used to estimate the actual ending account balance or expenses paid for the period. A shareholder may use this information to compare the ongoing costs of investing in the Fund and other funds. To do so, a shareholder would compare this 5% hypothetical example with the 5% hypothetical examples that appear in the shareholder reports of other funds.
The expenses shown in the table are meant to highlight your ongoing costs only and do not reflect any transactional costs, such as sales charges (loads), redemptions fees, or exchange fees. Therefore, the Hypothetical Example for Comparison Purposes is useful in comparing ongoing costs only, and will not help to determine the relevant total costs of owning different funds. In addition, if these transactional costs were included, shareholder costs would have been higher.
| | | | | | Expenses Paid |
| | | Annualized | Beginning | Ending | During Period |
| | | Net Expense | Account Value | Account Value | 1/1/17 – |
| | | Ratio 6/30/17 | 1/1/17 | 6/30/17 | 6/30/17(1) |
Actual Expenses(2) | | 0.97% | $1,000.00 | $1,025.40 | $4.87 |
| Hypothetical Example | | | | | |
| for Comparison Purposes | | | | | |
| (5% return before expenses) | | 0.97% | $1,000.00 | $1,019.98 | $4.86 |
(1) | Expenses are equal to the Fund’s annualized net expense ratio, multiplied by the average account value over the period, multiplied by 181/365 to reflect the one-half year period. |
(2) | Based on the actual returns of 2.54% for the six month-period ended June 30, 2017. |
SCHEDULE OF INVESTMENTS at June 30, 2017 (Unaudited) |
| Shares | | | | Value | |
| COMMON STOCKS: 69.4% | | | |
| | | | |
| Building Products: 4.6% | | | |
| | 172,090 | | Johnson Controls International plc# | | $ | 7,461,822 | |
| | 19,594 | | Mohawk Industries, Inc.* | | | 4,735,674 | |
| | 150,699 | | PGT Innovations, Inc.* | | | 1,928,947 | |
| | | | | | | 14,126,443 | |
| Business Software & Services: 1.9% | | | | |
| | 88,061 | | Amdocs Limited# | | | 5,676,412 | |
| | | | | | | |
| Chemicals: 1.9% | | | | | | |
| | 16,119 | | The Sherwin-Williams Company | | | 5,657,124 | |
| | | | | |
| Commercial Banks & Thrifts: 7.8% | | | | |
| | 35,987 | | American National Bankshares, Inc. | | | 1,329,719 | |
| | 184,985 | | Beneficial Bancorp, Inc. | | | 2,774,775 | |
| | 144,251 | | Clifton Bancorp, Inc. | | | 2,384,469 | |
| | 32,010 | | First Connecticut Bancorp, Inc. | | | 821,056 | |
| | 52,900 | | OceanFirst Financial Corp. | | | 1,434,648 | |
| | 23,073 | | Prudential Bancorp, Inc. | | | 419,006 | |
| | 168,446 | | Shore Bancshares, Inc. | | | 2,770,937 | |
| | 559,868 | | Southern National Bancorp of Virginia | | | 9,853,677 | |
| | 26,352 | | Westbury Bancorp, Inc.* | | | 536,527 | |
| | 143,231 | | Western New England Bancorp, Inc. | | | 1,453,795 | |
| | | | | | | 23,778,609 | |
| Consulting Services: 1.7% | | | | |
| | 148,914 | | FTI Consulting, Inc.* | | | 5,206,033 | |
| | | | | |
| Distributors: 1.9% | | | | |
| | 176,914 | | LKQ Corporation* | | | 5,829,316 | |
| | | | | |
| Diversified Financial Services: 3.1% | | | | |
| | 152,457 | | Discover Financial Services | | | 9,481,301 | |
| | | | | |
| Electrical Equipment & Instruments: 2.4% | | | | |
| | 17,400 | | Emerson Electric Co. | | | 1,037,388 | |
| | 177,109 | | Novanta, Inc.*# | | | 6,375,924 | |
| | | | | | | 7,413,312 | |
| Engineering & Construction: 10.7% | | | | |
| | 133,782 | | EMCOR Group, Inc. | | | 8,746,667 | |
| | 232,101 | | KBR, Inc. | | | 3,532,578 | |
| | 285,041 | | MasTec, Inc.* | | | 12,869,601 | |
| | 245,854 | | MYR Group, Inc.* | | | 7,626,391 | |
| | | | | | | 32,775,237 | |
| Entertainment: 4.6% | | | | |
| | 300,147 | | AMC Entertainment | | | | |
| | | | Holdings, Inc. - Class A | | | 6,828,344 | |
| | 119,076 | | Six Flags Entertainment Corp. | | | 7,098,121 | |
| | | | | | | 13,926,465 | |
| Healthcare-Products: 1.4% | | | | |
| | 11,000 | | Abbott Laboratories | | | 534,710 | |
| | 40,370 | | Medtronic PLC# | | | 3,582,838 | |
| | | | | | | 4,117,548 | |
| Hotels, Restaurants & Leisure: 0.6% | | | | |
| | 18,000 | | Marriott International, Inc. - Class A | | | 1,805,580 | |
| | | | | |
| Household & Personal Products: 0.1% | | | | |
| | 2,000 | | The Clorox Company | | | 266,480 | |
| | | | | |
| Household Durables: 0.1% | | | | |
| | 7,000 | | Newell Brands, Inc. | | | 375,340 | |
| | | | | |
| Industrial Equipment: 0.4% | | | | |
| | 20,000 | | Pentair PLC# | | | 1,330,800 | |
| | | | | |
| Information Technology Services: 2.5% | | | | |
| | 240,932 | | CSRA, Inc. | | | 7,649,591 | |
| | | | | |
| Internet Software & Services: 0.9% | | | | |
| | 30,850 | | j2 Global, Inc. | | | 2,625,026 | |
| | | | | |
| Machinery: 1.0% | | | | |
| | 20,102 | | Blue Bird Corp.* | | | 341,734 | |
| | 16,378 | | Snap-on Incorporated | | | 2,587,724 | |
| | | | | | | 2,929,458 | |
| Oil & Gas Exploration & Production: 3.5% | | | | |
| | 4,403 | | Energen Corporation* | | | 217,376 | |
| | 57,254 | | EOG Resources, Inc. | | | 5,182,632 | |
| | 176,735 | | Suncor Energy, Inc.# | | | 5,160,662 | |
| | | | | | | 10,560,670 | |
| Oil Refining & Marketing: 0.1% | | | | |
| | 2,813 | | Phillips 66 | | | 232,607 | |
| | | | | |
| Real Estate Investment Trusts: 4.8% | | | | |
| | 203,498 | | Condor Hospitality Trust, Inc. | | | 2,181,499 | |
| | 164,322 | | Gramercy Property Trust, Inc. | | | 4,882,007 | |
| | 882,624 | | New York REIT, Inc.~ | | | 7,625,871 | |
| | | | | | | 14,689,377 | |
| Retail: 1.8% | | | | |
| | 354,640 | | Party City Holdco Inc.* | | | 5,550,116 | |
The accompanying notes are an integral part of these financial statements.
SCHEDULE OF INVESTMENTS at June 30, 2017 (Unaudited) (Con’t) |
| Shares/Principal | | Value | |
| COMMON STOCKS: 69.4% (Con’t) | | | |
| | | | |
| Telecommunications Services: 0.7% | | | |
| | 122,050 | | Lumos Networks Corp.* | | $ | 2,181,034 | |
| | | | | |
| Trading Companies & Distributors: 0.1% | | | | |
| | 47,235 | | Nexeo Solutions, Inc.* | | | 392,051 | |
| | | | | |
| Transportation & Logistics: 2.0% | | | | |
| | 53,838 | | United Parcel Service, Inc. - Class B | | | 5,953,944 | |
| | | | | |
| Truck Dealerships: 0.9% | | | | |
| | 43,467 | | Rush Enterprises, Inc. - Class A* | | | 1,616,103 | |
| | 32,083 | | Rush Enterprises, Inc. - Class B* | | | 1,168,142 | |
| | | | | | | 2,784,245 | |
| Utilities: 3.0% | | | | |
| | 556,900 | | The AES Corporation | | | 6,187,159 | |
| | 78,825 | | PPL Corporation | | | 3,047,374 | |
| | | | | | | 9,234,533 | |
| Waste Management Services: 4.9% | | | | |
| | 236,915 | | Republic Services, Inc. | | | 15,098,593 | |
| | | | | |
| TOTAL COMMON STOCKS | | | | |
| (cost $138,435,283) | | | 211,647,245 | |
| | | | | | | | |
| CORPORATE BONDS: 25.4% | | | | |
| | | | | |
| Aerospace & Defense: 0.9% | | | | |
| $ | 2,671,000 | | Spirit AeroSystems, Inc., 5.250%, 3/15/22 | | | 2,771,921 | |
| | | | | |
| Apparel & Textiles: 0.1% | | | | |
| | 318,000 | | The William Carter Company, | | | | |
| | | | 5.250%, 8/15/21 | | | 327,938 | |
| | | | | |
| Building Products: 1.9% | | | | |
| | 1,878,000 | | Allegion US Holding Co, Inc., | | | | |
| | | | 5.750%, 10/1/21 | | | 1,953,120 | |
| | 3,618,000 | | Gibraltar Industries, Inc., 6.250%, 2/1/21 | | | 3,746,439 | |
| | | | | | | 5,699,559 | |
| Chemicals: 0.7% | | | | |
| | 2,031,000 | | Chemtura Corporation, 5.750%, 7/15/21 | | | 2,092,565 | |
| | | | | |
| Commercial Services & Supplies: 0.1% | | | | |
| | 255,000 | | APX Group, Inc., 6.375%, 12/1/19 | | | 262,331 | |
| | | | | |
| Consulting Services: 0.6% | | | | |
| | 1,853,000 | | FTI Consulting, Inc., 6.000%, 11/15/22 | | | 1,929,436 | |
| | | | | |
| Diversified Consumer Services: 0.4% | | | | |
| | 1,103,000 | | Graham Holdings Company, | | | | |
| | | | 7.250%, 2/1/19 | | | 1,184,346 | |
| | | | | |
| Engineering & Construction: 0.7% | | | | |
| | 577,000 | | AECOM, 5.750%, 10/15/22 | | | 606,571 | |
| | 1,553,000 | | MasTec, Inc., 4.875%, 3/15/23 | | | 1,556,883 | |
| | | | | | | 2,163,454 | |
| Food & Staples Retailing: 0.8% | | | | |
| | 2,211,000 | | Rite Aid Corporation, 9.250%, 3/15/20 | | | 2,288,385 | |
| | | | | |
| Healthcare-Products: 0.4% | | | | |
| | 1,317,000 | | Alere, Inc., 7.250%, 7/1/18 | | | 1,318,975 | |
| | | | | |
| Healthcare-Providers & Services: 3.0% | | | | |
| | 4,844,000 | | Acadia Healthcare Company, Inc., | | | | |
| | | | 6.125%, 3/15/21 | | | 5,001,430 | |
| | 1,635,000 | | Centene Corporation, 5.625%, 2/15/21 | | | 1,708,575 | |
| | 2,435,000 | | DaVita, Inc., 5.750%, 8/15/22 | | | 2,505,006 | |
| | | | | | | 9,215,011 | |
| Household & Personal Products: 1.3% | | | | |
| | 3,900,000 | | Spectrum Brands, Inc., 6.625%, 11/15/22 | | | 4,104,750 | |
| | | | | |
| Internet Software & Services: 1.4% | | | | |
| | 3,742,000 | | j2 Global, Inc., 8.000%, 8/1/20 | | | 3,836,654 | |
| | 366,000 | | Match Group, Inc., 6.750%, 12/15/22 | | | 382,012 | |
| | | | | | | 4,218,666 | |
| Media: 1.4% | | | | |
| | 345,000 | | CCO Holdings LLC/CCO | | | | |
| | | | Holdings Capital Corp., 5.250%, 3/15/21 | | | 354,703 | |
| | 290,000 | | Cinemark USA, Inc., 5.125%, 12/15/22 | | | 300,150 | |
| | 2,292,000 | | LIN Television Corporation, | | | | |
| | | | 5.875%, 11/15/22 | | | 2,412,330 | |
| | 1,222,000 | | TEGNA, Inc., 5.125%, 7/15/20 | | | 1,254,078 | |
| | | | | | | 4,321,261 | |
| Metals & Mining: 0.7% | | | | |
| | 74,000 | | Commercial Metals Company, | | | | |
| | | | 6.500%, 7/15/17 | | | 74,000 | |
| | 1,923,000 | | Steel Dynamics, Inc., 6.375%, 8/15/22 | | | 1,995,112 | |
| | | | | | | 2,069,112 | |
| Multiline Retail: 0.0% | | | | |
| | 132,000 | | Dollar Tree, Inc., 5.250%, 3/1/20 | | | 135,713 | |
The accompanying notes are an integral part of these financial statements.
SCHEDULE OF INVESTMENTS at June 30, 2017 (Unaudited) (Con’t) |
| Principal/Shares | | Value | |
| CORPORATE BONDS: 25.4% (Con’t) | | | |
| | | | |
| Oil & Gas Exploration & Production: 2.6% | | | |
| $ | 3,186,000 | | Gulfport Energy Corp., 6.625%, 5/1/23 | | $ | 3,209,895 | |
| | 4,431,000 | | PDC Energy, Inc., 7.750%, 10/15/22 | | | 4,619,318 | |
| | | | | | | 7,829,213 | |
| Packaging & Containers: 2.1% | | | | |
| | 5,204,000 | | Reynolds Group Issuer Inc./Reynolds | | | | |
| | | | Group Issuer LLC/Reynolds Group Issuer | | | | |
| | | | (Luxembourg), 5.750%, 10/15/20 | | | 5,331,966 | |
| | 932,019 | | Reynolds Group Issuer Inc./Reynolds | | | | |
| | | | Group Issuer LLC/Reynolds Group Issuer | | | | |
| | | | (Luxembourg), 6.875%, 2/15/21 | | | 958,814 | |
| | 157,000 | | Silgan Holdings, Inc., 5.000%, 4/1/20 | | | 159,159 | |
| | | | | | | 6,449,939 | |
| Real Estate Investment Trusts: 1.0% | | | | |
| | 152,000 | | FelCor Lodging LP, 5.625%, 3/1/23 | | | 158,460 | |
| | 2,847,000 | | Lamar Media Group, 5.875%, 2/1/22 | | | 2,946,645 | |
| | | | | | | 3,105,105 | |
| Specialty Retail: 1.9% | | | | |
| | 3,850,000 | | Michaels Stores, Inc., | | | | |
| | | | 5.875%, 12/15/20 - 144A | | | 3,946,250 | |
| | 1,644,000 | | Murphy Oil USA, Inc., 6.000%, 8/15/23 | | | 1,742,640 | |
| | | | | | | 5,688,890 | |
| Telecommunications Services: 1.1% | | | | |
| | 3,188,000 | | Level 3 Financing, Inc., 6.125%, 1/15/21 | | | 3,291,610 | |
| | | | | |
| Trading Companies & Distributors: 1.5% | | | | |
| | 402,000 | | United Rentals North America, Inc., | | | | |
| | | | 7.625%, 4/15/22 | | | 421,095 | |
| | 1,957,000 | | United Rentals North America, Inc., | | | | |
| | | | 6.125%, 6/15/23 | | | 2,042,619 | |
| | 1,985,000 | | WESCO Distribution, Inc., | | | | |
| | | | 5.375%, 12/15/21 | | | 2,071,844 | |
| | | | | | | 4,535,558 | |
| Utilities: 0.5% | | | | |
| | 1,643,000 | | The AES Corporation, 4.202%, 6/1/19º | | | 1,647,107 | |
| | | | | |
| Waste Management Services: 0.3% | | | | |
| | 748,000 | | Clean Harbors, Inc., 5.250%, 8/1/20 | | | 760,155 | |
| | | | | |
| TOTAL CORPORATE BONDS | | | | |
| (cost $77,256,684) | | | 77,411,000 | |
| | | | | | | | |
| SHORT-TERM INVESTMENTS: 4.5% | | | | |
| | | | | |
| Money Market Funds: 4.5%^ | | | | |
| | 13,646,691 | | The Government & Agency Portfolio, | | | | |
| | | | Institutional Share Class, 0.890% | | | 13,646,691 | |
| | 117,322 | | The Treasury Portfolio, | | | | |
| | | | Institutional Share Class, 0.850% | | | 117,322 | |
| | | | | |
| TOTAL SHORT-TERM INVESTMENTS | | | | |
| (cost $13,764,013) | | | 13,764,013 | |
| | | | | |
| TOTAL INVESTMENTS IN SECURITIES | | | | |
| (cost $229,455,980): 99.3% | | | 302,822,258 | |
| Other Assets and Liabilities 0.7% | | | 2,287,597 | |
| NET ASSETS: 100.0% | | $ | 305,109,855 | |
| * | | Non-income producing security. |
| # | | U.S. security of foreign issuer. |
| 144A | | Securities purchased pursuant to Rule 144A of the Securities Act of 1933, as amended, and may be sold only to dealers in that program or other “qualified institutional buyers.” These securities have been deemed to be liquid by the Fund’s adviser under the supervision of the Board of Directors. As of June 30, 2017, the value of these investments was $3,946,250, or 1.3% of total net assets. |
| º | | The coupon rate shown on variable rate securities represents the rates at June 30, 2017. |
| ^ | | Rate shown is the 7-day effective yield at June 30, 2017. |
| ~ | | Security in process of liquidation. |
The accompanying notes are an integral part of these financial statements.
STATEMENT OF ASSETS AND LIABILITIES at June 30, 2017 (Unaudited) |
| ASSETS | | | |
| Investments in securities, at value (cost $229,455,980) | | $ | 302,822,258 | |
| Receivables: | | | | |
| Dividends and interest | | | 1,554,540 | |
| Securities sold | | | 1,204,868 | |
| Fund shares sold | | | 137,692 | |
| Prepaid expenses | | | 50,765 | |
| Total assets | | | 305,770,123 | |
| | | | |
| LIABILITIES | | | | |
| Payables: | | | | |
| Due to affiliate (Note 5) | | | 193,960 | |
| Fund shares redeemed | | | 380,741 | |
| Accrued expenses | | | 85,567 | |
| Total liabilities | | | 660,268 | |
| | | | | |
| NET ASSETS | | $ | 305,109,855 | |
| | | | | |
| Capital shares issued and outstanding (60,000,000 shares authorized, $0.01 par value) | | | 12,013,080 | |
| | | | | |
| Net asset value, offering and redemption price per share | | $ | 25.40 | |
| | | | | |
| COMPONENTS OF NET ASSETS | | | | |
| Capital stock at par value | | $ | 120,131 | |
| Paid-in capital | | | 213,780,893 | |
| Accumulated undistributed net investment income | | | 2,867,986 | |
| Accumulated net realized gain on investments | | | 14,974,567 | |
| Net unrealized appreciation on investments | | | 73,366,278 | |
| NET ASSETS | | $ | 305,109,855 | |
The accompanying notes are an integral part of these financial statements.
STATEMENT OF OPERATIONS For the Six Months Ended June 30, 2017 (Unaudited) |
| INVESTMENT INCOME | | | |
| Income | | | |
| Interest | | $ | 2,367,794 | |
| Dividends (net of foreign withholding taxes of $12,667) | | | 1,827,978 | |
| Total income | | | 4,195,772 | |
| | | | | |
| Expenses | | | | |
| Advisory fees (Note 5) | | | 1,179,385 | |
| Sub transfer agent fees | | | 85,032 | |
| Administration fees | | | 71,939 | |
| Fund accounting fees | | | 32,442 | |
| Transfer agent fees | | | 32,261 | |
| Administration fees - Corbyn (Note 5) | | | 30,820 | |
| Legal fees | | | 22,843 | |
| Directors fees | | | 22,316 | |
| Blue sky fees | | | 15,334 | |
| Reports to shareholders | | | 14,936 | |
| Audit fees | | | 14,628 | |
| Custody fees | | | 14,543 | |
| Insurance fees | | | 14,300 | |
| Miscellaneous fees | | | 2,165 | |
| Total expenses | | | 1,552,944 | |
| Net investment income | | | 2,642,828 | |
| | | | | |
| NET REALIZED AND CHANGE IN NET UNREALIZED GAIN ON INVESTMENTS | | | | |
| Net realized gain on sale of investments | | | 9,703,318 | |
| Change in net unrealized appreciation on investments | | | (4,221,449 | ) |
| Net realized and change in net unrealized gain on investments | | | 5,481,869 | |
| Net increase in net assets resulting from operations | | $ | 8,124,697 | |
The accompanying notes are an integral part of these financial statements.
| STATEMENTS OF CHANGES IN NET ASSETS |
| | | Six Months Ended | | | Year Ended | |
| | | June 30, 2017# | | | December 31, 2016 | |
| INCREASE (DECREASE) IN NET ASSETS FROM: | | | | | | |
| | | | | | | |
| OPERATIONS | | | | | | |
| Net investment income | | $ | 2,642,828 | | | $ | 3,905,682 | |
| Net realized gain on sale of investments | | | 9,703,318 | | | | 10,160,677 | |
| Change in net unrealized appreciation on investments | | | (4,221,449 | ) | | | 38,285,096 | |
| Net increase in net assets resulting from operations | | | 8,124,697 | | | | 52,351,455 | |
| | | | | | | | | |
| DISTRIBUTIONS TO SHAREHOLDERS | | | | | | | | |
| From net investment income | | | — | | | | (4,067,707 | ) |
| From net realized gain | | | — | | | | (16,730,381 | ) |
| Total distributions to shareholders | | | — | | | | (20,798,088 | ) |
| | | | | | | | | |
| CAPITAL SHARE TRANSACTIONS | | | | | | | | |
| Net decrease in net assets derived | | | | | | | | |
from net change in outstanding shares(a) | | | (25,893,099 | ) | | | (26,110,999 | ) |
| | | | | | | | | |
| Total increase (decrease) in net assets | | | (17,768,402 | ) | | | 5,442,368 | |
| | | | | | | | | |
| NET ASSETS | | | | | | | | |
| Beginning of period | | | 322,878,257 | | | | 317,435,889 | |
| End of period (including accumulated net investment | | | | | | | | |
| income of $2,867,986 and $225,158, respectively) | | $ | 305,109,855 | | | $ | 322,878,257 | |
(a) | A summary of capital share transactions is as follows: |
| | | | Six Months Ended | | | Year Ended | |
| | | | June 30, 2017# | | | December 31, 2016 | |
| | | | Shares | | | Value | | | Shares | | | Value | |
| | Shares sold | | | 753,390 | | | $ | 18,830,237 | | | | 1,548,414 | | | $ | 36,991,034 | |
| | Shares issued in reinvestment of distributions | | | — | | | | — | | | | 864,943 | | | | 20,391,300 | |
| | Shares redeemed+ | | | (1,776,395 | ) | | | (44,723,336 | ) | | | (3,690,374 | ) | | | (83,493,333 | ) |
| | Net decrease | | | (1,023,005 | ) | | $ | (25,893,099 | ) | | | (1,277,017 | ) | | $ | (26,110,999 | ) |
| # | Unaudited. |
+ | Net of redemption fees of $2,449 and $2,795, respectively. |
The accompanying notes are an integral part of these financial statements.
FINANCIAL HIGHLIGHTS For a capital share outstanding throughout each period |
| | | Six Months | | | | | | | | | | | | | | | | |
| | | Ended | | | | | | | | | | | | | | | | |
| | | June 30, | | | Year Ended December 31, | |
| | | 2017# | | | | 2016 | | | | 2015 | | | | 2014 | | | | 2013 | | | | 2012 | |
| Net asset value, beginning of period | | $ | 24.77 | | | $ | 22.18 | | | $ | 24.80 | | | $ | 26.47 | | | $ | 23.23 | | | $ | 22.70 | |
| | | | | | | | | | | | | | | | | | | | | | | | | |
| INCOME (LOSS) FROM INVESTMENT OPERATIONS: | | | | | | | | | | | | | | | | | | | | | |
| Net investment income | | | 0.22 | | | | 0.32 | | | | 0.54 | | | | 0.70 | | | | 0.61 | | | | 0.67 | |
Net realized and unrealized gain (loss) on investments | | | 0.41 | | | | 3.96 | | | | (1.98 | ) | | | (1.35 | ) | | | 3.57 | | | | 1.35 | |
| Total from investment operations | | | 0.63 | | | | 4.28 | | | | (1.44 | ) | | | (0.65 | ) | | | 4.18 | | | | 2.02 | |
| | | | | | | | | | | | | | | | | | | | | | | | | |
| LESS DISTRIBUTIONS: | | | | | | | | | | | | | | | | | | | | | | | | |
| From net investment income | | | — | | | | (0.33 | ) | | | (0.53 | ) | | | (0.70 | ) | | | (0.58 | ) | | | (0.88 | ) |
| From net realized gain | | | — | | | | (1.36 | ) | | | (0.65 | ) | | | (0.32 | ) | | | (0.36 | ) | | | (0.61 | ) |
| Total distributions | | | — | | | | (1.69 | ) | | | (1.18 | ) | | | (1.02 | ) | | | (0.94 | ) | | | (1.49 | ) |
| Net asset value, end of period | | $ | 25.40 | | | $ | 24.77 | | | $ | 22.18 | | | $ | 24.80 | | | $ | 26.47 | | | $ | 23.23 | |
| Total return | | 2.54 | %^ | | | 19.78 | % | | | (5.86 | %) | | | (2.51 | %) | | | 18.13 | % | | | 9.07 | % |
| | | | | | | | | | | | | | | | | | | | | | | | | |
| RATIOS/SUPPLEMENTAL DATA: | | | | | | | | | | | | | | | | | | | | | | | | |
| Net assets, end of period (millions) | | $ | 305.1 | | | $ | 322.9 | | | $ | 317.4 | | | $ | 671.1 | | | $ | 868.3 | | | $ | 650.9 | |
| Ratio of expenses to average net assets | | | 0.97 | %+ | | | 1.01 | % | | | 0.95 | % | | | 0.89 | % | | | 0.92 | % | | | 0.93 | % |
Ratio of net investment income to average net assets | | | 1.66 | %+ | | | 1.32 | % | | | 1.93 | % | | | 2.54 | % | | | 2.25 | % | | | 2.89 | % |
| Portfolio turnover rate | | 29 | %^ | | | 48 | % | | | 25 | % | | | 50 | % | | | 68 | % | | | 28 | % |
| # | Unaudited. |
| ^ | Not Annualized. |
| + | Annualized. |
The accompanying notes are an integral part of these financial statements.
NOTES TO FINANCIAL STATEMENTS June 30, 2017 (Unaudited) |
| Note 1 – Significant Accounting Policies |
Greenspring Fund, Incorporated (the “Fund”) is a diversified, open-end management investment company registered under the Investment Company Act of 1940, as amended (the “1940 Act”). The Fund is organized as a Maryland corporation and commenced operations on July 1, 1983. Corbyn Investment Management, Inc. (the “Adviser” or “Corbyn”) is the Fund’s investment adviser.
The preparation of the financial statements in accordance with accounting principles generally accepted in the United States of America (“GAAP”) requires management to make estimates and assumptions that affect the reported amounts and disclosures in the financial statements. Actual results could differ from those estimates. In preparing these financial statements, the Fund has evaluated events and transactions for potential recognition or disclosure through the date the financial statements were issued.
The Fund is an investment company and accordingly follows the investment company accounting and reporting guidance of the Financial Accounting Standards Board (FASB) Accounting Standard codification topic 946 “Financial Services – Investment Companies.”
Investment transactions and related investment income – Investment transactions are recorded on the trade date. Dividend income is recorded on the ex-dividend date and interest income, including amortization of premiums and accretion of discounts, is recorded on the accrual basis. Dividends determined to be a return of capital are recorded as a reduction of the cost basis of the security. Realized gains and losses from investment transactions are reported on an identified cost basis.
Valuation of Investments – Generally, the Fund’s investments are valued at market value. Equity securities traded on a principal stock exchange are valued at the last quoted sale price. Equity securities traded on the NASDAQ National Market System (“NASDAQ”) are normally valued at the official closing price provided by NASDAQ. Equity securities that are not traded on a principal exchange or NASDAQ are valued at the last sale price in the over-the-counter market. In the absence of a last sale price or official closing price, or if there is no trading in a security on a business day, the security will be valued at the mean between its closing bid and asked prices obtained from sources the Adviser deems appropriate pursuant to policies and procedures approved by the Fund’s Board of Directors (the “Board”). Equity securities in an active market will be classified as Level 1 securities.
Investments in mutual funds, including money market funds, are valued at the mutual fund’s closing net asset value per share on the day of valuation. The prospectuses for such investment companies contain information on those investment companies’ valuation procedures and the effects of fair valuation. These securities will be classified as Level 1 securities.
Short-term debt instruments, including commercial paper or U.S. Treasury bills, having a maturity of 60 days or less may be valued at amortized cost, which approximates fair value. Amortized cost will not be used if its use would be inappropriate due to credit or other impairments of the issuer. These debt instruments will generally be classified as Level 2 securities.
Debt securities, such as corporate or convertible bonds, including those having a maturity or an announced call within 60 days, are generally traded in the over-the-counter market. These securities are valued at prices obtained from an independent pricing service, which may consider the yield or price of bonds of similar quality, coupon, maturity and type, as well as prices supplied by dealers who make markets in such securities. In the absence of a price from a pricing service, or if a quotation does not appear to accurately reflect the current value of a security, debt securities are valued at
NOTES TO FINANCIAL STATEMENTS June 30, 2017 (Unaudited) (Con’t) |
the mean of the closing bid and asked prices from sources the Adviser deems appropriate pursuant to policies and procedures approved by the Board. Debt securities will generally be classified as Level 2 securities.
Any securities for which market quotations are not readily available or for which the above valuation procedures are not appropriate or do not reflect fair market value are valued at fair value as determined in good faith by the Adviser pursuant to policies and procedures approved by the Board.
In determining fair value, the Adviser, as directed by the Board, considers all relevant qualitative and quantitative information available. These factors are subject to change over time and are reviewed periodically. The values assigned to fair value investments are based on available information and do not necessarily represent amounts that might ultimately be realized, since such amounts depend on future developments inherent in long-term investments. Further, because of the inherent uncertainty of valuation, those estimated values may differ significantly from the values that would have been used had a ready market for the investments existed, and the differences could be material.
The Fund has adopted fair valuation accounting standards that establish an authoritative definition of fair value and set out a hierarchy for measuring fair value. These standards require additional disclosures about the various input and valuation techniques used in measuring fair value. Fair value inputs are summarized in the three broad levels listed below:
| Level 1 – | Unadjusted quoted prices in active markets for identical securities that the Fund has the ability to access. |
| Level 2 – | Observable inputs other than quoted prices included in Level 1 that are observable for the security, either directly or indirectly. These inputs may include quoted prices for the identical instrument on an inactive market, prices for similar instruments, interest rates, prepayment speeds, credit risk, yield curves, default rates and similar data. |
| Level 3 – | Unobservable inputs for the security, to the extent relevant observable inputs are not available, representing the Fund’s own assumptions about the assumptions a market participant would use in valuing the security, and which would be based on the best information available. |
The inputs or methodology used for valuing securities are not necessarily an indication of the risk associated with investing in these securities. The following is a summary of the inputs used to value the Fund’s net assets as of June 30, 2017:
| | | Quoted Prices | | | Significant Other | | | Significant | | | Carrying Value, | |
| | | in Active | | | Observable | | | Unobservable | | | at June 30, | |
| | | Market | | | Inputs | | | Inputs | | | 2017 | |
| | | Level 1 | | | Level 2 | | | Level 3 | | | Total | |
| Common Stocks* | | $ | 211,647,245 | | | $ | — | | | $ | — | | | $ | 211,647,245 | |
| Corporate Bonds* | | | — | | | | 77,411,000 | | | | — | | | | 77,411,000 | |
| Short-Term Investments | | | 13,764,013 | | | | — | | | | — | | | | 13,764,013 | |
| Total | | $ | 225,411,258 | | | $ | 77,411,000 | | | $ | — | | | $ | 302,822,258 | |
* See Schedule of Investments for industry breakdown.
Transfers between levels are recognized at the end of the reporting period. During the period ended June 30, 2017, the Fund had no transfers between levels. The Fund did not have any Level 3 securities during the period.
NOTES TO FINANCIAL STATEMENTS June 30, 2017 (Unaudited) (Con’t) |
Dividends and distributions to stockholders – The Fund records dividends and distributions to shareholders on the ex-dividend date.
Redemption fees – The Board has adopted policies and procedures with respect to frequent purchases and redemptions of Fund shares by Fund shareholders. The Fund is intended for long-term investors. The Fund discourages and does not accommodate frequent purchases and redemptions of Fund shares by Fund shareholders. The Fund reserves the right to decline a purchase order for any reason.
“Market-timers” who engage in frequent purchases and redemptions over a short period can disrupt the Fund’s investment program by requiring the Fund to have excess cash on hand or to liquidate holdings to accommodate redemptions. In addition, frequent purchases and redemptions may impede efficient Fund management and create additional transaction costs that are borne by all shareholders. To the extent that the Fund invests a significant portion of its assets in small-cap securities or high-yield bonds, it may be subject to the risks of market timing more than a fund that does not. Therefore, the Fund imposes a 2% redemption fee for shares held 60 days or less. The fee is deducted from the seller’s redemption proceeds and deposited into the Fund to help offset brokerage commissions, market impact, and other costs associated with fluctuations in Fund asset levels and cash flow caused by short-term trading. All shareholders are subject to these restrictions regardless of whether you purchased your shares directly from the Fund or through a financial intermediary. However, the Fund is limited in its ability to determine whether trades placed through financial intermediaries may signal excessive trading. Accordingly, the Fund may not be able to determine whether trading in combined orders or in omnibus accounts is contrary to the Fund’s policies. The Fund reserves the right to reject combined or omnibus orders in whole or in part.
To calculate redemption fees, after first redeeming any shares associated with reinvested dividends or other distributions, the “first-in, first out” method is used to determine the holding period. Under this method, the date of redemption will be compared with the earliest purchase date of shares held in the account. If the holding period for shares purchased is 60 days or less, the fee will be charged. The redemption fee may be modified or discontinued at any time, in which case, shareholders will be notified. The redemption fee does not apply to shares acquired through the reinvestment of dividends or other distributions, or shares redeemed pursuant to a systematic withdrawal plan or a mandatory IRA distribution.
In compliance with Rule 22c-2 under the 1940 Act, Quasar Distributors, LLC, on behalf of the Fund, has entered into written agreements with each of the Fund’s financial intermediaries, under which the intermediaries must, upon request, provide the Fund with certain shareholder and identity trading information so that the Fund can enforce its frequent trading policies.
Risk of loss arising from indemnifications – In the normal course of business, the Fund enters into contracts that contain a variety of representations, which provide general indemnifications. The Fund’s maximum exposure under these arrangements is unknown as this would involve future claims that may be made against the Fund that have not yet occurred. However, based on experience, the Fund expects the risk of loss to be remote.
| Note 2 – Dividends and Distributions |
The Fund’s policy is to declare dividends from net investment income and distributions from net realized gains as determined in accordance with the Internal Revenue Code which may differ from GAAP. Accordingly, periodic reclassifications are made within the portfolio’s capital accounts to reflect income and gains available for distribution under income tax regulations.
NOTES TO FINANCIAL STATEMENTS June 30, 2017 (Unaudited) (Con’t) |
On July 13, 2016 an income dividend of $0.23 per share and a long-term capital gain distribution of $0.9777 were declared, payable on July 14, 2016, to shareholders of record on July 12, 2016. Additionally, on December 20, 2016, an income dividend of $0.0997 per share and a long-term capital gain distribution of $0.3792 per share were declared, payable on December 21, 2016 to shareholders of record on December 19, 2016. The tax character of distributions paid during the six months ended June 30, 2017 and the year ended December 31, 2016 were as follows:
| | Distributions paid from: | | June 30, 2017 | | | December 31, 2016 | |
| | Ordinary income | | $ | — | | | $ | 4,067,707 | |
| | Long-term capital gain | | $ | — | | | $ | 16,730,381 | |
These dividends are either distributed to shareholders or reinvested in the Fund as additional shares issued to shareholders. For those shareholders reinvesting the dividends, the number of shares issued is based on the net asset value per share as of the close of business on the ex-dividend date.
The Fund designated as long-term capital gain dividend, pursuant to Internal Revenue Code Section 852(b)(3), the amount necessary to reduce the earnings and profits of the Fund related to net capital gain to zero for the tax year ended December 31, 2016.
| Note 3 – Purchases and Sales of Investments |
For the six months ended June 30, 2017, purchases and sales of investments, other than short-term investments, aggregated $89,200,926 and $85,863,103, respectively. There were no purchases or sales of U.S. government securities for the Fund.
| Note 4 – Federal Income Taxes |
The Fund’s policy is to comply with the requirements of the Internal Revenue Code applicable to regulated investment companies. Accordingly, the Fund intends to distribute substantially all of its taxable income. Therefore, no federal income tax provision is required.
As of, and during, the six months ended June 30, 2017, the Fund did not have any tax positions that did not meet the “more-likely-than-not” threshold of being sustained by the applicable tax authority. Tax positions not deemed to meet the “more-likely-than-not” threshold would be recorded as a tax benefit or expense in the current year. Generally, tax authorities can examine tax returns filed for all open tax years (2013-2016).
Required Fund distributions are based on income and capital gain amounts determined in accordance with federal income tax regulations, which differ from net investment income and realized gains recognized for financial reporting purposes.
Accordingly, the composition of net assets and distributions on a tax basis may differ from those reflected in the accompanying financial statements. As of December 31, 2016, the Fund’s most recently completed year end, the components of distributable earnings on a tax basis were as follows:
NOTES TO FINANCIAL STATEMENTS June 30, 2017 (Unaudited) (Con’t) |
| | Cost of investments | | $ | 244,688,035 | |
| | Gross tax unrealized appreciation | | | 82,307,450 | |
| | Gross tax unrealized depreciation | | | (4,750,763 | ) |
| | Net tax unrealized appreciation | | | 77,556,687 | |
| | Undistributed ordinary income | | | 225,158 | |
| | Undistributed long-term capital gain | | | 5,302,289 | |
| | Total distributable earnings | | | 5,527,447 | |
| | Other accumulated losses | | | — | |
| | Total accumulated earnings | | $ | 83,084,134 | |
Accounting principles generally accepted in the United States of America require that certain components of net assets relating to permanent differences be reclassified between financial and tax reporting. These reclassifications have no effect on net assets or net asset value per share. For the year ended December 31, 2016, the Fund increased undistributed net investment income by $371 and decreased accumulated net realized gain on investments by $371. As of December 31, 2016, the Fund did not have a post-October capital loss or a capital loss carryforward.
| Note 5 – Transactions with Affiliated Parties |
Under an agreement between the Fund and Corbyn, the Fund pays Corbyn a fee of 0.75% of the first $250 million of average daily net assets, 0.70% of average daily net assets between $250 million and $500 million and 0.65% of average daily net assets in excess of $500 million, which is computed daily and paid monthly. For the six months ended June 30, 2017, the Fund incurred $1,179,385 in advisory fees.
The Fund has also entered into a Services Agreement with Corbyn to provide various administrative services. As compensation, the Fund pays Corbyn a fee of $2,500 per month plus 0.01% of average daily net assets, which is computed daily and paid monthly. For the six months ended June 30, 2017, the Fund incurred $30,820 in administrative fees to Corbyn.
At June 30, 2017, investors for whom Corbyn was investment adviser held 1,038,742 shares of the Fund.
| Note 6 – Accounting Pronouncements |
In March 2017, the Financial Accounting Standards Board (FASB) issued Accounting Standards Update (ASU) No. 2017-08, Receivables—Nonrefundable Fees and Other Costs (Subtopic 310-20): Premium Amortization on Purchased Callable Debt Securities. The amendments in the ASU shorten the amortization period for certain callable debt securities, held at a premium, to be amortized to the earliest call date. The ASU does not require an accounting change for securities held at a discount; which continues to be amortized to maturity. The ASU is effective for fiscal years and interim periods within those fiscal years beginning after December 15, 2018. The Adviser is currently evaluating the impact, if any, of applying this provision.
NOTES TO FINANCIAL STATEMENTS June 30, 2017 (Unaudited) (Con’t) |
| Note 7 – Subsequent Events |
On July 20, 2017 an income dividend of $0.25 per share and a long-term capital gain distribution of $0.44687 per share were declared, payable on July 21, 2017, to shareholders of record on July 19, 2017. Management has evaluated other events and transactions occurring after June 30, 2017 through the date that the financial statements were issued, and has determined that no additional disclosure in the financial statements is required.
APPROVAL OF INVESTMENT ADVISORY AGREEMENT (Unaudited) |
Continuance of the Investment Advisory Agreement (the “Agreement”) must be considered annually by the directors of the Fund who are not parties to the Agreement or “interested persons” of any such party (as defined in the 1940 Act) (the “Independent Directors”). In order for continuance to be approved, a majority of the Independent Directors must vote for such approval at an in-person meeting called for this purpose.
The Board of Directors (the “Board”), including a majority of the Independent Directors, approved the continuance of the Agreement most recently at an in-person meeting in February 2017. To assist the Directors in their evaluation of the Agreement, the Board was supplied with extensive information by the Adviser in advance of the meeting. After a detailed presentation by the Adviser, during which the written materials were reviewed and questions from the Board were answered, the Independent Directors met separately to consider the approval of the Agreement. The Board as a whole, and the Independent Directors voting separately, then approved the continuation of the Agreement as being in the best interest of the Fund. In considering the Agreement, the Board did not identify any particular overriding factor, but considered all the information available.
Below is a summary of the primary factors considered by the Board and the conclusions thereto that formed the basis for the Board approving the continuance of the Agreement:
| | 1. | The nature, extent, and quality of the services to be provided by the Adviser under the Agreement. The Board reviewed the qualifications and experience of the Fund’s portfolio manager and other key personnel of the Adviser involved in the day-to-day activities of the Fund. The Board considered the Adviser’s resources and compliance structure. The Board reviewed the compliance program of the Adviser and the qualifications of the CCO of the Adviser and the Fund, as well as the Adviser’s compliance record and the Adviser’s oversight of the Fund’s third-party service providers. Additionally, the Board discussed the Adviser’s resources to market the Fund and efforts to maintain and grow its assets to benefit shareholders. The Board concluded that the Adviser had sufficient quality and depth of personnel, resources, investment methods, compliance policies and procedures to perform its duties under the Advisory Agreement and that the nature, overall quality, and extent of the management services were satisfactory and reliable. |
| | 2. | The Fund’s historical investment performance. The Board discussed the short- and long-term investment performance of the Fund on an absolute basis and compared to category benchmarks, relative market indices and major market indices. The Board noted that for the year ended December 31, 2016, the Fund’s one-year returns were above the average performance of its category benchmarks. As part of its analysis of investment performance, the Board considered the Fund’s investment objective, relative market conditions, consistency of returns and level of risk taken. The Board concluded that the Fund’s historical investment performance was satisfactory given the market conditions, level of risk taken, consistency of returns and the Fund’s long-term performance objective. |
| | 3. | The costs of the services to be provided by the Adviser and the structure of the Adviser’s fees under the Advisory Agreement. The Board reviewed a presentation prepared by the Adviser comparing the Fund to a group of peer funds, which were similar in asset size, operating, and expense structure. The Board considered that the Fund’s contractual advisory fee and total expense ratio were less than the median contractual advisory fee and total expense ratio of the peer funds at a common net asset level. The Board discussed that the advisory |
APPROVAL OF INVESTMENT ADVISORY AGREEMENT (Unaudited) (Con’t) |
| | | fee, non-advisory expenses and total expenses as a percentage of net assets increased from prior years primarily due to the Fund’s lower average net assets during the most-recent year. The Board concluded that the Adviser had consistently maintained an annual expense ratio below the peer group median without waiving and/or reimbursing any Fund fees or expenses. Additionally, the Board was provided information on the services the Adviser provides to separately managed accounts and considered how those services differ from the services provided to the Fund. The Board concluded that the fee structure of the Advisory Agreement was reasonable. |
| | 4. | Economies of scale. The Board noted that the Advisory Agreement’s fee schedule includes breakpoints at net asset levels of $250 million and $500 million, whereby the fee paid by the Fund decreases at higher asset levels. The Board noted that, although the Fund’s net assets had begun to increase during the latter part of the past year, the shareholders only benefited from the $250 million breakpoint during 2016. |
| | 5. | Costs of services provided and profits to be realized by the Adviser. The Board also discussed the profitability of the Agreement with the representatives of the Adviser. The Board concluded that the profitability of the Adviser with respect to the Agreement was reasonable, and that the Adviser maintained adequate profit levels to support the services being provided to the Fund. |
| | 6. | Other factors and considerations. The Board also discussed the quality of management, advisory and other services provided by the Advisor to the Fund throughout the year. The Board considered the Adviser’s receipt of brokerage and research services in exchange for soft dollar commissions paid by the Fund. The Board also reviewed the Adviser’s management of its relationships with the Fund’s third-party service providers. The Board discussed the Fund’s portfolio management presentations and the detailed information relating to the Fund’s portfolio and performance presented at its quarterly meetings. |
NOTICE TO SHAREHOLDERS June 30, 2017 (Unaudited) |
Tax Information
The Fund designates 65.87% of dividends declared from net investment income during the fiscal year ended December 31, 2016 as qualified income under the Jobs and Growth Tax Relief Reconciliation Act of 2003.
For corporate shareholders in the Fund, the percentage of ordinary dividend income distributed for the year ended December 31, 2016, which is designated as qualifying for the dividends-received deduction, is 59.03%.
For foreign shareholders in the Fund, for the year ended December 31, 2016, 62.36% of the ordinary distributions paid qualify as interest-related dividends under the Internal Revenue Code Section 871(k)(1)(c), and 0.00% of the ordinary income distributions are designated as short-term capital gain distributions under Internal Revenue Code Section 871(k)(2)(c).
Proxy Voting Policies and Proxy Voting Record
The Fund’s proxy voting policies and procedures, as well as its proxy voting record for the most recent 12-month period ended June 30, are available without charge, upon request, by contacting the Fund at (800) 366-3863 or info@greenspringfund.com. The Fund will send the information within three business days of receipt of the request, by first class mail or other means designed to ensure equally prompt delivery. The Fund’s proxy voting record is also available on the U.S. Securities and Exchange Commission’s website at www.sec.gov.
Form N-Q Holdings Information
The Fund files its complete schedule of portfolio holdings with the U.S. Securities and Exchange Commission for the first and third quarters of each fiscal year on Form N-Q. The Fund’s Forms N-Q are available on the Commission’s website at www.sec.gov and may be reviewed and copied at the Commission’s Public Reference Room in Washington, DC. Information on the operation of the Public Reference Room may be obtained by calling (800) SEC-0330.
Reports and Householding
In an attempt to reduce shareholder expenses, we will mail only one copy of the Fund’s Summary Prospectus and each Annual and Semi-Annual Report to those addresses shared by two or more accounts. If you wish to receive individual copies of these documents, please call us at (800) 366-3863. We will begin sending you individual copies 30 days after receiving your request.
The Fund’s Summary Prospectus, Prospectus, Statement of Additional Information, Annual Report, and Semi-Annual Report, along with its first and third quarter portfolio holdings, are available on the Fund’s website at www.greenspringfund.com.
PRIVACY POLICY June 30, 2017 (Unaudited) |
The Greenspring Fund recognizes that individuals expect an exceptional level of privacy in their financial affairs. The Fund assures the confidentiality of personal information provided to it.
The information we collect is limited to what the Fund believes is necessary or useful to conduct our business; administer your records, accounts and funds; to comply with laws and regulations; and to help us design or improve products and services. The Fund collects non-public personal information about you from information it receives from you on applications or other forms or through its website, as well as from information about your transactions with the Fund.
Some of this information may be disclosed to the Fund’s investment adviser, but not for marketing solicitation, as well as non-affiliated third parties who provide non-financial services to the Fund such as our Transfer Agent, in order to administer customer accounts and mail transaction confirmations and tax forms, and the mailing house the Fund utilizes for mailing shareholder reports. Such information may also be disclosed to a non-affiliated third party engaged to provide fund accounting and administrative services to us. Disclosing this information enables us to meet customers’ financial needs and regulatory requirements. These third parties act on its behalf and are obligated to keep the information we provide to them confidential and to use the information only for the purposes authorized. The Fund does not disclose any non-public personal information about you or former customers to anyone, except as permitted by law.
To protect your non-public personal information, the Fund permits access to it only by authorized employees and maintains security practices to safeguard your information.
If you have any questions regarding our Privacy Policy, please contact us at 1-800-366-3863 or greenspring@greenspringfund.com. Thank you.
This Privacy Policy is not part of the Semi-Annual Report.
Performance Since Inception on
July 1, 1983 through June 30, 2017
(Unaudited)
| |
| HOW $10,000 INVESTED ON 7/1/83 WOULD HAVE GROWN* |
| |
 |
| |
| * | Figures include changes in principal value, reinvested dividends and capital gains distributions. Past expense limitations increased the Fund’s return. This chart illustrates the performance of a hypothetical $10,000 investment made in the Fund since inception through June 30, 2017. The total value of $208,829 assumes the reinvestment of dividends and capital gains, but does not reflect the effect of any redemption fees. This chart does not imply any future performance. |
Average annual total returns for the one, three, five, ten year and since inception periods ended June 30, 2017 were 15.83%, 3.29%, 7.30%, 4.91% and 9.35%, respectively. Average annual returns for more than one year assume a compounded rate of return and are not the Fund’s year-by-year results, which fluctuated over the periods shown. Returns do not reflect taxes that shareholders may pay on Fund distributions or redemption of Fund shares.
(This Page Intentionally Left Blank.)
Greenspring Fund, Incorporated
2330 West Joppa Road, Suite 110
Lutherville, MD 21093
(410) 823-5353
(800) 366-3863
www.greenspringfund.com
DIRECTORS
Charles vK. Carlson, Chairman
William E. Carlson
David T. Fu
Sean T. Furlong
Michael J. Fusting
OFFICERS
Charles vK. Carlson
President and Chief Executive Officer
Michael J. Fusting
Sr. Vice President and
Chief Financial Officer
Elizabeth Agresta Swam
Chief Compliance Officer,
Secretary, Treasurer
and AML Officer
INVESTMENT ADVISER
Corbyn Investment Management, Inc.
2330 West Joppa Road, Suite 108
Lutherville, MD 21093-7207
ADMINISTRATOR, FUND ACCOUNTANT
AND TRANSFER AGENT
U.S. Bancorp Fund Services, LLC
615 East Michigan Street
Milwaukee, WI 53202
DISTRIBUTOR
Quasar Distributors, LLC
777 East Wisconsin Avenue
Milwaukee, WI 53202
CUSTODIAN
U.S. Bank, N.A.
1555 N. Rivercenter Dr., Suite 302
Milwaukee, WI 53212
LEGAL COUNSEL
K&L Gates LLP
1601 K Street NW
Washington, DC 20006
Symbol – GRSPX
CUSIP – 395724107
Item 2. Code of Ethics.
Not applicable for semi-annual reports.
Item 3. Audit Committee Financial Expert.
Not applicable for semi-annual reports.
Item 4. Principal Accountant Fees and Services.
Not applicable for semi-annual reports.
Item 5. Audit Committee of Listed Registrants.
Not applicable to registrants who are not listed issuers (as defined in Rule 10A-3 under the Securities Exchange Act of 1934).
Item 6. Investments.
(a) Schedule of Investments is included as part of the report to shareholders filed under Item 1 of this Form.
(b) Not applicable
Item 7. Disclosure of Proxy Voting Policies and Procedures for Closed-End Management Investment Companies.
Not applicable to open-end investment companies.
Item 8. Portfolio Managers of Closed-End Management Investment Companies.
Not applicable to open-end investment companies.
Item 9. Purchases of Equity Securities by Closed‑End Management Investment Company and Affiliated Purchasers.
Not applicable to open-end investment companies.
Item 10. Submission of Matters to a Vote of Security Holders.
Not Applicable.
Item 11. Controls and Procedures.
| (a) | The Registrant’s Chief Executive Officer and Chief Financial Officer have reviewed the Registrant's disclosure controls and procedures (as defined in Rule 30a-3(c) under the Investment Company Act of 1940 (the “Act”) (17 CFR 270.30a-3(c))) as of a date within 90 days of the filing date of the report that includes the disclosure required by this paragraph, based on the evaluation of these controls and procedures required by Rule 30a-3(b) under the Act (17 CFR 270.30a-3(b)) and Rules 13a-15(b) or 15d‑15(b) under the Securities Exchange Act of 1934 (17 CFR 240.13a-(15(b) or 240.15d-15(b)). Based on their review, such officers have concluded that the disclosure controls and procedures are effective in ensuring that information required to be disclosed in this report is appropriately recorded, processed, summarized and reported and made known to them by others within the Registrant and by the Registrant’s service provider. |
| (b) | There were no changes in the Registrant's internal control over financial reporting (as defined in Rule 30a-3(d) under the Act (17 CFR 270.30a-3(d)) that occurred during the second fiscal quarter of the period covered by this report that has materially affected, or is reasonably likely to materially affect, the Registrant's internal control over financial reporting. |
Item 12. Exhibits.
| (a) | (1) Any code of ethics, or amendment thereto, that is the subject of the disclosure required by Item 2, to the extent that the registrant intends to satisfy Item 2 requirements through filing an exhibit. Not Applicable. |
(2) A separate certification for each principal executive and principal financial officer of the registrant as required by Rule 30a-2(a) under the Act (17 CFR 270.30a-2(a)), exactly as set forth below: Filed herewith.
(3) Any written solicitation to purchase securities under Rule 23c‑1 under the Act (17 CFR 270.23 C-1) sent or given during the period covered by the report by or on behalf of the registrant to 10 or more persons. Not applicable to open-end investment companies.
| (b) | Certifications pursuant to Section 906 of the Sarbanes‑Oxley Act of 2002. Furnished herewith. |
SIGNATURES
Pursuant to the requirements of the Securities Exchange Act of 1934 and the Investment Company Act of 1940, the registrant has duly caused this report to be signed on its behalf by the undersigned, thereunto duly authorized.
(Registrant) Greenspring Fund, Incorporated
By (Signature and Title)* /s/Charles vK. Carlson
Charles vK. Carlson, Chief Executive Officer
Date August 24, 2017
Pursuant to the requirements of the Securities Exchange Act of 1934 and the Investment Company Act of 1940, this report has been signed below by the following persons on behalf of the registrant and in the capacities and on the dates indicated.
By (Signature and Title)* /s/Charles vK. Carlson
Charles vK. Carlson, Chief Executive Officer
Date August 24, 2017
By (Signature and Title)* /s/Michael J. Fusting
Michael J. Fusting, Chief Financial Officer
Date August 24, 2017
* Print the name and title of each signing officer under his or her signature.