| | |
| UNITED STATES
SECURITIES AND EXCHANGE COMMISSION |
| | |
| CERTIFIED SHAREHOLDER REPORT OF REGISTERED
MANAGEMENT INVESTMENT COMPANIES
|
| | |
| Investment Company Act file number: | (811–03630) |
| | |
| Exact name of registrant as specified in charter: | Putnam California Tax Exempt Income Fund |
| | |
| Address of principal executive offices: | 100 Federal Street, Boston, Massachusetts 02110 |
| | |
| Name and address of agent for service: | Robert T. Burns, Vice President
100 Federal Street
Boston, Massachusetts 02110 |
| | |
| Copy to: | Bryan Chegwidden, Esq.
Ropes & Gray LLP
1211 Avenue of the Americas
New York, New York 10036 |
| | |
| Registrant's telephone number, including area code: | (617) 292–1000 |
| | |
| Date of fiscal year end: | September 30, 2020 |
| | |
| Date of reporting period: | October 1, 2019 — March 31, 2020 |
| | |
|
Item 1. Report to Stockholders: | |
| | |
| The following is a copy of the report transmitted to stockholders pursuant to Rule 30e-1 under the Investment Company Act of 1940: | |
Putnam
California Tax Exempt
Income Fund
Semiannual report
3|31|20
IMPORTANT NOTICE: Delivery of paper fund reports
In accordance with regulations adopted by the Securities and Exchange Commission, beginning on January 1, 2021, reports like this one will no longer be sent by mail unless you specifically request it. Instead, they will be on Putnam’s website, and you will be notified by mail whenever a new one is available, and provided with a website link to access the report.
If you wish to stop receiving paper reports sooner, or if you wish to continue to receive paper reports free of charge after January 1, 2021, please see the back cover or insert for instructions. If you invest through a bank or broker, your choice will apply to all funds held in your account. If you invest directly with Putnam, your choice will apply to all Putnam funds in your account.
If you already receive these reports electronically, no action is required.
Message from the Trustees
May 11, 2020
Dear Fellow Shareholder:
After a period of gains and relative tranquility, global financial markets encountered considerable challenges in early 2020 as COVID-19, the disease caused by the coronavirus, spread around the world. By mid-March, major U.S. indexes had fallen into bear market territory, defined as a 20% drop from a previous high. As often happens when stocks decline sharply, bonds generally provided better results. As investors rushed to safe havens, the yield on the benchmark 10-year U.S. Treasury note fell to historic lows.
Central banks and governments worldwide have enacted measures to inject liquidity into the markets and restore confidence. It is still unclear what the costs will be and how long the effects of the COVID-19 pandemic will last, but history has shown that markets recover from downturns. For investors, we believe the most important course of action is to remember your long-term goals and consult with your financial advisor. At Putnam, our investment professionals remain focused on actively managing fund portfolios with a research-intensive approach that includes risk management strategies.
We would like to take this opportunity to announce the arrival of Mona K. Sutphen to your fund’s Board of Trustees. Ms. Sutphen brings extensive professional and directorship experience to her role as a Trustee, and we are pleased to welcome her.
Thank you for investing with Putnam.


There’s an old adage in investing: “It’s not how much you make that matters, it’s how much you keep.” That’s particularly true when it comes to the fixed-income markets and the impact that taxes can have on your investment. The good news is that, unlike Treasuries or corporate bonds, the interest paid on municipal bonds is generally free from federal income taxes. Moreover, California residents generally pay no state income taxes on the distributions paid by municipal bonds issued in the Golden State. That can make municipal bonds particularly attractive to investors subject to higher personal income tax rates.

|
| 2 California Tax Exempt Income Fund |

Source: Putnam, as of 3/31/20. Past performance is no guarantee of future results. Yields for U.S. Treasuries, investment-grade corporates, and municipal bonds are represented by the average “yield to worst” — a calculation of the lowest possible yield generated without defaulting — of the Bloomberg Barclays U.S. Treasury Index, the Bloomberg Barclays U.S. Credit Index, and the Bloomberg Barclays Municipal Bond Index, respectively. You cannot invest directly in an index. Bond investments are subject to interest-rate risk (the risk of bond prices falling if interest rates rise) and credit risk (the risk of an issuer defaulting on interest or principal payments). Interest-rate risk is greater for longer-term bonds, and credit risk is greater for below-investment-grade bonds. Income from municipal bonds may be subject to the alternative minimum tax. Taxable equivalent yield and annual after-tax income are based on a 40.8% federal income tax rate. This rate reflects the Tax Cuts and Jobs Act of 2017 and includes the 3.80% Medicare surtax.
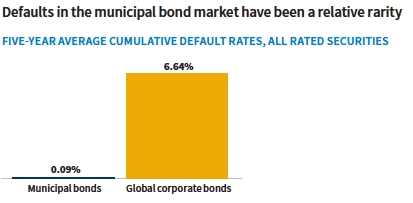
Source: Moody’s Investor Services, Annual U.S. Municipal Bond Defaults and Recoveries, Five-Year Average Cumulative Default Rates, 1970–2018 (August 2019). Most recent data available.
|
| California Tax Exempt Income Fund 3 |
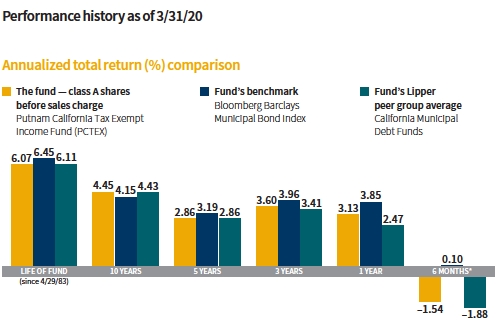
Current performance may be lower or higher than the quoted past performance, which cannot guarantee future results. Share price, principal value, and return will fluctuate, and you may have a gain or a loss when you sell your shares.Performance of class A shares assumes reinvestment of distributions and does not account for taxes. Fund returns in the bar chart do not reflect a sales charge of 4.00%; had they, returns would have been lower. See below and pages 9–10 for additional performance information. For a portion of the periods, the fund had expense limitations, without which returns would have been lower. To obtain the most recent month-end performance, visit putnam.com.
*Returns for the six-month period are not annualized, but cumulative.
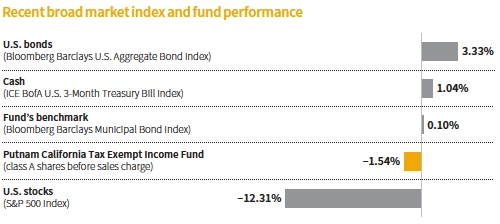
This comparison shows your fund’s performance in the context of broad market indexes for the six months ended 3/31/20. See above and pages 9–10 for additional fund performance information. Index descriptions can be found on pages 14–15.
|
| 4 California Tax Exempt Income Fund |

Paul holds a B.A. from Suffolk University. He has been in the investment industry since he joined Putnam in 1989.
Garrett L. Hamilton, CFA, is also a Portfolio Manager of the fund.
Paul, how did municipal bond funds perform during the reporting period?
Municipal bonds posted positive performance for the first five months of the period, supported by stabilizing U.S. economic fundamentals and positive supply/demand technicals. However, in late February, fears about the spread of the coronavirus and its potential impact on global economic growth sparked a steep sell-off in equities and other high-risk assets. After experiencing their largest inflow year in 2019, municipal bond funds began to see outflows in March, particularly in the lowest tiers of the market. [Fund flows are a measure of investor demand for mutual funds.] The heavy selling led to one of the worst months of performance [–3.63%] for the asset class in decades, as measured by the Bloomberg Barclays Municipal Bond Index [the fund’s benchmark]. The benchmark closed the reporting period with a return of 0.10%.
Credit spreads widened significantly, particularly among lower-quality, high-yield municipals led by airline/airport and tobacco bonds. As investors rushed to safety, even general obligation bonds of highly rated issuers, such as the State of California, sold off. The outflows
|
| California Tax Exempt Income Fund 5 |
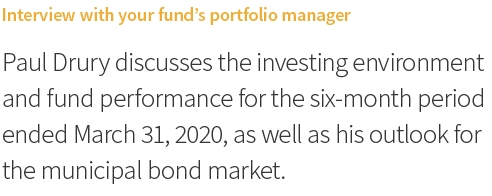
Allocations are shown as a percentage of the fund’s net assets as of 3/31/20. Cash and net other assets, if any, represent the market value weights of cash, derivatives, short-term securities, and other unclassified assets in the portfolio. Summary information may differ from the information in the portfolio schedule notes included in the financial statements due to the inclusion of derivative securities, any interest accruals, the timing of matured security transactions, the use of different classifications of securities for presentation purposes, and rounding. Holdings and allocations may vary over time.
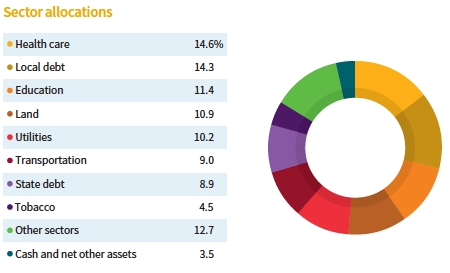
Credit qualities are shown as a percentage of the fund’s net assets as of 3/31/20. A bond rated BBB or higher (SP-3 or higher, for short-term debt) is considered investment grade. This chart reflects the highest security rating provided by one or more of Standard & Poor’s, Moody’s, and Fitch. Ratings may vary over time.
Cash and net other assets, if any, represent the market value weights of cash, derivatives, and short-term securities in the portfolio. The fund itself has not been rated by an independent rating agency.
|
| 6 California Tax Exempt Income Fund |
depressed prices, and yields rose. In turn, the municipal bond market saw a dislocation in the municipal and U.S. Treasury yield relationship, referred to as the Municipal/Treasury [M/T] ratio. The M/T ratio measures the yield on AAA-rated municipal bonds relative to the yield on U.S. Treasury bonds of similar maturities. The higher, or cheaper, the ratio, the more attractive municipal bonds are relative to U.S. Treasuries. Given the sell-off, municipal bonds were yielding more than 100% of Treasury yields. Historically, a ratio in excess of 100% is interpreted as a buy signal and suggests an attractive entry point for long-term investors.
With the health risks posed by the pandemic rising and economic and financial market conditions deteriorating, monetary and fiscal policy makers moved into action. The Federal Reserve lowered interest rates to near zero and increased its asset purchases to help ease tight credit markets. In an especially noteworthy move, the Fed announced on March 23 that it would start buying corporate and municipal debt. This allows cash-strapped states and cities to get loans to tide them over until the U.S. economy bounces back. On March 27, Congress finalized a $2.2 trillion relief package, the largest in history, to help hard-hit industries and to provide relief for families, small businesses, and hospitals and health-care systems.
How did the fund perform during the reporting period?
For the six months ended March 31, 2020, the fund underperformed the benchmark but outperformed the average return of its Lipper peer group, California Municipal Debt Funds.
Did your investment approach shift in response to the pandemic and economic uncertainty?
We did become more cautious in our fundamental outlook. At this point, while we don’t expect widespread defaults in the municipal market, some sectors could be hit harder than others. Small colleges, dorm financing, and weaker names in health care and transportationcome to mind. As such, we have become select sellers of lower-rated bonds in sectors that we believe could encounter more challenging credit conditions and possibly see an uptick in defaults over the next 12 to 24 months. This includes certain project finance, retirement communities, and land development sectors. In addition, we trimmed bonds that we believe may be more susceptible to the economic challenges brought on by the pandemic. Finally, we are carrying 3% to 5% of assets in cash versus a 2% level that is typical of more stable times.

In our view, safe-harbor sectors include state and local general obligation bonds and utilities. We believe states and local governments are in a unique and flexible position with broad capabilities to raise revenue and reduce expenses. And, as I mentioned earlier, the Fed is providing states, and by extension localities, with emergency aid and helping to maintain liquidity across the municipal bond market. We believe that water, sewer, and electric utilities should also remain resilient during the crisis as they provide essential services, and most borrowers benefit from the ability to raise rates if needed. While we may see a moderate increase in payment delinquencies, we do not expect any of these sectors to encounter a significant spike in defaults.
At period-end, the fund held an overweight exposure to higher-quality bonds rated A-and BBB- and an underweight exposure to non-rated bonds relative to the fund’s Lipper peer group. Duration positioning, a measure of the portfolio’s interest-rate sensitivity, was generally neutral relative to the level of its Lipper peer group. The fund’s yield curve positioning was focused on longer intermediate-term securities with maturities of 10 to 15 years. As part of this strategy, the fund held underweight
|
| California Tax Exempt Income Fund 7 |
exposures to long maturity holdings compared with the benchmark.
What is your current assessment of the health of the municipal bond market?
We believe state and local governments can benefit from their unique flexibility during economic downturns. The majority of state and local governments have ample reserves in preparation for potential revenue declines, and those without strong reserve levels will have some flexibility to balance their budgets using one-time measures. In our view, most states and local governments would only see prolonged fiscal stress should economic activity fail to stabilize over the next 12 to 18 months.
Our exposure to state and local governments is limited to credits with diverse tax bases and the ability to enact broad revenue enhancements or expense cuts.
What is your outlook as the second half of the fund’s fiscal year begins?
With regard to the effects of the pandemic on the U.S. economy, it is too early to know themagnitude of the shock or how deep or long any recession will be. We’ll continue to work closely with our macroeconomic team and municipal credit research analysts to monitor the direction of U.S. economic activity and its potential impact on municipal credit fundamentals.
Against this backdrop, we believe our higher-in-credit-quality approach can continue to add both income and return opportunities for our shareholders.
Thank you, Paul, for your time and insights today.
The views expressed in this report are exclusively those of Putnam Management and are subject to change. They are not meant as investment advice.
Please note that the holdings discussed in this report may not have been held by the fund for the entire period. Portfolio composition is subject to review in accordance with the fund’s investment strategy and may vary in the future. Current and future portfolio holdings are subject to risk. Statements in the Q&A concerning the fund’s performance or portfolio composition relative to those of the fund’s Lipper peer group may reference information produced by Lipper Inc. or through a third party.
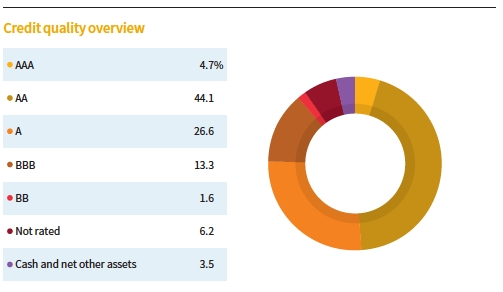
This chart shows how the fund’s top weightings have changed over the past six months. Allocations are shown as a percentage of the fund’s net assets. Current period summary information may differ from the information in the portfolio schedule notes included in the financial statements due to the inclusion of derivative securities, any interest accruals, the timing of matured security transactions, the use of different classifications of securities for presentation purposes, and rounding. Holdings and allocations may vary over time.
|
| 8 California Tax Exempt Income Fund |
Your fund’s performance
This section shows your fund’s performance, price, and distribution information for periods ended March 31, 2020, the end of the first half of its current fiscal year. In accordance with regulatory requirements for mutual funds, we also include expense information taken from the fund’s current prospectus. Performance should always be considered in light of a fund’s investment strategy. Data represent past performance. Past performance does not guarantee future results. More recent returns may be less or more than those shown. Investment return and principal value will fluctuate, and you may have a gain or a loss when you sell your shares. Performance information does not reflect any deduction for taxes a shareholder may owe on fund distributions or on the redemption of fund shares. For the most recent month-end performance, please visit the Individual Investors section at putnam.com or call Putnam at 1-800-225-1581. Class R6 and Y shares are not available to all investors. See the Terms and definitions section in this report for definitions of the share classes offered by your fund.
Fund performanceTotal return for periods ended 3/31/20
| | | | | | | | | |
| | Annual | | | | | | | | |
| | average | | Annual | | Annual | | Annual | | |
| | (life of fund) | 10 years | average | 5 years | average | 3 years | average | 1 year | 6 months |
| Class A(4/29/83) | | | | | | | | | |
| Before sales charge | 6.07% | 54.57% | 4.45% | 15.16% | 2.86% | 11.21% | 3.60% | 3.13% | –1.54% |
| After sales charge | 5.95 | 48.39 | 4.03 | 10.55 | 2.03 | 6.76 | 2.20 | –1.00 | –5.48 |
| Class B(1/4/93) | | | | | | | | | |
| Before CDSC | 5.87 | 46.97 | 3.93 | 11.57 | 2.21 | 9.12 | 2.95 | 2.47 | –1.86 |
| After CDSC | 5.87 | 46.97 | 3.93 | 9.65 | 1.86 | 6.14 | 2.01 | –2.47 | –6.64 |
| Class C(7/26/99) | | | | | | | | | |
| Before CDSC | 5.83 | 42.98 | 3.64 | 10.77 | 2.07 | 8.69 | 2.82 | 2.31 | –1.92 |
| After CDSC | 5.83 | 42.98 | 3.64 | 10.77 | 2.07 | 8.69 | 2.82 | 1.32 | –2.88 |
| Class R6(5/22/18) | | | | | | | | | |
| Net asset value | 6.15 | 58.11 | 4.69 | 16.44 | 3.09 | 11.97 | 3.84 | 3.35 | –1.41 |
| Class Y(1/2/08) | | | | | | | | | |
| Net asset value | 6.15 | 58.00 | 4.68 | 16.36 | 3.08 | 11.89 | 3.82 | 3.21 | –1.43 |
Current performance may be lower or higher than the quoted past performance, which cannot guarantee future results. After-sales-charge returns for class A shares reflect the deduction of the maximum 4.00 sales charge, levied at the time of purchase. Class B share returns after contingent deferred sales charge (CDSC) reflect the applicable CDSC, which is 5% in the first year, declining over time to 1% in the sixth year, and is eliminated thereafter. Class C share returns after CDSC reflect a 1% CDSC for the first year that is eliminated thereafter. Class Y shares have no initial sales charge or CDSC. Performance for class B, C, and Y shares before their inception is derived from the historical performance of class A shares, adjusted for the applicable sales charge (or CDSC) and the higher operating expenses for such shares, except for class Y shares, for which 12b-1 fees are not applicable. Performance for class R6 shares prior to their inception is derived from the historical performance of class Y shares and has not been adjusted for the lower investor servicing fees applicable to class R6 shares; had it, returns would have been higher.
For a portion of the periods, the fund had expense limitations, without which returns would have been lower.
Class B share performance reflects conversion to class A shares after eight years.
Class C share performance reflects conversion to class A shares after 10 years.
|
| California Tax Exempt Income Fund 9 |
Comparative index returnsFor periods ended 3/31/20
| | | | | | | | | |
| | Annual | | | | | | | | |
| | average | | Annual | | Annual | | Annual | | |
| | (life of fund) | 10 years | average | 5 years | average | 3 years | average | 1 year | 6 months |
| Bloomberg Barclays | | | | | | | | | |
| Municipal Bond Index | 6.45% | 50.11% | 4.15% | 17.00% | 3.19% | 12.35% | 3.96% | 3.85% | 0.10% |
| Lipper California | | | | | | | | | |
| Municipal Debt Funds | 6.11 | 54.70 | 4.43 | 15.22 | 2.86 | 10.60 | 3.41 | 2.47 | –1.88 |
| category average* | | | | | | | | | |
Index and Lipper results should be compared with fund performance before sales charge, before CDSC, or at net asset value.
*Over the 6-month, 1-year, 3-year, 5-year, 10-year, and life-of-fund periods ended 3/31/20, there were 134, 131, 116, 107, 87, and 3 funds, respectively, in this Lipper category.
Fund price and distribution informationFor the six-month period ended 3/31/20
| | | | | | |
| Distributions | Class A | Class B | Class C | Class R6 | Class Y |
| Number | 6 | 6 | 6 | 6 | 6 |
| Income1 | $0.103370 | $0.076882 | $0.070537 | $0.113317 | $0.112275 |
| Capital gains2 | — | — | — | — | — |
| Long-term gains | 0.077100 | 0.077100 | 0.077100 | 0.077100 | 0.077100 |
| Short-term gains | 0.056200 | 0.056200 | 0.056200 | 0.056200 | 0.056200 |
| Total | $0.236670 | $0.210182 | $0.203837 | $0.246617 | $0.245575 |
| | Before | After | Net | Net | Net | Net |
| | sales | sales | asset | asset | asset | asset |
| Share value | charge | charge | value | value | value | value |
| 9/30/19 | $8.33 | $8.68 | $8.32 | $8.38 | $8.36 | $8.35 |
| 3/31/20 | 7.97 | 8.30 | 7.96 | 8.02 | 8.00 | 7.99 |
| | Before | After | Net | Net | Net | Net |
| Current rate | sales | sales | asset | asset | asset | asset |
| (end of period) | charge | charge | value | value | value | value |
| Current dividend rate3 | 2.62% | 2.52% | 1.96% | 1.71% | 2.84% | 2.83% |
| Taxable equivalent4 | 5.71 | 5.49 | 4.27 | 3.73 | 6.19 | 6.17 |
| Current 30-day | | | | | | |
| SEC yield5 | N/A | 1.70 | 1.14 | 0.98 | 1.99 | 1.98 |
| Taxable equivalent4 | N/A | 3.70 | 2.48 | 2.14 | 4.34 | 4.31 |
The classification of distributions, if any, is an estimate. Before-sales-charge share value and current dividend rate for class A shares, if applicable, do not take into account any sales charge levied at the time of purchase. After-sales-charge share value, current dividend rate, and current 30-day SEC yield, if applicable, are calculated assuming that the maximum sales charge (4.00% for class A shares) was levied at the time of purchase. Final distribution information will appear on your year-end tax forms.
1For some investors, investment income may be subject to the federal alternative minimum tax.
2Capital gains, if any, are taxable for federal and, in most cases, state purposes.
3Most recent distribution, including any return of capital and excluding capital gains, annualized and divided by share price before or after sales charge at period-end.
4Assumes maximum 54.10% federal and state combined tax rate for 2020. Results for investors subject to lower tax rates would not be as advantageous.
5Based only on investment income and calculated using the maximum offering price for each share class, in accordance with SEC guidelines.
|
| 10 California Tax Exempt Income Fund |
Your fund’s expenses
As a mutual fund investor, you pay ongoing expenses, such as management fees, distribution fees (12b-1 fees), and other expenses. Using the following information, you can estimate how these expenses affect your investment and compare them with the expenses of other funds. You may also pay one-time transaction expenses, including sales charges (loads) and redemption fees, which are not shown in this section and would have resulted in higher total expenses. For more information, see your fund’s prospectus or talk to your financial representative.
Expense ratios
| | | | | |
| | Class A | Class B | Class C | Class R6 | Class Y |
| Total annual operating expenses for the fiscal | | | | | |
| year ended 9/30/19 | 0.76%* | 1.36% | 1.51% | 0.51% | 0.51% |
| Annualized expense ratio for the six-month | | | | | |
| period ended 3/31/20 | 0.73% | 1.37% | 1.52% | 0.52% | 0.52% |
Fiscal year expense information in this table is taken from the most recent prospectus, is subject to change, and may differ from that shown for the annualized expense ratio and in the financial highlights of this report.
Expenses are shown as a percentage of average net assets.
*Distribution and service (12b-1) fees have been restated to reflect current fees effective July 1, 2020.
Expenses per $1,000
The following table shows the expenses you would have paid on a $1,000 investment in each class of the fund from 10/1/19 to 3/31/20. It also shows how much a $1,000 investment would be worth at the close of the period, assumingactual returnsand expenses.
| | | | | |
| | Class A | Class B | Class C | Class R6 | Class Y |
| Expenses paid per $1,000*† | $3.62 | $6.79 | $7.53 | $2.58 | $2.58 |
| Ending value (after expenses) | $984.60 | $981.40 | $980.80 | $985.90 | $985.70 |
*Expenses for each share class are calculated using the fund’s annualized expense ratio for each class, which represents the ongoing expenses as a percentage of average net assets for the six months ended 3/31/20. The expense ratio may differ for each share class.
†Expenses are calculated by multiplying the expense ratio by the average account value for the period; then multiplying the result by the number of days in the period; and then dividing that result by the number of days in the year.
|
| California Tax Exempt Income Fund 11 |
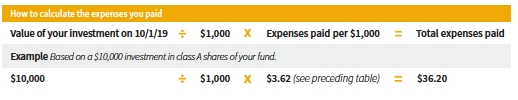
Estimate the expenses you paid
To estimate the ongoing expenses you paid for the six months ended 3/31/20, use the following calculation method. To find the value of your investment on 10/1/19, call Putnam at 1-800-225-1581.
Compare expenses using the SEC’s method
The Securities and Exchange Commission (SEC) has established guidelines to help investors assess fund expenses. Per these guidelines, the following table shows your fund’s expenses based on a $1,000 investment, assuming ahypothetical 5% annualized return. You can use this information to compare the ongoing expenses (but not transaction expenses or total costs) of investing in the fund with those of other funds. All mutual fund shareholder reports will provide this information to help you make this comparison. Please note that you cannot use this information to estimate your actual ending account balance and expenses paid during the period.
| | | | | |
| | Class A | Class B | Class C | Class R6 | Class Y |
| Expenses paid per $1,000*† | $3.69 | $6.91 | $7.67 | $2.63 | $2.63 |
| Ending value (after expenses) | $1,021.35 | $1,018.15 | $1,017.40 | $1,022.40 | $1,022.40 |
*Expenses for each share class are calculated using the fund’s annualized expense ratio for each class, which represents the ongoing expenses as a percentage of average net assets for the six months ended 3/31/20. The expense ratio may differ for each share class.
†Expenses are calculated by multiplying the expense ratio by the average account value for the six-month period; then multiplying the result by the number of days in the six-month period; and then dividing that result by the number of days in the year.
|
| 12 California Tax Exempt Income Fund |
Consider these risks before investing
The value of investments in the fund’s portfolio may fall or fail to rise over extended periods of time for a variety of reasons, including general economic, political, or financial market conditions; investor sentiment and market perceptions; government actions; geopolitical events or changes; and factors related to a specific issuer, geography, industry, or sector. These and other factors may lead to increased volatility and reduced liquidity in the fund’s portfolio holdings. The fund’s performance will be closely tied to the economic and political conditions in California, and can be more volatile than the performance of a more geographically diversified fund. To the extent investments in securities of issuers located outside of California are made, the fund may also be exposed to the risks affecting other states. Certain provisions of the California Constitution and state statutes limit the taxing and spending authority of California’s government entities, which could impair the ability of California issuers to pay principal and/or interest on their obligations. Capital gains, if any, are taxed at the federal and, in most cases, state levels. For some investors, investment income may be subject to the federal alternative minimum tax. Bond investments are subject to interest-rate risk (the risk of bond prices falling if interest rates rise) and credit risk (the risk of an issuer defaulting on interest or principal payments). Interest-rate risk is generally greater for longer-term bonds, and credit risk is generally greater for below-investment-grade bonds. Unlike bonds, funds that invest in bonds have fees and expenses. Tax-exempt bonds may be issued under the Internal Revenue Code only by limited types of issuers for limited types of projects. As a result, the fund’s investments may be focused in certain market segments and be more vulnerable to fluctuations in the values of the securities it holds than a more broadly invested fund. Interest the fund receives might be taxable. You can lose money by investing in the fund.
|
| California Tax Exempt Income Fund 13 |
Terms and definitions
Important terms
Total returnshows how the value of the fund’s shares changed over time, assuming you held the shares through the entire period and reinvested all distributions in the fund.
Before sales charge, or net asset value, is the price, or value, of one share of a mutual fund, without a sales charge. Before-sales-charge figures fluctuate with market conditions, and are calculated by dividing the net assets of each class of shares by the number of outstanding shares in the class.
After sales chargeis the price of a mutual fund share plus the maximum sales charge levied at the time of purchase. After-sales-charge performance figures shown here assume the 4.00% maximum sales charge for class A shares.
Contingent deferred sales charge (CDSC)is generally a charge applied at the time of the redemption of class B or C shares and assumes redemption at the end of the period. Your fund’s class B CDSC declines over time from a 5% maximum during the first year to 1% during the sixth year. After the sixth year, the CDSC no longer applies. The CDSC for class C shares is 1% for one year after purchase.
Share classes
Class A sharesare generally subject to an initial sales charge and no CDSC (except on certain redemptions of shares bought without an initial sales charge).
Class B sharesare closed to new investments and are only available by exchange from another Putnam fund or through dividend and/or capital gains reinvestment. They are not subject to an initial sales charge and may be subject to a CDSC.
Class C sharesare not subject to an initial sales charge and are subject to a CDSC only if the shares are redeemed during the first year.
Class R6 sharesare not subject to an initial sales charge or CDSC and carry no 12b-1 fee. They are generally only available to employer-sponsored retirement plans, corporate and institutional clients, and clients in other approved programs.
Class Y sharesare not subject to an initial sales charge or CDSC and carry no 12b-1 fee. They are generally only available to corporate and institutional clients and clients in other approved programs.
Fixed-income terms
Current rateis the annual rate of return earned from dividends or interest of an investment. Current rate is expressed as a percentage of the price of a security, fund share, or principal investment.
Yield curveis a graph that plots the yields of bonds with equal credit quality against their differing maturity dates, ranging from shortest to longest. It is used as a benchmark for other debt, such as mortgage or bank lending rates.
Comparative indexes
Bloomberg Barclays Municipal Bond Indexis an unmanaged index of long-term fixed-rate investment-grade tax-exempt bonds.
Bloomberg Barclays U.S. Aggregate Bond Indexis an unmanaged index of U.S. investment-grade fixed-income securities.
ICE BofA (Intercontinental Exchange Bank of America) U.S. 3-Month Treasury Bill Indexis an unmanaged index that seeks to measure the performance of U.S. Treasury bills available in the marketplace.
S&P 500 Indexis an unmanaged index of common stock performance.
Indexes assume reinvestment of all distributions and do not account for fees. Securities and performance of a fund and an index will differ. You cannot invest directly in an index.
|
| 14 California Tax Exempt Income Fund |
ICE Data Indices, LLC (“ICE BofA”), used with permission. ICE BofA permits use of the ICE BofA indices and related data on an “as is” basis; makes no warranties regarding same; does not guarantee the suitability, quality, accuracy, timeliness, and/or completeness of the ICE BofA indices or any data included in, related to, or derived therefrom; assumes no liability in connection with the use of the foregoing; and does not sponsor, endorse, or recommend Putnam Investments, or any of its products or services.
Lipperis a third-party industry-ranking entity that ranks mutual funds. Its rankings do not reflect sales charges. Lipper rankings are based on total return at net asset value relative to other funds that have similar current investment styles or objectives as determined by Lipper. Lipper may change a fund’s category assignment at its discretion. Lipper category averages reflect performance trends for funds within a category.
Other information for shareholders
Important notice regarding delivery of shareholder documents
In accordance with Securities and Exchange Commission (SEC) regulations, Putnam sends a single copy of annual and semiannual shareholder reports, prospectuses, and proxy statements to Putnam shareholders who share the same address, unless a shareholder requests otherwise. If you prefer to receive your own copy of these documents, please call Putnam at 1-800-225-1581, and Putnam will begin sending individual copies within 30 days.
Proxy voting
Putnam is committed to managing our mutual funds in the best interests of our shareholders. The Putnam funds’ proxy voting guidelines and procedures, as well as information regarding how your fund voted proxies relating to portfolio securities during the 12-month period ended June 30, 2019, are available in the Individual Investors section of putnam.com and on the SEC’s website, www.sec.gov. If you have questions about finding forms on the SEC’s website, you may call the SEC at 1-800-SEC-0330. You may also obtain the Putnam funds’ proxy voting guidelines andprocedures at no charge by calling Putnam’s Shareholder Services at 1-800-225-1581.
Fund portfolio holdings
The fund will file a complete schedule of its portfolio holdings with the SEC for the first and third quarters of each fiscal year on Form N-PORT within 60 days of the end of such fiscal quarter. Shareholders may obtain the fund’s Form N-PORT on the SEC’s website at www.sec.gov.
Prior to its use of Form N-PORT, the fund filed its complete schedule of its portfolio holdings with the SEC on Form N-Q, which is available online at www.sec.gov.
Trustee and employee fund ownership
Putnam employees and members of the Board of Trustees place their faith, confidence, and, most importantly, investment dollars in Putnam mutual funds. As of March 31, 2020, Putnam employees had approximately $402,000,000 and the Trustees had approximately $66,000,000 invested in Putnam mutual funds. These amounts include investments by the Trustees’ and employees’ immediate family members as well as investments through retirement and deferred compensation plans.
|
| California Tax Exempt Income Fund 15 |
Financial statements
These sections of the report, as well as the accompanying Notes, constitute the fund’s financial statements.
The fund’s portfoliolists all the fund’s investments and their values as of the last day of the reporting period. Holdings are organized by asset type and industry sector, country, or state to show areas of concentration and diversification.
Statement of assets and liabilitiesshows how the fund’s net assets and share price are determined. All investment and non-investment assets are added together. Any unpaid expenses and other liabilities are subtracted from this total. The result is divided by the number of shares to determine the net asset value per share, which is calculated separately for each class of shares. (For funds with preferred shares, the amount subtracted from total assets includes the liquidation preference of preferred shares.)
Statement of operationsshows the fund’s net investment gain or loss. This is done by first adding up all the fund’s earnings — from dividends and interest income — and subtracting its operating expenses to determine net investment income (or loss). Then, any net gain or loss the fund realized on the sales of its holdings — as well as any unrealized gains or losses over the period — is added toor subtracted from the net investment result to determine the fund’s net gain or loss for the fiscal period.
Statement of changes in net assetsshows how the fund’s net assets were affected by the fund’s net investment gain or loss, by distributions to shareholders, and by changes in the number of the fund’s shares. It lists distributions and their sources (net investment income or realized capital gains) over the current reporting period and the most recent fiscal year-end. The distributions listed here may not match the sources listed in the Statement of operations because the distributions are determined on a tax basis and may be paid in a different period from the one in which they were earned. Dividend sources are estimated at the time of declaration. Actual results may vary. Any non-taxable return of capital cannot be determined until final tax calculations are completed after the end of the fund’s fiscal year.
Financial highlightsprovide an overview of the fund’s investment results, per-share distributions, expense ratios, net investment income ratios, and portfolio turnover in one summary table, reflecting the five most recent reporting periods. In a semiannual report, the highlights table also includes the current reporting period.
|
| 16 California Tax Exempt Income Fund |
The fund’s portfolio3/31/20 (Unaudited)
Key to holding’s abbreviations
| |
| ABAGAssociation Of Bay Area Governments | G.O. BondsGeneral Obligation Bonds |
| AGMAssured Guaranty Municipal Corporation | NATLNational Public Finance Guarantee Corporation |
| AMBACAMBAC Indemnity Corporation | U.S. Govt. Coll.U.S. Government Collateralized |
| BAMBuild America Mutual | VRDNVariable Rate Demand Notes, which are floating- |
| COPCertificates of Participation | rate securities with long-term maturities that carry |
| FCS Farm Credit System | coupons that reset and are payable upon demand |
| FGIC Financial Guaranty Insurance Company | either daily, weekly or monthly. The rate shown is the |
| FHL Banks Coll. Federal Home Loan Banks | current interest rate at the close of the reporting |
| System Collateralized | period. Rates are set by remarketing agents and may |
| FNMA Coll. Federal National Mortgage | take into consideration market supply and demand, |
| Association Collateralized | credit quality and the current SIFMA Municipal Swap |
| FRB Floating Rate Bonds: the rate shown is the current | Index rate, which was 4.71% as of the close of the |
| interest rate at the close of the reporting period. Rates | reporting period. |
| may be subject to a cap or floor. For certain securities, | |
| the rate may represent a fixed rate currently in place | |
| at the close of the reporting period. | |
| | | |
| MUNICIPAL BONDS AND NOTES (100.5%)* | Rating** | Principal amount | Value |
| Alaska (1.0%) | | | |
| AK State Indl. Dev. & Export Auth. Rev. Bonds, | | | |
| (Tanana Chiefs Conference), Ser. A | | | |
| 5.00%, 10/1/33 | A+/F | $1,500,000 | $1,839,945 |
| 4.00%, 10/1/38 | A+/F | 4,270,000 | 4,770,316 |
| 4.00%, 10/1/36 | A+/F | 2,455,000 | 2,762,121 |
| 4.00%, 10/1/34 | A+/F | 2,110,000 | 2,391,073 |
| | | | 11,763,455 |
| California (98.1%) | | | |
| ABAG Fin. Auth. for Nonprofit Corps. Rev. Bonds, | | | |
| (Episcopal Sr. Cmntys.) | | | |
| 6.125%, 7/1/41 | A–/F | 2,045,000 | 2,100,849 |
| Ser. A, 5.00%, 7/1/42 | A–/F | 700,000 | 732,032 |
| ABAG Fin. Auth. for Nonprofit Corps. Special Tax | | | |
| Bonds, (Windemere Ranch Infrastructure Fin. | | | |
| Program), Ser. A, AGM | | | |
| 5.00%, 9/2/34 | AA | 415,000 | 509,147 |
| 5.00%, 9/2/33 | AA | 740,000 | 911,021 |
| 5.00%, 9/2/32 | AA | 350,000 | 431,869 |
| ABAG Fin. Auth. Non-Profit Corps Insd. Sr. Living Rev. | | | |
| Bonds, (Odd Fellows Home of CA), Ser. A | | | |
| 5.00%, 4/1/42 | AA– | 1,000,000 | 1,088,970 |
| 5.00%, 4/1/32 | AA– | 3,000,000 | 3,300,060 |
| Alameda, Corridor Trans. Auth. Rev. Bonds, Ser. B, | | | |
| AGM, 5.00%, 10/1/37 | AA | 450,000 | 525,240 |
| Albany, Unified School Dist. G.O. Bonds, (Election | | | |
| 2016), Ser. B | | | |
| 5.00%, 8/1/43 | Aa3 | 2,000,000 | 2,347,760 |
| 4.00%, 8/1/46 | Aa3 | 1,750,000 | 1,920,818 |
|
| California Tax Exempt Income Fund 17 |
| | | |
| MUNICIPAL BONDS AND NOTES (100.5%)*cont. | Rating** | Principal amount | Value |
| Californiacont. | | | |
| Anaheim, Hsg. & Pub. Impt. Auth. Rev. Bonds | | | |
| Ser. A, 5.00%, 10/1/50 | AA– | $1,400,000 | $1,621,018 |
| Ser. C, 5.00%, 10/1/45 | AA– | 2,730,000 | 3,171,823 |
| Anaheim, Pub. Fin. Auth. Rev. Bonds, Ser. C, AGM, | | | |
| zero %, 9/1/31 | AA | 5,000,000 | 3,946,450 |
| Bay Area Toll Auth. Rev. Bonds, (San Francisco Bay | | | |
| Area Sub. Toll Bridge), Ser. S-7, 4.00%, 4/1/38 | AA– | 9,850,000 | 10,870,657 |
| Bay Area Toll Auth. VRDN (San Francisco Bay Area), | | | |
| Ser. C, 4.10%, 4/1/53 | VMIG 1 | 4,210,000 | 4,210,000 |
| Bay Area Toll Auth. of CA Rev. Bonds, Ser. S-6, 5.00%, | | | |
| 10/1/54 (Prerefunded 10/1/24) | AA– | 8,650,000 | 10,105,536 |
| CA Hlth. Fac. Fin. Auth. Rev. Bonds, (Adventist Hlth. | | | |
| Syst./West), Ser. A, 4.00%, 3/1/33 | A | 4,575,000 | 4,738,739 |
| CA Hsg. Fin. Agcy. Rev. Bonds, Ser. 2, Class A, | | | |
| 4.00%, 3/20/33 | BBB+ | 3,000,000 | 3,187,800 |
| CA Muni. Fin. Auth. Rev. Bonds | | | |
| (Channing House), Ser. B, 5.00%, 5/15/47 | AA– | 6,530,000 | 7,647,610 |
| (Eisenhower Med. Ctr.), Ser. A, 5.00%, 7/1/42 | Baa2 | 300,000 | 329,370 |
| (Cmnty. Med. Ctr.), Ser. A, 5.00%, 2/1/42 | A3 | 3,400,000 | 3,798,956 |
| (Channing House), Ser. B, 5.00%, 5/15/37 | AA– | 250,000 | 296,580 |
| (Cmnty. Med. Ctr.), Ser. A, 5.00%, 2/1/37 | A3 | 1,000,000 | 1,124,420 |
| (Cmnty. Med. Ctr.), Ser. A, 5.00%, 2/1/36 | A3 | 1,800,000 | 2,028,420 |
| (Retirement Hsg. Foundation Oblig. Group), Ser. A, | | | |
| 5.00%, 11/15/32 | A–/F | 425,000 | 509,571 |
| (Channing House), Ser. B, 5.00%, 5/15/32 | AA– | 150,000 | 179,016 |
| (Retirement Hsg. Foundation Oblig. Group), Ser. A, | | | |
| 5.00%, 11/15/31 | A–/F | 750,000 | 896,940 |
| (Retirement Hsg. Foundation Oblig. Group), Ser. A, | | | |
| 5.00%, 11/15/30 | A–/F | 250,000 | 297,390 |
| CA Pub. Fin. Auth. VRDN, (Sharp Hlth. Care Oblig. | | | |
| Group), Ser. C, 0.60%, 8/1/52 | VMIG 1 | 4,815,000 | 4,815,000 |
| CA School Fac. Fin. Auth. Rev. Bonds | | | |
| (Kipp SoCal Pub. Schools), Ser. A, 5.00%, 7/1/54 | BBB | 2,150,000 | 2,305,295 |
| (Kipp SoCal Pub. Schools), Ser. A, 5.00%, 7/1/49 | BBB | 1,000,000 | 1,080,810 |
| (Kipp SoCal Pub. Schools), Ser. A, 5.00%, 7/1/39 | BBB | 1,000,000 | 1,096,950 |
| (Alliance College-Ready Pub. Schools), Ser. C, | | | |
| 5.00%, 7/1/31 | BBB | 1,425,000 | 1,526,531 |
| CA School Fac. Fin. Auth. 144A Rev. Bonds | | | |
| (Granada Hills Charter High School), 5.00%, 7/1/54 | BBB– | 4,220,000 | 4,393,020 |
| (Alliance College-Ready Pub. Schools), Ser. A, | | | |
| 5.00%, 7/1/51 | BBB | 1,570,000 | 1,629,644 |
| (Granada Hills Charter High School), 5.00%, 7/1/49 | BBB– | 1,900,000 | 1,986,089 |
| (Green Dot Pub. Schools), Ser. A, 5.00%, 8/1/48 | BBB– | 5,250,000 | 5,419,680 |
| (Green Dot Pub. Schools), Ser. A, 5.00%, 8/1/45 | BBB– | 1,500,000 | 1,536,135 |
| (Granada Hills Charter High School), 5.00%, 7/1/43 | BBB– | 1,750,000 | 1,838,638 |
| (Green Dot Pub. Schools), Ser. A, 5.00%, 8/1/38 | BBB– | 1,000,000 | 1,047,500 |
| (Alliance College-Ready Pub. Schools), Ser. A, | | | |
| 5.00%, 7/1/36 | BBB | 1,250,000 | 1,316,888 |
| (Alliance College-Ready Pub. Schools), Ser. A, | | | |
| 5.00%, 7/1/31 | BBB | 1,830,000 | 1,945,272 |
|
| 18 California Tax Exempt Income Fund |
| | | |
| MUNICIPAL BONDS AND NOTES (100.5%)*cont. | Rating** | Principal amount | Value |
| Californiacont. | | | |
| CA School Fin. Auth. Rev. Bonds, (Kipp LA Projects), | | | |
| Ser. A, 5.125%, 7/1/44 | BBB | $1,060,000 | $1,123,271 |
| CA State G.O. Bonds | | | |
| AGM, 5.25%, 8/1/32 | Aa2 | 2,300,000 | 3,139,040 |
| 4.00%, 3/1/46 | Aa2 | 3,000,000 | 3,451,110 |
| VRDN Ser. B1, 0.47%, 5/1/34 | VMIG 1 | 3,000,000 | 3,000,000 |
| CA State VRDN | | | |
| Ser. A-2, 0.80%, 5/1/33 | VMIG 1 | 7,430,000 | 7,430,000 |
| Ser. A-3, 0.65%, 5/1/33 | VMIG 1 | 1,535,000 | 1,535,000 |
| CA State Charter School Fin. Auth. 144A Rev. Bonds, | | | |
| (Summit Pub. Schools) | | | |
| 5.00%, 6/1/53 | Baa3 | 2,350,000 | 2,473,493 |
| 5.00%, 6/1/47 | Baa3 | 1,000,000 | 1,059,000 |
| CA State Cmnty. College Fin. Auth. Rev. Bonds, | | | |
| (Orange Coast College Hsg.) | | | |
| 5.25%, 5/1/43 | BBB– | 500,000 | 541,830 |
| 5.00%, 5/1/37 | BBB– | 1,000,000 | 1,083,970 |
| 5.00%, 5/1/34 | BBB– | 800,000 | 874,320 |
| 5.00%, 5/1/33 | BBB– | 600,000 | 657,564 |
| 5.00%, 5/1/31 | BBB– | 825,000 | 909,447 |
| CA State Dept. of Veterans Affairs Home Purchase | | | |
| Rev. Bonds, Ser. A, 4.00%, 12/1/49 | AA | 4,375,000 | 4,735,588 |
| CA State Edl. Fac. Auth. Rev. Bonds | | | |
| (U. of the Pacific), 5.50%, 11/1/39 | A2 | 1,085,000 | 1,088,798 |
| (U. of the Pacific), 5.25%, 11/1/29 | A2 | 1,265,000 | 1,269,175 |
| (Pepperdine U.), 5.00%, 10/1/49 | Aa3 | 2,000,000 | 2,311,320 |
| (Occidental College), 5.00%, 10/1/45 | Aa3 | 425,000 | 488,750 |
| (Pepperdine U.), 5.00%, 9/1/45 | Aa3 | 1,000,000 | 1,147,990 |
| (Santa Clara U.), 5.00%, 4/1/45 | Aa3 | 2,500,000 | 2,844,800 |
| (Pepperdine U.), 5.00%, 10/1/41 | Aa3 | 1,500,000 | 1,746,315 |
| (Occidental College), 5.00%, 10/1/38 | Aa3 | 595,000 | 690,617 |
| (U. of Redlands), Ser. A, 5.00%, 10/1/37 | A3 | 425,000 | 469,952 |
| (U. of the Pacific), 5.00%, 11/1/36 | A2 | 500,000 | 554,705 |
| (U. of Redlands), Ser. A, 5.00%, 10/1/35 | A3 | 1,000,000 | 1,084,880 |
| (Chapman U.), Ser. B, 4.00%, 4/1/47 | A2 | 4,940,000 | 5,104,403 |
| (Loyola-Marymount U.), Ser. A, NATL, | | | |
| zero %, 10/1/28 | A2 | 355,000 | 300,547 |
| CA State Hlth. Fac. Fin. Auth. Rev. Bonds | | | |
| (City of Hope Oblig. Group), 5.00%, 11/15/49 | A1 | 5,000,000 | 5,652,250 |
| (Sutter Hlth.), Ser. A, 5.00%, 11/15/46 | Aa3 | 11,685,000 | 13,203,583 |
| (Los Angeles Biomedical Research Inst.), | | | |
| 5.00%, 9/1/43 | Baa2 | 6,155,000 | 7,337,376 |
| (Children’s Hosp. Los Angeles), Ser. A, | | | |
| 5.00%, 8/15/42 | BBB+ | 4,000,000 | 4,727,440 |
| (Sutter Hlth.), Ser. A, 5.00%, 11/15/41 | Aa3 | 5,500,000 | 6,255,095 |
| (Los Angeles Biomedical Research Inst.), | | | |
| 5.00%, 9/1/37 | Baa2 | 1,845,000 | 2,223,797 |
| (City of Hope Oblig. Group), 4.00%, 11/15/45 | A1 | 11,000,000 | 12,487,970 |
| (Sutter Hlth. Oblig. Group), Ser. B, 4.00%, 11/15/38 | Aa3 | 3,000,000 | 3,287,520 |
| (Providence St. Joseph Hlth.), Ser. A, | | | |
| 4.00%, 10/1/35 | Aa3 | 1,000,000 | 1,120,660 |
|
| California Tax Exempt Income Fund 19 |
| | | |
| MUNICIPAL BONDS AND NOTES (100.5%)*cont. | Rating** | Principal amount | Value |
| Californiacont. | | | |
| CA State Infrastructure & Econ. Dev. Bank | | | |
| Mandatory Put Bonds (8/1/20) (Colburn School | | | |
| (The)), 1.75%, 8/1/55 | A+ | $4,600,000 | $4,648,944 |
| Mandatory Put Bonds (8/1/21) (CA Academy | | | |
| of Sciences), Ser. D, 1.043%, 8/1/47 | A2 | 7,300,000 | 7,306,862 |
| CA State Infrastructure & Econ. Dev. Bank Rev. | | | |
| Bonds, (Equitable School Revolving Fund), Ser. B, | | | |
| 5.00%, 11/1/39 | A | 600,000 | 730,560 |
| CA State Muni. Fin. Auth Mobile Home | | | |
| Park Rev. Bonds | | | |
| (Caritas Sr. Hsg. Network), Ser. A, 5.00%, 8/15/31 | BBB | 600,000 | 683,046 |
| (Caritas Affordable Hsg., Inc.), Ser. A, | | | |
| 5.00%, 8/15/30 | BBB+ | 1,000,000 | 1,096,330 |
| (Caritas Sr. Hsg. Network), Ser. A, 5.00%, 8/15/30 | BBB | 685,000 | 782,249 |
| CA State Muni. Fin. Auth. Rev. Bonds | | | |
| (Town & Country Manor of the Christian & | | | |
| Missionary Alliance), 5.00%, 7/1/49 | AA– | 2,650,000 | 3,231,119 |
| (UCR North Dist. Phase 1 Student Hsg.), | | | |
| 5.00%, 5/15/49 | AA | 3,000,000 | 3,194,280 |
| (LAX Integrated Express Solutions, LLC), Ser. A, | | | |
| 5.00%, 12/31/47 | BBB–/F | 5,000,000 | 5,301,350 |
| (HumanGood CA Oblig. Group), Ser. A, | | | |
| 5.00%, 10/1/44 | A–/F | 5,000,000 | 5,234,050 |
| (LINXS PPM), 5.00%, 12/31/43 | BBB–/F | 5,000,000 | 5,336,900 |
| (Dundee Glasgow Student Hsg.), 5.00%, 5/15/43 | Baa3 | 1,250,000 | 1,335,825 |
| (Orange Cnty. Civic Ctr.), 5.00%, 6/1/42 | AA | 5,000,000 | 5,963,700 |
| (Master’s U. (The)), 5.00%, 8/1/39 | BB+ | 3,390,000 | 3,440,274 |
| (Town & Country Manor of the Christian & | | | |
| Missionary Alliance), 5.00%, 7/1/39 | AA– | 1,995,000 | 2,482,897 |
| (LINXS Automated People Mover), Ser. A, | | | |
| 5.00%, 12/31/35 | BBB–/F | 1,000,000 | 1,089,260 |
| (LINXS Automated People Mover), Ser. A, | | | |
| 5.00%, 12/31/34 | BBB–/F | 1,200,000 | 1,312,260 |
| (Master’s U. (The)), 5.00%, 8/1/34 | BB+ | 1,385,000 | 1,428,683 |
| (LINXS Automated People Mover), Ser. A, | | | |
| 5.00%, 12/31/33 | BBB–/F | 1,000,000 | 1,097,050 |
| (West Village Student Hsg.), BAM, 4.00%, 5/15/48 | AA | 5,000,000 | 4,808,050 |
| (HumanGood CA Oblig. Group), Ser. A, | | | |
| 4.00%, 10/1/44 | A–/F | 2,500,000 | 2,435,150 |
| (HumanGood CA Oblig. Group), Ser. A, | | | |
| 4.00%, 10/1/39 | A–/F | 2,150,000 | 2,150,000 |
| (HumanGood CA Oblig. Group), Ser. A, | | | |
| 4.00%, 10/1/38 | A–/F | 3,790,000 | 3,800,764 |
| (HumanGood CA Oblig. Group), Ser. A, | | | |
| 4.00%, 10/1/37 | A–/F | 2,820,000 | 2,834,438 |
| (United Airlines, Inc.), 4.00%, 7/15/29 | BB– | 5,000,000 | 5,030,650 |
| CA State Muni. Fin. Auth. Charter School Lease | | | |
| 144A Rev. Bonds, (Bella Mente Montessori | | | |
| Academy), Ser. A | | | |
| 5.00%, 6/1/48 | Ba1 | 2,300,000 | 2,300,598 |
| 5.00%, 6/1/38 | Ba1 | 1,680,000 | 1,706,897 |
| 5.00%, 6/1/28 | Ba1 | 430,000 | 449,608 |
|
| 20 California Tax Exempt Income Fund |
| | | |
| MUNICIPAL BONDS AND NOTES (100.5%)*cont. | Rating** | Principal amount | Value |
| Californiacont. | | | |
| CA State Muni. Fin. Auth. Solid Waste Disp. | | | |
| 144A Mandatory Put Bonds (2/3/25), (Waste | | | |
| Management, Inc.), Ser. A, 1.30%, 2/1/39 | A– | $1,600,000 | $1,509,536 |
| CA State Poll. Control Fin. Auth. Rev. Bonds | | | |
| (San Jose Wtr. Co.), 5.10%, 6/1/40 | A | 4,500,000 | 4,526,145 |
| (Wtr. Furnishing), 5.00%, 11/21/45 | Baa3 | 14,250,000 | 14,046,510 |
| (San Jose Wtr. Co.), 4.75%, 11/1/46 | A | 2,250,000 | 2,544,413 |
| CA State Poll. Control Fin. Auth. Solid Waste | | | |
| Disp. Mandatory Put Bonds (5/1/24), (Waste | | | |
| Management, Inc.), Ser. A | | | |
| 2.50%, 11/1/38 | A– | 2,500,000 | 2,499,975 |
| 2.50%, 7/1/31 | A– | 1,125,000 | 1,124,989 |
| CA State Poll. Control Fin. Auth. Wtr. Fac. Rev. Bonds, | | | |
| (American Wtr. Cap. Corp.), 5.25%, 8/1/40 | A | 4,000,000 | 4,048,760 |
| CA State Poll. Control Fin. Auth. Wtr. Furnishing | | | |
| 144A Rev. Bonds, (San Diego Cnty. Wtr. Auth. | | | |
| Desalination), 5.00%, 11/21/45 | Baa3 | 4,390,000 | 4,327,311 |
| CA State Statewide Communities Dev. Auth. Hosp. | | | |
| Rev. Bonds, (Methodist Hosp. of Southern CA) | | | |
| 5.00%, 1/1/48 | BBB+ | 2,000,000 | 2,333,380 |
| 5.00%, 1/1/43 | BBB+ | 7,195,000 | 8,460,601 |
| CA State Tobacco Securitization Agcy. Rev. Bonds, | | | |
| (Kern Cnty. Tobacco Funding Corp.), 5.00%, 6/1/40 | BBB/P | 5,000,000 | 5,082,250 |
| CA State U. Rev. Bonds | | | |
| (Systemwide), Ser. A, 5.00%, 11/1/41 | Aa2 | 16,610,000 | 19,504,459 |
| Ser. A, 5.00%, 11/1/37 | Aa2 | 10,290,000 | 12,018,926 |
| CA Statewide Cmnty. Dev. Auth. Rev. Bonds | | | |
| (899 Charleston, LLC), Ser. A, 5.375%, 11/1/49 | BB/P | 1,000,000 | 1,025,000 |
| (899 Charleston, LLC), Ser. A, 5.25%, 11/1/44 | BB/P | 1,300,000 | 1,328,574 |
| (Front Porch Cmnty. & Svcs.), Ser. A, 5.00%, 4/1/47 | A– | 2,000,000 | 2,337,260 |
| (American Baptist Homes of the West), | | | |
| 5.00%, 10/1/45 | A–/F | 2,550,000 | 2,783,555 |
| AGM, 5.00%, 11/15/44 | AA | 5,195,000 | 5,774,762 |
| (American Baptist Homes of the West), | | | |
| 5.00%, 10/1/43 | A–/F | 1,190,000 | 1,244,181 |
| (Episcopal Cmntys. and Svcs.), 5.00%, 5/15/42 | A–/F | 3,250,000 | 3,436,095 |
| (Culinary Institute of America (The)), Ser. B, | | | |
| 5.00%, 7/1/41 | Baa2 | 380,000 | 407,208 |
| (Enloe Med. Ctr.), 5.00%, 8/15/38 | AA– | 2,750,000 | 3,216,345 |
| (Enloe Med. Ctr.), 5.00%, 8/15/35 | AA– | 1,580,000 | 1,860,418 |
| (Episcopal Cmntys. and Svcs.), 5.00%, 5/15/32 | A–/F | 600,000 | 637,698 |
| (Front Porch Cmnty. & Svcs.), Ser. A, 5.00%, 4/1/30 | A– | 310,000 | 376,046 |
| (Terraces at San Joaquin Gardens), Ser. A, | | | |
| 5.00%, 10/1/22 | A–/F | 1,690,000 | 1,760,304 |
| (Viamonte Senior Living 1, Inc.), Ser. A, | | | |
| 4.00%, 7/1/47 | AA– | 2,000,000 | 2,228,060 |
| (Front Porch Cmnty. & Svcs.), Ser. A, 4.00%, 4/1/47 | A– | 1,625,000 | 1,741,675 |
| (Marin Gen. Hosp.), Ser. A, 4.00%, 8/1/45 | A– | 2,500,000 | 2,669,825 |
| (Viamonte Senior Living 1, Inc.), Ser. A, | | | |
| 4.00%, 7/1/43 | AA– | 1,000,000 | 1,122,040 |
|
| California Tax Exempt Income Fund 21 |
| | | |
| MUNICIPAL BONDS AND NOTES (100.5%)*cont. | Rating** | Principal amount | Value |
| Californiacont. | | | |
| CA Statewide Cmnty. Dev. Auth. Rev. Bonds | | | |
| (Viamonte Senior Living 1, Inc.), Ser. A, | | | |
| 4.00%, 7/1/39 | AA– | $875,000 | $988,321 |
| (Viamonte Senior Living 1, Inc.), Ser. A, | | | |
| 4.00%, 7/1/38 | AA– | 800,000 | 905,368 |
| (Viamonte Senior Living 1, Inc.), Ser. A, | | | |
| 4.00%, 7/1/37 | AA– | 620,000 | 704,103 |
| (Viamonte Senior Living 1, Inc.), Ser. B, | | | |
| 3.00%, 7/1/25 | AA– | 4,600,000 | 4,636,294 |
| (Cmnty. Fac. Dist. No. 1-Zone 1B), zero %, 9/1/20 | BB/P | 125,000 | 124,393 |
| CA Statewide Cmnty. Dev. Auth. 144A Rev. Bonds | | | |
| (Lancer Edl. Student Hsg.), Ser. A, 5.00%, 6/1/51 | BB/P | 1,440,000 | 1,449,374 |
| (CA Baptist U.), Ser. A, 5.00%, 11/1/41 | BB/P | 1,535,000 | 1,573,866 |
| (Lancer Edl. Student Hsg.), Ser. A, 5.00%, 6/1/39 | BB/P | 475,000 | 485,835 |
| (Lancer Edl. Student Hsg.), Ser. A, 5.00%, 6/1/34 | BB/P | 375,000 | 390,360 |
| (CA Baptist U.), Ser. A, 5.00%, 11/1/32 | BB/P | 720,000 | 758,952 |
| (Lancer Edl. Student Hsg.), Ser. A, 3.00%, 6/1/29 | BB/P | 750,000 | 688,560 |
| CA Statewide Fin. Auth. Tobacco Settlement Rev. | | | |
| Bonds, Class B, 5.625%, 5/1/29 | Baa1 | 910,000 | 910,200 |
| Campbell, Union High School Dist. G.O. Bonds, | | | |
| (Election 2016), Ser. B, 4.00%, 8/1/37 | AAA | 2,410,000 | 2,694,115 |
| Carson, Pub. Fin. Auth. Reassessment Rev. Bonds, | | | |
| 5.00%, 9/2/28 | BB/P | 1,650,000 | 1,967,427 |
| Centinela Valley, Union High School Dist. G.O. | | | |
| Bonds, Ser. C, AGM, 4.00%, 8/1/34 | AA | 5,000,000 | 5,584,400 |
| Ceres, Unified School Dist. G.O. Bonds, BAM | | | |
| zero %, 8/1/40 | AA | 1,285,000 | 619,331 |
| zero %, 8/1/39 | AA | 1,075,000 | 542,219 |
| zero %, 8/1/38 | AA | 1,000,000 | 527,070 |
| zero %, 8/1/36 | AA | 545,000 | 313,299 |
| zero %, 8/1/34 | AA | 715,000 | 448,999 |
| zero %, 8/1/33 | AA | 250,000 | 163,668 |
| Chula Vista, Indl. Dev. Rev. Bonds, (San Diego Gas) | | | |
| Ser. C, 5.875%, 2/15/34 | A2 | 2,600,000 | 2,609,568 |
| Ser. D, 5.875%, 1/1/34 | A2 | 5,000,000 | 5,018,400 |
| Chula Vista, Muni. Fin. Auth. Special Tax Bonds | | | |
| 5.50%, 9/1/30 | AA– | 740,000 | 834,409 |
| 5.50%, 9/1/29 | AA– | 2,165,000 | 2,444,502 |
| Cloverdale Unified School Dist. G.O. Bonds, Ser. B, | | | |
| 4.00%, 8/1/49 | Aa3 | 5,000,000 | 5,505,700 |
| Commerce, Redev. Agcy. Tax Alloc. Bonds, (Redev. | | | |
| Area 1), U.S. Govt. Coll., zero %, 8/1/21 (Escrowed | | | |
| to maturity) | AAA/P | 5,130,000 | 4,858,674 |
| Corona-Norco, School Dist. Pub. Fin. Auth. | | | |
| Special Tax Bonds | | | |
| Ser. A, 5.00%, 9/1/35 | AA– | 585,000 | 651,503 |
| Ser. A, 5.00%, 9/1/32 | AA– | 1,125,000 | 1,254,476 |
| (Sr. Lien), Ser. A, 5.00%, 9/1/28 | AA– | 275,000 | 306,845 |
| Coronado, Cmnty. Dev. Successor Agcy. Tax Alloc. | | | |
| Bonds, Ser. A, 5.00%, 9/1/33 | AA | 13,695,000 | 16,089,571 |
|
| 22 California Tax Exempt Income Fund |
| | | |
| MUNICIPAL BONDS AND NOTES (100.5%)*cont. | Rating** | Principal amount | Value |
| Californiacont. | | | |
| Desert Cmnty. College Dist. G.O. Bonds, | | | |
| 5.00%, 8/1/36 | Aa2 | $1,000,000 | $1,178,270 |
| Eastern CA Muni. Waste Wtr. Dist. Rev. Bonds, Ser. A, | | | |
| 5.00%, 7/1/45 | AA+ | 2,740,000 | 3,195,361 |
| El Dorado, Irrigation Dist. Rev. Bonds, Ser. C, | | | |
| 4.00%, 3/1/34 | Aa3 | 1,500,000 | 1,680,435 |
| Emeryville, Redev. Successor Agcy. Tax Alloc. | | | |
| Bonds, Ser. A, AGM, 5.00%, 9/1/34 | AA | 500,000 | 574,795 |
| Fairfield Cmnty., Fac. Dist. Special Tax Bonds, (Impt. | | | |
| Area B), Ser. A | | | |
| 5.00%, 9/1/49 | BB/P | 1,600,000 | 1,780,064 |
| 5.00%, 9/1/44 | BB/P | 1,000,000 | 1,117,710 |
| 5.00%, 9/1/39 | BB/P | 500,000 | 567,390 |
| Fairfield-Suisun, Unified School Dist. G.O. Bonds, | | | |
| (Election 2016) | | | |
| 4.00%, 8/1/34 | Aa2 | 3,290,000 | 3,707,863 |
| 4.00%, 8/1/33 | Aa2 | 3,015,000 | 3,417,894 |
| Federal Home Loan Mortgage Corp. Rev. Bonds, | | | |
| Ser. M-054, Class A, 2.35%, 12/15/35 | AA+ | 1,000,000 | 1,108,070 |
| Folsom Cordova, Unified School Dist. G.O. Bonds, | | | |
| (School Fac. Impt. Dist. No. 1), Ser. A, NATL, | | | |
| zero %, 10/1/25 | Aa3 | 1,505,000 | 1,371,507 |
| Foothill/Eastern Corridor Agcy. Rev. Bonds, Ser. A, | | | |
| 6.00%, 1/15/53 (Prerefunded 1/15/24) | A– | 8,000,000 | 9,449,600 |
| Franklin-McKinley, School Dist. G.O. Bonds, | | | |
| (Election 2016), Ser. B, 5.00%, 8/1/44 | Aa3 | 2,825,000 | 3,310,731 |
| Fullerton, Cmnty. Fac. Dist. No. 1 Special Tax Bonds, | | | |
| (Amerige Heights), 5.00%, 9/1/32 | A+ | 1,000,000 | 1,087,200 |
| Golden State Tobacco Securitization | | | |
| Corp. Rev. Bonds | | | |
| Ser. A-2, 5.00%, 6/1/47 | BB/P | 11,000,000 | 10,585,410 |
| Ser. A, 5.00%, 6/1/45 | Aa3 | 16,575,000 | 18,595,824 |
| Ser. A, 5.00%, 6/1/40 | Aa3 | 23,940,000 | 27,029,218 |
| Ser. A, 5.00%, 6/1/35 | Aa3 | 1,065,000 | 1,212,353 |
| (Tobacco Settlement), Ser. A-1, 5.00%, 6/1/35 | BB+ | 2,500,000 | 2,867,375 |
| (Tobacco Settlement), Ser. A-1, 5.00%, 6/1/34 | BBB– | 2,500,000 | 2,881,075 |
| Ser. A, 5.00%, 6/1/33 | Aa3 | 4,355,000 | 4,978,375 |
| Ser. A-1, 5.00%, 6/1/31 | BBB | 5,000,000 | 5,838,850 |
| Ser. A-1, 5.00%, 6/1/27 | BBB | 2,000,000 | 2,345,640 |
| Ser. A-1, 5.00%, 6/1/26 | BBB | 1,100,000 | 1,270,192 |
| Ser. A, AMBAC, zero %, 6/1/24 | Aa3 | 12,000,000 | 11,128,200 |
| Grossmont-Cuyamaca, Cmnty. College Dist. G.O. | | | |
| Bonds, (Election 2012), Ser. B, 4.00%, 8/1/47 | Aa2 | 3,500,000 | 3,866,380 |
| Hartnell Cmnty. College Dist. G.O. Bonds, Ser. A | | | |
| zero %, 8/1/37 | Aa2 | 3,500,000 | 1,815,835 |
| zero %, 8/1/36 | Aa2 | 4,750,000 | 2,595,448 |
| zero %, 8/1/35 | Aa2 | 1,000,000 | 575,560 |
| Hayward, Unified School Dist. G.O. Bonds, | | | |
| 5.00%, 8/1/38 | A+ | 1,995,000 | 2,242,599 |
| Hsg. Fin. Agcy. Rev. Bonds, Ser. A, 4.25%, 1/15/35 | BBB+ | 2,975,734 | 3,195,521 |
|
| California Tax Exempt Income Fund 23 |
| | | |
| MUNICIPAL BONDS AND NOTES (100.5%)*cont. | Rating** | Principal amount | Value |
| Californiacont. | | | |
| Inglewood, Redev. Agcy. Successor Tax Allocation | | | |
| Bonds, (Merged Redev.), Ser. A, BAM | | | |
| 5.00%, 5/1/38 | AA | $250,000 | $298,080 |
| 5.00%, 5/1/34 | AA | 500,000 | 603,660 |
| Inland Valley, Dev. Agcy. Successor Tax Alloc. Bonds, | | | |
| Ser. A, 5.25%, 9/1/37 | A– | 4,925,000 | 5,525,752 |
| Irvine, Cmnty. Fac. Dist. No. 13-3 Special Tax Bonds | | | |
| (Great Park Impt. Area No. 1), 5.00%, 9/1/39 | BBB–/P | 1,000,000 | 1,077,330 |
| (Great Park Impt. Area No. 4), 4.00%, 9/1/41 | BB–/P | 2,500,000 | 2,588,750 |
| Irvine, Impt. Board Act of 1915 Special Assmt. Bonds | | | |
| (Ltd. Oblig. Assmt. Dist. No. 13-1), 5.00%, 9/2/29 | A+ | 705,000 | 784,912 |
| (Dist No. 12-1), 5.00%, 9/2/23 | A+ | 1,000,000 | 1,089,310 |
| Irvine, Unified School Dist. Special Tax Bonds | | | |
| (Cmnty. Fac. Dist. No. 09-1), Ser. A, 5.00%, 9/1/47 | BB+/P | 200,000 | 221,150 |
| (Cmnty. Fac. Dist. No. 09-1), Ser. C, 5.00%, 9/1/47 | BB+/P | 1,000,000 | 1,095,450 |
| (Cmnty. Fac. Dist. No. 09-1), Ser. A, 5.00%, 9/1/42 | BB+/P | 400,000 | 444,300 |
| (Cmnty. Fac. Dist. No. 09-1), Ser. B, 5.00%, 9/1/42 | BB+/P | 1,000,000 | 1,110,750 |
| BAM, 5.00%, 9/1/38 | AA | 2,500,000 | 2,849,600 |
| (Cmnty. Fac. Dist. No. 09-1), Ser. A, BAM, | | | |
| 4.00%, 9/1/49 | AA | 2,000,000 | 2,166,200 |
| (Cmnty. Fac. Dist. No. 09-1), Ser. A, BAM, | | | |
| 4.00%, 9/1/44 | AA | 1,000,000 | 1,091,780 |
| Jurupa, Pub. Fin. Auth. Special Tax Bonds, Ser. A | | | |
| 5.00%, 9/1/33 | A+ | 600,000 | 690,036 |
| 5.00%, 9/1/32 | A+ | 2,475,000 | 2,850,977 |
| Kaweah, Delta Hlth. Care Dist. Rev. Bonds, Ser. B, | | | |
| 5.00%, 6/1/40 | A3 | 1,500,000 | 1,701,375 |
| La Verne, COP, (Brethren Hillcrest Homes), | | | |
| 5.00%, 5/15/29 | BBB–/F | 635,000 | 651,897 |
| Lake Elsinore, Pub. Fin. Auth. Local Agcy. Special Tax | | | |
| Bonds, (Canyon Hills Impt. Areas), Ser. A & C | | | |
| 5.00%, 9/1/33 | BB+/P | 1,105,000 | 1,196,030 |
| 5.00%, 9/1/31 | BB+/P | 1,045,000 | 1,136,009 |
| Long Beach Marina, Rev. Bonds, 5.00%, 5/15/40 | BBB/F | 1,000,000 | 1,005,270 |
| Long Beach, Bond Fin. Auth. Rev. Bonds, (Natural | | | |
| Gas Purchase), Ser. A, 5.50%, 11/15/28 | A2 | 5,000,000 | 6,085,050 |
| Long Beach, Cmnty. College Dist. G.O. Bonds, (2008 | | | |
| Election), Ser. B | | | |
| zero %, 8/1/34 | Aa2 | 1,500,000 | 1,074,240 |
| zero %, 8/1/33 | Aa2 | 625,000 | 462,613 |
| Long Beach, Harbor Rev. Bonds | | | |
| (Green Bond), Ser. B, 5.00%, 5/15/43 | AA | 2,000,000 | 2,263,160 |
| Ser. A, 5.00%, 5/15/40 | AA | 5,000,000 | 5,684,300 |
| Long Beach, Unified School Dist. G.O. Bonds, | | | |
| Ser. D-1, zero %, 8/1/37 | Aa2 | 1,000,000 | 531,180 |
| Los Angeles Cnty., Pub. Wks. Fin. Auth. Rev. Bonds, | | | |
| Ser. A, 5.00%, 12/1/44 | AA+ | 1,000,000 | 1,143,400 |
| Los Angeles Ctny., Pub. Wks. Fin. Auth. Lease Rev. | | | |
| Bonds, Ser. D, 5.00%, 12/1/45 | AA+ | 3,000,000 | 3,498,390 |
| Los Angeles, Cmnty. College Dist. G.O. Bonds, Ser. G, | | | |
| 4.00%, 8/1/34 | Aaa | 2,610,000 | 2,859,177 |
|
| 24 California Tax Exempt Income Fund |
| | | |
| MUNICIPAL BONDS AND NOTES (100.5%)*cont. | Rating** | Principal amount | Value |
| Californiacont. | | | |
| Los Angeles, Cmnty. Fac. Dist. No. 4 Special Tax | | | |
| Bonds, (Playa Vista Phase 1) | | | |
| 5.00%, 9/1/31 | A+ | $1,480,000 | $1,697,989 |
| 5.00%, 9/1/30 | A+ | 1,480,000 | 1,698,670 |
| Los Angeles, Dept. of Arpt. Rev. Bonds | | | |
| (Los Angeles Intl. Arpt.), Ser. A, 5.00%, 5/15/40 | Aa2 | 3,500,000 | 4,338,145 |
| (Los Angeles Intl. Arpt.), Ser. A, 5.00%, 5/15/39 | Aa2 | 2,000,000 | 2,481,620 |
| (Los Angeles Intl. Arpt.), Ser. A, 5.00%, 5/15/38 | Aa2 | 2,000,000 | 2,487,500 |
| (Los Angeles Intl. Arpt.), Ser. A, 5.00%, 5/15/37 | Aa2 | 2,000,000 | 2,497,640 |
| (Los Angeles Intl. Arpt.), Ser. A, 4.00%, 5/15/34 | Aa3 | 1,155,000 | 1,247,065 |
| (Los Angeles Intl. Arpt.), Ser. F, 5.00%, 5/15/44 T | Aa3 | 10,000,000 | 11,518,462 |
| (Los Angeles Intl. Arpt.), Ser. F, 4.00%, 5/15/49 T | Aa3 | 8,000,000 | 8,927,648 |
| Los Angeles, Dept. of Wtr. & Pwr. Syst. Rev. Bonds, | | | |
| Ser. D, 5.00%, 7/1/44 | Aa2 | 9,000,000 | 11,059,290 |
| Los Angeles, Harbor Dept. Rev. Bonds, (Green | | | |
| Bond), Ser. C, 4.00%, 8/1/39 | Aa2 | 2,200,000 | 2,417,778 |
| Los Angeles, Muni. Impt. Corp. Lease Rev. Bonds, | | | |
| (Real Property), Ser. B, 4.00%, 11/1/33 | AA– | 3,480,000 | 3,923,143 |
| M-S-R Energy Auth. Rev. Bonds | | | |
| Ser. A, 6.50%, 11/1/39 | BBB+ | 6,000,000 | 8,405,880 |
| Ser. A, 6.125%, 11/1/29 | BBB+ | 1,035,000 | 1,249,856 |
| Ser. B, 6.125%, 11/1/29 | BBB+ | 2,590,000 | 3,128,875 |
| Merced, City School Dist. G.O. Bonds, (Election | | | |
| 2014), 5.00%, 8/1/45 | Aa3 | 3,500,000 | 4,007,115 |
| Merced, Union High School Dist. G.O. Bonds, AGM | | | |
| zero %, 8/1/44 | AA | 8,655,000 | 2,874,672 |
| zero %, 8/1/39 | AA | 5,005,000 | 2,185,784 |
| Metro. Wtr. Dist. of Southern CA Rev. Bonds, Ser. A, | | | |
| 5.00%, 10/1/49 | AAA | 12,700,000 | 15,791,307 |
| Modesto, Irrigation Dist. Fin. Auth. Elec. Syst. Rev. | | | |
| Bonds, Ser. A, 5.00%, 10/1/40 | A+ | 2,790,000 | 3,260,589 |
| Mountain View, Shoreline Regl. Pk. Cmnty. Tax Alloc. | | | |
| Bonds, Ser. A, AGM, 5.00%, 8/1/43 | AA | 5,615,000 | 6,788,760 |
| Murrieta Valley, Unified School Dist. G.O. Bonds, | | | |
| AGM, zero %, 9/1/31 | AA | 2,000,000 | 1,539,840 |
| Murrieta, Pub. Fin. Auth. Special Tax Bonds, | | | |
| 5.00%, 9/1/26 | A | 1,000,000 | 1,071,580 |
| Napa Valley, Cmnty. College Dist. G.O. Bonds | | | |
| stepped-coupon zero % (4.00%, 2/1/21), 8/1/34 †† | Aa2 | 1,500,000 | 1,609,665 |
| stepped-coupon zero % (4.00%, 2/1/21), 8/1/33 †† | Aa2 | 2,500,000 | 2,691,950 |
| Norco, Special Tax Bonds, (Norco Ridge Ranch), BAM | | | |
| 5.00%, 9/1/33 | AA | 660,000 | 804,778 |
| 5.00%, 9/1/30 | AA | 2,190,000 | 2,706,577 |
| North Natomas, Cmnty. Fac. Special Tax Bonds, | | | |
| (Dist. No. 4), Ser. E, 5.25%, 9/1/33 | BBB+ | 1,500,000 | 1,663,575 |
| Northern CA Energy Auth. Commodity Supply | | | |
| Mandatory Put Bonds (7/1/24), Ser. A, 4.00%, 7/1/49 | A3 | 10,000,000 | 10,380,400 |
| Oakland, Alameda Cnty. Unified School | | | |
| Dist. G.O. Bonds | | | |
| Ser. A, 5.00%, 8/1/40 | A1 | 4,000,000 | 4,594,800 |
| Ser. C, 5.00%, 8/1/38 | A1 | 3,235,000 | 3,822,411 |
|
| California Tax Exempt Income Fund 25 |
| | | |
| MUNICIPAL BONDS AND NOTES (100.5%)*cont. | Rating** | Principal amount | Value |
| Californiacont. | | | |
| Oakland, Alameda Cnty. Unified School | | | |
| Dist. G.O. Bonds | | | |
| Ser. C, 5.00%, 8/1/37 | A1 | $8,520,000 | $10,109,406 |
| Ser. A, 5.00%, 8/1/35 | A1 | 1,000,000 | 1,158,560 |
| Orange Cnty., Cmnty. Fac. Dist. Special Tax Bonds, | | | |
| (Ladera Ranch — No. 04-1), Ser. A | | | |
| 5.00%, 8/15/33 | A+ | 1,750,000 | 1,862,963 |
| 5.00%, 8/15/32 | A+ | 1,000,000 | 1,065,760 |
| Pico Rivera, Pub. Fin. Auth. Lease Rev. Bonds, NATL, | | | |
| 5.25%, 9/1/30 | AA– | 1,295,000 | 1,590,079 |
| Poway, Unified School Dist. G.O. Bonds, (Election | | | |
| of 2008), zero %, 8/1/29 | Aa3 | 11,350,000 | 9,606,640 |
| Pub. Fin. Auth. Rev. Bonds, (Sharp Healthcare), | | | |
| Ser. A, 4.00%, 8/1/47 | AA | 10,000,000 | 11,162,800 |
| Rancho Cordova, Cmnty. Fac. Dist. | | | |
| Special Tax Bonds | | | |
| (Sunridge Anatolia), Ser. 03-1, 5.00%, 9/1/32 | BBB–/P | 1,250,000 | 1,317,700 |
| (Sunridge Anatolia No. 03-1), 4.00%, 9/1/27 | BBB–/P | 425,000 | 459,536 |
| Redding, Elec. Syst. Rev. Bonds, NATL, 6.368%, | | | |
| 7/1/22 (Escrowed to maturity) | A | 1,395,000 | 1,469,563 |
| Redwood City, Redev. Agcy., Tax Alloc. Bonds, | | | |
| (Redev. Area 2-A), AMBAC, zero %, 7/15/22 | A | 3,230,000 | 3,124,896 |
| Regents of the U. of CA Med. Ctr. (The) Rev. Bonds, | | | |
| Ser. L, 5.00%, 5/15/41 | Aa3 | 2,000,000 | 2,284,360 |
| Ripon, Redev. Agcy. Tax Alloc. Bonds, (Cmnty. | | | |
| Redev.), NATL, 4.75%, 11/1/36 | Baa2 | 1,350,000 | 1,351,958 |
| Riverside Cnty., Pub. Fin. Auth. Tax Allocation | | | |
| Bonds, Ser. A, BAM, 4.00%, 10/1/40 | AA | 1,250,000 | 1,362,075 |
| Riverside Cnty., Redev. Successor Agcy. Tax Alloc. | | | |
| Bonds, (Hsg.), Ser. B | | | |
| BAM, stepped-coupon zero % (5.000%, 10/1/21), | | | |
| 10/1/41 †† | A | 1,990,000 | 2,195,288 |
| stepped-coupon zero % (5.000%, 10/1/21), | | | |
| 10/1/37 †† | A | 1,010,000 | 1,124,564 |
| stepped-coupon zero % (5.000%, 10/1/21), | | | |
| 10/1/32 †† | AA | 290,000 | 327,871 |
| BAM, stepped-coupon zero % (5.000%, 10/1/21), | | | |
| 10/1/29 †† | AA | 775,000 | 883,477 |
| stepped-coupon zero % (5.000%, 10/1/21), | | | |
| 10/1/28 †† | AA | 235,000 | 268,577 |
| BAM, stepped-coupon zero % (5.000%, 10/1/21), | | | |
| 10/1/26 †† | AA | 500,000 | 574,775 |
| BAM, stepped-coupon zero % (5.000%, 10/1/21), | | | |
| 10/1/24 †† | AA | 445,000 | 483,653 |
| Riverside Cnty., Trans. Comm. Toll Rev. Bonds, | | | |
| Ser. A, 5.75%, 6/1/44 | A | 750,000 | 807,323 |
| Rocklin, Special Tax, (Cmnty. Fac. Dist. No. 10) | | | |
| 5.00%, 9/1/40 | BB+/P | 500,000 | 542,075 |
| 5.00%, 9/1/39 | BB+/P | 500,000 | 543,860 |
| Rocklin, Special Tax Bonds, 5.00%, 9/1/35 | BB/P | 3,500,000 | 3,827,950 |
| Rohnert Pk., Cmnty. Dev. Agcy. Tax Alloc. Bonds, | | | |
| (Rohnert Redev.), NATL, zero %, 8/1/25 | A+ | 1,340,000 | 1,223,661 |
|
| 26 California Tax Exempt Income Fund |
| | | |
| MUNICIPAL BONDS AND NOTES (100.5%)*cont. | Rating** | Principal amount | Value |
| Californiacont. | | | |
| Romoland, School Dist. Special Tax Bonds, (Cmnty. | | | |
| Fac. Dist. No. 91-1), 5.00%, 9/1/41 | BB/P | $1,000,000 | $1,110,320 |
| Roseville, Special Tax | | | |
| 5.00%, 9/1/49 | BB/P | 1,000,000 | 1,107,600 |
| 5.00%, 9/1/45 | BB/P | 400,000 | 441,148 |
| 5.00%, 9/1/39 | BB/P | 465,000 | 523,079 |
| Roseville, Special Tax Bonds, (Westpark Cmnty. | | | |
| Pub. Fac. Dist. No. 1) | | | |
| 5.00%, 9/1/37 | BBB–/P | 1,250,000 | 1,370,000 |
| 5.00%, 9/1/33 | BBB–/P | 1,000,000 | 1,106,440 |
| Sacramento, City Fin. Auth. Tax Alloc. Bonds, Ser. A, | | | |
| FGIC, NATL, zero %, 12/1/23 | A | 10,000,000 | 9,212,700 |
| Salinas, Union High School Dist. G.O. Bonds, Ser. B | | | |
| 4.00%, 8/1/49 ## | A+ | 3,600,000 | 3,993,300 |
| 4.00%, 8/1/45 ## | A+ | 5,000,000 | 5,578,450 |
| San Bernardino Cnty., FRB, Ser. C, 1.811%, 8/1/23 | AA+ | 10,000,000 | 9,895,700 |
| San Bernardino Cnty., Special Tax Bonds, | | | |
| 5.00%, 9/1/33 | BBB–/P | 2,500,000 | 2,692,000 |
| San Diego Assn. of Govt. Capital Grant Receipts | | | |
| Rev. Bonds, (Mid Coast Corridor Transit), Ser. B, | | | |
| 1.80%, 11/15/27 | A– | 3,000,000 | 3,016,740 |
| San Diego Cmnty. Fac. Dist. No. 3 Special Tax Bonds, | | | |
| 5.00%, 9/1/36 | BBB/P | 975,000 | 1,033,305 |
| San Diego Cnty., Special Tax Bonds | | | |
| (Harmony Grove Village-Impt. Area No. 1), Ser. A, | | | |
| 4.00%, 9/1/50 | BB/P | 875,000 | 888,283 |
| (Harmony Grove Village-Impt. Area No. 2), Ser. A, | | | |
| 4.00%, 9/1/50 | BB/P | 1,100,000 | 1,121,065 |
| (Harmony Grove Village-Impt. Area No. 1), Ser. A, | | | |
| 4.00%, 9/1/45 | BB/P | 550,000 | 563,514 |
| (Harmony Grove Village-Impt. Area No. 2), Ser. A, | | | |
| 4.00%, 9/1/45 | BB/P | 1,000,000 | 1,031,000 |
| San Diego Cnty., Regl. Arpt. Auth. Rev. Bonds, Ser. B, | | | |
| 4.00%, 7/1/44 | A | 1,000,000 | 1,068,050 |
| San Diego, Assn. of Govt. South Bay Expressway Toll | | | |
| Rev. Bonds, Ser. A, 5.00%, 7/1/42 | A | 3,000,000 | 3,557,520 |
| San Diego, Cmnty College Dist. G.O. Bonds, | | | |
| 4.00%, 8/1/41 | Aaa | 2,345,000 | 2,579,008 |
| San Diego, Pub. Fac. Fin. Auth. Wtr. Rev. Bonds, | | | |
| Ser. B, FCS, FHL Banks Coll., FNMA Coll., U.S. Govt. | | | |
| Coll., 5.00%, 8/1/41 | Aa3 | 3,475,000 | 4,165,934 |
| San Diego, Tobacco Settlement Funding Corp. Rev. | | | |
| Bonds, Ser. C, 4.00%, 6/1/32 | BBB | 905,000 | 853,008 |
| San Diego, Unified School Dist. G.O. Bonds, Ser. K-2 | | | |
| zero %, 7/1/35 | Aa2 | 1,025,000 | 648,190 |
| zero %, 7/1/33 | Aa2 | 1,645,000 | 1,140,034 |
| zero %, 7/1/32 | Aa2 | 1,955,000 | 1,418,040 |
| San Francisco, City & Cnty. G.O. Bonds, Ser. A | | | |
| 4.00%, 6/15/36 | Aaa | 5,155,000 | 5,708,853 |
| 4.00%, 6/15/33 | Aaa | 3,550,000 | 3,935,424 |
|
| California Tax Exempt Income Fund 27 |
| | | |
| MUNICIPAL BONDS AND NOTES (100.5%)*cont. | Rating** | Principal amount | Value |
| Californiacont. | | | |
| San Francisco, City & Cnty. Rev. Bonds, (Pub. Util. | | | |
| Comm.), 4.00%, 11/1/39 | Aa2 | $5,000,000 | $5,502,550 |
| San Francisco, City & Cnty. Arpt. Comm. Intl. | | | |
| Arpt. Rev. Bonds | | | |
| (SFO Fuel Co., LLC), Ser. A, 5.00%, 1/1/47 | A1 | 3,000,000 | 3,449,190 |
| Ser. F, 5.00%, 5/1/40 | A1 | 4,740,000 | 4,752,419 |
| Ser. F, 5.00%, 5/1/40 (Prerefunded 5/1/20) | AA+/P | 10,000 | 10,032 |
| (SFO Fuel Co., LLC), Ser. A, 5.00%, 1/1/39 | A1 | 1,510,000 | 1,761,249 |
| (SFO Fuel Co., LLC), Ser. A, 5.00%, 1/1/38 | A1 | 1,500,000 | 1,754,415 |
| (SFO Fuel Co., LLC), Ser. A, 5.00%, 1/1/35 | A1 | 1,475,000 | 1,743,509 |
| Ser. E, 4.00%, 5/1/50 | A1 | 10,000,000 | 10,550,800 |
| San Francisco, City & Cnty. Arpt. Comm. Intl. Arpt. | | | |
| VRDN Rev. Bonds, Ser. B, 4.75%, 5/1/58 | VMIG 1 | 8,505,000 | 8,505,000 |
| San Francisco, City & Cnty. Pub. Util. Comm. Waste | | | |
| Wtr. Mandatory Put Bonds (10/1/23), (Green Bonds), | | | |
| Ser. C, 2.125%, 10/1/48 | AA | 3,000,000 | 3,058,230 |
| San Francisco, City & Cnty. Redev. Agcy. Cmnty. | | | |
| Successor Special Tax Bonds, (No. 6 Mission Bay | | | |
| South Pub. Impts.), Ser. A, 5.00%, 8/1/31 | BBB/P | 1,140,000 | 1,196,920 |
| San Francisco, City & Cnty. Redev. Agcy. Cmnty. | | | |
| Successor Tax Alloc. Bonds, (Mission Bay South | | | |
| Redev.), Ser. A, 5.00%, 8/1/43 | A– | 1,750,000 | 1,970,290 |
| San Jacinto, Unified School Dist. Fin. Auth. | | | |
| Special Tax | | | |
| 5.00%, 9/1/49 | BB/P | 2,650,000 | 2,946,535 |
| 5.00%, 9/1/44 | BB/P | 1,800,000 | 1,999,314 |
| 5.00%, 9/1/36 | BB/P | 600,000 | 679,542 |
| San Joaquin Hills, Trans. Corridor Agcy. Toll Road | | | |
| Rev. Bonds, Ser. A, 5.00%, 1/15/34 | A– | 7,125,000 | 7,689,585 |
| Santa Ana, Gas Tax Rev. Bonds | | | |
| 5.00%, 1/1/37 | AA– | 500,000 | 627,095 |
| 4.00%, 1/1/40 | AA– | 1,670,000 | 1,897,354 |
| 4.00%, 1/1/39 | AA– | 1,710,000 | 1,967,184 |
| 4.00%, 1/1/38 | AA– | 1,500,000 | 1,730,520 |
| Santaluz, Cmnty. Fac. Dist. No. 2 Special Tax Bonds, | | | |
| (Impt. Area No. 1), Ser. A | | | |
| 5.25%, 9/1/27 | A | 3,235,000 | 3,416,548 |
| 5.10%, 9/1/30 | A | 470,000 | 495,530 |
| Santee, CDC Successor Agcy. Tax Allocation Bonds, | | | |
| Ser. A, BAM | | | |
| 5.00%, 8/1/32 | AA | 2,000,000 | 2,399,000 |
| 5.00%, 8/1/31 | AA | 2,410,000 | 2,898,820 |
| School Fin. Fac. Auth. 144A Rev. Bonds, (Kipp | | | |
| LA Projects), Ser. A, 5.00%, 7/1/45 | BBB | 1,500,000 | 1,584,615 |
| South Orange Cnty., Pub. Fin. Auth. Special Tax | | | |
| Bonds, Ser. A | | | |
| 5.00%, 8/15/32 | AA | 1,000,000 | 1,065,620 |
| 5.00%, 8/15/30 | AA | 1,130,000 | 1,206,987 |
| South Western Cmnty. College Dist. G.O. Bonds, | | | |
| (Election 2008), Ser. D | | | |
| 5.00%, 8/1/44 | Aa2 | 4,000,000 | 4,601,360 |
| zero %, 8/1/37 | Aa2 | 3,100,000 | 1,527,742 |
|
| 28 California Tax Exempt Income Fund |
| | | |
| MUNICIPAL BONDS AND NOTES (100.5%)*cont. | Rating** | Principal amount | Value |
| Californiacont. | | | |
| Southern CA Pub. Pwr. Auth. Rev. Bonds | | | |
| (Natural Gas No. 1), Ser. A, 5.25%, 11/1/24 | A3 | $2,850,000 | $3,175,442 |
| Ser. A, 5.00%, 7/1/40 | Aa3 | 6,860,000 | 6,913,851 |
| Stockton, Pub. Wtr. Fin. Auth. Rev. Bonds, (Delta Wtr. | | | |
| Supply), Ser. A | | | |
| 6.25%, 10/1/40 (Prerefunded 10/1/23) | A | 1,250,000 | 1,471,213 |
| 6.25%, 10/1/38 (Prerefunded 10/1/23) | A | 2,235,000 | 2,630,528 |
| 6.125%, 10/1/35 (Prerefunded 10/1/23) | A | 750,000 | 879,518 |
| Stockton, Unified School Dist. COP | | | |
| 5.00%, 2/1/36 | A | 1,000,000 | 1,211,940 |
| 5.00%, 2/1/35 | A | 2,410,000 | 2,930,054 |
| 5.00%, 2/1/34 | A | 2,295,000 | 2,795,379 |
| 5.00%, 2/1/31 | A | 1,325,000 | 1,632,095 |
| Stockton, Unified School Dist. G.O. Bonds, (Election | | | |
| 2012), Ser. A | | | |
| 5.00%, 8/1/42 | AA | 3,000,000 | 3,359,100 |
| AGM, 5.00%, 8/1/38 | AA | 1,000,000 | 1,124,110 |
| Sunnyvale, Cmnty. Fac. Dist. Special Tax Bonds, | | | |
| 7.65%, 8/1/21 | B+/P | 1,195,000 | 1,198,513 |
| Sweetwater, G.O. Bonds, (Union High School Dist.), | | | |
| 5.00%, 8/1/35 | A3 | 2,330,000 | 2,707,507 |
| Tobacco Securitization Auth. of Southern | | | |
| CA Rev. Bonds | | | |
| Ser. A, Class 1, 5.00%, 6/1/48 | BBB+ | 2,000,000 | 2,103,180 |
| Ser. B-1, Class 2, 5.00%, 6/1/48 | BBB– | 14,250,000 | 14,512,628 |
| Ser. A, Class 1, 5.00%, 6/1/38 | A– | 725,000 | 849,287 |
| Ser. A, Class 1, 5.00%, 6/1/37 | A– | 1,000,000 | 1,179,620 |
| Turlock, Irrigation Dist. Rev. Bonds | | | |
| 5.00%, 1/1/39 ### | AA– | 2,425,000 | 3,049,777 |
| 5.00%, 1/1/38 ### | AA– | 2,325,000 | 2,896,880 |
| 5.00%, 1/1/37 ### | AA– | 4,550,000 | 5,690,731 |
| Tustin Cmnty., Fac. Dist. Special Tax Bonds, | | | |
| (No. 06-1 Legacy Columbus Villages), Ser. A, | | | |
| 5.00%, 9/1/37 | A– | 2,100,000 | 2,430,834 |
| Twin Rivers, Unified School Dist. G.O. Bonds, Ser. A, | | | |
| BAM, 5.00%, 8/1/40 | AA | 2,000,000 | 2,216,780 |
| U. of CA Rev. Bonds, Ser. AZ, 5.25%, 5/15/58 | Aa2 | 9,110,000 | 11,125,952 |
| U. of CA VRDN Rev. Bonds, Ser. AL-4, 0.40%, 5/15/48 | VMIG 1 | 5,900,000 | 5,900,000 |
| U. of CA Regents Med. Ctr. Rev. Bonds, Ser. L, | | | |
| 5.00%, 5/15/47 | Aa3 | 10,000,000 | 11,330,200 |
| Vernon, Elec. Syst. Rev. Bonds, Ser. A | | | |
| 5.00%, 8/1/37 | BBB+ | 795,000 | 933,370 |
| 5.00%, 8/1/35 | BBB+ | 1,440,000 | 1,702,152 |
| 5.00%, 8/1/34 | BBB+ | 1,060,000 | 1,257,817 |
| 5.00%, 8/1/33 | BBB+ | 960,000 | 1,143,120 |
| 5.00%, 8/1/32 | BBB+ | 1,000,000 | 1,194,070 |
| 5.00%, 8/1/31 | BBB+ | 770,000 | 921,913 |
| Yucaipa Special Tax Bonds, (Cmnty. Fac. Dist. No. | | | |
| 98-1 Chapman Heights), 5.375%, 9/1/30 | A | 2,350,000 | 2,469,051 |
| | | | 1,117,051,866 |
|
| California Tax Exempt Income Fund 29 |
| | | |
| MUNICIPAL BONDS AND NOTES (100.5%)*cont. | Rating** | Principal amount | Value |
| Guam (0.5%) | | | |
| Territory of GU, Govt. G.O. Bonds, 5.00%, 11/15/31 | Ba1 | $980,000 | $986,527 |
| Territory of GU, Govt. Wtr. Wks. Auth. Wtr. & | | | |
| Waste Wtr. Syst. Rev. Bonds, 5.625%, 7/1/40 | | | |
| (Prerefunded 7/1/20) | A– | 2,450,000 | 2,476,877 |
| Territory of GU, Port Auth. Rev. Bonds, Ser. A, | | | |
| 5.00%, 7/1/48 | A | 1,500,000 | 1,454,160 |
| Territory of GU, Pwr. Auth. Rev. Bonds, Ser. A, AGM, | | | |
| 5.00%, 10/1/30 | AA | 1,000,000 | 1,031,570 |
| | | | 5,949,134 |
| Illinois (0.2%) | | | |
| IL State G.O. Bonds, 5.00%, 1/1/41 | Baa3 | 1,770,000 | 1,783,063 |
| | | | 1,783,063 |
| Kentucky (0.7%) | | | |
| KY State Pub. Energy Auth. Gas Supply Mandatory | | | |
| Put Bonds (6/1/26), Ser. A, 4.00%, 12/1/50 | A1 | 8,000,000 | 8,000,160 |
| | | | 8,000,160 |
| Total municipal bonds and notes (cost $1,108,994,204) | | $1,144,547,678 |
| | | |
| | Principal amount/ | |
| SHORT-TERM INVESTMENTS (0.8%)* | | shares | Value |
| Putnam Short Term Investment Fund 0.92% L | Shares | 806,197 | $806,197 |
| U.S. Treasury Bills 1.572%, 5/7/20 ∆ | | $475,000 | 474,970 |
| U.S. Treasury Bills 1.546%, 7/16/20 ∆ | | 773,000 | 772,821 |
| U.S. Treasury Bills 1.144%, 6/11/20 ∆ | | 868,000 | 867,843 |
| U.S. Treasury Bills 0.502%, 5/5/20 ∆ | | 338,000 | 337,980 |
| U.S. Treasury Bills 0.294%, 4/28/20 ∆ | | 1,995,000 | 1,994,947 |
| U.S. Treasury Bills 0.005%, 9/10/20 ∆ | | 507,000 | 506,740 |
| U.S. Treasury Bills zero %, 8/20/20 ∆ | | 919,000 | 918,685 |
| U.S. Treasury Bills 1.551%, 5/14/20 | | 136,000 | 135,987 |
| U.S. Treasury Bills 0.407%, 4/14/20 | | 59,000 | 58,998 |
| U.S. Treasury Bills 0.310%, 7/23/20 | | 1,027,000 | 1,026,738 |
| U.S. Treasury Bills 0.015%, 9/3/20 | | 259,000 | 258,892 |
| U.S. Treasury Bills 0.011%, 8/6/20 | | 760,000 | 759,771 |
| U.S. Treasury Bills zero %, 8/13/20 | | 88,000 | 87,975 |
| Total short-term investments (cost $9,002,231) | | | $9,008,544 |
| |
| TOTAL INVESTMENTS | | | |
| Total investments (cost $1,117,996,435) | | $1,153,556,222 |
Notes to the fund’s portfolio
Unless noted otherwise, the notes to the fund’s portfolio are for the close of the fund’s reporting period, which ran from October 1, 2019 through March 31, 2020 (the reporting period). Within the following notes to the portfolio, references to “Putnam Management” represent Putnam Investment Management, LLC, the fund’s manager, an indirect wholly-owned subsidiary of Putnam Investments, LLC and references to “ASC 820” represent Accounting Standards Codification 820Fair Value Measurements and Disclosures.
*Percentages indicated are based on net assets of $1,138,736,265.
|
| 30 California Tax Exempt Income Fund |
**The Moody’s, Standard & Poor’s or Fitch ratings indicated are believed to be the most recent ratings available at the close of the reporting period for the securities listed. Ratings are generally ascribed to securities at the time of issuance. While the agencies may from time to time revise such ratings, they undertake no obligation to do so, and the ratings do not necessarily represent what the agencies would ascribe to these securities at the close of the reporting period. Securities rated by Fitch are indicated by “/F.” Securities rated by Putnam are indicated by “/P.” The Putnam rating categories are comparable to the Standard & Poor’s classifications. If a security is insured, it will usually be rated by the ratings organizations based on the financial strength of the insurer. For further details regarding security ratings, please see the Statement of Additional Information.
††The interest rate and date shown parenthetically represent the new interest rate to be paid and the date the fund will begin accruing interest at this rate.
∆This security, in part or in entirety, was pledged and segregated with the custodian for collateral on certain derivative contracts at the close of the reporting period. Collateral at period end totaled $3,918,573 and is included in Investments in securities on the Statement of assets and liabilities (Notes 1 and 8).
##Forward commitment, in part or in entirety (Note 1).
LSee Note 5 to the financial statements regarding investments in Putnam Short Term Investment Fund. The rate quoted in the security description is the annualized 7-day yield of the fund at the close of the reporting period.
TUnderlying security in a tender option bond transaction. This security has been segregated as collateral for financing transactions.
###When-issued security (Note 1).
At the close of the reporting period, the fund maintained liquid assets totaling $54,304,994 to cover certain derivative contracts, tender option bonds, and the settlement of certain securities.
Unless otherwise noted, the rates quoted in Short-term investments security descriptions represent the weighted average yield to maturity.
144A after the name of an issuer represents securities exempt from registration under Rule 144A of the Securities Act of 1933, as amended. These securities may be resold in transactions exempt from registration, normally to qualified institutional buyers.
On Mandatory Put Bonds, the rates shown are the current interest rates at the close of the reporting period and the dates shown represent the next mandatory put dates. Rates are set by remarketing agents and may take into consideration market supply and demand, credit quality and the current SIFMA Municipal Swap Index, 1 Month US LIBOR or 3 Month US LIBOR rates, which were 4.71%, 0.99% and 1.45%, respectively, as of the close of the reporting period.
The dates shown parenthetically on prerefunded bonds represent the next prerefunding dates.
The dates shown on debt obligations are the original maturity dates.
The fund had the following sector concentrations greater than 10% at the close of the reporting period (as a percentage of net assets):
| | |
| Health care | 14.8% | |
| Local debt | 14.3 | |
| Education | 11.8 | |
| Transportation | 11.2 | |
| Land | 11.0 | |
| Utilities | 10.2 | |
|
| California Tax Exempt Income Fund 31 |
| | | | | | |
| OTC INTEREST RATE SWAP CONTRACTS OUTSTANDING at 3/31/20 (Unaudited) | |
| | | Upfront | | | | |
| | | premium | Termina- | | | Unrealized |
| Swap counterparty/ | | received | tion | Payments | Payments | appreciation/ |
| Notional amount | Value | (paid) | date | made by fund | received by fund | (depreciation) |
| Citibank, N.A. | | | | | | |
| $24,840,000 | $1,685,618E | $— | 10/18/31 | 1.404% — | SIFMA Municipal | $(1,685,618) |
| | | | | Quarterly | Swap index — | |
| | | | | | Quarterly | |
| 46,000,000 | 1,445,550E | — | 10/18/26 | SIFMA Municipal | 1.182% — Quarterly | 1,445,550 |
| | | | | Swap index — | | |
| | | | | Quarterly | | |
| 88,000,000 | 2,661,560E | — | 10/20/26 | SIFMA Municipal | 1.159% — Quarterly | 2,661,560 |
| | | | | Swap index — | | |
| | | | | Quarterly | | |
| 25,900,000 | 3,611,133E | — | 10/21/41 | 1.559% — | SIFMA Municipal | (3,611,133) |
| | | | | Quarterly | Swap index — | |
| | | | | | Quarterly | |
| Upfront premium received | — | | Unrealized appreciation | 4,107,110 |
| Upfront premium (paid) | — | | Unrealized (depreciation) | (5,296,751) |
| Total | | $— | | Total | | $(1,189,641) |
EExtended effective date.
| | | | | | |
| OTC TOTAL RETURN SWAP CONTRACTS OUTSTANDING at 3/31/20 (Unaudited) | |
| | | Upfront | | | | |
| | | premium | Termina- | Payments | Total return | Unrealized |
| Swap counterparty/ | | received | tion | received (paid) | received by | appreciation/ |
| Notional amount | Value | (paid) | date | by fund | or paid by fund | (depreciation) |
| Bank of America N.A. | | | | | | |
| $9,110,000 | $52,747 | $— | 4/16/20 | $— | 1.02% minus | $(52,747) |
| | | | | | Municipal Market | |
| | | | | | Data Index AAA | |
| | | | | | municipal yields | |
| | | | | | 5 Year rate — At | |
| | | | | | maturity | |
| Citibank, N.A. | | | | | | |
| 24,000,000 | 537,240 | — | 5/14/20 | — | 1.27% minus | (537,240) |
| | | | | | Municipal Market | |
| | | | | | Data Index AAA | |
| | | | | | municipal yields | |
| | | | | | 10 Year rate — At | |
| | | | | | maturity | |
| 1,825,000 | 110,548 | — | 5/21/20 | — | 1.86% minus | (110,548) |
| | | | | | Municipal Market | |
| | | | | | Data Index AAA | |
| | | | | | municipal yields | |
| | | | | | 30 Year rate — At | |
| | | | | | maturity | |
| 3,650,000 | 225,884 | — | 6/4/20 | — | 1.86% minus | (225,884)�� |
| | | | | | Municipal Market | |
| | | | | | Data Index AAA | |
| | | | | | municipal yields | |
| | | | | | 30 Year rate — At | |
| | | | | | maturity | |
|
| 32 California Tax Exempt Income Fund |
| | | | | | |
| OTC TOTAL RETURN SWAP CONTRACTS OUTSTANDING at 3/31/20 (Unaudited)cont. | |
| | | Upfront | | | | |
| | | premium | Termina- | Payments | Total return | Unrealized |
| Swap counterparty/ | | received | tion | received (paid) | received by | appreciation/ |
| Notional amount | Value | (paid) | date | by fund | or paid by fund | (depreciation) |
| Citibank, N.A.cont. | | | | | | |
| $2,760,000 | $293,330 | $— | 6/2/20 | $— | 2.7% minus | $(293,330) |
| | | | | | Municipal Market | |
| | | | | | Data Index AAA | |
| | | | | | municipal yields | |
| | | | | | 30 Year rate — At | |
| | | | | | maturity | |
| 5,520,000 | 596,662 | — | 6/4/20 | — | 2.71% minus | (596,662) |
| | | | | | Municipal Market | |
| | | | | | Data Index AAA | |
| | | | | | municipal yields | |
| | | | | | 30 Year rate — At | |
| | | | | | maturity | |
| Morgan Stanley & Co. International PLC | | | | |
| 9,110,000 | 56,464 | — | 4/21/20 | — | 1.02% minus | (56,464) |
| | | | | | Municipal Market | |
| | | | | | Data Index AAA | |
| | | | | | municipal yields | |
| | | | | | 5 Year rate — At | |
| | | | | | maturity | |
| 2,283,000 | 142,856 | — | 5/21/20 | — | 1.85% minus | (142,856) |
| | | | | | Municipal Market | |
| | | | | | Data Index AAA | |
| | | | | | municipal yields | |
| | | | | | 30 Year rate — At | |
| | | | | | maturity | |
| 2,283,000 | 138,290 | — | 5/21/20 | — | 1.86% minus | (138,290) |
| | | | | | Municipal Market | |
| | | | | | Data Index AAA | |
| | | | | | municipal yields | |
| | | | | | 30 Year rate — At | |
| | | | | | maturity | |
| 3,500,000 | 357,322 | — | 6/4/20 | — | 2.68% minus | (357,322) |
| | | | | | Municipal Market | |
| | | | | | Data Index AAA | |
| | | | | | municipal yields | |
| | | | | | 30 Year rate — At | |
| | | | | | maturity | |
| Upfront premium received | — | | Unrealized appreciation | — |
| Upfront premium (paid) | — | | Unrealized (depreciation) | (2,511,343) |
| Total | | $— | | Total | | $(2,511,343) |
|
| California Tax Exempt Income Fund 33 |
ASC 820 establishes a three-level hierarchy for disclosure of fair value measurements. The valuation hierarchy is based upon the transparency of inputs to the valuation of the fund’s investments. The three levels are defined as follows:
Level 1: Valuations based on quoted prices for identical securities in active markets.
Level 2: Valuations based on quoted prices in markets that are not active or for which all significant inputs are observable, either directly or indirectly.
Level 3: Valuations based on inputs that are unobservable and significant to the fair value measurement.
The following is a summary of the inputs used to value the fund’s net assets as of the close of the reporting period:
| | | |
| | | | Valuation inputs | |
| Investments in securities: | Level 1 | Level 2 | Level 3 |
| Municipal bonds and notes | $— | $1,144,547,678 | $— |
| Short-term investments | 806,197 | 8,202,347 | — |
| Totals by level | $806,197 | $1,152,750,025 | $— |
| | | | |
| | | | Valuation inputs | |
| Other financial instruments: | Level 1 | Level 2 | Level 3 |
| Interest rate swap contracts | $— | $(1,189,641) | $— |
| Total return swap contracts | — | (2,511,343) | — |
| Totals by level | $— | $(3,700,984) | $— |
The accompanying notes are an integral part of these financial statements.
|
| 34 California Tax Exempt Income Fund |
Statement of assets and liabilities3/31/20 (Unaudited)
| |
| ASSETS | |
| Investment in securities, at value (Notes 1 and 8): | |
| Unaffiliated issuers (identified cost $1,117,190,238) | $1,152,750,025 |
| Affiliated issuers (identified cost $806,197) (Notes 1 and 5) | 806,197 |
| Interest and other receivables | 12,019,136 |
| Receivable for shares of the fund sold | 736,715 |
| Receivable for investments sold | 14,095,050 |
| Receivable for sales of delayed delivery securities (Note 1) | 9,270,318 |
| Receivable for custodian fees (Note 2) | 13,301 |
| Unrealized appreciation on OTC swap contracts (Note 1) | 4,107,110 |
| Prepaid assets | 10,151 |
| Total assets | 1,193,808,003 |
| |
| LIABILITIES | |
| Payable to custodian | 500,826 |
| Payable for purchases of delayed delivery securities (Note 1) | 29,765,679 |
| Payable for shares of the fund repurchased | 1,429,280 |
| Payable for compensation of Manager (Note 2) | 424,244 |
| Payable for investor servicing fees (Note 2) | 95,643 |
| Payable for Trustee compensation and expenses (Note 2) | 371,122 |
| Payable for administrative services (Note 2) | 1,915 |
| Payable for distribution fees (Note 2) | 563,642 |
| Payable for floating rate notes issued (Note 1) | 13,500,000 |
| Distributions payable to shareholders | 495,722 |
| Unrealized depreciation on OTC swap contracts (Note 1) | 7,808,094 |
| Other accrued expenses | 115,571 |
| Total liabilities | 55,071,738 |
| | |
| Net assets | $1,138,736,265 |
| |
| REPRESENTED BY | |
| Paid-in capital (Unlimited shares authorized) (Notes 1 and 4) | $1,102,451,704 |
| Total distributable earnings (Note 1) | 36,284,561 |
| Total — Representing net assets applicable to capital shares outstanding | $1,138,736,265 |
| |
| COMPUTATION OF NET ASSET VALUE AND OFFERING PRICE | |
| Net asset value and redemption price per class A share | |
| ($964,737,792 divided by 121,050,413 shares) | $7.97 |
| Offering price per class A share(100/96.00 of $7.97)* | $8.30 |
| Net asset value and offering price per class B share($1,380,310 divided by 173,390 shares)** | $7.96 |
| Net asset value and offering price per class C share($30,076,397 divided by 3,748,854 shares)** | $8.02 |
| Net asset value, offering price and redemption price per class R6 share | |
| ($2,421,179 divided by 302,670 shares) | $8.00 |
| Net asset value, offering price and redemption price per class Y share | |
| ($140,120,587 divided by 17,527,669 shares) | $7.99 |
*On single retail sales of less than $100,000. On sales of $100,000 or more the offering price is reduced.
**Redemption price per share is equal to net asset value less any applicable contingent deferred sales charge.
The accompanying notes are an integral part of these financial statements.
|
| California Tax Exempt Income Fund 35 |
Statement of operationsSix months ended 3/31/20 (Unaudited)
| |
| INVESTMENT INCOME | |
| Interest (including interest income of $50,214 from investments in affiliated issuers) (Note 5) | $18,455,573 |
| Total investment income | 18,455,573 |
| |
| EXPENSES | |
| Compensation of Manager (Note 2) | 2,477,030 |
| Investor servicing fees (Note 2) | 287,458 |
| Custodian fees (Note 2) | 9,654 |
| Trustee compensation and expenses (Note 2) | 15,185 |
| Distribution fees (Note 2) | 1,242,105 |
| Administrative services (Note 2) | 18,091 |
| Interest and fees expense (Note 2) | 82,971 |
| Other | 145,889 |
| Total expenses | 4,278,383 |
| Expense reduction (Note 2) | (1,721) |
| Net expenses | 4,276,662 |
| | |
| Net investment income | 14,178,911 |
| |
| REALIZED AND UNREALIZED GAIN (LOSS) | |
| Net realized gain (loss) on: | |
| Securities from unaffiliated issuers (Notes 1 and 3) | 6,093,656 |
| Futures contracts (Note 1) | (581,686) |
| Swap contracts (Note 1) | 1,465,615 |
| Total net realized gain | 6,977,585 |
| Change in net unrealized appreciation (depreciation) on: | |
| Securities from unaffiliated issuers | (38,057,800) |
| Futures contracts | 56,534 |
| Swap contracts | (2,641,962) |
| Total change in net unrealized depreciation | (40,643,228) |
| | |
| Net loss on investments | (33,665,643) |
| |
| Net decrease in net assets resulting from operations | $(19,486,732) |
The accompanying notes are an integral part of these financial statements.
|
| 36 California Tax Exempt Income Fund |
Statement of changes in net assets
| | |
| INCREASE (DECREASE) IN NET ASSETS | Six months ended 3/31/20* | Year ended 9/30/19 |
| Operations | | |
| Net investment income | $14,178,911 | $31,533,170 |
| Net realized gain on investments | 6,977,585 | 16,375,580 |
| Change in net unrealized appreciation (depreciation) | | |
| of investments | (40,643,228) | 48,139,378 |
| Net increase (decrease) in net assets resulting | | |
| from operations | (19,486,732) | 96,048,128 |
| Distributions to shareholders (Note 1): | | |
| From ordinary income | | |
| Taxable net investment income | | |
| Class A | (290,618) | (976,479) |
| Class B | (505) | (2,143) |
| Class C | (8,836) | (31,909) |
| Class M | — | (1,962) |
| Class R6 | (652) | (1,788) |
| Class Y | (31,233) | (83,479) |
| From tax-exempt net investment income | | |
| Class A | (12,295,530) | (27,779,258) |
| Class B | (15,165) | (44,715) |
| Class C | (251,439) | (636,667) |
| Class M | (5,950) | (51,044) |
| Class R6 | (32,693) | (54,210) |
| Class Y | (1,534,532) | (2,689,822) |
| Net realized short-term gain on investments | | |
| Class A | (6,805,315) | — |
| Class B | (11,822) | — |
| Class C | (206,902) | — |
| Class M | — | — |
| Class R6 | (15,269) | — |
| Class Y | (731,364) | — |
| From net realized long-term gain on investments | | |
| Class A | (9,336,209) | (9,551,970) |
| Class B | (16,218) | (20,959) |
| Class C | (283,845) | (312,132) |
| Class M | — | (19,190) |
| Class R6 | (20,947) | (17,488) |
| Class Y | (1,003,348) | (816,591) |
| Increase (decrease) from capital share transactions (Note 4) | 28,812,812 | (44,499,448) |
| Total increase (decrease) in net assets | (23,572,312) | 8,456,874 |
| |
| NET ASSETS | | |
| Beginning of period | 1,162,308,577 | 1,153,851,703 |
| End of period | $1,138,736,265 | $1,162,308,577 |
*Unaudited.
The accompanying notes are an integral part of these financial statements.
|
| California Tax Exempt Income Fund 37 |
Financial highlights(For a common share outstanding throughout the period)
| | | | | | | | | | | | | |
| | INVESTMENT OPERATIONS | LESS DISTRIBUTIONS | RATIOS AND SUPPLEMENTAL DATA |
| | | | | | | | | | | | | Ratio of net | |
| | Net asset | | Net realized | | From | | | | | | Ratio | investment | |
| | value, | | and unrealized | Total from | net | From | | Net asset | Total return | Net assets, | of expenses | income (loss) | Portfolio |
| | beginning | Net investment | gain (loss) | investment | investment | net realized gain | Total | value, end | at net asset | end of period | to average | to average | turnover |
| Period ended | of period | income (loss) | on investments | operations | income | on investments | distributions | of period | value (%)a | (in thousands) | net assets (%)b | net assets (%) | (%) |
| Class A | | | | | | | | | | | | | |
| March 31, 2020** | $8.33 | .10 | (.23) | (.13) | (.10) | (.13) | (.23) | $7.97 | (1.54)* | $964,738 | .37*d | 1.23* | 22* |
| September 30, 2019 | 7.95 | .23 | .46 | .69 | (.23) | (.08) | (.31) | 8.33 | 8.85 | 1,016,247 | .72 | 2.78 | 41 |
| September 30, 2018 | 8.14 | .24 | (.19) | .05 | (.24) | — | (.24) | 7.95 | .66 | 1,023,401 | .73 | 2.95 | 40 |
| September 30, 2017 | 8.39 | .27 | (.25) | .02 | (.27) | — | (.27) | 8.14 | .26 | 1,146,710 | .74 | 3.23 | 31 |
| September 30, 2016 | 8.19 | .29 | .20 | .49 | (.29) | — | (.29) | 8.39 | 6.08 | 1,253,683 | .75c | 3.43c | 16 |
| September 30, 2015 | 8.23 | .31 | (.04) | .27 | (.31) | — | (.31) | 8.19 | 3.29 | 1,226,347 | .74 | 3.73 | 14 |
| Class B | | | | | | | | | | | | | |
| March 31, 2020** | $8.32 | .07 | (.22) | (.15) | (.08) | (.13) | (.21) | $7.96 | (1.86)* | $1,380 | .69*d | .91* | 22* |
| September 30, 2019 | 7.94 | .17 | .47 | .64 | (.18) | (.08) | (.26) | 8.32 | 8.17 | 1,888 | 1.36 | 2.15 | 41 |
| September 30, 2018 | 8.13 | .19 | (.19) | — | (.19) | — | (.19) | 7.94 | .02 | 2,526 | 1.37 | 2.32 | 40 |
| September 30, 2017 | 8.38 | .21 | (.25) | (.04) | (.21) | — | (.21) | 8.13 | (.37) | 3,733 | 1.37 | 2.61 | 31 |
| September 30, 2016 | 8.18 | .23 | .21 | .44 | (.24) | — | (.24) | 8.38 | 5.41 | 5,059 | 1.38c | 2.81c | 16 |
| September 30, 2015 | 8.22 | .25 | (.04) | .21 | (.25) | — | (.25) | 8.18 | 2.64 | 5,360 | 1.37 | 3.10 | 14 |
| Class C | | | | | | | | | | | | | |
| March 31, 2020** | $8.38 | .07 | (.23) | (.16) | (.07) | (.13) | (.20) | $8.02 | (1.92)* | $30,076 | .76*d | .84* | 22* |
| September 30, 2019 | 8.00 | .16 | .47 | .63 | (.17) | (.08) | (.25) | 8.38 | 7.95 | 30,969 | 1.51 | 1.99 | 41 |
| September 30, 2018 | 8.19 | .18 | (.19) | (.01) | (.18) | — | (.18) | 8.00 | (.13) | 35,019 | 1.52 | 2.17 | 40 |
| September 30, 2017 | 8.44 | .20 | (.25) | (.05) | (.20) | — | (.20) | 8.19 | (.52) | 49,093 | 1.52 | 2.45 | 31 |
| September 30, 2016 | 8.23 | .22 | .21 | .43 | (.22) | — | (.22) | 8.44 | 5.33 | 60,951 | 1.53c | 2.64c | 16 |
| September 30, 2015 | 8.27 | .24 | (.04) | .20 | (.24) | — | (.24) | 8.23 | 2.46 | 46,944 | 1.52 | 2.95 | 14 |
| Class R6 | | | | | | | | | | | | | |
| March 31, 2020** | $8.36 | .11 | (.23) | (.12) | (.11) | (.13) | (.24) | $8.00 | (1.41)* | $2,421 | .26*d | 1.34* | 22* |
| September 30, 2019 | 7.97 | .24 | .48 | .72 | (.25) | (.08) | (.33) | 8.36 | 9.15 | 2,142 | .51 | 2.99 | 41 |
| September 30, 2018† | 8.01 | .09 | (.04) | .05 | (.09) | — | (.09) | 7.97 | .61* | 10 | .19* | 1.15* | 40 |
| Class Y | | | | | | | | | | | | | |
| March 31, 2020** | $8.35 | .11 | (.23) | (.12) | (.11) | (.13) | (.24) | $7.99 | (1.43)* | $140,121 | .26*d | 1.33* | 22* |
| September 30, 2019 | 7.97 | .24 | .47 | .71 | (.25) | (.08) | (.33) | 8.35 | 9.06 | 109,280 | .51 | 2.98 | 41 |
| September 30, 2018 | 8.16 | .26 | (.19) | .07 | (.26) | — | (.26) | 7.97 | .87 | 90,267 | .52 | 3.16 | 40 |
| September 30, 2017 | 8.41 | .28 | (.25) | .03 | (.28) | — | (.28) | 8.16 | .48 | 83,845 | .52 | 3.44 | 31 |
| September 30, 2016 | 8.21 | .30 | .21 | .51 | (.31) | — | (.31) | 8.41 | 6.29 | 78,603 | .53c | 3.63c | 16 |
| September 30, 2015 | 8.25 | .32 | (.04) | .28 | (.32) | — | (.32) | 8.21 | 3.50 | 58,017 | .52 | 3.95 | 14 |
*Not annualized.
**Unaudited.
†For the period May 22, 2018 (commencement of operations) to September 30, 2018.
aTotal return assumes dividend reinvestment and does not reflect the effect of sales charges.
bIncludes amounts paid through expense offset arrangements, if any (Note 2). Also excludes acquired fund fees, if any.
cReflects a voluntary waiver of certain fund expenses in effect during the period. As a result of such waivers, the expenses of each class reflect a reduction of less than .01% as a percentage of average net assets per share for each class (Note 2).
dIncludes interest and fees expense associated with borrowings which amounted to 0.01% as a percentage of average net assets.
The accompanying notes are an integral part of these financial statements.
| |
| 38 California Tax Exempt Income Fund | California Tax Exempt Income Fund 39 |
Notes to financial statements3/31/20 (Unaudited)
Within the following Notes to financial statements, references to “State Street” represent State Street Bank and Trust Company, references to “the SEC” represent the Securities and Exchange Commission, references to “Putnam Management” represent Putnam Investment Management, LLC, the fund’s manager, an indirect wholly-owned subsidiary of Putnam Investments, LLC and references to “OTC”, if any, represent over-the-counter. Unless otherwise noted, the “reporting period” represents the period from October 1, 2019 through March 31, 2020.
Putnam California Tax Exempt Income Fund (the fund) is a Massachusetts business trust, which is registered under the Investment Company Act of 1940, as amended, as a diversified open-end management investment company. The goal of the fund is to seek as high a level of current income exempt from federal income tax and California personal income tax as Putnam Management believes to be consistent with preservation of capital. The fund invests mainly in bonds that pay interest that is exempt from federal income tax and California personal income tax (but that may be subject to federal alternative minimum tax (AMT)), are investment-grade in quality, and have intermediate- to long-term maturities (i.e., three years or longer). Under normal circumstances, the fund invests so that at least 90% of the fund’s income distributions are exempt from federal income tax and California personal income tax, except during times of adverse market conditions, when more than 10% of the fund’s income distributions could be subject to these taxes. Such tax-exempt investments in which the fund invests are issued by or for states, territories or possessions of the United States or by their political subdivisions, agencies, authorities or other government entities, and the income from these investments is exempt from both federal and California personal income tax. This investment policy cannot be changed without the approval of the fund’s shareholders. Putnam Management may consider, among other factors, credit, interest rate and prepayment risks, as well as general market conditions, when deciding whether to buy or sell investments.
The fund offers class A, class B, class C, class R6 and class Y shares. Effective November 25, 2019, all class M shares were converted to class A shares and are no longer available for purchase. Purchases of class B shares are closed to new and existing investors except by exchange from class B shares of another Putnam fund or through dividend and/or capital gains reinvestment. Class A and class are sold with a maximum front-end sales charge of 4.00%. Class A shares generally are not subject to a contingent deferred sales charge, and class R6 and class Y shares are not subject to a contingent deferred sales charge. Class B shares, which convert to class A shares after approximately eight years, are not subject to a front-end sales charge and are subject to a contingent deferred sales charge if those shares are redeemed within six years of purchase. Class C shares are subject to a one-year 1.00% contingent deferred sales charge and generally convert to class A shares after approximately ten years. The expenses for class A, class B and class C may differ based on the distribution fee of each class, which is identified in Note 2. Class R6 and class Y shares, which are sold at net asset value, are generally subject to the same expenses as class A, class B and class C shares, but do not bear a distribution fee, and in the case of class R6 shares, bear a lower investor servicing fee, which is identified in Note 2. Class R6 and class Y shares are not available to all investors.
In the normal course of business, the fund enters into contracts that may include agreements to indemnify another party under given circumstances. The fund’s maximum exposure under these arrangements is unknown as this would involve future claims that may be, but have not yet been, made against the fund. However, the fund’s management team expects the risk of material loss to be remote.
The fund has entered into contractual arrangements with an investment adviser, administrator, distributor, shareholder servicing agent and custodian, who each provide services to the fund. Unless expressly stated otherwise, shareholders are not parties to, or intended beneficiaries of these contractual arrangements, and these contractual arrangements are not intended to create any shareholder right to enforce them against the service providers or to seek any remedy under them against the service providers, either directly or on behalf of the fund.
Under the fund’s Amended and Restated Agreement and Declaration of Trust, any claims asserted against or on behalf of the Putnam Funds, including claims against Trustees and Officers, must be brought in state and federal courts located within the Commonwealth of Massachusetts.
Note 1: Significant accounting policies
The following is a summary of significant accounting policies consistently followed by the fund in the preparation of its financial statements. The preparation of financial statements is in conformity with accounting principles generally accepted in the United States of America and requires management to make estimates and assumptions that affect the reported amounts of assets and liabilities in the financial statements and the reported amounts of increases and decreases in net assets from operations. Actual results could differ from those
|
| 40 California Tax Exempt Income Fund |
estimates. Subsequent events after the Statement of assets and liabilities date through the date that the financial statements were issued have been evaluated in the preparation of the financial statements.
Investment income, realized and unrealized gains and losses and expenses of the fund are borne pro-rata based on the relative net assets of each class to the total net assets of the fund, except that each class bears expenses unique to that class (including the distribution fees applicable to such classes). Each class votes as a class only with respect to its own distribution plan or other matters on which a class vote is required by law or determined by the Trustees. If the fund were liquidated, shares of each class would receive their pro-rata share of the net assets of the fund. In addition, the Trustees declare separate dividends on each class of shares.
Security valuationPortfolio securities and other investments are valued using policies and procedures adopted by the Board of Trustees. The Trustees have formed a Pricing Committee to oversee the implementation of these procedures and have delegated responsibility for valuing the fund’s assets in accordance with these procedures to Putnam Management. Putnam Management has established an internal Valuation Committee that is responsible for making fair value determinations, evaluating the effectiveness of the pricing policies of the fund and reporting to the Pricing Committee.
Tax-exempt bonds and notes are generally valued on the basis of valuations provided by an independent pricing service approved by the Trustees. Such services use information with respect to transactions in bonds, quotations from bond dealers, market transactions in comparable securities and various relationships between securities in determining value. These securities will generally be categorized as Level 2.
Investments in open-end investment companies (excluding exchange-traded funds), if any, which can be classified as Level 1 or Level 2 securities, are valued based on their net asset value. The net asset value of such investment companies equals the total value of their assets less their liabilities and divided by the number of their outstanding shares.
Certain investments, including certain restricted and illiquid securities and derivatives, are also valued at fair value following procedures approved by the Trustees. To assess the continuing appropriateness of fair valuations, the Valuation Committee reviews and affirms the reasonableness of such valuations on a regular basis after considering all relevant information that is reasonably available. Such valuations and procedures are reviewed periodically by the Trustees. These valuations consider such factors as significant market or specific security events such as interest rate or credit quality changes, various relationships with other securities, discount rates, U.S. Treasury, U.S. swap and credit yields, index levels, convexity exposures, recovery rates, sales and other multiples and resale restrictions. These securities are classified as Level 2 or as Level 3 depending on the priority of the significant inputs. The fair value of securities is generally determined as the amount that the fund could reasonably expect to realize from an orderly disposition of such securities over a reasonable period of time. By its nature, a fair value price is a good faith estimate of the value of a security in a current sale and does not reflect an actual market price, which may be different by a material amount.
Security transactions and related investment incomeSecurity transactions are recorded on the trade date (the date the order to buy or sell is executed). Gains or losses on securities sold are determined on the identified cost basis.
Interest income, including amortization and accretion of premiums and discounts on debt securities, is recorded on the accrual basis.
Securities purchased or sold on a forward commitment or delayed deliver basis may be settled at a future date beyond customary settlement time; interest income is accrued based on the terms of the securities. Losses may arise due to changes in the fair value of the underlying securities or if the counterparty does not perform under the contract.
Futures contractsThe fund uses futures contracts for hedging treasury term structure risk, and for yield curve positioning.
The potential risk to the fund is that the change in value of futures contracts may not correspond to the change in value of the hedged instruments. In addition, losses may arise from changes in the value of the underlying instruments, if there is an illiquid secondary market for the contracts, if interest or exchange rates move unexpectedly or if the counterparty to the contract is unable to perform. With futures, there is minimal counterparty credit risk to the fund since futures are exchange traded and the exchange’s clearinghouse, as counterparty to all exchange traded futures, guarantees the futures against default. Risks may exceed amounts recognized on the Statement of assets and liabilities. When the contract is closed, the fund records a realized gain or loss equal to the difference between the value of the contract at the time it was opened and the value at the time it was closed.
|
| California Tax Exempt Income Fund 41 |
Futures contracts are valued at the quoted daily settlement prices established by the exchange on which they trade. The fund and the broker agree to exchange an amount of cash equal to the daily fluctuation in the value of the futures contract. Such receipts or payments are known as “variation margin.”
Futures contracts outstanding at period end, if any, are listed after the fund’s portfolio.
Interest rate swap contractsThe fund entered into OTC and/or centrally cleared interest rate swap contracts, which are arrangements between two parties to exchange cash flows based on a notional principal amount, for hedging term structure risk, and for yield curve positioning.
An OTC and centrally cleared interest rate swap can be purchased or sold with an upfront premium. For OTC interest rate swap contracts, an upfront payment received by the fund is recorded as a liability on the fund’s books. An upfront payment made by the fund is recorded as an asset on the fund’s books. OTC and centrally cleared interest rate swap contracts are marked to market daily based upon quotations from an independent pricing service or market makers. Any change is recorded as an unrealized gain or loss on OTC interest rate swaps. Daily fluctuations in the value of centrally cleared interest rate swaps are settled through a central clearing agent and are recorded in variation margin on the Statement of assets and liabilities and recorded as unrealized gain or loss. Payments, including upfront premiums, received or made are recorded as realized gains or losses at the reset date or the closing of the contract. Certain OTC and centrally cleared interest rate swap contracts may include extended effective dates. Payments related to these swap contracts are accrued based on the terms of the contract.
The fund could be exposed to credit or market risk due to unfavorable changes in the fluctuation of interest rates or if the counterparty defaults, in the case of OTC interest rate contracts, or the central clearing agency or a clearing member defaults, in the case of centrally cleared interest rate swap contracts, on its respective obligation to perform under the contract. The fund’s maximum risk of loss from counterparty risk or central clearing risk is the fair value of the contract. This risk may be mitigated for OTC interest rate swap contracts by having a master netting arrangement between the fund and the counterparty and for centrally cleared interest rate swap contracts through the daily exchange of variation margin. There is minimal counterparty risk with respect to centrally cleared interest rate swap contracts due to the clearinghouse guarantee fund and other resources that are available in the event of a clearing member default. Risk of loss may exceed amounts recognized on the Statement of assets and liabilities.
OTC and centrally cleared interest rate swap contracts outstanding, including their respective notional amounts at period end, if any, are listed after the fund’s portfolio.
Total return swap contractsThe fund entered into OTC and/or centrally cleared total return swap contracts, which are arrangements to exchange a market-linked return for a periodic payment, both based on a notional principal amount, to hedge sector exposure, and for gaining exposure to specific sectors.
To the extent that the total return of the security, index or other financial measure underlying the transaction exceeds or falls short of the offsetting interest rate obligation, the fund will receive a payment from or make a payment to the counterparty. OTC and/or centrally cleared total return swap contracts are marked to market daily based upon quotations from an independent pricing service or market maker. Any change is recorded as an unrealized gain or loss on OTC total return swaps. Daily fluctuations in the value of centrally cleared total return swaps are settled through a central clearing agent and are recorded in variation margin on the Statement of assets and liabilities and recorded as unrealized gain or loss. Payments received or made are recorded as realized gains or losses. Certain OTC and/or centrally cleared total return swap contracts may include extended effective dates. Payments related to these swap contracts are accrued based on the terms of the contract. The fund could be exposed to credit or market risk due to unfavorable changes in the fluctuation of interest rates or in the price of the underlying security or index, the possibility that there is no liquid market for these agreements or that the counterparty may default on its obligation to perform. The fund’s maximum risk of loss from counterparty risk or central clearing risk is the fair value of the contract. This risk may be mitigated for OTC total return swap contracts by having a master netting arrangement between the fund and the counterparty and for centrally cleared total return swap contracts through the daily exchange of variation margin. There is minimal counterparty risk with respect to centrally cleared total return swap contracts due to the clearinghouse guarantee fund and other resources that are available in the event of a clearing member default. Risk of loss may exceed amounts recognized on the Statement of assets and liabilities.
OTC and/or centrally cleared total return swap contracts outstanding, including their respective notional amounts at period end, if any, are listed after the fund’s portfolio.
|
| 42 California Tax Exempt Income Fund |
Master agreementsThe fund is a party to ISDA (International Swaps and Derivatives Association, Inc.) Master Agreements (Master Agreements) with certain counterparties that govern OTC derivative and foreign exchange contracts entered into from time to time. The Master Agreements may contain provisions regarding, among other things, the parties’ general obligations, representations, agreements, collateral requirements, events of default and early termination. With respect to certain counterparties, in accordance with the terms of the Master Agreements, collateral posted to the fund is held in a segregated account by the fund’s custodian and, with respect to those amounts which can be sold or repledged, is presented in the fund’s portfolio.
Collateral pledged by the fund is segregated by the fund’s custodian and identified in the fund’s portfolio. Collateral can be in the form of cash or debt securities issued by the U.S. Government or related agencies or other securities as agreed to by the fund and the applicable counterparty. Collateral requirements are determined based on the fund’s net position with each counterparty.
Termination events applicable to the fund may occur upon a decline in the fund’s net assets below a specified threshold over a certain period of time. Termination events applicable to counterparties may occur upon a decline in the counterparty’s long-term and short-term credit ratings below a specified level. In each case, upon occurrence, the other party may elect to terminate early and cause settlement of all derivative and foreign exchange contracts outstanding, including the payment of any losses and costs resulting from such early termination, as reasonably determined by the terminating party. Any decision by one or more of the fund’s counterparties to elect early termination could impact the fund’s future derivative activity.
At the close of the reporting period, the fund had a net liability position of $3,700,984 on open derivative contracts subject to the Master Agreements. Collateral posted by the fund at period end for these agreements totaled $3,918,573 and may include amounts related to unsettled agreements.
Tender option bond transactionsThe fund may participate in transactions whereby a fixed-rate bond is transferred to a tender option bond trust (TOB trust) sponsored by a broker. The TOB trust funds the purchase of the fixed rate bonds by issuing floating-rate bonds to third parties and allowing the fund to retain the residual interest in the TOB trust’s assets and cash flows, which are in the form of inverse floating rate bonds. The inverse floating rate bonds held by the fund give the fund the right to (1) cause the holders of the floating rate bonds to tender their notes at par, and (2) to have the fixed-rate bond held by the TOB trust transferred to the fund, causing the TOB trust to collapse. The fund accounts for the transfer of the fixed-rate bond to the TOB trust as a secured borrowing by including the fixed-rate bond in the fund’s portfolio and including the floating rate bond as a liability in the Statement of assets and liabilities. At the close of the reporting period, the fund’s investments with a value of $20,446,110 were held by the TOB trust and served as collateral for $13,500,000 in floating-rate bonds outstanding. For the reporting period ended, the fund incurred interest expense of $62,775 for these investments based on an average interest rate of 1.61%.
Interfund lendingThe fund, along with other Putnam funds, may participate in an interfund lending program pursuant to an exemptive order issued by the SEC. This program allows the fund to borrow from other Putnam funds that permit such transactions. Interfund lending transactions are subject to each fund’s investment policies and borrowing and lending limits. Interest earned or paid on the interfund lending transaction will be based on the average of certain current market rates. During the reporting period, the fund did not utilize the program.
Lines of creditThe fund participates, along with other Putnam funds, in a $317.5 million unsecured committed line of credit and a $235.5 million unsecured uncommitted line of credit, both provided by State Street. Borrowings may be made for temporary or emergency purposes, including the funding of shareholder redemption requests and trade settlements. Interest is charged to the fund based on the fund’s borrowing at a rate equal to 1.25% plus the higher of (1) the Federal Funds rate and (2) the overnight LIBOR for the committed line of credit and the Federal Funds rate plus 1.30% for the uncommitted line of credit. A closing fee equal to 0.04% of the committed line of credit and 0.04% of the uncommitted line of credit has been paid by the participating funds. In addition, a commitment fee of 0.21% per annum on any unutilized portion of the committed line of credit is allocated to the participating funds based on their relative net assets and paid quarterly. During the reporting period, the fund had no borrowings against these arrangements.
Federal taxesIt is the policy of the fund to distribute all of its income within the prescribed time period and otherwise comply with the provisions of the Internal Revenue Code of 1986, as amended (the Code), applicable to regulated investment companies. It is also the intention of the fund to distribute an amount sufficient to avoid imposition of any excise tax under Section 4982 of the Code.
The fund is subject to the provisions of Accounting Standards Codification 740Income Taxes(ASC 740). ASC 740 sets forth a minimum threshold for financial statement recognition of the benefit of a tax position taken or
|
| California Tax Exempt Income Fund 43 |
expected to be taken in a tax return. The fund did not have a liability to record for any unrecognized tax benefits in the accompanying financial statements. No provision has been made for federal taxes on income, capital gains or unrealized appreciation on securities held nor for excise tax on income and capital gains. Each of the fund’s federal tax returns for the prior three fiscal years remains subject to examination by the Internal Revenue Service.
Tax cost of investments includes adjustments to net unrealized appreciation (depreciation) which may not necessarily be final tax cost basis adjustments, but closely approximate the tax basis unrealized gains and losses that may be realized and distributed to shareholders. The aggregate identified cost on a tax basis is $1,118,028,612, resulting in gross unrealized appreciation and depreciation of $63,917,545 and $32,090,919, respectively, or net unrealized appreciation of $31,826,626.
Distributions to shareholdersIncome dividends are recorded daily by the fund and are paid monthly. Distributions from capital gains, if any, are recorded on the ex-dividend date and paid at least annually. The amount and character of income and gains to be distributed are determined in accordance with income tax regulations which may differ from generally accepted accounting principles. Dividend sources are estimated at the time of declaration. Actual results may vary. Any non-taxable return of capital cannot be determined until final tax calculations are completed after the end of the fund’s fiscal year. Reclassifications are made to the fund’s capital accounts to reflect income and gains available for distribution (or available capital loss carryovers) under income tax regulations.
Note 2: Management fee, administrative services and other transactions
The fund pays Putnam Management a management fee (based on the fund’s average net assets and computed and paid monthly) at annual rates that may vary based on the average of the aggregate net assets of all open-end mutual funds sponsored by Putnam Management (excluding net assets of funds that are invested in, or that are invested in by, other Putnam funds to the extent necessary to avoid “double counting” of those assets). Such annual rates may vary as follows:
| | | | |
| 0.590% | of the first $5 billion, | | 0.390% | of the next $50 billion, |
| 0.540% | of the next $5 billion, | | 0.370% | of the next $50 billion, |
| 0.490% | of the next $10 billion, | | 0.360% | of the next $100 billion and |
| 0.440% | of the next $10 billion, | | 0.355% | of any excess thereafter. |
For the reporting period, the management fee represented an effective rate (excluding the impact from any expense waivers in effect) of 0.214% of the fund’s average net assets.
Putnam Management has contractually agreed, through January 30, 2021, to waive fees and/or reimburse the fund’s expenses to the extent necessary to limit the cumulative expenses of the fund, exclusive of brokerage, interest, taxes, investment-related expenses, extraordinary expenses, acquired fund fees and expenses and payments under the fund’s investor servicing contract, investment management contract and distribution plans, on a fiscal year-to-date basis to an annual rate of 0.20% of the fund’s average net assets over such fiscal year-to-date period. During the reporting period, the fund’s expenses were not reduced as a result of this limit.
Putnam Investments Limited (PIL), an affiliate of Putnam Management, is authorized by the Trustees to manage a separate portion of the assets of the fund as determined by Putnam Management from time to time. PIL did not manage any portion of the assets of the fund during the reporting period. If Putnam Management were to engage the services of PIL, Putnam Management would pay a quarterly sub-management fee to PIL for its services at an annual rate of 0.40% of the average net assets of the portion of the fund managed by PIL.
The fund reimburses Putnam Management an allocated amount for the compensation and related expenses of certain officers of the fund and their staff who provide administrative services to the fund. The aggregate amount of all such reimbursements is determined annually by the Trustees.
Custodial functions for the fund’s assets are provided by State Street. Custody fees are based on the fund’s asset level, the number of its security holdings and transaction volumes.
Putnam Investor Services, Inc., an affiliate of Putnam Management, provides investor servicing agent functions to the fund. Putnam Investor Services, Inc. received fees for investor servicing for class A, class B, class C and class Y shares that included (1) a per account fee for each direct and underlying non-defined contribution account (retail account) of the fund; (2) a specified rate of the fund’s assets attributable to defined contribution plan accounts; and (3) a specified rate based on the average net assets in retail accounts. Putnam Investor Services, Inc. has agreed that the aggregate investor servicing fees for each fund’s retail and defined contribution
|
| 44 California Tax Exempt Income Fund |
accounts for these share classes will not exceed an annual rate of 0.25% of the fund’s average assets attributable to such accounts.
Effective November 25, 2019, the fund converted all of its class M shares to class A shares and class M shares were no longer able to be purchased.
Class R6 shares paid a monthly fee based on the average net assets of class R6 shares at an annual rate of 0.05%.
During the reporting period, the expenses for each class of shares related to investor servicing fees were as follows:
| | | | |
| Class A | $249,961 | | Class R6 | 611 |
| Class B | 418 | | Class Y | 28,698 |
| Class C | 7,635 | | Total | $287,458 |
| Class M | 135 | | | |
The fund has entered into expense offset arrangements with Putnam Investor Services, Inc. and State Street whereby Putnam Investor Services, Inc.’s and State Street’s fees are reduced by credits allowed on cash balances. For the reporting period, the fund’s expenses were reduced by $1,721 under the expense offset arrangements.
Each Independent Trustee of the fund receives an annual Trustee fee, of which $779, as a quarterly retainer, has been allocated to the fund, and an additional fee for each Trustees meeting attended. Trustees also are reimbursed for expenses they incur relating to their services as Trustees.
The fund has adopted a Trustee Fee Deferral Plan (the Deferral Plan) which allows the Trustees to defer the receipt of all or a portion of Trustees fees payable on or after July 1, 1995. The deferred fees remain invested in certain Putnam funds until distribution in accordance with the Deferral Plan.
The fund has adopted an unfunded noncontributory defined benefit pension plan (the Pension Plan) covering all Trustees of the fund who have served as a Trustee for at least five years and were first elected prior to 2004. Benefits under the Pension Plan are equal to 50% of the Trustee’s average annual attendance and retainer fees for the three years ended December 31, 2005. The retirement benefit is payable during a Trustee’s lifetime, beginning the year following retirement, for the number of years of service through December 31, 2006. Pension expense for the fund is included in Trustee compensation and expenses in the Statement of operations. Accrued pension liability is included in Payable for Trustee compensation and expenses in the Statement of assets and liabilities. The Trustees have terminated the Pension Plan with respect to any Trustee first elected after 2003.
The fund has adopted distribution plans (the Plans) with respect to the following share classes pursuant to Rule 12b–1 under the Investment Company Act of 1940. The purpose of the Plans is to compensate Putnam Retail Management Limited Partnership, an indirect wholly-owned subsidiary of Putnam Investments, LLC, for services provided and expenses incurred in distributing shares of the fund. The Plans provide payments by the fund to Putnam Retail Management Limited Partnership at an annual rate of up to the following amounts (Maximum %) of the average net assets attributable to each class. The Trustees have approved payment by the fund at the following annual rate (Approved %) of the average net assets attributable to each class. During the reporting period, the class-specific expenses related to distribution fees were as follows:
| | | |
| | Maximum % | Approved % | Amount |
| Class A | 0.35% | * | $1,079,358 |
| Class B | 1.00% | 0.85% | 7,182 |
| Class C | 1.00% | 1.00% | 154,202 |
| Class M** | 1.00% | 0.50% | 1,363 |
| Total | | | $1,242,105 |
*Equals the weighted average of (i) 0.20% of the net assets of the fund attributable to class A shares purchased and paid for prior to April 1, 2005 and (ii) 0.25% of all other net assets of the fund attributable to class A shares.Effective July 1, 2020, the Trustees have approved payment by the fund at a rate of 0.25% of all assets attributable to class A shares.
**Effective November 25, 2019, the fund converted all of its class M shares to class A shares and class M shares were no longer able to be purchased.
|
| California Tax Exempt Income Fund 45 |
For the reporting period, Putnam Retail Management Limited Partnership, acting as underwriter, received net commissions of $16,129 and $0 from the sale of class A and class M shares, respectively, and received $39 and $0 in contingent deferred sales charges from redemptions of class B and class C shares, respectively.
A deferred sales charge of up to 1.00% is assessed on certain redemptions of class A shares. For the reporting period, Putnam Retail Management Limited Partnership, acting as underwriter, received no monies on class A redemptions.
Note 3: Purchases and sales of securities
During the reporting period, the cost of purchases and the proceeds from sales, excluding short-term investments, were as follows:
| | |
| | Cost of purchases | Proceeds from sales |
| Investments in securities (Long-term) | $245,646,383 | $252,918,424 |
| U.S. government securities (Long-term) | — | — |
| Total | $245,646,383 | $252,918,424 |
The fund may purchase or sell investments from or to other Putnam funds in the ordinary course of business, which can reduce the fund’s transaction costs, at prices determined in accordance with SEC requirements and policies approved by the Trustees. During the reporting period, purchases or sales of long-term securities from or to other Putnam funds, if any, did not represent more than 5% of the fund’s total cost of purchases and/or total proceeds from sales.
Note 4: Capital shares
At the close of the reporting period, there were an unlimited number of shares of beneficial interest authorized. Transactions, including, if applicable, direct exchanges pursuant to share conversions, in capital shares were as follows:
| | | | |
| | SIX MONTHS ENDED 3/31/20 | YEAR ENDED 9/30/19 |
| Class A | Shares | Amount | Shares | Amount |
| Shares sold | 5,256,662 | $43,553,536 | 7,211,008 | $58,269,203 |
| Shares issued in connection with | | | | |
| reinvestment of distributions | 2,890,115 | 23,728,160 | 3,880,144 | 31,157,964 |
| | 8,146,777 | 67,281,696 | 11,091,152 | 89,427,167 |
| Shares repurchased | (9,150,905) | (74,878,843) | (17,804,607) | (143,551,894) |
| Net decrease | (1,004,128) | $(7,597,147) | (6,713,455) | $(54,124,727) |
| |
| | SIX MONTHS ENDED 3/31/20 | YEAR ENDED 9/30/19 |
| Class B | Shares | Amount | Shares | Amount |
| Shares sold | 13,072 | $109,327 | 527 | $4,275 |
| Shares issued in connection with | | | | |
| reinvestment of distributions | 5,314 | 43,555 | 8,244 | 65,938 |
| | 18,386 | 152,882 | 8,771 | 70,213 |
| Shares repurchased | (72,054) | (597,569) | (99,921) | (799,073) |
| Net decrease | (53,668) | $(444,687) | (91,150) | $(728,860) |
|
| 46 California Tax Exempt Income Fund |
| | | | |
| | SIX MONTHS ENDED 3/31/20 | YEAR ENDED 9/30/19 |
| Class C | Shares | Amount | Shares | Amount |
| Shares sold | 484,281 | $4,044,003 | 526,092 | $4,289,883 |
| Shares issued in connection with | | | | |
| reinvestment of distributions | 76,002 | 627,902 | 99,894 | 805,280 |
| | 560,283 | 4,671,905 | 625,986 | 5,095,163 |
| Shares repurchased | (507,530) | (4,188,725) | (1,308,928) | (10,630,679) |
| Net increase (decrease) | 52,753 | $483,180 | (682,942) | $(5,535,516) |
| |
| | SIX MONTHS ENDED 3/31/20 | YEAR ENDED 9/30/19 |
| Class M* | Shares | Amount | Shares | Amount |
| Shares sold | — | $— | 2,711 | $21,758 |
| Shares issued in connection with | | | | |
| reinvestment of distributions | 327 | 2,709 | 7,712 | 61,669 |
| | 327 | 2,709 | 10,423 | 83,427 |
| Shares repurchased | (215,012) | (1,780,342) | (127,310) | (1,015,915) |
| Net decrease | (214,685) | $(1,777,633) | (116,887) | $(932,488) |
| |
| | SIX MONTHS ENDED 3/31/20 | YEAR ENDED 9/30/19 |
| Class R6 | Shares | Amount | Shares | Amount |
| Shares sold | 183,208 | $1,529,027 | 356,173 | $2,839,855 |
| Shares issued in connection with | | | | |
| reinvestment of distributions | 6,890 | 56,778 | 8,595 | 69,342 |
| | 190,098 | 1,585,805 | 364,768 | 2,909,197 |
| Shares repurchased | (143,804) | (1,193,797) | (109,656) | (879,382) |
| Net increase | 46,294 | $392,008 | 255,112 | $2,029,815 |
| |
| | SIX MONTHS ENDED 3/31/20 | YEAR ENDED 9/30/19 |
| Class Y | Shares | Amount | Shares | Amount |
| Shares sold | 7,124,170 | $59,669,503 | 5,648,363 | $45,864,026 |
| Shares issued in connection with | | | | |
| reinvestment of distributions | 301,049 | 2,480,415 | 320,835 | 2,588,652 |
| | 7,425,219 | 62,149,918 | 5,969,198 | 48,452,678 |
| Shares repurchased | (2,982,670) | (24,392,827) | (4,208,066) | (33,660,350) |
| Net increase | 4,442,549 | $37,757,091 | 1,761,132 | $14,792,328 |
*Effective November 25, 2019, the fund converted all of its class M shares to class A shares and class M shares were no longer able to be purchased.
|
| California Tax Exempt Income Fund 47 |
Note 5: Affiliated transactions
Transactions during the reporting period with any company which is under common ownership or control were as follows:
| | | | | |
| | | | | | Shares |
| | | | | | outstanding |
| | | | | | and fair |
| | Fair value as | Purchase | Sale | Investment | value as |
| Name of affiliate | of 9/30/19 | cost | proceeds | income | of 3/31/20 |
| Short-term investments | | | | | |
| Putnam Short Term | | | | | |
| Investment Fund* | $— | $152,259,892 | $151,453,695 | $50,214 | $806,197 |
| Total Short-term | | | | | |
| investments | $— | $152,259,892 | $151,453,695 | $50,214 | $806,197 |
*Management fees charged to Putnam Short Term Investment Fund have been waived by Putnam Management. There were no realized or unrealized gains or losses during the period.
Note 6: Market, credit and other risks
In the normal course of business, the fund trades financial instruments and enters into financial transactions where risk of potential loss exists due to changes in the market (market risk) or failure of the contracting party to the transaction to perform (credit risk). The fund may be exposed to additional credit risk that an institution or other entity with which the fund has unsettled or open transactions will default. The fund focuses a majority of its investments in the state of California and may be affected by economic and political developments in that state.
On July 27, 2017, the United Kingdom’s Financial Conduct Authority (“FCA”), which regulates LIBOR, announced a desire to phase out the use of LIBOR by the end of 2021. LIBOR has historically been a common benchmark interest rate index used to make adjustments to variable-rate loans. It is used throughout global banking and financial industries to determine interest rates for a variety of financial instruments and borrowing arrangements.. The transition process might lead to increased volatility and illiquidity in markets that currently rely on LIBOR to determine interest rates. It could also lead to a reduction in the value of some LIBOR-based investments and reduce the effectiveness of new hedges placed against existing LIBOR-based investments. While some LIBOR-based instruments may contemplate a scenario where LIBOR is no longer available by providing for an alternative rate-setting methodology, not all may have such provisions and there may be significant uncertainty regarding the effectiveness of any such alternative methodologies. Since the usefulness of LIBOR as a benchmark could deteriorate during the transition period, these effects could occur prior to the end of 2021.
Beginning in January 2020, global financial markets have experienced, and may continue, to experience significant volatility resulting from the spread of a virus known as COVID–19. The outbreak of COVID–19 has resulted in travel and border restrictions, quarantines, supply chain disruptions, lower consumer demand, and general market uncertainty. The effects of COVID–19 have adversely affected, and may continue to adversely affect, the global economy, the economies of certain nations, and individual issuers, all of which may negatively impact the fund’s performance.
|
| 48 California Tax Exempt Income Fund |
Note 7: Summary of derivative activity
The volume of activity for the reporting period for any derivative type that was held during the period is listed below and was based on an average of the holdings at the end of each fiscal quarter:
| |
| Futures contracts (number of contracts) | 20 |
| OTC interest rate swap contracts (notional) | $168,900,000 |
| OTC total return swap contracts (notional) | $61,200,000 |
The following is a summary of the fair value of derivative instruments as of the close of the reporting period:
| | | | |
| Fair value of derivative instruments as of the close of the reporting period | |
| | ASSET DERIVATIVES | LIABILITY DERIVATIVES |
| Derivatives not | | | | |
| accounted for as | Statement of | | Statement of | |
| hedging instruments | assets and | | assets and | |
| under ASC 815 | liabilities location | Fair value | liabilities location | Fair value |
| Interest rate contracts | Receivables | $4,107,110 | Payables | $7,808,094 |
| Total | | $4,107,110 | | $7,808,094 |
The following is a summary of realized and change in unrealized gains or losses of derivative instruments in the Statement of operations for the reporting period (Note 1):
| | | |
| Amount of realized gain or (loss) on derivatives recognized in net gain or (loss) on investments | |
| Derivatives not accounted for as hedging | | | |
| instruments under ASC 815 | Futures | Swaps | Total |
| Interest rate contracts | $(581,686) | $1,465,615 | $883,929 |
| Total | $(581,686) | $1,465,615 | $883,929 |
| |
| Change in unrealized appreciation or (depreciation) on derivatives recognized in net gain or (loss) | |
| on investments | | | |
| Derivatives not accounted for as hedging | | | |
| instruments under ASC 815 | Futures | Swaps | Total |
| Interest rate contracts | $56,534 | $(2,641,962) | $(2,585,428) |
| Total | $56,534 | $(2,641,962) | $(2,585,428) |
|
| California Tax Exempt Income Fund 49 |
Note 8: Offsetting of financial and derivative assets and liabilities
The following table summarizes any derivatives, repurchase agreements and reverse repurchase agreements, at the end of the reporting period, that are subject to an enforceable master netting agreement or similar agreement. For securities lending transactions or borrowing transactions associated with securities sold short, if any, see Note 1. For financial reporting purposes, the fund does not offset financial assets and financial liabilities that are subject to the master netting agreements in the Statement of assets and liabilities.
| | | | |
| | | | Morgan Stanley & | |
| | Bank of America | | Co. International | |
| | N.A. | Citibank, N.A. | PLC | Total |
| Assets: | | | | |
| OTC Interest rate swap contracts*# | $— | $4,107,110 | $— | $4,107,110 |
| OTC Total return swap contracts*# | — | — | — | — |
| Total Assets | $— | $4,107,110 | $— | $4,107,110 |
| Liabilities: | | | | |
| OTC Interest rate swap contracts*# | — | 5,296,751 | — | 5,296,751 |
| OTC Total return swap contracts*# | 52,747 | 1,763,664 | 694,932 | 2,511,343 |
| Total Liabilities | $52,747 | $7,060,415 | $694,932 | $7,808,094 |
| Total Financial and Derivative | $(52,747) | $(2,953,305) | $(694,932) | $(3,700,984) |
| Net Assets | | | | |
| Total collateral received | $(52,747) | $(2,953,305) | $(661,970) | |
| (pledged)†## | | | | |
| Net amount | $— | $— | $(32,962) | |
| Controlled collateral received | | | | |
| (including TBA commitments)** | $— | $— | $— | $— |
| Uncontrolled collateral received | $— | $— | $— | $— |
| Collateral (pledged) (including TBA | | | | |
| commitments)** | $(181,979) | $(3,074,624) | $(661,970) | $(3,918,573) |
*Excludes premiums, if any. Included in unrealized appreciation and depreciation on OTC swap contracts on the Statement of assets and liabilities.
**Included with Investments in securities on the Statement of assets and liabilities.
†Additional collateral may be required from certain brokers based on individual agreements.
#Covered by master netting agreement (Note 1).
##Any over-collateralization of total financial and derivative net assets is not shown. Collateral may include amounts related to unsettled agreements.
Note 9: Change in independent accountants
On March 20, 2020, the Audit, Compliance and Distributions Committee of the Trustees of the Putnam Funds approved and recommended the decision to change the Fund’s independent accountant and to not retain KPMG LLP, and on April 3, 2020, upon request of the Putnam Funds, KPMG LLP provided a letter of resignation. During the two previous fiscal years, KPMG LLP audit reports contained no adverse opinion or disclaimer of opinion; nor were its reports qualified or modified as to uncertainty, audit scope, or accounting principle. Further, in connection with its audits for the two previous fiscal years and the subsequent interim period through April 3, 2020: (i) there were no disagreements with KPMG LLP on any matter of accounting principles or practices, financial statement disclosure, or auditing scope or procedure, which disagreements if not resolved to the satisfaction of KPMG LLP would have caused it to make reference to the subject matter of the disagreements in its report on the Fund’s financial statements for such years, and (ii) there were no “reportable events” of the kind described in Item 304(a)(1)(v) of Regulation S-K under the Securities Act of 1933, as amended, and the Securities Exchange Act of 1934, as amended.
On April 17, 2020, the Audit, Compliance and Distributions Committee of the Trustees of the Putnam Funds approved and recommended the decision to appoint PricewaterhouseCoopers LLP as the Fund’s independent accountant.
|
| 50 California Tax Exempt Income Fund |
Putnam family of funds
The following is a list of Putnam’s open-end mutual funds offered to the public.Investors should carefully consider the investment objective, risks, charges, and expenses of a fund before investing. For a prospectus, or a summary prospectus if available, containing this and other information for any Putnam fund or product, contact your financial advisor or call Putnam Investor Services at 1-800-225-1581. Please read the prospectus carefully before investing.
| |
| Blend | Income |
| Capital Spectrum Fund | Convertible Securities Fund |
| Emerging Markets Equity Fund | Diversified Income Trust |
| Equity Spectrum Fund | Floating Rate Income Fund |
| Focused Equity Fund | Global Income Trust |
| Global Equity Fund | Government Money Market Fund* |
| International Capital Opportunities Fund | High Yield Fund |
| International Equity Fund | Income Fund |
| Multi-Cap Core Fund | Money Market Fund† |
| Research Fund | Mortgage Opportunities Fund |
| Mortgage Securities Fund |
| Global Sector | Short Duration Bond Fund |
| Global Health Care Fund | Ultra Short Duration Income Fund |
| Global Technology Fund | |
| Tax-free Income |
| Growth | AMT-Free Municipal Fund |
| Growth Opportunities Fund | Intermediate-Term Municipal Income Fund |
| International Growth Fund | Short-Term Municipal Income Fund |
| Small Cap Growth Fund | Tax Exempt Income Fund |
| Sustainable Future Fund | Tax-Free High Yield Fund |
| Sustainable Leaders Fund | |
| State tax-free income funds‡: |
| Value | California, Massachusetts, Minnesota, |
| Equity Income Fund | New Jersey, New York, Ohio, and Pennsylvania. |
| International Value Fund | |
| Small Cap Value Fund | |
|
| California Tax Exempt Income Fund 51 |
| |
| Absolute Return | Asset Allocation |
| Fixed Income Absolute Return Fund | Dynamic Risk Allocation Fund |
| Multi-Asset Absolute Return Fund | George Putnam Balanced Fund |
| |
| Putnam PanAgora** | Dynamic Asset Allocation Balanced Fund |
| Putnam PanAgora Managed Futures Strategy | Dynamic Asset Allocation Conservative Fund |
| Putnam PanAgora Market Neutral Fund | Dynamic Asset Allocation Growth Fund |
| Putnam PanAgora Risk Parity Fund | |
| RetirementReady® Maturity Fund |
| |
| | RetirementReady® 2060 Fund |
| | RetirementReady® 2055 Fund |
| | RetirementReady® 2050 Fund |
| | RetirementReady® 2045 Fund |
| | RetirementReady® 2040 Fund |
| | RetirementReady® 2035 Fund |
| | RetirementReady® 2030 Fund |
| | RetirementReady® 2025 Fund |
| | RetirementReady® 2020 Fund |
*You could lose money by investing in the fund. Although the fund seeks to preserve the value of your investment at $1.00 per share, it cannot guarantee it will do so. An investment in the fund is not insured or guaranteed by the Federal Deposit Insurance Corporation or any other government agency. The fund’s sponsor has no legal obligation to provide financial support to the fund, and you should not expect that the sponsor will provide financial support to the fund at any time.
†You could lose money by investing in the fund. Although the fund seeks to preserve the value of your investment at $1.00 per share, it cannot guarantee it will do so. The fund may impose a fee upon sale of your shares or may temporarily suspend your ability to sell shares if the fund’s liquidity falls below required minimums because of market conditions or other factors.An investment in the fund is not insured or guaranteed by the Federal Deposit Insurance Corporation or any other government agency. The fund’s sponsor has no legal obligation to provide financial support to the fund, and you should not expect that the sponsor will provide financial support to the fund at any time.
‡Not available in all states.
**Sub-advised by PanAgora Asset Management.
Check your account balances and the most recent month-end performance in the Individual Investors section at putnam.com.
|
| 52 California Tax Exempt Income Fund |
Fund information
Founded over 80 years ago, Putnam Investments was built around the concept that a balance between risk and reward is the hallmark of a well-rounded financial program. We manage funds across income, value, blend, growth, sustainable, asset allocation, absolute return, and global sector categories.
| | |
| Investment Manager | Trustees | Michael J. Higgins |
| Putnam Investment | Kenneth R. Leibler,Chair | Vice President, Treasurer, |
| Management, LLC | Liaquat Ahamed | and Clerk |
| 100 Federal Street | Ravi Akhoury | |
| Boston, MA 02110 | Barbara M. Baumann | Jonathan S. Horwitz |
| | Katinka Domotorffy | Executive Vice President, |
| Investment Sub-Advisor | Catharine Bond Hill | Principal Executive Officer, |
| Putnam Investments Limited | Paul L. Joskow | and Compliance Liaison |
| 16 St James’s Street | Robert E. Patterson | |
| London, England SW1A 1ER | George Putnam, III | Richard T. Kircher |
| | Robert L. Reynolds | Vice President and BSA |
| Marketing Services | Manoj P. Singh | Compliance Officer |
| Putnam Retail Management | Mona K. Sutphen | |
| 100 Federal Street | | Susan G. Malloy |
| Boston, MA 02110 | Officers | Vice President and |
| Robert L. Reynolds | Assistant Treasurer |
| Custodian | President | |
| State Street Bank | | Denere P. Poulack |
| and Trust Company | Robert T. Burns | Assistant Vice President, Assistant |
| Vice President and | Clerk, and Assistant Treasurer |
| Legal Counsel | Chief Legal Officer | |
| Ropes & Gray LLP | | Janet C. Smith |
| James F. Clark | Vice President, |
| | Vice President, Chief Compliance | Principal Financial Officer, |
| | Officer, and Chief Risk Officer | Principal Accounting Officer, |
| | | and Assistant Treasurer |
| | Nancy E. Florek | |
| | Vice President, Director of | Mark C. Trenchard |
| | Proxy Voting and Corporate | Vice President |
| | Governance, Assistant Clerk, | |
| | and Assistant Treasurer | |
This report is for the information of shareholders of Putnam California Tax Exempt Income Fund. It may also be used as sales literature when preceded or accompanied by the current prospectus, the most recent copy of Putnam’s Quarterly Performance Summary, and Putnam’s Quarterly Ranking Summary. For more recent performance, please visit putnam.com. Investors should carefully consider the investment objectives, risks, charges, and expenses of a fund, which are described in its prospectus. For this and other information or to request a prospectus or summary prospectus, call 1-800-225-1581 toll free. Please read the prospectus carefully before investing. The fund’s Statement of Additional Information contains additional information about the fund’s Trustees and is available without charge upon request by calling 1-800-225-1581.

| |
|
Item 3. Audit Committee Financial Expert: |
| |
|
Item 4. Principal Accountant Fees and Services: |
| |
|
Item 5. Audit Committee of Listed Registrants |
| |
|
Item 6. Schedule of Investments: |
| |
| The registrant's schedule of investments in unaffiliated issuers is included in the report to shareholders in Item 1 above. |
| |
| Item 7. Disclosure of Proxy Voting Policies and Procedures For Closed-End Management Investment Companies: |
| |
|
Item 8. Portfolio Managers of Closed-End Investment Companies |
| |
|
Item 9. Purchases of Equity Securities by Closed-End Management Investment Companies and Affiliated Purchasers: |
| |
|
Item 10. Submission of Matters to a Vote of Security Holders: |
| |
|
Item 11. Controls and Procedures: |
| |
|
(a) The registrant's principal executive officer and principal financial officer have concluded, based on their evaluation of the effectiveness of the design and operation of the registrant's disclosure controls and procedures as of a date within 180 days of the filing date of this report, that the design and operation of such procedures are generally effective to provide reasonable assurance that information required to be disclosed by the registrant in this report is recorded, processed, summarized and reported within the time periods specified in the Commission's rules and forms. |
| |
| (b) Changes in internal control over financial reporting: Not applicable |
| |
|
Item 12. Disclosures of Securities Lending Activities for Closed-End Investment Companies: |
| |
| Pursuant to the requirements of the Securities Exchange Act of 1934 and the Investment Company Act of 1940, the registrant has duly caused this report to be signed on its behalf by the undersigned, thereunto duly authorized. |
| |
| Putnam California Tax Exempt Income Fund |
| |
| By (Signature and Title): |
| |
| /s/ Janet C. Smith
Janet C. Smith
Principal Accounting Officer
|
| |
| Pursuant to the requirements of the Securities Exchange Act of 1934 and the Investment Company Act of 1940, this report has been signed below by the following persons on behalf of the registrant and in the capacities and on the dates indicated. |
| |
| By (Signature and Title): |
| |
| /s/ Jonathan S. Horwitz
Jonathan S. Horwitz
Principal Executive Officer
|
| |
| By (Signature and Title): |
| |
| /s/ Janet C. Smith
Janet C. Smith
Principal Financial Officer
|