| | |
| UNITED STATES
SECURITIES AND EXCHANGE COMMISSION |
| | |
| CERTIFIED SHAREHOLDER REPORT OF REGISTERED
MANAGEMENT INVESTMENT COMPANIES
|
| | |
| Investment Company Act file number: | (811–03630) |
| | |
| Exact name of registrant as specified in charter: | Putnam California Tax Exempt Income Fund |
| | |
| Address of principal executive offices: | 100 Federal Street, Boston, Massachusetts 02110 |
| | |
| Name and address of agent for service: | Stephen Tate, Vice President
100 Federal Street
Boston, Massachusetts 02110 |
| | |
| Copy to: | Bryan Chegwidden, Esq.
Ropes & Gray LLP
1211 Avenue of the Americas
New York, New York 10036 |
| | |
| | James E. Thomas, Esq.
Ropes & Gray LLP
800 Boylston Street
Boston, Massachusetts 02199 |
| | |
| Registrant’s telephone number, including area code: | (617) 292-1000 |
| | |
| Date of fiscal year end: | September 30, 2023 |
| | |
| Date of reporting period: | October 1 , 2022 – September 30, 2023 |
| | |
|
Item 1. Report to Stockholders: | |
| | |
| The following is a copy of the report transmitted to stockholders pursuant to Rule 30e-1 under the Investment Company Act of 1940: | |
Putnam
California Tax Exempt
Income Fund
Annual report
9 | 30 | 23
Message from the Trustees
November 8, 2023
Dear Fellow Shareholder:
Equity markets have risen from the depths of the 2022 downturn over the past 12 months. At the same time, the U.S. economy has continued to grow. However, both stocks and bonds have encountered headwinds recently. With the rate of inflation above the Federal Reserve’s target of 2%, the Fed has made it clear that short-term interest rates will remain high heading into 2024. Many experts believe the Fed’s restrictive policy keeps the risk of a recession alive.
Turning to bond markets, performance has been mostly lackluster over the past 12 months. The rise in bond yields since July has challenged many fixed income assets. Against this backdrop, investors are weighing the impact of high borrowing costs and tighter lending conditions at banks.
As active managers, your investment team continues to research attractive opportunities for your fund while monitoring risks. This report offers an update on their efforts.
Thank you for investing with Putnam.
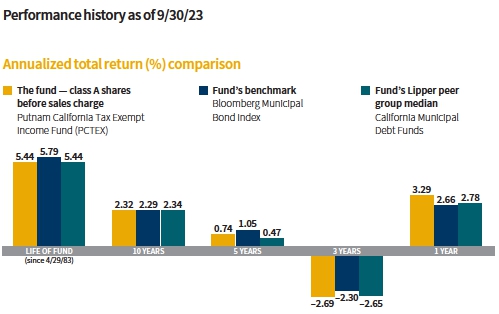
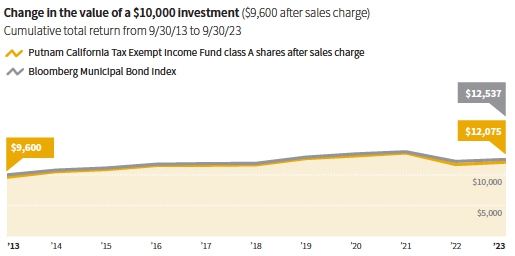
Current performance may be lower or higher than the quoted past performance, which cannot guarantee future results. Share price, principal value, and return will fluctuate, and you may have a gain or a loss when you sell your shares. Performance of class A shares assumes reinvestment of distributions and does not account for taxes. Fund returns in the bar chart do not reflect a sales charge of 4.00%; had they, returns would have been lower. See below and pages 7–9 for additional performance information. For a portion of the periods, the fund had expense limitations, without which returns would have been lower. To obtain the most recent month-end performance, visit putnam.com.
All Bloomberg indices are provided by Bloomberg Index Services Limited.
Lipper peer group median is provided by Lipper, an LSEG company.

This comparison shows your fund’s performance in the context of broad market indexes for the 12 months ended 9/30/23. See above and pages 7–9 for additional fund performance information. Index descriptions can be found on page 12.
All Bloomberg indices are provided by Bloomberg Index Services Limited.
|
| 2 California Tax Exempt Income Fund |


Paul, how did municipal bonds perform during the 12-month period ended September 30, 2023?
Municipal bonds encountered headwinds but ended the period in positive territory, due in large part to their solid credit fundamentals. Rising interest rates, U.S. debt concerns, and cooling but still high inflation weighed on investor sentiment for much of the period. The financial markets also experienced severe volatility in March 2023 due to turmoil in the banking sector. The failure of a few regional U.S. banks combined with a forced merger of a bank in Switzerland raised concerns about the health of the global banking system. Quick actions by global central banks, including shoring up bank deposits, mitigated systemic risk. Better-than-expected corporate earnings also contributed to an improving outlook.
Combatting inflation remained a top priority for the Federal Reserve. In July 2023, the Fed raised the federal funds rate by 0.25%, which brought the benchmark rate to 5.25%–5.50%. This was the highest range in 22 years. At its conference in August 2023, the Fed stated it would “proceed carefully” and continue making data-driven decisions on a meeting-to-meeting basis. As
|
| California Tax Exempt Income Fund 3 |
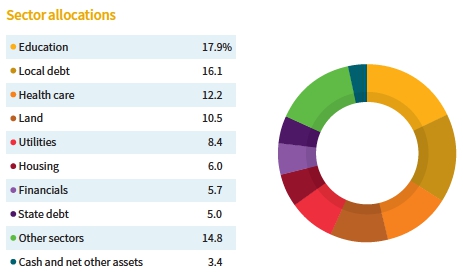
Allocations are shown as a percentage of the fund’s net assets as of 9/30/23. Cash and net other assets, if any, represent the market value weights of cash, derivatives, short-term securities, and other unclassified assets in the portfolio. Summary information may differ from the information in the portfolio schedule notes included in the financial statements due to the inclusion of derivative securities, any interest accruals, the timing of matured security transactions, the use of different classifications of securities for presentation purposes, and rounding. Holdings and allocations may vary over time. Due to rounding, percentages may not equal 100%.
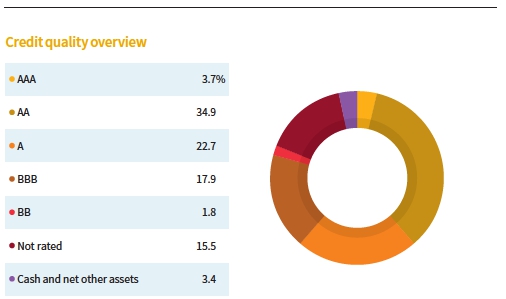
Credit qualities are shown as a percentage of the fund’s net assets as of 9/30/23. A bond rated BBB or higher (SP-3 or higher, for short-term debt) is considered investment grade. This chart reflects the highest security rating provided by one or more of Standard & Poor’s, Moody’s, and Fitch. Ratings may vary over time. Due to rounding, percentages may not equal 100%.
Cash and net other assets, if any, represent the market value weights of cash, derivatives, and short-term securities in the portfolio. The fund itself has not been rated by an independent rating agency.
|
| 4 California Tax Exempt Income Fund |
part of this process, the Fed mentioned it would try to balance the risk of doing too much and slowing growth against the risk of doing too little and reigniting inflation.
The Fed left its benchmark rate unchanged at the September 2023 meeting, but its commentary took on a more hawkish tone. The Fed suggested another interest-rate hike was possible before the end of 2023. Policymakers also indicated the need to keep interest rates high well into 2024 to ensure inflation drops back down to its 2% target rate and that, when rates eventually come down, it may happen more slowly than previously projected. Yields on U.S. Treasuries rose, and prices fell further, as investors ratcheted up their expectations for the Fed’s terminal interest rate. This, along with heavier-than-expected U.S. Treasury supply, weighed on municipal bond prices.
For the 12 months ended September 30, 2023, the Bloomberg Municipal Bond Index returned 2.66%. Long-term municipal bonds outperformed their short- and intermediate-term cohorts. From a credit perspective, high-yield bonds outperformed investment-grade bonds during the period.
How did the fund perform during the reporting period?
For the 12 months ended September 30, 2023, the fund outperformed its benchmark and the median return of its Lipper peer group, California Municipal Debt Funds.
What was your strategy during the reporting period?
We closely monitored our credit positioning throughout the period. We remain somewhat cautious on lower-rated cohorts and are currently not adding significantly to the fund’s high-yield allocation due to the uncertainty surrounding slowing U.S. economic growth. Regarding positioning, the fund had an overweight exposure to the lower-investment-grade universe [A and BBB] and an underweight exposure to the high-yield universe compared with its Lipper peer group.
Given the shape of the municipal bond curve, we favored bonds at the longer end of the curve. We targeted a modestly long-duration position in the portfolio relative to the fund’s Lipper peer group. [Duration is a measure of a fund’s interest-rate sensitivity.] The fund was invested in a wide range of sectors, including retirement community, private higher education, housing-backed, charter school, and state-backed bonds.
We continue to find opportunities across the municipal bond market, uncovering value in rating, sector, and coupon dislocations.
What is your current assessment of the health of the California municipal bond market?
California is in a strong fiscal position, in our view. A recent pullback in tax revenues following two years of strong pandemic-era revenue collections led to an initial budget-deficit projection of $31 billion for fiscal year [FY] 2024. However, the state subsequently made adjustments and is forecasted to achieve a balanced FY 2024 budget using a combination of budget cuts and reallocations of spending.
Longer term, we believe that California’s prudent fiscal policies, large and well-diversified economy, relatively well-funded pension systems, and status as a global trade hub will provide stability for bondholders despite the potential for ongoing revenue volatility. Our outlook for the state remains stable.
|
| California Tax Exempt Income Fund 5 |
What is your outlook as we approach the end of 2023?
Interest-rate volatility, a hawkish Fed, and inflationary pressures could remain headwinds for rate-sensitive investments in the near term, in our view. Following the market’s reaction to the Fed’s summary of economic projections and dot plot from its September meeting, 10-year U.S. Treasury yields reached their highest levels since October 2007. Given how resilient U.S. growth has been, we believe the Fed may need to keep interest rates higher for longer to allow the effects of its policy to trickle through the economy.
We regard any market volatility as an investment opportunity and continue to be vigilant for dips in the market that can present attractive entry points. Current valuations are attractive, in our view. At the close of period-end, taxable equivalent yields were close to 7.25%, suggesting municipal bonds were very cheap relative to the past 20 years, in our view.
Fundamentals across most municipal sectors remain stable, in our view. Generally speaking, defaults remain low and, to date, have been contained to the non-rated subsectors. That said, we believe security selection and rating exposure decisions matter, especially if the U.S. economy slows.
Thank you, Paul, for your time and insights today.
The views expressed in this report are exclusively those of Putnam Management and are subject to change. They are not meant as investment advice.
Please note that the holdings discussed in this report may not have been held by the fund for the entire period. Portfolio composition is subject to review in accordance with the fund’s investment strategy and may vary in the future. Current and future portfolio holdings are subject to risk. Statements in the Q&A concerning the fund’s performance or portfolio composition relative to those of the fund’s Lipper peer group may reference information produced by Lipper Inc. or through a third party.
|
| 6 California Tax Exempt Income Fund |
Your fund’s performance
This section shows your fund’s performance, price, and distribution information for periods ended September 30, 2023, the end of its most recent fiscal year. In accordance with regulatory requirements for mutual funds, we also include expense information taken from the fund’s current prospectus. Performance should always be considered in light of a fund’s investment strategy. Data represent past performance. Past performance does not guarantee future results. More recent returns may be less or more than those shown. Investment return and principal value will fluctuate, and you may have a gain or a loss when you sell your shares. Performance information does not reflect any deduction for taxes a shareholder may owe on fund distributions or on the redemption of fund shares. For the most recent month-end performance, please visit the Individual Investors section at putnam.com or call Putnam at 1-800-225-1581. Class R6 and Y shares are not available to all investors.
Annualized fund performance Total return for periods ended 9/30/23
| | | | | |
| | Life of fund | 10 years | 5 years | 3 years | 1 year |
| Class A (4/29/83) | | | | | |
| Before sales charge | 5.44% | 2.32% | 0.74% | –2.69% | 3.29% |
| After sales charge | 5.33 | 1.90 | –0.08 | –4.01 | –0.84 |
| Class B (1/4/93) | | | | | |
| Before CDSC | 5.26 | 1.81 | 0.15 | –3.24 | 2.67 |
| After CDSC | 5.26 | 1.81 | –0.20 | –4.13 | –2.33 |
| Class C (7/26/99) | | | | | |
| Before CDSC | 5.27 | 1.69 | –0.02 | –3.39 | 2.52 |
| After CDSC | 5.27 | 1.69 | –0.02 | –3.39 | 1.52 |
| Class R6 (5/22/18) | | | | | |
| Net asset value | 5.54 | 2.56 | 1.01 | –2.43 | 3.55 |
| Class Y (1/2/08) | | | | | |
| Net asset value | 5.54 | 2.55 | 0.98 | –2.43 | 3.40 |
Current performance may be lower or higher than the quoted past performance, which cannot guarantee future results. After-sales-charge returns for class A shares reflect the deduction of the maximum 4.00% sales charge levied at the time of purchase. Class B share returns after contingent deferred sales charge (CDSC) reflect the applicable CDSC, which is 5% in the first year, declining over time to 1% in the sixth year, and is eliminated thereafter. Class C share returns after CDSC reflect a 1% CDSC for the first year that is eliminated thereafter. Class R6 and Y shares have no initial sales charge or CDSC. Performance for class B, C, and Y shares before their inception is derived from the historical performance of class A shares, adjusted for the applicable sales charge (or CDSC) and the higher operating expenses for such shares, except for class Y shares, for which 12b-1 fees are not applicable. Performance for class R6 shares prior to their inception is derived from the historical performance of class Y shares and has not been adjusted for the lower investor servicing fees applicable to class R6 shares; had it, returns would have been higher.
For a portion of the periods, the fund had expense limitations, without which returns would have been lower.
Class B and C share performance reflects conversion to class A shares after eight years.
|
| California Tax Exempt Income Fund 7 |
Comparative annualized index returns For periods ended 9/30/23
| | | | | |
| | Life of fund | 10 years | 5 years | 3 years | 1 year |
| Bloomberg Municipal | | | | | |
| Bond Index | 5.79% | 2.29% | 1.05% | –2.30% | 2.66% |
| Lipper California Municipal | | | | | |
| Debt Funds category median* | 5.44 | 2.34 | 0.47 | –2.65 | 2.78 |
Index and Lipper results should be compared with fund performance before sales charge, before CDSC, or at net asset value.
All Bloomberg indices are provided by Bloomberg Index Services Limited.
Lipper peer group median is provided by Lipper, an LSEG company.
* Over the 1-year, 3-year, 5-year, 10-year, and life-of-fund periods ended 9/30/23, there were 120, 117, 109, 88, and 3 funds, respectively, in this Lipper category.
Past performance does not indicate future results. At the end of the same time period, a $10,000 investment in the fund’s class B and C shares would have been valued at $11,964 and $11,824, respectively, and no contingent deferred sales charges would apply. A $10,000 investment in the fund’s class R6 and Y shares would have been valued at $12,872 and $12,861, respectively.
All Bloomberg indices are provided by Bloomberg Index Services Limited.
|
| 8 California Tax Exempt Income Fund |
Fund price and distribution information For the 12-month period ended 9/30/23
| | | | | | |
| Distributions | Class A | Class B | Class C | ClassR6 | Class Y |
| Number | 12 | 12 | 12 | 12 | 12 |
| Income1 | $0.209921 | $0.167151 | $0.157620 | $0.229070 | $0.228524 |
| Capital gains2 | — | — | — | — | — |
| Total | $0.209921 | $0.167151 | $0.157620 | $0.229070 | $0.228524 |
| | Before | After | Net | Net | Net | Net |
| | sales | sales | asset | asset | asset | asset |
| Share value | charge | charge | value | value | value | value |
| 9/30/22 | $6.84 | $7.13 | $6.84 | $6.89 | $6.87 | $6.87 |
| 9/30/23 | 6.86 | 7.15 | 6.86 | 6.91 | 6.89 | 6.88 |
| | Before | After | Net | Net | Net | Net |
| Current rate | sales | sales | asset | asset | asset | asset |
| (end of period) | charge | charge | value | value | value | value |
| Current dividend rate3 | 3.25% | 3.12% | 2.64% | 2.48% | 3.51% | 3.51% |
| Taxable equivalent4 | 7.08 | 6.80 | 5.75 | 5.40 | 7.65 | 7.65 |
| Current 30-day | | | | | | |
| SEC yield5 | N/A | 3.56 | 3.10 | 2.95 | 3.98 | 3.97 |
| Taxable equivalent4 | N/A | 7.76 | 6.75 | 6.43 | 8.67 | 8.65 |
The classification of distributions, if any, is an estimate. Before-sales-charge share value and current dividend rate for class A shares, if applicable, do not take into account any sales charge levied at the time of purchase. After-sales-charge share value, current dividend rate, and current 30-day SEC yield, if applicable, are calculated assuming that the maximum sales charge (4.00% for class A shares) was levied at the time of purchase. Final distribution information will appear on your year-end tax forms.
1 For some investors, investment income may be subject to the federal alternative minimum tax.
2 Capital gains, if any, are taxable for federal and, in most cases, state purposes.
3 Most recent distribution, including any return of capital and excluding capital gains, annualized and divided by share price before or after sales charge at period-end.
4 Assumes maximum 54.10% federal and state combined tax rate for 2023. Results for investors subject to lower tax rates would not be as advantageous.
5 Based only on investment income and calculated using the maximum offering price for each share class, in accordance with SEC guidelines.
|
| California Tax Exempt Income Fund 9 |
Your fund’s expenses
As a mutual fund investor, you pay ongoing expenses, such as management fees, distribution fees (12b-1 fees), and other expenses. Using the following information, you can estimate how these expenses affect your investment and compare them with the expenses of other funds. You may also pay one-time transaction expenses, including sales charges (loads) and redemption fees, which are not shown in this section and would have resulted in higher total expenses. For more information, see your fund’s prospectus or talk to your financial representative.
Expense ratios
| | | | | |
| | Class A | Class B | Class C | Class R6 | Class Y |
| Total annual operating expenses for the fiscal | | | | | |
| year ended 9/30/22 | 0.80% | 1.40% | 1.55% | 0.55% | 0.55% |
| Annualized expense ratio for the six-month | | | | | |
| period ended 9/30/23† | 0.88% | 1.48% | 1.63% | 0.63% | 0.63% |
Fiscal year expense information in this table is taken from the most recent prospectus, is subject to change, and may differ from that shown for the annualized expense ratio and in the financial highlights of this report.
Expenses are shown as a percentage of average net assets.
† Expense ratios for each class are for the fund’s most recent fiscal half year. As a result of this, ratios may differ from expense ratios based on one-year data in the financial highlights.
Expenses per $1,000
The following table shows the expenses you would have paid on a $1,000 investment in each class of the fund from 4/1/23 to 9/30/23. It also shows how much a $1,000 investment would be worth at the close of the period, assuming actual returns and expenses.
| | | | | |
| | Class A | Class B | Class C | Class R6 | Class Y |
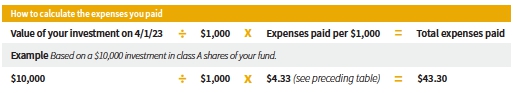
| Expenses paid per $1,000*† | $4.33 | $7.26 | $8.00 | $3.10 | $3.10 |
| Ending value (after expenses) | $960.60 | $957.70 | $957.30 | $962.00 | $960.60 |
* Expenses for each share class are calculated using the fund’s annualized expense ratio for each class, which represents the ongoing expenses as a percentage of average net assets for the six months ended 9/30/23. The expense ratio may differ for each share class.
† Expenses are calculated by multiplying the expense ratio by the average account value for the period; then multiplying the result by the number of days in the period (183); and then dividing that result by the number of days in the year (365).
|
| 10 California Tax Exempt Income Fund |
Estimate the expenses you paid
To estimate the ongoing expenses you paid for the six months ended 9/30/23, use the following calculation method. To find the value of your investment on 4/1/23, call Putnam at 1-800-225-1581.
Compare expenses using the SEC’s method
The Securities and Exchange Commission (SEC) has established guidelines to help investors assess fund expenses. Per these guidelines, the following table shows your fund’s expenses based on a $1,000 investment, assuming a hypothetical 5% annualized return. You can use this information to compare the ongoing expenses (but not transaction expenses or total costs) of investing in the fund with those of other funds. All mutual fund shareholder reports will provide this information to help you make this comparison. Please note that you cannot use this information to estimate your actual ending account balance and expenses paid during the period.
| | | | | |
| | Class A | Class B | Class C | Class R6 | Class Y |
| Expenses paid per $1,000*† | $4.46 | $7.49 | $8.24 | $3.19 | $3.19 |
| Ending value (after expenses) | $1,020.66 | $1,017.65 | $1,016.90 | $1,021.91 | $1,021.91 |
* Expenses for each share class are calculated using the fund’s annualized expense ratio for each class, which represents the ongoing expenses as a percentage of average net assets for the six months ended 9/30/23. The expense ratio may differ for each share class.
† Expenses are calculated by multiplying the expense ratio by the average account value for the six-month period; then multiplying the result by the number of days in the six-month period (183); and then dividing that result by the number of days in the year (365).
|
| California Tax Exempt Income Fund 11 |
Comparative index definitions
Bloomberg Municipal Bond Index is an unmanaged index of long-term, fixed-rate, investment-grade tax-exempt bonds.
Bloomberg U.S. Aggregate Bond Index is an unmanaged index of U.S. investment-grade fixed income securities.
ICE BofA (Intercontinental Exchange Bank of America) U.S. 3-Month Treasury Bill Index is an unmanaged index that seeks to measure the performance of U.S. Treasury bills available in the marketplace.
S&P 500® Index is an unmanaged index of common stock performance.
Indexes assume reinvestment of all distributions and do not account for fees. Securities and performance of a fund and an index will differ. You cannot invest directly in an index.
BLOOMBERG® is a trademark and service mark of Bloomberg Finance L.P. and its affiliates (collectively “Bloomberg”). Bloomberg or Bloomberg’s licensors own all proprietary rights in the Bloomberg Indices. Neither Bloomberg nor Bloomberg’s licensors approve or endorse this material, or guarantee the accuracy or completeness of any information herein, or make any warranty, express or implied, as to the results to be obtained therefrom, and to the maximum extent allowed by law, neither shall have any liability or responsibility for injury or damages arising in connection therewith.
ICE Data Indices, LLC (“ICE BofA”), used with permission. ICE BofA permits use of the ICE BofA indices and related data on an “as is” basis; makes no warranties regarding same; does not guarantee the suitability, quality, accuracy, timeliness, and/or completeness of the ICE BofA indices or any data included in, related to, or derived therefrom; assumes no liability in connection with the use of the foregoing; and does not sponsor, endorse, or recommend Putnam Investments, or any of its products or services.
Lipper, an LSEG company, is a third-party industry-ranking entity that ranks funds. Its rankings do not reflect sales charges. Lipper rankings are based on total return at net asset value relative to other funds that have similar current investment styles or objectives as determined by Lipper. Lipper may change a fund’s category assignment at its discretion. Lipper category medians reflect performance trends for funds within a category.
|
| 12 California Tax Exempt Income Fund |
Other information for shareholders
Important notice regarding delivery of shareholder documents
In accordance with Securities and Exchange Commission (SEC) regulations, Putnam sends a single notice of internet availability, or a single printed copy, of annual and semiannual shareholder reports, prospectuses, and proxy statements to Putnam shareholders who share the same address, unless a shareholder requests otherwise. If you prefer to receive your own copy of these documents, please call Putnam at 1-800-225-1581 or, for exchange-traded funds only, 1-833-228-5577. We will begin sending individual copies within 30 days.
Proxy voting
Putnam is committed to managing our funds in the best interests of our shareholders. The Putnam funds’ proxy voting guidelines and procedures, as well as information regarding how your fund voted proxies relating to portfolio securities during the 12-month period ended June 30, 2023, are available in the Individual Investors section of putnam.com and on the SEC’s website, www.sec.gov. If you have questions about finding forms on the SEC’s website, you may call the SEC at 1-800-SEC-0330. You may also obtain the Putnam funds’ proxy voting guidelines and procedures at no charge by calling Putnam’s Shareholder Services at 1-800-225-1581 or, for exchange-traded funds only, 1-833-228-5577.
Fund portfolio holdings
The fund will file a complete schedule of its portfolio holdings with the SEC for the first and third quarters of each fiscal year on Form N-PORT within 60 days of the end of such fiscal quarter. Shareholders may obtain the fund’s Form N-PORT on the SEC’s website at www.sec.gov.
Trustee and employee fund ownership
Putnam employees and members of the Board of Trustees place their faith, confidence, and, most importantly, investment dollars in Putnam funds. As of September 30, 2023, Putnam employees had approximately $477,000,000 and the Trustees had approximately $65,000,000 invested in Putnam funds. These amounts include investments by the Trustees’ and employees’ immediate family members as well as investments through retirement and deferred compensation plans.
Liquidity risk management program
Putnam, as the administrator of the fund’s liquidity risk management program (appointed by the Board of Trustees), presented the most recent annual report on the program to the Trustees in May 2023. The report covered the structure of the program, including the program documents and related policies and procedures adopted to comply with Rule 22e-4 under the Investment Company Act of 1940, and reviewed the operation of the program from January 2022 through December 2022. The report included a description of the annual liquidity assessment of the fund that Putnam performed in November 2022. The report noted that there were no material compliance exceptions identified under Rule 22e-4 during the period. The report included a review of the governance of the program and the methodology for classification of the fund’s investments. Putnam concluded that the program has been operating effectively and adequately to ensure compliance with Rule 22e-4.
|
| California Tax Exempt Income Fund 13 |
Important notice regarding Putnam’s privacy policy
In order to conduct business with our shareholders, we must obtain certain personal information such as account holders’ names, addresses, Social Security numbers, and dates of birth. Using this information, we are able to maintain accurate records of accounts and transactions.
It is our policy to protect the confidentiality of our shareholder information, whether or not a shareholder currently owns shares of our funds. In particular, it is our policy not to sell information about you or your accounts to outside marketing firms. We have safeguards in place designed to prevent unauthorized access to our computer systems and procedures to protect personal information from unauthorized use.
Under certain circumstances, we must share account information with outside vendors who provide services to us, such as mailings and proxy solicitations. In these cases, the service providers enter into confidentiality agreements with us, and we provide only the information necessary to process transactions and perform other services related to your account. Finally, it is our policy to share account information with your financial representative, if you’ve listed one on your Putnam account.
|
| 14 California Tax Exempt Income Fund |
Trustee approval of management contracts
Consideration of your fund’s new and interim management and sub-management contracts
At their meeting on June 23, 2023, the Board of Trustees of your fund, including all of the Trustees who are not “interested persons” (as this term is defined in the Investment Company Act of 1940, as amended (the “1940 Act”)) of the Putnam mutual funds, closed-end funds and exchange-traded funds (collectively, the “funds”) (the “Independent Trustees”) approved, subject to approval by your fund’s shareholders, a new management contract with Putnam Investment Management (“Putnam Management”) and a new sub-management contract between Putnam Management and its affiliate, Putnam Investments Limited (“PIL”) (collectively, the “New Management Contracts”). The Trustees considered the proposed New Management Contracts in connection with the planned acquisition of Putnam U.S. Holdings I, LLC (“Putnam Holdings”) by a subsidiary of Franklin Resources, Inc. (“Franklin Templeton”). The Trustees considered that, on May 31, 2023, Franklin Templeton and Great-West Lifeco Inc., the parent company of Putnam Holdings, announced that they had entered into a definitive agreement for a subsidiary of Franklin Templeton to acquire Putnam Holdings in a stock and cash transaction (the “Transaction”). The Trustees noted that Putnam Holdings was the parent company of Putnam Management and PIL. The Trustees were advised that the Transaction would result in a “change of control” of Putnam Management and PIL and would cause your fund’s current Management Contract with Putnam Management and Sub-Management Contract with PIL (collectively, the “Current Management Contracts”) to terminate in accordance with the 1940 Act. The Trustees considered that the New Management Contracts would take effect upon the closing of the Transaction, which was expected to occur in the fourth quarter of 2023.
In addition to the New Management Contracts, the Trustees also approved interim management and sub-management contracts with Putnam Management and PIL, respectively (the “Interim Management Contracts”), which would take effect in the event that for any reason shareholder approval of a New Management Contract was not received by the time of the Transaction closing. The Trustees considered that each Interim Management Contract that became effective would remain in effect until shareholders approved the proposed New Management Contract, or until 150 days elapse after the closing of the Transaction, whichever occurred first. The considerations and conclusions discussed in connection with the Trustees’ consideration of the New Management Contracts and the continuance of your fund’s Current Management Contracts also apply to the Trustees’ consideration of the Interim Management Contracts, supplemented by consideration of the terms, nature and reason for any Interim Management Contract.
The Independent Trustees met with their independent legal counsel, as defined in Rule 0 – 1(a)(6) under the 1940 Act (their “independent legal counsel”), and representatives of Putnam Management and its parent company, Power Corporation of Canada, to discuss the potential Transaction, including the timing and structure of the Transaction and its implications for Putnam Management and the funds, during their regular meeting on November 18, 2022, and the full Board of Trustees further discussed these matters with representatives of Putnam Management at its regular meeting on December 15, 2022. At a special meeting on December 20, 2022, the full Board of Trustees met with representatives of Putnam Management, Power Corporation of Canada and Franklin Templeton to further discuss the potential Transaction, including Franklin Templeton’s strategic plans for Putnam Management’s asset management business and the funds, potential sources of synergy between Franklin Templeton and Putnam Management, potential areas of partnership between Power Corporation of Canada and Franklin Templeton, Franklin Templeton’s distribution capabilities, Franklin Templeton’s existing service provider relationships and Franklin Templeton’s recent acquisitions of other asset management firms.
In order to assist the Independent Trustees in their consideration of the New Management Contracts and other anticipated impacts of the Transaction on the funds and their shareholders, independent legal counsel for the Independent Trustees furnished an initial information request to Franklin Templeton (the “Initial Franklin Request”). At a special meeting of the full Board of Trustees held on January 25, 2023, representatives of Franklin Templeton addressed the firm’s responses to the Initial Franklin Request. At the
|
| California Tax Exempt Income Fund 15 |
meeting, representatives of Franklin Templeton discussed, among other things, the business and financial condition of Franklin Templeton and its affiliates, Franklin Templeton’s U.S. registered fund operations, its recent acquisition history, Franklin Templeton’s intentions regarding the operation of Putnam Management and the funds following the completion of the potential Transaction and expected benefits to the funds and Putnam Management that might result from the Transaction.
The Board of Trustees actively monitored developments with respect to the potential Transaction throughout the period leading up to the public announcement of a final sale agreement on May 31, 2023. The Independent Trustees met to discuss these matters at their regular meetings on January 27, April 20 and May 19, 2023. The full Board of Trustees also discussed developments at their regular meeting on February 23, 2023. Following the public announcement of the Transaction on May 31, 2023, independent legal counsel for the Independent Trustees furnished a supplemental information request (the “Supplemental Franklin Request”) to Franklin Templeton. At the Board of Trustees’ regular in-person meeting held on June 22–23, 2023, representatives of Putnam Management and Power Corporation of Canada provided further information regarding, among other matters, the final terms of the Transaction and efforts undertaken to retain Putnam employees. The Contract Committee of the Board of Trustees also met on June 22, 2023 to discuss Franklin Templeton’s responses to the Supplemental Franklin Request. Mr. Reynolds, the only Trustee affiliated with Putnam Management, participated in portions of these meetings to provide the perspective of the Putnam organization, but did not otherwise participate in the deliberations of the Independent Trustees or the Contract Committee regarding the potential Transaction.
After the presentations and after reviewing the written materials provided, the Independent Trustees met at their in-person meeting on June 23, 2023 to consider the New Management Contracts for each fund, proposed to become effective upon the closing of the Transaction, and the filing of a preliminary proxy statement. At this meeting and throughout the process, the Independent Trustees also received advice from their independent legal counsel regarding their responsibilities in evaluating the potential Transaction and the New Management Contracts. The Independent Trustees reviewed the terms of the proposed New Management Contracts and the differences between the New Management Contracts and the Current Management Contracts. They noted that the terms of the proposed New Management Contracts were substantially identical to the Current Management Contracts, except for certain changes designed largely to address differences among various of the existing contracts, which had been developed and implemented at different times in the past.
In considering the approval of the proposed New Management Contracts, the Board of Trustees took into account a number of factors, including:1
(i) Franklin Templeton’s and Putnam Management’s belief that the Transaction would not adversely affect the funds or their shareholders and their belief that the Transaction was likely to result in certain benefits (described below) for the funds and their shareholders;
(ii) That Franklin Templeton did not intend to make any material change in Putnam Management’s senior investment professionals (other than certain changes related to reporting structure and organization of personnel discussed below), including the portfolio managers of the funds, or to the firm’s operating locations as a result of the Transaction;
(iii) That Franklin Templeton intended for Putnam Management’s equity investment professionals to continue to operate largely independently from Franklin Templeton, reporting to Franklin Templeton’s Head of Public Markets following the Transaction;
(iv) That, while Putnam Management’s organizational structure was not expected to change immediately following the Transaction, Franklin Templeton intended to revise Putnam Management’s reporting structure in order to include Putnam Management’s fixed income investment professionals in Franklin Templeton’s fixed income group and to include Putnam Management’s Global Asset Allocation (“GAA”) investment professionals in Franklin Templeton’s investment solutions group, with both Franklin Templeton groups reporting to Franklin Templeton’s Head of Public Markets;

1 All subsequent references to Putnam Management describing the Board of Trustees’ considerations should be deemed to include references to PIL as necessary or appropriate in the context.
|
| 16 California Tax Exempt Income Fund |
(v) Franklin Templeton’s expectation that there would not be any changes in the investment objectives, strategies or portfolio holdings of the funds as a result of the Transaction;
(vi) That neither Franklin Templeton nor Putnam Management had any current plans to propose changes to the funds’ existing management fees or expense limitations, or current plans to make changes to the funds’ existing distribution arrangements;
(vii) Franklin Templeton’s and Putnam Management’s representations that, following the Transaction, there was not expected to be any diminution in the nature, quality and extent of services provided to the funds and their shareholders by Putnam Management and PIL, including compliance and other non-advisory services;
(viii) That Franklin Templeton did not currently plan to change the branding of the funds or to change the lineup of funds in connection with the Transaction but would continue to evaluate how best to position the funds in the market;
(ix) The possible benefits accruing to the funds and their shareholders as a result of the Transaction, including:
a. That the scale of Franklin Templeton’s investment operations platform would increase the investment and operational resources available to the funds;
b. That the Putnam open-end funds would benefit from Franklin Templeton’s large retail and institutional global distribution capabilities and significant network of intermediary relationships, which may provide additional opportunities for the funds to increase assets and reduce expenses by spreading expenses over a larger asset base; and
c. Potential benefits to shareholders of the Putnam open-end funds that could result from the alignment of certain fund features and shareholder benefits with those of other funds sponsored by Franklin Templeton and its affiliates and access to a broader array of investment opportunities;
(x) The financial strength, reputation, experience and resources of Franklin Templeton and its investment advisory subsidiaries;
(xi) Franklin Templeton’s expectation that the Transaction would not impact the capabilities or responsibilities of Putnam Management’s Investment Division (other than any impact related to reporting structure changes for Putnam Management’s equity, fixed income and GAA investment groups and to including Putnam Management’s fixed income and GAA investment professionals in existing Franklin Templeton investment groups, as discussed above) and that any changes to the Investment Division over the longer term would be made in order to achieve perceived operational efficiencies or improvements to the portfolio management process;
(xii) Franklin Templeton’s commitment to maintaining competitive compensation arrangements to allow Putnam Management to continue to attract and retain highly qualified personnel and Putnam Management’s and Franklin Templeton’s efforts to retain personnel, including efforts implemented since the Transaction was announced;
(xiii) That the current senior management teams at Putnam Management and Power Corporation of Canada had indicated their strong support of the Transaction and that Putnam Management had recommended that the Board of Trustees approve the New Management Contracts; and
(xiv) Putnam Management’s and Great-West Lifeco Inc.’s commitment to bear all expenses incurred by the funds in connection with the Transaction, including all costs associated with the proxy solicitation in connection with seeking shareholder approval of the New Management Contracts.
Finally, in considering the proposed New Management Contracts, the Board of Trustees also took into account their concurrent deliberations and conclusions, as described below, in connection with their annual review of the funds’ Current Management Contracts and the approval of their continuance, effective July 1, 2023, and the extensive materials that they had reviewed in connection with that review process.
Based upon the foregoing considerations, on June 23, 2023, the Board of Trustees, including all of the Independent Trustees, unanimously approved the proposed New Management Contracts and determined to recommend their approval to the shareholders of the funds.
General conclusions — Current
Management Contracts
The Board of Trustees oversees the management of each fund and, as required by law, determines annually whether to approve the continuance of
|
| California Tax Exempt Income Fund 17 |
your fund’s management contract with Putnam Management and the sub-management contract with respect to your fund between Putnam Management and PIL. (Because PIL is an affiliate of Putnam Management and Putnam Management remains fully responsible for all services provided by PIL, the Trustees did not attempt to evaluate PIL as a separate entity.) The Board of Trustees, with the assistance of its Contract Committee, requests and evaluates all information it deems reasonably necessary under the circumstances in connection with its annual contract review. The Contract Committee consists solely of Independent Trustees.
At the outset of the review process, members of the Board of Trustees’ independent staff and independent legal counsel considered any possible changes to the annual contract review materials furnished to the Contract Committee during the course of the previous year’s review and, as applicable, identified those changes to Putnam Management. Following these discussions and in consultation with the Contract Committee, the Independent Trustees’ independent legal counsel requested that Putnam Management and its affiliates furnish specified information, together with any additional information that Putnam Management considered relevant, to the Contract Committee. Over the course of several months ending in June 2023, the Contract Committee met on a number of occasions with representatives of Putnam Management, and separately in executive session, to consider the information that Putnam Management provided. Throughout this process, the Contract Committee was assisted by the members of the Board of Trustees’ independent staff and by independent legal counsel for the funds and the Independent Trustees.
At the Board of Trustees’ June 2023 meeting, the Contract Committee met in executive session to discuss and consider its recommendations with respect to the continuance of the contracts. At that meeting, the Contract Committee also met in executive session with the other Independent Trustees to review a summary of the key financial, performance and other data that the Contract Committee considered in the course of its review. The Contract Committee recommended, and the Independent Trustees approved, the continuance of your fund’s Current Management Contracts, effective July 1, 2023, and the approval of your fund’s New Management Contracts and Interim Management Contracts, as discussed above.
The Independent Trustees’ approvals were based on the following conclusions:
• That the fee schedule in effect for your fund represented reasonable compensation in light of the nature and quality of the services being provided to the fund, the fees paid by competitive funds, the costs incurred by Putnam Management in providing services to the fund and the application of certain reductions and waivers noted below; and
• That the fee schedule in effect for your fund represented an appropriate sharing between fund shareholders and Putnam Management of any economies of scale as may exist in the management of the fund at current asset levels.
These conclusions were based on a comprehensive consideration of all information provided to the Trustees and were not the result of any single factor. Some of the factors that figured particularly in the Trustees’ deliberations and how the Trustees considered these factors are described below, although individual Trustees may have evaluated the information presented differently, giving different weights to various factors. It is also important to recognize that the management arrangements for your fund and the other Putnam mutual funds and closed-end funds are the result of many years of review and discussion between the Independent Trustees and Putnam Management, that some aspects of the arrangements may receive greater scrutiny in some years than others and that the Trustees’ conclusions may be based, in part, on their consideration of fee arrangements in previous years. For example, with certain exceptions primarily involving newer funds (including the exchange-traded funds) or repositioned funds, the current fee arrangements under the vast majority of the funds’ management contracts were first implemented at the beginning of 2010 following extensive review by the Contract Committee and discussions with representatives of Putnam Management, as well as approval by shareholders. The Trustees also took into account their concurrent deliberations and conclusions, and the materials that they had reviewed, in connection with their approval on June 23, 2023 of the Interim Management Contracts and the New Management Contracts, which had been proposed in light of the Transaction (which would cause the fund’s Current Management Contracts to terminate in accordance with applicable law or the terms of each contract).
|
| 18 California Tax Exempt Income Fund |
Management fee schedules
and total expenses
The Trustees reviewed the management fee schedules in effect for all funds, including fee levels and any breakpoints. Under its management contract, your fund has the benefit of breakpoints in its management fee schedule that provide shareholders with reduced fee levels as assets under management in the Putnam family of funds increase. The Trustees also reviewed the total expenses of each Putnam fund, recognizing that in most cases management fees represented the major, but not the sole, determinant of total costs to fund shareholders. (Two mutual funds and each of the exchange-traded funds have implemented so-called “all-in” or unitary management fees covering substantially all routine fund operating costs.)
In reviewing fees and expenses, the Trustees generally focus their attention on material changes in circumstances — for example, changes in assets under management, changes in a fund’s investment strategy, changes in Putnam Management’s operating costs or profitability, or changes in competitive practices in the fund industry —that suggest that consideration of fee changes might be warranted. The Trustees concluded that the circumstances did not indicate that changes to the management fee schedule for your fund would be appropriate at this time.
As in the past, the Trustees also focused on the competitiveness of each fund’s total expense ratio. The Trustees, Putnam Management and the funds’ investor servicing agent, Putnam Investor Services, Inc. (“PSERV”), have implemented expense limitations that were in effect during your fund’s fiscal year ending in 2022. These expense limitations were: (i) a contractual expense limitation applicable to specified mutual funds, including your fund, of 25 basis points on investor servicing fees and expenses and (ii) a contractual expense limitation applicable to specified mutual funds, including your fund, of 20 basis points on so-called “other expenses” (i.e., all expenses exclusive of management fees, distribution fees, investor servicing fees, investment-related expenses, interest, taxes, brokerage commissions, acquired fund fees and expenses and extraordinary expenses). These expense limitations attempt to maintain competitive expense levels for the funds. Most funds, including your fund, had sufficiently low expenses that these expense limitations were not operative during their fiscal years ending in 2022. Putnam Management and PSERV have agreed to maintain these expense limitations until at least January 30, 2025. Putnam Management and PSERV’s commitment to these expense limitation arrangements, which were intended to support an effort to have the mutual fund expenses meet competitive standards, was an important factor in the Trustees’ decision to approve your fund’s New Management Contracts and Interim Management Contracts and the continuance of your fund’s Current Management Contracts.
The Trustees reviewed comparative fee and expense information for a custom group of competitive funds selected by Broadridge Financial Solutions, Inc. (“Broadridge”). This comparative information included your fund’s percentile ranking for effective management fees and total expenses (excluding any applicable 12b-1 fees), which provides a general indication of your fund’s relative standing. In the custom peer group, your fund ranked in the first quintile in effective management fees (determined for your fund and the other funds in the custom peer group based on fund asset size and the applicable contractual management fee schedule) and in the second quintile in total expenses (excluding any applicable 12b-1 fees) as of December 31, 2022. The first quintile represents the least expensive funds and the fifth quintile the most expensive funds. The fee and expense data reported by Broadridge as of December 31, 2022 reflected the most recent fiscal year-end data available in Broadridge’s database at that time.
In connection with their review of fund management fees and total expenses, the Trustees also reviewed the costs of the services provided and the profits realized by Putnam Management and its affiliates from their contractual relationships with the funds. This information included trends in revenues, expenses and profitability of Putnam Management and its affiliates relating to the investment management, investor servicing and distribution services provided to the funds, as applicable. In this regard, the Trustees also reviewed an analysis of the revenues, expenses and profitability of Putnam Management and its affiliates, allocated on a fund-by-fund basis, with respect to (as applicable) the funds’ management, distribution and investor servicing contracts. For each fund, the analysis presented information about revenues, expenses and profitability in 2022 for each of the applicable agreements separately and for the agreements taken together on a
|
| California Tax Exempt Income Fund 19 |
combined basis. The Trustees concluded that, at current asset levels, the fee schedules in place for each of the funds, including the fee schedule for your fund, represented reasonable compensation for the services being provided and represented an appropriate sharing between fund shareholders and Putnam Management of any economies of scale as may exist in the management of the funds at that time.
The information examined by the Trustees in connection with their annual contract review for the funds included information regarding services provided and fees charged by Putnam Management and its affiliates to other clients, including collective investment trusts offered in the defined contribution and defined benefit retirement plan markets, sub-advised mutual funds, private funds sponsored by affiliates of Putnam Management, model-only separately managed accounts and Putnam Management’s manager-traded separately managed account programs. This information included, in cases where a product’s investment strategy corresponds with a fund’s strategy, comparisons of those fees with fees charged to the funds, as well as an assessment of the differences in the services provided to these clients as compared to the services provided to the funds. The Trustees observed that the differences in fee rates between these clients and the funds are by no means uniform when examined by individual asset sectors, suggesting that differences in the pricing of investment management services to these types of clients may reflect, among other things, historical competitive forces operating in separate marketplaces. The Trustees considered the fact that in many cases fee rates across different asset classes are higher on average for 1940 Act-registered funds than for other clients, and the Trustees also considered the differences between the services that Putnam Management provides to the funds and those that it provides to its other clients. The Trustees did not rely on these comparisons to any significant extent in concluding that the management fees paid by your fund are reasonable.
Investment performance
The quality of the investment process provided by Putnam Management represented a major factor in the Trustees’ evaluation of the quality of services provided by Putnam Management under your fund’s management contract. The Trustees were assisted in their review of Putnam Management’s investment process and performance by the work of the investment oversight committees of the Trustees and the full Board of Trustees, which meet on a regular basis with individual portfolio managers and with senior management of Putnam Management’s Investment Division throughout the year. The Trustees concluded that Putnam Management generally provides a high-quality investment process — based on the experience and skills of the individuals assigned to the management of fund portfolios, the resources made available to them and in general Putnam Management’s ability to attract and retain high-quality personnel — but also recognized that this does not guarantee favorable investment results for every fund in every time period.
The Trustees considered that, in the aggregate, peer-relative and benchmark-relative Putnam fund performance was generally encouraging in 2022 against a backdrop of volatile equity and fixed income markets, driven by factors such as Russia’s invasion of Ukraine, increased tensions with China, disruptions in energy markets and broader supply chains, rising inflation and the significant tightening of monetary policy by the Board of Governors of the Federal Reserve in an effort to combat inflation. The Trustees further noted that, in the face of these numerous economic headwinds, corporate earnings and employment data had been generally robust throughout 2022. For the one-year period ended December 31, 2022, the Trustees noted that the Putnam funds, on an asset-weighted basis, ranked in the 41st percentile of their peers as determined by Lipper Inc. (“Lipper”) and, on an asset-weighted-basis, outperformed their benchmarks by 1.3% gross of fees over the one-year period. The Committee also noted that the funds’ aggregate performance over longer-term periods continued to be strong, with the funds, on an asset-weighted basis, ranking in the 34th, 27th and 22nd percentiles of their Lipper peers over the three-year, five-year and ten-year periods ended December 31, 2022, respectively. The Trustees further noted that the funds, in the aggregate, outperformed their benchmarks on a gross basis for each of the three-year, five-year and ten-year periods. The Trustees also considered the Morningstar Inc. ratings assigned to the funds and that 40 funds were rated four or five stars at the end of 2022, which represented an increase of 15 funds year-over-year. The Trustees also considered that seven funds were five-star rated at the end of 2022, which was a year-over-year decrease of two funds, and that 83% of the funds’ aggregate assets were in four- or five-star rated funds at year end.
|
| 20 California Tax Exempt Income Fund |
In addition to the performance of the individual Putnam funds, the Trustees considered, as they had in prior years, the performance of The Putnam Fund complex versus competitor fund complexes, as reported in the Barron’s/Lipper Fund Families survey (the “Survey”). The Trustees noted that the Survey ranks mutual fund companies based on their performance across a variety of asset types, and that The Putnam Fund complex had performed exceptionally well in 2022. In this regard, the Trustees considered that the funds had ranked 9th out of 49 fund companies, 3rd out of 49 fund companies and 2nd out of 47 fund companies for the one-year, five-year and ten-year periods, respectively. The Trustees also noted that The Putnam Fund complex had been the only fund family to rank in the top ten in all three time periods. They also noted, however, the disappointing investment performance of some Putnam funds for periods ended December 31, 2022 and considered information provided by Putnam Management regarding the factors contributing to the underperformance and, where relevant, actions being taken to improve the performance of these particular funds. The Trustees indicated their intention to continue to monitor the performance of those funds.
For purposes of the Trustees’ evaluation of the Putnam funds’ investment performance, the Trustees generally focus on a competitive industry ranking of each fund’s total net return over a one-year, three-year and five-year period. For a number of Putnam funds with relatively unique investment mandates for which Putnam Management informed the Trustees that meaningful competitive performance rankings are not considered to be available, the Trustees evaluated performance based on their total gross and net returns and comparisons of those returns to the returns of selected investment benchmarks. In the case of your fund, the Trustees considered that its class A share cumulative total return performance at net asset value was in the following quartiles of its Lipper peer group (Lipper California Municipal Debt Funds) for the one-year, three-year and five-year periods ended December 31, 2022 (the first quartile representing the best-performing funds and the fourth quartile the worst-performing funds):
| |
| One-year period | 2nd |
| Three-year period | 2nd |
| Five-year period | 2nd |
Over the one-year, three-year and five-year periods ended December 31, 2022, there were 123, 119 and 109 funds, respectively, in your fund’s Lipper peer group. (When considering performance information, shareholders should be mindful that past performance is not a guarantee of future results.)
The Trustees also considered Putnam Management’s continued efforts to support fund performance through certain initiatives, including structuring compensation for portfolio managers to enhance accountability for fund performance, emphasizing accountability in the portfolio management process and affirming its commitment to a fundamental-driven approach to investing.
Brokerage and soft-dollar allocations; distribution and investor servicing
The Trustees considered various potential benefits that Putnam Management may receive in connection with the services it provides under the management contract with your fund. These include benefits related to brokerage allocation and the use of soft dollars, whereby a portion of the commissions paid by a fund for brokerage may be used to acquire research services that are expected to be useful to Putnam Management in managing the assets of the fund and of other clients. Subject to policies established by the Trustees, soft dollars generated by these means are used predominantly to acquire brokerage and research services (including third-party research and market data) that enhance Putnam Management’s investment capabilities and supplement Putnam Management’s internal research efforts. The Trustees indicated their continued intent to monitor regulatory and industry developments in this area with the assistance of their Brokerage Committee. In addition, with the assistance of their Brokerage Committee, the Trustees indicated their continued intent to monitor the allocation of the funds’ brokerage in order to ensure that the principle of seeking best price and execution remains paramount in the portfolio trading process.
Putnam Management may also receive benefits from payments made to Putnam Management’s affiliates by the mutual funds for distribution services and investor services. In conjunction with the review of your fund’s management and sub-management contracts, the Trustees reviewed your fund’s investor servicing agreement
|
| California Tax Exempt Income Fund 21 |
with PSERV and its distributor’s contract and distribution plans with Putnam Retail Management Limited Partnership (“PRM”), both of which are affiliates of Putnam Management. The Trustees concluded that the fees payable by the mutual funds to PSERV and PRM for such services were fair and reasonable in relation to the nature and quality of such services, the fees paid by competitive funds and the costs incurred by PSERV and PRM in providing such services. Furthermore, the Trustees were of the view that the investor services provided by PSERV were required for the operation of the mutual funds, and that they were of a quality at least equal to those provided by other providers.
|
| 22 California Tax Exempt Income Fund |
Audited financial statements
These sections of the report, as well as the accompanying Notes, preceded by the Report of Independent Registered Public Accounting Firm, constitute the fund’s audited financial statements.
The fund’s portfolio lists all the fund’s investments and their values as of the last day of the reporting period. Holdings are organized by asset type and industry sector, country, or state to show areas of concentration and diversification.
Statement of assets and liabilities shows how the fund’s net assets and share price are determined. All investment and non-investment assets are added together. Any unpaid expenses and other liabilities are subtracted from this total. The result is divided by the number of shares to determine the net asset value per share, which is calculated separately for each class of shares. (For funds with preferred shares, the amount subtracted from total assets includes the liquidation preference of preferred shares.)
Statement of operations shows the fund’s net investment gain or loss. This is done by first adding up all the fund’s earnings — from dividends and interest income — and subtracting its operating expenses to determine net investment income (or loss). Then, any net gain or loss the fund realized on the sales of its holdings — as well as any unrealized gains or losses over the period — is added to or subtracted from the net investment result to determine the fund’s net gain or loss for the fiscal period.
Statement of changes in net assets shows how the fund’s net assets were affected by the fund’s net investment gain or loss, by distributions to shareholders, and by changes in the number of the fund’s shares. It lists distributions and their sources (net investment income or realized capital gains) over the current reporting period and the most recent fiscal year-end. The distributions listed here may not match the sources listed in the Statement of operations because the distributions are determined on a tax basis and may be paid in a different period from the one in which they were earned.
Financial highlights provide an overview of the fund’s investment results, per-share distributions, expense ratios, net investment income ratios, and portfolio turnover (not required for money market funds) in one summary table, reflecting the five most recent reporting periods. In a semiannual report, the highlights table also includes the current reporting period.
|
| California Tax Exempt Income Fund 23 |
Report of Independent Registered Public Accounting Firm
To the Board of Trustees and Shareholders of
Putnam California Tax Exempt Income Fund:
Opinion on the Financial Statements
We have audited the accompanying statement of assets and liabilities, including the fund’s portfolio, of Putnam California Tax Exempt Income Fund (the “Fund”) as of September 30, 2023, the related statement of operations for the year ended September 30, 2023, the statement of changes in net assets for each of the two years in the period ended September 30, 2023, including the related notes, and the financial highlights for each of the four years in the period ended September 30, 2023 (collectively referred to as the “financial statements”). In our opinion, the financial statements present fairly, in all material respects, the financial position of the Fund as of September 30, 2023, the results of its operations for the year then ended, the changes in its net assets for each of the two years in the period ended September 30, 2023 and the financial highlights for each of the four years in the period ended September 30, 2023 in conformity with accounting principles generally accepted in the United States of America.
The financial statements of the Fund as of and for the year ended September 30, 2019 and the financial highlights for each of the periods ended on or prior to September 30, 2019 (not presented herein, other than the financial highlights) were audited by other auditors whose report dated November 8, 2019 expressed an unqualified opinion on those financial statements and financial highlights.
Basis for Opinion
These financial statements are the responsibility of the Fund’s management. Our responsibility is to express an opinion on the Fund’s financial statements based on our audits. We are a public accounting firm registered with the Public Company Accounting Oversight Board (United States) (“PCAOB”) and are required to be independent with respect to the Fund in accordance with the U.S. federal securities laws and the applicable rules and regulations of the Securities and Exchange Commission and the PCAOB.
We conducted our audits of these financial statements in accordance with the standards of the PCAOB. Those standards require that we plan and perform the audit to obtain reasonable assurance about whether the financial statements are free of material misstatement, whether due to error or fraud.
Our audits included performing procedures to assess the risks of material misstatement of the financial statements, whether due to error or fraud, and performing procedures that respond to those risks. Such procedures included examining, on a test basis, evidence regarding the amounts and disclosures in the financial statements. Our audits also included evaluating the accounting principles used and significant estimates made by management, as well as evaluating the overall presentation of the financial statements. Our procedures included confirmation of securities owned as of September 30, 2023 by correspondence with the custodian, transfer agent and brokers; when replies were not received from brokers, we performed other auditing procedures. We believe that our audits provide a reasonable basis for our opinion.
PricewaterhouseCoopers LLP
Boston, Massachusetts
November 8, 2023
We have served as the auditor of one or more investment companies in the Putnam Investments family of funds since at least 1957. We have not been able to determine the specific year we began serving as auditor.
|
| 24 California Tax Exempt Income Fund |
| | |
| The fund’s portfolio 9/30/23 | | |
|
Key to holding’s abbreviations
|
| AGM Assured Guaranty Municipal Corporation |
| BAM Build America Mutual |
| COP Certificates of Participation |
| G.O. Bonds General Obligation Bonds |
| NATL National Public Finance Guarantee Corporation |
| VRDN Variable Rate Demand Notes, which are floating-rate securities with long-term maturities that carry coupons that reset and are payable upon demand either daily, weekly or monthly. The rate shown is the current interest rate at the close of the reporting period. Rates are set by remarketing agents and may take into consideration market supply and demand, credit quality and the current SIFMA Municipal Swap Index rate, which was 3.98% as of the close of the reporting period. |
|
| | | | |
| MUNICIPAL BONDS AND NOTES (99.2%)* | Rating** | | Principal amount | Value |
| Alaska (1.3%) |
| AK State Indl. Dev. & Export Auth. Rev. Bonds, (Tanana Chiefs Conference), Ser. A | | | | |
| 5.00%, 10/1/33 | A+/F | | $1,500,000 | $1,541,882 |
| 4.00%, 10/1/38 | A+/F | | 4,270,000 | 3,809,609 |
| 4.00%, 10/1/36 | A+/F | | 2,455,000 | 2,260,088 |
| 4.00%, 10/1/34 | A+/F | | 2,110,000 | 1,977,832 |
| | | | 9,589,411 |
| California (96.5%) |
| Alameda, Corridor Trans. Auth. Rev. Bonds | | | | |
| Ser. B, AGM, 5.00%, 10/1/37 | AA | | 450,000 | 456,530 |
| Ser. A, zero %, 10/1/49 | A3 | | 10,000,000 | 4,789,602 |
| Anaheim, Hsg. & Pub. Impt. Auth. Rev. Bonds | | | | |
| Ser. A, 5.00%, 10/1/50 | AA− | | 1,400,000 | 1,411,034 |
| Ser. C, 5.00%, 10/1/45 | AA− | | 2,730,000 | 2,755,928 |
| Bay Area Toll Auth. VRDN (San Francisco Bay Area), Ser. C, 2.22%, 4/1/53 | VMIG 1 | | 2,710,000 | 2,710,000 |
| CA Cmnty. Choice Fin. Auth. Mandatory Put Bonds (12/1/27), (Clean Energy), Ser. A, 4.00%, 10/1/52 | A2 | | 11,600,000 | 11,245,924 |
| CA Cmnty. Hsg. Agcy. Essential Hsg. 144A Rev. Bonds | | | | |
| (The Arbors), Ser. A, 5.00%, 8/1/50 | BB−/P | | 4,500,000 | 3,892,998 |
| (Aster Apt.), Ser. A-1, 4.00%, 2/1/56 | BB+/P | | 1,100,000 | 851,856 |
| (Fountains at Emerald Park), 3.00%, 8/1/56 | BBB/P | | 7,775,000 | 4,811,003 |
| CA Hsg. Fin. Agcy. Rev. Bonds, Ser. 2, Class A, 4.00%, 3/20/33 | BBB+ | | 4,696,859 | 4,470,917 |
| CA Hsg. Fin. Agcy. Muni. Certif. Rev. Bonds, Ser. 21-1, Class A, 3.50%, 11/20/35 | BBB+ | | 3,971,640 | 3,485,541 |
| CA Muni. Fin. Auth. Rev. Bonds | | | | |
| (Channing House), Ser. B, 5.00%, 5/15/47 | AA− | | 6,530,000 | 6,645,579 |
| (Eisenhower Med. Ctr.), Ser. A, 5.00%, 7/1/42 | Baa2 | | 300,000 | 287,182 |
| CA Muni. Fin. Auth. Special Fin. Agcy. VII Essential Hsg. 144A Rev. Bonds, (The Breakwater Apt.), Ser. A-1, 3.00%, 8/1/56 | BB+/P | | 2,000,000 | 1,254,711 |
| CA School Fac. Fin. Auth. Rev. Bonds | | | | |
| (Green Dot Pub. Schools), 5.75%, 8/1/52 | BBB− | | 1,500,000 | 1,512,575 |
| (Kipp SoCal Pub. Schools), Ser. A, 5.00%, 7/1/54 | BBB | | 3,150,000 | 2,914,529 |
| (Kipp SoCal Pub. Schools), Ser. A, 5.00%, 7/1/39 | BBB | | 1,000,000 | 988,213 |
| |
California Tax Exempt Income Fund 25 |
| | | | |
| MUNICIPAL BONDS AND NOTES (99.2%)* cont. | Rating** | | Principal amount | Value |
| California cont. |
| CA School Fac. Fin. Auth. 144A Rev. Bonds | | | | |
| (Granada Hills Charter High School), 5.00%, 7/1/54 | BBB | | $7,120,000 | $6,319,152 |
| (Alliance College-Ready Pub. Schools), Ser. A, 5.00%, 7/1/51 | BBB | | 1,570,000 | 1,414,512 |
| (Green Dot Pub. Schools), Ser. A, 5.00%, 8/1/48 | BBB− | | 5,250,000 | 4,782,195 |
| (Green Dot Pub. Schools), Ser. A, 5.00%, 8/1/45 | BBB− | | 1,500,000 | 1,387,938 |
| (Granada Hills Charter High School), 5.00%, 7/1/43 | BBB | | 1,750,000 | 1,629,268 |
| (Green Dot Pub. Schools), Ser. A, 5.00%, 8/1/38 | BBB− | | 1,000,000 | 970,138 |
| (Alliance College-Ready Pub. Schools), Ser. A, 5.00%, 7/1/36 | BBB | | 1,250,000 | 1,247,032 |
| (Alliance College-Ready Pub. Schools), Ser. A, 5.00%, 7/1/31 | BBB | | 1,830,000 | 1,837,784 |
| (Alliance College-Ready Pub. Schools), Ser. C, 5.00%, 7/1/31 | BBB | | 1,425,000 | 1,434,375 |
| (Kipp SoCal Pub. Schools Oblig. Group), Ser. A, 4.00%, 7/1/55 | BBB | | 1,075,000 | 820,140 |
| (Kipp SoCal Pub. Schools Oblig. Group), Ser. A, 4.00%, 7/1/50 | BBB | | 1,140,000 | 892,293 |
| (Granada Hills Charter High School Oblig. Group), 4.00%, 7/1/48 | BBB | | 675,000 | 507,513 |
| (Kipp SoCal Pub. Schools Oblig. Group), Ser. A, 4.00%, 7/1/40 | BBB | | 800,000 | 688,457 |
| (Granada Hills Charter High School Oblig. Group), 4.00%, 7/1/38 | BBB | | 465,000 | 392,103 |
| CA School Fin. Auth. Rev. Bonds, (Kipp LA Projects), Ser. A, 5.125%, 7/1/44 | BBB | | 1,060,000 | 1,045,432 |
| CA State G.O. Bonds | | | | |
| 5.00%, 10/1/42 | Aa2 | | 6,000,000 | 6,370,941 |
| 3.00%, 12/1/46 | Aa2 | | 1,750,000 | 1,312,289 |
| 3.00%, 12/1/43 | Aa2 | | 500,000 | 388,629 |
| CA State Charter School Fin. Auth. 144A Rev. Bonds | | | | |
| (Hawking STEAM Charter Schools, Inc.), 5.50%, 7/1/62 | BB+ | | 1,000,000 | 939,229 |
| (Aspire Pub. Schools Oblig. Group), Ser. A, 5.00%, 8/1/59 | BBB | | 2,365,000 | 2,097,942 |
| (Summit Pub. Schools), 5.00%, 6/1/53 (Prerefunded 6/1/27) | AAA/P | | 1,250,000 | 1,311,159 |
| (Summit Pub. Schools), 5.00%, 6/1/53 | Ba3 | | 1,100,000 | 928,332 |
| (Classical Academy Oblig. Group), Ser. A, 5.00%, 10/1/50 | BBB− | | 3,000,000 | 2,730,875 |
| (Aspire Pub. Schools Oblig. Group), Ser. A, 5.00%, 8/1/50 | BBB | | 3,000,000 | 2,727,527 |
| (Summit Pub. Schools), 5.00%, 6/1/47 (Prerefunded 6/1/27) | AAA/P | | 530,000 | 555,931 |
| (Summit Pub. Schools), 5.00%, 6/1/47 | Ba3 | | 470,000 | 407,770 |
| (Aspire Public Schools), 5.00%, 8/1/42 | BBB | | 1,000,000 | 945,835 |
| (Classical Academy Oblig. Group), Ser. A, 5.00%, 10/1/40 | BBB− | | 215,000 | 206,613 |
| (Aspire Pub. Schools Oblig. Group), Ser. A, 5.00%, 8/1/40 | BBB | | 1,000,000 | 961,156 |
| |
26 California Tax Exempt Income Fund |
| | | | |
| MUNICIPAL BONDS AND NOTES (99.2%)* cont. | Rating** | | Principal amount | Value |
| California cont. |
| CA State Charter School Fin. Auth. 144A Rev. Bonds | | | | |
| (Santa Clarita Valley Intl. Charter School), Ser. A, 4.00%, 6/1/61 | BB/P | | $1,175,000 | $799,807 |
| (Vista Charter Pub. Schools Oblig. Group), Ser. A, 4.00%, 6/1/61 | BB | | 3,000,000 | 2,048,861 |
| (Santa Clarita Valley Intl. Charter School), Ser. A, 4.00%, 6/1/51 | BB/P | | 650,000 | 467,965 |
| (Santa Clarita Valley Intl. Charter School), Ser. A, 4.00%, 6/1/41 | BB/P | | 500,000 | 397,080 |
| CA State Cmnty. College Fin. Auth. Rev. Bonds, (Orange Coast College Hsg.) | | | | |
| 5.25%, 5/1/43 | BB+ | | 500,000 | 492,168 |
| 5.00%, 5/1/37 | BB+ | | 1,000,000 | 998,983 |
| 5.00%, 5/1/34 | BB+ | | 800,000 | 811,396 |
| 5.00%, 5/1/33 | BB+ | | 600,000 | 610,031 |
| 5.00%, 5/1/31 | BB+ | | 825,000 | 842,891 |
| CA State Edl. Fac. Auth. Rev. Bonds | | | | |
| (U. of the Pacific), 5.00%, 11/1/53 | A2 | | 4,000,000 | 4,051,526 |
| (Occidental College), 5.00%, 10/1/45 | Aa3 | | 425,000 | 429,359 |
| (U. of Redlands), Ser. A, 5.00%, 10/1/37 | Baa2 | | 425,000 | 423,449 |
| (U. of the Pacific), 5.00%, 11/1/36 | A2 | | 500,000 | 506,263 |
| (U. of Redlands), Ser. A, 5.00%, 10/1/35 | Baa2 | | 1,000,000 | 1,003,267 |
| CA State Enterprise Dev. Auth. Student Hsg. Rev. Bonds, (Provident Group-SDSU Properties, LLC), Ser. A | | | | |
| 5.00%, 8/1/57 | Baa3 | | 400,000 | 380,585 |
| 5.00%, 8/1/50 | Baa3 | | 500,000 | 491,981 |
| 5.00%, 8/1/40 | Baa3 | | 1,000,000 | 1,005,100 |
| CA State Hlth. Fac. Fin. Auth. Rev. Bonds | | | | |
| (Los Angeles Biomedical Research Inst.), 5.00%, 9/1/43 | Baa2 | | 6,155,000 | 5,815,209 |
| (Los Angeles Biomedical Research Inst.), 5.00%, 9/1/37 | Baa2 | | 1,845,000 | 1,825,697 |
| (Providence St. Joseph Hlth.), Ser. A, 4.00%, 10/1/35 | A2 | | 1,000,000 | 947,764 |
| (Cedars-Sinai Med. Ctr.), Ser. A, 3.00%, 8/15/51 | Aa3 | | 11,000,000 | 7,654,743 |
| CA State Infrastructure & Econ. Dev. Bank Mandatory Put Bonds (2/1/26), (Colburn School (The)), 1.75%, 8/1/55 | A+ | | 4,600,000 | 4,200,875 |
| CA State Infrastructure & Econ. Dev. Bank Rev. Bonds | | | | |
| (Equitable School Revolving Fund), 5.00%, 11/1/57 | A | | 5,000,000 | 4,797,438 |
| (Equitable School Revolving Fund), 5.00%, 11/1/47 | A | | 2,300,000 | 2,258,327 |
| (Equitable School Revolving Fund), Ser. B, 5.00%, 11/1/39 | A | | 600,000 | 605,082 |
| (CA Science Ctr. Foundation), 4.00%, 5/1/51 | A3 | | 1,250,000 | 1,033,442 |
| (Los Angeles Cnty. Museum of Natural History Foundation), 4.00%, 7/1/50 | A2 | | 7,125,000 | 6,034,280 |
| Ser. B, 4.00%, 11/1/39 | A | | 1,360,000 | 1,223,579 |
| |
California Tax Exempt Income Fund 27 |
| | | | |
| MUNICIPAL BONDS AND NOTES (99.2%)* cont. | Rating** | | Principal amount | Value |
| California cont. |
| CA State Infrastructure & Econ. Dev. Bank Rev. Bonds | | | | |
| (Performing Arts Center of Los Angeles Cnty.), 4.00%, 12/1/37 | A | | $505,000 | $467,690 |
| Ser. B, 4.00%, 11/1/37 | A | | 1,720,000 | 1,583,126 |
| (Performing Arts Center of Los Angeles Cnty.), 4.00%, 12/1/36 | A | | 515,000 | 483,106 |
| (Performing Arts Center of Los Angeles Cnty.), 4.00%, 12/1/35 | A | | 855,000 | 821,562 |
| CA State Infrastructure & Econ. Dev. Bank 144A Rev. Bonds | | | | |
| (WFCS Holdings II, LLC), Ser. A-1, 5.00%, 1/1/56 | BB/P | | 1,740,000 | 1,309,098 |
| (WFCS Holdings, LLC), 5.00%, 1/1/55 | BB/P | | 2,920,000 | 2,227,226 |
| (WFCS Holdings, LLC), 4.125%, 1/1/35 | BB/P | | 485,000 | 413,145 |
| CA State Infrastructure & Econ. Dev. Bk. Rev. Bonds, (CA Science Ctr. Foundation), 4.00%, 5/1/55 | A3 | | 6,945,000 | 5,664,018 |
| CA State Muni. Fin. Auth Mobile Home Park Rev. Bonds | | | | |
| (Caritas Sr. Hsg. Network), Ser. A, 5.00%, 8/15/31 | A− | | 600,000 | 622,164 |
| (Caritas Affordable Hsg., Inc.), Ser. A, 5.00%, 8/15/30 | A− | | 1,000,000 | 1,009,863 |
| (Caritas Sr. Hsg. Network), Ser. A, 5.00%, 8/15/30 | A− | | 685,000 | 711,108 |
| CA State Muni. Fin. Auth. COP, (Palomar Hlth.), Ser. A, AGM, 5.25%, 11/1/52 | AA | | 6,000,000 | 6,193,484 |
| CA State Muni. Fin. Auth. Rev. Bonds | | | | |
| (Bethany Home Society of San Joaquin Cnty.), 5.00%, 11/15/52 | AA− | | 5,000,000 | 5,103,183 |
| (Town & Country Manor of the Christian & Missionary Alliance), 5.00%, 7/1/49 | AA− | | 2,650,000 | 2,726,442 |
| (UCR North Dist. Phase 1 Student Hsg.), 5.00%, 5/15/49 | Baa3 | | 3,000,000 | 2,936,203 |
| (Cmnty. Hosp. of Central CA), Ser. A, 5.00%, 2/1/47 | A3 | | 3,400,000 | 3,362,896 |
| (HumanGood CA Oblig. Group), Ser. A, 5.00%, 10/1/44 | A−/F | | 5,000,000 | 4,997,442 |
| (Dundee Glasgow Student Hsg.), 5.00%, 5/15/43 | Baa3 | | 5,195,000 | 5,197,034 |
| (CHF-Riverside I, LLC), 5.00%, 5/15/40 | Baa3 | | 500,000 | 503,336 |
| (Master’s U. (The)), 5.00%, 8/1/39 | BBB− | | 3,390,000 | 3,243,501 |
| (Town & Country Manor of the Christian & Missionary Alliance), 5.00%, 7/1/39 | AA− | | 1,995,000 | 2,063,465 |
| (Master’s U. (The)), 5.00%, 8/1/34 | BBB− | | 1,385,000 | 1,389,769 |
| (Congregational Homes, Inc.), 4.00%, 11/15/56 | BBB−/F | | 750,000 | 505,136 |
| (Congregational Homes, Inc.), 4.00%, 11/15/52 | BBB−/F | | 750,000 | 518,114 |
| (Orchard Park Student Hsg.), BAM, 4.00%, 5/15/46 | AA | | 1,375,000 | 1,155,593 |
| (U. of the Pacific), 4.00%, 11/1/44 | A2 | | 1,180,000 | 1,027,075 |
| (HumanGood CA Oblig. Group), Ser. A, 4.00%, 10/1/44 | A−/F | | 5,000,000 | 4,288,265 |
| (Congregational Homes, Inc.), 4.00%, 11/15/42 | BBB−/F | | 295,000 | 225,626 |
| (U. of the Pacific), 4.00%, 11/1/42 | A2 | | 1,600,000 | 1,414,230 |
| (U. of the Pacific), 4.00%, 11/1/40 | A2 | | 600,000 | 542,418 |
| (CHF-Davis II, LLC), BAM, 4.00%, 5/15/38 | AA | | 1,300,000 | 1,183,613 |
| (U. of the Pacific), 4.00%, 11/1/37 | A2 | | 400,000 | 371,496 |
| |
28 California Tax Exempt Income Fund |
| | | | |
| MUNICIPAL BONDS AND NOTES (99.2%)* cont. | Rating** | | Principal amount | Value |
| California cont. |
| CA State Muni. Fin. Auth. Rev. Bonds | | | | |
| (U. of the Pacific), 4.00%, 11/1/36 | A2 | | $860,000 | $810,460 |
| (Orchard Park Student Hsg.), BAM, 4.00%, 5/15/35 | AA | | 1,295,000 | 1,239,802 |
| (United Airlines, Inc.), 4.00%, 7/15/29 | BB− | | 5,000,000 | 4,792,466 |
| (CHF-Davis II, LLC), BAM, 3.00%, 5/15/51 | AA | | 9,250,000 | 6,186,924 |
| (CA Inst. of the Arts), 3.00%, 10/1/41 | Baa1 | | 960,000 | 680,785 |
| CA State Muni. Fin. Auth. Special Tax | | | | |
| (BOLD Program), Ser. A, 4.00%, 9/1/51 | BB−/P | | 1,500,000 | 1,148,287 |
| Ser. B, 4.00%, 9/1/50 | BB−/P | | 1,525,000 | 1,203,492 |
| (BOLD Program), Ser. A, 4.00%, 9/1/46 | BB−/P | | 1,090,000 | 867,742 |
| Ser. B, 4.00%, 9/1/43 | BB−/P | | 1,070,000 | 887,399 |
| (BOLD Program), Ser. A, 4.00%, 9/1/41 | BB−/P | | 660,000 | 557,952 |
| Ser. B, 4.00%, 9/1/35 | BB−/P | | 660,000 | 614,683 |
| CA State Muni. Fin. Auth. Mobile Home Pk. Rev. Bonds, (Caritas Acquisitions IX, LLC), Ser. A | | | | |
| 5.25%, 8/15/58 | A− | | 800,000 | 805,764 |
| 5.25%, 8/15/53 | A− | | 900,000 | 914,049 |
| CA State Muni. Fin. Auth. Solid Waste Disp. 144A Mandatory Put Bonds (2/3/25), (Waste Management, Inc.), Ser. A, 1.30%, 2/1/39 | A− | | 1,600,000 | 1,534,826 |
| CA State Poll. Control Fin. Auth. 144A Rev. Bonds | | | | |
| (Wtr. Furnishing), 5.00%, 11/21/45 | Baa3 | | 14,250,000 | 13,606,587 |
| (Poseidon Resources Channelside LP), 5.00%, 7/1/39 | Baa3 | | 2,250,000 | 2,255,999 |
| CA State Poll. Control Fin. Auth. Solid Waste Disp. Mandatory Put Bonds (5/1/24), (Waste Management, Inc.), Ser. A | | | | |
| 2.50%, 11/1/38 | A− | | 2,500,000 | 2,472,728 |
| 2.50%, 7/1/31 | A− | | 1,125,000 | 1,112,727 |
| CA State Poll. Control Fin. Auth. Wtr. Furnishing 144A Rev. Bonds, (San Diego Cnty. Wtr. Auth. Desalination), 5.00%, 11/21/45 | Baa3 | | 2,140,000 | 2,083,981 |
| CA State Statewide Communities Dev. Auth. Hosp. Rev. Bonds, (Methodist Hosp. of Southern CA) | | | | |
| 5.00%, 1/1/48 | BBB− | | 2,000,000 | 1,930,965 |
| 5.00%, 1/1/43 | BBB− | | 7,195,000 | 7,012,001 |
| CA State Tobacco Securitization Agcy. Rev. Bonds | | | | |
| (Merced Cnty. Tobacco Funding Corp.), 5.00%, 6/1/50 | BBB−/P | | 900,000 | 843,342 |
| Ser. B-1, 5.00%, 6/1/49 | BBB+ | | 535,000 | 525,401 |
| (Sonoma Cnty. Securitization Corp.), 5.00%, 6/1/49 | BBB− | | 310,000 | 304,438 |
| (Kern Cnty. Tobacco Funding Corp.), 5.00%, 6/1/40 | BBB/P | | 5,000,000 | 4,835,012 |
| (Merced Cnty. Tobacco Funding Corp.), 4.00%, 6/1/42 | A− | | 100,000 | 88,778 |
| (Merced Cnty. Tobacco Funding Corp.), 4.00%, 6/1/41 | A− | | 100,000 | 89,823 |
| Ser. A, 4.00%, 6/1/40 | A− | | 400,000 | 363,118 |
| (Merced Cnty. Tobacco Funding Corp.), 4.00%, 6/1/40 | A− | | 200,000 | 181,566 |
| |
California Tax Exempt Income Fund 29 |
| | | | |
| MUNICIPAL BONDS AND NOTES (99.2%)* cont. | Rating** | | Principal amount | Value |
| California cont. |
| CA State Tobacco Securitization Agcy. Rev. Bonds | | | | |
| (Sonoma Cnty. Securitization Corp.), 4.00%, 6/1/40 | A− | | $325,000 | $295,045 |
| Ser. A, 4.00%, 6/1/39 | A− | | 300,000 | 275,513 |
| Ser. A, 4.00%, 6/1/38 | A− | | 275,000 | 255,397 |
| (Merced Cnty. Tobacco Funding Corp.), 4.00%, 6/1/38 | A− | | 250,000 | 232,173 |
| (Sonoma Cnty. Securitization Corp.), 4.00%, 6/1/38 | A− | | 800,000 | 742,954 |
| (Merced Cnty. Tobacco Funding Corp.), 4.00%, 6/1/37 | A− | | 100,000 | 94,396 |
| (Merced Cnty. Tobacco Funding Corp.), 4.00%, 6/1/36 | A− | | 225,000 | 216,007 |
| (Sonoma Cnty. Securitization Corp.), 4.00%, 6/1/36 | A− | | 610,000 | 585,618 |
| (Merced Cnty. Tobacco Funding Corp.), 4.00%, 6/1/35 | A− | | 100,000 | 97,625 |
| (Sonoma Cnty. Securitization Corp.), 4.00%, 6/1/35 | A− | | 350,000 | 341,689 |
| (Merced Cnty. Tobacco Funding Corp.), 4.00%, 6/1/34 | A− | | 200,000 | 197,801 |
| (Sonoma Cnty. Securitization Corp.), zero %, 6/1/55 | BB/P | | 7,295,000 | 1,215,836 |
| CA State U. Mandatory Put Bonds 11/1/26), Ser. B-2, 0.55%, 11/1/49 | Aa2 | | 1,500,000 | 1,315,137 |
| CA State U. Rev. Bonds, Ser. A | | | | |
| 5.25%, 11/1/53 | Aa2 | | 3,000,000 | 3,198,997 |
| 5.25%, 11/1/48 | Aa2 | | 2,000,000 | 2,143,371 |
| CA Statewide Cmnty. Dev. Auth. Rev. Bonds | | | | |
| (Front Porch Cmnty. & Svcs.), Ser. A, 5.00%, 4/1/47 | A− | | 2,000,000 | 1,964,293 |
| (American Baptist Homes of the West), 5.00%, 10/1/45 | A−/F | | 2,550,000 | 2,392,647 |
| (Front Porch Cmnty. & Svcs.), Ser. A, 5.00%, 4/1/30 | A− | | 310,000 | 314,805 |
| (Viamonte Senior Living 1, Inc.), Ser. A, 4.00%, 7/1/47 | AA− | | 2,000,000 | 1,811,593 |
| (Front Porch Cmnty. & Svcs.), Ser. A, 4.00%, 4/1/47 | A− | | 1,625,000 | 1,365,830 |
| (Marin Gen. Hosp.), Ser. A, 4.00%, 8/1/45 | BBB | | 2,500,000 | 2,008,551 |
| (Viamonte Senior Living 1, Inc.), Ser. A, 4.00%, 7/1/43 | AA− | | 1,000,000 | 920,195 |
| (Viamonte Senior Living 1, Inc.), Ser. A, 4.00%, 7/1/37 | AA− | | 620,000 | 609,496 |
| (Front Porch Cmnty. & Svcs. Oblig. Group), Ser. A, 3.00%, 4/1/51 | A− | | 9,000,000 | 5,796,413 |
| CA Statewide Cmnty. Dev. Auth. Special Tax, (Cmnty. Fac. Dist. No. 2020-02) | | | | |
| 4.00%, 9/1/51 | BB+/P | | 1,170,000 | 930,149 |
| 4.00%, 9/1/41 | BB+/P | | 500,000 | 432,578 |
| CA Statewide Cmnty. Dev. Auth. 144A Rev. Bonds | | | | |
| (Lancer Edl. Student Hsg.), Ser. A, 5.00%, 6/1/51 | BB/P | | 1,440,000 | 1,248,391 |
| (CA Baptist U.), Ser. A, 5.00%, 11/1/41 | BB/P | | 1,535,000 | 1,409,796 |
| (Lancer Edl. Student Hsg.), Ser. A, 5.00%, 6/1/39 | BB/P | | 475,000 | 439,430 |
| |
30 California Tax Exempt Income Fund |
| | | | |
| MUNICIPAL BONDS AND NOTES (99.2%)* cont. | Rating** | | Principal amount | Value |
| California cont. |
| CA Statewide Cmnty. Dev. Auth. 144A Rev. Bonds | | | | |
| (Lancer Edl. Student Hsg.), Ser. A, 5.00%, 6/1/34 | BB/P | | $375,000 | $356,802 |
| (CA Baptist U.), Ser. A, 5.00%, 11/1/32 | BB/P | | 720,000 | 716,857 |
| (Lancer Edl. Student Hsg.), Ser. A, 3.00%, 6/1/29 | BB/P | | 635,000 | 564,055 |
| Central CA Unified School Dist. G.O. Bonds, Ser. B, 5.25%, 8/1/52 | Aa3 | | 4,500,000 | 4,711,879 |
| Ceres, Unified School Dist. G.O. Bonds, BAM | | | | |
| zero %, 8/1/40 | AA | | 1,285,000 | 549,910 |
| zero %, 8/1/39 | AA | | 1,075,000 | 489,041 |
| zero %, 8/1/38 | AA | | 1,000,000 | 485,228 |
| zero %, 8/1/36 | AA | | 545,000 | 303,842 |
| zero %, 8/1/34 | AA | | 715,000 | 439,577 |
| zero %, 8/1/33 | AA | | 250,000 | 161,068 |
| Chino, Cmnty. Fac. Special Tax, (Dist. No. 2003-3) | | | | |
| 4.00%, 9/1/50 | BB/P | | 1,265,000 | 1,001,294 |
| 4.00%, 9/1/45 | BB/P | | 500,000 | 411,442 |
| 3.00%, 9/1/25 | BB/P | | 345,000 | 332,022 |
| 3.00%, 9/1/24 | BB/P | | 335,000 | 328,670 |
| Chino, Cmnty. Fac. Special Tax Bonds, (Dist. No. 2003-3) | | | | |
| 5.375%, 9/1/52 | BB+/P | | 2,000,000 | 1,922,843 |
| 5.375%, 9/1/47 | BB+/P | | 1,615,000 | 1,575,318 |
| 5.25%, 9/1/42 | BB+/P | | 1,585,000 | 1,550,808 |
| Chula Vista, Muni. Fin. Auth. Special Tax Bonds | | | | |
| 5.50%, 9/1/30 | AA− | | 740,000 | 741,030 |
| 5.50%, 9/1/29 | AA− | | 2,165,000 | 2,168,118 |
| CMFA Special Fin. Agcy. I 144A Rev. Bonds, (Social Bond), Ser. A-2, 4.00%, 4/1/56 | BB/P | | 3,500,000 | 2,349,946 |
| Coronado, Cmnty. Dev. Successor Agcy. Tax Alloc. Bonds, Ser. A, 5.00%, 9/1/33 | AA | | 8,595,000 | 8,784,154 |
| CSCDA Cmnty. Impt. Auth. Rev. Bonds, (Pasadena Portfolio), Ser. A-2, 3.00%, 12/1/56 | BBB−/P | | 3,350,000 | 2,079,022 |
| CSCDA Cmnty. Impt. Auth. 144A Rev. Bonds | | | | |
| (Anaheim), 4.00%, 8/1/56 | BB/P | | 3,245,000 | 2,286,544 |
| (Jefferson-Anaheim), 3.125%, 8/1/56 | BB+/P | | 2,775,000 | 1,772,376 |
| (City of Orange Portfolio), 3.00%, 3/1/57 | BBB−/P | | 8,110,000 | 5,059,927 |
| (Essential Hsg.), Ser. A-2, 3.00%, 2/1/57 | BBB−/P | | 7,800,000 | 4,818,753 |
| (Jefferson-Anaheim), 2.875%, 8/1/41 | BB+/P | | 2,200,000 | 1,778,915 |
| Dixon, Special Tax, (Cmnty. Fac. Dist. No. 2019-1 Homestead) | | | | |
| 4.00%, 9/1/45 | BB−/P | | 2,000,000 | 1,597,473 |
| 4.00%, 9/1/40 | BB−/P | | 400,000 | 342,284 |
| 4.00%, 9/1/36 | BB−/P | | 175,000 | 158,836 |
| 4.00%, 9/1/33 | BB−/P | | 425,000 | 400,874 |
| Dublin, Special Tax, (Cmnty. Fac. Dist. No. 2015-1) | | | | |
| 4.00%, 9/1/51 | BB/P | | 865,000 | 667,167 |
| 4.00%, 9/1/45 | BB/P | | 850,000 | 687,223 |
| East Bay Muni. Util. Dist. Waste Wtr. Syst. Rev. Bonds, (Green Bonds), Ser. A, 5.00%, 6/1/45 | AAA | | 1,130,000 | 1,198,738 |
| |
California Tax Exempt Income Fund 31 |
| | | | |
| MUNICIPAL BONDS AND NOTES (99.2%)* cont. | Rating** | | Principal amount | Value |
| California cont. |
| Fairfield Cmnty., Fac. Special Tax, (Dist. No. 2016-1), 4.00%, 9/1/52 | BB/P | | $2,500,000 | $1,907,804 |
| Federal Home Loan Mortgage Corporation Rev. Bonds, Ser. M-054, Class A, 2.35%, 12/15/35 | AA+ | | 965,000 | 736,759 |
| Fillmore, Cmnty. Fac. Special Tax Bonds, (Dist. No. 5), 5.00%, 9/1/43 | BB/P | | 1,095,000 | 1,043,165 |
| Folsom Cordova, Unified School Dist. G.O. Bonds, (School Fac. Impt. Dist. No. 1), Ser. A, NATL, zero %, 10/1/25 | Aa2 | | 1,505,000 | 1,391,745 |
| Fontana, Special Tax, (Cmnty. Fac. Dist. No. 85) | | | | |
| 4.00%, 9/1/50 | BB+/P | | 900,000 | 699,766 |
| 4.00%, 9/1/45 | BB+/P | | 750,000 | 607,194 |
| 4.00%, 9/1/40 | BB+/P | | 625,000 | 534,819 |
| 4.00%, 9/1/36 | BB+/P | | 550,000 | 500,178 |
| 4.00%, 9/1/32 | BB+/P | | 240,000 | 227,530 |
| Foothill-Eastern Trans. Corridor Agcy. Rev. Bonds, (Senior Lien), Ser. A, 4.00%, 1/15/46 | A | | 3,250,000 | 2,909,225 |
| Foothill/Eastern Corridor Agcy. Rev. Bonds, Ser. A, 6.00%, 1/15/53 (Prerefunded 1/15/24) | A | | 8,000,000 | 8,048,885 |
| Fremont, Union High School Dist. G.O. Bonds | | | | |
| 5.00%, 8/1/35 ### | Aaa | | 2,000,000 | 2,208,273 |
| 5.00%, 8/1/34 ### | Aaa | | 1,500,000 | 1,664,793 |
| 5.00%, 8/1/33 ### | Aaa | | 1,000,000 | 1,105,522 |
| Golden State Tobacco Securitization Corp. Rev. Bonds, Ser. A-1, 5.00%, 6/1/51 | BBB+ | | 5,000,000 | 5,080,052 |
| Hartnell Cmnty. College Dist. G.O. Bonds, Ser. A | | | | |
| zero %, 8/1/37 | Aa2 | | 3,500,000 | 1,798,643 |
| zero %, 8/1/36 | Aa2 | | 4,750,000 | 2,605,357 |
| zero %, 8/1/35 | Aa2 | | 1,000,000 | 583,266 |
| Hastings Campus HFA Rev. Bonds, (U. of CA Hastings College of the Law), Ser. A, 5.00%, 7/1/61 | BB−/P | | 3,500,000 | 2,788,581 |
| Hsg. Fin. Agcy. Rev. Bonds, Ser. A, 4.25%, 1/15/35 | BBB+ | | 2,813,255 | 2,640,292 |
| Imperial, Cmnty. College Dist. G.O. Bonds, Ser. A, AGM | | | | |
| 5.25%, 8/1/53 | AA | | 1,500,000 | 1,582,791 |
| 5.00%, 8/1/48 | AA | | 1,500,000 | 1,552,580 |
| Indio, Pub. Fin. Auth. Rev. Bonds, Ser. A, BAM, 5.25%, 11/1/42 | AA | | 4,000,000 | 4,231,828 |
| Irvine, Cmnty. Fac. Dist. No. 13-3 Special Tax Bonds | | | | |
| (Great Park Impt. Area No. 1), 5.00%, 9/1/39 | BBB−/P | | 1,000,000 | 1,001,638 |
| (Great Park Impt. Area No. 4), 4.00%, 9/1/41 | BB−/P | | 2,500,000 | 2,134,091 |
| Irvine, Unified School Dist. Special Tax Bonds, (Cmnty. Fac. Dist. No. 09-1) | | | | |
| Ser. A, 5.00%, 9/1/47 | BB+/P | | 190,000 | 190,114 |
| Ser. C, 5.00%, 9/1/47 | BB+/P | | 995,000 | 995,598 |
| Ser. A, 5.00%, 9/1/42 | BB+/P | | 395,000 | 397,441 |
| Ser. B, 5.00%, 9/1/42 | BB+/P | | 995,000 | 1,001,148 |
| Lake Elsinore, Pub. Fin. Auth. Local Agcy. Special Tax Bonds, (Canyon Hills Impt. Areas), Ser. A & C | | | | |
| 5.00%, 9/1/33 | BB+/P | | 1,105,000 | 1,112,353 |
| 5.00%, 9/1/31 | BB+/P | | 1,045,000 | 1,051,994 |
| |
32 California Tax Exempt Income Fund |
| | | | |
| MUNICIPAL BONDS AND NOTES (99.2%)* cont. | Rating** | | Principal amount | Value |
| California cont. |
| Liberty, Union High School Dist. G.O. Bonds, Ser. B, 3.00%, 8/1/41 | Aa2 | | $1,670,000 | $1,269,734 |
| Long Beach Marina, Rev. Bonds, 5.00%, 5/15/40 | BBB/F | | 1,000,000 | 972,193 |
| Long Beach, Arpt. Syst. Rev. Bonds | | | | |
| Ser. B, AGM, 5.00%, 6/1/40 | AA | | 940,000 | 1,009,443 |
| Ser. A, AGM, 5.00%, 6/1/39 | AA | | 500,000 | 538,960 |
| Ser. B, AGM, 5.00%, 6/1/39 | AA | | 500,000 | 538,960 |
| Long Beach, Bond Fin. Auth. Rev. Bonds, (Natural Gas Purchase), Ser. A, 5.50%, 11/15/28 | A1 | | 5,000,000 | 5,192,316 |
| Long Beach, Cmnty. College Dist. G.O. Bonds, (2008 Election), Ser. B | | | | |
| zero %, 8/1/34 | Aa2 | | 1,500,000 | 948,950 |
| zero %, 8/1/33 | Aa2 | | 625,000 | 414,858 |
| Long Beach, Fin Auth. Rev. Bonds, 5.00%, 8/1/46 | AA− | | 5,180,000 | 5,326,043 |
| Long Beach, Unified School Dist. G.O. Bonds | | | | |
| Ser. B, 3.00%, 8/1/48 | Aa2 | | 4,600,000 | 3,222,684 |
| Ser. D-1, zero %, 8/1/37 | Aa2 | | 1,000,000 | 509,753 |
| Los Angeles Cnty., Pub. Wks. Fin. Auth. Rev. Bonds, Ser. A, 5.00%, 12/1/44 | AA+ | | 1,000,000 | 1,005,379 |
| Los Angeles Ctny., Pub. Wks. Fin. Auth. Lease Rev. Bonds, Ser. D, 5.00%, 12/1/45 | AA+ | | 3,000,000 | 3,035,188 |
| Los Angeles, Dept. of Wtr. & Pwr. Rev. Bonds | | | | |
| Ser. A, 5.00%, 7/1/51 | Aa2 | | 5,000,000 | 5,180,800 |
| Ser. B, 5.00%, 7/1/51 | Aa2 | | 4,750,000 | 4,912,329 |
| Ser. B, 5.00%, 7/1/48 | Aa2 | | 1,500,000 | 1,553,553 |
| Ser. B, 5.00%, 7/1/40 | Aa2 | | 2,200,000 | 2,376,551 |
| Los Angeles, Dept. of Wtr. & Pwr. Wtr. Works Rev. Bonds, Ser. C, 5.00%, 7/1/42 | Aa2 | | 8,150,000 | 8,711,054 |
| M-S-R Energy Auth. Rev. Bonds | | | | |
| Ser. A, 6.50%, 11/1/39 | BBB+ | | 6,000,000 | 6,807,906 |
| Ser. A, 6.125%, 11/1/29 | BBB+ | | 925,000 | 964,968 |
| Ser. B, 6.125%, 11/1/29 | BBB+ | | 2,325,000 | 2,425,527 |
| Menifee, Union School Dist. Cmnty. Fac. Special Tax, (Dist. No. 2011-1) | | | | |
| 4.00%, 9/1/51 | BB+/P | | 1,815,000 | 1,399,893 |
| 4.00%, 9/1/36 | BB+/P | | 500,000 | 454,262 |
| Modesto, Elementary School Dist. G.O. Bonds, (Stanislaus Cnty., Election 2018, Measure D), Ser. C, 5.00%, 8/1/52 | Aa3 | | 5,000,000 | 5,200,488 |
| Montebello, Unified School Dist. G.O. Bonds, Ser. B, AGM | | | | |
| 5.00%, 8/1/50 | AA | | 3,000,000 | 3,062,466 |
| 5.00%, 8/1/44 | AA | | 2,000,000 | 2,057,306 |
| Moreno Valley, Unified School Dist. G.O. Bonds, (Election of 2014), Ser. D, AGM, 5.25%, 8/1/52 | AA | | 8,000,000 | 8,352,586 |
| Murrieta Valley, Unified School Dist. G.O. Bonds, AGM, zero %, 9/1/31 | Aa2 | | 2,000,000 | 1,448,141 |
| Newport Beach, Impt. Dist. No. 124 Special Assmt. Bonds, Ser. A | | | | |
| 5.00%, 9/2/43 | BBB/P | | 650,000 | 650,968 |
| 4.125%, 9/2/38 | BBB/P | | 575,000 | 529,796 |
| |
California Tax Exempt Income Fund 33 |
| | | | |
| MUNICIPAL BONDS AND NOTES (99.2%)* cont. | Rating** | | Principal amount | Value |
| California cont. |
| Newport Beach, Impt. Dist. No. 124 Special Assmt. Bonds, Ser. A | | | | |
| 4.00%, 9/2/33 | BBB/P | | $200,000 | $193,568 |
| 4.00%, 9/2/32 | BBB/P | | 250,000 | 242,854 |
| 4.00%, 9/2/31 | BBB/P | | 250,000 | 244,366 |
| North Natomas, Cmnty. Fac. Special Tax Bonds, (Dist. No. 4), Ser. E, 5.25%, 9/1/33 (Prerefunded 12/22/23) | A− | | 1,360,000 | 1,363,860 |
| Northern CA Energy Auth. Commodity Supply Mandatory Put Bonds (7/1/24), Ser. A, 4.00%, 7/1/49 | A2 | | 13,000,000 | 12,964,606 |
| Norwalk-La Mirada, Unified School Dist. G.O. Bonds, Ser. F, 5.00%, 8/1/51 | Aa3 | | 3,000,000 | 3,085,386 |
| Ontario, Special Tax, (Cmnty. Fac. Dist. No. 53) | | | | |
| 4.00%, 9/1/51 | BB+/P | | 1,170,000 | 898,354 |
| 4.00%, 9/1/42 | BB+/P | | 600,000 | 498,491 |
| 4.00%, 9/1/36 | BB+/P | | 500,000 | 453,372 |
| Ontario, Intl. Arpt. Auth. Rev. Bonds, Ser. A, AGM, 4.00%, 5/15/41 | AA | | 750,000 | 704,468 |
| Poway Unified School Dist. Cmnty. Fac. Dist. No. 15 Special Tax Bonds, BAM | | | | |
| 5.25%, 9/1/52 | AA | | 2,500,000 | 2,543,144 |
| 4.125%, 9/1/47 | AA | | 1,250,000 | 1,110,891 |
| 4.00%, 9/1/42 | AA | | 800,000 | 718,844 |
| Rancho Cordova, Cmnty. Fac. Dist. Special Tax Bonds, (Sunridge Anatolia No. 03-1), 4.00%, 9/1/27 | BBB−/P | | 425,000 | 417,287 |
| Regents of the U. of CA Med. Ctr. (The) Rev. Bonds, Ser. P, 5.00%, 5/15/40 | Aa3 | | 21,125,000 | 22,384,012 |
| Riverside Cnty., Redev. Successor Agcy. Tax Alloc. Bonds, (Hsg.), Ser. B, BAM | | | | |
| 5.00%, 10/1/41 | AA | | 1,990,000 | 2,034,188 |
| 5.00%, 10/1/37 | AA | | 1,010,000 | 1,038,618 |
| 5.00%, 10/1/26 | AA | | 500,000 | 519,649 |
| 5.00%, 10/1/24 | AA | | 445,000 | 450,129 |
| Rocklin, Special Tax, (Cmnty. Fac. Dist. No. 10) | | | | |
| 5.00%, 9/1/40 | BB+/P | | 485,000 | 484,298 |
| 5.00%, 9/1/39 | BB+/P | | 485,000 | 485,773 |
| Rocklin, Special Tax Bonds, 5.00%, 9/1/35 | BB/P | | 3,430,000 | 3,463,338 |
| Rohnert Pk., Cmnty. Dev. Agcy. Tax Alloc. Bonds, (Rohnert Redev.), NATL, zero %, 8/1/25 | A+ | | 1,340,000 | 1,241,462 |
| Romoland, School Dist. Special Tax, Ser. A | | | | |
| 4.00%, 9/1/50 | BB+/P | | 2,360,000 | 1,843,133 |
| 4.00%, 9/1/45 | BBB+/F | | 750,000 | 607,194 |
| 4.00%, 9/1/40 | BB+/P | | 555,000 | 471,044 |
| Roseville, Special Tax | | | | |
| 5.00%, 9/1/39 | BB/P | | 465,000 | 467,599 |
| (Fiddyment Ranch Cmnty. Fac. Dist. No. 5), 4.00%, 9/1/50 | BB/P | | 1,775,000 | 1,398,696 |
| (Ranch at Sierra Vista Cmnty. Fac. Dist. No. 1), 4.00%, 9/1/50 | BB−/P | | 450,000 | 350,402 |
| |
34 California Tax Exempt Income Fund |
| | | | |
| MUNICIPAL BONDS AND NOTES (99.2%)* cont. | Rating** | | Principal amount | Value |
| California cont. |
| Roseville, Special Tax | | | | |
| (Ranch at Sierra Vista Cmnty. Fac. Dist. No. 1), 4.00%, 9/1/45 | BB−/P | | $1,000,000 | $809,592 |
| (Fiddyment Ranch Cmnty. Fac. Dist. No. 5), 4.00%, 9/1/41 | BB/P | | 700,000 | 597,546 |
| Roseville, Special Tax Bonds | | | | |
| (The Ranch at Sierra Vista Cmnty. Fac. Dist. No. 1), 5.00%, 9/1/53 | BB+/P | | 1,000,000 | 912,467 |
| (The Ranch at Sierra Vista Cmnty. Fac. Dist. No. 1), 5.00%, 9/1/48 | BB+/P | | 850,000 | 785,882 |
| (The Ranch at Sierra Vista Cmnty. Fac. Dist. No. 1), 5.00%, 9/1/43 | BB+/P | | 735,000 | 701,934 |
| (Westpark Cmnty. Pub. Fac. Dist. No. 1), 5.00%, 9/1/37 | BBB−/P | | 1,250,000 | 1,255,694 |
| (Westpark Cmnty. Pub. Fac. Dist. No. 1), 5.00%, 9/1/33 | BBB−/P | | 1,000,000 | 1,011,146 |
| Sacramento, Special Tax, (Greenbriar Cmnty. Fac. Dist. No 2018-03) | | | | |
| 4.00%, 9/1/46 | BB/P | | 600,000 | 477,656 |
| 4.00%, 9/1/41 | BB/P | | 1,000,000 | 840,276 |
| Sacramento, City Unified School Dist. G.O. Bonds, Ser. G, AGM, 4.00%, 8/1/37 | AA | | 450,000 | 441,813 |
| San Bernardino Cnty., Special Tax Bonds, 5.00%, 9/1/33 | BBB−/P | | 2,500,000 | 2,513,523 |
| San Diego Cmnty. Fac. Dist. No. 3 Special Tax Bonds, 5.00%, 9/1/36 | BBB/P | | 970,000 | 970,250 |
| San Diego Cnty., COP, 5.00%, 10/1/46 | Aa1 | | 6,645,000 | 6,961,982 |
| San Diego Cnty., Special Tax Bonds, (Harmony Grove Village-Impt. Area No. 1), Ser. A | | | | |
| 4.00%, 9/1/50 | BB/P | | 875,000 | 682,350 |
| 4.00%, 9/1/45 | BB/P | | 550,000 | 447,088 |
| San Diego Cnty., Regl. Arpt. Auth. Rev. Bonds, Ser. B, 4.00%, 7/1/44 | A | | 1,000,000 | 870,130 |
| San Diego, Assn. of Govt. South Bay Expressway Toll Rev. Bonds, Ser. A, 5.00%, 7/1/42 | A | | 3,000,000 | 3,045,142 |
| San Diego, Pub. Fac. Fin. Auth. Rev. Bonds, (Cap. Impt.), Ser. A, 5.25%, 10/15/52 | AA− | | 8,000,000 | 8,443,759 |
| San Diego, Tobacco Settlement Funding Corp. Rev. Bonds, Ser. C, 4.00%, 6/1/32 | A | | 455,000 | 438,808 |
| San Diego, Unified School Dist. G.O. Bonds | | | | |
| Ser. R-2, stepped-coupon zero % (6.625%, 7/1/30), 7/1/41 †† | Aa2 | | 1,990,000 | 1,624,492 |
| Ser. K-2, zero %, 7/1/35 | Aa2 | | 1,025,000 | 602,030 |
| Ser. K-2, zero %, 7/1/32 | Aa2 | | 1,955,000 | 1,338,882 |
| San Francisco City & Cnty., Special Tax, (Cmnty. Fac. Dist. No. 2016-1), Ser. 21, 4.00%, 9/1/41 | BB−/P | | 850,000 | 718,575 |
| San Francisco, Bay Area Rapid Transit Dist. G.O. Bonds | | | | |
| (Election 2016), 3.00%, 8/1/49 | Aaa | | 6,365,000 | 4,387,457 |
| 3.00%, 8/1/38 | Aaa | | 4,280,000 | 3,441,390 |
| (Green Bonds), Ser. C-1, 3.00%, 8/1/37 | Aaa | | 3,250,000 | 2,672,196 |
| |
California Tax Exempt Income Fund 35 |
| | | | |
| MUNICIPAL BONDS AND NOTES (99.2%)* cont. | Rating** | | Principal amount | Value |
| California cont. |
| San Francisco, Bay Area Rapid Transit Dist. Sales Tax Rev. Bonds, Ser. A, 3.00%, 7/1/44 | AA+ | | $3,000,000 | $2,223,256 |
| San Francisco, City & Cnty. Arpt. Comm. Intl. Arpt. Rev. Bonds, Ser. B, 5.00%, 5/1/52 | A1 | | 5,285,000 | 5,499,042 |
| San Francisco, City & Cnty. Arpt. Comm. Intl. Arpt. VRDN, Ser. B, 2.65%, 5/1/58 | VMIG 1 | | 5,000,000 | 5,000,000 |
| San Francisco, City & Cnty. Pub. Util. Comm. Rev. Bonds, Ser. A, 5.00%, 11/1/53 | AA | | 7,000,000 | 7,233,260 |
| San Francisco, City & Cnty. Redev. Agcy. Cmnty. Successor Special Tax Bonds, (No. 6 Mission Bay South Pub. Impts.), Ser. A, 5.00%, 8/1/31 | BBB/P | | 1,140,000 | 1,148,692 |
| San Francisco, City & Cnty. Redev. Agcy. Cmnty. Successor Tax Alloc. Bonds, (Mission Bay South Redev.), Ser. A, 5.00%, 8/1/43 | A− | | 1,750,000 | 1,758,961 |
| San Francisco, City & Cnty., Infrastructure & Revitalization 144A Tax Alloc. Bonds, (Fin. Dist. No. 1 Fac.), Ser. A, 5.00%, 9/1/52 | BBB/P | | 1,300,000 | 1,127,763 |
| San Francisco, Pub. Fac. Fin. Auth. Rev. Bonds | | | | |
| 5.25%, 6/1/46 | AA+ | | 1,250,000 | 1,308,628 |
| 5.00%, 6/1/40 | AA+ | | 600,000 | 626,129 |
| San Joaquin, Regl. Rail Comm. COP | | | | |
| 4.00%, 5/1/40 | A2 | | 390,000 | 344,224 |
| 4.00%, 5/1/38 | A2 | | 460,000 | 412,892 |
| 4.00%, 5/1/37 | A2 | | 490,000 | 449,067 |
| 4.00%, 5/1/36 | A2 | | 350,000 | 328,957 |
| 4.00%, 5/1/35 | A2 | | 330,000 | 316,832 |
| San Luis Obispo Cnty., Fin. Auth. Rev. Bonds, Ser. A, 5.50%, 11/15/47 | AA+ | | 1,885,000 | 1,977,935 |
| Santa Maria, G.O. Bonds, (Joint Union High School Dist. Election 2016) | | | | |
| 3.00%, 8/1/42 | Aa2 | | 540,000 | 403,464 |
| 3.00%, 8/1/39 | Aa2 | | 1,385,000 | 1,095,276 |
| 3.00%, 8/1/37 | Aa2 | | 355,000 | 292,607 |
| 3.00%, 8/1/36 | Aa2 | | 250,000 | 211,522 |
| School Fin. Fac. Auth. 144A Rev. Bonds, (Kipp LA Projects), Ser. A, 5.00%, 7/1/45 | BBB | | 1,500,000 | 1,429,830 |
| South Lake Tahoe, Joint Pwrs. Fin. Auth. Rev. Bonds, Ser. A | | | | |
| 5.25%, 10/1/53 | AA | | 4,000,000 | 4,230,588 |
| 5.25%, 10/1/48 | AA | | 3,500,000 | 3,720,196 |
| Southern CA Pub. Pwr. Auth. Rev. Bonds | | | | |
| (Los Angeles, Dept. of Wtr. & Pwr.), Ser. 1-A, 5.25%, 7/1/53 | Aa2 | | 2,500,000 | 2,665,426 |
| (Natural Gas No. 1), Ser. A, 5.25%, 11/1/24 | A2 | | 2,850,000 | 2,866,427 |
| Stockton, Unified School Dist. COP | | | | |
| 5.00%, 2/1/36 | A− | | 1,000,000 | 1,039,336 |
| 5.00%, 2/1/35 | A− | | 2,410,000 | 2,513,512 |
| Sweetwater, G.O. Bonds, (Sweetwater Union High School Dist.), Ser. A1, 5.00%, 8/1/52 | A1 | | 6,500,000 | 6,650,935 |
| Tobacco Securitization Auth. of Southern CA Rev. Bonds, Ser. B-1, Class 2, 5.00%, 6/1/48 | BBB− | | 11,500,000 | 11,476,579 |
| |
36 California Tax Exempt Income Fund |
| | | | |
| MUNICIPAL BONDS AND NOTES (99.2%)* cont. | Rating** | | Principal amount | Value |
| California cont. |
| Tustin Cmnty., Fac. Dist. Special Tax Bonds, (No. 06-1 Legacy Columbus Villages), Ser. A, 5.00%, 9/1/37 | A− | | $2,100,000 | $2,125,633 |
| U. of CA Rev. Bonds | | | | |
| Ser. S, 5.00%, 5/15/38 T | Aa3 | | 10,650,000 | 11,518,752 |
| Ser. AZ, 5.25%, 5/15/58 | Aa2 | | 9,110,000 | 9,435,084 |
| Vernon, Elec. Syst. Rev. Bonds, Ser. A | | | | |
| 5.00%, 8/1/40 | Baa1 | | 740,000 | 736,418 |
| 5.00%, 8/1/39 | Baa1 | | 425,000 | 424,089 |
| 5.00%, 8/1/35 | Baa1 | | 1,440,000 | 1,482,074 |
| 5.00%, 8/1/34 | Baa1 | | 1,060,000 | 1,097,697 |
| 5.00%, 8/1/33 | Baa1 | | 960,000 | 992,356 |
| 5.00%, 8/1/32 | Baa1 | | 1,000,000 | 1,034,418 |
| 5.00%, 8/1/31 | Baa1 | | 770,000 | 796,139 |
| Western Placer Waste Mgt. Auth. Rev. Bonds, (Material Recvy. Fac.), Ser. A, 5.00%, 6/1/40 | AA | | 1,200,000 | 1,293,275 |
| Yucaipa Special Tax Bonds, (Cmnty. Fac. Dist. No. 98-1 Chapman Heights), 5.375%, 9/1/30 | A+ | | 2,350,000 | 2,356,222 |
| Los Angeles, Dept. of Arpt. Rev. Bonds | | | | |
| (Los Angeles Intl. Arpt.), Ser. G, 5.00%, 5/15/47 T | Aa2 | | 9,000,000 | 9,034,288 |
| (Los Angeles Intl. Arpt.), Ser. A, 5.00%, 5/15/44 T | Aa3 | | 10,000,000 | 10,002,005 |
| | | | 728,506,468 |
| Guam (0.3%) |
| Territory of GU, Govt. G.O. Bonds, 5.00%, 11/15/31 | Ba1 | | 785,000 | 775,208 |
| Territory of GU, Port Auth. Rev. Bonds, Ser. A, 5.00%, 7/1/48 | A | | 1,500,000 | 1,431,719 |
| | | | 2,206,927 |
| Illinois (0.8%) |
| IL State G.O. Bonds | | | | |
| 5.00%, 1/1/41 | A3 | | 1,770,000 | 1,696,853 |
| 5.00%, 11/1/38 | A3 | | 4,200,000 | 4,116,924 |
| | | | 5,813,777 |
| Puerto Rico (0.3%) |
| Cmnwlth. of PR, G.O. Bonds, Ser. A-1, 4.00%, 7/1/37 | BB/P | | 2,750,000 | 2,315,443 |
| | | | 2,315,443 |
| Total municipal bonds and notes (cost $826,128,757) | $748,432,026 |
|
| | | |
| SHORT-TERM INVESTMENTS (2.1%)* | Principal amount/
shares | Value |
| Putnam Short Term Investment Fund Class P 5.57% L | Shares | 14,977,564 | $14,977,564 |
| U.S. Treasury Bills 5.405%, 10/26/23 # | | $614,000 | 611,837 |
| Total short-term investments (cost $15,589,346) | $15,589,401 |
|
| |
| TOTAL INVESTMENTS |
| Total investments (cost $841,718,103) | $764,021,427 |
|
| |
California Tax Exempt Income Fund 37 |
| | | |
| Notes to the fund’s portfolio |
| Unless noted otherwise, the notes to the fund’s portfolio are for the close of the fund’s reporting period, which ran from October 1, 2022 through September 30, 2023 (the reporting period). Within the following notes to the portfolio, references to “Putnam Management” represent Putnam Investment Management, LLC, the fund’s manager, an indirect wholly-owned subsidiary of Putnam Investments, LLC and references to “ASC 820” represent Accounting Standards Codification 820 Fair Value Measurements and Disclosures. |
| * | Percentages indicated are based on net assets of $754,561,868. |
| ** | The Moody’s, Standard & Poor’s or Fitch ratings indicated are believed to be the most recent ratings available at the close of the reporting period for the securities listed. Ratings are generally ascribed to securities at the time of issuance. While the agencies may from time to time revise such ratings, they undertake no obligation to do so, and the ratings do not necessarily represent what the agencies would ascribe to these securities at the close of the reporting period. Securities rated by Fitch are indicated by “/F.” Securities rated by Putnam are indicated by “/P.” The Putnam rating categories are comparable to the Standard & Poor’s classifications. If a security is insured, it will usually be rated by the ratings organizations based on the financial strength of the insurer. Ratings are not covered by the Report of Independent Registered Public Accounting Firm. For further details regarding security ratings, please see the Statement of Additional Information. |
| †† | The interest rate and date shown parenthetically represent the new interest rate to be paid and the date the fund will begin accruing interest at this rate. |
| # | This security, in part or in entirety, was pledged and segregated with the broker to cover margin requirements for futures contracts at the close of the reporting period. Collateral at period end totaled $223,104 and is included in Investments in securities on the Statement of assets and liabilities (Notes 1 and 8). |
| L | Affiliated company (Note 5). The rate quoted in the security description is the annualized 7-day yield of the fund at the close of the reporting period. |
| T | Underlying security in a tender option bond transaction. This security has been segregated as collateral for financing transactions. |
| ### | When-issued security (Note 1). |
| Unless otherwise noted, the rates quoted in Short-term investments security descriptions represent the weighted average yield to maturity. |
| 144A after the name of an issuer represents securities exempt from registration under Rule 144A of the Securities Act of 1933, as amended. These securities may be resold in transactions exempt from registration, normally to qualified institutional buyers. |
| On Mandatory Put Bonds, the rates shown are the current interest rates at the close of the reporting period and the dates shown represent the next mandatory put dates. Rates are set by remarketing agents and may take into consideration market supply and demand, credit quality and the current SIFMA Municipal Swap Index, 1 Month US LIBOR or 3 Month US LIBOR rates, which were 3.98%, 5.43% and 5.66%, respectively, as of the close of the reporting period. |
| The dates shown parenthetically on prerefunded bonds represent the next prerefunding dates. |
| The dates shown on debt obligations are the original maturity dates. |
| The fund had the following sector concentrations greater than 10% at the close of the reporting period (as a percentage of net assets): |
| Education | 18.8% |
| Local debt | 16.0 |
| Health care | 12.1 |
| Land | 10.4 |
|
| |
38 California Tax Exempt Income Fund |
| | | | | |
| FUTURES CONTRACTS OUTSTANDING at 9/30/23 |
| Number of
contracts | Notional
amount | Value | Expiration
date | Unrealized
appreciation/
(depreciation) |
| U.S. Treasury Note Ultra 10 yr (Short) | 70 | $7,809,375 | $7,809,375 | Dec-23 | $229,632 |
| Unrealized appreciation | | | | 229,632 |
| Unrealized (depreciation) | | | | — |
| Total | $229,632 |
|
ASC 820 establishes a three-level hierarchy for disclosure of fair value measurements. The valuation hierarchy is based upon the transparency of inputs to the valuation of the fund’s investments. The three levels are defined as follows:
Level 1: Valuations based on quoted prices for identical securities in active markets.
Level 2: Valuations based on quoted prices in markets that are not active or for which all significant inputs are observable, either directly or indirectly.
Level 3: Valuations based on inputs that are unobservable and significant to the fair value measurement.
The following is a summary of the inputs used to value the fund’s net assets as of the close of the reporting period:
|
| | | |
| | Valuation inputs |
| Investments in securities: | Level 1 | Level 2 | Level 3 |
| Municipal bonds and notes | $— | $748,432,026 | $— |
| Short-term investments | — | 15,589,401 | — |
| Totals by level | $— | $764,021,427 | $— |
|
| | | |
| | Valuation inputs |
| Other financial instruments: | Level 1 | Level 2 | Level 3 |
| Futures contracts | $229,632 | $— | $— |
| Totals by level | $229,632 | $— | $— |
The accompanying notes are an integral part of these financial statements.
| |
California Tax Exempt Income Fund 39 |
Statement of assets and liabilities 9/30/23
| |
| ASSETS | |
| Investment in securities, at value (Notes 1 and 8): | |
| Unaffiliated issuers (identified cost $826,740,539) | $749,043,863 |
| Affiliated issuers (identified cost $14,977,564) (Note 5) | 14,977,564 |
| Interest and other receivables | 9,297,467 |
| Receivable for shares of the fund sold | 721,772 |
| Receivable for investments sold | 19,166,014 |
| Prepaid assets | 31,271 |
| Total assets | 793,237,951 |
| |
| LIABILITIES | |
| Payable to custodian | 8,431 |
| Payable for investments purchased | 10,604,916 |
| Payable for purchases of delayed delivery securities (Note 1) | 5,250,400 |
| Payable for shares of the fund repurchased | 1,012,874 |
| Payable for compensation of Manager (Note 2) | 272,814 |
| Payable for custodian fees (Note 2) | 4,369 |
| Payable for investor servicing fees (Note 2) | 104,003 |
| Payable for Trustee compensation and expenses (Note 2) | 314,641 |
| Payable for administrative services (Note 2) | 2,725 |
| Payable for distribution fees (Note 2) | 437,836 |
| Payable for floating rate notes issued (Note 1) | 20,270,001 |
| Payable for variation margin on futures contracts (Note 1) | 16,413 |
| Distributions payable to shareholders | 271,049 |
| Other accrued expenses | 105,611 |
| Total liabilities | 38,676,083 |
| | |
| Net assets | $754,561,868 |
| |
| REPRESENTED BY | |
| Paid-in capital (Unlimited shares authorized) (Notes 1 and 4) | $848,507,529 |
| Total distributable earnings (Note 1) | (93,945,661) |
| Total — Representing net assets applicable to capital shares outstanding | $754,561,868 |
| |
| COMPUTATION OF NET ASSET VALUE AND OFFERING PRICE | |
| Net asset value and redemption price per class A share | |
| ($653,392,276 divided by 95,242,980 shares) | $6.86 |
| Offering price per class A share (100/96.00 of $6.86)* | $7.15 |
| Net asset value and offering price per class B share ($149,975 divided by 21,878 shares)** | $6.86 |
| Net asset value and offering price per class C share ($8,388,219 divided by 1,214,383 shares)** | $6.91 |
| Net asset value, offering price and redemption price per class R6 share | |
| ($2,498,127 divided by 362,801 shares) | $6.89 |
| Net asset value, offering price and redemption price per class Y share | |
| ($90,133,271 divided by 13,097,400 shares) | $6.88 |
*On single retail sales of less than $50,000. On sales of $50,000 or more the offering price is reduced.
**Redemption price per share is equal to net asset value less any applicable contingent deferred sales charge.
The accompanying notes are an integral part of these financial statements.
|
| 40 California Tax Exempt Income Fund |
Statement of operations Year ended 9/30/23
| |
| INVESTMENT INCOME | |
| Interest (including interest income of $443,303 from investments in affiliated issuers) (Note 5) | $31,420,621 |
| Total investment income | 31,420,621 |
| |
| EXPENSES | |
| Compensation of Manager (Note 2) | 3,497,931 |
| Investor servicing fees (Note 2) | 438,505 |
| Custodian fees (Note 2) | 18,019 |
| Trustee compensation and expenses (Note 2) | 35,991 |
| Distribution fees (Note 2) | 1,878,392 |
| Administrative services (Note 2) | 26,463 |
| Interest and fee expense (Note 2) | 870,082 |
| Other | 337,881 |
| Total expenses | 7,103,264 |
| Expense reduction (Note 2) | (14,217) |
| Net expenses | 7,089,047 |
| | |
| Net investment income | 24,331,574 |
| |
| REALIZED AND UNREALIZED GAIN (LOSS) | |
| Net realized gain (loss) on: | |
| Securities from unaffiliated issuers (Notes 1 and 3) | (12,375,946) |
| Futures contracts (Note 1) | 1,030,723 |
| Swap contracts (Note 1) | 76,500 |
| Total net realized loss | (11,268,723) |
| Change in net unrealized appreciation (depreciation) on: | |
| Securities from unaffiliated issuers and TBA sale commitments | 14,672,386 |
| Futures contracts | 229,632 |
| Swap contracts | 359,295 |
| Total change in net unrealized appreciation | 15,261,313 |
| | |
| Net gain on investments | 3,992,590 |
| |
| Net increase in net assets resulting from operations | $28,324,164 |
The accompanying notes are an integral part of these financial statements.
|
| California Tax Exempt Income Fund 41 |
Statement of changes in net assets
| | |
| DECREASE IN NET ASSETS | Year ended 9/30/23 | Year ended 9/30/22 |
| Operations | | |
| Net investment income | $24,331,574 | $23,422,975 |
| Net realized loss on investments | (11,268,723) | (8,998,767) |
| Change in net unrealized appreciation (depreciation) | | |
| of investments | 15,261,313 | (156,862,027) |
| Net increase (decrease) in net assets resulting | | |
| from operations | 28,324,164 | (142,437,819) |
| Distributions to shareholders (Note 1): | | |
| From ordinary income | | |
| Taxable net investment income | | |
| Class A | (80,627) | (122,570) |
| Class B | (23) | (48) |
| Class C | (1,181) | (2,201) |
| Class R6 | (325) | (190) |
| Class Y | (10,391) | (23,664) |
| Net realized short-term gain on investments | | |
| Class A | — | (3,733,143) |
| Class B | — | (1,448) |
| Class C | — | (66,663) |
| Class R6 | — | (5,793) |
| Class Y | — | (719,960) |
| From tax-exempt net investment income | | |
| Class A | (20,843,605) | (19,809,029) |
| Class B | (4,443) | (5,377) |
| Class C | (217,983) | (222,233) |
| Class R6 | (85,782) | (39,436) |
| Class Y | (2,806,365) | (3,343,678) |
| From capital gain on investments | | |
| Net realized long-term gain on investments | | |
| Class A | — | (13,323,465) |
| Class B | — | (5,168) |
| Class C | — | (237,941) |
| Class R6 | — | (20,675) |
| Class Y | — | (2,569,565) |
| Decrease from capital share transactions (Note 4) | (64,725,881) | (153,180,842) |
| Total decrease in net assets | (60,452,442) | (339,870,908) |
| |
| NET ASSETS | | |
| Beginning of year | 815,014,310 | 1,154,885,218 |
| End of year | $754,561,868 | $815,014,310 |
The accompanying notes are an integral part of these financial statements.
|
| 42 California Tax Exempt Income Fund |
|
| This page left blank intentionally. |
|
| California Tax Exempt Income Fund 43 |
Financial highlights
(For a common share outstanding throughout the period)
| | | | | | | | | | | | | |
| | INVESTMENT OPERATIONS | LESS DISTRIBUTIONS | RATIOS AND SUPPLEMENTAL DATA |
| | | | | | | | | | | | | Ratio of net | |
| | Net asset | | Net realized | | | | | | | | Ratio | investment | |
| | value, | | and unrealized | Total from | From net | From | | Net asset | Total return | Net assets, | of expenses | income (loss) | Portfolio |
| | beginning | Net investment | gain (loss) | investment | investment | net realized gain | Total | value, end | at net asset | end of period | to average | to average | turnover |
| Period ended | of period | income (loss) | on investments | operations | income | on investments | distributions | of period | value (%)a | (in thousands) | net assets (%)b | net assets (%) | (%) |
| Class A | | | | | | | | | | | | | |
| September 30, 2023 | $6.84 | .22 | .01 | .23 | (.21) | — | (.21) | $6.86 | 3.29 | $653,392 | .89c | 2.98 | 25 |
| September 30, 2022 | 8.29 | .19 | (1.31) | (1.12) | (.18) | (.15) | (.33) | 6.84 | (13.92) | 722,335 | .80c | 2.33 | 27 |
| September 30, 2021 | 8.28 | .18 | .12 | .30 | (.18) | (.11) | (.29) | 8.29 | 3.63 | 956,034 | .76c | 2.11 | 29 |
| September 30, 2020 | 8.33 | .19 | .09 | .28 | (.20) | (.13) | (.33) | 8.28 | 3.45 | 980,931 | .75c | 2.39 | 41 |
| September 30, 2019 | 7.95 | .23 | .46 | .69 | (.23) | (.08) | (.31) | 8.33 | 8.85 | 1,016,247 | .72 | 2.78 | 41 |
| Class B | | | | | | | | | | | | | |
| September 30, 2023 | $6.84 | .17 | .02 | .19 | (.17) | — | (.17) | $6.86 | 2.67 | $150 | 1.49c | 2.38 | 25 |
| September 30, 2022 | 8.28 | .14 | (1.30) | (1.16) | (.13) | (.15) | (.28) | 6.84 | (14.35) | 207 | 1.40c | 1.72 | 27 |
| September 30, 2021 | 8.27 | .13 | .12 | .25 | (.13) | (.11) | (.24) | 8.28 | 3.01 | 426 | 1.36c | 1.53 | 29 |
| September 30, 2020 | 8.32 | .14 | .08 | .22 | (.14) | (.13) | (.27) | 8.27 | 2.80 | 888 | 1.38c | 1.78 | 41 |
| September 30, 2019 | 7.94 | .17 | .47 | .64 | (.18) | (.08) | (.26) | 8.32 | 8.17 | 1,888 | 1.36 | 2.15 | 41 |
| Class C | | | | | | | | | | | | | |
| September 30, 2023 | $6.89 | .16 | .02 | .18 | (.16) | — | (.16) | $6.91 | 2.52 | $8,388 | 1.64c | 2.23 | 25 |
| September 30, 2022 | 8.35 | .13 | (1.32) | (1.19) | (.12) | (.15) | (.27) | 6.89 | (14.58) | 10,534 | 1.55c | 1.57 | 27 |
| September 30, 2021 | 8.33 | .12 | .13 | .25 | (.12) | (.11) | (.23) | 8.35 | 2.97 | 17,822 | 1.51c | 1.38 | 29 |
| September 30, 2020 | 8.38 | .13 | .08 | .21 | (.13) | (.13) | (.26) | 8.33 | 2.62 | 26,718 | 1.53c | 1.62 | 41 |
| September 30, 2019 | 8.00 | .16 | .47 | .63 | (.17) | (.08) | (.25) | 8.38 | 7.95 | 30,969 | 1.51 | 1.99 | 41 |
| Class R6 | | | | | | | | | | | | | |
| September 30, 2023 | $6.87 | .24 | .01 | .25 | (.23) | — | (.23) | $6.89 | 3.55 | $2,498 | .64c | 3.24 | 25 |
| September 30, 2022 | 8.32 | .21 | (1.31) | (1.10) | (.20) | (.15) | (.35) | 6.87 | (13.65) | 2,364 | .55c | 2.62 | 27 |
| September 30, 2021 | 8.31 | .20 | .12 | .32 | (.20) | (.11) | (.31) | 8.32 | 3.89 | 1,484 | .52c | 2.34 | 29 |
| September 30, 2020 | 8.36 | .21 | .08 | .29 | (.21) | (.13) | (.34) | 8.31 | 3.68 | 661 | .53c | 2.63 | 41 |
| September 30, 2019 | 7.97 | .24 | .48 | .72 | (.25) | (.08) | (.33) | 8.36 | 9.15 | 2,142 | .51 | 2.99 | 41 |
| Class Y | | | | | | | | | | | | | |
| September 30, 2023 | $6.87 | .23 | .01 | .24 | (.23) | — | (.23) | $6.88 | 3.40 | $90,133 | .64c | 3.23 | 25 |
| September 30, 2022 | 8.32 | .21 | (1.31) | (1.10) | (.20) | (.15) | (.35) | 6.87 | (13.64) | 79,574 | .55c | 2.53 | 27 |
| September 30, 2021 | 8.30 | .20 | .13 | .33 | (.20) | (.11) | (.31) | 8.32 | 4.01 | 179,118 | .51c | 2.37 | 29 |
| September 30, 2020 | 8.35 | .21 | .08 | .29 | (.21) | (.13) | (.34) | 8.30 | 3.67 | 168,885 | .53c | 2.60 | 41 |
| September 30, 2019 | 7.97 | .24 | .47 | .71 | (.25) | (.08) | (.33) | 8.35 | 9.06 | 109,280 | .51 | 2.98 | 41 |
a Total return assumes dividend reinvestment and does not reflect the effect of sales charges.
b Includes amounts paid through expense offset arrangements, if any (Note 2). Also excludes acquired fund fees, if any.
c Includes interest and fees expense associated with borrowings which amounted to the following:
| | | |
| | Percentage of average net assets | | |
| September 30, 2023 | 0.11% | | |
| September 30, 2022 | 0.03 | | |
| September 30, 2021 | 0.01 | | |
| September 30, 2020 | 0.01 | | |
The accompanying notes are an integral part of these financial statements.
| |
| 44 California Tax Exempt Income Fund | California Tax Exempt Income Fund 45 |
Notes to financial statements 09/30/23
Unless otherwise noted, the “reporting period” represents the period from October 1, 2022 through September 30, 2023. The following table defines commonly used references within the Notes to financial statements:
| |
| References to | Represent |
| Putnam Management | Putnam Investment Management, LLC, the fund’s manager, an indirect wholly-owned |
| | subsidiary of Putnam Investments, LLC |
| State Street | State Street Bank and Trust Company |
| JPMorgan | JPMorgan Chase Bank, N.A. |
| the SEC | the Securities and Exchange Commission |
| OTC | over-the-counter |
| PAC | The Putnam Advisory Company, LLC, an affiliate of Putnam Management |
| PIL | Putnam Investments Limited, an affiliate of Putnam Management |
Putnam California Tax Exempt Income Fund (the fund) is a Massachusetts business trust, which is registered under the Investment Company Act of 1940, as amended, as a diversified open-end management investment company. The goal of the fund is to seek as high a level of current income, exempt from federal income tax and California personal income tax as Putnam Management believes to be consistent with preservation of capital. The fund invests mainly in bonds that pay interest that is exempt from federal income tax and California personal income tax (but that may be subject to federal and/or California alternative minimum tax (AMT)), are investment-grade in quality, and have intermediate- to long-term maturities (i.e., three years or longer). Under normal circumstances, the fund invests so that at least 90% of the fund’s income distributions are exempt from federal income tax and California personal income tax, except during times of adverse market conditions, when more than 10% of the fund’s income distributions could be subject to these taxes. Such tax-exempt investments in which the fund invests are issued by or for states, territories or possessions of the United States or by their political subdivisions, agencies, authorities or other government entities, and the income from these investments is exempt from both federal and California personal income tax. This investment policy cannot be changed without the approval of the fund’s shareholders. Putnam Management may consider, among other factors, credit, interest rate and prepayment risks, as well as general market conditions, when deciding whether to buy or sell investments.
The fund offers the following share classes. The expenses for each class of shares may differ based on the distribution and investor servicing fees of each class, which are identified in Note 2.
| | | |
| Share class | Sales charge | Contingent deferred sales charge | Conversion feature |
| | | 1.00% on certain redemptions of shares | |
| Class A | Up to 4.00% | bought with no initial sales charge | None |
| | | | Converts to class A shares |
| Class B* | None | 5.00% phased out over six years | after 8 years |
| | | | Converts to class A shares |
| Class C | None | 1.00% eliminated after one year | after 8 years |
| Class R6† | None | None | None |
| Class Y† | None | None | None |
* Purchases of class B shares are closed to new and existing investors except by exchange from class B shares of another Putnam fund or through dividend and/or capital gains reinvestment.
† Not available to all investors.
In the normal course of business, the fund enters into contracts that may include agreements to indemnify another party under given circumstances. The fund’s maximum exposure under these arrangements is unknown as this would involve future claims that may be, but have not yet been, made against the fund. However, the fund’s management team expects the risk of material loss to be remote.
|
| 46 California Tax Exempt Income Fund |
The fund has entered into contractual arrangements with an investment adviser, administrator, distributor, shareholder servicing agent and custodian, who each provide services to the fund. Unless expressly stated otherwise, shareholders are not parties to, or intended beneficiaries of these contractual arrangements, and these contractual arrangements are not intended to create any shareholder right to enforce them against the service providers or to seek any remedy under them against the service providers, either directly or on behalf of the fund.
Under the fund’s Amended and Restated Agreement and Declaration of Trust, any claims asserted by a shareholder against or on behalf of the fund, including claims against Trustees and Officers, must be brought in state and federal courts located within the Commonwealth of Massachusetts.
Note 1: Significant accounting policies
The following is a summary of significant accounting policies consistently followed by the fund in the preparation of its financial statements. The preparation of financial statements is in conformity with accounting principles generally accepted in the United States of America and requires management to make estimates and assumptions that affect the reported amounts of assets and liabilities in the financial statements and the reported amounts of increases and decreases in net assets from operations. Actual results could differ from those estimates. Subsequent events after the Statement of assets and liabilities date through the date that the financial statements were issued have been evaluated in the preparation of the financial statements.
Investment income, realized and unrealized gains and losses and expenses of the fund are borne pro-rata based on the relative net assets of each class to the total net assets of the fund, except that each class bears expenses unique to that class (including the distribution fees applicable to such classes). Each class votes as a class only with respect to its own distribution plan or other matters on which a class vote is required by law or determined by the Trustees. If the fund were liquidated, shares of each class would receive their pro-rata share of the net assets of the fund. In addition, the Trustees declare separate dividends on each class of shares.
Security valuation Portfolio securities and other investments are valued using policies and procedures adopted by the Board of Trustees. The Trustees have formed a Pricing Committee to oversee the implementation of these procedures and have delegated responsibility for valuing the fund’s assets in accordance with these procedures to Putnam Management. Putnam Management has established an internal Valuation Committee that is responsible for making fair value determinations, evaluating the effectiveness of the pricing policies of the fund and reporting to the Pricing Committee.
Tax-exempt bonds and notes are generally valued on the basis of valuations provided by an independent pricing service approved by the Trustees. Such services use information with respect to transactions in bonds, quotations from bond dealers, market transactions in comparable securities and various relationships between securities in determining value. These securities will generally be categorized as Level 2.
Market quotations are not considered to be readily available for certain debt obligations (including short-term investments with remaining maturities of 60 days or less) and other investments; such investments are valued on the basis of valuations furnished by an independent pricing service approved by the Trustees or dealers selected by Putnam Management. Such services or dealers determine valuations for normal institutional-size trading units of such securities using methods based on market transactions for comparable securities and various relationships, generally recognized by institutional traders, between securities (which consider such factors as security prices, yields, maturities and ratings). These securities will generally be categorized as Level 2. Securities quoted in foreign currencies, if any, are translated into U.S. dollars at the current exchange rate.
Investments in open-end investment companies (excluding exchange-traded funds), if any, which can be classified as Level 1 or Level 2 securities, are valued based on their net asset value. The net asset value of such investment companies equals the total value of their assets less their liabilities and divided by the number of their outstanding shares.
To the extent a pricing service or dealer is unable to value a security or provides a valuation that Putnam Management does not believe accurately reflects the security’s fair value, the security will be valued at fair value by Putnam Management, which has been designated as valuation designee pursuant to Rule 2a–5 under the Investment Company Act of 1940, in accordance with policies and procedures approved by the Trustees. Certain investments, including certain restricted and illiquid securities and derivatives, are also valued at fair value following procedures approved by the Trustees. These valuations consider such factors as significant market or specific security events such as interest rate or credit quality changes, various relationships with other securities, discount rates, U.S. Treasury, U.S. swap and credit yields, index levels, convexity exposures, recovery rates, sales and other multiples and resale restrictions. These securities are classified as Level 2 or as Level 3 depending on the priority of the significant inputs.
|
| California Tax Exempt Income Fund 47 |
To assess the continuing appropriateness of fair valuations, the Valuation Committee reviews and affirms the reasonableness of such valuations on a regular basis after considering all relevant information that is reasonably available. Such valuations and procedures are reviewed periodically by the Trustees. The fair value of securities is generally determined as the amount that the fund could reasonably expect to realize from an orderly disposition of such securities over a reasonable period of time. By its nature, a fair value price is a good faith estimate of the value of a security in a current sale and does not reflect an actual market price, which may be different by a material amount.
Security transactions and related investment income Security transactions are recorded on the trade date (the date the order to buy or sell is executed). Gains or losses on securities sold are determined on the identified cost basis.
Interest income, net of any applicable withholding taxes, if any, is recorded on the accrual basis. Amortization and accretion of premiums and discounts on debt securities, if any, is recorded on the accrual basis.
Securities purchased or sold on a when-issued or delayed delivery basis may be settled at a future date beyond customary settlement time; interest income is accrued based on the terms of the securities. Losses may arise due to changes in the fair value of the underlying securities or if the counterparty does not perform under the contract.
Futures contracts The fund uses futures contracts for yield curve positioning.
The potential risk to the fund is that the change in value of futures contracts may not correspond to the change in value of the hedged instruments. In addition, losses may arise from changes in the value of the underlying instruments, if there is an illiquid secondary market for the contracts, if interest or exchange rates move unexpectedly or if the counterparty to the contract is unable to perform. With futures, there is minimal counterparty credit risk to the fund since futures are exchange traded and the exchange’s clearinghouse, as counterparty to all exchange traded futures, guarantees the futures against default. Risks may exceed amounts recognized on the Statement of assets and liabilities. When the contract is closed, the fund records a realized gain or loss equal to the difference between the value of the contract at the time it was opened and the value at the time it was closed.
Futures contracts are valued at the quoted daily settlement prices established by the exchange on which they trade. The fund and the broker agree to exchange an amount of cash equal to the daily fluctuation in the value of the futures contract. Such receipts or payments are known as “variation margin.”
Futures contracts outstanding at period end, if any, are listed after the fund’s portfolio.
Total return swap contracts The fund entered into OTC and/or centrally cleared total return swap contracts, which are arrangements to exchange a market-linked return for a periodic payment, both based on a notional principal amount, for hedging and gaining exposure to interest rate and term structure risk.
To the extent that the total return of the security, index or other financial measure underlying the transaction exceeds or falls short of the offsetting interest rate obligation, the fund will receive a payment from or make a payment to the counterparty. OTC and/or centrally cleared total return swap contracts are marked to market daily based upon quotations from an independent pricing service or market maker. Any change is recorded as an unrealized gain or loss on OTC total return swaps. Daily fluctuations in the value of centrally cleared total return swaps are settled through a central clearing agent and are recorded in variation margin on the Statement of assets and liabilities and recorded as unrealized gain or loss. Payments received or made are recorded as realized gains or losses. Certain OTC and/or centrally cleared total return swap contracts may include extended effective dates. Payments related to these swap contracts are accrued based on the terms of the contract. The fund could be exposed to credit or market risk due to unfavorable changes in the fluctuation of interest rates or in the price of the underlying security or index, the possibility that there is no liquid market for these agreements or that the counterparty may default on its obligation to perform. The fund’s maximum risk of loss from counterparty risk or central clearing risk is the fair value of the contract. This risk may be mitigated for OTC total return swap contracts by having a master netting arrangement between the fund and the counterparty and for centrally cleared total return swap contracts through the daily exchange of variation margin. There is minimal counterparty risk with respect to centrally cleared total return swap contracts due to the clearinghouse guarantee fund and other resources that are available in the event of a clearing member default. Risk of loss may exceed amounts recognized on the Statement of assets and liabilities.
OTC and/or centrally cleared total return swap contracts outstanding, including their respective notional amounts at period end, if any, are listed after the fund’s portfolio.
|
| 48 California Tax Exempt Income Fund |
Master agreements The fund is a party to ISDA (International Swaps and Derivatives Association, Inc.) Master Agreements (Master Agreements) with certain counterparties that govern OTC derivative and foreign exchange contracts entered into from time to time. The Master Agreements may contain provisions regarding, among other things, the parties’ general obligations, representations, agreements, collateral requirements, events of default and early termination. With respect to certain counterparties, in accordance with the terms of the Master Agreements, collateral pledged to the fund is held in a segregated account by the fund’s custodian and, with respect to those amounts which can be sold or repledged, is presented in the fund’s portfolio.
Collateral pledged by the fund is segregated by the fund’s custodian and identified in the fund’s portfolio. Collateral can be in the form of cash or debt securities issued by the U.S. Government or related agencies or other securities as agreed to by the fund and the applicable counterparty. Collateral requirements are determined based on the fund’s net position with each counterparty.
Termination events applicable to the fund may occur upon a decline in the fund’s net assets below a specified threshold over a certain period of time. Termination events applicable to counterparties may occur upon a decline in the counterparty’s long-term and short-term credit ratings below a specified level. In each case, upon occurrence, the other party may elect to terminate early and cause settlement of all derivative and foreign exchange contracts outstanding, including the payment of any losses and costs resulting from such early termination, as reasonably determined by the terminating party. Any decision by one or more of the fund’s counterparties to elect early termination could impact the fund’s future derivative activity.
At the close of the reporting period, the fund did not have a net liability position on open derivative contracts subject to the Master Agreements.
Tender option bond transactions The fund may participate in transactions whereby a fixed-rate bond is transferred to a tender option bond trust (TOB trust) sponsored by a broker. The TOB trust funds the purchase of the fixed rate bonds by issuing floating-rate bonds to third parties and allowing the fund to retain the residual interest in the TOB trust’s assets and cash flows, which are in the form of inverse floating rate bonds. The inverse floating rate bonds held by the fund give the fund the right to (1) cause the holders of the floating rate bonds to tender their notes at par, and (2) to have the fixed-rate bond held by the TOB trust transferred to the fund, causing the TOB trust to collapse. The fund accounts for the transfer of the fixed-rate bond to the TOB trust as a secured borrowing by including the fixed-rate bond in the fund’s portfolio and including the floating rate bond as a liability in the Statement of assets and liabilities. At the close of the reporting period, the fund’s investments with a value of $30,555,045 were held by the TOB trust and served as collateral for $20,270,001 in floating-rate bonds outstanding. For the reporting period ended, the fund incurred interest expense of $742,591 for these investments based on an average interest rate of 3.00%.
Interfund lending The fund, along with other Putnam funds, may participate in an interfund lending program pursuant to an exemptive order issued by the SEC. This program allows the fund to borrow from other Putnam funds that permit such transactions. Interfund lending transactions are subject to each fund’s investment policies and borrowing and lending limits. Interest earned or paid on the interfund lending transaction will be based on the average of certain current market rates. During the reporting period, the fund did not utilize the program.
Lines of credit The fund participates, along with other Putnam funds, in a $320 million syndicated unsecured committed line of credit, provided by State Street ($160 million) and JPMorgan ($160 million), and a $235.5 million unsecured uncommitted line of credit, provided by State Street. Prior to May 2, 2023, the fund participated, along with other Putnam funds, in a $100 million unsecured committed line of credit and a $235.5 million unsecured uncommitted line of credit, both provided by State Street. Borrowings may be made for temporary or emergency purposes, including the funding of shareholder redemption requests and trade settlements. Interest is charged to the fund based on the fund’s borrowing at a rate equal to 1.25% plus the higher of (1) the Federal Funds rate and (2) the Overnight Bank Funding Rate for the committed line of credit and 1.30% plus the higher of (1) the Federal Funds rate and (2) the Overnight Bank Funding Rate for the uncommitted line of credit. A closing fee equal to 0.04% of the committed line of credit and 0.04% of the uncommitted line of credit has been paid by the participating funds and a $75,000 fee has been paid by the participating funds to State Street as agent of the syndicated committed line of credit. In addition, a commitment fee of 0.21% per annum on any unutilized portion of the committed line of credit is allocated to the participating funds based on their relative net assets and paid quarterly. During the reporting period, the fund had no borrowings against these arrangements.
Federal taxes It is the policy of the fund to distribute all of its income within the prescribed time period and otherwise comply with the provisions of the Internal Revenue Code of 1986, as amended (the Code), applicable to regulated investment companies. It is also the intention of the fund to distribute an amount sufficient to avoid imposition of any excise tax under Section 4982 of the Code.
|
| California Tax Exempt Income Fund 49 |
The fund is subject to the provisions of Accounting Standards Codification 740 Income Taxes (ASC 740). ASC 740 sets forth a minimum threshold for financial statement recognition of the benefit of a tax position taken or expected to be taken in a tax return. The fund did not have a liability to record for any unrecognized tax benefits in the accompanying financial statements. No provision has been made for federal taxes on income, capital gains or unrealized appreciation on securities held nor for excise tax on income and capital gains. Each of the fund’s federal tax returns for the prior three fiscal years remains subject to examination by the Internal Revenue Service.
Under the Regulated Investment Company Modernization Act of 2010, the fund will be permitted to carry forward capital losses incurred for an unlimited period and the carry forwards will retain their character as either short-term or long-term capital losses. At September 30, 2023, the fund had the following capital loss carryovers available, to the extent allowed by the Code, to offset future net capital gain, if any:
| | |
| | Loss carryover | |
| Short-term | Long-term | Total |
| $12,850,428 | $9,202,373 | $22,052,801 |
Distributions to shareholders Income dividends are recorded daily by the fund and are paid monthly. Distributions from capital gains, if any, are recorded on the ex-dividend date and paid at least annually. The amount and character of income and gains to be distributed are determined in accordance with income tax regulations, which may differ from generally accepted accounting principles. Dividend sources are estimated at the time of declaration. Actual results may vary. Any non-taxable return of capital cannot be determined until final tax calculations are completed after the end of the fund’s fiscal year. Reclassifications are made to the fund’s capital accounts to reflect income and gains available for distribution (or available capital loss carryovers) under income tax regulations.
For the reporting period, there were no material temporary or permanent differences. Reclassifications are made to the fund’s capital accounts to reflect income and gains available for distribution (or available capital loss carryovers) under income tax regulations. At the close of the reporting period, the fund reclassified $277,281 to decrease undistributed net investment income and $277,281 to decrease accumulated net realized loss.
Tax cost of investments includes adjustments to net unrealized appreciation (depreciation) which may not necessarily be final tax cost basis adjustments, but closely approximate the tax basis unrealized gains and losses that may be realized and distributed to shareholders. The tax basis components of distributable earnings and the federal tax cost as of the close of the reporting period were as follows:
| |
| Unrealized appreciation | $3,164,984 |
| Unrealized depreciation | (80,592,675) |
| Net unrealized depreciation | (77,427,691) |
| Undistributed ordinary income | 331,566 |
| Undistributed tax-exempt income | 5,474,311 |
| Capital loss carryforward | (22,052,801) |
| Cost for federal income tax purposes | $841,678,750 |
Note 2: Management fee, administrative services and other transactions
The fund pays Putnam Management a management fee (based on the fund’s average net assets and computed and paid monthly) at annual rates that may vary based on the average of the aggregate net assets of all open-end mutual funds sponsored by Putnam Management (excluding net assets of funds that are invested in, or that are invested in by, other Putnam funds to the extent necessary to avoid “double counting” of those assets). Such annual rates may vary as follows:
| | | | |
| 0.590% | of the first $5 billion, | | 0.390% | of the next $50 billion, |
| 0.540% | of the next $5 billion, | | 0.370% | of the next $50 billion, |
| 0.490% | of the next $10 billion, | | 0.360% | of the next $100 billion and |
| 0.440% | of the next $10 billion, | | 0.355% | of any excess thereafter. |
|
| 50 California Tax Exempt Income Fund |
For the reporting period, the management fee represented an effective rate (excluding the impact from any expense waivers in effect) of 0.431% of the fund’s average net assets.
Putnam Management has contractually agreed, through January 30, 2025, to waive fees and/or reimburse the fund’s expenses to the extent necessary to limit the cumulative expenses of the fund, exclusive of brokerage, interest, taxes, investment-related expenses, extraordinary expenses, acquired fund fees and expenses and payments under the fund’s investor servicing contract, investment management contract and distribution plans, on a fiscal year-to-date basis to an annual rate of 0.20% of the fund’s average net assets over such fiscal year-to-date period. During the reporting period, the fund’s expenses were not reduced as a result of this limit.
PIL is authorized by the Trustees to manage a separate portion of the assets of the fund as determined by Putnam Management from time to time. PIL did not manage any portion of the assets of the fund during the reporting period. If Putnam Management were to engage the services of PIL, Putnam Management would pay a quarterly sub-management fee to PIL for its services at an annual rate of 0.20% of the average net assets of the portion of the fund managed by PIL.
The fund reimburses Putnam Management an allocated amount for the compensation and related expenses of certain officers of the fund and their staff who provide administrative services to the fund. The aggregate amount of all such reimbursements is determined annually by the Trustees.
Custodial functions for the fund’s assets are provided by State Street. Custody fees are based on the fund’s asset level, the number of its security holdings and transaction volumes.
Putnam Investor Services, Inc., an affiliate of Putnam Management, provides investor servicing agent functions to the fund. Putnam Investor Services, Inc. received fees for investor servicing for class A, class B, class C and class Y shares that included (1) a per account fee for each direct and underlying non-defined contribution account (retail account) of the fund; (2) a specified rate of the fund’s assets attributable to defined contribution plan accounts; and (3) a specified rate based on the average net assets in retail accounts. Putnam Investor Services, Inc. has agreed that the aggregate investor servicing fees for each fund’s retail and defined contribution accounts for these share classes will not exceed an annual rate of 0.25% of the fund’s average assets attributable to such accounts.
Class R6 shares paid a monthly fee based on the average net assets of class R6 shares at an annual rate of 0.05%.
During the reporting period, the expenses for each class of shares related to investor servicing fees were as follows:
| | | | |
| Class A | $384,070 | | Class R6 | 1,345 |
| Class B | 103 | | Class Y | 47,586 |
| Class C | 5,401 | | Total | $438,505 |
The fund has entered into expense offset arrangements with Putnam Investor Services, Inc. and State Street whereby Putnam Investor Services, Inc.’s and State Street’s fees are reduced by credits allowed on cash balances. For the reporting period, the fund’s expenses were reduced by $14,217 under the expense offset arrangements.
Each Independent Trustee of the fund receives an annual Trustee fee, of which $678, as a quarterly retainer, has been allocated to the fund, and an additional fee for each Trustees meeting attended. Trustees also are reimbursed for expenses they incur relating to their services as Trustees.
The fund has adopted a Trustee Fee Deferral Plan (the Deferral Plan) which allows the Trustees to defer the receipt of all or a portion of Trustees fees payable on or after July 1, 1995. The deferred fees remain invested in certain Putnam funds until distribution in accordance with the Deferral Plan.
The fund has adopted an unfunded noncontributory defined benefit pension plan (the Pension Plan) covering all Trustees of the fund who have served as a Trustee for at least five years and were first elected prior to 2004. Benefits under the Pension Plan are equal to 50% of the Trustee’s average annual attendance and retainer fees for the three years ended December 31, 2005. The retirement benefit is payable during a Trustee’s lifetime, beginning the year following retirement, for the number of years of service through December 31, 2006. Pension expense for the fund is included in Trustee compensation and expenses in the Statement of operations. Accrued pension liability is included in Payable for Trustee compensation and expenses in the Statement of assets and liabilities. The Trustees have terminated the Pension Plan with respect to any Trustee first elected after 2003.
|
| California Tax Exempt Income Fund 51 |
The fund has adopted distribution plans (the Plans) with respect to the following share classes pursuant to Rule 12b–1 under the Investment Company Act of 1940. The purpose of the Plans is to compensate Putnam Retail Management Limited Partnership, an indirect wholly-owned subsidiary of Putnam Investments, LLC, for services provided and expenses incurred in distributing shares of the fund. The Plans provide payments by the fund to Putnam Retail Management Limited Partnership at an annual rate of up to the following amounts (Maximum %) of the average net assets attributable to each class. The Trustees have approved payment by the fund at the following annual rate (Approved %) of the average net assets attributable to each class. During the reporting period, the class-specific expenses related to distribution fees were as follows:
| | | |
| | Maximum % | Approved % | Amount |
| Class A | 0.35% | 0.25% | $1,776,813 |
| Class B | 1.00% | 0.85% | 1,621 |
| Class C | 1.00% | 1.00% | 99,958 |
| Total | | | $1,878,392 |
For the reporting period, Putnam Retail Management Limited Partnership, acting as underwriter, received net commissions of $7,744 from the sale of class A shares and received no monies and $65 in contingent deferred sales charges from redemptions of class B and class C shares, respectively.
A deferred sales charge of up to 1.00% is assessed on certain redemptions of class A shares. For the reporting period, Putnam Retail Management Limited Partnership, acting as underwriter, received no monies on class A redemptions.
Note 3: Purchases and sales of securities
During the reporting period, the cost of purchases and the proceeds from sales, excluding short-term investments, were as follows:
| | |
| | Cost of purchases | Proceeds from sales |
| Investments in securities (Long-term) | $206,244,155 | $267,726,158 |
| U.S. government securities (Long-term) | — | — |
| Total | $206,244,155 | $267,726,158 |
The fund may purchase or sell investments from or to other Putnam funds in the ordinary course of business, which can reduce the fund’s transaction costs, at prices determined in accordance with SEC requirements and policies approved by the Trustees. During the reporting period, purchases or sales of long-term securities from or to other Putnam funds, if any, did not represent more than 5% of the fund’s total cost of purchases and/or total proceeds from sales.
Note 4: Capital shares
At the close of the reporting period, there were an unlimited number of shares of beneficial interest authorized. Transactions, including, if applicable, direct exchanges pursuant to share conversions, in capital shares were as follows:
| | | | |
| | YEAR ENDED 9/30/23 | YEAR ENDED 9/30/22 |
| Class A | Shares | Amount | Shares | Amount |
| Shares sold | 5,551,559 | $39,663,390 | 4,721,873 | $35,368,652 |
| Shares issued in connection with | | | | |
| reinvestment of distributions | 2,443,846 | 17,413,159 | 3,965,736 | 31,045,883 |
| | 7,995,405 | 57,076,549 | 8,687,609 | 66,414,535 |
| Shares repurchased | (18,286,710) | (130,402,515) | (18,469,147) | (140,963,662) |
| Net decrease | (10,291,305) | $(73,325,966) | (9,781,538) | $(74,549,127) |
|
| 52 California Tax Exempt Income Fund |
| | | | |
| | YEAR ENDED 9/30/23 | YEAR ENDED 9/30/22 |
| Class B | Shares | Amount | Shares | Amount |
| Shares sold | 1 | $7 | — | $— |
| Shares issued in connection with | | | | |
| reinvestment of distributions | 625 | 4,449 | 1,529 | 12,041 |
| | 626 | 4,456 | 1,529 | 12,041 |
| Shares repurchased | (8,958) | (64,234) | (22,813) | (175,343) |
| Net decrease | (8,332) | $(59,778) | (21,284) | $(163,302) |
| |
| | YEAR ENDED 9/30/23 | YEAR ENDED 9/30/22 |
| Class C | Shares | Amount | Shares | Amount |
| Shares sold | 202,795 | $1,468,670 | 188,728 | $1,473,551 |
| Shares issued in connection with | | | | |
| reinvestment of distributions | 28,342 | 203,365 | 62,931 | 500,119 |
| | 231,137 | 1,672,035 | 251,659 | 1,973,670 |
| Shares repurchased | (545,290) | (3,921,121) | (858,420) | (6,616,199) |
| Net decrease | (314,153) | $(2,249,086) | (606,761) | $(4,642,529) |
| |
| | YEAR ENDED 9/30/23 | YEAR ENDED 9/30/22 |
| Class R6 | Shares | Amount | Shares | Amount |
| Shares sold | 223,015 | $1,577,589 | 287,968 | $2,128,110 |
| Shares issued in connection with | | | | |
| reinvestment of distributions | 11,745 | 84,044 | 8,566 | 66,094 |
| | 234,760 | 1,661,633 | 296,534 | 2,194,204 |
| Shares repurchased | (215,962) | (1,541,580) | (130,892) | (976,349) |
| Net increase | 18,798 | $120,053 | 165,642 | $1,217,855 |
| |
| | YEAR ENDED 9/30/23 | YEAR ENDED 9/30/22 |
| Class Y | Shares | Amount | Shares | Amount |
| Shares sold | 7,445,741 | $53,164,432 | 5,460,875 | $42,089,584 |
| Shares issued in connection with | | | | |
| reinvestment of distributions | 335,166 | 2,396,808 | 475,621 | 3,726,796 |
| | 7,780,907 | 55,561,240 | 5,936,496 | 45,816,380 |
| Shares repurchased | (6,273,227) | (44,772,344) | (15,884,094) | (120,860,119) |
| Net increase (decrease) | 1,507,680 | $10,788,896 | (9,947,598) | $(75,043,739) |
|
| California Tax Exempt Income Fund 53 |
Note 5: Affiliated transactions
Transactions during the reporting period with any company which is under common ownership or control were as follows:
| | | | | |
| | | | | | Shares |
| | | | | | outstanding |
| | | | | | and fair |
| | Fair value as | Purchase | Sale | Investment | value as |
| Name of affiliate | of 9/30/22 | cost | proceeds | income | of 9/30/23 |
| Short-term investments | | | | | |
| Putnam Short Term | | | | | |
| Investment Fund* | $2,312,477 | $215,346,884 | $202,681,797 | $443,303 | $14,977,564 |
| Total Short-term | | | | | |
| investments | $2,312,477 | $215,346,884 | $202,681,797 | $443,303 | $14,977,564 |
* Management fees charged to Putnam Short Term Investment Fund have been waived by Putnam Management. There were no realized or unrealized gains or losses during the period.
Note 6: Market, credit and other risks
In the normal course of business, the fund trades financial instruments and enters into financial transactions where risk of potential loss exists due to changes in the market (market risk) or failure of the contracting party to the transaction to perform (credit risk). The fund may be exposed to additional credit risk that an institution or other entity with which the fund has unsettled or open transactions will default. The fund focuses a majority of its investments in the state of California and may be affected by economic and political developments in that state.
Note 7: Summary of derivative activity
The volume of activity for the reporting period for any derivative type that was held during the period is listed below and was based on an average of the holdings at the end of each fiscal quarter:
| |
| Futures contracts (number of contracts) | 100 |
| OTC total return swap contracts (notional) | $330,000 |
The following is a summary of the fair value of derivative instruments as of the close of the reporting period:
| | | | |
| Fair value of derivative instruments as of the close of the reporting period | |
| | ASSET DERIVATIVES | LIABILITY DERIVATIVES |
| Derivatives not | | | | |
| accounted for as | Statement of | | Statement of | |
| hedging instruments | assets and | | assets and | |
| under ASC 815 | liabilities location | Fair value | liabilities location | Fair value |
| Interest rate contracts | Receivables | $229,632* | Payables | $— |
| Total | | $229,632 | | $— |
* Includes cumulative appreciation/depreciation of futures contracts as reported in the fund’s portfolio. Only current day’s variation margin is reported within the Statement of assets and liabilities.
|
| 54 California Tax Exempt Income Fund |
The following is a summary of realized and change in unrealized gains or losses of derivative instruments in the Statement of operations for the reporting period (Note 1):
| | | |
| Amount of realized gain or (loss) on derivatives recognized in net gain or (loss) on investments | |
| Derivatives not accounted for as hedging | | | |
| instruments under ASC 815 | Futures | Swaps | Total |
| Interest rate contracts | $1,030,723 | $76,500 | $1,107,223 |
| Total | $1,030,723 | $76,500 | $1,107,223 |
| |
| Change in unrealized appreciation or (depreciation) on derivatives recognized in net gain or (loss) |
| on investments | | | |
| Derivatives not accounted for as hedging | | | |
| instruments under ASC 815 | Futures | Swaps | Total |
| Interest rate contracts | $229,632 | $359,295 | $588,927 |
| Total | $229,632 | $359,295 | $588,927 |
|
| California Tax Exempt Income Fund 55 |
Note 8: Offsetting of financial and derivative assets and liabilities
The following table summarizes any derivatives, repurchase agreements and reverse repurchase agreements, at the end of the reporting period, that are subject to an enforceable master netting agreement or similar agreement. For securities lending transactions or borrowing transactions associated with securities sold short, if any, see Note 1. For financial reporting purposes, the fund does not offset financial assets and financial liabilities that are subject to the master netting agreements in the Statement of assets and liabilities.
| | |
| | JPMorgan Securities LLC | Total |
| Futures contracts§ | $— | $— |
| Total Assets | $— | $— |
| Liabilities: | | |
| Futures contracts§ | 16,413 | 16,413 |
| Total Liabilities | $16,413 | $16,413 |
| Total Financial and Derivative Net Assets | $(16,413) | $(16,413) |
| Total collateral received (pledged)†## | $— | |
| Net amount | $(16,413) | |
| Controlled collateral received (including | | |
| TBA commitments)** | $— | $— |
| Uncontrolled collateral received | $— | $— |
| Collateral (pledged) (including TBA commitments)** | $— | $— |
** Included with Investments in securities on the Statement of assets and liabilities.
† Additional collateral may be required from certain brokers based on individual agreements.
##Any over-collateralization of total financial and derivative net assets is not shown. Collateral may include amounts related to unsettled agreements.
§ Includes current day’s variation margin only as reported on the Statement of assets and liabilities, which is not collateralized. Cumulative appreciation/(depreciation) for futures contracts and centrally cleared swap contracts is represented in the tables listed after the fund’s portfolio. Collateral pledged for initial margin on futures contracts, which is not included in the table above, amounted to $223,104.
Note 9: Of special note
On May 31, 2023, Franklin Resources, Inc. (“Franklin Resources”) and Great-West Lifeco Inc., the parent company of Putnam U.S. Holdings I, LLC (“Putnam Holdings”), announced that they have entered into a definitive agreement for a subsidiary of Franklin Resources to acquire Putnam Holdings in a stock and cash transaction.
As part of this transaction, Putnam Management, a wholly-owned subsidiary of Putnam Holdings and investment manager to the Putnam family of funds (the “Putnam Funds”), would become an indirect wholly-owned subsidiary of Franklin Resources.
The transaction is subject to customary closing conditions, including receipt of applicable regulatory approvals. Subject to such approvals and the satisfaction of these conditions, the transaction is currently expected to be consummated in the fourth quarter of 2023.
Under the Investment Company Act of 1940, as amended, consummation of the transaction will result in the automatic termination of the investment management contract between each Putnam Fund and Putnam Management and any related sub-management and sub-advisory contracts, where applicable. In anticipation of this automatic termination, on June 23, 2023, the Board of Trustees of the Putnam Funds approved a new investment management contract between each Putnam Fund and Putnam Management (and new sub-management and sub-advisory contracts, if applicable), which will be presented to the shareholders of each Putnam Fund for their approval at shareholder meetings in October 2023 or at any adjourned sessions of such meetings. Proxy solicitation materials related to these meetings have been made available to shareholders that held shares of the fund at the close of business on July 24, 2023.
|
| 56 California Tax Exempt Income Fund |
Federal tax information (Unaudited)
The fund has designated 99.61% of dividends paid from net investment income during the reporting period as tax exempt for federal income tax purposes.
The Form 1099 that will be mailed to you in January 2024 will show the tax status of all distributions paid to your account in calendar 2023.
|
| California Tax Exempt Income Fund 57 |

|
| 58 California Tax Exempt Income Fund |

* Mr. Reynolds is an “interested person” (as defined in the Investment Company Act of 1940) of the fund and Putnam Investments. He is President and Chief Executive Officer of Putnam Investments, as well as the President of your fund and each of the other Putnam funds.
The address of each Trustee is 100 Federal Street, Boston, MA 02110.
As of September 30, 2023, there were 89 mutual funds, 4 closed-end funds, and 12 exchange-traded funds in the Putnam funds complex. Each Trustee serves as Trustee of all funds in the Putnam funds complex.
Each Trustee serves for an indefinite term, until his or her resignation, retirement at age 75, removal, or death.
|
| California Tax Exempt Income Fund 59 |
Officers
In addition to Robert L. Reynolds, the other officers of the fund are shown below:
| |
| James F. Clark (Born 1974) | Alan G. McCormack (Born 1964) |
| Vice President and Chief Compliance Officer | Vice President and Derivatives Risk Manager |
| Since 2016 | Since 2022 |
| Chief Compliance Officer and Chief Risk Officer, | Head of Quantitative Equities and Risk, |
| Putnam Investments, and Chief Compliance Officer, | Putnam Investments |
| Putnam Management |
| Denere P. Poulack (Born 1968) |
| Michael J. Higgins (Born 1976) | Assistant Vice President, Assistant Clerk, |
| Vice President, Treasurer, and Clerk | and Assistant Treasurer |
| Since 2010 | Since 2004 |
| |
| Jonathan S. Horwitz (Born 1955) | Janet C. Smith (Born 1965) |
| Executive Vice President, Principal Executive Officer, | Vice President, Principal Financial Officer, Principal |
| and Compliance Liaison | Accounting Officer, and Assistant Treasurer |
| Since 2004 | Since 2007 |
| | Head of Fund Administration Services, |
| Richard T. Kircher (Born 1962) | Putnam Investments and Putnam Management |
| Vice President and BSA Compliance Officer | |
| Since 2019 | Stephen J. Tate (Born 1974) |
| Assistant Director, Operational Compliance, Putnam | Vice President and Chief Legal Officer |
| Investments and Putnam Retail Management | Since 2021 |
| | General Counsel, Putnam Investments, |
| Martin Lemaire (Born 1984) | Putnam Management, and Putnam Retail Management |
| Vice President and Derivatives Risk Manager | |
| Since 2022 | Mark C. Trenchard (Born 1962) |
| Risk Manager and Risk Analyst, Putnam Investments | Vice President |
| | Since 2002 |
| Susan G. Malloy (Born 1957) | Director of Operational Compliance, Putnam |
| Vice President and Assistant Treasurer | Investments and Putnam Retail Management |
| Since 2007 | |
| Head of Accounting and Middle Office Services, | |
| Putnam Investments and Putnam Management | |
The principal occupations of the officers for the past five years have been with the employers as shown above, although in some cases they have held different positions with such employers. The address of each officer is 100 Federal Street, Boston, MA 02110.
|
| 60 California Tax Exempt Income Fund |
Fund information
Founded over 85 years ago, Putnam Investments was built around the concept that a balance between risk and reward is the hallmark of a well-rounded financial program. We manage funds across income, value, blend, growth, sustainable, and asset allocation categories.
| | |
| Investment Manager | Trustees | Richard T. Kircher |
| Putnam Investment | Kenneth R. Leibler, Chair | Vice President and |
| Management, LLC | Barbara M. Baumann, Vice Chair | BSA Compliance Officer |
| 100 Federal Street | Liaquat Ahamed | |
| Boston, MA 02110 | Katinka Domotorffy | Martin Lemaire |
| | Catharine Bond Hill | Vice President and |
| Investment Sub-Advisor | Jennifer Williams Murphy | Derivatives Risk Manager |
| Putnam Investments Limited | Marie Pillai | |
| 16 St James’s Street | George Putnam III | Susan G. Malloy |
| London, England SW1A 1ER | Robert L. Reynolds | Vice President and |
| Manoj P. Singh | Assistant Treasurer |
| Marketing Services | Mona K. Sutphen | |
| Putnam Retail Management | | Alan G. McCormack |
| Limited Partnership | Officers | Vice President and |
| 100 Federal Street | Robert L. Reynolds | Derivatives Risk Manager |
| Boston, MA 02110 | President | |
| | | Denere P. Poulack |
| Custodian | James F. Clark | Assistant Vice President, |
| State Street Bank | Vice President and | Assistant Clerk, and |
| and Trust Company | Chief Compliance Officer | Assistant Treasurer |
| | | |
| Legal Counsel | Michael J. Higgins | Janet C. Smith |
| Ropes & Gray LLP | Vice President, Treasurer, | Vice President, |
| and Clerk | Principal Financial Officer, |
| Independent Registered | | Principal Accounting Officer, |
| Public Accounting Firm | Jonathan S. Horwitz | and Assistant Treasurer |
| PricewaterhouseCoopers LLP | Executive Vice President, | |
| | Principal Executive Officer, | Stephen J. Tate |
| | and Compliance Liaison | Vice President and |
| | | Chief Legal Officer |
| | |
| | | Mark C. Trenchard |
| | | Vice President |
This report is for the information of shareholders of Putnam California Tax Exempt Income Fund. It may also be used as sales literature when preceded or accompanied by the current prospectus, the most recent copy of Putnam’s Quarterly Performance Summary, and Putnam’s Quarterly Ranking Summary. For more recent performance, please visit putnam.com. Investors should carefully consider the investment objectives, risks, charges, and expenses of a fund, which are described in its prospectus. For this and other information or to request a prospectus or summary prospectus, call 1-800-225-1581 toll free. Please read the prospectus carefully before investing. The fund’s Statement of Additional Information contains additional information about the fund’s Trustees and is available without charge upon request by calling 1-800-225-1581.

| |
| (a) The fund’s principal executive, financial and accounting officers are employees of Putnam Investment Management, LLC, the Fund’s investment manager. As such they are subject to a comprehensive Code of Ethics adopted and administered by Putnam Investments which is designed to protect the interests of the firm and its clients. The Fund has adopted a Code of Ethics which incorporates the Code of Ethics of Putnam Investments with respect to all of its officers and Trustees who are employees of Putnam Investment Management, LLC. For this reason, the Fund has not adopted a separate code of ethics governing its principal executive, financial and accounting officers. |
| |
| (c) In January 2023, the Code of Ethics of Putnam Investments and Code of Ethics of Putnam Funds were amended. The key changes to the Putnam Investments Code of Ethics are as follows: (i) Prohibition on investments in a single stock ETFs and (ii) Revision to the 7-day blackout rule for Analysts. The key change to the Putnam Funds Code of Ethics was that the provisions of the Code of Ethics for employees of PanAgora Asset Management, inc. and any of its subsidiaries are excluded from the Putnam Funds’ Code of Ethics. |
| |
| Item 3. Audit Committee Financial Expert: |
| |
| The Funds’ Audit, Compliance and Risk Committee is comprised solely of Trustees who are “independent” (as such term has been defined by the Securities and Exchange Commission (“SEC”) in regulations implementing Section 407 of the Sarbanes-Oxley Act (the “Regulations”)). The Trustees believe that each member of the Audit, Compliance and Risk Committee also possesses a combination of knowledge and experience with respect to financial accounting matters, as well as other attributes, that qualifies him or her for service on the Committee. In addition, the Trustees have determined that each of Dr. Hill, Ms. Murphy and Mr. Singh qualifies as an “audit committee financial expert” (as such term has been defined by the Regulations) based on their review of his or her pertinent experience and education.The SEC has stated, and the funds’ amended and restated agreement and Declaration of Trust provides, that the designation or identification of a person as an audit committee financial expert pursuant to this Item 3 of Form N-CSR does not impose on such person any duties, obligations or liability that are greater than the duties, obligations and liability imposed on such person as a member of the Audit, Compliance and Risk Committee and the Board of Trustees in the absence of such designation or identification. |
| |
| Item 4. Principal Accountant Fees and Services: |
| |
| The following table presents fees billed in each of the last two fiscal years for services rendered to the fund by the fund’s independent auditor: |
| | | | | |
| Fiscal year ended | Audit Fees | Audit-Related Fees | Tax Fees | All Other Fees |
|
|
| | | | | |
| September 30, 2023 | $66,952 | $ — | $7,779 | $ — |
| September 30, 2022 | $88,381 | $ — | $7,761 | $ — |
| |
| For the fiscal years ended September 30, 2023 and September 30, 2022, the fund’s independent auditor billed aggregate non-audit fees in the amounts of $228,411 and $306,044 respectively, to the fund, Putnam Management and any entity controlling, controlled by or under common control with Putnam Management that provides ongoing services to the fund. |
| |
| Audit Fees represent fees billed for the fund’s last two fiscal years relating to the audit and review of the financial statements included in annual reports and registration statements, and other services that are normally provided in connection with statutory and regulatory filings or engagements. |
| |
| Audit-Related Fees represent fees billed in the fund’s last two fiscal years for services traditionally performed by the fund’s auditor, including accounting consultation for proposed transactions or concerning financial accounting and reporting standards and other audit or attest services not required by statute or regulation. |
| |
| Tax Fees represent fees billed in the fund’s last two fiscal years for tax compliance, tax planning and tax advice services. Tax planning and tax advice services include assistance with tax audits, employee benefit plans and requests for rulings or technical advice from taxing authorities. |
| |
| Pre-Approval Policies of the Audit, Compliance and Risk Committee. The Audit, Compliance and Risk Committee of the Putnam funds has determined that, as a matter of policy, all work performed for the funds by the funds’ independent auditors will be pre-approved by the Committee itself and thus will generally not be subject to pre-approval procedures. |
| |
| The Audit, Compliance and Risk Committee also has adopted a policy to pre-approve the engagement by Putnam Management and certain of its affiliates of the funds’ independent auditors, even in circumstances where pre-approval is not required by applicable law. Any such requests by Putnam Management or certain of its affiliates are typically submitted in writing to the Committee and explain, among other things, the nature of the proposed engagement, the estimated fees, and why this work should be performed by that particular audit firm as opposed to another one. In reviewing such requests, the Committee considers, among other things, whether the provision of such services by the audit firm are compatible with the independence of the audit firm. |
| |
| The following table presents fees billed by the fund’s independent auditor for services required to be approved pursuant to paragraph (c)(7)(ii) of Rule 2–01 of Regulation S-X. |
| | | | | |
| Fiscal year ended | Audit-Related Fees | Tax Fees | All Other Fees | Total Non-Audit Fees |
|
|
| September 30, 2023 | $ — | $220,632 | $ — | $ — |
| September 30, 2022 | $ — | $298,283 | $ — | $ — |
| |
| Item 5. Audit Committee of Listed Registrants |
| |
| Item 6. Schedule of Investments: |
| |
| The registrant’s schedule of investments in unaffiliated issuers is included in the report to shareholders in Item 1 above. |
| |
| Item 7. Disclosure of Proxy Voting Policies and Procedures For Closed-End Management Investment Companies: |
| |
| Item 8. Portfolio Managers of Closed-End Investment Companies |
| |
| Item 9. Purchases of Equity Securities by Closed-End Management Investment Companies and Affiliated Purchasers: |
| |
| Item 10. Submission of Matters to a Vote of Security Holders: |
| |
| Item 11. Controls and Procedures: |
| |
| (a) The registrant’s principal executive officer and principal financial officer have concluded, based on their evaluation of the effectiveness of the design and operation of the registrant’s disclosure controls and procedures as of a date within 90 days of the filing date of this report, that the design and operation of such procedures are generally effective to provide reasonable assurance that information required to be disclosed by the registrant in this report is recorded, processed, summarized and reported within the time periods specified in the Commission’s rules and forms. |
| |
| (b) Changes in internal control over financial reporting: Not applicable |
| |
| Item 12. Disclosures of Securities Lending Activities for Closed-End Management Investment Companies: |
| |
| (a)(1) The Code of Ethics of The Putnam Funds, which incorporates the Code of Ethics of Putnam Investments, is filed herewith. |
| |
| Pursuant to the requirements of the Securities Exchange Act of 1934 and the Investment Company Act of 1940, the registrant has duly caused this report to be signed on its behalf by the undersigned, thereunto duly authorized. |
| |
| Putnam California Tax Exempt Income Fund |
| |
| By (Signature and Title): |
| |
| /s/ Janet C. Smith
Janet C. Smith
Principal Accounting Officer
|
| |
| Pursuant to the requirements of the Securities Exchange Act of 1934 and the Investment Company Act of 1940, this report has been signed below by the following persons on behalf of the registrant and in the capacities and on the dates indicated. |
| |
| By (Signature and Title): |
| |
| /s/ Jonathan S. Horwitz
Jonathan S. Horwitz
Principal Executive Officer
|
| |
| By (Signature and Title): |
| |
| /s/ Janet C. Smith
Janet C. Smith
Principal Financial Officer
|