Exhibit 99.3

THE COOPER COMPANIES, INC.
FORWARD LOOKING
STATEMENTS
This presentation contains forward-looking projections of Cooper’s results. Actual results could differ materially from these projections. Additional information concerning factors that could cause material differences can be found in Cooper’s periodic filings with the Securities and Exchange Commission. They are available publicly and on request from Cooper’s investor relations department.
THE COOPER COMPANIES, INC.
AGENDA
Introductions – Tom Bender
Soft Contact Lens Market Overview – Tom Bender
Integration of COO and OCLR – Greg Fryling
R&D Portfolio – Chris Marmo
Financial Overview and Guidance – Bob Weiss
THE COOPER COMPANIES, INC.
Tom Bender
Chairman of the Board,
President and
Chief Executive Officer
The Cooper Companies, Inc.
THE COOPER COMPANIES, INC.
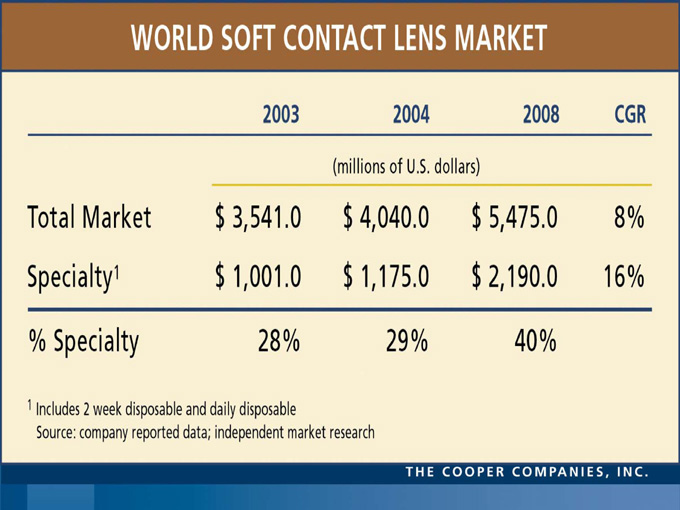
WORLD SOFT CONTACT LENS MARKET
2003 2004 2008 CGR
(millions of U.S. dollars)
Total Market $3,541.0 $4,040.0 $5,475.0 8%
Specialty1 $1,001.0 $1,175.0 $2,190.0 16%
% Specialty 28% 29% 40%
1Includes 2 week disposable and daily disposable
Source: company reported data; independent market research
THE COOPPER COMPANIES, INC.
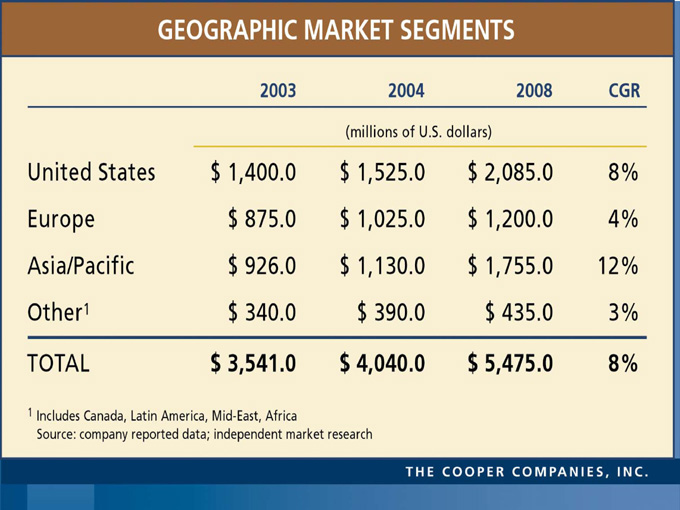
GEOGRAPHIC MARKET SEGMENTS
2003 2004 2008 CGR
(millions of U.S. dollars)
United States $1,400.0 $1,525.0 $2,085.0 8%
Europe $875.0 $1,025.0 $1,200.0 4%
Asia/Pacific $926.0 $1,130.0 $1,755.0 12%
Other1 $340.0 $390.0 $435.0 3%
TOTAL $3,541.0 $4,040.0 $5,475.0` 8%
1 Includes Canada, Latin America, Mid-East, Africa
Source: company reported data; independent market research
THE COOPER COMPANIES, INC.
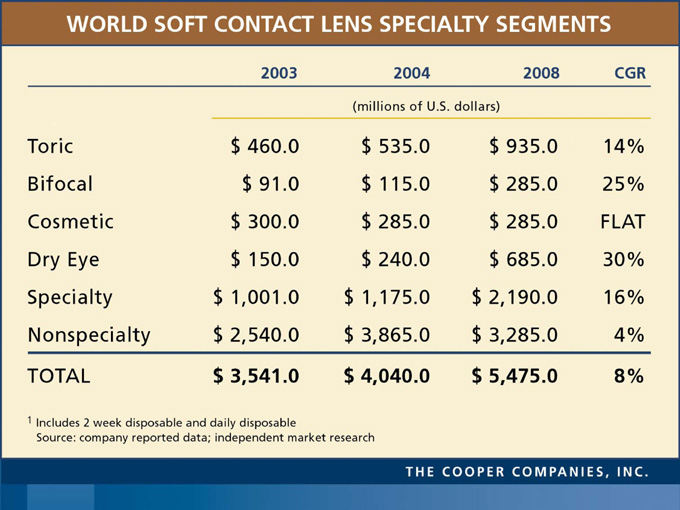
WORLD SOFT CONTACT LENS SPECIALTY SEGMENTS
2003 2004 2008 CGR
(millions of U.S. dollars)
Toric $460.0 $535.0 $935.0 14%
Bifocal $91.0 $115.0 $285.0 25%
Cosmetic $300.0 $285.0 $285.0 FLAT
Dry Eye $150.0 $1,175.0 $685.0 30%
Specialty $1,001.0 $3,865.0 $2,190.0 16%
Nonspecialty $2,540.0 $4,040.0 $3,285.0 4%
TOTAL $3,541.0 $240.0$5,475.0 8%
1 Includes 2 week disposable and daily disposable
Source: company reported data; independent market research
THE COOPER COMPANIES, INC.
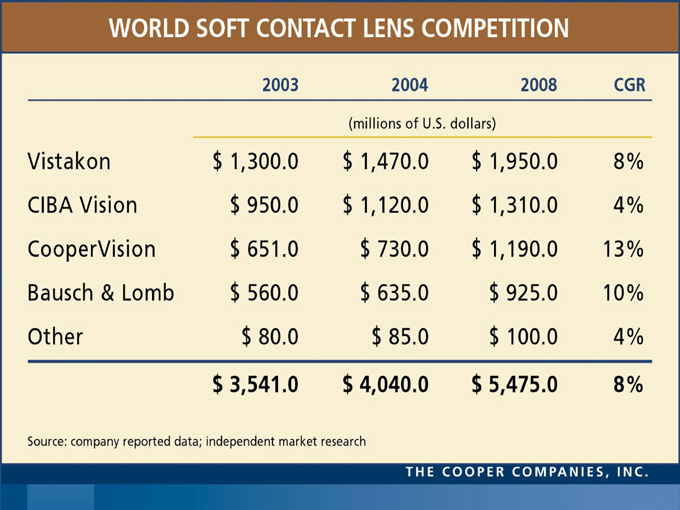
WORLD SOFT CONTACT LENS COMPETITION
2003 2004 2008 CGR
millions of U.S. dollars
Vistakon $1,300.0 $1,470.0 $1,950.0 8%
CIBA Vision $950.0 $1,120.0 $1,310.0 4%
CooperVision $651.0 $730.0 $1,190.0 13%
Bausch & Lomb $560.0 $635.0 $925.0 10%
Other $80.00 $85.0 $100.0 4%
$3,541.0 $4,040.0 $5,475.0 8%
Source: Company reported data; independent market research
THE COOPER COMPANIES, INC.
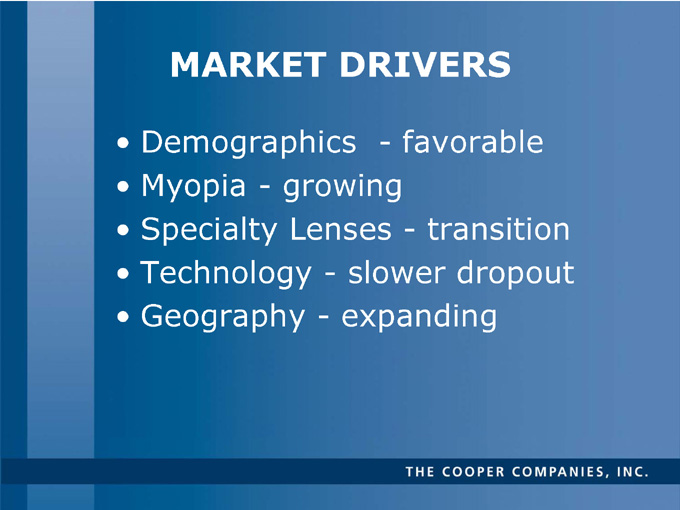
MARKET DRIVERS
Demographics - favorable
Myopia - growing
Specialty Lenses - transition
Technology - slower dropout
Geography - expanding
THE COOPER COMPANIES, INC.
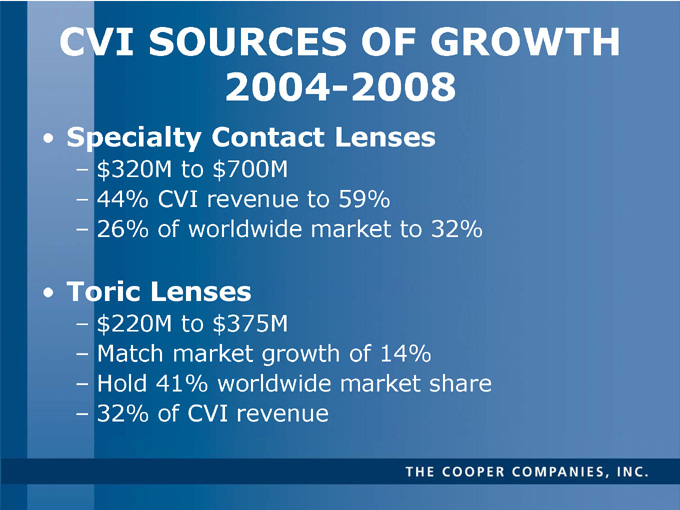
CVI SOURCES OF GROWTH
2004-2008
Specialty Contact Lenses
– $ 320M to $700M
– 44% CVI revenue to 59%
– 26% of worldwide market to 32%
Toric Lenses
– $ 220M to $375M
– Match market growth of 14%
– Hold 41% worldwide market share
– 32% of CVI revenue
THE COOPER COMPANIES, INC.
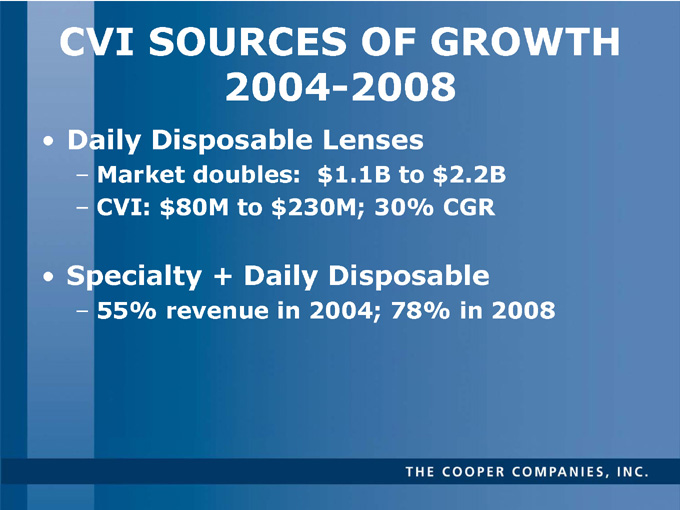
CVI SOURCES OF GROWTH
2004-2008
Daily Disposable Lenses
– Market doubles: $1.1B to $2.2B
– CVI: $80M to $230M; 30% CGR
Specialty + Daily Disposable
– 55% revenue in 2004; 78% in 2008
THE COOPER COMPANIES, INC.
Greg Fryling
President and
Chief Operating Officer
CooperVision, Inc.
THE COOPER COMPANIES, INC.

THE COOPER COMPANIES, INC.
Why We Did the Deal
Grow revenue faster than the two companies could achieve on a stand-alone basis
$ 50 Million Operating Income Synergies After 3 Years
THE COOPER COMPANIES, INC.
Synergistic Revenue Opportunities
THE COOPER COMPANIES, INC.

Revenue Opportunities
Complimentary Product Lines
Product Category CVI OSI Market Size (Billion)
Daily Disposable No Yes $1.2
2 Week & Monthly Sphere Yes Yes $1.7
Color Yes Yes $0.3
Toric Yes Yes $0.5
Multifocal (Disposable) Yes No $ 0.1
Silicon Hydrogel * (Continuous Wear) No No $ 0.2
Total $ 4.0
*Launch Date FY05-06
Ability to bundle or pull through a family of products
THE COOPER COMPANIES, INC.
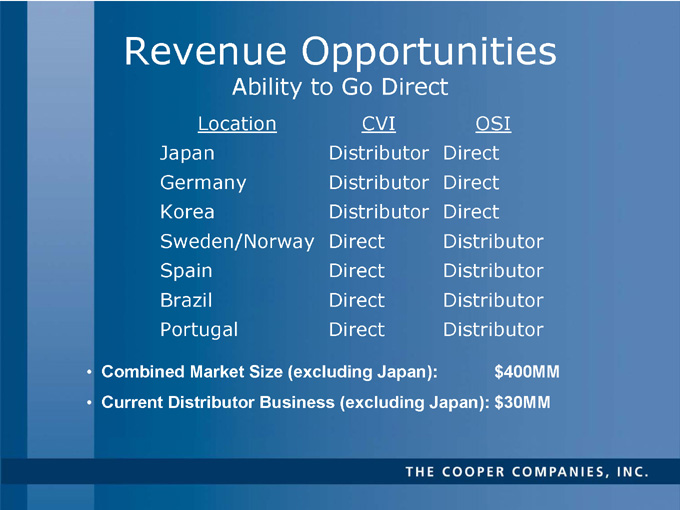
Revenue Opportunities
Ability to Go Direct
Location CVI OSI
Japan Distributor Direct
Germany Distributor Direct
Korea Distributor Direct
Sweden/Norway Direct Distributor
Spain Direct Distributor
Brazil Direct Distributor
Portugal Direct Distributor
Combined Market Size (excluding Japan): $400MM
Current Distributor Business (excluding Japan): $30MM
THE COOPER COMPANIES, INC.
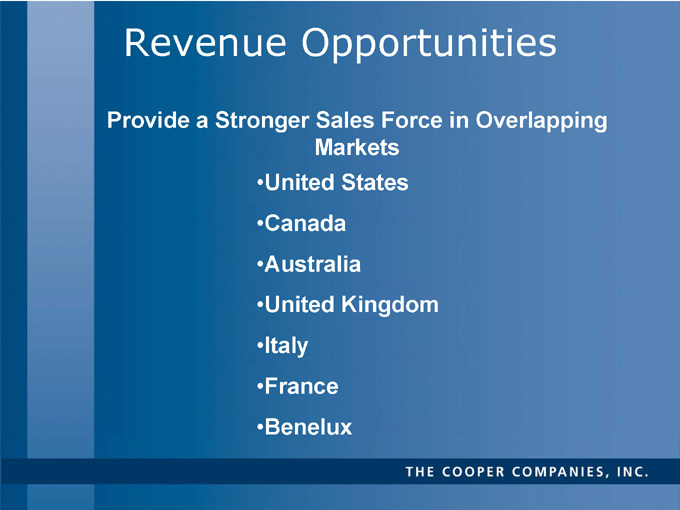
Revenue Opportunities
Provide a Stronger Sales Force in Overlapping Markets
United States
Canada
Australia
United Kingdom
Italy
France
Benelux
THE COOPER COMPANIES, INC.
Revenue Opportunities
Stronger R&D Organization to Provide
New Products to the Market over a Quicker Timeline
THE COOPER COMPANIES, INC.
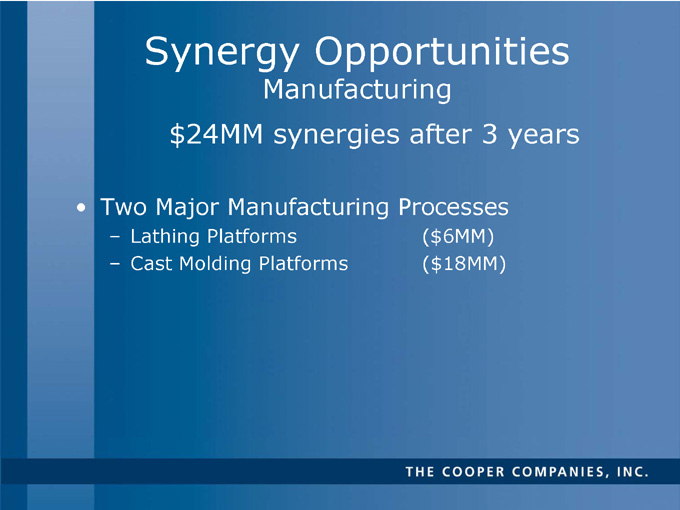
Synergy Opportunities
Manufacturing
$24MM synergies after 3 years
Two Major Manufacturing Processes
Lathing Platforms ($6MM)
Cast Molding Platforms ($18MM)
THE COOPER COMPANIES, INC.

Lathing MFG Synergies
(Three Years Out)
$6.0M Annual Savings
$ 1.4 from Facilities Consolidation
$ 4.6 from Manufacturing Platform Conversions (including labor)
Consolidate Lathing locations (currently 7)
Total Value of Production: $45MM
FY05 Budget Unit Production: 21MM
Revenue from Lathing Operations: ~$150MM
THE COOPER COMPANIES, INC.
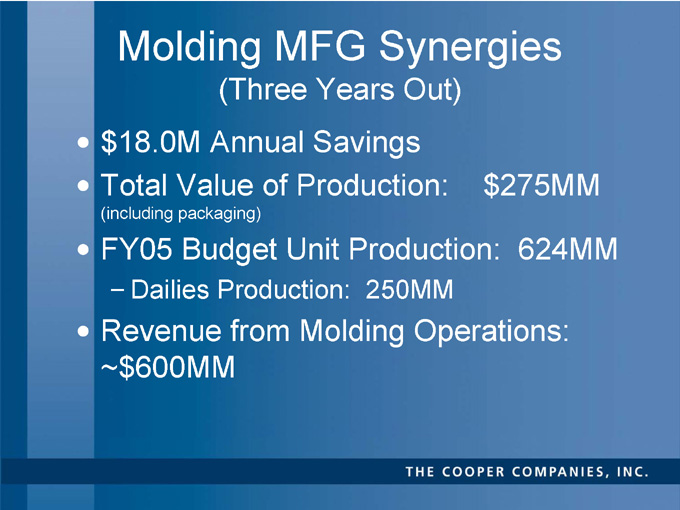
Molding MFG Synergies
(Three Years Out)
$18.0M Annual Savings
Total Value of Production: $275MM
(including packaging)
FY05 Budget Unit Production: 624MM
Dailies Production: 250MM
Revenue from Molding Operations: ~$600MM
THE COOPER COMPANIES, INC.
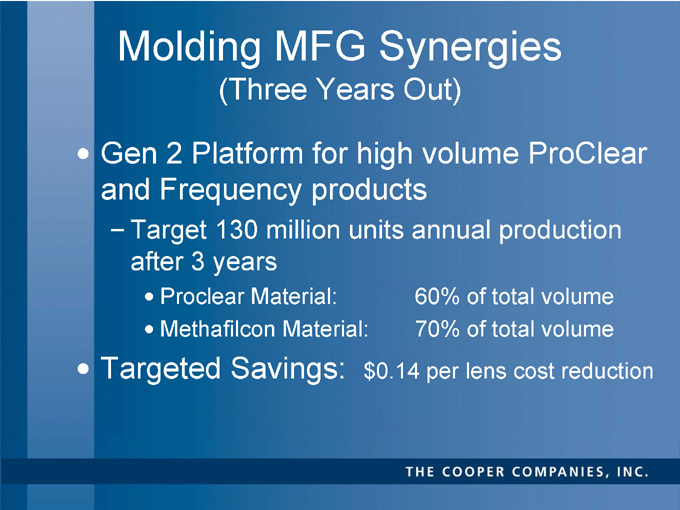
Molding MFG Synergies
(Three Years Out)
Gen 2 Platform for high volume ProClear and Frequency products
Target 130 million units annual production after 3 years
Proclear Material: 60% of total volume
Methafilcon Material: 70% of total volume
Targeted Savings: $0.14 per lens cost reduction
THE COOPER COMPANIES, INC.
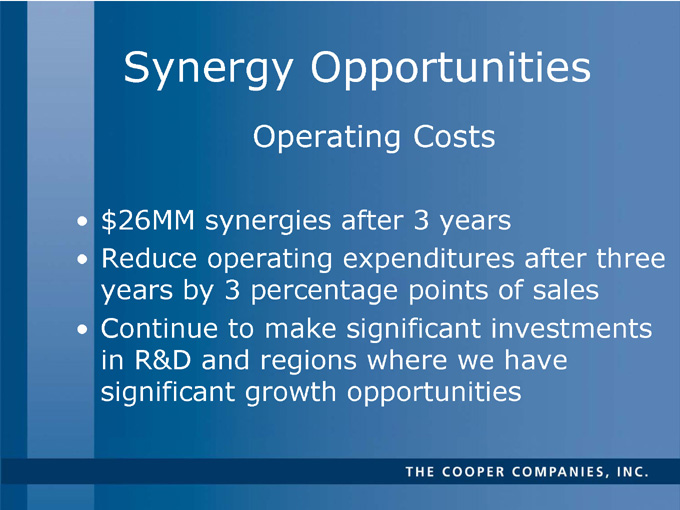
Synergy Opportunities
Operating Costs
$26MM synergies after 3 years
Reduce operating expenditures after three years by 3 percentage points of sales
Continue to make significant investments in R&D and regions where we have significant growth opportunities
THE COOPER COMPANIES, INC.
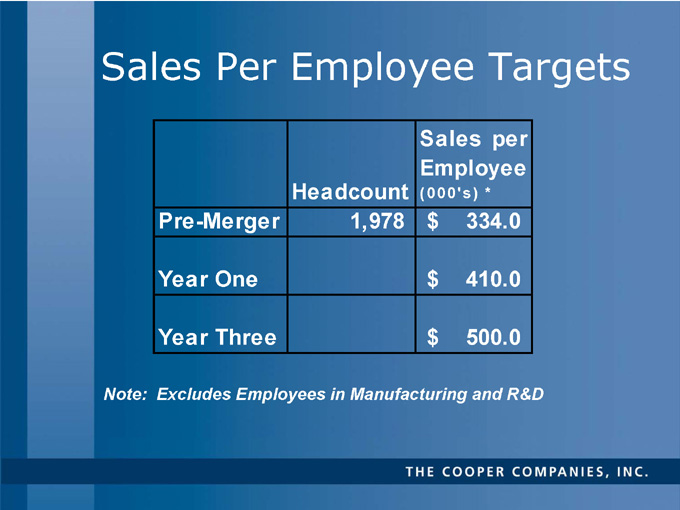
Sales Per Employee Targets
Sales per Employee Headcount (000’s) *
Pre-Merger 1,978 $ 334.0
Year One $ 410.0
Year Three $ 500.0
Note: Excludes Employees in Manufacturing and R&D
THE COOPER COMPANIES, INC.
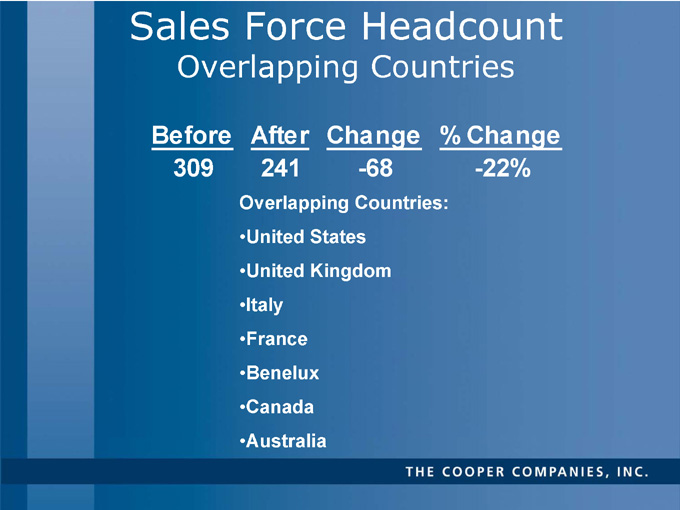
Sales Force Headcount
Overlapping Countries
Before After Change % Change
309 241 -68 -22%
Overlapping Countries:
United States
United Kingdom
Italy
France
Benelux
Canada
Australia
THE COOPER COMPANIES, INC.
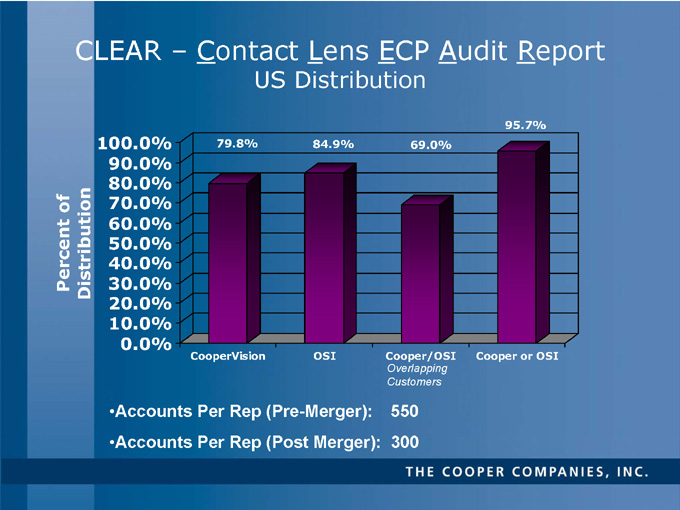
CLEAR – Contact Lens ECP Audit Report
US Distribution
95.7% 79.8% 84.9% 69.0%
100.0%
90.0%
80.0%
70.0%
60.0%
Percent of Distribution
50.0%
40.0%
30.0%
20.0%
10.0%
0.0%
CooperVision
OSI
Cooper/OSI
Overlapping Customers
Cooper or OSI
Accounts Per Rep (Pre-Merger): 550
Accounts Per Rep (Post Merger): 300
THE COOPER COMPANIES, INC.
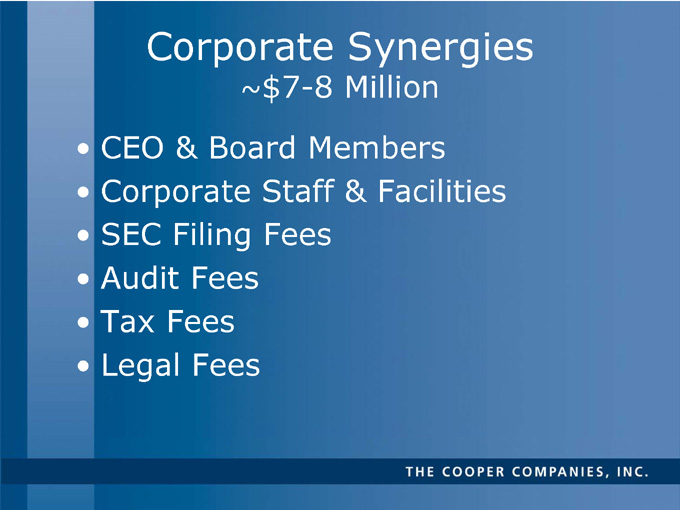
Corporate Synergies
~$ 7-8 Million
CEO & Board Members
Corporate Staff & Facilities
SEC Filing Fees
Audit Fees
Tax Fees
Legal Fees
THE COOPER COMPANIES, INC.
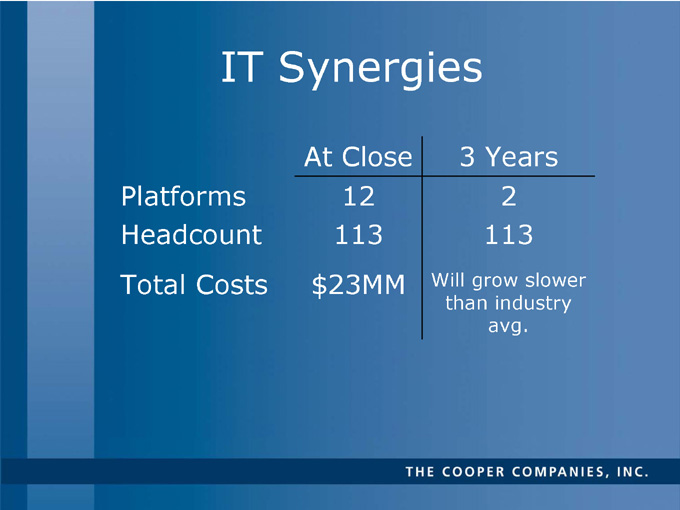
IT Synergies
At Close 3 Years
Platforms 12 2
Headcount 113 113
Total Costs $23MM Will grow slower than industry avg.
THE COOPER COMPANIES, INC.
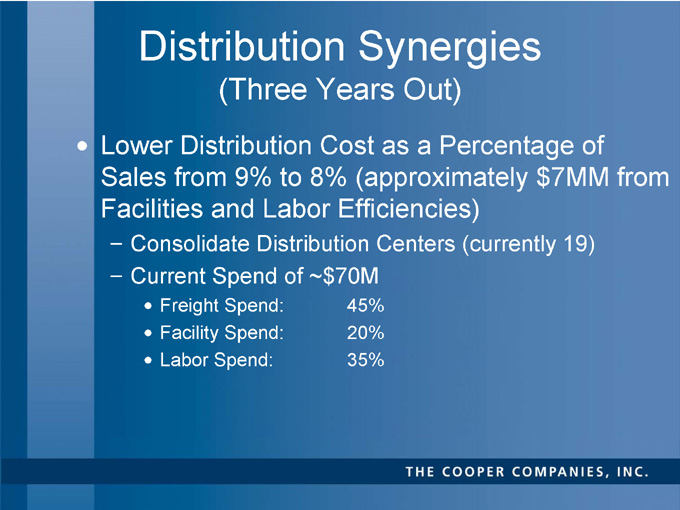
Distribution Synergies
(Three Years Out)
Lower Distribution Cost as a Percentage of Sales from 9% to 8% (approximately $7MM from Facilities and Labor Efficiencies)
Consolidate Distribution Centers (currently 19)
Current Spend of ~$70M
Freight Spend: 45%
Facility Spend: 20%
Labor Spend: 35%
THE COOPER COMPANIES, INC.
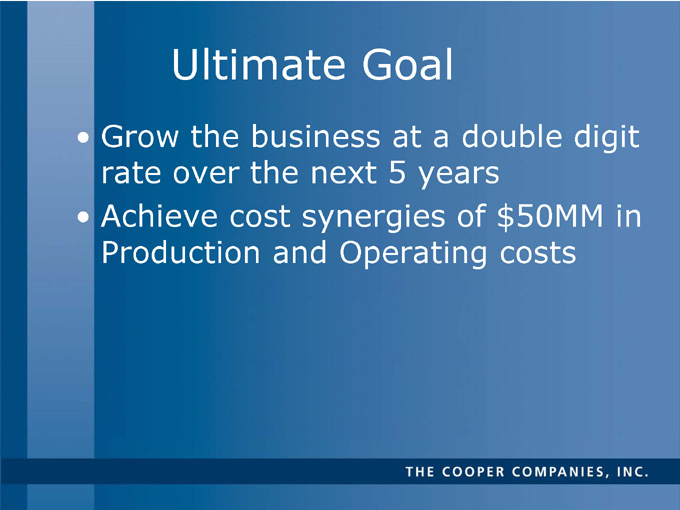
Ultimate Goal
Grow the business at a double digit rate over the next 5 years
Achieve cost synergies of $50MM in Production and Operating costs
THE COOPER COMPANIES, INC.

CVI Philosophy
Best of the Best
Best Practices
Maintain a Passionate Spirit
THE COOPER COMPANIES, INC.

CVI Organization
Greg Fryling
President & COO
***
Claire Dickerson
Exec. Administrator
John Calcagno
Chief Financial Officer
Global Finance
Global IT
Greg Zimmerman
Vice President
HR
Jeff McLean
President
US
Jack Gibson
President
Canada
Jim Welch
President
International
Northern Europe-Andrew Sedgwick
Southern Europe-Giacomo Grassi
Asia Pacific-Michael Kotow
Japan-Masakazu Niwa
Latin America-Juan Carlos Aragon
John Weber
Vice President
WW Operations
Christopher Marmo
Vice President
R & D
Christine Moench
Director
RA / QA
Dave Fancher
President
CooperVision Surgical
THE COOPER COMPANIES, INC.
Chris Marmo
Vice President
Research & Development
CooperVision, Inc.
THE COOPER COMPANIES, INC.
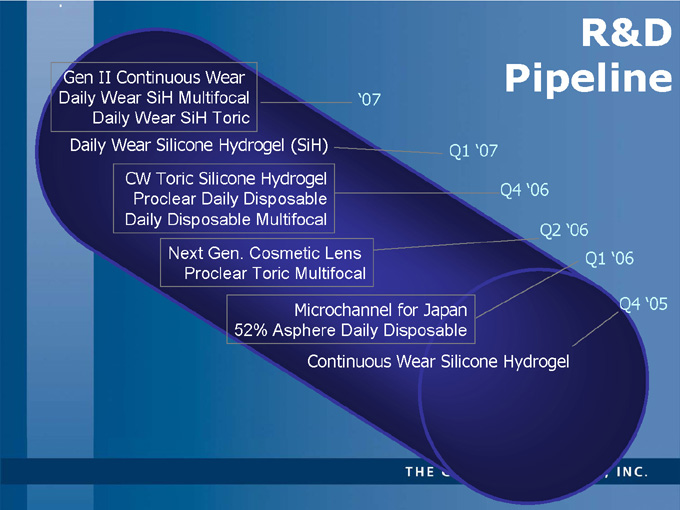
R&D
Pipeline
Gen II Continuous Wear
Daily Wear SiH Multifocal
Daily Wear SiH Toric ‘07
Daily Wear Silicone Hydrogel (SiH) Q1 ‘07
CW Toric Silicone Hydrogel Q4 ‘06
Proclear Daily Disposable
Daily Disposable Multifocal
Next Gen. Cosmetic Lens
Proclear Toric Multifocal Q2 ‘06
Microchannel for Japan Q1 ‘06
52% Asphere Daily Disposable
Continuous Wear Silicone Hydrogel Q4 ‘05
THE COOPER COMPANIES, INC.
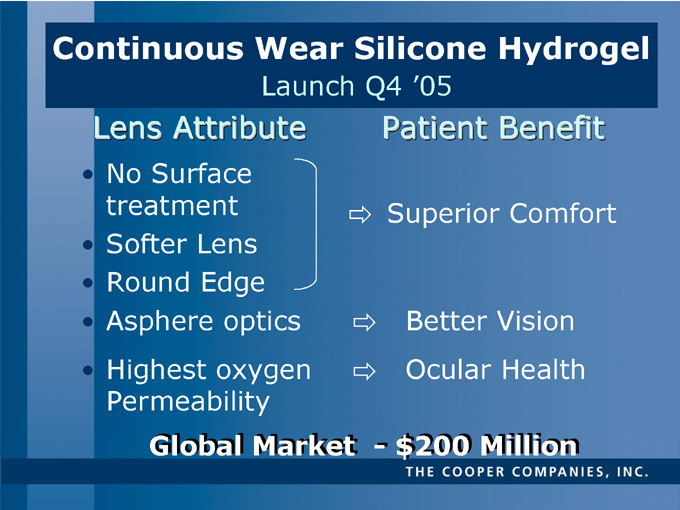
Continuous Wear Silicone Hydrogel
Launch Q4 ‘05
Lens Attribute Patient Benefit
No Surface treatment
Softer Lens
Round Edge Superior Comfort
Asphere optics Better Vision
Highest oxygen
Permeability Ocular Health
Global Market - $200 Million
THE COOPER COMPANIES, INC.
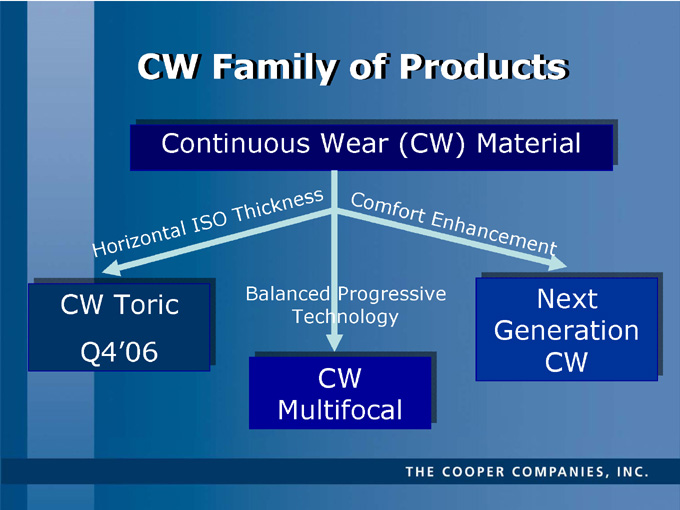
CW Family of Products
Continuous Wear (CW) Material
Horizontal ISO Thickness
Comfort Enhancement
CW Toric Q4’06
Balanced Progressive
Technology
Next Generation CW
CW Multifocal
THE COOPER COMPANIES, INC.
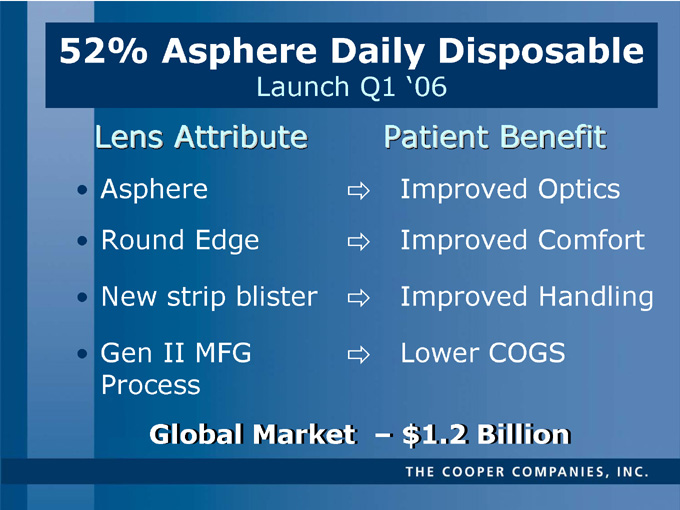
52% Asphere Daily Disposable
Launch Q1 ‘06
Lens Attribute Patient Benefit
Asphere Improved Optics
Round Edge Improved Comfort
New strip blister Improved Handling
Gen II MFG Process Lower COGS
Global Market – $1.2 Billion
THE COOPER COMPANIES, INC.
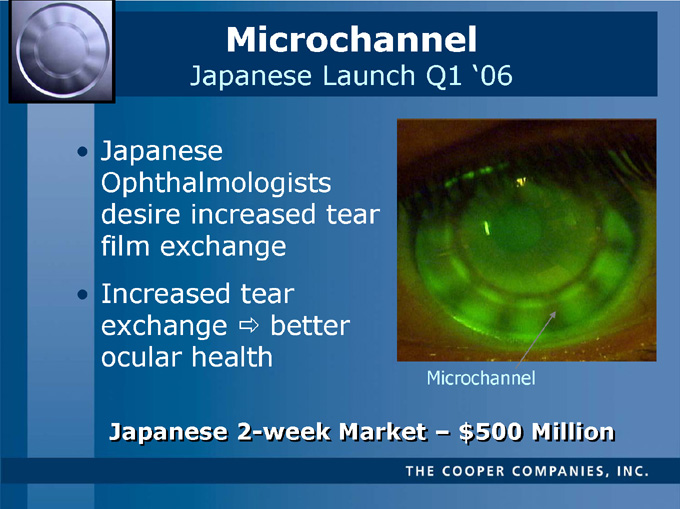
Microchannel
Japanese Launch Q1 ‘06
Japanese Ophthalmologists desire increased tear film exchange
Increased tear exchange better ocular health
Microchannel
Japanese 2-week Market – $500 Million
THE COOPER COMPANIES, INC.

Proclear Toric Multifocal
Launch Q2 ‘06
Lens Attribute Patient Benefit
Proclear Material Increased end of day comfort
Toric Expertise
Consistent Visual Outcome
Balanced Progressive Multifocal Technology
THE COOPER COMPANIES, INC.
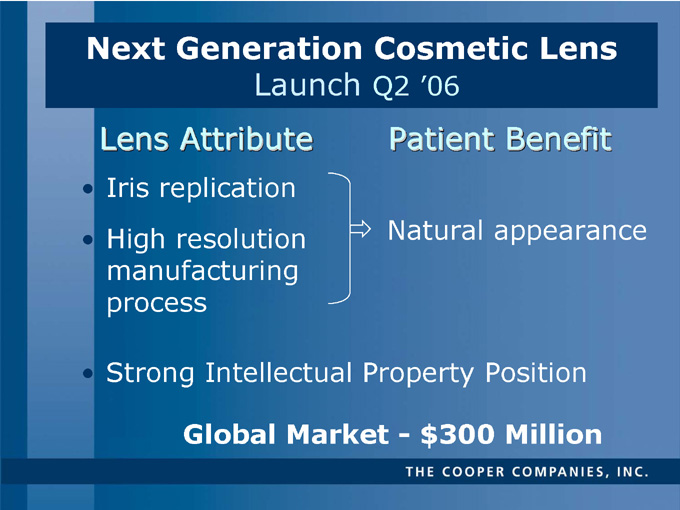
Next Generation Cosmetic Lens
Launch Q2 ‘06
Lens Attribute Patient Benefit
Iris replication
High resolution manufacturing process
Natural appearance
Strong Intellectual Property Position
Global Market - $300 Million
THE COOPER COMPANIES, INC.
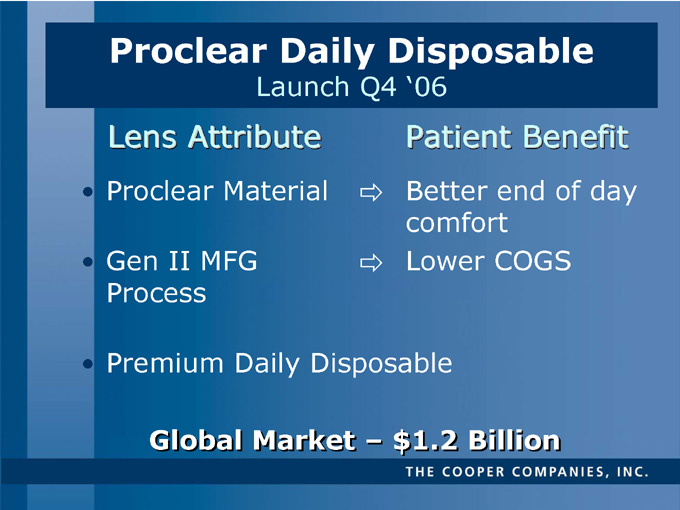
Proclear Daily Disposable
Launch Q4 ‘06
Lens Attribute Patient Benefit
Proclear Material
Better end of day comfort
Gen II MFG Process
Lower COGS
Premium Daily Disposable
Global Market – $1.2 Billion
THE COOPER COMPANIES, INC.
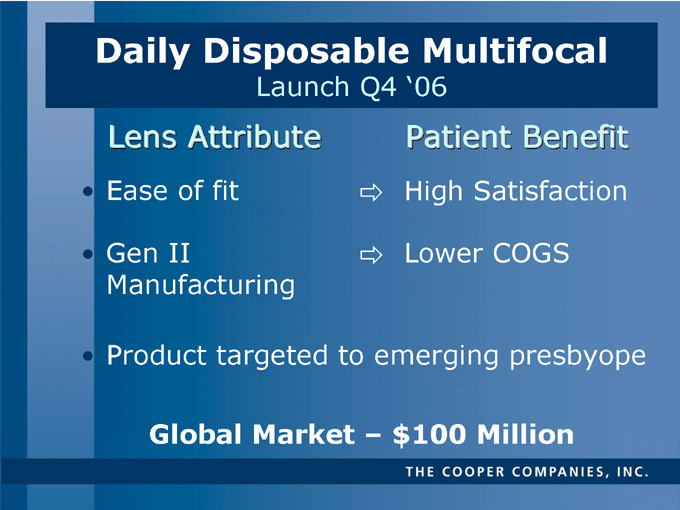
Daily Disposable Multifocal
Launch Q4 ‘06
Lens Attribute
Patient Benefit
Ease of fit High Satisfaction
Gen II Lower COGS Manufacturing
Product targeted to emerging presbyope
Global Market – $100 Million
THE COOPER COMPANIES, INC.
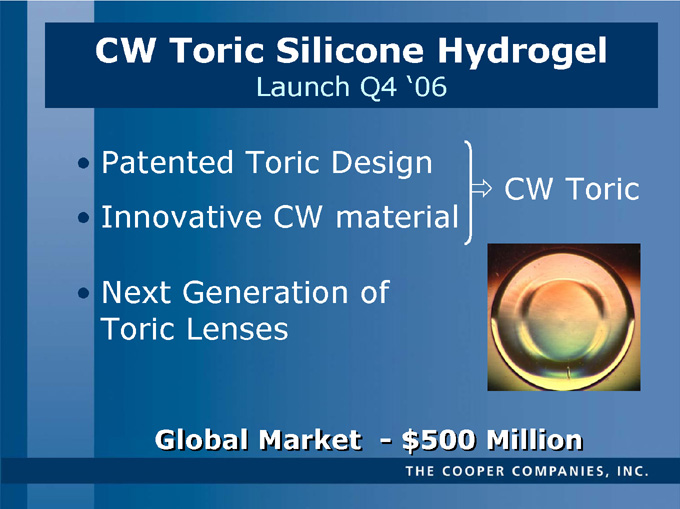
CW Toric Silicone Hydrogel
Launch Q4 ‘06
Patented Toric Design
CW Toric
Innovative CW material
Next Generation of Toric Lenses
Global Market - $500 Million
THE COOPER COMPANIES, INC.
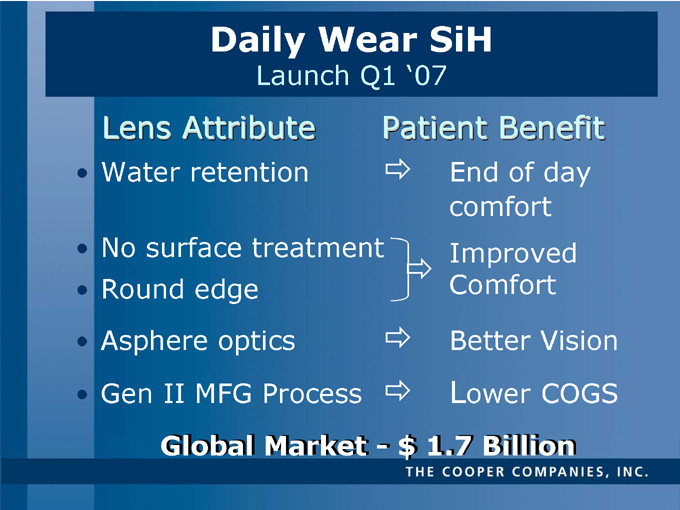
Daily Wear SiH
Launch Q1 ‘07
Lens Attribute Patient Benefit
Water retention
End of day comfort
No surface treatment
Improved Comfort
Round edge
Asphere optics
Better Vision
Gen II MFG Process
Lower COGS
Global Market - $ 1.7 Billion
THE COOPER COMPANIES, INC.
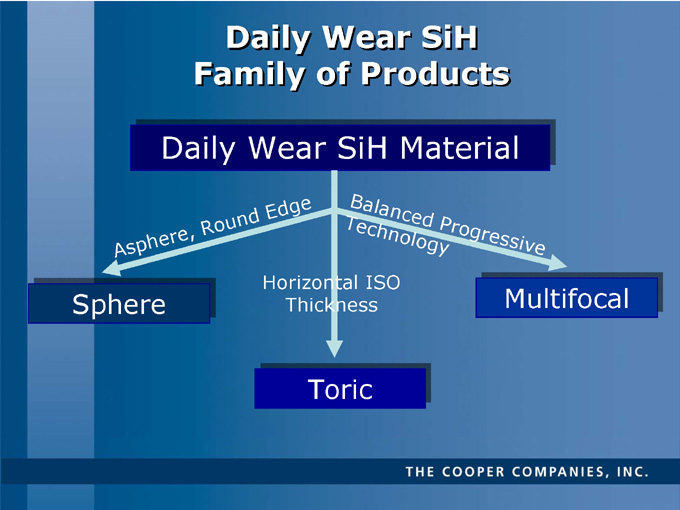
Daily Wear SiH
Family of Products
Daily Wear SiH Material
Asphere, Round Edge
Balanced Progressive
Technology
Sphere
Horizontal ISO
Thickness
Multifocal
Toric
THE COOPER COMPANIES, INC.
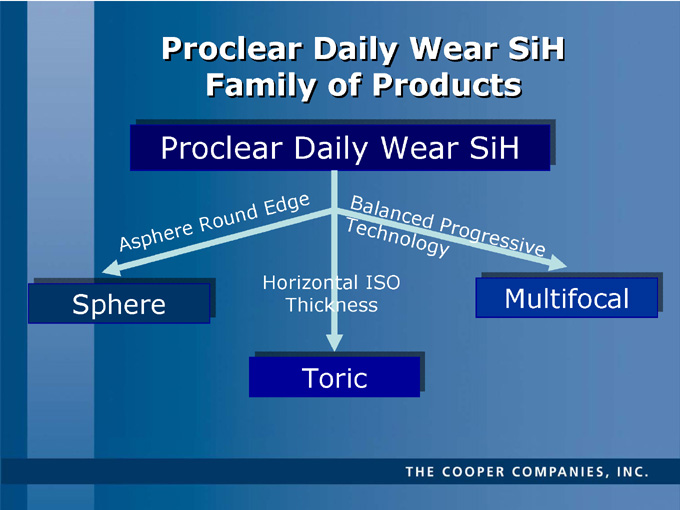
Proclear Daily Wear SiH
Family of Products
Proclear Daily Wear SiH
Asphere Round Edge
Balanced Progressive
Technology
Sphere
Horizontal ISO
Thickness
Multifocal
Toric
THE COOPER COMPANIES, INC.
Bob Weiss
Executive Vice President
and Chief Financial Officer
The Cooper Companies, Inc.
THE COOPER COMPANIES, INC.
Financial Highlights
THE COOPER COMPANIES, INC.
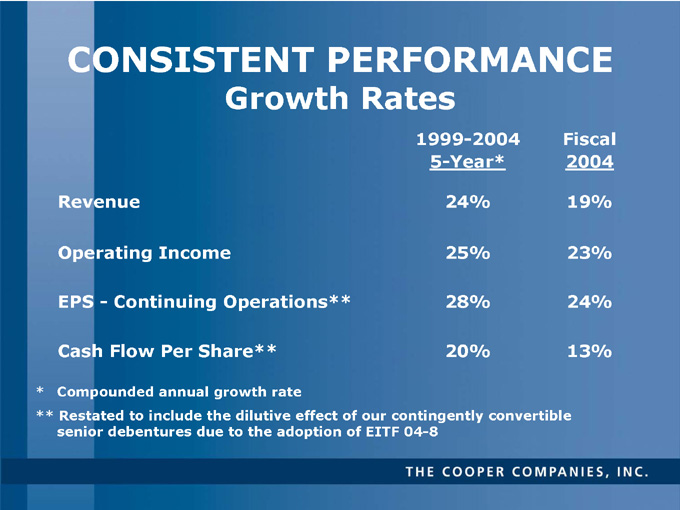
CONSISTENT PERFORMANCE
Growth Rates
1999-2004
5-Year*
24%
25%
28%
20%
Fiscal
2004
19%
23%
24%
13%
Revenue
Operating Income
EPS - Continuing Operations**
Cash Flow Per Share**
* Compounded annual growth rate
** Restated to include the dilutive effect of our contingently convertible senior debentures due to the adoption of EITF 04-8
THE COOPER COMPANIES, INC.
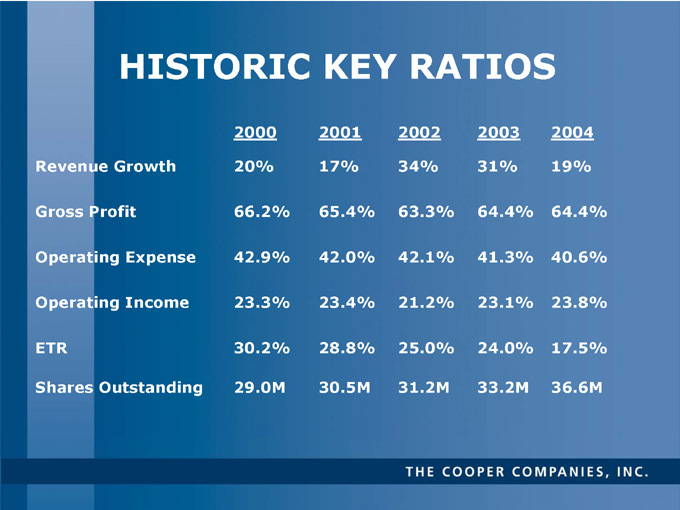
HISTORIC KEY RATIOS
2000
2001
2002
2003
2004
Revenue Growth
20%
17%
34%
31%
19%
Gross Profit
66.2%
65.4%
63.3%
64.4%
64.4%
Operating Expense
42.9%
42.0%
42.1%
41.3%
40.6%
Operating Income
23.3%
23.4%
21.2%
23.1%
23.8%
ETR
30.2%
28.8%
25.0%
24.0%
17.5%
Shares Outstanding
29.0M
30.5M
31.2M
33.2M
36.6M
THE COOPER COMPANIES, INC.
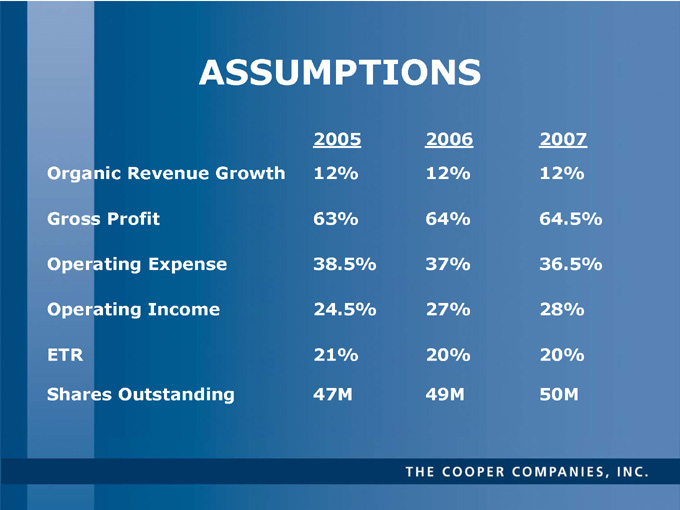
ASSUMPTIONS
2005 2006 2007
Organic Revenue Growth 12% 12% 12%
Gross Profit 63% 64% 64.5%
Operating Expense 38.5% 37% 36.5%
Operating Income 24.5% 27% 28%
ETR 21% 20% 20%
Shares Outstanding 47M 49M 50M
THE COOPER COMPANIES, INC.
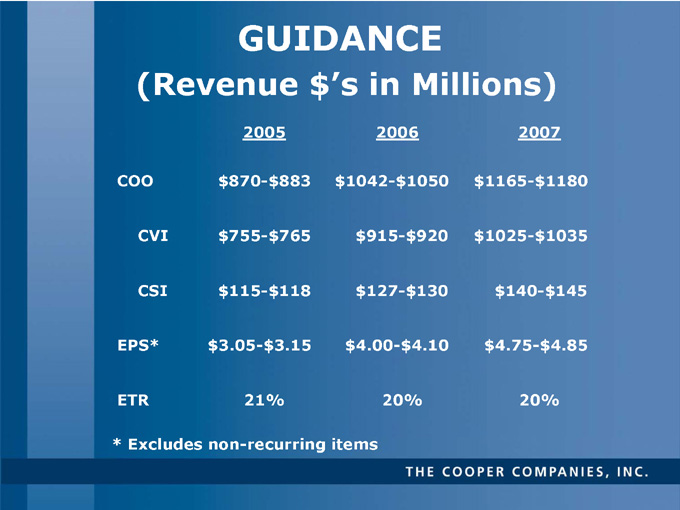
GUIDANCE
(Revenue $’s in Millions)
2005 2006 2007
COO $870-$883 $1042-$1050 $1165-$1180
CVI $755-$765 $915-$920 $1025-$1035
CSI $115-$118 $127-$130 $140-$145
EPS* $3.05-$3.15 $4.00-$4.10 $4.75-$4.85
ETR 21% 20% 20%
* Excludes non-recurring items
THE COOPER COMPANIES, INC.
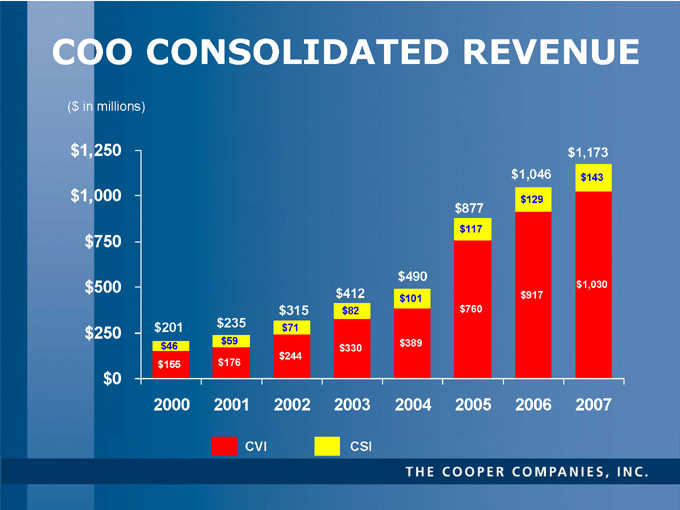
COO CONSOLIDATED REVENUE
($ in millions)
$1,250
$1,000
$750
$500
$250
$0
$1,173
$1,046
$143
$877
$490
$412
$315
$129
$235
$201
$117
$1,030
$101
$917
$82
$760
$71
$59
$389
$46
$330
$244
$155
$176
2000 2001 2002 2003 2004 2005 2006 2007
CVI CSI
THE COOPER COMPANIES, INC.
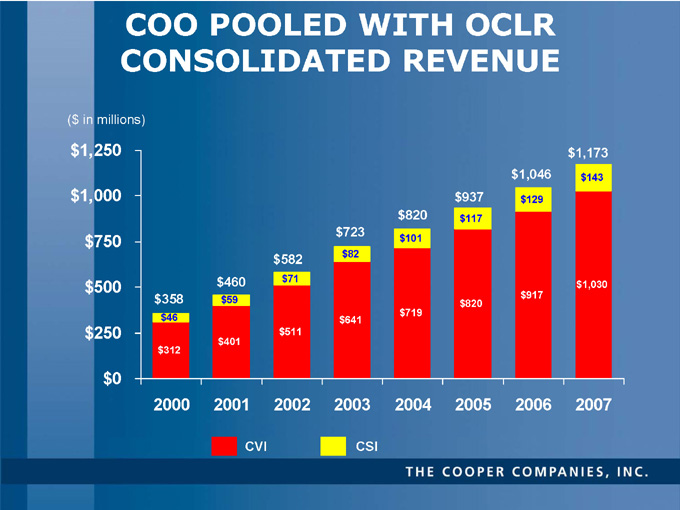
COO POOLED WITH OCLR CONSOLIDATED REVENUE
($ in millions)
$1,250
$1,173
$1,046
$143
$1,000
$937
$129
$820
$117
$723
$750
$101
$582
$82
$460
$71
$500
$1,030
$917
$358
$59
$820
$719
$46
$641
$250
$511
$401
$312
$0
2000
2001
2002
2003
2004
2005
2006
2007
CVI CSI
THE COOPER COMPANIES, INC.
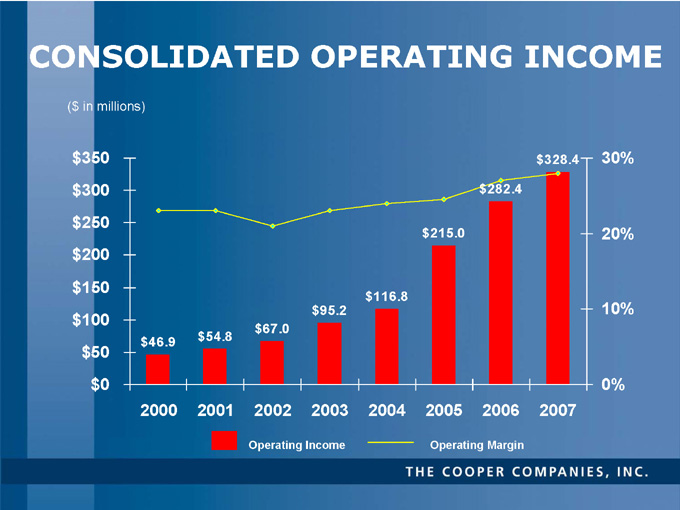
CONSOLIDATED OPERATING INCOME
($ in millions)
$350
$328.4
30%
$300
$282.4
$250
$215.0
20%
$200
$150
$116.8
$95.2
10%
$100
$67.0
$46.9
$54.8
$50
$0
0%
2000
2001
2002
2003
2004
2005
2006
2007
Operating Income Operating Margin
THE COOPER COMPANIES, INC.
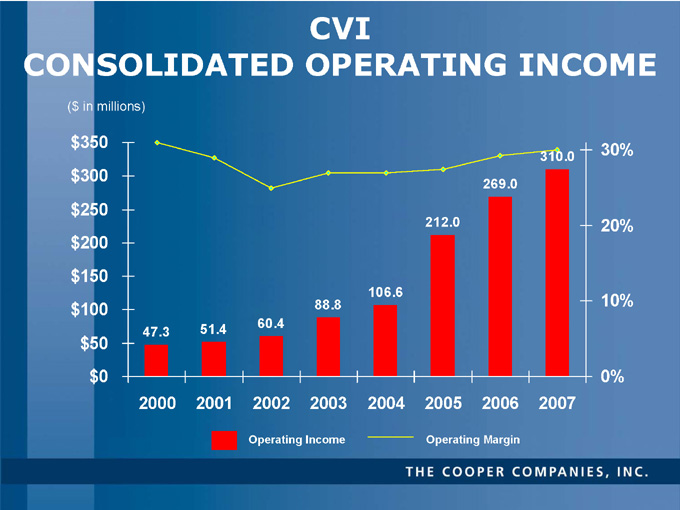
CVI
CONSOLIDATED OPERATING INCOME
($ in millions)
$350
30%
310.0
$300
269.0
$250
212.0
20%
$200
$150
106.6
88.8
10%
$100
51.4
60.4
47.3
$50
$0
0%
2000
2001
2002
2003
2004
2005
2006
2007
Operating Income Operating Margin
THE COOPER COMPANIES, INC.
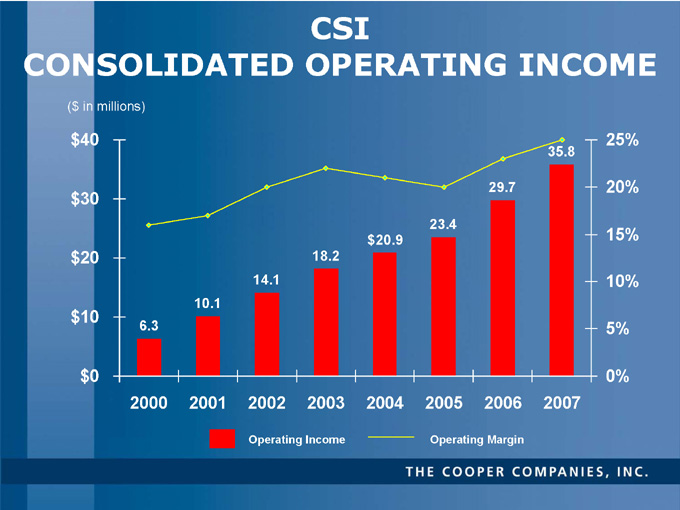
CSI
CONSOLIDATED OPERATING INCOME
($ in millions)
$40
25%
35.8
29.7
20%
$30
23.4
$20.9
15%
$20
18.2
14.1
10%
10.1
$10
6.3
5%
$0
0%
2000
2001
2002
2003
2004
2005
2006
2007
Operating Income - Operating Margin
THE COOPER COMPANIES, INC.
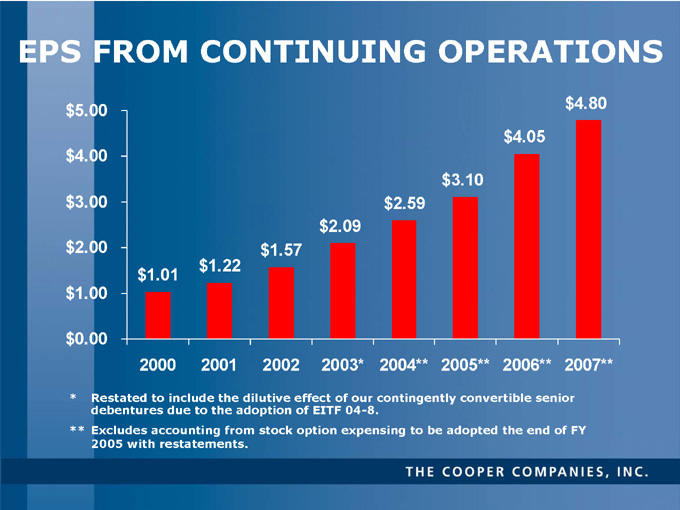
EPS FROM CONTINUING OPERATIONS
$5.00
$4.80
$4.05
$4.00
$3.10
$3.00
$2.59
$2.09
$2.00
$1.57
$1.22
$1.01
$1.00
$0.00
2000
2001
2002
2003*
2004**
2005**
2006**
2007**
*Restated to include the dilutive effect of our contingently convertible senior debentures due to the adoption of EITF 04-8.
**Excludes accounting from stock option expensing to be adopted the end of FY 2005 with restatements.
THE COOPER COMPANIES, INC.
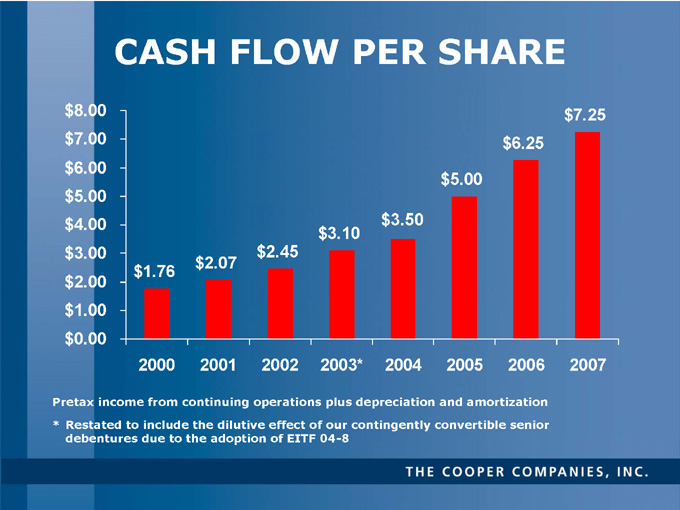
CASH FLOW PER SHARE
$8.00
$7.25
$7.00
$6.25
$6.00
$5.00
$5.00
$4.00
$3.50
$3.10
$3.00
$2.45
$2.07
$1.76
$2.00
$1.00
$0.00
2000
2001
2002
2003*
2004
2005
2006
2007
Pretax income from continuing operations plus depreciation and amortization
* Restated to include the dilutive effect of our contingently convertible senior debentures due to the adoption of EITF 04-8
THE COOPER COMPANIES, INC.

LIQUIDITY
Cash Flow from Operations
NOL’s
Free Cash Flow
THE COOPER COMPANIES, INC.
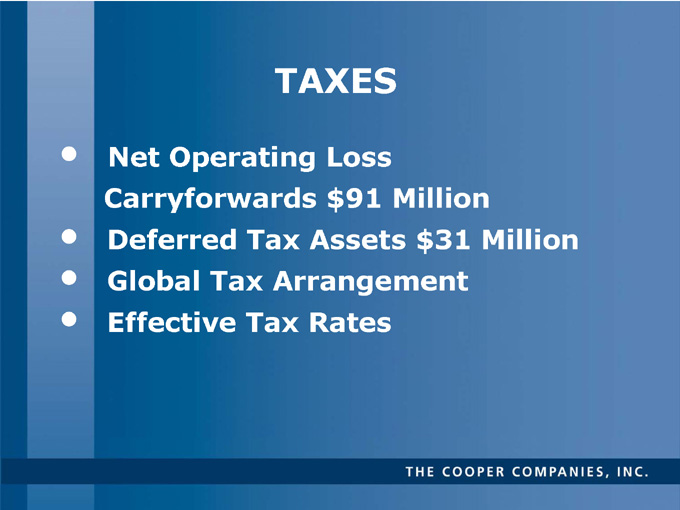
TAXES
Net Operating Loss Carryforwards $91 Million
Deferred Tax Assets $31 Million
Global Tax Arrangement
Effective Tax Rates
THE COOPER COMPANIES, INC.
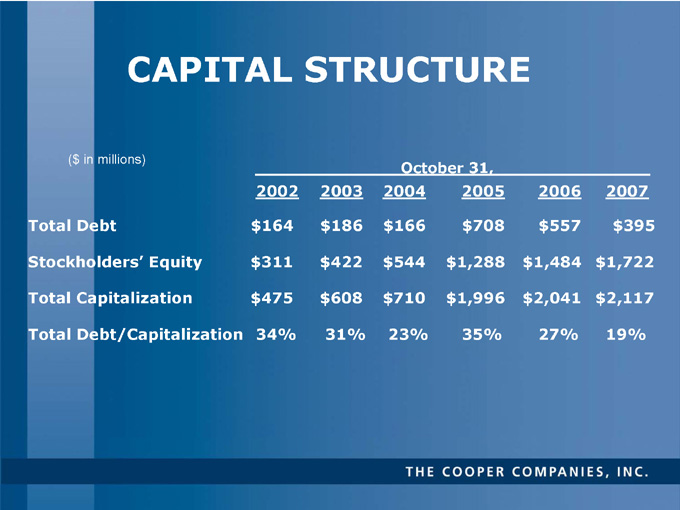
CAPITAL STRUCTURE
($ in millions)
October 31,
2002
2003
2004
2005
2006
2007
Total Debt
$164
$186
$166
$708
$557
$395
Stockholders’ Equity
$311
$422
$544
$1,288
$1,484
$1,722
Total Capitalization
$475
$608
$710
$1,996
$2,041
$2,117
Total Debt/Capitalization
34%
31%
23%
35%
27%
19%
THE COOPER COMPANIES, INC.
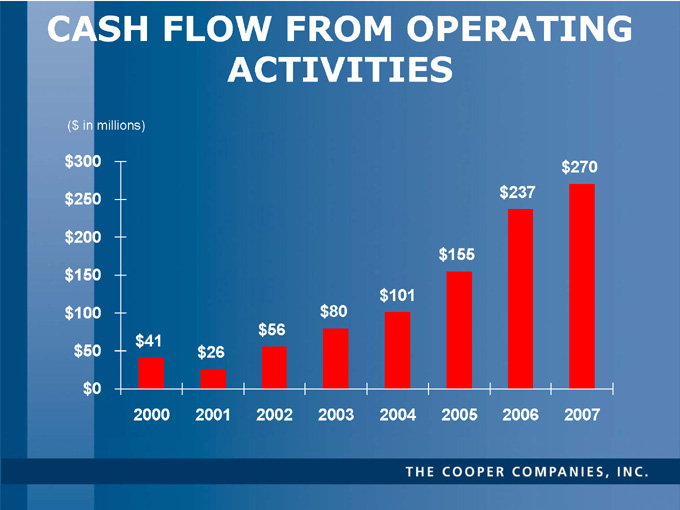
CASH FLOW FROM OPERATING
ACTIVITIES
($ in millions)
$300
$270
$250
$237
$200
$155
$150
$101
$100
$80
$56
$41
$50
$26
$0
2000
2001
2002
2003
2004
2005
2006
2007
THE COOPER COMPANIES, INC.
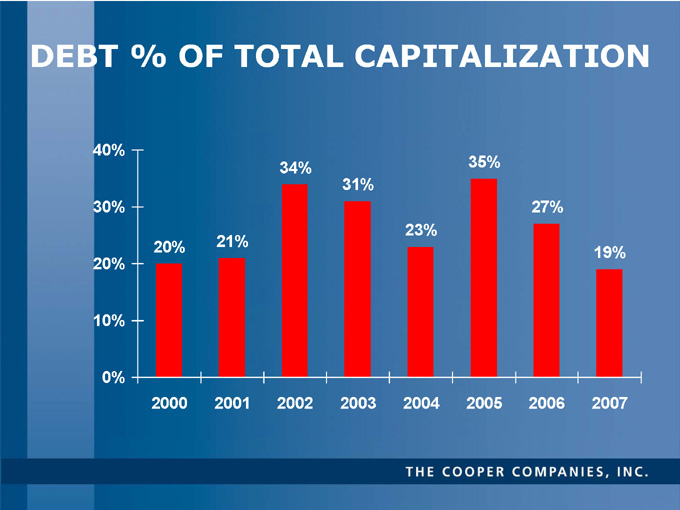
DEBT % OF TOTAL CAPITALIZATION
40%
34%
35%
31%
30%
27%
23%
20%
21%
19%
20%
10%
0%
2000
2001
2002
2003
2004
2005
2006
2007
THE COOPER COMPANIES, INC.
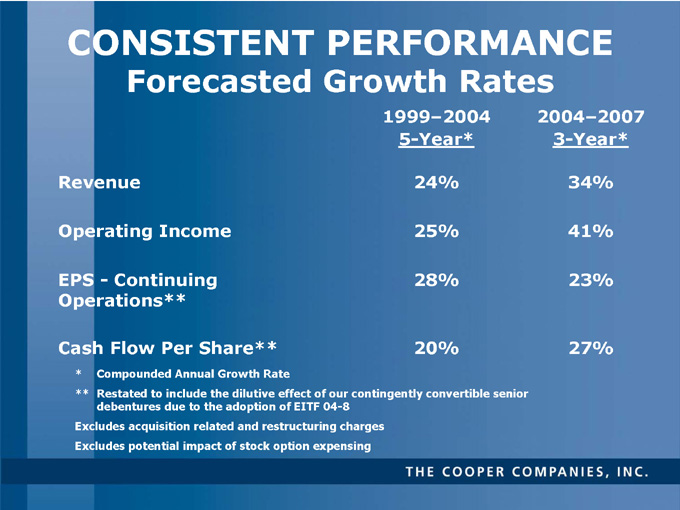
CONSISTENT PERFORMANCE
Forecasted Growth Rates
1999–2004
2004–2007
5-Year*
3-Year*
Revenue 24% 34%
Operating Income 25% 41%
EPS - Continuing 28% 23%
Operations**
Cash Flow Per Share** 20% 27%
* Compounded Annual Growth Rate
** Restated to include the dilutive effect of our contingently convertible senior debentures due to the adoption of EITF 04-8 Excludes acquisition related and restructuring charges Excludes potential impact of stock option expensing
THE COOPER COMPANIES, INC.
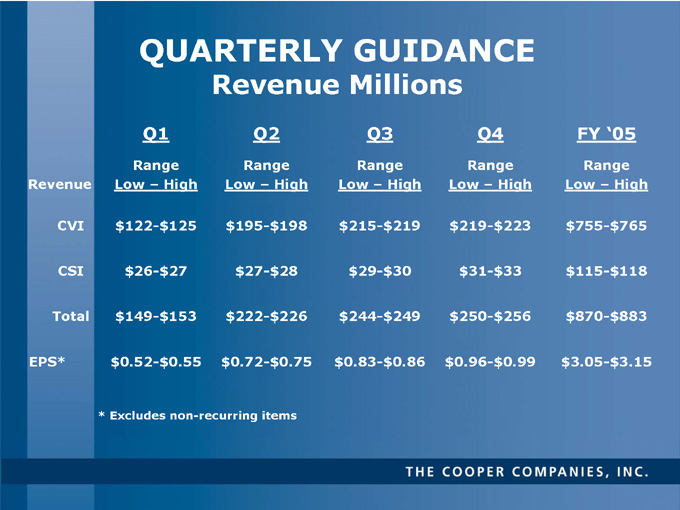
QUARTERLY GUIDANCE
Revenue Millions
Q1
Q2
Q3
Q4
FY ‘05
Range
Low – High
Range
Low – High
Range
Low – High
Range
Low – High
Range
Low – High
Revenue
CVI
$122-$125
$195-$198
$215-$219
$219-$223
$755-$765
CSI
$26-$27
$27-$28
$29-$30
$31-$33
$115-$118
Total
$149-$153
$222-$226
$244-$249
$250-$256
$870-$883
EPS*
$0.52-$0.55
$0.72-$0.75
$0.83-$0.86
$0.96-$0.99
$3.05-$3.15
* Excludes non-recurring items
THE COOPER COMPANIES, INC.
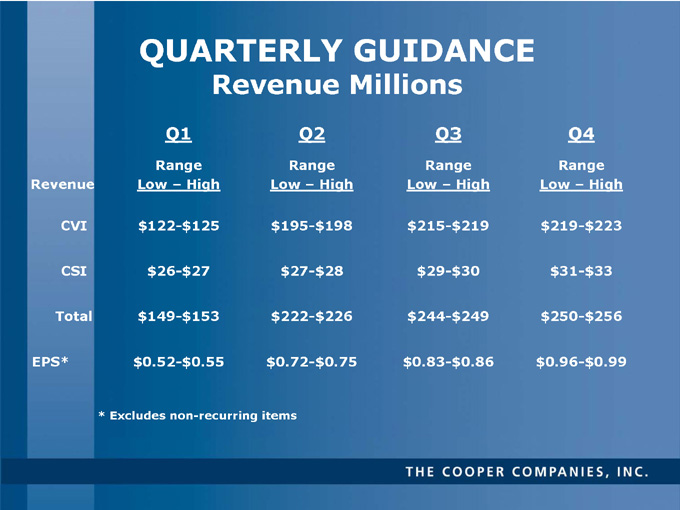
QUARTERLY GUIDANCE
Revenue Millions
Q1
Q2
Q3
Q4
Range
Range
Range
Range
Low – High
Low – High
Low – High
Low – High
Revenue
CVI
$122-$125
$195-$198
$215-$219
$219-$223
CSI
$26-$27
$27-$28
$29-$30
$31-$33
Total
$149-$153
$222-$226
$244-$249
$250-$256
EPS*
$0.52-$0.55
$0.72-$0.75
$0.83-$0.86
$0.96-$0.99
* Excludes non-recurring items
THE COOPER COMPANIES, INC.
THE COOPER COMPANIES, INC.