UNITED STATES
SECURITIES AND EXCHANGE COMMISSION
WASHINGTON, D. C. 20549
FORM N-CSR
Investment Company Act file number: 811-03632
Deutsche Tax Free Trust
(Exact Name of Registrant as Specified in Charter)
345 Park Avenue
New York, NY 10154-0004
(Address of Principal Executive Offices) (Zip Code)
Registrant’s Telephone Number, including Area Code: (212) 250-3220
Paul Schubert
345 Park Avenue
New York, NY 10154-0004
(Name and Address of Agent for Service)
| Date of fiscal year end: | 5/31 |
| | |
| Date of reporting period: | 5/31/2017 |
| ITEM 1. | REPORT TO STOCKHOLDERS |

May 31, 2017
Annual Report
to Shareholders
Deutsche Intermediate Tax/AMT Free Fund

Contents
3 Letter to Shareholders 5 Portfolio Management Review 10 Performance Summary 12 Portfolio Summary 13 Investment Portfolio 35 Statement of Assets and Liabilities 37 Statement of Operations 38 Statements of Changes in Net Assets 39 Financial Highlights 43 Notes to Financial Statements 51 Report of Independent Registered Public Accounting Firm 52 Information About Your Fund's Expenses 53 Tax Information 54 Advisory Agreement Board Considerations and Fee Evaluation 59 Board Members and Officers 64 Account Management Resources |
This report must be preceded or accompanied by a prospectus. To obtain a summary prospectus, if available, or prospectus for any of our funds, refer to the Account Management Resources information provided in the back of this booklet. We advise you to consider the fund's objectives, risks, charges and expenses carefully before investing. The summary prospectus and prospectus contain this and other important information about the fund. Please read the prospectus carefully before you invest.
Bond investments are subject to interest-rate, credit, liquidity and market risks to varying degrees. When interest rates rise, bond prices generally fall. Credit risk refers to the ability of an issuer to make timely payments of principal and interest. Although the fund seeks income that is exempt from federal income taxes, a portion of the fund’s distributions may be subject to federal, state and local taxes, including the alternative minimum tax. See the prospectus for details.
Deutsche Asset Management represents the asset management activities conducted by Deutsche Bank AG or any of its subsidiaries.
NOT FDIC/NCUA INSURED NO BANK GUARANTEE MAY LOSE VALUE NOT A DEPOSIT NOT INSURED BY ANY FEDERAL GOVERNMENT AGENCY
Letter to Shareholders
Dear Shareholder:
America’s economic expansion, now in its eighth year, continues. Much of the damage from the Great Recession appears to have been repaired, and growth, while not spectacular, has been sufficient to support a stronger labor market.
How long can this last? Our economists generally expect the economy to continue performing well this year. The labor markets should firm a bit further, and underlying inflation is edging closer to target.
Against this backdrop, the U.S. stock markets have set a series of record highs — thanks, in part, to expectations for a boost from Washington. The challenge is that the new administration is still finding its footing. So, while some combination of tax cuts, regulatory reforms, and spending increases in infrastructure and defense seems likely, the timing of implementation is unclear. It remains to be seen how the President’s legislative agenda will translate into tangible results after running the gauntlet of political procedure and bargaining.
We invite you to stay abreast of that process — and our economists’ take on the impact for the markets and investors — by visiting deutschefunds.com. The "Insights" section of our Web site offers up-to-date views on the global and domestic economies and the implications for each asset class.
Thank you, as always, for allowing us to serve your investment needs.
Best regards,

 |
Brian Binder President, Deutsche Funds |
Assumptions, estimates and opinions contained in this document constitute our judgment as of the date of the document and are subject to change without notice. Any projections are based on a number of assumptions as to market conditions and there can be no guarantee that any projected results will be achieved. Past performance is not a guarantee of future results.
Portfolio Management Review (Unaudited)
Overview of Market and Fund Performance
All performance information below is historical and does not guarantee future results. Returns shown are for Class A shares, unadjusted for sales charges. Investment return and principal fluctuate, so your shares may be worth more or less when redeemed. Current performance may differ from performance data shown. Please visit deutschefunds.com for the most recent month-end performance of all share classes. Fund performance includes reinvestment of all distributions. Unadjusted returns do not reflect sales charges and would have been lower if they had. Please refer to pages 10 through 11 for more complete performance information.
Investment Strategy The fund invests in a wide variety of municipal bonds. These include general obligation bonds, for which payments of principal and interest are secured by the full faith and credit of the issuer and usually supported by the issuer's taxing power. In addition, securities held may include revenue bonds, for which principal and interest are secured by revenues from tolls, rents or other fees gained from the facility that was built with the bond issue proceeds. The fund's management team seeks to hold municipal bonds that appear to offer the best opportunity to meet the fund's objectives of providing a high level of income exempt from regular federal income taxes and limiting principal fluctuation. In selecting securities, the managers weigh the impact of the economic outlook and potential interest rate movements to characteristics of specific securities such as differing coupons, maturity dates and call dates, and changes in supply and demand within the municipal market. Although portfolio management may adjust the dollar-weighted average effective maturity of the fund's portfolio between three and 10 years, it generally intends to keep it between five and 10 years. In determining the dollar-weighted average effective maturity, portfolio management uses the security's stated maturity or, if appropriate, an earlier date, reflecting a maturity-shortening device (such as a call, a put, prerefunding, prepayment or redemption provision, or a demand feature) which will likely cause the instrument to be repaid earlier than the stated maturity date. |
Deutsche Intermediate Tax/AMT Free Fund posted a return of 0.83% over the 12 months ended May 31, 2017. The overall municipal bond market, as measured by the unmanaged Bloomberg Barclays Municipal Bond Index, delivered a total return of 1.46% for the same period, while the fund's primary benchmark index, the Bloomberg Barclays 7-Year Municipal Bond Index, returned 1.78%. The average fund in the Morningstar Muni National Intermediate category returned 0.89% for the 12 months ended May 31, 2017.
For much of the 12-month period, municipal bond prices were supported by a global search for yield on the part of investors against a backdrop of exceptionally low interest rates overseas. Flows into tax-free mutual funds were consistently positive over the first several months of the period. However, the results of the November 8th, 2016 U.S. presidential election sent interest rates sharply higher with a corresponding negative impact on bond prices generally, as investors anticipated pro-growth policies under unified Republican control of the government. November and December saw significant outflows from tax-free mutual funds as individual investors sought shelter from rising rates. In addition, interest in municipals from insurance companies appeared to be dampened by uncertainty over the future of corporate tax rates under the new administration.
| "The results of the November 8th, 2016 U.S. presidential election sent interest rates sharply higher with a corresponding negative impact on bond prices generally." |
Demand for municipals would largely recover entering 2017. Interest rates stabilized, in part due to an easing in oil prices and inflation expectations in March. In addition, the failure of Republicans to agree on a plan to replace the Affordable Care Act tempered expectations with respect to the scope and timing of other Trump administration initiatives, including tax reform. Municipal returns were also aided by a drop in supply over the first several months of 2017 relative to the same period in 2016.
The municipal yield curve steepened modestly over the 12 months ended May 31, 2017, and yields rose along the length of the curve. Specifically, the two-year bond yield rose from 0.72% to 0.89%, the five-year yield rose from 1.09% to 1.22%, the 10-year rose from 1.66% to 1.90%, the 20-year rose from 2.25% to 2.59%, and the 30-year rose from 2.45% to 2.74%. (See the graph below for municipal bond yield changes from the beginning to the end of the period.) For the 12 months, municipal market credit spreads — the incremental yield offered by lower-quality issues vs. AAA-rated issues — generally tightened.
| Municipal Bond Yield Curve (as of 5/31/17 and 5/31/16) |
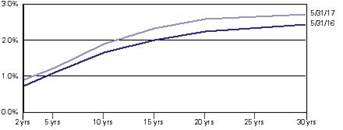 |
Source: Municipal Market Data, AAA-rated universe, as of 5/31/17.
Chart is for illustrative purposes only and does not represent any Deutsche AM product.
Positive and Negative Contributors to Fund Performance
We have maintained a slightly underweight duration relative to the benchmark index in an effort to maintain an interest rate sensitivity profile in line with the fund's peer group. This benefited performance relative to the benchmark as municipal yields rose over the 12-month period ended May 31, 2017. However, the positive contribution from the fund's duration stance was more than offset by our yield curve positioning. Specifically, we maintained exposure to bonds with maturities in the 10-to-15-year range, which was balanced by short-term holdings in the one-to-three-year range in order to maintain an overall average maturity within the fund's guidelines. This "barbelled" yield curve positioning detracted from relative performance, as the 6 to 8 year maturity range comprising the benchmark index outperformed for the 12 months on demand from separately managed accounts.
The fund's broad positioning with respect to credit quality was essentially a neutral factor in performance relative to the benchmark. The benefit to performance from an overweight to A-rated issues as spreads tightened was essentially offset by an underweight to issues in the BBB range. Within the single-A quality range, holdings of transportation bonds added the most to relative performance.
Outlook and Positioning
At the end of the period, municipal yields were at fairly low levels by historical standards, but were at more or less fair value relative to U.S. Treasuries. As of the end of May 2017, the 10-year municipal bond yield of 1.90% was 86.4% of the comparable-maturity U.S. Treasury bond yield before taking into account the tax advantage of municipals. The 30-year municipal yield of 2.74% was 95.8% of the comparable U.S. Treasury yield.
The municipal curve is at a roughly average steepness by historical standards, allowing incremental income to be gained by holding longer-term issues. We are currently evaluating premium coupon issues in the 10-to-15-year range that can provide a degree of protection against rising interest rates.
Credit spreads are narrow by historical standards in the wake of the global search for yield. With respect to the fund's credit positioning, we view spreads for issues rated A and BBB as tight and are being selective in adding exposure there. An additional factor to which we are paying close attention is that bond covenants have generally become less favorable following a period when new municipal issues have been subscribed several times over. We continue to perform careful analysis of each issue's risk/reward profile as we look for opportunities to add incremental yield, while also maintaining a strong focus on liquidity.
Portfolio Management Team
Ashton P. Goodfield, CFA, Managing Director
Co-Lead Portfolio Manager of the fund. Began managing the fund in 1990.
— Joined Deutsche Asset Management in 1986.
— Co-Head of Municipal Bonds.
— BA, Duke University.
Matthew J. Caggiano, CFA, Managing Director
Co-Lead Portfolio Manager of the fund. Began managing the fund in 2014.
— Joined Deutsche Asset Management in 1989.
— BS, Pennsylvania State University; MS, Boston College.
Peter Aloisi, CFA, Vice President
Portfolio Manager of the fund. Began managing the fund in 2014.
— Joined Deutsche Asset Management in 2010 with five years of industry experience; previously, served as an Associate at Banc of America Securities.
— Municipal Trader: Boston.
— BA and MBA, Boston College.
The views expressed reflect those of the portfolio management team only through the end of the period of the report as stated on the cover. The management team's views are subject to change at any time based on market and other conditions and should not be construed as a recommendation. Past performance is no guarantee of future results. Current and future portfolio holdings are subject to risk.
Terms to Know
The Bloomberg Barclays Municipal Bond Index is an unmanaged, market-value-weighted measure of municipal bonds issued across the United States. Index issues have a credit rating of at least Baa and a maturity of at least two years.
The Bloomberg Barclays 7-Year Municipal Bond Index is an unmanaged, total-return subset of the Barclays Municipal Bond Index. It includes maturities of six to eight years.
Index returns do not reflect fees or expenses and it is not possible to invest directly into an index.
The Morningstar Muni National Intermediate category consists of funds that invest in municipal bonds issued by various state and local governments to fund public projects and are free from federal taxes. These funds have an average duration of more than 4.5 years but less than 7 years, or average maturity of more than 5 years but less than 12 years.
The yield curve is a graph with a left-to-right line that shows how high or low yields are, from the shortest to the longest maturities. Typically (and when the yield curve is characterized as "steep," this is especially true), the line rises from left to right as investors who are willing to tie up their money for a longer period are rewarded with higher yields.
Credit spread is the additional yield provided by municipal bonds rated AA and below vs. municipals rated AAA with comparable effective maturity.
Contributors and detractors incorporate both a stock’s return and its weight. If two stocks have the same return but one has a larger weighting in the fund, it will have a larger contribution to return in the period.
Duration, which is expressed in years, measures the sensitivity of the price of a bond or bond fund to a change in interest rates.
Credit quality measures a bond issuer's ability to repay interest and principal in a timely manner. Rating agencies assign letter designations, such as AAA, AA and so forth. The lower the rating the higher the probability of default. Credit quality does not remove market risk and is subject to change.
Coupon is the interest rate, expressed as an annual percentage of face value, which a bond issuer promises to pay until maturity.
Performance Summary May 31, 2017 (Unaudited)
| Class A | 1-Year | 5-Year | 10-Year |
| Average Annual Total Returns as of 5/31/17 |
| Unadjusted for Sales Charge | 0.83% | 2.20% | 3.86% |
| Adjusted for the Maximum Sales Charge (max 2.75% load) | –1.95% | 1.63% | 3.57% |
| Bloomberg Barclays 7-Year Municipal Bond Index† | 1.78% | 2.82% | 4.75% |
| Class C | 1-Year | 5-Year | 10-Year |
| Average Annual Total Returns as of 5/31/17 |
| Unadjusted for Sales Charge | 0.15% | 1.43% | 3.08% |
| Adjusted for the Maximum Sales Charge (max 1.00% CDSC) | 0.15% | 1.43% | 3.08% |
| Bloomberg Barclays 7-Year Municipal Bond Index† | 1.78% | 2.82% | 4.75% |
| Class S | 1-Year | 5-Year | 10-Year |
| Average Annual Total Returns as of 5/31/17 |
| No Sales Charges | 1.07% | 2.43% | 4.07% |
| Bloomberg Barclays 7-Year Municipal Bond Index† | 1.78% | 2.82% | 4.75% |
| Institutional Class | 1-Year | 5-Year | 10-Year |
| Average Annual Total Returns as of 5/31/17 |
| No Sales Charges | 1.07% | 2.45% | 4.14% |
| Bloomberg Barclays 7-Year Municipal Bond Index† | 1.78% | 2.82% | 4.75% |
Performance in the Average Annual Total Returns table(s) above and the Growth of an Assumed $10,000 Investment line graph that follows is historical and does not guarantee future results. Investment return and principal fluctuate, so your shares may be worth more or less when redeemed. Current performance may differ from performance data shown. Please visit deutschefunds.com for the Fund's most recent month-end performance. Fund performance includes reinvestment of all distributions. Unadjusted returns do not reflect sales charges and would have been lower if they had.
The gross expense ratios of the Fund, as stated in the fee table of the prospectus dated October 1, 2016 are 0.79%, 1.55%, 0.62% and 0.53% for Class A, Class C, Class S and Institutional Class shares, respectively, and may differ from the expense ratios disclosed in the Financial Highlights tables in this report.
Index returns do not reflect any fees or expenses and it is not possible to invest directly into an index.
Performance figures do not reflect the deduction of taxes that a shareholder would pay on fund distributions or the redemption of fund shares.
A portion of the Fund's distributions may be subject to federal, state and local taxes.
Generally accepted accounting principles require adjustments to be made to the net assets of the Fund at period end for financial reporting purposes only, and as such, the total return based on the unadjusted net asset value per share may differ from the total return reported in the financial highlights.
| Growth of an Assumed $10,000 Investment (Adjusted for Maximum Sales Charge) |
■ Deutsche Intermediate Tax/AMT Free Fund — Class A ■ Bloomberg Barclays 7-Year Municipal Bond Index† |
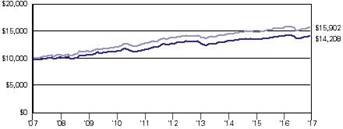 |
| Yearly periods ended May 31 |
The Fund's growth of an assumed $10,000 investment is adjusted for the maximum sales charge of 2.75%. This results in a net initial investment of $9,725.
The growth of $10,000 is cumulative.
Performance of other share classes will vary based on the sales charges and the fee structure of those classes.
† The Bloomberg Barclays 7-Year Municipal Bond Index is an unmanaged, total return subset of the Barclays Municipal Bond Index. It includes maturities of six to eight years.
| | Class A | Class C | Class S | Institutional Class |
| Net Asset Value |
| 5/31/17 | $ 11.93 | $ 11.93 | $ 11.93 | $ 11.93 |
| 5/31/16 | $ 12.11 | $ 12.10 | $ 12.11 | $ 12.11 |
| Distribution Information as of 5/31/17 |
| Income Dividends, Twelve Months | $ .28 | $ .19 | $ .31 | $ .31 |
| May Income Dividend | $ .0236 | $ .0163 | $ .0260 | $ .0259 |
| SEC 30-day Yield‡‡ | 1.03% | 0.35% | 1.29% | 1.29% |
| Tax Equivalent Yield‡‡ | 1.82% | 0.62% | 2.28% | 2.28% |
| Current Annualized Distribution Rate‡‡ | 2.37% | 1.64% | 2.62% | 2.61% |
‡‡ The SEC yield is net investment income per share earned over the month ended May 31, 2017, shown as an annualized percentage of the maximum offering price per share on the last day of the period. The SEC yield is computed in accordance with a standardized method prescribed by the Securities and Exchange Commission. The SEC yield would have been 1.24% for Class S shares had certain expenses not been reduced. Tax equivalent yield is based on the Fund's yield and a marginal federal income tax rate of 43.40%. Current annualized distribution rate is the latest monthly dividend shown as an annualized percentage of net asset value on May 31, 2017. Distribution rate simply measures the level of dividends and is not a complete measure of performance. The current annualized distribution rate would have been 2.57% for Class S shares had certain expenses not been reduced. Yields and distribution rates are historical, not guaranteed and will fluctuate.
Portfolio Summary (Unaudited)
| Asset Allocation (As a % of Investment Portfolio) | 5/31/17 | 5/31/16 |
| | | |
| Revenue Bonds | 56% | 57% |
| General Obligation Bonds | 24% | 26% |
| Escrow to Maturity/Prerefunded Bonds | 11% | 8% |
| Lease Obligations | 9% | 9% |
| | 100% | 100% |
| Interest Rate Sensitivity | 5/31/17 | 5/31/16 |
| | | |
| Effective Maturity | 5.2 years | 5.1 years |
| Modified Duration | 4.4 years | 4.3 years |
Effective maturity is the weighted average of the maturity date of bonds held by the fund taking into consideration any available maturity shortening features.
Modified duration is an approximate measure of a fund's sensitivity to movements in interest rates based on the current interest rate environment.
| Quality (As a % of Investment Portfolio) | 5/31/17 | 5/31/16 |
| | | |
| AAA | 20% | 24% |
| AA | 53% | 51% |
| A | 23% | 20% |
| BBB | 2% | 3% |
| CC | 0% | — |
| Not Rated | 2% | 2% |
| | 100% | 100% |
The quality ratings represent the higher of Moody's Investors Service, Inc. ("Moody's"), Fitch Ratings, Inc. ("Fitch") or Standard & Poor's Corporation ("S&P") credit ratings. The ratings of Moody's, Fitch and S&P represent their opinions as to the quality of the securities they rate. Credit quality measures a bond issuer's ability to repay interest and principal in a timely manner. Ratings are relative and subjective and are not absolute standards of quality. Credit quality does not remove market risk and is subject to change.
| Top Five State Allocations (As a % of Investment Portfolio) | 5/31/17 | 5/31/16 |
| | | |
| Texas | 20% | 20% |
| California | 9% | 8% |
| New York | 8% | 11% |
| Illinois | 5% | 4% |
| Pennsylvania | 5% | 3% |
Portfolio holdings and characteristics are subject to change.
For more complete details about the fund's investment portfolio, see page 13. A quarterly Fact Sheet is available on deutschefunds.com or upon request. Please see the Account Management Resources section on page 64 for contact information.
Investment Portfolio as of May 31, 2017
| | Principal Amount ($) | Value ($) |
| | | | |
| Municipal Bonds and Notes 100.0% |
| Alabama 0.8% |
| Alabama, State Public School & College Authority Revenue: |
| | Series B, 5.0%, 1/1/2024 | 9,680,000 | 11,769,138 |
| | Series A, Prerefunded 5/1/2019 @ 100, 5.0%, 5/1/2024 | 3,000,000 | 3,229,620 |
| | 14,998,758 |
| Alaska 1.0% |
| Alaska, State Housing Finance Corp., Mortgage Revenue, Series A, 4.0%, 6/1/2040 | 980,000 | 1,006,088 |
| Alaska, State Housing Finance Corp., State Capital Project Bonds II, Series D, 5.0%, 12/1/2026 | 5,515,000 | 6,602,172 |
| Valdez, AK, Marine Terminal Revenue, Exxon Mobil Project, 0.78%*, 12/1/2029, GTY: Exxon Mobil Corp. | 10,000,000 | 10,000,000 |
| | 17,608,260 |
| Arizona 1.8% |
| Arizona, State School Facilities Board, Certificates of Participation, Series A, 5.0%, 9/1/2023 | 3,500,000 | 4,194,225 |
| Arizona, State Transportation Board Excise Tax Revenue, Maricopa County Regional Area Road, Prerefunded 7/1/2019 @ 100, 5.0%, 7/1/2025 | 3,000,000 | 3,251,310 |
| Arizona, Water Infrastructure Finance Authority Revenue, Series A, Prerefunded 10/1/2018 @ 100, 5.0%, 10/1/2024 | 4,000,000 | 4,217,360 |
| Arizona, Water Infrastructure Finance Authority Revenue, Water Quality, Series A, Prerefunded 10/1/2020 @ 100, 5.0%, 10/1/2030 | 3,750,000 | 4,234,575 |
| Maricopa County, AZ, Industrial Development Authority, Hospital Facility Revenue, Samaritan Health Services, Series B, ETM, 6.0%, 12/1/2019, INS: NATL | 1,305,000 | 1,395,893 |
| Phoenix, AZ, Civic Improvement Corp., Airport Revenue, Series A, 5.0%, 7/1/2028 | 4,000,000 | 4,460,000 |
| Phoenix, AZ, Civic Improvement Corp., Wastewater System Revenue, 5.5%, 7/1/2022 | 2,545,000 | 2,673,472 |
| Phoenix, AZ, General Obligation, Series B, 5.0%, 7/1/2018 | 8,160,000 | 8,188,805 |
| Pima County, AZ, Sewer Revenue, Series A, 5.0%, 7/1/2021 | 650,000 | 750,665 |
| | 33,366,305 |
| California 9.2% |
| California, Bay Area Toll Authority, Toll Bridge Revenue, San Francisco Bay Area: | |
| | Series F-1, Prerefunded 4/1/2019 @ 100, 5.0%, 4/1/2028 | 10,000,000 | 10,748,500 |
| | Series F-1, Prerefunded 4/1/2019 @ 100, 5.25%, 4/1/2029 | 2,500,000 | 2,698,450 |
| California, Health Facilities Financing Authority Revenue, Catholic Healthcare West, Series A, Prerefunded 7/1/2019 @ 100, 6.0%, 7/1/2029 | 4,000,000 | 4,421,840 |
| California, Mount San Antonio Community College District, Bond Anticipation Notes, Zero Coupon, 4/1/2022 | 4,585,000 | 4,252,083 |
| California, State Department of Water Resources, Center Valley Project, Water Systems, Series AT, 1.08%**, Mandatory Put 12/1/2017 @ 100, 12/1/2035 | 14,285,000 | 14,283,714 |
| California, State Economic Recovery, Series A, Prerefunded 7/1/2019 @ 100, 5.25%, 7/1/2021 | 5,000,000 | 5,453,300 |
| California, State General Obligation, 5.25%, 10/1/2025 | 10,000,000 | 10,997,100 |
| California, State General Obligation, Various Purposes: |
| | 4.0%, 9/1/2032 | 5,000,000 | 5,460,250 |
| | 5.25%, 9/1/2027 | 10,000,000 | 11,677,500 |
| | 6.0%, 4/1/2018 | 1,700,000 | 1,774,137 |
| | 6.0%, 3/1/2033 | 3,765,000 | 4,248,012 |
| California, State Public Works Board, Lease Revenue, Capital Projects, Series I-1, Prerefunded 11/1/2019 @ 100, 6.25%, 11/1/2021 | 7,000,000 | 7,895,580 |
| California, State Public Works Board, Lease Revenue, Department of General Services, Buildings 8 & 9, Series A, Prerefunded 4/1/2019 @ 100, 6.125%, 4/1/2028 | 2,000,000 | 2,191,300 |
| California, State Public Works Board, Lease Revenue, Judicial Council Projects, Series A, 5.0%, 3/1/2024 | 1,000,000 | 1,186,560 |
| California, University Revenues, Limited Project, Series E, 5.0%, 5/15/2021 | 5,000,000 | 5,601,700 |
| Los Angeles, CA, Department of Airports Revenue, Los Angeles International Airport, Series A, 5.0%, 5/15/2031 | 10,000,000 | 11,099,900 |
| Orange County, CA, Airport Revenue, Series A, 5.25%, 7/1/2025 | 3,000,000 | 3,247,260 |
| Sacramento, CA, Municipal Utility District: |
| | Series U, 5.0%, 8/15/2023, INS: AGMC | 4,295,000 | 4,512,928 |
| | Series U, Prerefunded 8/15/2018 @ 100, 5.0%, 8/15/2023, INS: AGMC | 2,705,000 | 2,844,281 |
| San Diego, CA, Public Facilities Financing Authority, Sewer Revenue, Series A, Prerefunded 5/15/2019 @ 100, 5.125%, 5/15/2029 | 4,000,000 | 4,330,320 |
| San Diego, CA, Public Facilities Financing Authority, Water Revenue: | |
| | Series A, Prerefunded 8/1/2020 @ 100, 5.25%, 8/1/2027 | 5,000,000 | 5,664,050 |
| | Series A, Prerefunded 8/1/2020 @ 100, 5.25%, 8/1/2028 | 5,000,000 | 5,664,050 |
| San Francisco, CA, City & County Airports Commission, International Airport Revenue, Series E, 5.25%, 5/1/2024 | 9,000,000 | 9,732,690 |
| San Francisco, CA, City & County Airports Commission, International Airport Revenue, Governmental Purpose: | |
| | Series C, 5.0%, 5/1/2025 | 1,145,000 | 1,270,961 |
| | Series C, Prerefunded 5/1/2020 @ 100, 5.0%, 5/1/2025 | 855,000 | 954,462 |
| | Series C, 5.0%, 5/1/2026 | 1,635,000 | 1,813,869 |
| | Series C, Prerefunded 5/1/2020 @ 100, 5.0%, 5/1/2026 | 1,215,000 | 1,356,341 |
| San Francisco, CA, City & County Public Utilities Commission, Water Revenue, Series A, 4.0%, 11/1/2030 | 13,000,000 | 14,524,640 |
| University of California, Regents Medical Center Pooled Revenue, Series K, 0.73%*, 5/15/2047 | 2,045,000 | 2,045,000 |
| Ventura County, CA, Certificates of Participation, Public Financing Authority III, Prerefunded 8/15/2019 @ 100, 6.0%, 8/15/2026 | 3,370,000 | 3,746,800 |
| | 165,697,578 |
| Colorado 0.6% |
| Colorado, Health Facilities Authority Revenue, Sisters Leavenworth, Series A, 5.25%, 1/1/2025 | 2,500,000 | 2,737,325 |
| Colorado, State Building Excellent School Today, Certificate of Participation, Series G, 5.0%, 3/15/2025 | 3,285,000 | 3,722,693 |
| Colorado, University Enterprise System Revenue, Series A, Prerefunded 6/1/2019 @ 100, 5.5%, 6/1/2023 | 1,000,000 | 1,089,510 |
| Denver City & County, CO, Airport Revenue System: |
| | Series B, 5.0%, 11/15/2020 | 500,000 | 563,215 |
| | Series B, 5.0%, 11/15/2021 | 500,000 | 577,370 |
| | Series B, 5.0%, 11/15/2022 | 2,350,000 | 2,760,588 |
| | 11,450,701 |
| Connecticut 1.3% |
| Connecticut, State General Obligation, Green Bonds, Series F, 5.0%, 10/15/2030 | 7,000,000 | 8,132,600 |
| Connecticut, State Housing Finance Program Authority Revenue, Housing Finance Program, Series A-1, 4.0%, 11/15/2047 | 5,790,000 | 6,336,865 |
| Connecticut, State Special Tax Obligation Revenue, Transportation Infrastructure, Series A, 5.0%, 10/1/2027 | 8,000,000 | 9,504,560 |
| | 23,974,025 |
| Delaware 0.3% |
| Delaware, Transportation Authority Revenue, 5.0%, 9/1/2024 | 5,115,000 | 5,725,066 |
| District of Columbia 0.9% |
| District of Columbia, General Obligation: |
| | Series E, 5.0%, 6/1/2027 | 2,500,000 | 3,145,200 |
| | Series A, 5.0%, 6/1/2029 (a) | 1,745,000 | 2,169,209 |
| | Series A, 5.0%, 6/1/2030 (a) | 2,000,000 | 2,469,060 |
| | Series A, 5.0%, 6/1/2031 (a) | 2,000,000 | 2,451,900 |
| District of Columbia, Income Tax Revenue, Series A, 5.0%, 12/1/2023 | 5,000,000 | 5,568,900 |
| | 15,804,269 |
| Florida 4.7% |
| Broward County, FL, School Board Certificates of Participation, Series A, 5.0%, 7/1/2023 | 1,875,000 | 2,239,556 |
| Broward County, FL, Water & Sewer Utility Revenue, Series A, Prerefunded 10/1/2018 @ 100, 5.0%, 10/1/2024 | 2,745,000 | 2,895,865 |
| Dade County, FL, Health Facilities Authority Hospital Revenue, Baptist Hospital of Miami Project, Series A, ETM, 5.75%, 5/1/2021, INS: NATL | 1,745,000 | 1,934,123 |
| Florida, Housing Finance Corp. Revenue, Homeowner Mortgage Special Program, Series A, 5.0%, 7/1/2028 | 670,000 | 697,028 |
| Florida, State Board of Public Education, Capital Outlay, Series B, 4.0%, 6/1/2029 | 1,450,000 | 1,630,656 |
| Florida, Tohopekaliga Water Utility System Revenue, 4.0%, 10/1/2032 | 2,145,000 | 2,360,615 |
| Jacksonville, FL, Sales Tax Revenue, Better Jacksonville, 5.0%, 10/1/2021 | 1,335,000 | 1,538,788 |
| Jacksonville, FL, Water & Sewer System Revenue, Series A, 5.0%, 10/1/2026 | 5,000,000 | 6,014,500 |
| Lee County, FL, School Board Certificates of Participation, Series A, 5.0%, 8/1/2027 | 4,360,000 | 5,172,660 |
| Miami-Dade County, FL, Aviation Revenue: |
| | Series B, 5.0%, 10/1/2024 | 4,000,000 | 4,481,200 |
| | Series A, 5.75%, 10/1/2026 | 8,000,000 | 8,848,640 |
| Miami-Dade County, FL, Aviation Revenue, Miami International Airport: | |
| | Series A-1, 5.5%, 10/1/2025 | 2,275,000 | 2,584,855 |
| | Series A-1, Prerefunded 10/1/2020 @ 100, 5.5%, 10/1/2025 | 725,000 | 830,270 |
| | Series A-1, 5.5%, 10/1/2026 | 3,335,000 | 3,786,893 |
| | Series A-1, Prerefunded 10/1/2020 @ 100, 5.5%, 10/1/2026 | 1,065,000 | 1,219,638 |
| Miami-Dade County, FL, School Board, Certificates of Participation, Series D, 5.0%, 2/1/2029 | 7,000,000 | 8,238,860 |
| Miami-Dade County, FL, Water & Sewer Systems Revenue, 5.0%, 10/1/2027, INS: AGMC | 10,000,000 | 11,161,300 |
| Monroe County, FL, School District, Sales Tax Revenue, 5.0%, 10/1/2023, INS: AGMC | 1,200,000 | 1,429,836 |
| Orlando & Orange County, FL, Expressway Authority Revenue: | |
| | Series B, 5.0%, 7/1/2022 | 2,000,000 | 2,338,720 |
| | Series A, Prerefunded 7/1/2020 @ 100, 5.0%, 7/1/2028 | 7,500,000 | 8,391,600 |
| South Florida, Water Management District, Certificates of Participation, 5.0%, 10/1/2023 | 3,000,000 | 3,582,540 |
| South Miami, FL, Health Facilities Authority, Hospital Revenue, Baptist Health South Florida Group, 5.0%, 8/15/2021 | 2,500,000 | 2,520,850 |
| | 83,898,993 |
| Georgia 3.8% |
| Atlanta, GA, Airport Passenger Facility Charge Revenue, Series B, 5.0%, 1/1/2021 | 8,345,000 | 9,173,825 |
| Atlanta, GA, Airport Revenue, Series C, 5.75%, 1/1/2023 | 2,460,000 | 2,847,647 |
| Atlanta, GA, Water & Wastewater Revenue: |
| | Series B, 5.0%, 11/1/2022 | 3,000,000 | 3,570,330 |
| | Series B, 5.25%, 11/1/2027, INS: AGMC | 10,000,000 | 12,850,200 |
| DeKalb County, GA, Water & Sewer Revenue, Series A, 5.25%, 10/1/2029 | 10,300,000 | 11,961,390 |
| Gainesville & Hall County, GA, Hospital Authority, Northeast Georgia Health System Obligated Group: | |
| | Series B, 5.5%, 2/15/2029 | 2,110,000 | 2,312,497 |
| | Series B, Prerefunded 2/15/2020 @ 100, 5.5%, 2/15/2029 | 6,790,000 | 7,557,609 |
| Georgia, Main Street Natural Gas, Inc., Gas Project Revenue, Series A, 5.5%, 9/15/2024, GTY: Merrill Lynch & Co., Inc. | 1,705,000 | 2,035,054 |
| Georgia, Municipal Electric Authority, Combined Cycle Project: |
| | Series A, 5.0%, 11/1/2022 | 1,000,000 | 1,157,240 |
| | Series A, 5.0%, 11/1/2027 | 1,000,000 | 1,109,130 |
| Georgia, Municipal Electric Authority, General Resolution Projects, Series A, 5.25%, 1/1/2019 | 2,500,000 | 2,655,050 |
| Georgia, Municipal Electric Authority, Project One, Series A, 5.0%, 1/1/2021 | 3,420,000 | 3,825,886 |
| Georgia, State General Obligation, Series C-1, 3.0%, 1/1/2027 | 5,000,000 | 5,447,700 |
| Georgia, State Road & Tollway Authority Revenue, Federal Highway Grant Anticipation Bonds, Series A, 5.0%, 6/1/2021 | 2,500,000 | 2,688,650 |
| | 69,192,208 |
| Guam 0.1% |
| Guam, Government Limited Obligation Revenue, Section 30, Series A, Prerefunded 12/1/2019 @ 100, 5.375%, 12/1/2024 | 1,000,000 | 1,108,230 |
| Hawaii 2.3% |
| Hawaii, State Airports Systems Revenue: |
| | Series A, 5.25%, 7/1/2027 | 2,335,000 | 2,614,359 |
| | Series A, 5.25%, 7/1/2028 | 5,010,000 | 5,612,603 |
| | Series A, 5.25%, 7/1/2029 | 3,155,000 | 3,524,324 |
| Hawaii, State General Obligation: |
| | Series FB, 4.0%, 4/1/2029 | 10,000,000 | 11,285,800 |
| | Series FH, 4.0%, 10/1/2031 | 8,000,000 | 8,866,640 |
| | Series FK, 4.0%, 5/1/2032 | 4,400,000 | 4,858,348 |
| | Series DK, Prerefunded 5/1/2018 @ 100, 5.0%, 5/1/2021 | 180,000 | 186,923 |
| Honolulu City & County, HI, Wastewater Systems Revenue: |
| | Series B, 4.0%, 7/1/2029 | 2,475,000 | 2,797,542 |
| | Series B, 4.0%, 7/1/2030 | 1,000,000 | 1,121,630 |
| | 40,868,169 |
| Illinois 5.3% |
| Chicago, IL, O'Hare International Airport Revenue: |
| | Series D, 5.0%, 1/1/2023 | 6,540,000 | 7,688,686 |
| | Series B, 5.0%, 1/1/2029 | 5,000,000 | 5,843,450 |
| | Series C, 5.25%, 1/1/2030, INS: AGC | 10,000,000 | 10,869,500 |
| Chicago, IL, O'Hare International Airport Revenue, Senior Lien: | |
| | Series E, 5.0%, 1/1/2024 | 4,000,000 | 4,777,520 |
| | Series C, 5.0%, 1/1/2030 | 1,250,000 | 1,467,875 |
| Illinois, Railsplitter Tobacco Settlement Authority Revenue: |
| | 5.0%, 6/1/2019 | 3,500,000 | 3,762,045 |
| | 5.25%, 6/1/2020 | 3,000,000 | 3,346,440 |
| Illinois, Regional Transportation Authority, Series A, 5.5%, 7/1/2024, INS: NATL | 5,000,000 | 6,202,600 |
| Illinois, State Finance Authority Revenue, University of Chicago, Series A, 5.0%, 10/1/2026 | 6,330,000 | 7,559,602 |
| Illinois, State Municipal Electric Agency, Power Supply Revenue, Series A, 5.0%, 2/1/2028 | 10,000,000 | 11,799,600 |
| Illinois, State Toll Highway Authority Revenue: |
| | Series D, 5.0%, 1/1/2024 | 11,840,000 | 14,190,240 |
| | Series A, 5.0%, 1/1/2027 | 1,250,000 | 1,451,463 |
| | Series A, 5.0%, 1/1/2028 | 1,250,000 | 1,443,588 |
| | Series A-1, 5.25%, 1/1/2030 | 5,000,000 | 5,477,300 |
| Illinois, Will, Grundy Etc. Counties, Community College District Number 525, Joliet Jr. College, 6.25%, 6/1/2021 | 1,000,000 | 1,051,580 |
| Northern, IL, Municipal Power Agency, Power Project Revenue, Series A, 5.0%, 12/1/2028 | 3,435,000 | 4,103,966 |
| Rockford-Concord Commons, IL, Housing Facility, Concord Commons Project, Series A, 6.15%, 11/1/2022 | 690,000 | 692,194 |
| Springfield, IL, Electric Revenue, Senior Lien, 5.0%, 3/1/2029 | 3,500,000 | 4,040,505 |
| | 95,768,154 |
| Indiana 1.5% |
| Indiana, State Finance Authority Revenue, Green Bonds, Series B, 5.0%, 2/1/2023 | 4,285,000 | 5,150,656 |
| Indiana, Transportation Finance Authority Highway Revenue, Series A, 5.5%, 12/1/2022 | 10,000,000 | 11,732,600 |
| Indiana, Wastewater Utility Revenue, CWA Authority Project, Series A, 5.0%, 10/1/2027 | 1,565,000 | 1,797,074 |
| Indianapolis, IN, Local Public Improvement Bond Bank, Series K, 5.0%, 6/1/2026 | 5,355,000 | 5,996,261 |
| Jasper County, IN, Pollution Control Revenue, Northern Indiana Public Service, Series C, 5.85%, 4/1/2019, INS: NATL | 2,000,000 | 2,146,020 |
| | 26,822,611 |
| Iowa 1.7% |
| Iowa, State Finance Authority Revenue, Green Bonds, State Revolving Fund, 5.0%, 8/1/2024 | 15,000,000 | 18,508,500 |
| Iowa, State Finance Authority, Health Facilities Revenue, Iowa Health System, 5.25%, 2/15/2029, INS: AGC | 10,000,000 | 10,626,700 |
| Iowa, State Higher Education Loan Authority, Private College Facility, Loras College, 0.8%*, 11/1/2036, LOC: Bank of America NA | 2,000,000 | 2,000,000 |
| | 31,135,200 |
| Kansas 0.7% |
| Kansas, State Development Finance Authority Hospital Revenue, Adventist Health, 5.5%, 11/15/2022 | 4,470,000 | 4,936,311 |
| Kansas, State Development Finance Authority, Sisters of Charity of Leavenworth Health System, Inc.: | |
| | Series A, 5.25%, 1/1/2025 | 995,000 | 1,092,112 |
| | Series A, Prerefunded 1/1/2020 @ 100, 5.25%, 1/1/2025 | 6,505,000 | 7,201,230 |
| | 13,229,653 |
| Kentucky 0.1% |
| Kentucky, Asset/Liability Commission Agency Revenue, Federal Highway Trust, First Series, 5.25%, 9/1/2019, INS: NATL | 1,000,000 | 1,090,860 |
| Louisiana 0.2% |
| Louisiana, Local Government Environmental Facilities & Community Development Authority, LCTCS Facilities Corp. Project, Series B, 5.0%, 10/1/2027, INS: AGC | 1,365,000 | 1,476,739 |
| Louisiana, Regional Transit Authority, Sales Tax Revenue, 5.0%, 12/1/2025, INS: AGMC | 1,550,000 | 1,726,808 |
| | 3,203,547 |
| Maine 0.5% |
| Maine, Health & Higher Educational Facilities Authority Revenue, Series A, 5.25%, 7/1/2031 | 8,040,000 | 8,889,908 |
| Massachusetts 3.1% |
| Massachusetts, Metropolitan Boston Transit Parking Corp., Systemwide Parking Revenue, Senior Lien, 5.0%, 7/1/2028 | 3,760,000 | 4,285,723 |
| Massachusetts, State Central Artery, Series B, 0.71%*, 12/1/2030, SPA: Bank of America NA | 1,550,000 | 1,550,000 |
| Massachusetts, State Development Finance Agency Revenue, Series H-1, 5.0%, 7/1/2022 | 2,740,000 | 3,203,307 |
| Massachusetts, State Development Finance Agency Revenue, CareGroup Obligated Group: | |
| | Series I, 5.0%, 7/1/2027 | 3,300,000 | 3,993,528 |
| | Series I, 5.0%, 7/1/2028 | 5,000,000 | 6,005,550 |
| Massachusetts, State Development Finance Agency Revenue, Harvard University, Series B-3, 5.0%, 1/1/2022 | 9,210,000 | 10,440,732 |
| Massachusetts, State Development Finance Agency Revenue, Partners Healthcare System, Inc., Series M-3, 1.33%**, Mandatory Put 1/30/2018 @ 100, 7/1/2038 | 4,920,000 | 4,925,018 |
| Massachusetts, State Development Finance Agency Revenue, Suffolk University: | | |
| | 5.0%, 7/1/2031 | 5,860,000 | 6,801,175 |
| | Series A, 6.0%, 7/1/2024 | 1,785,000 | 1,951,826 |
| | Series A, Prerefunded, 7/1/2019 @ 100, 6.0%, 7/1/2024 | 3,215,000 | 3,548,396 |
| Massachusetts, State Housing Finance Agency, Series 162, 2.75%, 12/1/2041 | 645,000 | 654,049 |
| Massachusetts, State School Building Authority, Sales Tax Revenue, Series B, 5.0%, 10/15/2027 | 7,000,000 | 8,089,270 |
| | 55,448,574 |
| Michigan 4.5% |
| Detroit, MI, City School District Building & Site: |
| | Series A, 5.0%, 5/1/2020 | 3,110,000 | 3,412,292 |
| | Series A, 5.0%, 5/1/2021 | 2,100,000 | 2,360,946 |
| Michigan, Great Lakes Water Authority, Water Supply Systems Revenue, Senior Lien, Series C, 5.0%, 7/1/2031 | 10,000,000 | 11,622,800 |
| Michigan, State Building Authority Revenue, Facilities Program: | |
| | Series II-A, 5.0%, 10/15/2024 | 1,610,000 | 1,828,219 |
| | Series I, 5.0%, 4/15/2027 | 11,225,000 | 13,451,928 |
| Michigan, State Finance Authority Revenue, Series C-3, 5.0%, 4/1/2023 | 3,000,000 | 3,443,310 |
| Michigan, State Finance Authority Revenue, Clean Water Revolving Fund, Series B, 4.0%, 10/1/2030 | 7,500,000 | 8,379,825 |
| Michigan, State Finance Authority Revenue, Henry Ford Health System: | |
| | 5.0%, 11/15/2028 | 2,000,000 | 2,388,500 |
| | 5.0%, 11/15/2031 | 10,700,000 | 12,469,459 |
| Michigan, State Finance Authority Revenue, Trinity Health Corp., 5.5%, 12/1/2026 | 2,000,000 | 2,491,400 |
| Michigan, State Hospital Finance Authority Revenue, Ascension Health Credit Group, 5.0%, 11/15/2027 | 2,250,000 | 2,696,355 |
| Michigan, State Hospital Finance Authority Revenue, Ascension Health Senior Credit Group, Series B, 5.0%, 11/15/2025 | 5,920,000 | 6,429,475 |
| Michigan, State Trunk Line, 5.0%, 11/1/2024 | 3,000,000 | 3,261,180 |
| University of Michigan, State University Revenues, Series E, 1.21%**, Mandatory Put 4/2/2018 @ 100, 4/1/2033 | 7,000,000 | 7,011,970 |
| | 81,247,659 |
| Minnesota 0.7% |
| Minneapolis & St. Paul, MN, Metropolitan Airports Commission, Airport Revenue: | |
| | Series A, 5.0%, 1/1/2027 | 2,000,000 | 2,375,140 |
| | Series A, 5.0%, 1/1/2028 | 3,500,000 | 4,137,490 |
| Minnesota, State General Fund Revenue, Series B, 5.0%, 3/1/2023 | 5,945,000 | 6,918,791 |
| | 13,431,421 |
| Mississippi 1.0% |
| Mississippi, Development Bank Special Obligation, Department of Corrections: | |
| | Series C, Prerefunded 8/1/2020 @ 100, 5.25%, 8/1/2027 | 6,110,000 | 6,906,744 |
| | Series D, Prerefunded 8/1/2020 @ 100, 5.25%, 8/1/2027 | 5,000,000 | 5,652,000 |
| Mississippi, Home Corp., Single Family Mortgage Revenue, Series C-1, 5.6%, 6/1/2038 | 430,000 | 430,305 |
| Mississippi, State Gaming Tax Revenue, Series E, 5.0%, 10/15/2028 | 4,755,000 | 5,539,528 |
| | 18,528,577 |
| Missouri 0.2% |
| Cape Girardeau County, MO, Industrial Development Authority, St. Francis Medical Center: | |
| | Series A, 5.0%, 6/1/2022 | 1,570,000 | 1,831,295 |
| | Series A, 5.0%, 6/1/2023 | 1,375,000 | 1,597,063 |
| Missouri, State Housing Development Commission, Single Family Mortgage Revenue, Homeownership Loan Program, Series D, 4.8%, 3/1/2040 | 420,000 | 439,832 |
| Missouri, State Housing Development Commission, Single Family Mortgage Revenue, Special Homeownership Loan Program Market Bonds, Series E-1, 5.0%, 11/1/2027 | 305,000 | 323,093 |
| | 4,191,283 |
| Nebraska 0.2% |
| Nebraska, State Investment Finance Authority, Single Family Housing Revenue: | |
| | Series E, 3.0%, 3/1/2043 | 840,000 | 855,817 |
| | Series C, 4.5%, 9/1/2043 | 2,595,000 | 2,670,307 |
| | 3,526,124 |
| Nevada 1.7% |
| Clark County, NV, Board Bank: |
| | 5.0%, 6/1/2024 | 3,040,000 | 3,275,418 |
| | 5.0%, 6/1/2025 | 3,190,000 | 3,434,386 |
| Clark County, NV, Flood Control, 5.0%, 11/1/2022 | 3,215,000 | 3,818,777 |
| Clark County, NV, General Obligation, Series A, 5.0%, 12/1/2026 | 3,025,000 | 3,310,197 |
| Las Vegas Valley, NV, Water District: |
| | Series A, 5.0%, 6/1/2027 | 2,000,000 | 2,424,540 |
| | Series C, 5.0%, 9/15/2027 | 4,355,000 | 5,301,298 |
| | Series B, 5.0%, 12/1/2027 | 2,500,000 | 3,022,450 |
| Washoe County, NV, School District, Series A, 5.0%, 6/1/2026 | 4,855,000 | 5,829,544 |
| | 30,416,610 |
| New Hampshire 0.1% |
| New Hampshire, State Turnpike Systems, Series B, 5.0%, 2/1/2024 | 1,775,000 | 2,045,279 |
| New Jersey 2.3% |
| New Jersey, State Economic Development Authority Revenue, 5.0%, 6/15/2020 | 1,150,000 | 1,237,619 |
| New Jersey, State Economic Development Authority Revenue, School Facilities Construction, Series W, Prerefunded 3/1/2018 @ 100, 5.0%, 3/1/2019 | 3,000,000 | 3,093,990 |
| New Jersey, State Health Care Facilities Financing Authority Revenue, Princeton Healthcare System, Series A, 5.0%, 7/1/2024 | 2,000,000 | 2,376,980 |
| New Jersey, State Transportation Trust Fund Authority: |
| | Series B, 5.25%, 6/15/2025 | 5,000,000 | 5,342,350 |
| | Series B, 5.25%, 6/15/2026 | 5,000,000 | 5,322,950 |
| New Jersey, State Turnpike Authority Revenue: |
| | Series B, 5.0%, 1/1/2028 | 7,870,000 | 9,066,397 |
| | Series A, 5.0%, 1/1/2032 | 12,000,000 | 14,238,600 |
| | 40,678,886 |
| New Mexico 0.1% |
| New Mexico, Mortgage Finance Authority, Single Family Mortgage: | |
| | "I", Series E, 5.3%, 9/1/2040 | 495,000 | 508,989 |
| | "I", Series D, 5.35%, 9/1/2040 | 375,000 | 395,719 |
| | "I", Series B-2, 5.65%, 9/1/2039 | 190,000 | 196,610 |
| | 1,101,318 |
| New York 8.5% |
| Nassau County, NY, Sewer & Storm Water Finance Authority Systems Revenue, Series A, 5.0%, 10/1/2023 | 3,000,000 | 3,663,000 |
| New York, Metropolitan Transportation Authority Revenue, Series D-2B, 1.287%**, Mandatory Put 5/15/2018 @ 100, 11/1/2032, INS: AGMC | 4,200,000 | 4,205,754 |
| New York, Metropolitan Transportation Authority, Dedicated Tax Fund, Series A-2B, 1.36%**, Mandatory Put 11/1/2019 @ 100, 11/1/2031 | 5,000,000 | 5,016,700 |
| New York, Sales Tax Asset Receivable Corp., Fiscal 2015, Series A, 5.0%, 10/15/2026 | 5,930,000 | 7,304,040 |
| New York, State Dormitory Authority Revenues, Non State Supported Debt, North Shore-Long Island Jewish Obligated Group, Series A, 5.0%, 5/1/2028 | 8,820,000 | 10,569,800 |
| New York, State Dormitory Authority Revenues, Non-State Supported Debt, Mount Sinai School of Medicine, Series A, 5.0%, 7/1/2021 | 1,000,000 | 1,108,900 |
| New York, State Environmental Facilities Corp., State Clean Water & Drinking Revolving Funds, New York City Municipal Water Finance Authority Projects, 5.0%, 6/15/2029 | 10,000,000 | 11,483,600 |
| New York, State Thruway Authority, Series J, 5.0%, 1/1/2028 | 10,000,000 | 11,828,200 |
| New York, TSASC, Inc., Series A, 5.0%, 6/1/2022 | 1,000,000 | 1,140,030 |
| New York, Utility Debt Securitization Authority, Restructuring Revenue, Series A, 5.0%, 12/15/2026 | 15,000,000 | 18,549,450 |
| New York City, NY, Municipal Water Finance Authority, Water & Sewer System Revenue: | |
| | Series BB-1, 0.81%*, 6/15/2039, SPA: Landesbank Hessen-Thuringen | 1,000,000 | 1,000,000 |
| | Series AA, 5.0%, 6/15/2021 | 8,145,000 | 8,518,530 |
| | Series AA, Prerefunded 6/15/2018 @ 100, 5.0%, 6/15/2021 | 1,855,000 | 1,936,249 |
| New York City, NY, Transitional Finance Authority Revenue, Future Tax Secured: | |
| | Series B1, 5.0%, 11/1/2027 | 750,000 | 905,047 |
| | Series B1, 5.0%, 11/1/2028 | 1,175,000 | 1,410,012 |
| | Series D-1, 5.0%, 11/1/2028 | 9,715,000 | 11,257,256 |
| | Series E-1, 5.0%, 2/1/2029 | 3,055,000 | 3,536,835 |
| | Series B1, 5.0%, 11/1/2029 | 935,000 | 1,114,221 |
| New York City, NY, Transitional Finance Authority, Building Aid Revenue, Series S-2, 5.0%, 7/15/2028 | 6,750,000 | 8,242,762 |
| New York, NY, General Obligation: |
| | Series F, 5.0%, 8/1/2024 | 9,000,000 | 10,480,590 |
| | Series B, 5.0%, 8/1/2026 | 2,870,000 | 3,463,774 |
| | Series C, 5.0%, 8/1/2027 | 5,000,000 | 6,060,850 |
| | Series D-1, 5.0%, 8/1/2029 | 8,620,000 | 10,156,429 |
| Triborough, NY, Bridge & Tunnel Authority Revenues: |
| | Series ABCD-4, 1.13%**, 1/1/2018, INS: AGMC | 3,665,000 | 3,663,058 |
| | Series A, 5.0%, 11/15/2028 | 4,975,000 | 5,838,759 |
| | 152,453,846 |
| North Carolina 2.1% |
| Charlotte, NC, Airport Revenue, Series A, 5.5%, 7/1/2034 | 1,000,000 | 1,107,940 |
| North Carolina, Eastern Municipal Power Agency Systems Revenue, Series B, Prerefunded 1/1/2019 @ 100, 5.0%, 1/1/2026 | 4,200,000 | 4,471,446 |
| North Carolina, State Capital Improvement Obligation, Series A, 5.0%, 5/1/2024 | 10,745,000 | 11,949,944 |
| North Carolina, State Eastern Municipal Power Agency, Power System Revenue, Series A, Prerefunded 7/1/2022 @ 100, 5.0%, 1/1/2026 | 1,500,000 | 1,772,970 |
| North Carolina, State Limited Obligation: |
| | Series C, 5.0%, 5/1/2022 | 5,000,000 | 5,888,000 |
| | Series B, 5.0%, 6/1/2024 | 10,000,000 | 12,248,700 |
| | 37,439,000 |
| North Dakota 0.1% |
| Fargo, ND, Sanford Health Systems Revenue, 5.5%, 11/1/2021 | 1,250,000 | 1,469,313 |
| Ohio 2.3% |
| Cleveland, OH, Airport Systems Revenue: |
| | Series A, 5.0%, 1/1/2027 | 3,000,000 | 3,376,830 |
| | Series A, 5.0%, 1/1/2031, INS: AGMC | 1,000,000 | 1,143,480 |
| Columbus, OH, General Obligation, Series 1, 5.0%, 7/1/2023 | 5,125,000 | 6,199,046 |
| Lucas County, OH, Hospital Revenue, Promedica Healthcare, Series D, 5.0%, 11/15/2024 | 2,800,000 | 3,218,712 |
| Ohio, State Capital Facilities Lease Appropriation-Administration Building Fund Projects, Series A, 5.0%, 10/1/2022 | 2,355,000 | 2,792,182 |
| Ohio, State Higher Educational Facility Commission Revenue, Cleveland Clinic Health, Series A, 5.25%, 1/1/2021 | 2,150,000 | 2,207,728 |
| Ohio, State Higher Educational Facility Commission Revenue, Summa Health Systems 2010 Project, 5.5%, 11/15/2030, INS: AGMC | 5,000,000 | 5,507,700 |
| Ohio, State Housing Finance Agency, Residential Mortgage Revenue, Mortgage-Backed Securities Program, Series E, 5.0%, 9/1/2039 | 140,000 | 142,697 |
| Ohio, State Infrastructure Improvement, Series A, 5.0%, 9/1/2023 | 12,000,000 | 14,603,040 |
| Ohio, State Turnpike Commission, Infrastructure Projects, Series A-1, 5.25%, 2/15/2029 | 1,310,000 | 1,554,865 |
| | 40,746,280 |
| Oregon 1.5% |
| Oregon, State Department of Administrative Services Lottery Revenue: | |
| | Series C, 5.0%, 4/1/2023 | 2,000,000 | 2,410,360 |
| | Series E, 5.0%, 4/1/2023 | 2,020,000 | 2,434,463 |
| Oregon, State General Obligation: |
| | Series L, 5.0%, 5/1/2025 | 3,000,000 | 3,422,940 |
| | Series J, Prerefunded 5/1/2021 @ 100, 5.0%, 5/1/2029 | 5,425,000 | 6,243,687 |
| Port of Portland, OR, Airport Revenue, Passenger Facility Charge, Portland International Airport: | |
| | Series A, 5.5%, 7/1/2026 | 4,025,000 | 4,612,127 |
| | Series A, 5.5%, 7/1/2029 | 7,000,000 | 7,964,810 |
| | 27,088,387 |
| Pennsylvania 5.0% |
| Lehigh County, PA, Industrial Development Authority Revenue, PPL Electric Utilities Corp.: | |
| | Series B, 0.9%**, Mandatory Put 8/15/2017 @ 100, 2/15/2027 | 1,555,000 | 1,555,109 |
| | Series A, 0.9%**, Mandatory Put 9/1/2017 @ 100, 9/1/2029 | 1,800,000 | 1,799,856 |
| Pennsylvania, Commonwealth Systems of Higher Education, University of Pittsburgh Capital Project, Series B, Prerefunded 3/15/2019 @ 100, 5.5%, 9/15/2024 | 1,000,000 | 1,081,540 |
| Pennsylvania, Delaware River Joint Toll Bridge Commission Revenue: | |
| | 5.0%, 7/1/2031 | 1,000,000 | 1,204,760 |
| | 5.0%, 7/1/2032 | 1,500,000 | 1,798,335 |
| Pennsylvania, Saint Mary Hospital Authority, Health System Revenue, Catholic Health East, Series A, 5.0%, 11/15/2021 | 8,000,000 | 8,956,400 |
| Pennsylvania, State Economic Development Financing Authority Revenue, UPMC Obligated Group: | |
| | Series A, 5.0%, 2/1/2028 | 3,000,000 | 3,526,830 |
| | 5.0%, 3/15/2029 | 10,000,000 | 11,947,000 |
| Pennsylvania, State Economic Development Financing Authority, Unemployment Compensation Revenue, Series B, 5.0%, 7/1/2021 | 2,215,000 | 2,289,313 |
| Pennsylvania, State General Obligation, Series 2, 5.0%, 9/15/2029 | 7,000,000 | 8,308,650 |
| Pennsylvania, State Housing Finance Agency, Single Family Mortgage Revenue: | |
| | Series 119, 3.5%, 10/1/2041 | 5,295,000 | 5,562,027 |
| | Series 122, 4.0%, 10/1/2046 | 8,725,000 | 9,444,813 |
| Pennsylvania, State Turnpike Commission Revenue: |
| | Series B-1, 1.66%**, 12/1/2020 | 3,000,000 | 3,011,430 |
| | Series B, 1.93%**, 12/1/2019 | 500,000 | 502,895 |
| | Series C, 5.0%, 12/1/2028 | 2,950,000 | 3,454,804 |
| | Series B, 5.0%, 6/1/2029 | 5,000,000 | 5,844,200 |
| | Series C, 5.5%, 12/1/2026 | 2,120,000 | 2,577,114 |
| | Series C, 5.5%, 12/1/2027 | 2,820,000 | 3,408,590 |
| | Series C, 5.5%, 12/1/2028 | 1,000,000 | 1,202,540 |
| Philadelphia, PA, Gas Works Revenue, 1998 General Ordinance, Series 14, 5.0%, 10/1/2029 | 1,500,000 | 1,758,240 |
| Philadelphia, PA, Redevelopment Authority, Multi-Family Housing Revenue, Woodstock, 5.45%, 2/1/2023 | 315,000 | 317,690 |
| Philadelphia, PA, School District, Series F, 5.0%, 9/1/2030 | 9,000,000 | 10,120,230 |
| | 89,672,366 |
| Puerto Rico 0.0% |
| Puerto Rico, Sales Tax Financing Corp., Sales Tax Revenue, Series A, Prerefunded 8/1/2019 @ 100, 5.5%, 8/1/2028 | 45,000 | 49,341 |
| South Carolina 1.1% |
| Beaufort County, SC, School District, Series A, 5.0%, 3/1/2023 | 7,360,000 | 8,822,800 |
| Berkeley County, SC, School District Installment Purchase Revenue, Securing Assets for Education, Series A, 5.0%, 12/1/2026 | 2,000,000 | 2,406,900 |
| Greenwood County, SC, Hospital Revenue, Self Regional Healthcare, Series B, 5.0%, 10/1/2025 | 2,755,000 | 3,146,871 |
| South Carolina, Beaufort-Jasper Water & Sewer Authority, Waterworks & Sewer System Revenue: | |
| | Series B, 5.0%, 3/1/2023 | 1,880,000 | 2,253,650 |
| | Series B, 5.0%, 3/1/2024 | 500,000 | 609,610 |
| South Carolina, SCAGO Educational Facilities Corp. for Pickens School District, 5.0%, 12/1/2026 | 2,970,000 | 3,530,409 |
| | 20,770,240 |
| Tennessee 0.4% |
| Tennessee, Housing Development Agency, Residential Financing Program Revenue, Series 1C, 3.0%, 7/1/2038 | 4,225,000 | 4,366,833 |
| Tennessee, State Housing Development Agency, Homeownership Program: | |
| | Series 2C, 4.0%, 7/1/2038 | 1,310,000 | 1,381,605 |
| | Series 1C, 4.5%, 7/1/2037 | 1,375,000 | 1,463,935 |
| | 7,212,373 |
| Texas 19.7% |
| Allen, TX, Independent School District, 5.0%, 2/15/2025 | 1,640,000 | 1,859,596 |
| Comal, TX, Independent School District, School Building Improvements, Series A, 5.25%, 2/1/2020 | 40,000 | 41,127 |
| Dallas, TX, Independent School District, Series A, 4.0%, 2/15/2029 | 12,710,000 | 14,190,715 |
| Dallas, TX, Waterworks & Sewer Systems Revenue: |
| | 5.0%, 10/1/2029 | 970,000 | 1,083,655 |
| | Prerefunded 10/1/2020 @ 100, 5.0%, 10/1/2029 | 3,030,000 | 3,418,325 |
| | 5.0%, 10/1/2030 | 1,210,000 | 1,349,574 |
| | Prerefunded 10/1/2020 @ 100, 5.0%, 10/1/2030 | 3,790,000 | 4,275,726 |
| Dallas-Fort Worth, TX, International Airport Revenue, Series B, 5.0%, 11/1/2028 | 5,000,000 | 5,782,500 |
| Denton County, TX, General Obligation, 4.0%, 7/15/2030 | 3,000,000 | 3,345,030 |
| Duncanville, TX, Independent School District, 5.0%, 2/15/2028 | 5,645,000 | 6,822,378 |
| El Paso, TX, Independent School District, School Building Improvements: | |
| | 5.0%, 8/15/2022 | 680,000 | 713,959 |
| | Prerefunded 8/15/2018 @ 100, 5.0%, 8/15/2022 | 4,205,000 | 4,415,250 |
| Fort Bend County, TX, General Obligation: |
| | Series B, 5.0%, 3/1/2027 | 4,470,000 | 5,402,129 |
| | Series B, 5.0%, 3/1/2028 | 7,800,000 | 9,353,292 |
| Fort Worth, TX, Independent School District, School Building, 5.0%, 2/15/2028 | 9,210,000 | 10,135,605 |
| Frisco, TX, Independent School District: |
| | 4.0%, 8/15/2029 (a) | 6,940,000 | 7,874,610 |
| | 4.0%, 8/15/2030 (a) | 8,170,000 | 9,185,449 |
| Grand Prairie, TX, Independent School District, 4.0%, 8/15/2027 | 7,525,000 | 8,612,061 |
| Harris County, TX, Cultural Education Facilities Finance Corp. Revenue, Memorial Herman Hospital Health System, Series B, 1.36%**, Mandatory Put 12/1/2019 @ 100, 12/1/2042 | 6,000,000 | 6,005,700 |
| Harris County, TX, Flood Control District, Contract Tax Revenue: | |
| | Series B, 5.0%, 10/1/2028 | 5,000,000 | 6,102,000 |
| | Series A, 5.0%, 10/1/2029 | 5,000,000 | 5,620,650 |
| Harris County, TX, Metropolitan Transit Authority, Sales & Use Tax, Series A, 5.0%, 11/1/2031 | 2,795,000 | 3,177,496 |
| Houston, TX, Airport Systems Revenue: |
| | Series B, 5.0%, 7/1/2026 | 4,000,000 | 4,540,560 |
| | Series B, 5.0%, 7/1/2027 | 9,600,000 | 11,070,720 |
| | Series A, 5.25%, 7/1/2029 | 8,000,000 | 8,358,240 |
| Houston, TX, General Obligation: |
| | Series A, 5.0%, 3/1/2026 | 865,000 | 924,763 |
| | Series A, Prerefunded 3/1/2019 @ 100, 5.0%, 3/1/2026 | 7,135,000 | 7,640,443 |
| Houston, TX, Port Authority, Series A, 5.0%, 10/1/2023 | 4,565,000 | 5,524,517 |
| Houston, TX, Utility System Revenue, SIFMA Index, Series A, 1.68%**, Mandatory Put 5/1/2020 @ 100, 5/15/2034 | 12,000,000 | 11,997,720 |
| Houston, TX, Utility Systems Revenue: |
| | Series C, 5.0%, 5/15/2022 | 2,000,000 | 2,350,040 |
| | Series D, 5.0%, 11/15/2028 | 3,560,000 | 4,327,928 |
| | Series A, 5.25%, 11/15/2028 | 2,500,000 | 2,851,750 |
| Humble, TX, Independent School District, School Building, Series A, 5.0%, 2/15/2029 | 1,335,000 | 1,506,000 |
| Judson, TX, Independent School District, School Building, 4.0%, 2/1/2029 | 2,000,000 | 2,253,000 |
| Katy, TX, Independent School District: |
| | Series B, 5.0%, 2/15/2027 | 3,020,000 | 3,671,172 |
| | Series A, 5.0%, 2/15/2028 | 6,210,000 | 7,505,220 |
| Longview, TX, Independent School District, School Building Improvements, Prerefunded 8/15/2018 @ 100, 5.0%, 2/15/2022 | 2,000,000 | 2,101,001 |
| Lubbock, TX, General Obligation, 5.0%, 2/15/2029 | 2,000,000 | 2,250,020 |
| Magnolia, TX, Independent School District: |
| | 4.0%, 8/15/2029 | 1,255,000 | 1,407,344 |
| | 4.0%, 8/15/2030 | 1,305,000 | 1,446,697 |
| North Texas, Tollway Authority Revenue: |
| | Series A, 5.0%, 1/1/2027 | 1,945,000 | 2,312,955 |
| | Series A, 5.0%, 1/1/2028 | 1,150,000 | 1,357,909 |
| | Series B, 5.0%, 1/1/2029 | 2,845,000 | 3,367,996 |
| North Texas, Tollway Authority Revenue, First Tier: |
| | Series A, 5.0%, 1/1/2025 | 1,480,000 | 1,764,648 |
| | Series A, 6.0%, 1/1/2022 | 865,000 | 889,108 |
| | Series A, Prerefunded 1/1/2018 @ 100, 6.0%, 1/1/2022 | 6,135,000 | 6,320,216 |
| North Texas, Tollway Authority Revenue, Special Projects Systems: | |
| | Series D, 5.25%, 9/1/2027 | 9,080,000 | 10,533,436 |
| | Series A, 5.5%, 9/1/2028 | 1,240,000 | 1,445,666 |
| Plano, TX, General Obligation, 5.0%, 9/1/2029 | 1,635,000 | 1,789,197 |
| San Antonio, TX, Electric & Gas Revenue, Series A, Prerefunded 2/1/2019 @ 100, 5.25%, 2/1/2026 | 7,000,000 | 7,501,270 |
| San Antonio, TX, Water Systems Revenue, Junior Lien, Series E, 5.0%, 5/15/2027 | 1,900,000 | 2,251,519 |
| Tarrant County, TX, Cultural Education Facilities Finance Corp., Hospital Revenue, Scott & White Healthcare, Prerefunded 8/15/2020 @ 100, 5.25%, 8/15/2023 | 2,500,000 | 2,830,725 |
| Tarrant, TX, Regional Water District Revenue, 5.0%, 3/1/2024 | 4,955,000 | 6,030,631 |
| Texas, Dallas-Fort Worth International Airport Revenue: |
| | Series A, 5.0%, 11/1/2018 | 1,000,000 | 1,057,190 |
| | Series D, 5.0%, 11/1/2024 | 2,250,000 | 2,527,560 |
| | Series C, 5.0%, 11/1/2025 | 4,605,000 | 5,169,803 |
| | Series C, 5.0%, 11/1/2026 | 3,290,000 | 3,691,150 |
| Texas, Grapevine-Colleyville Independent School District Building, 5.0%, 8/15/2031 | 3,465,000 | 3,920,197 |
| Texas, Klein Independent School District, Series A, 5.0%, 8/1/2030 | 5,745,000 | 6,914,682 |
| Texas, Municipal Gas Acquisition & Supply Corp. I, Gas Supply Revenue, Senior Lien, Series D, 6.25%, 12/15/2026, GTY: Merrill Lynch & Co., Inc. | 13,680,000 | 16,870,997 |
| Texas, SA Energy Acquisition Public Facility Corp., Gas Supply Revenue: | |
| | 5.25%, 8/1/2017, GTY: The Goldman Sachs Group, Inc. | 5,690,000 | 5,727,156 |
| | 5.5%, 8/1/2020, GTY: The Goldman Sachs Group, Inc. | 3,790,000 | 4,237,068 |
| Texas, State Department of Housing & Community Affairs, Residential Mortgage Revenue, Series A, 5.375%, 1/1/2039 | 720,000 | 743,112 |
| Texas, State General Obligation, Series B-2, 2.0%, Mandatory Put 8/1/2019 @ 100, 8/1/2025 | 3,645,000 | 3,651,452 |
| Texas, State Municipal Gas Acquisition & Supply Corp., III Gas Supply Revenue, 5.0%, 12/15/2022, GTY: Macquarie Group Ltd. | 5,000,000 | 5,819,800 |
| Texas, State Transportation Commission, Series A, 5.0%, 10/1/2028 | 5,000,000 | 6,027,750 |
| Texas, State Transportation Commission Mobility Fund, Series B, 1.16%**, Mandatory Put 10/1/2018 @ 100, 10/1/2041 | 5,000,000 | 4,998,300 |
| Texas, State University Systems Financing Revenue, Series A, 5.0%, 3/15/2027 | 4,000,000 | 4,837,000 |
| Texas, State Veterans Housing Assistance Program, Fund II, Series A, 5.25%, 12/1/2023 | 4,000,000 | 4,338,960 |
| Texas, Water Development Board Revenue, State Revolving Fund: | |
| | Series A, 5.0%, 7/15/2020 | 3,150,000 | 3,166,348 |
| | Series B, 5.25%, 7/15/2021 | 3,000,000 | 3,016,650 |
| Victoria, TX, Independent School District: |
| | 4.0%, 2/15/2028 | 5,000,000 | 5,612,500 |
| | 4.0%, 2/15/2029 | 3,625,000 | 4,036,474 |
| West Harris County, TX, Regional Water Authority, Water Systems Revenue: | |
| | 5.0%, 12/15/2026 | 2,640,000 | 2,873,719 |
| | 5.0%, 12/15/2027 | 2,770,000 | 3,010,879 |
| | 5.0%, 12/15/2028 | 2,905,000 | 3,157,619 |
| | 354,295,604 |
| Utah 0.2% |
| Riverton, UT, Hospital Revenue, IHC Health Services, Inc., 5.0%, 8/15/2020 | 2,825,000 | 3,076,707 |
| Virginia 1.7% |
| Salem, VA, Industrial Development Authority, Multi-Family Housing Revenue, Oak Park Apartments Project, 0.77%*, 8/15/2043, LIQ: Fannie Mae, LOC: Fannie Mae | 4,200,000 | 4,200,000 |
| Virginia, State College Building Authority, Educational Facilities Revenue, 21st Century College, Series B, 4.0%, 2/1/2029 | 16,745,000 | 18,682,564 |
| Virginia, State Public School Authority, School Financing, Series B, 4.0%, 8/1/2029 | 7,060,000 | 8,052,495 |
| | 30,935,059 |
| Washington 4.6% |
| King County, WA, Public Hospital District No. 2, 5.0%, 12/1/2022 | 6,865,000 | 8,128,915 |
| Port of Seattle, WA, Revenue Bond, Series B, 5.0%, 3/1/2022 | 1,250,000 | 1,452,262 |
| Seattle, WA, Municipal Light & Power Revenue: |
| | Series B-1, 1.46%**, Mandatory Put 11/1/2018 @ 100, 5/1/2045 | 6,000,000 | 6,000,240 |
| | Series B, 5.0%, 2/1/2025 | 7,250,000 | 7,989,210 |
| Washington, Energy Northwest Electric Revenue, Project No. 1, Series A, 5.0%, 7/1/2028 | 5,000,000 | 6,062,450 |
| Washington, State Economic Development Finance Authority, Solid Waste Dispensary Revenue, Waste Management, Inc., Series D, 144A, 1.25%, 11/1/2017 | 3,000,000 | 3,003,090 |
| Washington, State General Obligation: |
| | Series 2011-A, 5.0%, 8/1/2028 | 10,000,000 | 11,171,600 |
| | Series R-2015-C, 5.0%, 7/1/2030 | 3,095,000 | 3,679,336 |
| | Series 2011-A, 5.0%, 8/1/2031 | 17,845,000 | 19,790,105 |
| | Series A, 5.0%, 8/1/2032 | 14,000,000 | 15,897,420 |
| Washington, State Housing Finance Commission, Homeownership Program, Series A, 4.7%, 10/1/2028 | 330,000 | 347,299 |
| | 83,521,927 |
| West Virginia 0.1% |
| West Virginia, State Hospital Finance Authority Revenue, State University Health System Obligated Group, Series A, 5.0%, 6/1/2032 | 2,400,000 | 2,794,008 |
| Wisconsin 2.0% |
| Wisconsin, State Clean Water Revenue: |
| | Prerefunded 6/1/2024 @ 100, 5.0%, 6/1/2029 | 8,500,000 | 10,438,255 |
| | Series 1, Prerefunded 6/1/2020 @ 100, 5.0%, 6/1/2031 | 2,500,000 | 2,792,850 |
| Wisconsin, State General Fund, Annual Appropriation Revenue: | |
| | Series A, 6.0%, 5/1/2026 | 4,525,000 | 4,954,015 |
| | Series A, Prerefunded 5/1/2019 @ 100, 6.0%, 5/1/2026 | 475,000 | 520,738 |
| Wisconsin, State General Obligation: |
| | Series 1, 5.0%, 5/1/2027 | 3,000,000 | 3,568,020 |
| | Series A, Prerefunded 5/1/2021 @ 100, 5.25%, 5/1/2026 | 3,500,000 | 4,054,365 |
| Wisconsin, State Health & Educational Facilities Authority Revenue, Children's Hospital of Wisconsin, Series B, 5.375%, 8/15/2024 | 1,000,000 | 1,099,760 |
| Wisconsin, State Transportation Revenue: |
| | Series 2, 5.0%, 7/1/2023 | 2,500,000 | 3,025,550 |
| | Series 2, 5.0%, 7/1/2026 | 5,000,000 | 6,002,500 |
| | 36,456,053 |
| | % of Net Assets | Value ($) |
| | |
| Total Investment Portfolio (Cost $1,708,482,365)† | 100.0 | 1,802,428,730 |
| Other Assets and Liabilities, Net | 0.0 | (184,595) |
| Net Assets | 100.0 | 1,802,244,135 |
* Variable rate demand notes are securities whose interest rates are reset periodically at market levels. These securities are payable on demand, either daily or weekly, and are shown at their current rates as of May 31, 2017. Maturity date shown is the final maturity date.
** Floating rate securities' yields vary with a designated market index or market rate, such as the coupon-equivalent of the U.S. Treasury Bill rate. These securities are shown at their current rates as of May 31, 2017.
† The cost for federal income tax purposes was $1,707,516,210. At May 31, 2017, net unrealized appreciation for all securities based on tax cost was $94,912,520. This consisted of aggregate gross unrealized appreciation for all securities in which there was an excess of value over tax cost of $96,176,009 and aggregate gross unrealized depreciation for all securities in which there was an excess of tax cost over value of $1,263,489.
(a) When-issued security.
144A: Security exempt from registration under Rule 144A of the Securities Act of 1933. These securities may be resold in transactions exempt from registration, normally to qualified institutional buyers.
AGC: Assured Guaranty Corp.
AGMC: Assured Guaranty Municipal Corp.
ETM: Bonds bearing the description ETM (escrow to maturity) are collateralized usually by U.S. Treasury securities which are held in escrow and used to pay principal and interest on bonds so designated.
GTY: Guaranty Agreement
INS: Insured
LIQ: Liquidity Facility
LOC: Letter of Credit
NATL: National Public Finance Guarantee Corp.
Prerefunded: Bonds which are prerefunded are collateralized usually by U.S. Treasury securities which are held in escrow and used to pay principal and interest on tax-exempt issues and to retire the bonds in full at the earliest refunding date.
SIFMA: Securities Industry and Financial Markets Association
SPA: Standby Bond Purchase Agreement
Fair Value Measurements
Various inputs are used in determining the value of the Fund's investments. These inputs are summarized in three broad levels. Level 1 includes quoted prices in active markets for identical securities. Level 2 includes other significant observable inputs (including quoted prices for similar securities, interest rates, prepayment speeds and credit risk). Level 3 includes significant unobservable inputs (including the Fund's own assumptions in determining the fair value of investments). The level assigned to the securities valuations may not be an indication of the risk or liquidity associated with investing in those securities.
The following is a summary of the inputs used as of May 31, 2017 in valuing the Fund's investments. For information on the Fund's policy regarding the valuation of investments, please refer to the Security Valuation section of Note A in the accompanying Notes to Financial Statements.
| Assets | Level 1 | Level 2 | Level 3 | Total |
| |
| Municipal Investments (b) | $ — | $ 1,802,428,730 | $ — | $ 1,802,428,730 |
| Total | $ — | $ 1,802,428,730 | $ — | $ 1,802,428,730 |
There have been no transfers between fair value measurement levels during the year ended May 31, 2017.
(b) See Investment Portfolio for additional detailed categorizations.
The accompanying notes are an integral part of the financial statements.
Statement of Assets and Liabilities
| as of May 31, 2017 |
| Assets |
| Investments in securities, at value (cost $1,708,482,365) | $ 1,802,428,730 |
| Cash | 2,429,086 |
| Receivable for investments sold | 7,323,143 |
| Receivable for Fund shares sold | 1,396,544 |
| Interest receivable | 21,433,402 |
| Other assets | 71,613 |
| Total assets | 1,835,082,518 |
| Liabilities |
| Payable for investments purchased | 4,839,261 |
| Payable for investments purchased — when-issued securities | 23,720,779 |
| Payable for Fund shares redeemed | 1,790,640 |
| Distributions payable | 863,073 |
| Accrued management fee | 448,219 |
| Accrued Trustees' fees | 11,126 |
| Other accrued expenses and payables | 1,165,285 |
| Total liabilities | 32,838,383 |
| Net assets, at value | $ 1,802,244,135 |
| Net Assets Consist of |
| Undistributed net investment income | 731,542 |
| Net unrealized appreciation (depreciation) on investments | 93,946,365 |
| Accumulated net realized gain (loss) | (8,183,328) |
| Paid-in capital | 1,715,749,556 |
| Net assets, at value | $ 1,802,244,135 |
The accompanying notes are an integral part of the financial statements.
| Statement of Assets and Liabilities as of May 31, 2017 (continued) |
| Net Asset Value |
Class A Net Asset Value and redemption price per share ($206,636,416 ÷ 17,318,826 outstanding shares of beneficial interest, $.01 par value, unlimited number of shares authorized) | $ 11.93 |
| Maximum offering price per share (100 ÷ 97.25 of $11.93) | $ 12.27 |
Class C Net Asset Value, offering and redemption price (subject to contingent deferred sales charge) per share ($47,442,985 ÷ 3,977,893 outstanding shares of beneficial interest, $.01 par value, unlimited number of shares authorized) | $ 11.93 |
Class S Net Asset Value, offering and redemption price per share ($678,559,652 ÷ 56,861,842 outstanding shares of beneficial interest, $.01 par value, unlimited number of shares authorized) | $ 11.93 |
Institutional Class Net Asset Value, offering and redemption price per share ($869,605,082 ÷ 72,870,624 outstanding shares of beneficial interest, $.01 par value, unlimited number of shares authorized) | $ 11.93 |
The accompanying notes are an integral part of the financial statements.
Statement of Operations
| for the year ended May 31, 2017 |
| Investment Income |
Income: Interest | $ 60,036,913 |
Expenses: Management fee | 6,070,497 |
| Administration fee | 1,927,142 |
| Services to shareholders | 2,452,398 |
| Distribution and service fees | 1,175,603 |
| Custodian fee | 13,063 |
| Professional fees | 130,357 |
| Reports to shareholders | 71,629 |
| Registration fees | 89,878 |
| Trustees' fees and expenses | 82,423 |
| Other | 157,670 |
| Total expenses before expense reductions | 12,170,660 |
| Expense reductions | (460,210) |
| Total expenses after expense reductions | 11,710,450 |
| Net investment income | 48,326,463 |
| Realized and Unrealized Gain (Loss) |
| Net realized gain (loss) from investments | 5,825,711 |
| Change in net unrealized appreciation (depreciation) on investments | (38,161,702) |
| Net gain (loss) | (32,335,991) |
| Net increase (decrease) in net assets resulting from operations | $ 15,990,472 |
The accompanying notes are an integral part of the financial statements.
Statements of Changes in Net Assets
| Increase (Decrease) in Net Assets | Years Ended May 31, |
| 2017 | 2016 |
Operations: Net investment income | $ 48,326,463 | $ 47,904,334 |
| Net realized gain (loss) | 5,825,711 | 3,081,687 |
| Change in net unrealized appreciation (depreciation) | (38,161,702) | 32,093,064 |
| Net increase (decrease) in net assets resulting from operations | 15,990,472 | 83,079,085 |
Distributions to shareholders from: Net investment income: Class A | (5,725,596) | (6,687,171) |
| Class B | — | (689)* |
| Class C | (884,438) | (1,000,722) |
| Class S | (17,211,629) | (16,882,472) |
| Institutional Class | (24,335,748) | (23,170,535) |
| Total distributions | (48,157,411) | (47,741,589) |
Fund share transactions: Proceeds from shares sold | 488,345,318 | 542,092,343 |
| Reinvestment of distributions | 43,449,274 | 42,959,689 |
| Payments for shares redeemed | (748,340,034) | (528,663,726) |
| Net increase (decrease) in net assets from Fund share transactions | (216,545,442) | 56,388,306 |
| Increase (decrease) in net assets | (248,712,381) | 91,725,802 |
| Net assets at beginning of period | 2,050,956,516 | 1,959,230,714 |
| Net assets at end of period (including undistributed net investment income of $731,542 and $730,995, respectively) | $ 1,802,244,135 | $ 2,050,956,516 |
* For the period from June 1, 2015 to February 10, 2016 (see Note A).
The accompanying notes are an integral part of the financial statements.
Financial Highlights
| Class A | |
Years Ended May 31, |
| 2017 | 2016 | 2015 | 2014 | 2013 |
| Selected Per Share Data |
| Net asset value, beginning of period | $ 12.11 | $ 11.88 | $ 11.94 | $ 11.99 | $ 12.07 |
Income from investment operations: Net investment income | .28 | .28 | .28 | .31 | .30 |
| Net realized and unrealized gain (loss) | (.18) | .22 | (.06) | (.05) | (.08) |
| Total from investment operations | .10 | .50 | .22 | .26 | .22 |
Less distributions from: Net investment income | (.28) | (.27) | (.28) | (.31) | (.30) |
| Net asset value, end of period | $ 11.93 | $ 12.11 | $ 11.88 | $ 11.94 | $ 11.99 |
| Total Return (%)a | .83 | 4.29 | 1.85b | 2.25 | 1.80 |
| Ratios to Average Net Assets and Supplemental Data |
| Net assets, end of period ($ millions) | 207 | 284 | 311 | 335 | 466 |
| Ratio of expenses before expense reductions (%) | .79 | .79 | .79 | .78 | .78 |
| Ratio of expenses after expense reductions (%) | .79 | .79 | .79 | .78 | .78 |
| Ratio of net investment income (loss) (%) | 2.33 | 2.29 | 2.35 | 2.66 | 2.45 |
| Portfolio turnover rate (%) | 36 | 41 | 54 | 67 | 35 |
a Total return does not reflect the effect of any sales charges. b Total return would have been lower had certain expenses not been reduced. |
| Class C | |
Years Ended May 31, |
| 2017 | 2016 | 2015 | 2014 | 2013 |
| Selected Per Share Data |
| Net asset value, beginning of period | $ 12.10 | $ 11.88 | $ 11.94 | $ 11.99 | $ 12.07 |
Income from investment operations: Net investment income | .19 | .18 | .19 | .22 | .21 |
| Net realized and unrealized gain (loss) | (.17) | .22 | (.06) | (.05) | (.08) |
| Total from investment operations | .02 | .40 | .13 | .17 | .13 |
Less distributions from: Net investment income | (.19) | (.18) | (.19) | (.22) | (.21) |
| Net asset value, end of period | $ 11.93 | $ 12.10 | $ 11.88 | $ 11.94 | $ 11.99 |
| Total Return (%)a | .15 | 3.42b | 1.09b | 1.48b | 1.03 |
| Ratios to Average Net Assets and Supplemental Data |
| Net assets, end of period ($ millions) | 47 | 62 | 70 | 76 | 106 |
| Ratio of expenses before expense reductions (%) | 1.55 | 1.55 | 1.56 | 1.55 | 1.54 |
| Ratio of expenses after expense reductions (%) | 1.55 | 1.55 | 1.54 | 1.54 | 1.54 |
| Ratio of net investment income (%) | 1.57 | 1.54 | 1.61 | 1.90 | 1.69 |
| Portfolio turnover rate (%) | 36 | 41 | 54 | 67 | 35 |
a Total return does not reflect the effect of any sales charges. b Total return would have been lower had certain expenses not been reduced. |
| Class S | |
Years Ended May 31, |
| 2017 | 2016 | 2015 | 2014 | 2013 |
| Selected Per Share Data |
| Net asset value, beginning of period | $ 12.11 | $ 11.89 | $ 11.95 | $ 11.99 | $ 12.07 |
Income from investment operations: Net investment income | .31 | .30 | .31 | .34 | .32 |
| Net realized and unrealized gain (loss) | (.18) | .22 | (.06) | (.05) | (.08) |
| Total from investment operations | .13 | .52 | .25 | .29 | .24 |
Less distributions from: Net investment income | (.31) | (.30) | (.31) | (.33) | (.32) |
| Net asset value, end of period | $ 11.93 | $ 12.11 | $ 11.89 | $ 11.95 | $ 11.99 |
| Total Return (%)a | 1.07 | 4.45 | 2.11 | 2.57 | 1.97 |
| Ratios to Average Net Assets and Supplemental Data |
| Net assets, end of period ($ millions) | 679 | 684 | 675 | 663 | 809 |
| Ratio of expenses before expense reductions (%) | .62 | .62 | .61 | .63 | .61 |
| Ratio of expenses after expense reductions (%) | .55 | .55 | .54 | .57 | .61 |
| Ratio of net investment income (%) | 2.57 | 2.54 | 2.60 | 2.88 | 2.62 |
| Portfolio turnover rate (%) | 36 | 41 | 54 | 67 | 35 |
| a Total return would have been lower had certain expenses not been reduced. |
| Institutional Class | |
Years Ended May 31, |
| 2017 | 2016 | 2015 | 2014 | 2013 |
| Selected Per Share Data |
| Net asset value, beginning of period | $ 12.11 | $ 11.89 | $ 11.95 | $ 12.00 | $ 12.08 |
Income (loss) from investment operations: Net investment income | .31 | .31 | .31 | .34 | .33 |
| Net realized and unrealized gain (loss) | (.18) | .21 | (.06) | (.05) | (.08) |
| Total from investment operations | .13 | .52 | .25 | .29 | .25 |
Less distributions from: Net investment income | (.31) | (.30) | (.31) | (.34) | (.33) |
| Net asset value, end of period | $ 11.93 | $ 12.11 | $ 11.89 | $ 11.95 | $ 12.00 |
| Total Return (%) | 1.07 | 4.47 | 2.12 | 2.53 | 2.07 |
| Ratios to Average Net Assets and Supplemental Data |
| Net assets, end of period ($ millions) | 870 | 1,021 | 904 | 534 | 520 |
| Ratio of expenses (%) | .55 | .53 | .54 | .52 | .51 |
| Ratio of net investment income (%) | 2.57 | 2.55 | 2.59 | 2.93 | 2.71 |
| Portfolio turnover rate (%) | 36 | 41 | 54 | 67 | 35 |
| |
Notes to Financial Statements
A. Organization and Significant Accounting Policies
Deutsche Intermediate Tax/AMT Free Fund (the "Fund") is a diversified series of Deutsche Tax Free Trust (the "Trust"), which is registered under the Investment Company Act of 1940, as amended (the "1940 Act"), as an open-end management investment company organized as a Massachusetts business trust.
The Fund offers multiple classes of shares which provide investors with different purchase options. Class A shares are subject to an initial sales charge. Class B shares automatically converted to Class A shares on February 10, 2016 and are no longer offered. Class B shares were not subject to an initial sales charge and were subject to higher ongoing expenses than Class A shares and a contingent deferred sales charge payable upon certain redemptions. Class C shares are not subject to an initial sales charge but are subject to higher ongoing expenses than Class A shares and a contingent deferred sales charge payable upon certain redemptions within one year of purchase. Class S shares are not subject to initial or contingent deferred sales charges and are only available to a limited group of investors. Institutional Class shares are not subject to initial or contingent deferred sales charges and are generally available only to qualified institutions.
Investment income, realized and unrealized gains and losses, and certain fund-level expenses and expense reductions, if any, are borne pro rata on the basis of relative net assets by the holders of all classes of shares, except that each class bears certain expenses unique to that class such as distribution and service fees, services to shareholders and certain other class-specific expenses. Differences in class-level expenses may result in payment of different per share dividends by class. All shares of the Fund have equal rights with respect to voting subject to class-specific arrangements.
The Fund's financial statements are prepared in accordance with accounting principles generally accepted in the United States of America ("U.S. GAAP") which require the use of management estimates. Actual results could differ from those estimates. The Fund qualifies as an investment company under Topic 946 of Accounting Standards Codification of U.S. GAAP. The policies described below are followed consistently by the Fund in the preparation of its financial statements.
Security Valuation. Investments are stated at value determined as of the close of regular trading on the New York Stock Exchange on each day the exchange is open for trading.
Various inputs are used in determining the value of the Fund's investments. These inputs are summarized in three broad levels. Level 1 includes quoted prices in active markets for identical securities. Level 2 includes other significant observable inputs (including quoted prices for similar securities, interest rates, prepayment speeds and credit risk). Level 3 includes significant unobservable inputs (including the Fund's own assumptions in determining the fair value of investments). The level assigned to the securities valuations may not be an indication of the risk or liquidity associated with investing in those securities.
Municipal debt securities are valued at prices supplied by independent pricing services approved by the Fund's Board, whose valuations are intended to reflect the mean between the bid and asked prices. Such services may use various pricing techniques which take into account appropriate factors such as yield, quality, coupon rate, maturity, type of issue, trading characteristics and other data, as well as broker quotes. If the pricing services are unable to provide valuations, the securities are valued at the mean of the most recent bid and asked quotations or evaluated prices, as applicable, obtained from one or more broker-dealers. These securities are generally categorized as Level 2.
Securities and other assets for which market quotations are not readily available or for which the above valuation procedures are deemed not to reflect fair value are valued in a manner that is intended to reflect their fair value as determined in accordance with procedures approved by the Board and are generally categorized as Level 3. In accordance with the Fund's valuation procedures, factors considered in determining value may include, but are not limited to, the type of the security; the size of the holding; the initial cost of the security; the existence of any contractual restrictions on the security's disposition; the price and extent of public trading in similar securities of the issuer or of comparable companies; quotations or evaluated prices from broker-dealers and/or pricing services; information obtained from the issuer, analysts, and/or the appropriate stock exchange (for exchange-traded securities); an analysis of the company's or issuer's financial statements; an evaluation of the forces that influence the issuer and the market(s) in which the security is purchased and sold; and with respect to debt securities, the maturity, coupon, creditworthiness, currency denomination and the movement of the market in which the security is normally traded. The value determined under these procedures may differ from published values for the same securities.
Disclosure about the classification of fair value measurements is included in a table following the Fund's Investment Portfolio.
When-Issued/Delayed Delivery Securities. The Fund may purchase securities with delivery or payment to occur at a later date beyond the normal settlement period. At the time the Fund enters into a commitment to purchase a security, the transaction is recorded and the value of the security is reflected in the net asset value. The price of such security and the date when the security will be delivered and paid for are fixed at the time the transaction is negotiated. The value of the security may vary with market fluctuations. No interest accrues to the Fund until payment takes place. At the time the Fund enters into this type of transaction, it is required to segregate cash or other liquid assets at least equal to the amount of the commitment.
Certain risks may arise upon entering into when-issued or delayed delivery securities from the potential inability of counterparties to meet the terms of their contracts or if the issuer does not issue the securities due to political, economic or other factors. Additionally, losses may arise due to changes in the value of the underlying securities.
Federal Income Taxes. The Fund's policy is to comply with the requirements of the Internal Revenue Code, as amended, which are applicable to regulated investment companies, and to distribute all of its taxable and tax-exempt income to its shareholders.
Under the Regulated Investment Company Modernization Act of 2010, net capital losses incurred post-enactment may be carried forward indefinitely, and their character is retained as short-term and/or long-term. Previously, net capital losses were carried forward for eight years and treated as short-term losses. As a transition rule, the Act requires that post-enactment net capital losses be used before pre-enactment net capital losses.
At May 31, 2017, the Fund had a net tax basis capital loss carryforward of approximately $9,149,000, including $1,320,000 of pre-enactment losses, which may be applied against any realized net taxable capital gains of each succeeding year until fully utilized or until May 31, 2018, the expiration date, whichever occurs first; and approximately $7,829,000 of post-enactment short-term losses, which may be applied against realized net taxable capital gains indefinitely.
The Fund has reviewed the tax positions for the open tax years as of May 31, 2017 and has determined that no provision for income tax and/or uncertain tax provisions is required in the Fund's financial statements. The Fund's federal tax returns for the prior three fiscal years remain open subject to examination by the Internal Revenue Service.
Distribution of Income and Gains. Net investment income of the Fund is declared as a daily dividend and is distributed to shareholders monthly. Net realized gains from investment transactions, in excess of available capital loss carryforwards, would be taxable to the Fund if not distributed, and, therefore, will be distributed to shareholders at least annually. The Fund may also make additional distributions for tax purposes if necessary.
The timing and characterization of certain income and capital gain distributions are determined annually in accordance with federal tax regulations which may differ from accounting principles generally accepted in the United States of America. These differences primarily relate to certain securities sold at a loss and accretion of market discount on debt securities. As a result, net investment income (loss) and net realized gain (loss) on investment transactions for a reporting period may differ significantly from distributions during such period. Accordingly, the Fund may periodically make reclassifications among certain of its capital accounts without impacting the net asset value of the Fund.
At May 31, 2017, the Fund's components of distributable earnings (accumulated losses) on a tax basis were as follows:
| Undistributed tax-exempt income | $ 1,594,615 |
| Capital loss carryforward | $ (9,149,000) |
| Net unrealized appreciation (depreciation) on investments | $ 94,912,520 |
In addition, the tax character of distributions paid to shareholders by the Fund is summarized as follows:
| | Years Ended May 31, |
| 2017 | 2016 |
| Distributions from tax-exempt income | $ 48,157,411 | $ 47,741,589 |
Expenses. Expenses of the Trust arising in connection with a specific fund are allocated to that fund. Other Trust expenses which cannot be directly attributed to a fund are apportioned among the funds in the Trust based upon the relative net assets or other appropriate measures.
Contingencies. In the normal course of business, the Fund may enter into contracts with service providers that contain general indemnification clauses. The Fund's maximum exposure under these arrangements is unknown, as this would involve future claims that may be made against the Fund that have not yet been made. However, based on experience, the Fund expects the risk of loss to be remote.
Other. Investment transactions are accounted for on a trade date plus one basis for daily net asset value calculations. However, for financial reporting purposes, investment transactions are reported on trade date. Interest income is recorded on the accrual basis. Realized gains and losses from investment transactions are recorded on an identified cost basis. All premiums and discounts are amortized/accreted for financial reporting purposes.
B. Purchases and Sales of Securities
During the year ended May 31, 2017, purchases and sales of investment securities (excluding short-term investments) aggregated $690,655,443 and $899,530,093, respectively.
C. Related Parties
Management Agreement. Under the Investment Management Agreement with Deutsche Investment Management Americas Inc. ("DIMA" or the "Advisor"), an indirect, wholly owned subsidiary of Deutsche Bank AG, the Advisor directs the investments of the Fund in accordance with its investment objectives, policies and restrictions. The Advisor determines the securities, instruments and other contracts relating to investments to be purchased, sold or entered into by the Fund.
The management fee payable under the Investment Management Agreement is at an annual rate (exclusive of any applicable waivers/reimbursements) of 0.315% of the Fund's average daily net assets, computed and accrued daily and payable monthly.
For the period from June 1, 2016 through September 30, 2017, the Advisor has contractually agreed to waive its fees and/or reimburse certain operating expenses of the Fund to the extent necessary to maintain the total annual operating expenses (excluding certain expenses such as extraordinary expenses, taxes, brokerage and interest) of each class as follows:
| Class A | .80% |
| Class C | 1.55% |
| Class S | .55% |
| Institutional Class | .55% |
For the year ended May 31, 2017, fees waived and/or expenses reimbursed for Class S aggregated $460,210.
Administration Fee. Pursuant to an Administrative Services Agreement, DIMA provides most administrative services to the Fund. For all services provided under the Administrative Services Agreement, the Fund pays the Advisor an annual fee ("Administration Fee") of 0.10% of the Fund's average daily net assets, computed and accrued daily and payable monthly. For the year ended May 31, 2017, the Administration Fee was $1,927,142, of which $152,285 is unpaid.
Service Provider Fees. Deutsche AM Service Company ("DSC"), an affiliate of the Advisor, is the transfer agent, dividend-paying agent and shareholder service agent of the Fund. Pursuant to a sub-transfer agency agreement between DSC and DST Systems, Inc. ("DST"), DSC has delegated certain transfer agent, dividend-paying agent and shareholder service agent functions to DST. DSC compensates DST out of the shareholder servicing fee it receives from the Fund. For the year ended May 31, 2017, the amounts charged to the Fund by DSC were as follows:
| Services to Shareholders | Total Aggregated | Unpaid at May 31, 2017 |
| Class A | $ 8,777 | $ 2,327 |
| Class C | 2,793 | 769 |
| Class S | 56,309 | 14,597 |
| Institutional Class | 24,289 | 6,389 |
| | $ 92,168 | $ 24,082 |
Distribution and Service Fees. Under the Fund's Class C 12b-1 Plan, Deutsche AM Distributors, Inc. ("DDI"), an affiliate of the Advisor, receives a fee ("Distribution Fee") of 0.75% of average daily net assets of Class C shares. In accordance with the Fund's Underwriting and Distribution Services Agreement, DDI enters into related selling group agreements with various firms at various rates for sales of Class C shares. For the year ended May 31, 2017, the Distribution Fee was as follows:
| Distribution Fee | Total Aggregated | Unpaid at May 31, 2017 |
| Class C | $ 425,441 | $ 31,651 |
In addition DDI provides information and administrative services for a fee ("Service Fee") to Class A and C shareholders at an annual rate of up to 0.25% of average daily net assets for each such class. DDI in turn has various agreements with financial services firms that provide these services and pays these fees based upon the assets of shareholder accounts the firms service. For the year ended May 31, 2017, the Service Fee was as follows:
| Service Fee | Total Aggregated | Unpaid at May 31, 2017 | Annual
Rate |
| Class A | $ 608,784 | $ 129,012 | .25% |
| Class C | 141,378 | 31,861 | .25% |
| | $ 750,162 | $ 160,873 | |
Underwriting Agreement and Contingent Deferred Sales Charge. DDI is the principal underwriter for the Fund. Underwriting commissions paid in connection with the distribution of Class A shares for the year ended May 31, 2017 aggregated $8,034.
In addition, DDI receives any contingent deferred sales charge ("CDSC") from Class C share redemptions occurring within one year of purchase. There is no such charge upon redemption of any share appreciation or reinvested dividends. The CDSC is 1% of the value of the shares redeemed for Class C. For the year ended May 31, 2017, the CDSC for Class C shares aggregated $4,166. A deferred sales charge of up to 0.50% is assessed on certain redemptions of Class A shares. For the year ended May 31, 2017, DDI received $1,824 for Class A shares.
Typesetting and Filing Service Fees. Under an agreement with DIMA, DIMA is compensated for providing typesetting and certain regulatory filing services to the Fund. For the year ended May 31, 2017, the amount charged to the Fund by DIMA included in the Statement of Operations under "Reports to shareholders" aggregated $21,088, of which $7,756 is unpaid.
Trustees' Fees and Expenses. The Fund paid retainer fees to each Trustee not affiliated with the Advisor, plus specified amounts to the Board Chairperson and Vice Chairperson and to each committee Chairperson.
Transactions with Affiliates. The Fund may purchase securities from, or sell securities to, an affiliated fund provided the affiliation is solely due to having a common investment adviser, common officers, or common trustees. During the year ended May 31, 2017, the Fund engaged in securities purchases of $203,745,000 and securities sales of $202,990,000 with an affiliated fund in compliance with Rule 17a-7 under the 1940 Act.
D. Line of Credit
The Fund and other affiliated funds (the "Participants") share in a $400 million revolving credit facility provided by a syndication of banks. The Fund may borrow for temporary or emergency purposes, including the meeting of redemption requests that otherwise might require the untimely disposition of securities. The Participants are charged an annual commitment fee which is allocated based on net assets, among each of the Participants. Interest is calculated at a rate per annum equal to the sum of the Federal Funds Rate plus 1.25 percent plus if the one-month LIBOR exceeds the Federal Funds Rate, the amount of such excess. The Fund may borrow up to a maximum of 33 percent of its net assets under the agreement. The Fund had no outstanding loans at May 31, 2017.
E. Share Transactions
The following table summarizes share and dollar activity in the Fund:
| | Year Ended May 31, 2017 | Year Ended May 31, 2016 |
| | Shares | Dollars | Shares | Dollars |
| Shares sold |
| Class A | 2,770,384 | $ 32,789,415 | 3,783,612 | $ 45,500,673 |
| Class C | 318,977 | 3,797,529 | 508,269 | 6,094,492 |
| Class S | 18,874,283 | 223,182,643 | 13,405,980 | 161,050,779 |
| Institutional Class | 19,256,425 | 228,575,731 | 27,363,726 | 329,446,399 |
| | | $ 488,345,318 | | $ 542,092,343 |
| Shares issued to shareholders in reinvestment of distributions |
| Class A | 420,501 | $ 5,014,185 | 489,438 | $ 5,867,260 |
| Class B | — | — | 54* | 644* |
| Class C | 51,412 | 612,318 | 56,802 | 680,678 |
| Class S | 1,150,993 | 13,720,068 | 1,140,928 | 13,684,808 |
| Institutional Class | 2,021,532 | 24,102,703 | 1,894,265 | 22,726,299 |
| | | $ 43,449,274 | | $ 42,959,689 |
| Shares redeemed |
| Class A | (9,346,225) | $ (110,817,754) | (6,925,511) | $ (83,010,648) |
| Class B | — | — | (8,120)* | (97,328)* |
| Class C | (1,536,740) | (18,243,507) | (1,274,546) | (15,263,410) |
| Class S | (19,612,468) | (232,345,852) | (14,893,740) | (178,549,138) |
| Institutional Class | (32,677,036) | (386,932,921) | (21,027,246) | (251,743,202) |
| | | $ (748,340,034) | | $ (528,663,726) |
| Net increase (decrease) |
| Class A | (6,155,340) | $ (73,014,154) | (2,652,461) | $ (31,642,715) |
| Class B | — | — | (8,066)* | (96,684)* |
| Class C | (1,166,351) | (13,833,660) | (709,475) | (8,488,240) |
| Class S | 412,808 | 4,556,859 | (346,832) | (3,813,551) |
| Institutional Class | (11,399,079) | (134,254,487) | 8,230,745 | 100,429,496 |
| | | $ (216,545,442) | | $ 56,388,306 |
* For the period from June 1, 2015 to February 10, 2016 (see Note A).
Report of Independent Registered Public Accounting Firm
To the Board of Trustees of Deutsche Tax Free Trust and Shareholders of the Deutsche Intermediate Tax/AMT Free Fund:
In our opinion, the accompanying statement of assets and liabilities, including the investment portfolio, and the related statements of operations, and of changes in net assets and the financial highlights, present fairly, in all material respects, the financial position of the Deutsche Intermediate Tax/AMT Free Fund (the "Fund") as of May 31, 2017, and the results of its operations, the changes in its net assets and the financial highlights for each of the periods therein, in conformity with accounting principles generally accepted in the United States of America. These financial statements and financial highlights (hereafter referred to as "financial statements") are the responsibility of the Fund's management. Our responsibility is to express an opinion on these financial statements based on our audits. We conducted our audits of these financial statements in accordance with the standards of the Public Company Accounting Oversight Board (United States). Those standards require that we plan and perform the audit to obtain reasonable assurance about whether the financial statements are free of material misstatement. An audit includes examining, on a test basis, evidence supporting the amounts and disclosures in the financial statements, assessing the accounting principles used and significant estimates made by management, and evaluating the overall financial statement presentation. We believe that our audits, which included confirmation of securities as of May 31, 2017 by correspondence with the custodian and brokers and the application of alternative auditing procedures where such confirmations had not been received, provide a reasonable basis for our opinion.
Boston, Massachusetts
July 24, 2017 | PricewaterhouseCoopers LLP |
Information About Your Fund's Expenses
As an investor of the Fund, you incur two types of costs: ongoing expenses and transaction costs. Ongoing expenses include management fees, distribution and service (12b-1) fees and other Fund expenses. Examples of transaction costs include sales charges (loads) and account maintenance fees, which are not shown in this section. The following tables are intended to help you understand your ongoing expenses (in dollars) of investing in the Fund and to help you compare these expenses with the ongoing expenses of investing in other mutual funds. In the most recent six-month period, Class S shares limited these expenses; had they not done so, expenses would have been higher. The example in the table is based on an investment of $1,000 invested at the beginning of the six-month period and held for the entire period (December 1, 2016 to May 31, 2017).
The tables illustrate your Fund's expenses in two ways:
— Actual Fund Return. This helps you estimate the actual dollar amount of ongoing expenses (but not transaction costs) paid on a $1,000 investment in the Fund using the Fund's actual return during the period. To estimate the expenses you paid over the period, simply divide your account value by $1,000 (for example, an $8,600 account value divided by $1,000 = 8.6), then multiply the result by the number in the "Expenses Paid per $1,000" line under the share class you hold.
— Hypothetical 5% Fund Return. This helps you to compare your Fund's ongoing expenses (but not transaction costs) with those of other mutual funds using the Fund's actual expense ratio and a hypothetical rate of return of 5% per year before expenses. Examples using a 5% hypothetical fund return may be found in the shareholder reports of other mutual funds. The hypothetical account values and expenses may not be used to estimate the actual ending account balance or expenses you paid for the period.
Please note that the expenses shown in these tables are meant to highlight your ongoing expenses only and do not reflect any transaction costs. The "Expenses Paid per $1,000" line of the tables is useful in comparing ongoing expenses only and will not help you determine the relative total expense of owning different funds. Subject to certain exceptions, an account maintenance fee of $20.00 assessed once per calendar year for Classes A, C and S shares may apply for accounts with balances less than $10,000. This fee is not included in these tables. If it was, the estimate of expenses paid for Classes A, C and S shares during the period would be higher, and account value during the period would be lower, by this amount.
Expenses and Value of a $1,000 Investment
for the six months ended May 31, 2017 (Unaudited) |
| Actual Fund Return | Class A | Class C | Class S | Institutional Class |
| Beginning Account Value 12/1/16 | $ 1,000.00 | $ 1,000.00 | $ 1,000.00 | $ 1,000.00 |
| Ending Account Value 5/31/17 | $ 1,039.90 | $ 1,037.00 | $ 1,041.20 | $ 1,041.20 |
| Expenses Paid per $1,000* | $ 4.02 | $ 7.82 | $ 2.80 | $ 2.85 |
| Hypothetical 5% Fund Return | Class A | Class C | Class S | Institutional Class |
| Beginning Account Value 12/1/16 | $ 1,000.00 | $ 1,000.00 | $ 1,000.00 | $ 1,000.00 |
| Ending Account Value 5/31/17 | $ 1,020.99 | $ 1,017.25 | $ 1,022.19 | $ 1,022.14 |
| Expenses Paid per $1,000* | $ 3.98 | $ 7.75 | $ 2.77 | $ 2.82 |
* Expenses are equal to the Fund's annualized expense ratio for each share class, multiplied by the average account value over the period, multiplied by 182 (the number of days in the most recent six-month period), then divided by 365.
| Annualized Expense Ratios | Class A | Class C | Class S | Institutional Class |
| Deutsche Intermediate Tax/AMT Free Fund | .79% | 1.54% | .55% | .56% |
For more information, please refer to the Fund's prospectus.
For an analysis of the fees associated with an investment in the Fund or similar funds, please refer to http://apps.finra.org/fundanalyzer/1/fa.aspx.
Tax Information (Unaudited)
Of the dividends paid from net investment income for the taxable year ended May 31, 2017, 100% are designated as exempt-interest dividends for federal income tax purposes.
Please consult a tax advisor if you have questions about federal or state income tax laws, or on how to prepare your tax returns. If you have specific questions about your account, please call (800) 728-3337.
Advisory Agreement Board Considerations and Fee Evaluation
The Board of Trustees (hereinafter referred to as the "Board" or "Trustees") approved the renewal of Deutsche Intermediate Tax/AMT Free Fund’s (the "Fund") investment management agreement (the "Agreement") with Deutsche Investment Management Americas Inc. ("DIMA") in September 2016.
In terms of the process that the Board followed prior to approving the Agreement, shareholders should know that:
— During the entire process, all of the Fund’s Trustees were independent of DIMA and its affiliates (the "Independent Trustees").
— The Board met frequently during the past year to discuss fund matters and dedicated a substantial amount of time to contract review matters. Over the course of several months, the Board’s Contract Committee reviewed extensive materials received from DIMA, independent third parties and independent counsel. These materials included an analysis of the Fund’s performance, fees and expenses, and profitability from a fee consultant retained by the Fund’s Independent Trustees (the "Fee Consultant"). The Board also received extensive information throughout the year regarding performance of the Fund.
— The Independent Trustees regularly meet privately with counsel to discuss contract review and other matters. In addition, the Independent Trustees were advised by the Fee Consultant in the course of their review of the Fund’s contractual arrangements and considered a comprehensive report prepared by the Fee Consultant in connection with their deliberations.
— In connection with reviewing the Agreement, the Board also reviewed the terms of the Fund’s Rule 12b-1 plan, distribution agreement, administrative services agreement, transfer agency agreement and other material service agreements.
— Based on its evaluation of the information provided, the Contract Committee presented its findings and recommendations to the Board. The Board then reviewed the Contract Committee’s findings and recommendations.
In connection with the contract review process, the Contract Committee and the Board considered the factors discussed below, among others. The Board also considered that DIMA and its predecessors have managed the Fund since its inception, and the Board believes that a long-term relationship with a capable, conscientious advisor is in the best interests of the Fund. The Board considered, generally, that shareholders chose to invest or remain invested in the Fund knowing that DIMA managed the Fund, and that the Agreement was approved by the Fund's shareholders. DIMA is part of Deutsche Bank AG’s ("Deutsche Bank") Asset Management ("Deutsche AM") division. Deutsche AM is a global asset management business that offers a wide range of investing expertise and resources, including research capabilities in many countries throughout the world. Deutsche Bank has advised the Board that the U.S. asset management business continues to be a critical and integral part of Deutsche Bank, and that Deutsche Bank will continue to invest in Deutsche AM and seek to enhance Deutsche AM’s investment platform. Deutsche Bank also has confirmed its commitment to maintaining strong legal and compliance groups within the Deutsche AM division.
As part of the contract review process, the Board carefully considered the fees and expenses of each Deutsche fund overseen by the Board in light of the fund’s performance. In many cases, this led to the negotiation and implementation of expense caps. As part of these negotiations, the Board indicated that it would consider relaxing these caps in future years following sustained improvements in performance, among other considerations.
While shareholders may focus primarily on fund performance and fees, the Fund’s Board considers these and many other factors, including the quality and integrity of DIMA’s personnel and such other issues as back-office operations, fund valuations, and compliance policies and procedures.
Nature, Quality and Extent of Services. The Board considered the terms of the Agreement, including the scope of advisory services provided under the Agreement. The Board noted that, under the Agreement, DIMA provides portfolio management services to the Fund and that, pursuant to a separate administrative services agreement, DIMA provides administrative services to the Fund. The Board considered the experience and skills of senior management and investment personnel and the resources made available to such personnel. The Board reviewed the Fund’s performance over short-term and long-term periods and compared those returns to various agreed-upon performance measures, including market index(es) and a peer universe compiled using information supplied by Morningstar Direct ("Morningstar"), an independent fund data service. The Board also noted that it has put into place a process of identifying "Focus Funds" (e.g., funds performing poorly relative to a peer universe), and receives additional reporting from DIMA regarding such funds and, where appropriate, DIMA’s plans to address underperformance. The Board believes this process is an effective manner of identifying and addressing underperforming funds. Based on the information provided, the Board noted that for the one-, three- and five-year periods ended December 31, 2015, the Fund’s performance (Class A shares) was in the 3rd quartile, 4th quartile and 3rd quartile, respectively, of the applicable Morningstar universe (the 1st quartile being the best performers and the 4th quartile being the worst performers). The Board also observed that the Fund has underperformed its benchmark in the one-, three- and five-year periods ended December 31, 2015. The Board noted the disappointing investment performance of the Fund in recent periods and continued to discuss with senior management of DIMA the factors contributing to such underperformance and actions being taken to improve performance. The Board considered DIMA’s statements that the Fund had a lower risk profile than many of its peer funds. The Board recognized the efforts by DIMA in recent years to enhance its investment platform and improve long-term performance across the Deutsche fund complex.
Fees and Expenses. The Board considered the Fund’s investment management fee schedule, operating expenses and total expense ratios, and comparative information provided by Broadridge Financial Solutions, Inc. ("Broadridge") and the Fee Consultant regarding investment management fee rates paid to other investment advisors by similar funds (1st quartile being the most favorable and 4th quartile being the least favorable). With respect to management fees paid to other investment advisors by similar funds, the Board noted that the contractual fee rates paid by the Fund, which include a 0.10% fee paid to DIMA under the Fund’s administrative services agreement, were lower than the median (1st quartile) of the applicable Broadridge peer group (based on Broadridge data provided as of December 31, 2015). The Board noted that the Fund’s Class A shares total (net) operating expenses (excluding 12b-1 fees) were expected to be higher than the median (3rd quartile) of the applicable Broadridge expense universe (based on Broadridge data provided as of December 31, 2015, and analyzing Broadridge expense universe Class A (net) expenses less any applicable 12b-1 fees) ("Broadridge Universe Expenses"). The Board also reviewed data comparing each share class’s total (net) operating expenses to the applicable Broadridge Universe Expenses. The Board noted that the expense limitations agreed to by DIMA were expected to help the Fund’s total (net) operating expenses remain competitive. The Board considered the Fund’s management fee rate as compared to fees charged by DIMA to comparable Deutsche U.S. registered funds ("Deutsche Funds") and considered differences between the Fund and the comparable Deutsche Funds. The information requested by the Board as part of its review of fees and expenses also included information about institutional accounts (including any sub-advised funds and accounts) and funds offered primarily to European investors ("Deutsche Europe funds") managed by Deutsche AM. The Board noted that DIMA indicated that Deutsche AM does not manage any institutional accounts or Deutsche Europe funds comparable to the Fund.
On the basis of the information provided, the Board concluded that management fees were reasonable and appropriate in light of the nature, quality and extent of services provided by DIMA.
Profitability. The Board reviewed detailed information regarding revenues received by DIMA under the Agreement. The Board considered the estimated costs and pre-tax profits realized by DIMA from advising the Deutsche Funds, as well as estimates of the pre-tax profits attributable to managing the Fund in particular. The Board also received information regarding the estimated enterprise-wide profitability of DIMA and its affiliates with respect to all fund services in totality and by fund. The Board and the Fee Consultant reviewed DIMA’s methodology in allocating its costs to the management of the Fund. Based on the information provided, the Board concluded that the pre-tax profits realized by DIMA in connection with the management of the Fund were not unreasonable. The Board also reviewed certain publicly available information regarding the profitability of certain similar investment management firms. The Board noted that while information regarding the profitability of such firms is limited (and in some cases is not necessarily prepared on a comparable basis), DIMA and its affiliates’ overall profitability with respect to the Deutsche Funds (after taking into account distribution and other services provided to the funds by DIMA and its affiliates) was lower than the overall profitability levels of most comparable firms for which such data was available.
Economies of Scale. The Board considered whether there are economies of scale with respect to the management of the Fund and whether the Fund benefits from any economies of scale. In this regard, the Board observed that while the Fund’s current investment management fee schedule does not include breakpoints, the Fund’s fee schedule represents an appropriate sharing between the Fund and DIMA of such economies of scale as may exist in the management of the Fund at current asset levels.
Other Benefits to DIMA and Its Affiliates. The Board also considered the character and amount of other incidental benefits received by DIMA and its affiliates, including any fees received by DIMA for administrative services provided to the Fund and any fees received by an affiliate of DIMA for distribution services. The Board also considered benefits to DIMA related to brokerage and soft-dollar allocations, including allocating brokerage to pay for research generated by parties other than the executing broker dealers, which pertain primarily to funds investing in equity securities, along with the incidental public relations benefits to DIMA related to Deutsche Funds advertising and cross-selling opportunities among DIMA products and services. The Board considered these benefits in reaching its conclusion that the Fund’s management fees were reasonable.
Compliance. The Board considered the significant attention and resources dedicated by DIMA to documenting and enhancing its compliance processes in recent years. The Board noted in particular (i) the experience, seniority and time commitment of the individuals serving as DIMA’s and the Fund’s chief compliance officers; (ii) the large number of DIMA compliance personnel; and (iii) the substantial commitment of resources by DIMA and its affiliates to compliance matters.
Based on all of the information considered and the conclusions reached, the Board unanimously determined that the continuation of the Agreement is in the best interests of the Fund. In making this determination, the Board did not give particular weight to any single factor identified above. The Board considered these factors over the course of numerous meetings, certain of which were in executive session with only the Independent Trustees and counsel present. It is possible that individual Independent Trustees may have weighed these factors differently in reaching their individual decisions to approve the continuation of the Agreement.
Board Members and Officers
The following table presents certain information regarding the Board Members and Officers of the fund. Each Board Member's year of birth is set forth in parentheses after his or her name. Unless otherwise noted, (i) each Board Member has engaged in the principal occupation(s) noted in the table for at least the most recent five years, although not necessarily in the same capacity; and (ii) the address of each Independent Board Member is c/o Keith R. Fox, Deutsche Funds Board Chair, c/o Thomas R. Hiller, Ropes & Gray LLP, Prudential Tower, 800 Boylston Street, Boston, MA 02199-3600. Except as otherwise noted below, the term of office for each Board Member is until the election and qualification of a successor, or until such Board Member sooner dies, resigns, is removed or as otherwise provided in the governing documents of the fund. Because the fund does not hold an annual meeting of shareholders, each Board Member will hold office for an indeterminate period. The Board Members may also serve in similar capacities with other funds in the fund complex.
| Independent Board Members |
| Name, Year of Birth, Position with the Fund and Length of Time Served1 | Business Experience and Directorships During the Past Five Years | Number of Funds in Deutsche Fund Complex Overseen | Other Directorships Held by Board Member |
Keith R. Fox, CFA (1954) Chairperson since 2017, and Board Member since 1996 | Managing General Partner, Exeter Capital Partners (a series of private investment funds) (since 1986). Directorships: Progressive International Corporation (kitchen goods importer and distributor); The Kennel Shop (retailer); former Chairman, National Association of Small Business Investment Companies; former Directorships: BoxTop Media Inc. (advertising); Sun Capital Advisers Trust (mutual funds) (2011–2012) | 96 | — |
Kenneth C. Froewiss (1945) Vice Chairperson since 2017, Board Member since 2001 | Retired Clinical Professor of Finance, NYU Stern School of Business (1997–2014); Member, Finance Committee, Association for Asian Studies (2002–present); Director, Mitsui Sumitomo Insurance Group (US) (2004–present); prior thereto, Managing Director, J.P. Morgan (investment banking firm) (until 1996) | 96 | — |
John W. Ballantine (1946) Board Member since 1999 | Retired; formerly, Executive Vice President and Chief Risk Management Officer, First Chicago NBD Corporation/The First National Bank of Chicago (1996–1998); Executive Vice President and Head of International Banking (1995–1996); former Directorships: Director and former Chairman of the Board, Healthways, Inc.2 (population well-being and wellness services) (2003–2014); Stockwell Capital Investments PLC (private equity); Enron Corporation; FNB Corporation; Tokheim Corporation; First Oak Brook Bancshares, Inc. and Oak Brook Bank; Prisma Energy International. Not-for-Profit Director, Trustee: Palm Beach Civic Association; Public Radio International; Window to the World Communications (public media); Harris Theater for Music and Dance (Chicago) | 96 | Portland General Electric2 (utility company) (2003– present) |
Henry P. Becton, Jr. (1943) Board Member since 1990 | Vice Chair and former President, WGBH Educational Foundation. Directorships: Public Radio International; Public Radio Exchange (PRX); The Pew Charitable Trusts (charitable organization); former Directorships: Becton Dickinson and Company2 (medical technology company); Belo Corporation2 (media company); The PBS Foundation; Association of Public Television Stations; Boston Museum of Science; American Public Television; Concord Academy; New England Aquarium; Mass. Corporation for Educational Telecommunications; Committee for Economic Development; Public Broadcasting Service; Connecticut College; North Bennett Street School (Boston) | 96 | — |
Dawn-Marie Driscoll (1946) Board Member since 1987 | Emeritus Executive Fellow, Center for Business Ethics, Bentley University; formerly: President, Driscoll Associates (consulting firm); Partner, Palmer & Dodge (law firm) (1988–1990); Vice President of Corporate Affairs and General Counsel, Filene's (retail) (1978–1988). Directorships: Advisory Board, Center for Business Ethics, Bentley University; Trustee and former Chairman of the Board, Southwest Florida Community Foundation (charitable organization); former Directorships: ICI Mutual Insurance Company (2007–2015); Sun Capital Advisers Trust (mutual funds) (2007–2012), Investment Company Institute (audit, executive, nominating committees) and Independent Directors Council (governance, executive committees) | 96 | — |
Paul K. Freeman (1950) Board Member since 1993 | Consultant, World Bank/Inter-American Development Bank; Independent Directors Council (former chair); Investment Company Institute (executive and nominating committees); formerly: Chairman of Education Committee of Independent Directors Council; Project Leader, International Institute for Applied Systems Analysis (1998–2001); Chief Executive Officer, The Eric Group, Inc. (environmental insurance) (1986–1998); Directorships: Denver Zoo Foundation (December 2012–present); Knoebel Institute for Healthy Aging, University of Denver (2017–present); former Directorships: Prisma Energy International | 96 | — |
Richard J. Herring (1946) Board Member since 1990 | Jacob Safra Professor of International Banking and Professor, Finance Department, The Wharton School, University of Pennsylvania (since July 1972); Co-Director, Wharton Financial Institutions Center; formerly: Vice Dean and Director, Wharton Undergraduate Division (July 1995–June 2000); Director, Lauder Institute of International Management Studies (July 2000–June 2006) | 96 | Director, Aberdeen Singapore and Japan Funds (since 2007); Independent Director of Barclays Bank Delaware (since September 2010) |
William McClayton (1944) Board Member since 2004 | Private equity investor (since October 2009); previously, Managing Director, Diamond Management & Technology Consultants, Inc. (global consulting firm) (2001–2009); Directorship: Board of Managers, YMCA of Metropolitan Chicago; formerly: Senior Partner, Arthur Andersen LLP (accounting) (1966–2001); Trustee, Ravinia Festival | 96 | — |
Rebecca W. Rimel (1951) Board Member since 1995 | President, Chief Executive Officer and Director, The Pew Charitable Trusts (charitable organization) (1994–present); formerly: Executive Vice President, The Glenmede Trust Company (investment trust and wealth management) (1983–2004); Board Member, Investor Education (charitable organization) (2004–2005); Trustee, Executive Committee, Philadelphia Chamber of Commerce (2001–2007); Director, Viasys Health Care2 (January 2007–June 2007); Trustee, Thomas Jefferson Foundation (charitable organization) (1994–2012) | 96 | Director, Becton Dickinson and Company2 (medical technology company) (2012– present); Director, BioTelemetry Inc.2 (health care) (2009– present) |
William N. Searcy, Jr. (1946) Board Member since 1993 | Private investor since October 2003; formerly: Pension & Savings Trust Officer, Sprint Corporation2 (telecommunications) (November 1989–September 2003); Trustee, Sun Capital Advisers Trust (mutual funds) (1998–2012) | 96 | — |
Jean Gleason Stromberg (1943) Board Member since 1997 | Retired. Formerly, Consultant (1997–2001); Director, Financial Markets U.S. Government Accountability Office (1996–1997); Partner, Norton Rose Fulbright, L.L.P. (law firm) (1978–1996); former Directorships: The William and Flora Hewlett Foundation (charitable organization) (2000–2015); Service Source, Inc. (nonprofit), Mutual Fund Directors Forum (2002–2004), American Bar Retirement Association (funding vehicle for retirement plans) (1987–1990 and 1994–1996) | 96 | — |
| Officers4 |
| Name, Year of Birth, Position with the Fund and Length of Time Served5 | Business Experience and Directorships During the Past Five Years |
Brian E. Binder8 (1972) President and Chief Executive Officer, 2013–present | Managing Director3 and Head of US Product and Fund Administration, Deutsche Asset Management (2013–present); Director and President, Deutsche AM Service Company (since 2016); Director and Vice President, Deutsche AM Distributors, Inc. (since 2016); Director and President, DB Investment Managers, Inc. (since 2016); formerly, Head of Business Management and Consulting at Invesco, Ltd. (2010–2012) |
John Millette7 (1962) Vice President and Secretary, 1999–present | Director,3 Deutsche Asset Management; Chief Legal Officer, Deutsche Investment Management Americas Inc. (2015–present); and Director and Vice President, Deutsche AM Trust Company (since 2016); formerly, Secretary, Deutsche Investment Management Americas Inc. (2015–2017) |
Hepsen Uzcan6 (1974) Vice President, since 2016 Assistant Secretary, 2013–present | Director,3 Deutsche Asset Management |
Paul H. Schubert6 (1963) Chief Financial Officer, 2004–present Treasurer, 2005–present | Managing Director,3 Deutsche Asset Management, and Chairman, Director and President, Deutsche AM Trust Company (since 2013); Vice President, Deutsche AM Distributors, Inc. (since 2016); formerly, Director, Deutsche AM Trust Company (2004–2013) |
Caroline Pearson7 (1962) Chief Legal Officer, 2010–present | Managing Director,3 Deutsche Asset Management; Secretary, Deutsche AM Service Company; formerly, Secretary, Deutsche AM Distributors, Inc. |
Scott D. Hogan7 (1970) Chief Compliance Officer, since 2016 | Director,3 Deutsche Asset Management |
Wayne Salit6 (1967) Anti-Money Laundering Compliance Officer, 2014–present | Director,3 Deutsche Asset Management; formerly: Managing Director, AML Compliance Officer at BNY Mellon (2011–2014); and Director, AML Compliance Officer at Deutsche Bank (2004–2011) |
Paul Antosca7 (1957) Assistant Treasurer, 2007–present | Director,3 Deutsche Asset Management |
Diane Kenneally7 (1966) Assistant Treasurer, 2007–present | Director,3 Deutsche Asset Management |
1 The length of time served represents the year in which the Board Member joined the board of one or more Deutsche funds currently overseen by the Board.
2 A publicly held company with securities registered pursuant to Section 12 of the Securities Exchange Act of 1934.
3 Executive title, not a board directorship.
4 As a result of their respective positions held with the Advisor, these individuals are considered "interested persons" of the Advisor within the meaning of the 1940 Act. Interested persons receive no compensation from the fund.
5 The length of time served represents the year in which the officer was first elected in such capacity for one or more Deutsche funds.
6 Address: 60 Wall Street, New York, NY 10005.
7 Address: One Beacon Street, Boston, MA 02108.
8 Address: 222 South Riverside Plaza, Chicago, IL 60606.
The fund's Statement of Additional Information ("SAI") includes additional information about the Board Members. The SAI is available, without charge, upon request. If you would like to request a copy of the SAI, you may do so by calling the following toll-free number: (800) 728-3337.
Account Management Resources
| |
| For More Information | The automated telephone system allows you to access personalized account information and obtain information on other Deutsche funds using either your voice or your telephone keypad. Certain account types within Classes A, C and S also have the ability to purchase, exchange or redeem shares using this system. For more information, contact your financial advisor. You may also access our automated telephone system or speak with a Shareholder Service representative by calling: (800) 728-3337 |
| Web Site | deutschefunds.com View your account transactions and balances, trade shares, monitor your asset allocation, subscribe to fund and account updates by e-mail, and change your address, 24 hours a day. Obtain prospectuses and applications, blank forms, interactive worksheets, news about Deutsche funds, retirement planning information, and more. |
| Written Correspondence | Deutsche Asset Management PO Box 219151
Kansas City, MO 64121-9151 |
| Proxy Voting | The fund's policies and procedures for voting proxies for portfolio securities and information about how the fund voted proxies related to its portfolio securities during the most recent 12-month period ended June 30 are available on our Web site — deutschefunds.com (click on "proxy voting"at the bottom of the page) — or on the SEC's Web site — sec.gov. To obtain a written copy of the fund's policies and procedures without charge, upon request, call us toll free at (800) 728-3337. |
| Portfolio Holdings | Following the fund's fiscal first and third quarter-end, a complete portfolio holdings listing is filed with the SEC on Form N-Q. This form will be available on the SEC's Web site at sec.gov, and it also may be reviewed and copied at the SEC's Public Reference Room in Washington, D.C. Information on the operation of the SEC's Public Reference Room may be obtained by calling (800) SEC-0330. The fund's portfolio holdings are also posted on deutschefunds.com from time to time. Please see the fund's current prospectus for more information. |
| Principal Underwriter | If you have questions, comments or complaints, contact: Deutsche AM Distributors, Inc. 222 South Riverside Plaza
Chicago, IL 60606-5808 (800) 621-1148 |
| Investment Management | Deutsche Investment Management Americas Inc. ("DIMA" or the "Advisor"), which is part of Deutsche Asset Management, is the investment advisor for the fund. DIMA and its predecessors have more than 80 years of experience managing mutual funds and DIMA provides a full range of investment advisory services to both institutional and retail clients. DIMA is an indirect, wholly owned subsidiary of Deutsche Bank AG. Deutsche Bank AG is a major global banking institution engaged in a wide variety of financial services, including investment management, retail, private and commercial banking, investment banking and insurance. |
| | Class A | Class C | Class S | Institutional Class |
| Nasdaq Symbol | SZMAX | SZMCX | SCMTX | SZMIX |
| CUSIP Number | 25159H 108 | 25159H 306 | 25159H 405 | 25159H 504 |
| Fund Number | 445 | 745 | 2045 | 1445 |
Notes
Notes

| | |
| ITEM 2. | CODE OF ETHICS |
| | |
| | As of the end of the period covered by this report, the registrant has adopted a code of ethics, as defined in Item 2 of Form N-CSR that applies to its Principal Executive Officer and Principal Financial Officer. There have been no amendments to, or waivers from, a provision of the code of ethics during the period covered by this report that would require disclosure under Item 2. A copy of the code of ethics is filed as an exhibit to this Form N-CSR. |
| | |
| ITEM 3. | AUDIT COMMITTEE FINANCIAL EXPERT |
| | |
| | The fund’s audit committee is comprised solely of trustees who are "independent" (as such term has been defined by the Securities and Exchange Commission ("SEC") in regulations implementing Section 407 of the Sarbanes-Oxley Act (the "Regulations")). The fund’s Board of Trustees has determined that there are several "audit committee financial experts" (as such term has been defined by the Regulations) serving on the fund’s audit committee including Mr. Paul K. Freeman, the chair of the fund’s audit committee. An “audit committee financial expert” is not an “expert” for any purpose, including for purposes of Section 11 of the Securities Act of 1933 and the designation or identification of a person as an “audit committee financial expert” does not impose on such person any duties, obligations or liability that are greater than the duties, obligations and liability imposed on such person as a member of the audit committee and board of directors in the absence of such designation or identification. |
| | |
| ITEM 4. | PRINCIPAL ACCOUNTANT FEES AND SERVICES |
| | |
deutsche intermediate Tax/AMT Free Fund
form n-csr disclosure re: AUDIT FEES
The following table shows the amount of fees that PricewaterhouseCoopers, LLP (“PWC”), the Fund’s independent registered public accounting firm, billed to the Fund during the Fund’s last two fiscal years. The Audit Committee approved in advance all audit services and non-audit services that PWC provided to the Fund.
Services that the Fund’s Independent Registered Public Accounting Firm Billed to the Fund
Fiscal Year
Ended
May 31, | Audit Fees Billed to Fund | Audit-Related
Fees Billed to Fund | Tax Fees Billed to Fund | All
Other Fees Billed to Fund |
| 2017 | $85,782 | $3,000 | $0 | $0 |
| 2016 | $83,282 | $0 | $0 | $0 |
The “Audit-Related Fees Billed to Fund” were billed for services rendered in connection with a registration filing.
Services that the Fund’s Independent Registered Public Accounting Firm Billed to the Adviser and Affiliated Fund Service Providers
The following table shows the amount of fees billed by PWC to Deutsche Investment Management Americas Inc. (“DIMA” or the “Adviser”), and any entity controlling, controlled by or under common control with DIMA (“Control Affiliate”) that provides ongoing services to the Fund (“Affiliated Fund Service Provider”), for engagements directly related to the Fund’s operations and financial reporting, during the Fund’s last two fiscal years.
Fiscal Year Ended
May 31, | Audit-Related
Fees Billed to Adviser and Affiliated Fund Service Providers | Tax Fees Billed to Adviser and Affiliated Fund Service Providers | All
Other Fees Billed to Adviser and Affiliated Fund Service Providers |
| 2017 | $0 | $52,339 | $0 |
| 2016 | $0 | $30,661 | $0 |
The “Tax Fees Billed to the Advisor” were billed for services associated with foreign tax filings.
Non-Audit Services
The following table shows the amount of fees that PWC billed during the Fund’s last two fiscal years for non-audit services. The Audit Committee pre-approved all non-audit services that PWC provided to the Adviser and any Affiliated Fund Service Provider that related directly to the Fund’s operations and financial reporting. The Audit Committee requested and received information from PWC about any non-audit services that PWC rendered during the Fund’s last fiscal year to the Adviser and any Affiliated Fund Service Provider. The Committee considered this information in evaluating PWC’s independence.
Fiscal Year
Ended
May 31, | Total
Non-Audit Fees Billed to Fund (A) | Total Non-Audit Fees billed to Adviser and Affiliated Fund Service Providers (engagements related directly to the operations and financial reporting of the Fund) (B) | Total Non-Audit Fees billed to Adviser and Affiliated Fund Service Providers (all other engagements) (C) | Total of (A), (B)
and (C) |
| 2017 | $0 | $52,339 | $0 | $52,339 |
| 2016 | $0 | $30,661 | $0 | $30,661 |
Audit Committee Pre-Approval Policies and Procedures. Generally, each Fund’s Audit Committee must pre approve (i) all services to be performed for a Fund by a Fund’s Independent Registered Public Accounting Firm and (ii) all non-audit services to be performed by a Fund’s Independent Registered Public Accounting Firm for the DIMA Entities with respect to operations and financial reporting of the Fund, except that the Chairperson or Vice Chairperson of each Fund’s Audit Committee may grant the pre-approval for non-audit services described in items (i) and (ii) above for non-prohibited services for engagements of less than $100,000. All such delegated pre approvals shall be presented to each Fund’s Audit Committee no later than the next Audit Committee meeting.
There were no amounts that were approved by the Audit Committee pursuant to the de minimis exception under Rule 2-01 of Regulation S-X.
According to the registrant’s principal Independent Registered Public Accounting Firm, substantially all of the principal Independent Registered Public Accounting Firm's hours spent on auditing the registrant's financial statements were attributed to work performed by full-time permanent employees of the principal Independent Registered Public Accounting Firm.
***
In connection with the audit of the 2016 and 2017 financial statements, the Fund entered into an engagement letter with PwC. The terms of the engagement letter required by PwC, and agreed to by the Fund’s Audit Committee, include a provision mandating the use of mediation and arbitration to resolve any controversy or claim between the parties arising out of or relating to the engagement letter or the services provided there-under.
***
In a letter provided to the Audit Committee pursuant to PCAOB Rule 3526 and dated July 19, 2016, PwC informed the Audit Committee that PwC had identified circumstances where PwC maintains lending relationships with owners of greater than 10% of the shares of certain investment companies within the “investment company complex” as defined under Rule 2-01(f)(14) of Regulation S-X. PwC informed the Audit Committee that these lending relationships are inconsistent with the SEC Staff’s interpretation of Rule 2-01(c)(l)(ii)(A) of Regulation S-X (referred to as the “Loan Rule”).
The Loan Rule specifically provides that an accounting firm would not be independent if it receives a loan from a lender that is a record or beneficial owner of more than ten percent of an audit client’s equity securities. For purposes of the Loan Rule, audit clients include the Fund as well as all registered investment companies advised by Deutsche Investment Management Americas Inc. (the “Adviser”), the Fund’s investment adviser, and its affiliates, including other subsidiaries of the Adviser’s parent company, Deutsche Bank AG (collectively, the “Deutsche Funds Complex”). PwC’s lending relationships effect PwC’s independence under the SEC Staff’s interpretation of the Loan Rule with respect to all investment companies in the Deutsche Funds Complex.
In its July 19, 2016 letter, PwC affirmed to the Audit Committee that, as of the date of the letter, PwC is an independent accountant with respect to the Fund, within the meaning of PCAOB Rule 3520. In its letter, PwC also informed the Audit Committee that, after evaluating the facts and circumstances and the applicable independence rules, PwC has concluded that with regard to its compliance with the independence criteria set forth in the rules and regulations of the SEC related to the Loan Rule, it believes that it remains objective and impartial despite matters that may ultimately be determined to be inconsistent with these criteria and therefore it can continue to serve as the Fund’s registered public accounting firm. PwC informed the Audit Committee that its conclusion was based on a number of factors, including, among others, PwC’s belief that the lenders are not able to impact the impartiality of PwC or assert any influence over the investment companies in the Deutsche Funds Complex whose shares the lenders own or the applicable investment company’s investment adviser; and the lenders receive no direct benefit from their ownership of the investment companies in the Deutsche Funds Complex in separate accounts maintained on behalf of their insurance contract holders. In addition, the individuals at PwC who arranged PwC’s lending relationships have no oversight of, or ability to influence, the individuals at PwC who conducted the audits of the Fund’s financial statements.
On June 20, 2016, the SEC Staff issued a “no-action” letter to another mutual fund complex (see Fidelity Management & Research Company et al., No-Action Letter) related to similar Loan Rule issues as those described above. In that letter, the SEC Staff confirmed that it would not recommend enforcement action against an investment company that relied on the audit services performed by an audit firm that was not in compliance with the Loan Rule in certain specified circumstances. The circumstances described in the no-action letter appear to be substantially similar to the circumstances that affected PwC’s independence under the Loan Rule with respect to the Fund. PwC confirmed to the Audit Committee that it meets the conditions of the no-action letter. In the no-action letter, the SEC Staff stated that the relief under the letter is temporary and will expire 18 months after the issuance of the letter.
| | |
| ITEM 5. | AUDIT COMMITTEE OF LISTED REGISTRANTS |
| | |
| | Not applicable |
| | |
| ITEM 6. | SCHEDULE OF INVESTMENTS |
| | |
| | Not applicable |
| | |
| ITEM 7. | DISCLOSURE OF PROXY VOTING POLICIES AND PROCEDURES FOR CLOSED-END MANAGEMENT INVESTMENT COMPANIES |
| | |
| | Not applicable |
| | |
| ITEM 8. | PORTFOLIO MANAGERS OF CLOSED-END MANAGEMENT INVESTMENT COMPANIES |
| | |
| | Not applicable |
| | |
| ITEM 9. | PURCHASES OF EQUITY SECURITIES BY CLOSED-END MANAGEMENT INVESTMENT COMPANY AND AFFILIATED PURCHASERS |
| | |
| | Not applicable |
| | |
| ITEM 10. | SUBMISSION OF MATTERS TO A VOTE OF SECURITY HOLDERS |
| | |
| | There were no material changes to the procedures by which shareholders may recommend nominees to the Fund’s Board. The primary function of the Nominating and Governance Committee is to identify and recommend individuals for membership on the Board and oversee the administration of the Board Governance Guidelines. Shareholders may recommend candidates for Board positions by forwarding their correspondence by U.S. mail or courier service to Keith R. Fox, Deutsche Funds Board Chair, c/o Thomas R. Hiller, Ropes & Gray LLP, Prudential Tower, 800 Boylston Street, Boston, MA 02199-3600. |
| | |
| ITEM 11. | CONTROLS AND PROCEDURES |
| | |
| | (a) | The Chief Executive and Financial Officers concluded that the Registrant’s Disclosure Controls and Procedures are effective based on the evaluation of the Disclosure Controls and Procedures as of a date within 90 days of the filing date of this report. |
| | |
| | (b) | There have been no changes in the registrant’s internal control over financial reporting that occurred during the second fiscal quarter of the period covered by this report that has materially affected, or is reasonably likely to materially affect, the registrant’s internal controls over financial reporting. |
| | |
| ITEM 12. | EXHIBITS |
| | |
| | (a)(1) | Code of Ethics pursuant to Item 2 of Form N-CSR is filed and attached hereto as EX-99.CODE ETH. |
| | |
| | (a)(2) | Certification pursuant to Rule 30a-2(a) under the Investment Company Act of 1940 (17 CFR 270.30a-2(a)) is filed and attached hereto as Exhibit 99.CERT. |
| | |
| | (b) | Certification pursuant to Rule 30a-2(b) under the Investment Company Act of 1940 (17 CFR 270.30a-2(b)) is furnished and attached hereto as Exhibit 99.906CERT. |
SIGNATURES
Pursuant to the requirements of the Securities Exchange Act of 1934 and the Investment Company Act of 1940, the registrant has duly caused this report to be signed on its behalf by the undersigned, thereunto duly authorized.
| Registrant: | Deutsche Intermediate Tax/AMT Free Fund, a series of Deutsche Tax Free Trust |
| | |
| | |
| By: | /s/Brian E. Binder Brian E. Binder President |
| | |
| Date: | 7/28/2017 |
Pursuant to the requirements of the Securities Exchange Act of 1934 and the Investment Company Act of 1940, this report has been signed below by the following persons on behalf of the registrant and in the capacities and on the dates indicated.
| By: | /s/Brian E. Binder Brian E. Binder President |
| | |
| Date: | 7/28/2017 |
| | |
| | |
| | |
| By: | /s/Paul Schubert Paul Schubert Chief Financial Officer and Treasurer |
| | |
| Date: | 7/28/2017 |
| | |