UNITED STATES
SECURITIES AND EXCHANGE COMMISSION
WASHINGTON, D. C. 20549
FORM N-CSR
Investment Company Act file number: 811-03632
Deutsche DWS Tax Free Trust
(Exact Name of Registrant as Specified in Charter)
875 Third Avenue
New York, NY 10022-6225
(Address of Principal Executive Offices) (Zip Code)
Registrant’s Telephone Number, including Area Code: (212) 454-4500
Diane Kenneally
100 Summer Street
Boston, MA 02110
(Name and Address of Agent for Service)
| Date of fiscal year end: | 5/31 |
| | |
| Date of reporting period: | 5/31/2021 |
| ITEM 1. | REPORT TO STOCKHOLDERS |
| | |
| | (a) |

May 31, 2021
Annual Report
to Shareholders
DWS Intermediate Tax-Free Fund
This report must be preceded or accompanied by a prospectus. To obtain a summary prospectus, if available, or prospectus for any of our funds, refer to the Account Management Resources information provided in the back of this booklet. We advise you to consider the Fund’s objectives, risks, charges and expenses carefully before investing. The summary prospectus and prospectus contain this and other important information about the Fund. Please read the prospectus carefully before you invest.
The brand DWS represents DWS Group GmbH & Co. KGaA and any of its subsidiaries such as DWS Distributors, Inc. which offers investment products or DWS Investment Management Americas, Inc. and RREEF America L.L.C. which offer advisory services.
NOT FDIC/NCUA INSURED NO BANK GUARANTEE MAY LOSE VALUE
NOT A DEPOSIT NOT INSURED BY ANY FEDERAL GOVERNMENT AGENCY
| 2 | | DWS Intermediate Tax-Free Fund |
Bond investments are subject to interest-rate, credit, liquidity and market risks to varying degrees. When interest rates rise, bond prices generally fall. Credit risk refers to the ability of an issuer to make timely payments of principal and interest. Municipal securities are subject to the risk that litigation, legislation or other political events, local business or economic conditions or the bankruptcy of the issuer could have a significant effect on an issuer’s ability to make payments of principal and/or interest. The market for municipal bonds may be less liquid than for taxable bonds and there may be less information available on the financial condition of issuers of municipal securities than for public corporations. Although the Fund seeks income that is exempt from federal income taxes, a portion of the Fund’s distributions may be subject to federal, state and local taxes, including the alternative minimum tax. This Fund may use ESG criteria. ESG criteria in a Fund’s investment strategy does not guarantee a return or protect against a loss, limits the types and number of investment opportunities available to the Fund and, as a result, the Fund may underperform other funds that do not have an ESG focus. Please read the prospectus for details.
War, terrorism, economic uncertainty, trade disputes, public health crises (including the recent pandemic spread of the novel coronavirus) and related geopolitical events could lead to increased market volatility, disruption to U.S. and world economies and markets and may have significant adverse effects on the Fund and its investments.
| DWS Intermediate Tax-Free Fund | | 3 |
Letter to Shareholders
Dear Shareholder:
The economic outlook remains positive overall, buoyed by progress in the handling of the pandemic, good corporate earnings and support from central banks. While the U.S. and Asia are acting as growth engines, there is still some uncertainty whether the current momentum is sustainable.
Inflation has come back into focus sooner than expected as a result of the combination of the growth upswing, stimulus packages, expansive central banks, and, most recently, sharply rising oil prices. These circumstances may, to a great extent, prove to be a temporary phenomenon driven by one-time, pandemic-related effects. For example, the massive underutilization of productive capacity and labor in 2020 depressed prices last year. Normalization of commodity prices alone is providing a significant base effect. Together with pent-up demand for many goods, especially in services, this is likely to increase inflationary pressure this year, before it then subsides as economic activity returns to a more typical level.
Whether central banks will be able to leave interest rates at their current low levels is another critical question for the markets this year. Again, our CIO Office believes that government bond yields are likely to rise only temporarily this year.
The scope and pace of recovery is likely to remain uneven among regions, asset classes and investment sectors. We believe that this underscores the value add of active portfolio management. We also believe that the strong partnership between our portfolio managers and our CIO Office — which synthesizes the views of more than 900 DWS economists, analysts and investment professionals around the world — makes an important difference in making strategic and tactical decisions for the DWS Funds.
Thank you for your trust. We welcome the opportunity to help you navigate these unusual times. For ongoing updates to our market and economic outlook, please visit the “Insights” section of dws.com.
Best regards,
Hepsen Uzcan
President, DWS Funds
Assumptions, estimates and opinions contained in this document constitute our judgment as of the date of the document and are subject to change without notice. Any projections are based on a number of assumptions as to market conditions and there can be no guarantee that any projected results will be achieved. Past performance is not a guarantee of future results.
| 4 | | DWS Intermediate Tax-Free Fund |
| Portfolio Management Review | (Unaudited) |
Market Overview and Fund Performance
All performance information below is historical and does not guarantee future results. Returns shown are for Class A shares, unadjusted for sales charges. Investment return and principal fluctuate, so your shares may be worth more or less when redeemed. Current performance may differ from performance data shown. Please visit dws.com for the most recent month-end performance of all share classes. Fund performance includes reinvestment of all distributions. Unadjusted returns do not reflect sales charges and would have been lower if they had. Please refer to pages 11 through 13 for more complete performance information.
Investment Strategy
The Fund can buy many types of municipal securities of all maturities. These may include revenue bonds (which are backed by revenues from a particular source) and general obligation bonds (which are typically backed by the issuer’s ability to levy taxes).
The Fund’s management team seeks to hold municipal bonds that appear to offer the best opportunity to meet the Fund’s objectives of providing a high level of income exempt from regular federal income taxes and limiting principal fluctuation. In making its buy and sell decisions, portfolio management typically weighs a number of factors against each other, from economic outlooks and possible interest rate movements to characteristics of specific securities, such as coupon, maturity date and call date, and changes in supply and demand within the municipal bond market. Although portfolio management may adjust the dollar-weighted average effective maturity of the Fund’s portfolio between three and 10 years, it generally intends to keep it between five and 10 years.
DWS Intermediate Tax-Free Fund posted a return of 4.81% over the 12 months ended May 31, 2021, while the Fund’s primary benchmark index, the Bloomberg Barclays Municipal Bond 1–15 Year Blend (1–17) Index, returned 3.55%. The average fund in the Morningstar Muni National Intermediate category returned 5.47% for the 12 months ended May 31, 2021.
As the period opened, investor sentiment continued to be supported in the wake of the COVID-19 pandemic by extraordinary measures from policy makers. These included the Federal Reserve (Fed) maintaining its benchmark overnight lending rate at zero, providing emergency lending facilities and engaging in broad-based bond purchases. Investors were increasingly optimistic that plans to re-open the economy would limit the
| DWS Intermediate Tax-Free Fund | | 5 |
magnitude of the coronavirus-driven downturn. Municipal bond prices benefited from positive tax-free mutual fund investor flows.
As 2020 progressed, market sentiment was supported by improving economic data and optimism over a COVID-19 vaccine. November saw a source of uncertainty removed with a clear outcome to the presidential election, followed shortly after by headlines around the emergency use authorization for a pair of COVID-19 vaccines.
” Municipal credit sentiment was supported by congressional passage of a $1.9 trillion stimulus package with $350 billion earmarked for supporting state and local governments.”
The first quarter of 2021 saw longer-term U.S. Treasury yields move higher on rising inflation expectations and fears that the Fed would feel compelled to move forward the timetable for tightening policy. The AAA municipal yield curve steepened as the short end remained anchored and yields rose on longer maturities. Municipal credit sentiment was supported by congressional passage of a $1.9 trillion stimulus package with $350 billion earmarked for supporting state and local governments. In addition, municipals were boosted by speculation that tax rates would be raised for high earners and corporations to support a large infrastructure package. Against this backdrop, the pace of investor flows into municipal mutual funds reached all-time highs.
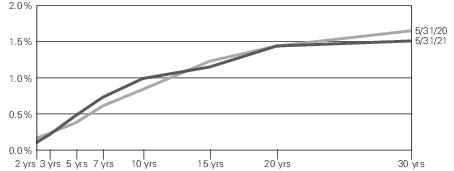
For the 12 months ended May 31, 2021, lower-quality issues within the municipal market significantly outperformed as investors sought yield given improving confidence around the economy. Despite the upward move seen in the first quarter of 2021, longer-term AAA municipal yields finished the period lower and the curve flattened between 2 and 30 years. To illustrate, the two-year yield went from 0.16% to 0.10%, the 10-year from 0.84% to 0.99%, and the 30-year from 1.65% to 1.51% (source: Thomson Reuters).
| 6 | | DWS Intermediate Tax-Free Fund |
AAA Municipal Bond Yield Curve (as of 5/31/21 and 5/31/20)
Source: Refinitiv TM3 as of 5/31/21.
Chart is for illustrative purposes only and does not represent any DWS product.
Positive and Negative Contributors to Fund Performance
The Fund’s overall positioning with respect to credit quality was the most significant contributor to performance vs. the benchmark. During the period we were overweight issues in the single-A and BBB quality ranges, adding to performance given the heavy inflows into tax exempt mutual funds in 2021 and the improving outlook for municipal credit. Similarly, modest out-of-benchmark exposure to below-investment-grade issues was also supportive.
In sector terms, overweight exposure to health care was most supportive. In particular, holdings within the continuing care retirement community segment recovered after being heavily impacted by COVID-19 concerns. Holdings of prepaid gas issues also recovered as these bonds are backed by the financial sector which previously saw declines due to the pandemic. An overweight to airports within the transportation sector added to performance as travel levels continue to improve. An overweight to the housing sector was a drag on performance as investors preferred lower quality areas of the municipal market during the period.
Yield curve positioning added to the Fund’s performance vs. the benchmark. Specifically, the Fund had an overweight in the 15-year part of the curve which saw yields decline along with a corresponding underweight in the 5-year maturity range which experienced rising yields.
| DWS Intermediate Tax-Free Fund | | 7 |
Outlook and Positioning
As of the end of May 2021, municipal yields on an absolute basis and relative to U.S. Treasuries were at low levels by historical standards. The two-year municipal bond yield of 0.10% was 71.4% of the comparable-maturity U.S. Treasury bond yield before taking into account the tax advantage of municipals. The 10-year municipal bond yield of 0.99% was 61.9% of the comparable-maturity U.S. Treasury bond yield, while the 30- year municipal yield of 1.51% was 66.2% of the comparable U.S. Treasury yield.
With an end to the pandemic and economic reopening in sight as vaccines are rolled out, the municipal market remains well supported by accommodative monetary and fiscal policy as well as the potential for higher tax rates under a new political regime. We continue to be vigilant in our credit evaluation of lower quality issues, particularly in the BBB range and below.
Portfolio Management Team
The current portfolio management team is as follows:
Ashton P. Goodfield, CFA, Head of Investment Strategy Fixed Income
Portfolio Manager of the Fund through September 30, 2021. Began managing the Fund in 1990.
—
Joined DWS in 1986.
—
Head of Municipal Bond Department; Portfolio Manager, Municipal Bond Mutual Funds: Boston.
—
BA, Duke University.
Matthew J. Caggiano, CFA, Senior Portfolio Manager Fixed Income
Portfolio Manager of the Fund. Began managing the Fund in 2014.
—
Joined DWS in 1989.
—
Effective October 1, 2021, Co-Head of Municipal Bond Department.
—
BS, Pennsylvania State University; MS, Boston College.
Peter Aloisi, CFA, Portfolio Manager Fixed Income
Portfolio Manager of the Fund. Began managing the Fund in 2014.
—
Joined DWS in 2010 with five years of industry experience; previously, served as an Associate at Banc of America Securities.
—
BA and MBA, Boston College.
| 8 | | DWS Intermediate Tax-Free Fund |
Effective October 1, 2021, the portfolio management team will be as follows:
Matthew J. Caggiano, CFA, Senior Portfolio Manager Fixed Income
Portfolio Manager of the Fund. Began managing the Fund in 2014.
—
Joined DWS in 1989.
—
Effective October 1, 2021, Co-Head of Municipal Bond Department.
—
BS, Pennsylvania State University; MS, Boston College.
Peter Aloisi, CFA, Portfolio Manager Fixed Income
Portfolio Manager of the Fund. Began managing the Fund in 2014.
—
Joined DWS in 2010 with five years of industry experience; previously, served as an Associate at Banc of America Securities.
—
BA and MBA, Boston College.
Chad H. Farrington, CFA, Senior Portfolio Manager Fixed Income
Portfolio Manager of the Fund effective October 1, 2021.
—
Joined DWS in 2018 with 20 years of industry experience; previously, worked as Portfolio Manager, Head of Municipal Research, and Senior Credit Analyst at Columbia Threadneedle.
—
Effective October 1, 2021, Co-Head of Municipal Bond Department.
—
BS, Montana State University.
The views expressed reflect those of the portfolio management team only through the end of the period of the report as stated on the cover. The management team’s views are subject to change at any time based on market and other conditions and should not be construed as a recommendation. Past performance is no guarantee of future results. Current and future portfolio holdings are subject to risk.
Terms to Know
The Bloomberg Barclays Municipal Bond 1–15 Year Blend (1–17) Index is a sub- index of the Bloomberg Barclays Municipal Bond Index. It is a rules-based market value-weighted index of bonds with maturities of one year to 17 years designed for the tax-exempt bond market.
Index returns do not reflect fees or expenses and it is not possible to invest directly into an index.
The Morningstar Muni National Intermediate category consists of funds that invest in municipal bonds issued by various state and local governments to fund public projects and are free from federal taxes. These funds have an average duration of more than 4.5 years but less than 7 years, or average maturity of more than 5 years but less than 12 years.
The yield curve is a graph with a left-to-right line that shows how high or low yields are, from the shortest to the longest maturities. Typically (and when the yield curve is characterized as “steep,” this is especially true), the line rises from left to right as investors who are willing to tie up their money for a longer period are rewarded with higher yields.
Credit spread is the additional yield provided by municipal bonds rated AA and below vs. municipals rated AAA with comparable effective maturity.
| DWS Intermediate Tax-Free Fund | | 9 |
Contributors and detractors incorporate both a stock’s return and its weight. If two stocks have the same return but one has a larger weighting in the Fund, it will have a larger contribution to return in the period.
Credit quality measures a bond issuer’s ability to repay interest and principal in a timely manner. Rating agencies assign letter designations, such as AAA, AA and so forth. The lower the rating the higher the probability of default. Credit quality does not remove market risk and is subject to change.
| 10 | | DWS Intermediate Tax-Free Fund |
| Performance Summary | May 31, 2021 (Unaudited) |
| Class A | 1-Year | 5-Year | 10-Year |
| Average Annual Total Returns as of 5/31/21 |
| Unadjusted for Sales Charge | 4.81% | 2.64% | 3.23% |
Adjusted for the Maximum Sales Charge
(max 2.75% load) | 1.93% | 2.07% | 2.94% |
Bloomberg Barclays Municipal Bond
1-15 Year Blend (1-17) Index† | 3.55% | 3.05% | 3.53% |
| Class C | 1-Year | 5-Year | 10-Year |
| Average Annual Total Returns as of 5/31/21 |
| Unadjusted for Sales Charge | 4.03% | 1.89% | 2.45% |
Adjusted for the Maximum Sales Charge
(max 1.00% CDSC) | 4.03% | 1.89% | 2.45% |
Bloomberg Barclays Municipal Bond
1-15 Year Blend (1-17) Index† | 3.55% | 3.05% | 3.53% |
| Class S | 1-Year | 5-Year | 10-Year |
| Average Annual Total Returns as of 5/31/21 |
| No Sales Charges | 5.16% | 2.91% | 3.46% |
Bloomberg Barclays Municipal Bond
1-15 Year Blend (1-17) Index† | 3.55% | 3.05% | 3.53% |
| Institutional Class | 1-Year | 5-Year | 10-Year |
| Average Annual Total Returns as of 5/31/21 |
| No Sales Charges | 5.07% | 2.90% | 3.48% |
Bloomberg Barclays Municipal Bond
1-15 Year Blend (1-17) Index† | 3.55% | 3.05% | 3.53% |
Performance in the Average Annual Total Returns table above and the Growth of an Assumed $10,000 Investment line graph that follows is historical and does not guarantee future results. Investment return and principal fluctuate, so your shares may be worth more or less when redeemed. Current performance may differ from performance data shown. Please visit dws.com for the Fund’s most recent month-end performance. Fund performance includes reinvestment of all distributions. Unadjusted returns do not reflect sales charges and would have been lower if they had.
The gross expense ratios of the Fund, as stated in the fee table of the prospectus dated October 1, 2020 are 0.78%, 1.54%, 0.62% and 0.55% for Class A, Class C, Class S and Institutional Class shares, respectively, and may differ from the expense ratios disclosed in the Financial Highlights tables in this report.
| DWS Intermediate Tax-Free Fund | | 11 |
Index returns do not reflect any fees or expenses and it is not possible to invest directly into an index.
Performance figures do not reflect the deduction of taxes that a shareholder would pay on fund distributions or the redemption of fund shares.
A portion of the Fund’s distributions may be subject to federal, state and local taxes.
Generally accepted accounting principles require adjustments to be made to the net assets of the Fund at period end for financial reporting purposes only, and as such, the total return based on the unadjusted net asset value per share may differ from the total return reported in the financial highlights.
Growth of an Assumed $10,000 Investment
(Adjusted for Maximum Sales Charge)

Yearly periods ended May 31
The Fund’s growth of an assumed $10,000 investment is adjusted for the maximum sales charge of 2.75%. This results in a net initial investment of $9,725.
The growth of $10,000 is cumulative.
Performance of other share classes will vary based on the sales charges and the fee structure of those classes.
| † | Bloomberg Barclays Municipal Bond 1–15 Year Blend (1–17) Index is a sub-index of the Bloomberg Barclays Municipal Bond Index. It is a rules-based market value-weighted index of bonds with maturities of one year to 17 years designed for the tax-exempt bond market. |
| 12 | | DWS Intermediate Tax-Free Fund |
| | Class A | Class C | Class S | Institutional
Class |
| Net Asset Value |
| 5/31/21 | $ 12.02 | $ 12.02 | $ 12.03 | $ 12.02 |
| 5/31/20 | $ 11.80 | $ 11.80 | $ 11.80 | $ 11.80 |
| Distribution Information as of 5/31/21 |
| Income Dividends, Twelve Months | $ .28 | $ .19 | $ .31 | $ .31 |
| Capital Gain Distributions | $ .0653 | $ .0653 | $ .0653 | $ .0653 |
| May Income Dividend | $ .0212 | $ .0133 | $ .0238 | $ .0238 |
| SEC 30-day Yield‡‡ | .48% | –.24% | .74% | .74% |
| Tax Equivalent Yield‡‡ | .81% | –.24% | 1.25% | 1.25% |
| Current Annualized Distribution Rate‡‡ | 2.08% | 1.30% | 2.33% | 2.33% |
| ‡‡ | The SEC yield is net investment income per share earned over the month ended May 31, 2021, shown as an annualized percentage of the maximum offering price per share on the last day of the period. The SEC yield is computed in accordance with a standardized method prescribed by the Securities and Exchange Commission. The SEC yields would have been 0.39%, 0.65% and 0.65% for Class A, Class S and Institutional Class shares, respectively, had certain expenses not been reduced. Tax equivalent yield is based on the Fund’s yield and a marginal income tax rate of 40.8%. Current annualized distribution rate is the latest monthly dividend shown as an annualized percentage of net asset value on May 31, 2021. Distribution rate simply measures the level of dividends and is not a complete measure of performance. The current annualized distribution rates would have been 1.99%, 2.24% and 2.24% for Class A, Class S and Institutional Class shares, respectively, had certain expenses not been reduced. Yields and distribution rates are historical, not guaranteed and will fluctuate. |
| DWS Intermediate Tax-Free Fund | | 13 |
| Portfolio Summary | (Unaudited) |
| Asset Allocation (As a % of Investment Portfolio excluding Open-End Investment Companies) | 5/31/21 | 5/31/20 |
| Revenue Bonds | 71% | 71% |
| General Obligation Bonds | 12% | 13% |
| Lease Obligations | 11% | 9% |
| Escrow to Maturity/Prerefunded Bonds | 5% | 7% |
| Others | 1% | — |
| | 100% | 100% |
| Interest Rate Sensitivity | 5/31/21 | 5/31/20 |
| Effective Maturity | 5.2 years | 5.4 years |
| Modified Duration | 4.5 years | 4.6 years |
Effective maturity is the weighted average of the maturity date of bonds held by the Fund taking into consideration any available maturity shortening features.
Modified duration is an approximate measure of a fund’s sensitivity to movements in interest rates based on the current interest rate environment.
| Quality (As a % of Investment Portfolio excluding Open-End Investment Companies) | 5/31/21 | 5/31/20 |
| AAA | 12% | 13% |
| AA | 37% | 37% |
| A | 33% | 36% |
| BBB | 12% | 10% |
| BB | 2% | 1% |
| B | 0% | — |
| Not Rated | 4% | 3% |
| | 100% | 100% |
The quality ratings represent the higher of Moody’s Investors Service, Inc. (“Moody’s” ), Fitch Ratings, Inc. (“Fitch” ) or S&P Global Ratings (“S&P” ) credit ratings. The ratings of Moody’s, Fitch and S&P represent their opinions as to the quality of the securities they rate. Credit quality measures a bond issuer’s ability to repay interest and principal in a timely manner. Ratings are relative and subjective and are not absolute standards of quality. Credit quality does not remove market risk and is subject to change.
| Top Five State Allocations (As a % of Investment Portfolio excluding Open-End Investment Companies) | 5/31/21 | 5/31/20 |
| New York | 17% | 12% |
| California | 10% | 9% |
| Texas | 9% | 10% |
| Pennsylvania | 8% | 7% |
| Georgia | 6% | 7% |
Portfolio holdings and characteristics are subject to change.
For more complete details about the Fund’s investment portfolio, see page 15. A quarterly Fact Sheet is available on dws.com or upon request. Please see the Account Management Resources section on page 66 for contact information.
| 14 | | DWS Intermediate Tax-Free Fund |
| Investment Portfolio | as of May 31, 2021 |
| | Principal
Amount ($) | Value ($) |
| Municipal Bonds and Notes 102.9% | |
| Arizona 2.2% | |
| Arizona, Salt River Project Agricultural Improvement and Power District, Electric System Revenue: | | | |
| Series A, 5.0%, 1/1/2028 (a) | | 1,160,000 | 1,456,032 |
| Series A, 5.0%, 1/1/2029 (a) | | 1,605,000 | 2,061,609 |
| Arizona, State Industrial Development Authority Revenue, “A” , Series 2019-2, 3.625%, 5/20/2033 | | 4,866,053 | 5,540,366 |
| Arizona, State Industrial Development Authority, Education Revenue, Odyssey Preparatory Academy Project, 144A, 4.375%, 7/1/2039 | | 1,500,000 | 1,612,101 |
| Chandler, AZ, Industrial Development Authority, AMT, 5.0%, Mandatory Put 6/3/2024 @ 100, 6/1/2049 | | 7,235,000 | 8,194,225 |
| Maricopa County, AZ, Industrial Development Authority, Education Revenue, Legency Traditional School Project, Series B, 144A, 5.0%, 7/1/2039 | | 1,000,000 | 1,177,069 |
| Yavapai County, AZ, Industrial Development Authority, Solid Waste Disposal Revenue, Waste Management, Inc. Project, Series A-2, AMT, 2.2%, Mandatory Put 6/3/2024 @ 100, 3/1/2028 | | 1,750,000 | 1,845,544 |
| | | | 21,886,946 |
| California 10.5% | |
| California, Bay Area Toll Authority, Toll Bridge Revenue, Series C, MUNIPSA + 0.45%, 0.5% (b), Mandatory Put 4/1/2026 @ 100, 4/1/2056 | | 1,000,000 | 1,001,696 |
| California, Federal Home Loan Mortgage Corp., Multi-Family Variable Rate Certificates: | | | |
| Series M-049, 3.05%, 4/15/2034 | | 2,465,000 | 2,714,234 |
| Series M-050, AMT, 144A, 3.05%, 6/15/2037 | | 7,150,000 | 7,854,764 |
| Series M-050, “A” , 3.35%, 11/25/2033, GTY: Freddie Mac | | 599,672 | 680,889 |
| California, Golden State Tobacco Securitization Corp., Tobacco Settlement, Series A-1, 5.0%, 6/1/2032 | | 5,000,000 | 6,169,538 |
| California, Infrastructure & Economic Development Bank, California Academy of Science, Series A, MUNIPSA + 0.35%, 0.38% (b), Mandatory Put 8/1/2024 @ 100, 8/1/2047 (a) | | 1,430,000 | 1,430,312 |
| California, Metropolitan Water District of Southern California, Series E, MUNIPSA + 0.14%, 0.19% (b), Mandatory Put 5/21/2024 @100, 7/1/2037 | | 2,120,000 | 2,120,526 |
| California, Public Finance Authority Revenue, Enso VIillage Project, Series A, 144A, 5.0%, 11/15/2036 (a) | | 1,000,000 | 1,147,403 |
The accompanying notes are an integral part of the financial statements.
| DWS Intermediate Tax-Free Fund | | 15 |
| | Principal
Amount ($) | Value ($) |
| California, Public Finance Authority Revenue, Sharp Healthcare Obligated Group, Series C, 0.01% (c), 6/1/2021, LOC: Barclays Bank PLC | | 500,000 | 500,000 |
| California, State General Obligation, Various Purposes: | | | |
| 5.0%, 9/1/2031 (a) | | 2,800,000 | 3,799,252 |
| 5.0%, 4/1/2036 | | 7,000,000 | 9,063,214 |
| 5.25%, 9/1/2027 | | 10,000,000 | 10,128,777 |
| California, State Housing Finance Agency, Multi-Family Green Tax-Exempt Mortgage Backed Bonds, Noble Towers Apartment, Series N, 2.35%, 12/1/2035 | | 9,776,825 | 9,993,685 |
| California, State Pollution Control Finance Authority, Solid Waste Disposal Revenue, Waste Management Project, Series A, AMT, 2.5%, Mandatory Put 5/1/2024 @ 100, 11/1/2038 | | 5,500,000 | 5,847,467 |
| California, State Public Works Board Lease Revenue, A Various Captial Projects, Series A, 5.0%, 8/1/2031 (a) | | 3,500,000 | 4,546,748 |
| California, University Revenues, Limited Project: | | | |
| Series S, 5.0%, 5/15/2031 (a) | | 2,000,000 | 2,620,815 |
| Series S, 5.0%, 5/15/2032 (a) | | 2,000,000 | 2,672,093 |
| Riverside, CA, Water Revenue, Series A, MUNIPSA + 0.13%, 0.18% (b), Mandatory Put 1/18/2023 @ 100, 10/1/2035 | | 3,000,000 | 2,996,591 |
| San Diego County, CA, Regional Airport Authority, Subordinate Airport Revenue, Series B, 5.0%, 7/1/2037 | | 1,800,000 | 2,339,103 |
| San Francisco, CA, City & County Airports Commission, International Airport Revenue, Series A, AMT, 5.0%, 5/1/2035 | | 7,000,000 | 8,813,629 |
| Santa Barbara County, CA, Solid Waste System Revenue, Certificates of Participation: | | | |
| Series B, AMT, 5.0%, 12/1/2034 | | 5,000,000 | 6,234,806 |
| Series B, AMT, 5.0%, 12/1/2035 | | 5,000,000 | 6,222,888 |
| Turlock, CA, Irrigation District Revenue, 5.0%, 1/1/2033 | | 2,620,000 | 3,448,130 |
| | | | 102,346,560 |
| Colorado 2.5% | |
| Colorado, General Obligation, Vauxmont Metropolitan District, 3.25%, 12/15/2050, INS: AGMC | | 2,000,000 | 2,137,419 |
| Colorado, State Health Facilities Authority, Hospital Revenue, Valley View Hospital Association Project, 2.8%, Mandatory Put 5/15/2023 @ 100, 5/15/2042 | | 2,765,000 | 2,860,790 |
| Colorado, State Housing & Finance Authority, Series H, 4.25%, 11/1/2049 | | 2,225,000 | 2,497,619 |
| Denver City & County, CO, Airport Revenue System: | | | |
| Series B, 5.0%, 11/15/2022 | | 1,500,000 | 1,605,475 |
| Series A, AMT, 5.0%, 12/1/2034 | | 10,000,000 | 12,493,724 |
The accompanying notes are an integral part of the financial statements.
| 16 | | DWS Intermediate Tax-Free Fund |
| | Principal
Amount ($) | Value ($) |
| Denver, CO, Convention Center Hotel Authority Revenue: | | | |
| 5.0%, 12/1/2027 | | 500,000 | 600,769 |
| 5.0%, 12/1/2033 | | 500,000 | 587,299 |
| 5.0%, 12/1/2034 | | 1,000,000 | 1,171,669 |
| | | | 23,954,764 |
| Connecticut 2.8% | |
| Connecticut, State General Obligation, Series B, 3.0%, 6/1/2037 (a) | | 1,075,000 | 1,193,253 |
| Connecticut, State Housing Finance Program Authority Revenue, Series A-1, 4.0%, 11/15/2047 | | 3,040,000 | 3,299,337 |
| Connecticut, State Special Tax Obligation Revenue, Transportation Infrastructure Purpose: | | | |
| Series A, 5.0%, 1/1/2027 | | 8,000,000 | 9,902,995 |
| Series A, 5.0%, 10/1/2027 | | 8,000,000 | 8,848,677 |
| Seies C, 5.0%, 1/1/2030 (a) | | 1,000,000 | 1,286,496 |
| Seies C, 5.0%, 1/1/2031 (a) | | 1,000,000 | 1,311,131 |
| Seies C, 5.0%, 1/1/2032 (a) | | 835,000 | 1,111,944 |
| | | | 26,953,833 |
| Florida 4.3% | |
| Escambia County, FL, Housing Finance Authority Single Family Mortgage Revenue, County Program, Series A, 4.75%, 4/1/2050 | | 3,740,000 | 4,193,398 |
| Florida, Capital Project Finance Authority, Student Housing Revenue, Series A-1, 5.0%, 10/1/2029 | | 1,650,000 | 2,074,157 |
| Florida, Capital Trust Agency, Educational Growth Fund, Charter Educational Foundation Project, Seies A-1, 144A, 3.375%, 7/1/2031 | | 2,100,000 | 2,251,167 |
| Florida, Development Finance Corp., Educational Facilities Revenue, Mater Academy Projects, Series A, 5.0%, 6/15/2035 | | 1,000,000 | 1,158,241 |
| Florida, Development Finance Corp., Surface Transportation Facilities Revenue, Virgin Trains USA Passenger Rail Project: | | | |
| Series A, 144A, AMT, 6.375%, Mandatory Put 1/1/2026 @ 100, 1/1/2049 | | 2,000,000 | 2,036,259 |
| Series A, 144A, AMT, 6.5%, Mandatory Put 1/1/2029 @ 100, 1/1/2049 | | 1,685,000 | 1,712,490 |
| Florida, Reedy Creek Improvement District, Series A, 4.0%, 6/1/2032 | | 1,500,000 | 1,740,457 |
| Florida, State Department of Transportation, Florida Right-of-Way Acquisition & Bridge Construction, Series A, 4.0%, 7/1/2034 | | 5,000,000 | 6,017,137 |
| Florida, Tohopekaliga Water Utility System Revenue, 4.0%, 10/1/2032 | | 2,145,000 | 2,501,949 |
The accompanying notes are an integral part of the financial statements.
| DWS Intermediate Tax-Free Fund | | 17 |
| | Principal
Amount ($) | Value ($) |
| Lake County, FL, Educational Facilities Revenue, Imagine South Lake Charter School Project, Series A, 144A, 5.0%, 1/15/2029 | | 750,000 | 825,508 |
| Lee County, FL, School Board Certificates of Participation, Series A, 5.0%, 8/1/2027 | | 4,360,000 | 4,970,198 |
| Miami-Dade County, FL, School Board, Certificates of Participation, Series D, 5.0%, 2/1/2029 | | 7,000,000 | 8,307,921 |
| Pasco County, FL, School Board, Certificates of Participations, Series B, MUNIPSA + 0.75%, 0.8% (b), Mandatory Put 8/2/2023 @ 100, 8/1/2032 | | 3,075,000 | 3,077,882 |
| Village, FL, Community Development District No. 13, Special Assessment Revenue, 3.0%, 5/1/2029 | | 995,000 | 1,064,600 |
| | | | 41,931,364 |
| Georgia 6.5% | |
| Atlanta, GA, Water & Wastewater Revenue: | | | |
| Series B, 5.0%, 11/1/2022 | | 3,000,000 | 3,208,046 |
| Series B, 5.25%, 11/1/2027, INS: AGMC | | 10,000,000 | 12,417,617 |
| Burke County, GA, Development Authority, Pollution Control Revenue, Georgia Power Co., Plant Vogtle Project, 2.25%, Mandatory Put 5/25/2023 @ 100, 10/1/2032 | | 1,000,000 | 1,036,158 |
| Burke County, GA, Development Authority, Pollution Control Revenue, Oglethorpe Power Corp., Series E, 3.25%, Mandatory Put 2/3/2025 @ 100, 11/1/2045 | | 8,800,000 | 9,571,891 |
| Cobb County, GA, Kennestone Hospital Authority, Wellstar Health System, Inc. Project: | | | |
| Series B, 4.0%, 4/1/2032 | | 200,000 | 240,776 |
| Series B, 4.0%, 4/1/2033 | | 200,000 | 239,998 |
| Series B, 4.0%, 4/1/2034 | | 250,000 | 299,071 |
| Series B, 4.0%, 4/1/2035 | | 225,000 | 268,652 |
| Series B, 4.0%, 4/1/2036 | | 250,000 | 297,717 |
| DeKalb County, GA, Water & Sewer Revenue, Series A, 5.25%, 10/1/2029 | | 10,300,000 | 10,468,514 |
| Georgia, George L Smith II World Congress Center Authority, Convention Center Hotel Second Tier Revenue, Series B, 144A, 5.0%, 1/1/2036 | | 1,250,000 | 1,525,809 |
| Georgia, Main Street Natural Gas, Inc., Gas Project Revenue, Series A, 5.5%, 9/15/2024, GTY: Merrill Lynch & Co. | | 1,705,000 | 1,975,275 |
| Georgia, Main Street Natural Gas, Inc., Gas Supply Revenue: | | | |
| Series C, 4.0%, Mandatory Put 12/1/2023 @ 100, 8/1/2048, LIQ: Royal Bank of Canada | | 8,250,000 | 8,955,775 |
| Series B, 4.0%, Mandatory Put 12/2/2024 @ 100, 8/1/2049, GTY: TD Bank NA | | 5,000,000 | 5,587,290 |
| Series A, 5.0%, 5/15/2035, GTY: Macquarie Group Ltd. | | 1,135,000 | 1,572,109 |
The accompanying notes are an integral part of the financial statements.
| 18 | | DWS Intermediate Tax-Free Fund |
| | Principal
Amount ($) | Value ($) |
| Series A, 5.0%, 5/15/2036, GTY: Macquarie Group Ltd. | | 2,000,000 | 2,803,384 |
| Georgia, Municipal Electric Authority, Combined Cycle Project, Series A, 5.0%, 11/1/2022 | | 1,000,000 | 1,066,689 |
| Monroe County, GA, Development Authority, Pollution Control Revenue, Georgia Power Co. Plant Scherer Project, Series 1st, 2.25%, 7/1/2025 | | 2,295,000 | 2,362,438 |
| | | | 63,897,209 |
| Hawaii 0.5% | |
| Hawaii, State General Obligation, Series FK, 4.0%, 5/1/2032 | | 4,400,000 | 5,107,643 |
| Illinois 6.2% | |
| Chicago, IL, Board of Education: | | | |
| Series A, 5.0%, 12/1/2035 | | 1,500,000 | 1,888,424 |
| Series A, 5.0%, 12/1/2036 | | 1,250,000 | 1,568,688 |
| Series A, 5.0%, 12/1/2037 | | 1,000,000 | 1,251,240 |
| Series A, 5.0%, 12/1/2038 | | 1,000,000 | 1,247,955 |
| Chicago, IL, O’Hare International Airport Revenue, Series D, 5.0%, 1/1/2023 | | 6,540,000 | 7,031,041 |
| Chicago, IL, O’Hare International Airport Revenue, Senior Lien, Series A, AMT, 5.0%, 1/1/2036 | | 2,500,000 | 3,105,073 |
| Chicago, IL, Waterworks Revenue: | | | |
| Series 2017-2, 5.0%, 11/1/2023 | | 650,000 | 720,764 |
| Series 2017-2, 5.0%, 11/1/2024 | | 1,000,000 | 1,149,369 |
| Illinois, Regional Transportation Authority, Series A, 5.5%, 7/1/2024, INS: NATL | | 5,000,000 | 5,742,974 |
| Illinois, State Finance Authority Revenue: | | | |
| Series A, 5.0%, 10/1/2031 (a) | | 1,000,000 | 1,350,772 |
| Series A, 5.0%, 10/1/2032 (a) | | 1,000,000 | 1,370,028 |
| Illinois, State Finance Authority Revenue, The University of Chicago Medical Center: | | | |
| Series B, 0.01% (c), 6/1/2021, LOC: PNC Bank NA | | 4,000,000 | 4,000,000 |
| Series B, 0.01% (c), 6/1/2021, LOC: Wells Fargo Bank NA | | 425,000 | 425,000 |
| Illinois, State General Obligation: | | | |
| 5.0%, 8/1/2023 | | 7,150,000 | 7,850,778 |
| 5.0%, 11/1/2024 | | 5,325,000 | 6,115,536 |
| 5.5%, 5/1/2024 | | 500,000 | 571,915 |
| 5.5%, 5/1/2025 | | 1,500,000 | 1,779,659 |
| Illinois, State Municipal Electric Agency, Power Supply Revenue, Series A, 5.0%, 2/1/2028 | | 6,500,000 | 7,651,595 |
The accompanying notes are an integral part of the financial statements.
| DWS Intermediate Tax-Free Fund | | 19 |
| | Principal
Amount ($) | Value ($) |
| Illinois, State Toll Highway Authority Revenue, Series A, 5.0%, 1/1/2028 | | 1,250,000 | 1,341,580 |
| Springfield, IL, Electric Revenue, Senior Lien, 5.0%, 3/1/2029 | | 3,500,000 | 4,054,502 |
| | | | 60,216,893 |
| Indiana 2.0% | |
| Indiana, Rockport Pollution Control Revenue, Michigan Power Co. Project, Series A, 3.05%, 6/1/2025 | | 3,700,000 | 4,060,599 |
| Indiana, State Finance Authority Revenue, BHI Senior Living Obligated Group, 5.0%, 11/15/2033 | | 2,000,000 | 2,302,766 |
| Indiana, Transportation Finance Authority Highway Revenue, Series A, 5.5%, 12/1/2022 | | 5,270,000 | 5,659,548 |
| Indiana, Wastewater Utility Revenue, CWA Authority Project, Series A, 5.0%, 10/1/2027 | | 1,565,000 | 1,662,433 |
| Indianapolis, IN, Local Public Improvement Bond Bank, Series K, 5.0%, 6/1/2026 | | 5,355,000 | 5,355,000 |
| | | | 19,040,346 |
| Iowa 0.3% | |
| Iowa, State Higher Education Loan Authority, Loras College, 0.02% (c), 6/1/2021, LOC: Bank of America NA | | 250,000 | 250,000 |
| Iowa, State Student Loan Liquidity Corp., Senior Revenue, Series B, AMT, 3.0%, 12/1/2039 | | 2,500,000 | 2,649,127 |
| | | | 2,899,127 |
| Kentucky 0.3% | |
| Louisville & Jefferson County, KY, Metropolitan Government Health System Revenue, Norton Healthcare, Inc., Series B, 0.01% (c), 6/1/2021, LOC: PNC Bank NA | | 3,000,000 | 3,000,000 |
| Louisiana 0.2% | |
| New Orleans, LA, Aviation Board Special Facility Revenue, Parking Facilities Corp., Consol Garage System, Series A, 5.0%, 10/1/2035, INS: AGMC | | 1,250,000 | 1,568,598 |
| Maryland 0.3% | |
| Gaithersburg, MD, Economic Development Revenue, Asbury Obligated Group, Series A, 5.0%, 1/1/2033 | | 2,500,000 | 2,807,921 |
| Maryland, State Economic Development Corp. Special Obligation Bonds, Port Covington Project, 4.0%, 9/1/2040 | | 250,000 | 291,147 |
| | | | 3,099,068 |
The accompanying notes are an integral part of the financial statements.
| 20 | | DWS Intermediate Tax-Free Fund |
| | Principal
Amount ($) | Value ($) |
| Massachusetts 2.3% | |
| Massachusetts, Metropolitan Boston Transit Parking Corp., Systemwide Parking Revenue, Senior Lien, 5.0%, 7/1/2028 | | 3,760,000 | 3,774,803 |
| Massachusetts, State Development Finance Agency Revenue, CareGroup Obligated Group: | | | |
| Series J-2, 5.0%, 7/1/2033 | | 1,000,000 | 1,245,936 |
| Series J-2, 5.0%, 7/1/2034 | | 2,000,000 | 2,485,987 |
| Massachusetts, State Development Finance Agency Revenue, College of The Holy Cross, Series A, 0.01% (c), 6/1/2021, LOC: Bank of America NA | | 200,000 | 200,000 |
| Massachusetts, State Educational Financing Authority, Series B, AMT, 3.0%, 7/1/2035 | | 3,000,000 | 3,171,275 |
| Massachusetts, State Port Authority: | | | |
| Series A, AMT, 5.0%, 7/1/2035 | | 5,000,000 | 6,314,574 |
| Series A, AMT, 5.0%, 7/1/2036 | | 4,000,000 | 5,038,751 |
| | | | 22,231,326 |
| Michigan 2.0% | |
| Michigan, State Building Authority Revenue, Facilities Program, Series II-A, Prerefunded 10/15/2021 @ 100, 5.0%, 10/15/2024 | | 1,610,000 | 1,639,375 |
| Michigan, State Finance Authority Revenue, Henry Ford Health System, 5.0%, 11/15/2031 | | 10,700,000 | 13,107,243 |
| Michigan, State Strategic Fund Ltd., Obligation Revenue, Improvement Project: | | | |
| Series I-75, AMT, 5.0%, 6/30/2032 | | 1,320,000 | 1,649,484 |
| Series I-75, AMT, 5.0%, 12/31/2032 | | 700,000 | 873,495 |
| Series I-75, AMT, 5.0%, 12/31/2033 | | 1,600,000 | 1,988,604 |
| | | | 19,258,201 |
| Minnesota 0.3% | |
| Minnesota, State Office of Higher Education Revenue, AMT, 2.65%, 11/1/2038 | | 3,205,000 | 3,274,932 |
| Mississippi 1.1% | |
| Mississippi, State Gaming Tax Revenue: | | | |
| Series E, 5.0%, 10/15/2028 | | 4,755,000 | 5,511,975 |
| Series A, 5.0%, 10/15/2036 | | 4,000,000 | 4,942,554 |
| | | | 10,454,529 |
| Missouri 1.8% | |
| Missouri, Higher Education Loan Authority Revenue, Taxable Student Loan Asset Back Notes, Series 2021-1, 1.53%, 1/25/2061 | | 7,509,254 | 7,506,099 |
| Missouri, Plaza At Noah’s Ark Community Improvement District, 3.0%, 5/1/2030 (a) | | 725,000 | 734,519 |
The accompanying notes are an integral part of the financial statements.
| DWS Intermediate Tax-Free Fund | | 21 |
| | Principal
Amount ($) | Value ($) |
| Missouri, State Health & Educational Facilities Authority Revenue, St Louis University, Series B-1, 0.01% (c), 6/1/2021, LOC: Barclays Bank PLC | | 4,050,000 | 4,050,000 |
| Missouri, State Public Utilities Commission Revenue, 0.5%, 3/1/2022 | | 5,600,000 | 5,605,489 |
| | | | 17,896,107 |
| Nebraska 1.3% | |
| Nebraska, Public Power District Revenue: | | | |
| 5.0%, 1/1/2035 (a) | | 1,410,000 | 1,802,387 |
| 5.0%, 1/1/2036 (a) | | 2,840,000 | 3,624,506 |
| 5.0%, 1/1/2037 (a) | | 2,750,000 | 3,501,896 |
| 5.0%, 1/1/2038 (a) | | 3,000,000 | 3,809,945 |
| | | | 12,738,734 |
| Nevada 0.7% | |
| Clark County, NV, General Obligation, 4.0%, 12/1/2035 | | 3,000,000 | 3,564,090 |
| Nevada, Director of the State of Department of Business & Industry Solid Waster Disposal Revenue, Republic Services, Inc. Project, AMT, 144A, 0.3% (b), Mandatory Put 12/1/2021 @ 100, 12/1/2026 (a) | | 1,500,000 | 1,500,000 |
| Sparks, NV, Tourism Improvement District #1 Revenue, Sales Tax, Series A, 144A, 2.75%, 6/15/2028 | | 1,500,000 | 1,555,535 |
| | | | 6,619,625 |
| New Jersey 3.7% | |
| New Jersey, State Covid-19 General Obligation Emergency Bonds: | | | |
| Series A, 4.0%, 6/1/2030 | | 1,035,000 | 1,279,440 |
| Series A, 4.0%, 6/1/2031 | | 1,035,000 | 1,298,242 |
| Series A, 4.0%, 6/1/2032 | | 495,000 | 630,385 |
| New Jersey, State Economic Development Authority Revenue, White Horse HMT Urban Renewal LLC Project, 144A, 5.0%, 1/1/2040 | | 1,505,000 | 1,524,436 |
| New Jersey, State Economic Development Authority, Motor Vehicle Surcharge Revenue, Series A, 3.125%, 7/1/2029 | | 915,000 | 924,449 |
| New Jersey, State Higher Education Assistance Authority, Student Loan Revenue: | | | |
| Series B, AMT, 2.5%, 12/1/2040 | | 830,000 | 842,843 |
| Series B, AMT, 3.25%, 12/1/2039 | | 1,500,000 | 1,622,892 |
| Series B, AMT, 3.5%, 12/1/2039 | | 2,000,000 | 2,202,867 |
| New Jersey, State Transportation Trust Fund Authority: | | | |
| Series B, 5.25%, 6/15/2025 | | 5,000,000 | 5,009,182 |
| Series B, 5.25%, 6/15/2026 | | 5,000,000 | 5,009,182 |
The accompanying notes are an integral part of the financial statements.
| 22 | | DWS Intermediate Tax-Free Fund |
| | Principal
Amount ($) | Value ($) |
| New Jersey, State Transportation Trust Fund Authority Revenue, Federal Highway Reimbursement Notes, Series A, 5.0%, 6/15/2029 | | 970,000 | 1,154,623 |
| New Jersey, State Transportation Trust Fund Authority, Transportation Systems: | | | |
| Series A, 5.0%, 6/15/2033 (a) | | 2,500,000 | 3,131,517 |
| Series A, 5.0%, 6/15/2034 (a) | | 1,700,000 | 2,118,823 |
| 5.0%, 6/15/2036 | | 2,000,000 | 2,557,902 |
| 5.0%, 6/15/2037 | | 2,000,000 | 2,549,993 |
| New Jersey, Tobacco Settlement Financing Corp., Series A, 5.0%, 6/1/2029 | | 3,000,000 | 3,798,954 |
| | | | 35,655,730 |
| New Mexico 0.4% | |
| New Mexico, State Mortgage Finance Authority, Series C, 4.0%, 1/1/2050 | | 3,370,000 | 3,741,079 |
| New York 17.7% | |
| Broome County, NY, Local Development Corp., Revenue, United Health Services Hospitals, Inc., Project: | | | |
| 3.0%, 4/1/2035, INS: AGMC | | 1,820,000 | 1,978,658 |
| 3.0%, 4/1/2036, INS: AGMC | | 1,750,000 | 1,897,422 |
| Monroe County, NY, Industrial Development Corp. Revenue, State Ann’s Community Project, 4.0%, 1/1/2030 | | 3,295,000 | 3,571,751 |
| New York, Metropolitan Transportation Authority Revenue: | | | |
| Series E-1, 0.02% (c), 6/1/2021, LOC: U.S. Bank NA | | 4,090,000 | 4,090,000 |
| Series B, 5.0%, 11/15/2028 | | 3,170,000 | 4,050,120 |
| Series C-1, 5.0%, 11/15/2028 | | 1,200,000 | 1,512,452 |
| Series A-2, 5.0%, Mandatory Put 5/15/2030 @ 100, 11/15/2045 | | 5,335,000 | 6,922,394 |
| New York, Metropolitan Transportation Authority, Dedicated Tax Fund, Series A-1, 0.02% (c), 6/1/2021, LOC: TD Bank NA | | 10,300,000 | 10,300,000 |
| New York, State Dormitory Authority Revenues, Non-State Supported Debt, Mount Sinai School of Medicine, Series A, 5.0%, 7/1/2021 | | 1,000,000 | 1,003,550 |
| New York, State Dormitory Authority Revenues, Non-State Supported Debt, North Shore-Long Island Jewish Obligated Group, Series A, 5.0%, 5/1/2028 | | 8,820,000 | 10,233,646 |
| New York, State Environmental Facilities Corp., State Clean Water & Drinking Revolving Funds, New York City Municipal Water Finance Authority Projects, 5.0%, 6/15/2029 | | 10,000,000 | 10,035,055 |
The accompanying notes are an integral part of the financial statements.
| DWS Intermediate Tax-Free Fund | | 23 |
| | Principal
Amount ($) | Value ($) |
| New York, State Liberty Development Corporation, Second Priority Liberty Revenue, “1” , 2.45%, 9/15/2069 | | 5,000,000 | 5,215,350 |
| New York, State Thruway Authority, Series J, 5.0%, 1/1/2028 | | 10,000,000 | 11,175,017 |
| New York, State Transportation Development Corp., Special Facility Revenue, Delta Air Lines, Inc., LaGuardia Airport Terminals C&D Redevelopment Project, AMT, 5.0%, 1/1/2026 | | 3,970,000 | 4,698,528 |
| New York, State Urban Development Corp., Personal Income Tax Revenue, Series C, 5.0%, 3/15/2036 | | 5,000,000 | 6,544,517 |
| New York, Triborough Bridge & Tunnel Authority Revenue: | | | |
| Series F, 0.01% (c), 6/1/2021, LOC: Citibank NA | | 100,000 | 100,000 |
| Series 4-C, 0.02% (c), 6/1/2021, LOC: U.S. Bank NA | | 800,000 | 800,000 |
| New York, TSASC, Inc., Series A, 5.0%, 6/1/2022 | | 1,000,000 | 1,047,845 |
| New York City, NY, Municipal Water Finance Authority, Water & Sewer Systems Revenue: | | | |
| Series DD-3B, 0.02% (c), 6/1/2021, PA: State Street B&t Co. | | 200,000 | 200,000 |
| Series FF-2, 4.0%, 6/15/2036 | | 3,000,000 | 3,584,772 |
| New York City, NY, Transitional Finance Authority Revenue, Future Tax Secured: | | | |
| Series A, 4.0%, 11/1/2034 | | 2,500,000 | 3,065,842 |
| Series B1, 5.0%, 11/1/2027 | | 750,000 | 851,424 |
| Series B1, 5.0%, 11/1/2028 | | 1,175,000 | 1,333,531 |
| Series D-1, 5.0%, 11/1/2028 | | 4,715,000 | 4,808,913 |
| Series E-1, 5.0%, 2/1/2029 | | 2,830,000 | 2,920,200 |
| Series E-1, Prerefunded 2/1/2022 @ 100, 5.0%, 2/1/2029 | | 225,000 | 232,238 |
| Series B1, 5.0%, 11/1/2029 | | 935,000 | 1,060,858 |
| New York City, NY, Transitional Finance Authority, Building Aid Revenue: | | | |
| Series S-2, 5.0%, 7/15/2028 | | 6,750,000 | 7,979,974 |
| Series S-3, 5.0%, 7/15/2035 | | 5,000,000 | 6,316,048 |
| New York, NY, General Obligation: | | | |
| Series G-6, 0.01% (c), 6/1/2021, LOC: Mizuho Bank Ltd. | | 10,570,000 | 10,570,000 |
| Series D-4, 0.02% (c), 6/1/2021, LOC: TD Bank NA | | 2,750,000 | 2,750,000 |
| Series I-4, 0.02% (c), 6/1/2021, LOC: TD Bank NA | | 5,585,000 | 5,585,000 |
| Series 2, 0.18% (c), 6/1/2021 | | 760,000 | 760,000 |
| Series B-3, 0.18% (c), 6/1/2021 | | 2,420,000 | 2,420,000 |
| Series 3, 0.2% (c), 6/7/2021 | | 2,040,000 | 2,040,000 |
| Series C, 4.0%, 8/1/2037 | | 1,000,000 | 1,204,940 |
| Series F, 5.0%, 8/1/2024 | | 9,000,000 | 9,293,620 |
| Series D-1, 5.0%, 8/1/2029 | | 8,620,000 | 9,484,657 |
The accompanying notes are an integral part of the financial statements.
| 24 | | DWS Intermediate Tax-Free Fund |
| | Principal
Amount ($) | Value ($) |
| Triborough, NY, Bridge & Tunnel Authority Revenues, Series A, 5.0%, 11/15/2028 | | 4,975,000 | 5,418,340 |
| Troy, NY, Capital Resource Corp. Revenue, Rensselaer Polytechnic Institute: | | | |
| Series A, 5.0%, 9/1/2030 | | 1,345,000 | 1,771,002 |
| Series A, 5.0%, 9/1/2031 | | 2,020,000 | 2,652,541 |
| Series A, 5.0%, 9/1/2032 | | 1,250,000 | 1,636,392 |
| | | | 173,116,597 |
| North Carolina 0.5% | |
| North Carolina, State Turnpike Authority, Monroe Expressway System: | | | |
| 5.0%, 7/1/2035 | | 820,000 | 1,108,660 |
| 5.0%, 7/1/2036 | | 1,000,000 | 1,347,840 |
| 5.0%, 7/1/2037 | | 1,000,000 | 1,343,442 |
| 5.0%, 7/1/2038 | | 500,000 | 669,937 |
| | | | 4,469,879 |
| North Dakota 0.1% | |
| Fargo, ND, Sanford Health Systems Revenue, ETM, 5.5%, 11/1/2021 | | 1,250,000 | 1,277,340 |
| Ohio 1.3% | |
| Cleveland, OH, Airport Systems Revenue, Series A, Prerefunded 1/1/2022 @ 100, 5.0%, 1/1/2027 | | 3,000,000 | 3,086,009 |
| Lucas County, OH, Hospital Revenue, Promedica Healthcare, Series D, Prerefunded 11/15/2021 @ 100, 5.0%, 11/15/2024 | | 995,000 | 1,016,787 |
| Ohio, Akron, Bath & Copley Joint Township Hospital District Revenue, Summa Health System, 4.0%, 11/15/2035 | | 1,665,000 | 1,984,866 |
| Ohio, State Hospital Revenue, Aultman Health Foundation, 144A, 5.0%, 12/1/2028 | | 5,000,000 | 5,585,112 |
| Ohio, State Turnpike Commission, Infrastructure Projects, Series A-1, 5.25%, 2/15/2029 | | 1,310,000 | 1,417,165 |
| | | | 13,089,939 |
| Oregon 1.9% | |
| Oregon, State Facilities Authority Revenue, Peace Health, Series A, 0.02% (c), 6/1/2021, LOC: U.S. Bank NA | | 2,275,000 | 2,275,000 |
| Oregon, State Housing & Community Services Department, Mortgage Revenue, Series A, 4.5%, 1/1/2049 | | 4,570,000 | 4,997,334 |
The accompanying notes are an integral part of the financial statements.
| DWS Intermediate Tax-Free Fund | | 25 |
| | Principal
Amount ($) | Value ($) |
| Port of Portland, OR, Airport Revenue, Passenger Facility Charge, Portland International Airport: | | | |
| Series A, 5.5%, 7/1/2026 | | 4,025,000 | 4,041,924 |
| Series A, 5.5%, 7/1/2029 | | 7,000,000 | 7,029,085 |
| | | | 18,343,343 |
| Pennsylvania 7.8% | |
| Allegheny County, PA, Hospital Development Authority, Allegheny Health Network Obligated Group, Series A, 5.0%, 4/1/2034 | | 5,000,000 | 6,191,813 |
| Franklin County, PA, Industrial Development Authority Revenue, Menno Haven, Inc. Project, 5.0%, 12/1/2038 | | 1,000,000 | 1,090,221 |
| Montgomery County, PA, Higher Education & Health Authority, State Presbyterian Homes, Inc. Project: | | | |
| 5.0%, 12/1/2027 | | 2,735,000 | 3,145,996 |
| 5.0%, 12/1/2032 | | 2,745,000 | 3,113,730 |
| Montgomery County, PA, Industrial Development Authority, Meadowood Senior Living Project, Series A, 5.0%, 12/1/2033 | | 8,435,000 | 9,644,868 |
| Pennsylvania, Higher Education Assistance Agency Education Loan Revenue: | | | |
| Series A, AMT, 2.45%, 6/1/2041 | | 4,880,000 | 4,939,838 |
| Series A, AMT, 2.625%, 6/1/2042 (a) | | 705,000 | 706,856 |
| Pennsylvania, State Certificates of Participation: | | | |
| Series A, 5.0%, 7/1/2029 | | 300,000 | 375,630 |
| Series A, 5.0%, 7/1/2031 | | 850,000 | 1,057,123 |
| Pennsylvania, State Economic Development Financing Authority Revenue, UPMC Obligated Group, Series A, 5.0%, 2/1/2028 | | 3,000,000 | 3,411,737 |
| Pennsylvania, State Economic Development Financing Authority, Solid Waste Disposal Revenue, Waste Management, Inc. Project, AMT, 2.15%, Mandatory Put 7/1/2024 @ 100, 7/1/2041, GTY: Waste Management, Inc. | | 1,250,000 | 1,318,089 |
| Pennsylvania, State Housing Finance Agency, Single Family Mortgage Revenue: | | | |
| Series 119, 3.5%, 10/1/2041 | | 1,950,000 | 2,044,306 |
| 3.7%, 10/1/2047 | | 5,000,000 | 5,339,606 |
| Series 122, 4.0%, 10/1/2046 | | 4,450,000 | 4,796,518 |
| Pennsylvania, State Turnpike Commission Revenue: | | | |
| Series C, 5.0%, 12/1/2028 | | 2,950,000 | 3,404,094 |
| Series B, 5.0%, 6/1/2029 | | 5,000,000 | 6,010,539 |
| Series C, Prerefunded 12/1/2023 @ 100, 5.5%, 12/1/2026 | | 2,120,000 | 2,402,599 |
| Series C, Prerefunded 12/1/2023 @ 100, 5.5%, 12/1/2027 | | 2,820,000 | 3,195,910 |
The accompanying notes are an integral part of the financial statements.
| 26 | | DWS Intermediate Tax-Free Fund |
| | Principal
Amount ($) | Value ($) |
| Series C, Prerefunded 12/1/2023 @ 100, 5.5%, 12/1/2028 | | 1,000,000 | 1,133,302 |
| Philadelphia, PA, Authority for Industrial Development Charter School Revenue Bond, 144A, 5.0%, 6/15/2040 | | 900,000 | 1,061,503 |
| Philadelphia, PA, School District: | | | |
| Series F, 5.0%, 9/1/2030 | | 8,970,000 | 10,843,592 |
| Series F, Prerefunded 9/1/2026 @ 100, 5.0%, 9/1/2030 | | 30,000 | 36,773 |
| Pittsburgh, PA, Water & Sewer System Revenue, First Lien, Series C, MUNIPSA + 0.65%, 0.7% (b), Mandatory Put 12/1/2023 @ 100, 9/1/2040, INS: AGMC | | 1,000,000 | 1,009,730 |
| | | | 76,274,373 |
| South Carolina 0.3% | |
| Greenwood County, SC, Hospital Revenue, Self Regional Healthcare, Series B, 5.0%, 10/1/2025 | | 2,755,000 | 2,858,940 |
| South Carolina, State Housing Finance & Development Authority, Mortgage Revenue, Series A, 4.0%, 1/1/2050 | | 345,000 | 387,379 |
| | | | 3,246,319 |
| Tennessee 0.9% | |
| Greeneville, TN, Health & Educational Facilities Board, Hospital Revenue, Ballad Health Obligation Group, Series A, 5.0%, 7/1/2035 | | 2,500,000 | 3,087,816 |
| Shelby County, TN, State General Obligation, Series B, 4.0%, 4/1/2034 | | 3,330,000 | 4,022,987 |
| Tennessee, Housing Development Agency, Residential Financing Program Revenue, Series 1C, 3.0%, 7/1/2038 | | 1,050,000 | 1,073,434 |
| Tennessee, State Housing Development Agency, Homeownership Program: | | | |
| Series 2C, 4.0%, 7/1/2038 | | 140,000 | 141,759 |
| Series 1C, 4.5%, 7/1/2037 | | 165,000 | 167,771 |
| | | | 8,493,767 |
| Texas 9.3% | |
| Central Texas, Regional Mobility Authority Revenue, Senior Lien, Series E, 4.0%, 1/1/2037 | | 1,500,000 | 1,785,432 |
| El Paso, TX, Independent School District, 4.0%, 8/15/2035 | | 5,000,000 | 5,915,514 |
| Harris County, TX, Metropolitan Transit Authority, Sales & Use Tax, Series A, Prerefunded 11/1/2021 @ 100, 5.0%, 11/1/2031 | | 2,795,000 | 2,852,130 |
| Houston, TX, Airport Systems Revenue: | | | |
| Series B, Prerefunded 7/1/2021 @ 100, 5.0%, 7/1/2026 | | 4,000,000 | 4,015,748 |
The accompanying notes are an integral part of the financial statements.
| DWS Intermediate Tax-Free Fund | | 27 |
| | Principal
Amount ($) | Value ($) |
| Series B, Prerefunded 7/1/2022 @ 100, 5.0%, 7/1/2027 | | 9,600,000 | 10,103,576 |
| Houston, TX, Hotel Occupancy Tax And Special Revenue, Convention And Entertainment Facilities Department: | | | |
| 5.0%, 9/1/2027 | | 1,590,000 | 1,946,087 |
| 5.0%, 9/1/2028 | | 1,350,000 | 1,683,774 |
| Houston, TX, Utility Systems Revenue, First Lien, Series A, 5.0%, 11/15/2033 | | 1,525,000 | 2,039,521 |
| North Texas, Tollway Authority Revenue, Special Projects Systems: | | | |
| Series D, Prerefunded 9/1/2021 @ 100, 5.25%, 9/1/2027 | | 5,080,000 | 5,144,517 |
| Series A, Prerefunded 9/1/2021 @ 100, 5.5%, 9/1/2028 | | 1,240,000 | 1,256,514 |
| Northside, TX, Independent School District: | | | |
| 1.6%, Mandatory Put 8/1/2024 @ 100, 8/1/2049 | | 2,980,000 | 3,084,383 |
| 2.75%, Mandatory Put 8/1/2023 @ 100, 8/1/2048 | | 1,540,000 | 1,618,129 |
| San Antonio, TX, Water Systems Revenue, Junior Lien, Series E, 5.0%, 5/15/2027 | | 1,900,000 | 2,072,829 |
| Tarrant County, TX, Cultural Education Facilities Finance Corp., Baylor Health Care System Project, Series C, 0.02% (c), 6/1/2021, LOC: TD Bank NA | | 630,000 | 630,000 |
| Texas, Aldine Independent School District, 4.0%, 2/15/2032 | | 3,000,000 | 3,492,454 |
| Texas, Grand Parkway Transportation Corp., 5.0%, 2/1/2023 | | 6,460,000 | 6,958,896 |
| Texas, New Hope Cultural Education Facilities Finance Corp., Education Revenue, Cumberland Academy Project, Series A, 144A, 5.0%, 8/15/2040 | | 6,000,000 | 6,557,063 |
| Texas, State Department of Housing & Community Affairs, 2.17%, 5/1/2038 | | 6,000,000 | 6,022,390 |
| Texas, State Municipal Gas Acquisition & Supply Corp. I, Gas Supply Revenue, Series D, 6.25%, 12/15/2026, GTY: Merrill Lynch & Co. | | 7,935,000 | 9,304,942 |
| Texas, State Private Activity Bond, Surface Transportation Corp. Revenue, Senior Lien Revenue: | | | |
| Series A, 4.0%, 12/31/2035 | | 500,000 | 599,454 |
| Series A, 4.0%, 12/31/2036 | | 2,000,000 | 2,388,313 |
| Texas, State Water Development Board, Series A, 4.0%, 10/15/2032 | | 5,000,000 | 5,948,466 |
| Texas, State Water Development Board, State Water Implementation Fund, Series A, 4.0%, 10/15/2034 | | 4,900,000 | 5,811,014 |
| | | | 91,231,146 |
The accompanying notes are an integral part of the financial statements.
| 28 | | DWS Intermediate Tax-Free Fund |
| | Principal
Amount ($) | Value ($) |
| Utah 0.6% | |
| Salt Lake City, UT, Airport Revenue, Series A, AMT, 5.0%, 7/1/2035 | | 5,000,000 | 6,156,746 |
| Virginia 3.9% | |
| Hampton Roads, VA, Transportation Accountability Commission Revenue, Senior Lien Revenue: | | | |
| Series A, 4.0%, 7/1/2036 | | 2,070,000 | 2,540,083 |
| Series A, 4.0%, 7/1/2038 | | 4,370,000 | 5,328,452 |
| Virginia, State College Building Authority, Educational Facilities Revenue, 21st Century College, Series B, 4.0%, 2/1/2029 | | 18,755,000 | 21,608,729 |
| Virginia, State Public School Authority, School Financing, Series B, 4.0%, 8/1/2029 | | 7,060,000 | 8,209,120 |
| | | | 37,686,384 |
| Washington 4.3% | |
| Washington, State Convention Center Public Facilities District: | | | |
| 4.0%, 7/1/2031 | | 3,000,000 | 3,463,917 |
| 5.0%, 7/1/2035 | | 2,000,000 | 2,395,913 |
| 5.0%, 7/1/2036 | | 4,350,000 | 5,199,290 |
| Washington, State General Obligation: | | | |
| Series R-2021A, 5.0%, 6/1/2030 | | 1,000,000 | 1,343,323 |
| Series R-2021A, 5.0%, 6/1/2031 | | 750,000 | 1,002,843 |
| Series R-2021A, 5.0%, 6/1/2032 | | 1,000,000 | 1,332,216 |
| Series A, Prerefunded 8/1/2021 @ 100, 5.0%, 8/1/2032 | | 14,000,000 | 14,113,312 |
| Washington, State Health Care Facilities Authority Revenue, Virginia Mason Medical Center, 5.0%, 8/15/2029 | | 2,300,000 | 2,773,162 |
| Washington, State Housing Finance Commission Municipal Certificates, “A” , Series A-1, 3.5%, 12/20/2035 | | 1,235,000 | 1,437,578 |
| Washington, State Housing Finance Commission, Horizon House Project: | | | |
| 144A, 5.0%, 1/1/2028 | | 750,000 | 885,662 |
| 144A, 5.0%, 1/1/2029 | | 840,000 | 989,053 |
| 144A, 5.0%, 1/1/2031 | | 1,030,000 | 1,204,218 |
| 144A, 5.0%, 1/1/2033 | | 1,050,000 | 1,221,492 |
| Washington, University of Washington Revenue: | | | |
| Series C, 5.0%, 4/1/2030 | | 2,000,000 | 2,678,072 |
| Series C, 5.0%, 4/1/2031 | | 1,750,000 | 2,334,736 |
| | | | 42,374,787 |
The accompanying notes are an integral part of the financial statements.
| DWS Intermediate Tax-Free Fund | | 29 |
| | Principal
Amount ($) | Value ($) |
| West Virginia 0.4% | |
| West Virginia, State Economic Development Authority, Arch Resources Project, Series A, AMT, 4.125%, Mandatory Put 7/1/2025 @ 100, 7/1/2045 | | 1,250,000 | 1,286,235 |
| West Virginia, State Hospital Finance Authority Revenue, State University Health System Obligated Group, Series A, 5.0%, 6/1/2032 | | 2,400,000 | 2,916,923 |
| | | | 4,203,158 |
| Puerto Rico 0.2% | |
| Puerto Rico, Sales Tax Financing Corp., Sales Tax Revenue, Series A-1, Zero Coupon, 7/1/2031 | | 3,000,000 | 2,365,023 |
| Other 1.5% | |
| Federal Home Loan Mortgage Corp., Multi-Family Variable Rate Certificates: | | | |
| “A” , Series M-024, AMT, 2.304%, 5/15/2027 | | 1,862,779 | 1,930,133 |
| “A” , Series M-051, 144A, 2.65%, 6/15/2035 | | 7,867,270 | 8,415,407 |
| Freddie Mac Multi-family: | | | |
| 144A, 1.896%, 11/25/2037, GTY: Freddie Mac | | 2,806,977 | 2,836,113 |
| Class A, 3.4%, 1/25/2036, GTY: Freddie Mac | | 1,447,519 | 1,659,794 |
| | | | 14,841,447 |
| Total Municipal Bonds and Notes (Cost $940,626,450) | 1,004,942,862 |
| Government & Agency Obligations 0.8% | |
| U.S. Treasury Obligations | |
| U.S. Treasury Note, 0.875%, 11/15/2030 (Cost $8,583,816) | | 8,800,000 | 8,258,250 |
| | Shares | Value ($) |
| Open-End Investment Companies 0.0% | |
| BlackRock Liquidity Funds MuniCash Portfolio, Institutional Shares, 0.01% (d) (Cost $262,744) | | 262,691 | 262,743 |
| | | % of Net
Assets | Value ($) |
| Total Investment Portfolio (Cost $949,473,010) | 103.7 | 1,013,463,855 |
| Other Assets and Liabilities, Net | (3.7) | (36,542,048) |
| Net Assets | 100.0 | 976,921,807 |
The accompanying notes are an integral part of the financial statements.
| 30 | | DWS Intermediate Tax-Free Fund |
| (b) | Variable or floating rate security. These securities are shown at their current rate as of May 31, 2021. For securities based on a published reference rate and spread, the reference rate and spread are indicated within the description above. Certain variable rate securities are not based on a published reference rate and spread but adjust periodically based on current market conditions, prepayment of underlying positions and/or other variables. Securities with a floor or ceiling feature are disclosed at the inherent rate, where applicable. |
| (c) | Variable rate demand notes are securities whose interest rates are reset periodically (usually daily mode or weekly mode) by remarketing agents based on current market levels, and are not directly set as a fixed spread to a reference rate. These securities may be redeemed at par by the holder at any time, and are shown at their current rates as of May 31, 2021. Date shown reflects the earlier of demand date or stated maturity date. |
| (d) | Current yield; not a coupon rate. |
| 144A: Security exempt from registration under Rule 144A of the Securities Act of 1933. These securities may be resold in transactions exempt from registration, normally to qualified institutional buyers. |
| AGMC: Assured Guaranty Municipal Corp. |
| AMT: Subject to alternative minimum tax. |
| ETM: Bonds bearing the description ETM (escrow to maturity) are collateralized usually by U.S. Treasury securities which are held in escrow and used to pay principal and interest on bonds so designated. |
| GTY: Guaranty Agreement |
| INS: Insured |
| LIQ: Liquidity Facility |
| LOC: Letter of Credit |
| MUNIPSA: SIFMA Municipal Swap Index Yield |
| NATL: National Public Finance Guarantee Corp. |
| Prerefunded: Bonds which are prerefunded are collateralized usually by U.S. Treasury securities which are held in escrow and used to pay principal and interest on tax-exempt issues and to retire the bonds in full at the earliest refunding date. |
| SIFMA: Securities Industry and Financial Markets Association |
The accompanying notes are an integral part of the financial statements.
| DWS Intermediate Tax-Free Fund | | 31 |
Fair Value Measurements
Various inputs are used in determining the value of the Fund’s investments. These inputs are summarized in three broad levels. Level 1 includes quoted prices in active markets for identical securities. Level 2 includes other significant observable inputs (including quoted prices for similar securities, interest rates, prepayment speeds and credit risk). Level 3 includes significant unobservable inputs (including the Fund’s own assumptions in determining the fair value of investments). The level assigned to the securities valuations may not be an indication of the risk or liquidity associated with investing in those securities.
The following is a summary of the inputs used as of May 31, 2021 in valuing the Fund’s investments. For information on the Fund’s policy regarding the valuation of investments, please refer to the Security Valuation section of Note A in the accompanying Notes to Financial Statements.
| Assets | Level 1 | Level 2 | Level 3 | Total |
| Municipal Bonds and Notes (a) | $ — | $1,004,942,862 | $— | $1,004,942,862 |
| Government & Agency Obligations | — | 8,258,250 | — | 8,258,250 |
| Open-End Investment Companies | 262,743 | — | — | 262,743 |
| Total | $262,743 | $1,013,201,112 | $ — | $1,013,463,855 |
| (a) | See Investment Portfolio for additional detailed categorizations. |
The accompanying notes are an integral part of the financial statements.
| 32 | | DWS Intermediate Tax-Free Fund |
Statement of Assets and Liabilities
as of May 31, 2021
| Assets | |
| Investment in securities, at value (cost $949,473,010) | $ 1,013,463,855 |
| Receivable for investments sold | 507,191 |
| Receivable for Fund shares sold | 1,205,222 |
| Interest receivable | 10,768,044 |
| Other assets | 40,900 |
| Total assets | 1,025,985,212 |
| Liabilities | |
| Payable for investments purchased — when-issued securities | 47,420,918 |
| Payable for Fund shares redeemed | 585,914 |
| Distributions payable | 426,570 |
| Accrued management fee | 182,164 |
| Accrued Trustees' fees | 8,596 |
| Other accrued expenses and payables | 439,243 |
| Total liabilities | 49,063,405 |
| Net assets, at value | $ 976,921,807 |
| Net Assets Consist of | |
| Distributable earnings (loss) | 67,178,899 |
| Paid-in capital | 909,742,908 |
| Net assets, at value | $ 976,921,807 |
The accompanying notes are an integral part of the financial statements.
| DWS Intermediate Tax-Free Fund | | 33 |
Statement of Assets and Liabilities as of May 31, 2021 (continued)
| Net Asset Value | |
| Class A | |
Net Asset Value and redemption price per share
($155,493,855 ÷ 12,932,761 outstanding shares of beneficial interest,
$.01 par value, unlimited number of shares authorized) | $ 12.02 |
| Maximum offering price per share (100 ÷ 97.25 of $12.02) | $ 12.36 |
| Class C | |
Net Asset Value, offering and redemption price
(subject to contingent deferred sales charge) per share
($6,830,081 ÷ 568,148 outstanding shares of beneficial interest,
$.01 par value, unlimited number of shares authorized) | $ 12.02 |
| Class S | |
Net Asset Value, offering and redemption price per share
($362,047,154 ÷ 30,106,360 outstanding shares of beneficial interest,
$.01 par value, unlimited number of shares authorized) | $ 12.03 |
| Institutional Class | |
Net Asset Value, offering and redemption price per share
($452,550,717 ÷ 37,642,669 outstanding shares of beneficial interest,
$.01 par value, unlimited number of shares authorized) | $ 12.02 |
The accompanying notes are an integral part of the financial statements.
| 34 | | DWS Intermediate Tax-Free Fund |
Statement of Operations
for the year ended May 31, 2021
| Investment Income | |
| Income: | |
| Interest | $ 29,285,907 |
| Expenses: | |
| Management fee | 3,024,651 |
| Administration fee | 931,400 |
| Services to shareholders | 1,175,531 |
| Distribution and service fees | 514,013 |
| Custodian fee | 9,770 |
| Professional fees | 76,977 |
| Reports to shareholders | 65,118 |
| Registration fees | 90,608 |
| Trustees' fees and expenses | 31,980 |
| Other | 53,430 |
| Total expenses before expense reductions | 5,973,478 |
| Expense reductions | (903,150) |
| Total expenses after expense reductions | 5,070,328 |
| Net investment income | 24,215,579 |
| Realized and Unrealized Gain (Loss) | |
| Net realized gain (loss) from investments | 4,710,558 |
| Change in net unrealized appreciation (depreciation) on investments | 18,256,113 |
| Net gain (loss) | 22,966,671 |
| Net increase (decrease) in net assets resulting from operations | $ 47,182,250 |
The accompanying notes are an integral part of the financial statements.
| DWS Intermediate Tax-Free Fund | | 35 |
Statements of Changes in Net Assets
| | Years Ended May 31, |
| Increase (Decrease) in Net Assets | 2021 | 2020 |
| Operations: | | |
| Net investment income | $ 24,215,579 | $ 28,256,635 |
| Net realized gain (loss) | 4,710,558 | 7,825,334 |
Change in net unrealized appreciation
(depreciation) | 18,256,113 | (7,330,031) |
| Net increase (decrease) in net assets resulting from operations | 47,182,250 | 28,751,938 |
| Distributions to shareholders: | | |
| Class A | (4,416,236) | (5,001,590) |
| Class C | (290,831) | (614,870) |
| Class S | (12,310,970) | (18,212,955) |
| Institutional Class | (12,209,026) | (13,025,494) |
| Total distributions | (29,227,063) | (36,854,909) |
| Fund share transactions: | | |
| Proceeds from shares sold | 256,623,089 | 233,496,121 |
| Reinvestment of distributions | 22,696,992 | 29,208,079 |
| Payments for shares redeemed | (282,470,044) | (345,098,709) |
| Net increase (decrease) in net assets from Fund share transactions | (3,149,963) | (82,394,509) |
| Increase (decrease) in net assets | 14,805,224 | (90,497,480) |
| Net assets at beginning of period | 962,116,583 | 1,052,614,063 |
| Net assets at end of period | $ 976,921,807 | $ 962,116,583 |
The accompanying notes are an integral part of the financial statements.
| 36 | | DWS Intermediate Tax-Free Fund |
Financial Highlights
| DWS Intermediate Tax-Free Fund — Class A |
| | Years Ended May 31, |
| | 2021 | 2020 | 2019 | 2018 | 2017 |
| Selected Per Share Data |
| Net asset value, beginning of period | $11.80 | $11.88 | $11.60 | $11.93 | $12.11 |
| Income (loss) from investment operations: | | | | | |
| Net investment income | .28 | .30 | .31 | .29 | .28 |
| Net realized and unrealized gain (loss) | .29 | .02 | .28 | (.33) | (.18) |
| Total from investment operations | .57 | .32 | .59 | (.04) | .10 |
| Less distributions from: | | | | | |
| Net investment income | (.28) | (.30) | (.31) | (.29) | (.28) |
| Net realized gains | (.07) | (.10) | (.00) * | (.00) * | — |
| Total distributions | (.35) | (.40) | (.31) | (.29) | (.28) |
| Net asset value, end of period | $12.02 | $11.80 | $11.88 | $11.60 | $11.93 |
| Total Return (%)a | 4.81 b | 2.73 b | 5.25 b | (.30) | .83 |
| Ratios to Average Net Assets and Supplemental Data |
| Net assets, end of period ($ millions) | 155 | 144 | 154 | 174 | 207 |
| Ratio of expenses before expense reductions (%) | .78 | .78 | .79 | .78 | .79 |
| Ratio of expenses after expense reductions (%) | .72 | .77 | .78 | .78 | .79 |
| Ratio of net investment income (%) | 2.33 | 2.55 | 2.70 | 2.47 | 2.33 |
| Portfolio turnover rate (%) | 38 | 41 | 61 | 44 | 36 |
| a | Total return does not reflect the effect of any sales charges. |
| b | Total return would have been lower had certain expenses not been reduced. |
| * | Amount is less than $.005. |
The accompanying notes are an integral part of the financial statements.
| DWS Intermediate Tax-Free Fund | | 37 |
| DWS Intermediate Tax-Free Fund — Class C |
| | Years Ended May 31, |
| | 2021 | 2020 | 2019 | 2018 | 2017 |
| Selected Per Share Data |
| Net asset value, beginning of period | $11.80 | $11.88 | $11.59 | $11.93 | $12.10 |
| Income (loss) from investment operations: | | | | | |
| Net investment income | .19 | .21 | .23 | .20 | .19 |
| Net realized and unrealized gain (loss) | .29 | .02 | .29 | (.34) | (.17) |
| Total from investment operations | .48 | .23 | .52 | (.14) | .02 |
| Less distributions from: | | | | | |
| Net investment income | (.19) | (.21) | (.23) | (.20) | (.19) |
| Net realized gains | (.07) | (.10) | (.00) * | (.00) * | — |
| Total distributions | (.26) | (.31) | (.23) | (.20) | (.19) |
| Net asset value, end of period | $12.02 | $11.80 | $11.88 | $11.59 | $11.93 |
| Total Return (%)a | 4.03 b | 1.97 b | 4.56 b | (1.15) b | .15 |
| Ratios to Average Net Assets and Supplemental Data |
| Net assets, end of period ($ millions) | 7 | 20 | 28 | 36 | 47 |
| Ratio of expenses before expense reductions (%) | 1.53 | 1.54 | 1.56 | 1.56 | 1.55 |
| Ratio of expenses after expense reductions (%) | 1.48 | 1.52 | 1.53 | 1.55 | 1.55 |
| Ratio of net investment income (%) | 1.60 | 1.80 | 1.95 | 1.70 | 1.57 |
| Portfolio turnover rate (%) | 38 | 41 | 61 | 44 | 36 |
| a | Total return does not reflect the effect of any sales charges. |
| b | Total return would have been lower had certain expenses not been reduced. |
| * | Amount is less than $.005. |
The accompanying notes are an integral part of the financial statements.
| 38 | | DWS Intermediate Tax-Free Fund |
| DWS Intermediate Tax-Free Fund — Class S |
| | Years Ended May 31, |
| | 2021 | 2020 | 2019 | 2018 | 2017 |
| Selected Per Share Data |
| Net asset value, beginning of period | $11.80 | $11.88 | $11.60 | $11.93 | $12.11 |
| Income (loss) from investment operations: | | | | | |
| Net investment income | .31 | .33 | .34 | .32 | .31 |
| Net realized and unrealized gain (loss) | .30 | .02 | .28 | (.33) | (.18) |
| Total from investment operations | .61 | .35 | .62 | (.01) | .13 |
| Less distributions from: | | | | | |
| Net investment income | (.31) | (.33) | (.34) | (.32) | (.31) |
| Net realized gains | (.07) | (.10) | (.00) * | (.00) * | — |
| Total distributions | (.38) | (.43) | (.34) | (.32) | (.31) |
| Net asset value, end of period | $12.03 | $11.80 | $11.88 | $11.60 | $11.93 |
| Total Return (%)a | 5.16 | 2.99 | 5.51 | (.07) | 1.07 |
| Ratios to Average Net Assets and Supplemental Data |
| Net assets, end of period ($ millions) | 362 | 443 | 543 | 629 | 679 |
| Ratio of expenses before expense reductions (%) | .61 | .62 | .63 | .62 | .62 |
| Ratio of expenses after expense reductions (%) | .48 | .52 | .53 | .55 | .55 |
| Ratio of net investment income (%) | 2.58 | 2.80 | 2.95 | 2.71 | 2.57 |
| Portfolio turnover rate (%) | 38 | 41 | 61 | 44 | 36 |
| a | Total return would have been lower had certain expenses not been reduced. |
| * | Amount is less than $.005. |
The accompanying notes are an integral part of the financial statements.
| DWS Intermediate Tax-Free Fund | | 39 |
| DWS Intermediate Tax-Free Fund — Institutional Class |
| | Years Ended May 31, |
| | 2021 | 2020 | 2019 | 2018 | 2017 |
| Selected Per Share Data |
| Net asset value, beginning of period | $11.80 | $11.88 | $11.60 | $11.93 | $12.11 |
| Income (loss) from investment operations: | | | | | |
| Net investment income | .31 | .33 | .34 | .32 | .31 |
| Net realized and unrealized gain (loss) | .29 | .02 | .28 | (.33) | (.18) |
| Total from investment operations | .60 | .35 | .62 | (.01) | .13 |
| Less distributions from: | | | | | |
| Net investment income | (.31) | (.33) | (.34) | (.32) | (.31) |
| Net realized gains | (.07) | (.10) | (.00) * | (.00) * | — |
| Total distributions | (.38) | (.43) | (.34) | (.32) | (.31) |
| Net asset value, end of period | $12.02 | $11.80 | $11.88 | $11.60 | $11.93 |
| Total Return (%) | 5.07 a | 2.99 a | 5.52 a | (.06) | 1.07 |
| Ratios to Average Net Assets and Supplemental Data |
| Net assets, end of period ($ millions) | 453 | 356 | 327 | 680 | 870 |
| Ratio of expenses before expense reductions (%) | .54 | .55 | .55 | .54 | .55 |
| Ratio of expenses after expense reductions (%) | .47 | .52 | .53 | .54 | .55 |
| Ratio of net investment income (%) | 2.57 | 2.80 | 2.93 | 2.71 | 2.57 |
| Portfolio turnover rate (%) | 38 | 41 | 61 | 44 | 36 |
| a | Total return would have been lower had certain expenses not been reduced. |
| * | Amount is less than $.005. |
The accompanying notes are an integral part of the financial statements.
| 40 | | DWS Intermediate Tax-Free Fund |
Notes to Financial Statements
| A. | Organization and Significant Accounting Policies |
DWS Intermediate Tax-Free Fund (the “Fund” ) is a diversified series of Deutsche DWS Tax Free Trust (the “Trust” ), which is registered under the Investment Company Act of 1940, as amended (the “1940 Act” ), as an open-end management investment company organized as a Massachusetts business trust.
The Fund offers multiple classes of shares which provide investors with different purchase options. Class A shares are subject to an initial sales charge. Class C shares are not subject to an initial sales charge but are subject to higher ongoing expenses than Class A shares and a contingent deferred sales charge payable upon certain redemptions within one year of purchase. Class C shares automatically convert to Class A shares in the same fund after 8 years instead of 10 years, provided that the Fund or the financial intermediary through which the shareholder purchased the Class C shares has records verifying that the Class C shares have been held for at least 8 years. Class S shares are not subject to initial or contingent deferred sales charges and are available through certain intermediary relationships with financial services firms, or can be purchased by establishing an account directly with the Fund’s transfer agent. Institutional Class shares are not subject to initial or contingent deferred sales charges and are generally available only to qualified institutions.
Investment income, realized and unrealized gains and losses, and certain fund-level expenses and expense reductions, if any, are borne pro rata on the basis of relative net assets by the holders of all classes of shares, except that each class bears certain expenses unique to that class such as distribution and service fees, services to shareholders and certain other class-specific expenses. Differences in class-level expenses may result in payment of different per share dividends by class. All shares of the Fund have equal rights with respect to voting subject to class-specific arrangements.
The Fund’s financial statements are prepared in accordance with accounting principles generally accepted in the United States of America (“U.S. GAAP” ) which require the use of management estimates. Actual results could differ from those estimates. The Fund qualifies as an investment company under Topic 946 of Accounting Standards Codification of U.S. GAAP. The policies described below are followed consistently by the Fund in the preparation of its financial statements.
Security Valuation. Investments are stated at value determined as of the close of regular trading on the New York Stock Exchange on each day the exchange is open for trading.
| DWS Intermediate Tax-Free Fund | | 41 |
Various inputs are used in determining the value of the Fund’s investments. These inputs are summarized in three broad levels. Level 1 includes quoted prices in active markets for identical securities. Level 2 includes other significant observable inputs (including quoted prices for similar securities, interest rates, prepayment speeds and credit risk). Level 3 includes significant unobservable inputs (including the Fund’s own assumptions in determining the fair value of investments). The level assigned to the securities valuations may not be an indication of the risk or liquidity associated with investing in those securities.
Municipal debt securities are valued at prices supplied by independent pricing services approved by the Fund’s Board, whose valuations are intended to reflect the mean between the bid and asked prices. Such services may use various pricing techniques which take into account appropriate factors such as yield, quality, coupon rate, maturity, type of issue, trading characteristics and other data, as well as broker quotes. If the pricing services are unable to provide valuations, the securities are valued at the mean of the most recent bid and asked quotations or evaluated prices, as applicable, obtained from one or more broker-dealers. These securities are generally categorized as Level 2.
Debt securities are valued at prices supplied by independent pricing services approved by the Fund’s Board. Such services may use various pricing techniques which take into account appropriate factors such as yield, quality, coupon rate, maturity, type of issue, trading characteristics, prepayment speeds and other data, as well as broker quotes. If the pricing services are unable to provide valuations, debt securities are valued at the average of the most recent reliable bid quotations or evaluated prices, as applicable, obtained from broker-dealers. These securities are generally categorized as Level 2.
Investments in open-end investment companies are valued at their net asset value each business day and are categorized as Level 1.
Securities and other assets for which market quotations are not readily available or for which the above valuation procedures are deemed not to reflect fair value are valued in a manner that is intended to reflect their fair value as determined in accordance with procedures approved by the Board and are generally categorized as Level 3. In accordance with the Fund’s valuation procedures, factors considered in determining value may include, but are not limited to, the type of the security; the size of the holding; the initial cost of the security; the existence of any contractual restrictions on the security’s disposition; the price and extent of public trading in similar securities of the issuer or of comparable companies; quotations or evaluated prices from broker-dealers and/or pricing services; information obtained from the issuer, analysts, and/or the appropriate stock exchange (for exchange-traded securities); an analysis of the company’s or issuer’s financial statements; an evaluation of the forces
| 42 | | DWS Intermediate Tax-Free Fund |
that influence the issuer and the market(s) in which the security is purchased and sold; and with respect to debt securities, the maturity, coupon, creditworthiness, currency denomination and the movement of the market in which the security is normally traded. The value determined under these procedures may differ from published values for the same securities.
Disclosure about the classification of fair value measurements is included in a table following the Fund’s Investment Portfolio.
When-Issued/Delayed Delivery Securities. The Fund may purchase securities with delivery or payment to occur at a later date beyond the normal settlement period. At the time the Fund enters into a commitment to purchase a security, the transaction is recorded and the value of the security is reflected in the net asset value. The price of such security and the date when the security will be delivered and paid for are fixed at the time the transaction is negotiated. The value of the security may vary with market fluctuations. No interest accrues to the Fund until payment takes place. At the time the Fund enters into this type of transaction, it is required to segregate cash or other liquid assets at least equal to the amount of the commitment.
Certain risks may arise upon entering into when-issued or delayed delivery transactions from the potential inability of counterparties to meet the terms of their contracts or if the issuer does not issue the securities due to political, economic, or other factors. Additionally, losses may arise due to changes in the value of the underlying securities.
Federal Income Taxes. The Fund’s policy is to comply with the requirements of the Internal Revenue Code, as amended, which are applicable to regulated investment companies, and to distribute all of its taxable and tax-exempt income to its shareholders.
The Fund has reviewed the tax positions for the open tax years as of May 31, 2021 and has determined that no provision for income tax and/or uncertain tax positions is required in the Fund’s financial statements. The Fund’s federal tax returns for the prior three fiscal years remain open subject to examination by the Internal Revenue Service.
Distribution of Income and Gains. Net investment income of the Fund is declared as a daily dividend and is distributed to shareholders monthly. Net realized gains from investment transactions, in excess of available capital loss carryforwards, would be taxable to the Fund if not distributed, and, therefore, will be distributed to shareholders at least annually. The Fund may also make additional distributions for tax purposes if necessary.
The timing and characterization of certain income and capital gain distributions are determined annually in accordance with federal tax regulations which may differ from accounting principles generally accepted in the United States of America. As a result, net investment
| DWS Intermediate Tax-Free Fund | | 43 |
income (loss) and net realized gain (loss) on investment transactions for a reporting period may differ significantly from distributions during such period. Accordingly, the Fund may periodically make reclassifications among certain of its capital accounts without impacting the net asset value of the Fund.
At May 31, 2021, the Fund’s components of distributable earnings (accumulated losses) on a net tax basis were as follows:
| Undistributed tax-exempt income | $ 1,286,396 |
| Undistributed ordinary income* | $ 536,396 |
| Undistributed long-term capital gains | $ 1,716,182 |
| Net unrealized appreciation (depreciation) on investments | $ 64,066,495 |
At May 31, 2021, the aggregate cost of investments for federal income tax purposes was $949,397,360. The net unrealized appreciation for all investments based on tax cost was $64,066,495. This consisted of aggregate gross unrealized appreciation for all investments for which there was an excess of value over tax cost of $64,449,561 and aggregate gross unrealized depreciation for all investments for which there was an excess of tax cost over value of $383,066.
In addition, the tax character of distributions paid to shareholders by the Fund is summarized as follows:
| | Years Ended May 31, |
| | 2021 | 2020 |
| Distributions from tax-exempt income | $ 24,027,012 | $ 28,245,334 |
| Distributions from ordinary income* | $ 2,330,445 | $ 1,368,121 |
| Distributions from long-term capital gains | $ 2,869,606 | $ 7,241,454 |
| * | For tax purposes, short-term capital gain distributions are considered ordinary income distributions. |
Expenses. Expenses of the Trust arising in connection with a specific fund are allocated to that fund. Other Trust expenses which cannot be directly attributed to a fund are apportioned among the funds in the Trust based upon the relative net assets or other appropriate measures.
Contingencies. In the normal course of business, the Fund may enter into contracts with service providers that contain general indemnification clauses. The Fund’s maximum exposure under these arrangements is unknown, as this would involve future claims that may be made against the Fund that have not yet been made. However, based on experience, the Fund expects the risk of loss to be remote.
Other. Investment transactions are accounted for on a trade date plus one basis for daily net asset value calculations. However, for financial reporting
| 44 | | DWS Intermediate Tax-Free Fund |
purposes, investment transactions are reported on trade date. Interest income is recorded on the accrual basis. Realized gains and losses from investment transactions are recorded on an identified cost basis. All premiums and discounts are amortized/accreted for financial reporting purposes.
| B. | Purchases and Sales of Securities |
During the year ended May 31, 2021, purchases and sales of investment securities, excluding short-term investments, were as follows:
| | Purchases | Sales |
| Non-U.S. Treasury Obligations | $380,729,255 | $373,885,474 |
| U.S. Treasury Obligations | $ 8,583,816 | $ — |
Management Agreement. Under the Investment Management Agreement with DWS Investment Management Americas, Inc. (“DIMA” or the “Advisor” ), an indirect, wholly owned subsidiary of DWS Group GmbH & Co. KGaA (“DWS Group” ), the Advisor directs the investments of the Fund in accordance with its investment objectives, policies and restrictions. The Advisor determines the securities, instruments and other contracts relating to investments to be purchased, sold or entered into by the Fund.
The management fee payable under the Investment Management Agreement is at equal to an annual rate (exclusive of any applicable waivers/ reimbursements) of 0.315% of the Fund’s average daily net assets, computed and accrued daily and payable monthly.
For the period from June 1, 2020 through September 30, 2020, the Advisor had contractually agreed to waive its fees and/or reimburse certain operating expenses of the Fund to the extent necessary to maintain the total annual operating expenses (excluding certain expenses such as extraordinary expenses, taxes, brokerage and interest expense) of each class as follows:
| Class A | .77% |
| Class C | 1.52% |
| Class S | .52% |
| Institutional Class | .52% |
Effective October 1, 2020 through September 30, 2021, the Advisor has contractually agreed to waive its fees and/or reimburse certain operating expenses of the Fund to the extent necessary to maintain the total annual operating expenses (excluding certain expenses such as extraordinary
| DWS Intermediate Tax-Free Fund | | 45 |
expenses, taxes, brokerage and interest expense) of each class as follows:
| Class A | | .70% |
| Class C | | 1.45% |
| Class S | | .45% |
| Institutional Class | | .45% |
For the year ended May 31, 2021, fees waived and/or expenses reimbursed for each class are as follows:
| Class A | $ 89,009 |
| Class C | 6,403 |
| Class S | 541,668 |
| Institutional Class | 266,070 |
| | $ 903,150 |
Administration Fee. Pursuant to an Administrative Services Agreement, DIMA provides most administrative services to the Fund. For all services provided under the Administrative Services Agreement, the Fund pays the Advisor an annual fee (“Administration Fee” ) of 0.097% of the Fund’s average daily net assets, computed and accrued daily and payable monthly. For the year ended May 31, 2021, the Administration Fee was $931,400, of which $80,273 is unpaid.
Service Provider Fees. DWS Service Company (“DSC” ), an affiliate of the Advisor, is the transfer agent, dividend-paying agent and shareholder service agent for the Fund. Pursuant to a sub-transfer agency agreement between DSC and DST Systems, Inc. (“DST” ), DSC has delegated certain transfer agent, dividend-paying agent and shareholder service agent functions to DST. DSC compensates DST out of the shareholder servicing fee it receives from the Fund. For the year ended May 31, 2021, the amounts charged to the Fund by DSC were as follows:
| Services to Shareholders | Total
Aggregated | Unpaid at
May 31, 2021 |
| Class A | $ 3,019 | $ 468 |
| Class C | 799 | 125 |
| Class S | 35,447 | 5,840 |
| Institutional Class | 2,094 | 234 |
| | $ 41,359 | $ 6,667 |
In addition, for the year ended May 31, 2021, the amounts charged to the Fund for recordkeeping and other administrative services provided by
| 46 | | DWS Intermediate Tax-Free Fund |
unaffiliated third parties, included in the Statement of Operations under “Services to shareholders,” were as follows:
| Sub-Recordkeeping | Total
Aggregated |
| Class A | $ 134,305 |
| Class C | 9,833 |
| Class S | 615,308 |
| Institutional Class | 357,977 |
| | $ 1,117,423 |
Distribution and Service Fees. Under the Fund’s Class C 12b-1 Plan, DWS Distributors, Inc. (“DDI” ), an affiliate of the Advisor, receives a fee (“Distribution Fee” ) of 0.75% of the average daily net assets of Class C shares. In accordance with the Fund’s Underwriting and Distribution Services Agreement, DDI enters into related selling group agreements with various firms at various rates for sales of Class C shares. For the year ended May 31, 2021, the Distribution Fee was as follows:
| Distribution Fee | Total
Aggregated | Unpaid at
May 31, 2021 |
| Class C | $ 102,759 | $ 5,301 |
In addition, DDI provides information and administrative services for a fee (“Service Fee” ) to Class A and C shareholders at an annual rate of up to 0.25% of the average daily net assets for each such class. DDI in turn has various agreements with financial services firms that provide these services and pays these fees based upon the assets of shareholder accounts the firms service. For the year ended May 31, 2021, the Service Fee was as follows:
| Service Fee | Total
Aggregated | Unpaid at
May 31, 2021 | Annual
Rate |
| Class A | $ 377,033 | $ 61,572 | .24% |
| Class C | 34,221 | 3,582 | .25% |
| | $ 411,254 | $ 65,154 | |
Underwriting Agreement and Contingent Deferred Sales Charge. DDI is the principal underwriter for the Fund. Underwriting commissions paid in connection with the distribution of Class A shares for the year ended May 31, 2021 aggregated $2,204.
In addition, DDI receives any contingent deferred sales charge (“CDSC” ) from Class C share redemptions occurring within one year of purchase. There is no such charge upon redemption of any share appreciation or reinvested dividends. The CDSC is 1% of the value of the shares redeemed for Class C. For the year ended May 31, 2021, the CDSC for
| DWS Intermediate Tax-Free Fund | | 47 |
Class C shares aggregated $221. A deferred sales charge of up to 1% is assessed on certain redemptions of Class A shares. For the year ended May 31, 2021, DDI received $95 for Class A shares.
Other Service Fees. Under an agreement with the Fund, DIMA is compensated for providing certain pre-press and regulatory filing services to the Fund. For the year ended May 31, 2021, the amount charged to the Fund by DIMA included in the Statement of Operations under “Reports to shareholders” aggregated $4,075, of which $1,006 is unpaid.
Trustees' Fees and Expenses. The Fund paid retainer fees to each Trustee not affiliated with the Advisor, plus specified amounts to the Board Chairperson and to each committee Chairperson.
Transactions with Affiliates. The Fund may purchase securities from, or sell securities to, an affiliated fund provided the affiliation is solely due to having a common investment adviser, common officers or common trustees. During the year ended May 31, 2021, the Fund engaged in securities purchases of $100,362,000 and securities sales of $91,452,000 with a net gain (loss) on securities sales of $0, with an affiliated fund in compliance with Rule 17a-7 under the 1940 Act.
The Fund and other affiliated funds (the “Participants” ) share in a $350 million revolving credit facility provided by a syndication of banks. The Fund may borrow for temporary or emergency purposes, including the meeting of redemption requests that otherwise might require the untimely disposition of securities. The Participants are charged an annual commitment fee, which is allocated based on net assets, among each of the Participants. Interest is calculated at a daily fluctuating rate per annum equal to the sum of 0.10% plus the higher of the Federal Funds Effective Rate and the Overnight Bank Funding Rate, plus 1.25%. The Fund may borrow up to a maximum of 33 percent of its net assets under the agreement. The Fund had no outstanding loans at May 31, 2021.
| 48 | | DWS Intermediate Tax-Free Fund |
| E. | Fund Share Transactions |
The following table summarizes share and dollar activity in the Fund:
| | Year Ended
May 31, 2021 | Year Ended
May 31, 2020 |
| | Shares | Dollars | Shares | Dollars |
| Shares sold |
| Class A | 2,640,505 | $ 31,657,787 | 1,384,711 | $ 16,409,291 |
| Class C | 121,763 | 1,457,367 | 128,802 | 1,515,329 |
| Class S | 5,315,761 | 63,651,428 | 7,571,037 | 90,062,820 |
| Institutional Class | 13,331,288 | 159,856,507 | 10,575,884 | 125,508,681 |
| | | $ 256,623,089 | | $ 233,496,121 |
| Shares issued to shareholders in reinvestment of distributions |
| Class A | 311,062 | $ 3,728,202 | 362,850 | $ 4,306,440 |
| Class C | 21,837 | 261,625 | 36,559 | 433,845 |
| Class S | 847,215 | 10,156,777 | 1,237,209 | 14,689,564 |
| Institutional Class | 713,512 | 8,550,388 | 824,018 | 9,778,230 |
| | | $ 22,696,992 | | $ 29,208,079 |
| Shares redeemed |
| Class A | (2,219,487) | $ (26,572,157) | (2,534,295) | $ (30,115,643) |
| Class C | (1,249,635) | (14,994,157) | (819,976) | (9,736,698) |
| Class S | (13,567,024) | (162,556,150) | (17,031,521) | (201,990,346) |
| Institutional Class | (6,551,209) | (78,347,580) | (8,789,506) | (103,256,022) |
| | | $ (282,470,044) | | $ (345,098,709) |
| Net increase (decrease) |
| Class A | 732,080 | $ 8,813,832 | (786,734) | $ (9,399,912) |
| Class C | (1,106,035) | (13,275,165) | (654,615) | (7,787,524) |
| Class S | (7,404,048) | (88,747,945) | (8,223,275) | (97,237,962) |
| Institutional Class | 7,493,591 | 90,059,315 | 2,610,396 | 32,030,889 |
| | | $ (3,149,963) | | $ (82,394,509) |
| F. | Other — COVID-19 Pandemic |
A novel coronavirus known as COVID-19, declared a pandemic by the World Health Organization, has caused significant uncertainty, market volatility, decreased economic and other activity, increased government activity, including economic stimulus measures, and supply chain interruptions. The full effects, duration and costs of the COVID-
| DWS Intermediate Tax-Free Fund | | 49 |
19 pandemic are impossible to predict, and the circumstances surrounding the COVID-19 pandemic will continue to evolve, including the risk of future increased rates of infection due to low vaccination rates and/or the lack of effectiveness of current vaccines against new variants. The pandemic has affected and may continue to affect certain countries, industries, economic sectors, companies and investment products more than others, may exacerbate existing economic, political, or social tensions and may increase the probability of an economic recession or depression. The Fund and its investments may be adversely affected by the effects of the COVID-19 pandemic, and the pandemic may result in the Fund and its service providers experiencing operational difficulties in coordinating a remote workforce and implementing their business continuity plans, among others. Management will continue to monitor the impact COVID-19 has on the Fund and reflect the consequences as appropriate in the Fund’s accounting and financial reporting.
| 50 | | DWS Intermediate Tax-Free Fund |
Report of Independent Registered Public Accounting Firm
To the Board of Trustees of Deutsche DWS Tax Free Trust and Shareholders of DWS Intermediate Tax-Free Fund:
Opinion on the Financial Statements
We have audited the accompanying statement of assets and liabilities of DWS Intermediate Tax-Free Fund (the “Fund” ) (one of the funds constituting Deutsche DWS Tax Free Trust) (the “Trust” ), and the related statement of operations for the year then ended, the statements of changes in net assets for each of the two years in the period then ended, the financial highlights for each of the three years in the period then ended and the related notes (collectively referred to as the “financial statements” ). In our opinion, the financial statements present fairly, in all material respects, the financial position of the Fund (one of the funds constituting Deutsche DWS Tax Free Trust ) at May 31, 2021, the results of its operations for the year then ended, the changes in its net assets for each of the two years in the period then ended, and its financial highlights for each of the three years in the period then ended, in conformity with U.S. generally accepted accounting principles.
The financial highlights for the years ended May 31, 2017 and May 31, 2018 were audited by another independent registered public accounting firm whose report, dated July 24, 2018, expressed an unqualified opinion on those financial highlights.
Basis for Opinion
These financial statements are the responsibility of the Trust’s management. Our responsibility is to express an opinion on the Fund’s financial statements based on our audits. We are a public accounting firm registered with the Public Company Accounting Oversight Board (United States) (“PCAOB” ) and are required to be independent with respect to the Trust in accordance with the U.S. federal securities laws and the applicable rules and regulations of the Securities and Exchange Commission and the PCAOB.
We conducted our audits in accordance with the standards of the PCAOB. Those standards require that we plan and perform the audit to obtain reasonable assurance about whether the financial statements are free of material misstatement, whether due to error or fraud. The Trust is not required to have, nor were we engaged to perform, an audit of the Trust’s internal control over financial reporting. As part of our audits, we are required to obtain an understanding of internal control over financial
| DWS Intermediate Tax-Free Fund | | 51 |
reporting, but not for the purpose of expressing an opinion on the effectiveness of the Trust’s internal control over financial reporting. Accordingly, we express no such opinion.
Our audits included performing procedures to assess the risks of material misstatement of the financial statements, whether due to error or fraud, and performing procedures that respond to those risks. Such procedures included examining, on a test basis, evidence regarding the amounts and disclosures in the financial statements. Our procedures included confirmation of securities owned as of May 31, 2021, by correspondence with the custodian and others or by other appropriate auditing procedures where replies from others were not received. Our audits also included evaluating the accounting principles used and significant estimates made by management, as well as evaluating the overall presentation of the financial statements. We believe that our audits provide a reasonable basis for our opinion.
We have served as the auditor of one or more investment companies in the DWS family of funds since at least 1979, but we are unable to determine the specific year.
Boston, Massachusetts
July 28, 2021
| 52 | | DWS Intermediate Tax-Free Fund |
Information About Your Fund’s Expenses
As an investor of the Fund, you incur two types of costs: ongoing expenses and transaction costs. Ongoing expenses include management fees, distribution and service (12b-1) fees and other Fund expenses. Examples of transaction costs include sales charges (loads) and account maintenance fees, which are not shown in this section. The following tables are intended to help you understand your ongoing expenses (in dollars) of investing in the Fund and to help you compare these expenses with the ongoing expenses of investing in other mutual funds. In the most recent six-month period, the Fund limited these expenses; had it not done so, expenses would have been higher. The example in the table is based on an investment of $1,000 invested at the beginning of the six-month period and held for the entire period (December 1, 2020 to May 31, 2021).
The tables illustrate your Fund’s expenses in two ways:
| — | Actual Fund Return. This helps you estimate the actual dollar amount of ongoing expenses (but not transaction costs) paid on a $1,000 investment in the Fund using the Fund’s actual return during the period. To estimate the expenses you paid over the period, simply divide your account value by $1,000 (for example, an $8,600 account value divided by $1,000 = 8.6), then multiply the result by the number in the “Expenses Paid per $1,000” line under the share class you hold. |
| — | Hypothetical 5% Fund Return. This helps you to compare your Fund’s ongoing expenses (but not transaction costs) with those of other mutual funds using the Fund’s actual expense ratio and a hypothetical rate of return of 5% per year before expenses. Examples using a 5% hypothetical fund return may be found in the shareholder reports of other mutual funds. The hypothetical account values and expenses may not be used to estimate the actual ending account balance or expenses you paid for the period. |
Please note that the expenses shown in these tables are meant to highlight your ongoing expenses only and do not reflect any transaction costs. The “Expenses Paid per $1,000” line of the tables is useful in comparing ongoing expenses only and will not help you determine the relative total expense of owning different funds. Subject to certain exceptions, an account maintenance fee of $20.00 assessed once per calendar year for Classes A, C and S shares may apply for accounts with balances less than $10,000. This fee is not included in these tables. If it was, the estimate of expenses paid for Classes A, C and S shares during the period would be higher, and account value during the period would be lower, by this amount.
| DWS Intermediate Tax-Free Fund | | 53 |
Expenses and Value of a $1,000 Investment
for the six months ended May 31, 2021 (Unaudited)
| Actual Fund Return | Class A | Class C | Class S | Institutional
Class |
| Beginning Account Value 12/1/20 | $1,000.00 | $1,000.00 | $1,000.00 | $1,000.00 |
| Ending Account Value 5/31/21 | $1,015.00 | $1,011.20 | $1,017.10 | $1,016.30 |
| Expenses Paid per $1,000* | $ 3.52 | $ 7.27 | $ 2.26 | $ 2.26 |
| Hypothetical 5% Fund Return | Class A | Class C | Class S | Institutional
Class |
| Beginning Account Value 12/1/20 | $1,000.00 | $1,000.00 | $1,000.00 | $1,000.00 |
| Ending Account Value 5/31/21 | $1,021.44 | $1,017.70 | $1,022.69 | $1,022.69 |
| Expenses Paid per $1,000* | $ 3.53 | $ 7.29 | $ 2.27 | $ 2.27 |
| * | Expenses are equal to the Fund’s annualized expense ratio for each share class, multiplied by the average account value over the period, multiplied by 182 (the number of days in the most recent six-month period), then divided by 365. |
| Annualized Expense Ratios | Class A | Class C | Class S | Institutional
Class |
| DWS Intermediate Tax-Free Fund | .70% | 1.45% | .45% | .45% |
For more information, please refer to the Fund’s prospectus.
For an analysis of the fees associated with an investment in the Fund or similar funds, please refer to tools.finra.org/fund_analyzer/.
| Tax Information | (Unaudited) |
The Fund paid distributions of $0.04 per share from net long-term capital gains during its year ended May 31, 2021.
Pursuant to Section 852 of the Internal Revenue Code, the Fund designates $3,833,000 as capital gain dividends for its year ended May 31, 2021.
Of the dividends paid from net investment income for the taxable year ended May 31, 2021, 100% are designated as exempt interest dividends for federal income tax purposes.
Please consult a tax advisor if you have questions about federal or state income tax laws, or on how to prepare your tax returns. If you have specific questions about your account, please call (800) 728-3337.
| 54 | | DWS Intermediate Tax-Free Fund |
Liquidity Risk Management
In accordance with Rule 22e-4 (the “Liquidity Rule” ) under the Investment Company Act of 1940 (the “1940 Act” ), your Fund has adopted a liquidity risk management program (the “Program” ), and the Board has designated DWS Investment Management Americas, Inc. (“DIMA” ) as Program administrator. The Program is designed to assess and manage your Fund’s liquidity risk (the risk that the Fund would be unable to meet requests to redeem shares of the Fund without significant dilution of remaining investors’ interests in the Fund). DIMA has designated a committee (the “Committee” ) composed of personnel from multiple departments within DIMA and its affiliates that is responsible for the implementation and ongoing administration of the Program, which includes assessing the Fund’s liquidity risk under both normal and reasonably foreseeable stressed conditions. Under the Program, every investment held by a Fund is classified on a daily basis into one of four liquidity categories based on estimations of the investment’s ability to be sold during designated timeframes in current market conditions without significantly changing the investment’s market value.
In February 2021, as required by the Program and the Liquidity Rule, DIMA provided the Board with an annual written report (the “Report” ) addressing the operation of the Program and assessing the adequacy and effectiveness of its implementation during the period from December 1, 2019 through November 30, 2020 (the “Reporting Period” ). During the Reporting Period, your Fund was primarily invested in highly liquid investments (investments that the Fund anticipates can be converted to cash within three business days or less in current market conditions without significantly changing their market value). As a result, your Fund is not required to adopt, and has not adopted, a “Highly Liquid Investment Minimum” as defined in the Liquidity Rule. During the Reporting Period, the Fund did not approach the 15% limit imposed by the Liquidity Rule on holdings in illiquid investments (investments that cannot be sold or disposed of in seven days or less in current market conditions without the sale of the investment significantly changing the market value of the investment). Your Fund did not experience any issues meeting investor redemptions at any time during the Reporting Period. In the Report, DIMA stated that it believes the Program has operated adequately and effectively to manage the Fund’s liquidity risk during the Reporting Period. DIMA also reported that there were no material changes made to the Program during the Reporting Period.
| DWS Intermediate Tax-Free Fund | | 55 |
Advisory Agreement Board Considerations and Fee Evaluation
The Board of Trustees (hereinafter referred to as the “Board” or “Trustees” ) approved the renewal of DWS Intermediate Tax-Free Fund’s (the “Fund” ) investment management agreement (the “Agreement” ) with DWS Investment Management Americas, Inc. (“DIMA” ) in September 2020.
In terms of the process that the Board followed prior to approving the Agreement, shareholders should know that:
| — | During the entire process, all of the Fund’s Trustees were independent of DIMA and its affiliates (the “Independent Trustees” ). |
| — | The Board met frequently during the past year to discuss fund matters and dedicated a substantial amount of time to contract review matters. Over the course of several months, the Board reviewed extensive materials received from DIMA, independent third parties and independent counsel. These materials included an analysis of the Fund’s performance, fees and expenses, and profitability from a fee consultant retained by the Fund’s Independent Trustees (the “Fee Consultant” ). |
| — | The Board also received extensive information throughout the year regarding performance of the Fund. |
| �� | The Independent Trustees regularly met privately with counsel to discuss contract review and other matters. In addition, the Independent Trustees were advised by the Fee Consultant in the course of their review of the Fund’s contractual arrangements and considered a comprehensive report prepared by the Fee Consultant in connection with their deliberations. |
| — | In connection with reviewing the Agreement, the Board also reviewed the terms of the Fund’s Rule
12b-1 plan, distribution agreement, administrative services agreement, transfer agency agreement and other material service agreements. |
In connection with the contract review process, the Board considered the factors discussed below, among others. The Board also considered that DIMA and its predecessors have managed the Fund since its inception, and the Board believes that a long-term relationship with a capable, conscientious advisor is in the best interests of the Fund. The Board considered, generally, that shareholders chose to invest or remain invested in the Fund knowing that DIMA managed the Fund. DIMA is part of DWS Group GmbH & Co. KGaA (“DWS Group” ). DWS Group is a global asset management business that offers a wide range of investing expertise and resources, including research capabilities in many countries throughout the world. In 2018, approximately 20% of DWS Group’s
| 56 | | DWS Intermediate Tax-Free Fund |
shares were sold in an initial public offering, with Deutsche Bank AG owning the remaining shares.
As part of the contract review process, the Board carefully considered the fees and expenses of each DWS fund overseen by the Board in light of the fund’s performance. In many cases, this led to the negotiation and implementation of expense caps.
While shareholders may focus primarily on fund performance and fees, the Fund’s Board considers these and many other factors, including the quality and integrity of DIMA’s personnel and administrative support services provided by DIMA, such as back-office operations, fund valuations, and compliance policies and procedures.
Nature, Quality and Extent of Services. The Board considered the terms of the Agreement, including the scope of advisory services provided under the Agreement. The Board noted that, under the Agreement, DIMA provides portfolio management services to the Fund and that, pursuant to a separate administrative services agreement, DIMA provides administrative services to the Fund. The Board considered the experience and skills of senior management and investment personnel and the resources made available to such personnel. The Board also considered the risks to DIMA in sponsoring or managing the Fund, including financial, operational and reputational risks, the potential economic impact to DIMA from such risks and DIMA’s approach to addressing such risks. The Board reviewed the Fund’s performance over short-term and long-term periods and compared those returns to various agreed-upon performance measures, including market index(es) and a peer universe compiled using information supplied by Morningstar Direct (“Morningstar” ), an independent fund data service. The Board also noted that it has put into place a process of identifying “Funds in Review” (e.g., funds performing poorly relative to a peer universe), and receives additional reporting from DIMA regarding such funds and, where appropriate, DIMA’s plans to address underperformance. The Board believes this process is an effective manner of identifying and addressing underperforming funds. Based on the information provided, the Board noted that, for the one-, three- and five-year periods ended December 31, 2019, the Fund’s performance (Class A shares) was in the 3rd quartile, 4th quartile and 4th quartile, respectively, of the applicable Morningstar universe (the 1st quartile being the best performers and the 4th quartile being the worst performers). The Board also observed that the Fund has performed equal to its benchmark in the one-year period and has underperformed its benchmark in the three- and five-year periods ended December 31, 2019. The Board noted the disappointing investment performance of the Fund in recent periods and continued to discuss with senior management of DIMA the factors contributing to such underperformance and actions being taken to improve performance. The Board noted that, effective August 2, 2018, a change was made to the Fund’s investment strategy, allowing it to invest
| DWS Intermediate Tax-Free Fund | | 57 |
up to 10% of its assets in high yield debt securities (commonly referred to as “junk bonds” ). The Board observed that the Fund had experienced improved relative performance during the first eight months of 2020. The Board recognized the efforts by DIMA in recent years to enhance its investment platform and improve long-term performance across the DWS fund complex.
Fees and Expenses. The Board considered the Fund’s investment management fee schedule, operating expenses and total expense ratios, and comparative information provided by Broadridge Financial Solutions, Inc. (“Broadridge” ) and the Fee Consultant regarding investment management fee rates paid to other investment advisors by similar funds (1st quartile being the most favorable and 4th quartile being the least favorable). With respect to management fees paid to other investment advisors by similar funds, the Board noted that the contractual fee rates paid by the Fund, which include a 0.10% fee paid to DIMA under the Fund’s administrative services agreement, were lower than the median (2nd quartile) of the applicable Broadridge peer group (based on Broadridge data provided as of December 31, 2019). The Board noted that, effective March 1, 2020, the fee paid to DIMA under the Fund’s administrative services agreement was reduced to 0.097%. The Board noted that the Fund’s Class A shares total (net) operating expenses (excluding 12b-1 fees) were expected to be lower than the median (2nd quartile) of the applicable Broadridge expense universe (based on Broadridge data provided as of December 31, 2019, and analyzing Broadridge expense universe Class A (net) expenses less any applicable 12b-1 fees) (“Broadridge Universe Expenses” ). The Board also reviewed data comparing each other operational share class’s total (net) operating expenses to the applicable Broadridge Universe Expenses. The Board noted that the expense limitations agreed to by DIMA were expected to help the Fund’s total (net) operating expenses remain competitive. The Board considered the Fund’s management fee rate as compared to fees charged by DIMA to comparable DWS U.S. registered funds (“DWS Funds” ) and considered differences between the Fund and the comparable DWS Funds. The information requested by the Board as part of its review of fees and expenses also included information about institutional accounts (including any sub-advised funds and accounts) and funds offered primarily to European investors (“DWS Europe Funds” ) managed by DWS Group. The Board noted that DIMA indicated that DWS Group does not manage any institutional accounts or DWS Europe Funds comparable to the Fund.
On the basis of the information provided, the Board concluded that management fees were reasonable and appropriate in light of the nature, quality and extent of services provided by DIMA.
| 58 | | DWS Intermediate Tax-Free Fund |
Profitability. The Board reviewed detailed information regarding revenues received by DIMA under the Agreement. The Board considered the estimated costs to DIMA, and pre-tax profits realized by DIMA, from advising the DWS Funds, as well as estimates of the pre-tax profits attributable to managing the Fund in particular. The Board also received information regarding the estimated enterprise-wide profitability of DIMA and its affiliates with respect to all fund services in totality and by fund. The Board and the Fee Consultant reviewed DIMA’s methodology in allocating its costs to the management of the Fund. Based on the information provided, the Board concluded that the pre-tax profits realized by DIMA in connection with the management of the Fund were not unreasonable. The Board also reviewed certain publicly available information regarding the profitability of certain similar investment management firms. The Board noted that, while information regarding the profitability of such firms is limited (and in some cases is not necessarily prepared on a comparable basis), DIMA and its affiliates’ overall profitability with respect to the DWS Funds (after taking into account distribution and other services provided to the funds by DIMA and its affiliates) was lower than the overall profitability levels of most comparable firms for which such data was available.
Economies of Scale. The Board considered whether there are economies of scale with respect to the management of the Fund and whether the Fund benefits from any economies of scale. In this regard, the Board observed that while the Fund’s current investment management fee schedule does not include breakpoints, the Fund’s fee schedule represents an appropriate sharing between the Fund and DIMA of such economies of scale as may exist in the management of the Fund at current asset levels.
Other Benefits to DIMA and Its Affiliates. The Board also considered the character and amount of other incidental or “fall-out” benefits received by DIMA and its affiliates, including any fees received by DIMA for administrative services provided to the Fund, any fees received by an affiliate of DIMA for transfer agency services provided to the Fund and any fees received by an affiliate of DIMA for distribution services. The Board also considered benefits to DIMA related to brokerage and soft- dollar allocations, including allocating brokerage to pay for research generated by parties other than the executing broker dealers, which pertain primarily to funds investing in equity securities. In addition, the Board considered the incidental public relations benefits to DIMA related to DWS Funds advertising and cross-selling opportunities among DIMA products and services. The Board considered these benefits in reaching its conclusion that the Fund’s management fees were reasonable.
Compliance. The Board considered the significant attention and resources dedicated by DIMA to its compliance processes in recent years. The Board
| DWS Intermediate Tax-Free Fund | | 59 |
noted in particular (i) the experience, seniority and time commitment of the individuals serving as DIMA’s and the Fund’s chief compliance officers and (ii) the substantial commitment of resources by DIMA and its affiliates to compliance matters, including the retention of compliance personnel.
The Board also considered that on September 24, 2020, the SEC granted a temporary order permitting DIMA and its affiliates to continue providing investment advisory and underwriting services to the DWS Funds notwithstanding a consent order entered into by Deutsche Bank AG on June 17, 2020 (the “Consent Order” ). The Board noted that the temporary order was granted effective as of the date of the Consent Order. The Board also noted various representations by DIMA to the Board relating to the Consent Order, including that the conduct giving rise to the Consent Order (unintentional conduct that resulted from a system outage that prevented Deutsche Bank AG from reporting data in accordance with applicable CFTC requirements for five days in April 2016) did not involve any DWS Fund or services DIMA and its affiliates provide to the DWS Funds, that DIMA and its personnel had no involvement in the alleged conduct giving rise to the Consent Order, and that the DWS Funds would not bear any financial impact or costs relating to the Consent Order.
Based on all of the information considered and the conclusions reached, the Board determined that the continuation of the Agreement is in the best interests of the Fund. In making this determination, the Board did not give particular weight to any single factor identified above. The Board considered these factors over the course of numerous meetings, certain of which were in executive session with only the Independent Trustees and counsel present. It is possible that individual Independent Trustees may have weighed these factors differently in reaching their individual decisions to approve the continuation of the Agreement.
| 60 | | DWS Intermediate Tax-Free Fund |
Board Members and Officers
The following table presents certain information regarding the Board Members and Officers of the Trust/Corporation. Each Board Member’s year of birth is set forth in parentheses after his or her name. Unless otherwise noted, (i) each Board Member has engaged in the principal occupation(s) noted in the table for at least the most recent five years, although not necessarily in the same capacity; and (ii) the address of each Independent Board Member is c/o Keith R. Fox, DWS Funds Board Chair, c/o Thomas R. Hiller, Ropes & Gray LLP, Prudential Tower, 800 Boylston Street, Boston, MA 02199-3600. Except as otherwise noted below, the term of office for each Board Member is until the election and qualification of a successor, or until such Board Member sooner dies, resigns, is removed or as otherwise provided in the governing documents of the Trust/Corporation. Because the Fund does not hold an annual meeting of shareholders, each Board Member will hold office for an indeterminate period.
The Board Members may also serve in similar capacities with other funds in the fund complex. The number of funds in the DWS fund complex shown in the table below includes all registered open- and closed-end funds (including all of their portfolios) advised by the Advisor and any registered funds that have an investment advisor that is an affiliated person of the Advisor.
Independent Board Members
Name, Year of
Birth, Position
with the Trust/
Corporation
and Length of
Time Served1 | Business Experience and Directorships
During the Past Five Years | Number of
Funds in
DWS Fund
Complex
Overseen | Other
Directorships
Held by Board
Member |
| Keith R. Fox, CFA (1954)Chairperson since 2017, and Board Member since 1996 | Managing General Partner, Exeter Capital Partners (a series of private investment funds) (since 1986). Directorships: Progressive International Corporation (kitchen goods importer and distributor); former Chairman, National Association of Small Business Investment Companies; Former Directorships: ICI Mutual Insurance Company; BoxTop Media Inc. (advertising); Sun Capital Advisers Trust (mutual funds) | 72 | — |
| DWS Intermediate Tax-Free Fund | | 61 |
Name, Year of
Birth, Position
with the Trust/
Corporation
and Length of
Time Served1 | Business Experience and Directorships
During the Past Five Years | Number of
Funds in
DWS Fund
Complex
Overseen | Other
Directorships
Held by Board
Member |
| John W. Ballantine (1946)Board Member since 1999 | Retired; formerly, Executive Vice President and Chief Risk Management Officer, First Chicago NBD Corporation/The First National Bank of Chicago (1996–1998); Executive Vice President and Head of International Banking (1995–1996); Not-for-Profit Directorships: Palm Beach Civic Assn.; Window to the World Communications (public media); Life Director of Harris Theater for Music and Dance (Chicago); Life Director of Hubbard Street Dance Chicago; Former Directorships: Director and Chairman of the Board, Healthways, Inc.2 (population wellbeing and wellness services) (2003–2014); Stockwell Capital Investments PLC (private equity); Enron Corporation; FNB Corporation; Tokheim Corporation; First Oak Brook Bancshares, Inc.; Oak Brook Bank; Portland General Electric2 (utility company (2003–2021); and Prisma Energy International; Former Not-for-Profit Directorships: Public Radio International | 72 | — |
| Dawn-Marie Driscoll (1946)Board Member since 1987 | Advisory Board and former Executive Fellow, Hoffman Center for Business Ethics, Bentley University; formerly: Partner, Palmer & Dodge (law firm) (1988–1990); Vice President of Corporate Affairs and General Counsel, Filene’s (retail) (1978–1988); Directorships: Trustee and former Chairman of the Board, Southwest Florida Community Foundation (charitable organization); Former Directorships: ICI Mutual Insurance Company (2007–2015); Sun Capital Advisers Trust (mutual funds) (2007–2012), Investment Company Institute (audit, executive, nominating committees) and Independent Directors Council (governance, executive committees) | 72 | — |
| 62 | | DWS Intermediate Tax-Free Fund |
Name, Year of
Birth, Position
with the Trust/
Corporation
and Length of
Time Served1 | Business Experience and Directorships
During the Past Five Years | Number of
Funds in
DWS Fund
Complex
Overseen | Other
Directorships
Held by Board
Member |
| Richard J. Herring (1946)Board Member since 1990 | Jacob Safra Professor of International Banking and Professor of Finance, The Wharton School, University of Pennsylvania (since July 1972); Director, The Wharton Financial Institutions Center (1994–2020); formerly: Vice Dean and Director, Wharton Undergraduate Division (1995–2000) and Director, The Lauder Institute of International Management Studies (2000–2006); Member FDIC Systemic Risk Advisory Committee since 2011, member Systemic Risk Council since 2012 and member of the Advisory Board at the Yale Program on Financial Stability since 2013; Former Directorships: Co-Chair of the Shadow Financial Regulatory Committee (2003–2015), Executive Director of The Financial Economists Roundtable (2008–2015), Director of The Thai Capital Fund (2007–2013), Director of The Aberdeen Singapore Fund (2007–2018), and Nonexecutive Director of Barclays Bank DE (2010–2018) | 72 | Director, Aberdeen Japan Fund (since 2007) |
| William McClayton (1944)Board Member since 2004 | Private equity investor (since October 2009); formerly: Managing Director, Diamond Management & Technology Consultants, Inc. (global consulting firm) (2001–2009); Senior Partner, Arthur Andersen LLP (accounting) (1966–2001); Former Directorships: Board of Managers, YMCA of Metropolitan Chicago; Trustee, Ravinia Festival | 72 | — |
| Rebecca W. Rimel (1951)Board Member since 1995 | Senior Advisor, The Pew Charitable Trusts (charitable organization) (since July 2020); Director, The Bridgespan Group (nonprofit organization) (since October 2020); formerly: Executive Vice President, The Glenmede Trust Company (investment trust and wealth management) (1983–2004); Board Member, Investor Education (charitable organization) (2004–2005); Former Directorships: Trustee, Executive Committee, Philadelphia Chamber of Commerce (2001–2007); Director, Viasys Health Care2 (January 2007–June 2007); Trustee, Thomas Jefferson Foundation (charitable organization) (1994–2012); President, Chief Executive Officer and Director, The Pew Charitable Trusts (charitable organization) (1994–2020); Director, BioTelemetry Inc.2 (acquired by Royal Philips in 2021) (healthcare) (2009–2021) | 72 | Director, Becton Dickinson and Company2 (medical technology company)
(2012–present) |
| William N. Searcy, Jr. (1946)Board Member since 1993 | Private investor since October 2003; formerly: Pension & Savings Trust Officer, Sprint Corporation2 (telecommunications) (November 1989–September 2003); Former Directorships: Trustee, Sun Capital Advisers Trust (mutual funds) (1998–2012) | 72 | — |
| DWS Intermediate Tax-Free Fund | | 63 |
Officers3
Name, Year of Birth, Position
with the Trust/Corporation
and Length of Time Served4 | Business Experience and Directorships During the
Past Five Years |
| Hepsen Uzcan5 (1974)President and Chief Executive Officer, 2017–present | Fund Administration (Head since 2017), DWS; Secretary, DWS USA Corporation (2018–present); Assistant Secretary, DWS Distributors, Inc. (2018–present); Director and Vice President, DWS Service Company (2018–present); Assistant Secretary, DWS Investment Management Americas, Inc. (2018–present); Director and President, DB Investment Managers, Inc. (2018–present); President and Chief Executive Officer, The European Equity Fund, Inc., The New Germany Fund, Inc. and The Central and Eastern Europe Fund, Inc. (2017–present); formerly: Vice President for the Deutsche funds (2016–2017); Assistant Secretary for the DWS funds (2013–2019); Assistant Secretary, The European Equity Fund, Inc., The New Germany Fund, Inc. and The Central and Eastern Europe Fund, Inc. (2013–2020); Directorships: Interested Director, The European Equity Fund, Inc., The New Germany Fund, Inc. and The Central and Eastern Europe Fund, Inc. (since June 25, 2020); ICI Mutual Insurance Company (since October 16, 2020); and Episcopalian Charities of New York (2018–present) |
| John Millette6 (1962)Vice President and Secretary, 1999–present | Legal (Associate General Counsel), DWS; Chief Legal Officer, DWS Investment Management Americas, Inc. (2015–present); Director and Vice President, DWS Trust Company (2016–present); Secretary, DBX ETF Trust (2020–present); Vice President, DBX Advisors LLC (2021–present); Secretary, The European Equity Fund, Inc., The New Germany Fund, Inc. and The Central and Eastern Europe Fund, Inc. 2011–present); formerly: Secretary, Deutsche Investment Management Americas Inc. (2015–2017); and Assistant Secretary, DBX ETF Trust (2019–2020) |
| Ciara Crawford7 (1984)Assistant Secretary, (2019–present) | Fund Administration (Specialist), DWS (2015–present); formerly, Legal Assistant at Accelerated Tax Solutions. |
| Diane Kenneally6 (1966)Chief Financial Officer and Treasurer, 2018–present | Fund Administration Treasurer’s Office (Co-Head since 2018), DWS; Treasurer, Chief Financial Officer and Controller, DBX ETF Trust (2019–present); Treasurer and Chief Financial Officer, The European Equity Fund, Inc., The New Germany Fund, Inc. and The Central and Eastern Europe Fund, Inc. (2018–present); formerly: Assistant Treasurer for the DWS funds (2007–2018) |
| Paul Antosca6 (1957)Assistant Treasurer, 2007–present | Fund Administration Tax (Head), DWS; and Assistant Treasurer, DBX ETF Trust (2019–present) |
| Sheila Cadogan6 (1966)Assistant Treasurer, 2017–present | Fund Administration Treasurer’s Office (Co-Head since 2018), DWS; Director and Vice President, DWS Trust Company (2018–present); Assistant Treasurer, DBX ETF Trust (2019–present); Assistant Treasurer, The European Equity Fund, Inc., The New Germany Fund, Inc. and The Central and Eastern Europe Fund, Inc. (2018–present) |
| Scott D. Hogan6 (1970)Chief Compliance Officer, 2016–present | Anti-Financial Crime & Compliance US (Senior Team Lead), DWS; Chief Compliance Officer, The European Equity Fund, Inc., The New Germany Fund, Inc. and The Central and Eastern Europe Fund, Inc. (2016–present) |
| 64 | | DWS Intermediate Tax-Free Fund |
Name, Year of Birth, Position
with the Trust/Corporation
and Length of Time Served4 | Business Experience and Directorships During the
Past Five Years |
| Caroline Pearson6 (1962)Chief Legal Officer, 2010–present | Legal (Senior Team Lead), DWS; Assistant Secretary, DBX ETF Trust (2020–present); Chief Legal Officer, DBX Advisors LLC and DBX Strategic Advisors LLC (2020–present); Chief Legal Officer, The European Equity Fund, Inc., The New Germany Fund, Inc. and The Central and Eastern Europe Fund, Inc. (2012–present); formerly: Secretary, Deutsche AM Distributors, Inc. (2002–2017); and Secretary, Deutsche AM Service Company (2010–2017) |
Michelle Goveia-Pine5 (1970)Interim Anti-Money Laundering
Compliance Officer,
since July 10, 2020 | Anti-Financial Crime & Compliance US (Regional Head), DWS; Interim AML Officer, DWS Trust Company (since July 28, 2020); Interim AML Officer, DBX ETF Trust (since July 9, 2020); Interim AML Officer, The European Equity Fund, Inc., The New Germany Fund, Inc. and The Central and Eastern Europe Fund, Inc. (since July 24, 2020) |
| 1 | The length of time served represents the year in which the Board Member joined the board of one or more DWS funds currently overseen by the Board. |
| 2 | A publicly held company with securities registered pursuant to Section 12 of the Securities Exchange Act of 1934. |
| 3 | As a result of their respective positions held with the Advisor or its affiliates, these individuals are considered “interested persons” of the Advisor within the meaning of the 1940 Act. Interested persons receive no compensation from the Fund. |
| 4 | The length of time served represents the year in which the officer was first elected in such capacity for one or more DWS funds. |
| 5 | Address: 875 Third Avenue, New York, NY 10022. |
| 6 | Address: 100 Summer Street, Boston, MA 02110. |
| 7 | Address: 5022 Gate Parkway, Suite 400, Jacksonville, FL 32256. |
Certain officers hold similar positions for other investment companies for which DIMA or an affiliate serves as the Advisor.
The Fund’s Statement of Additional Information (“SAI” ) includes additional information about the Board Members. The SAI is available, without charge, upon request. If you would like to request a copy of the SAI, you may do so by calling the following toll-free number: (800) 728-3337.
| DWS Intermediate Tax-Free Fund | | 65 |
Account Management Resources
| For More Information | The automated telephone system allows you to access personalized account information and obtain information on other DWS funds using either your voice or your telephone keypad. Certain account types within Classes A, C and S also have the ability to purchase, exchange or redeem shares using this system. |
For more information, contact your financial representative. You may also access our automated telephone system or speak with a Shareholder Service representative by calling:
(800) 728-3337 |
| Web Site | dws.com
View your account transactions and balances, trade shares, monitor your asset allocation, subscribe to fund and account updates by e-mail, and change your address, 24 hours a day. |
| Obtain prospectuses and applications, news about DWS funds, insight from DWS economists and investment specialists and access to DWS fund account information. |
| Written Correspondence | DWSPO Box 219151
Kansas City, MO 64121-9151 |
| Proxy Voting | The Fund’s policies and procedures for voting proxies for portfolio securities and information about how the Fund voted proxies related to its portfolio securities during the most recent 12-month period ended June 30 are available on our Web site — dws.com/en-us/resources/proxy-voting — or on the SEC’s Web site — sec.gov. To obtain a written copy of the Fund’s policies and procedures without charge, upon request, call us toll free at (800) 728-3337. |
| Portfolio Holdings | Following the Fund’s fiscal first and third quarter-end, a complete portfolio holdings listing is posted on dws.com, and is available free of charge by contacting your financial intermediary, or if you are a direct investor, by calling (800) 728-3337. In addition, the portfolio holdings listing is filed with SEC on the Fund’s Form N-PORT and will be available on the SEC’s Web site at sec.gov. Additional portfolio holdings for the Fund are also posted on dws.com from time to time. Please see the Fund’s current prospectus for more information. |
| Principal Underwriter | If you have questions, comments or complaints, contact:DWS Distributors, Inc.
222 South Riverside Plaza
Chicago, IL 60606-5808
(800) 621-1148 |
| 66 | | DWS Intermediate Tax-Free Fund |
| Investment Management | DWS Investment Management Americas, Inc. (“DIMA” or the “Advisor” ), which is part of the DWS Group GmbH & Co. KGaA (“DWS Group” ), is the investment advisor for the Fund. DIMA and its predecessors have more than 90 years of experience managing mutual funds and DIMA provides a full range of investment advisory services to both institutional and retail clients. DIMA is an indirect, wholly owned subsidiary of DWS Group. |
| | DWS Group is a global organization that offers a wide range of investing expertise and resources, including hundreds of portfolio managers and analysts and an office network that reaches the world’s major investment centers. This well-resourced global investment platform brings together a wide variety of experience and investment insight across industries, regions, asset classes and investing styles. |
| | Class A | Class C | Class S | Institutional Class |
| Nasdaq Symbol | SZMAX | SZMCX | SCMTX | SZMIX |
| CUSIP Number | 25159H 108 | 25159H 306 | 25159H 405 | 25159H 504 |
| Fund Number | 445 | 745 | 2045 | 1445 |
| DWS Intermediate Tax-Free Fund | | 67 |
DITFF-2
(R-027918-10 7/21)
| | |
| | (b) Not applicable |
| | |
| ITEM 2. | CODE OF ETHICS |
| | |
| | As of the end of the period covered by this report, the registrant has adopted a code of ethics, as defined in Item 2 of Form N-CSR that applies to its Principal Executive Officer and Principal Financial Officer. There have been no amendments to, or waivers from, a provision of the code of ethics during the period covered by this report that would require disclosure under Item 2. A copy of the code of ethics is filed as an exhibit to this Form N-CSR. |
| | |
| ITEM 3. | AUDIT COMMITTEE FINANCIAL EXPERT |
| | |
| | The fund’s audit committee is comprised solely of trustees who are "independent" (as such term has been defined by the Securities and Exchange Commission ("SEC") in regulations implementing Section 407 of the Sarbanes-Oxley Act (the "Regulations")). The fund’s Board of Trustees has determined that there are several "audit committee financial experts" (as such term has been defined by the Regulations) serving on the fund’s audit committee including Mr. William McClayton, the chair of the fund’s audit committee. An “audit committee financial expert” is not an “expert” for any purpose, including for purposes of Section 11 of the Securities Act of 1933 and the designation or identification of a person as an “audit committee financial expert” does not impose on such person any duties, obligations or liability that are greater than the duties, obligations and liability imposed on such person as a member of the audit committee and board of directors in the absence of such designation or identification. |
| | |
| ITEM 4. | PRINCIPAL ACCOUNTANT FEES AND SERVICES |
| | |
DWS intermediate tax-free Fund
form n-csr disclosure re: AUDIT FEES
The following table shows the amount of fees that Ernst & Young LLP (“EY”), the Fund’s Independent Registered Public Accounting Firm, billed to the Fund during the Fund’s last two fiscal years. The Audit Committee approved in advance all audit services and non-audit services that EY provided to the Fund.
Services that the Fund’s Independent Registered Public Accounting Firm Billed to the Fund
Fiscal Year
Ended
May 31, | Audit Fees Billed to Fund | Audit-Related
Fees Billed to Fund | Tax Fees Billed to Fund | All
Other Fees Billed to Fund |
| 2021 | $42,433 | $0 | $7,880 | $0 |
| 2020 | $42,433 | $0 | $8,565 | $0 |
The above “Tax Fees” were billed for professional services rendered for tax preparation.
Services that the Fund’s Independent Registered Public Accounting Firm Billed to the Adviser and Affiliated Fund Service Providers
The following table shows the amount of fees billed by EY to DWS Investment Management Americas, Inc. (“DIMA” or the “Adviser”), and any entity controlling, controlled by or under common control with DIMA (“Control Affiliate”) that provides ongoing services to the Fund (“Affiliated Fund Service Provider”), for engagements directly related to the Fund’s operations and financial reporting, during the Fund’s last two fiscal years.
Fiscal Year
Ended
May 31, | Audit-Related
Fees Billed to Adviser and Affiliated Fund Service Providers | Tax Fees Billed to Adviser and Affiliated Fund Service Providers | All
Other Fees Billed to Adviser and Affiliated Fund Service Providers |
| 2021 | $0 | $57,532 | $0 |
| 2020 | $0 | $625,431 | $0 |
The above “Tax Fees” were billed in connection with tax compliance services and agreed upon procedures.
Non-Audit Services
The following table shows the amount of fees that EY billed during the Fund’s last two fiscal years for non-audit services. The Audit Committee pre-approved all non-audit services that EY provided to the Adviser and any Affiliated Fund Service Provider that related directly to the Fund’s operations and financial reporting. The Audit Committee requested and received information from EY about any non-audit services that EY rendered during the Fund’s last fiscal year to the Adviser and any Affiliated Fund Service Provider. The Committee considered this information in evaluating EY’s independence.
Fiscal Year
Ended
May 31, | Total
Non-Audit Fees Billed to Fund
(A) | Total Non-Audit Fees billed to Adviser and Affiliated Fund Service Providers (engagements related directly to the operations and financial reporting of the Fund)
(B) | Total Non-Audit Fees billed to Adviser and Affiliated Fund Service Providers (all other engagements)
(C) | Total of
(A), (B) and (C) |
| 2021 | $7,880 | $57,532 | $0 | $65,412 |
| 2020 | $8,565 | $625,431 | $0 | $633,996 |
All other engagement fees were billed for services in connection with agreed upon procedures and tax compliance for DIMA and other related entities.
Audit Committee Pre-Approval Policies and Procedures. Generally, each Fund’s Audit Committee must pre approve (i) all services to be performed for a Fund by a Fund’s Independent Registered Public Accounting Firm and (ii) all non-audit services to be performed by a Fund’s Independent Registered Public Accounting Firm for the DIMA Entities with respect to operations and financial reporting of the Fund, except that the Chairperson or Vice Chairperson of each Fund’s Audit Committee may grant the pre-approval for non-audit services described in items (i) and (ii) above for non-prohibited services for engagements of less than $100,000. All such delegated pre approvals shall be presented to each Fund’s Audit Committee no later than the next Audit Committee meeting.
There were no amounts that were approved by the Audit Committee pursuant to the de minimis exception under Rule 2-01 of Regulation S-X.
According to the registrant’s principal Independent Registered Public Accounting Firm, substantially all of the principal Independent Registered Public Accounting Firm's hours spent on auditing the registrant's financial statements were attributed to work performed by full-time permanent employees of the principal Independent Registered Public Accounting Firm.
***
In connection with the audit of the 2020 and 2021 financial statements, the Fund entered into an engagement letter with EY. The terms of the engagement letter required by EY, and agreed to by the Audit Committee, include a provision mandating the use of mediation and arbitration to resolve any controversy or claim between the parties arising out of or relating to the engagement letter or services provided thereunder.
***
Pursuant to PCAOB Rule 3526, EY is required to describe in writing to the Fund’s Audit Committee, on at least an annual basis, all relationships between EY, or any of its affiliates, and the DWS Funds, including the Fund, or persons in financial reporting oversight roles at the DWS Funds that, as of the date of the communication, may reasonably be thought to bear on EY’s independence. Pursuant to PCAOB Rule 3526, EY has reported the matters set forth below that may reasonably be thought to bear on EY’s independence. With respect to each reported matter in the aggregate, EY advised the Audit Committee that, after careful consideration of the facts and circumstances and the applicable independence rules, it concluded that the matters do not and will not impair EY’s ability to exercise objective and impartial judgement in connection with the audits of the financial statements for the Fund and a reasonable investor with knowledge of all relevant facts and circumstances would conclude that EY has been and is capable of exercising objective and impartial judgment on all issues encompassed within EY’s audit engagements. EY also confirmed to the Audit Committee that it can continue act as the Independent Registered Public Accounting Firm for the Fund.
| · | EY advised the Fund’s Audit Committee that various covered persons within EY and EY’s affiliates held investments in, or had other financial relationships with, entities within the DWS Funds “investment company complex” (as defined in Regulation S-X) (the “DWS Funds Complex”). EY informed the Audit Committee that these investments and financial relationships were inconsistent with Rule 2-01(c)(1) of Regulation S-X. EY reported that all breaches have been resolved and that none of the breaches involved any professionals who were part of the audit engagement team for the Fund or in the position to influence the audit engagement team for the Fund. |
| | |
| ITEM 5. | AUDIT COMMITTEE OF LISTED REGISTRANTS |
| | |
| | Not applicable |
| | |
| ITEM 6. | SCHEDULE OF INVESTMENTS |
| | |
| | Not applicable |
| | |
| ITEM 7. | DISCLOSURE OF PROXY VOTING POLICIES AND PROCEDURES FOR CLOSED-END MANAGEMENT INVESTMENT COMPANIES |
| | |
| | Not applicable |
| | |
| ITEM 8. | PORTFOLIO MANAGERS OF CLOSED-END MANAGEMENT INVESTMENT COMPANIES |
| | |
| | Not applicable |
| | |
| ITEM 9. | PURCHASES OF EQUITY SECURITIES BY CLOSED-END MANAGEMENT INVESTMENT COMPANY AND AFFILIATED PURCHASERS |
| | |
| | Not applicable |
| | |
| ITEM 10. | SUBMISSION OF MATTERS TO A VOTE OF SECURITY HOLDERS |
| | |
| | There were no material changes to the procedures by which shareholders may recommend nominees to the Fund’s Board. The primary function of the Nominating and Governance Committee is to identify and recommend individuals for membership on the Board and oversee the administration of the Board Governance Guidelines. Shareholders may recommend candidates for Board positions by forwarding their correspondence by U.S. mail or courier service to Keith R. Fox, DWS Funds Board Chair, c/o Thomas R. Hiller, Ropes & Gray LLP, Prudential Tower, 800 Boylston Street, Boston, MA 02199-3600. |
| | |
| ITEM 11. | CONTROLS AND PROCEDURES |
| | |
| | (a) | The Chief Executive and Financial Officers concluded that the Registrant’s Disclosure Controls and Procedures are effective based on the evaluation of the Disclosure Controls and Procedures as of a date within 90 days of the filing date of this report. |
| | |
| | (b) | There have been no changes in the registrant’s internal control over financial reporting that occurred during the period covered by this report that has materially affected, or is reasonably likely to materially affect, the registrant’s internal controls over financial reporting. |
| | |
| ITEM 12. | Disclosure of Securities Lending Activities for Closed-End Management Investment Companies |
| | |
| | Not applicable |
| | |
| ITEM 13. | EXHIBITS |
| | |
| | (a)(1) | Code of Ethics pursuant to Item 2 of Form N-CSR is filed and attached hereto as EX-99.CODE ETH. |
| | |
| | (a)(2) | Certification pursuant to Rule 30a-2(a) under the Investment Company Act of 1940 (17 CFR 270.30a-2(a)) is filed and attached hereto as Exhibit 99.CERT. |
| | |
| | (b) | Certification pursuant to Rule 30a-2(b) under the Investment Company Act of 1940 (17 CFR 270.30a-2(b)) is furnished and attached hereto as Exhibit 99.906CERT. |
SIGNATURES
Pursuant to the requirements of the Securities Exchange Act of 1934 and the Investment Company Act of 1940, the registrant has duly caused this report to be signed on its behalf by the undersigned, thereunto duly authorized.
| Registrant: | DWS Intermediate Tax-Free Fund, a series of Deutsche DWS Tax Free Trust |
| | |
| | |
| By: | /s/Hepsen Uzcan Hepsen Uzcan President |
| | |
| Date: | 7/30/2021 |
Pursuant to the requirements of the Securities Exchange Act of 1934 and the Investment Company Act of 1940, this report has been signed below by the following persons on behalf of the registrant and in the capacities and on the dates indicated.
| By: | /s/Hepsen Uzcan Hepsen Uzcan President |
| | |
| Date: | 7/30/2021 |
| | |
| | |
| | |
| By: | /s/Diane Kenneally Diane Kenneally Chief Financial Officer and Treasurer |
| | |
| Date: | 7/30/2021 |
| | |