Exhibit 99.2
COLONY BANKCROP, INC. Investor Presenttation D e c e m b e r 1 8 , 2 0 1 8
Use ofNon-GAAP Financial Measures This confidential presentation includes certain financial measures that are not measures recognized under U.S. generally accepted accounting principles (“GAAP”) and therefore are considerednon-GAAP financial measures. Colony Bankcorp, Inc.’s (“Colony” or the “Company”) management uses thesenon-GAAP financial measures in their analysis of the Company’s performance, financial condition and the efficiency of its operations. Management believes that thesenon-GAAP financial measures provide a greater understanding of the ongoing operations and enhance comparability of results with prior periods. The Company’s management also believes that investors find thesenon-GAAP financial measures useful as they assist investors in understanding the Company’s underlying operating performance and the analysis of ongoing operating trends. However, thenon-GAAP financial measures discussed herein should not be considered in isolation or as a substitute for the most directly comparable or other financial measures calculated in accordance with GAAP. Moreover, the manner in which the Company calculates thenon-GAAP financial measures discussed herein may differ from the reporting measures with similar names as used by other companies. You should understand how such other banking organizations calculate theirnon-GAAP financial measures with names similar to thenon-GAAP financial measures discussed herein when comparing such information. See “Reconciliation ofNon-GAAP Measures” at the end of this confidential presentation for a reconciliations of thenon-GAAP financial measures to the most directly comparable GAAP financial measures. 1
Cautionary Statements Certain statements contained in this presentation that are not statements of historical fact constitute forward-looking statements within the meaning of the Private Securities Litigation Reform Act of 1995 (the “Act”), notwithstanding that such statements are not specifically identified. In addition, certain statements may be contained in the Company’s future filings with the Securities and Exchange Commission (the “SEC”), in press releases, and in oral and written statements made by or with the approval of the Company that are not statements of historical fact and constitute forward-looking statements within the meaning of the Act. Examples of forward-looking statements include, but are not limited to: (i) projections of revenues, income or loss, earnings or loss per share, the payment or nonpayment of dividends, capital structure and other financial items; (ii) statement of plans and objectives of the Company or its management or Board of Directors, including those relating to products or services; (iii) statements of future economic performance; (iv) statements of the anticipated benefits of the proposed acquisition of LBC Bancshares, Inc. (“LBC”) and the timing of the closing of such acquisition; and (v) statements of assumptions underlying such statements. Words such as “believes,” “anticipates,” “expects,” “intends,” “targeted” and similar expressions are intended to identify forward-looking statements but are not the exclusive means of identifying such statements. Prospective investors are cautioned that any such forward-looking statements are not guarantees of future performance and involve known and unknown risks and uncertainties, including, among others, the Company’s ability to implement its various strategic initiatives and the Company’s ability to consummate its proposed acquisition of LBC and realize the anticipated benefits of such acquisition, which may cause the actual results, performance or achievements of the Company to be materially different from the future results, performance or achievements expressed or implied by such forward-looking statements. Forward-looking statements are based on the information known to, and current beliefs and expectations of, the Company’s management and are subject to significant risks and uncertainties. Actual results may differ materially from those contemplated by such forward-looking statements. A number of factors could cause actual results to differ materially from those contemplated by the forward-looking statements in this press release. Many of these factors are beyond the Company’s ability to control or predict. These forward-looking statements are based upon information presently known to the Company’s management and are inherently subjective, uncertain and subject to change due to any number of risks and uncertainties, including, without limitation, the risks and other factors set forth in the Company’s filings with the SEC, the Company’s Annual Report on Form10-K for the year ended December 31, 2017, under the captions “Forward-Looking Statements and Factors that Could Affect Future Results” and “Risk Factors” and in the Company’s quarterly reports on Form10-Q and current reports on Form8-K. Forward-looking statements speak only as of the date on which such statements are made. The Company undertakes no obligation to update any forward-looking statement to reflect events or circumstances after the date on which such statement is made, or to reflect the occurrence of unanticipated events. Readers are cautioned not to place undue reliance on these forward-looking statements.
Additional Information Participants in the Transaction The Company, LBC and certain of their respective directors and executive officers may be deemed to be participants in the solicitation of proxies from the shareholders of LBC in connection with the proposed transaction. Certain information regarding the interests of these participants and a description of their direct and indirect interests, by security holdings or otherwise, will be included in the proxy statement/prospectus regarding the proposed transaction when it becomes available. Additional information about the Company and its directors and officers may be found in the definitive proxy statement of the Company relating to its 2018 Annual Meeting of Stockholders filed with the SEC on April 20, 2018. The definitive proxy statement can be obtained free of charge from the sources described below. Additional Information about the Merger and Where to Find It This presentation does not constitute an offer to sell or the solicitation of an offer to buy any securities, or a solicitation of any vote or approval, nor shall there be any sale of securities in any jurisdiction in which such offer, solicitation or sale would be unlawful prior to registration or qualification under the securities laws of any such jurisdiction. In connection with the proposed merger of the Company and LBC, the Company will file with the SEC a registration statement on FormS-4 that will include a proxy statement of LBC and a prospectus of the Company, as well as other relevant documents concerning the proposed transaction. WE URGE INVESTORS AND SECURITY HOLDERS TO READ THE REGISTRATION STATEMENT ON FORMS-4, THE PROXY STATEMENT/PROSPECTUS INCLUDED WITHIN THE REGISTRATION STATEMENT ON FORMS-4 AND ANY OTHER RELEVANT DOCUMENTS TO BE FILED WITH THE SEC IN CONNECTION WITH THE PROPOSED MERGER BECAUSE THEY WILL CONTAIN IMPORTANT INFORMATION ABOUT THE COMPANY, LBC AND THE PROPOSED MERGER. The proxy statement/prospectus will be sent to the shareholders of LBC seeking the required shareholder approval. Investors and security holders will be able to obtain free copies of the registration statement on FormS-4 and the related proxy statement/prospectus, when filed, as well as other documents filed with the SEC by the Company through the web site maintained by the SEC at www.sec.gov. Documents filed with the SEC by the Company will also be available free of charge by directing a written request to Colony Bankcorp, Inc., 115 South Grant Street, Fitzgerald, Georgia 31750, Attn: Terry Hester. The Company’s telephone number is (229)426-6000. 3
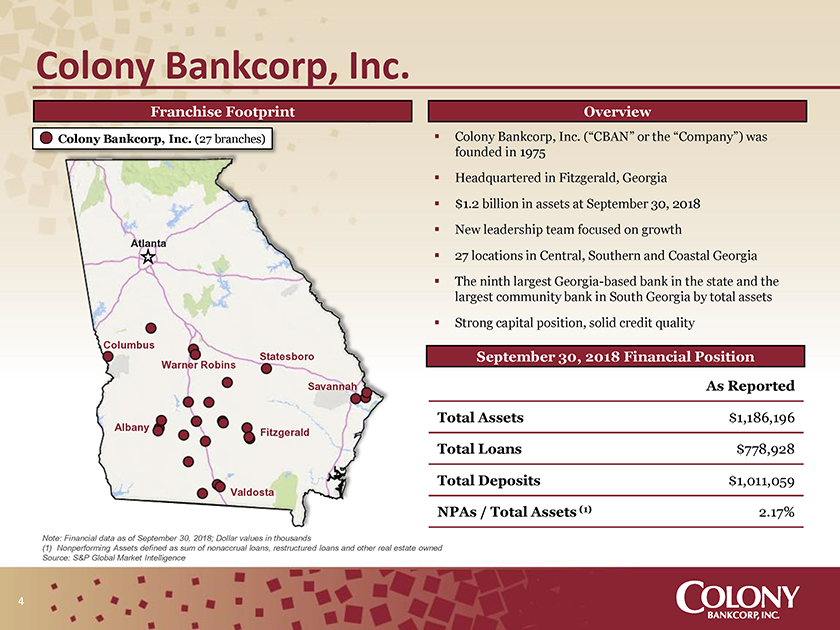
Colony Bankcorp, Inc. Franchise Footprint Overview Colony Bankcorp, Inc. (27 branches)ï,§ Colony Bankcorp, Inc. (“CBAN” or the “Company”) was founded in 1975ï,§ Headquartered in Fitzgerald, Georgiaï,§ $1.2 billion in assets at September 30, 2018ï,§ New leadership team focused on growth Atlanta ï,§ 27 locations in Central, Southern and Coastal Georgiaï,§ The ninth largest Georgia-based bank in the state and the largest community bank in South Georgia by total assetsï,§ Strong capital position, solid credit quality Columbus Statesboro September 30, 2018 Financial Position Warner Robins Savannah As Reported Albany Total Assets $1,186,196 Fitzgerald Total Loans $778,928 Total Deposits $1,011,059 Valdosta NPAs / Total Assets (1) 2.17% Note: Financial data as of September 30, 2018; Dollar values in thousands (1) Nonperforming Assets defined as sum of nonaccrual loans, restructured loans and other real estate owned Source: S&P Global Market Intelligence 4

Key Executive Officers Name / Position Age Background T. Heath Fountain 43 Mr. Thomas Heath Fountain, CPA, has been President and Chief Executive Officer of the President & Chief Executive Company since July 2018. He previously served as Chief Executive Officer of Planters Officer First Bank since July 2015. During his tenure at Planters First Bank, Mr. Fountain led growth initiatives that included adding two new markets, a secondary market mortgage division and increasing loans and deposits over $50 million in three years. Prior to this, Mr. Fountain joined Heritage Financial Group, Inc. (NASDAQ: HBOS) in 2003 where he served as Chief Financial Officer since 2007 as well as Chief Administrative Officer and Executive Vice President since 2011. Mr. Fountain was a key member of Heritage’s executive management team that grew the company from less than $400 million in assets and 6 offices in Albany, GA to $1.8 billion in assets and over 50 offices at the time of its ultimate sale to Renasant Corporation in July 2015. He is a Certified Public Accountant and has an accounting degree from the University of Georgia. Years in Banking: 19 Years at the Company: Joined Colony on July 30, 2018 J. Stan Cook 55 Mr. J. Stan Cook has been Chief Operating Officer and Executive Vice President of the Executive Vice President & Chief Company since May 2016. Mr. Cook joined the Company in July 2012 as a member of the Operating Officer Bank’s senior management team. He was charged with improving the Bank’s operation and information technology systems and preparing the Bank to operate in compliance with the Dodd Frank Act. Prior to his promotion, Mr. Cook served as Director of Operations at the Bank. Previously, Mr. Cook served as Senior Vice President of Retail Banking at Atlantic Southern Bank. Mr. Cook earned his BBA in Finance from Georgia Southern University in 1984 and his MBA from Georgia College and State University in 1991. He also is a 1996 graduate of the LSU Graduate School of Banking. Years in Banking: 34 Years at the Company: 7 5
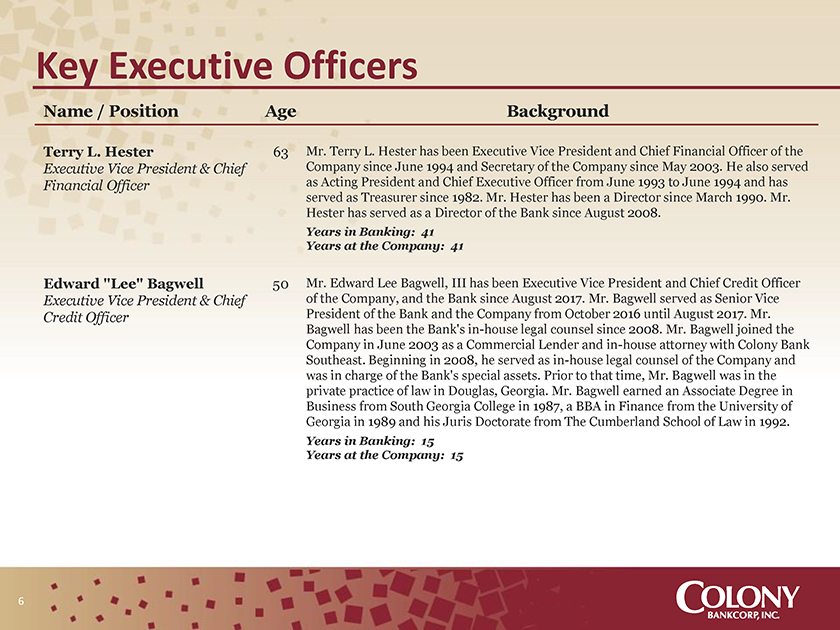
Key Executive Officers Name / Position Age Background Terry L. Hester 63 Mr. Terry L. Hester has been Executive Vice President and Chief Financial Officer of the Executive Vice President & Chief Company since June 1994 and Secretary of the Company since May 2003. He also served Financial Officer as Acting President and Chief Executive Officer from June 1993 to June 1994 and has served as Treasurer since 1982. Mr. Hester has been a Director since March 1990. Mr. Hester has served as a Director of the Bank since August 2008. Years in Banking: 41 Years at the Company: 41 Edward “Lee” Bagwell 50 Mr. Edward Lee Bagwell, III has been Executive Vice President and Chief Credit Officer Executive Vice President & Chief of the Company, and the Bank since August 2017. Mr. Bagwell served as Senior Vice Credit Officer President of the Bank and the Company from October 2016 until August 2017. Mr. Bagwell has been the Bank’sin-house legal counsel since 2008. Mr. Bagwell joined the Company in June 2003 as a Commercial Lender andin-house attorney with Colony Bank Southeast. Beginning in 2008, he served asin-house legal counsel of the Company and was in charge of the Bank’s special assets. Prior to that time, Mr. Bagwell was in the private practice of law in Douglas, Georgia. Mr. Bagwell earned an Associate Degree in Business from South Georgia College in 1987, a BBA in Finance from the University of Georgia in 1989 and his Juris Doctorate from The Cumberland School of Law in 1992. Years in Banking: 15 Years at the Company: 15
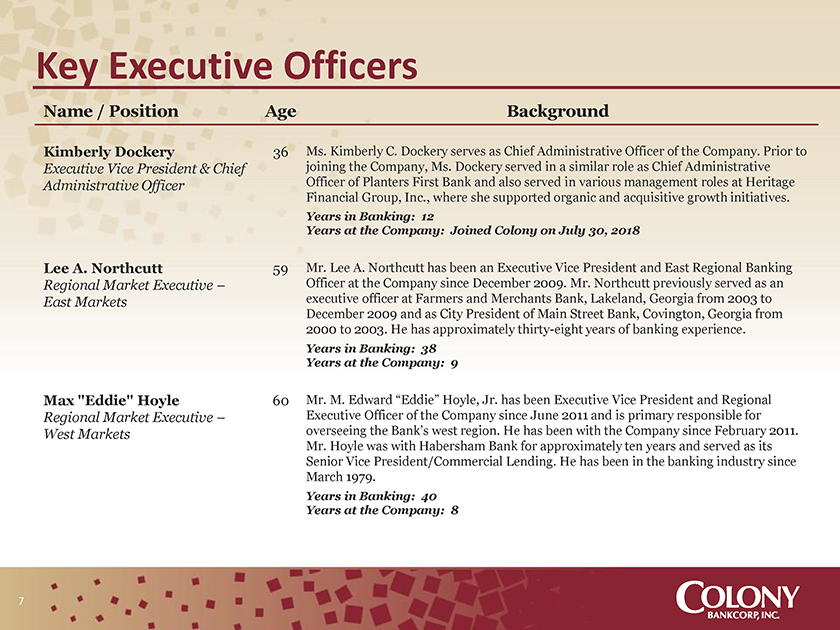
Key Executive Officers Name / Position Age Background Kimberly Dockery 36 Ms. Kimberly C. Dockery serves as Chief Administrative Officer of the Company. Prior to Executive Vice President & Chief joining the Company, Ms. Dockery served in a similar role as Chief Administrative Administrative Officer Officer of Planters First Bank and also served in various management roles at Heritage Financial Group, Inc., where she supported organic and acquisitive growth initiatives. Years in Banking: 12 Years at the Company: Joined Colony on July 30, 2018 Lee A. Northcutt 59 Mr. Lee A. Northcutt has been an Executive Vice President and East Regional Banking Regional Market Executive – Officer at the Company since December 2009. Mr. Northcutt previously served as an East Markets executive officer at Farmers and Merchants Bank, Lakeland, Georgia from 2003 to December 2009 and as City President of Main Street Bank, Covington, Georgia from 2000 to 2003. He has approximately thirty-eight years of banking experience. Years in Banking: 38 Years at the Company: 9 Max “Eddie” Hoyle 60 Mr. M. Edward “Eddie” Hoyle, Jr. has been Executive Vice President and Regional Regional Market Executive – Executive Officer of the Company since June 2011 and is primary responsible for West Markets overseeing the Bank’s west region. He has been with the Company since February 2011. Mr. Hoyle was with Habersham Bank for approximately ten years and served as its Senior Vice President/Commercial Lending. He has been in the banking industry since March 1979. Years in Banking: 40 Years at the Company: 8 7
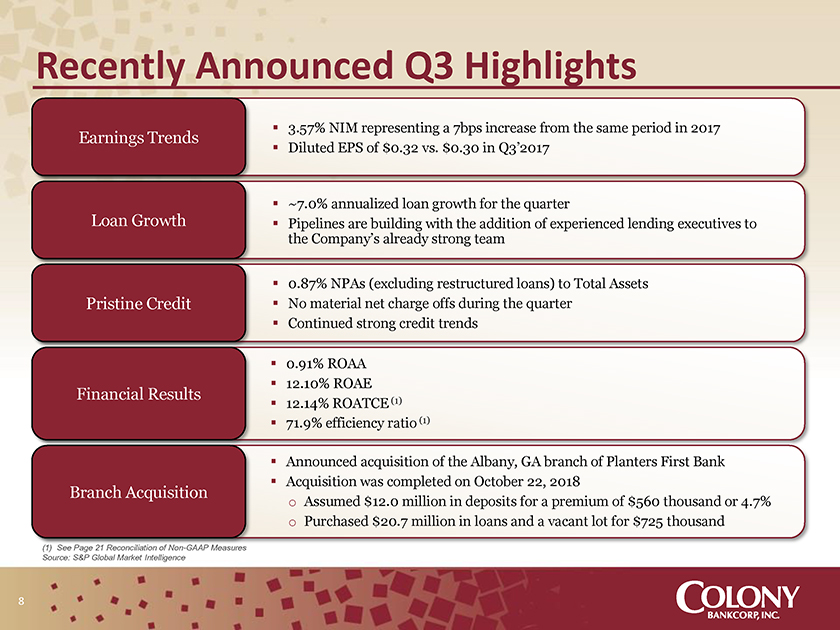
Recently Announced Q3 Highlights ï,§ 3.57% NIM representing a 7bps increase from the same period in 2017 Earnings Trends ï,§ Diluted EPS of $0.32 vs. $0.30 in Q3’2017 ï,§ ~7.0% annualized loan growth for the quarter Loan Growthï,§ Pipelines are building with the addition of experienced lending executives to the Company’s already strong team ï,§ 0.87% NPAs (excluding restructured loans) to Total Assets Pristine Creditï,§ No material net charge offs during the quarterï,§ Continued strong credit trends ï,§ 0.91% ROAAï,§ 12.10% ROAE Financial Results (1) ï,§ 12.14% ROATCEï,§ 71.9% efficiency ratio (1) ï,§ Announced acquisition of the Albany, GA branch of Planters First Bankï,§ Acquisition was completed on October 22, 2018 Branch Acquisition o Assumed $12.0 million in deposits for a premium of $560 thousand or 4.7% o Purchased $20.7 million in loans and a vacant lot for $725 thousand (1) See Page 21 Reconciliation ofNon-GAAP Measures Source: S&P Global Market Intelligence 8
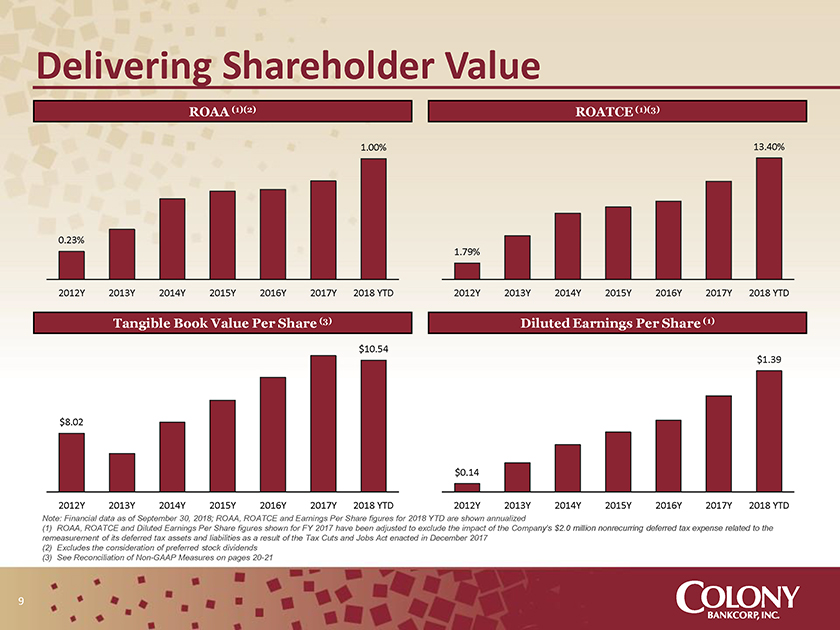
Delivering Shareholder Value ROAA (1)(2) ROATCE (1)(3) 1.00% 13.40% 0.23% 1.79% 2012Y 2013Y 2014Y 2015Y 2016Y 2017Y 2018 YTD 2012Y 2013Y 2014Y 2015Y 2016Y 2017Y 2018 YTD Tangible Book Value Per Share (3) Diluted Earnings Per Share (1) $10.54 $1.39 $8.02 $0.14 2012Y 2013Y 2014Y 2015Y 2016Y 2017Y 2018 YTD 2012Y 2013Y 2014Y 2015Y 2016Y 2017Y 2018 YTD Note: Financial data as of September 30, 2018; ROAA, ROATCE and Earnings Per Share figures for 2018 YTD are shown annualized (1) ROAA, ROATCE and Diluted Earnings Per Share figures shown for FY 2017 have been adjusted to exclude the impact of the Company’s $2.0 million nonrecurring deferred tax expense related to the remeasurement of its deferred tax assets and liabilities as a result of the Tax Cuts and Jobs Act enacted in December 2017 (2) Excludes the consideration of preferred stock dividends (3) See Reconciliation ofNon-GAAP Measures on pages20-21 9
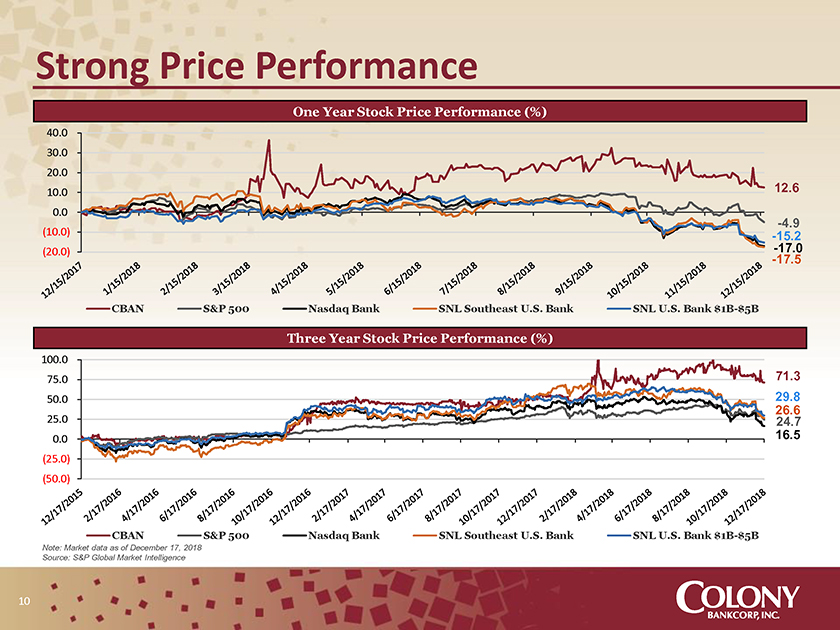
Strong Price Performance One Year Stock Price Performance (%) 40.0 30.0 20.0 10.0 12.6 0.0-4.9 (10.0)-15.2 (20.0)--17 17..5 0 CBAN S&P 500 Nasdaq Bank SNL Southeast U.S. Bank SNL U.S. Bank$1B-$5B Three Year Stock Price Performance (%) 100.0 75.0 71.3 50.0 29.8 25.0 26 24..6 7 0.0 16.5 (25.0) (50.0) CBAN S&P 500 Nasdaq Bank SNL Southeast U.S. Bank SNL U.S. Bank$1B-$5B Note: Market data as of December 17, 2018 Source: S&P Global Market Intelligence 10
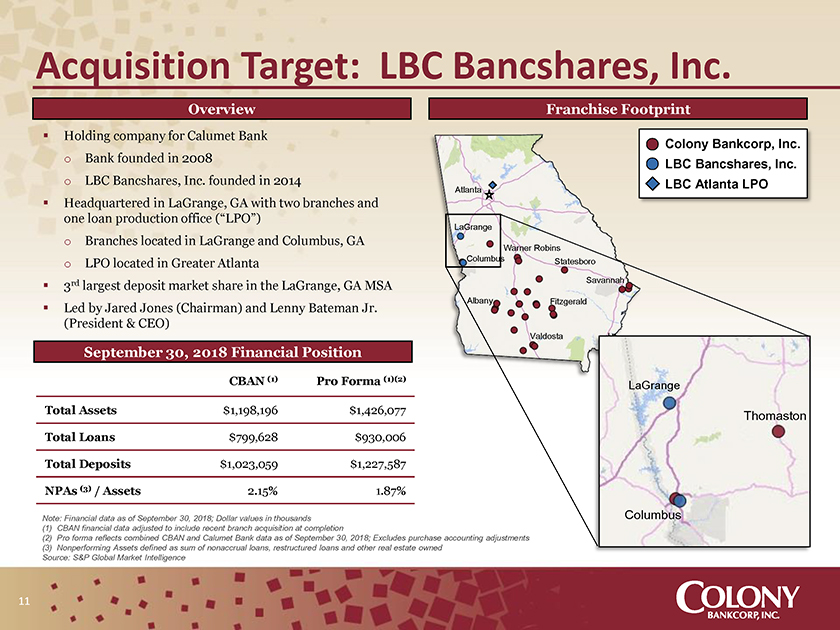
Acquisition Target: LBC Bancshares, Inc. Overview Franchise Footprint ï,§ Holding company for Calumet Bank Colony Bankcorp, Inc. o Bank founded in 2008 LBC Bancshares, Inc. o LBC Bancshares, Inc. founded in 2014 LBC Atlanta LPO Atlanta ï,§ Headquartered in LaGrange, GA with two branches and one loan production office (“LPO”) LaGrange o Branches located in LaGrange and Columbus, GA ColumbusWarner Robins o LPO located in Greater Atlanta Statesboro rd Savannah ï,§ 3 largest deposit market share in the LaGrange, GA MSA Albany Fitzgerald ï,§ Led by Jared Jones (Chairman) and Lenny Bateman Jr. (President & CEO) Valdosta September 30, 2018 Financial Position CBAN (1) Pro Forma (1)(2) LaGrange Total Assets $1,198,196 $1,426,077 Thomaston Total Loans $799,628 $930,006 Total Deposits $1,023,059 $1,227,587 NPAs (3) / Assets 2.15% 1.87% Note: Financial data as of September 30, 2018; Dollar values in thousands Columbus (1) CBAN financial data adjusted to include recent branch acquisition at completion (2) Pro forma reflects combined CBAN and Calumet Bank data as of September 30, 2018; Excludes purchase accounting adjustments (3) Nonperforming Assets defined as sum of nonaccrual loans, restructured loans and other real estate owned Source: S&P Global Market Intelligence

Transaction Rationale ï,§ Natural expansion into logical, contiguous markets in western Georgia o Provides entry into the LaGrange, GA market and strengthens existing footprint in Columbus, GA Strategic Rationale o Creates a more favorable demographic profile for CBAN ï,§ Pro forma Company ranks 3rd and 9th in largest deposit market share for the LaGrange, GA and Columbus, GA markets, respectively ï,§ Projected to be immediately accretive to earnings with a tangible book value dilution (1) Key Transaction Impacts recovery period of less than four years Tier 1 Leverage 9.0% ï,§ Achievable results with conservative Tier 1 RBC 12.5% Attractive Financial projections Total RBC 13.2% 300% CRE Guideline 260.9% Outlookï,§ Pricing is consistent with recent transactions TBV Recovery < 4.0 years for high-performing banks of similar size and 2019 EPS Accretion ~10.3% * geography 2020 EPS Accretion ~17.2% * Partial Year ï,§ Increased scale and capital base to support increased borrower demand ï,§ Creates a more favorable pro forma demographic profile for CBAN by expanding footprint in attractive rural Georgia markets Franchise Well-ï,§ Provides immediate ability to increase scale and build on existing operations in Positioned for Growth western Georgia while also providing access to the Atlanta loan marketï,§ Increased balance sheet and market share can lead to further benefits of scale as well as enhance opportunities for continued growth (1) Estimated impacts based on the transaction terms and assumptions noted on the following pages and provided solely for illustrative purposes Source: S&P Global Market Intelligence 12
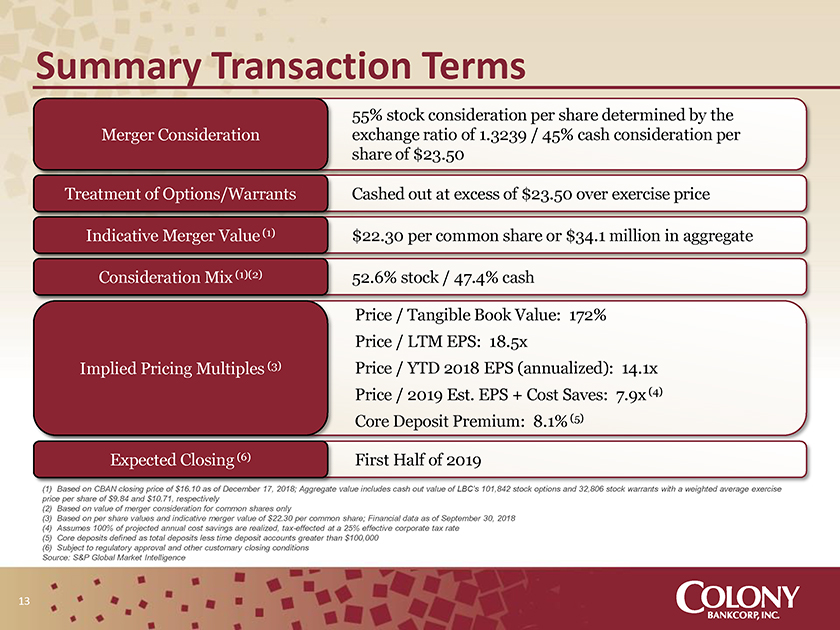
Summary Transaction Terms 55% stock consideration per share determined by the Merger Consideration exchange ratio of 1.3239 / 45% cash consideration per share of $23.50 Treatment of Options/Warrants Cashed out at excess of $23.50 over exercise price Indicative Merger Value (1) $22.30 per common share or $34.1 million in aggregate Consideration Mix (1)(2) 52.6% stock / 47.4% cash Price / Tangible Book Value: 172% Price / LTM EPS: 18.5x Implied Pricing Multiples (3) Price / YTD 2018 EPS (annualized): 14.1x Price / 2019 Est. EPS + Cost Saves: 7.9x (4) Core Deposit Premium: 8.1% (5) Expected Closing (6) First Half of 2019 (1) Based on CBAN closing price of $16.10 as of December 17, 2018; Aggregate value includes cash out value of LBC’s 101,842 stock options and 32,806 stock warrants with a weighted average exercise price per share of $9.84 and $10.71, respectively (2) Based on value of merger consideration for common shares only (3) Based on per share values and indicative merger value of $22.30 per common share; Financial data as of September 30, 2018 (4) Assumes 100% of projected annual cost savings are realized,tax-effected at a 25% effective corporate tax rate (5) Core deposits defined as total deposits less time deposit accounts greater than $100,000 (6) Subject to regulatory approval and other customary closing conditions Source: S&P Global Market Intelligence 13
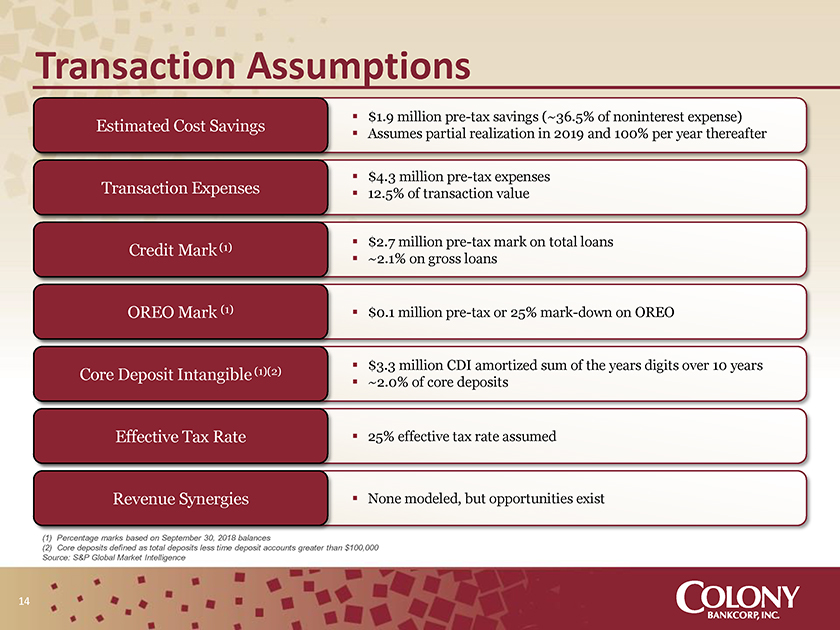
Transaction Assumptions ï,§ $1.9 millionpre-tax savings (~36.5% of noninterest expense) Estimated Cost Savings ï,§ Assumes partial realization in 2019 and 100% per year thereafter ï,§ $4.3 millionpre-tax expenses Transaction Expensesï,§ 12.5% of transaction value (1)ï,§ $2.7 millionpre-tax mark on total loans Credit Mark ï,§ ~2.1% on gross loans OREO Mark (1)ï,§ $0.1 millionpre-tax or 25% mark-down on OREO ï,§ $3.3 million CDI amortized sum of the years digits over 10 years Core Deposit Intangible (1)(2) ï,§ ~2.0% of core deposits Effective Tax Rateï,§ 25% effective tax rate assumed Revenue Synergiesï,§ None modeled, but opportunities exist (1) Percentage marks based on September 30, 2018 balances (2) Core deposits defined as total deposits less time deposit accounts greater than $100,000 Source: S&P Global Market Intelligence 14
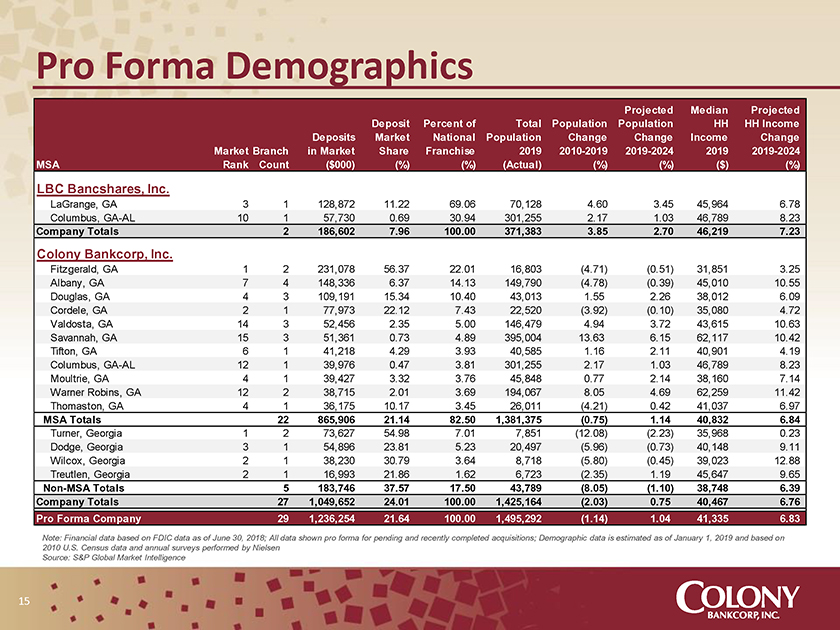
Pro Forma Demographics Projected Median Projected Deposit Percent of Total Population Population HH HH Income Deposits Market National Population Change Change Income Change Market Branch in Market Share Franchise 2019 2010-2019 2019-2024 2019 2019-2024 MSA Rank Count ($000) (%) (%) (Actual) (%) (%) ($) (%) LBC Bancshares, Inc. LaGrange, GA 3 1 128,872 11.22 69.06 70,128 4.60 3.45 45,964 6.78 Columbus,GA-AL 10 1 57,730 0.69 30.94 301,255 2.17 1.03 46,789 8.23 Company Totals 2 186,602 7.96 100.00 371,383 3.85 2.70 46,219 7.23 Colony Bankcorp, Inc. Fitzgerald, GA 1 2 231,078 56.37 22.01 16,803 (4.71) (0.51) 31,851 3.25 Albany, GA 7 4 148,336 6.37 14.13 149,790 (4.78) (0.39) 45,010 10.55 Douglas, GA 4 3 109,191 15.34 10.40 43,013 1.55 2.26 38,012 6.09 Cordele, GA 2 1 77,973 22.12 7.43 22,520 (3.92) (0.10) 35,080 4.72 Valdosta, GA 14 3 52,456 2.35 5.00 146,479 4.94 3.72 43,615 10.63 Savannah, GA 15 3 51,361 0.73 4.89 395,004 13.63 6.15 62,117 10.42 Tifton, GA 6 1 41,218 4.29 3.93 40,585 1.16 2.11 40,901 4.19 Columbus,GA-AL 12 1 39,976 0.47 3.81 301,255 2.17 1.03 46,789 8.23 Moultrie, GA 4 1 39,427 3.32 3.76 45,848 0.77 2.14 38,160 7.14 Warner Robins, GA 12 2 38,715 2.01 3.69 194,067 8.05 4.69 62,259 11.42 Thomaston, GA 4 1 36,175 10.17 3.45 26,011 (4.21) 0.42 41,037 6.97 MSA Totals 22 865,906 21.14 82.50 1,381,375 (0.75) 1.14 40,832 6.84 Turner, Georgia 1 2 73,627 54.98 7.01 7,851 (12.08) (2.23) 35,968 0.23 Dodge, Georgia 3 1 54,896 23.81 5.23 20,497 (5.96) (0.73) 40,148 9.11 Wilcox, Georgia 2 1 38,230 30.79 3.64 8,718 (5.80) (0.45) 39,023 12.88 Treutlen, Georgia 2 1 16,993 21.86 1.62 6,723 (2.35) 1.19 45,647 9.65Non-MSA Totals 5 183,746 37.57 17.50 43,789 (8.05) (1.10) 38,748 6.39 Company Totals 27 1,049,652 24.01 100.00 1,425,164 (2.03) 0.75 40,467 6.76 Pro Forma Company 29 1,236,254 21.64 100.00 1,495,292 (1.14) 1.04 41,335 6.83 Note: Financial data based on FDIC data as of June 30, 2018; All data shown pro forma for pending and recently completed acquisitions; Demographic data is estimated as of January 1, 2019 and based on 2010 U.S. Census data and annual surveys performed by Nielsen Source: S&P Global Market Intelligence 15
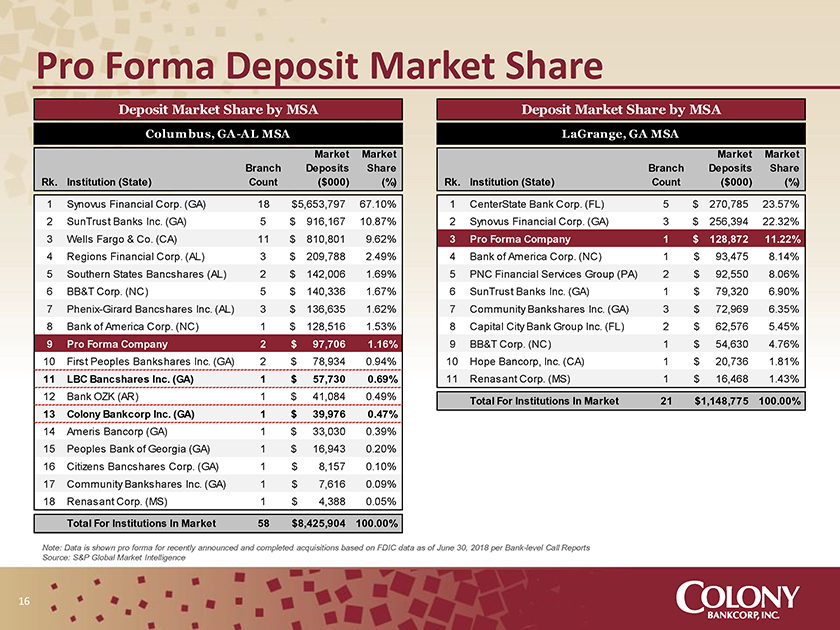
Pro Forma Deposit Market Share Deposit Market Share by MSA Deposit Market Share by MSA Colum bus,GA-AL MSA LaGrange, GA MSA Market Market Market Market Branch Deposits Share Branch Deposits Share Rk. Institution (State) Count ($000) (%) Rk. Institution (State) Count ($000) (%) 1 Synovus Financial Corp. (GA) 18 $5,653,797 67.10% 1 CenterState Bank Corp. (FL) 5 $ 270,785 23.57% 2 SunTrust Banks Inc. (GA) 5 $ 916,167 10.87% 2 Synovus Financial Corp. (GA) 3 $ 256,394 22.32% 3 Wells Fargo & Co. (CA) 11 $ 810,801 9.62% 3 Pro Forma Company 1 $ 128,872 11.22% 4 Regions Financial Corp. (AL) 3 $ 209,788 2.49% 4 Bank of America Corp. (NC) 1 $ 93,475 8.14% 5 Southern States Bancshares (AL) 2 $ 142,006 1.69% 5 PNC Financial Services Group (PA) 2 $ 92,550 8.06% 6 BB&T Corp. (NC) 5 $ 140,336 1.67% 6 SunTrust Banks Inc. (GA) 1 $ 79,320 6.90% 7 Phenix-Girard Bancshares Inc. (AL) 3 $ 136,635 1.62% 7 Community Bankshares Inc. (GA) 3 $ 72,969 6.35% 8 Bank of America Corp. (NC) 1 $ 128,516 1.53% 8 Capital City Bank Group Inc. (FL) 2 $ 62,576 5.45% 9 Pro Forma Company 2 $ 97,706 1.16% 9 BB&T Corp. (NC) 1 $ 54,630 4.76% 10 First Peoples Bankshares Inc. (GA) 2 $ 78,934 0.94% 10 Hope Bancorp, Inc. (CA) 1 $ 20,736 1.81% 11 LBC Bancshares Inc. (GA) 1 $ 57,730 0.69% 11 Renasant Corp. (MS) 1 $ 16,468 1.43% 12 Bank OZK (AR) 1 $ 41,084 0.49% Total For Institutions In Market 21 $1,148,775 100.00% 13 Colony Bankcorp Inc. (GA) 1 $ 39,976 0.47% 14 Ameris Bancorp (GA) 1 $ 33,030 0.39% 15 Peoples Bank of Georgia (GA) 1 $ 16,943 0.20% 16 Citizens Bancshares Corp. (GA) 1 $ 8,157 0.10% 17 Community Bankshares Inc. (GA) 1 $ 7,616 0.09% 18 Renasant Corp. (MS) 1 $ 4,388 0.05% Total For Institutions In Market 58 $8,425,904 100.00% Note: Data is shown pro forma for recently announced and completed acquisitions based on FDIC data as of June 30, 2018 per Bank-level Call Reports Source: S&P Global Market Intelligence 16
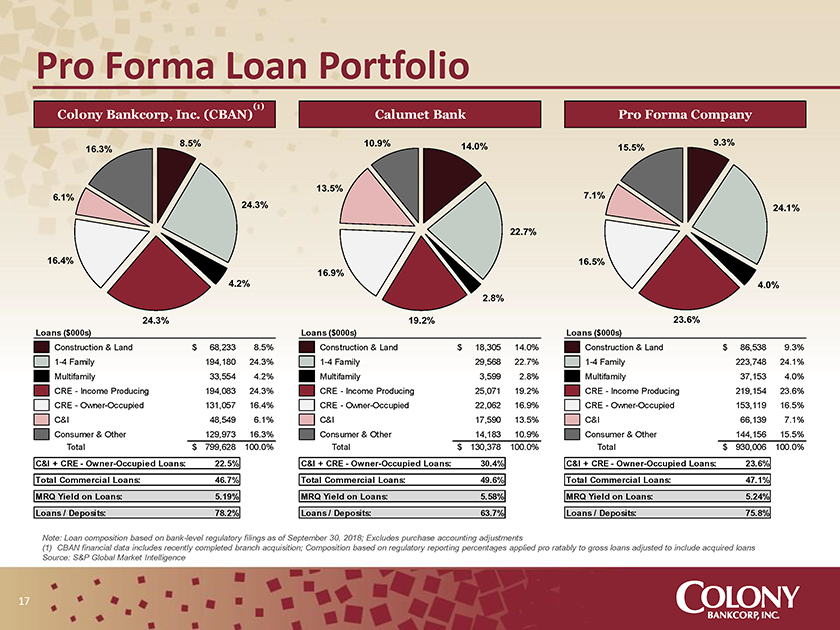
Pro Forma Loan Portfolio (1) Colony Bankcorp, Inc. (CBAN) Calumet Bank Pro Forma Company 8.5% 10.9% 14.0% 9.3% 16.3% 15.5% 13.5% 6.1% 7.1% 24.3% 24.1% 22.7% 16.4% 16.5% 16.9% 4.2% 4.0% 2.8% 24.3% 19.2% 23.6% Loans ($000s) Loans ($000s) Loans ($000s) Construction & Land $ 68,233 8.5% Construction & Land $ 18,305 14.0% Construction & Land $ 86,538 9.3%1-4 Family 194,180 24.3%1-4 Family 29,568 22.7%1-4 Family 223,748 24.1% Multifamily 33,554 4.2% Multifamily 3,599 2.8% Multifamily 37,153 4.0% CRE—Income Producing 194,083 24.3% CRE—Income Producing 25,071 19.2% CRE—Income Producing 219,154 23.6% CRE—Owner-Occupied 131,057 16.4% CRE—Owner-Occupied 22,062 16.9% CRE—Owner-Occupied 153,119 16.5% C&I 48,549 6.1% C&I 17,590 13.5% C&I 66,139 7.1% Consumer & Other 129,973 16.3% Consumer & Other 14,183 10.9% Consumer & Other 144,156 15.5% Total $ 799,628 100.0% Total $ 130,378 100.0% Total $ 930,006 100.0% C&I + CRE—Owner-Occupied Loans: 22.5% C&I + CRE—Owner-Occupied Loans: 30.4% C&I + CRE—Owner-Occupied Loans: 23.6% Total Commercial Loans: 46.7% Total Commercial Loans: 49.6% Total Commercial Loans: 47.1% MRQ Yield on Loans: 5.19% MRQ Yield on Loans: 5.58% MRQ Yield on Loans: 5.24% Loans / Deposits: 78.2% Loans / Deposits: 63.7% Loans / Deposits: 75.8% Note: Loan composition based on bank-level regulatory filings as of September 30, 2018; Excludes purchase accounting adjustments (1) CBAN financial data includes recently completed branch acquisition; Composition based on regulatory reporting percentages applied pro ratably to gross loans adjusted to include acquired loans Source: S&P Global Market Intelligence 17
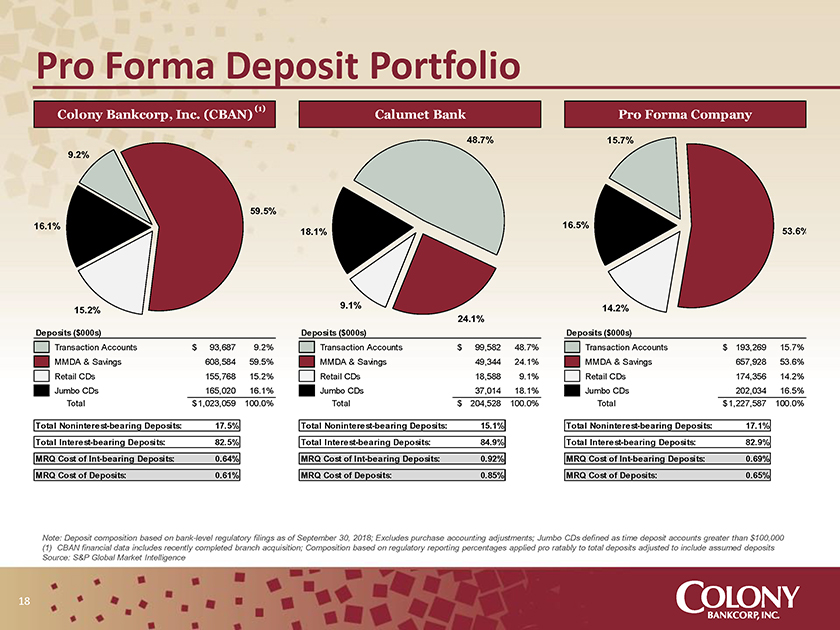
Pro Forma Deposit Portfolio Colony Bankcorp, Inc. (CBAN) (1) Calumet Bank Pro Forma Company 48.7% 15.7% 9.2% 59.5% 16.1% 16.5% 18.1% 53.6% 9.1% 14.2% 15.2% 24.1% Deposits ($000s) Deposits ($000s) Deposits ($000s) Transaction Accounts $ 93,687 9.2% Transaction Accounts $ 99,582 48.7% Transaction Accounts $ 193,269 15.7% MMDA & Savings 608,584 59.5% MMDA & Savings 49,344 24.1% MMDA & Savings 657,928 53.6% Retail CDs 155,768 15.2% Retail CDs 18,588 9.1% Retail CDs 174,356 14.2% Jumbo CDs 165,020 16.1% Jumbo CDs 37,014 18.1% Jumbo CDs 202,034 16.5% Total $ 1,023,059 100.0% Total $ 204,528 100.0% Total $ 1,227,587 100.0% Total Noninterest-bearing Deposits: 17.5% Total Noninterest-bearing Deposits: 15.1% Total Noninterest-bearing Deposits: 17.1% Total Interest-bearing Deposits: 82.5% Total Interest-bearing Deposits: 84.9% Total Interest-bearing Deposits: 82.9% MRQ Cost ofInt-bearing Deposits: 0.64% MRQ Cost ofInt-bearing Deposits: 0.92% MRQ Cost ofInt-bearing Deposits: 0.69% MRQ Cost of Deposits: 0.61% MRQ Cost of Deposits: 0.85% MRQ Cost of Deposits: 0.65% Note: Deposit composition based on bank-level regulatory filings as of September 30, 2018; Excludes purchase accounting adjustments; Jumbo CDs defined as time deposit accounts greater than $100,000 (1) CBAN financial data includes recently completed branch acquisition; Composition based on regulatory reporting percentages applied pro ratably to total deposits adjusted to include assumed deposits Source: S&P Global Market Intelligence 18
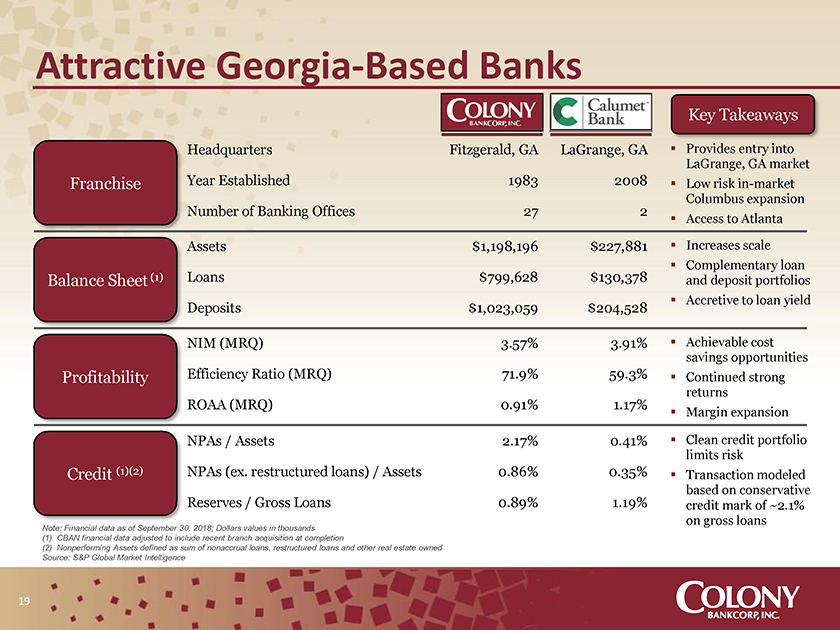
Attractive Georgia-Based Banks Key Takeaways Headquarters Fitzgerald, GA LaGrange, GAï,§ Provides entry into LaGrange, GA market Franchise Year Established 1983 2008ï,§ Low riskin-market Number of Banking Offices 27 2 Columbus expansion ï,§ Access to Atlanta Assets $1,198,196 $227,881ï,§ Increases scale ï,§ Complementary loan Balance Sheet (1) Loans $799,628 $130,378 and deposit portfoliosï,§ Accretive to loan yield Deposits $1,023,059 $204,528 NIM (MRQ) 3.57% 3.91%ï,§ Achievable cost savings opportunities Profitability Efficiency Ratio (MRQ) 71.9% 59.3%ï,§ Continued strong ROAA (MRQ) 0.91% 1.17% returns ï,§ Margin expansion NPAs / Assets 2.17% 0.41%ï,§ Clean credit portfolio limits risk Credit (1)(2) NPAs (ex. restructured loans) / Assets 0.86% 0.35%ï,§ Transaction modeled Reserves / Gross Loans 0.89% 1.19% based on conservative credit mark of ~2.1% on gross loans Note: Financial data as of September 30, 2018; Dollars values in thousands (1) CBAN financial data adjusted to include recent branch acquisition at completion (2) Nonperforming Assets defined as sum of nonaccrual loans, restructured loans and other real estate owned Source: S&P Global Market Intelligence 19
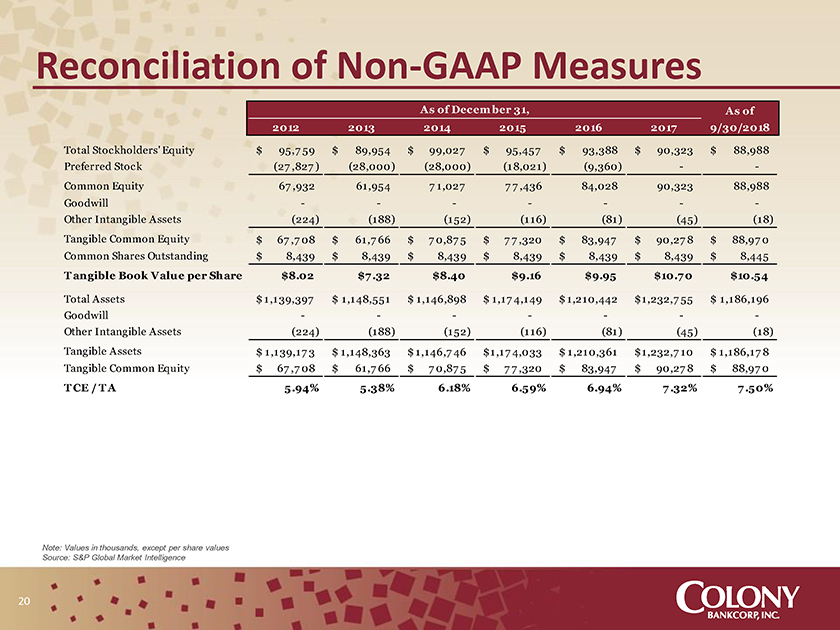
Reconciliation ofNon-GAAP Measures As of Decem ber 31, As of 2012 2013 2014 2015 2016 2017 9/30/2018 Total Stockholders’ Equity $ 95,7 59 $ 89,954 $ 99,027 $ 95,457 $ 93,388 $ 90,323 $ 88,988 Preferred Stock (27 ,827 ) (28,000) (28,000) (18,021) (9,360) —Common Equity 67 ,932 61,954 7 1,027 7 7 ,436 84,028 90,323 88,988 Goodwill — — — -Other Intangible Assets (224) (188) (152) (116) (81) (45) (18) Tangible Common Equity $ 67 ,7 08 $ 61,7 66 $ 7 0,87 5 $ 7 7 ,320 $ 83,947 $ 90,27 8 $ 88,97 0 Common Shares Outstanding $ 8,439 $ 8,439 $ 8,439 $ 8,439 $ 8,439 $ 8,439 $ 8,445 T angible Book Value per Share $8.02 $7 .32 $8.40 $9.16 $9.95 $10.7 0 $10.54 Total Assets $ 1,139,397 $ 1,148,551 $ 1,146,898 $ 1,17 4,149 $ 1,210,442 $1,232,7 55 $ 1,186,196 Goodwill — — — -Other Intangible Assets (224) (188) (152) (116) (81) (45) (18) Tangible Assets $ 1,139,17 3 $ 1,148,363 $ 1,146,7 46 $1,17 4,033 $ 1,210,361 $1,232,7 10 $ 1,186,17 8 Tangible Common Equity $ 67 ,7 08 $ 61,7 66 $ 7 0,87 5 $ 7 7 ,320 $ 83,947 $ 90,27 8 $ 88,97 0 T CE / T A 5.94% 5.38% 6.18% 6.59% 6.94% 7 .32% 7 .50% Note: Values in thousands, except per share values Source: S&P Global Market Intelligence 20
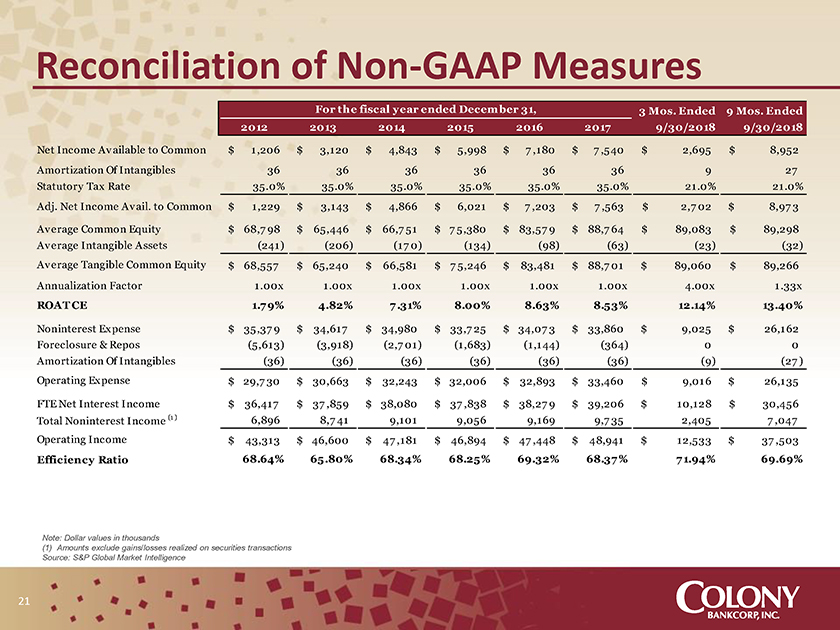
Reconciliation ofNon-GAAP Measures For the fiscal year ended Decem ber 31, 3 Mos. Ended 9 Mos. Ended 2012 2013 2014 2015 2016 2017 9/30/2018 9/30/2018 Net Income Av ailable to Common $ 1,206 $ 3,120 $ 4,843 $ 5,998 $ 7 ,180 $ 7 ,540 $ 2,695 $ 8,952 Amortization Of Intangibles 36 36 36 36 36 36 9 27 Statutory Tax Rate 35.0% 35.0% 35.0% 35.0% 35.0% 35.0% 21.0% 21.0% Adj. Net Income Av ail. to Common $ 1,229 $ 3,143 $ 4,866 $ 6,021 $ 7 ,203 $ 7 ,563 $ 2,7 02 $ 8,97 3 Av erage Common Equity $ 68,7 98 $ 65,446 $ 66,7 51 $ 7 5,380 $ 83,57 9 $ 88,7 64 $ 89,083 $ 89,298 Av erage Intangible Assets (241) (206) (17 0) (134) (98) (63) (23) (32) Av erage Tangible Common Equity $ 68,557 $ 65,240 $ 66,581 $ 7 5,246 $ 83,481 $ 88,7 01 $ 89,060 $ 89,266 Annualization Factor 1.00x 1.00x 1.00x 1.00x 1.00x 1.00x 4.00x 1.33x ROAT CE 1.7 9% 4.82% 7 .31% 8.00% 8.63% 8.53% 12.14% 13.40% Noninterest Expense $ 35,37 9 $ 34,617 $ 34,980 $ 33,7 25 $ 34,07 3 $ 33,860 $ 9,025 $ 26,162 Foreclosure & Repos (5,613) (3,918) (2,7 01) (1,683) (1,144) (364) 0 0 Amortization Of Intangibles (36) (36) (36) (36) (36) (36) (9) (27 ) Operating Expense $ 29,7 30 $ 30,663 $ 32,243 $ 32,006 $ 32,893 $ 33,460 $ 9,016 $ 26,135 FTE Net Interest Income $ 36,417 $ 37 ,859 $ 38,080 $ 37 ,838 $ 38,27 9 $ 39,206 $ 10,128 $ 30,456 Total Noninterest Income (1 ) 6,896 8,7 41 9,101 9,056 9,169 9,7 35 2,405 7 ,047 Operating Income $ 43,313 $ 46,600 $ 47 ,181 $ 46,894 $ 47 ,448 $ 48,941 $ 12,533 $ 37 ,503 Efficiency Ratio 68.64% 65.80% 68.34% 68.25% 69.32% 68.37 % 7 1.94% 69.69% Note: Dollar values in thousands (1) Amounts exclude gains/losses realized on securities transactions Source: S&P Global Market Intelligence 21
COLONY BANKCORP,INC. N a s d a q : C B A N