Washington, D.C. 20549
Indicate by check mark if the registrant is a well-known seasoned issuer, as defined in Rule 405 of the Securities Act:
Indicate by check mark whether any registrant is a large accelerated filer, an accelerated filer, a non-accelerated filer, or a smaller reporting company. (See definition of “large accelerated filer", "accelerated filer" and "smaller reporting company" in Rule 12b-2 of the Exchange Act).
State the aggregate market value of NV Energy, Inc.'s common stock held by non-affiliates. As of June 30, 2009: $ 2,531,506,363
Indicate the number of shares outstanding of each of the issuer’s classes of Common Stock, as of the latest practicable date.
Common Stock, $1.00 par value, of NV Energy, Inc. outstanding at February 19, 2010: 234,843,222 Shares
NV Energy, Inc. is the sole holder of the 1,000 shares of outstanding Common Stock, $1.00 stated value, of Nevada Power Company.
NV Energy, Inc. is the sole holder of the 1,000 shares of outstanding Common Stock, $3.75 par value, of Sierra Pacific Power Company.
Portions of NV Energy, Inc.'s definitive proxy statement to be filed in connection with the annual meeting of shareholders, to be held May 4, 2010, are incorporated by reference into Part III hereof.
This combined Annual Report on Form 10-K is separately filed by NV Energy, Inc., Nevada Power Company and Sierra Pacific Power Company. Information contained in this document relating to Nevada Power Company is filed by NV Energy, Inc. and separately by Nevada Power Company on its own behalf. Nevada Power Company makes no representation as to information relating to NV Energy, Inc. or its subsidiaries, except as it may relate to Nevada Power Company.
Information contained in this document relating to Sierra Pacific Power Company is filed by NV Energy, Inc. and separately by Sierra Pacific Power Company on its own behalf. Sierra Pacific Power Company makes no representation as to information relating to NV Energy, Inc. or its subsidiaries, except as it may relate to Sierra Pacific Power Company.
NV ENERGY, INC.
FORWARD LOOKING STATEMENTS
The discussion of forward looking statements in Item 7, Management’s Discussion and Analysis of Financial Condition and Results of Operations, is incorporated herein by reference.
PART I
NV Energy, Inc., is an investor-owned holding company that was incorporated under Nevada law on December 12, 1983. The company’s stock is traded on the New York Stock Exchange under the symbol “NVE”. NVE’s mailing address is 6226 West Sahara Avenue, Las Vegas, Nevada 89146.
NVE has six primary, wholly-owned subsidiaries: Nevada Power Company d/b/a NV Energy, Sierra Pacific Power Company d/b/a NV Energy, Sierra Pacific Communications, Sierra Pacific Energy Company, NVE Insurance Company, Inc. and Lands of Sierra. References to NVE refer to the consolidated entity, except where the context provides otherwise. NPC and SPPC are referred to collectively in this report as the “Utilities”.
The Utilities operate three business segments, as defined by the Segment Reporting Topic of the FASC: NPC electric; SPPC electric; and SPPC natural gas. Electric service is provided to Las Vegas and surrounding Clark County, and to northern Nevada and the Lake Tahoe area of California. Natural gas service is provided in the Reno-Sparks area of Nevada. The Utilities are the major contributors to NVE’s financial position and results of operations. Other subsidiaries either do not meet the definition of a segment or are below the quantitative threshold for separate segment disclosure and are combined under “all other” in the following pages. Parenthetical references are included after each major section title to identify the specific entity or entities addressed in the section. See Note 2, Segment Information of the Notes to Financial Statements, for further discussion.
NPC is a Nevada corporation organized in 1921 and, by itself and through a predecessor corporation, has been providing electric services to southern Nevada since 1906. NPC became a subsidiary of NVE in July 1999. Its mailing address is 6226 West Sahara Avenue, Las Vegas, Nevada 89146.
NEICO is a wholly-owned subsidiary of NPC. NEICO is a 25% member of Northwind Aladdin, LLC, the other 75% of Northwind Aladdin, LLC is owned by Macquarie Infrastructure Company Trust.
A Nevada corporation since 1965, SPPC was originally incorporated in Maine in 1912. SPPC became a subsidiary of NVE in 1984. Its mailing address is P. O. Box 10100 (6100 Neil Road), Reno, Nevada 89520-0024.
SPPC has three primary, wholly-owned subsidiaries: GPSF-B, PPC and PPIC. GPSF-B, PPC and PPIC, collectively, own Piñon Pine Company, LLC, which was formed to utilize federal income tax credits available under Section 20 of the Internal Revenue Code associated with the alternative fuel (syngas) produced by the coal gasifier located at the Piñon Pine facility.
Periodic reports for NVE, NPC and SPPC on Form 10-K and Form 10-Q and current reports on Form 8-K are made available to the public, free of charge, on NVE’s website (www.nvenergy.com) through links on this website to the SEC’s website at www.sec.gov, as soon as reasonably practicable after they have been filed with the SEC. The contents of the above referenced website address are not part of this Form 10-K. The public may also read any copy of materials filed with the SEC by NVE, NPC or SPPC at the SEC’s Public Reference Room at 100 F Street, NE, Washington, D.C. 20549. Information on the operation of the Public Reference Room may be obtained by calling the SEC at 1-(800) SEC-0030. Reports, proxy and information statements, and other information regarding NVE, NPC and SPPC may also be obtained directly from the SEC’s website. Available on the nvenergy.com website are the code of ethics for the chief executive officer, chief financial officer and controller, charters for the Audit, Compensation, and Nominating and Governance Committees of NVE’s BOD and our corporate governance and standards of conduct guidelines. Printed copies of these documents may be obtained free of charge by writing to NVE’s Corporate Secretary at NV Energy, Inc., 6226 West Sahara Avenue, Las Vegas, Nevada 89146.
Overview
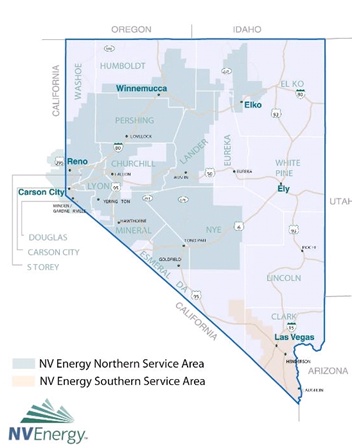
NPC and SPPC are public utilities that generate, transmit and distribute electric energy in Nevada and, in the case of SPPC, also delivers natural gas service. At year-end 2009, NPC served approximately 827,000 electric customers primarily in Las Vegas, North Las Vegas, Henderson and adjoining areas, including Nellis Air Force Base and the DOE’s Nevada Test Site in Nye County. At year end 2009, SPPC served approximately 367,000 electric customers and its electric service territory covered over 50,000 square miles of western, central and northeastern Nevada, including the cities of Reno, Sparks, Carson City, and Elko, and a portion of eastern California, including the Lake Tahoe area. Additionally, SPPC provided natural gas service to approximately 151,000 customers in an area of about 800 square miles in Nevada’s Reno/Sparks area.
Major industries served include gaming/recreation, mining, warehousing/manufacturing and other governmental entities. The Utilities’ revenues and operating income are subject to fluctuations during the year due to the impacts that seasonal weather, rate changes and customer usage patterns have on demand for electric energy and services. NPC is a summer peaking utility, experiencing its highest retail energy sales in response to the demand for air conditioning. SPPC’s electric system peak also occurs in the summer, with a slightly lower peak demand in the winter. SPPC’s gas business typically peaks in the winter months due to heating demands.
NPC and SPPC service territories are as follows:
Beginning in 2007, the Utilities embarked on a three part energy supply strategy to manage resources against our load by encouraging energy efficiency and conservation programs, the purchase and development of renewable energy projects, construction of generating facilities and expanding transmission capability in an effort to reduce our reliance on purchased power.
Energy Efficiency and Conservation Programs
A part of our strategy to reduce dependence on purchased power is to manage our resources against our load requirements with energy efficiency and conservation programs for our customers, also known as DSM programs. NVE has designed a portfolio of cost effective DSM programs that allow every customer to take advantage of savings from energy efficiency measures. DSM programs are marketed across all segments of customer classes (residential, commercial, public and low income).
In 2009, the Utilities invested $60.4 million towards energy efficiency and conservation programs. The Utilities current 2010 budget includes approximately $26.4 million for these programs. However, as discussed further under NPC’s 2009 IRP, NPC has requested approval of an additional $81.7 million for energy efficiency and conservation programs. As such, the budget for 2010 may be revised based on the decision by the PUCN, which is expected in August 2010. Additionally, the final amount may be adjusted by numerous factors, such as the economy, the impact of federal government stimulus legislation, and performance of existing and new programs.
The Portfolio Standard, discussed below, allows energy efficiency measures from qualified conservation programs to meet up to 25% of the Portfolio Standard. A PEC is created for each kWh of energy conserved by qualified energy efficiency programs. Energy saved during peak demand hours earns double the PEC's. After the DSM percentage allowance is fully utilized, NVE’s strategy is to continue to implement cost-effective DSM programs.
In addition, NVE has been awarded a $138 million grant in stimulus funding, made available through the American Recovery and Reinvestment Act, from the DOE specifically for NVE’s $301 million ASD initiative. The ASD initiative will provide NVE with the Smart Grid infrastructure necessary to enable widespread use of smart meters, enabling customers to more directly manage their energy usage. The ASD initiative entails the deployment of a delivery mechanism that sets a new, more capable foundation for NVE’s demand response and energy efficiency and conservation programs.
NVE has submitted a plan in NPC’s 2009 IRP filed in February 2010 with a proposed company investment of $95 million and a demand response program budget of $16 million for the ASD initiative. SPPC’s investment of $50 million is expected to be submitted in its next IRP amendment filing. An additional $2 million within NVE’s capital budget covers energy management system upgrades in 2010.
The Assistance Agreement between NVE and the DOE is currently being negotiated. Upon execution of the agreement, a pilot program will be implemented with the ultimate goal of completing the installation of 1.5 million smart meters throughout the entire state of Nevada by 2012, making Nevada one of the first states to implement a statewide Smart Grid Plan.
Purchase and Development of Renewable Energy Projects
The Utilities have embarked on a strategy to invest in renewable energy that, along with purchased power contracts and an increase in DSM programs, will enhance the opportunity for the Utilities to fully meet the Portfolio Standard as required by Nevada law. The Utilities' compliance with the Portfolio Standard is dependent on the supply of PECs resulting from renewable energy generation and DSM activities. In 2009, legislation was passed in Nevada that permits renewable energy purchased outside Nevada to qualify towards the Portfolio Standard.
Nevada law sets forth the Portfolio Standard requiring providers of electric service to acquire, generate, or save a specific percentage of its total retail energy sales from renewables. Renewables include biomass, geothermal, solar, waterpower and wind and qualified recovered energy generation projects. In 2009 and 2010, the Utilities are required to obtain an amount of PECs equivalent to 12% percent of their total retail energy from renewables. Currently, the Portfolio Standard increases to 15% for 2011 and 2012, to 18% for 2013 and 2014 and reaches 20% in 2015 after which it increases to 22% for the years 2020 through 2024, and to 25% for 2025 and beyond. Moreover, not less than 5% of the total Portfolio Standard must be met from solar resources until 2016 when a minimum of 6% must be solar. Currently, Nevada’s Portfolio Standard is more stringent than current proposed federal legislation.
NPC’s current capital budget includes investing approximately $112.3 million for renewable energy projects through 2011. NPC entered into contracts to either jointly construct or pursue the development of projects using wind, geothermal and recovered energy generation technologies, and in 2009 received PUCN approval to purchase the output from three geothermal plants expanded by 32 MW, an additional 49 MW of output from two new solar projects, and a landfill gas project to be completed in 2010/2011. In 2010, NPC will continue development of these renewable energy projects, conduct additional requests for proposals for renewable energy, and explore other opportunities to add to their supplies of renewable energy and associated PECs.
Construction of Generating Facilities and Expansion of Transmission Capabilities
Since 2004, the Utilities have added approximately 3,260 MW of generating capacity as part of our strategy to become more self sufficient. In 2010, NPC will continue the construction of the 500 MW (nominally rated) natural gas generating station at the existing Harry Allen Generating Station, which is expected to be operational by summer 2011. As a result of this increased generating capacity, the Utilities continue to focus on the optimization of these generating assets.
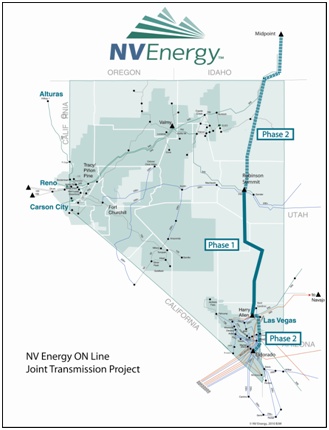
In NPC’s IRP filed in February 2010, it is requesting approval of either of two alternative approaches to completing the ON Line project, which is a 500 kV transmission line from the proposed Robinson Summit Substation near Ely, Nevada to the existing Harry Allen Generating Station located northeast of Las Vegas, Nevada. The preferred plan is the Joint Project among NPC, SPPC and GBT, an affiliate of LS Power. The Utilities have entered into a Memorandum of Understanding and Term Sheet (“MOU”) for the Joint Project that contemplates two phases of development as described in the IRP section. The Joint Project is subject to negotiation of definitive agreements and other conditions, such as PUCN and FERC approvals. The alternative to the Joint Project is for the Utilities' to self build the ON Line. In addition to connecting NVE's northern service territory with its service territory in southern Nevada, the ON Line would also provide access to isolated renewable energy resources in parts of northern and eastern Nevada, which would further advance the Utilities’ ability in meeting its Portfolio Standard, discussed above. See the Transmission section later for a graphical representation of the Joint Project/ON Line.
Business and Competitive Environment
Operations
NPC and SPPC Electric
The Utilities are charged with meeting the energy needs of the residential and business populations, as well as the public sectors in Nevada. Revenues are impacted by rate changes, seasonal or atypical weather and customer use. The Utilities’ electric peak demand occurs in the summer. Therefore, the Utilities’ revenues and associated expenses are not incurred or generated evenly throughout the year.
To serve their customer base, the Utilities generate electricity and purchase power in accordance with an ESP, as discussed in more detail later in this section and in Item 7, Management’s Discussion and Analysis of Financial Condition and Results of Operations, Energy Supply.
SPPC Gas
Gas demand and revenues are very seasonal for SPPC Gas. Average daily temperatures in SPPC's gas service territory range from 71 to 34 degrees Fahrenheit and the average high temperature to low temperature range from 91 to 21 degrees Fahrenheit. This wide temperature swing causes gas volumes to vary substantially depending on the weather.
In spite of price declines during the first half of 2009, natural gas prices, year on year, have trended upward and fluctuated widely, depending on such factors as weather, supply, demand, and the cost of competing fuels. Natural gas supply and demand fundamentals indicate immediate continued volatility. Relatively low-priced sources of fuel continue to be depleted and new supply is expensive to bring on-line. Additionally, gas demand has steadily increased, particularly due to an increase in gas-fired electric generation on a national level.
SPPC is well connected with several major gas producing regions and gas transport systems into northern Nevada. SPPC’s gas distribution system receives gas supplies from two interstate natural gas pipelines, the Paiute Pipeline Company and the TGTC. In addition, SPPC has contracted for natural gas storage services to supplement firm and spot market purchases.
Regulatory Environment
The FERC, PUCN and, in the case of the California electric service territory of SPPC, the CPUC, regulate portions of the Utilities’ accounting practices and electricity and natural gas rates. The FERC has jurisdiction under the Federal Power Act with respect to wholesale rates, service, interconnection, accounting, and other matters in connection with the Utilities sale of electricity for resale and interstate transmission. The FERC also has jurisdiction over the natural gas pipeline companies from which the Utilities buy transportation for natural gas. The PUCN and CPUC have authority over rates charged to retail customers, the issuance of securities and transactions with affiliated parties.
Nevada regulations require the Utilities to file electric GRCs every three years with the PUCN to adjust rates, based primarily on cost of service and return on investment. Nevada state regulations also requires the Utilities to file annual DEAA applications to either recover or refund electric balances that have been deferred and that represent the difference between fuel and purchased power costs actually incurred and the amounts collected in current retail rates. Additionally, the Utilities are required to file to reset BTERs quarterly, reflecting more recent fuel and purchased power costs. Moreover, the 2009 Nevada Legislature passed Senate Bill 358 which requires the PUCN to adopt regulations authorizing an electric utility to recover an amount that is attributable to the measurable and verifiable effects associated with the implementations of efficiency and conservation programs approved by the PUCN. The PUCN has opened a rulemaking docket to develop these regulations.
Nevada regulations require annual filings to reset base purchased gas rates and recover deferred balances that include purchased gas costs above or below amounts collected in current rates. The regulations also require a Gas Supply Report as well as a Gas Informational Report to be filed annually. Natural gas commodity costs are passed directly through to customers on a dollar for dollar basis. SPPC may also file gas GRCs to adjust gas division rates including cost of service and return on investment. Moreover, the 2007 Nevada Legislature passed Senate Bill 437 which allowed gas utility decoupling. The PUCN completed the rulemaking process in 2009 to establish regulations to allow gas utility decoupling. Rate cases are discussed in more detail in Item 7, Management’s Discussion and Analysis of Financial Condition and Results of Operations, Regulatory Proceedings, and Note 3, Regulatory Actions, of the Notes to Financial Statements.
Competition
NPC and SPPC Electric
The Utilities operate under franchise agreements in their respective operating areas; therefore, competition in their operating areas is limited. Under State law, commercial customers with an average annual load of 1 MW or more may file a letter of intent and application with the PUCN to acquire electric energy, capacity, and ancillary services from another provider. The law requires customers wishing to choose a new supplier to receive the approval of the PUCN and meet public interest standards. In particular, departing customers must secure new energy resources that are not under contract to NPC or SPPC, the departure must not burden the Utilities with increased costs or cause any remaining customers to pay increased costs, and the departing customers must pay their portion of any deferred energy balances. The PUCN adopted regulations prescribing the criteria that will be used to determine if there will be negative impacts to remaining customers or to the Utilities. Customers wishing to choose a new supplier must provide 180-day notice to NPC or SPPC. The Utilities would continue to provide transmission, distribution, metering, and billing services to such customers. Management believes that those customers securing energy from new energy suppliers would reduce the Utilities need to purchase power from potentially volatile wholesale energy markets.
The PUCN approved the City of Las Vegas’ application to exit NPC’s system November 1, 2009 in regards to nine premises. The departure is not expected to materially affect NPC’s load requirements, nor impact NPC’s net income. There are no other material applications pending with the PUCN to exit NPC’s service territory.
Newmont achieved full commercial operation of a new 204 MW (nominally rated) coal-fired power plant located in northeastern Nevada on May 1, 2008. In 2007, SPPC and Newmont entered into a wholesale power sale agreement and a new form of retail service, General Service New Generation (GS-4NG). Newmont will sell the electrical output from its plant to SPPC for at least 15 years under the long-term wholesale, purchased power agreement, and remain a retail customer of SPPC during at least that period under the terms of a retail service agreement and pursuant to the new GS-4NG rate schedule.
In 2008, after Barrick Gold Corporation (Barrick) completed its acquisition of the Cortez mining property in Nevada, it applied for and received approval from the PUCN for Cortez to depart SPPC’s retail system and, effective November 1, 2008, to be served under the terms of a DOS Agreement and the applicable DOS Tariff. In 2005, Barrick completed construction of a 118 MW generating facility and departed SPPC’s retail system, but continues to be served under a DOS agreement and applicable tariff.
Currently, there are no other material applications pending with the PUCN to exit the system in SPPC’s service territory.
SPPC Gas
SPPC’s natural gas LDC business is subject to competition from other suppliers and other forms of energy available to its customers. Large gas customers using 12,000 therms per month with fuel switching capability are allowed to participate in the Incentive Natural Gas Rate tariff. Once a service agreement has been executed, a customer can compare natural gas prices under this tariff to alternative energy sources and choose their source of fuel. Additionally, customers using greater than 1,000 therms per day have the ability to secure their own gas supplies. As of January 1, 2010, there were 15 large customers securing their own supplies. These customers have a combined firm distribution load of approximately 5,867 Dth per day. Transportation customers continue to pay firm and interruptible distribution charges. These customers are responsible for procuring and paying for their own gas supply, which reduces SPPC’s purchases, but does not have an impact on net income.
Sales
In 2009, NPC’s and SPPC’s electric revenues were approximately $2.4 billion and $957 million, respectively. SPPC’s natural gas business accounted for approximately $205 million in 2009 operating revenues or 17.7% of SPPC’s total revenues from continuing operations. NPC’s peak electric load increased at an average annual growth rate of 2.4% over the past five years, while SPPC’s decreased by 1.0%. In 2009 NPC’s and SPPC’s electric system peaks were 5,586 MW and 1,554 MW, respectively, compared to 5,504 MW and 1,648 MW, respectively, in 2008. NPC’s retail total electric MWh sales have increased at an average annual growth rate of 2.4% over the past five years; however, retail electric MWh sales declined slightly from 2008 to 2009, as discussed below. SPPC’s retail total electric MWh sales have decreased at an average annual rate of 2.2% over the past five years primarily due to a decrease in mining customers discussed below.
NPC’s electric customers by class contributed the following MWh sales:
| | | MWh Sales (Billed and Unbilled) | |
| | | 2009 | | | 2008 | | | 2007 | |
| | | MWh | | | % of Total | | | MWh | | | % of Total | | | MWh | | | % of Total | |
| Retail: | | | | | | | | | | | | | | | | | | |
| Residential | | | 8,893,542 | | | | 41.8 | % | | | 9,041,403 | | | | 41.7 | % | | | 9,371,726 | | | | 42.8 | % |
| | | | | | | | | | | | | | | | | | | | | | | | | |
| Commercial & Industrial: | | | | | | | | | | | | | | | | | | | | | | | | |
| Gaming/Recreation/Restaurants | | | 3,392,658 | | | | 16.0 | % | | | 3,695,156 | | | | 17.0 | % | | | 3,697,324 | | | | 16.8 | % |
| All Other Retail | | | 8,670,931 | | | | 40.8 | % | | | 8,644,314 | | | | 39.8 | % | | | 8,551,874 | | | | 39.0 | % |
| Total Retail | | | 20,957,131 | | | | 98.6 | % | | | 21,380,873 | | | | 98.5 | % | | | 21,620,924 | | | | 98.6 | % |
| | | | | | | | | | | | | | | | | | | | | | | | | |
| Wholesale | | | 69,915 | | | | 0.3 | % | | | 83,123 | | | | 0.4 | % | | | 76,499 | | | | 0.3 | % |
| Sales to Public Authorities | | | 240,302 | | | | 1.1 | % | | | 231,647 | | | | 1.1 | % | | | 252,119 | | | | 1.1 | % |
| Total | | | 21,267,348 | | | | 100.0 | % | | | 21,695,643 | | | | 100.0 | % | | | 21,949,542 | | | | 100.0 | % |
Total retail MWh sales decreased approximately 2.0% in 2009 from 2008, primarily due to a decrease in customer usage which may be attributable to the economic declines, discussed below, and/or conservation efforts. NPC’s average retail residential customer count increased by 0.1% in 2009 from 2008.
The economy in southern Nevada has been adversely affected by the U.S. and global recessionary environment in 2009, resulting in decelerated customer growth compared to prior years when Nevada was experiencing high customer growth. Tourism and gaming remain southern Nevada’s leading industries, driving construction activity, the housing market and employment in the region, and together comprising one of NPC’s largest classes of customers. Management continues to monitor hotel room additions and the hotel/motel occupancy rate in Las Vegas. As of December 2009, the hotel/motel occupancy rate has decreased approximately 2.0% from a year ago. The estimated hotel/motel room growth rate for 2009 was 6.1%, concentrated primarily in City Center which added approximately 6,000 rooms. In 2010, hotel/motel room growth is expected to be 2.7% and then slow to 0.1% in 2011. The expected increase in hotel/motel room growth for 2010 is primarily due to The Cosmopolitan Resort & Casino, which is expected to add approximately 3,000 rooms to Las Vegas. Gaming properties in southern Nevada are experiencing financial problems, including difficulties meeting debt payments, bankruptcies and delays or termination of construction projects which may further decrease the projected growth in rooms or offset any increases. The unemployment rate in Nevada continues to increase. As of December 2009, the unemployment rate was 13.0% compared to 8.4% in 2008. Construction employment has decreased 27.2% from December 2008, when approximately 87,000 people were employed, to December 2009, when approximately 63,000 people were employed. Other economic conditions affecting Nevada include the national decrease in real estate activity, which makes it more difficult for individuals and business to sell their properties in order to relocate to Nevada. These factors, among other items, are considered and evaluated by management in assessing load forecast.
SPPC’s electric customers by class contributed the following MWh sales:
| | | MWh Sales (Billed and Unbilled) | |
| | | 2009 | | | 2008 | | | 2007 | |
| | | MWh | | | % of Total | | | MWh | | | % of Total | | | MWh | | | % of Total | |
| Retail: | | | | | | | | | | | | | | | | | | |
| Residential | | | 2,502,537 | | | | 30.6 | % | | | 2,523,923 | | | | 29.4 | % | | | 2,519,666 | | | | 28.6 | % |
| Mining | | | 1,405,087 | | | | 17.1 | % | | | 1,632,882 | | | | 19.0 | % | | | 1,742,641 | | | | 19.8 | % |
| Commercial and Industrial | | | 4,254,749 | | | | 51.9 | % | | | 4,403,403 | | | | 51.2 | % | | | 4,510,825 | | | | 51.2 | % |
| Total Retail | | | 8,162,373 | | | | 99.6 | % | | | 8,560,208 | | | | 99.6 | % | | | 8,773,132 | | | | 99.6 | % |
| | | | | | | | | | | | | | | | | | | | | | | | | |
| Wholesale | | | 14,993 | | | | 0.2 | % | | | 15,577 | | | | 0.2 | % | | | 15,441 | | | | 0.2 | % |
| Streetlights | | | 16,535 | | | | 0.2 | % | | | 16,108 | | | | 0.2 | % | | | 15,943 | | | | 0.2 | % |
| TOTAL | | | 8,193,901 | | | | 100.0 | % | | | 8,591,893 | | | | 100.0 | % | | | 8,804,516 | | | | 100.0 | % |
Total retail MWh sales decreased approximately 4.6% in 2009 from 2008, primarily due to a decrease in customer usage as a result of cooler summer weather and, to a lesser extent, changes in customer usage patterns. Also contributing to the decrease in MWhs in 2009, compared to 2008 and 2007, is the transition of certain customers to DOS as discussed below.
Mining is a leading industry in northern Nevada and comprises one of SPPC’s largest classes of customers. According to the Nevada Mining Association, spot gold price levels, coupled with Nevada’s reasonable regulatory environment, the State’s favorable geology for gold deposits, and the industry’s success in controlling its costs and attracting a high quality labor force offer a strong foundation for investment in continued mine development and the industry’s continuing high level of energy usage. However, SPPC has seen a decline in mining MWhs as a result of certain customers transferring to DOS.
The economy in SPPC’s service territory has been adversely affected by U.S. and global recessionary environment in 2009. The unemployment rate in Washoe County, which is a majority of SPPC’s service territory, was at 12.7% as of December 2009. Construction employment has decreased 26.5% from December 2008 when approximately 14,000 people were employed compared to December 2009, when approximately 10,000 people were employed. Furthermore, taxable sales have decreased 13% and gaming revenue decreased 4.2% as of November 2009 compared to November 2008.
SPPC has long-term electric service agreements with eight of its largest commercial and industrial customers, with yearly revenues under these agreements totaling approximately $59 million. For 2009, this represented approximately 6.2% of SPPC’s electric operating revenues of approximately $957 million. Such agreements include requirements for customers to maintain minimum demand and load factor levels. In addition, they include provisions to recover all investments for customer-specific facilities that have been made by SPPC on their behalf. Commercial customers who receive approval from the PUCN to acquire electric energy, capacity, and ancillary services from another provider, and who may have previously received service from SPPC under terms of a long-term service agreement, will migrate to being served under the provisions of a DOS agreement. Under a DOS agreement, customer-specific facilities charges will continue to be collected along with a flat distribution charge per meter.
The statistical data provided above or used throughout this 2009 Form 10-K are based upon independent industry publications, government publications, reports by market research firms or other published independent sources. We did not commission any of these publications or reports. These publications generally state that they have obtained information from sources believed to be reliable, but do not guarantee the accuracy or completeness of such information. While we believe that each of these studies and publications is reliable, we have not independently verified such data and make no representation as to the accuracy of such information.
Demand
Load and Resources Forecast
NPC’s integrated peak electric demand increased in 2009 to 5,586 MW from 5,504 MW in 2008. SPPC’s integrated peak electric demand decreased in 2009 to 1,554 MWs from 1,648 MWs in 2008. Variations in energy usage occur as a result of varying weather conditions, economic conditions, and other energy usage behaviors, such as conservation efforts by our customers. This necessitates a continual balancing of loads and resources, and requires both purchases and sales of energy under short and long-term contracts and the prudent management and optimization of available resources.
The Utilities plan to meet their customers’ needs through a combination of company-owned-generation and purchased power. See the Generation section and Purchased Power section below for details of the Utilities’ generation and contracts for purchased power. Remaining needs will be met through power purchases through RFPs or short-term purchases.
Below are tables summarizing the forecasted summer electric capacity requirement and resource needs of the Utilities after consideration of energy conservation programs (assuming no curtailment of supply or load, and normal weather conditions):
| NPC | | | |
| | | Forecasted Electric Capacity | |
| | | Requirements and Resources (MW) | |
| | | 2010 | | | 2011 | | | 2012 | | | 2013 | | | 2014 | |
| | | | | | | | | | | | | | | | |
Total requirements (1) | | | 6,375 | | | | 6,341 | | | | 6,304 | | | | 6,289 | | | | 6,353 | |
| | | | | | | | | | | | | | | | | | | | | |
| Resources: | | | | | | | | | | | | | | | | | | | | |
Company-owned existing generation (2) | | | 4,236 | | | | 4,236 | | | | 4,236 | | | | 4,231 | | | | 4,231 | |
Company-owned new generation (3) | | | - | | | | 489 | | | | 489 | | | | 489 | | | | 489 | |
| Contracts for power purchases | | | 2,101 | | | | 1,653 | | | | 1,659 | | | | 1,651 | | | | 1,556 | |
| Total resources | | | 6,337 | | | | 6,378 | | | | 6,384 | | | | 6,371 | | | | 6,276 | |
| | | | | | | | | | | | | | | | | | | | | |
Total additional required (4) | | | 38 | | | | - | | | | - | | | | - | | | | 77 | |
| (1) | Includes system peak load plus 12% planning reserves. The decrease in total requirements from 2010 to 2013 is primarily due to an increase in conservation programs. |
| (2) | Includes 232 MWs of peaking capacity at Reid Gardner Generating Station Unit No. 4, which is co-owned with CDWR, see Item 2, Properties. |
| (3) | Includes 484 MWs combined cycle unit at the Harry Allen Generating Station in 2011, and 5 MWs at the Goodsprings renewable energy plant in 2011. |
| (4) | Total additional required is the difference between the total requirements and total resources. Total additional required represents the amount needed to achieve the forecasted system peak plus a planning reserve margin. |
| SPPC | | | |
| | | Forecasted Electric Capacity | |
| | | Requirements and Resources (MW) | |
| | | 2010 | | | 2011 | | | 2012 | | | 2013 | | | 2014 | |
| | | | | | | | | | | | | | | | |
Total requirements (1) | | | 1,807 | | | | 1,794 | | | | 1,815 | | | | 1,829 | | | | 1,846 | |
| | | | | | | | | | | | | | | | | | | | | |
| Resources: | | | | | | | | | | | | | | | | | | | | |
| Company-owned existing generation | | | 1,577 | | | | 1,577 | | | | 1,567 | | | | 1,567 | | | | 1,504 | |
| Contracts for power purchases | | | 357 | | | | 387 | | | | 392 | | | | 275 | | | | 275 | |
| Total resources | | | 1,934 | | | | 1,964 | | | | 1,959 | | | | 1,842 | | | | 1,779 | |
| | | | | | | | | | | | | | | | | | | | | |
Total additional required (2) | | | - | | | | - | | | | - | | | | - | | | | 67 | |
| (1) | Includes system peak load plus 15% planning reserves. The decrease in total requirements from 2010 to 2011 is due to an increase in conservation programs. |
| (2) | Total additional required represents the difference between the total requirements and total resources. Total additional required represents the amount needed to achieve the forecasted system peak plus a planning reserve margin. |
Energy Supply
The energy supply function at the Utilities encompasses the reliable and efficient operation of the Utilities’ owned generation, the procurement of all fuels and purchased power, and resource optimization.
The Utilities face energy supply challenges for their load control area. There is the potential for continued price volatility in the Utilities’ service territory, particularly during peak periods. A greater dependence on generation from the wholesale markets subjects power prices to price volatilities due to available supply and gas prices.
In response to these energy supply challenges, the Utilities have adopted an approach to managing the energy supply function that has three primary elements. The first element is a set of management guidelines that relate to procuring and optimizing the supply portfolio that is consistent with the requirements of a load serving entity with a full requirements obligation. The second element is an energy risk management and risk control approach that ensures clear separation of roles between the day-to-day management of risks and compliance monitoring and control, and a clear distinction between policy setting (or planning) and execution. Lastly, the Utilities will continue to pursue a process of ongoing regulatory involvement and acknowledgement of the resource portfolio management plans. Details of the Energy Supply function are discussed in Item 7, Management’s Discussion and Analysis of Financial Condition and Results of Operations, Energy Supply.
Total System
The Utilities manage a portfolio of energy supply options. The availability of alternate resources allows the Utilities to dispatch their electric generation system in a more cost-effective manner under varying operating and fuel market conditions while maintaining system integrity. As shown below, during 2009, NPC generated approximately 74.2% of its total system requirements, purchasing the remaining 25.8%, and SPPC generated 62.9% of its total electric energy requirements, purchasing the remaining 37.1%.
NPC
| | | 2009 | | | 2008 | | | 2007 | |
| | | MWh | | | % of Total | | | MWh | | | % of Total | | | MWh | | | % of Total | |
| NPC Company Generation | | | | | | | | | | | | | | | | | | |
| Gas/Oil | | | 12,793,249 | | | | 57.8 | % | | | 10,976,006 | | | | 49.5 | % | | | 10,437,115 | | | | 45.3 | % |
| Coal | | | 3,632,385 | | | | 16.4 | % | | | 3,992,392 | | | | 18.0 | % | | | 4,083,262 | | | | 17.7 | % |
| Total Generated | | | 16,425,634 | | | | 74.2 | % | | | 14,968,398 | | | | 67.5 | % | | | 14,520,377 | | | | 63.0 | % |
| | | | | | | | | | | | | | | | | | | | | | | | | |
| Total Purchased | | | 5,696,555 | | | | 25.8 | % | | | 7,190,431 | | | | 32.5 | % | | | 8,510,429 | | | | 37.0 | % |
| | | | | | | | | | | | | | | | | | | | | | | | | |
| Total System | | | 22,122,189 | | | | 100 | % | | | 22,158,829 | | | | 100.0 | % | | | 23,030,806 | | | | 100.0 | % |
SPPC
| | | 2009 | | | 2008 | | | 2007 | |
| | | MWh | | | % of Total | | | MWh | | | % of Total | | | MWh | | | % of Total | |
| SPPC Company Generation | | | | | | | | | | | | | | | | | | |
| Gas/Oil | | | 3,852,662 | | | | 43.4 | % | | | 2,819,767 | | | | 30.7 | % | | | 2,282,636 | | | | 24.3 | % |
| Coal | | | 1,729,466 | | | | 19.5 | % | | | 1,812,918 | | | | 19.8 | % | | | 1,705,789 | | | | 18.1 | % |
| Hydro | | | - | | | | N/A | | | | - | | | | N/A | | | | 43,577 | | | | 0.5 | % |
| Total Generated | | | 5,582,128 | | | | 62.9 | % | | | 4,632,685 | | | | 50.5 | % | | | 4,032,002 | | | | 42.9 | % |
| | | | | | | | | | | | | | | | | | | | | | | | | |
| Total Purchased | | | 3,296,482 | | | | 37.1 | % | | | 4,547,062 | | | | 49.5 | % | | | 5,376,364 | | | | 57.1 | % |
| | | | | | | | | | | | | | | | | | | | | | | | | |
| Total System | | | 8,878,610 | | | | 100 | % | | | 9,179,747 | | | | 100.0 | % | | | 9,408,366 | | | | 100.0 | % |
As a supplement to their own generation, the Utilities purchase spot, firm and non-firm energy to meet its customer demand requirements. Total energy supply includes purchases from outside the electric system due to limited control area generation and also the need to access market energy supplies. The Utilities decision to purchase this energy is based on economics, mitigation of availability risk, and system import limits. Firm block purchases are transacted as both a price hedging strategy and to ensure that needed firm capacity is available over peak load periods. Spot market energy is purchased based on the economics of purchasing “as-available” energy when it is less expensive than the Utilities own generation, again, subject to net system import limits.
NPC’s 2009 company generated MWhs increased 9.7% from 2008. NPC’s 2009 purchased power MWhs decreased 20.8% compared to 2008 due to NPC’s increased reliance on self generation and a slight decrease in total system demand. SPPC’s 2009 company generation increased 20.5% compared to 2008. SPPC’s 2009 purchased power MWhs decreased 27.5% compared to 2008 due to SPPC’s increased reliance on self generation and a decrease in total demand. See Energy Supply in Management’s Discussion and Analysis of Financial Condition and Results of Operations for additional information regarding the Utilities’ purchasing strategies.
Risk Management
See Item 7, Management’s Discussion and Analysis of Financial Conditions and Results of Operations, Energy Supply (Utilities), for discussion regarding energy risk management and control, and Item 7A, Quantitative and Qualitative Disclosures About Market Risk.
Generation
NPC continues construction of a 500 MW (nominally rated) natural gas generating station at the existing Harry Allen Generating Station, which is expected to be operational by summer 2011.
NPC’s generation capacity consists of a combination of 42 gas, oil and coal generating units with a combined summer capacity of 4,004 MWs as described in Item 2, Properties. In 2009, NPC generated approximately 74.2% of its total system requirements.
SPPC’s generation capacity consists of a combination of 35 gas, oil and coal generating units with a combined summer capacity of 1,577 MWs as described in Item 2, Properties. In 2009, SPPC generated approximately 62.9% of its total system requirements.
Fuel Sources
The Utilities’ 2009 fuel sources for electric generation were provided by natural gas, coal, and oil. The average costs of gas, coal, and oil, including hedging costs, for energy generation per MMBtu for the years 2005 through 2009, along with the percentage contribution to the Utilities’ total fuel sources were as follows:
NPC Electric
| | Average Consumption Cost & Percentage Contribution to Total Fuel | |
| | Gas | | Coal | | Oil |
| | $/MMBtu | Percent | | $/MMBtu | Percent | | $/MMBtu | Percent |
| 2009 | 5.09 | 71.8% | | 2.23 | 28.2% | | 10.34 | 0.0% |
| 2008 | 7.79 | 66.5% | | 2.17 | 33.5% | | 18.87 | 0.0% |
| 2007 | 6.32 | 64.4% | | 1.89 | 35.6% | | 17.17 | 0.0% |
| 2006 | 7.40 | 58.8% | | 1.63 | 41.1% | | 16.66 | 0.1% |
| 2005 | 6.18 | 32.8% | | 1.59 | 67.1% | | 13.50 | 0.1% |
For a discussion of the change in fuel costs, see Results of Operations in Item 7, Management’s Discussion and Analysis of Financial Condition and Results of Operations.
2009 was a transition period in which NPC moved from a one season ahead competitive bidding process to a laddering strategy in which physical gas supplies are procured up to three seasons ahead through two seasonal competitive bidding processes. Although NPC has actively requested fixed price physical gas supplies, no such fixed price transactions were executed during 2009. Therefore, the physical gas prices are set at an appropriate industry index during the month of current delivery. All natural gas is delivered to NPC through the use of firm gas transport contracts. Monthly and daily gas supply adjustments are made based on the current energy marketplace and operational considerations.
NPC continues to optimize the use of the Lenzie Generating Station, Higgins Generating Station, and Silverhawk Generating Station. These units are more efficient than most generating facilities supplying energy to the market in which NPC purchases energy and, consequently, will require less fuel to produce the same amount of electric energy.
NPC utilizes a laddered strategy with respect to coal supply and has long term coal contracts with Arch Coal Company (expires 2011), Andalex Resources, Inc. (expires 2010), and Bowie Resources (expires 2010) to supply the Reid Gardner Generating Station. These contracts represent 40% of projected coal requirements for 2010 and 20% for 2011. New sources of coal supply such as Powder River Basin coal for test burns were tested and qualified for use in 2009, with negotiations with suppliers currently underway. The availability of Powder River Basin coal is such that it allows for updated laddering strategies to be applied.
As of December 31, 2009, Reid Gardner Generating Station’s coal inventory level was 255,639 tons, or approximately 82 days of consumption at 100% capacity.
A transportation services contract with Union Pacific Railroad provides for deliveries from the Provo, Utah interchange, as well as various mines in Utah and Colorado, to the Reid Gardner Generating Station in Moapa, Nevada. The Utah Railway contract provides for delivery of all coal not loaded by the Union Pacific in Helper, Utah to interchange with Union Pacific at Provo, Utah. The contract which expired on December 31, 2009 has been extended until March 31, 2010 to allow for final negotiations of a replacement contract.
Coal for the Navajo Generating Station, which is jointly owned by several entities and operated by Salt River, is obtained from surface mining operations conducted by Peabody on portions of the Black Mesa in Arizona within the Navajo and Hopi Indian tribes (the Tribes) reservations. The Navajo Generating Station's supply contract expires June 2011, with an option provided to NPC to extend for an additional 15 years.
Listed below is NPC’s transportation portfolio as of December 31, 2009:
| Firm Transportation Capacity | | Dth per day firm | | Term |
| Forward Haul Capacity -Interstate | | | | |
| Kern River | | 50,000 | | | (Apr - Oct) |
| Kern River | | 157,208 | | | (Annual) |
| Backhaul Capacity-Interstate | | | | | |
| Kern River | | 400,000 | | | (Annual) |
| | | | | | |
| Forward Haul Capacity -Intrastate | (LVCo-Gen/Clark/SunRise) |
| Southwest Gas LV CoGen 1 | | 5,200 | | | (Jun - Sep) |
| Southwest Gas LV CoGen 2 | | 45,000 | | | (Annual) |
| Southwest Gas | | 288,000 | | | (Annual) |
SPPC Electric
| | | Average Consumption Cost & Percentage Contribution to Total Fuel |
| | | Gas | | Coal | | Oil |
| | | $/MMBtu | | Percent | | $/MMBtu | | Percent | | $/MMBtu | | Percent |
| 2009 | | 7.98 | | 63.4% | | 2.12 | | 36.5% | | 15.91 | | 0.1% |
| 2008 | | 8.95 | | 57.5% | | 2.09 | | 42.4% | | 20.90 | | 0.1% |
| 2007 | | 8.34 | | 57.8% | | 1.93 | | 42.0.% | | 12.10 | | 0.2% |
| 2006 | | 8.92 | | 55.9% | | 1.83 | | 43.9% | | 10.15 | | 0.2% |
| 2005 | | 7.87 | | 56.8% | | 1.67 | | 43.1% | | 7.37 | | 0.1% |
For a discussion of the change in fuel costs, see Results of Operations in Item 7, Management’s Discussion and Analysis of Financial Condition and Results of Operations.
2009 was a transition period in which SPPC moved from a one season ahead competitive bidding process to a laddering strategy in which physical gas supplies are procured up to three seasons ahead through two seasonal competitive bidding processes. Although SPPC has actively requested fixed price physical gas supplies, no such fixed price transactions were executed during 2009. Therefore, the physical gas prices are set at an appropriate industry index during the month of current delivery. All natural gas is delivered to SPPC through the use of firm gas transport contracts. Monthly and daily gas supply adjustments are made based on the current energy marketplace and operational considerations.
SPPC utilizes a laddered strategy with respect to coal supply and has long-term coal contracts with Black Butte Coal Company and Arch Coal Sales Company that provide for deliveries through December 31, 2015 and December 31, 2011 respectively. These contracts represent 90% of the Valmy Generating Station’s projected coal requirements in 2010, 78% for 2011, 50% for 2012, 40% for 2013, 40% for 2014, and 30% for 2015. New sources of coal supply such as Powder River Basin coal for test burns were tested and qualified for use in 2009, with negotiations with suppliers currently underway. The availability of Powder River Basin coal is such that it allows for updated laddering strategies to be applied.
Union Pacific Railroad originates and delivers coal to the Valmy Generating Station. This contract, which expired on December 31, 2009, has been extended until March 31, 2010 to allow for final negotiation of a replacement contract.
As of December 31, 2009, the coal inventory level at Valmy Generating Station was 336,138 tons or approximately 118 days of consumption at 100% capacity.
SPPC Gas
Growth in all sectors is expected to continue, although at a much slower pace due to a general slowdown in real estate development activity which began in 2008 and is expected to continue through 2010. Projected peak demand, which will only occur when the calculated average of the high and low temperatures for a given day drops to negative 5 degrees Fahrenheit, is estimated to be 190,667 Dth per day for the winter of 2009/2010.
To secure gas supplies for power generation and the LDC, SPPC contracted for firm winter, summer, and annual gas supplies with over a dozen Canadian and domestic suppliers. In 2009, seasonal and monthly gas supply net purchases averaged approximately 103,757 Dth per day with the winter period contracts averaging approximately 129,829 Dth per day, and the summer period contracts averaging approximately 85,360 Dth per day.
SPPC’s firm natural gas supply is supplemented with natural gas storage services and supplies from the Northwest Pipeline Company facility located at Jackson Prairie in southern Washington. The Jackson Prairie facility can contribute up to a total of 12,687 Dth per day of peaking supplies. SPPC also has storage on the Paiute Pipeline system. This liquefied gas storage facility provides for an incremental supply of 23,000 Dth per day and is available at any time with two hours notice. Therefore, this storage project supports increases in short term gas supply needs due to unforeseen events such as extreme weather patterns and pipeline interruptions.
Following is a summary of SPPC’s transportation and storage portfolio as of December 31, 2009:
| Firm Transportation Capacity | | Dth per day firm | | Term |
| | | | | |
| Northwest | | 68,696 | | (Annual) |
| Paiute | | 68,696 | | (November through March) |
| Paiute | | 61,044 | | (April through October) |
| Paiute | | 23,000 | | (LNG tank to Reno/Sparks) |
| Nova | | 130,217 | | (Annual) |
| ANG | | 128,932 | | (Annual) |
| GTN | | 140,169 | | (November through April) |
| GTN | | 79,899 | | (May through October) |
| Tuscarora | | 172,823 | | (Annual) |
| | | | | |
| Storage Capacity | | | | |
| | | | | |
| Williams: | | 281,242 | | Inventory capability at Jackson Prairie |
| | | 12,687 | | Withdrawal capability per day from Jackson Prairie |
| Paiute: | | 303,604 | | Inventory capability at Paiute LNG |
| | | 23,000 | | LNG Storage |
Total LDC Dth supply requirements in 2009 and 2008 were 15.1 million Dth and 15.1 million Dth, respectively. Electric generating fuel requirements for 2009 and 2008 were 30.9 million Dth and 31.0 million Dth, respectively.
Water Supply
NPC and SPPC
Assured supplies of water are important for the Utilities’ generating plants, and at the present time, the Utilities have adequate water to meet their generation needs. Reliable water supply is critical to the entire desert southwest region, including the State of Nevada. The newer generation facilities in the Utilities’ fleet have been designed to minimize water usage and employ innovative conservation based technologies such as dry cooling. Although there are current drought conditions in the Las Vegas area, water resources for most of these facilities rely on regional aquifers that are not closely connected to transient drought conditions.
Purchased Power
Under the guidelines set forth in the respective ESPs, NPC and SPPC continue to manage a diverse portfolio of contracted and spot market supplies, as well as its own generation resources, with the objective of minimizing its net average system operating costs. During 2009, NPC and SPPC purchased 25.8 % and 37.1 %, respectively, of their total energy requirements.
NPC Electric
NPC purchases both forward firm energy and spot market energy based on economics, operating reserve margins, and unit availability. NPC seeks to manage its loads efficiently by utilizing its generation resources and long-term purchase power contracts in conjunction with buying and selling opportunities in the market.
NPC has entered into long-term purchase power contracts (3 or more years) with suppliers that generate electricity utilizing gas and renewable resource facilities with a total MW capacity of 2,141 and contract termination dates ranging from 2013 to 2036. Included in these contracts are 530 MWs of nameplate capacity of renewable energy of which approximately 335 MWs of nameplate capacity are under development and not currently available. The energy from renewable resource facilities is also used towards compliance with the Portfolio Standard. In 2010, NPC entered into additional long-term renewable energy agreements, which are still subject to PUCN approval.
NPC is a member of the WSPP and the SRSG. NPC’s membership in the SRSG has allowed it to network with other utilities in an effort to use its resources more efficiently in the sharing of responsibilities for reserves.
NPC’s credit standing may affect the terms under which NPC is able to purchase fuel and electricity in the western energy markets; however, as a result of NPC’s improved credit rating over the last several years, this was not a significant factor in 2009.
SPPC Electric
SPPC purchases both forward firm energy and spot market energy based on economics, operating reserve margins, and unit availability. SPPC seeks to manage its loads efficiently by utilizing its generation resources and long-term purchase power contracts in conjunction with buying and selling opportunities in the market.
SPPC has entered into long-term purchase power contracts (3 or more years) with suppliers that generate electricity utilizing coal and renewable resource facilities, with a total MW capacity of 417 and contract termination dates ranging from 2016 to 2039. Included in these contracts are 214 MWs of nameplate capacity of renewable energy. The energy from renewable resource facilities is also used towards compliance with the Portfolio Standard.
SPPC is a member of the NWPP and WSPP. These pools have provided SPPC further access to reserves and spot market power, respectively, in the Pacific Northwest and Southwest. In turn, SPPC’s generation resources provide a backup source for other pool members who rely heavily on hydroelectric systems.
SPPC’s credit standing may affect the terms under which SPPC is able to purchase fuel and electricity in the western energy markets; however, as a result of SPPC’s improved credit rating over the last several years, this was not a significant factor in 2009.
Transmission
Electric transmission systems deliver energy from electric generators to distribution systems for final delivery to customers. Transmission systems are designed to move electricity over long distances because generators can be located anywhere from a few miles to hundreds of miles from customers.
The Utilities’ electric transmission systems are part of the Western Interconnection, the regional grid in the west. The Western Interconnection includes the interconnected transmission systems of fourteen western states, two Canadian provinces and the
parts of Mexico that make up the Western Electricity Coordinating Council (WECC). WECC is one of eight regional councils of the NERC, the entity responsible for the reliability, adequacy and security of North America’s bulk electric system.
NPC’s transmission system links generating units within and outside of the NPC Balancing Authority Area to the NPC distribution system. NPC’s transmission system is directly interconnected with the transmission systems of Western Area Power Administration, Los Angeles Department of Water and Power, Southern California Edison, and PacifiCorp. NPC currently is not directly interconnected with SPPC; however, the Utilities have proposed the ON Line, which will link NPC’s and SPPC’s transmission systems in the southern and northern portions of the state, allowing for the transfer of energy, including renewable resources between the Utilities’ service territories.
SPPC’s transmission system links generating units within the SPPC Balancing Authority Area to the SPPC distribution system. SPPC’s transmission system is directly interconnected with the transmission systems of Idaho Power, Los Angeles Department of Water and Power, Southern California Edison, PacifiCorp, Bonneville Power Administration, Pacific Gas & Electric and Plumas-Sierra Rural Electric Cooperative.
Under the NERC guidelines, the Utilities are Balancing Authorities, Transmission Operators, and Transmission Owners among other roles. As defined by NERC, the Balancing Authority integrates resource plans ahead of time, maintains load-interchange-generation balance within a Balancing Authority Area, and supports Interconnection frequency in real time (i.e., the Balancing Authority is responsible for assuring that the demands on the system are matched by an equivalent amount of resources, whether from generators within its area or from imports). The Transmission Operator is responsible for the reliability of its local transmission system, and operates or directs the operations of the transmission facilities. The Transmission Owner owns and maintains transmission facilities. The Utilities also schedule power deliveries over their transmission systems and maintain reliability through their operations and maintenance practices and by verifying that customers are matching loads with resources.
NPC and SPPC plan, build, and operate transmission systems that delivered 21,267,348 MWh and 8,193,901 MWh of electricity to customers, respectively, in their Balancing Authority Areas in 2009. The NPC system handled a system peak load of 5,586 MW in 2009 through approximately 1,700 miles of transmission lines and other transmission facilities ranging from 60 kV to 500 kV. The SPPC system handled a system peak load of 1,554 MW in 2009 through 2,145 miles of transmission lines and other facilities ranging from 60 kV to 345 kV. The Utilities process generation and transmission interconnection requests and requests for transmission service from a variety of customers. These requests usually involve new planning studies and the negotiation of contracts with new and existing customers in this growing system.
Transmission Regulatory Environment
Transmission for the Utilities’ bundled retail customers is subject to the jurisdiction of the PUCN for rate making purposes. The Utilities’ wholesale and retail access transmission services are regulated by the FERC under cost based regulation subject to the OATT which the Utilities operate under. In accordance with the OATT, the Utilities offer several transmission services to wholesale customers:
| • | Long-term and short-term firm point-to-point transmission service (“highest quality” service with fixed delivery and receipt points), |
| • | Non-firm point-to-point service (“as available” service with fixed delivery and receipt points), and |
| • | Network transmission service (equivalent to the service NPC provides for NPC’s bundled retail customers). |
These services are all offered on a nondiscriminatory basis in that all potential customers, including the Utilities, have an equal opportunity to access the transmission system. The Utilities’ transmission business is managed and operated independently from the energy marketing business in accordance with FERC Standards of Conduct.
The Utilities are members of WestConnect and the WestConnect Subregional Transmission Planning Committee. WestConnect is a group of southwest transmission-providing utilities that have agreed to work collaboratively to assess stakeholder and market needs and to investigate, analyze and recommend to its Steering Committee implementation of cost-effective enhancements to the western wholesale electricity market. The Subregional Transmission Planning Committee was established to provide coordinated transmission planning across the WestConnect footprint, including the Southwest Area Transmission Group in which NPC participates and the Sierra Nevada Planning Group in which SPPC participates.
Integrated Resource Plan
The Utilities file IRPs every three years, and as necessary, may file amendments to their IRPs. The IRPs are prepared in compliance with Nevada laws and regulations and cover a 20-year period. The IRPs develop a comprehensive, integrated plan that considers customer energy requirements and propose the resources to meet those requirements in a manner that is consistent with prevailing market fundamentals. The ultimate goal of the IRPs is to balance the objectives of minimizing costs and reducing volatility while reliably meeting the electric needs of NPC’s and SPPC’s customers.
NPC Electric
In July 2009, as required by Nevada law, NPC filed its 2009 triennial IRP with the PUCN. As a result of reviews of the Company’s load forecast by the PUCN and NPC, NPC requested to withdraw its July 2009 IRP. In August 2009, the PUCN approved NPC’s withdrawal request and agreed that NPC met its statutory deadline for filing. On February 1, 2010, NPC refiled its 2009 triennial IRP. Significant requests in the filing include:
| • | | NPC is requesting approval of either of two alternative approaches to completing the ON Line project, which is a 500 kV transmission line from the proposed Robinson Summit Substation near Ely, Nevada to the existing Harry Allen Generating Station located northeast of Las Vegas, Nevada at an aggregate project cost of approximately $509 million (excluding AFUDC). The preferred plan is the Joint Project among NPC, SPPC and GBT, an affiliate of LS Power. The alternative to the Joint Project is for the Utilities' to self build the ON Line. In addition to connecting NVE's northern service territory with its service territory in southern Nevada, the ON Line would also provide access to isolated renewable energy resources in parts of northern and eastern Nevada, which would further advance the Utilities’ ability in meeting its Portfolio Standard, discussed above. The Joint Project consists of two phases. In Phase 1 of the Joint Project, the parties would complete construction of an initial 500 kV interconnection between the Robinson Summit substation on the SPPC system and the Harry Allen Generating Station on the NPC system by December 31, 2012 (Phase 1 is essentially identical to the ON Line or the Utilities’ self build option). Under the Joint Project, the Utilities would own a 25% interest in Phase 1 and enter into a transmission use agreement with GBT for its 75% interest in Phase 1. The Utilities would have rights to 100% of the capacity of Phase 1, which is estimated at approximately 600 MW. NPC would operate and maintain all Phase 1 facilities. In Phase 2, GBT would construct two additional transmission segments at either end of the ON Line: one extending from Robinson Summit north to Midpoint, Idaho, and the other commencing at the Harry Allen Generating Station and interconnecting south to the Eldorado substation. GBT would pay for and own 100% of Phase 2 facilities. However, NPC and SPPC would have rights to additional transmission capacity from Midpoint to Eldorado (for a total of approximately 760 MW based on a rating of 2,000 MW for the complete path). See the Transmission section earlier for a graphical representation of the Joint Project/ON Line. |
| | | |
| • | | NPC also is requesting approval to proceed with permitting and right of way activities for three new 500 kV transmission corridors intended to support renewable resource development: from Harry Allen Generating Station to the Northwest Substation, from the Northwest Substation to Amargosa Valley, and from Harry Allen Generating Station to the Mead and Eldorado substations. |
| | | |
| • | | Approval of the ASD initiative component of the DSM plan with a budget of approximately $95 million (excluding AFUDC). This project will allow customers to control their energy use by providing transparent and timely consumption and pricing information and energy control capabilities while facilitating and enhancing NVE’s existing and planned demand response programs and other energy conservation and efficiency measures. |
| | | |
| • | | Approval of various DSM programs to increase energy efficiency and conservation programs totaling approximately $99 million, of which $17.2 million is included in our current capital budget. |
| | | |
| • | | Approval of the long-term load forecast and the three-year forecast. |
SPPC Electric
In June 2007, SPPC filed its 2007 triennial IRP with the PUCN and has since filed several amendments to the IRP. In March 2010, SPPC expects to file an amendment requesting the approval of the Joint Project with GBT for the ON Line project. SPPC is required to file an IRP by July 2010.
Construction Program
The Utilities construction programs and estimated expenditures are subject to continuing review, and are periodically revised to include the rate of load growth, construction costs, availability of fuel types, the number and status of proposed independent generation projects, the need for additional transmission capacity in Nevada, regulatory considerations and impact to customers, the Utilities ability to raise necessary capital, and changes in environmental regulations. Under the Utilities’ franchise agreements, they are obligated to provide a safe and reliable source of energy to their customers. Capital construction expenditures and estimates are reflective of the Utilities’ obligation to serve their customer base.
Gross construction expenditures for 2009, including AFUDC, net salvage and CIAC, were $656.1 million and $187.1 million for NPC and SPPC, respectively, and for the period 2005 through 2009, were $4.0 billion and $1.3 billion, respectively. Estimated construction expenditures for PUCN approved projects, projects under contract, compliance projects and other base capital requirements are as follows (dollars in thousands):
NPC
| | | 2010 | | | | 2011-2014 | | | Total 5 - Year | |
| Electric Facilities: | | | | | | | | | | |
| Generation | | $ | 372,867 | | | $ | 563,607 | | | $ | 936,474 | |
| Distribution | | | 89,793 | | | | 336,962 | | | | 426,755 | |
| Transmission | | | 8,224 | | | | 248,166 | | | | 256,390 | |
| Other | | | 61,387 | | | | 117,573 | | | | 178,960 | |
| Total | | $ | 532,271 | | | $ | 1,266,308 | | | $ | 1,798,579 | |
Total estimated cash requirements related to construction projects consist of the following (dollars in thousands):
| | | 2010 | | | | 2011-2014 | | | Total 5 - Year | |
| | | | | | | | | | | |
| Construction Expenditures | | $ | 532,271 | | | $ | 1,266,308 | | | $ | 1,798,579 | |
| AFUDC | | | (41,933 | ) | | | (66,109 | ) | | | (108,042 | ) |
| Net Salvage/ Cost of Removal | | | (589 | ) | | | (1,442 | ) | | | (2,031 | ) |
| Net Customer Advances and CIAC | | | (42,431 | ) | | | (103,858 | ) | | | (146,289 | ) |
| Total Cash Requirements | | $ | 447,318 | | | $ | 1,094,899 | | | $ | 1,542,217 | |
SPPC
| | | 2010 | | | | 2011-2014 | | | Total 5 - Year | |
| Electric Facilities: | | | | | | | | | | |
| Generation | | $ | 19,841 | | | $ | 89,873 | | | $ | 109,714 | |
| Distribution | | | 51,682 | | | | 181,654 | | | | 233,336 | |
| Transmission | | | 13,728 | | | | 250,538 | | | | 264,266 | |
| Other | | | 35,940 | | | | 70,748 | | | | 106,688 | |
| Total | | | 121,191 | | | | 592,813 | | | | 714,004 | |
| | | | | | | | | | | | | |
| Gas Facilities: | | | | | | | | | | | | |
| Distribution | | | 12,980 | | | | 54,083 | | | | 67,063 | |
| Other | | | 752 | | | | 3,128 | | | | 3,880 | |
| Total | | | 13,732 | | | | 57,211 | | | | 70,943 | |
| | | | | | | | | | | | | |
| Common Facilities | | | 16,145 | | | | 47,867 | | | | 64,012 | |
| | | | | | | | | | | | | |
| Total | | $ | 151,068 | | | $ | 697,891 | | | $ | 848,959 | |
Total estimated cash requirements related to construction projects consist of the following (dollars in thousands):
| | | 2010 | | | | 2011-2014 | | | Total 5 - Year | |
| | | | | | | | | | | |
| Construction Expenditures | | $ | 151,068 | | | $ | 697,891 | | | $ | 848,959 | |
| AFUDC | | | (1,941 | ) | | | (29,013 | ) | | | (30,954 | ) |
| Net Salvage/ Cost of Removal | | | 2,582 | | | | 11,583 | | | | 14,165 | |
| Net Customer Advances and CIAC | | | (4,972 | ) | | | (22,300 | ) | | | (27,272 | ) |
| | | | | | | | | | | | | |
| Total Cash Requirements | | $ | 146,737 | | | $ | 658,161 | | | $ | 804,898 | |
Major PUCN approved projects included in the 5 year estimated construction expenditures are as follows (dollars in thousands):
| Projects | | MW | | | Approved by PUCN | | | Total Cost 2010 | | | Total Project Cost Cash Flows | | | Cumulative Expenditures as of December 31, 2009 | | | Projected In Service Completion Date Year | |
EEC (1) | | | 1,500 | | | $ | 130,000 | | | $ | 1,000 | | | $ | 81,305 | | | $ | 78,805 | | | | - | |
| Harry Allen Generating Station | | | 484 | | | | 682,367 | | | | 218,917 | | | | 682,367 | | | | 438,997 | | | | 2011 | |
Renewable Projects (2) | | | 26 | | | | 112,300 | | | | 13,518 | | | | 112,300 | | | | 10,337 | | | | 2010-2012 | |
| | (1) | See discussion below regarding the EEC by the PUCN. 80% of these costs are allocated to NPC and 20% to SPPC.. |
| | (2) | MWs reflect NPC’s expected ownership share of these projects. |
In 2008, the PUCN approved the construction of a new 484-megawatt (MW) natural gas combined cycle electric generating plant at NPC’s Harry Allen Generating Station. This facility, 25 miles northeast of Las Vegas, is expected to commence operations by the summer of 2011. The construction of the Harry Allen plant would be more beneficial to NV Energy’s customers than relying on purchasing power from energy markets.
As discussed under the IRP, the PUCN approved the Utilities spending on the EEC up to $130 million, of which the Utilities have spent approximately $ 79 million, which includes costs related to the ON Line, as of December 31, 2009. However, on February 9, 2009, NVE and the Utilities announced their intention to postpone the construction of the EEC but plan to proceed with the construction of the On Line. In 2010, the Utilities intend to file amendments to their IRP’s requesting PUCN approval to accelerate the development of the On Line.
NPC has various renewable energy projects, including wind, solar and geothermal, under development and negotiation. In 2008, the PUCN approved the Carson Lake project and Goodsprings Waste Heat Recovery project for $91 million and $21.3 million respectively. The Carson Lake project and the Goodsprings Waste Heat Recovery project are scheduled for commercial operation in 2012 and 2010, respectively.
NPC has entered into a joint development agreement, the China Mountain Wind Project, for approximately $238 million. Under the joint development agreement, NPC has the opportunity to evaluate the feasibility of the project. The PUCN has not yet approved the project, and as such, it has not been included in the above tables.
OTHER SUBSIDIARIES OF NV ENERGY, INC.
Sierra Pacific Communications
SPC was formed as a Nevada corporation in 1999 to identify and develop business opportunities in telecommunications services and infrastructure. SPC entered 2004 with two distinct business areas. The first involved a fiber optic system extending between Salt Lake City, Utah and Sacramento, California (the Long Haul System) and the second was the Metro Area Network (MAN) business in Las Vegas and Reno, Nevada. In 2004, SPC disposed of their MAN assets. Currently, management is assessing various business opportunities in regards to the remaining Long Haul System. In 2008, SPC recorded an impairment of the Long Haul System of approximately $3.8 million, net of taxes. As of December 31, 2009, SPC’s recorded asset value for the Long Haul System is approximately $4.1 million. SPC does not otherwise contribute significantly to the results of operations of NVE.
Lands of Sierra
Lands of Sierra (LOS) was organized in 1964 to develop and manage SPPC’s non-utility property in Nevada and California. These properties previously included retail, industrial, office and residential sites, timberland, and other properties. In keeping with NVE's strategy to focus on its core energy business, LOS continues to sell its remaining properties, which are located in Nevada and are of minimal book value. LOS does not materially contribute to the results of operations of NVE.
For a discussion of other subsidiaries’ results of operations, refer to Item 7, Management’s Discussion and Analysis of Financial Condition and Results of Operations.
ENVIRONMENTAL (NVE, NPC AND SPPC)
As with other utilities, NPC and SPPC are subject to various environmental laws and regulations enforced by federal, state and local authorities. The EPA, NDEP and Clark County Department of Air Quality and Environmental Management administer regulations involving air quality, water pollution, solid, and hazardous and toxic waste. Nevada’s Utility Environmental Protection Act also requires the Utilities to obtain approval of the PUCN prior to construction of major utility, generation or transmission facilities.
From the beginning phases of siting and development to the ongoing operation of existing or new electric generating, transmission and distribution facilities, our activities involve compliance with diverse laws and regulations which address noise, emissions, impacts to air and water, protected and cultural resources, solid, hazardous, and toxic waste. Our activities often require complex and lengthy processes as we obtain approvals, permits or licenses for new, existing or modified facilities. Additionally, the use and handling of various chemicals or hazardous materials (including wastes) requires release prevention plans and emergency response procedures. As new laws or regulations are promulgated, we assess their applicability and implement the necessary modifications to our facilities or our operations to ensure complete compliance. The most significant environmental laws and regulations affecting NPC and SPPC are discussed below:
Federal Environmental Laws, Regulations and Regulatory Initiatives
Clean Air Standards
The Clean Air Act provides a framework for protecting and improving the nation’s air quality and controlling mobile and stationary sources of air emissions. The 1990 amendments to the Clean Air Act impose limitations on the emissions of sulfur dioxide (SO2), nitrogen oxide (NOx) as well as other pollutants. All of the Utilities' fossil fuel generating stations are subject to these limitations and are in compliance with current standards. Congress has from time to time considered legislation that would amend the Clean Air Act to target specific emissions from electric utility generating plants. If enacted, this legislation could require reductions in emissions of NOx, SO2, mercury and/or other pollutants. The Clean Air Act programs which most directly affect NVE’s electric generating facilities, are described below:
Mercury
The federal Clean Air Mercury Rule (CAMR) was an EPA rule based on a national cap-and-trade system which was designed to achieve a 70 percent reduction in mercury emissions and affecting all coal and oil-fired generating units across the country greater than 25 MWs.
On February 8, 2008, in State of New Jersey v. EPA, the U.S. Court of Appeals for the District of Columbia Circuit vacated two EPA rules issued under the Clean Air Act regarding the emission of hazardous air pollutants ("HAPs") from electric utility steam generating units ("EGUs"), including the CAMR as well as a rule delisting EGUs from HAPs requirements. The EPA and industry groups each filed separate petitions for certiorari with the U.S. Supreme Court on October 17, 2008 asking the Court to hear their
appeal. Then, on January 29, 2009, the EPA requested that the Department of Justice withdraw the petition for certiorari in the State of New Jersey case, stating in part that EPA intends to develop emission standards for utility units under section 112 of the Clean Air Act and thus to abide by the D.C. Circuit’s decision in this case. The EPA subsequently signed on October 22, 2009 a consent decree with environmentalists that requires the agency to propose the maximum achievable control technology (MACT) for coal and oil-fired utility units by March 2011 and issue a final rule by November 2011. It is anticipated that the final rule will require all facilities to meet emissions based on the average of the top 12% of best performers, as determined through data collection. The Utilities are currently monitoring their actual mercury emissions and will timely respond to the EPA’s December 24, 2009 information request. At this time, the EPA is considering giving the utility sector additional time to test emissions and comply with the final MACT due to the large amount of data and installation of pollution controls that will likely be required.
Recently, lawmakers have announced they intend to introduce new legislation that would limit SO2, NOx, as well as mercury emissions from the power plant sector. While the final outcome and timing for EPA's and/or Congressional actions cannot be estimated at this point, the Utilities will continue to monitor this issue and assess its potential impact on our generation fleet as new information becomes available.
Regional Haze Rules
In June 2005, the EPA finalized amendments to the July 1999 regional haze rules; thereby requiring states to develop implementation plans (SIP) to demonstrate compliance. These amendments apply to the provisions of the regional haze rule that require emission controls for industrial facilities emitting air pollutants that reduce visibility by causing or contributing to regional haze. States are required to identify the facilities that will have to reduce emissions through installation of emission controls, known as Best Available Retrofit Technology (BART), and then set emissions limits for those facilities. In 2008, the State of Nevada began its BART rule development and the proposed SIP to implement the BART requirements was released in the first quarter 2009. As presented in the SIP, the impacted BART units are Reid Gardner Generating Station Units 1, 2 & 3; Ft. Churchill Generating Station Units 1 & 2; and Tracy Generating Station Units 1, 2 & 3. Nevada’s BART SIP has now been submitted to the EPA for approval. The submitted BART SIP contains targeted emission rates and compliance with the state’s BART program which can be achieved through options such as retrofit of emission reduction equipment on the affected units or unit retirement. Due to the uncertainties of technology requirements necessary to meet the target emission rates, implementation timing and the economic profile of the impacted units at the projected time of implementation, NVE is not able to estimate the cost impact to its system at this time.
National Ambient Air Quality Standards (NAAQS)
NAAQS form the basis of the requirements in the Clean Air Act. As NAAQS are adopted and become more stringent over time, so do Clean Air Act programs. The Clean Air Act requires the EPA to review the standards for each criteria pollutant every five years. In 2010, the EPA is reviewing several of the NAAQS, which set ambient limits for six criteria pollutants. As part of the reviews, the EPA is expected to prepare integrated science assessments, risk/exposure assessments and policy assessments prior to a final decision on whether to revise the existing standards.
Particulate Matter NAAQS
In 1998, the EPA adopted revised and new NAAQS for particulate matter (PM). The regulations set a standard for PM 2.5 (fine particulates 2.5 microns in diameter or less), and retained the former standard for PM 10 (coarse particulates 10 microns or less). The EPA finalized the last particulate matter review in late 2006. On February 24, 2009, a federal appellate court remanded the EPA’s annual PM 2.5 standard back to the EPA ruling that the agency needed to better justify why it maintained the existing standard rather than making it more stringent in line with the Clean Air Scientific Advisory Committee (CASAC)’s recommendations. The EPA is complying with the court by combining its review of the 2006 standard into an ongoing PM NAAQS review, and is doing so on an accelerated schedule. The EPA is expected to publish a proposal in late 2010 with a final rule to follow. Due to uncertainty regarding the final standard, NVE is not able to estimate the cost impact to its generating system at this time.
Ozone NAAQS
On January 6, 2010, the EPA issued a proposal to reduce the NAAQS for ozone. In the proposal, the EPA presented a more stringent primary air quality standard to protect human health, as well as a more stringent secondary standard to protect the environment. If adopted, the proposed rule could increase the number of non-attainment areas within Nevada which will, in turn, potentially require reductions in emissions from major sources in those areas; require offsets in order to develop new sources; as well as require continued focus on reducing mobile source emissions. The EPA has indicated it will issue the final rule by August 31, 2010. Due to uncertainty regarding the final standard, NVE is not able to estimate the cost impact to its generating system at this time.
NOx NAAQS
On January 22, 2010, the EPA adopted a new NAAQS for NOx at a level of 100 parts per billion averaged over a one-hour period. The EPA, however, has not yet identified areas as either in attainment or not in attainment with the new NAAQS. Due to uncertainty regarding the new standard, NVE is not able to estimate the cost impact to its generating system at this time.
SO2 NAAQS
On November 16, 2009, the EPA proposed a more stringent NAAQS for SO2 to a level between 50 and 100 parts per billion averaged over a one-hour period. Due to uncertainty regarding the final standard, NVE is not able to estimate the cost impact to its generating system at this time.
Clean Water Act Standards
The EPA administers rules establishing aquatic protection requirements for power generation facilities that withdraw and discharge large quantities of water from and into rivers, streams, lakes, reservoirs, estuaries, oceans, or other U.S. waters for cooling purposes. In consideration of the desert environment in which the Utilities operate, none of the Utilities’ generation plants employ “once through” cooling water intake structures into public water bodies. Further, all of the Utilities’ generation stations are designed to have either minimal or zero water discharge into the surrounding environment. Therefore, the various laws regulating “once through” cooling water intake structures and thermal discharges of wastewater from power generation facilities do not specifically apply to the NPC and SPPC generation sites.
Coal Combustion Product (CCP) Management
The EPA has indicated it is considering regulatory measures for the management and disposal of coal combustion products, primarily ash, from coal-fired power plants. These regulatory measures may also impose requirements for the mandatory closure of active surface water impoundments used for the management of ash. None of the Utilities’ coal facilities currently manage ash in surface water impoundments; rather, these ash products are handled and processed in a dry form at both the Reid Gardner and Valmy Generating Stations.
The Utilities believe it is possible that the EPA will continue to allow some beneficial use, such as recycling of ash, without classifying it as hazardous waste. However, any additional regulations which more stringently regulate coal ash will likely increase costs for NVE’s coal generation facilities if the ability to recycle this material is impaired or current landfill disposal requirements are modified. Due to the uncertainties of how this material may be regulated in the future, the Utilities are unable to predict the outcome any such regulations might have on their systems at this time.
Remediation Activities
Due to the age and/or historical usage of past and present operating properties, the Utilities may be responsible for various levels of environmental remediation at contaminated sites. This can include properties that are part of ongoing Utility operations, sites formerly owned or used by NVE or the Utilities, and/or sites owned by third parties. The responsibility to remediate typically involves management of contaminated soils and may involve groundwater remediation. Managed in conjunction with relevant federal, state and local agencies, activities vary with site conditions and locations, remedial requirements, complexity and sharing of responsibility. If remediation activities involve statutory joint and several liability provisions, strict liability, or cost recovery or contribution actions, NVE, the Utilities or their respective affiliates could potentially be held responsible for contamination caused by other parties. In some instances, NVE or the Utilities may share liability associated with contamination with other potentially responsible parties, and may also benefit from insurance policies or contractual indemnities that cover some or all cleanup costs. These types of sites/situations are generally managed in the normal course of business operations.
Climate Change
The topic of climate change continues to evolve, and response to this issue brings with it significant environmental, economic and social implications for NVE and other electric utilities. Potential impacts from proposed legislation could vary, depending upon proposed CO2 emission limits, the timing of implementation of those limits, the method of allocating allowances, the degree to which offsets are allowed and available, and provisions for cost containment measures, such as a “safety valve” that provides a ceiling price for emission allowance purchases. However, the Utilities’ contribution of greenhouse gases amongst its current generation fleet is mitigated due to our diverse fuel portfolio being predominately natural gas which emits approximately 50% less CO2 than coal.
On June 26, 2009, the U.S. House of Representatives passed energy legislation entitled “The American Clean Energy and Security Act of 2009” that, if enacted, would establish an economy-wide cap-and-trade program. The goal of this proposed cap-and-trade program is to reduce greenhouse gas emissions from capped sources, including coal-fired electric generation units, to a level that is 3% below 2005 levels by 2012, and 83% below 2005 levels by the year 2050. The proposed legislation provides an allocation of
free emission allowances and greenhouse gas offsets to utilities, as well as certain merchant coal-fired electric generators in competitive markets. This aspect of the proposed legislation would mitigate some of the cost of compliance for electric utilities; however, the amount of free allowances provided declines over time and is ultimately phased out.
On September 30, 2009, the U.S. Senate introduced climate legislation entitled “The Clean Jobs and American Power Act,” which is similar to that passed by the U.S. House of Representatives in June 2009, although with a slightly greater reduction in greenhouse gas emissions in the year 2020. It is uncertain at this time when this or similar initiatives may be reconsidered.
The EPA finalized regulations in September 2009 that require certain categories of businesses, including fossil fuel-fired power plants, to monitor and report their annual greenhouse gas emissions beginning in January 2011 for 2010 emissions. NVE has been reporting its annual greenhouse gas emissions since it joined the California Climate Action Registry (CCAR) in 2006. Thus, this new rule covering the reporting of greenhouse gas emissions is not expected to have a material effect on NVE and the Utilities' operations.
On September 30, 2009, the EPA announced a proposed rule that would establish new thresholds for regulating greenhouse gas emissions from stationary sources, such as power plants under preconstruction and operating permit programs. The rule would require any source that emits at least 25,000 tons per year of greenhouse gases measured as CO2 equivalents (CO2e) to obtain an operating permit under the Clean Air Act, if it does not already have one. Sources that already have an operating permit would have greenhouse gas-specific provisions added to their permits upon renewal. Currently, all NVE generation facilities have operating permits that, depending on the final rule, may be required to be modified to comply with the new rule. A rule is expected to be finalized in early 2010. The extent to which this proposed rule could have a material impact on our generating facilities depends upon future EPA guidance on what constitutes best available control technology for greenhouse gas emissions from power plants, whether physical changes or change in operation subject to the rule would occur at our generating facilities, and whether federal legislation is passed which pre-empts the proposed rule.
On December 15, 2009, the EPA issued an “endangerment finding” regarding greenhouse gas emissions from motor vehicles. The EPA has indicated that the Clean Air Act would require the agency to regulate greenhouse gas emissions from stationary sources through its preconstruction and operating permit programs if it adopts greenhouse gas emission standards for motor vehicles. Timing of implementation, as well as utility specific impacts of any future EPA regulatory program for greenhouse gas emissions from motor vehicles or otherwise, remains unknown at this time.
The impact on NVE of future initiatives related to greenhouse gas emissions and global climate change is unknown. Although compliance costs are unlikely in the near future, federal legislative, federal regulatory, and state and regional-sponsored initiatives to control greenhouse gas emissions continue to progress, making it more likely that some form of greenhouse gas emissions control will eventually be required. Since these initiatives continue to evolve, the impact on the Utilities’ coal-fired generation plants and customers’ costs is unknown, NVE has and will continue to identify projects that minimize or offset greenhouse gas emissions and believes precautionary actions to limit greenhouse gas emissions are appropriate. Further, NVE continues to employ a three-part strategy to meet the energy needs of Nevada while concurrently reducing its carbon footprint. This strategy includes increasing the Utilities energy efficiency and conservation programs, and expanding renewable energy initiatives and investments.
GENERAL – EMPLOYEES (ALL)
NVE and its subsidiaries had 3,087 employees as of January 20, 2010, of which 1,770 were employed by NPC, and 1,209 were employed by SPPC.
NPC’s amendment to its existing contract with the IBEW Local No. 396, which covers approximately 57% of NPC’s workforce, was ratified by the IBEW Local No. 396 on September 29, 2008. The contract will be in effect through February 1, 2011.
SPPC’s current contract with IBEW Local 1245, which covers approximately 61% of SPPC’s workforce, was renegotiated and ratified on February 28, 2007 and was in effect until December 31, 2009. SPPC and IBEW Local 1245 opened general negotiations on July 23, 2009 and negotiations on a new collective bargaining agreement continue. Generally, all terms of the current collective bargaining agreement will continue during the negotiations process until a new contract is ratified by the IBEW Local 1245 membership or when SPPC unilaterally implements its last, best and final offer.
GENERAL – FRANCHISES (NPC AND SPPC)
The Utilities have nonexclusive local franchises or revocable permits to carry on their business in the localities in which their respective operations are conducted in Nevada and California. The franchise and other governmental requirements of some of the cities and counties in which the Utilities operate provide for payments based on gross revenues. Public utilities are required by law to collect from their customers a universal energy charge (UEC) based on consumption. The UEC is designed to help those customers who need assistance in paying their utility bills or need help in paying for ways to reduce energy consumption. During 2009, the
Utilities collected $137.7 million in franchise or other fees based on gross revenues. They collected $9.8 million in UEC based on consumption. They also paid and recorded as expense $2.7 million of fees based on net profits.
The Utilities will apply for renewal of franchises in a timely manner prior to their respective expiration dates.
Risks related to NVE and the Utilities Results of Operations
Economic conditions could negatively impact our business.
Our operations are affected by local, national and global economic conditions. Moreover, the growth of our business depends in part on continued customer growth and tourism demand in the Las Vegas portion of our service area. The consequences of the current recession have included a lower level of economic activity and uncertainty regarding energy prices and the capital and commodity markets, including availability and cost of credit, inflation rates, monetary policy and unemployment rates. A lower level of economic activity, changes in discretionary spending, conservation efforts by our customers, and decreased tourism activity in Las Vegas have resulted in a decline in energy consumption, which has and may continue to adversely affect our revenues and future growth. Instability in the financial markets, as a result of recession or otherwise, also may affect the cost of capital and our ability to raise capital, including the Utilities’ options with respect to replacing their expiring credit facilities, which are discussed in greater detail in Management’s Discussion and Analysis of Financial Condition and Results of Operations - Liquidity and Capital Resources.
Current economic conditions have and continue to be exacerbated by insufficient financial sector liquidity leading to potential increased unemployment, which may impact customers’ ability to pay on a timely basis, increase customer bankruptcies, and lead to increased bad debt. It is expected that commercial and industrial customers will be impacted first with residential customers following, if such circumstances occur.
Our operating results will likely fluctuate on a seasonal and quarterly basis.
Electric power generation is generally a seasonal business. In many parts of the country, including our service areas, demand for power peaks during the hot summer months, with market prices also peaking at that time. As a result, our operating results in the future will likely fluctuate substantially on a seasonal basis. In addition, we have historically sold less power, and consequently earned less income, when weather conditions in our service areas are milder. Unusually mild weather in the future could diminish our results of operations and harm our financial condition.
Changes in consumer preferences, current recessionary environment, war, and the threat of terrorism or pandemics may harm our future growth and operating results.
Changes in consumer preferences or discretionary consumer spending in the Las Vegas portion of our service area could continue to harm our business. We cannot predict the extent to which the current recessionary environment, future terrorist and war activities, or pandemics, in the U.S. and elsewhere may affect us, directly or indirectly. An extended period of reduced discretionary spending and/or disruptions or declines in airline travel and business conventions could significantly harm the businesses in and the continued growth of the Las Vegas portion of our service area, which could harm our business and results of operations. In addition, instability in the financial markets as a result of the current recessionary environment, war, terrorism or pandemics may affect our ability to raise capital.
Risks related to NVE and the Utilities’ Environmental Matters
If Federal and/or State requirements are imposed on the Utilities mandating further emission reductions, including limitations on carbon dioxide (CO2) or other greenhouse gas emissions, and proposals to reduce the national standards for ozone and other pollutants, such requirements could make some electric generating units, uneconomical to maintain or operate.
Emissions of nitrogen and sulfur oxides, mercury and particulates from fossil fueled generating plants are potentially subject to increased regulations, controls and mitigation expenses. Certain Congressional leaders, environmental advocacy groups and regulatory agencies in the United States have also been focusing considerable attention on carbon dioxide (CO2) emissions from power generation facilities and their potential role in climate change. Moreover, there are many legislative and rulemaking initiatives pending at the federal and state level that are aimed at the reduction of greenhouse gas emissions, as well as the reduction of the National Ambient Air Quality Standards (NAAQS) for ozone and other pollutants. We cannot predict the outcome of pending or future legislative and rulemaking proposals. Future changes in environmental laws or regulations governing emissions reductions could make certain electric generating units, especially those utilizing coal for fuel, uneconomical to construct, maintain or operate or could require design changes or the adoption of new technologies that could significantly increase costs or delay in-service dates. In addition, any legal obligation that would require the Utilities to substantially reduce their emissions beyond present levels could require extensive mitigation efforts and, in the case of CO2 legislation, would raise uncertainty about the future viability of fossil fuels, particularly coal, as an energy source for new and existing electric generation facilities.
The Utilities are subject to numerous environmental laws and regulations that may increase our cost of operations, impact or limit our business plans, expose us to environmental liabilities, or make some electric generating units uneconomical to maintain or operate.
The Utilities are subject to extensive federal, state and local laws and regulations relating to environmental protection. These laws and regulations can result in increased capital, construction, operating, and other costs. These laws and regulations generally require us to obtain and comply with a wide variety of environmental licenses, permits, inspections and other approvals, and may be enforced by both public officials and private individuals. We cannot predict the outcome or effect of any action or litigation that may arise from applicable environmental regulations.
In addition, either of the Utilities may be identified as a responsible party for environmental cleanup by environmental agencies or regulatory bodies. We cannot predict with certainty the amount or timing of future expenditures related to environmental matters because of the difficulty of estimating clean up costs. There is also uncertainty in quantifying liabilities under environmental laws that impose joint and several liability on all potentially responsible parties. Environmental regulations may also require us to install pollution control equipment at, or perform environmental remediation on, our facilities.
Existing environmental regulations regarding air emissions (such as NOx, SO2 or mercury emissions), water quality and other toxic pollutants may be revised or new climate change laws or regulations may be adopted or become applicable to us. Revised or additional laws or regulations, which may result in increased compliance costs, including the adoption of new technologies or additional operating restrictions, could have a material adverse effect on our financial condition and results of operations particularly if those costs are not fully recoverable from our customers.
Furthermore, we may not be able to obtain or maintain all environmental regulatory approvals necessary to our business. If there is a delay in obtaining any required environmental regulatory approval or if we fail to obtain, maintain or comply with any such approval, operations at our affected facilities could be delayed, halted or subjected to additional costs.
Risks related to NVE and the Utilities’ Liquidity and Capital Resources
The Utilities plan to make significant capital expenditures to construct new generation and transmission facilities. In addition, the Utilities require liquidity to bridge the cost of fuel and purchased power and other operating activities until recovered through rates. If we are unable to finance such construction or limit the amount of capital expenditures associated with those facilities to forecasted levels, finance or generate sufficient liquidity for fuel and purchased power including, risk management activities, and/or recover amounts spent on construction, fuel and purchased power and other operating activities through future filings with the PUCN, and/or maintain our credit ratings, our financial condition and results of operation could be adversely affected.
Our long term business objectives include plans to construct new generation and transmission facilities. We do not currently generate sufficient cash flow to fund the construction plan. Significant construction capital requirements and liquidity to bridge the cost of fuel and purchased power and other operating activities, until recovered through rates, require that the Utilities may finance through significant additional borrowings under the Utilities’ respective credit facilities, through additional debt financings in private or public offerings or through debt or equity financings by NVE. See Item 7, Management’s Discussion and Analysis of Financial Condition and Results of Operations, Liquidity and Capital Resources, NVE. We cannot be sure that we will be able to obtain financing on favorable terms, or at all, since the availability and terms of financing depend on financial market conditions, including the effect of volatility in financial and credit markets, changes in availability and cost of capital either due to market conditions or as a result of the Utilities’ credit ratings, or interest rate fluctuations. Neither can we be sure that we will be successful in limiting capital expenditures to planned amounts, particularly in the event of escalating costs for materials, labor and environmental compliance, timing delays and other economic factors. If we cannot adequately replace our expiring credit facilities, obtain favorable financing arrangements for our planned capital expenditures, limit such capital expenditures to forecasted amounts, finance or generate sufficient liquidity for fuel and purchased power, including risk management activities and other operating costs, and/or recover or timely recover amounts spent on construction, fuel and purchased power and other operating activities through future filings with the PUCN, and/or maintain our credit ratings, our financial condition and results of operations could be adversely affected.
Lower than expected investment returns on pension plan assets and other factors may increase NVE’s pension liability and pension funding requirements.
Substantially all of NVE employees are covered by a defined benefit pension plan. At present, the pension plan is underfunded in that the projected pension benefit obligation exceeds the aggregate fair value of plan assets. The funded status of the plan can be affected by contributions to plan assets, plan design, investment returns on plan assets, discount rates, mortality rates of plan participants, pension reform legislation and a number of other factors. There can be no assurance that the value of NVE’s pension plan assets will be sufficient to cover future liabilities. Although NVE has made significant contributions to its pension plan in recent years, it is possible that NVE could incur a significant pension liability adjustment, or could be required to make significant additional
cash contributions to its plan, which would reduce the cash available for operating activities, and have a material impact on earnings. Refer to Note 11, Retirement Plan and Post-Retirement Benefits of the Notes to Financial Statements.
The Utilities are subject to fuel and wholesale electricity pricing risks, which could result in unanticipated liabilities and cash flow requirements or increased volatility in our earnings, and to related credit and liquidity risks.
The Utilities’ business and operations are subject to changes in purchased power prices and fuel costs that may cause increases in the amounts they must pay for power supplies on the wholesale market and the cost of producing power in their generation plants. As evidenced by the western utility crisis that began in 2000, prices for electricity, fuel and natural gas may fluctuate substantially over relatively short periods of time and expose the Utilities to significant commodity price risks. Among the factors that could affect market prices for electricity and fuel are:
| · | prevailing market prices for coal, oil, natural gas and other fuels used in generation plants, including associated transportation costs, and supplies of such commodities; |
| | |
| · | changes in the regulatory framework for the commodities markets that they rely on for purchased power and fuel; |
| · | liquidity in the general wholesale electricity market; |
| | |
| · | the actions of external parties, such as the FERC or independent system operators, that may impose price limitations and other mechanisms to address volatility in the western energy markets; |
| | |
| · | weather conditions impacting demand for electricity or availability of hydroelectric power or fuel supplies; |
| | |
| · | union and labor relations; |
| | |
| · | natural disasters, wars, acts of terrorism, embargoes and other catastrophic events; and |
| | |
| · | changes in federal and state energy and environmental laws and regulations. |
As a part of the Utilities’ risk management strategy, they focus on executing contracts for power deliveries to the Utilities’ physical points of delivery to mitigate the commodity-related risks listed above. To the extent that open positions exist, fluctuating commodity prices could have a material adverse effect on their cash flows and their ability to operate and, consequently, on our financial condition.
Increasing energy commodity prices, particularly with respect to natural gas, have a significant effect on our short-term liquidity. Although the Utilities are entitled to recover their prudently incurred power, natural gas and fuel costs through deferred energy rate case filings with the PUCN, if current commodity prices increase, the Utilities’ deferred energy balances will increase, which will negatively affect our cash flow and liquidity until such costs are recovered from customers.
The Utilities are also subject to credit risk for losses that they incur as a result of non-performance by counterparties of their contractual obligations to deliver fuel, purchased power, natural gas (for resale) or settlement payments. The Utilities often extend credit to counterparties and customers and they are exposed to the risk that they may not be able to collect amounts owed to them. Credit risk includes the risk that a counterparty may default due to circumstances relating directly to it, and also the risk that a counterparty may default due to circumstances that relate to other market participants that have a direct or indirect relationship with such counterparty. Should a counterparty, customer or supplier fail to perform, the Utilities may be required to replace existing contracts with contracts at then-current market prices or to honor the underlying commitment.
The Utilities are also subject to liquidity risk resulting from the exposure that their counterparties perceive with respect to the possible non-performance by the Utilities of their physical and financial obligations under their energy, fuel and natural gas contracts. These counterparties may under certain circumstances, pursuant to the Utilities’ agreements with them, seek assurances of performance from the Utilities in the form of letters of credit, prepayment or cash deposits. In periods of price volatility, the Utilities’ exposure levels can change significantly, which could have a significant negative impact on our liquidity and earnings. In the event the Utilities’ credit ratings are downgraded below investment grade, the maximum amount of collateral the Utilities would be required to post is approximately $82.5 million. Refer to Management’s Discussion and Analysis, Factors Affecting Liquidity for NPC and SPPC.
As of February 19, 2010, NPC had approximately $429.3 million available under its $589 million revolving credit facility and SPPC has approximately $291.2 million available under its $332 million revolving credit facility. The combined effects of higher natural gas prices, significant deferred energy balances and ongoing under-recovery of fuel, energy and natural gas costs may have a negative effect on our short-term liquidity.
If NVE is precluded from receiving dividends from the Utilities, its financial condition, and its ability to meet its debt service obligations, pay dividends and make capital contributions to its subsidiaries, will be materially adversely affected.
Since NVE is a holding company, substantially all of its cash flow is provided by dividends paid to NVE by NPC and SPPC on their common stock, all of which is owned by NVE. Since NPC and SPPC are public utilities, they are subject to regulation by state utility commissions, which impose limits on investment returns or otherwise impact the amount of dividends that the Utilities may declare and pay.
In addition, certain agreements entered into by the Utilities set restrictions on the amount of dividends they may declare and pay and restrict the circumstances under which such dividends may be declared and paid. As a result of the Utilities’ credit rating on their senior secured debt at investment grade by S&P and Moody’s, these restrictions are suspended and no longer in effect so long as the debt remains investment grade by both rating agencies. In addition to the restrictions imposed by specific agreements, the Federal Power Act prohibits the payment of dividends from “capital accounts.” Although the meaning of this provision is unclear, the Utilities believe that the Federal Power Act restriction, as applied to their particular circumstances, would not be construed or applied by the FERC to prohibit the payment of dividends for lawful and legitimate business purposes from current year earnings, or in the absence of current year earnings, from other/additional paid-in capital accounts. If, however, the FERC were to interpret this provision differently, the ability of the Utilities to pay dividends to NVE could be jeopardized.
We cannot assure investors that future dividend payments on our Common Stock will be made or, if made, in what amounts they may be paid.
On July 28, 2007, NVE’s BOD declared a quarterly cash dividend of $0.08 per share of Common Stock, payable on September 12, 2007. This dividend was the first declared by the BOD since February 2002. Dividends are considered periodically by NVE’s BOD and are subject to factors that ordinarily affect dividend policy, such as current and prospective financial condition, earnings and liquidity, prospective business conditions, regulatory factors, and dividend restrictions in NVE’s and the Utilities’ financing agreements. The BOD will continue to review these factors on a periodic basis to determine if and when it would be prudent to declare a dividend on NVE’s Common Stock. Since the dividend on July 28, 2007 was declared, NVE’s BOD has declared in each of the successive quarters cash dividends; however, there is no guarantee that dividends will be paid in the future, or that, if paid, the dividends will be paid in the same amount or with the same frequency as in the past.
NVE’s indebtedness is effectively subordinated to the liabilities of its subsidiaries, particularly NPC and SPPC. NVE and the Utilities have the ability to issue a significant amount of additional indebtedness under the terms of their various financing agreements.
Because NVE is a holding company, its indebtedness is effectively subordinated to the Utilities’ existing indebtedness and other future liabilities, including claims by the Utilities’ trade creditors, debt holders, secured creditors, taxing authorities, and guarantee holders. NVE conducts substantially all of its operations through its subsidiaries, and thus NVE’s ability to meet its obligations under its indebtedness and to pay any dividends on its common stock will be dependent on the earnings and cash flows of those subsidiaries and the ability of those subsidiaries to pay dividends or to advance or repay funds to NVE. As of December 31, 2009, the Utilities had approximately $5.0 billion of debt outstanding. The terms of NVE’s indebtedness restrict the amount of additional indebtedness that NVE and the Utilities may issue. Based on NVE’s December 31, 2009 financial statements, assuming an interest rate of 7%, NVE’s indebtedness restrictions would allow NVE and the Utilities to issue up to approximately $1.2 billion of additional indebtedness in the aggregate, unless the indebtedness being issued is specifically permitted under the terms of NVE’s indebtedness. In addition, NPC and SPPC are subject to restrictions under the terms of their various financing agreements on their ability to issue additional indebtedness.
Risks related to NVE and the Utilities’ Regulatory Proceedings
If the Utilities do not receive favorable rulings in their future GRCs or other regulatory filings, it will have a significant adverse effect on our financial condition, cash flows and future results of operations.
The Utilities’ revenues and earnings are subject to change as a result of regulatory proceedings known as GRCs, which the Utilities file with the PUCN approximately every three years. In the Utilities’ GRCs, the PUCN establishes, among other things, their recoverable rate base, their ROE, overall ROR, depreciation rates and their cost of capital.
For a discussion of NPC’s and SPPC’s recent GRCs, see Note 3, Regulatory Actions of the Notes to Financial Statements.
We cannot predict what the PUCN will direct in their orders on the Utilities’ future GRCs. Inadequate base energy rates would have a significant adverse effect on the Utilities’ financial condition and future results of operations and could cause downgrades of their securities by the rating agencies and make it significantly more difficult or expensive to finance operations and construction projects and to buy fuel, natural gas and purchased power from third parties.
If the Utilities do not receive favorable rulings in the deferred energy applications that they file with the PUCN and they are unable to recover their deferred purchased power, natural gas and fuel costs, including changes in prices due to temporary suspension of hedging programs, they will experience an adverse impact on cash flow and earnings. Any significant disallowance of deferred energy charges in the future could materially adversely affect their cash flow, financial condition and liquidity.
Under Nevada law, purchased power, natural gas and fuel costs in excess of those included in base rates are deferred as an asset on the Utilities’ balance sheets and are not shown as an expense until recovered from their retail customers. The Utilities are required to file DEAA applications with the PUCN at least once every twelve months so that the PUCN may verify the prudence of the energy costs. Nevada law also requires the PUCN to act on these cases within a specified time period. Any of these costs determined by the PUCN to have been imprudently incurred cannot be recovered from the Utilities’ customers. Past disallowances in the Utilities’ deferred energy cases have been significant, which resulted in ratings downgrades of our debt securities and adversely affected our liquidity and access to capital markets.
For a discussion of NPC’s and SPPC’s recent and pending deferred energy rate cases, see Note 3, Regulatory Actions of the Notes to Financial Statements.
Material disallowances of deferred energy costs, gas costs or inadequate BTERs would have a significant adverse effect on the Utilities’ financial condition and future results of operations, could cause downgrades of NVE’s and the Utilities’ securities by the rating agencies and could make it more difficult or expensive to finance operations and construction projects and buy fuel, natural gas and purchased power from third parties.
Historically, the Utilities have purchased a significant portion of the power that they sell to their customers from power suppliers. If the Utilities’ and/or their power suppliers’ credit ratings are downgraded, the Utilities may experience difficulty entering into new power supply contracts, and to the extent that they must rely on the spot market, they may experience difficulty obtaining such power from suppliers in the spot market in light of their financial condition, or the financial condition of their power suppliers. In addition, if the Utilities experience unexpected failures or outages in their generation facilities, they may need to purchase a greater portion of the power they provide to their customers. If they do not have sufficient funds or access to liquidity to obtain their power requirements, particularly for NPC at the onset of the summer months, and are unable to obtain power through other means, their business, operations and financial condition will be materially adversely affected.
If the Utilities cannot maintain the required level of renewable energy or procure sufficient solar energy to meet Nevada’s increasing Portfolio Standard the PUCN may, among other things, impose an administrative fine for noncompliance.
Nevada law sets forth the Portfolio Standard requiring providers of electric service to acquire, generate, or save from renewable energy systems or energy efficiency measures a specific percentage of its total retail energy sales from renewable energy sources, including biomass, geothermal, solar, waterpower, wind, and recovered energy generation projects. In 2009 and 2010 the Utilities are required to obtain an amount of PECs equivalent to 12% of their total retail energy from renewables. The Portfolio Standard increases to 15% for 2011 and 2012, to 18% for 2013 and 2014, and reaches 20% in 2015, after which it increases again to 22% for the years 2020 through 2024, and to 25% for 2025 and beyond. Moreover, not less than 5% of the total Portfolio Standard must be met from solar resources until 2016, when a minimum of 6% must be solar. In the event the Utilities do not fully meet the standard in a given year, if the PUCN does not exempt them, they will be required to make up the PEC deficiency in subsequent years.
Due to periodic increases in the Portfolio Standard and increasing retail sales, the Utilities must acquire increasing amounts of renewable energy. The Utilities’ success in meeting the increasing Portfolio Standard remains largely dependent on their ability to acquire additional renewable energy from either self-owned renewable generation facilities or the purchase of renewable energy from third-party developers or other utilities and a decrease in demand through qualified conservation and energy efficiency measures. In 2009 the PUCN issued its order finding the Utilities fully compliant with the Portfolio Standard for 2008.
The Utilities’ ability to access the capital markets is dependent on their ability to obtain regulatory approval to do so.
The Utilities will need to continue to support working capital and capital expenditures, and to refinance maturing debt, through external financing. The Utilities must obtain regulatory approval in Nevada in order to borrow money or to issue securities and are therefore dependent on the PUCN to issue favorable orders in a timely manner to permit them to finance their operations, construction and acquisition costs and to purchase power and fuel necessary to serve their customers. On February 4, 2009, the PUCN approved financing authority for NPC to issue up to $1.25 billion of long-term debt securities over a two-year period ending December 31, 2010; ongoing authority to maintain a revolving credit facility of up to $1.3 billion and authority to refinance up to approximately $471 million of long term debt securities. On October 28, 2009, the PUCN approved financing authority for SPPC to issue up to $350 million of long-term debt securities over a three-year period ending December 31, 2012; ongoing authority to maintain a revolving credit facility of up to $600 million; and authority to refinance up to approximately $348 million of long-term debt securities. However, we cannot assure you that in the future the PUCN will issue such favorable orders or that such favorable orders will be issued on a timely basis.
None.
Substantially all of NPC’s and SPPC’s property in Nevada and California is subject to the lien of the General and Refunding Mortgage Indentures dated as of May 1, 2001, between NPC and SPPC, respectively, and The Bank of New York Mellon Trust Company, N.A., as trustee, as amended and supplemented.
The following is a list of NPC’s share of electric generation plants including the type and fuel used to generate, the anticipated 2010 net capacity (MW), and the years that the units were installed.
| | | | | | | Number of | | Summer MW | | Commercial Operation |
| Plant Name | | Type | | Fuel | | Units | | Capacity | | Year |
Clark Generating Station (1) | | Combined Cycle | | Gas | | 6 | | 430 | | 1979, 1979, 1980, 1982, 1993, 1994 |
| | | Gas | | Gas | | 1 | | 54 | | 1973 |
| | | Peakers | | Gas | | 12 | | 619 | | 2008 |
| Sunrise | | Steam | | Gas | | 1 | | 80 | | 1964 |
| | | Gas | | Gas | | 1 | | 70 | | 1974 |
| Harry Allen Generating Station | | Gas | | Gas | | 2 | | 144 | | 1995, 2006 |
Lenzie Generating Station (2) | | Combined Cycle | | Gas | | 6 | | 1,102 | | 2006 |
Silverhawk Generating Station (3) | | Combined Cycle | | Gas | | 3 | | 395 | | 2004 |
| Higgins Generating Station | | Combined Cycle | | Gas | | 3 | | 530 | | 2004 |
Mohave Generating Station (4)(5) | | Steam | | Coal | | 0 | | 0 | | 1971, 1971 |
Navajo Generating Station (6) | | Steam | | Coal | | 3 | | 255 | | 1974, 1975, 1976 |
Reid Gardner Generating Station (7) | | Steam | | Coal | | 4 | | 325 | | 1965, 1968, 1976, 1983 |
| Total | | | | | | 42 | | 4,004 | | |
| (1) | The two combined cycles at Clark Generating Station each consist of two gas turbines, two Heat Recovery Steam Generators (HRSG), and one steam turbine. In 1993 and 1994, the original four gas turbines (1979-1982) were combined with four new HRSGs and two new steam turbines to form the combined cycles. Capacity of the Clark Peakers is derated due to low gas delivery pressure in the winter period. |
| (2) | The two combined cycles at the Lenzie Generating Station each consist of two gas turbines, two HRSGs and one steam turbine. |
| (3) | The acquisition of a 75% ownership interest in the Silverhawk Generating Station from Pinnacle West was consummated in 2006. SNWA continues to hold a 25% ownership interest in the plant. The combined cycle plant consists of two gas turbines, two HRSGs and one steam turbine. |
| (4) | Per a 1999 Consent Decree, Mohave Generating Station ceased operation on December 31, 2005. The PUCN approved establishing regulatory accounts related to the shutdown and decommissioning. See Note 3, Regulatory Actions, of the Notes to Financial Statements for further discussion. |
| (5) | Prior to the shut down, the total summer net capacity of the Mohave Generating Station was 1,580 MW. Southern California Edison is the operating agent and NPC has a 14% interest in the Mohave Generating Station. |
| (6) | NPC has an 11.3% interest in the Navajo Generating Station. The total capacity of the Navajo Generating Station is 2,250 MW. Salt River is the operator (21.7% interest). There are four other partners: U.S. Bureau of Reclamation (24.3% interest), Los Angeles Dept. of Water & Power (21.2% interest), Arizona Public Service Co (14% interest), and Tucson Electric Power (7.5% interest). |
| (7) | Reid Gardner Generating Station Unit No. 4 is co-owned by the CDWR (67.8%) and NPC (32.2%); NPC is the operating agent. NPC is entitled to 25 MW of base load capacity and 232 MW of peaking capacity from that Unit, subject to the following limitations: 1,500 hours/year, 300 hours/month, and 8 hours/day. The total summer net capacity of the Unit, subject to heat input limitation, is 257 MW. Reid Gardner Generating Station Units 1, 2, and 3, subject to heat input limitations, have a combined net capacity of the Station is 300 MW. The Reid Gardner Generating Station summer capacity is 557 MW. |
The following is a list of SPPC’s share of electric generation plants including the type and fuel used to generate, the anticipated 2010 net capacity (MW), and the years that the units became operational.
| | | | | | | Number of | | Summer MW | | Commercial Operation |
| Plant Name | | Type | | Fuel | | Units | | Capacity | | Year |
| Ft. Churchill Generating Station | | Steam | | Gas/Oil | | 2 | | 226 | | 1968, 1971 |
| Tracy Generating Station | | Steam | | Gas/Oil | | 3 | | 244 | | 1963, 1965, 1974 |
Tracy Generating Station 4&5 (1) | | Combined Cycle | | Gas | | 2 | | 104 | | 1996, 1996 |
Tracy Generating Station (2) | | Combined Cycle | | Gas | | 3 | | 541 | | 2008 |
| Clark Mtn. CT's | | Gas | | Gas/Oil | | 2 | | 132 | | 1994, 1994 |
Valmy Generating Station (3) | | Steam | | Coal | | 2 | | 261 | | 1981, 1985 |
Other (4) | | Gas, Diesels | | Propane, Oil | | 21 | | 69 | | 1960-2008 |
| Total | | | | | | 35 | | 1,577 | | |
| (1) | The combined cycle consists of one combustion turbine, one HRSG, and one steam turbine. In 2003, SPPC installed duct burners, which added 15 MW of capacity. |
| (2) | A new combined cycle at Tracy Generating Station consists of 2 gas turbines, 2 HRSGs and 1 steam turbine. It became operational in the summer of 2008. |
| (3) | Valmy Generating Station is co-owned by Idaho Power Company (50%) and SPPC (50%); SPPC is the operator. Valmy Generating Station has a total net capacity of 522 MW. |
| (4) | As of December 31, 2009, there were 3 combustion turbines and 18 diesel units included in the “Other” category. |
Nevada Power Company and Sierra Pacific Power Company
Western United States Energy Crisis Proceedings before the FERC
FERC 206 complaints
In December 2001, the Utilities filed ten complaints with the FERC against various power suppliers, including Enron, under Section 206 of the Federal Power Act seeking price reduction of forward wholesale power purchase contracts entered into prior to the FERC mandated price caps imposed in June 2001 in reaction to the Western United States energy crisis. The Utilities contested the amounts paid for power actually delivered as well as termination claims for undelivered power against terminating suppliers.
In June 2003, the FERC dismissed the Utilities’ Section 206 complaints, stating that the Utilities had failed to satisfy their burden of proof under the strict public interest standard. In July 2003, the Utilities filed a petition for rehearing, but the FERC reaffirmed its June decision (“July decision”). The Utilities appealed this decision to the Ninth Circuit. In December 2006, a three judge panel of the Ninth Circuit overturned the FERC’s July decision and remanded the case back to the FERC for application of factors that the Ninth Circuit outlines in its decision. In May 2007, American Electric Power Service Corporation, Allegheny Energy Supply Company and other interested parties filed petitions for certiorari (“Petitions”) with the U.S. Supreme Court seeking review of the Ninth Circuit’s decision. The Utilities, together with other parties and the FERC, filed their opposition to these Petitions in August 2007. In September 2007, the U.S. Supreme Court granted certiorari. In June 2008, the U.S. Supreme Court rejected the Ninth Circuit’s reasoning in reversing the FERC but nonetheless found that the FERC’s order was defective and should be reversed for other reasons. The case was remanded to the FERC.
The FERC established a formal settlement discussion protocol for bilateral settlement discussions with other respondents, including Allegheny Energy Supply Company, American Electric Power Service Corporation and BP Energy, and stayed the case pending settlement discussions. The Utilities, together with other interested parties including the Nevada Bureau of Consumer Protection (BCP), have settled and resolved all claims against BP Energy (“BP Settlement”). On August 25, 2009, the BP Settlement received final approval by the FERC, under which BP Energy was ordered to settle with NPC for an immaterial amount in return for NPC and the BCP’s release of all claims against BP Energy. On November 19, 2009, the Utilities, together with other interested parties, executed a settlement agreement with American Electric Power Service Corporation (“AEP Settlement”). On December 23, 2009, the AEP Settlement received final approval by the FERC, under which AEP was ordered to settle with the Utilities in return for a release of all claims by the Utilities and BCP against AEP. The Utilities had previously negotiated settlements with Duke Energy Trading and Marketing, Morgan Stanley Capital Group, El Paso Merchant Energy, now known as El Paso Marketing L.P., Calpine Energy Services and Enron. The Utilities continue discussions under FERC settlement procedures with Allegheny Energy Supply Company. Management cannot predict the timing or outcome of a decision in this matter.
Other Legal Matters
NVE and its subsidiaries, through the course of their normal business operations, are currently involved in a number of other legal actions, none of which has had or, in the opinion of management, is expected to have a significant impact on their financial positions or results of operations. See Note 13, Commitments and Contingencies in the Notes to Financial Statements for further discussion of other legal matters.
None.
The following are current executive officers of NVE, NPC and SPPC indicated and their ages as of December 31, 2009. There are no family relationships among them. Officers serve a term which extends to and expires at the annual meeting of the BOD or until a successor has been elected and qualified:
Michael W. Yackira, 58, President and Chief Executive Officer, NVE; President and Chief Executive Officer of NPC; Chief Executive Officer of SPPC
Mr. Yackira was elected to his current position as CEO of NVE effective August 2007. He was previously the Company’s president and chief operating officer from February, 2007 until August, 2007. Prior to that, he served as executive vice president and chief financial officer from December 2003 to February 2007. Prior to that, he was Executive Vice President, Strategy and Policy, from January 2003 to December 2003. Previously Mr. Yackira served as vice president and CFO of Mars Music, Inc. from 2001 to 2002. Prior to that, he was with Florida-based FPL Group, Inc. from 1989 to 2000 where he held such positions as President of FPL Energy, Vice President, Finance and CFO of FPL Group and Senior Vice President of Market and Regulatory Services among other positions. Mr. Yackira also serves as a director of the Edison Electric Institute, the Nevada Development Authority and the Council for a Better Nevada. Mr. Yackira serves on the board of trustees of UNLV Foundation and Las Vegas Chamber of Commerce. Mr. Yackira served as a director on United Way from 2007 to 2009. He further served as a director on the American Heart Association Mr. Yackira holds a Bachelor of Science degree in accounting from Lehman College, City University of New York. Mr. Yackira is a CPA. Mr. Yackira was elected a director of NVE, NPC and SPPC in February 2007.
Jeffrey L. Ceccarelli, 55, Senior Vice President, Energy Supply, NVE; President, SPPC
Mr. Ceccarelli was elected to his present position as Senior Vice President, Energy Supply on June 1, 2009. Prior to that, he served as Senior Vice President, Service Delivery & Operations since October 2004. From June 2000, he held the position of President, SPPC. He previously held the position of Vice President, Distribution Services, New Business, in July 1999 for SPPC and NPC. A civil engineer, Mr. Ceccarelli has been with SPPC since 1972.
Roberto R. Denis, 60, Senior Vice President, Energy Delivery, NVE
Mr. Denis was elected to his present position of Senior Vice President, Energy Delivery on June 1, 2009 and holds the same position at NPC and SPPC. Prior to that he held the position of Senior Vice President, Energy Supply since October 2004. From August 2003 to October 2004 he held the position of Vice President, Energy Supply, for NPC and SPPC. From 2001 to 2003, he held the position of Vice President, Market & Regulatory Affairs, at FPL Energy, LLC., a subsidiary of FPL Group. Prior to that, he held the position of Vice President of Market Services from 1999 to 2001 at FPL Energy, LLC.
Paul J. Kaleta, 54, Senior Vice President, General Counsel, Shared Services, and Secretary, NVE
Mr. Kaleta was elected to his present position in February 2006, and holds the same position at NPC and SPPC. Previously he was General Counsel for Koch Industries, Inc. and various Koch subsidiaries from 1998 to 2005. Prior to that, he was Vice President and General Counsel of Niagara Mohawk Power Company for 8 years and, before that, in the private practice of law as an associate with Skadden, Arps, Slate, Meagher & Flom and as an associate and then equity member with Swidler Berlin, Chtd. (now Bingham McCutchen), both in Washington, D.C., for a total of 9 years. Mr. Kaleta serves as a Director of the United Way of Southern Nevada since June 2009. Mr. Kaleta also serves as a Director of I Have a Dream Foundation.
Tony F. Sanchez, III, 43, Senior Vice President, Public Policy and External Affairs, NVE
Mr. Sanchez was elected to his current position effective August 1, 2007, and holds the same position at NPC and SPPC. Prior to joining NVE, Mr. Sanchez was a partner in the Nevada based law firm of Jones Vargas. Prior to that, Mr. Sanchez served as executive assistant to Nevada’s then-Governor Bob Miller from 1998 to 1999. From 1995 to 1998, he held the position of assistant General Counsel for the PUCN. From 1992 to 1995, he worked as associate legislative counsel in Washington, D.C.
handling energy and natural resource issues for Nevada's then-U.S. Senator Richard H. Bryan. He further currently serves on the boards of the Latin Chamber of Commerce Foundation, Nevada Partners, the Nevada Mining Association, the Clark County Public Education Foundation and the Nevada Partnership for Homeless Youth.
E. Kevin Bethel, 46, Vice President, Interim Chief Financial Officer, Chief Accounting Officer, and Controller, NVE
Mr. Bethel was elected as Interim Chief Financial Officer of NVE, NPC and SPPC effective February 2, 2010. He joined NVE as Vice President and Chief Accounting Officer of NVE on November 2, 2007, effective December 10, 2007, and holds the same position at NPC and SPPC. He was subsequently elected Corporate Controller of NVE as well as Vice President, Chief Accounting Officer, and Controller of NPC and SPPC on February 8, 2008. Prior to joining NVE, Mr. Bethel served as Assistant Controller for American Electric Power, Inc. (AEP), in Columbus, Ohio where he held management positions in accounting from 2001 to 2007. From 2000 to 2001, he held a management position with CSW Energy until they merged with AEP. Before that, he held accounting management positions with The Williams Company in 1999, Central & South West Services from 1994 to 1999 and the Public Service Company of Oklahoma from 1991 to 1994. Mr. Bethel is a CPA.
Thomas R. Fair, 63, Vice President, Renewables
Mr. Fair was elected to his present position in February 2009, and holds the same position at NPC and SPPC. Previously he was Executive, Renewable Energy from 2006 to 2009. Prior to that, he was Director, Environmental Services since 2004. Mr. Fair has held a number of executive positions in renewable energy development and environmental affairs with such companies as Florida-based FPL Energy and Niagara Mohawk.
Kevin C. Geraghty, 44, Vice President Power Generation
Mr. Geraghty was elected to his present position in February, 2009, and holds the same position at NPC and SPPC. Previously, he was Executive, Generation since joining the company in June, 2008. Prior to that, he was at Allegheny Energy Supply, where he directed generation facilities and regions throughout the nation, including several years in the southwestern part of the United States.
Gary L. Lavey, 51, Vice President, Internal Audit, NVE
Mr. Lavey was elected as Vice President, Internal Audit of NVE in October, 2008, effective January 1, 2009. He reports to the Audit Committee of the BOD. Prior to joining NVE, Mr. Lavey was vice president of Risk Management for CNG Financial (a privately held company) from 2006 to 2008. Prior to CNG, he held the position of Vice President of Global Risk Management for Cinergy Corporation (a publicly held company) from 1999 to 2006 and was President of their captive insurance company. Before that he held risk management positions at Ameren Energy Inc. (a publicly held company) and LG&E Energy Marketing Inc. (a subsidiary of a publicly held company). Mr. Lavey is a CPA and began his career with PricewaterhouseCoopers.
Mary O. Simmons, 54, Vice President, External Affairs, NVE
Ms. Simmons was elected to her current position in May 2008, and holds the same position at NPC and SPPC. From November 2004 to May 2008, she held the position of Vice President, External Affairs, SPPC. From May 2001 to November 2004, she held the position of Vice President, Rates and Regulatory Affairs, for NPC and SPPC. Previously she held the position of Controller for NVE and SPPC since 1997 and held the same position with NPC beginning in 1999. Ms. Simmons serves on the Board of Lear Theatre, Great Basin National Park Foundation, Nevada Volunteers and UNR Athletic Association. Ms. Simmons is a CPA and has been with NVE since 1985.
Robert E. Stewart, 61, Senior Vice President, Customer Relationship, NVE
Mr. Stewart was elected to his current position in August 9, 2009, and holds the same position at NPC and SPPC. From February 2008 to August 2009, he was the Vice President, Marketing for NVE. From January 1997 to February 2008, he worked as an independent consultant in several industries, including energy services and telecommunications. He was Vice President of Marketing for FPL Group, Inc. from June 1991 to November 1996. Prior to that, he worked at GTE for 19 years and was Vice President of Product Management at GTE Telephone Operations from June 1989 to June 1991. Mr. Stewart serves as Director of YMCA of Southern Nevada.
Punam N. Mathur, 48, Vice President, Human Resources, NVE
Ms. Mathur was elected to her current position in April 2009. Prior to joining NVE, Ms. Mathur was Senior Vice President, Corporate Diversity and Community Affairs and a Corporate Officer of MGM MIRAGE, a gaming entertainment company, since 2005. She was Vice President of Corporate Diversity and Community Affairs of MGM MIRAGE from 2000-2005, and Director of Government Affairs and Community Relations for Mirage Resorts from 1996-2000. Prior to that she held various positions with the
Las Vegas Chamber of Commerce between 1990 and 1996, including Director of Marketing, Vice President of Marketing and Senior Vice President of Government Affairs. Ms. Mathur is Chairwoman of the Board of Three Square, a not-for-profit organization, and Executive Committee Co-Chair of NV Partnership for Inclusive Education. She serves on the UNLV President’s Task Force on Diversity, Nevada State College’s Diversity council and as a Board Member on the National Minority Supplier Development Council.
Mario Villar, 58, Vice President, Transmission, NVE
Mr. Villar was elected to his present position in February, 2010, and holds the same position at NPC and SPPC. Previously, he was Executive, Transmission since October, 2007, and Director of Resource Planning and Analysis since joining the company in April 2005. From 2003 until joining NVE, he was an independent energy consultant on transmission and regulatory matters. Prior to that, he was with FPL Group, Inc. where he held a number of positions in distribution, system planning, bulk power markets, power contracts, transmission tariffs and contracts, state and federal regulatory affairs, and resource planning. Mr. Villar holds a Bachelor of Science in Electrical Engineering and a Juris Doctor.
PART II
| MARKET FOR REGISTRANT’S COMMON EQUITY, RELATED STOCKHOLDER MATTERS AND ISSUER PURCHASES OF EQUITY SECURITIES (NVE) |
NVE’s Common Stock is traded on the New York Stock Exchange (symbol NVE). Dividends paid per share and high and low sale prices of the Common Stock as reported for 2009 and 2008 are as follows:
| | | Dividends declared per share | | | 2009 | | | 2008 | |
| | | 2009 | | | 2008 | | | High | | | Low | | | High | | | Low | |
| First Quarter | | $ | 0.10 | | | $ | 0.08 | | | $ | 11.15 | | | $ | 7.96 | | | $ | 17.03 | | | $ | 11.64 | |
| Second Quarter | | | 0.10 | | | | 0.08 | | | | 11.17 | | | | 9.27 | | | | 14.26 | | | | 12.60 | |
| Third Quarter | | | 0.10 | | | | 0.08 | | | | 12.49 | | | | 10.52 | | | | 12.77 | | | | 8.90 | |
| Fourth Quarter | | | 0.11 | | | | 0.10 | | | | 12.75 | | | | 11.19 | | | | 10.01 | | | | 6.90 | |
Number of Security Holders:
Title of Class Number of Record Holders
Common Stock: $1.00 Par Value As of February 18, 2010: 15,034
Dividends are considered periodically by the BOD and are subject to factors that ordinarily affect dividend policy, such as current and prospective earnings, current and prospective business conditions, regulatory factors, NVE’s financial condition and other matters within the discretion of the BOD, as well as dividend restrictions set forth in NVE’s 8.625% Senior Notes due 2014, 7.803% Senior Notes due 2012 and 6.75% Senior Notes due 2017.
On February 2, 2010, NVE’s BOD declared a quarterly cash dividend of $0.11 per share payable on March 17, 2010 to common shareholders of record on March 2, 2010.
There is no guarantee that NVE will continue to pay dividends in the future, or that the dividends will be paid at the same amount or with the same frequency. See Note 8, Debt Covenant and Other Restrictions of the Notes to Financial Statements, for a description of the restrictions on NPC’s and SPPC’s ability to pay dividends to NVE and on NVE’s ability to pay dividends on its common stock.
For information on the equity compensation plans, see Item 12.
In the past, the financial statements for NVE and the Utilities were presented in a traditional utility format; however, many utilities have partially or completely departed from the traditional utility format. As a result, NVE and the Utilities elected to present current and prior period financial statements and related financial data in a similar commercial format and have reclassified prior year information to conform with the current period presentation. The change in format did not have an effect on net income.
See Item 7, Management’s Discussion and Analysis of Financial Condition and Results of Operations, for a discussion of factors that may affect the future financial condition and results of operations of NVE, NPC and SPPC (dollars in thousands, except per share amounts):
| NV ENERGY, INC. |
| | | |
| | | Year ended December 31, |
| | | 2009 | | | 2008 | | | 2007 | | | 2006 (2) | | | 2005 |
| | | | | | | | | | | | | | | |
| Operating Revenues | | $ | 3,585,798 | | | $ | 3,528,113 | | | $ | 3,600,960 | | | $ | 3,355,950 | | | $ | 3,030,242 |
| | | | | | | | | | | | | | | | | | | | |
| Operating Income | | $ | 564,083 | | | $ | 552,079 | | | $ | 489,722 | | | $ | 580,368 | | | $ | 397,863 |
| | | | | | | | | | | | | | | | | | | | |
| | | | | | | | | | | | | | | | | | | | |
| Net Income | | $ | 182,936 | | | $ | 208,887 | | | $ | 197,295 | | | $ | 277,451 | | | $ | 82,237 |
| | | | | | | | | | | | | | | | | | | | |
| Net Income | | | | | | | | | | | | | | | | | | | |
| Per Average Common Share - Basic and Diluted | | $ | 0.78 | | | $ | 0.89 | | | $ | 0.89 | | | $ | 1.33 | | | $ | 0.44 |
| | | | | | | | | | | | | | | | | | | | |
| | | | | | | | | | | | | | | | | | | | |
| Total Assets | | $ | 11,413,463 | | | $ | 11,347,870 | (1) | | $ | 9,468,119 | | | $ | 8,832,076 | | | $ | 7,870,546 |
| | | | | | | | | | | | | | | | | | | | |
| Long-Term Debt (not including current maturities) | | $ | 5,303,357 | | | $ | 5,266,982 | | | $ | 4,137,864 | | | $ | 4,001,542 | | | $ | 3,817,122 |
| | | | | | | | | | | | | | | | | | | | |
| Dividends Declared Per | | | | | | | | | | | | | | | | | | | |
| Common Share | | $ | 0.41 | | | $ | 0.34 | | | $ | 0.16 | | | $ | - | | | $ | - |
| (1) | Total assets increased significantly in 2008 primarily due to an increase in plant in service as a result of NPC's acquisition of the Higgins Generating Station, the completion of the Clark Peaking Units by NPC and the completion of the Tracy Generating Station by SPPC. Also contributing to the increase was an increase in Regulatory Assets and Regulatory Assets for Pension Plans. |
| (2) | Income for the year ended December 31, 2006 includes reinstatement of deferred energy of approximately $116.2 million net of taxes and a $40.9 million net of taxes gain on the sale of TGPC's partnership interest in TGTC. |
| NEVADA POWER COMPANY |
| | | | | | | | | | | | | | | |
| | | Year ended December 31, |
| | | 2009 | | | 2008 | | | 2007 | | | 2006 (2) | | | 2005 |
| | | | | | | | | | | | | | | |
| Operating Revenues | | $ | 2,423,377 | | | $ | 2,315,427 | | | $ | 2,356,620 | | | $ | 2,124,081 | | | $ | 1,883,267 |
| | | | | | | | | | | | | | | | | | | | |
| Operating Income | | $ | 396,362 | | | $ | 369,966 | | | $ | 358,412 | | | $ | 443,053 | | | $ | 275,252 |
| | | | | | | | | | | | | | | | | | | | |
| Net Income | | $ | 134,284 | | | $ | 151,431 | | | $ | 165,694 | | | $ | 224,540 | | | $ | 132,734 |
| | | | | | | | | | | | | | | | | | | | |
| Total Assets | | $ | 8,096,371 | | | $ | 7,904,147 | (1) | | $ | 6,377,369 | | | $ | 5,987,515 | | | $ | 5,173,921 |
| | | | | | | | | | | | | | | | | | | | |
| Long-Term Debt (not including current maturities) | | $ | 3,535,440 | | | $ | 3,385,106 | | | $ | 2,528,141 | | | $ | 2,380,139 | | | $ | 2,214,063 |
| | | | | | | | | | | | | | | | | | | | |
| Dividends Declared - Common Stock | | $ | 112,000 | | | $ | 44,000 | | | $ | 25,667 | | | $ | 48,917 | | | $ | 35,258 |
| (1) | Total assets increased significantly in 2008 primarily due to an increase in plant in service as a result of NPC's acquisition of the Higgins Generating Station, the completion of the Clark Peaking Units by NPC. Also contributing to the increase was an increase in Regulatory Assets and Regulatory Assets for Pension Plans. |
| (2) | Income from continuing operations, for the year ended December 31, 2006 includes reinstatement of deferred energy of approximately $116.2 million net of taxes. |
| SIERRA PACIFIC POWER COMPANY |
| | | | | | | | | | | | | | | |
| | | Year ended December 31, |
| | | 2009 | | | 2008 | | | 2007 | | | 2006 | | | 2005 |
| | | | | | | | | | | | | | | |
| Operating Revenues | | $ | 1,162,393 | | | $ | 1,212,661 | | | $ | 1,244,297 | | | $ | 1,230,230 | | | $ | 1,145,697 |
| | | | | | | | | | | | | | | | | | | | |
| Operating Income | | $ | 170,589 | | | $ | 185,959 | | | $ | 135,948 | | | $ | 143,587 | | | $ | 142,342 |
| | | | | | | | | | | | | | | | | | | | |
| Net Income | | $ | 73,085 | | | $ | 90,582 | | | $ | 65,667 | | | $ | 57,709 | | | $ | 52,074 |
| | | | | | | | | | | | | | | | | | | | |
| Total Assets | | $ | 3,342,145 | | | $ | 3,464,435 | (1) | | $ | 2,979,893 | | | $ | 2,807,837 | | | $ | 2,546,301 |
| | | | | | | | | | | | | | | | | | | | |
| Preferred Stock | | $ | - | | | $ | - | | | $ | - | | | $ | - | | | $ | 50,000 |
| | | | | | | | | | | | | | | | | | | | |
| Long-Term Debt (not including current maturities) | | $ | 1,282,225 | | | $ | 1,395,987 | | | $ | 1,084,550 | | | $ | 1,070,858 | | | $ | 941,804 |
| | | | | | | | | | | | | | | | | | | | |
| Dividends Declared - Common Stock | | $ | 32,000 | | | $ | 233,000 | | | $ | 12,833 | | | $ | 24,619 | | | $ | 23,933 |
| | | | | | | | | | | | | | | | | | | | |
| Dividends Declared - Preferred Stock | | $ | - | | | $ | - | | | $ | - | | | $ | 975 | | | $ | 3,900 |
| (1) | Total assets increased significantly in 2008 primarily due to an increase in plant in service as a result of the completion of the Tracy Generating Station. Also contributing to the increase was an increase in Regulatory Assets and Regulatory Assets for Pension Plans. |
| MANAGEMENT’S DISCUSSION AND ANALYSIS OF FINANCIAL CONDITION AND RESULTS OF OPERATIONS |
Forward-Looking Statements
The information in this Form 10-K includes forward-looking statements within the meaning of the Private Securities Litigation Reform Act of 1995. These forward-looking statements relate to anticipated financial performance, management’s plans and objectives for future operations, business prospects, outcome of regulatory proceedings, market conditions and other matters.
Words such as “anticipate,” “believe,” “estimate,” “expect,” “intend,” “plan” and “objective” and other similar expressions identify those statements that are forward-looking. These statements are based on management’s beliefs and assumptions and on information currently available to management. Actual results could differ materially from those contemplated by the forward-looking statements. In addition to any assumptions and other factors referred to specifically in connection with such statements, factors that could cause the actual results of NVE, NPC or SPPC; (NPC and SPPC are collectively referred to as the Utilities) to differ materially from those contemplated in any forward-looking statement include, among others, the following:
| (1) | economic conditions both nationwide and regionally, including availability and cost of credit, inflation rates, monetary policy, unemployment rates, customer bankruptcies, weaker housing markets, a decrease in tourism, particularly in southern Nevada, and cancelled or deferred hotel construction projects, each of which affect customer growth, customer collections, customer demand and usage patterns; |
| (2) | changes in the rate of industrial, commercial and residential growth in the service territories of the Utilities, including the effect of weaker housing markets, increased unemployment, and energy conservation programs, which could affect the Utilities’ ability to accurately forecast electric and gas demand; |
| (3) | changes in environmental laws or regulations, including the imposition of limits on emissions of carbon dioxide or other greenhouse gases from electric generating facilities, which could significantly affect our existing operations as well as our construction program; |
| (4) | employee workforce factors, including changes in and renewals of collective bargaining unit agreements, strikes or work stoppages, the ability to adjust the labor cost structure to changes in growth within our service territories, and potential difficulty in recruiting new talent to mitigate losses in critical knowledge and skill areas due to an aging workforce; |
| (5) | the ability and terms upon which NVE, NPC and SPPC will be able to access the capital markets to support their requirements for working capital, particularly, their options with respect to replacing their expiring credit facilities, including amounts necessary for construction and acquisition costs and other capital expenditures, as well as to finance deferred energy costs, particularly in the event of: continued volatility in the global credit markets, changes in availability and cost of capital either due to market conditions or as a result of unfavorable rulings by the PUCN, a downgrade of the current debt ratings of NVE, NPC or SPPC, and/or interest rate fluctuations; |
| (6) | whether the Utilities can procure and/or obtain sufficient renewable energy sources in each compliance year to satisfy the Portfolio Standard in the State of Nevada; |
| (7) | unseasonable or severe weather, drought, threat of wildfire and other natural phenomena, which could affect the Utilities’ customers’ demand for power, could seriously impact the Utilities’ ability and/or cost to procure adequate supplies of fuel or purchased power, and could affect the amount of water available for electric generating plants in the Southwestern U.S., and could have other adverse effects on our business; |
| (8) | whether the Utilities will be able to continue to obtain fuel and power from their suppliers on favorable payment terms and favorable prices, particularly in the event of unanticipated power demands (for example, due to unseasonably hot weather), suspension of a hedging program, physical availability, sharp increases in the prices for fuel (including increases in long term transportation costs) and/or power, or a ratings downgrade; |
| (9) | wholesale market conditions, including availability of power on the spot market and the availability to enter into gas financial hedges with creditworthy counterparties, which affect the prices the Utilities have to pay for power as well as the prices at which the Utilities can sell any excess power; |
| (10) | whether the Nevada Supreme Court's January 28, 2010 ruling in Great Basin Water Network v. Nevada State Engineer could impact some of NVE's pending water appropriation applications and could impact the pending water appropriation applications of other third parties, which, respectively, could have an adverse effect on the Utilities' water rights and/or the water supply necessary for the operation of the Utilities' generating units, and, with respect to the pending water appropriation applications of third parties, may affect the water supply to the Utilities' service territories, which could have an adverse impact on future growth and customer usage patterns; |
| (11) | whether the Utilities will be able to continue to pay NVE dividends under the terms of their respective financing and credit agreements and limitations imposed by the Federal Power Act; |
| (12) | unfavorable or untimely rulings in rate or other cases filed or to be filed by the Utilities with the PUCN, including the periodic applications to recover costs for fuel and purchased power that have been recorded by the Utilities in their deferred energy accounts, and deferred natural gas costs recorded by SPPC for its gas distribution business; |
| (13) | construction risks, such as delays in permitting, changes in environmental laws, difficulty in securing adequate skilled labor, cost and availability of materials and equipment (including escalating costs for materials, labor and environmental compliance due to timing delays and other economic factors which may affect vendor access to capital), equipment failure, work accidents, fire or explosions, business interruptions, possible cost overruns, delay of in-service dates, and pollution and environmental damage; |
| (14) | the discretion of NVE's BOD regarding NVE's future common stock dividends based on the BOD periodic consideration of factors ordinarily affecting dividend policy, such as current and prospective financial condition, earnings and liquidity, prospective business conditions, regulatory factors, and restrictions in NVE's and the Utilities' agreements; |
| (15) | further increases in the unfunded liability or changes in actuarial assumptions, the interest rate environment and the actual return on plan assets for our pension plan, which can affect future funding obligations, costs and pension plan liabilities; |
| (16) | the effect that any future terrorist attacks, wars, threats of war or pandemics may have on the tourism and gaming industries in Nevada, particularly in Las Vegas, as well as on the national economy in general; |
| (17) | changes in tax or accounting matters or other laws and regulations to which NVE or the Utilities are subject; |
| (18) | the effect of existing or future Nevada, California or federal legislation or regulations affecting electric industry restructuring, including laws or regulations which could allow additional customers to choose new electricity suppliers or change the conditions under which they may do so; |
| (19) | changes in the business or power demands of the Utilities’ major customers, including those engaged in gold mining or gaming, which may result in changes in the demand for services of the Utilities, including the effect on the Nevada gaming industry of the opening of additional gaming establishments in California, other states and internationally; and |
| (20) | unusual or unanticipated changes in normal business operations, including unusual maintenance or repairs. |
Other factors and assumptions not identified above may also have been involved in deriving these forward-looking statements, and the failure of those other assumptions to be realized, as well as other factors, may also cause actual results to differ materially from those projected. NVE, NPC and SPPC assume no obligation to update forward-looking statements to reflect actual results, changes in assumptions or changes in other factors affecting forward-looking statements.
NOTE REGARDING RELIANCE ON STATEMENTS IN OUR CONTRACTS
In reviewing the agreements filed as exhibits to this Annual Report on Form 10-K, please remember that they are filed to provide you with information regarding their terms and are not intended to provide any other factual or disclosure information about NVE, the Utilities or the other parties to the agreements. The agreements contain representations and warranties by each of the parties to the applicable agreement. These representations and warranties have been made solely for the benefit of the other parties to the applicable agreement and:
| • | should not in all instances be treated as categorical statements of fact, but rather as a way of allocating the risk to one of the parties to the agreement if those statements prove to be inaccurate; |
| • | have been qualified by disclosures that were made to the other party in connection with the negotiation of the applicable agreement, which disclosures are not necessarily reflected in the agreement; |
| • | may apply standards of materiality in a way that is different from what may be viewed as material to investors; and |
| • | were made only as of the date of the applicable agreement or such other date or dates as may be specified in the agreement and are subject to more recent developments. |
Accordingly, these representations and warranties may not describe the actual state of affairs as of the date they were made or at any other time.
Management’s Discussion and Analysis of Financial Condition and Results of Operations explains the general financial condition and the results of operations of NVE and its two primary subsidiaries, NPC and SPPC, collectively referred to as the “Utilities” (references to “we,” “us” and “our” refer to NVE and the Utilities collectively), and includes discussion of the following:
| • | | Critical Accounting Policies and Estimates: |
| | | | | |
| | | § | | Recent Pronouncements |
| | | | | |
| • | | For each of NVE, NPC and SPPC: |
| | | | | |
| | | § | | Results of Operations |
| | | § | | Analysis of Cash Flows |
| | | § | | Liquidity and Capital Resources |
| | | | | |
| • | | Energy Supply (Utilities) |
| | | |
| • | | Regulatory Proceedings (Utilities) |
NVE’s Utilities operate three regulated business segments which are NPC electric, SPPC electric and SPPC natural gas. The Utilities are public utilities engaged in the generation, transmission, distribution and sale of electricity and, in the case of SPPC, sale of natural gas. Other operations consist mainly of unregulated operations and the holding company operations. The Utilities are the principal operating subsidiaries of NVE and account for substantially all of NVE’s assets and revenues. NVE, NPC and SPPC are separate filers for SEC reporting purposes and as such this discussion has been divided to reflect the individual filers (NVE, NPC and SPPC), except for discussions that relate to all three entities or the Utilities.
The Utilities are regulated by the PUCN and, for the California electric service territory of SPPC, the CPUC, with respect to rates, standards of service, siting of and necessity for generation and certain transmission facilities, accounting, issuance of securities and other matters with respect to generation, distribution and transmission operations. The FERC has jurisdiction under the Federal Power Act with respect to wholesale rates, service, interconnection, accounting, and other matters in connection with the Utilities’ sale of electricity for resale and interstate transmission. The FERC also has jurisdiction over the natural gas pipeline companies from which the Utilities take service. As a result of regulation, many of the fundamental business decisions of the Utilities, as well as the ROR they are permitted to earn on their utility assets, are subject to the approval of governmental agencies.
The Utilities’ revenues and operating income are subject to fluctuations during the year due to impacts that seasonal weather, rate changes, and customer usage patterns have on demand for electric energy and resources. NPC is a summer peaking utility experiencing its highest retail energy sales in response to the demand for air conditioning. SPPC’s electric system peak typically occurs in the summer, while its gas business typically peaks in the winter. The variations in energy usage due to varying weather, customer growth and other energy usage patterns necessitates a continual balancing of loads and resources and purchases and sales of energy under short and long term contracts. As a result, the prudent management and optimization of available resources has a direct effect on the operating and financial performance of the Utilities. Additionally, the timely recovery of purchased power and fuel costs, and other costs, and the ability to earn a fair return on investments are essential to the operating and financial performance of the Utilities.
Overview of Major Factors Affecting Results of Operations
NVE recognized net income of $182.9 million compared to $208.9 million in 2008. NPC’s gross margin increased $114.7 million, primarily due to increased rates as a result of NPC’s 2008 GRC, effective July 1, 2009. SPPC’s electric gross margin increased $33.7 million while its gas gross margin remained relatively flat. SPPC’s electric gross margin increased primarily due to SPPC’s 2007 GRC, effective July 1, 2008. Consolidated net income decreased primarily due to an increase in other operating and maintenance expenses, depreciation and interest charges, some of which are costs related to the purchase of the Higgins Generating Station and the construction of the Clark Peaking Units, which were not included in rates prior to July 1, 2009 and a decrease in AFUDC, partially offset by higher revenues. Also contributing to the decrease in net income were severance costs as a result of NVE’s reduction in workforce, discussed further in Note 17, Severance Programs of the Notes to Financial Statements.
During 2008, NVE’s net income was $208.9 million compared to $197.3 million in 2007. Earnings were higher primarily due to an increase in gross margin at both Utilities. At NPC gross margin increased primarily due to an increase in BTGR as a result of NPC’s 2006 GRC, effective June 1, 2007, and increased customer growth; partially offsetting these increases was a decrease in
customer usage due to cooler weather and a change in customer usage patterns. At SPPC gross margin increased primarily due to an increase in BTGR revenue as a result of SPPC’s 2007 GRC, effective July 1, 2008, increased customer growth and in 2007 a charge of approximately $9.2 million, net of taxes, for deferred energy disallowed. Partially offsetting these increases was a decrease in customer usage primarily due to cooler summer weather. Partially offsetting the increase in gross margin was higher interest expense and in 2007, NPC recorded income of approximately $7.2 million, net of taxes, for reinstated interest on deferred energy, which was expensed in prior years.
2009 Key Objectives
| · | Management of Energy Resources |
| | § | Energy Efficiency and Conservation Programs |
| | § | Purchase and Development of Renewable Energy Projects |
| | § | Construction of Generating Facilities |
| · | Management of Environmental Matters |
| · | Management of Regulatory Filings |
| · | Further Broaden Access to Capital |
2009 Accomplishments
Management of Energy Resources
| · | Energy Efficiency and Conservation Programs – The Utilities continued to aggressively pursue its DSM projects by investing over $60 million in 2009 for DSM. Additionally, the Utilities reported in their Portfolio Standard Annual Report for Compliance Year 2008 that they met the maximum PEC DSM level of 25% that may be applied towards the Portfolio Standard for the first time. NVE has installed over 10 million energy efficient compact florescent lamps through 2009. The Utilities expanded their Demand Response Program to 146 MW in 2009 creating additional resources during hot peak summer months. NVE’s Commercial New Construction Program provided a rebate to City Center. City Center installed energy efficiency measures to provide a savings equivalent to power 8,800 homes annually. Additionally, NVE has been awarded a $138 million grant in stimulus funding from the DOE specifically for NVE’s $301 million ASD initiative. This grant was made available through the American Recovery and Reinvestment Act. The ASD initiative will provide NVE with the Smart Grid infrastructure necessary to enable widespread use of smart meters, enabling customers to more directly manage their energy usage. The ASD initiative entails the deployment of a delivery mechanism that sets a new, more capable foundation for NVE’s demand response and energy efficiency and conservation programs. |
| | |
| · | Purchase and Development of Renewable Energy Projects – In 2009, progress continued on development of projects using wind, geothermal and recovered energy generation technologies. NPC also received PUCN approval of purchases of an additional 32 MW of output from three geothermal plants that came online in 2009, and approximately 49MW of output from two solar projects and a landfill gas project to be completed in 2010/11. Additionally, in 2009 the PUCN issued its order finding the Utilities fully compliant with the Portfolio Standard for 2008. In 2009, legislation was passed in Nevada that permits renewable energy purchased outside Nevada to qualify towards the Portfolio Standard. The PUCN also granted a waiver enabling NPC to enter into an agreement with a neighboring utility for a short-term purchase of renewable energy and associated credits. |
| | |
| · | Construction of Generating Facilities– In 2009, progress continued on the construction of a 500 MW (nominally rated) natural gas generating station at the existing Harry Allen Generating Station, which is expected to be operational by summer 2011. |
Management of Environmental Matters
As of December 31, 2009, NPC spent a cumulative $150.2 million on environmental upgrades. This included the completion of pollution control upgrades at both the Reid Gardner Generating Station and the Clark Generating Station, which have already resulted in significant emissions reductions at both facilities.
Management of Regulatory Filings
In December 2008, NPC filed its GRC. In June 2009, the PUCN issued its order which resulted in an increase in general rates by $222.7 million, approximately a 9.8% increase, an ROE and ROR of 10.5% and 8.53%, respectively; and authorization to recover the costs of major plant additions, among other items. See Note 3, Regulatory Actions of the Notes to Consolidated Financial Statements for further details. In 2009, legislation was passed in Nevada which requires the PUCN to adopt regulations authorizing an electric utility to recover an amount that is attributable to the measurable and verifiable effects associated with the implementations of efficiency and conservation programs approved by the PUCN. Additionally, legislation was passed that changes the timing of the
Utilities general rate cases such that rates will go into effect in January rather than July, which is the Utilities peak season. This measure will soften the impact of rate increases on the Utilities customers.
Further Broaden Access to Capital
NVE and the Utilities maintained sufficient liquidity to meet their operating and construction cost needs, despite the economic recession and the uncertainty in the credit markets. In 2009, NPC issued approximately $625 million of G&R Mortgage Notes, and SPPC issued $150 million of G&R Mortgage Notes. Additionally, the Utilities purchased, redeemed and converted several series of notes. In 2009, the Utilities also maintained their credit ratings for the senior secured debt at investment grade. Furthermore, NVE and the Utilities took proactive steps to reduce capital expenditures as the Utilities service territory transitioned from a time of high growth to a period of slower growth. See Financing Transactions in the Utilities' Liquidity and Capital Resources sections.
2010 and Beyond Objectives and Challenges
In 2010, management’s key objectives will remain focused on implementing our three part strategy of energy efficiency and conservation programs for our customers, purchase and development of renewable energy projects and construction of generating facilities and expansion of transmission capability. Another key objective will be to obtain PUCN approval of NPC’s IRP and the filing of SPPC’s IRP. The approval of NPC’s IRP will enable us to fulfill our three part strategy by increasing the dollars spent on DSM projects, implementing our ASD initiative, approval of the ON Line transmission line, which will connect the northern and southern service area and also provide greater access to renewable energy resources. However, due to the economic uncertainty in Nevada, NVE’s execution of the three part strategy will be a significant challenge. Another challenge will be to further broaden our access to capital to fund the three-part strategy and maintain sufficient liquidity.
Economic Conditions
Although the economy in the U.S. is starting to show signs of recovery from the recession, Nevada continues to struggle. As of December 2009, the unemployment rate in Nevada was 13.0%, up 4.6% from a year ago. As of November 2009, taxable sales have declined 10.9% while gaming revenues have increased to 4.3% and visitor volume remained flat compared to November 2008.
Tourism and gaming remain southern Nevada’s leading industries, driving construction activity, the housing market and employment in the region, and together comprising one of NPC’s largest classes of customers. In addition to employment, management continues to monitor hotel room additions and the hotel/motel occupancy rate in Las Vegas as signs of future growth in customers and customer usage. As of December 2009, the hotel/motel occupancy rate in Las Vegas has decreased approximately 2.0% from a year ago. The estimated room growth rate for 2009 was 6.1%, concentrated primarily in City Center which added approximately 6,000 rooms. In 2010, room growth is expected to increase by 2.7% and then slow to 0.1% in 2011. The increase in room growth for 2010 is primarily due to The Cosmopolitan Resort & Casino, which is expected to add approximately 3,000 rooms to Las Vegas. Gaming properties in southern Nevada are experiencing financial problems, including difficulties meeting debt payments, bankruptcies and delays or termination of construction projects which may further decrease the projected growth in rooms or offset any increases. In southern Nevada, construction activity, another leading indicator, has seen a decrease in the number of commercial permits while residential permits has remained relatively flat. Construction employment has decreased 27.2% as of December 2009 compared to December 2008.
SPPC’s service territory, which consists primarily of Washoe County, has also been affected by the recessionary environment. Unemployment in Washoe County was at 12.7% as of December 2009. Construction employment decreased 26.5% from December 2008 to December 2009. Taxable sales decreased 13%, and gaming revenues decreased 4.2% as of November 2009 compared to November 2008. Other economic conditions affecting Nevada include the national decrease in real estate market activity which makes it more difficult for individuals and businesses to sell their properties in order to relocate to Nevada.
As the Utilities’ service territories continue to endure economically, management will continue to place a significant emphasis on evaluating the foregoing economic indicators and their effect on various interrelated factors including, but not limited to:
| • | customer growth; |
| • | customer usage; |
| • | revenues; |
| • | load factors; |
| • | future capital projects and capital requirements; |
| • | managing operating and maintenance expenses within projected revenue growth without compromising safety, reliability and efficiency; |
| • | our liquidity and ability to access capital markets; |
| • | collections on accounts receivable; |
| • | counterparty risk; and |
| • | workforce reduction. |
Management cannot predict when economic recovery may occur in Nevada, but expects that the Nevada economy will continue to struggle for the next several years. As such, a significant challenge for us will be to manage costs, while remaining steadfast in carrying out our three part strategy of the energy supply plan which includes energy efficiency and conservation programs; purchase and development of renewable energy projects and expansion of traditional generating capacity and transmission capability to move energy throughout the state. In response to this challenge, the three part strategy will become more focused on projects that will allow us to leverage existing assets, improve transmission capabilities which is necessary for the Utilities to meet their Portfolio Standard, discussed below, further develop the ASD initiative, which will allow us to reduce our cost structure and future capital expenditures and effectively contain capital and operating costs. Effective capital and operating cost containment began during 2009 by the reduction and delay of capital expenditures and implementation of severance programs as discussed further in Note 17, Severance Programs, in the Notes to Financial Statements.
Three Part Strategy
Beginning in 2007, NVE embarked on a three part energy supply strategy to manage resources against our load by encouraging energy efficiency and conservation programs, the purchase and development of renewable energy projects, construction of generating facilities, and expansion of transmission capability in an effort to reduce our reliance on purchased power.
Energy Efficiency and Conservation Programs
The Utilities current 2010 budget includes approximately $26.4 million for energy efficiency and conservation programs. However, NPC has requested approval of an additional $81.7 million for energy efficiency and conservation programs in its 2009 IRP. As such, the budget for 2010 may be revised based on the decision by the PUCN which is expected in August 2010. Furthermore, the final amount may be adjusted by numerous factors, such as the economy, the impact of federal government stimulus legislation, performance of existing and new programs.
In addition, NVE has been awarded a $138 million grant in stimulus funding from the DOE specifically for NVE’s $301 million ASD initiative. The ASD initiative will provide NVE with the Smart Grid infrastructure necessary to enable widespread use of smart meters, enabling customers to more directly manage their energy usage. The ASD initiative entails the deployment of a delivery mechanism that sets a new, more capable foundation for NVE’s demand response and energy efficiency and conservation programs.
NVE has submitted a plan in NPC’s 2009 IRP filed in February 2010 with a proposed company investment of $95 million and a demand response program budget of $16 million. SPPC’s investment of $50 million is expected to be submitted in its next IRP amendment filing. An additional $2 million within NVE’s capital budget covers energy management system upgrades in 2010.
The Assistance Agreement between NVE and the DOE is currently being negotiated. Upon execution of the agreement, a pilot program will be implemented with the ultimate goal of completing the installation of approximately 1.5 million smart meters throughout the entire state of Nevada by 2012, making Nevada one of the first states to implement a statewide Smart Grid Plan.
Additional key objectives include management of energy risk, management of environmental matters, management of regulatory filings and to further broaden access to capital.
Purchase and Development of Renewable Energy Projects
NPC’s current capital budget includes investing approximately $112.3 million for renewable energy projects through 2011. As discussed earlier, in 2008, NPC entered into contracts to either jointly construct or pursue the development of projects using wind, geothermal and recovered energy generation technologies, and in 2009 received PUCN approval to purchase the output from three geothermal plants expanded by 32 MW, an additional 49 MW of output from two new solar projects, and a landfill gas project to be completed in 2010/2011. In 2010, the Utilities will continue development of these renewable energy projects, conduct additional requests for proposals for renewable energy, and explore other opportunities to add to their supplies of renewable energy and associated PECs.
Construction of Generating Facilities and Expansion of Transmission Capabilities
In 2010, NPC will continue the construction of the 500 MW (nominally rated) natural gas generating station at the existing Harry Allen Generating Station, which is expected to be operational by summer 2011. In addition, the Utilities will continue to optimize the operations of their existing generating assets.
In NPC’s IRP filed in February 2010, it is requesting approval of either of two alternative approaches to completing the ON Line project, which is a 500 kV transmission line from the proposed Robinson Summit Substation near Ely, Nevada to the existing Harry Allen Substation located northeast of Las Vegas, Nevada at an aggregate cost of approximately $509 million. The preferred
plan is a joint ownership proposal (“Joint Project”) of the line among NPC, SPPC and Great Basin Transmission, LLC (“GBT”), an affiliate of LS Power. The Utilities have entered into a Memorandum of Understanding and Term Sheet (“MOU”) for the Joint Project that contemplates two phases of development. The Joint Project is subject to negotiation of definitive agreements and other conditions, such as PUCN and FERC approvals. The alternative to the Joint Project is for the Utilities’ to self build the ON Line. In addition to connecting NVE’s northern service territory with its service territory in southern Nevada, the ON Line would also provide access to isolated renewable energy resources in parts of northern and eastern Nevada, which would further advance the Utilities’ ability in meeting its Portfolio Standard, discussed above.
Further Broaden Access to Capital
A significant focus in 2010 will again be to generate sufficient cash from operations to meet operating needs and contribute to capital projects by managing recovery of deferred fuel and purchased power costs, reducing regulatory lag in recovery of costs and controlling costs. Maintaining or improving the Utilities credit ratings will be essential to negotiating favorable financing terms, and will continue to be a significant focus in 2010. Depending on the approval of NPC’s IRP, significant amounts of capital may be necessary to fund prospective construction projects, as discussed further under NVE’s Liquidity and Capital Resources. Additionally, if energy costs rise at a rapid rate and the Utilities do not recover the cost of fuel and purchased power in a timely manner, the Utilities may need to issue additional debt to support their operating costs or delay capital expenditures. Management will be required to meet such financial obligations with a combination of internally generated funds, the use of the Utilities’ revolving credit facilities, the issuance of long-term debt, and/or the issuance of equity by NVE. As such, the ability to issue new debt or equity securities on favorable terms, including the negotiation of new revolving credit facilities to replace the existing credit facilities expiring in November 2010, will be a significant focus in 2010.
CRITICAL ACCOUNTING POLICIES AND ESTIMATES
NVE prepared its consolidated financial statements in accordance with GAAP. In doing so, certain estimates were made that were critical in nature to the results of operations. The following discusses those significant estimates that may have a material impact on the financial results of NVE and the Utilities and are subject to the greatest amount of subjectivity. Senior management has discussed the development and selection of these critical accounting policies with the Audit Committee of NVE's BOD. The items discussed below represent critical accounting estimates that under different conditions or using different assumptions could have a material effect on the financial condition, results of operation, cash flows, liquidity and capital resources of NVE and the Utilities.
Regulatory Accounting
The Utilities’ retail rates are currently subject to the approval of the PUCN and, in the case of the California service territory of SPPC, they are also subject to the CPUC and are designed to recover the cost of providing generation, transmission and distribution services. As a result, the Utilities qualify for the application of regulatory accounting treatment as allowed by the Regulated Operations Topic of the FASC. The accounting guidance for regulated operations recognizes that the rate actions of a regulator can provide reasonable assurance of the existence of an asset and requires the capitalization of incurred costs that would otherwise be charged to expense where it is probable that future revenue will be provided to recover these costs. The accounting guidance prescribes the method to be used to record the financial transactions of a regulated entity. The criteria for applying the accounting guidance for regulated operations include the following: (i) rates are set by an independent third party regulator, (ii) approved rates are intended to recover the specific costs of the regulated products or services, and (iii) rates that are set at levels that will recover costs can be charged to and collected from customers. Under federal law, wholesale rates charged by the Utilities are subject to certain jurisdictional regulation, primarily by the FERC. The FERC has jurisdiction under the Federal Power Act with respect to rates, service, interconnection, accounting, and other matters in connection with the Utilities’ sale of electricity for resale and interstate transmission. The FERC also has jurisdiction over the natural gas pipeline companies from which the Utilities take service.
Regulatory assets represent incurred costs that have been deferred because it is probable they will be recovered through future rates collected from customers. Regulatory liabilities generally represent obligations to make refunds to customers for previous collections for costs that are not likely to be incurred. Although current rates do not include the recovery of all existing regulatory assets as discussed further below and in Note 1, Summary of Significant Accounting Policies of the Notes to Financial Statements, management believes the existing regulatory assets are probable of recovery either because we have received prior PUCN approval or due to regulatory precedent set for similar circumstances. Management’s judgment reflects the current political and regulatory climate in the state, and is subject to change in the future. If future recovery of costs ceases to be probable, the write-off of regulatory assets would be required to be recognized as a charge and expensed in current period earnings.
Regulatory Accounting affects other Critical Accounting Policies, including Deferred Energy Accounting, Accounting for Pensions, and Accounting for Derivatives and Hedging Activities, all of which are discussed immediately below.
Deferred Energy Accounting
Under deferred energy accounting, to the extent actual fuel and purchased power costs exceed fuel and purchased power costs recoverable through current rates, the excess is not recorded as a current expense on the statement of operations but rather is deferred and recorded as an asset on the balance sheet. Conversely, a liability is recorded to the extent fuel and purchased power costs recoverable through current rates exceed actual fuel and purchased power costs. These excess amounts are reflected in adjustments to rates and recorded as revenue or expense in future time periods, subject to PUCN approval. Nevada law provides that the PUCN may not allow the recovery of any costs for purchased fuel or purchased power “that were the result of any practice or transaction that was undertaken, managed or performed imprudently by the electric utility.” Nevada law specifies that fuel and purchased power costs include all costs incurred to purchase fuel, to purchase capacity, and to purchase energy. Both Utilities are entitled under statute to utilize deferred energy accounting for their electric operations and both Utilities accumulate amounts in their deferral of energy costs accounts. The Utilities also record, and are eligible under the statute to recover, a carrying charge on such deferred balances, recognized as interest income/expense on regulatory items in the current period.
The Utilities are exposed to commodity price risk primarily related to changes in the market price of electricity as well as changes in fuel costs incurred to generate electricity. See Item 7A, Quantitative and Qualitative Disclosures About Market Risk, for a discussion of the Utilities’ purchased power procurement strategies, and commodity price risk and commodity risk management program. Currently, commodity price increases are recoverable through the deferred energy accounting mechanism, with no anticipated effect on earnings. However, the Utilities are subject to regulatory risk related to commodity price changes due to the fact that the PUCN may disallow recovery for any of these costs that it considers imprudently incurred.
See Note 3, Regulatory Actions of the Notes to Financial Statements, for additional discussion of the regulatory process to recover these deferred costs.
Accounting for Derivatives and Hedging Activities
NVE, NPC and SPPC apply the accounting guidance as required by the Derivatives and Hedging Topic of the FASC. The accounting guidance for derivative instruments requires that an entity recognize all derivatives as either assets or liabilities in the statement of financial position and measure those instruments at fair value, unless they meet the normal purchase/normal sale scope exception. The accounting for derivatives depends on the intended use of the derivatives and the resulting designation.
Fuel and Purchased Power Contracts
In order to manage loads, resources and energy price risk, the Utilities may enter into forward contracts to purchase or sell a specified amount of energy at a specified time or during a specified period in the future. In addition, the Utilities’ use over-the-counter options with financial institutions and other energy companies to manage price risk which are typically considered derivatives under the Derivatives and Hedging Topic of the FASC and are marked-to-market in the statement of financial position unless the contract qualifies for the normal purchases or sales exemption per the accounting guidance for derivative instruments.
The PUCN and the CPUC have authorized the Utilities to defer the recognition of mark to market gains and losses on energy commodity transactions, that would otherwise be recorded to the statement of operations and/or comprehensive income, until the period of settlement by recording a risk management regulatory asset or liability. Upon settlement of these transactions, actual gains and losses are recognized as fuel and purchased power costs.
Interest Rate Swap Contracts
NVE, NPC, and SPPC are subject to risk of fluctuating interest rates in the normal course of business. As such, management may enter into interest rate swaps to manage fixed interest rate exposure with variable interest rate instruments in order to lower overall borrowing costs. If the conditions required by the Regulated Operations Topic of the FASC are met, NVE, NPC and SPPC are permitted to defer the change in fair value of the interest rate swap as Risk Management Regulatory Asset/Liability.
Fair Value Measurements and Disclosures
Effective January 1, 2008, NVE and the Utilities’ adopted the requirements of the Fair Value Measurements and Disclosure Topic of the FASC, which defines fair value, establishes a framework for measuring fair value and enhances disclosures about assets and liabilities recorded at fair value.
Fair Value Measurements and Disclosure Topic of the FASC establishes a three-level hierarchy which requires an entity to maximize the use of observable inputs and minimize the use of unobservable inputs when measuring fair value. The three levels are defined as follows:
Level 1 – Quoted prices in active markets for identical assets or liabilities. Active markets are those in which transactions for the asset or liability occur in sufficient frequency and volume to provide pricing information on an ongoing basis. Level 1 primarily consists of financial instruments such as exchange-traded derivatives and listed equities.
Level 2 – Observable inputs other than Level 1 prices, such as quoted prices for similar assets or liabilities; quoted prices in markets that are not active; or other inputs that are observable or can be corroborated by observable market data for substantially the full term of the assets or liabilities.
Level 3 – Unobservable inputs that are supported by little or no market activity and that are significant.
As required by the Fair Value Measurements and Disclosure Topic of the FASC, financial assets and liabilities are classified in their entirety based on the lowest level of input that is significant to the fair value measurement. NVE and the Utilities’ assessment of the significance of a particular input to fair value measurements requires judgment. The fair value of the Utilities’ assets and liabilities are sensitive to market price fluctuations that can occur on a daily basis. The use of different assumptions and variables in determining fair value could significantly impact the valuation and classification within the fair value hierarchy of assets and liabilities. See Note 1, Summary of Significant Accounting Policies, Note 4, Investments and Other Property, and Note 9, Derivatives and Hedging Activities in the Notes to Financial Statements for more detailed disclosure of NVE’s, NPC’s and SPPC’s fair value measurements.
Accounting for Income Taxes
Current and deferred income tax provisions and benefits as well as deferred income tax assets and liabilities involve significant management estimates and judgments. NVE and the Utilities file a consolidated federal income tax return. Current income taxes are allocated based on NVE and the Utilities’ respective taxable income or loss and tax credits as if each utility filed a separate return.
NVE and the Utilities recognize deferred tax liabilities and assets for the future tax consequences of events that have been included in the financial statements or tax returns. Deferred tax liabilities and assets are determined based on the difference between the financial statement and tax basis of assets and liabilities using enacted tax rates in effect for the year in which the differences are expected to reverse. Deferred tax assets are also recorded for deductions incurred and credits earned that have not been utilized in tax returns filed or to be filed for tax years through the date of the financial statements. Management considers estimates of the amount and character of future taxable income by tax jurisdiction in assessing the likelihood of realization of deferred tax assets. If it is not more likely than not that a deferred tax asset will be realized in its entirety, a valuation allowance is recorded with respect to the portion estimated not likely to be realized.
At December 31, 2009, NVE had a gross federal NOL carryover of $518.4 million. The following table summarizes the NOL and tax credit carryovers and associated carryover periods, and valuation allowance for amounts which NVE has determined that realization is unlikely (dollars in thousands):
| | | Deferred | | | Valuation | | | Net Deferred | | | Expiration | |
| | | Tax Asset | | | Allowance | | | Tax Asset | | | Period | |
| Federal NOL | | $ | 181,434 | | | $ | - | | | $ | 181,434 | | | | 2022-2029 | |
| Research and development credit | | | 11,241 | | | | - | | | | 11,241 | | | | 2022-2029 | |
| Alternative minimum tax credit | | | 13,865 | | | | - | | | | 13,865 | | | indefinite | |
| Arizona state coal credits | | | 1,578 | | | | 1,430 | | | | 148 | | | | 2010-2014 | |
| Total | | $ | 208,118 | | | $ | 1,430 | | | $ | 206,688 | | | | | |
Actual income taxes could vary from estimated amounts due to the future impacts of various items, including changes in income tax laws, our financial condition and results of operations in future periods, and the review of filed tax returns by taxing authorities. NVE and the Utilities’ income tax returns are regularly audited by applicable tax authorities. Tax benefits associated with income tax positions taken, or expected to be taken, in a tax return are recorded only when the more-likely-than-not recognition threshold is satisfied and measured at the largest amount of benefit that is greater than 50% likely of being realized upon settlement. NVE and the Utilities classify interest and penalties associated with unrecognized tax benefits as interest and other expense, respectively, within the income statement. No interest expense or penalties associated with unrecognized tax benefits have been recorded. As of December 31, 2009, NVE and the Utilities recorded a liability for uncertain tax positions of approximately $38.2 million.
The Utilities reduce rates to reflect the current tax benefits associated with recognizing certain tax deductions sooner than when the expenses are recognized for financial reporting purposes. A regulatory asset is recorded for these amounts to reflect the future increases in income taxes payable that will be recovered from customers when these temporary differences reverse. The Utilities have been fully normalized since 1987. AFUDC-equity is recorded on an after-tax basis. Accordingly, a regulatory asset is recorded when AFUDC-equity is recognized. This regulatory asset reverses as the related plant is depreciated, resulting in an increase
to the tax provision. The Utilities also record regulatory liabilities for obligations to reduce rates charged customers for deferred taxes recovered from customers in prior years at corporate tax rates higher than the current tax rates. The reduction in rates charged customers will occur as the temporary differences resulting in the excess deferred tax liabilities reverse. NVE and subsidiaries had a net regulatory tax asset of $239.5 million at December 31, 2009.
Environmental Contingencies
NVE and its subsidiaries are subject to federal, state and local regulations governing air and water quality, hazardous and solid waste, land use and other environmental considerations. Nevada’s Utility Environmental Protection Act requires approval of the PUCN prior to construction of major utility, generation or transmission facilities. The EPA, NDEP and Clark County Department of Air Quality and Environmental Management administer regulations involving air and water quality, solid, and hazardous and toxic waste.
NVE and its subsidiaries are subject to rising costs that result from a steady increase in the number of federal, state and local laws and regulations designed to protect the environment. These laws and regulations can result in increased capital, operating, and other costs as a result of compliance, remediation, containment and monitoring obligations, particularly with laws relating to power plant emissions. In addition, NVE or its subsidiaries may be a responsible party for environmental cleanup at any site identified by a regulatory body. The management of NVE and its subsidiaries cannot predict with certainty the amount and timing of all future expenditures related to environmental matters because of the difficulty of estimating clean up costs and compliance and the possibility that changes will be made to current environmental laws and regulations. There is also uncertainty in quantifying liabilities under environmental laws that impose joint and several liability on all potentially responsible parties.
Depending on whether environmental liabilities occurred from normal operations or as part of new environmental laws, the Utilities accrue for environmental remediation liabilities in accordance with the accounting guidance required by the Asset Retirement and Environmental Obligations Topic of the FASC. Estimated costs from environmental remediation obligations generally are recognized no later than completion of the remedial feasibility study or when the accounting requirements for environmental obligations have been met. Such costs are adjusted as additional information develops or circumstances change. Certain environmental costs receive regulatory accounting treatment, under which the costs are recorded as regulatory assets. Recoveries of environmental remediation costs from other parties are recognized when their receipt is deemed probable. Environmental expenditures that have future economic benefits are capitalized in accordance with our asset capitalization policy.
Note 13, Commitments and Contingencies of the Notes to Financial Statements, discusses the environmental matters of NVE and its subsidiaries that have been identified, and the estimated financial effect of those matters. To the extent that (1) actual results differ from the estimated financial effects, (2) there are environmental matters not yet identified for which NVE or its subsidiaries are determined to be responsible, or (3) the Utilities are unable to recover through future rates the costs to remediate such environmental matters, there could be a material adverse effect on the financial condition and future liquidity and results of operations of NVE and its subsidiaries.
Defined Benefit Plans and Other Post-retirement Plans
As further explained in Note 11, Retirement Plan and Post-Retirement Benefits of the Notes to Financial Statements, NVE maintains a qualified pension plan, a non-qualified supplemental executive retirement plan (SERP) and restoration plan, as well as a post-retirement benefit (OPEB) plan which provides health and life insurance for retired employees.
Pension Plans
NVE’s reported costs of providing non-contributory defined pension benefits (described in Note 11, Retirement Plan and Post-Retirement Benefits of the Notes to Financial Statements) are dependent upon numerous factors resulting from actual plan experience and assumptions for future experience.
In accordance with the Compensation Retirement Benefits Topic of the FASC, changes in pension obligations associated with these factors may not be immediately recognized as pension costs on the income statement, but generally are recognized in future years over the remaining average service period of plan participants. As such, significant portions of pension costs recorded in any period may not reflect the actual level of cash benefits provided to plan participants. Furthermore, the Compensation Retirement Benefits Topic of the FASC requires the immediate recognition of changes in benefit obligations due to differences between actuarial assumptions and actual experience in Accumulated Other Comprehensive Income, net of taxes. However, since NVE recovers these costs through rates, these amounts will be recorded as Other Regulatory Assets under the provisions of the Regulated Operations Topic of the FASC, and will be recognized as expense over a period of time.
For the years ended December 31, 2009, 2008, and 2007, NVE recorded pension expense for all pension plans of approximately $51.6 million, $24 million, and $33.7 million, respectively, in accordance with the accounting guidance as defined by the Compensation Retirement Benefits Topic of the FASC. Actual payments of benefits made to retirees and terminated vested
employees for the years ended December 31, 2009 and 2008 were $40.1 million and $27.4 million, respectively, and for the twelve months ended September 30, 2007 were $31.9 million. Pension costs are impacted by actual employee demographics (including age and employment periods), the level of contributions NVE makes to the plan, and earnings on plan assets. Changes made to the provisions of the plan may also impact current and future pension costs. Pension costs may also be significantly affected by changes in key actuarial assumptions, including anticipated rates of return on plan assets, the discount rates and demographic (mortality, retirement, termination) assumptions used in determining the projected benefit obligation and pension costs.
Plan Assets
NVE’s pension plan assets are primarily made up of equity and fixed income investments. Fluctuations in actual equity market returns as well as changes in general interest rates may result in increased or decreased pension costs in future periods. Likewise, changes in assumptions such as current discount rates, mortality assumption and/or expected rates of return on plan assets could also increase or decrease recorded pension costs. See Note 11, Retirement and Post-Retirement Benefits of the Notes to Financial Statements, for further discussion on NVE’s investment strategy and asset allocation.
Plan Assumptions and Sensitivities Analysis
As further described in Note 11, Retirement Plan and Post-Retirement Benefits of the Notes to Financial Statements, NVE reduced the discount rate used in determining pension expense from 6.09% in 2009 to 5.80% for the calendar year 2010.
In selecting an assumed discount rate for fiscal years 2009 and 2008 disclosures, and for fiscal years 2009, 2008 and 2007 pension cost, NVE’s projected benefit payments were matched to the yield curve derived from a portfolio of over 300 high quality Aa bonds with yields within the 10th to 90th percentiles of these bond yields.
In selecting an assumed rate of return on plan assets, NVE considers past performance and economic forecasts for the types of investments held by the plan. Investment returns on plan assets in the retirement plan increased by approximately $123.7 million in 2009 and decreased by approximately $181.8 million in 2008. Due to the increases in investment returns and the contributions by NVE, the funded status of the plan has improved compared to the prior year.
The following chart reflects the sensitivities associated with a change in certain actuarial assumptions by the indicated percentage for all pension plans. While the chart below reflects an increase in the percentage for each assumption, NVE and its actuaries expect that a decrease would impact the projected benefit obligation (PBO) and the reported annual pension cost (PC) by a similar amount in the opposite direction. Each sensitivity below reflects an evaluation of the change based solely on a change in that assumption only.
| Actuarial Assumption (dollars in millions) | | Change in Assumption | | | Impact on PBO | | | Impact on PC | |
| | | Incr/(Decr) | | | Incr/(Decr) | | | Incr/(Decr) | |
| Discount Rate | | | 1 | % | | $ | (79.70 | ) | | $ | (7.60 | ) |
| Rate of Return on Plan Assets | | | 1 | % | | $ | 0.00 | | | $ | (5.20 | ) |
Other Post-retirement Benefits
NVE’s reported costs of providing other post-retirement benefits (described in Note 11, Retirement Plan and Post-Retirement Benefits of the Notes to Financial Statements) are dependent upon numerous factors resulting from actual plan experience and assumptions of future experience.
For the year ended December 31, 2009, 2008, and 2007, NVE recorded other post-retirement benefit expense of $10.6 million, $7.7 million, and $11.3 million, respectively, in accordance with the provisions of the Compensation Retirement Benefits Topic of the FASC. Actual payments of benefits made to retirees for the year ended December 31, 2009 and 2008 was $11.0 million and $11.8 million, respectively, and for September 30, 2007 were $10.0 million. Other post-retirement benefit costs are impacted by actual employee demographics (including age and employment periods), the level of contributions made to the plan, earnings on plan assets, and health care cost trends. Changes made to the provisions of the plan may also impact current and future other post-retirement benefit costs. Other post-retirement benefit costs may also be significantly affected by changes in key actuarial assumptions, including anticipated rates of return on plan assets, discount rates and demographic (mortality, retirement, termination) assumptions used in determining the post-retirement benefit obligation and post-retirement costs.
Plan Assets
NVE’s other post-retirement benefit plan assets are primarily made up of equity and fixed income investments. Fluctuations in actual equity market returns, as well as, changes in general interest rates may result in increased or decreased other post-retirement benefit costs in future periods. Likewise, changes in assumptions regarding current discount rates and expected rates of return on plan
assets could also increase or decrease recorded other post-retirement benefit costs. See Note 11, Retirement and Post-Retirement Benefits of the Notes to Financial Statements, for further discussion on NVE’s investment strategy and asset allocation.
Plan Assumptions and Sensitivities Analysis
As further described in Note 11, Retirement Plan and Post-Retirement Benefits of the Notes to Financial Statements, NVE has revised the discount rate for its 2009 disclosures to 5.75%, as compared to 2008 disclosures of 6.07%. For determining the expense to be recorded in 2010, NVE moved to a 5.75% discount rate from 6.07% in 2009. In determining the other post-retirement benefit obligation and related cost, these assumptions can change with each measurement date, and such changes could result in material changes to such amounts.
In selecting an assumed discount rate for fiscal year 2009 other post-retirement benefits cost and disclosures, NVE’s projected benefit payments were matched to the yield curve derived from a portfolio of over 300 high quality Aa bonds with yields within the 10th to 90th percentiles of these bond yields.
In selecting an assumed rate of return on plan assets, NVE considers past performance and economic forecasts for the types of investments held by the plan. Investment returns on plan assets increased $17.6 million in 2009 and decreased $23.3 million in 2008.
The following chart reflects the sensitivities associated with a change in certain actuarial assumptions by the indicated percentage. While the chart below reflects an increase in the percentage for each assumption, NVE and its actuaries expect that a decrease would impact the projected accumulated other post-retirement benefit obligation (APBO) and the reported annual other post-retirement benefit cost (PBC) on the income statement by a similar amount in the opposite direction. Each sensitivity below reflects an evaluation of the change based solely on a change in that assumption only.
| Actuarial Assumption (dollars in millions) | | Change in Assumption | | | Impact on APBO | | | Impact on PC(1) | |
| | | Incr/(Decr) | | | Incr/(Decr) | | | Incr/(Decr) | |
| Discount Rate | | | 1 | % | | $ | (17.80 | ) | | $ | (1.20 | ) |
| Health Care Cost Trend Rate | | | 1 | % | | $ | 7.30 | | | $ | 1.90 | |
| Rate of Return on Plan Assets | | | 1 | % | | $ | 0.00 | | | $ | (0.80 | ) |
| (1) | Reflects the September 30, 2009 re-measurement of the OPEB plan. |
Unbilled Receivables
Revenues related to the sale of energy are recorded based on meter reads, which occur on a systematic basis throughout a month, rather than when the service is rendered or energy is delivered. At the end of each month, the energy delivered to the customers from the date of their last meter read to the end of the month is estimated and the corresponding unbilled revenues are calculated. These estimates of unbilled sales and revenues are based on the ratio of billable days versus unbilled days, amount of energy procured and generated during that month, historical customer class usage patterns, line loss and the Utilities’ current tariffs. Customer accounts receivable as of December 31, 2009, include unbilled receivables of $103 million and $78 million for NPC and SPPC, respectively. Customer accounts receivable as of December 31, 2008 include unbilled receivables of $103 million and $76 million for NPC and SPPC, respectively.
RECENT PRONOUNCEMENTS
See Note 1, Summary of Significant Accounting Policies of the Notes to Financial Statements, for discussion of accounting policies and recent pronouncements.
NV Energy, Inc. (Holding Company) and Other Subsidiaries
NVE (Holding Company)
The Holding Company’s (stand alone) operating results included approximately $37.7 million, $40.3 million and $42.5 million of long-term debt interest costs for the years ended December 31, 2009, 2008 and 2007, respectively. The decrease in interest costs for the year ended December 31, 2009 as compared to the same period in 2008 was primarily due to debt redemptions in 2008. See Note 6, Long-Term Debt of the Notes to Financial Statements, for further discussion of the debt repurchase.
Other Subsidiaries
Other Subsidiaries of NVE, except for NPC and SPPC, did not contribute materially to the consolidated results of operations of NVE.
NV Energy, Inc. (Consolidated)
See Executive Overview, Overview of Major Factors Affecting Results of Operations for NVE Consolidated.
NVE’s cash flows increased in 2009 compared to 2008 due to an increase in cash from operating activities and a decrease in cash used for investing activities, partially offset by a reduction in cash from financing activities.
Cash From Operating Activities. The increase in cash from operating activities was primarily due to the over collection of revenues in excess of fuel and purchased power costs, decreased purchased power and fuel costs, increased BTGR revenues beginning July 1, 2009 in the case of NPC and for the first six months of 2009 in the case of SPPC, a decrease in the funding of pension plans and the settlement of outstanding litigation. These increases were partially offset by increased operating and maintenance costs for new generating facilities, some of which were not included in rates until July 1, 2009, higher balances for fuel and purchased power costs at year end 2008 that were subsequently paid in 2009, increased interest costs, the receipt of prepaid transmission revenue in 2008 and the repayment of transmission deposits in 2009.
Cash Used By Investing Activities. The decrease in cash used by investing activities was primarily due to the acquisition of the Higgins Generating Station in October 2008 and the general slowdown in construction for infrastructure.
Cash From Financing Activities. The decrease in cash from financing activities is primarily due to a reduction in the issuance of debt. In 2008, a significant amount of debt was issued for the purchase of the Higgins Generating Station and for the construction at the Harry Allen and Clark Generating Stations. Also contributing to the decrease was the payments on the Utilities outstanding balances on their revolving credit facilities and higher dividend payments by NVE to its common shareholders. These decreases were partially offset by the issuance in 2009 of $125 million in Series U and $500 million in Series V General and Refunding Mortgage Notes at NPC and the addition of $150 million to SPPC’s Series M Notes.
Overall Liquidity
NVE’s consolidated operating cash flows are primarily derived from the operations of NPC and SPPC. The primary source of operating cash flows for the Utilities is revenues (including the recovery of previously deferred energy costs and natural gas costs) from sales of electricity and, in the case of SPPC, natural gas. Significant uses of cash flows from operations include the purchase of electricity and natural gas, other operating expenses, capital expenditures and interest. Operating cash flows can be significantly influenced by factors such as weather, regulatory outcomes, and economic conditions.
| Available Liquidity as of December 31, 2009 (in millions) |
| | | NVE | | | NPC | | | SPPC |
| Cash and Cash Equivalents | | $ | 3.7 | | | $ | 42.6 | | | $ | 14.4 |
Balance available on Revolving Credit Facilities (1)(2) | | | N/A | | | | 553.3 | | | | 301.8 |
| | | | | | | | | | | | |
| | | $ | 3.7 | | | $ | 595.9 | | | $ | 316.2 |
| (1) | NPC’s balance reflects combined amount available under the multi-year revolving credit facility and the $90 million supplemental revolving credit facility. The supplemental facility expired January 3, 2010. |
| (2) | As of February 19, 2010, NPC and SPPC had approximately $429.3 million and $291.2 million available under their revolving credit facilities. |
NVE and the Utilities attempt to maintain their cash and cash equivalents in highly liquid investments, such as U.S. treasury bills. In addition to cash on hand, the Utilities’ may use their revolving credit facilities, in order to meet their liquidity needs. Alternatively, depending on the usage of their revolving credit facilities, the Utilities may issue debt, subject to certain restrictions as discussed in Factors Affecting Liquidity, Ability to Issue Debt, below.
NVE and the Utilities have no significant debt maturities in 2010, except for the balances on their revolving credit facilities, which as of February 19, 2010 are $145 million and $25 million for NPC and SPPC, not including letters of credit. NPC’s and SPPC’s revolving credit facilities expire on November 4, 2010 and its $90 million supplemental revolving credit facility expired on January 3, 2010. Currently, the Utilities are assessing their options with respect to replacing their expiring and expired credit
facilities. Significant debt maturities in 2011 are limited to NPC’s $350 million 8.25% General and Refunding Notes, Series A, which mature on June 1, 2011.
NVE and the Utilities anticipate that they will be able to meet short-term operating costs, such as fuel and purchased power costs, with internally generated funds, including the recovery of deferred energy, and the use of their revolving credit facilities. Additionally, to manage liquidity needs as a result of seasonal peaks in fuel requirements, NVE and the Utilities may use hedging activities. Furthermore, in order to fund long-term capital requirements, NVE and the Utilities will likely use a combination of internally generated funds, the Utilities’ revolving credit facilities, the issuance of long-term debt and/or equity and in the case of the Utilities capital contributions from NVE. However, if energy costs rise at a rapid rate and the Utilities do not recover the cost of fuel, purchased power and operating costs in a timely manner or the Utilities were to experience a credit rating downgrade resulting in the posting of collateral as discussed below under Gas Supplier Matters and Financial Gas Hedges, the amount of liquidity available to the Utilities could be significantly less. In order to maintain sufficient liquidity, NVE and the Utilities may be required to delay capital expenditures, re-finance debt or issue equity at NVE.
The ability to issue debt, as discussed later, is subject to certain covenant calculations which include net income of NVE and the Utilities. As a result of these covenant calculations and the seasonality of the Utilities’ business, the ability to issue debt can vary from quarter to quarter and the Utilities utilization of their revolving credit facilities may be limited.
In 2009, the Utilities credit ratings on their senior secured debt remained at investment grade (see Credit Ratings below). However, disruptions in the banking and capital markets not specifically related to NVE or the Utilities may affect their ability to access funding sources or cause an increase in the interest rates paid on newly issued debt.
As of February 19, 2010, NVE has approximately $31.3 million payable of debt service obligations remaining for 2010, which it intends to pay through dividends from subsidiaries. (See “Factors Affecting Liquidity-Dividends from Subsidiaries” below).
NVE designs operating and capital budgets to control operating costs and capital expenditures. In addition to operating expenses, NVE has continuing commitments for capital expenditures for construction, improvement and maintenance of facilities.
Detailed below are NVE’s Capital Structure, Capital Requirements, recently completed financing transactions and factors affecting our ability to obtain debt on favorable terms, including the effect of our holding company structure and limitation on dividends from the Utilities.
Capital Structure
NVE’s actual capital structure on a consolidated basis was as follows at December 31 (dollars in thousands):
| | | 2009 | | | 2008 | |
| | | Amount | | | Percent of Total Capitalization | | | Amount | | | Percent of Total Capitalization | |
| Current Maturities of Long-Term Debt | | $ | 134,474 | | | | 1.55 | % | | $ | 9,291 | | | | 0.10 | % |
| Long-Term Debt | | | 5,303,357 | | | | 61.23 | % | | | 5,266,982 | | | | 62.60 | % |
| Shareholders’ Equity | | | 3,223,922 | | | | 37.22 | % | | | 3,131,186 | | | | 37.30 | % |
| Total | | $ | 8,661,753 | | | | 100 | % | | $ | 8,407,459 | | | | 100 | % |
Capital Requirements
Construction Expenditures
NVE’s consolidated cash requirements for construction expenditures for 2010 are projected to be $594.1 million. NVE’s consolidated cash requirements for cash construction expenditures for 2010-2014 are projected to be $2.3 billion. Cash used by investing activities for the years ended 2009, 2008 and 2007 were approximately $800.6 million, $1.5 billion and $1.1 billion, respectively. To fund future capital projects, NVE and the Utilities may meet such financial obligations with a combination of internally generated funds, the use of the Utilities’ revolving credit facilities, the issuance of long-term debt, and if necessary, the issuance of equity by NVE.
Estimated construction expenditures for PUCN approved projects, projects under contract, compliance projects and other base capital requirements are as follows (dollars in thousands):
| | | 2010 | | | | 2011-2014 | | | Total 5 - Year | |
| Electric Facilities: | | | | | | | | | | |
| Generation | | $ | 392,708 | | | $ | 653,480 | | | $ | 1,046,188 | |
| Distribution | | | 141,475 | | | | 518,616 | | | | 660,091 | |
| Transmission | | | 21,952 | | | | 498,704 | | | | 520,656 | |
| Other | | | 97,327 | | | | 188,321 | | | | 285,648 | |
| Total | | | 653,462 | | | | 1,859,121 | | | | 2,512,583 | |
| | | | | | | | | | | | | |
| Gas Facilities: | | | | | | | | | | | | |
| Distribution | | | 12,980 | | | | 54,083 | | | | 67,063 | |
| Other | | | 752 | | | | 3,128 | | | | 3,880 | |
| Total | | | 13,732 | | | | 57,211 | | | | 70,943 | |
| | | | | | | | | | | | | |
| Common Facilities | | | 16,145 | | | | 47,867 | | | | 64,012 | |
| | | | | | | | | | | | | |
| Total | | $ | 683,339 | | | $ | 1,964,199 | | | $ | 2,647,538 | |
Total estimated cash requirements related to construction projects consist of the following (dollars in thousands):
| | | 2010 | | | | 2011-2014 | | | Total 5 - Year | |
| Construction Expenditures | | $ | 683,339 | | | $ | 1,964,199 | | | $ | 2,647,538 | |
| AFUDC | | | (43,874 | ) | | | (95,122 | ) | | | (138,996 | ) |
| Net Salvage/ Cost of Removal | | | 1,993 | | | | 10,141 | | | | 12,134 | |
| Net Customer Advances and CIAC | | | (47,403 | ) | | | (126,159 | ) | | | (173,562 | ) |
| | | | | | | | | | | | | |
| Total Cash Requirements | | $ | 594,055 | | | $ | 1,753,059 | | | $ | 2,347,114 | |
Contractual Obligations (NVE Consolidated)
The table below provides NVE’s contractual obligations on a consolidated basis (except as otherwise indicated) that NVE expects to satisfy through a combination of internally generated cash and, as necessary, through the issuance of short-term and long-term debt. Certain contracts contain variable factors which required NVE to estimate the obligation depending on the final variable amount. Actual amounts could differ. The table does not include estimated construction expenditures described above, except for major capital projects for which the Utilities have executed contracts by December 31, 2009, or Pension funding requirements as discussed in Note 11, Retirement Plan and Post-Retirement Benefits of the Notes to Financial Statements, as of December 31, 2008. Additionally, at December 31, 2009, NVE has recorded an uncertain tax liability of $38.2 million in accordance with the accounting guidance for Uncertainty in Income Taxes Topic of the FASC all of which is classified as non-current. NVE is unable to make a reasonably reliable estimate of the period of cash payments to relevant tax authorities; consequently, none of the uncertain tax liability is included in the contractual obligations table below (dollars in thousands):
| | | Payment Due by Period | | | |
| | | 2010 | | | 2011 | | | 2012 | | | 2013 | | | 2014 | | | Thereafter | | | Total |
| | | | | | | | | | | | | | | | | | | | | |
| NPC/SPPC Long-Term Debt Maturities | | $ | 125,000 | | | $ | 364,000 | | | $ | 230,000 | | | $ | 250,000 | | | $ | 125,000 | | | $ | 3,807,242 | | | $ | 4,901,242 |
| NPC/SPPC Long-Term Debt Interest Payments | | | 290,643 | | | | 273,487 | | | | 250,487 | | | | 241,658 | | | | 223,740 | | | | 2,053,791 | | | | 3,333,806 |
| NVE Long-Term Debt Maturities | | | - | | | | - | | | | 63,670 | | | | - | | | | 230,039 | | | | 191,500 | | | | 485,209 |
| NVE Long-Term Debt Interest Payments | | | 37,735 | | | | 37,735 | | | | 35,044 | | | | 32,767 | | | | 17,060 | | | | 33,931 | | | | 194,272 |
Purchased Power (1) | | | 495,126 | | | | 449,957 | | | | 455,392 | | | | 460,171 | | | | 447,317 | | | | 4,682,309 | | | | 6,990,272 |
Coal, Natural Gas and Transportation | | | 804,660 | | | | 217,137 | | | | 135,799 | | | | 134,127 | | | | 133,138 | | | | 1,098,820 | | | | 2,523,681 |
Long-Term Service Agreements (2) | | | 30,833 | | | | 30,833 | | | | 30,833 | | | | 30,833 | | | | 30,833 | | | | 122,822 | | | | 276,987 |
Capital Projects (3) | | | 165,496 | | | | 8,121 | | | | - | | | | 34,397 | | | | - | | | | - | | | | 208,014 |
| Operating Leases | | | 26,393 | | | | 18,867 | | | | 15,535 | | | | 14,510 | | | | 12,924 | | | | 104,075 | | | | 192,304 |
| Capital Leases | | | 12,466 | | | | 9,630 | | | | 9,493 | | | | 9,510 | | | | 5,723 | | | | 26,945 | | | | 73,767 |
| | | | | | | | | | | | | | | | | | | | | | | | | | | | |
| Total Contractual Cash Obligations | | $ | 1,988,352 | | | $ | 1,409,767 | | | $ | 1,226,253 | | | $ | 1,207,973 | | | $ | 1,225,774 | | | $ | 12,121,435 | | | $ | 19,179,554 |
| (1) | Related party purchase power agreements have been eliminated. |
| (2) | Includes long-term service agreements for the Lenzie Generating Station, Silverhawk Generating Station, Higgins Generating Station and the Tracy Generating Station. |
| (3) | Capital Projects include the Harry Allen Generating Station Combined Cycle Project and Goodsprings Energy Recovery Project. |
Pension and Other Postretirement Benefit Plan Matters
NVE has a qualified pension plan and other postretirement benefits plan which cover substantially all employees of NVE, NPC and SPPC. The annual net benefit cost for the plans is expected to decrease in 2010 by approximately $24.7 million compared to the 2009 cost of $62.2 million, which excludes one-time special termination charges associated with severance programs. See Note 17, Severance Programs, of the Notes to Financial Statements for further discussion. As of December 31, 2009, the measurement date, the plan was under funded under the provisions of the Compensation Retirement Benefits Topic of the FASC. Refer to Note 11, Retirement Plan and Post-Retirement Benefits, in the Notes to Financial Statements. During 2009, NVE funded a total of $53.5 million to the trusts established for these plans. At the present time, NVE cannot determine if additional funding will be required in 2010 to meet the minimum funding level requirements defined by the Pension Protection Act of 2006. NVE is expected to fund approximately $40 million to the Plans in 2010.
Factors Affecting Liquidity
Effect of Holding Company Structure
As of December 31, 2009, NVE (on a stand-alone basis) has outstanding debt and other obligations including, but not limited to: $63.7 million of its unsecured 7.803% Senior Notes due 2012; $191.5 million of its unsecured 6.75% Senior Notes due 2017; and $230 million of its unsecured 8.625% Senior Notes due 2014.
Due to the holding company structure, NVE’s right as a common shareholder to receive assets of any of its direct or indirect subsidiaries upon a subsidiary’s liquidation or reorganization is junior to the claims against the assets of such subsidiary by its creditors. Therefore, NVE’s debt obligations are effectively subordinated to all existing and future claims of the creditors of NPC and SPPC and its other subsidiaries, including trade creditors, debt holders, secured creditors, taxing authorities and guarantee holders.
As of December 31, 2009, NVE, NPC, SPPC and their subsidiaries had approximately $5.4 billion of debt and other obligations outstanding, consisting of approximately $3.7 billion of debt at NPC, approximately $1.3 billion of debt at SPPC and approximately $485 million of debt at the holding company and other subsidiaries. Although NVE and the Utilities are parties to agreements that limit the amount of additional indebtedness they may incur, NVE and the Utilities retain the ability to incur substantial additional indebtedness and other liabilities.
Dividends from Subsidiaries
Since NVE is a holding company, substantially all of its cash flow is provided by dividends paid to NVE by NPC and SPPC on their common stock, all of which is owned by NVE. Since NPC and SPPC are public utilities, they are subject to regulation by state utility commissions, which impose limits on investment returns or otherwise impact the amount of dividends that the Utilities may declare and pay.
In addition, certain agreements entered into by the Utilities set restrictions on the amount of dividends they may declare and pay and restrict the circumstances under which such dividends may be declared and paid. As a result of the Utilities’ credit rating on their senior secured debt at investment grade by S&P and Moody’s, these restrictions are suspended and no longer in effect so long as the debt remains investment grade by both rating agencies. In addition to the restrictions imposed by specific agreements, the Federal Power Act prohibits the payment of dividends from “capital accounts.” Although the meaning of this provision is unclear, the Utilities believe that the Federal Power Act restriction, as applied to their particular circumstances, would not be construed or applied by the FERC to prohibit the payment of dividends for lawful and legitimate business purposes from current year earnings, or in the absence of current year earnings, from other/additional paid-in capital accounts. If, however, the FERC were to interpret this provision differently, the ability of the Utilities to pay dividends to NVE could be jeopardized.
Credit Ratings
NVE, NPC and SPPC are currently rated by three Nationally Recognized Statistical Rating Organizations (NRSRO’s): Fitch, Moody’s and S&P. DBRS is no longer covering NVE and the Utilities. The senior secured debt of NPC and SPPC is rated investment grade by these three rating organizations. As of December 31, 2009, the ratings are as follows:
| | | | Rating Agency |
| | | | Fitch | | Moody’s | | S&P |
| NVE | Sr. Unsecured Debt | | BB- | | Ba3 | | BB |
| NPC | Sr. Secured Debt | | BBB-* | | Baa3* | | BBB* |
| NPC | Sr. Unsecured Debt | | BB | | Not rated | | BB+ |
| SPPC | Sr. Secured Debt | | BBB-* | | Baa3* | | BBB* |
*Investment grade
S&P’s and Moody’s rating outlook for NVE, NPC and SPPC is Stable. Fitch’s rating outlook for NVE, NPC and SPPC is Positive.
A security rating is not a recommendation to buy, sell or hold securities. Security ratings are subject to revision and withdrawal at any time by the assigning rating organization, and each rating should be evaluated independently of any other rating.
Energy Supplier Matters
With respect to NPC’s and SPPC’s contracts for purchased power, NPC and SPPC purchase and sell electricity with counterparties under the WSPP agreement, an industry standard contract that NPC and SPPC use as members of the WSPP. The WSPP contract is posted on the WSPP website.
Under these contracts, a material adverse change (e.g., a credit rating downgrade) in NPC and SPPC may allow the counterparty to request adequate financial assurance, which, if not provided within three business days, could cause a default. Most contracts and confirmations for purchased power have been modified or separate agreements have been made to either shorten the normal payment due date or require payment in advance of delivery in response to requests for financial assurance. A default must be declared within 30 days of the event, giving rise to the default becoming known. A default will result in a termination payment equal to the present value of the net gains and losses for the entire remaining term of all contracts between the parties aggregated to a single liquidated amount due within three business days following the date the notice of termination is received. The mark-to-market value, which is substantially based on quoted market prices, can be used to roughly approximate the termination payment and benefit at any point in time. The net mark-to-market value as of December 31, 2009 for all suppliers continuing to provide power under a WSPP agreement would approximate a $69.6 million payment or obligation to NPC. No amounts would be due to or from SPPC. These contracts qualify for the normal purchases scope exception as required by the Derivatives and Hedging Topic of the FASC, and as such, are not required to be marked-to-market on the balance sheet. Refer to Note 9, Derivatives and Hedging Activities, of the Notes to Financial Statements for further discussion.
Gas Supplier Matters
With respect to the purchase and sale of natural gas, NPC and SPPC use several types of standard industry contracts. The natural gas contract terms and conditions are more varied than the electric contracts. Consequently, some of the contracts contain language similar to that found in the WSPP agreement and other agreements have unique provisions dealing with material adverse changes, which primarily means a credit rating downgrade below investment grade. Most contracts and confirmations for natural gas purchases have been modified or separate agreements have been made to either shorten the normal payment due date or require payment in advance of delivery in response to requests for financial assurances. Forward physical gas supplies are purchased under index based pricing terms and as such do not carry forward mark-to-market exposure.
Gas transmission service is secured under FERC Tariffs or custom agreements. These service contracts and Tariffs require the user to establish and maintain creditworthiness to obtain service or otherwise post cash or a letter of credit to be able to receive service. Service contracts are subject to FERC approved tariffs, which, under certain circumstances, require the Utilities to provide collateral to continue receiving service. NPC has one transmission counterparty for which it is required to post cash collateral or a letter of credit in the event of credit rating downgrades. As of December 31, 2009, the maximum amount of additional collateral NPC would be required to post under these contracts in the event of credit rating downgrades was approximately $30.6 million. Of this amount, approximately $22.9 million would be required if NPC’s Senior Unsecured ratings are downgraded from their current level and an additional amount of approximately $7.7 million would be required if NPC’s Senior Secured ratings are downgraded to below investment grade.
Financial Gas Hedges
The Utilities enter into certain hedging contracts with various counterparties to manage the gas price risk inherent in purchased power and fuel contracts. However, in October 2009, the program was temporarily suspended. See Energy Supply Planning, below, for further discussion. The hedging contracts require that the Utilities maintain their Moody’s and S&P Senior Unsecured or equivalent ratings in place at the time the contracts were entered into. In the event that the Utilities Senior Unsecured debt rating is downgraded by two out of the three rating agencies, the counterparties have the right to require the Utilities to post cash or a letter of credit to the extent the counterparties have mark-to-market exposure to the Utilities, subject to certain caps. As of December 31, 2009, the maximum amount of collateral the Utilities would be required to post under these agreements is approximately $51.9 million based on mark-to-market values, which are substantially based on quoted market prices. Of this amount, approximately $40.9 million would be required if the Utilities are downgraded one level and an additional amount of approximately $11.0 million would be required if the Utilities are downgraded two levels.
Ability to Issue Debt
NV Energy, Inc.
Certain debt of NVE (holding company) places restrictions on debt incurrence, liens and dividends, unless, at the time the debt is incurred, the ratio of cash flow to fixed charges for NVE’s (consolidated) most recently ended four quarter period on a pro forma basis is at least 2 to 1. Under this covenant restriction, as of December 31, 2009, NVE (consolidated) would be allowed to incur up to $1.2 billion of additional indebtedness, assuming an interest rate of 7%. The amount of additional indebtedness allowed would likely be impacted if there is a change in current market conditions or material change in our financial condition.
Notwithstanding this restriction, under the terms of the debt, NPC and SPPC would still be permitted to incur a combined total of up to $500 million in indebtedness and letters of credit under their respective revolving credit facilities. As of December 31, 2009, the combined total outstanding indebtedness and letters of credit under their respective revolving credit facilities was approximately $156.4 million. See NPC’s and SPPC’s Ability to Issue Debt sections for further discussion of the Utilities’ limitations on ability to issue debt.
If the applicable series of debt is upgraded to investment grade by both Moody’s and S&P, these restrictions will be suspended and will no longer be in effect so long as the applicable series of Notes remain investment grade by both Moody’s and S&P (see Credit Ratings above).
Cross Default Provisions
None of the Utilities’ financing agreements contains a cross-default provision that would result in an event of default by that Utility upon an event of default by NVE or the other Utility under any of their respective financing agreements. Certain of NVE’s financing agreements, however, do contain cross-default provisions that would result in an event of default by NVE upon an event of default by the Utilities under their respective financing agreements. In addition, certain financing agreements of each of NVE and the Utilities provide for an event of default if there is a failure under other financing agreements of that entity to meet payment terms or to observe other covenants that would result in an acceleration of payments due. Most of these default provisions (other than ones relating to a failure to pay other indebtedness) provide for a cure period of 30-60 days from the occurrence of a specified event, during which time NVE or the Utilities may rectify or correct the situation before it becomes an event of default.
The energy supply function at the Utilities encompasses the reliable and efficient operation of the Utilities’ owned generation, the procurement of all fuels and purchased power and resource optimization (i.e., physical and economic dispatch).
The Utilities face energy supply challenges for their respective load control areas. There is the potential for continued price volatility in each Utility’s service territory, particularly during peak periods. A greater dependence on generation from the wholesale market subjects power prices to price volatilities due to available supply and gas prices. Both Utilities face load obligation uncertainty due to the potential for customer switching. Some counterparties in these areas have significant credit difficulties, representing credit risk to the Utilities. Finally, each Utility’s own credit situation can have an impact on its ability to enter into transactions.
In response to these energy supply challenges, the Utilities have adopted an approach to managing the energy supply function that has three primary elements. The first element is a set of management guidelines to procuring and optimizing the supply portfolio that is consistent with the requirements of a load serving entity with a full requirements obligation. The second element is an energy risk management and risk control approach that ensures clear separation of roles between the day-to-day management of risks and compliance monitoring and control; and ensures clear distinction between policy setting (or planning) and execution. Lastly, the Utilities will pursue a process of ongoing regulatory involvement and acknowledgement of the resource portfolio management plans.
Energy Supply Planning
Within the energy supply planning process, there are three key components covering different time frames:
| 1. | The PUCN-approved long-term IRP, which is filed every three years, has a twenty-year planning horizon; |
| 2. | The PUCN-approved ESP which is an intermediate term resource procurement and risk management plan that establishes the supply portfolio strategies within which intermediate term resource requirements will be met, has a one to three year planning horizon; and |
| 3. | Tactical execution activities with a one-month to twelve-month focus. |
The ESP operates in conjunction with the PUCN-approved twenty-year IRP. It serves as a guide for near-term execution and fulfillment of energy needs. When the ESP calls for executing contracts with a duration of more than three years, the IRP regulations require PUCN approval as part of the resource planning process.
In developing and executing ESPs, management guidelines followed by the Utilities include:
| • | Maintaining an ESP that minimizes supply costs and retail price volatility and maximizes reliability of supply over the term of the ESP; |
| • | Investigating feasible commercial options to execute the ESP; |
| • | Applying quantitative techniques and diligence commensurate with risk to evaluate and execute each transaction; |
| • | Monitoring the portfolio against evolving market conditions and managing the resource optimization options; and |
| • | Ensuring transparent and well-documented decisions and execution processes. |
In October 2009, with the concurrence of the BCP and PUCN staff, the Utilities hedging programs were temporarily suspended until the second quarter 2010 when a PUCN order is expected to be issued. Prior to that the Utilities typically hedged for three seasons ahead; as such, they remain partially hedged through the summer 2011. The Utilities’ new ESP, filed in December 2009 with the PUCN, requests approval for a hedging program consisting of 50% swaps and 50% open positions for four seasons ahead. However, until a PUCN order is issued, other parties may intervene and suggest other strategies.
Energy Risk Management and Control
The Utilities’ efforts to manage energy commodity (electricity, natural gas, coal and oil) price risk are governed by the BOD's revised and approved Enterprise Risk Management and Control Policy. That policy created the EROC and made that committee responsible for the overall policy direction of the Utilities’ risk management and control efforts. That policy further instructed the EROC to oversee the development of appropriate risk management and control policies including the Energy Risk Management and Control Policy.
The Utilities’ commodity risk management program establishes a control framework based on existing commercial practices. The program creates predefined risk thresholds and delineates management responsibilities and organizational relationships. The program requires that transaction accounting systems and procedures be maintained for systematically identifying, measuring, evaluating and responding to the variety of risks inherent in the Utilities’ commercial activities. The program’s control framework consists of a disclosure and reporting mechanism designed to keep management fully informed of the operation’s compliance with portfolio and credit limits.
The Utilities, through the purchase and sale of financial instruments and physical products, maintain an energy risk management program that limits energy risk to levels consistent with ESPs approved by the Chief Executive Officer and the EROC.
Regulatory Issues
The Utilities’ long-term IRPs are filed with the PUCN for approval every three years. Nevada law provides that resource additions approved by the PUCN in the resource planning process are deemed prudent for ratemaking purposes. NPC’s 2009 IRP was re-filed in February 2010. SPPC’s last IRP was filed in June 2007 and received approval in December 2007. Between IRP filings, the Utilities are required to seek PUCN approval for modifications to their resource plans and for power purchases with terms of three years or greater by filing amendments to prior IRP filings. NPC’s and SPPC’s next IRP filings will be in 2012 and 2010, respectively.
The Utilities also seek regulatory input and acknowledgement of intermediate term ESPs. The Utilities feel this is necessary to ensure that the appropriate levels of risks are being mitigated at reasonable costs, the appropriate levels of risks are being retained in the portfolio, and decisions to manage risks with best available information at the point in time when decisions are made are subject to reasonable mechanisms for recovery in rates.
Intermediate Term ESPs
The Utilities update their intermediate term ESPs annually. In December 2009, both SPPC and NPC filed their ESP updates for the periods 2010 and 2010-2012 respectively. Both plans were approved by the EROC and the CEO prior to submission to the PUCN. The ESPs operate within the framework of the PUCN-approved 20-year IRPs and serve as a guide for near-term execution and fulfillment of energy needs. When the ESPs call for the execution of contracts of duration of more than three years, an amendment to the IRP is prepared and submitted for PUCN approval.
During 2009, SPPC filed three amendments to its 2007 IRP. In January 2009, SPPC filed the Fifth Amendment as it relates to an amendment to the WSPP Confirmation with Newmont Nevada Electric Investment and an amendment to the existing renewable power purchase agreements with Homestretch. In March 2009, SPPC filed the Sixth Amendment for authority to construct the One Nevada Transmission Line and approval of its updated fuel and purchased power forecasts and load forecast. In August 2009, SPPC
filed the Seventh Amendment as it relates to a Settlement Agreement and related contract amendments with Ormat Nevada and various Ormat subsidiaries.
During 2009, NPC filed three amendments to its 2006 IRP. In January 2009, NPC filed the Tenth Amendment as it relates to renewable power purchase agreements with NGP Blue Mountain I LLC, Enel Salt Wells LLC, Enel Stillwater LLC, and an amendment to the solar renewable energy credit purchase agreement with SunPower Corporation. In March 2009, NPC filed the Eleventh Amendment for seeking authorization to construct the One Nevada Transmission Line and to enter into a long-term power purchase agreement with Las Vegas Power Company LLC related to the 525 MW Apex Generating Facility. In August 2009, NPC filed the Twelfth Amendment as it relates to renewable power purchase agreements with American Capital Energy – Searchlight Solar, LLC, Fotowatio Nevada Solar, LLC, CC Landfill Energy LLC, a Settlement Agreement and related contract amendments with Ormat Nevada and various Ormat subsidiaries, and the 2010 Interim Demand Side Plan.
NPC filed its 2009 IRP in February 2010, and SPPC expects to file its IRP in July 2010.
The summer needs of 2010 for both SPPC and NPC will be met through a portfolio mix consisting of self-generation, forward contracts for power and peaking and seasonal capacity, or synthetic tolling based contracts (i.e., power prices indexed to gas prices), to meet the following requirements:
| • | Optimize the tradeoff between overall fuel and purchased power cost and market price and supply risk. |
| • | Pursue in-region capacity to enhance long-term regional reliability. |
| • | Represent the set of transactions/products available in the market. |
| • | Manage credit risk—in a market with some counter-parties that may be in a weak financial condition. |
| • | Procure to meet a needle-peak load profile. |
| • | Hedge the gas price risk exposure in the fuel portfolio through the purchase of risk management options consistent with the PUCN approved gas hedging strategy. This program has been temporarily suspended with the concurrence of the BCP and PUCN staff effective October 2009. See discussion under Energy Supply Planning, above. |
| • | Manage energy price risk through ongoing intermediate and short-term optimization activities (e.g., optimizing the dispatch of generation, buying heat rate call options for summer capacity, or buying energy from the market). |
Long Term Purchased Power Activities
The Utilities update their respective long-term IRPs on a triennial basis in concert with the preparation of their annual ESPs. As noted above, the ESPs serve as a guide for near-term execution and fulfillment of energy needs. When the ESPs call for purchased power of duration more than three years, RFPs are issued, bids are evaluated, and contracts are executed with the successful bidders. Those contracts are submitted to the PUCN for approval through an amended IRP.
Currently, NPC has approximately 1,611 MW of long term contracts (3 or more years) for non-renewable resources with various providers, terms and expiration dates. SPPC currently has 203 MW of long term contracts (3 or more years) for non-renewable resources with various providers, terms and expiration dates.
Currently, NPC has long-term contracts for renewable resources with nameplate capacities of 530 MW, of which 335 MW are under construction, and SPPC has similar contracts for 214 MW. Pursuant to those contracts, NPC and SPPC will receive renewable energy and associated PCs from solar, geothermal, hydroelectric, and biomass facilities.
Short-Term Resource Optimization Strategy
The Utilities’ short-term resource optimization strategy involves both day-ahead (next day through the end of the current month) and real-time (next hour through the end of the current day) activities that require buying, selling and scheduling power resources to determine the most economical way to produce or procure the power resources needed to meet the retail customer load and operating reserve requirement. The Utilities commit and dispatch generating units based on the comparative economics of generation versus spot-market purchase opportunities. Any amount of excess capacity or energy is sold on the wholesale market, while any deficient capacity or energy position is filled by either buying on the spot-market or utilizing available generating capacity.
The day-ahead resource optimization begins with an analysis of projected hourly loads, existing resources and operating reserve requirements. Firm forward take-or-pay contracts are scheduled and counted towards meeting the capacity needs of the day being pre-scheduled. The day-of resource optimization involves minimizing system production costs each hour by lowering or raising generating unit output or buying power and/or selling excess power in the wholesale market all in order to meet the system load requirement and operating reserve requirement. Any sale of excess power priced above the incremental cost of producing such power reduces the net production cost of operating the electrical system and thereby benefits the end use customer. The Utilities endeavor to reduce the electrical systems’ net production cost by selling available excess energy when it exists.
Real-time resource optimization requires an hourly determination of whether to increase or decrease the loading of on-line generating units, commit previously off-line generating units, un-commit on-line generating units, sell excess power, or purchase power in the real-time market to meet the companies’ resource needs. In order to achieve the lowest production cost, the projected incremental or decremental cost of the next available generation resource options is compared to determine the lowest cost option.
NPC recognized net income of $134.3 million in 2009 compared to net income of $151.4 million in 2008 and $165.7 million in 2007. In 2009 NPC paid dividends to NVE of approximately $112 million. In February 2010, NPC declared a dividend of approximately $27 million to NVE. Details of NPC’s operating results are further discussed below.
Gross margin is presented by NPC in order to provide information that management believes aids the reader in determining how profitable the electric business is at the most fundamental level. Gross margin, which is a “non-GAAP financial measure” as defined in accordance with SEC rules, provides a measure of income available to support the other operating expenses of the business and is a key factor utilized by management in its analysis of its business.
NPC believes presenting gross margin allows the reader to assess the impact of NPC’s regulatory treatment and its overall regulatory environment on a consistent basis. To the extent purchased power and natural gas supply costs are deemed prudent by the PUCN, changes in these costs are designed to pass through to our customers and do not effect gross margin or operating income. Gross margin, as calculated below, provides a measure of income available to support the other operating expenses of NPC. For reconciliation to operating income, see Note 2, Segment Information in the Notes to Financial Statements. Gross margin may be impacted by such factors as customer usage, customer growth and general base rate adjustments (filed every three years by statute).
The components of gross margin for the years ended December 31 (dollars in thousands):
| | | 2009 | | | 2008 | | | 2007 | |
| | | Amount | | | Change from Prior Year | | | Amount | | | Change from Prior Year | | | Amount | |
| |
| | | | | | | | | | | | | | | | |
| Operating revenues | | $ | 2,423,377 | | | | 4.7 | % | | $ | 2,315,427 | | | | -1.7 | % | | $ | 2,356,620 | |
| | | | | | | | | | | | | | | | | | | | | |
| Energy Costs: | | | | | | | | | | | | | | | | | | | | |
| Fuel for power generation | | | 587,647 | | | | -22.3 | % | | | 755,925 | | | | 27.2 | % | | | 594,382 | |
| Purchased power | | | 627,759 | | | | -7.8 | % | | | 680,816 | | | | -1.1 | % | | | 688,606 | |
| Deferred energy - net | | | 207,611 | | | | N/A | | | | (6,947 | ) | | | -103.0 | % | | | 233,166 | |
| | | $ | 1,423,017 | | | | -0.5 | % | | $ | 1,429,794 | | | | -5.7 | % | | $ | 1,516,154 | |
| | | | | | | | | | | | | | | | | | | | | |
| Gross Margin | | $ | 1,000,360 | | | | 13.0 | % | | $ | 885,633 | | | | 5.4 | % | | $ | 840,466 | |
NPC’s gross margin increased for the year ended December 31, 2009 compared to the same period in 2008, primarily due to an increase in BTGR revenue as a result of NPC’s 2008 GRC, effective July 1, 2009, increased revenues associated with renewable energy programs, and a slight increase in average customer growth. Partially offsetting the increase was a change in customer usage patterns and the termination of various transmission service agreements.
NPC’s gross margin increased for the year ended December 31, 2008 compared to the same period in 2007, primarily due to an increase in BTGR as a result of NPC’s 2006 GRC, effective June 1, 2007 and increased customer growth. Partially offsetting these increases was a decrease in customer usage due to cooler weather and a change in customer usage patterns.
The causes for significant changes in specific lines comprising the results of operations for NPC for the respective years ended are provided below (dollars in thousands except for amounts per unit).
Operating Revenues
| | | 2009 | | | 2008 | | | 2007 | |
| | | Amount | | | Change from Prior Year | | | Amount | | | Change from Prior Year | | | Amount | |
| Operating Revenues: | | | | | | | | | | | | | | | |
| Residential | | $ | 1,143,836 | | | | 7.5 | % | | $ | 1,064,510 | | | | -3.4 | % | | $ | 1,102,418 | |
| Commercial | | | 477,477 | | | | 1.3 | % | | | 471,236 | | | | -2.0 | % | | | 480,613 | |
| Industrial | | | 720,850 | | | | 6.3 | % | | | 678,117 | | | | -0.9 | % | | | 684,221 | |
| Retail Revenues | | | 2,342,163 | | | | 5.8 | % | | | 2,213,863 | | | | -2.4 | % | | | 2,267,252 | |
| Other | | | 81,214 | | | | -20.0 | % | | | 101,564 | | | | 13.6 | % | | | 89,368 | |
| Total Operating Revenues | | $ | 2,423,377 | | | | 4.7 | % | | $ | 2,315,427 | | | | -1.7 | % | | $ | 2,356,620 | |
| | | | | | | | | | | | | | | | | | | | | |
| Retail sales in thousands | | | | | | | | | | | | | | | | | | | | |
| of megawatt-hours (MWh) | | | 20,957 | | | | -2.0 | % | | | 21,381 | | | | -1.1 | % | | | 21,621 | |
| | | | | | | | | | | | | | | | | | | | | |
| Average retail revenue per MWh | | $ | 111.76 | | | | 7.9 | % | | $ | 103.54 | | | | -1.3 | % | | $ | 104.86 | |
| | | | | | | | | | | | | | | | | | | | | |
NPC’s retail revenues increased for the year ended December 31, 2009 compared to the same period in 2008, primarily due to increases in rates as a result of NPC’s GRC effective July 1, 2009, partially offset by decreased rates as a result of NPC’s various BTER quarterly cases and deferred energy cases. For further discussions on NPC’s various rate cases see Note 3, Regulatory Actions of the Notes to the Financial Statements. The overall rate increase was partially offset by decreased usage caused by changes in customer usage patterns, which may be attributable to economic conditions and/or conservation efforts, and cooler summer weather during 2009. Average residential, commercial, and industrial customers increased by 0.1%, 0.4% and 1.5%, respectively, compared to prior year.
NPC’s retail revenues decreased for the year ended December 31, 2008 compared to the same period in 2007 due to decreases in retail rates and decreases in customer usage as a result of cooler summer weather and changes in customer usage patterns. Retail rates decreased as a result of NPC’s various BTER quarterly cases and Deferred Energy cases partially offset by an increase in rates as a result of NPC’s 2006 GRC, effective June 1, 2007, see Note 3, Regulatory Actions in the Notes to Financial Statements. In 2007, NPC experienced hotter summer weather, whereas in 2008, NPC experienced milder summer weather. Average residential, commercial, and industrial customers increased by 0.8%, 2.6% and 3.8%, respectively.
Other Operating Revenues decreased for the year ended December 31, 2009 compared to the same period in 2008. The decrease is primarily due to the termination of several transmission agreements, including a transmission agreement related to the Higgins Generating Station which was purchased by NPC in October 2008.
Other Operating Revenues increased for the year ended December 31, 2008 compared to the same period in 2007, primarily due to the elimination of the reclassification of revenues associated with the Mohave Generating Station, as a result of NPC’s 2006 GRC which in 2007 were reclassified to Other Regulatory Assets as a result of the shutdown of the Mohave Generating Station. For further discussion on the Mohave Generating Station, refer to Note 3, Regulatory Actions of the Notes to the Financial Statements. Also contributing to the increase was transmission related revenue as a result of the Calpine settlement, as discussed further in Note 13, Commitments and Contingencies. This increase was partially offset by a decrease in energy usage by Public Authority customers due to their transitioning to DOS by purchasing their energy from other sources, as allowed by Nevada law under certain circumstances.
Energy Costs
Energy Costs include Fuel for Generation and Purchased Power. Energy costs are dependent upon several factors which may vary by season or period. As a result, NPC’s usage and average cost per MWh of Fuel for Generation versus Purchased Power to meet demand can vary significantly. Factors that may affect Energy Costs include, but are not limited to:
| · | Weather; |
| · | Generation efficiency; |
| · | Plant outages; |
| · | Total system demand; |
| · | Resource constraints; |
| · | Transmission constraints; |
| · | Natural gas constraints; |
| · | Long term contracts; and |
| · | Mandated power purchases. |
| | | 2009 | | | 2008 | | | 2007 | |
| | | | | | Change from | | | | | | Change from | | | | |
| | | Amount | | | Prior Year | | | Amount | | | Prior Year | | | Amount | |
| Energy Costs | | | | | | | | | | | | | | | |
| Fuel for Generation | | $ | 587,647 | | | | -22.3 | % | | $ | 755,925 | | | | 27.2 | % | | $ | 594,382 | |
| Purchased Power | | | 627,759 | | | | -7.8 | % | | | 680,816 | | | | -1.1 | % | | | 688,606 | |
| Energy Costs | | $ | 1,215,406 | | | | -15.4 | % | | $ | 1,436,741 | | | | 12.0 | % | | $ | 1,282,988 | |
| | | | | | | | | | | | | | | | | | | | | |
| MWhs | | | | | | | | | | | | | | | | | | | | |
| Fuel for Generation (in thousands) | | | 16,431 | | | | 9.8 | % | | | 14,968 | | | | 3.1 | % | | | 14,520 | |
| Purchased Power (in thousands) | | | 5,697 | | | | -20.8 | % | | | 7,190 | | | | -15.5 | % | | | 8,510 | |
| Total MWhs | | | 22,128 | | | | -0.1 | % | | | 22,158 | | | | -3.8 | % | | | 23,030 | |
| | | | | | | | | | | | | | | | | | | | | |
| Average cost per MWh | | | | | | | | | | | | | | | | | | | | |
| Average fuel cost per MWh of Generated Power | | $ | 35.76 | | | | -29.2 | % | | $ | 50.50 | | | | 23.4 | % | | $ | 40.94 | |
| Average cost per MWh of Purchased Power | | $ | 110.19 | | | | 16.4 | % | | $ | 94.69 | | | | 17.0 | % | | $ | 80.92 | |
| Average cost per MWh | | $ | 54.92 | | | | -15.3 | % | | $ | 64.84 | | | | 16.4 | % | | $ | 55.71 | |
Energy Costs decreased for the year ended December 31, 2009 compared to the same period in 2008 primarily due to a decrease in natural gas prices coupled with an increase in self generation, partially offset by an increase in hedging costs. In 2009, self generation, which is primarily gas fired generating units, satisfied 74% of NPC’s system load.
| · | Fuel for generation, as a component of energy costs decreased primarily due to a decrease in natural gas prices. |
| · | Purchased power, as a component of energy costs, as well as the average cost per MWh, decreased primarily due to a decrease in natural gas prices and a decrease in volume, partially offset by an increase in hedging costs. The average cost per MWh increased primarily due to increased hedging costs, partially offset by a decrease in natural gas prices. |
The increase in Energy Costs for the year ended December 31, 2008 compared to the same period in 2007 was primarily due to higher fuel for generation costs, slightly offset by a decrease in purchased power costs. Fuel for generation costs increased due to higher natural gas prices partially offset by a decrease in the cost of hedging instruments. Purchased power costs were lower primarily due to a decrease in volume; however, the average cost per MWh of purchased power increased due to higher natural gas prices. Total MWhs decreased primarily due to a decrease in customer demand as a result of a cooler summer; however, fuel for generation MWhs increased due to increased self generation as a result of the addition of the Clark Peaking Units and the acquisition of the Higgins Generating Station. The average cost per MWh increased primarily due to higher natural gas prices.
Deferred Energy – Net
| | | 2009 | | | 2008 | | | 2007 | |
| | | Amount | | | Change from Prior Year | | | Amount | | | Change from Prior Year | | | Amount | |
| | | | | | | | | | | | | | | | | | | | | |
| Deferred energy - net | | $ | 207,611 | | | | N/A | | | $ | (6,947 | ) | | | -103.0 | % | | $ | 233,166 | |
Deferred energy – net represent the difference between actual fuel and purchased power costs incurred during the period and amounts recoverable through current rates. To the extent actual costs exceed amounts recoverable through current rates, the excess is recognized as a reduction in costs. Conversely to the extent actual costs are less than amounts recoverable through current rates, the difference is recognized as an increase in costs. Deferred energy – net also includes the current amortization of fuel and purchased power costs previously deferred. See Note 3, Regulatory Actions, of the Notes to Financial Statements for further detail of deferred energy balances.
Amounts for 2009, 2008 and 2007 include amortization of deferred energy of $42 million, $132.6 million and $177.3 million, respectively; and an over-collection of amounts recoverable in rates of $165.6 million in 2009, an under-collection of $139.6 million in 2008, and an over-collection of $55.8 million in 2007.
Other Operating Expenses
| | | 2009 | | | 2008 | | | 2007 | |
| | | Amount | | | Change from Prior Year | | | Amount | | | Change from Prior Year | | | Amount | |
| | | | | | | | | | | | | | | | |
| Other operating expense | | $ | 279,865 | | | | 12.3 | % | | $ | 249,236 | | | | 7.1 | % | | $ | 232,610 | |
| Maintenance expense | | $ | 71,019 | | | | 12.2 | % | | $ | 63,282 | | | | -6.2 | % | | $ | 67,482 | |
| Depreciation and amortization | | $ | 215,873 | | | | 26.2 | % | | $ | 171,080 | | | | 12.5 | % | | $ | 152,139 | |
Other operating expense increased for the year ended December 31, 2009, compared to the same period in 2008, primarily due to higher pension and other post retirement benefit expenses, costs related to severance programs, as discussed further in Note 17, Severance Programs, of the Notes to Financial Statements, costs associated with renewable energy programs and new DSM regulatory amortizations, higher operating leases and operating expenses for the Higgins Generating Station acquired in October 2008.
Other operating expense increased for the year ended December 31, 2008, compared to the same period in 2007, primarily due to the reversal of a reserve established for Enron legal fees in 2007. In March 2007, the PUCN granted recovery of these expenses, see Note 3, Regulatory Actions, of the Notes to Financial Statements for further discussion. Additionally, in 2007 certain consulting fees were reclassified to a regulatory asset, reducing expense. Also contributing to the increase in other operating expenses were higher costs for regulatory amortizations in 2008 as compared to the same period in 2007, as well as an increase in reserves for uncollectible accounts; partially offset by a decrease in claims and labor costs.
Maintenance expense increased for the year ended December 31, 2009, compared to the same period in 2008, due to the addition of the Higgins Generating Station and increased scheduled maintenance for Navajo, Lenzie and Silverhawk Generating Stations in 2009, partially offset by lower maintenance cost for the Reid Gardner Generating Station, attributable to a major turbine overhaul in 2008.
Maintenance expense decreased for the year ended December 31, 2008, compared to the same period in 2007, due to a forced outage at the Harry Allen Generating Station and maintenance costs incurred for the Lenzie Generating Station in 2007; partially offset by a major turbine overhaul at the Clark Generating Station as well as major forced outages at the Reid Gardner Generating Station in 2008.
Depreciation and amortization expenses increased for the year ended December 31, 2009, compared to the same period in 2008, as a result of increases in plant in service, primarily due to the completion of the Clark Peaking units and the addition of the Higgins Generating Station in the latter part of 2008.
Depreciation and amortization increased for the year ended December 31, 2008, compared to the same period in 2007, primarily due to an increase in plant-in-service. Plant-in-service increased primarily as a result of the inclusion of the Lenzie Generating Station in depreciation, beginning June 2007, as a result of NPC’s 2006 GRC, the completion of the Clark Peaking units in the latter part of 2008 and the purchase of the Higgins Generating Station in October of 2008. This increase was partially offset by deferred taxes for the TRED trust.
Interest Expense
| | | 2009 | | | 2008 | | | 2007 | |
| | | Amount | | | Change from Prior Year | | | Amount | | | Change from Prior Year | | | Amount | |
| | | | | | | | | | | | | | | | |
| Interest expense (net of AFUDC-debt) | | $ | 226,252 | | | | 21.1 | % | | $ | 186,822 | | | | 7.0 | % | | $ | 174,667 | |
Interest expense increased for the year ended December 31, 2009 compared to the same period in 2008 primarily due to the issuance of the following debt:
| · | $500 million Series S General and Refunding Mortgage Notes in July 2008; |
| · | $125 million Series U General and Refunding Mortgage Notes in January 2009; and |
| · | $500 million Series V General and Refunding Mortgage Notes in March 2009. |
Partially offsetting this increase was lower interest on variable rate debt, interest charges related to IRS income tax settlements in 2008, interest expense associated with refunds for construction advances in 2008, lower AFUDC-debt during construction due to the completion of the Clark Peaking Units in the latter part of 2008 and the expiration in 2009 of amortization of costs related to debt issues and redemptions.
Interest expense increased for the year ended December 31, 2008 compared to the same period in 2007, primarily due to the issuance of $500 million Series S General and Refunding Mortgage Notes in July 2008, the issuance of $350 million in Series R General and Refunding Mortgage Notes and to interest charges related to IRS income tax settlements, as well as interest expense associated with refunds for construction advances. This increase was partially offset by the redemption of the Series G General and Refunding Mortgage Notes of approximately $210.3 million in June 2007 and the remaining $17.2 million in August 2008, lower interest associated with customer transmission deposits in 2008 and increased allowance for borrowed funds used during construction primarily due to the construction of the Clark Peaking Units.
Other Income (Expense)
| | | 2009 | | | 2008 | | | 2007 | |
| | | Amount | | | Change from Prior Year | | | Amount | | | Change from Prior Year | | | Amount | |
| | | | | | | | | | | | | | | | |
| Interest income (expense) on regulatory items | | $ | 3,463 | | | | -52.8 | % | | $ | 7,342 | | | | -71.0 | % | | $ | 25,289 | |
| AFUDC-equity | | $ | 21,025 | | | | -18.9 | % | | $ | 25,917 | | | | 63.4 | % | | $ | 15,861 | |
| Other income | | $ | 19,658 | | | | 18.2 | % | | $ | 16,631 | | | | 15.3 | % | | $ | 14,423 | |
| Other expense | | $ | (18,320 | ) | | | 79.2 | % | | $ | (10,221 | ) | | | -10.0 | % | | $ | (11,352 | ) |
Interest income (expense) on regulatory items decreased for the year ended December 31, 2009 compared to the same period in 2008 due to lower carrying charges associated with NPC’s Western Energy Crisis Rate Case, which began June 1, 2007, and overall lower deferred energy balances. See Note 3, Regulatory Actions, of the Notes to Financial Statements for further details of deferred energy balances.
Interest income (expense) on regulatory items decreased for the year ended December 31, 2008 compared to the same period in 2007 primarily due to the reinstatement in 2007 of approximately $11.1 million, before taxes, for interest on deferred energy which was approved by the PUCN in 2007. See Note 3, Regulatory Actions of the Notes to Financial Statements for discussion. Also contributing to the decrease was lower deferred energy balances, partially offset by carrying charges associated with NPC’s Western Energy Crisis Rate Case, which began June 1, 2007. See Note 3, Regulatory Actions of the Notes to Financial Statements for further details of deferred energy balances.
AFUDC-equity decreased for the year ended December 31, 2009 compared to 2008 primarily due to completion of Clark Peaking Units.
AFUDC-equity increased for the year ended December 31, 2008 compared to 2007 primarily due to an increase in the Construction Work-In-Progress (CWIP) balance due to the expansion of the Clark Peaking Units.
Other income increased for the year ended December 31, 2009 compared to the same period in 2008 due to the settlement of outstanding legal matters associated with the Natural Gas Provider case, as discussed further in Note 13, Commitments and Contingencies in the Notes to Financial Statements, and interest received on income tax refunds. These were partially offset by expiration of the amortization of gains associated with the disposition of property, lower interest income on investments and income earned in 2008 as a result of the settlement with Calpine, and the subsequent gain on sale of the stock received, as discussed further in Note 13, Commitments and Contingencies in the Notes to Financial Statements.
Other income increased for the year ended December 31, 2008 compared to the same period in 2007 primarily due to carrying charges on energy conservation programs and the gain from the settlement with Calpine as discussed further in Note 13, Commitments and Contingencies in the Notes to Financial Statements. This income was partially offset by lower interest income in 2008 and the adjustment for and expiration of the amortization of gains associated with the disposition of property.
Other expense increased for the year ended December 31, 2009 compared to the same period in 2008 primarily due to adjustments resulting from NPC’s GRC and a disallowance related to contract pricing for energy. The increase in other expense was partially offset by lower advertising expenses in 2009.
Other expense decreased for the year ended December 31, 2008 compared to the same period in 2007 primarily due to a decrease in deferred compensation costs and donations, partially offset by an increase in advertising costs.
NPC’s cash flows increased in 2009 compared to 2008 due to an increase in cash from operating activities and a decrease in cash used in investing activities, partially offset by a decrease in cash from financing activities.
Cash From Operating Activities. The increase in cash from operating activities was primarily due to the over collection of revenues in excess of fuel and purchased power costs, decreased purchased power and fuel costs, increased BTGR revenues beginning July 1, 2009, a decrease in the funding of pension plans and the settlement of outstanding litigation. These increases were partially offset by increased operating and maintenance costs for new generating facilities, some of which were not included in rates until July 1, 2009, higher interest payments, the receipt of prepaid transmission revenue in 2008 and the repayment of transmission deposits in 2009.
Cash Used By Investing Activities. The decrease in cash used by investing activities was primarily due to the acquisition of the Higgins Generating Station in October 2008 and the general slowdown in construction for infrastructure.
Cash From Financing Activities. The decrease in cash from financing activities is primarily due to a reduction in the issuance of debt. In 2008, a significant amount of debt was issued for the purchase of the Higgins Generating Station and for the construction at the Harry Allen and Clark Generating Stations. Also contributing to the decrease was the payments on NPC’s outstanding balances on its revolving credit facilities and higher dividend payments to NVE. These decreases were partially offset by the issuance in 2009 of $125 million in Series U and $500 million in Series V General and Refunding Mortgage Notes at NPC
Overall Liquidity
NPC’s primary source of operating cash flows is electric revenues, including the recovery of previously deferred energy costs. Significant uses of cash flows from operations include the purchase of electricity and natural gas, other operating expenses, capital expenditures and the payment of interest on NPC’s outstanding indebtedness. Operating cash flows can be significantly influenced by factors such as weather, regulatory outcome, and economic conditions.
| Available Liquidity as of December 31, 2009 (in millions) | |
| | | NPC | |
| Cash and Cash Equivalents | | $ | 42.6 | |
Balance available on Revolving Credit Facility (1)(2) | | | 553.3 | |
| | | | | |
| | | $ | 595.9 | |
| (1) | Balance reflects combined amount available under NPC’s multi-year revolving credit facility and the $90 million supplemental revolving credit facility. The supplemental facility expired January 3, 2010. |
| (2) | As of February 19, 2010, NPC had approximately $429.3 million available under its revolving credit facility. |
NPC attempts to maintain its cash and cash equivalents in highly liquid investments, such as U.S. treasury bills. In addition to cash on hand, NPC may use its revolving credit facilities in order to meet its liquidity needs. Alternatively, depending on the usage of the revolving credit facilities, NPC may issue debt, subject to certain restrictions as discussed in Factors Affecting Liquidity, Ability to Issue Debt, below.
NPC has no significant debt maturities in 2010, except for the balance on its revolving credit facility. NPC’s revolving credit facility expires on November 4, 2010 and its $90 million supplemental revolving credit facility expired on January 3, 2010. Currently, NPC is assessing its options with respect to replacing its expired and expiring credit facilities. As of February 19, 2010, NPC has borrowed approximately $145 million on its revolving credit facility, not including letters of credit. NPC’s significant debt maturities in 2011 are limited to its $350 million 8.25% General and Refunding Notes, Series A, which mature on June 1, 2011.
NPC anticipates that it will be able to meet short-term operating costs, such as fuel and purchased power costs, with internally generated funds, including recovery of deferred energy, and the use of its revolving credit facility. Additionally, to manage liquidity needs as a result of seasonal peaks in fuel requirements, NPC may use hedging activities. Furthermore, in order to fund long term capital requirements, NPC will likely use a combination of internally generated funds, its revolving credit facility, the issuance of long-term debt and /or capital contributions from NVE. However, if energy costs rise at a rapid rate and NPC does not recover the cost of fuel and purchased power in a timely manner, if operating costs are not recovered in a timely manner or NPC were to experience a credit rating downgrade resulting in the posting of collateral as discussed below under Gas Supplier Matters and Financial Gas Hedges, the amount of liquidity available to NPC could be significantly less. In order to maintain sufficient liquidity, NPC may be required to further delay capital expenditures, re-finance debt or obtain funding through an equity issuance by NVE.
The ability to issue debt, as discussed later, is subject to certain covenant calculations which include consolidated net income of NVE and the Utilities. As a result of these covenant calculations and the seasonality of the Utilities’ business, the ability to issue debt can vary from quarter to quarter, and the Utilities may not be able to fully utilize the availability on their revolving credit facilities.
In 2009, NPC paid dividends to NVE of approximately $112 million.
NPC designs operating and capital budgets to control operating costs and capital expenditures. In addition to operating expenses, NPC has continuing commitments for capital expenditures for construction, improvement and maintenance of facilities.
Detailed below are NPC’s Capital Structure, Capital Requirements, recently completed Financing Transactions and Factors Affecting Liquidity, including our ability to obtain debt on favorable terms.
Capital Structure
NPC’s actual consolidated capital structure was as follows at December 31 (dollars in thousands):
| | | 2009 | | | 2008 | |
| | | Amount | | | Percent of Total Capitalization | | | Amount | | | Percent of Total Capitalization | |
| Current Maturities of Long-Term Debt | | $ | 119,474 | | | | 1.9 | % | | $ | 8,691 | | | | 0.1 | % |
| Long-Term Debt | | | 3,535,440 | | | | 56.1 | % | | | 3,385,106 | | | | 56.2 | % |
| Shareholder’s Equity | | | 2,650,039 | | | | 42.0 | % | | | 2,627,567 | | | | 43.7 | % |
| Total | | $ | 6,304,953 | | | | 100 | % | | $ | 6,021,364 | | | | 100 | % |
Capital Requirements
Construction Expenditures
NPC’s cash requirement for construction expenditures for 2010 is projected to be $447.3 million. The majority of this requirement is for the construction of the 484 MW (nominally rated) Harry Allen Generating Station. NPC’s cash requirements for construction expenditures for 2010 through 2014 are projected to be $1.5 billion. Cash used by investing activities for the years ended 2009, 2008 and 2007 were approximately $615.4 million, $1.3 billion, and $729.1 million, respectively. To fund future capital projects NPC may meet such financial obligations with a combination of internally generated funds, the use of its revolving credit facilities, the issuance of long-term debt, and if necessary, capital contributions from NVE.
Contractual Obligations
The table below provides NPC’s consolidated contractual obligations that NPC expects to satisfy through a combination of internally generated cash and, as necessary, through the issuance of short-term and long-term debt. Certain contracts contain variable factors which required NPC to estimate the obligation depending on the final variable amount. Actual amounts could differ. The table does not include estimated construction expenditures described above, except for major capital projects for which NPC has executed contracts by December 31, 2009. Additionally, at December 31, 2009, NPC has recorded an uncertain tax liability of $26.6 million as required by the accounting guidance for Uncertainty in Income Taxes Topic of the FASC, all of which is classified as non-current. NPC is unable to make a reasonably reliable estimate of the period of cash payments to relevant tax authorities; consequently, none of the uncertain tax liability is included in the contractual obligations table below (dollars in thousands):
| | | Payment Due by Period |
| | | | | | | | | | | | | | | | | | | | | |
| | | 2010 | | | 2011 | | | 2012 | | | 2013 | | | 2014 | | | Thereafter | | | Total |
| | | | | | | | | | | | | | | | | | | | | |
| Long-Term Debt Maturities | | $ | 110,000 | | | $ | 364,000 | | | $ | 130,000 | | | $ | - | | | $ | 125,000 | | | $ | 2,890,825 | | | $ | 3,619,825 |
| Long-Term Debt Interest Payments | | | 225,391 | | | | 208,249 | | | | 189,676 | | | | 187,211 | | | | 178,377 | | | | 1,607,013 | | | | 2,595,917 |
| Purchased Power | | | 415,331 | | | | 375,340 | | | | 384,315 | | | | 388,639 | | | | 371,092 | | | | 4,034,236 | | | | 5,968,953 |
Coal, Natural Gas and Transportation | | | 521,321 | | | | 107,172 | | | | 75,191 | | | | 75,065 | | | | 74,076 | | | | 877,324 | | | | 1,730,149 |
Long-Term Service Agreements (1) | | | 25,202 | | | | 25,202 | | | | 25,202 | | | | 25,202 | | | | 25,202 | | | | 89,038 | | | | 215,048 |
Capital Projects (2) | | | 165,496 | | | | 8,121 | | | | - | | | | 34,397 | | | | - | | | | - | | | | 208,014 |
| Operating Leases | | | 12,648 | | | | 10,341 | | | | 8,373 | | | | 7,981 | | | | 7,183 | | | | 64,202 | | | | 110,728 |
| Capital Leases | | | 12,466 | | | | 9,630 | | | | 9,493 | | | | 9,510 | | | | 5,723 | | | | 26,945 | | | | 73,767 |
| | | | | | | | | | | | | | | | | | | | | | | | | | | | |
| Total Contractual Cash Obligations | | $ | 1,487,855 | | | $ | 1,108,055 | | | $ | 822,250 | | | $ | 728,005 | | | $ | 786,653 | | | $ | 9,589,583 | | | $ | 14,522,401 |
| (1) | Includes long term service agreements for the Lenzie Generating Station, the Silverhawk Generating Station, and the Higgins Generating Station. |
| (2) | Capital Projects include Harry Allen Generating Station Combined Cycle Project and Goodsprings Energy Recovery project. |
Pension and Other Postretirement Benefit Plan Matters
NVE has a qualified pension plan and other postretirement benefits plan which cover substantially all employees of NVE, NPC and SPPC. The annual net benefit cost for the plans is expected to decrease in 2010 by approximately $24.7 million compared to the 2009 cost of $62.2 million, which excludes one-time special termination charges associated with severance programs. See Note 17, Severance Programs, of the Notes to Financial Statements for further discussion. As of December 31, 2009, the measurement date, the plan was under funded under the provisions of the Compensation Retirement Benefits Topic of the FASC. Refer to Note 11, Retirement Plan and Post-Retirement Benefits, of the Notes to Financial Statements. During 2009, NVE funded a total of $53.5 million to the trusts established for these plans. At the present time, NVE cannot determine if additional funding will be required in 2010 to meet the minimum funding level requirements defined by the Pension Protection Act of 2006. NVE is expected to fund approximately $40 million to the Plans in 2010.
Financing Transactions
Redemption of Clark County, Nevada Industrial Development Revenue Bonds, Series 1997A
In November 2009, NPC provided a notice of redemption to the holders of all of the approximately $52.3 million aggregate principal amount of Clark County, Nevada Industrial Development Revenue Bonds, Series 1997A. The notes were redeemed in December 2009, at 100% of the stated principal amount plus accrued interest to the date of redemption. NPC redeemed these notes with the use of its revolving credit facility.
Maturity of Clark County Nevada Pollution Control Revenue Bonds, Series 2000B
In October 2009 the Clark County Nevada Pollution Control Revenue Bonds, Series 2000B, in the aggregate principal amount of $15 million, matured. In July 2008, these securities were converted from auction rate securities to variable rate demand notes. NPC purchased 100% of the bonds at that time, and remained the sole holder of these bonds until the maturity date. NPC financed the maturity with available cash.
Revolving Credit Facilities
In March 2009, NPC amended its $600 million Second Amended and Restated Revolving Credit Agreement, which matures in November 2010, to remove a bankrupt lending bank from the facility. This amendment reduced the capacity of the facility to approximately $589 million.
In January 2009, NPC entered into a new $90 million supplemental revolving credit facility. The supplemental facility expired in January 2010. Currently, NPC is assessing its options with respect to replacing its expired and expiring credit facilities. See Ability to Issue Debt, below, for further details of the revolving credit facilities.
General and Refunding Mortgage Notes, Series V
In March 2009, NPC issued and sold $500 million of its 7.125% General and Refunding Mortgage Notes, Series V due 2019. The net proceeds of the issuance were used to repay approximately $404 million of amounts outstanding under NPC’s approximate $589 million revolving credit facility, and for general corporate purposes.
General and Refunding Mortgage Notes, Series U
In January 2009, NPC issued and sold $125 million of its 7.375% General and Refunding Mortgage Notes, Series U due 2014. The net proceeds of the issuance were used to repay approximately $124 million of amounts outstanding under NPC’s approximate $589 million revolving credit facility.
Factors Affecting Liquidity
Ability to Issue Debt
NPC’s ability to issue debt is impacted by certain factors such as financing authority from the PUCN, financial covenants in its financing agreements and revolving credit facility agreements, and the terms of certain NVE debt. As of December 31, 2009, the most restrictive of the factors below is the PUCN authority. As such, NPC may issue up to $750 million in long term debt, in addition to the use of its existing credit facilities. However, depending on NVE’s or SPPC’s issuance of long term debt or the use of the Utilities’ revolving credit facilities the PUCN authority may not remain the most restrictive factor. The factors affecting NPC’s ability to issue debt are further detailed below:
| a. | Financing authority from the PUCN - As of December 31, 2009, NPC has financing authority from the PUCN to issue (1) additional long term debt of up to $750 million for the period ending December 31, 2010, (2) ongoing authority to maintain a revolving credit facility of up to $1.3 billion, and (3) authority to refinance up to approximately $471 million of long-term debt securities. |
| | |
| b. | Financial covenants within NPC’s financing agreements – NPC’s $589 million Second Amended and Restated Revolving Credit Agreement dated November 2005 contains two financial maintenance covenants. The first requires NPC to maintain a ratio of consolidated indebtedness to consolidated capital, determined as of the last day of each fiscal quarter, not to exceed 0.68 to 1. The second requires NPC to maintain a ratio of consolidated cash flow to consolidated interest expense, determined as of the last day of each fiscal quarter for the period of four consecutive fiscal quarters, not to be less that 2.0 to 1. As of December 31, 2009, NPC was in compliance with these covenants. In order to maintain compliance with these covenants, NPC is limited to $2.0 billion of additional indebtedness. |
| | All other financial covenants contained in NPC’s revolving credit facility and its financing agreements are suspended, as NPC’s senior secured debt is rated investment grade. However, if NPC’s senior secured debt ratings fall below investment grade by either Moody’s or S&P, NPC would again be subject to the limitations under these additional covenants; and |
| | |
| c. | Financial covenants within NVE’s financing agreements – As discussed in NVE’s Ability to Issue Debt, NPC is also subject to NVE’s cap on additional consolidated indebtedness of $1.2 billion. |
Ability to Issue General and Refunding Mortgage Securities
To the extent that NPC has the ability to issue debt under the most restrictive covenants in its financing agreements and has financing authority to do so from the PUCN, NPC’s ability to issue secured debt is still limited by the amount of bondable property or retired bonds that can be used to issue debt under NPC’s General and Refunding Mortgage Indenture (“Indenture”).
The Indenture creates a lien on substantially all of NPC’s properties in Nevada. As of December 31, 2009 $4.0 billion of NPC’s General and Refunding Mortgage Securities were outstanding. NPC had the capacity to issue $718.7 million of General and Refunding Mortgage Securities as of December 31, 2009. That amount is determined on the basis of:
| 1. | 70% of net utility property additions; |
| 2. | The principal amount of retired General and Refunding Mortgage Securities; and/or |
| 3. | The principal amount of first mortgage bonds retired after October 2001. |
Property additions include plant in service and specific assets in CWIP. The amount of bond capacity listed above does not include eligible property in CWIP.
NPC also has the ability to release property from the lien of the mortgage indenture on the basis of net property additions, cash and/or retired bonds. To the extent NPC releases property from the lien of NPC’s Indenture, it will reduce the amount of securities issuable under the Indenture.
Credit Ratings
NPC’s senior secured debt is rated investment grade by three Nationally Recognized Statistical Rating Organizations: Fitch, Moody’s and S&P. DBRS is no longer covering NPC. As of December 31, 2009, the ratings are as follows:
| | | | Rating Agency |
| | | | Fitch | | Moody’s | | S&P |
| NPC | Sr. Secured Debt | | BBB-* | | Baa3* | | BBB* |
| NPC | Sr. Unsecured Debt | | BB | | Not rated | | BB+ |
* Investment grade
S&P’s and Moody’s rating outlook for NPC is Stable. Fitch’s rating outlook is Positive.
A security rating is not a recommendation to buy, sell or hold securities. Security ratings are subject to revision and withdrawal at any time by the assigning rating organization, and each rating should be evaluated independently of any other rating.
Energy Supplier Matters
With respect to NPC’s contracts for purchased power, NPC purchases and sells electricity with counterparties under the WSPP agreement, an industry standard contract that NPC uses as a member of the WSPP. The WSPP contract is posted on the WSPP website.
Under these contracts, a material adverse change (e.g., a credit rating downgrade) in NPC may allow the counterparty to request adequate financial assurance, which, if not provided within three business days, could cause a default. Most contracts and confirmations for purchased power have been modified or separate agreements have been made to either shorten the normal payment due date or require payment in advance of delivery in response to requests for financial assurance. A default must be declared within 30 days of the event giving rise to the default becoming known. A default will result in a termination payment equal to the present value of the net gains and losses for the entire remaining term of all contracts between the parties aggregated to a single liquidated amount due within three business days following the date the notice of termination is received. The mark-to-market value, which is substantially based on quoted market prices, can be used to roughly approximate the termination payment and benefit at any point in time. The net mark-to-market value as of December 31, 2009 for all suppliers continuing to provide power under a WSPP agreement would approximate a $69.6 million payment or obligation to NPC. These contracts qualify for the normal purchases scope exception as defined by the Derivatives and Hedging Topic of the FASC, and as such, are not required to be marked-to-market on the balance sheet. Refer to Note 9, Derivatives and Hedging Activities, of the Notes to Financial Statements for further discussion.
Gas Supplier Matters
With respect to the purchase and sale of natural gas, NPC uses several types of standard industry contracts. The natural gas contract terms and conditions are more varied than the electric contracts. Consequently, some of the contracts contain language similar to that found in the WSPP agreement and other agreements have unique provisions dealing with material adverse changes, which primarily means a credit rating downgrade below investment grade. Most contracts and confirmations for natural gas purchases have been modified or separate agreements have been made to either shorten the normal payment due date or require payment in advance of delivery in response to requests for financial assurances. Forward physical gas supplies are purchased under index based pricing terms and as such do not carry forward mark-to-market exposure.
Gas transmission service is secured under FERC Tariffs or custom agreements. These service contracts and Tariffs require the user to establish and maintain creditworthiness to obtain service or otherwise post cash or a letter of credit to be able to receive service. Service contracts are subject to FERC approved tariffs, which, under certain circumstances, require the Utilities to provide collateral to continue receiving service. NPC has one transmission counterparty for which it is required to post cash collateral or a letter of credit in the event of credit rating downgrades. As of December 31, 2009, the maximum amount of additional collateral NPC would be required to post under these contracts in the event of credit rating downgrades was approximately $30.6 million. Of this amount, approximately $22.9 million would be required if NPC’s Senior Unsecured ratings are downgraded from their current level and an additional amount of approximately $7.7 million would be required if NPC’s Senior Secured ratings are downgraded to below investment grade.
Financial Gas Hedges
NPC enters into certain hedging contracts with various counterparties to manage the gas price risk inherent in purchased power and fuel contracts. However, in October 2009, the program was temporarily suspended. See Energy Supply Planning, above, for further discussion. The hedging contracts require that NPC maintain its Moody’s and S&P Senior Unsecured or equivalent ratings in place at the time the contracts were entered into. In the event that NPC’s Senior Unsecured debt rating is downgraded by two out of the three rating agencies, the counterparties have the right to require NPC to post cash or a letter of credit to the extent the counterparties have mark-to-market exposure to NPC, subject to certain caps. As of December 31, 2009, the maximum amount of collateral NPC would be required to post under these agreements is approximately $26.6 million based on mark-to-market values, which are substantially based on quoted market prices. Of this amount, approximately $21.1 million would be required if NPC is downgraded one level, and an additional amount of approximately $5.5 million would be required if NPC is downgraded two levels.
Cross Default Provisions
None of the financing agreements of NPC contains a cross-default provision that would result in an event of default by NPC upon an event of default by NVE or SPPC under any of its financing agreements. In addition, certain financing agreements of NPC provide for an event of default if there is a failure under other financing agreements of NPC to meet payment terms or to observe other covenants that would result in an acceleration of payments due. Most of these default provisions (other than ones relating to a failure to pay such other indebtedness when due) provide for a cure period of 30-60 days from the occurrence of a specified event during which time NPC may rectify or correct the situation before it becomes an event of default.
SPPC recognized net income of $73.1million for the year ended December 31, 2009, compared to net income of $90.6 million in 2008 and a net income of $65.7 million in 2007. In 2009, SPPC paid dividends to NVE of approximately $128.8 million. In February 2010, SPPC declared a dividend of approximately $13 million to NVE. Details of SPPC’s operating results are further discussed below.
Gross margin is presented by SPPC in order to provide information that management believes aids the reader in determining how profitable the electric business is at the most fundamental level. Gross margin, which is a “non-GAAP financial measure” as defined in accordance with SEC rules, provides a measure of income available to support the other operating expenses of the business and is a key factor utilized by management in its analysis of its business.
SPPC believes presenting gross margin allows the reader to assess the impact of SPPC’s regulatory treatment and its overall regulatory environment on a consistent basis. To the extent purchased power and natural gas supply costs are deemed prudent by the PUCN and/or the CPUC, changes in these costs are designed to pass through to our customers and do not effect gross margin or operating income. Gross margin, as calculated below, provides a measure of income available to support the other operating expenses of SPPC. For reconciliation to operating income, see Note 2, Segment information in the Notes to Financial Statements. Gross margin may be impacted by such factors as customer usage, customer growth and general base rate adjustments (filed every three years by statute).
The components of gross margin for the years ended December 31 (dollars in thousands):
| | | 2009 | | | 2008 | | | 2007 | |
| | | | | | Change from | | | | | | Change from | | | | |
| | | Amount | | | Prior Year | | | Amount | | | Prior Year | | | Amount | |
| Operating Revenues: | | | | | | | | | | | | | | | |
| Electric | | $ | 957,130 | | | | -4.5 | % | | $ | 1,002,674 | | | | -3.5 | % | | $ | 1,038,867 | |
| Gas | | | 205,263 | | | | -2.2 | % | | | 209,987 | | | | 2.2 | % | | | 205,430 | |
| | | $ | 1,162,393 | | | | -4.1 | % | | $ | 1,212,661 | | | | -2.5 | % | | $ | 1,244,297 | |
| | | | | | | | | | | | | | | | | | | | | |
| Energy Costs: | | | | | | | | | | | | | | | | | | | | |
| Fuel for power generation | | $ | 294,121 | | | | 3.8 | % | | $ | 283,342 | | | | 16.6 | % | | $ | 242,973 | |
| Purchased power | | | 130,977 | | | | -55.4 | % | | | 293,527 | | | | -15.7 | % | | | 348,299 | |
| Gas purchased for resale | | | 153,607 | | | | -9.9 | % | | | 170,468 | | | | 13.0 | % | | | 150,879 | |
| Deferred energy – electric - net | | | 73,829 | | | | - | | | | 1,291 | | | | -98.3 | % | | | 78,044 | |
| Deferred energy – gas - net | | | 7,636 | | | | -265.7 | % | | | (4,609 | ) | | | -142.8 | % | | | 10,763 | |
| | | $ | 660,170 | | | | -11.3 | % | | $ | 744,019 | | | | -10.5 | % | | $ | 830,958 | |
| Energy Costs by Segment: | | | | | | | | | | | | | | | | | | | | |
| Electric | | $ | 498,927 | | | | -13.7 | % | | $ | 578,160 | | | | -13.6 | % | | $ | 669,316 | |
| Gas | | | 161,243 | | | | -2.8 | % | | | 165,859 | | | | 2.6 | % | | | 161,642 | |
| | | $ | 660,170 | | | | -11.3 | % | | $ | 744,019 | | | | -10.5 | % | | $ | 830,958 | |
| | | | | | | | | | | | | | | | | | | | | |
| Gross Margin by Segment: | | | | | | | | | | | | | |
| Electric | | $ | 458,203 | | | | 7.9 | % | | $ | 424,514 | | | | 14.9 | % | | $ | 369,551 | |
| Gas | | | 44,020 | | | | -0.2 | % | | | 44,128 | | | | 0.8 | % | | | 43,788 | |
| | | $ | 502,223 | | | | 7.2 | % | | $ | 468,642 | | | | 13.4 | % | | $ | 413,339 | |
| | | | | | | | | | | | | | | | | | | | | |
SPPC’s electric gross margin increased for the year ended December 31, 2009, compared to the same period in 2008, primarily due to an increase in BTGR revenue as a result of SPPC’s 2007 GRC, effective July 1, 2008, increased revenues associated with renewable energy programs, and a slight increase in average customer growth. Partially offsetting the increase was a change in customer usage patterns, a decrease in short-term transmission revenue, and the switching of certain mining customers to DOS.
SPPC’s electric gross margin increased for the year ended December 31, 2008, compared to the same period in 2007, primarily due to an increase in BTGR revenue as a result of SPPC’s 2007 GRC, effective July 1, 2008, increased customer growth, and in 2007 a charge of approximately $14.2 million for deferred energy disallowed. See Note 3, Regulatory Actions of the Notes to Financial Statements. Partially offsetting these increases was a decrease in customer usage primarily due to cooler weather.
SPPC’s gas gross margin did not change materially for the year ended December 31, 2009 compared to the same period in 2008.
SPPC’s gas gross margin increased for the year ended December 31, 2008, compared to the same period in 2007, primarily due to increased customer usage as a result of colder winter temperatures.
The causes for significant changes in specific lines comprising the results of operations for the years ended are provided below (dollars in thousands except for amounts per unit):
Electric Operating Revenues
| | | 2009 | | | 2008 | | | 2007 | |
| | | Amount | | | Change from Prior year | | | Amount | | | Change from Prior year | | | Amount | |
| Electric Operating Revenues: | | | | | | | | | | | | | | | |
| Residential | | $ | 345,455 | | | | 1.3 | % | | $ | 340,972 | | | | 3.2 | % | | $ | 330,557 | |
| Commercial | | | 381,805 | | | | -1.3 | % | | | 386,678 | | | | 0.6 | % | | | 384,364 | |
| Industrial | | | 199,510 | | | | -17.1 | % | | | 240,711 | | | | -17.9 | % | | | 293,270 | |
| Retail revenues | | | 926,770 | | | | -4.3 | % | | | 968,361 | | | | -4.0 | % | | | 1,008,191 | |
| Other | | | 30,360 | | | | -11.5 | % | | | 34,313 | | | | -11.9 | % | | | 30,676 | |
| Total Revenues | | $ | 957,130 | | | | -4.5 | % | | $ | 1,002,674 | | | | -3.5 | % | | $ | 1,038,867 | |
| | | | | | | | | | | | | | | | | | | | | |
| Retail sales in thousands | | | | | | | | | | | | | | | | | | | | |
| of megawatt-hours (MWh) | | | 8,162 | | | | -4.6 | % | | | 8,560 | | | | -2.4 | % | | | 8,773 | |
| | | | | | | | | | | | | | | | | | | | | |
| Average retail revenue per MWh | | $ | 113.55 | | | | 0.4 | % | | $ | 113.13 | | | | -1.6 | % | | $ | 114.92 | |
SPPC’s retail revenues decreased for the year ended December 31, 2009 compared to the same period in 2008 primarily due to lower industrial revenue and decreased customer usage mainly due to milder weather during the first three quarters of 2009. Industrial revenues decreased primarily due to the transition of Cortez Mine to DOS effective November 1, 2008 and a new retail service agreement with Newmont beginning in June 2008, discussed below. In addition, one large commercial customer moved to standby service effective November 1, 2009. Lower rates as a result of the BTER quarterly update and the annual Deferred Energy cases effective October 1, 2009 also contributed to the decrease. These decreases were partially offset by increased retail rates as a result of SPPC’s BTGR case effective July 1, 2008 (see Note 3, Regulatory Actions of the Notes to Financial Statements). The average number of residential customers decreased 0.1% and the average number of commercial and industrial customers increased 1.3% and 1.8%, respectively.
In 2007, SPPC and Newmont entered into a wholesale power sale agreement and a new form of retail service, whereby Newmont will sell the electrical output from its generating plant to SPPC for at least 15 years under a long-term wholesale purchase power agreement and remain a retail customer of SPPC during at least that period under the terms of the retail service agreement and pursuant to a new rate schedule. The terms of these contracts became effective on June 1, 2008, at which point Newmont moved to a new retail service agreement at a reduced energy rate, which resulted in decreased electric revenues.
Retail revenues decreased for the year ended December 31, 2008 compared to the same period in 2007 primarily due to lower industrial revenue, decreases in retail rates, and decreased customer usage due to cooler summer temperatures. Industrial revenues decreased primarily due the agreement with Newmont as discussed above. In addition, Cortez Mine transitioned to DOS effective November 1, 2008. Two large industrial customers also moved to DOS and standby service during the second quarter of 2007. Retail rates decreased as a result of SPPC’s various BTER quarterly cases and the annual Deferred Energy case but were partially offset by increased BTGR as a result of the general rate case effective July 1, 2008 (see Note 3, Regulatory Actions of the Notes to Financial Statements). These decreases were partially offset by increases in the number of residential, commercial, and industrial customers (0.5%, 2.0%, and 4.5% respectively).
Electric Operating Revenues – Other decreased for the year ended December 31, 2009 compared to the same period in 2008 primarily due to decreased sales of wholesale power to other utilities and decreased transmission revenues due to the termination of several transmission service agreements.
Electric Operating Revenues – Other increased for the year ended December 31, 2008 compared to the same period in 2007 primarily due to increased transmission wheeling revenue. Additionally, contributing to the increase was the recognition of BTGR impact charge as a result of Newmont’s transition discussed above. These increases were offset by a decrease in charges related to the departure of Barrick Gold Corporation from SPPC’s system.
Gas Operating Revenues
| | | 2009 | | | 2008 | | | 2007 | |
| | | Amount | | | Change from Prior Year | | | Amount | | | Change from Prior Year | | | Amount | |
| Gas Operating Revenues: | | | | | | | | | | | | | | | |
| Residential | | $ | 116,680 | | | | 1.6 | % | | $ | 114,845 | | | | -2.6 | % | | $ | 117,871 | |
| Commercial | | | 52,186 | | | | 0.0 | % | | | 52,163 | | | | -2.6 | % | | | 53,551 | |
| Industrial | | | 17,458 | | | | -10.5 | % | | | 19,514 | | | | -3.1 | % | | | 20,145 | |
| Retail revenues | | | 186,324 | | | | -0.1 | % | | | 186,522 | | | | -2.6 | % | | | 191,567 | |
| Wholesale | | | 16,560 | | | | -21.0 | % | | | 20,956 | | | | 88.5 | % | | | 11,116 | |
| Miscellaneous | | | 2,379 | | | | -5.2 | % | | | 2,509 | | | | -8.7 | % | | | 2,747 | |
| Total Revenues | | $ | 205,263 | | | | -2.2 | % | | $ | 209,987 | | | | 2.2 | % | | $ | 205,430 | |
| | | | | | | | | | | | | | | | | | | | | |
| Retail sales in thousands | | | | | | | | | | | | | | | | | | | | |
| of Dths | | | 15,046 | | | | -0.2 | % | | | 15,070 | | | | 1.2 | % | | | 14,893 | |
| | | | | | | | | | | | | | | | | | | | | |
| Average retail revenues per Dth | | $ | 12.38 | | | | 0.0 | % | | $ | 12.38 | | | | -3.7 | % | | $ | 12.86 | |
Retail gas revenues decreased slightly for the year ended December 31, 2009 compared to the same period in 2008. Retail rates decreased slightly in 2009 as a result of SPPC’s 2007 and 2008 Natural Gas and Propane Deferred Rate Case and BTER updates. See Note 3, Regulatory Actions of the Notes to Financial Statements. The average number of retail customers increased by 0.4%.
Retail gas revenues decreased for the year ended December 31, 2008 as compared to the same period in 2007 primarily due to decreases in retail customer rates. Retail rates decreased as a result of SPPC’s 2007 and 2008 Natural Gas and Propane Deferred Rate Case and BTER updates. See Note 3, Regulatory Actions of the Notes to Financial Statements. This decrease was partially offset by increased usage due to colder winter temperatures and growth in retail customers. The average number of retail customers increased by 1.2%.
Wholesale revenues decreased for the year ended December 31, 2009 compared to the same period in 2008 primarily due to decreased availability of gas for wholesale sales during the fourth quarter of 2009.
Wholesale revenues increased for the year ended December 31, 2008 compared to the same period in 2007 primarily due to increased availability of gas for wholesale sales during the second half of 2008.
Energy Costs
Energy Costs include Fuel for Generation and Purchased Power. These costs are dependent upon many factors which may vary by season or period. As a result, SPPC’s usage and average cost per MWh of Fuel for Generation versus Purchased Power can vary significantly as the company meets the demands of the season. These factors include, but are not limited to:
| · | Weather; |
| · | Plant outages; |
| · | Total system demand; |
| · | Resource constraints; |
| · | Transmission constraints; |
| · | Gas transportation constraints; |
| · | Natural gas constraints; |
| · | Mandated power purchases; and |
| · | Generation efficiency. |
| | | 2009 | | | 2008 | | | 2007 | |
| | | | | | Change from | | | | | | Change from | | | | |
| | | Amount | | | Prior Year | | | Amount | | | Prior Year | | | Amount | |
| Energy Costs | | | | | | | | | | | | | | | |
| Fuel for Generation | | $ | 294,121 | | | | 3.8 | % | | $ | 283,342 | | | | 16.6 | % | | $ | 242,973 | |
| Purchased Power | | | 130,977 | | | | -55.4 | % | | | 293,527 | | | | -15.7 | % | | | 348,299 | |
| Total Energy Costs | | $ | 425,098 | | | | -26.3 | % | | $ | 576,869 | | | | -2.4 | % | | $ | 591,272 | |
| | | | | | | | | | | | | | | | | | | | | |
| MWhs | | | | | | | | | | | | | | | | | | | | |
| Fuel for Generation (in thousands) | | | 5,582 | | | | 20.5 | % | | | 4,633 | | | | 14.9 | % | | | 4,032 | |
| Purchased Power (in thousands) | | | 3,296 | | | | -27.5 | % | | | 4,547 | | | | -15.4 | % | | | 5,376 | |
| Total MWhs | | | 8,878 | | | | -3.3 | % | | | 9,180 | | | | -2.4 | % | | | 9,408 | |
| | | | | | | | | | | | | | | | | | | | | |
| Average cost per MWh | | | | | | | | | | | | | | | | | | | | |
| Fuel for Generation | | $ | 52.69 | | | | -13.8 | % | | $ | 61.16 | | | | 1.5 | % | | $ | 60.26 | |
| Purchased Power | | $ | 39.74 | | | | -38.4 | % | | $ | 64.55 | | | | -0.4 | % | | $ | 64.79 | |
| Total average cost per MWh | | $ | 47.88 | | | | -23.8 | % | | $ | 62.84 | | | | 0.0 | % | | $ | 62.85 | |
Energy costs decreased for the year ended December 31, 2009, compared to the same period in 2008, primarily due to lower natural gas prices, reduced capacity, tolling and transmission costs, partially offset by hedging costs. Total MWhs decreased due to cooler summer temperatures, certain customers switching to DOS and a change in customer usage patterns.
| · | Fuel for generation, as a component of energy costs, increased primarily due to an increase in self generation as a result of the expansion at the Tracy Generating Station which was placed in service July 2008. The average cost per MWh for fuel for generation decreased in 2009 primarily due to lower market prices for natural gas partially offset by increased costs for hedging instruments. |
| · | Purchase power costs, as a component of energy costs, and the average cost per MWh of purchased power decreased primarily due to a decrease in volume. As a result of the decrease in volume SPPC was able to fulfill a significant amount of its purchased power requirements through the purchase power contract with Newmont, as discussed above under Electric Operating Revenues. Furthermore, SPPC was able to significantly reduce capacity, tolling and transmission costs. |
Energy costs decreased for the year ended December 31, 2008, compared to the same period in 2007, primarily due to a decrease in total system demand. The average cost per MWh remained relatively stable in 2008 compared to 2007. The average cost per MWh for energy costs, self generation and purchased power can fluctuate considerably during the year. When hydro conditions are favorable it is more economical for SPPC to purchase more power relative to self generation. However, transmission capacity constraints limit the amount of power that SPPC can purchase and import into its service territory. In the third quarter 2008, SPPC’s Tracy Generating Station expansion became commercially operable, thereby increasing SPPC’s ability to self generate compared to prior years.
Gas Purchased for Resale
| | | 2009 | | | 2008 | | | 2007 | |
| | | Amount | | | Change from Prior Year | | | Amount | | | Change from Prior Year | | | Amount | |
| | | | | | | | | | | | | | | | |
| Gas Purchased for Resale | | $ | 153,607 | | | | -9.9 | % | | $ | 170,468 | | | | 13.0 | % | | $ | 150,879 | |
| | | | | | | | | | | | | | | | | | | | | |
| Gas Purchased for Resale | | | 19,588 | | | | 1.7 | % | | | 19,265 | | | | 10.9 | % | | | 17,378 | |
| (in thousands of Dth) | | | | | | | | | | | | | | | | | | | | |
| | | | | | | | | | | | | | | | | | | | | |
| Average Cost per Dth | | $ | 7.84 | | | | -11.4 | % | | $ | 8.85 | | | | 2.0 | % | | $ | 8.68 | |
Gas purchased for resale and average cost per Dth decreased for the year ended December 31, 2009 as compared to the same period in 2008. The decrease is primarily due to a decrease in natural gas prices partially offset by an increase in hedging cost. The volume of gas purchased for resale increased in 2009 compared to 2008 primarily due to slightly colder weather in 2009.
The cost of gas purchased for resale and average cost per Dth increased for the year ended December 31, 2008, compared to the same period in 2007. The increase is primarily due to an increase in natural gas prices which were partially offset by a decrease in the costs associated with hedging instruments. The volume of gas purchased for resale increased in 2008 compared to 2007 primarily due to colder weather in 2008.
Deferred Energy – Net
| | | 2009 | | | 2008 | | | 2007 | |
| | | Amount | | | Change from Prior Year | | | Amount | | | Change from Prior Year | | | Amount | |
| | | | | | | | | | | | | | | | |
| Deferred energy - electric - net | | $ | 73,829 | | | | N/A | | | $ | 1,291 | | | | -98.3 | % | | $ | 78,044 | |
| Deferred energy - gas - net | | | 7,636 | | | | -265.9 | % | | | (4,609 | ) | | | -142.8 | % | | | 10,763 | |
| Total | | $ | 81,465 | | | | | | | $ | (3,318 | ) | | | | | | $ | 88,807 | |
Deferred energy – net represents the difference between actual fuel and purchased power costs incurred during the period and amounts recoverable through current rates. To the extent actual costs exceed amounts recoverable through current rates, the excess is recognized as a reduction in costs. Conversely to the extent actual costs are less than amounts recoverable through current rates the difference is recognized as an increase in costs. Deferred energy – net also include the current amortization of fuel and purchased power costs previously deferred.
Deferred energy - electric – net for 2009, 2008 and 2007 reflect amortization of deferred energy costs of $(7.6), $16.3 million and $44.1 million, respectively; and an over-collection of amount recoverable in rates of $81.4 million in 2009, an under-collection of $15 million in 2008, and over-collection of $19.7 million in 2007. See Note 3, Regulatory Actions, of the Notes to Financial Statements for further detail of deferred energy balances. In addition, the amount for 2007 includes the November 2007 disallowance of $14.2 million by the PUCN of deferred settlement costs incurred to resolve claims arising from the Western Energy Crisis, reference Note 3, Regulatory Actions of the Notes to Financial Statements.
Deferred energy - gas - net for 2009, 2008 and 2007 reflect amortization of deferred energy of $(3.1) million, $(1) million and $0.7 million, respectively; and an over-collection of amount recoverable in rates of $10.8 million in 2009, an under-collection of $3.6 million in 2008 and over-collection of $10.1 million in 2007.
Other Operating Expenses
| | | 2009 | | | 2008 | | | 2007 | |
| | | Amount | | | Change from Prior Year | | | Amount | | | Change from Prior Year | | | Amount | |
| | | | | | | | | | | | | | | | |
| Other operating expense | | $ | 170,849 | | | | 21 | % | | $ | 141,064 | | | | -0.9 | % | | $ | 142,348 | |
| Maintenance expense | | $ | 31,290 | | | | 2 | % | | $ | 30,787 | | | | -2.4 | % | | $ | 31,553 | |
| Depreciation and amortization | | $ | 106,048 | | | | 18.5 | % | | $ | 89,528 | | | | 7.4 | % | | $ | 83,393 | |
Other operating expense increased for the year ended December 31, 2009, compared to the same period in 2008, primarily due to higher pension and other post retirement benefit expenses, costs related to the severance programs, as discussed further in Note 17, Severance Programs, of the Notes to Financial Statements, costs associated with renewable energy programs, legal expenses, operating expenses for the Tracy Generating Station expansion placed in service in summer 2008 and chemical costs for the Valmy Generating Station. Additionally, contributing to higher expenses was higher provisions for bad debt in 2009 compared to 2008.
Other operating expense decreased for the year ended December 31, 2008, compared to the same period in 2007, primarily due to a disallowance by the PUCN of deferred settlement costs incurred to resolve claims arising from the Western Energy Crisis in November 2007. Also contributing to the decrease in other operating expense were lower cost for claims and legal fees, as well as, a reduction in bad debt expense and lower labor costs; partially offset by higher regulatory amortizations.
Maintenance expense increased for the year ended December 31, 2009, compared to the same period in 2008, mainly due to the addition of the Tracy Generating Station expansion that became operational in summer of 2008, partially offset by outages at the Valmy Generating Station for boiler repairs in 2008 and lower maintenance cost for Ft. Churchill in 2009.
Maintenance expense decreased for the year ended December 31, 2008, compared to the same period in 2007, due to outages in 2007 at the Valmy Generating Station for turbine and boiler tube repairs; partially offset by higher maintenance expense for the Tracy Generating Station placed in service July 2008.
Depreciation and amortization increased the year ended December 31, 2009, compared to the same period in 2008, primarily as a result of increases in plant-in-service, primarily due to the completion of the Tracy Generating Station in July of 2008.
Depreciation and amortization increased the year ended December 31, 2008, compared to the same period in 2007, primarily as a result of increases in plant-in-service, primarily due to the completion of the Tracy Generating Station in July of 2008, and commencement of the TRED Deferred Tax Amortization.
Interest Expense
| | | 2009 | | | 2008 | | | 2007 | |
| | | Amount | | | Change from Prior Year | | | Amount | | | Change from Prior Year | | | Amount | |
| Interest Expense (net of AFUCD-debt) | | $ | 69,413 | | | | -4.5 | % | | $ | 72,712 | | | | 19.7 | % | | $ | 60,735 | |
Interest expense decreased for the year ended December 31, 2009 compared to the same period in 2008 primarily due to lower interest rates on variable rate debt, interest savings related to repurchased debt, and the redemption of $99 million Series A General and Refunding Mortgage Bonds in June 2008. These amounts were partially offset by the issuance of $250 million Series Q General and Refunding Mortgage Notes in September 2008, the addition of $150 million to its 6.0% Series M General and Refunding Mortgage Notes in August 2009 and a decrease in AFUDC-debt due to the completion of the Tracy Generating Station in July of 2008. See Note 6, Long-Term Debt, of the Notes to Financial Statements for additional information regarding long-term debt.
Interest charges on long-term debt increased for the year ended December 31, 2008 compared to the same period in 2007 primarily due to the issuance of $250 million Series Q General and Refunding Mortgage Notes in September 2008, and the issuance of the $325 million Series P General and Refunding Mortgage Notes in June 2007. These amounts were partially offset by the redemption of $99 million Series A General and Refunding Mortgage Bonds in June 2008, and the redemption of the $221 million Series A General and Refunding Mortgage Bonds in June 2007.
Other Income and (Expenses)
| | | 2009 | | | 2008 | | | 2007 | |
| | | Amount | | | Change from Prior Year | | | Amount | | | Change from Prior Year | | | Amount | |
| | | | | | | | | | | | | | | | |
| | | | | | | | | | | | | | | | |
| Interest income (expense) on regulatory items | | $ | (5,743 | ) | | | 175.2 | % | | $ | (2,087 | ) | | | -341.3 | % | | $ | 865 | |
| AFUDC-equity | | $ | 3,249 | | | | -74.1 | % | | $ | 12,524 | | | | -21.5 | % | | $ | 15,948 | |
| Other income | | $ | 13,276 | | | | 3.6 | % | | $ | 12,819 | | | | 58.4 | % | | $ | 8,091 | |
| Other expense | | $ | (7,648 | ) | | | -8.1 | % | | $ | (8,318 | ) | | | -1.5 | % | | $ | (8,441 | ) |
Interest income (expense) on regulatory items increased for the year ended December 31, 2009 compared to the same period in 2008 due to higher over-collected deferred energy balances in 2009.
Interest income (expense) on regulatory items decreased for the year ended December 31, 2008 compared to the same period in 2007 due to over collected deferred energy in 2008. See Note 3, Regulatory Actions of the Notes to Financial Statements for further details of deferred energy balances.
AFUDC-equity was lower for the year ended December 31, 2009 compared to the same period in 2008 primarily due to the completion of the Tracy Generating Station in July of 2008, which resulted in a decrease in the CWIP balance.
AFUDC-equity was lower for the year ended December 31, 2008 compared to the same period in 2007 primarily due to the completion of the Tracy Generating Station in July of 2008, which resulted in a decrease in the CWIP balance.
Other income increased for the year ended December 31, 2009 compared to the same period in 2008 primarily due to gains on the disposition of property in 2009 and interest received for tax refunds partially offset by income earned in 2008 related to the reinstatement of previously disallowed costs associated with Piñon Pine and the settlement with Calpine as discussed in Note 3, Regulatory Actions and Note 13, Commitments and Contingencies of the Notes to Financial Statements.
Other income increased for the year ended December 31, 2008 compared to the same period in 2007 primarily due to the reinstatement of previously disallowed costs associated with Piñon Pine, as discussed in Note 3, Regulatory Actions of the Notes to Financial Statements, and the settlement with Calpine, as discussed further in Note 13, Commitments and Contingencies of the Notes to Financial Statements. This increase was partially offset by lower interest income on investments and a refund of expenses in 2007.
Other expense decreased for the year ended December 31, 2009 compared to the same period in 2008 due to lower advertising costs in 2009 and adjustments resulting from the decision in SPPC’s GRC in 2008. See Note 3, Regulatory Actions of the Notes to Financial Statements for further information. Partially offsetting the decrease was a disallowance relating to contract pricing for energy.
Other expense decreased slightly for the year ended December 31, 2008 compared to the same period in 2007 primarily due to development costs in 2007 associated with an information technology system conversion project, offset by higher advertising costs and donations in 2008.
SPPC’s cash flows decreased in 2009 compared to 2008 due to a reduction in cash from financing activities, partially offset by an increase in cash from operating activities and a decrease in cash used in investing activities.
Cash From Operating Activities. The increase in cash from operating activities was primarily due to the over collection of revenues in excess of fuel and purchased power costs, an increase in BTGR revenues as a result of SPPC’s 2007 GRC, lower funding of pension plans and settlement of affiliate tax receivables. These increases were offset by the payment in 2009 of higher balances for fuel and purchased power costs at December 2008.
Cash Used By Investing Activities. Cash used by investing activities decreased due to the slowdown in construction for infrastructure.
Cash From Financing Activities. The decrease in cash from financing activities is primarily due to the repurchase of debt and payments on the revolving credit facility. These decreases were partially offset by the addition of $150 million to the Series M Notes, a decrease in dividends to NVE and an increase in investment by NVE.
Overall Liquidity
SPPC’s primary source of operating cash flows is electric revenues, including the recovery of previously deferred energy costs. Significant uses of cash flows from operations include the purchase of electricity and natural gas, other operating expenses, capital expenditures and the payment of interest on SPPC’s outstanding indebtedness. Operating cash flows can be significantly influenced by factors such as weather, regulatory outcome and economic conditions.
| Available Liquidity as of December 31, 2009 (in millions) | |
| | | SPPC | |
| Cash and Cash Equivalents | | $ | 14.4 | |
Balance available on Revolving Credit Facility (1) | | | 301.8 | |
| | | | | |
| | | $ | 316.2 | |
| (1) | As of February 19, 2010, SPPC had approximately $291.2 million available under its revolving credit facility. |
SPPC attempts to maintain its cash and cash equivalents in highly liquid investments, such as U.S. treasury bills. In addition to cash on hand, SPPC may use its revolving credit facilities in order to meet its liquidity needs. Alternatively, depending on the usage of the revolving credit facilities, SPPC may issue debt, subject to certain restrictions as discussed in Factors Affecting Liquidity, Ability to Issue Debt, below.
SPPC has no significant debt maturities in 2010 or 2011, except for the balances on its revolving credit facility. SPPC’s long-term credit facility expires on November 4, 2010. Currently, SPPC is assessing its options with respect to replacing its expiring credit facility. As of February 19, 2010, SPPC has borrowed approximately $25 million on its revolving credit facility, not including letters of credit.
SPPC anticipates that it will be able to meet short-term operating costs, such as fuel and purchased power costs, with internally generated funds, including the recovery of deferred energy and the use of its revolving credit facilities. Additionally, to manage liquidity needs as a result of seasonal peaks in fuel requirements, SPPC may use hedging activities. Furthermore, in order to fund long-term capital requirements, SPPC will likely meet such financial obligations with a combination of internally generated funds, the use of the revolving credit facilities, the issuance of long-term debt, and capital contributions from NVE. However, if energy costs rise at a rapid rate and SPPC does not recover the cost of fuel and purchased power in a timely manner, if operating costs are not recovered in a timely manner or SPPC were to experience a credit rating downgrade resulting in the posting of collateral as discussed below under Gas Supplier Matters and Financial Gas Hedges, the amount of liquidity available to SPPC could be significantly less. In order to maintain sufficient liquidity, SPPC may be required to further delay capital expenditures, re-finance debt or obtain funding through an equity issuance by NVE.
The ability to issue debt, as discussed later, is subject to certain covenant calculations which include consolidated net income of NVE and the Utilities. As a result of these covenant calculations and the seasonality of the Utilities’ business, the ability to issue
debt can vary from quarter to quarter, and the Utilities may not be able to fully utilize the availability on their revolving credit facilities.
In 2009, SPPC paid dividends to NVE of $128.8 million.
SPPC designs operating and capital budgets to control operating costs and capital expenditures. In addition to operating expenses, SPPC has continuing commitments for capital expenditures for construction, improvement and maintenance of facilities.
Detailed below are SPPC’s Capital Structure, Capital Requirements, recently completed Financing Transactions and Factors Affecting Liquidity, including our ability to obtain debt on favorable terms.
Capital Structure
SPPC’s actual consolidated capital structure was as follows at December 31 (dollars in thousands):
| | | 2009 | | | 2008 | |
| | | Amount | | | Percent of Total Capitalization | | | Amount | | | Percent of Total Capitalization | |
| Current Maturities of Long-Term Debt | | $ | 15,000 | | | | 0.7 | % | | $ | 600 | | | | 0.0 | % |
| Long-Term Debt | | | 1,282,225 | | | | 55.6 | % | | | 1,395,987 | | | | 61.4 | % |
| Shareholder’s Equity | | | 1,009,258 | | | | 43.8 | % | | | 877,961 | | | | 38.6 | % |
| Total | | $ | 2,306,483 | | | | 100.0 | % | | $ | 2,274,548 | | | | 100 | % |
Capital Requirements
Construction Expenditures
SPPC’s cash construction expenditures for 2010 are projected to be $146.7 million. SPPC’s cash construction expenditures for 2010 through 2014 are projected to be $804.9 million. Cash used by investing activities for the years ended 2009, 2008 and 2007 were approximately $185.7 million, $207.8 million and $393.2 million, respectively. To fund future capital projects SPPC may meet such financial obligations with a combination of internally generated funds, the use of its revolving credit facility and if necessary, the issuance of long-term debt and/or capital contributions from NVE.
Contractual Obligations
The table below provides SPPC’s consolidated contractual obligations that SPPC expects to satisfy through a combination of internally generated cash and, as necessary, through the issuance of short-term and long-term debt. Certain contracts contain variable factors which required SPPC to estimate the obligation depending on the final variable amount. Actual amounts could differ. The table does not include estimated construction expenditures described above, except for major capital projects for which SPPC has executed contracts by December 31, 2009. Additionally, at December 31, 2009, SPPC recorded an uncertain tax liability of $10.5 million as required by the accounting guidance for Uncertainty in Income Taxes Topic of the FASC, all of which is classified as non-current. SPPC is unable to make a reasonably reliable estimate of the period of cash payments to relevant tax authorities; consequently, none of the uncertain tax liability is included in the contractual obligations table below (dollars in thousands):
| | | Payment Due by Period | |
| | | 2010 | | | 2011 | | | 2012 | | | 2013 | | | 2014 | | | Thereafter | | | Total | |
| | | | | | | | | | | | | | | | | | | | | | |
| Long-Term Debt Maturities | | $ | 15,000 | | | $ | - | | | $ | 100,000 | | | $ | 250,000 | | | $ | - | | | $ | 916,417 | | | $ | 1,281,417 | |
| Long-Term Debt Interest Payments | | | 65,252 | | | | 65,238 | | | | 60,811 | | | | 54,447 | | | | 45,363 | | | | 446,778 | | | | 737,889 | |
| Purchased Power | | | 177,295 | | | | 176,400 | | | | 173,788 | | | | 175,180 | | | | 180,820 | | | | 2,336,732 | | | | 3,220,215 | |
Coal, Natural Gas and Transportation | | | 283,339 | | | | 109,965 | | | | 60,608 | | | | 59,062 | | | | 59,062 | | | | 221,497 | | | | 793,533 | |
| Long-Term Service Agreements | | | 5,631 | | | | 5,631 | | | | 5,631 | | | | 5,631 | | | | 5,631 | | | | 33,784 | | | | 61,939 | |
| Operating Leases | | | 13,745 | | | | 8,526 | | | | 7,162 | | | | 6,529 | | | | 5,741 | | | | 39,872 | | | | 81,575 | |
| | | | | | | | | | | | | | | | | | | | | | | | | | | | | |
| Total Contractual Cash Obligations | | $ | 560,262 | | | $ | 365,760 | | | $ | 408,000 | | | $ | 550,849 | | | $ | 296,617 | | | $ | 3,994,080 | | | $ | 6,176,568 | |
Pension and Other Postretirement Benefit Plan Matters
NVE has a qualified pension plan and other postretirement benefits plan which cover substantially all employees of NVE, NPC and SPPC. The annual net benefit cost for the plans is expected to decrease in 2010 by approximately $24.7 million compared to the 2009 cost of $62.2 million, which excludes one-time special termination charges associated with severance programs. See Note 17, Severance Programs, of the Notes to Financial Statements for further discussion. As of December 31, 2009, the measurement date,
the plan was under funded under the provisions of the Compensation Retirement Benefits Topic of the FASC. Refer to Note 11, Retirement Plan and Post-Retirement Benefits, in the Notes to Financial Statements. During 2009, NVE funded a total of $53.5 million to the trusts established for these plans. At the present time, NVE cannot determine if additional funding will be required in 2010 to meet the minimum funding level requirements defined by the Pension Protection Act of 2006. NVE is expected to fund approximately $40 million to the Plans in 2010.
Financing Transactions
Revolving Credit Facility
On March 2, 2009, SPPC amended its $350 million Amended and Restated Revolving Credit Agreement, due November 2010, to remove a bankrupt lending bank from the facility. This amendment reduced the capacity of the facility to approximately $332 million. SPPC’s credit facility expires in November 2010. See Ability to Issue Debt, below, for further details of the revolving credit facility.
Tender Offer for General and Refunding Mortgage Notes, Series P
In November 2009, SPPC provided notice of a cash tender offer to purchase up to $75 million aggregate principal amount of its 6.75% General and Refunding Mortgage Notes, Series P, due 2037. Those holders who tendered their Bonds by the early tender date of December 7, 2009 received a purchase price of $1,102.15 per $1,000 principal amount of Notes. Holders who validly tendered their Notes after the early tender date but before the tender expiration date of December 21, 2009 received a purchase price of $1,062.15 per $1,000 principal amount of Notes. In addition, holders received accrued and unpaid interest to, but not including the date of purchase. Approximately $73.3 million of the $325 million Series P Notes outstanding were validly tendered and accepted by SPPC. The tender offer was funded predominantly with cash on hand, with the balance being funded with borrowings under its revolving credit facility.
General and Refunding Mortgage Notes, Series M
On August 21, 2009, SPPC issued an additional $150 million in aggregate principal amount of its 6% General and Refunding Mortgage Notes, Series M, as part of the same series as the original Series M Notes issued in March 2006. Upon the issuance of these Notes, the aggregate principal amount of the Series M Notes outstanding is $450 million. The proceeds from the second issuance were used to repay amounts outstanding under SPPC’s revolving credit facility.
Conversion of Washoe County Water Facilities Refunding Revenue Bonds
In January 2009, SPPC converted the $40 million principal amount, Washoe County, Nevada Water Facilities Refunding Revenue Bonds Series 2007A bonds, due 2036 (the “Water Bonds”) from auction rate securities to variable rate demand notes. The purpose of the conversion was to reduce interest costs and volatility associated with these bonds. SPPC purchased 100% of the Water Bonds on that date, with the use of its revolving credit facility and available cash, and will remain the sole holder of the Water Bonds, until such time as SPPC determines to reoffer the Water Bonds to investors. These Water Bonds remain outstanding and have not been retired or cancelled. However, as SPPC is the sole holder of the Water Bonds, for financial reporting purposes the investment in the Water Bonds and the indebtedness will be offset for presentation purposes.
Factors Affecting Liquidity
Ability to Issue Debt
SPPC’s ability to issue debt is impacted by certain factors such as financing authority from the PUCN, financial covenants in its financing agreements and its revolving credit facility agreement, and the terms of certain NVE debt. As of December 31, 2009, the most restrictive of the factors below is the PUCN authority. Based on this restriction, SPPC may issue up to $350 million of long term debt securities, and maintain a credit facility of up to $600 million. However, depending on NVE’s or NPC’s issuance of long-term debt or the use of Utilities’ revolving credit facilities, the PUCN authority may not remain the most restrictive factor. The factors affecting SPPC’s ability to issue debt are further detailed below.
| a. | Financing authority from the PUCN - As of December 31, 2009, SPPC has financing authority from the PUCN to issue (1) additional long term debt of up to $350 million for the three-year period ending December 31, 2012, (2) ongoing authority to maintain a revolving credit facility of up to $600 million, and (3) authority to refinance approximately $348 million of long-term debt securities. |
| | |
| b. | Financial covenants within SPPC’s financing agreements – SPPC’s $332 million Amended and Restated Revolving Credit Agreement dated November 2005 contains two financial maintenance covenants. The first requires SPPC to maintain a ratio of consolidated indebtedness to consolidated capital, determined as of the last day of each fiscal quarter, not to exceed 0.68 to 1. The second requires SPPC to maintain a ratio of consolidated cash flow to consolidated interest expense, determined as of the last day of each fiscal quarter for the period of four consecutive fiscal quarters, not to be less that 2.0 to 1. As of December 31, 2009, SPPC was in compliance with these covenants. In order to maintain compliance with these covenants, SPPC is limited to $832 million of additional indebtedness. |
| | |
| | All other financial covenants contained in SPPC’s revolving credit facility and its financing agreements are suspended, as SPPC’s senior secured debt is rated investment grade. However, if SPPC’s senior secured debt ratings fall below investment grade by either Moody’s or S&P, SPPC would again be subject to the limitations under these additional covenants; and |
| c. | Financial covenants within NVE’s financing agreements – As discussed in NVE’s Ability to Issue Debt, SPPC is also subject to NVE’s cap on additional consolidated indebtedness of $1.2 billion. |
Ability to Issue General and Refunding Mortgage Securities
To the extent that SPPC has the ability to issue debt under the most restrictive covenants in its financing agreements and has financing authority to do so from the PUCN, SPPC’s ability to issue secured debt is still limited by the amount of bondable property or retired bonds that can be used to issue debt under SPPC’s General and Refunding Mortgage Indenture (“Indenture”).
The Indenture creates a lien on substantially all of SPPC’s properties in Nevada. As of December 31, 2009, $1.7 billion of SPPC’s General and Refunding Mortgage Securities were outstanding. SPPC had the capacity to issue $573.0 million of General and Refunding Mortgage Securities as of December 31, 2009. That amount is determined on the basis of:
| 1. | 70% of net utility property additions; |
| 2. | The principal amount of retired General and Refunding Mortgage Securities; and/or |
| 3. | The principal amount of first mortgage bonds retired after October 2001. |
Property additions include plant in service and specific assets in CWIP. The amount of bond capacity listed above does not include eligible property in CWIP.
SPPC also has the ability to release property from the lien of the mortgage indenture on the basis of net property additions, cash and/or retired bonds. To the extent SPPC releases property from the lien of SPPC’s Indenture, it will reduce the amount of securities issuable under the Indenture.
Credit Ratings
SPPC’s senior secured debt is rated investment grade by three Nationally Recognized Statistical Rating Organizations: Fitch, Moody’s and S&P. DBRS is no longer covering NVE and the Utilities. As of December 31, 2009, the ratings are as follows:
| | | | Rating Agency |
| | | | Fitch | | Moody’s | | S&P |
| SPPC | Sr. Secured Debt | | BBB-* | | Baa3* | | BBB* |
* Investment grade
S&P’s and Moody’s rating outlook for SPPC is Stable. Fitch’s rating outlook is Positive.
A security rating is not a recommendation to buy, sell or hold securities. Security ratings are subject to revision and withdrawal at any time by the assigning rating organization, and each rating should be evaluated independently of any other rating.
Energy Supplier Matters
With respect to SPPC’s contracts for purchased power, SPPC purchases and sells electricity with counterparties under the WSPP agreement, an industry standard contract that SPPC uses as a member of the WSPP. The WSPP contract is posted on the WSPP website.
Under these contracts, a material adverse change (e.g., a credit rating downgrade) in SPPC may allow the counterparty to request adequate financial assurance, which, if not provided within three business days, could cause a default. Most contracts and confirmations for purchased power have been modified or separate agreements have been made to either shorten the normal payment due date or require payment in advance of delivery in response to requests for financial assurance. A default must be declared within 30 days of the event, giving rise to the default becoming known. A default will result in a termination payment equal to the present value of the net gains and losses for the entire remaining term of all contracts between the parties aggregated to a single liquidated amount due within three business days following the date the notice of termination is received. The mark-to-market value, which is
substantially based on quoted market prices, can be used to roughly approximate the termination payment and benefit at any point in time. Under the net mark-to-market value as of December 31, 2009 for all suppliers continuing to provide power under a WSPP agreement no amounts would be due to or from SPPC. These contracts qualify for the normal purchases scope exception as defined by the Derivatives and Hedging Topic of the FASC, and as such, are not required to be mark-to-market on the balance sheet. Refer to Note 9, Derivatives and Hedging Activities, of the Notes to Financial Statements for further discussion.
Gas Supplier Matters
With respect to the purchase and sale of natural gas, SPPC uses several types of standard industry contracts. The natural gas contract terms and conditions are more varied than the electric contracts. Consequently, some of the contracts contain language similar to that found in the WSPP agreement and other agreements have unique provisions dealing with material adverse change, which primarily means a credit rating downgrade below investment grade. Forward physical gas supplies are purchased under index based pricing terms and as such do not carry forward mark-to-market exposure. Because of creditworthiness concerns, most contracts and confirmations for natural gas purchases have been modified or separate agreements have been made to either shorten the normal payment due date or require payment in advance of delivery. At the present time, no counterparties require payment in advance of delivery.
Gas transmission service is secured under FERC Tariffs or custom agreements. These service contracts and Tariffs require the user to establish and maintain creditworthiness to obtain service or otherwise post cash or a letter of credit to be able to receive service. Service contracts are subject to FERC approved tariffs, which, under certain circumstances, require the Utilities to provide collateral to continue receiving service.
Financial Gas Hedges
SPPC enters into certain hedging contracts with various counterparties to manage the gas price risk inherent in purchased power and fuel contracts. However, in October 2009, the program was temporarily suspended. See Energy Supply Planning, above, for further discussion. The hedging contracts require that SPPC maintain its Moody’s and S&P Senior Unsecured or equivalent ratings in place at the time the contracts were entered into. In the event that SPPC’s Senior Unsecured debt rating is downgraded by two out of the three rating agencies, the counterparties have the right to require SPPC to post cash or a letter of credit to the extent the counterparties have mark-to-market exposure to SPPC, subject to certain caps. As of December 31, 2009, the maximum amount of collateral SPPC would be required to post under these agreements is approximately $25.3 million based on mark-to-market values, which are substantially based on quoted market prices. Of this amount, approximately $19.8 million would be required if SPPC is downgraded one level and an additional amount of approximately $5.5 million would be required if SPPC is downgraded two levels.
Cross Default Provisions
None of the financing agreements of SPPC contains a cross-default provision that would result in an event of default by SPPC upon an event of default by NVE or NPC under any of its financing agreements. In addition, certain financing agreements of SPPC provide for an event of default if there is a failure under other financing agreements of SPPC to meet payment terms or to observe other covenants that would result in an acceleration of payments due. Most of these default provisions (other than ones relating to a failure to pay such other indebtedness when due) provide for a cure period of 30-60 days from the occurrence of a specified event during which time SPPC may rectify or correct the situation before it becomes an event of default.
NVE is a “holding company” under the Public Utility Holding Company Act of 2005 (PUHCA 2005). As a result, NVE and all of its subsidiaries (whether or not engaged in any energy related business) are required to maintain books, accounts and other records in accordance with FERC regulations and to make them available to the FERC, the PUCN and CPUC. In addition, the PUCN, CPUC or the FERC have the authority to review allocations of costs of non-power goods and administrative services among NVE and its subsidiaries. The FERC has the authority generally to require that rates subject to its jurisdiction be just and reasonable and in this context would continue to be able to, among other things, review transactions between NVE, NPC and/or SPPC and/or any other affiliated company.
The Utilities are subject to the jurisdiction of the PUCN and, in the case of SPPC, the CPUC with respect to rates, standards of service, siting of and necessity for generation and certain transmission facilities, accounting, issuance of securities and other matters with respect to electric distribution and transmission operations. NPC and SPPC submit IRPs to the PUCN for approval.
Under federal law, the Utilities are subject to certain jurisdictional regulation, primarily by the FERC. The FERC has jurisdiction under the Federal Power Act with respect to rates, service, interconnection, accounting and other matters in connection with the Utilities’ sale of electricity for resale and interstate transmission. The FERC also has jurisdiction over the natural gas pipeline companies from which the Utilities take service.
As a result of regulation, many of the fundamental business decisions of the Utilities, as well as the ROR they are permitted to earn on their utility assets, are subject to the approval of governmental agencies.
The Utilities are required to file annual electric and gas DEAA cases on March 1 as mandated by the 2007 Nevada Legislature, quarterly BTER Updates for the Utilities’ electric and gas departments, and triennial GRCs in Nevada. A DEAA case is filed to recover/refund any under/over collection of prior energy costs and the BTER Updates recover current energy costs. As of December 31, 2009, NPC’s and SPPC’s balance sheets included approximately $65 million and credit of $116 million, respectively, of deferred energy of which $239 million and credits of $25 million had been previously approved for collection over various periods. The remaining amounts will be requested in future DEAA filings. A GRC filing is to set rates to recover operation and maintenance expenses, depreciation, taxes and provide a return on invested capital. Refer to Note 3, Regulatory Actions, of the Notes to Financial Statements for further information on significant regulatory matters and deferred energy and regulatory asset and liability balances.
Interest Rate Risk
As of December 31, 2009, NVE, NPC and SPPC have evaluated their risk related to financial instruments whose values are subject to market sensitivity. Such instruments are fixed and variable rate debt. The tables below do not include the interest rate swap entered into in 2009 and discussed further in Note 9, Derivatives and Hedging Activities, of the Notes to Financial Statements, as the amount is considered immaterial. Fair market value is determined using quoted market price for the same or similar issues or on the current rates offered for debt of the same remaining maturities (dollars in thousands).
| | | December 31, 2009 | | | | | | | |
| | | Expected Maturities | | | | | | | |
| | | | | | | | | | | | | | | | | | | | | | | | Fair | |
| | | 2010 | | | 2011 | | | 2012 | | | 2013 | | | 2014 | | | Thereafter | | | Total | | | Value | |
| Long-Term Debt | | | | | | | | | | | | | | | | | | | | | | | | |
| NVE | | | | | | | | | | | | | | | | | | | | | | | | |
| Fixed Rate | | $ | - | | | $ | - | | | $ | 63,670 | | | $ | - | | | $ | 230,039 | | | $ | 191,500 | | | $ | 485,209 | | | $ | 490,533 | |
| Average Interest Rate | | | - | | | | - | | | | 7.80 | % | | | - | | | | 8.63 | % | | | 6.75 | % | | | 7.78 | % | | | | |
| | | | | | | | | | | | | | | | | | | | | | | | | | | | | | | | | |
| NPC | | | | | | | | | | | | | | | | | | | | | | | | | | | | | | | | |
| Fixed Rate | | $ | - | | | $ | 364,000 | | | $ | 130,000 | | | $ | - | | | $ | 125,000 | | | $ | 2,717,050 | | | $ | 3,336,050 | | | $ | 3,564,421 | |
| Average Interest Rate | | | - | | | | 8.14 | % | | | 6.50 | % | | | - | | | | 7.38 | % | | | 6.50 | % | | | 6.72 | % | | | | |
| | | | | | | | | | | | | | | | | | | | | | | | | | | | | | | | | |
| Variable Rate | | $ | 110,000 | | | $ | - | | | $ | - | | | $ | - | | | $ | - | | | $ | 173,775 | | | $ | 283,775 | | | $ | 283,775 | |
| Average Interest Rate | | | 0.99 | % | | | - | | | | - | | | | - | | | | - | | | | .98 | % | | | .99 | % | | | | |
| | | | | | | | | | | | | | | | | | | | | | | | | | | | | | | | | |
| SPPC | | | | | | | | | | | | | | | | | | | | | | | | | | | | | | | | |
| Fixed Rate | | $ | - | | | $ | - | | | $ | 100,000 | | | $ | 250,000 | | | $ | - | | | $ | 701,742 | | | $ | 1,051,742 | | | $ | 1,112,275 | |
| Average Interest Rate | | | - | | | | - | | | | 6.25 | % | | | 5.45 | % | | | - | | | | 6.27 | % | | | 6.07 | % | | | | |
| | | | | | | | | | | | | | | | | | | | | | | | | | | | | | | | | |
| Variable Rate | | $ | 15,000 | | | $ | - | | | $ | - | | | $ | - | | | $ | - | | | $ | 214,675 | | | $ | 229,675 | | | $ | 229,675 | |
| Average Interest Rate | | | 0.99 | % | | | - | | | | - | | | | - | | | | - | | | | 1.00 | % | | | 1.00 | % | | | - | |
| | | | | | | | | | | | | | | | | | | | | | | | | | | | | | | | | |
| TOTAL DEBT | | $ | 125,000 | | | $ | 364,000 | | | $ | 293,670 | | | $ | 250,000 | | | $ | 355,039 | | | $ | 3,998,742 | | | $ | 5,386,451 | | | $ | 5,680,679 | |
| | | December 31, 2008 | | | | | | | |
| | | Expected Maturities | | | | | | | |
| | | | | | | | | | | | | | | | | | | | | | | | Fair | |
| | | 2009 | | | 2010 | | | 2011 | | | 2012 | | | 2013 | | | Thereafter | | | Total | | | Value | |
| Long-Term Debt | | | | | | | | | | | | | | | | | | | | | | | | |
| NVE | | | | | | | | | | | | | | | | | | | | | | | | |
| Fixed Rate | | $ | - | | | $ | - | | | $ | - | | | $ | 63,670 | | | $ | - | | | $ | 421,539 | | | $ | 485,209 | | | $ | 427,348 | |
| Average Interest Rate | | | - | | | | - | | | | - | | | | 7.80 | % | | | - | | | | 7.77 | % | | | 7.78 | % | | | | |
| | | | | | | | | | | | | | | | | | | | | | | | | | | | | | | | | |
| NPC | | | | | | | | | | | | | | | | | | | | | | | | | | | | | | | | |
| Fixed Rate | | $ | - | | | $ | - | | | $ | 364,000 | | | $ | 130,000 | | | $ | - | | | $ | 2,269,335 | | | $ | 2,763,335 | | | $ | 2,531,977 | |
| Average Interest Rate | | | - | | | | - | | | | 8.14 | % | | | 6.50 | % | | | - | | | | 6.35 | % | | | 6.60 | % | | | | |
| | | | | | | | | | | | | | | | | | | | | | | | | | | | | | | | | |
| Variable Rate | | $ | - | | | $ | 409,629 | | | $ | - | | | $ | - | | | $ | - | | | $ | 179,500 | | | $ | 589,129 | | | $ | 589,129 | |
| Average Interest Rate | | | - | | | | 2.32 | % | | | - | | | | - | | | | - | | | | 5.92 | % | | | 3.42 | % | | | | |
| | | | | | | | | | | | | | | | | | | | | | | | | | | | | | | | | |
| SPPC | | | | | | | | | | | | | | | | | | | | | | | | | | | | | | | | |
| Fixed Rate | | $ | 600 | | | $ | - | | | $ | - | | | $ | 100,000 | | | $ | 250,000 | | | $ | 625,000 | | | $ | 975,600 | | | $ | 899,098 | |
| Average Interest Rate | | | 6.40 | % | | | - | | | | - | | | | 6.25 | % | | | 5.45 | % | | | 6.39 | % | | | 6.13 | % | | | | |
| | | | | | | | | | | | | | | | | | | | | | | | | | | | | | | | | |
| Variable Rate | | $ | - | | | $ | 152,912 | | | $ | - | | | $ | - | | | $ | - | | | $ | 258,500 | | | $ | 411,412 | | | $ | 411,412 | |
| Average Interest Rate | | | - | | | | 2.15 | % | | | - | | | | - | | | | - | | | | 5.72 | % | | | 4.39 | % | | | - | |
| | | | | | | | | | | | | | | | | | | | | | | | | | | | | | | | | |
| TOTAL DEBT | | $ | 600 | | | $ | 562,541 | | | $ | 364,000 | | | $ | 293,670 | | | $ | 250,000 | | | $ | 3,753,874 | | | $ | 5,224,685 | | | $ | 4,858,964 | |
Commodity Price Risk
Commodity price increases due to changes in market conditions are recovered through the deferred energy mechanism. Although the Utilities actively manage energy commodity (electric, natural gas, coal and oil) price risk through their procurement strategies, the ability to recover commodity price changes through future rates substantially mitigates commodity price risk. However, the Utilities are subject to cash flow risk due to changes in the value of their open positions and are subject to regulatory risk because the PUCN may disallow recovery for any costs that it considers imprudently incurred. The Utilities mitigate both risk associated with its open positions and regulatory risk through prudent energy supply practices which include the use of long-term fuel supply agreements, long-term purchase power agreements and derivative instruments such as forwards, options and swaps to meet the anticipated fuel and power requirements. See Energy Supply in Item 7, Management’s Discussion and Analysis of Financial Condition and Results of Operations, for a discussion of the Utilities’ purchased power procurement strategies.
Credit Risk
The Utilities monitor and manage credit risk with their counterparties. Credit risk is defined as the possibility that a counterparty to one or more contracts will be unable or unwilling to fulfill its financial or physical obligations to the Utilities because of the counterparty’s financial condition. The Utilities’ credit risk associated with counterparties was approximately $73.2 million as of December 31, 2009, compared to a balance of $334.3 million at December 31, 2008, and $73.7 million at September 30, 2009. The decrease from December 31, 2008 is primarily due to lower market prices for physical electric contracts and lower contract prices for natural gas contracts.
| FINANCIAL STATEMENTS AND SUPPLEMENTARY DATA | |
| | | | |
| | | | |
| | | | Page |
| | |
| Reports of Independent Registered Public Accounting Firm | 84 |
| | | | |
| NV Energy, Inc.: | |
| | | | |
| | Consolidated Income Statements for the Years Ended December 31, 2009, 2008 and 2007 | 87 |
| | Consolidated Balance Sheets as of December 31, 2009 and 2008 | 88 |
| | Consolidated Statements of Cash Flows for the Years Ended December 31, 2009, 2008 and 2007 | 90 |
| | Consolidated Statements of Comprehensive Income for the Years Ended December 31, 2009, 2008 and 2007 | 91 |
| | Consolidated Statements of Common Shareholders’ Equity for the Years Ended December 31, 2009, 2008 and 2007 | 92 |
| | | | |
| Nevada Power Company: | |
| | | | |
| | Consolidated Income Statements for the Years Ended December 31, 2009, 2008 and 2007 | 93 |
| | Consolidated Balance Sheets as of December 31, 2009 and 2008 | 94 |
| | Consolidated Statements of Cash Flows for the Years Ended December 31, 2009, 2008 and 2007 | 96 |
| | Consolidated Statements of Comprehensive Income for the Years Ended December 31, 2009, 2008 and 2007 | 97 |
| | Consolidated Statements of Common Shareholder’s Equity for the Years Ended December 31, 2009, 2008 and 2007 | 98 |
| | | | |
| Sierra Pacific Power Company: | |
| | | | |
| | Consolidated Income Statements for the Years Ended December 31, 2009, 2008 and 2007 | 99 |
| | Consolidated Balance Sheets as of December 31, 2009 and 2008 | 100 |
| | Consolidated Statements of Cash Flows for the Years Ended December 31, 2009, 2008 and 2007 | 102 |
| | Consolidated Statements of Comprehensive Income for the Years Ended December 31, 2009, 2008 and 2007 | 103 |
| | Consolidated Statements of Common Shareholder’s Equity for the Years Ended December 31, 2009, 2008 and 2007 | 104 |
| | | | |
| Notes to Financial Statements for NV Energy, Inc., Nevada Power Company and Sierra Pacific Power Company | 105 |
To the Board of Directors and Shareholders of
NV Energy, Inc.
Las Vegas, Nevada
We have audited the accompanying consolidated balance sheets of NV Energy, Inc. and subsidiaries (the “Company”) as of December 31, 2009 and 2008, and the related consolidated statements of income, comprehensive income (loss), common shareholders’ equity, and cash flows for each of the three years in the period ended December 31, 2009. Our audits also included the financial statement schedule listed in the Index at Item 15. These financial statements and financial statement schedule are the responsibility of the Company’s management. Our responsibility is to express an opinion on the financial statements and financial statement schedule based on our audits.
We conducted our audits in accordance with the standards of the Public Company Accounting Oversight Board (United States). Those standards require that we plan and perform the audit to obtain reasonable assurance about whether the financial statements are free of material misstatement. An audit includes examining, on a test basis, evidence supporting the amounts and disclosures in the financial statements. An audit also includes assessing the accounting principles used and significant estimates made by management, as well as evaluating the overall financial statement presentation. We believe that our audits provide a reasonable basis for our opinion.
In our opinion, such consolidated financial statements present fairly, in all material respects, the financial position of NV Energy, Inc. and subsidiaries as of December 31, 2009 and 2008, and the results of their operations and their cash flows for each of the three years in the period ended December 31, 2009, in conformity with accounting principles generally accepted in the United States of America. Also, in our opinion, such financial statement schedule, when considered in relation to the basic consolidated financial statements taken as a whole, presents fairly, in all material respects, the information set forth therein.
We have also audited, in accordance with the standards of the Public Company Accounting Oversight Board (United States), the Company’s internal control over financial reporting as of December 31, 2009, based on the criteria established in Internal Control — Integrated Framework issued by the Committee of Sponsoring Organizations of the Treadway Commission and our report dated February 22, 2010 expressed an unqualified opinion on the Company’s internal control over financial reporting.
Las Vegas, Nevada
February 22, 2010
REPORT OF INDEPENDENT REGISTERED PUBLIC ACCOUNTING FIRM
To the Board of Directors and Shareholder of
Nevada Power Company
Las Vegas, Nevada
We have audited the accompanying consolidated balance sheets of Nevada Power Company and subsidiaries (the “Company”) as of December 31, 2009 and 2008, and the related consolidated statements of income, comprehensive income (loss), common shareholder’s equity, and cash flows for each of the three years in the period ended December 31, 2009. Our audits also included the financial statement schedule listed in the Index at Item 15. These financial statements and financial statement schedule are the responsibility of the Company’s management. Our responsibility is to express an opinion on the financial statements and financial statement schedule based on our audits.
We conducted our audits in accordance with the standards of the Public Company Accounting Oversight Board (United States). Those standards require that we plan and perform the audit to obtain reasonable assurance about whether the financial statements are free of material misstatement. The Company is not required to have, nor were we engaged to perform, an audit of its internal control over financial reporting. Our audits included consideration of internal control over financial reporting as a basis for designing audit procedures that are appropriate in the circumstances, but not for the purpose of expressing an opinion on the effectiveness of the Company’s internal control over financial reporting. Accordingly, we express no such opinion. An audit also includes examining, on a test basis, evidence supporting the amounts and disclosures in the financial statements. An audit also includes assessing the accounting principles used and significant estimates made by management, as well as evaluating the overall financial statement presentation. We believe that our audits provide a reasonable basis for our opinion.
In our opinion, such consolidated financial statements present fairly, in all material respects, the financial position of Nevada Power Company and subsidiaries as of December 31, 2009 and 2008, and the results of their operations and their cash flows for each of the three years in the period ended December 31, 2009, in conformity with accounting principles generally accepted in the United States of America. Also, in our opinion, such financial statement schedule, when considered in relation to the basic consolidated financial statements taken as a whole, presents fairly, in all material respects, the information set forth therein.
Las Vegas, Nevada
February 22, 2010
REPORT OF INDEPENDENT REGISTERED PUBLIC ACCOUNTING FIRM
To the Board of Directors and Shareholder of
Sierra Pacific Power Company
Las Vegas, Nevada
We have audited the accompanying consolidated balance sheets of Sierra Pacific Power Company and subsidiaries (the “Company”) as of December 31, 2009 and 2008, and the related consolidated statements of income, comprehensive income (loss), common shareholder’s equity, and cash flows for each of the three years in the period ended December 31, 2009. Our audits also included the financial statement schedule listed in the Index at Item 15. These financial statements and financial statement schedule are the responsibility of the Company’s management. Our responsibility is to express an opinion on the financial statements and financial statement schedule based on our audits.
We conducted our audits in accordance with the standards of the Public Company Accounting Oversight Board (United States). Those standards require that we plan and perform the audit to obtain reasonable assurance about whether the financial statements are free of material misstatement. The Company is not required to have, nor were we engaged to perform, an audit of its internal control over financial reporting. Our audits included consideration of internal control over financial reporting as a basis for designing audit procedures that are appropriate in the circumstances, but not for the purpose of expressing an opinion on the effectiveness of the Company’s internal control over financial reporting. Accordingly, we express no such opinion. An audit also includes examining, on a test basis, evidence supporting the amounts and disclosures in the financial statements. An audit also includes assessing the accounting principles used and significant estimates made by management, as well as evaluating the overall financial statement presentation. We believe that our audits provide a reasonable basis for our opinion.
In our opinion, such consolidated financial statements present fairly, in all material respects, the financial position of Sierra Pacific Power Company and subsidiaries as of December 31, 2009 and 2008, and the results of their operations and their cash flows for each of the three years in the period ended December 31, 2009, in conformity with accounting principles generally accepted in the United States of America. Also, in our opinion, such financial statement schedule, when considered in relation to the basic consolidated financial statements taken as a whole, presents fairly, in all material respects, the information set forth therein.
Las Vegas, Nevada
February 22, 2010
| NV ENERGY, INC. | |
| |
| (Dollars in Thousands, Except Per Share Amounts) | |
| | |
| | | | |
| | | Year Ended December 31, | |
| | | 2009 | | | 2008 | | | 2007 | |
| | | | | | | | | | |
| | | | | | | | | | |
| OPERATING REVENUES | | $ | 3,585,798 | | | $ | 3,528,113 | | | $ | 3,600,960 | |
| | | | | | | | | | | | | |
| OPERATING EXPENSES: | | | | | | | | | | | | |
| �� Fuel for power generation | | | 881,768 | | | | 1,039,267 | | | | 837,355 | |
| Purchased power | | | 758,736 | | | | 974,343 | | | | 1,036,905 | |
| Gas purchased for resale | | | 153,607 | | | | 170,468 | | | | 150,879 | |
| Deferred energy | | | 289,076 | | | | (10,265 | ) | | | 321,973 | |
| Other operating expenses | | | 453,413 | | | | 394,019 | | | | 379,446 | |
| Maintenance | | | 102,309 | | | | 94,069 | | | | 99,035 | |
| Depreciation and amortization | | | 321,921 | | | | 260,608 | | | | 235,532 | |
| Taxes other than income | | | 60,885 | | | | 53,525 | | | | 50,113 | |
| Total Operating Expenses | | | 3,021,715 | | | | 2,976,034 | | | | 3,111,238 | |
| OPERATING INCOME | | | 564,083 | | | | 552,079 | | | | 489,722 | |
| | | | | | | | | | | | | |
| OTHER INCOME (EXPENSE): | | | | | | | | | | | | |
Interest expense (net of AFUDC-debt: 2009-$20,229; 2008-$29,527; 2007-$25,967) | | | (334,314 | ) | | | (300,857 | ) | | | (279,788 | ) |
| Interest income (expense) on regulatory items | | | (2,280 | ) | | | 5,255 | | | | 26,154 | |
| AFUDC-equity | | | 24,274 | | | | 38,441 | | | | 31,809 | |
| Carrying charge for Lenzie | | | - | | | | - | | | | 16,080 | |
| Gain on sale of investment | | | - | | | | - | | | | 1,369 | |
| Other income | | | 33,122 | | | | 34,278 | | | | 24,580 | |
| Other expense | | | (26,498 | ) | | | (24,955 | ) | | | (25,076 | ) |
| Total Other Income (Expense) | | | (305,696 | ) | | | (247,838 | ) | | | (204,872 | ) |
| Income Before Income Tax Expense | | | 258,387 | | | | 304,241 | | | | 284,850 | |
| | | | | | | | | | | | | |
| Income tax expense (Note 10) | | | 75,451 | | | | 95,354 | | | | 87,555 | |
| | | | | | | | | | | | | |
| NET INCOME | | $ | 182,936 | | | $ | 208,887 | | | $ | 197,295 | |
| | | | | | | | | | | | | |
| Amount per share basic and diluted (Note 15) | | | | | | | | | | | | |
| Net Income per share basic and diluted | | $ | 0.78 | | | $ | 0.89 | | | $ | 0.89 | |
| | | | | | | | | | | | | |
| Weighted Average Shares of Common Stock Outstanding - basic | | | 234,542,292 | | | | 234,031,750 | | | | 222,180,440 | |
| Weighted Average Shares of Common Stock Outstanding - diluted | | | 235,180,688 | | | | 234,585,004 | | | | 222,554,024 | |
| Dividends Declared Per Share of Common Stock | | $ | 0.41 | | | $ | 0.34 | | | $ | 0.16 | |
| | | | | | | | | | | | | |
| The accompanying notes are an integral part of the financial statements. | |
| NV ENERGY, INC. | |
| |
| (Dollars in Thousands) | |
| | |
| | |
| | | | December 31, | |
| | | | 2009 | | | 2008 | |
| ASSETS | | | | | | | |
| | | | | | | | |
| Current Assets: | | | | | | | |
| Cash and cash equivalents | | | $ | 62,706 | | | $ | 54,359 | |
| Accounts receivable less allowance for uncollectible accounts: | | | | | | | | | |
| | 2009 - $32,341, 2008 - $32,884 | | | | 400,911 | | | | 410,184 | |
| Deferred energy (Note 3) | | | | - | | | | 50,436 | |
| Materials, supplies and fuel, at average cost | | | | 124,040 | | | | 124,271 | |
| Risk management assets (Note 9) | | | | 27,558 | | | | 16,118 | |
| Current income taxes receivable | | | | - | | | | 5,487 | |
| Deferred income taxes (Note 10) | | | | 87,562 | | | | 49,996 | |
| Other current assets | | | | 44,298 | | | | 52,633 | |
| Total Current Assets | | | | 747,075 | | | | 763,484 | |
| | | | | | | | | | | |
| Utility Property: | | | | | | | | | |
| Plant in service | | | | 10,833,622 | | | | 10,175,741 | |
| Construction work-in-progress | | | | 716,128 | | | | 605,163 | |
| Total | | | | 11,549,750 | | | | 10,780,904 | |
| Less accumulated provision for depreciation | | | | 2,884,199 | | | | 2,603,287 | |
| Total Utility Property, Net | | | | 8,665,551 | | | | 8,177,617 | |
| | | | | | | | | | | |
| Investments and other property, net (Note 4) | | | | 51,169 | | | | 25,181 | |
| | | | | | | | | | | |
| Deferred Charges and Other Assets: | | | | | | | | | |
| Deferred energy (Note 3) | | | | 138,963 | | | | 231,027 | |
| Regulatory assets (Note 3) | | | | 1,218,778 | | | | 1,415,286 | |
| Regulatory asset for pension plans (Note 3) | | | | 264,892 | | | | 413,544 | |
| Risk management assets (Note 9) | | | | 6,732 | | | | 9,959 | |
| Other deferred charges and assets | | | | 173,145 | | | | 169,266 | |
| Total Deferred Charges and Other Assets | | | | 1,802,510 | | | | 2,239,082 | |
| | | | | | | | | | | |
| Assets Held for Sale (Note 16) | | | | 147,158 | | | | 142,506 | |
| | | | | | | | | | | |
| TOTAL ASSETS | | | $ | 11,413,463 | | | $ | 11,347,870 | |
| | | | | | | | | | | |
| (Continued) | |
| NV ENERGY, INC. | |
| CONSOLIDATED BALANCE SHEETS | |
| (Dollars in Thousands) | |
| | |
| | | December 31, | |
| | | 2009 | | | 2008 | |
| | | | | | | |
| LIABILITIES AND SHAREHOLDERS' EQUITY | | | | | | |
| | | | | | | |
| Current Liabilities: | | | | | | |
| Current maturities of long-term debt (Note 6) | | $ | 134,474 | | | $ | 9,291 | |
| Accounts payable | | | 352,000 | | | | 400,084 | |
| Accrued expenses | | | 134,328 | | | | 131,720 | |
| Risk management liabilities (Note 9) | | | 66,871 | | | | 313,846 | |
| Deferred energy (Note 3) | | | 191,405 | | | | 28,546 | |
| Other current liabilities | | | 67,301 | | | | 87,060 | |
| Total Current Liabilities | | | 946,379 | | | | 970,547 | |
| | | | | | | | | |
| Long-term debt (Note 6) | | | 5,303,357 | | | | 5,266,982 | |
| | | | | | | | | |
| Commitments and Contingencies (Note 13) | | | | | | | | |
| | | | | | | | | |
| Deferred Credits and Other Liabilities: | | | | | | | | |
| Deferred income taxes (Note 10) | | | 1,072,780 | | | | 920,481 | |
| Deferred investment tax credit | | | 22,541 | | | | 25,923 | |
| Accrued retirement benefits | | | 149,925 | | | | 288,841 | |
| Risk management liabilities (Note 9) | | | 2,233 | | | | 53,403 | |
| Regulatory liabilities (Note 3) | | | 386,019 | | | | 350,526 | |
| Other deferred credits and liabilities | | | 280,560 | | | | 315,881 | |
| Total Deferred Credits and Other Liabilities | | | 1,914,058 | | | | 1,955,055 | |
| | | | | | | | | |
| Liabilities Held for Sale (Note 16) | | | 25,747 | | | | 24,100 | |
| | | | | | | | | |
| Shareholders' Equity: | | | | | | | | |
| Common stock | | | 234,834 | | | | 234,317 | |
| Other paid-in capital | | | 2,700,329 | | | | 2,694,792 | |
| Retained earnings | | | 295,247 | | | | 208,437 | |
| Accumulated other comprehensive loss | | | (6,488 | ) | | | (6,360 | ) |
| Total Shareholders' Equity | | | 3,223,922 | | | | 3,131,186 | |
| | | | | | | | | |
| TOTAL LIABILITIES AND SHAREHOLDERS' EQUITY | | $ | 11,413,463 | | | $ | 11,347,870 | |
| | | | | | | | | |
| The accompanying notes are an integral part of the financial statements. | |
| | |
| (Concluded) | |
| NV ENERGY, INC. | |
| |
| (Dollars in Thousands) | |
| | |
| | | For the Year Ended December 31, | |
| | | 2009 | | | 2008 | | | 2007 | |
| CASH FLOWS FROM OPERATING ACTIVITIES: | | | | | | | | | |
| Net Income | | $ | 182,936 | | | $ | 208,887 | | | $ | 197,295 | |
Adjustments to reconcile net income to net cash from operating activities: | | | | | | | | | | | | |
| Depreciation and amortization | | | 321,921 | | | | 260,608 | | | | 235,532 | |
| Deferred taxes and deferred investment tax credit | | | 111,219 | | | | 52,060 | | | | 79,337 | |
| AFUDC-equity | | | (24,274 | ) | | | (38,441 | ) | | | (31,809 | ) |
| Deferred energy | | | 306,406 | | | | 2,717 | | | | 309,587 | |
| Carrying charge on Lenzie Generating Station | | | - | | | | - | | | | (16,080 | ) |
| Reinstated interest on deferred energy | | | - | | | | - | | | | (11,076 | ) |
| Gain on sale of investment | | | - | | | | - | | | | (1,369 | ) |
| Other, net | | | (2,004 | ) | | | 100,482 | | | | 71,543 | |
| Changes in certain assets and liabilities: | | | | | | | | | | | | |
| Accounts receivable | | | 12,733 | | | | 39,776 | | | | (19,276 | ) |
| Materials, supplies and fuel | | | 465 | | | | (7,908 | ) | | | (13,725 | ) |
| Other current assets | | | 8,335 | | | | (6,724 | ) | | | 1,639 | |
| Accounts payable | | | (31,888 | ) | | | (12,028 | ) | | | 42,958 | |
| Accrued retirement benefits | | | (20,080 | ) | | | (79,242 | ) | | | (75,820 | ) |
| Other current liabilities | | | (17,287 | ) | | | 40,747 | | | | 22,475 | |
| Risk management assets and liabilities (Note 9) | | | 5,058 | | | | (4,924 | ) | | | 10,088 | |
| Other deferred assets | | | (13,831 | ) | | | (51,874 | ) | | | 498 | |
| Other regulatory assets | | | (69,937 | ) | | | (67,460 | ) | | | (45,864 | ) |
| Other deferred liabilities | | | (18,251 | ) | | | 22,238 | | | | (2,112 | ) |
| Net Cash from Operating Activities | | | 751,521 | | | | 458,914 | | | | 753,821 | |
| | | | | | | | | | | | | |
| CASH FLOWS USED BY INVESTING ACTIVITIES: | | | | | | | | | | | | |
| Additions to utility plant (excluding AFUDC-equity) | | | (843,132 | ) | | | (1,535,503 | ) | | | (1,165,517 | ) |
| Customer advances for construction | | | (8,369 | ) | | | (11,981 | ) | | | 8,230 | |
| Contributions in aid of construction | | | 76,940 | | | | 62,521 | | | | 32,165 | |
| Proceeds from sale of investment | | | - | | | | - | | | | 1,935 | |
| Investments and other property - net | | | (26,061 | ) | | | 4,301 | | | | 2,810 | |
| Net Cash used by Investing Activities | | | (800,622 | ) | | | (1,480,662 | ) | | | (1,120,377 | ) |
| | | | | | | | | | | | | |
| CASH FLOWS FROM FINANCING ACTIVITIES: | | | | | | | | | | | | |
| Proceeds from issuance of long-term debt | | | 1,418,872 | | | | 2,135,151 | | | | 1,246,383 | |
| Retirement of long-term debt | | | (1,271,350 | ) | | | (1,114,226 | ) | | | (1,044,866 | ) |
| Sale of Common Stock | | | 6,051 | | | | 5,756 | | | | 213,339 | |
| Proceeds from exercise of stock options | | | - | | | | - | | | | 548 | |
| Dividends paid | | | (96,125 | ) | | | (79,714 | ) | | | (35,417 | ) |
| Net Cash from Financing Activities | | | 57,448 | | | | 946,967 | | | | 379,987 | |
| | | | | | | | | | | | | |
| Net Increase (Decrease) in Cash and Cash Equivalents | | | 8,347 | | | | (74,781 | ) | | | 13,431 | |
| Beginning Balance in Cash and Cash Equivalents | | | 54,359 | | | | 129,140 | | | | 115,709 | |
| Ending Balance in Cash and Cash Equivalents | | $ | 62,706 | | | $ | 54,359 | | | $ | 129,140 | |
| | | | | | | | | | | | | |
| Supplemental Disclosures of Cash Flow Information: | | | | | | | | | | | | |
| Cash paid (received) during period for: | | | | | | | | | | | | |
| Interest | | $ | 325,508 | | | $ | 284,044 | | | $ | 267,082 | |
| Income taxes | | $ | (13,186 | ) | | $ | 10,677 | | | $ | 9,727 | |
| Significant non-cash transactions: | | | | | | | | | | | | |
| Accrued construction expenses as of December 31, | | $ | 127,786 | | | $ | 143,982 | | | $ | 111,163 | |
| | | | | | | | | | | | | |
| The accompanying notes are an integral part of the financial statements. | |
| NV ENERGY, INC. | |
| |
| (Dollars in Thousands) | |
| | | | |
| | | | |
| | | Year Ended December 31, | |
| | | 2009 | | | 2008 | | | 2007 | |
| | | | | | | | | | |
| NET INCOME | | $ | 182,936 | | | $ | 208,887 | | | $ | 197,295 | |
| | | | | | | | | | | | | |
| OTHER COMPREHENSIVE INCOME (LOSS) | | | | | | | | | | | | |
| | | | | | | | | | | | | |
| Change in compensation retirement benefits liability and amortization (Net of taxes $72, $284 and $1,250 in 2009, 2008 and 2007, respectively) | | | | | | | | | | | | |
| | $ | (128 | ) | | $ | (492 | ) | | $ | (2,323 | ) |
| | | | | | | | | | | | | |
| OTHER COMPREHENSIVE LOSS | | $ | (128 | ) | | $ | (492 | ) | | $ | (2,323 | ) |
| COMPREHENSIVE INCOME | | $ | 182,808 | | | $ | 208,395 | | | $ | 194,972 | |
| | | | | | | | | | | | | |
| The accompanying notes are an integral part of the financial statements. | |
| NV ENERGY, INC. | |
| |
| (Dollars in Thousands) | |
| | | | | | | | | | |
| | | | |
| | | December 31, | |
| | | 2009 | | | 2008 | | | 2007 | |
Common Stock: | | | | | | | | | |
| Balance at Beginning of Year | | $ | 234,317 | | | $ | 233,739 | | | $ | 221,030 | |
| Stock issuance/exchange, CSIP, DRP, ESPP and other | | | 517 | | | | 578 | | | | 12,709 | |
| Balance at end of year | | | 234,834 | | | | 234,317 | | | | 233,739 | |
| | | | | | | | | | | | | |
Other Paid-In Capital: | | | | | | | | | | | | |
| Balance at Beginning of Year | | | 2,694,792 | | | | 2,684,845 | | | | 2,483,244 | |
| Premium on issuance/exchange of common stock | | | - | | | | - | | | | 190,808 | |
| Common Stock issuance costs | | | - | | | | (90 | ) | | | (298 | ) |
| Stock purchase and dividend reinvestment | | | 2,494 | | | | 2,141 | | | | 504 | |
| Tax Benefit from stock option exercises | | | 7 | | | | 365 | | | | 891 | |
| CSIP, DRP, ESPP and other | | | 3,036 | | | | 7,531 | | | | 9,696 | |
| Balance at End of Year | | | 2,700,329 | | | | 2,694,792 | | | | 2,684,845 | |
| | | | | | | | | | | | | |
Retained Earnings: | | | | | | | | | | | | |
| Balance at Beginning of Year | | | 208,437 | | | | 83,859 | | | | (78,432 | ) |
Adjustments to beginning balances: Compensation retirement benefits in 2008 (net of taxes of ($2,514)), and uncertain tax positions in 2007 | | | (1 | ) | | | (4,669 | ) | | | 487 | |
| Income for the year | | | 182,936 | | | | 208,887 | | | | 197,295 | |
| Common stock dividends declared | | | (96,125 | ) | | | (79,640 | ) | | | (35,491 | ) |
| Balance at End of Year | | | 295,247 | | | | 208,437 | | | | 83,859 | |
| | | | | | | | | | | | | |
| Accumulated Other Comprehensive Income (Loss): | | | | | | | | | | | | |
| | | | | | | | | | | | | |
| Balance at Beginning of Year | | | (6,360 | ) | | | (5,868 | ) | | | (3,545 | ) |
Change in compensation retirement benefits liability and amortization (net of taxes of $72, $284 and $1,250 in 2009, 2008 and 2007 respectively) | | | (128 | ) | | | (492 | ) | | | (2,323 | ) |
| Balance at End of Year | | | (6,488 | ) | | | (6,360 | ) | | | (5,868 | ) |
| | | | | | | | | | | | | |
| Total Common Shareholders' Equity at End of Year | | $ | 3,223,922 | | | $ | 3,131,186 | | | $ | 2,996,575 | |
| | | | | | | | | | | | | |
| The accompanying notes are an integral part of the financial statements. | |
| | | | | | | | | | | | | |
| NEVADA POWER COMPANY | |
| |
| (Dollars in Thousands) | |
| | |
| | | | |
| | | Year Ended December 31, | |
| | | 2009 | | | 2008 | | | 2007 | |
| | | | | | | | | | |
| OPERATING REVENUES | | $ | 2,423,377 | | | $ | 2,315,427 | | | $ | 2,356,620 | |
| | | | | | | | | | | | | |
| OPERATING EXPENSES: | | | | | | | | | | | | |
| Fuel for power generation | | | 587,647 | | | | 755,925 | | | | 594,382 | |
| Purchased power | | | 627,759 | | | | 680,816 | | | | 688,606 | |
| Deferred energy | | | 207,611 | | | | (6,947 | ) | | | 233,166 | |
| Other operating expenses | | | 279,865 | | | | 249,236 | | | | 232,610 | |
| Maintenance | | | 71,019 | | | | 63,282 | | | | 67,482 | |
| Depreciation and amortization | | | 215,873 | | | | 171,080 | | | | 152,139 | |
| Taxes other than income | | | 37,241 | | | | 32,069 | | | | 29,823 | |
| Total Operating Expenses | | | 2,027,015 | | | | 1,945,461 | | | | 1,998,208 | |
| OPERATING INCOME | | | 396,362 | | | | 369,966 | | | | 358,412 | |
| | | | | | | | | | | | | |
| OTHER INCOME (EXPENSE): | | | | | | | | | | | | |
Interest expense (net of AFUDC-debt: 2009 - $17,184; 2008 - $20,063; 2007 - $13,196) | | | (226,252 | ) | | | (186,822 | ) | | | (174,667 | ) |
| Interest income on regulatory items | | | 3,463 | | | | 7,342 | | | | 25,289 | |
| AFUDC-Equity | | | 21,025 | | | | 25,917 | | | | 15,861 | |
| Carrying charge for Lenzie | | | - | | | | - | | | | 16,080 | |
| Other income | | | 19,658 | | | | 16,631 | | | | 14,423 | |
| Other expense | | | (18,320 | ) | | | (10,221 | ) | | | (11,352 | ) |
| Total Other Income (Expense) | | | (200,426 | ) | | | (147,153 | ) | | | (114,366 | ) |
| Income Before Income Tax Expense | | | 195,936 | | | | 222,813 | | | | 244,046 | |
| | | | | | | | | | | | | |
| Income tax expense (Note 10) | | | 61,652 | | | | 71,382 | | | | 78,352 | |
| | | | | | | | | | | | | |
| NET INCOME | | $ | 134,284 | | | $ | 151,431 | | | $ | 165,694 | |
| | | | | | | | | | | | | |
| | | | | | | | | | | | | |
| The accompanying notes are an integral part of the financial statements. | |
| NEVADA POWER COMPANY | |
| |
| (Dollars in Thousands) | |
| | |
| | |
| | | | December 31, | |
| | | | 2009 | | | 2008 | |
| ASSETS | | | | | | | |
| | | | | | | | |
| Current Assets: | | | | | | | |
| Cash and cash equivalents | | | $ | 42,609 | | | $ | 28,594 | |
| Accounts receivable less allowance for uncollectible accounts: | | | | | | | | | |
| | 2009 - $29,375, 2008 - $30,621 | | | | 254,027 | | | | 238,379 | |
| Deferred energy (Note 3) | | | | - | | | | 50,436 | |
| Materials, supplies and fuel, at average cost | | | | 69,176 | | | | 74,103 | |
| Risk management assets (Note 9) | | | | 21,902 | | | | 11,724 | |
| Intercompany income taxes receivable | | | | 10,356 | | | | 20,695 | |
| Deferred income taxes (Note 10) | | | | 58,425 | | | | 2,682 | |
| Other current assets | | | | 27,855 | | | | 34,657 | |
| Total Current Assets | | | | 484,350 | | | | 461,270 | |
| | | | | | | | | | | |
| Utility Property: | | | | | | | | | |
| Plant in service | | | | 7,414,432 | | | | 6,884,033 | |
| Construction work-in-progress | | | | 627,026 | | | | 514,096 | |
| Total | | | | 8,041,458 | | | | 7,398,129 | |
| Less accumulated provision for depreciation | | | | 1,727,710 | | | | 1,500,502 | |
| Total Utility Property, Net | | | | 6,313,748 | | | | 5,897,627 | |
| | | | | | | | | | | |
| Investments and other property, net (Note 4) | | | | 41,167 | | | | 19,701 | |
| | | | | | | | | | | |
| Deferred Charges and Other Assets: | | | | | | | | | |
| Deferred energy (Note 3) | | | | 138,963 | | | | 231,027 | |
| Regulatory assets (Note 3) | | | | 856,769 | | | | 971,354 | |
| Regulatory asset for pension plans (Note 3) | | | | 129,709 | | | | 187,894 | |
| Risk management assets (Note 9) | | | | 5,590 | | | | 7,346 | |
| Other deferred charges and assets | | | | 126,075 | | | | 127,928 | |
| Total Deferred Charges and Other Assets | | | | 1,257,106 | | | | 1,525,549 | |
| | | | | | | | | | | |
| TOTAL ASSETS | | | $ | 8,096,371 | | | $ | 7,904,147 | |
| | | | | | | | | | | |
| (Continued) | |
| NEVADA POWER COMPANY | |
| CONSOLIDATED BALANCE SHEETS | |
| (Dollars in Thousands) | |
| | |
| | | December 31, | |
| | | 2009 | | | 2008 | |
| | | | | | | |
| LIABILITIES AND SHAREHOLDER'S EQUITY | | | | | | |
| | | | | | | |
| Current Liabilities: | | | | | | |
| Current maturities of long-term debt (Note 6) | | $ | 119,474 | | | $ | 8,691 | |
| Accounts payable | | | 249,962 | | | | 262,552 | |
| Accounts payable, affiliated companies | | | 32,414 | | | | 32,901 | |
| Accrued expenses | | | 86,983 | | | | 80,069 | |
| Risk management liabilities (Note 9) | | | 39,122 | | | | 222,856 | |
| Deferred energy (Note 3) | | | 74,129 | | | | - | |
| Other current liabilities | | | 52,306 | | | | 72,762 | |
| Total Current Liabilities | | | 654,390 | | | | 679,831 | |
| | | | | | | | | |
| Long-term debt (Note 6) | | | 3,535,440 | | | | 3,385,106 | |
| | | | | | | | | |
| Commitments and Contingencies (Note 13) | | | | | | | | |
| | | | | | | | | |
| Deferred Credits and Other Liabilities: | | | | | | | | |
| Deferred income taxes (Note 10) | | | 794,890 | | | | 635,523 | |
| Deferred investment tax credit | | | 8,698 | | | | 10,001 | |
| Accrued retirement benefits | | | 39,678 | | | | 103,023 | |
| Risk management liabilities (Note 9) | | | 1,165 | | | | 35,241 | |
| Regulatory liabilities (Note 3) | | | 210,287 | | | | 188,709 | |
| Other deferred credits and liabilities | | | 201,784 | | | | 239,146 | |
| Total Deferred Credits and Other Liabilities | | | 1,256,502 | | | | 1,211,643 | |
| | | | | | | | | |
| Shareholder's Equity: | | | | | | | | |
| Common stock | | | 1 | | | | 1 | |
| Other paid-in capital | | | 2,254,189 | | | | 2,254,182 | |
| Retained earnings | | | 399,345 | | | | 377,055 | |
| Accumulated other comprehensive loss | | | (3,496 | ) | | | (3,671 | ) |
| Total Shareholder's Equity | | | 2,650,039 | | | | 2,627,567 | |
| | | | | | | | | |
| TOTAL LIABILITIES AND SHAREHOLDER'S EQUITY | | $ | 8,096,371 | | | $ | 7,904,147 | |
| | | | | | | | | |
| The accompanying notes are an integral part of the financial statements. | |
| | |
| (Concluded) | |
| NEVADA POWER COMPANY | |
| |
| (Dollars in Thousands) | |
| | |
| | | For the Year Ended December 31, | |
| | | 2009 | | | 2008 | | | 2007 | |
| CASH FLOWS FROM OPERATING ACTIVITIES: | | | | | | | | | |
| Net Income | | $ | 134,284 | | | $ | 151,431 | | | $ | 165,694 | |
| Adjustments to reconcile net income to net cash from operating activities: | | | | | | | | | | | | |
| Depreciation and amortization | | | 215,873 | | | | 171,080 | | | | 152,139 | |
| Deferred taxes and deferred investment tax credit | | | 96,831 | | | | 45,039 | | | | 56,868 | |
| AFUDC-equity | | | (21,025 | ) | | | (25,917 | ) | | | (15,861 | ) |
| Deferred energy | | | 216,629 | | | | 4,211 | | | | 218,992 | |
| Carrying charge on Lenzie Generating Station | | | - | | | | - | | | | (16,080 | ) |
| Reinstated interest on deferred energy | | | - | | | | - | | | | (11,076 | ) |
| Other, net | | | (34,291 | ) | | | 73,209 | | | | 38,821 | |
| Changes in certain assets and liabilities: | | | | | | | | | | | | |
| Accounts receivable | | | (5,309 | ) | | | 35,863 | | | | (29,619 | ) |
| Materials, supplies and fuel | | | 4,928 | | | | (5,432 | ) | | | (7,916 | ) |
| Other current assets | | | 6,802 | | | | (6,305 | ) | | | (1,395 | ) |
| Accounts payable | | | (10,694 | ) | | | (47,424 | ) | | | 60,269 | |
| Accrued retirement benefits | | | (18,721 | ) | | | (32,413 | ) | | | (46,067 | ) |
| Other current liabilities | | | (13,544 | ) | | | 38,598 | | | | 11,267 | |
| Risk management assets and liabilities | | | 3,319 | | | | (3,622 | ) | | | 3,673 | |
| Other deferred assets | | | (10,336 | ) | | | (51,172 | ) | | | (2,164 | ) |
| Other regulatory assets | | | (54,061 | ) | | | (50,347 | ) | | | (31,790 | ) |
| Other deferred liabilities | | | (25,611 | ) | | | 24,063 | | | | 18,873 | |
| Net Cash from Operating Activities | | | 485,074 | | | | 320,862 | | | | 564,628 | |
| | | | | | | | | | | | | |
| CASH FLOWS USED BY INVESTING ACTIVITIES: | | | | | | | | | | | | |
| Additions to utility plant (excluding AFUDC-equity) | | | (656,074 | ) | | | (1,314,697 | ) | | | (750,275 | ) |
| Customer advances for construction | | | (5,281 | ) | | | (13,121 | ) | | | (1,150 | ) |
| Contributions in aid of construction | | | 67,514 | | | | 52,261 | | | | 19,576 | |
| Investments and other property - net | | | (21,547 | ) | | | 2,690 | | | | 2,768 | |
| Net Cash used by Investing Activities | | | (615,388 | ) | | | (1,272,867 | ) | | | (729,081 | ) |
| | | | | | | | | | | | | |
| CASH FLOWS FROM FINANCING ACTIVITIES: | | | | | | | | | | | | |
| Proceeds from issuance of long-term debt | | | 1,065,338 | | | | 1,437,412 | | | | 724,391 | |
| Retirement of long-term debt | | | (809,009 | ) | | | (585,507 | ) | | | (596,339 | ) |
| Additional investment by parent company | | | - | | | | 146,600 | | | | 65,000 | |
| Dividends paid | | | (112,000 | ) | | | (54,907 | ) | | | (28,231 | ) |
| Net Cash from Financing Activities | | | 144,329 | | | | 943,598 | | | | 164,821 | |
| | | | | | | | | | | | | |
| Net Increase (Decrease) in Cash and Cash Equivalents | | | 14,015 | | | | (8,407 | ) | | | 368 | |
| Beginning Balance in Cash and Cash Equivalents | | | 28,594 | | | | 37,001 | | | | 36,633 | |
| Ending Balance in Cash and Cash Equivalents | | $ | 42,609 | | | $ | 28,594 | | | $ | 37,001 | |
| | | | | | | | | | | | | |
| Supplemental Disclosures of Cash Flow Information: | | | | | | | | | | | | |
| Cash paid during period for: | | | | | | | | | | | | |
| Interest | | $ | 217,807 | | | $ | 170,281 | | | $ | 164,704 | |
| Income taxes | | $ | 2 | | | $ | 15,535 | | | $ | 6,760 | |
| Significant non-cash transactions: | | | | | | | | | | | | |
| Accrued construction expenses as of December 31, | | $ | 117,226 | | | $ | 119,608 | | | $ | 80,284 | |
| | | | | | | | | | | | | |
| The accompanying notes are an integral part of the financial statements. | | | | | |
| NEVADA POWER COMPANY | |
| |
| (Dollars in Thousands) | |
| | | | |
| | | | |
| | | Year Ended December 31, | |
| | | 2009 | | | 2008 | | | 2007 | |
| | | | | | | | | | |
| NET INCOME | | $ | 134,284 | | | $ | 158,431 | | | $ | 165,694 | |
| | | | | | | | | | | | | |
| OTHER COMPREHENSIVE INCOME (LOSS) | | | | | | | | | | | | |
| | | | | | | | | | | | | |
| Change in compensation retirement benefits liability and amortization (Net of taxes $(96), $207 and $487 in 2009, 2008 and 2007, respectively) | | | | | | | | | | | | |
| | $ | 175 | | | $ | (393 | ) | | $ | (905 | ) |
| | | | | | | | | | | | | |
| OTHER COMPREHENSIVE INCOME (LOSS) | | $ | 175 | | | $ | (393 | ) | | $ | (905 | ) |
| COMPREHENSIVE INCOME | | $ | 134,459 | | | $ | 151,038 | | | $ | 164,789 | |
| | | | | | | | | | | | | |
| The accompanying notes are an integral part of the financial statements. | |
| NEVADA POWER COMPANY | |
| |
| (Dollars in Thousands) | |
| | | | | | | | | | |
| | | December 31, | |
| | | 2009 | | | 2008 | | | 2007 | |
| | | | | | | | | | |
Common Stock: | | | | | | | | | |
| Balance at Beginning of Year and End of Year | | $ | 1 | | | $ | 1 | | | $ | 1 | |
| | | | | | | | | | | | | |
Other Paid-In Capital: | | | | | | | | | | | | |
| | | | | | | | | | | | | |
| Balance at Beginning of Year | | | 2,254,182 | | | | 2,107,582 | | | | 2,042,369 | |
| Capital contribution from parent | | | - | | | | 146,600 | | | | 65,000 | |
| Tax Benefit from stock option exercises | | | 7 | | | | - | | | | 213 | |
| Balance at End of Year | | | 2,254,189 | | | | 2,254,182 | | | | 2,107,582 | |
| | | | | | | | | | | | | |
Retained Earnings: | | | | | | | | | | | | |
| | | | | | | | | | | | | |
| Balance at Beginning of Year | | | 377,055 | | | | 272,435 | | | | 132,201 | |
Adjustments to beginning balances: Compensation retirement benefits in 2008 (net of taxes of ($1,514)) and uncertain tax positions in 2007 | | | 6 | | | | (2,811 | ) | | | 207 | |
| Income for the year | | | 134,284 | | | | 151,431 | | | | 165,694 | |
| Common stock dividends declared | | | (112,000 | ) | | | (44,000 | ) | | | (25,667 | ) |
| Balance at End of Year | | | 399,345 | | | | 377,055 | | | | 272,435 | |
| | | | | | | | | | | | | |
Accumulated Other Comprehensive (Loss): | | | | | | | | | | | | |
| | | | | | | | | | | | | |
| Balance at Beginning of Year | | | (3,671 | ) | | | (3,278 | ) | | | (2,373 | ) |
Change in compensation retirement benefits liability and amortization (net of taxes of ($96), $207 & $487 in 2009, 2008 and 2007 respectively) | | | 175 | | | | (393 | ) | | | (905 | ) |
| Balance at End of Year | | | (3,496 | ) | | | (3,671 | ) | | | (3,278 | ) |
| | | | | | | | | | | | | |
| Total Common Shareholder’s Equity at End of Year | | $ | 2,650,039 | | | $ | 2,627,567 | | | $ | 2,376,740 | |
| | | | | | | | | | | | | |
| The accompanying notes are an integral part of the financial statements. | |
| SIERRA PACIFIC POWER COMPANY | |
| |
| (Dollars in Thousands) | |
| | |
| | |
| | | Year ended December 31, | |
| | | 2009 | | | 2008 | | | 2007 | |
| | | | | | | | | | |
| OPERATING REVENUES: | | | | | | | | | |
| Electric | | $ | 957,130 | | | $ | 1,002,674 | | | $ | 1,038,867 | |
| Gas | | | 205,263 | | | | 209,987 | | | | 205,430 | |
| Total Operating Revenues | | | 1,162,393 | | | | 1,212,661 | | | | 1,244,297 | |
| | | | | | | | | | | | | |
| OPERATING EXPENSES: | | | | | | | | | | | | |
| Fuel for power generation | | | 294,121 | | | | 283,342 | | | | 242,973 | |
| Purchased power | | | 130,977 | | | | 293,527 | | | | 348,299 | |
| Gas purchased for resale | | | 153,607 | | | | 170,468 | | | | 150,879 | |
| Deferred energy - electric - net | | | 73,829 | | | | 1,291 | | | | 78,044 | |
| Deferred energy - gas - net | | | 7,636 | | | | (4,609 | ) | | | 10,763 | |
| Other operating expenses | | | 170,849 | | | | 141,064 | | | | 142,348 | |
| Maintenance | | | 31,290 | | | | 30,787 | | | | 31,553 | |
| Depreciation and amortization | | | 106,048 | | | | 89,528 | | | | 83,393 | |
| Taxes other than income | | | 23,447 | | | | 21,304 | | | | 20,097 | |
| Total Operating Expenses | | | 991,804 | | | | 1,026,702 | | | | 1,108,349 | |
| OPERATING INCOME | | | 170,589 | | | | 185,959 | | | | 135,948 | |
| | | | | | | | | | | | | |
| OTHER INCOME (EXPENSE): | | | | | | | | | | | | |
Interest expense (net of AFUDC-debt: 2009 - $3,044; 2008 - $9,464; 2007 - $12,771) | | | (69,413 | ) | | | (72,712 | ) | | | (60,735 | ) |
| Interest income (expense) on regulatory items | | | (5,743 | ) | | | (2,087 | ) | | | 865 | |
| AFUDC-equity | | | 3,249 | | | | 12,524 | | | | 15,948 | |
| Other income | | | 13,276 | | | | 12,819 | | | | 8,091 | |
| Other expense | | | (7,648 | ) | | | (8,318 | ) | | | (8,441 | ) |
| Total Other Income (Expense) | | | (66,279 | ) | | | (57,774 | ) | | | (44,272 | ) |
| Income Before Income Tax Expense | | | 104,310 | | | | 128,185 | | | | 91,676 | |
| | | | | | | | | | | | | |
| Income tax expense (Note 10) | | | 31,225 | | | | 37,603 | | | | 26,009 | |
| | | | | | | | | | | | | |
| NET INCOME | | | 73,085 | | | | 90,582 | | | | 65,667 | |
| | | | | | | | | | | | | |
| The accompanying notes are an integral part of the financial statements. | |
| SIERRA PACIFIC POWER COMPANY | |
| |
| (Dollars in Thousands) | |
| | |
| | |
| | | | December 31, | |
| | | | 2009 | | | 2008 | |
| ASSETS | | | | | | | |
| | | | | | | | |
| Current Assets: | | | | | | | |
| Cash and cash equivalents | | | $ | 14,359 | | | $ | 21,411 | |
| Accounts receivable less allowance for uncollectible accounts: | | | | | | | | | |
| | 2009 - $2,966; 2008 - $2,262 | | | | 146,883 | | | | 171,729 | |
| Materials, supplies and fuel, at average cost | | | | 54,802 | | | | 50,132 | |
| Risk management assets (Note 9) | | | | 5,656 | | | | 4,394 | |
| Intercompany income taxes receivable | | | | 19,315 | | | | 64,932 | |
| Deferred income taxes (Note 10) | | | | 46,414 | | | | 12,253 | |
| Other current assets | | | | 16,056 | | | | 17,631 | |
| Total Current Assets | | | | 303,485 | | | | 342,482 | |
| | | | | | | | | | | |
| Utility Property: | | | | | | | | | |
| Plant in service | | | | 3,419,190 | | | | 3,291,708 | |
| Construction work-in-progress | | | | 89,102 | | | | 91,067 | |
| Total | | | | 3,508,292 | | | | 3,382,775 | |
| Less accumulated provision for depreciation | | | | 1,156,489 | | | | 1,102,785 | |
| Total Utility Property, Net | | | | 2,351,803 | | | | 2,279,990 | |
| | | | | | | | | | | |
| Investments and other property, net (Note 4) | | | | 5,428 | | | | 403 | |
| | | | | | | | | | | |
| Deferred Charges and Other Assets: | | | | | | | | | |
| Regulatory assets (Note 3) | | | | 362,009 | | | | 443,932 | |
| Regulatory asset for pension plans (Note 3) | | | | 130,283 | | | | 218,550 | |
| Risk management assets (Note 9) | | | | 1,142 | | | | 2,613 | |
| Other deferred charges and assets | | | | 40,837 | | | | 33,959 | |
| Total Deferred Charges and Other Assets | | | | 534,271 | | | | 699,054 | |
| | | | | | | | | | | |
| Assets Held for Sale (Note 16) | | | | 147,158 | | | | 142,506 | |
| | | | | | | | | | | |
| TOTAL ASSETS | | | $ | 3,342,145 | | | $ | 3,464,435 | |
| | | | | | | | | | | |
| (Continued) | |
| SIERRA PACIFIC POWER COMPANY | |
| CONSOLIDATED BALANCE SHEETS | |
| (Dollars in Thousands) | |
| | |
| | | December 31, | |
| | | 2009 | | | 2008 | |
| | | | | | | |
| LIABILITIES AND SHAREHOLDER'S EQUITY | | | | | | |
| | | | | | | |
| Current Liabilities: | | | | | | |
| Current maturities of long-term debt (Note 6) | | $ | 15,000 | | | $ | 600 | |
| Accounts payable | | | 76,867 | | | | 109,410 | |
| Accounts payable, affiliated companies | | | 21,091 | | | | 17,433 | |
| Accrued expenses | | | 34,185 | | | | 37,787 | |
| Dividends declared | | | - | | | | 96,800 | |
| Risk management liabilities (Note 9) | | | 27,749 | | | | 90,990 | |
| Deferred energy (Note 3) | | | 117,276 | | | | 28,546 | |
| Other current liabilities | | | 14,996 | | | | 14,298 | |
| Total Current Liabilities | | | 307,164 | | | | 395,864 | |
| | | | | | | | | |
| Long-term debt (Note 6) | | | 1,282,225 | | | | 1,395,987 | |
| | | | | | | | | |
| Commitments and Contingencies (Note 13) | | | | | | | | |
| | | | | | | | | |
| Deferred Credits and Other Liabilities: | | | | | | | | |
| Deferred income taxes (Note 10) | | | 350,802 | | | | 287,251 | |
| Deferred investment tax credit | | | 13,843 | | | | 15,922 | |
| Accrued retirement benefits | | | 104,854 | | | | 180,209 | |
| Risk management liabilities (Note 9) | | | 1,068 | | | | 18,162 | |
| Regulatory liabilities (Note 3) | | | 175,732 | | | | 161,817 | |
| Other deferred credits and liabilities | | | 71,452 | | | | 107,162 | |
| Total Deferred Credits and Other Liabilities | | | 717,751 | | | | 770,523 | |
| | | | | | | | | |
| Liabilities Held for Sale (Note 16) | | | 25,747 | | | | 24,100 | |
| | | | | | | | | |
| Shareholder's Equity: | | | | | | | | |
| Common stock | | | 4 | | | | 4 | |
| Other paid-in capital | | | 1,111,260 | | | | 1,020,960 | |
| Retained earnings | | | (99,601 | ) | | | (140,685 | ) |
| Accumulated other comprehensive loss | | | (2,405 | ) | | | (2,318 | ) |
| Total Shareholder's Equity | | | 1,009,258 | | | | 877,961 | |
| | | | | | | | | |
| TOTAL LIABILITIES AND SHAREHOLDER'S EQUITY | | $ | 3,342,145 | | | $ | 3,464,435 | |
| | | | | | | | | |
| The accompanying notes are an integral part of the financial statements. | |
| | |
| (Concluded) | |
| SIERRA PACIFIC POWER COMPANY | |
| |
| (Dollars in Thousands) | |
| | |
| | | For the Year Ended December 31, | |
| | | 2009 | | | 2008 | | 2007 | |
| CASH FLOWS FROM OPERATING ACTIVITIES: | | | | | | | | |
| Net Income | | $ | 73,085 | | | $ | 90,582 | | | $ | 65,667 | |
| Adjustments to reconcile net income to net cash from operating activities: | | | | | | | | | | | | |
| Depreciation and amortization | | | 106,048 | | | | 89,528 | | | | 83,393 | |
| Deferred taxes and deferred investment tax credit | | | 32,548 | | | | 24,598 | | | | (36,713 | ) |
| AFUDC-equity | | | (3,249 | ) | | | (12,524 | ) | | | (15,948 | ) |
| Deferred energy | | | 89,777 | | | | (1,494 | ) | | | 90,595 | |
| Other, net | | | 30,368 | | | | 22,872 | | | | 29,451 | |
| Changes in certain assets and liabilities: | | | | | | | | | | | | |
| Accounts receivable | | | 68,435 | | | | (59,701 | ) | | | 10,092 | |
| Materials, supplies and fuel | | | (4,436 | ) | | | (2,453 | ) | | | (5,809 | ) |
| Other current assets | | | 1,575 | | | | (376 | ) | | | 2,839 | |
| Accounts payable | | | (15,071 | ) | | | (574 | ) | | | 15,010 | |
| Accrued retirement benefits | | | (2,227 | ) | | | (47,923 | ) | | | (25,248 | ) |
| Other current liabilities | | | (3,038 | ) | | | 3,673 | | | | 11,196 | |
| Risk management assets and liabilities | | | 1,739 | | | | (1,302 | ) | | | 6,415 | |
| Other deferred assets | | | (3,495 | ) | | | (702 | ) | | | 2,662 | |
| Other regulatory assets | | | (15,876 | ) | | | (17,113 | ) | | | (14,074 | ) |
| Other deferred liabilities | | | (30,388 | ) | | | 31,536 | | | | (5,349 | ) |
| Net Cash from Operating Activities | | | 325,795 | | | | 118,627 | | | | 214,179 | |
| | | | | | | | | | | | | |
| CASH FLOWS USED BY INVESTING ACTIVITIES: | | | | | | | | | | | | |
| Additions to utility plant (excluding AFUDC-equity) | | | (187,058 | ) | | | (220,806 | ) | | | (415,242 | ) |
| Customer advances for construction | | | (3,088 | ) | | | 1,140 | | | | 9,380 | |
| Contributions in aid of construction | | | 9,426 | | | | 10,260 | | | | 12,590 | |
| Investments and other property - net | | | (5,017 | ) | | | 1,611 | | | | 39 | |
| Net Cash used by Investing Activities | | | (185,737 | ) | | | (207,795 | ) | | | (393,233 | ) |
| | | | | | | | | | | | | |
| CASH FLOWS (USED BY) FROM FINANCING ACTIVITIES: | | | | | | | | | | | | |
| Proceeds from issuance of long-term debt | | | 353,534 | | | | 697,739 | | | | 521,992 | |
| Retirement of long-term debt | | | (462,144 | ) | | | (489,434 | ) | | | (423,155 | ) |
| Investment by parent company | | | 90,300 | | | | 20,000 | | | | 65,000 | |
| Dividends paid | | | (128,800 | ) | | | (141,533 | ) | | | (14,236 | ) |
| Net Cash (used by) from Financing Activities | | | (147,110 | ) | | | 86,772 | | | | 149,601 | |
| | | | | | | | | | | | | |
| Net Decrease in Cash and Cash Equivalents | | | (7,052 | ) | | | (2,396 | ) | | | (29,453 | ) |
| Beginning Balance in Cash and Cash Equivalents | | | 21,411 | | | | 23,807 | | | | 53,260 | |
| Ending Balance in Cash and Cash Equivalents | | $ | 14,359 | | | $ | 21,411 | | | $ | 23,807 | |
| | | | | | | | | | | | | |
| Supplemental Disclosures of Cash Flow Information: | | | | | | | | | | | | |
| Cash paid during period for: | | | | | | | | | | | | |
| Interest | | $ | 69,966 | | | $ | 72,443 | | | $ | 59,496 | |
| Income taxes | | $ | 12 | | | $ | 19 | | | $ | 64 | |
| Significant non-cash transactions: | | | | | | | | | | | | |
| Accrued construction expenses as of December 31, | | $ | 10,560 | | | $ | 24,374 | | | $ | 30,879 | |
| | | | | | |
| The accompanying notes are an integral part of the financial statements. | |
| SIERRA PACIFIC POWER COMPANY | |
| |
| (Dollars in Thousands) | |
| | | | |
| | | | |
| | | Year Ended December 31, | |
| | | 2009 | | | 2008 | | | 2007 | |
| | | | | | | | | | |
| NET INCOME | | $ | 73,085 | | | $ | 90,582 | | | $ | 65,667 | |
| | | | | | | | | | | | | |
| OTHER COMPREHENSIVE INCOME (LOSS) | | | | | | | | | | | | |
| | | | | | | | | | | | | |
| Change in compensation retirement benefits liability and amortization (Net of taxes $48, $126 and $620 in 2009, 2008 and 2007, respectively) | | | | | | | | | | | | |
| | $ | (87 | ) | | $ | (234 | ) | | $ | (1,153 | ) |
| | | | | | | | | | | | | |
| OTHER COMPREHENSIVE LOSS | | $ | (87 | ) | | $ | (234 | ) | | $ | (1,153 | ) |
| COMPREHENSIVE INCOME | | $ | 72,998 | | | $ | 90,348 | | | $ | 64,514 | |
| | | | | | | | | | | | | |
| The accompanying notes are an integral part of the financial statements. | |
| SIERRA PACIFIC POWER COMPANY | |
| |
| (Dollars in Thousands) | |
| | | | | | | | | | |
| | | December 31, | |
| | | 2009 | | | 2008 | | | 2007 | |
| | | | | | | | | | |
Common Stock: | | | | | | | | | |
| Balance at Beginning of Year | | | | | | | | | |
| and End of Year | | $ | 4 | | | $ | 4 | | | $ | 4 | |
| | | | | | | | | | | | | |
Other Paid-In Capital: | | | | | | | | | | | | |
| | | | | | | | | | | | | |
| Balance at Beginning of Year | | | 1,020,960 | | | | 1,000,595 | | | | 935,453 | |
| Capital contribution from parent | | | 90,300 | | | | 20,000 | | | | 65,000 | |
| Tax Benefit from stock option exercises | | | - | | | | 365 | | | | 142 | |
| Balance at End of Year | | | 1,111,260 | | | | 1,020,960 | | | | 1,000,595 | |
| | | | | | | | | | | | | |
Retained Earnings (Deficit): | | | | | | | | | | | | |
| | | | | | | | | | | | | |
| Balance at Beginning of Year | | | (140,685 | ) | | | 3,325 | | | | (49,789 | ) |
| | | | | | | | | | | | | |
Adjustments to beginning balances: Compensation retirement benefits in 2008 (net of taxes of ($857)), and uncertain tax positions in 2007 | | | (1 | ) | | | (1,592 | ) | | | 280 | |
| Income for the year | | | 73,085 | | | | 90,582 | | | | 65,667 | |
| Common stock dividends declared | | | (32,000 | ) | | | (233,000 | ) | | | (12,833 | ) |
| Balance at End of Year | | | (99,601 | ) | | | (140,685 | ) | | | 3,325 | |
| | | | | | | | | | | | | |
Accumulated Other Comprehensive Loss: | | | | | | | | | | | | |
| | | | | | | | | | | | | |
| Balance at Beginning of Year | | | (2,318 | ) | | | (2,084 | ) | | | (931 | ) |
| | | | | | | | | | | | | |
Change in compensation retirement benefits liability and amortization (net of taxes of ($19), $126 & $620 in 2009, 2008 and 2007 respectively) | | | (87 | ) | | | (234 | ) | | | (1,153 | ) |
| Balance at End of Year | | | (2,405 | ) | | | (2,318 | ) | | | (2,084 | ) |
| | | | | | | | | | | | | |
| Total Common Shareholder’s Equity at End of Year | | $ | 1,009,258 | | | $ | 877,961 | | | $ | 1,001,840 | |
| | | | | | | | | | | | | |
| The accompanying notes are an integral part of the financial statements. | |
NOTES TO FINANCIAL STATEMENTS
The significant accounting policies for both utility and non-utility operations are as follows:
Basis of Presentation
The consolidated financial statements include the accounts of NV Energy, Inc. and its wholly-owned subsidiaries, Nevada Power Company, Sierra Pacific Power Company, Sierra Pacific Communications, Lands of Sierra, Inc., Sierra Energy Company dba e·three, Sierra Pacific Energy Company, Sierra Water Development Company, NVE Insurance and Sierra Gas Holding Company. All significant intercompany balances and intercompany transactions have been eliminated in consolidation.
The preparation of consolidated financial statements in conformity with GAAP requires management to make estimates and assumptions that affect the reported amounts of certain assets and liabilities. These estimates and assumptions also affect the disclosure of contingent assets and liabilities at the date of the financial statements and the reported amounts of certain revenues and expenses during the reporting period. Actual results could differ from these estimates.
In the past, the financial statements for NVE and the Utilities were presented in a traditional utility format; however, many utilities have partially or completely departed from the traditional utility format. As a result, NVE and the Utilities elected to present current and prior period financial statements and related financial data in a similar commercial format and have reclassified prior year information to conform with the current period presentation. The change in format did not have an effect on net income.
NPC is an operating public utility that provides electric service in Clark County in southern Nevada. The assets of NPC represent approximately 71% of the consolidated assets of NVE at December 31, 2009. NPC provides electricity to approximately 827,000 customers in the communities of Las Vegas, North Las Vegas, Henderson, Searchlight, Laughlin and adjoining areas, including Nellis Air Force Base. Service is also provided to the Department of Energy’s Nevada Test Site in Nye County. The consolidated financial statements of NVE include NPC’s wholly-owned subsidiary, NEICO.
SPPC is an operating public utility that provides electric service in northern Nevada and northeastern California. SPPC also provides natural gas service in the Reno/Sparks area of Nevada. The assets of SPPC represent approximately 29% of the consolidated assets of NVE at December 31, 2009. SPPC provides electricity to approximately 367,000 customers in a 50,000 square mile service area including western, central and northeastern Nevada, including the cities of Reno, Sparks, Carson City and Elko, and a portion of eastern California, including the Lake Tahoe area. SPPC also provides natural gas service in Nevada to approximately 151,000 customers in an area of about 800 square miles in the Reno and Sparks areas. The consolidated financial statements of SPPC include the accounts of SPPC’s wholly-owned subsidiaries, PPC, PPIC, GPSF-B, SPPC Funding LLC, and Sierra Pacific Power Capital I.
The Utilities’ accounts for electric operations and SPPC’s accounts for gas operations are maintained in accordance with the Uniform System of Accounts prescribed by the FERC.
Regulatory Accounting and Other Regulatory Assets
The Utilities’ rates are currently subject to the approval of the PUCN and, in the case of SPPC, rates are also subject to the approval of the CPUC and are designed to recover the cost of providing generation, transmission and distribution services. As a result, the Utilities qualify for the application of regulatory accounting treatment as allowed by the Regulated Operations Topic of the FASC. This statement recognizes that the rate actions of a regulator can provide reasonable assurance of the existence of an asset and requires the deferral of incurred costs that would otherwise be charged to expense where it is probable that future revenue will be provided to recover these costs. The accounting guidance prescribes the method to be used to record the financial transactions of a regulated entity. The criteria for applying the accounting for regulated operations include the following: (i) rates are set by an independent third party regulator; (ii) regulated rates are designed to recover the specific costs of the regulated products or services; and (iii) it is reasonable to assume that rates are set at levels that recovered costs can be charged to and collected from customers. Management periodically assesses whether the requirements for application of regulatory accounting treatment as allowed by the Regulated Operations Topic of the FASC are satisfied.
Regulatory assets represent incurred costs that have been deferred because it is probable they will be recovered through future rates collected from customers. If at any time the incurred costs no longer meet these criteria, these costs are charged to earnings. Regulatory liabilities generally represent obligations to make refunds to customers for previous collections, except for cost of removal which represents the cost of removing future electric and gas assets. Management believes the existing regulatory assets are probable of recovery either because the Utilities received prior PUCN approval or due to regulatory precedent set for similar circumstances. Included in Note 3, Regulatory Actions, are details of other regulatory assets and liabilities, and their current regulatory treatment.
Equity Carrying Charges
In accordance with various regulatory orders, the Utilities’ record carrying charges as allowed by the Regulated Operations Topic of the FASC. However, for financial reporting purposes the amounts representing equity carrying charges are not recognized until collected through regulated rates. As of December 31, 2009, NPC and SPPC have accumulated approximately $2.5 million and $0.5 million, respectively (excluding the carrying charge on the Lenzie Generating Station as discussed below), of equity related carrying charges that will be recognized into income when the corresponding regulatory assets are collected through rates. For further information, see Note 3, Regulatory Actions, of the Notes to Financial Statements, Other Regulatory Assets table.
Carrying Charge on the Lenzie Generating Station
In 2004, the PUCN granted NPC’s request to designate the Lenzie Generating Station as a critical facility and allowed a 2% enhanced ROE to be applied to the Lenzie Generating Station construction costs expended after acquisition. The order allowed for an additional 1% enhanced ROE if the two Lenzie Generating Station units were brought on line early. In addition, the PUCN granted NPC’s request to begin accumulating a carrying charge as a regulatory asset including the 3% enhanced ROE (collectively referred to as “carrying charges”), until the plant is included in rates. Units 1 and 2 were declared commercially operable in January 2006 and April 2006, respectively, qualifying for the incentive ROE treatment.
Through June 30, 2007, NPC had accumulated approximately $57.6 million in carrying charges; however, as of December 31, 2009 $7.7 million of this amount was not recorded for financial reporting purposes as it represents equity carrying costs that are not recognized until collected through rates. NPC did not record a separate carrying charge component related to the Lenzie Generating Station during 2009 as the plant is in rate base effective June 1, 2007, as discussed below.
In May 2007, the PUCN issued its order on NPC’s 2006 GRC authorizing recovery of the carrying charges, effective as of June 1, 2007. NPC was authorized to recover over a 35 year period $30.3 million of the carrying charges calculated through the certification period ending October 31, 2006. Beginning June 1, 2007, NPC began recognizing its full return on the Lenzie Generating Station through rates rather than as a separate carrying charge component. In June 2009, as a result of its 2008 GRC, the PUCN authorized recovery of the remaining $27.3 million in carrying charges over the life of the asset.
Deferred Energy Accounting
Nevada and California statutes permit regulated utilities to adopt deferred energy accounting procedures. The intent of these procedures is to ease the effect on customers of fluctuations in the cost of purchased gas, fuel and purchased power.
Under deferred energy accounting, to the extent actual fuel and purchased power costs exceed fuel and purchased power costs recoverable through current rates that excess is not recorded as a current expense on the statement of operations but rather is deferred and recorded as an asset on the balance sheet in accordance with the provisions of the Regulated Operations Topic of the FASC. Conversely, a liability is recorded to the extent fuel and purchased power costs recoverable through current rates exceed actual fuel and purchased power costs. These excess amounts are reflected in adjustments to rates and recorded as revenue or expense in future time periods, subject to PUCN review.
Nevada law requires the Utilities file annual DEAA applications and provides that the PUCN may not allow the recovery of any costs for purchased fuel or purchased power “that were the result of any practice or transaction that was undertaken, managed or performed imprudently by the electric utility.” Nevada law also specifies that fuel and purchased power costs include all costs incurred to purchase fuel, to purchase capacity and to purchase energy. The Utilities also record and are eligible under the statute to recover a carrying charge on such deferred balances. See Note 3, Regulatory Actions for details regarding deferred energy balances.
Utility Plant
The cost of additions, including betterments and replacements of units of property, are charged to utility plant. When units of property are replaced, renewed or retired, their cost plus removal or disposal costs, less salvage proceeds, are charged to accumulated depreciation. The cost of current repairs and minor replacements are charged to maintenance expense when incurred, with the exception of long term service agreements. These agreements may have annual payment amounts for repairs which could vary over the life of the agreement between maintenance expense and amounts to be capitalized. To ensure consistency in annual expense for rate making purposes, the amounts to be charged to maintenance expense are smoothed over the life of the contract, with an offset to a regulatory asset or liability account. Amounts prepaid for capital expenditure are recorded in a prepaid asset account.
In addition to direct labor and material costs, certain other direct and indirect costs are capitalized. The indirect construction overhead costs capitalized are based upon the following cost components: the cost of time spent by administrative and supervision employees in planning and directing construction; property taxes; employee benefits including such costs as pensions, post retirement and post employment benefits, vacations and payroll taxes; and an AFUDC which includes the cost of debt and equity capital associated with construction activity.
AFUDC
As part of the cost of constructing utility plant, the Utilities capitalize AFUDC. AFUDC represents the cost of borrowed funds and, where appropriate, the cost of equity funds used for construction purposes in accordance with rules prescribed by the FERC and the PUCN. AFUDC is capitalized in the same manner as construction labor and material costs, however, with an offsetting credit to “other income” for the portion representing the cost of equity funds; and as a reduction of interest charges for the portion representing borrowed funds. Recognition of this item as a cost of utility plant is in accordance with established regulatory ratemaking practices. Such practices are intended to permit the Utility to earn a fair return on, and recover in rates charged for utility services, all capital costs. This is accomplished by including such costs in the rate base and in the provision for depreciation. NPC’s AFUDC rate used during 2009 was 8.57% and 2008 and 2007 was 9.06%. SPPC’s AFUDC rates used during 2009, 2008 and 2007 were 7.96%, 8.54% and 8.60%, respectively. As specified by the PUCN, certain projects may be assigned a lower or higher AFUDC rate due to specific interest-rate financings directly associated with those projects.
Depreciation
Substantially all of the Utilities’ plant is subject to the ratemaking jurisdiction of the PUCN or the FERC, and, in the case of SPPC, the CPUC. Depreciation expense is calculated using the straight-line composite method over the estimated remaining service lives of the related properties, which approximates the anticipated physical lives of these assets in most cases. NPC’s depreciation provision, as authorized by the PUCN and stated as a percentage of the average depreciable property balances for those years, was approximately 2.74%, 2.56%, and 2.66% during 2009, 2008 and 2007, respectively. SPPC’s depreciation provision for 2009, 2008 and 2007, as authorized by the PUCN and stated as a percentage of the average cost of depreciable property, was approximately 3.07%, 2.77% and 3.01%, respectively.
The average estimated useful life for each major class of utility property, plant and equipment are as follows:
| | Estimated Useful Lives |
| | NPC | | SPPC |
| Electric Generation | 30 to 125 years | | 30 to 125 years |
| Electric Transmission | 35 to 60 years | | 50 to 70 years |
| Electric Distribution | 25 to 65 years | | 33 to 65 years |
| Gas Distribution | N/A | | 28 to 65 years |
| General Plant | 5 to 50 years | | 5 to 45 years |
Impairment of Long-Lived Assets
NVE, NPC and SPPC evaluate on an ongoing basis the recoverability of its assets for impairments whenever events or changes in circumstance indicate that the carrying amount may not be recoverable as described in the Property, Plant and Equipment Topic of the FASC.
Cash and Cash Equivalents
Cash is comprised of cash on hand and working funds. Cash equivalents consist of high quality investments in money market funds and do not have any withdrawal restrictions.
Federal Income Taxes
NVE and the Utilities file a consolidated federal income tax return. Current income taxes are allocated based on NVE’s and each Utilitiy’s respective taxable income or loss and tax credits as if each Utility filed a separate return.
NVE and the Utilities recognize deferred tax liabilities and assets for the future tax consequences of events that have been included in the financial statements or tax returns. Deferred tax liabilities and assets are determined based on the difference between the financial statement and tax basis of assets and liabilities using enacted tax rates in effect for the year in which the differences are expected to reverse. Deferred tax assets are also recorded for deductions incurred and credits earned that have not been utilized in tax returns filed or to be filed for tax years through the date of the financial statements. Management considers estimates of the amount and character of future taxable income by tax jurisdiction in assessing the likelihood of realization of deferred tax assets. If it is not more likely than not that a deferred tax asset will be realized in its entirety, a valuation allowance is recorded with respect to the portion estimated not likely to be realized.
Tax benefits associated with income tax positions taken, or expected to be taken, in a tax return are recorded only when the more-likely-than-not recognition threshold is satisfied and measured at the largest amount of benefit that is greater than 50 percent likely of being realized upon settlement. NVE and the Utilities classify interest and penalties associated with unrecognized tax
benefits as interest and other expense, respectively, within the income statement. No interest expense or penalties associated with unrecognized tax benefits have been recorded.
The Utilities reduce rates to reflect the current tax benefits associated with recognizing certain tax deductions sooner than when the expenses are recognized for financial reporting purposes. A regulatory asset is recorded for these amounts to reflect the future increases in income taxes payable that will be recovered from customers when these temporary differences reverse. The Utilities have been fully normalized since 1987. AFUDC-equity is recorded on an after-tax basis. Accordingly, a regulatory asset is recorded when AFUDC-equity is recognized. This regulatory asset reverses as the related plant is depreciated, resulting in an increase to the tax provision.
The Utilities also record regulatory liabilities for obligations to reduce rates charged customers for deferred taxes recovered from customers in prior years at corporate tax rates higher than the current tax rates. The reduction in rates charged customers will occur as the temporary differences resulting in the excess deferred tax liabilities reverse.
Investment tax credits are deferred and amortized over the estimated service lives of the related properties.
Revenues
Operating revenues include billed and unbilled utility revenues. The accrual for unbilled revenues represents amounts owed to the Utilities for service provided to customers for which the customers have not yet been billed. These unbilled amounts are also included in accounts receivable. Reference NPC’s 2008 GRC for further discussion of the deferred rate increase in Note 3, Regulatory Actions, of the Notes to Financial Statements.
Revenues related to the sale of energy are recorded based on meter reads, which occur on a systematic basis throughout a month, rather than when the service is rendered or energy is delivered. At the end of each month, the energy delivered to the customers from the date of their last meter read to the end of the month is estimated and the corresponding unbilled revenues are calculated. These estimates of unbilled sales and revenues are based on the ratio of billable days versus unbilled days, amount of energy procured and generated during that month, historical customer class usage patterns, line loss and the Utilities’ current tariffs. Accounts receivable as of December 31, 2009, include unbilled receivables of $103 million and $78 million for NPC and SPPC, respectively. Accounts receivable as of December 31, 2008, include unbilled receivables of $103 million and $76 million for NPC and SPPC, respectively.
Asset Retirement Obligations
The Asset Retirement and Environmental Liabilities Topic of the FASC provides accounting requirements for the recognition and measurement of liabilities associated with the retirement of tangible long-lived assets. Under the accounting guidance, these liabilities are recognized at fair value as incurred and capitalized as part of the cost of the related tangible long-lived assets. Accretion of the liabilities due to the passage of time is classified as an operating expense. Retirement obligations associated with long-lived assets included within the scope of the accounting guidance are those for which a legal obligation exists under enacted laws, statutes written or oral contracts, including obligations arising under the doctrine of promissory estoppel. NVE, NPC and SPPC adopted the provisions of this accounting guidance on January 1, 2003.
Management’s methodology to assess its legal obligation included an inventory of assets by company, system and components and a review of rights of way and easements, regulatory orders, leases and federal, state, and local environmental laws. Management identified a legal obligation to retire generation plant assets specified in land leases for NPC’s jointly-owned Navajo Generating Station and the newly acquired Higgins Generating Station. Provisions of the lease require the lessees to remove the facilities upon request of the lessors at the expiration of the leases.
In March, 2005, the FASB issued additional guidance related to the Asset Retirement and Environmental Liabilities Topic of the FASC. The updated guidance was effective no later than the end of fiscal years ending after December 15, 2005 (December 31, 2005, for calendar-year enterprises). The updated accounting guidance clarified the term conditional retirement obligation as well as when an entity would have sufficient information to reasonably estimate the fair value of an asset retirement obligation.
Similar to the methodology used to assess legal obligations, management reviewed the inventory of assets by system and components, as well as rights of way and easements, regulatory orders, leases and federal, state, and local environmental laws. Management has determined evaporative ponds, dry ash landfills, fuel storage tanks, asbestos and oils treated with Poly Chlorinated Biphenyl to have met the conditional asset retirement obligations as defined in the Asset Retirement and Environmental Liabilities Topic of the FASC.
The following table presents a reconciliation of the beginning and ending aggregate carrying amounts of asset retirement obligation for the years presented below (dollars in thousands):
| | | | NVE | | | | NPC | | | | SPPC | |
| | | | 2009 | | | | 2008 | | | | 2009 | | | | 2008 | | | | 2009 | | | | 2008 | |
| Balance at January 1 | | $ | 57,627 | | | $ | 53,462 | | | $ | 50,216 | | | $ | 46,270 | | | $ | 7,411 | | | $ | 7,192 | |
| Liabilities incurred in current period | | | 7,888 | | | | 3,424 | | | | 7,888 | | | | 3,162 | | | | - | | | | 262 | |
| Liabilities settled in current period | | | - | | | | (4,160 | ) | | | - | | | | (4,160 | ) | | | - | | | | - | | |
| Accretion expense | | | 4,258 | | | | 2,904 | | | | 3,776 | | | | 2,503 | | | | 482 | | | | 401 | |
| Revision in estimated cash flows | | | (13,805 | ) | | | 1,997 | | | | (13,560 | ) | | | 2,441 | | | | (245 | ) | | | (444 | ) |
| Balance at December 31 | | $ | 55,968 | | | $ | 57,627 | | | $ | 48,320 | | | $ | 50,216 | | | $ | 7,648 | | | $ | 7,411 | |
Cost of Removal
In addition to the legal asset retirement obligations booked under the accounting guidance for asset retirement obligations, the Utilities have accrued for the cost of removing non-legal retirement obligations of other electric and gas assets. The amounts of such accruals included in regulatory liabilities in 2009 are approximately $192.9 million and $166.7 million for NPC and SPPC, respectively. In 2008, the amounts were approximately $174.3 million and $150.5 million.
Variable Interest Entities
The FASC Consolidation guidance provides that a variable interest entity be consolidated by the enterprise that is the primary beneficiary of the variable interest entity. To identify potential variable interests, management reviewed long term purchase power contracts, including contracts with QFs, jointly owned facilities and partnerships that are not consolidated. The Utilities identified seven QFs with long-term purchase power contracts that are variable interests. However, the Utilities are not required at this time to consolidate these QFs under the scope exception provided for in FASC Consolidation guidance due to the inability to obtain information necessary to (1) determine whether the entity is a variable interest entity, (2) determine whether the enterprise is the variable interest entity’s primary beneficiary, or (3) perform the accounting required to consolidate the variable interest entity for which it is determined to be the primary beneficiary. The Utilities have requested financial information from these QFs but have not been successful in obtaining the information. The Utilities' maximum exposure to loss is limited to the cost of replacing these purchase power contracts if the QFs are unable to deliver power. However, the Utilities believe their exposure is mitigated as they would likely recover these costs through their deferred energy accounting mechanism. The Utilities have not identified any other significant variable interests that require consolidation as of December 31, 2009. Furthermore, as discussed under Recent Pronouncements, NVE and the Utilities will adopt the FASC Consolidation accounting guidance for variable interest entities effective January 1, 2010, but do not expect the adoption to have a material impact on the consolidated financial statements.
Franchise Fees and Universal Energy Charges
NPC and SPPC, as agents for some state and local governments collect from customers franchise fees and universal energy charges (UEC) levied by the state or local governments on our customers. NPC and SPPC do not record these fees or charges as revenue or expense.
Recent Accounting Standards Updates
FASC and the Hierarchy of Generally Accepted Accounting Principles
In June 2009, the FASB issued guidance related to the FASC, which became the single source of authoritative GAAP, other than guidance put forth by the SEC. All other accounting literature not included in the codification will be considered non-authoritative. The guidance is effective for NVE and the Utilities for the quarterly period ending September 30, 2009 and will impact the current disclosure of the financial statements since all references to authoritative accounting literature will be topic references in accordance with the FASC.
Fair Value Measurements and Disclosures
In February 2008, the FASB issued transition guidance which deferred the effective date of applying fair value measurements to nonfinancial assets and nonfinancial liabilities which are nonrecurring. The transition guidance was effective for NVE and the Utilities beginning January 1, 2009. The adoption of this guidance did not have a material impact on the consolidated financial statements of NVE and the Utilities.
In April 2009, the FASB issued additional guidance on measuring the fair value of financial instruments when markets become inactive and quoted prices may reflect distressed transactions. The provisions of this guidance are effective for NVE and the Utilities as of June 30, 2009. The adoption did not have an effect on the consolidated financial statements of NVE and the Utilities.
In August 2009, the FASB issued an update on the Fair Value Measurements and Disclosures Topic as reflected in the FASB Accounting Standards Codification for the fair value of liabilities. This update provides clarification on measuring liabilities at fair
value when a quoted price in an active market is not available. The provisions of this guidance were effective for NVE and the Utilities beginning October 1, 2009. The adoption of this guidance did not have a significant impact on the consolidated financial statements.
In September 2009, the FASB issued an update on the Fair Value Measurements and Disclosures Topic as reflected in the FASB Accounting Standards Codification for the fair value measurement of investments in certain entities that calculate net asset value per share (or its equivalent). The guidance permits a reporting entity to measure the fair value of an investment within its scope on the basis of net asset value per share of the investment (or its equivalent). NVE and the Utilities adopted the accounting update as of December 31, 2009. See Note 11, Retirement Plan and Post-Retirement Benefits.
In January 2010, the FASB issued an update on the Fair Value Measurements and Disclosure Topic as reflected in the FASB Accounting Standards Codification for recurring and nonrecurring fair value measurements. The new accounting guidance adds requirements for disclosures about transfers into and out of Levels 1 and 2 and separate disclosures about purchases, sales, issuances, and settlements relating to Level 3 measurements. It also clarifies existing fair value disclosures about the level of disaggregation and about inputs and valuation techniques used to measure fair value. In addition, the accounting update amends guidance on employers’ disclosures about postretirement benefit plan assets to require disclosures by classes of assets instead of by major categories of assets. The guidance is effective for NVE and the Utilities as of January 1, 2010, except for the disclosures about purchases, sales, issuances, and settlements in the roll forward activity in Level 3 fair value measurements. Those disclosures are effective for NVE and the Utilities as of January 1, 2011. NVE and the Utilities do not expect the adoption to have a significant impact on their disclosure requirements.
Derivatives and Hedging
In March 2008, the FASB issued an amendment of its existing guidance effective for financial statements issued for fiscal years and interim periods beginning after November 15, 2008. The purpose of the amendment is to provide more adequate disclosure about how derivative and hedging activities affect an entity’s financial position, financial performance and cash flows. NVE and the Utilities adopted the amendment beginning January 1, 2009. See Note 9, Derivatives and Hedging Activities.
Subsequent Events
In May 2009, the FASB issued guidance which establishes the accounting principles and disclosure requirements for subsequent events. The guidance requires an entity to disclose the date through which subsequent events have been evaluated, as well as whether that date is the date the financial statements were issued or the date the financial statements were available to be issued. NVE and the Utilities evaluated subsequent events at the time the financial statements were issued, which was February 22, 2010. The guidance was effective for NVE and the Utilities as of June 30, 2009.
Consolidations of Variable Interest Entities
In June 2009, the FASB amended existing guidance related to the Consolidation of Variable Interest Entities. The amendment requires an enterprise to perform an analysis to determine whether the enterprise’s variable interest or interests give it a controlling financial interest in a variable interest entity. This analysis identifies the primary beneficiary of a variable interest entity as the enterprise that has both of the following characteristics: a) the power to direct the activities of a variable interest entity that most significantly impact the entity’s economic performance, and b) the obligation to absorb losses of the entity that could potentially be significant to the variable interest entity or the right to receive benefits from the entity that could potentially be significant to the variable interest entity. The amendment will be effective for NVE and the Utilities beginning January 1, 2010. Although NVE and the Utilities have substantially completed their evaluation of the impacts of this statement, at this time, NVE and the Utilities do not believe the adoption will have a material impact on the consolidated financial statements.
Compensation-Retirement Benefits
In December 2008, the FASB amended existing guidance related to the Compensation-Retirement Benefits Topic of the FASC. The amended guidance requires enhanced disclosures about plan assets of a defined benefit pension or other postretirement plan. The provisions of the accounting guidance are effective for NVE and the Utilities as of December 31, 2009. See Note 11, Retirement Plan and Post-Retirement Benefits.
The Utilities operate three regulated business segments as required by the Segment Reporting Topic of the FASC: NPC electric, SPPC electric and SPPC natural gas service. Electric service is provided to Las Vegas and surrounding Clark County by NPC, and northern Nevada and the Lake Tahoe area of California by SPPC. Natural gas services are provided by SPPC in the Reno-Sparks area of Nevada. Other information includes amounts below the quantitative thresholds for separate disclosure.
In the past, the financial statements for NVE and the Utilities were presented in a traditional utility format; however, many utilities have partially or completely departed from the traditional utility format. As a result, NVE and the Utilities elected to present current and prior period financial statements and related financial data in a similar commercial format and have reclassified prior year information to conform with the current period presentation. The change in format did not have an effect on net income.
Operational information of the different business segments is set forth below based on the nature of products and services offered. NVE evaluates performance based on several factors, of which, the primary financial measure is business segment gross margin. Gross margin, which the Utilities calculate as operating revenues less fuel, purchased power, and deferred energy costs, provides a measure of income available to support the other operating expenses of the Utilities. Operating expenses are provided by segment in order to reconcile to operating income as reported in the consolidated financial statements. SPPC's deferred energy costs-net for the year ended December 31, 2007 include $14.2 million of disallowed energy costs (dollars in thousands):
| | | | | | | | | | | SPPC | | | | | | | | | |
| | | NPC | | | SPPC | | | SPPC | | Reconciling | | SPPC | | | NVE | | | NVE | |
| December 31, 2009 | | Electric | | | Electric | | | Gas | | Eliminations(1) | | Total | | | Other | | | Consolidated | |
| Operating Revenues | | $ | 2,423,377 | | | $ | 957,130 | | | $ | 205,263 | | | | $ | 1,162,393 | | | $ | 28 | | | $ | 3,585,798 | |
| | | | | | | | | | | | | | | | | | | | | | | | | | |
| Energy Costs: | | | | | | | | | | | | | | | | | | | | | | | | | |
| Fuel for power generation | | | 587,647 | | | | 294,121 | | | | - | | | | | 294,121 | | | | - | | | | 881,768 | |
| Purchased Power | | | 627,759 | | | | 130,977 | | | | - | | | | | 130,977 | | | | - | | | | 758,736 | |
| Gas purchased for resale | | | - | | | | - | | | | 153,607 | | | | | 153,607 | | | | - | | | | 153,607 | |
| Deferred energy - net | | | 207,611 | | | | 73,829 | | | | 7,636 | | | | | 81,465 | | | | - | | | | 289,076 | |
| | | | 1,423,017 | | | | 498,927 | | | | 161,243 | | | | | 660,170 | | | | - | | | | 2,083,187 | |
| | | | | | | | | | | | | | | | | | | | | | | | | | |
| Gross Margin | | $ | 1,000,360 | | | $ | 458,203 | | | $ | 44,020 | | | | $ | 502,223 | | | $ | 28 | | | $ | 1,502,611 | |
| | | | | | | | | | | | | | | | | | | | | | | | | | |
| | | | | | | | | | | | | | | | | | | | | | | | | | |
| Other operating expense | | | 279,865 | | | | | | | | | | | | | 170,849 | | | | 2,699 | | | | 453,413 | |
| Maintenance | | | 71,019 | | | | | | | | | | | | | 31,290 | | | | - | | | | 102,309 | |
| Depreciation and amortization | | | 215,873 | | | | | | | | | | | | | 106,048 | | | | - | | | | 321,921 | |
| Taxes other than income | | | 37,241 | | | | | | | | | | | | | 23,447 | | | | 197 | | | | 60,885 | |
| | | | | | | | | | | | | | | | | | | | | | | | | | |
| Operating Income | | $ | 396,362 | | | | | | | | | | | | $ | 170,589 | | | $ | (2,868 | ) | | $ | 564,083 | |
| | | | | | | | | | | | | | | | | | | | | | | | | | |
| Assets | | $ | 8,096,371 | | | $ | 2,997,116 | | | $ | 305,434 | $ | 39,595 | | $ | 3,342,145 | | | $ | (25,053 | ) | | $ | 11,413,463 | |
| | | | | | | | | | | | | | | | | | | | | | | | | | |
| Capital expenditures | | $ | 656,074 | | | $ | 171,036 | | | $ | 16,022 | | | | $ | 187,058 | | | | | | | $ | 843,132 | |
| | | | | | | | | | | SPPC | | | | | | | | | |
| | | NPC | | | SPPC | | | SPPC | | Reconciling | | SPPC | | | NVE | | | NVE | |
| December 31, 2008 | | Electric | | | Electric | | | Gas | | Eliminations(1) | | Total | | | Other | | | Consolidated | |
| Operating Revenues | | $ | 2,315,427 | | | $ | 1,002,674 | | | $ | 209,987 | | | | $ | 1,212,661 | | | $ | 25 | | | $ | 3,528,113 | |
| | | | | | | | | | | | | | | | | | | | | | | | | | |
| Energy Costs: | | | | | | | | | | | | | | | | | | | | | | | | | |
| Fuel for power generation | | | 755,925 | | | | 283,342 | | | | - | | | | | 283,342 | | | | | | | | 1,039,267 | |
| Purchased Power | | | 680,816 | | | | 293,527 | | | | - | | | | | 293,527 | | | | | | | | 974,343 | |
| Gas purchased for resale | | | - | | | | - | | | | 170,468 | | | | | 170,468 | | | | | | | | 170,468 | |
| Deferred energy - net | | | (6,947 | ) | | | 1,291 | | | | (4,609 | ) | | | | (3,318 | ) | | | | | | | (10,265 | ) |
| | | | 1,429,794 | | | | 578,160 | | | | 165,859 | | | | | 744,019 | | | | | | | | 2,173,813 | |
| | | | | | | | | | | | | | | | | | | | | | | | | | |
| Gross Margin | | $ | 885,633 | | | $ | 424,514 | | | $ | 44,128 | | | | $ | 468,642 | | | $ | 25 | | | $ | 1,354,300 | |
| | | | | | | | | | | | | | | | | | | | | | | | | | |
| | | | | | | | | | | | | | | | | | | | | | | | | | |
| Other operating expense | | | 249,236 | | | | | | | | | | | | | 141,064 | | | | 3,719 | | | | 394,019 | |
| Maintenance | | | 63,282 | | | | | | | | | | | | | 30,787 | | | | | | | | 94,069 | |
| Depreciation and amortization | | | 171,080 | | | | | | | | | | | | | 89,528 | | | | | | | | 260,608 | |
| Taxes other than income | | | 32,069 | | | | | | | | | | | | | 21,304 | | | | 152 | | | | 53,525 | |
| | | | | | | | | | | | | | | | | | | | | | | | | | |
| Operating Income | | $ | 369,966 | | | | | | | | | | | | $ | 185,959 | | | $ | (3,846 | ) | | $ | 552,079 | |
| | | | | | | | | | | | | | | | | | | | | | | | | | |
| Assets | | $ | 7,904,147 | | | $ | 3,113,539 | | | $ | 315,095 | $ | 35,801 | | $ | 3,464,435 | | | $ | (20,712 | ) | | $ | 11,347,870 | |
| | | | | | | | | | | | | | | | | | | | | | | | | | |
| Capital expenditures | | $ | 1,314,697 | | | $ | 202,011 | | | $ | 18,795 | | | | $ | 220,806 | | | | | | | $ | 1,535,503 | |
| | | | | | | | | | | SPPC | | | | | | | | | |
| | | NPC | | | SPPC | | | SPPC | | Reconciling | | SPPC | | | NVE | | | NVE | |
| December 31, 2007 | | Electric | | | Electric | | | Gas | | Eliminations(1) | | Total | | | Other | | | Consolidated | |
| Operating Revenues | | $ | 2,356,620 | | | $ | 1,038,867 | | | $ | 205,430 | | | | $ | 1,244,297 | | | $ | 43 | | | $ | 3,600,960 | |
| | | | | | | | | | | | | | | | | | | | | | | | | | |
| Energy Costs: | | | | | | | | | | | | | | | | | | | | | | | | | |
| Fuel for power generation | | | 594,382 | | | | 242,973 | | | | - | | | | | 242,973 | | | | | | | | 837,355 | |
| Purchased Power | | | 688,606 | | | | 348,299 | | | | - | | | | | 348,299 | | | | | | | | 1,036,905 | |
| Gas purchased for resale | | | - | | | | - | | | | 150,879 | | | | | 150,879 | | | | | | | | 150,879 | |
| Deferred energy - net | | | 233,166 | | | | 78,044 | | | | 10,763 | | | | | 88,807 | | | | | | | | 321,973 | |
| | | | 1,516,154 | | | | 669,316 | | | | 161,642 | | | | | 830,958 | | | | - | | | | 2,347,112 | |
| | | | | | | | | | | | | | | | | | | | | | | | | | |
| Gross Margin | | $ | 840,466 | | | $ | 369,551 | | | $ | 43,788 | | | | $ | 413,339 | | | $ | 43 | | | $ | 1,253,848 | |
| | | | | | | | | | | | | | | | | | | | | | | | | | |
| Other operating expense | | | 232,610 | | | | | | | | | | | | | 142,348 | | | | 4,488 | | | | 379,446 | |
| Maintenance | | | 67,482 | | | | | | | | | | | | | 31,553 | | | | - | | | | 99,035 | |
| Depreciation and amortization | | | 152,139 | | | | | | | | | | | | | 83,393 | | | | - | | | | 235,532 | |
| Taxes other than income | | | 29,823 | | | | | | | | | | | | | 20,097 | | | | 193 | | | | 50,113 | |
| | | | | | | | | | | | | | | | | | | | | | | | | | |
| Operating Income | | $ | 358,412 | | | | | | | | | | | | $ | 135,948 | | | $ | (4,638 | ) | | $ | 489,722 | |
| | | | | | | | | | | | | | | | | | | | | | | | | | |
| Assets | | $ | 6,377,369 | | | $ | 2,669,312 | | | $ | 273,220 | $ | 37,361 | | $ | 2,979,893 | | | $ | 110,857 | | | $ | 9,468,119 | |
| | | | | | | | | | | | | | | | | | | | | | | | | | |
| Capital expenditures | | $ | 750,275 | | | $ | 379,692 | | | $ | 35,550 | | | | $ | 415,242 | | | | | | | $ | 1,165,517 | |
(1) The reconciliation of segment assets at December 31, 2009, 2008, and 2007 to the consolidated total includes the following unallocated amounts:
| | | 2009 | | | 2008 | | | 2007 | |
| Other investments | | $ | 5,428 | | | $ | - | | | $ | - | |
| Cash | | | 14,359 | | | | 21,411 | | | | 23,807 | |
| Deferred charges-other | | | 19,808 | | | | 14,390 | | | | 13,554 | |
| | | $ | 39,595 | | | $ | 35,801 | | | $ | 37,361 | |
The Utilities are subject to the jurisdiction of the PUCN and, in the case of SPPC, the CPUC with respect to rates, standards of service, siting of and necessity for generation and certain transmission facilities, accounting, issuance of securities and other matters with respect to electric distribution and transmission operations. Additionally, under federal law, the Utilities are subject to certain jurisdictional regulation, primarily by the FERC. The FERC has jurisdiction under the Federal Power Act with respect to rates, service, interconnection, accounting and other matters in connection with the Utilities’ sale of electricity for resale and interstate transmission.
As a result of regulation, the Utilities are required to file annual electric and gas DEAA cases by March 1, quarterly BTER updates for the Utilities’ electric and gas departments and triennial GRCs. A DEAA case is filed to recover/refund any under/over collection of prior energy costs and the BTER updates recover current energy costs. A GRC filing is to set rates to recover operation and maintenance expenses, depreciation, taxes and provide a return on invested capital. Detailed below are Deferred Energy Costs which relate to the DEAA and BTER filings and further below are other regulatory assets and liabilities which primarily relate to the GRCs. Additionally, significant pending or settled rate cases are discussed below.
The following deferred energy amounts were included in the consolidated balance sheets as of the dates shown (dollars in thousands):
| | | December 31, 2009 | |
| Description | | NPC Electric | | | SPPC Electric | | | SPPC Gas | | | NVE Total | |
| | | | | | | | | | | | | |
| Nevada Deferred Energy | | | | | | | | | | | | |
| Cumulative Balance authorized in 2009 DEAA | | $ | 74,885 | (1) | | $ | (24,870 | ) | | $ | (8,733 | ) | | $ | 41,282 | |
| 2009 Amortization | | | 171 | | | | 5,817 | | | | 3,128 | | | | 9,116 | |
2009 Deferred Energy Over Collections (2) | | | (173,782 | ) | | | (81,227 | ) | | | (11,391 | ) | | | (266,400 | ) |
| Nevada Deferred Energy Balance at December 31, 2009 - Subtotal | | | (98,726 | | | | (100,280 | ) | | | (16,996 | ) | | | (216,002 | ) |
| Cumulative CPUC balance | | | - | | | | 842 | | | | - | | | | 842 | |
Western Energy Crisis Rate Case (effective 6/07, 3 years) | | | 16,263 | | | | - | | | | - | | | | 16,263 | |
| Reinstatement of deferred energy (effective 6/07, 10 years) | | | 147,297 | | | | - | | | | - | | | | 147,297 | |
| | | | | | | | | | | | | | | | | |
Total | | $ | 64,834 | | | $ | (99,438 | ) | | $ | (16,996 | ) | | $ | (51,600 | ) |
| | | | | | | | | | | | | | | | | |
| Current Assets | | | | | | | | | | | | | | | | |
Other deferred charges (3) | | | - | | | | 842 | | | | - | | | | 842 | |
| Deferred Assets | | | | | | | | | | | | | | | | |
Deferred energy | | | 138,963 | | | | - | | | | - | | | | 138,963 | |
| Current Liabilities | | | | | | | | | | | | | | | | |
| Deferred energy | | | (74,129 | ) | | | (100,280 | ) | | | (16,996 | ) | | | (191,405 | ) |
Total | | $ | 64,834 | | | $ | (99,438 | ) | | $ | (16,996 | ) | | $ | (51,600 | ) |
| (1) | These deferred costs include PUCN ordered adjustments and will be included as an offset to 2009 Deferred Energy Over-Collections within the February 2010 DEAA filings. |
| (2) | These deferred over collections are to be requested in February 2010 DEAA filings, and include PUCN ordered adjustments. |
| (3) | Refer to Note 16, Assets Held For Sale. |
| | | December 31, 2008 | |
| Description | | NPC Electric | | | SPPC Electric | | | SPPC Gas | | | NVE Total | |
| | | | | | | | | | | | | |
| Nevada Deferred Energy | | | | | | | | | | | | |
| Cumulative Balance requested in 2008 DEAA | | $ | 35,500 | (1) | | $ | (21,043 | ) | | $ | (11,382 | ) | | $ | 3,075 | |
| 2008 Amortization | | | (89,659 | ) | | | (13,100 | ) | | | 993 | | | | (101,766 | ) |
2008 Deferred Energy (2) | | | 130,597 | | | | 14,330 | | | | 1,656 | | | | 146,583 | |
| Nevada Deferred Energy Balance at December 31, 2008 - Subtotal | | $ | 76,438 | | | $ | (19,813 | ) | | $ | (8,733 | ) | | $ | 47,892 | |
| Cumulative CPUC balance | | | - | | | | 1,890 | | | | - | | | | 1,890 | |
Western Energy Crisis Rate Case (effective 6/07, 3 years) | | | 41,704 | | | | - | | | | - | | | | 41,704 | |
| Reinstatement of deferred energy (effective 6/07, 10 years) | | | 163,321 | | | | - | | | | - | | | | 163,321 | |
| | | | | | | | | | | | | | | | | |
Total | | $ | 281,463 | | | $ | (17,923 | ) | | $ | (8,733 | ) | | $ | 254,807 | |
| | | | | | | | | | | | | | | | | |
| Current Assets | | | | | | | | | | | | | | | | |
Other deferred charges (3) | | | 50,436 | | | | 1,890 | | | | - | | | | 52,326 | |
| Deferred Assets | | | | | | | | | | | | | | | | |
Deferred energy | | | 231,027 | | | | - | | | | - | | | | 231,027 | |
| Current Liabilities | | | | | | | | | | | | | | | | |
| Deferred energy | | | - | | | | (19,813 | ) | | | (8,733 | ) | | | (28,546 | ) |
Total | | $ | 281,463 | | | $ | (17,923 | ) | | $ | (8,733 | ) | | $ | 254,807 | |
| (1) | These deferred costs include PUCN ordered adjustments. |
| (2) | These deferred costs were requested in February 2009 DEAA filings. |
| (3) | Refer to Note 16, Assets Held For Sale. |
As discussed in Note 1, Summary of Significant Accounting Policies, regulatory assets represent incurred costs that have been deferred because it is probable they will be recovered through future rates collected from customers. If at any time the incurred costs no longer meet these criteria, these costs are charged to earnings. Regulatory liabilities generally represent obligations to make refunds to customers for previous collections, except for cost of removal which represents the cost of removing future electric and gas assets. Management regularly assesses whether the regulatory assets are probable of future recovery by considering actions of regulators, current laws related to regulation, applicable regulatory environment changes and the status of any current, pending or potential legislation. Detailed below are Other Regulatory Assets and Liabilities included in the balance sheet of NVE, NPC and SPPC and their current regulatory treatment.
| NV ENERGY, INC. | | | | |
| OTHER REGULATORY ASSETS AND LIABILITIES | | | | |
| | | | | |
| | AS OF DECEMBER 31, 2009 | | | | |
| | | | Receiving Regulatory Treatment | | | | | | | | | | |
(dollars in thousands) DESCRIPTION | Remaining Amortization Period | | Earning a Return(1) | | | Not Earning a Return | | | Pending Regulatory Treatment | | | 2009 Total | | | As of December 31, 2008 Total | |
| | | | | | | | | | | | | | | | | |
| Regulatory assets | | | | | | | | | | | | | | | | |
| Loss on reacquired debt | Term of Related Debt | | $ | 81,951 | | | $ | - | | | $ | - | | | $ | 81,951 | | | $ | 87,381 | |
| Income taxes | Various | | | - | | | | 261,633 | | | | - | | | | 261,633 | | | | 264,779 | |
| Risk management | | | | - | | | | 48,586 | | | | - | | | | 48,586 | | | | 360,000 | |
| Lenzie Generating Station | 2042 | | | - | | | | 75,949 | | | | - | | | | 75,949 | | | | 77,616 | |
| Mohave Generating Station and deferred costs | 2015 | | | 14,456 | | | | - | | | | 6,620 | (2) | | | 21,076 | | | | 19,090 | |
| Clark Generating Station Units 1-3 | 2012 | | | 4,252 | | | | 10,136 | | | | - | | | | 14,388 | | | | 18,689 | |
| Piñon Pine | Various thru 2029 | | | 30,521 | | | | 8,969 | | | | 1,445 | (2) | | | 40,935 | | | | 42,953 | |
| Plant assets | Various thru 2031 | | | 2,332 | | | | - | | | | 1,302 | (2) | | | 3,634 | | | | 2,971 | |
| Asset retirement obligations | | | | | | | | - | | | | 51,916 | (2) | | | 51,916 | | | | 43,812 | |
| Nevada divestiture costs | 2012 | | | 10,442 | | | | - | | | | - | | | | 10,442 | | | | 14,955 | |
| Merger transition/transaction costs | 2016 | | | - | | | | 17,186 | | | | - | | | | 17,186 | | | | 21,096 | |
| Merger severance/relocation | 2016 | | | - | | | | 9,518 | | | | - | | | | 9,518 | | | | 11,640 | |
| Merger goodwill | 2046 | | | - | | | | 269,697 | | | | - | | | | 269,697 | | | | 277,531 | |
| California restructure costs | | | | - | | | | - | | | | - | | | | - | | | | 220 | |
| Conservation programs | Thru 2015 | | | 93,550 | | | | - | | | | 82,170 | (3) | | | 175,720 | | | | 125,940 | |
| Renewable energy programs | | | | - | | | | - | | | | - | | | | - | | | | 4,042 | |
| Legal costs | | | | | | | | - | | | | - | | | | - | | | | 6,044 | |
| Peabody coal costs | | | | - | | | | 17,366 | | | | - | | | | 17,366 | | | | 17,126 | |
| Deferred Rate Increase | | | | - | | | | - | | | | 95,483 | (4) | | | 95,483 | | | | - | |
| Legal fees-Western Energy Crisis | 2010 | | | 697 | | | | - | | | | - | | | | 697 | | | | 1,788 | |
| Union contract OPEB change | 2017 | | | - | | | | - | | | | 9,275 | (2) | | | 9,275 | | | | 10,155 | |
| Impact Fees | 2011 | | | 210 | | | | - | | | | 4,791 | (2) | | | 5,001 | | | | 2,040 | |
| Obsolete Inventory | | | | - | | | | - | | | | 2,828 | (2) | | | 2,828 | | | | 746 | |
| Other costs | Thru 2017 | | | 241 | | | | 5,256 | | | | - | | | | 5,497 | | | | 4,672 | |
| Subtotal | | | $ | 238,652 | | | $ | 724,296 | | | $ | 255,830 | | | $ | 1,218,778 | | | $ | 1,415,286 | |
| Pensions | | | | - | | | | 264,892 | | | | - | | | | 264,892 | | | | 413,544 | |
| Total regulatory assets | | | $ | 238,652 | | | $ | 989,188 | | | $ | 255,830 | | | $ | 1,483,670 | | | $ | 1,828,830 | |
| | | | | | | | | | | | | | | |
| Regulatory liabilities | | | | | | | | | | | | | | |
| Cost of removal | Various | | $ | 348,150 | | $ | - | | $ | - | | | $ | 348,150 | | | $ | 315,753 | |
| Income taxes | Various | | | - | | | 22,128 | | | - | | | | 22,128 | | | | 25,479 | |
| Gain on property sales | | | | - | | | - | | | - | | | | - | | | | (643 | ) |
| SO2 allowances | Various thru 2015 | | | 499 | | | - | | | - | | | | 499 | | | | 696 | |
| Depreciation-customer advances | 2011 | | | 5,476 | | | - | | | 268 | (2) | | | 5,744 | | | | - | |
| Renewable energy programs | 2011 | | | 7,236 | | | - | | | - | | | | 7,236 | | | | 7,938 | |
| Domestic production tax deduction | | | - | | | - | | | - | | | | - | | | | 943 | |
| Impact Fees | | | | - | | | - | | | 1,120 | (2) | | | 1,120 | | | | - | |
| Other | | | | - | | | - | | | 1,142 | (2) | | | 1,142 | | | | 360 | |
| Total regulatory liabilities | | | $ | 361,361 | | $ | 22,128 | | $ | 2,530 | | | $ | 386,019 | | | $ | 350,526 | |
| | NEVADA POWER COMPANY | | | | |
| | OTHER REGULATORY ASSETS AND LIABILITIES | | | | |
| | | | | | | | | | | | | | | | |
| | AS OF DECEMBER 31, 2009 | | | | |
| | | | Receiving Regulatory Treatment | | | | | | | | | | |
(dollars in thousands) DESCRIPTION | Remaining Amortization Period | | Earning a Return(1) | | Not Earning a Return | | | Pending Regulatory Treatment | | | 2009 Total | | | As of December 31, 2008 Total | |
| | | | | | | | | | | | | | | | |
| Regulatory assets | | | | | | | | | | | | | | | |
| Loss on reacquired debt | Term of Related Debt | | $ | 45,229 | | $ | - | | | $ | - | | | $ | 45,229 | | | $ | 55,659 | |
| Income taxes | Various | | | - | | | 173,336 | | | | - | | | | 173,336 | | | | 169,506 | |
| Risk management | | | | - | | | 23,334 | | | | - | | | | 23,334 | | | | 252,884 | |
| Lenzie Generating Station | 2042 | | | - | | | 75,949 | | | | - | | | | 75,949 | | | | 77,616 | |
| Mohave Generating Station and deferred costs | 2015 | | | 14,456 | | | - | | | | 6,620 | (2) | | | 21,076 | | | | 19,090 | |
| Clark Generating Station Units 1-3 | 2012 | | | 4,252 | | | 10,136 | | | | - | | | | 14,388 | | | | 18,689 | |
| Asset retirement obligations | | | | - | | | - | | | | 46,323 | (2) | | | 46,323 | | | | 38,847 | |
| Nevada divestiture costs | 2012 | | | 6,285 | | | - | | | | - | | | | 6,285 | | | | 9,078 | |
| Merger transition/transaction costs | 2014 | | | - | | | 11,863 | | | | - | | | | 11,863 | | | | 14,655 | |
| Merger severance/relocation | 2014 | | | - | | | 4,336 | | | | - | | | | 4,336 | | | | 5,356 | |
| Merger goodwill | 2044 | | | - | | | 169,536 | | | | - | | | | 169,536 | | | | 174,486 | |
| Conservation programs | 2015 | | | 87,606 | | | - | | | | 57,288 | (3) | | | 144,894 | | | | 104,608 | |
| Renewable energy programs | | | | - | | | - | | | | - | | | | - | | | | 1,932 | |
| Peabody coal costs | | | | - | | | 17,366 | | | | - | | | | 17,366 | | | | 17,126 | |
| Deferred Rate Increase | | | | - | | | - | | | | 95,483 | (4) | | | 95,483 | | | | - | |
| Legal costs | | | | - | | | - | | | | | | | | - | | | | 6,044 | |
| Legal fees-Western Energy Crisis | 2010 | | | 697 | | | - | | | | - | | | | 697 | | | | 1,788 | |
| Obsolete Inventory | | | | - | | | - | | | | 2,062 | (2) | | | 2,062 | | | | 518 | |
| Other costs | 2012 | | | - | | | 4,612 | | | | - | | | | 4,612 | | | | 3,472 | |
| Subtotal | | | $ | 158,525 | | $ | 490,468 | | | $ | 207,776 | | | $ | 856,769 | | | $ | 971,354 | |
| Pensions | | | | - | | | 129,709 | | | | - | | | | 129,709 | | | | 187,894 | |
| Total regulatory assets | | | $ | 158,525 | | $ | 620,177 | | | $ | 207,776 | | | $ | 986,478 | | | $ | 1,159,248 | |
| | | | | | | | | | | | | | | | | | | | | |
| Regulatory liabilities | | | | | | | | | | | | | | | | | | | | |
| Cost of removal | Various | | $ | 192,944 | | $ | - | | | $ | - | | | $ | 192,944 | | | $ | 174,262 | |
| Income taxes | Various | | | - | | | 7,149 | | | | - | | | | 7,149 | | | | 8,713 | |
| SO2 allowances | Various thru 2015 | | | 499 | | | - | | | | - | | | | 499 | | | | 696 | |
| Depreciation-customer advances | 2012 | | | 3,113 | | | - | | | | - | | | | 3,113 | | | | 3,735 | |
| Renewable energy programs | 2011 | | | 4,320 | | | - | | | | - | | | | 4,320 | | | | - | |
| Domestic production tax deduction | | | | | | - | | | | | | | | - | | | | 943 | |
| Impact Fees | | | | - | | | - | | | | 1,120 | (2) | | | 1,120 | | | | - | |
| Other | | | | - | | | - | | | | 1,142 | (2) | | | 1,142 | | | | 360 | |
| Total regulatory liabilities | | | $ | 200,876 | | $ | 7,149 | | | $ | 2,262 | | | $ | 210,287 | | | $ | 188,709 | |
| | SIERRA PACIFIC POWER COMPANY | | | | |
| | OTHER REGULATORY ASSETS AND LIABILITIES | | | | |
| | | | | | | | | | | | | | | | | |
| | AS OF DECEMBER 31, 2009 | | | | |
| | | | Receiving Regulatory Treatment | | | | | | | | | | |
(dollars in thousands) DESCRIPTION | Remaining Amortization Period | | Earning a Return(1) | | | Not Earning a Return | | | Pending Regulatory Treatment | | | 2009 Total | | | As of December 31, 2008 Total | |
| | | | | | | | | | | | | | | | | |
| Regulatory assets | | | | | | | | | | | | | | | | |
| Loss on reacquired debt | Term of Related Debt | | $ | 36,722 | | | $ | - | | | $ | - | | | $ | 36,722 | | | $ | 31,722 | |
| Income taxes | Various | | | - | | | | 88,297 | | | | - | | | | 88,297 | | | | 95,273 | |
| Risk management | | | | - | | | | 25,252 | | | | - | | | | 25,252 | | | | 107,116 | |
| Piñon Pine | Various thru 2029 | | | 30,521 | | | | 8,969 | | | | 1,445 | (2) | | | 40,935 | | | | 42,953 | |
| Plant assets | Various thru 2031 | | | 2,332 | | | | - | | | | 1,302 | (2) | | | 3,634 | | | | 2,971 | |
| Asset retirement obligations | | | | - | | | | - | | | | 5,593 | (2) | | | 5,593 | | | | 4,965 | |
| Nevada divestiture costs | 2012 | | | 4,157 | | | | - | | | | - | | | | 4,157 | | | | 5,877 | |
| Merger transition/transaction costs | 2016 | | | - | | | | 5,323 | | | | - | | | | 5,323 | | | | 6,441 | |
| Merger severance/relocation | 2016 | | | - | | | | 5,182 | | | | - | | | | 5,182 | | | | 6,284 | |
| Merger goodwill | 2046 | | | - | | | | 100,161 | | | | - | | | | 100,161 | | | | 103,045 | |
| California restructure costs | | | | | | | | - | | | | - | | | | - | | | | 220 | |
| Conservation programs | Thru 2014 | | | 5,944 | | | | - | | | | 24,882 | (3) | | | 30,826 | | | | 21,332 | |
| Renewable energy programs | | | | - | | | | - | | | | - | | | | - | | | | 2,110 | |
| Union contract OPEB change | 2017 | | | - | | | | - | | | | 9,275 | (2) | | | 9,275 | | | | 10,155 | |
| Legal fees-Western Energy Crisis | | | | | | | | - | | | | | | | | - | | | | - | |
| Impact Fees | 2011 | | | 210 | | | | - | | | | 4,791 | (2) | | | 5,001 | | | | 2,040 | |
| Obsolete Inventory | | | | - | | | | - | | | | 766 | (2) | | | 766 | | | | 228 | |
| Other costs | Various thru 2017 | | | 241 | | | | 644 | | | | - | | | | 885 | | | | 1,200 | |
| Subtotal | | | $ | 80,127 | | | $ | 233,828 | | | $ | 48,054 | | | $ | 362,009 | | | $ | 443,932 | |
| Pensions | | | | - | | | | 130,283 | | | | - | | | | 130,283 | | | | 218,550 | |
| Total regulatory assets | | | $ | 80,127 | | | $ | 364,111 | | | $ | 48,054 | | | $ | 492,292 | | | $ | 662,482 | |
| | | | | | | | | | | | | | | | | | | | | | |
| Regulatory liabilities | | | | | | | | | | | | | | | | | | | | | |
| | | | | | | | | | | | | | | | | | | | | | |
| Cost of removal | Various | | $ | 155,206 | | | $ | - | | | $ | - | | | $ | 155,206 | | | $ | 141,491 | |
| Income taxes | Various | | | - | | | | 14,979 | | | | - | | | | 14,979 | | | | 16,766 | |
| Gain on property sales | | | | - | | | | - | | | | - | | | | - | | | | (643 | ) |
| Depreciation-customer advances | 2011 | | | 2,363 | | | | - | | | | 268 | (2) | | | 2,631 | | | | 4,203 | |
| Renewable energy programs | 2011 | | | 2,916 | | | | - | | | | - | | | | 2,916 | | | | - | |
| Total regulatory liabilities | | | $ | 160,485 | | | $ | 14,979 | | | $ | 268 | | | $ | 175,732 | | | $ | 161,817 | |
| (1) | Earning a Return includes either a carrying charge on the asset/liability balance, or a return as a component of weighted cost of capital. |
| (2) | Pending regulatory treatment includes either amounts which have prior regulatory precedent or have been approved and are subject to prudency review. |
| (3) | Assets which are allowed to earn a carrying charge until included in rates. Reference Note 1, Summary of Significant Accounting Policies, Equity Carrying Charges. |
| (4) | Represents the asset associated with the difference between revenue recognized in accordance with NPC’s 2008 GRC PUCN authorized rate increase effective July 1, 2009 and the amounts authorized to be billed to customers for the period July 1, 2009 through December 31, 2009. In its June 2009 order, the PUCN delayed billings to customers during this period in order to mitigate the rate impact during the hottest summer months. NPC was ordered to track the delayed billings with a carrying charge and seek regulatory approval in a future rate case to determine an appropriate collection period for the delayed billings. Reference further discussion of NPC’s 2008 GRC discussed later. |
Pending Regulatory Actions
Nevada Power Company and Sierra Pacific Power Company
Ely Energy Center
On February 9, 2009, NVE and the Utilities announced their intention to postpone plans to construct the EEC due to increasing environmental and economic uncertainties until such time as carbon sequestration becomes commercially viable, which is not expected for at least a decade. The PUCN had previously approved the Utilities spending on the EEC up to $130 million, of which the Utilities have spent and recorded as an other deferred asset approximately $78.8 million as of December 31, 2009. Management expects full recovery of the amounts expended through December 31, 2009. In June 2009, the Utilities filed to withdraw the initial construction application under the Utility Environmental Protection Act (UEPA) filed in 2006 due to postponing the construction of the EEC. Simultaneously, the Utilities filed a new UEPA application for the construction of a transmission line.
Sierra Pacific Power Company
SPPC California Divestiture Filing
In October 2009, SPPC and CalPeco filed an application with the CPUC requesting approval of the transaction in which SPPC has agreed to sell its California electric distribution and generation assets to CalPeco. Upon closing of the transaction, SPPC will transfer to CalPeco all of its California electric distribution and generation assets and approximately 46,000 retail electric customers. Separately in December 2009, SPPC filed an application with the PUCN requesting PUCN approval of the transaction. On or before July 1, 2010 SPPC will file certain components of the transaction under its IRP process and request consolidation with the previously filed application. See Note 16, Assets Held for Sale.
Settled Regulatory Actions
Nevada Power Company
NPC 2009 DEAA
In February 2009, NPC filed an application to create a new DEAA rate. In this application, NPC requested to increase rates by $72.1 million, an increase of 3.18%, while recovering $77.5 million of deferred fuel and purchased power costs. In September 2009, the PUCN ordered that the DEAA rate remain set at $0.00 per kWh, a slight increase to the Temporary Renewable Energy Development charge and slight decrease to the Renewable Energy Program Rate which is a decrease to revenues of $4.6 million, or a 0.20% decrease. The PUCN found that NPC’s purchases of fuel and power were prudent and approved those costs for the test period which will be included as an offset to 2009 deferred energy over-collections within the February 2010 DEAA filing.
NPC 2008 GRC
In December 2008, NPC filed its statutorily required GRC with the PUCN and further updated the filing in February and March 2009. The filing, as updated, requested an ROE of 11.0% and ROR of 8.88% and an increase to general revenues of $305.7 million.
The PUCN issued its order in June 2009, which resulted in the following significant items:
| • | Increase in general rates by $222.7 million, approximately a 9.8% increase; |
| • | ROE and ROR of 10.5% and 8.53%, respectively; |
| • | Authorized to recover the costs of major plant additions including the purchase of the Higgins Generating Station, construction of Clark Peaking Units, an upgrade to the emission control systems on existing units at the Clark Generating Station, installation of environmental equipment upgrades at the Reid Gardner Generating Station and new transmission and distribution projects; |
| • | CWIP as of November 2008 in rate base for the construction of a 500 MW (nominally rated) combined cycle unit at the existing Harry Allen Generating Station site; and |
| • | A two part implementation of the rate increase to be billed to customers. The part I rate increase was effective July 1, 2009 and resulted in a 3% increase to all core customer classes. The part II rate increase was effective January 1, 2010 and implemented the remainder of the increase to all core customer classes. The PUCN granted approval for NPC to track and record the difference between the 9.8% general rate increase and billings associated with the part I rate increase each month in a regulatory asset account and permitted NPC to record a carrying charge on these amounts. Reference Equity Carrying Charges in Note 1, Summary of Significant Accounting Policies of the Notes to Financial Statements for further discussion on the recognition of the carrying charge. NPC will seek authority to amortize this regulatory asset over an appropriate collection period in its next GRC filing, currently scheduled for June 2011. |
NPC 2008 DEAA and BTER Update
In February 2008, NPC filed applications to create a new DEAA rate and to update the going forward BTER. In these applications, NPC requested to decrease rates by $116.3 million, a decrease of 5.04% while recovering $36 million of deferred fuel and purchased power costs. The going forward BTER became effective April 1, 2008. The PUCN issued its order in September 2008 setting the DEAA rate for all customers at $0.00 per kWh effective October 1, 2008. The PUCN found that NPC’s purchases of fuel and power were prudent and approved those costs for the test period.
NPC 2007 Quarterly BTER Filings
In November 2007, NPC filed an application to update the going forward BTER. NPC requested to decrease rates by $26.6 million, resulting in a 1% decrease. The PUCN approved the requested rate change with rates effective January 1, 2008.
In August 2007, NPC filed an application to update the going forward BTER. NPC requested to increase rates by $22.7 million, resulting in a 1% increase. The PUCN approved the requested rate change with rates effective October 1, 2007.
NPC 2007 DEAA and BTER Update
In January 2007, NPC filed an application to create a new DEAA rate and to update the going forward BTER. NPC requested to decrease rates by $33.2 million, while recovering $75 million of deferred fuel and purchased power costs.
In March 2007, NPC filed an update to its going forward BTER which lowered the overall decrease in rates from $33.2 million to $5.9 million, resulting in less than a 1% decrease. NPC requested the amortization to begin June 1, 2007 and to continue for a 14-month period.
In June 2007, the PUCN approved a stipulation between the parties that resolved all the issues in this case with no material impact to the requested rate change with rates effective June 1, 2007.
NPC 2007 Western Energy Crisis Rate Case
In January 2007, NPC filed an application to recover $83.6 million in deferred legal and settlement costs incurred to resolve claims associated with power supply contracts terminated during the Western Energy Crisis. This application requested to begin amortizing the costs over a four-year period beginning June 1, 2007.
In March 2007, the PUCN approved a negotiated settlement where NPC is authorized to recover the $83.6 million plus carrying charges over a three-year period beginning June 1, 2007, which differed from the four-year period requested in the application.
NPC 2001 DEAA
In November 2001, NPC made a deferred energy filing with the PUCN seeking repayment for purchased fuel and power costs accumulated between March 1, 2001, and September 30, 2001, as required by law. The application sought to establish a rate to repay purchased fuel and power costs of $922 million and to spread the recovery of the deferred costs, together with a carrying charge, over a period of not more than three years.
In March 2002, the PUCN issued its Order on the application, allowing NPC to recover $478 million over a three-year period, but disallowing $434 million of deferred purchased fuel and power costs and $30.9 million in carrying charges consisting of $10.1 million in carrying charges accrued through September 2001 and $20.8 million in carrying charges accrued from October 2001 through February 2002. The Order stated that the disallowance was based on alleged imprudence in incurring the disallowed costs. NPC and the BCP both sought individual review of the PUCN Order in the First District Court of Nevada (the District Court). The District Court affirmed the PUCN’s decision. Both NPC and the BCP filed Notices of Appeal with the Nevada Supreme Court.
In July 2006, the Supreme Court of Nevada issued a ruling reversing $178.8 million of the PUCN’s disallowance which was part of the NPC’s 2001 Deferred Energy Case. The decision directed the District Court to remand the matter back to the PUCN to determine the appropriate rate schedule.
In March 2007, the PUCN approved a stipulation that authorizes NPC to recover in rates $189.9 million over ten years beginning on June 1, 2007, with no additional carrying charges. The $189.9 million represents Nevada’s jurisdictional portion of the
$178.8 million disallowance plus carrying charges of $11.1 million from the date the costs were incurred to the date of disallowance by the PUCN.
NPC 2006 GRC
In November 2006, NPC filed its statutorily required electric GRC and further updated the filing in February 2007. The filing requested an ROE and ROR of 11.4% and 9.39% and an increase to general revenues of $156.4 million.
The PUCN issued its order in May 2007, with rates effective as of June 1, 2007. The PUCN order resulted in the following significant items:
| • | increase in general rates of $120.1 million, a 5.66% increase; |
| • | ROE and ROR of 10.7% and 9.06%, respectively; |
| • | authorized 100% recovery of unamortized 1999 NPC / SPPC merger costs; |
| • | authorized incentive rate making for the Lenzie Generating Station; |
| • | authorized recovery of accumulated cost and savings, including the net book value of the Mohave Generating Station over an eight year period, see below for further discussion of the Mohave Generating Station. |
Mohave Generating Station
NPC owns approximately 14% of the Mohave Generating Station. Southern California Edison is the operating partner of the Mohave Generating Station.
When operating, the Mohave Generating Station obtained all of its coal supply from a mine in northeast Arizona on lands of the Navajo Nation and the Hopi Tribe (the Tribes). This coal was delivered from the mine to the Mohave Generating Station by means of a coal slurry pipeline, which requires water that is obtained from groundwater wells located on lands of the Tribes in the mine vicinity.
The Grand Canyon Trust and Sierra Club filed a lawsuit in the U.S. District Court, District of Nevada in February 1998 against the owners (including NPC) of the Mohave Generating Station, alleging violations of the Clean Air Act regarding emissions of sulfur dioxide and particulates. An additional plaintiff, National Parks and Conservation Association, later joined the suit. In 1999, the plant owners and plaintiffs filed a settlement with the court, which resulted in a consent decree, approved by the court in November 1999. The consent decree established emission limits for sulfur dioxide and opacity and required installation of air pollution controls for sulfur dioxide, nitrogen oxides, and particulate matter. Pursuant to the decree, the Mohave Generating Station Units 1 and 2 ceased operations as of January 2006 as the new emission limits were not met. Due to the lack of resolution regarding continual availability of the coal and water supply with the Tribes, the Owners did not proceed with the Consent Decree.
In December 2005, the Owners of the Mohave Generating Station suspended operation, pending resolution of these issues. However, in June 2006, majority stake holder Southern California Edison announced it would no longer participate in the efforts to return the plant to service. As a result, NPC decided it is not economically feasible to continue its participation in the project. In September 2006, Salt River’s co-tenancy agreement expired and the operating agreement between the Owners expired in July 2006. The Owners are negotiating an extension of both agreements including a process that addresses how Owners may sell or assign their right, title, interest and obligations in the Mohave Generating Station.
Included in other regulatory assets is approximately $14.5 million, which has been approved by the PUCN and included in rates. All other costs for Mohave Generating Station, including decommissioning costs continue to be accumulated in other regulatory assets as incurred and will be requested for recovery in future GRC’s, see the Other Regulatory Assets/Liabilities table above .
In June 2009, Southern California Edison announced that the Mohave Generating Station will be dismantled and its operating permits terminated following a December 2005 suspension of operations due to pending environmental matters. NPC believes it will continue to recover the costs for the Mohave Generating Station through the regulatory process and does not expect the dismantling of the plant to have a material impact on its financial condition.
Sierra Pacific Power Company
SPPC California GRC
In July 2008, SPPC filed a GRC with the CPUC and subsequently filed an amendment to the original filing in December 2008. SPPC requested an ROE of 11.4% and ROR of 8.81% and an increase in general revenues of $8.9 million. In July 2009 a settlement was filed with the CPUC, which includes the following:
| • | Increase in general rates of $5.5 million, approximately an 8% increase; |
| • | ROE and ROR of 10.7% and 8.51%, respectively; |
| • | Approval of authorization to recover the costs of major plant additions, which include the Tracy Generating Station, and distribution plant additions, as well as a decrease to the California Energy Efficiency Program; and |
| • | Approval of a two-part mechanism to recover changes in non-energy cost adjustment clause costs incurred during the two years between rate cases. |
The CPUC approved the settlement and rates were effective December 1, 2009.
SPPC 2009 Nevada Gas DEAA
In February 2009, SPPC filed an application to create a new gas DEAA rate for Nevada customers. In this application, SPPC requested to decrease rates by $8.7 million, a decrease of 4.71%, while refunding $8.7 million of deferred gas costs. The PUCN issued its order in September 2009 approving SPPC’s requested rate decrease and approving SPPC’s purchases of natural gas and propane as prudent for the test period. The new DEAA rate became effective October 1, 2009.
SPPC 2009 Nevada Electric DEAA
In February 2009, SPPC filed an application to create a new electric DEAA rate for Nevada customers. In this application, SPPC requested to decrease rates by $25.9 million, a decrease of 2.69%, while refunding $19.8 million of deferred fuel and purchased power costs. The PUCN issued its order in September 2009 decreasing rates by $30.8 million, a decrease of 3.19% and approving SPPC’s purchases of fuel and power as prudent for the test period. The new credit DEAA rate became effective October 1, 2009.
SPPC Nevada Gas DEAA and BTER Update
In December 2007, SPPC filed for the authority to implement quarterly BTER adjustments for its natural gas and liquefied propane gas services. The authority was approved in January 2008, and as a result, in February 2008, SPPC filed applications to create a new DEAA rate and to update the going forward BTER. In these applications SPPC requested to decrease rates by $9.9 million, a decrease of 5.53%, while refunding an over collection of $11.4 million in deferred natural gas and liquid propane costs. The going forward BTER became effective April 1, 2008. The PUCN issued its order in October 2008 setting the DEAA rate at $0.00 per therm effective October 1, 2008 and approving SPPC’s purchases of natural gas and propane for the test period as prudent.
SPPC Nevada Electric DEAA and BTER Update
In February 2008, SPPC filed applications to create a new DEAA rate and to update the going forward BTER. In these applications SPPC requested to decrease rates by $42.1 million, a decrease of 4.57%, while refunding an over collection of $20.9 million in deferred fuel and purchased power costs. The going forward BTER became effective April 1, 2008. The PUCN issued its order in October 2008 setting the DEAA rate at $0.00 per kWh effective October 1, 2008. The PUCN found that SPPC’s purchases of fuel and power were prudent and approved those costs for the test period.
SPPC California Energy Cost Adjustment Clause
In April 2008, SPPC filed to decrease rates by $12.2 million, a decrease of 15.2%. The CPUC approved the filing in August 2008. The rates requested in this filing were effective September 1, 2008.
SPPC 2007 Nevada GRC
In December 2007, SPPC filed its statutorily required electric GRC. The filing requested a ROE and ROR of 11.5% and 8.73%, respectively, and an increase to general revenues of $110.8 million.
The PUCN issued its order in June 2008, with rates effective July 1, 2008. The PUCN order resulted in the following significant items:
| • | Increase in general rates of $87.1 million, a 10.45% increase; |
| • | ROE and ROR of 10.6% and 8.41%, respectively; |
| • | Authorization to recover the costs of the new 541 MW (nominally rated) Tracy Generating Station; and |
| • | Authorization to recover the projected operating and maintenance costs associated with the new Tracy Generating Station. |
SPPC Piñon Pine
In its 2003 GRC, SPPC sought recovery of its unreimbursed costs associated with the Piñon Pine Coal Gasification Demonstration Project (the “Project”). The Project represented experimental technology tested pursuant to a DOE Clean Coal
Technology initiative. Under the terms of the Project agreement, SPPC and DOE agreed to each fund 50% of construction costs of the Project. SPPC's participation in the Project had received PUCN approval as part of SPPC’s 1993 IRP. While the conventional portion of the plant, a gas-fired combined cycle unit, was installed and performed as planned, the coal gasification unit never became fully operational. After numerous attempts to re-engineer the coal gasifier, the technology was determined to be unworkable.
In its order of May 25, 2004, the PUCN disallowed $43 million of unreimbursed costs associated with the Project. As a result, these amounts were expensed in 2004. SPPC filed a Petition for Judicial Review with the Second Judicial District Court of Nevada (District Court) in June 2004 (CV04-01434). On January 25, 2006, the District Court vacated the PUCN’s disallowance in SPPC’s 2003 GRC and remanded the case back to the PUCN for further review as to whether the costs were justly and reasonably incurred (“the Order”). On March 27, 2006, the PUCN appealed the Order to the Nevada Supreme Court (the “Supreme Court”) and filed a motion to stay the Order pending the appeal to the Supreme Court. On June 12, 2006, the District Court granted the PUCN’s motion to stay the Order. The Supreme Court dismissed the appeal in September 2006. Requests for rehearing were denied in late December 2006, and on January 18, 2007 the matter was remitted back to the District Court, which, consistent with the Order, remanded the matter back to the PUCN for further review.
On March 18, 2008, the PUCN issued an order to place $5.8 million (Nevada jurisdiction) of the previously disallowed $43 million unreimbursed costs in a regulatory asset account without a carrying charge. As a result of this order and in accordance with FASC accounting for regulated operations and abandonments, SPPC recognized approximately $4.3 million in income for the year ended December 31, 2008. The remaining difference of $1.5 million will be recognized over an approximate six year period. The time for any party to appeal the PUCN’s decision ended in June 2008 and no appeals were filed.
SPPC 2007 Quarterly Electric BTER Filings
In November 2007, SPPC filed an application to update the going forward BTER. SPPC requested to decrease rates by $7.7 million, resulting in approximately a 1% decrease. The PUCN approved the requested rate change with rates effective January 1, 2008.
In August 2007, SPPC filed an application to update the going forward BTER. SPPC requested to decrease rates by $17.4 million, resulting in a 1.85% decrease. The PUCN approved the requested rate change with rates effective October 1, 2007.
SPPC 2007 Nevada Natural Gas and Propane DEAA and BTER Update
In May 2007, SPPC filed an application to create a new Deferred Energy Accounting Adjustment (DEAA) rate and to update the going forward BTER. SPPC requests to increase rates by $13.4 million, while recovering $900 thousand of deferred gas costs. This application requests an overall rate increase of 7.05%.
Subsequent to the filing, SPPC reduced its deferred gas costs by $2.3 million due to a re-allocation of cost between the gas and electric segments. As a result, SPPC updated its filing from recovering $900 thousand of deferred gas costs to a refund of $1.4 million to the customers. In addition, due to lower natural gas costs, SPPC updated its forecasts used in calculating the going forward BTER and its overall requested rate change went from an increase of $13.4 million to a decrease of $2.3 million.
In November 2007, the PUCN approved the revised rate change with rates effective December 1, 2007.
SPPC 2006 Nevada Western Energy Crisis Rate Case
In December 2006, SPPC filed an application to recover $22.6 million in deferred legal and settlement costs incurred to resolve claims arising from the Western Energy Crisis. This application requested an overall rate increase of 0.53% and to begin amortizing the costs over a four-year period beginning July 1, 2007.
In February 2007, SPPC entered into a stipulation pursuant to which SPPC replaced its request to implement rates on July 1, 2007 with a request to recover approximately $16.3 and $6.3 million, respectively, in deferred settlement and legal costs. SPPC further requested authority to recover carrying charges on the regulatory asset.
In November 2007, the PUCN authorized SPPC to establish a regulatory asset, including carrying charges, to recover $2.8 million of the legal costs. The recovery period was not established in this proceeding but will be determined in a later filing. As a result of this order and recognition of legal reserves and other adjustments in prior periods, SPPC recorded a $7.6 million expense (net of taxes) in the fourth quarter of 2007.
SPPC 2006 Nevada Electric DEAA and BTER Update
In December 2006, SPPC filed an application to create a new electric DEAA rate and to update the electric BTER. SPPC requested to decrease rates by $7.9 million, a decrease of 0.86%, while recovering $18.7 million of deferred fuel and purchased power costs. SPPC sought recovery using a symmetrical two-year amortization period beginning July 1, 2007.
In June 2007, the PUCN approved a stipulation between the parties that resolved all the issues in this case with no material impact to the requested rate change with rates effective July 1, 2007.
FERC Matters
California Wholesale Spot Market Refunds
NPC and SPPC are participants in a FERC proceeding wherein California parties have been authorized to recalculate, or mitigate, the prices they paid for wholesale spot market power between October 2, 2000 and June 20, 2001. Both of the Utilities made spot market sales that are eligible for mitigation, therefore the Utilities expect to pay refunds resulting from the recalculated energy prices. Parties have contested the FERC’s decision to limit the timeframe for the recalculations and a Ninth Circuit court decision remanded a related issue to the FERC, therefore NPC and SPPC are not able to determine the eventual magnitude of refunds that may result from this FERC process. NPC and SPPC are actively participating in this docket to ensure their interests are represented.
Nevada Power Company
Based on the FERC’s orders to date, NPC believes the recalculated energy prices for NPC sales to the California Independent System Operator (CAISO) and the bankrupt California Power Exchange (CALPX) would result in an approximate $19 million refund. The FERC has also allowed for energy sellers to provide cost justification in the event the recalculated energy prices fall below sellers’ costs. NPC developed and filed a cost based filing, which justified a $6 million reduction to the estimated refunds resulting in a $13 million refund.
CAISO and CALPX currently owe NPC approximately $19 million for power delivered during the same timeframe for which NPC had fully reserved for in 2001. As such, if NPC is ordered to pay CAISO and CALPX the refunds discussed above, NPC would apply such payments towards NPC’s receivable of $19 million from CAISO and CALPX.
Sierra Pacific Power Company
Based on the FERC’s orders to date, SPPC believes the recalculated energy prices for sales to the CAISO and CALPX during the October 2, 2000 to June 20, 2001 timeframe would result in a $4 million refund.
CAISO and CALPX currently owe SPPC approximately $1 million for power delivered during the same timeframe and SPPC recorded a reserve against the $1 million receivable in 2001. In 2004, SPPC recorded an additional $3 million liability for this item.
Investments in subsidiaries and other property consisted of (dollars in thousands):
NV Energy, Inc.
| | | December 31, | |
| | | 2009 | | | 2008 | |
Investments held in Rabbi Trust (1) | | $ | 26,490 | | | $ | - | |
| Cash Value-Life Insurance | | | 2,512 | | | | 2,456 | |
| Non-utility property of NEICO | | | 5,338 | | | | 5,238 | |
Non-utility property of SPC (2) | | | 4,130 | | | | 4,130 | |
| Property not designated for Utility use | | | 12,255 | | | | 12,418 | |
| Other non-utility Property | | | 444 | | | | 947 | |
| | | $ | 51,169 | | | $ | 25,189 | |
Nevada Power Company
| | | December 31, | |
| | | 2009 | | | 2008 | |
Investments held in Rabbi Trust(1) | | $ | 21,492 | | | $ | - | |
| Cash Value-Life Insurance | | | 2,512 | | | | 2,456 | |
| Non-utility property of NEICO | | | 5,338 | | | | 5,238 | |
| Property not designated for Utility use | | | 11,825 | | | | 12,007 | |
| | | $ | 41,167 | | | $ | 19,701 | |
Sierra Pacific Power Company
| | | December 31, | |
| | | 2009 | | | 2008 | |
Investments held in Rabbi Trust(1) | | $ | 4,998 | | | $ | - | |
| Property not designated for Utility use | | | 430 | | | | 403 | |
| | | $ | 5,428 | | | $ | 403 | |
| (1) | Rabbi trust assets represent non-qualified deferred compensation plans, which consist of actively traded money market and equity funds with quoted prices in active markets which are considered level 1 in the fair value hierarchy. The balance also includes life insurance policies, which are recorded at its cash surrender value of $4.6 million on the consolidated balance sheet. |
| (2) | SPC, a wholly owned subsidiary of NVE, incurred an impairment charge of its long haul network assets of $5.9 million, before taxes in 2008. |
| | | % Owned | | | Plant In Service | | | Accumulated Depreciation | | | Net Plant in Service | | | CWIP | |
| | | | | | | | | | | | | | | | |
| NPC | | | | | | | | | | | | | | | |
| Navajo Generating Station | | | 11.3 | % | | $ | 249,193 | | | $ | 135,732 | | | $ | 113,461 | | | $ | 341 | |
| Reid Gardner Generating Station No. 4 | | | 32.2 | % | | $ | 174,671 | | | $ | 103,961 | | | $ | 70,710 | | | $ | 16,368 | |
| Silverhawk Generating Station | | | 75.0 | % | | $ | 246,098 | | | $ | 39,715 | | | $ | 206,383 | | | $ | 2 | |
| | | | | | | $ | 669,962 | | | $ | 279,408 | | | $ | 390,554 | | | $ | 16,711 | |
| SPPC | | | | | | | | | | | | | | | | | | | | |
| Valmy Generating Station | | | 50.0 | % | | $ | 304,131 | | | $ | 195,479 | | | $ | 108,652 | | | $ | 3,023 | |
The amounts for Navajo Generating Station include NPC’s share of transmission systems, general plant equipment and NPC’s share of the jointly owner railroad which delivers coal to the plant. Each participant provides its own financing for all these jointly owned facilities. NPC’s share of the operating expenses for these facilities is included in the corresponding operating expenses in its consolidated statement of income.
Reid Gardner Generating Station Unit No. 4 is owned by the California Department of Water Resources (67.8%) and NPC (32.2%). NPC is operating agent. Contractually, NPC is entitled to receive 25 MW of base load capacity and 232 MW of peaking capacity. Operationally, Unit No. 4 subject to heat input at 257 MW is entitled to use 100% of the unit’s peaking capacity for 1500 hours each year and is entitled to 9.6% of the first 250 MW of capacity and associated energy. The contract expires in 2013. NPC's share of the operating expenses for this facility is included in the corresponding operating expenses in its consolidated income statements.
NPC is the operator of the Silverhawk Generating Station, which is jointly owned with SNWA. NPC’s owns 75% and its share of direct operation and maintenance expenses is included in its accompanying consolidated income statements.
SPPC and Idaho Power Company each own a 50% undivided interest in the Valmy Generating Station, with each company being responsible for financing its share of capital and operating costs. SPPC is the operating of the plant for both parties. SPPC’s share of direct operation and maintenance expenses for Valmy Generating Station are in included in its accompanying consolidated income statements.
NVE’s, NPC’s and SPPC’s long term debt consists of the following (dollars in thousands):
| | | December 31, 2009 | | December 31, 2008 | |
| Long-Term Debt: | | SPPC | | NPC | | NVE Holding Co. | | Consolidated | | SPPC | | NPC | | NVE Holding Co. | | Consolidated | |
| Secured Debt | | | | | | | | | | | | | | | | | |
| Debt Secured by General and Refunding Mortgage Securities | | | | | | | | | | | | | | | | | |
| 8.25% NPC Series A due 2011 | | $ | - | | $ | 350,000 | | $ | - | | $ | 350,000 | | $ | - | | $ | 350,000 | | $ | - | | $ | 350,000 | |
| 6.50% NPC Series I due 2012 | | | - | | | 130,000 | | | - | | | 130,000 | | | - | | | 130,000 | | | - | | | 130,000 | |
| 5.875% NPC Series L due 2015 | | | - | | | 250,000 | | | - | | | 250,000 | | | - | | | 250,000 | | | - | | | 250,000 | |
| 5.95% NPC Series M due 2016 | | | - | | | 210,000 | | | - | | | 210,000 | | | - | | | 210,000 | | | - | | | 210,000 | |
| 6.65% NPC Series N due 2036 | | | - | | | 370,000 | | | - | | | 370,000 | | | - | | | 370,000 | | | - | | | 370,000 | |
| 6.50% NPC Series O due 2018 | | | - | | | 325,000 | | | - | | | 325,000 | | | - | | | 325,000 | | | - | | | 325,000 | |
| 6.75% NPC Series R due 2037 | | | - | | | 350,000 | | | - | | | 350,000 | | | - | | | 350,000 | | | - | | | 350,000 | |
| 6.50% NPC Series S due 2018 | | | - | | | 500,000 | | | - | | | 500,000 | | | - | | | 500,000 | | | - | | | 500,000 | |
| 7.375% Series U due 2014 | | | - | | | 125,000 | | | - | | | 125,000 | | | - | | | - | | | - | | | - | |
| 7.125% Series V due 2019 | | | - | | | 500,000 | | | - | | | 500,000 | | | - | | | - | | | - | | | - | |
| 6.25% SPPC Series H due 2012 | | | 100,000 | | | - | | | - | | | 100,000 | | | 100,000 | | | - | | | - | | | 100,000 | |
| 6.00% SPPC Series M due 2016 | | | 450,000 | | | - | | | - | | | 450,000 | | | 300,000 | | | - | | | - | | | 300,000 | |
| 6.75% SPPC Series P due 2037 | | | 251,742 | | | - | | | - | | | 251,742 | | | 325,000 | | | - | | | - | | | 325,000 | |
| 5.45% SPPC Series Q due 2013 | | | 250,000 | | | - | | | - | | | 250,000 | | | 250,000 | | | - | | | - | | | 250,000 | |
| Variable Rate Notes | | | | | | | | | | | | | | | | | | | | | | | | | |
| NPC IDRB Series 2000A due 2020 | | | - | | | 98,100 | | | - | | | 98,100 | | | - | | | 100,000 | | | - | | | 100,000 | |
| NPC PCRB Series 2006 due 2036 | | | - | | | 37,700 | | | - | | | 37,700 | | | - | | | 39,500 | | | - | | | 39,500 | |
| NPC PCRB Series 2006A due 2032 | | | - | | | 37,975 | | | - | | | 37,975 | | | - | | | 40,000 | | | - | | | 40,000 | |
| SPPC PCRB Series 2006A due 2031 | | | 58,200 | | | - | | | - | | | 58,200 | | | 58,700 | | | - | | | - | | | 58,700 | |
| SPPC PCRB Series 2006B due 2036 | | | 75,000 | | | - | | | - | | | 75,000 | | | 75,000 | | | - | | | - | | | 75,000 | |
| SPPC PCRB Series 2006C due 2036 | | | 81,475 | | | - | | | - | | | 81,475 | | | 84,800 | | | - | | | - | | | 84,800 | |
| SPPC WFRB Series 2007A due 2036 | | | - | | | - | | | - | | | - | | | 40,000 | | | - | | | - | | | 40,000 | |
| Revolving Credit Facilities | | | 15,000 | | | 110,000 | | | - | | | 125,000 | | | 152,912 | | | 409,629 | | | - | | | 562,541 | |
| Unsecured Debt | | | | | | | | | | | | | | | | | | | | | | | | | |
| Revenue Bonds | | | | | | | | | | | | | | | | | | | | | | | | | |
| 5.30% NPC Series 1995D due 2011 | | | - | | | 14,000 | | | - | | | 14,000 | | | - | | | 14,000 | | | - | | | 14,000 | |
| 5.45% NPC Series 1995D due 2023 | | | - | | | 6,300 | | | - | | | 6,300 | | | - | | | 6,300 | | | - | | | 6,300 | |
| 5.50% NPC Series 1995C due 2030 | | | - | | | 44,000 | | | - | | | 44,000 | | | - | | | 44,000 | | | - | | | 44,000 | |
| 5.60% NPC Series 1995A due 2030 | | | - | | | 76,750 | | | - | | | 76,750 | | | - | | | 76,750 | | | - | | | 76,750 | |
| 5.90% NPC Series 1995B due 2030 | | | - | | | 85,000 | | | - | | | 85,000 | | | - | | | 85,000 | | | - | | | 85,000 | |
| 5.90% NPC Series 1997A due 2032 | | | - | | | - | | | - | | | - | | | - | | | 52,285 | | | - | | | 52,285 | |
| 7.803% NVE Senior Notes due 2012 | | | - | | | - | | | 63,670 | | | 63,670 | | | - | | | - | | | 63,670 | | | 63,670 | |
| 8.625% NVE Notes due 2014 | | | - | | | - | | | 230,039 | | | 230,039 | | | - | | | - | | | 230,039 | | | 230,039 | |
| 6.75% NVE Senior Notes due 2017 | | | - | | | - | | | 191,500 | | | 191,500 | | | - | | | - | | | 191,500 | | | 191,500 | |
| Obligations under capital leases | | | - | | | 47,047 | | | - | | | 47,047 | | | - | | | 54,265 | | | - | | | 54,265 | |
| Unamortized bond premium and discount, net | | | 15,808 | | | (11,958 | ) | | 483 | | | 4,333 | | | 9,575 | | | (12,932 | ) | | 680 | | | (2,677 | ) |
| Current maturities and sinking fund requirements | | | (15,000 | ) | | (119,474 | ) | | - | | | (134,474 | ) | | (600 | ) | | (8,691 | ) | | - | | | (9,291 | ) |
| Other, excluding current portion | | | - | | | - | | | - | | | - | | | 600 | | | - | | | - | | | 600 | |
| Total Long-Term Debt | | $ | 1,282,225 | | $ | 3,535,440 | | $ | 485,692 | | $ | 5,303,357 | | $ | 1,395,987 | | $ | 3,385,106 | | $ | 485,889 | | $ | 5,266,982 | |
Maturities of Long-Term Debt
As of December 31, 2009, NPC’s, SPPC’s and NVE’s aggregate annual amount of maturities for long-term debt (including obligations related to capital leases) for the next five years and thereafter are shown below (dollars in thousands):
| | | SPPC | | | NPC | | | NVE Holding Co. | | | NVE Consolidated | |
2010(1) | | $ | 15,000 | | | $ | 118,004 | | | $ | - | | | $ | 133,004 | |
| 2011 | | | - | | | | 369,924 | | | | - | | | | 369,924 | |
| 2012 | | | 100,000 | | | | 136,449 | | | | 63,670 | | | | 300,119 | |
| 2013 | | | 250,000 | | | | 7,146 | | | | - | | | | 257,146 | |
| 2014 | | | - | | | | 129,236 | | | | 230,039 | | | | 359,275 | |
| | | | 365,000 | | | | 760,759 | | | | 293,709 | | | | 1,419,468 | |
| Thereafter | | | 916,417 | | | | 2,906,113 | | | | 191,500 | | | | 4,014,030 | |
| | | | 1,281,417 | | | | 3,666,872 | | | | 485,209 | | | | 5,433,498 | |
| Unamortized Premium(Discount) Amount | | | 15,808 | | | | (11,958 | ) | | | 483 | | | | 4,333 | |
| Total | | $ | 1,297,225 | | | $ | 3,654,914 | | | $ | 485,692 | | | $ | 5,437,831 | |
| (1) | Amounts may differ from current portion of long-term debt as reported on the consolidated balance sheet due to the timing difference of payments and the change in obligation. |
Substantially all utility plant is subject to the liens of NPC’s and SPPC’s indentures under which their respective General and Refunding Mortgage bonds are issued.
Lease Commitments
In 1984, NPC entered into a 30-year capital lease for its Pearson building with five-year renewal options beginning in year 2015. The fixed rental obligation for the first 30 years is $5.1 million per year. Also, NPC has a power purchase contract with Nevada Sun-Peak Limited Partnership. The contract contains a buyout provision for the facility at the end of the contract term in 2016. The facility is situated on NPC property. In 2007, NPC entered into a 20-year lease, with three 10 year renewal options, to occupy land and building for its Beltway Complex, an operations center in southern Nevada. As required by the Leases Topic of the FASC, NPC accounts for the building portion of the lease as a capital lease and the land portion of the lease as an operating lease. NPC transferred operations to the facilities in June 2009. In 2007, the Utilities entered into Master leasing agreements of which various pieces of equipment qualify as capital leases. The remaining equipment is treated as operating leases. The lease term is for 7 years.
Future cash payments for these capital leases, combined, as of December 31, 2009, were as follows (dollars in thousands):
| 2010 | $ 12,466 |
| 2011 | 9,630 |
| 2012 | 9,493 |
| 2013 | 9,510 |
| 2014 | 5,723 |
| Thereafter | 26,945 |
| Total Minimum Lease Payments | $ 73,767 |
| | |
| Less amounts representing interest | $ 26,716 |
| | |
| Present Value of Net minimum lease payments | $ 47,051 |
Financing Transactions
NPC
Redemption of Clark County, Nevada Industrial Development Revenue Bonds, Series 1997A
In November 2009, NPC provided a notice of redemption to the holders of all of the approximately $52.3 million aggregate principal amount of Clark County, Nevada Industrial Development Revenue Bonds, Series 1997A. The notes were redeemed in December 2009, at 100% of the stated principal amount plus accrued interest to the date of redemption. NPC redeemed these notes with the use of its revolving credit facility.
Maturity of Clark County Nevada Pollution Control Revenue Bonds, Series 2000B
In October 2009 the Clark County Nevada Pollution Control Revenue Bonds, Series 2000B, in the aggregate principal amount of $15 million, matured. In July 2008, these securities were converted from auction rate securities to variable rate demand notes. NPC purchased 100% of the bonds at that time, and remained the sole holder of these bonds until the maturity date. NPC financed the maturity with available cash.
General and Refunding Mortgage Notes, Series V
In March 2009, NPC issued and sold $500 million of its 7.125% General and Refunding Mortgage Notes, Series V due 2019. The net proceeds of the issuance were used to repay approximately $404 million of amounts outstanding under NPC’s approximate $589 million revolving credit facility, and for general corporate purposes.
General and Refunding Mortgage Notes, Series U
In January 2009, NPC issued and sold $125 million of its 7.375% General and Refunding Mortgage Notes, Series U due 2014. The net proceeds of the issuance were used to repay approximately $124 million of amounts outstanding under NPC’s revolving credit facility.
General and Refunding Mortgage Notes, Series S
In July 2008, NPC issued and sold $500 million of its 6.5% General and Refunding Mortgage Notes, Series S, due 2018. The net proceeds of the issuance were used to repay $270 million of amounts outstanding under NPC’s revolving credit facility and for general corporate purposes.
In August 2008, NPC redeemed approximately $17.2 million 9.00% General and Refunding Mortgage Notes, Series G, at 104.50% of the stated principal amount, plus accrued interest to the date of redemption. NPC used available cash on hand to redeem these notes.
Conversion of Coconino County Pollution Control Refunding Revenue Bonds and Clark County Pollution Control Revenue Bonds
In July 2008, NPC converted the $13 million principal amount Coconino County, Arizona Pollution Control Refunding Revenue Bonds Series 2006B bonds, due 2039 and the $15 million principal amount Clark County Nevada Pollution Control Revenue Bonds, Series 2000B due 2009, (collectively, the “Bonds”) from auction rate securities to variable rate demand notes. The purpose of these conversions was to reduce interest costs and volatility associated with these Bonds. NPC purchased 100% of the Bonds with the use of its revolving credit facility and available cash, and is the sole holder of the Bonds until such time as NPC determines to reoffer the Pollution Control Bonds to investors. The Bonds remain outstanding and have not been retired or cancelled. However, as NPC is the sole holder of the Bonds, for financial reporting purposes the investment in the Bonds and the indebtedness is offset for presentation purposes.
Revolving Credit Facilities
In April 2006, NPC increased the size of its revolving credit facility from $350 million to $600 million. The facility provides additional liquidity for increased commodity prices and temporary bridge financing of capital expenditures. In March 2009, NPC amended its $600 million Second Amended and Restated Revolving Credit Agreement, which matures in November 2010, to remove a bankrupt lending bank from the facility. This amendment reduced the capacity of the facility to approximately $589 million. In January 2009, NPC entered into a new $90 million supplemental revolving credit facility. The supplemental facility expired on January 3, 2010. Currently, NPC is assessing its options with respect to replacing its expired and expiring credit facilities.
As of December 31, 2009, NPC had $15.8 million of letters of credit outstanding and had $110 million in borrowings outstanding under the $600 million revolving credit facility, which expires in November 2010. As of February 19, 2010, NPC had $14.8 million of letters of credit outstanding and had $145 million borrowed under the $600 million revolving credit facility.
The NPC Credit Agreements contain two financial maintenance covenants. The first requires that NPC maintain a ratio of consolidated indebtedness to consolidated capital, determined as of the last day of each fiscal quarter, not to exceed 0.68 to 1. The second requires that NPC maintain a ratio of consolidated cash flow to consolidated interest expense, determined as of the last day of each fiscal quarter for the period of four consecutive fiscal quarters, not to be less than 2.0 to 1. As of December 31, 2009, NPC was in compliance with these covenants.
The NPC Credit Agreement provides for an event of default if there is a failure under NPC’s other financing agreements to meet certain payment terms or to observe other covenants that would result in an acceleration of payments due.
The NPC Credit Agreement places certain restrictions on debt incurrence, liens and dividends. These restrictions are discussed in Note 8, Debt Covenant and Other Restrictions.
Sierra Pacific Power Company
Tender Offer for General and Refunding Mortgage Notes, Series P
In November 2009, SPPC provided notice of a cash tender offer to purchase up to $75 million aggregate principal amount of its 6.75% General and Refunding Mortgage Notes, Series P, due 2037. Those holders who tendered their Bonds by the early tender date of December 7, 2009 received a purchase price of $1,102.15 per $1,000 principal amount of Notes. Holders who validly tendered their Notes after the early tender date but before the tender expiration date of December 21, 2009 received a purchase price of $1,062.15 per $1,000 principal amount of Notes. In addition, holders received accrued and unpaid interest to, but not including the date of purchase. Approximately $73.3 million of the $325 million Series P Notes outstanding were validly tendered and accepted by SPPC. The tender offer was funded predominantly with cash on hand, with the balance being funded with borrowings under its revolving credit facility.
General and Refunding Mortgage Notes, Series M
On August 21, 2009, SPPC issued an additional $150 million in aggregate principal amount of its 6% General and Refunding Mortgage Notes, Series M, as part of the same series as the original Series M Notes issued in March 2006. Upon the issuance of these Notes, the aggregate principal amount of the Series M Notes outstanding is $450 million. The proceeds from the second issuance were used to repay amounts outstanding under SPPC’s revolving credit facility.
General and Refunding Mortgage Notes, Series Q
In September 2008, SPPC issued and sold $250 million of its 5.45% General and Refunding Mortgage Notes, Series Q, due 2013. The net proceeds of the issuance were used to repay $238 million of amounts outstanding under SPPC’s revolving credit facility and for general corporate purposes.
Conversions
Conversion of Washoe County Water Facilities Refunding Revenue Bonds
In January 2009, SPPC converted the $40 million principal amount, Washoe County, Nevada Water Facilities Refunding Revenue Bonds Series 2007A bonds, due 2036 (the “Water Bonds”) from auction rate securities to variable rate demand notes. The purpose of the conversion was to reduce interest costs and volatility associated with these bonds. SPPC purchased 100% of the Water Bonds on that date, with the use of its revolving credit facility and available cash, and will remain the sole holder of the Water Bonds until such time as SPPC determines to reoffer the Water Bonds to investors. These Water Bonds remain outstanding and have not been retired or cancelled. However, as SPPC is the sole holder of the Water Bonds, for financial reporting purposes the investment in the Water Bonds and the indebtedness is offset for presentation purposes.
Conversion of Humboldt County Pollution Control Refunding Revenue Bonds Series 2006
In October 2008, SPPC converted the $49.8 million principal amount, Humboldt County, Nevada Pollution Control Refunding Revenue Bonds Series 2006 bonds, due 2029 (the “Pollution Control Bonds”) from auction rate securities to variable rate demand notes. The purpose of the conversion was to reduce interest costs and volatility associated with these bonds. SPPC purchased 100% of the Pollution Control Bonds on that date, with the use of its revolving credit facility and available cash, and are the sole holder of the Pollution Control Bonds until such time as SPPC determines to reoffer the Pollution Control Bonds to investors. The Pollution Control Bonds remain outstanding and have not been retired or cancelled. However, as SPPC is the sole holder of the Pollution Control Bonds, for financial reporting purposes the investment in the Pollution Control Bonds and the indebtedness is offset for presentation purposes.
Conversion of Washoe County Water Facilities Refunding Revenue Bonds
In July 2008, SPPC converted the $40 million principal amount, Washoe County, Nevada Water Facilities Refunding Revenue Bonds Series 2007B bonds, due 2036 (the “Water Bonds”) from auction rate securities to variable rate demand notes. The purpose of the conversion was to reduce interest costs and volatility associated with these bonds. SPPC purchased 100% of the Water Bonds on that date, with the use of its revolving credit facility and available cash, and will remain the sole holder of the Water Bonds until such time as SPPC determines to reoffer the Water Bonds to investors. These Water Bonds remain outstanding and have not been retired or cancelled. However, as SPPC is the sole holder of the Water Bonds, for financial reporting purposes the investment in the Water Bonds and the indebtedness is offset for presentation purposes.
Revolving Credit Facility
In April 2006, SPPC increased the size of its revolving credit facility from $250 million to $350 million. The facility provides additional liquidity for increased commodity prices and temporary bridge financing of capital expenditures. On March 2, 2009, SPPC amended its $350 million Amended and Restated Revolving Credit Agreement, due November 2010, to remove a bankrupt lending bank from the facility. This amendment reduced the capacity of the facility to approximately $332 million. SPPC’s credit facility expires in November 2010. Currently, SPPC is assessing its options with respect to replacing its expiring credit facility.
As of December 31, 2009, SPPC had $15.6 million of letters of credit outstanding and had $15 million borrowed under the revolving credit facility. As of February 19, 2010, SPPC had $16.2 million of letters of credit and had $25 million borrowed under the revolving credit facility.
The SPPC Credit Agreement contains two financial maintenance covenants. The first requires that SPPC maintain a ratio of consolidated indebtedness to consolidated capital, determined as of the last day of each fiscal quarter, not to exceed 0.68 to 1. The second requires that SPPC maintain a ratio of consolidated cash flow to consolidated interest expense, determined as of the last day of each fiscal quarter for the period of four consecutive fiscal quarters, not to be less than 2.0 to 1. As of December 31, 2009, SPPC was in compliance with these covenants.
The SPPC Credit Agreement provides for an event of default if there is a failure under SPPC’s other financing agreements to meet certain payment terms or to observe other covenants that would result in an acceleration of payments due.
The SPPC Credit Agreement, similar to SPPC's Series H Notes, places certain restrictions on debt incurrence, liens and dividends. These limitations are discussed in Note 8, Debt Covenant and Other Restrictions.
NVE
Debt Repurchase
In the fourth quarter of 2008, NVE repurchased approximately $20 million of the 8.625% Senior Notes and approximately $19 million of the 6.75% Senior Notes. NVE used cash on hand to pay the total consideration of approximately $34.7 million, including accrued interest. As of December 31, 2009, the outstanding balances for the 6.75% Senior Notes and 8.625% Senior Notes were $191.5 million and $230 million, respectively.
The December 31, 2009, carrying amount of cash and cash equivalents, current assets, accounts receivable, accounts payable and current liabilities approximates fair value due to the short-term nature of these instruments.
The total fair value of NVE’s consolidated long-term debt at December 31, 2009, is estimated to be $5.6 billion (excluding current portion) based on quoted market prices for the same or similar issues or on the current rates offered to NVE for debt of the same remaining maturities. The total fair value (excluding current portion) was estimated to be $4.9 billion as of December 31, 2008.
The total fair value of NPC’s consolidated long-term debt at December 31, 2009, is estimated to be $3.7 billion (excluding current portion) based on quoted market prices for the same or similar issues or on the current rates offered to NPC for debt of the same remaining maturities. The total fair value (excluding current portion) was estimated to be $3.1 billion at December 31, 2008.
The total fair value of SPPC’s consolidated long-term debt at December 31, 2009, is estimated to be $1.3 billion (excluding current portion) based on quoted market prices for the same or similar issues or on the current rates offered to SPPC for debt of the same remaining maturities. The total fair value (excluding current portion) was estimated to be $1.3 billion as of December 31, 2008.
Dividends from Subsidiaries
Since NVE is a holding company, substantially all of its cash flow is provided by dividends paid to NVE by NPC and SPPC on their common stock, all of which is owned by NVE. In 2009, NPC and SPPC paid $112 million and $128.8 million in dividends, respectively, to NVE.
On February 2, 2010, NPC and SPPC declared a $27 million and $13 million dividend, respectively, to NVE, to be paid in February 2010.
Since NPC and SPPC are public utilities, they are subject to regulation by state utility commissions, which impose limits on investment returns or otherwise may impact the amount of dividends that the Utilities may declare and pay.
Certain debt agreements entered into by NVE and the Utilities contain covenants which set restrictions on certain payments, including the amount of dividends they may declare and pay, and restrict the circumstances under which such dividends may be declared and paid.
Limits on Restricted Payments
NVE
Dividends are considered periodically by NVE’s BOD and are subject to factors that ordinarily affect dividend policy, such as current and prospective earnings, current and prospective business conditions, regulatory factors, NVE’s financial conditions and other matters within the discretion of the BOD, as well as dividend restrictions set forth in NVE’s debt. The BOD will continue to review the factors described above on a periodic basis to determine if and when it is prudent to declare a dividend on NVE’s Common Stock. There is no guarantee that dividends will be paid in the future, or that, if paid, the dividends will be paid at the same amount or with the same frequency as in the past. In February, June and September 2009, NVE paid a cash dividend of $0.10 per share. In October 2009, the BOD increased the cash dividend to $0.11 per share, which was paid in December 2009. In February 2010, NVE declared a cash dividend of $0.11 per share for common stock holders of record as of March 2, 2010.
Certain NVE debt agreements contain covenants that limit the amount of restricted payments, including dividends that may be made by NVE. However, as of December 31, 2009, NVE complied with all such covenants, and management does not believe that these covenants will materially affect NVE’s ability to pay dividends.
Dividend Restrictions Applicable to the Utilities
Since NVE is a holding company, substantially all of its cash flow is provided by dividends paid to NVE by NPC and SPPC on their common stock, all of which is owned by NVE. Since NPC and SPPC are public utilities, they are subject to regulation by state utility commissions, which impose limits on investment returns or otherwise impact the amount of dividends that the Utilities may declare and pay.
In addition, certain agreements entered into by the Utilities set restrictions on the amount of dividends they may declare and pay and restrict the circumstances under which such dividends may be declared and paid. As a result of the Utilities’ credit rating on their senior secured debt at investment grade by S&P and Moody’s, these restrictions are suspended and no longer in effect so long as the debt remains investment grade by both rating agencies. In addition to the restrictions imposed by specific agreements, the Federal Power Act prohibits the payment of dividends from “capital accounts.” Although the meaning of this provision is unclear, the Utilities believe that the Federal Power Act restriction, as applied to their particular circumstances, would not be construed or applied by the FERC to prohibit the payment of dividends for lawful and legitimate business purposes from current year earnings, or in the absence of current year earnings, from other/additional paid-in capital accounts. If, however, the FERC were to interpret this provision differently, the ability of the Utilities to pay dividends to NVE could be jeopardized.
Ability to Issue Debt
NVE
Certain debt of NVE (holding company) places restrictions on debt incurrence, liens and dividends, unless, at the time the debt is incurred, the ratio of cash flow to fixed charges for NVE’s (consolidated) most recently ended four quarter period on a pro forma basis is at least 2 to 1. Under this covenant restriction, as of December 31, 2009, NVE (consolidated) would be allowed to incur up to $1.2 billion of additional consolidated indebtedness, assuming an interest rate of 7%. The amount of additional consolidated indebtedness allowed would likely be impacted if there is a change in current market conditions or material change in our financial condition.
Notwithstanding this restriction, under the terms of the debt, NPC and SPPC would still be permitted to incur a combined total of up to $500 million in indebtedness and letters of credit under their respective revolving credit facilities. As of December 31, 2009, the combined total outstanding indebtedness and letters of credit under their respective revolving credit facilities was approximately $156.4 million.
If the applicable series of debt is upgraded to investment grade by both Moody’s and S&P, these restrictions will be suspended and will no longer be in effect so long as the applicable series of Notes remain investment grade by both Moody’s and S&P.
NPC
Ability to Issue Debt
NPC’s ability to issue debt is impacted by certain factors such as financing authority from the PUCN, financial covenants in its financing agreements and revolving credit facility agreements, and the terms of certain NVE debt. As of December 31, 2009, the most restrictive of the factors below is the PUCN authority. As such, NPC may issue up to $750 million in long term debt, in addition to the use of its existing credit facilities. However, depending on NVE’s or SPPC’s issuance of long term debt or the use of the Utilities’ revolving credit facilities the PUCN authority may not remain the most restrictive factor. The factors affecting NPC’s ability to issue debt are further detailed below:
| a. | Financing authority from the PUCN - As of December 31, 2009, NPC has remaining financing authority from the PUCN to issue (1) long term debt of up to $750 million for the period ending December 31, 2010, (2) ongoing authority to maintain a revolving credit facility of up to $1.3 billion, and (3) authority to refinance up to approximately $471 million of long-term debt securities. |
| | |
| b. | Financial covenants within NPC’s financing agreements – NPC’s $589 million Second Amended and Restated Revolving Credit Agreement dated November 2005 contains two financial maintenance covenants. The first requires NPC to maintain a ratio of consolidated indebtedness to consolidated capital, determined as of the last day of each fiscal quarter, not to exceed 0.68 to 1. The second requires NPC to maintain a ratio of consolidated cash flow to consolidated interest expense, determined as of the last day of each fiscal quarter for the period of four consecutive fiscal quarters, not to be less that 2.0 to 1. As of December 31, 2009, NPC was in compliance with these covenants. In order to maintain compliance with these covenants, NPC is limited to $2.0 billion of additional indebtedness. |
| | |
| | All other financial covenants contained in NPC’s revolving credit facility and its financing agreements are suspended, as NPC’s senior secured debt is rated investment grade. However, if NPC’s senior secured debt ratings fall below investment grade by either Moody’s or S&P, NPC would again be subject to the limitations under these additional covenants; and |
| | |
| c. | Financial covenants within NVE’s financing agreements – As discussed in NVE’s Ability to Issue Debt, NPC is also subject to NVE’s cap on additional consolidated indebtedness of $1.2 billion. |
Ability to Issue General and Refunding Mortgage Securities
To the extent that NPC has the ability to issue debt under the most restrictive covenants in its financing agreements and has financing authority to do so from the PUCN, NPC’s ability to issue secured debt is still limited by the amount of bondable property or retired bonds that can be used to issue debt under NPC’s General and Refunding Mortgage Indenture (“Indenture”).
The Indenture creates a lien on substantially all of NPC’s properties in Nevada. As of December 31, 2009, approximately $4.0 billion of NPC’s General and Refunding Mortgage Securities were outstanding. NPC had the capacity to issue $718.7 million of General and Refunding Mortgage Securities as of December 31, 2009. That amount is determined on the basis of:
| 1. | 70% of net utility property additions; |
| 2. | The principal amount of retired General and Refunding Mortgage Securities; and/or |
| 3. | The principal amount of first mortgage bonds retired after October 2001. |
Property additions include plant in service and specific assets in CWIP. The amount of bond capacity listed above does not include eligible property in CWIP.
NPC also has the ability to release property from the lien of the mortgage indenture on the basis of net property additions, cash and/or retired bonds. To the extent NPC releases property from the lien of its General and Refunding Mortgage Indenture, it will reduce the amount of securities issuable under the indenture.
SPPC
Ability to Issue Debt
SPPC’s ability to issue debt is impacted by certain factors such as financing authority from the PUCN, financial covenants in its financing agreements and its revolving credit facility agreement, and the terms of certain NVE debt. As of December 31, 2009, the most restrictive of the factors below is the PUCN authority. Based on this restriction, SPPC may issue up to $350 million of long-term debt securities, and maintain a credit facility of up to $600 million. However, depending on NVE’s or NPC’s issuance of long-
term debt or the use of Utilities’ revolving credit facilities, the PUCN authority may not remain the most restrictive factor. The factors affecting SPPC’s ability to issue debt are further detailed below.
| a. | Financing authority from the PUCN - As of December 31, 2009, SPPC has remaining financing authority from the PUCN to issue (1) long term debt of up to $350 million for the three-year period ending December 31, 2012, (2) ongoing authority to maintain a revolving credit facility of up to $600 million, and (3) authority to refinance approximately $348 million of long-term debt securities. |
| | |
| b. | Financial covenants within SPPC’s financing agreements – SPPC’s $332 million Amended and Restated Revolving Credit Agreement dated November 2005 contains two financial maintenance covenants. The first requires SPPC to maintain a ratio of consolidated indebtedness to consolidated capital, determined as of the last day of each fiscal quarter, not to exceed 0.68 to 1. The second requires SPPC to maintain a ratio of consolidated cash flow to consolidated interest expense, determined as of the last day of each fiscal quarter for the period of four consecutive fiscal quarters, not to be less that 2.0 to 1. As of December 31, 2009, SPPC was in compliance with these covenants. In order to maintain compliance with these covenants, SPPC is limited to $832 million of additional indebtedness. |
| | |
| | All other financial covenants contained in SPPC’s revolving credit facility and its financing agreements are suspended, as SPPC’s senior secured debt is rated investment grade. However, if SPPC’s senior secured debt ratings fall below investment grade by either Moody’s or S&P, SPPC would again be subject to the limitations under these additional covenants; and |
| | |
| c. | Financial covenants within NVE’s financing agreements – As discussed in NVE’s Ability to Issue Debt, SPPC is also subject to NVE’s cap on additional consolidated indebtedness of $1.2 billion. |
Ability to Issue General and Refunding Mortgage Securities
To the extent that SPPC has the ability to issue debt under the most restrictive covenants in its financing agreements and has financing authority to do so from the PUCN, SPPC’s ability to issue secured debt is still limited by the amount of bondable property or retired bonds that can be used to issue debt under SPPC’s General and Refunding Mortgage Indenture (“Indenture”).
The Indenture creates a lien on substantially all of SPPC’s properties in Nevada. As of December 31, 2009, approximately $1.7 billion of SPPC’s General and Refunding Mortgage Securities were outstanding. SPPC had the capacity to issue $572.0 million of General and Refunding Mortgage Securities as of December 31, 2009. That amount is determined on the basis of:
| 1. | 70% of net utility property additions; |
| 2. | the principal amount of retired General and Refunding Mortgage Securities; and/or |
| 3. | the principal amount of first mortgage bonds retired after October 2001. |
Property additions include plant in service and specific assets in CWIP. The amount of bond capacity listed above does not include eligible property in CWIP.
SPPC also has the ability to release property from the lien of the mortgage indenture on the basis of net property additions, cash and/or retired bonds. To the extent SPPC releases property from the lien of its General and Refunding Mortgage Indenture, it will reduce the amount of securities issuable under the indenture.
NVE, SPPC and NPC apply the accounting guidance as required by the Derivatives and Hedging Topic of the FASC. The accounting guidance for derivative instruments including certain derivative instruments embedded in other contracts and for hedging activities, requires that an entity recognize all derivatives as either assets or liabilities in the statement of financial position, measure those instruments at fair value, and recognize changes in the fair value of the derivative instruments in earnings in the period of change, unless the derivative meets certain defined conditions and qualifies as an effective hedge. The accounting guidance for derivative instruments also provides a scope exception for contracts that meet the normal purchase and sales criteria specified in the standard. The normal purchases and normal sales exception requires, among other things, physical delivery in quantities expected to be used or sold over a reasonable period in the normal course of business. Contracts that are designated as normal purchase and normal sales are not recorded on the Consolidated Balance Sheets at fair value.
Commodity Risk
The energy supply function encompasses the reliable and efficient operation of the Utilities’ generation, the procurement of all fuels and power and resource optimization (i.e., physical and economic dispatch) and is exposed to risks relating to, but not limited to, changes in commodity prices. NVE and the Utilities’ objective in using derivative instruments is to reduce exposure to energy
price risk. Energy price risks result from activities that include the generation, procurement and sale of power and the procurement and sale of natural gas. Derivative instruments used to manage energy price risk from time to time may include: forward contracts, which involve physical delivery of an energy commodity; over-the-counter options with financial institutions and other energy companies, which mitigate price risk by providing the right, but not the requirement, to buy or sell energy related commodities at a fixed price; and swaps, which require the Utilities’ to receive or make payments based on the difference between a specified price and the actual price of the underlying commodity. These contracts assist the Utilities’ to reduce the risks associated with volatile electricity and natural gas markets.
Interest Rate Risk
In August 2009, NPC entered into two interest rate swap agreements which terminate in 2011, for an aggregated notional amount of $350 million associated with its $350 million 8.25% General and Refunding Mortgage Notes, Series A, due 2011. These interest rate swaps manage the existing fixed rate interest rate exposure with a variable interest rate in order to lower overall borrowing costs. As NPC met the requirements of the Regulated Operations Topic of the FASC, as of December 31, 2009, the fair value of the interest rate swaps were recorded as a Risk Management Asset with the corresponding offset recorded as a Risk Management Regulatory Liability and are included in the fair value table below.
Credit Risk Contingent Features
The Utilities enter into certain hedging contracts with various counterparties to manage the gas price risk inherent in purchased power and fuel contracts. The contracts require that the Utilities maintain their Moody’s and S&P Senior Unsecured or equivalent ratings in place at the time the contracts were entered into. In the event that the Utilities Senior Unsecured debt rating is downgraded by two out of the three rating agencies, the counterparties have the right to require the Utilities to post cash or a letter of credit to the extent the counterparties have mark-to-market exposure to the Utilities, subject to certain caps. As of December 31, 2009, the maximum amount of collateral NPC and SPPC would be required to post under these agreements is approximately $39.4 million and $28.8 million, respectively, based on mark-to-market liability values, which are substantially based on quoted market prices. Of this amount, approximately $30.1 million and $23.2 million, respectively, would be required if NPC and SPPC are downgraded one level and additional amounts of approximately $9.3 million and $5.6 million would be required respectively if NPC and SPPC are downgraded two levels.
Determination of Fair Value
As required by the Fair Value Measurements and Disclosure Topic of the FASC, financial assets and liabilities are classified in their entirety based on the lowest level of input that is significant to the fair value measurement. Risk management assets and liabilities in the recurring fair value measures table below include over-the-counter forwards, swaps, options, and interest rate swaps. Total risk management assets below do not include option premiums which are not considered a derivative asset. Option premiums upon settlement are recorded in fuel and purchased power expense and are subsequently requested for recovery through the deferred energy mechanism. Option premium amounts included in risk management assets for NVE, NPC and SPPC were as follows (dollars in millions):
| | | December 31, 2009 | | | December 31, 2008 | |
| | | NVE | | | NPC | | | SPPC | | | NVE | | | NPC | | | SPPC | |
| Current | | $ | 11.9 | | | $ | 9.2 | | | $ | 2.7 | | | $ | 13.3 | | | $ | 9.7 | | | $ | 3.6 | |
| Non-Current | | | 1.9 | | | | 1.4 | | | | 0.5 | | | | 5.6 | | | | 4.2 | | | | 1.4 | |
| Total | | $ | 13.8 | | | $ | 10.6 | | | $ | 3.2 | | | $ | 18.9 | | | $ | 13.9 | | | $ | 5.0 | |
Forwards and swaps are valued using a market approach that uses quoted forward commodity prices for similar assets and liabilities, which incorporates a mid-market pricing convention (the mid-point price between bid and ask prices) as a practical expedient for valuing its assets and liabilities measured and reported at fair value. Options are valued based on an income approach using an option pricing model that includes various inputs; such as forward commodity prices, interest rate yield curves and option volatility rates. Interest rate swaps are valued using a financial model which utilizes observable inputs for similar instruments based primarily on market price curves. The determination of the fair value for derivative instruments not only includes counterparty risk, but also the impact of NVE and the Utilities nonperformance risk on their liabilities. Nonperformance risk is based on the credit quality of NVE and the Utilities and had an immaterial impact to the fair value of their derivative instruments.
The following table shows the fair value of the open derivative positions recorded on the consolidated balance sheets of NVE, NPC and SPPC and the related regulatory assets and/or liabilities that did not meet the normal purchase and normal sales exception criteria as required by the Derivatives and Hedging Topic of the FASC. Due to regulatory accounting treatment under which the Utilities’ operate, regulatory assets and liabilities are established to the extent that derivative gains and losses are recoverable or payable through future rates, once realized. This accounting treatment is intended to defer the recognition of mark-to-market gains and losses on derivative transactions until the period of settlement (dollars in millions):
| | | December 31, 2009 | | | December 31, 2008 | |
| Derivative Contracts | | Level 2 | | | Level 2 | |
| | | NVE | | | NPC | | | SPPC | | | NVE | | | NPC | | | SPPC | |
| | | | | | | | | | | | | | | | | | | |
| Risk management assets- current | | $ | 15.7 | | | $ | 12.7 | | | $ | 3.0 | | | $ | 2.8 | | | $ | 2.0 | | | $ | 0.8 | |
Risk management assets- noncurrent(1) | | | 4.8 | | | | 4.2 | | | | 0.6 | | | | 4.4 | | | | 3.2 | | | | 1.2 | |
| Total risk management assets | | | 20.5 | | | | 16.9 | | | | 3.6 | | | | 7.2 | | | | 5.2 | | | | 2.0 | |
| | | | | | | | | | | | | | | | | | | | | | | | | |
| Risk management liabilities- current | | | 66.9 | | | | 39.1 | | | | 27.8 | | | | 313.8 | | | | 222.9 | | | | 90.9 | |
| Risk management liabilities- noncurrent | | | 2.2 | | | | 1.1 | | | | 1.1 | | | | 53.4 | | | | 35.2 | | | | 18.2 | |
| Total risk management liabilities | | | 69.1 | | | | 40.2 | | | | 28.9 | | | | 367.2 | | | | 258.1 | | | | 109.1 | |
| | | | | | | | | | | | | | | | | | | | | | | | | |
Risk management regulatory assets/liabilities – net (2) | | $ | (48.6 | ) | | $ | (23.3 | ) | | $ | (25.3 | ) | | $ | (360.0 | ) | | $ | (252.9 | ) | | $ | (107.1 | ) |
| (1) | Included in Risk management assets – noncurrent is a $2.6 million cumulative gain for interest rate swaps with the offset recorded in the Risk management regulatory assets/liabilities amounts above. |
| (2) | When amount is negative it represents a Risk Management Regulatory Asset, when positive it represents a Risk Management Regulatory Liability. For the year ended December 31, 2009, NVE and the Utilities would have recorded a gain of $311.4 million, $229.6 million, and $81.8 million, respectively; however, as permitted by the Regulated Operations Topic of the FASB Accounting Standards Codification, NVE and the Utilities deferred these gains and losses, which are included in the Risk Management Regulatory Assets/Liabilities amounts above. |
As a result of the nature of operations and the use of mark-to-market accounting for certain derivatives that do not meet the normal purchase and normal sales exception criteria, mark-to-market fair values will fluctuate. The Utilities’ cannot predict these fluctuations, but the primary factors that cause changes in the fair values are the number and size of the Utilities’ open derivative positions with their counterparties and the changes in market prices. The decrease in risk management liabilities as of December 31, 2009, as compared to December 31, 2008, is primarily due to contract settlements and reduced hedging volume during the year ended December 31, 2009.
The following table shows the commodity volume for our open derivative contracts related to natural gas contracts (amounts in millions):
| | | December 31, 2009 | | | December 31, 2008 | |
| | | Commodity Volume (MMBTU) | | | Commodity Volume (MMBTU) | |
| | | NVE | | | NPC | | | SPPC | | | NVE | | | NPC | | | SPPC | |
| | | | | | | | | | | | | | | | | | | |
| Commodity volume assets- current | | | 47.1 | | | | 40.7 | | | | 6.4 | | | | 1.2 | | | | 1.0 | | | | 0.2 | |
| Commodity volume assets- noncurrent | | | 10.3 | | | | 7.6 | | | | 2.7 | | | | 1.1 | | | | 1.0 | | | | 0.1 | |
| Total commodity volume of assets | | | 57.4 | | | | 48.3 | | | | 9.1 | | | | 2.3 | | | | 2.0 | | | | 0.3 | |
| | | | | | | | | | | | | | | | | | | | | | | | | |
| Commodity volume liabilities- current | | | 51.7 | | | | 32.7 | | | | 19.0 | | | | 119.9 | | | | 86.7 | | | | 33.2 | |
| Commodity volume liabilities- noncurrent | | | 7.8 | | | | 5.3 | | | | 2.5 | | | | 40.6 | | | | 28.6 | | | | 12.0 | |
| Total commodity volume of liabilities | | | 59.5 | | | | 38.0 | | | | 21.5 | | | | 160.5 | | | | 115.3 | | | | 45.2 | |
NVE
The following reflects the composition of taxes on income from continuing operations (dollars in thousands):
| | | 2009 | | | 2008 | | | 2007 | |
| Provisions for income taxes | | | | | | | | | |
| Current and other | | | | | | | | | |
| Federal | | $ | (34,072 | ) | | $ | 44,647 | | | $ | 10,503 | |
| State | | | 12 | | | | 12 | | | | 70 | |
| Total current and other | | | (34,060 | ) | | | 44,659 | | | | 10,573 | |
| | | | | | | | | | | | | |
| Deferred | | | | | | | | | | | | |
| Federal | | | 114,053 | | | | 54,341 | | | | 85,165 | |
| State | | | 548 | | | | 693 | | | | 366 | |
| Total deferred | | | 114,601 | | | | 55,034 | | | | 85,531 | |
| | | | | | | | | | | | | |
| Amortization of excess deferred taxes | | | (1,709 | ) | | | (1,365 | ) | | | (2,226 | ) |
| | | | | | | | | | | | | |
| Amortization of investment tax credits | | | (3,381 | ) | | | (2,974 | ) | | | (6,323 | ) |
| | | | | | | | | | | | | |
| Total provision for income taxes | | $ | 75,451 | | | $ | 95,354 | | | $ | 87,555 | |
| | | | | | | | | | | | | |
The total income tax provision differs from amounts computed by applying the federal statutory tax rate to income before income taxes for the following reasons (dollars in thousands):
| | | 2009 | | | 2008 | | | 2007 | |
| | | | | | | | | | |
| Net Income | | $ | 182,936 | | | $ | 208,887 | | | $ | 197,295 | |
| Total income tax expense | | | 75,451 | | | | 95,354 | | | | 87,555 | |
| Pretax income | | | 258,387 | | | | 304,241 | | | | 284,850 | |
| Statutory tax rate | | | 35 | % | | | 35 | % | | | 35 | % |
| Federal income tax expense at statutory rate | | | 90,435 | | | | 106,484 | | | | 99,698 | |
| Depreciation related to difference in cost basis for tax purposes | | | (2,067 | ) | | | 1,132 | | | | 2,970 | |
| AFUDC - equity | | | (8,496 | ) | | | (13,454 | ) | | | (11,133 | ) |
| Investment tax credit amortization | | | (3,381 | ) | | | (2,973 | ) | | | (6,322 | ) |
| Regulatory asset for goodwill | | | 2,742 | | | | 2,742 | | | | 2,742 | |
| Research and development credit | | | (1,120 | ) | | | (1,310 | ) | | | (1,130 | ) |
| Other – net | | | (2,662 | ) | | | 2,733 | | | | 730 | |
| Provision for income taxes | | $ | 75,451 | | | $ | 95,354 | | | $ | 87,555 | |
| | | | | | | | | | | | | |
| Effective tax rate | | | 29.2 | % | | | 31.3 | % | | | 30.7 | % |
The net deferred income tax liability consists of deferred income tax liabilities less related deferred income tax assets, as shown (dollars in thousands):
| | | 2009 | | | 2008 | |
| Deferred income tax assets | | | | | | |
| Net operating loss and credit carryovers | | $ | 208,118 | | | $ | 34,839 | |
| Employee benefit plans | | | 66,292 | | | | 107,622 | |
| Customer advances | | | 27,921 | | | | 30,851 | |
| Gross-ups received on contribution in aid of construction and customer advances | | | 28,119 | | | | 30,870 | |
| Deferred revenues | | | 5,336 | | | | 5,440 | |
| Deferred energy | | | 18,060 | | | | - | |
| Reserves | | | 14,376 | | | | 15,419 | |
| Other | | | 33,198 | | | | 30,473 | |
| Subtotal | | | 401,420 | | | | 255,514 | |
| Deferred income tax assets associated with regulatory matters | | | | | | | | |
| Excess deferred income taxes | | | 9,812 | | | | 11,521 | |
| Unamortized investment tax credit | | | 12,317 | | | | 13,958 | |
| Subtotal | | | 22,129 | | | | 25,479 | |
| Total deferred income tax assets before valuation allowance | | | 423,549 | | | | 280,993 | |
| Valuation allowance | | | (1,430 | ) | | | (1,160 | ) |
| Total deferred income tax assets after valuation allowance | | $ | 422,119 | | | $ | 279,833 | |
| | | | | | | | | |
| Deferred income tax liabilities | | | | | | | | |
| Excess of tax depreciation over book depreciation | | $ | 881,282 | | | $ | 530,048 | |
| Deferred energy | | | - | | | | 89,182 | |
| Regulatory assets | | | 169,128 | | | | 183,622 | |
| Other | | | 95,294 | | | | 82,687 | |
| Subtotal | | | 1,145,704 | | | | 885,539 | |
| Deferred income tax liabilities associated with regulatory matters | | | | | | | | |
| Tax benefits flowed through to customers | | | 261,633 | | | | 264,779 | |
| Total deferred income tax liability | | $ | 1,407,337 | | | $ | 1,150,318 | |
| | | | | | | | | |
| Net deferred income tax liability | | $ | 745,714 | | | $ | 631,185 | |
| Net deferred income tax liability associated with regulatory matters | | | 239,504 | | | | 239,300 | |
| Total net deferred income tax liability | | $ | 985,218 | | | $ | 870,485 | |
NVE’s balance sheets contain a net regulatory tax asset of $239.5 million at December 31, 2009 and $239.3 million at December 31, 2008. For balance sheet presentation, the regulatory tax asset is included in regulatory assets. The regulatory tax asset balance consists of future revenue to be received from customers due to flow-through of the tax benefits of temporary differences and goodwill recognized from the merger of NPC and NVE. Offset against these amounts are future revenues to be refunded to customers (regulatory tax liabilities). For balance sheet presentation, the regulatory tax liability is included in regulatory liabilities. The regulatory tax liability balance consists of temporary differences for liberalized depreciation at rates in excess of current rates and unamortized investment tax credits. The regulatory liability for temporary differences related to liberalized depreciation will continue to be amortized using the average rate assumption method required by the Tax Reform Act of 1986. The regulatory liability for temporary differences caused by the investment tax credit will be amortized ratably in the same fashion as the accumulated deferred investment tax credit.
The following table summarizes NVE’s net regulatory tax asset and liability (dollars in thousands):
| | | 2009 | | | 2008 | |
| Tax benefits flowed through to customers | | | | | | |
| Related to property | | $ | 117,212 | | | $ | 116,167 | |
| Related to goodwill | | | 144,421 | | | | 148,612 | |
| Regulatory tax asset | | | 261,633 | | | | 264,779 | |
| | | | | | | | | |
| Liberalized depreciation at rates in excess of current rates | | | 9,812 | | | | 11,521 | |
| Unamortized investment tax credits | | | 12,317 | | | | 13,958 | |
| Regulatory tax liability | | | 22,129 | | | | 25,479 | |
| Net regulatory tax asset | | $ | 239,504 | | | $ | 239,300 | |
NVE and its subsidiaries file a consolidated federal income tax return. Current income taxes are allocated based on NVE’s and each subsidiaries’ respective taxable income or loss and tax credits as if each subsidiary filed a separate return.
The following table summarizes as of December 31, 2009 the net operating loss and tax credit carryovers and associated carryover periods, and valuation allowance for amounts which NVE has determined that realization is uncertain (dollars in thousands):
| | | Deferred Tax Asset | | | Valuation Allowance | | | Net Deferred Tax Asset | | | Expiration Period | |
| Net operating loss | | $ | 181,434 | | | $ | - | | | $ | 181,434 | | | | 2022-2029 | |
| Research and development credit | | | 11,241 | | | | - | | | | 11,241 | | | | 2022-2029 | |
| Alternative minimum tax credit | | | 13,865 | | | | - | | | | 13,865 | | | indefinite | |
| Arizona coal credits | | | 1,578 | | | | 1,430 | | | | 148 | | | | 2010-2014 | |
| Total | | $ | 208,118 | | | $ | 1,430 | | | $ | 206,688 | | | | | |
At December 31, 2009, NVE had a gross federal NOL carryover of $518.4 million.
Considering all positive and negative evidence regarding the utilization of NVE’s deferred tax assets, it has been determined that NVE is more-likely-than-not to realize all recorded deferred tax assets, except the Arizona coal credits. As such, these Arizona coal credits represent the only valuation allowance that has been recorded as of December 31, 2009.
Uncertain tax liabilities are all long term and are included in the “other deferred credits and liabilities” line item on the balance sheet. A reconciliation of the beginning and ending amount of unrecognized tax benefits is as follows (dollars in thousands):
| | | 2009 | | | 2008 | |
| | | | | | | |
| Balance at January 1 | | $ | 93,928 | | | $ | 25,016 | |
| Additions based on tax positions related to the current year | | | 3,325 | | | | 8,855 | |
| Additions for tax positions of prior years | | | 11,773 | | | | 65,426 | |
| Reductions for tax positions of prior years | | | (70,797 | ) | | | (5,369 | ) |
| Balance at December 31 | | $ | 38,229 | | | $ | 93,928 | |
In December 2007, NVE and the Utilities filed a Form 3115, Application for Change in Accounting Method (“Application”), with the IRS requesting a change in accounting for deducting repair expenditures. In April 2009, NVE and the Utilities received notice from the IRS approving the Application. Accordingly, during the second quarter of 2009, NVE, NPC and SPPC recorded reductions to their unrecognized tax benefits for the repair positions taken in the prior period of approximately $64.4 million, $32.0 million and $32.2 million, respectively. No additional material changes in the income tax reserves are anticipated in the next twelve months.
NVE and the Utilities classify interest and penalties related to income taxes as interest and other expense, respectively. The total amount of unrecognized tax benefits as of December 31, 2009 and December 31, 2008 is $38.2 million and $93.9 million, respectively, of which $4.5 million and $3.2 million, respectively, would affect the effective tax rate if recognized. No interest or penalties have been accrued as of December 31, 2009 and December 31, 2008. NVE and the Utilities do not expect unrecognized tax benefits to statutorily expire within the next twelve months.
NVE and the Utilities file a consolidated U.S. federal income tax return. The U.S. federal jurisdiction is the only “significant” tax jurisdiction for NVE and the Utilities. As of December 31, 2009, NVE and the Utilities’ tax years 2005 through 2008 are subject to examination. As of December 31, 2009, NVE and the Utilities are no longer subject to examinations by U.S. federal, state, or local tax authorities for years before 2005, with few exceptions.
NPC
The following reflects the composition of taxes on income (dollars in thousands):
| | | 2009 | | | 2008 | | | 2007 | |
| Provisions for income taxes | | | | | | | | | |
| Current and other | | | | | | | | | |
| Federal | | $ | (34,318 | ) | | $ | 27,038 | | | $ | 25,351 | |
| State | | | - | | | | - | | | | - | |
| Total current and other | | | (34,318 | ) | | | 27,038 | | | | 25,351 | |
| | | | | | | | | | | | | |
| Deferred | | | | | | | | | | | | |
| Federal | | | 97,878 | | | | 45,830 | | | | 58,344 | |
| State | | | 256 | | | | 378 | | | | (63 | ) |
| Total deferred | | | 98,134 | | | | 46,208 | | | | 58,281 | |
| | | | | | | | | | | | | |
| Amortization of excess deferred taxes | | | (862 | ) | | | (695 | ) | | | (1,236 | ) |
| | | | | | | | | | | | | |
| Amortization of investment tax credits | | | (1,302 | ) | | | (1,169 | ) | | | (4,044 | ) |
| | | | | | | | | | | | | |
| Total provision for income taxes | | $ | 61,652 | | | $ | 71,382 | | | $ | 78,352 | |
| | | | | | | | | | | | | |
The total income tax provision differs from amounts computed by applying the federal statutory tax rate to income before income taxes for the following reasons (dollars in thousands):
| | | 2009 | | | 2008 | | | 2007 | |
| | | | | | | | | | |
| Net income | | $ | 134,284 | | | $ | 151,431 | | | $ | 165,694 | |
| Total income tax expense | | | 61,652 | | | | 71,382 | | | | 78,352 | |
| Pretax income | | | 195,936 | | | | 222,813 | | | | 244,046 | |
| Statutory tax rate | | | 35 | % | | | 35 | % | | | 35 | % |
| Federal income tax expense at statutory rate | | | 68,578 | | | | 77,985 | | | | 85,416 | |
| Depreciation related to difference in cost basis for tax purposes | | | 1,695 | | | | 1,209 | | | | 1,291 | |
| AFUDC - equity | | | (7,359 | ) | | | (9,071 | ) | | | (5,551 | ) |
| Investment tax credit amortization | | | (1,302 | ) | | | (1,169 | ) | | | (4,044 | ) |
| Regulatory asset for goodwill | | | 1,732 | | | | 1,732 | | | | 1,732 | |
| Research and development credit | | | (959 | ) | | | (1,078 | ) | | | (527 | ) |
| Other - net | | | (733 | ) | | | 1,774 | | | | 35 | |
| Provision for income taxes | | $ | 61,652 | | | $ | 71,382 | | | $ | 78,352 | |
| | | | | | | | | | | | | |
| Effective tax rate | | | 31.5 | % | | | 32.0 | % | | | 32.1 | % |
| | | 2009 | | | 2008 | |
| Deferred income tax assets | | | | | | |
| Net operating loss and credit carryovers | | $ | 115,855 | | | $ | 1,384 | |
| Employee benefit plans | | | 25,176 | | | | 45,127 | |
| Customer advances | | | 14,171 | | | | 16,019 | |
| Gross-ups received on CIAC and customer advances | | | 20,343 | | | | 21,934 | |
| Deferred revenues | | | 4,214 | | | | 3,549 | |
| Reserves | | | 12,144 | | | | 12,670 | |
| Other - net | | | 21,294 | | | | 21,135 | |
| Subtotal | | | 213,197 | | | | 121,818 | |
| Deferred income tax assets associated with regulatory matters | | | | | | | | |
| Excess deferred income taxes | | | 2,466 | | | | 3,328 | |
| Unamortized investment tax credit | | | 4,683 | | | | 5,385 | |
| Subtotal | | | 7,149 | | | | 8,713 | |
| Total deferred income tax assets before valuation allowance | | | 220,346 | | | | 130,531 | |
| Valuation allowance | | | (1,430 | ) | | | (1,160 | ) |
| Total deferred income tax assets after valuation allowance | | $ | 218,916 | | | $ | 129,371 | |
| | | | | | | | | |
| Deferred income tax liabilities | | | | | | | | |
| Excess of tax depreciation over book depreciation | | $ | 572,682 | | | $ | 333,888 | |
| Deferred energy | | | 22,692 | | | | 98,512 | |
| Regulatory assets | | | 115,697 | | | | 97,932 | |
| Other - net | | | 70,974 | | | | 62,374 | |
| Subtotal | | | 782,045 | | | | 592,706 | |
| Deferred income tax liabilities associated with regulatory matters | | | | | | | | |
| Tax benefits flowed through to customers | | | 173,336 | | | | 169,506 | |
| Total deferred income tax liability | | $ | 955,381 | | | $ | 762,212 | |
| | | | | | | | | |
| Net deferred income tax liability | | | 570,278 | | | $ | 472,048 | |
| Net deferred income tax liability associated with regulatory matters | | | 166,187 | | | | 160,793 | |
| Total net deferred income tax liability | | $ | 736,465 | | | $ | 632,841 | |
NPC’s balance sheet contains a net regulatory asset of $166.2 million at December 31, 2009 and $160.8 million at December 31, 2008. For balance sheet presentation, the regulatory tax asset is included in regulatory assets. The regulatory tax asset balance consists of future revenue to be received from customers due to flow-through of the tax benefits of temporary differences and goodwill recognized from the merger of NPC and NVE. Offset against these amounts are future revenues to be refunded to customers (regulatory tax liabilities). For balance sheet presentation, the regulatory tax liability is included in regulatory liabilities. The regulatory tax liability balance consists of temporary differences for liberalized depreciation at rates in excess of current rates and unamortized investment tax credits. The regulatory liability for temporary differences related to liberalized depreciation will continue to be amortized using the average rate assumption method required by the Tax Reform Act of 1986. The regulatory liability for temporary differences caused by the investment tax credit will be amortized ratably in the same fashion as the accumulated deferred investment tax credit.
The following table summarizes NPC’s net regulatory tax asset and liability (dollars in thousands):
| | | 2009 | | | 2008 | |
| Tax benefits flowed through to customers | | | | | | |
| Related to property | | $ | 82,958 | | | $ | 76,489 | |
| Related to goodwill | | | 90,378 | | | | 93,017 | |
| Regulatory tax asset | | | 173,336 | | | | 169,506 | |
| | | | | | | | | |
| Liberalized depreciation at rates in excess of current rates | | | 2,466 | | | | 3.328 | |
| Unamortized investment tax credits | | | 4,683 | | | | 5,385 | |
| Regulatory tax liability | | | 7,149 | | | | 8,713 | |
| Net regulatory tax asset | | $ | 166,187 | | | $ | 160,793 | |
Current income taxes are allocated based on NVE’s and each subsidiaries’ respective taxable income or loss and tax credits as if each subsidiary filed a separate return.
The following table summarizes as of December 31, 2009 net operating loss and tax credit carryovers and associated carryover periods, and valuation allowance for amounts which NPC has determined that realization is uncertain (dollars in thousands):
| Type of Carryforward | | Deferred Tax Asset | | | Valuation Allowance | | | Net Deferred Tax Asset | | | Expiration Period | |
| Federal net operating loss | | $ | 106,703 | | | $ | - | | | $ | 106,703 | | | | 2022-2029 | |
| Research and development credit | | | 7,574 | | | | - | | | | 7,574 | | | | 2022-2029 | |
| Arizona coal credits | | | 1,578 | | | | 1,430 | | | | 148 | | | | 2010-2014 | |
| Total | | $ | 115,855 | | | $ | 1,430 | | | $ | 114,425 | | | | | |
At December 31, 2009, NPC has a gross federal NOL carryover of $304.9 million.
Considering all positive and negative evidence regarding the utilization of NPC’s deferred tax assets, it has been determined that NPC is more-likely-than-not to realize all recorded deferred tax assets, except for a portion of the Arizona coal credits. As such, these Arizona coal credits represent the only valuation allowance that has been recorded as of December 31, 2009.
Uncertain tax liabilities are all long term and are included in the “other deferred credits and liabilities” line item on the balance sheet. A reconciliation of the beginning and ending amount of unrecognized tax benefits for NPC is as follows (dollars in thousands):
| | | 2009 | | | 2008 | |
| | | | | | | |
| Balance at January 1 | | $ | 48,487 | | | $ | 20,129 | |
| Additions based on tax positions related to the current year | | | 2,787 | | | | 3,549 | |
| Additions for tax positions of prior years | | | 9,246 | | | | 34,353 | |
| Reductions for tax positions of prior years | | | (33,906 | ) | | | (9,544 | ) |
| Balance at December 31 | | $ | 26,614 | | | $ | 48,487 | |
In December 2007, NVE and the Utilities filed a Form 3115, Application for Change in Accounting Method (“Application”), with the IRS requesting a change in accounting for deducting repair expenditures. In April 2009, NVE and the Utilities received notice from the IRS approving the Application. Accordingly, during the second quarter of 2009, NPC recorded reductions to its unrecognized tax benefits for the repair positions taken in the prior period of approximately $32.0 million. No additional material changes in the income tax reserves are anticipated in the next twelve months.
NVE and the Utilities classify interest and penalties related to income taxes as interest and other expense, respectively. The total amount of unrecognized tax benefits for NPC as of December 31, 2009 and December 31, 2008 is $26.6 million and $48.5 million, respectively, of which $3.1 million and $2.0 million, respectively, would affect the effective tax rate if recognized. No interest or penalties have been accrued as of December 31, 2009 and December 31, 2008. NVE and the Utilities do not expect unrecognized tax benefits to statutorily expire within the next twelve months.
NVE and the Utilities file a consolidated U.S. federal income tax return. The U.S. federal jurisdiction is the only “significant” tax jurisdiction for NVE and the Utilities. As of December 31, 2009, NVE and the Utilities’ tax years 2005 through 2008 are subject to examination. As of December 31, 2009, NVE and the Utilities are no longer subject to examinations by U.S. federal, state, or local tax authorities for years before 2005, with few exceptions.
SPPC
The following reflects the composition of taxes on income (dollars in thousands):
| | | 2009 | | | 2008 | | | 2007 | |
| Provision for income taxes | | | | | | | | | |
| Current and other | | | | | | | | | |
| Federal | | $ | (488 | ) | | $ | 13,663 | | | $ | 57,483 | |
| State | | | 12 | | | | 12 | | | | 70 | |
| Total current and other | | | (476 | ) | | | 13,675 | | | | 57,553 | |
| | | | | | | | | | | | | |
| Deferred | | | | | | | | | | | | |
| Federal | | | 34,335 | | | | 26,087 | | | | (28,705 | ) |
| State | | | 292 | | | | 315 | | | | 429 | |
| Total deferred | | | 34,627 | | | | 26,402 | | | | (28,276 | ) |
| | | | | | | | | | | | | |
| Amortization of excess deferred taxes | | | (847 | ) | | | (670 | ) | | | (990 | ) |
| | | | | | | | | | | | | |
| Amortization of investment tax credits | | | (2,079 | ) | | | (1,804 | ) | | | (2,278 | ) |
| | | | | | | | | | | | | |
| Total provision for income taxes | | $ | 31,225 | | | $ | 37,603 | | | $ | 26,009 | |
The total income tax provision differs from amounts computed by applying the federal statutory tax rate to income before income taxes for the following reasons (dollars in thousands):
| | | 2009 | | | 2008 | | | 2007 | |
| | | | | | | | | | |
| Net Income | | $ | 73,086 | | | $ | 90,582 | | | $ | 65,667 | |
| Total income tax expense | | | 31,224 | | | | 37,603 | | | | 26,009 | |
| Pretax income | | | 104,310 | | | | 128,185 | | | | 91,676 | |
| Statutory tax rate | | | 35 | % | | | 35 | % | | | 35 | % |
| Federal income tax expense (benefit) at statutory rate | | | 36,509 | | | | 44,865 | | | | 32,087 | |
| Depreciation related to difference in cost basis for tax purposes | | | (3,762 | ) | | | (77 | ) | | | 1,679 | |
| AFUDC - equity | | | (1,137 | ) | | | (4,383 | ) | | | (5,582 | ) |
| Investment tax credit amortization | | | (2,079 | ) | | | (1,804 | ) | | | (2,278 | ) |
| Regulatory asset for goodwill | | | 1,009 | | | | 1,009 | | | | 1,009 | |
| Research and development credit | | | (161 | ) | | | (232 | ) | | | (603 | ) |
| Other - net | | | 846 | | | | (1,775 | ) | | | (303 | ) |
| Provision for income taxes | | $ | 31,225 | | | $ | 37,603 | | | $ | 26,009 | |
| Effective tax rate | | | 29.9 | % | | | 29.3 | % | | | 28.4 | % |
As a large corporate taxpayer, the NVE consolidated group’s tax returns are examined by the IRS on a regular basis. SPPC believes that it has adequately provided reasonable reserves for reasonable and foreseeable outcomes related to uncertain tax matters.
The net deferred income tax liability consists of deferred income tax liabilities less related deferred income tax assets, as shown (dollars in thousands):
| | | 2009 | | | 2008 |
| Deferred income tax assets | | | | | |
| Credit carryforwards and net operating loss | | $ | 41,282 | | | $ | - |
| Employee benefit plans | | | 37,092 | | | | 59,083 |
| Customer advances | | | 13,751 | | | | 14,831 |
| Gross-ups received on CIAC and customer advances | | | 7,776 | | | | 8,936 |
| Deferred revenues | | | 1,122 | | | | 1,891 |
| Deferred energy | | | 40,752 | | | | 9,330 |
| Reserves | | | 1,910 | | | | 2,542 |
| Other | | | 9,782 | | | | 6,463 |
| Subtotal | | | 153,467 | | | | 103,076 |
| Deferred income tax assets associated with regulatory matters | | | | | | | |
| Excess deferred income taxes | | | 7,346 | | | | 8,193 |
| Unamortized investment tax credit | | | 7,634 | | | | 8,573 |
| Subtotal | | | 14,980 | | | | 16,766 |
| Total deferred income tax assets | | $ | 168,447 | | | $ | 119,842 |
| | | | | | | | |
| Deferred income tax liabilities | | | | | | | |
| Excess of tax depreciation over book depreciation | | $ | 308,600 | | | $ | 196,161 |
| Regulatory assets | | | 52,132 | | | | 83,608 |
| Other | | | 23,806 | | | | 19,798 |
| Subtotal deferred tax liabilities | | | 384,538 | | | | 299,567 |
| Deferred income tax liabilities associated with regulatory matters | | | | | | | |
| Tax benefits flowed through to customers | | | 88,297 | | | | 95,273 |
| Total deferred income tax liability | | $ | 472,835 | | | $ | 394,840 |
| | | | | | | | |
| Net deferred income tax liability | | $ | 231,070 | | | $ | 196,491 |
| Net deferred income tax liability associated with regulatory matters | | | 73,317 | | | | 78,507 |
| Total net deferred income tax liability | | $ | 304,388 | | | $ | 274,998 |
SPPC’s balance sheet contains a net regulatory asset of $73.3 million at December 31, 2009 and $78.5 million at December 31, 2008. For balance sheet presentation, the regulatory tax asset is included in regulatory assets. The regulatory tax asset consists of future revenue to be received from customers due to flow-through of the tax benefits of temporary differences and goodwill recognized from the merger of NPC and NVE. Offset against these amounts are future revenues to be refunded to customers (regulatory liabilities). For balance sheet presentation, the regulatory tax liability is included in regulatory liabilities. The regulatory tax liabilities consist of temporary differences for liberalized depreciation at rates in excess of current rates and unamortized investment tax credits. The regulatory liability for temporary differences related to liberalized depreciation will continue to be amortized using the average rate assumption method required by the Tax Reform Act of 1986. The regulatory liability for temporary differences caused by the investment tax credit will be amortized ratably in the same fashion as the accumulated deferred investment tax credit.
The following table summarizes SPPC’s net regulatory tax asset and liability (dollars in thousands):
| | | 2009 | | | 2008 |
| Tax benefits flowed through to customers | | | | | |
| Related to property | | $ | 34,254 | | | $ | 39,678 |
| Related to goodwill | | | 54,043 | | | | 55,595 |
| Regulatory tax asset | | | 88,297 | | | | 95,273 |
| | | | | | | | |
| Liberalized depreciation at rates in excess of current rates | | | 7,346 | | | | 8,193 |
| Unamortized investment tax credits | | | 7,634 | | | | 8,573 |
| Regulatory tax liability | | | 14,980 | | | | 16,766 |
| Net regulatory tax asset | | $ | 73,317 | | | $ | 78,507 |
NVE and its subsidiaries file a consolidated federal income tax return. Current income taxes are allocated based on NVE’s and each subsidiaries’ respective taxable income or loss and tax credits as if each subsidiary filed a separate return.
The following table summarizes as of December 31, 2009 net operating losses and tax credit carryovers and associated carryover periods for amounts which SPPC has determined that realization is uncertain (dollars in thousands):
| Type of Carryforward | | Deferred Tax Asset | | | Valuation Allowance | | | Net Deferred Tax Asset | | | Expiration Period | |
| Federal net operating loss | | $ | 37,615 | | | $ | - | | | $ | 37,615 | | | | 2010-2014 | |
| Research and development credit | | | 3,667 | | | | - | | | | 3,667 | | | | 2010-2014 | |
| Total | | $ | 41,282 | | | $ | - | | | $ | 41,282 | | | | | |
At December 31, 2009, SPPC has a gross federal NOL carryover of $107.5 million.
Considering all positive and negative evidence regarding the utilization of SPPC’s deferred tax assets, it has been determined that SPPC is more-likely-than-not to realize all recorded deferred tax assets and therefore no valuation allowance has been recorded as of December 31, 2009.
Uncertain tax liabilities are all long term and are included in the “other deferred credits and liabilities” line item on the balance sheet. A reconciliation of the beginning and ending amount of unrecognized tax benefits for SPPC is as follows (dollars in thousands):
| | | 2009 | | | 2008 | |
| | | | | | | |
| Balance at January 1 | | $ | 40,126 | | | $ | 4,430 | |
| Additions based on tax positions related to the current year | | | 500 | | | | 4,536 | |
| Additions for tax positions of prior years | | | 2,527 | | | | 31,709 | |
| Reductions for tax positions of prior years | | | (32,644 | ) | | | (549 | ) |
| Balance at December 31 | | $ | 10,509 | | | $ | 40,126 | |
In December 2007, NVE and the Utilities filed a Form 3115, Application for Change in Accounting Method (“Application”), with the IRS requesting a change in accounting for deducting repair expenditures. In April 2009, NVE and the Utilities received notice from the IRS approving the Application. Accordingly, during the second quarter of 2009, SPPC recorded reductions to its unrecognized tax benefits for the repair positions taken in the prior period of approximately $32.3 million. No additional material changes in the income tax reserves are anticipated in the next twelve months.
NVE and the Utilities classify interest and penalties related to income taxes as interest and other expense, respectively. The total amount of unrecognized tax benefits for SPPC as of December 31, 2009 and December 31, 2008 is $10.5 million and $40.1 million, respectively, of which $1.4 million and $1.2 million, respectively, would affect the effective tax rate if recognized. No interest or penalties have been accrued as of December 31, 2009 and December 31, 2008. NVE and the Utilities do not expect unrecognized tax benefits to statutorily expire within the next twelve months.
NVE and the Utilities file a consolidated U.S. federal income tax return. The U.S. federal jurisdiction is the only “significant” tax jurisdiction for NVE and the Utilities. As of December 31, 2009, NVE and the Utilities’ tax years 2005 through 2008 are subject to examination. As of December 31, 2009, NVE and the Utilities are no longer subject to examinations by U.S. federal, state, or local tax authorities for years before 2005, with few exceptions.
NVE has a defined benefit pension plan covering substantially all employees. Certain grandfathered and certain union employees are covered under a benefit formula based on years of service and the employee's highest compensation for a period prior to retirement, while most employees are covered under a cash balance formula. NVE also has other postretirement plans, including a defined contribution plan which provide medical and life insurance benefits for certain retired employees.
Plan Changes
In September 2009, the postretirement plan for existing retirees in the northern service area was amended to cap company contributions for retiree medical plans at 2009 levels in order to contain costs. As a result, NVE’s obligation for the postretirement medical plan was re-measured at September 30, 2009, resulting in a reduction to the liability for other postretirement benefits of $24.2 million, and a fourth quarter reduction in pension expense of approximately $1.0 million. The annual impact of this change is estimated to be $4.0 million.
During 2009, in an effort to reduce costs, NVE implemented severance programs, as discussed in Note 17, Severance Programs, of the Notes to Financial Statements. Under the terms of the program employees close to retirement age were offered special enhancements to bridge their pension and postretirement benefits. NVE recognized expense of $0.3 million for pension benefits and $2.8 million for other postretirement benefits in 2009, under the special termination provisions of the Compensation Nonretirement Postemployment Benefits Topic of the FASC.
In November 2007, the BOD approved a change in the plan for MPAT employees from a traditional defined benefit pension plan to a defined benefit cash balance pension plan. Employees with combined age and service totaling 75 years or more had the choice of staying with the current plan or electing to switch to the new plan. The new plan went into effect on April 1, 2008; all employees hired after that date will be eligible for the cash balance plan, and will be vested after three years of service. This change, along with market conditions and plan asset values at the time of the re-measurement of the plan obligation, increased 2008 pension expense by $2.7 million over the original estimate of $21.3 million.
Under the terms of NPC’s current contract with IBEW Local No. 396, the pension benefits for those employees covered under that agreement have also changed from a traditional defined benefit plan to a defined benefit cash balance plan effective December 31, 2008. However, the impact of this change was offset by 2008 market conditions and plan asset values. NVE did not make any changes to pension plan provisions in 2007 that had significant impacts on recorded pension expense.
In 2008, the postretirement plan was amended to provide that all MPAT employees hired after April 1, 2008 will not be eligible for retiree medical coverage, and those hired after January 1, 2009 will not be eligible for retiree life insurance coverage. Additionally, all Local Union 396 employees hired after October 13, 2008 will cease to have retiree medical coverage after attaining the age of 65, and they will not be eligible for retiree life insurance coverage. The impact of these changes on the postretirement plan costs is not known.
In 2007, NVE completed negotiations with SPPC’s bargaining unit 1245 employees, and reached a settlement with regards to postretirement medical coverage. This agreement resulted in changes to NVE’s future obligations under this plan, and as a result of a re-measurement of the plan obligation, NVE’s 2007 expense was reduced by $1.3 million.
NVE also has a non-qualified Supplemental Executive Retirement Plan and a Restoration Plan for executives. NVE contributed $26.5 million to establish a rabbi trust for these plans in 2009. Assets held in the trust for these non-contributory defined benefit plans consist of a variety of marketable securities and life insurance policies, none of which is NVE stock. At December 31, 2009 trust assets were $26.5 million and are reflected in NVE’s consolidated balance sheet within “Investments and other property, net”. NVE’s obligation under these supplemental and restoration plans is included in “Accrued retirement benefits” in NVE’s consolidated balance sheet, and amounted to $25.1 million at December 31, 2009. NVE is not required to make contributions to the plans.
Benefit Obligations
In 2008, in accordance with the accounting guidance as required by the Compensation Retirement Benefits Topic of the FASC, NVE, NPC and SPPC recorded additional pension costs of $5.3 million, $3.6 million and $1.4 million, respectively, before taxes, to retained earnings due to the elimination of the early measurement date. Also in 2008, in accordance with the accounting guidance for compensation retirement benefits, NVE, NPC and SPPC recorded additional post retirement benefit costs of $1.9 million, $0.7 million and $1.1 million, respectively, before taxes, to retained earnings due to the elimination of the early measurement date. These amounts represent the expense attributable to the three-month period from September 30, 2007 to December 31, 2007. NVE has changed the measurement date for its benefit plans from September 30 to December 31, which coincides with NVE’s fiscal year end. The following tables provide a reconciliation of benefit obligations, plan assets and the funded status of the plans. These reconciliations are based on a December 31 measurement date for 2009 and 2008, and a September 30 measurement date for 2007 (dollars in thousands):
| | | | | | | | | Other Postretirement | |
| | | Pension Benefits | | | Benefits | |
| | | 2009 | | | 2008 | | | 2009 | | | 2008 | |
| Change in benefit obligations | | | | | | | | | | | | |
| Benefit obligation, beginning of year | | $ | 727,472 | | | $ | 674,687 | | | $ | 176,059 | | | $ | 150,175 | |
| Effect of Eliminating Early Measurement Date | | | - | | | $ | 10,708 | | | | - | | | $ | 2,438 | |
| Service cost | | | 18,838 | | | | 21,748 | | | | 2,421 | | | | 2,562 | |
| Interest cost | | | 44,145 | | | | 42,818 | | | | 10,072 | | | | 10,732 | |
| Plan Participants' contributions | | | - | | | | - | | | | 1,677 | | | | 1,475 | |
| Actuarial loss (gain) | | | 7,054 | | | | 38,174 | | | | 7,617 | | | | (7,567 | ) |
| Gross Benefits paid | | | (40,077 | ) | | | (31,944 | ) | | | (10,953 | ) | | | (11,838 | ) |
| Administrative Expenses | | | - | | | | (455 | ) | | | - | | | | - | |
| Plan amendments | | | - | | | | (28,264 | ) | | | (35,507 | ) | | | 4,562 | |
| Special Termination Benefits | | | 316 | | | | - | | | | 2,818 | | | | - | |
| Change in Estimates | | | - | | | | - | | | | - | | | | 23,520 | |
| Remeasurement Adjustment | | | - | | | | - | | | | 83 | | | | - | |
| Benefit obligation, end of year | | $ | 757,748 | | | $ | 727,472 | | | $ | 154,287 | | | $ | 176,059 | |
The accumulated benefit obligation for Pension Benefits at the end of 2009 and 2008 was $701 million and $659 million respectively.
The actuarial assumptions used to determine end of year benefit obligations were as follows:
| | | | | | Other Postretirement |
| | Pension Benefits | | Benefits |
| | 2009 | | 2008 | | 2009 | | 2008 |
| Discount rate | 5.80% | | 6.09% | | 5.75% | | 6.07% |
| Rate of compensation increase | 4.50% | | 4.50% | | N/A | | N/A |
In selecting an assumed discount rate for fiscal year 2009 pension cost and for fiscal year-end 2009 disclosures, NVE’s projected benefit payments were matched to the yield curve derived from a portfolio of over 300 high quality Aa bonds with yields within the 10th to 90th percentiles of these bond yields.
For measurement purposes, the following assumptions were used regarding health care cost trend rates at December 31:
| | | 2009 | | 2008 |
| Health care cost trend rate assumed for year | | 8.00% | | 8.50% |
| Rate to which the cost trend rate is assumed to decline (the ultimate trend rate) | | 5.00% | | 5.00% |
| Year the rate reaches the ultimate trend rate | | 2016 | | 2014 |
Assumed health care cost trend rates have a significant effect on the amounts reported for the health care plans. A one-percentage-point change in assumed health care cost trend rates would have the following effect:
| Effect on the postretirement benefit obligation | | 2009 | | | 2008 | |
| Effect of a 1-percentage point increase | | $ | 8,294 | | | $ | 14,407 | |
| Effect of a 1-percentage point decrease | | $ | (6,657 | ) | | $ | (12,333 | ) |
Plan Assets
NVE’s investment strategy is to ensure the safety of the principal of the assets and obtain asset performance to meet the continuing obligations of the plan. NVE contributed a total of $53.5 million in 2009 towards the pension plans.
NVE strives to maintain a reasonable and prudent amount of risk, and seeks to limit risk through diversification of assets. Also, NVE considers the ability of the plan to pay all benefit and expense obligations when due, and to control the costs of administering and managing the plan. NVE’s investment guidelines prohibit investing the plan assets in real estate and NVE’s stock.
NVE’s long term strategy for the pension plan assets is to maximize risk adjusted returns while maintaining adequate liquidity to pay plan benefits. NVE is committed to prudent investments with ample diversification in terms of asset types, fund strategies, and investment managers. NVE has increased the target allocation of fixed income from 40% to 70% in order to minimize the earnings volatility of plan assets to match its liabilities. As such, NVE has elected to include an appropriate mix of indexed and actively managed investments to accomplish its strategy. The current allocation for pension plan net assets at December 31, 2009 is 44% fixed income, 36% domestic equity, 13% international equity, and 7% cash. The long-term target allocation for pension plan net assets is 70% fixed income, 17% U.S. equity, 8% international equity, and 5% other (cash and alternative investments). The fixed income investments are benchmarked against government and corporate credit bond indices. U.S. equity investments include large cap, mid-cap, and small-cap companies with an emphases towards small and mid-cap investments relative to the Russell 2500 Growth Index. International equity is currently actively managed and includes investments in both established and emerging markets.
The current allocation for the other post-retirement benefit plan net assets at December 31, 2009 is 60% equity securities, 36% fixed income and 4% cash. The long term strategy for the other post-retirement benefit plan net assets is similar to the pension plan net assets strategy as described above. The target allocation for other post-retirement benefit assets is 60% equity and 40% fixed income. The equity is invested in indexed securities that track the S&P 500 Index. The fixed income is indexed and benchmarked against government and corporate credit bond indices.
The fair values of NVE’s pension plan and other postretirement benefits assets at December 31, 2009, within the fair value hierarchy as required by the Fair Value Measurements and Disclosures Topic of the FASC, by asset category are as follows (dollars in thousands):
Pension Plan Assets
| | | Fair Value Measurements at December 31, 2009 | |
| Asset Category | | Level 1 | | | Level 2 | | | Level 3 | | | Total | |
Cash & Cash equivalents (1) | | $ | 6,751 | | | $ | 57,628 | | | | - | | | $ | 64,379 | |
| Equity: | | | | | | | | | | | | | | | | |
U.S. Equity Securities (2) | | | 213,085 | | | | - | | | | - | | | | 213,085 | |
| International Equity Securities | | | 108,779 | | | | - | | | | - | | | | 108,779 | |
| Fixed Income: | | | | | | | | | | | | | | | | |
| U.S. Preferred Securities | | | 179 | | | | - | | | | - | | | | 179 | |
| International Preferred Securities | | | 419 | | | | - | | | | - | | | | 419 | |
U.S. Fixed Income Securities (3) | | | 55,728 | | | | 224,157 | | | | 457 | | | | 280,342 | |
| International Fixed Income Securities | | | - | | | | 22,542 | | | | - | | | | 22,542 | |
| Other: | | | | | | | | | | | | | | | | |
| U.S. Future Contracts | | | 7 | | | | - | | | | - | | | | 7 | |
| International Future Contracts | | | 29 | | | | - | | | | - | | | | 29 | |
| U.S. Convertible Securities | | | - | | | | 175 | | | | - | | | | 175 | |
Total (4) | | $ | 384,977 | | | $ | 304,502 | | | $ | 457 | | | $ | 689,936 | |
Other Postretirement Benefit Assets
| | | Fair Value Measurements at December 31, 2009 | |
| Asset Category | | Level 1 | | | Level 2 | | | Level 3 | | | Total | |
Cash & Cash equivalents (1) | | $ | 218 | | | $ | 3,877 | | | $ | - | | | $ | 4,095 | |
| Equity: | | | | | | | | | | | | | | | | |
U.S. Equity Securities (2) | | | 58,714 | | | | - | | | | - | | | | 58,714 | |
| International Equity Securities | | | 3,519 | | | | - | | | | - | | | | 3,519 | |
| Fixed Income: | | | | | | | | | | | | | | | | |
| U.S. Preferred Securities | | | 6 | | | | - | | | | - | | | | 6 | |
| International Preferred Securities | | | 14 | | | | - | | | | - | | | | 14 | |
U.S. Fixed Income Securities (3) | | | 1,803 | | | | 25,016 | | | | 15 | | | | 26,834 | |
| International Fixed Income Securities | | | - | | | | 729 | | | | - | | | | 729 | |
| Other: | | | | | | | | | | | | | | | | |
| International Future Contracts | | | 1 | | | | - | | | | - | | | | 1 | |
| U.S. Convertible Securities | | | - | | | | 5 | | | | - | | | | 5 | |
Total (4) | | $ | 64,275 | | | $ | 29,627 | | | $ | 15 | | | $ | 93,917 | |
| (1) | Level 1 investments are comprised of U.S. Treasury bills. Level 2 investments consist of commingled funds that are primarily comprised of money market holdings and marketable securities, U.S. Treasury bills and commercial paper valued and redeemable at cost. |
| | |
| (2) | This category includes approximately 45% large-cap, 27% mid-cap, 9% small cap, and 19% broad market domestic equity investments. |
| | |
| (3) | Level 1 investments are comprised of fixed income securities that mainly invest in U.S. Treasury bills. Level 2 investments consist of commingled funds that track either the Barclays Capital Aggregate Bond Index or Barclays Capital Long Government and Corporate Credit Index. Level 3 investments are comprised of corporate loans. |
| | |
| (4) | The fair value of NVE’s pension plan and postretirement benefit assets does not reflect approximately $19.1 million and $0.6 million, respectively, in administrative trust net liabilities. As such, the fair value of the plans assets for both pension and postretirement benefits net of the $19.1 million and $0.6 million liability is approximately $670.8 million and $93.3 million, respectively, at December 31, 2009. |
The following table shows the change in plan net assets for 2009 and 2008. Employer contributions reflect funding and benefit payments made by NVE (dollars in thousands):
| | | | | | | | | Other Postretirement | |
| | | Pension Benefits | | | Benefits | |
| | | 2009 | | | 2008 | | | 2009 | | | 2008 | |
| Change in plan net assets | | | | | | | | | | | | |
| Fair value of plan net assets, beginning of year | | $ | 531,373 | | | $ | 639,996 | | | $ | 84,661 | | | $ | 108,921 | |
| Effect of Eliminating Early Measurement Date | | | - | | | | 6,893 | | | | - | | | | 1,202 | |
| Actual return on plan assets | | | 123,693 | | | | (181,760 | ) | | | 17,619 | | | | (23,280 | ) |
| Employer contributions | | | 55,805 | | | | 94,143 | | | | 294 | | | | 8,181 | |
| Plan participants' contributions | | | - | | | | - | | | | 1,677 | | | | 1,475 | |
| Gross benefits paid | | | (40,077 | ) | | | (27,444 | ) | | | (10,953 | ) | | | (11,838 | ) |
| Expenses paid | | | - | | | | (455 | ) | | | - | | | | - | |
| Fair value of plan net assets, end of year | | $ | 670,794 | | | $ | 531,373 | | | $ | 93,298 | | | $ | 84,661 | |
The expected long-term rate of return on the pension and other postretirement benefit plan assets is 6.75%, 7.10% and 8.00%, and 7.10%, 7.10% and 8.00%, respectively, in 2010, 2009 and 2008, respectively.
Funded Status
The following table shows the funded status of each of the plans for 2009 and 2008 (dollars in thousands):
| | | | | | | | | Other Postretirement | |
| | | Pension Benefits | | | Benefits | |
| Funded Status, end of year: | | 2009 | | | 2008 | | | 2009 | | | 2008 | |
| Fair value of plan net assets | | $ | 670,794 | | | $ | 531,373 | | | $ | 93,298 | | | $ | 84,660 | |
| Benefit obligations | | $ | (757,748 | ) | | $ | (727,472 | ) | | $ | (154,287 | ) | | $ | (176,059 | ) |
| Funded status | | $ | (86,954 | ) | | $ | (196,099 | ) | | $ | (60,989 | ) | | $ | (91,399 | ) |
Amounts for pension and postretirement benefits recognized in the consolidated balance sheets consist of the following (dollars in thousands):
| | | | | | | | | Other Postretirement | |
| | | Pension Benefits | | | Benefits | |
| Amounts recognized in the statement of financial position consist of: | | 2009 | | | 2008 | | | 2009 | | | 2008 | |
| Current liability | | | (1,519 | ) | | | (1,561 | ) | | | - | | | | - | |
| Noncurrent liability | | | (85,435 | ) | | | (194,537 | ) | | | (60,989 | ) | | | (91,399 | ) |
| Net amount recognized | | $ | (86,954 | ) | | $ | (196,098 | ) | | $ | (60,989 | ) | | $ | (91,399 | ) |
The following amounts would have been recognized in Accumulated Other Comprehensive Income, net of taxes, according to the provisions of the Compensation Retirement Benefits Topic of the FASC. Since NVE is able to recover expenses through rates, the amounts will be recorded as Other Regulatory Assets under the provisions of the Regulated Operations Topic of the FASC (dollars in thousands).
| | | | | | | | | Other Postretirement | |
| | | Pension Benefits | | | Benefits | |
| Amounts recognized as other regulatory assets: | | 2009 | | | 2008 | | | 2009 | | | 2008 | |
| Net actuarial (gain)/loss | | $ | 249,793 | | | $ | 355,553 | | | $ | 71,229 | | | $ | 80,836 | |
| Prior service (credit)/cost | | | (15,753 | ) | | | (16,965 | ) | | | (40,377 | ) | | | (5,880 | ) |
| | | $ | 234,040 | | | $ | 338,588 | | | $ | 30,852 | | | $ | 74,956 | |
The estimated amounts that will be amortized from other regulatory assets and accumulated other comprehensive income into net periodic cost in 2010 are as follows (dollars in thousands):
| | | Pension Benefits | | | Other Postretirement Benefits | |
| Actuarial (gain)/loss | | $ | 15,068 | | | $ | 4,318 | |
| Prior service (credit)/cost | | | (1,794 | ) | | | (3,890 | ) |
At the end of 2009 and 2008, the projected benefit obligation, accumulated benefit obligation, and fair value of plan net assets for pension plans with a projected benefit obligation in excess of plan net assets, and pension plans with an accumulated benefit obligation in excess of plan assets, were as follows (dollars in thousands):
| | | Benefit Obligation Exceeds | | | Accumulated Benefit Obligation Exceeds | |
| | | the Fair Value of Plan's Assets | | | the Fair Value of Plan's Assets | |
| | | 2009 | | | 2008 | | | 2009 | | | 2008 | |
| Projected benefit obligation, end of year | | $ | 757,748 | | | $ | 727,472 | | | $ | - | | | $ | - | |
| Accumulated benefit obligation, end of year | | | - | | | | - | | | | 700,665 | | | | 659,404 | |
| Fair value of plan net assets, end of year | | | 670,794 | | | | 531,373 | | | | 670,794 | | | | 531,373 | |
The expected cash flows for the plans, including trust accounts, are as follows (dollars in thousands):
| | | Pension Benefits | | | Other Postretirement Benefits | |
| Company contributions | | | | | | | | | |
| 2010 (expected) | | $ | 41,519 | | | $ | 294 | | | | |
| | | | | | | | | | | | |
| | | | | | | Gross | | | Expected Federal Subsidy | |
| Expected benefit payments | | | | | | | | | | | |
| 2010 | | | 70,117 | | | | 9,802 | | | | - | |
| 2011 | | | 44,711 | | | | 10,422 | | | | - | |
| 2012 | | | 47,110 | | | | 10,642 | | | | - | |
| 2013 | | | 50,218 | | | | 10,480 | | | | - | |
| 2014 | | | 51,746 | | | | 10,456 | | | | - | |
| 2015-2019 | | | 272,475 | | | | 52,884 | | | | - | |
| | | | | | | | | | | | | |
The above benefit payments are obligations of the indicated plan, and reflect payments which do not include employee contributions. The expected benefit payment information that reflects the employee obligation is almost exclusively paid from plan assets. A small portion of the pension benefit obligation is paid from the plan sponsor’s assets.
Net Periodic Cost
The components of net periodic pension and other postretirement benefit costs for NVE, NPC and SPPC are presented below (dollars in thousands):
| | | Pension Benefits | | | Other Postretirement Benefits | |
| NV Energy, consolidated | | 2009 | | | 2008 | | | 2007 | | | 2009 | | | 2008 | | | 2007 | |
| | | | | | | | | | | | | | | | | | | |
| Service cost | | $ | 18,837 | | | $ | 21,748 | | | $ | 22,901 | | | $ | 2,421 | | | $ | 2,562 | | | $ | 2,680 | |
| Interest cost | | | 44,145 | | | | 42,818 | | | | 39,420 | | | | 10,072 | | | | 10,732 | | | | 10,088 | |
| Expected return on plan assets | | | (37,159 | ) | | | (47,051 | ) | | | (41,895 | ) | | | (6,048 | ) | | | (8,351 | ) | | | (5,182 | ) |
| Amortization of: | | | | | | | | | | | | | | | | | | | | | | | | |
| Actuarial (gain)/loss | | | 27,575 | | | | 6,714 | | | | 7,211 | | | | 5,296 | | | | 3,489 | | | | 3,413 | |
| Prior service (credit)/cost | | | (1,794 | ) | | | (166 | ) | | | 1,629 | | | | (1,466 | ) | | | (1,028 | ) | | | (225 | ) |
| Transition (asset)/obligation | | | - | | | | - | | | | - | | | | - | | | | - | | | | 484 | |
| Settlement (gain)/loss | | | - | | | | - | | | | 4,441 | | | | - | | | | 338 | | | | - | |
| Remeasurement Adjustment | | | - | | | | - | | | | - | | | | 336 | | | | - | | | | - | |
| Total net benefit cost | | $ | 51,604 | | | $ | 24,063 | | | $ | 33,707 | | | $ | 10,611 | | | $ | 7,742 | | | $ | 11,258 | |
The NVE total net periodic cost excludes special termination benefits of $0.3 million for pension and $2.8 million for other postretirement benefits, related to severance programs implemented in 2009. See Note 17, Severance Programs, of the Notes to Financial Statements for further discussion.
The average percentage of NVE net periodic costs capitalized during 2009, 2008 and 2007 was 36.6%, 37.1% and 34.7%, respectively.
| | | Pension Benefits | | | Other Postretirement Benefits | |
| Nevada Power Company | | 2009 | | | 2008 | | | 2007 | | | 2009 | | | 2008 | | | 2007 | |
| | | | | | | | | | | | | | | | | | | |
| Service cost | | $ | 9,572 | | | $ | 12,798 | | | $ | 13,092 | | | $ | 1,325 | | | $ | 1,217 | | | $ | 1,079 | |
| Interest cost | | | 21,079 | | | | 21,240 | | | | 18,977 | | | | 2,437 | | | | 2,524 | | | | 2,178 | |
| Expected return on plan assets | | | (17,847 | ) | | | (22,554 | ) | | | (19,000 | ) | | | (2,067 | ) | | | (2,702 | ) | | | (1,232 | ) |
| Amortization of: | | | | | | | | | | | | | | | | | | | | | | | | |
| Actuarial (gain)/loss | | | 13,192 | | | | 3,321 | | | | - | | | | 1,272 | | | | 808 | | | | 729 | |
| Prior service (credit)/cost | | | (1,733 | ) | | | 57 | | | | 1,430 | | | | 1,104 | | | | 1,157 | | | | 606 | |
| Transition (asset)/obligation | | | - | | | | - | | | | 3,429 | | | | - | | | | - | | | | 485 | |
| Remeasurement Adjustment | | | - | | | | - | | | | - | | | | 57 | | | | - | | | | - | |
| Total net benefit cost | | $ | 24,263 | | | $ | 14,862 | | | $ | 17,928 | | | $ | 4,128 | | | $ | 3,004 | | | $ | 3,845 | |
The average percentage of NPC net periodic costs capitalized during 2009, 2008 and 2007 was 39.4%, 40.5% and 38.8%, respectively.
| | | Pension Benefits | | | Other Postretirement Benefits | |
| Sierra Pacific Power Company | | 2009 | | | 2008 | | | 2007 | | | 2009 | | | 2008 | | | 2007 | |
| | | | | | | | | | | | | | | | | | | |
| Service cost | | $ | 8,245 | | | $ | 7,998 | | | $ | 8,553 | | | $ | 1,028 | | | $ | 1,275 | | | $ | 1,542 | |
| Interest cost | | | 21,885 | | | | 20,248 | | | | 19,100 | | | | 7,567 | | | | 8,054 | | | | 7,844 | |
| Expected return on plan assets | | | (18,321 | ) | | | (23,270 | ) | | | (21,969 | ) | | | (3,894 | ) | | | (5,512 | ) | | | (3,823 | ) |
| Amortization of: | | | | | | | | | | | | | | | | | | | | | | | | |
| Actuarial (gain)/loss | | | 13,701 | | | | 3,085 | | | | - | | | | 3,990 | | | | 2,633 | | | | 2,663 | |
| Prior service (credit)/cost | | | (104 | ) | | | (137 | ) | | | 212 | | | | (2,586 | ) | | | (2,201 | ) | | | (831 | ) |
| Transition (asset)/obligation | | | - | | | | - | | | | 3,467 | | | | - | | | | - | | | | - | |
| Remeasurement Adjustment | | | - | | | | - | | | | - | | | | 277 | | | | - | | | | - | |
| Total net benefit cost | | $ | 25,406 | | | $ | 7,924 | | | $ | 9,363 | | | $ | 6,382 | | | $ | 4,249 | | | $ | 7,395 | |
The average percentage of SPPC net periodic costs capitalized during 2009, 2008 and 2007 was 36.4%, 36.5% and 35.7%, respectively.
The weighted-average assumptions used to determine net periodic cost are as follows:
| | | | | | | | | Other Postretirement |
| | | Pension Benefits | | Benefits |
| | | 2009 | | 2008 | | 2007 | | 2009 | | | 2008 | | 2007 |
| Discount rate | | | 6.09% | | | 6.38% | | | 6.00% | | | 6.07% | (1) | | | 6.25% | | | 6.00% |
| Expected Return on Plan Assets | | | 7.10% | | | 8.00% | | | 8.00% | | | 7.10% | | | | 8.00% | | | 8.00% |
| Rate of compensation increase | | | 4.50% | | | 4.50% | | | 4.50% | | | N/A | | | | N/A | | | N/A |
| (1) | A discount rate of 5.37% was used for the September 30, 2009 remeasurement. |
For measurement purposes, the following assumptions were used regarding health care cost trend rates at December 31:
| | | 2009 | | 2008 |
| Health care cost trend rate assumed for year | | 8.50% | | 8.00% |
| Rate to which the cost trend rate is assumed to decline (the ultimate trend rate) | | 5.00% | | 5.00% |
| Year the rate reaches the ultimate trend rate | | 2015 | | 2014 |
The assumed health care cost trend rate has a significant effect on the amounts reported. A one percentage point change in the assumed health care cost trend rate would have had the following effect:
| One percentage point change: | | 2009 | | | 2008 | | | 2007 | |
| Effect on total of service and interest cost components | | | | | | | | | |
| Effect of a 1-percentage point increase in health care trend | | | 1,005 | | | | 1,130 | | | | 1,476 | |
| Effects of a 1-percentage point decrease in health care trend | | | (788 | ) | | | (947 | ) | | | (1,210 | ) |
The expected ROR on plan assets was determined by considering a realistic projection of what assets can earn, given existing capital market conditions, historical equity and bond premiums over inflation, the effect of “normative” economic conditions that may differ from existing conditions, and projected ROR on reinvested assets.
There were no significant transactions between the plan and the employer or related parties during 2009, 2008, or 2007.
At December 31, 2009, NVE had several stock-based compensation plans, which are described below.
NVE’s executive long-term incentive plan for key management employees, which was approved by shareholders in May 2004, provides for the issuance of up to 7,750,000 of NVE’s common shares to key employees through December 31, 2013. The plan permits the following types of grants, separately or in combination: nonqualified and qualified stock options, stock appreciation rights, restricted stock, performance units, performance shares, and bonus stock. During 2009, NVE granted restricted shares and performance shares under the long-term incentive plan.
NVE recorded $6.8 million, $4.1 million and $8.5 million as stock compensation expense in 2009, 2008 and 2007, respectively.
Non-Qualified Stock Options
Elected officers and key employees specifically designated by a committee of the BOD are eligible to be awarded non-qualified stock options (NQSO’s) based on the guidelines in the plan. These grants are at 100% of the then current fair market value, and vest over different periods as stated in the grant. These options have to be exercised within ten years of award, and no earlier than one year from the date of grant. At the time of grant, rights to dividend equivalents may be awarded; however, historically, dividend equivalents have not been granted.
In 2009 and 2008, there were no grants of non-qualified stock options made to employees. The total number of non-qualifying stock options granted to all employees in 2007 was 411,036, which were issued at an option price not less than market value at the date of grant. Of this amount, 409,934 will vest over three years from the grant date at one-third per year. The remaining 1,102, granted on November 1, 2007 will vest over three years beginning on February 15, 2008. The grants may be exercised for a period not exceeding ten years from the grant date. The options may be exercised using either cash or previously acquired shares valued at the current market price, or a combination of both. The Committee also allows cashless exercises, subject to applicable securities law restrictions or other means consistent with the purpose of the plan and the applicable law.
A summary of the status of NVE’s nonqualified stock option plan as of December 31, 2009, 2008, and 2007, and changes during the year is presented below:
| | | 2009 | | | 2008 | | | 2007 | |
| | | | | | Weighted- | | | | | | Weighted- | | | | | | Weighted- | |
| | | | | | Average | | | | | | Average | | | | | | Average | |
| Nonqualified Stock Options | | Shares | | | Exercise Price | | | Shares | | | Exercise Price | | | Shares | | | Exercise Price | |
| | | | | | | | | | | | | | | | | | | |
| Outstanding at beginning of year | | | 1,278,557 | | | $ | 15.65 | | | | 1,294,397 | | | $ | 15.77 | | | | 1,199,188 | | | $ | 14.66 | |
| Granted | | | - | | | | - | | | | - | | | | - | | | | 411,036 | | | $ | 18.25 | |
| Exercised | | | 8,000 | | | $ | 7.35 | | | | - | | | | - | | | | 312,639 | | | $ | 14.82 | |
| Forfeited | | | 415,840 | | | $ | 16.31 | | | | 15,840 | | | $ | 24.93 | | | | 3,188 | | | $ | 19.97 | |
| Outstanding at end of year | | | 854,717 | | | $ | 15.40 | | | | 1,278,557 | | | $ | 15.65 | | | | 1,294,397 | | | $ | 15.77 | |
| | | | | | | | | | | | | | | | | | | | | | | | | |
| Options exercisable at year-end | | | 717,705 | | | $ | 14.84 | | | | 956,431 | | | $ | 14.94 | | | | 747,317 | | | $ | 14.94 | |
| | | | | | | | | | | | | | | | | | | | | | | | | |
| Intrinsic value of options exercised | | $ | 21,120 | | | | | | | $ | - | | | | | | | $ | 1,381,976 | | | | | |
| | | | | | | | | | | | | | | | | | | | | | | | | |
| Fair value of options vested | | $ | - | | | | | | | $ | - | | | | | | | $ | - | | | | | |
| Weighted-average grant date fair | | | | | | | | | | | | | | | | | | | | | | | | |
value of options granted 1: | | | | | | | | | | | | | | | | | | | | | | | | |
| | | | | | | | | | | | | | | | | | | | | | | | | |
| Average of all grants for: | | | | | | | | | | | | | | | | | | | | | | | | |
| 2009 | | $ | 0.00 | | | | | | | | | | | | | | | | | | | | | |
| 2008 | | | | | | | | | | $ | 0.00 | | | | | | | | | | | | | |
| 2007 | | | | | | | | | | | | | | | | | | $ | 6.27 | | | | | |
| | | | | | | | | | | | | | | | | | | | | | | | | |
| (1) | The fair value of each nonqualified option has been estimated on the date of grant using the Black-Scholes option pricing model with the following assumptions used for grants issued in 2007: Average Dividend Yield, 0%, Average Expected Volatility, 24.23%, Average Risk-Free Rate of Return, 4.41%, and Average Expected Life, 6 years. |
The following table summarizes information about nonqualified stock options outstanding at December 31, 2009:
| | | | | | Options Outstanding | | | Options Exercisable | |
| | | | | | | | | | | | | | | Number | |
| | | | | | Number | | | | | | Weighted | | | Vested and | |
| | | Weighted Average | | | Outstanding | | | Remaining | | | Average | | | Exercisable at | |
| Year of Grant | | Exercise Price | | | At 12/31/09 | | | Contractual Life | | | Exercise Price | | | 12/31/09 | |
| | | | | | | | | | | | | | | | |
| 2000 | | $ | 16.00 | | | | 20,600 | | | <1 year | | | $ | 16.00 | | | | 20,600 | |
| 2001 | | $ | 15.08 | | | | 22,510 | | | 1 years | | | $ | 15.08 | | | | 22,510 | |
| 2002 | | $ | 14.05 | | | | 78,410 | | | 2- 2.5 years | | | $ | 14.05 | | | | 78,410 | |
| 2004 | | $ | 7.29 | | | | 25,000 | | | 4.5 years | | | $ | 7.29 | | | | 25,000 | |
| 2005 | | $ | 10.10 | | | | 126,966 | | | 5.2 - 5.4 years | | | $ | 10.10 | | | | 126,966 | |
| 2006 | | $ | 13.29 | | | | 170,195 | | | 6.1 years | | | $ | 13.29 | | | | 170,195 | |
| 2007 | | $ | 18.25 | | | | 411,036 | | | 7.1 -7.8 years | | | $ | 18.25 | | | | 274,024 | |
| | | | | | | | | | | | | | | | | | | | |
| Weighted Average Remaining Contractual Life | | | | | | | | | | | | | | | | | | | |
| | | | | | | | | | | 5.84 | | | | | | | | 5.54 | |
| | | | | | | | | | | | | | | | | | | | |
| | | | | | | | | | | | | | | | | | | | | |
| Intrinsic Value | | $ | 416,732 | | | | | | | | | | | $ | 416,732 | | | | | |
| | | | | | | | | | | | | | | | | | | | | |
The total amount of NQSO compensation expense recognized in 2009, 2008 and 2007 was $0.4 million, $1.0 million and $1.5 million, respectively. Dividend Equivalents were not granted for any of these awards.
Performance Shares
In 2009, 2008 and 2007, NVE granted performance shares in the following numbers and initial values:
| | | | | | | | | | |
| | | 2009 | | | 2008 | | | 2007 | |
| | | | | | | | | | |
| Shares Granted | | | 895,803 | | | | 518,121 | | | | 138,967 | |
| Fair value per Share | | $ | 10.90 | | | $ | 15.27 | | | $ | 16.96 | |
In 2009, 2008 and 2007, 895,803, 518,121 and 138,967 shares of stock, respectively, were granted to plan participants; the actual number of shares earned by each participant is dependent upon NVE achieving certain financial goals over three-year performance periods. The value of all performance share grants, if earned, will be equal to the market value of NVE's common shares as of the end of the performance periods. NVE, at its sole discretion, may pay earned performance shares in the form of cash or in shares, or a combination thereof.
In 2006, there were 2,610 special grant shares awarded, which were to be earned only upon the restoration of both the NPC and SPPC investment grade credit status within three years of the date of grant. The shares for this grant were earned and issued in 2007.
In August, 2006, upon the signing of an employment agreement for the prior Chief Executive Officer, a grant of 500,000 performance shares was issued according to the agreement. The grant requires the achievement of specific performance goals which were established in the agreement. The final determination and approval of the number of shares awarded was at the discretion of the BOD and the Compensation Committee. In 2007, 200,000 shares were deemed to have been earned and were issued in the form of cash.
There were 42,920 special grant shares awarded in 2005, which were to be earned only upon the restoration of both the NPC and SPPC investment grade credit status within three years of the date of grant. These shares were earned and issued in 2007.
In 2005, there were 182,114 performance shares awarded, and due to the achievement of certain performance goals established for this grant over a three year cycle, the number of shares available under this grant was increased to 224,591; these shares were issued in early 2008.
In 2006, there were 162,008 performance shares awarded, and at the discretion of the BOD and the Compensation Committee, it was determined that the performance goals established for this grant over a three year cycle, were not achieved and the shares were forfeited in early 2009.
In accordance with the Stock Compensation Topic of the FASC, NVE recognized expense in 2009, 2008 and 2007 related to performance shares. Expense was recognized using the closing market price of NVE stock at the end of each interim period and on December 31, 2009.
The total fair value of shares issued in 2009, 2008 and 2007 were $0, $3.8 million and $4.4 million, respectively. The total fair value of shares vested in 2009, 2008, and 2007 were $5.4 million, $2.5 million and $3.1 million, respectively.
Restricted Stock Shares
In 2009, NVE awarded several grants of restricted shares; 63,000 shares were awarded with a grant price of $10.91 per share, 2,000 shares were awarded with a grant price of $11.57 per share, and 1,000 shares were awarded with a grant price of $11.71 per share. These grants will vest equally over three years from the date of grant. The issuance of these shares is conditional upon the employee retaining employment with NVE throughout the entire vesting period.
In 2008, NVE awarded several grants of restricted shares; 30,000 shares were awarded with a grant price of $14.39 per share, 10,000 shares were awarded with a grant price of $10.73 per share, and 3,500 shares were awarded with a grant price of $8.07 per share. These grants will vest equally over three years from the date of grant. The issuance of these shares is conditional upon the employee retaining employment with NVE throughout the entire vesting period.
There were no restricted shares granted in 2007.
In 2006, 5,643 shares of restricted stock were awarded at a grant price of $13.29 per share; this grant was fully vested on December 31, 2006 and the shares were issued in early 2007.
The total fair value of shares issued in 2009, 2008 and 2007 were $0, $0 and $6.0 million, respectively. The total fair value of shares vested in 2009, 2008 and 2007 were $0.5 million, $0.3 million and $3.7 million, respectively.
Employee Stock Purchase Plan
Upon the inception of NVE’s employee stock purchase plan, NVE was authorized to issue up to an aggregate of 200,162 shares of common stock to all of its employees with minimum service requirements. On June 19, 2000, shareholders approved an additional 700,000 shares for distribution under the plan. According to the terms of the plan, employees can choose twice each year to have up to 15% of their base earnings withheld to purchase NVE’s common stock. In 2008, the BOD of NVE and its stockholders, approved changes to the plan which increased the option price discount from 10% to 15%, and provided for the purchase price to be the lesser of 85% of the market value on the offering commencement date, or 85% of the market value on the offering exercise date. Employees can withdraw from the plan at any time prior to the exercise date. Under the plan NVE sold 178,152, 109,924 and 56,835 shares to employees in 2009, 2008 and 2007, respectively.
In accordance with the Stock Compensation Topic of the FASC, NVE recognized expense in 2009, 2008 and 2007 related to the employee stock purchase plan. For purposes of determining the expense for those years, compensation cost has been estimated for the employees’ purchase rights on the date of grant, using the Black-Scholes option-pricing model with the following assumptions used for 2009, 2008 and 2007, with an option life of six months:
| Year | | Average Dividend Yield | | | Average Expected Volatility | | | Average Risk-Free Rate of Return | | | Weighted Average Fair Value | |
| | | | | | | | | | | | | |
| 2009 | | | 3.90 | % | | | 28.89 | % | | | 0.22 | % | | $ | 2.54 | |
| 2008 | | | 0.00 | % | | | 40.31 | % | | | 1.22 | % | | $ | 2.56 | |
| 2007 | | | 0.00 | % | | | 20.75 | % | | | 4.13 | % | | $ | 3.02 | |
| | | | | | | | | | | | | | | | | |
Purchased Power
The Utilities have several contracts for long-term purchase of electric energy. Expiration of these contracts ranges from 2010 to 2039. Related party purchase power agreements have been eliminated from the NVE totals. Estimated future commitments under non-cancelable agreements as of December 31, 2009 were as follows (dollars in thousands):
| | | Purchased Power | |
| | | NPC | | | SPPC | | | NVE | |
| 2010 | | $ | 415,331 | | | $ | 177,295 | | | $ | 495,126 | |
| 2011 | | | 375,340 | | | | 176,400 | | | | 449,957 | |
| 2012 | | | 384,315 | | | | 173,788 | | | | 455,392 | |
| 2013 | | | 388,639 | | | | 175,180 | | | | 460,171 | |
| 2014 | | | 371,092 | | | | 180,820 | | | | 447,317 | |
| Thereafter | | | 4,034,236 | | | | 2,336,732 | | | | 4,682,309 | |
Coal, Natural Gas and Transportation
The Utilities have several long-term contracts for the purchase and transportation of coal and natural gas. These contracts expire in years ranging from 2010 to 2031. Estimated future commitments under non-cancelable agreements as of December 31, 2009 were as follows (dollars in thousands):
| | | Coal and Natural Gas | | | Transportation | |
| | | NPC | | | SPPC | | | NVE | | | NPC | | | SPPC | | | NVE | |
| 2010 | | $ | 472,859 | | | $ | 209,751 | | | $ | 682,610 | | | $ | 48,462 | | | $ | 73,588 | | | $ | 122,050 | |
| 2011 | | | 55,133 | | | | 44,564 | | | | 99,697 | | | | 52,039 | | | | 65,401 | | | | 117,440 | |
| 2012 | | | - | | | | 15,831 | | | | 15,831 | | | | 75,191 | | | | 44,777 | | | | 119,968 | |
| 2013 | | | - | | | | 14,906 | | | | 14,906 | | | | 75,065 | | | | 44,156 | | | | 119,221 | |
| 2014 | | | - | | | | 14,906 | | | | 14,906 | | | | 74,076 | | | | 44,156 | | | | 118,232 | |
| Thereafter | | | - | | | | 13,249 | | | | 13,249 | | | | 877,324 | | | | 208,248 | | | | 1,085,572 | |
Long-Term Service Agreements
NPC entered into long-term service agreements for the performance of maintenance on generation units located at the Lenzie Generating Station, the Silverhawk Generating Station and the Higgins Generating Station. SPPC entered into a long-term service agreement for the Tracy Generating Station. Future commitments under these agreements are as follows (dollars in thousands):
| | | Long-Term Service Agreements | |
| | | NPC | | | SPPC | | | NVE | |
| 2010 | | $ | 25,202 | | | $ | 5,631 | | | $ | 30,833 | |
| 2011 | | | 25,202 | | | | 5,631 | | | | 30,833 | |
| 2012 | | | 25,202 | | | | 5,631 | | | | 30,833 | |
| 2013 | | | 25,202 | | | | 5,631 | | | | 30,833 | |
| 2014 | | | 25,202 | | | | 5,631 | | | | 30,833 | |
| Thereafter | | | 89,038 | | | | 33,784 | | | | 122,822 | |
Capital Projects
Capital projects at NPC include construction of the Harry Allen Generating Station, and the construction of a Recovered Energy Generation Project. Future commitments under these agreements are as follows (dollars in thousands):
| | | Capital Projects | |
| | | NPC | | | SPPC | | | NVE | |
| 2010 | | $ | 165,496 | | | $ | - | | | $ | 165,496 | |
| 2011 | | | 8,121 | | | | - | | | | 8,121 | |
| 2012 | | | - | | | | - | | | | - | |
| 2013 | | | 34,397 | | | | - | | | | 34,397 | |
Operating Leases
NPC and SPPC have entered into various operating leases for buildings, land and equipment. Rent payments for 2009, 2008 and 2007 were $13.8 million, $10.8 million and $5.7 million, respectively, for NPC. Rent payments for 2009, 2008 and 2007 were $13.9 million, $12.1 million and $10.5 million, respectively, for SPPC. NVE’s, NPC’s and SPPC’s estimated future minimum cash payments under non-cancelable operating leases as of December 31, 2009, were as follows (dollars in thousands):
| | | Operating Leases | |
| | | NPC | | | SPPC | | | NVE | |
| 2010 | | $ | 12,648 | | | $ | 13,745 | | | $ | 26,393 | |
| 2011 | | | 10,341 | | | | 8,526 | | | | 18,867 | |
| 2012 | | | 8,373 | | | | 7,162 | | | | 15,535 | |
| 2013 | | | 7,981 | | | | 6,529 | | | | 14,510 | |
| 2014 | | | 7,183 | | | | 5,741 | | | | 12,924 | |
| Thereafter | | | 64,202 | | | | 39,872 | | | | 104,074 | |
Environmental
NPC
Reid Gardner Generating Station
Surface and Groundwater Matters
The Reid Gardner Generating Station is a coal generating station consisting of four units. NPC is the owner and operator of Unit Nos. 1, 2 and 3. Unit No. 4 is co-owned by the CDWR 67.8% and 32.2% by NPC. NPC is the operating agent for Unit No. 4.
The Reid Gardner Generating Station has a number of raw water and scrubber make-up storage ponds, as well as lined ponds used for process water evaporation. Process water, which has been used beyond the treatable limits, is routed to lined onsite ponds for evaporation. Solid waste management units are present throughout the site and surrounding area. Environmental contaminants identified at the Reid Gardner Generating Station include but are not limited to, elevated concentrations of total dissolved solids, sulfate, chloride, dissolved metals, volatile organic compounds and petroleum hydrocarbons.
In August 1999, the NDEP issued a discharge permit to the Reid Gardner Generating Station and an Order that requires all evaporation and fly ash settling ponds to be closed or lined with impermeable liners over the next ten years. This order also required NPC to submit a Site Characterization Plan to NDEP to ascertain impacts. This plan has been reviewed and approved by NDEP. In
collaboration with NDEP, NPC has evaluated remediation requirements. In May 2004, NPC submitted a schedule of remediation actions to NDEP which included proposed dates for corrective action plans and/or suggested additional assessment plans for each specified area. Any future ponds will be double-lined with inter-liner leak detection in accordance with the most recent NDEP Authorization to Discharge Permit issued October 2005.
Pond construction and lining costs to satisfy the NDEP order expended through December 31, 2009 was approximately $42.0 million. No additional expenditures associated with this order are projected as the final pond was closed per the requirements of the order on October 21, 2009.
In 2006 NPC and the Corrective Actions Division of NDEP began discussions regarding what additional soil and groundwater remediation may be required at the site, beyond the scope of the current pond relining project. The proposed solution was to enter into an Administrative Order of Consent (AOC), which was delivered in final form to NPC in December 2007.
In February 2008, NPC signed the AOC as owner and operator of Unit Nos. 1, 2 and 3 and as co-owner and operating agent of Unit No. 4. Furthermore, the AOC has been designed to supersede previous Orders and takes a comprehensive approach to address historical environmental impacts associated with facility operations. As a result, NPC has recorded an asset retirement obligation as referenced in Note 1, Summary of Significant Accounting Policies of the Notes to the Financial Statements and capital and remediation costs of approximately $32.3 million in addition to a 2008 charge to operating and maintenance expense of approximately $1.3 million. However, these estimates may vary significantly once the scope of work is further defined and additional characterization has been completed.
Air Quality Matters
In June 2006, the EPA issued a Finding and Notice of Violation (NOV) related to monitoring, recordkeeping and emission exceedances at the Reid Gardner Generating Station. In April 2007, NPC lodged a Consent Decree in federal district court with NDEP, EPA and the Department of Justice regarding the NOVs and providing for additional environmental controls and equipment changes, environmental benefit projects, monetary penalties, and/or other measures required to resolve the alleged violations. Terms of the Consent Decree included a $1.1 million fine, which was paid during 2007, funding of an approximately $2 million Supplemental Environmental Project (SEP) with the Clark County School District, and the installation of emission reduction equipment at the facility. The SEP was aimed at achieving increased energy efficiency and cost savings for the school district and involved extensive lighting retrofits at multiple schools in the Las Vegas valley. Certain environmental controls and equipment changes needed to assure compliance with existing or modified regulations, and which satisfied the terms of the consent decree, were previously submitted by NPC to the PUCN in NPC’s 2006 IRP filing. Installation of the required environmental controls was fully completed in 2009. These expenditures were approved by the PUCN in late 2006 and include equipment installation on the various units to control startup opacity and particulates and reduce operating opacity and oxides of nitrogen. Capital expenditures are estimated at $92.3 million, of which $84 million was approved by the PUCN in NPC’s 2006 IRP, which is still subject to prudency review. NPC will seek full recovery of these amounts in a future GRC filing.
NEICO
NEICO, a wholly-owned subsidiary of NPC, owns property in Wellington, Utah, which was the site of a coal washing and load-out facility. The site has a reclamation estimate supported by a bond of approximately $5 million with the Utah Division of Oil and Gas Mining, which management believes is sufficient to cover reclamation costs. Management is continuing to evaluate various options including reclamation and sale.
SPPC
Valmy Generating Station
On June 22, 2009, SPPC received a request for information from the EPA—Region 9 under Section 114 of the Federal Clean Air Act requesting current and historical operations and capital project information for SPPC’s Valmy Generating Station located in Valmy, Nevada. SPPC co-owns and operates this coal-fired plant. Idaho Power Company owns the remaining 50%. The EPA’s Section 114 information request does not allege any incidents of non-compliance at the plant, and there have been no other new enforcement-related proceedings that have been initiated by the EPA relating to the plant. SPPC completed its response to the EPA in December 2009 and will continue to monitor developments relating to this Section 114 request. SPPC cannot predict the impact, if any, associated with this information request.
Litigation Contingencies
NPC and SPPC
Calpine Settlement
On September 19, 2007, NPC, SPPC and Calpine entered into a settlement agreement (the “Settlement Agreement”) that resolved the issues and claims pertaining to three proofs of claim (Claim Nos. 5177, 5178 and 5179) filed by the Utilities against Calpine in Calpine’s bankruptcy proceeding. The Settlement Agreement was approved by the United States Bankruptcy Court for the Southern District of New York on October 10, 2007, and by the FERC on December 28, 2007, in orders that are final and non-appealable.
Claim Nos. 5177 and 5179 filed by SPPC and NPC relate to complaints filed with FERC in December 2001 under Section 206 of the Federal Power Act seeking price reduction of forward wholesale power purchase contracts entered into prior to the FERC mandated price caps imposed in reaction to the Western United States energy crisis. The Settlement Agreement provided that, for Claim Nos. 5177 and 5179, SPPC and NPC would receive general unsecured claims in the Calpine bankruptcy proceeding of approximately $1.7 million and $1.3 million respectively, totaling $3 million. In February 2008, Calpine distributed shares of Calpine common stock to SPPC and NPC with respect to Claim Nos. 5177 and 5179, at the approximate value at the time of the distribution of approximately $1.3 million, and $1.1 million, respectively. The Utilities recognized these amounts as income for the year ended December 31, 2008.
Claim No. 5178 filed by NPC regarding Calpine’s alleged breach of a 400 MW TSA and a 2002 settlement agreement approved by the FERC. The Settlement Agreement provided that the claim shall be amended to reflect a general unsecured claim of $18 million against Calpine. NPC agreed to treat the distribution in respect to Claim No. 5178 as a prepayment for a new 400 MW TSA (“New TSA”) with a term commencing January 1, 2008 and ending approximately March 31, 2010, assuming no change in NPC’s OATT service schedules and, in the event of any such changes, ending on the date the $18 million is depleted based on the applicable OATT service rate schedule. In February 2008, Calpine distributed shares of Calpine common stock to NPC having an approximate value at that time of $14.4 million, which will be recognized as transmission revenue over the term of the new TSA.
The distributions discussed above represent approximately 80% of the balance owed to NPC and SPPC under the three proofs of claims filed. Management cannot predict if the remaining 20% will be recovered due to the status of Calpine’s bankruptcy proceedings, and as such has not recorded any further amounts as income. Subsequent to the distribution, NPC and SPPC sold all of their shares of Calpine common stock and recorded a gain of $1.8 million for the year ended December 31, 2008.
NPC
Lawsuit Against Natural Gas Providers
In April 2003, NVE (originally filed under the corporate name of SPR) and NPC filed a complaint in the U.S. District Court for the District of Nevada against several natural gas providers and traders seeking restitution of excessive prices paid for natural gas during the Western Energy Crisis. In July 2003, NVE and NPC filed a First Amended Complaint. A Second Amended Complaint was filed in June 2004, which named three different groups of defendants: (1) El Paso Corporation, El Paso Natural Gas Company, El Paso Merchant Energy, L.P., El Paso Merchant Energy Company, El Paso Tennessee Pipeline Company, El Paso Merchant Energy-Gas Company (“El Paso”); (2) Dynegy Marketing and Trade (“Dynegy”); and (3) Sempra Energy, Sempra Energy Trading Corporation, Southern California Gas Company, and San Diego Gas and Electric (“Sempra”). On December 13, 2005, the District Court dismissed NVE and NPC’s claims. NVE and NPC appealed this decision to the Ninth Circuit Court of Appeals. Subsequently, NVE abandoned its appeal and the matter proceeded only with respect to NPC. In September 2007, the Ninth Circuit reversed the District Court’s order. In November 2007, the Ninth Circuit denied the gas providers and traders’ petition for rehearing. The Ninth Circuit remanded the case to the District Court for further proceedings. In January 2008, the defendants filed motions to dismiss, to which NPC responded in February 2008. In June 2008, NPC’s claims survived the defendant’s filed motions to dismiss and proceeded to discovery. On December 9, 2008, NPC settled with Sempra for an immaterial amount. In June 2009, NPC reached settlement agreements with both Dynegy and El Paso. Any disputes between the parties have now been resolved and all claims have been dismissed.
Peabody Western Coal Company
NPC owns an 11% interest in the Navajo Generating Station which is located in Northern Arizona and is operated by Salt River. Other participants in the Navajo Generating Station are Arizona Public Service Company, Los Angeles Department of Water and Power and Tucson Electric Power Company (together with Salt River and NPC, the “Navajo Joint Owners”). NPC also owns a 14% interest in the Mohave Generating Station which is located in Laughlin, Nevada and was operated by Southern California Edison (SCE) prior to the time it became non-operational on December 31, 2005.
Royalty Claim
On October 15, 2004, the Navajo Generating Station’s coal supplier, Peabody Western Coal Co. (Peabody WC), filed a complaint against the Navajo Joint Owners in Missouri State Court in St. Louis, alleging, among other things, a declaration that the Navajo Joint Owners are obligated to reimburse Peabody WC for any royalty, tax or other obligations arising out of a lawsuit that the Navajo Nation filed against Salt River, several Peabody Coal Company entities (including Peabody WC and collectively referred to as “Peabody”) and SCE in June 1999 in the U.S. District Court for the District of Columbia (DC Lawsuit).
The Navajo Joint owners were first served in the Missouri lawsuit in January 2005. The operating agent for the Navajo Generating Station, Salt River, defended the suit on behalf of the Navajo Joint Owners In July 2008, the Court dismissed all counts against NPC, two without prejudice to their possible refiling at a later date. NPC is unable to predict whether any liability may arise from any of these matters, including from the ultimate outcome of the DC Lawsuit.
NPC is not a party to the DC Lawsuit although, as noted above, it is a participant in both the Navajo Generating Station and the Mohave Generating Station. The DC Lawsuit consists of various claims relating to the renegotiations of coal royalty and lease agreements and alleges, among other things, that the defendants obtained a favorable coal royalty rate for the lease agreements under which Peabody mines coal for both the Navajo Generating Station and the Mohave Generating Station by improperly influencing the outcome of a federal administrative process pursuant to which the royalty rate was to be adjusted. The DC Lawsuit seeks $600 million in damages, treble damages, and punitive damages of not less than $1 billion, and the ejection of defendants from all possessory interests and Navajo Tribal lands arising out of the primary coal lease. In July 2001, the U.S. District Court dismissed all claims against Salt River. The action had been stayed since October, 2004 until March, 2008, when the U.S. District Court lifted the stay and referred pending discovery related motions to a Magistrate judge. Those discovery motions have now been resolved and the Court ordered substantial completion of factual discovery (except for certain depositions) by July 15, 2010. Management cannot predict the timing or outcome of a decision on this matter.
Retiree Health Care and Reclamation Claims
In addition to the above action before the Missouri State Court, Peabody further asserted in 1994 that the Navajo Joint Owners are liable under the CSA for Retiree Health Care Costs (RHCC) and Final Reclamation Costs (FRC), which Peabody WC is obligated to pay after the CSA expires and the Kayenta Mine closes. In 1996, Salt River and the Navajo Joint Owners filed a complaint in the Maricopa County (Arizona) Supreme Court seeking determinations that they are not liable for RHCC or FRC or, alternatively, that Peabody WC cannot recover RHCC and FRC until after the CSA ends. The case was dormant for several years, while Peabody WC pursued other RHCC and FRC claims arising out of similar coal contracts. Settlement discussions, led by Salt River on both the RHCC matter and the FRC claim reached final approvals with Peabody WC and the Navajo Joint Owners in July 2008 (Settlement Agreement and Mutual Release with Peabody). As of December 31, 2009, NPC has a $17.4 million liability recorded which management has assessed as the approximate amount to be paid, and recorded a corresponding other regulatory asset for such claims, as management believes that these costs are recoverable through deferred energy. The underlying lawsuit and arbitration have both been dismissed.
SPPC
Farad Dam
SPPC sold four hydro generating units, (10.3 MW total capacity), located in Nevada and California, for $8 million to TMWA in June 2001. The Farad Hydro (2.8 MW), has been out of service since the summer of 1996 due to a collapsed flume. The current estimate to rebuild the diversion dam, if management decides to proceed, is approximately $20 million. Under the terms of the contract with TMWA, SPPC is not entitled to receive the proceeds of sale relating to Farad unless and until it has reconstructed the Farad facility in a manner reasonably acceptable to TMWA or, alternatively SPPC assigns its casualty loss claim to TMWA and TMWA is reasonably satisfied regarding its rights with respect to such claim.
SPPC filed a claim with the insurers Hartford Steam Boiler Inspection and Insurance Co. and Zurich-American Insurance Company (collectively, the “Insurers”) for the Farad flume and Farad Dam. In December 2003, SPPC sued the Insurers in the U.S. District Court for the District of Nevada on a coverage dispute relating to potential rebuild costs for Farad Dam. The case went to trial before the Court in April 2008. On September 30, 2008, the Court ruled that SPPC was not time barred from reconstructing Farad Dam, and has coverage for the full rebuild costs, subject to coverage sub-limits set forth in the insurance policies. The Court further ruled that SPPC is entitled to recover $4 million for costs incurred to date on Farad Dam and that SPPC shall have three years to rebuild the dam from the date of the Court’s decision. In the event Farad Dam is not rebuilt, the Court determined SPPC would be entitled to actual cash value of approximately $1.3 million. SPPC has requested the court to reconsider the cash value to reflect rebuild costs and the Insurers opposed. The Insurers time to file an appeal on the Court’s decision had been suspended pending the Court’s determination on the cash value reconsideration. On July 10, 2009, the District Court declined SPPC’s request to reconsider the cash value and further ordered that the three year period to replace the dam commences as of July 10th (Order). In early August 2009, SPPC appealed the District Court’s $1.3 million cash value determination with the U.S. Court of Appeals for the Ninth Circuit
(Ninth Circuit Court). Subsequently, in August 2009, the Insurers appealed the District Court’s insurance coverage decision with the Ninth Circuit Court. In January 2010, the Ninth Circuit Court ordered the parties to complete briefing on both appeals by April 2010.
Other Legal Matters
NVE and its subsidiaries, through the course of their normal business operations, are currently involved in a number of other legal actions, none of which, in the opinion of management, is expected to have a significant impact on their financial positions, results of operations or cash flows.
Rights Agreement
In December 2005, the BOD voted to amend the Rights Agreement, dated as of February 2001 (as amended and restated, the “Rights Agreement”), between NVE and Wells Fargo Bank Minnesota, N.A., to accelerate the final expiration date of the rights (“Rights”) issued thereunder to December 2005, and to terminate the Rights Agreement upon the expiration of the Rights. The BOD also adopted a policy governing future entry into a shareholder rights agreement or similar agreement (a “shareholder rights plan”). NVE’s policy is to seek shareholder approval prior to the adoption of a shareholder rights plan, unless the BOD, in the exercise of its fiduciary duties and with the concurrence of a majority of its independent members, determines that, under the circumstances existing at the time, it is in the best interest of NVE’s shareholders to adopt a shareholder rights plan without first obtaining shareholder approval. If a shareholder rights plan is adopted without prior shareholder approval, the plan must provide that it shall expire, unless ratified by shareholders, within one year of adoption.
Stock Ownership Plans
As of December 31, 2009, 10,956,240 shares of common stock were reserved for issuance under the Common Stock Investment Plan (CSIP), Employees’ Stock Purchase Plan (ESPP), and Executive Long-Term Incentive Plan (LTIP).
The 2005 LTIP for officers and key employees allows for the issuance of NVE’s common shares through December 2013, which can be earned and issued prior to December 2013. This Plan permits the following types of grants, separately or in combination: nonqualified and qualified stock options; stock appreciation rights; restricted stock; performance units; performance shares, bonus stock and cash.
NVE also provides an ESPP to all of its employees meeting minimum service requirements. Employees can choose twice each year (offering date) to have up to 15% of their base earnings withheld to purchase NVE common stock. The purchase price of the stock is 85% of the market value on the offering date or the execution date, whichever is less.
Non-Employee Director Stock
The Non-employee Director Stock Plan provides that a portion of NVE’s outside directors’ annual retainer be paid in NVE common stock. In addition, in 1996, NVE eliminated its outside director retirement plan and converted the present value of each director’s vested retirement benefit to phantom stock based on the stock price at the time of conversion. Phantom stock earns dividends, also payable in phantom stock, which are recorded in each Director’s phantom account. The value of these accounts is issued in stock or cash, at the election of the BOD, at the time the Director leaves the BOD.
The annual retainer for non-employee directors is $120,000, and the minimum amount to be paid in NVE stock is $75,000 per director. During 2009, 2008, and 2007, NVE granted the following total shares and related compensation to directors including NVE stock, respectively: 93,730, 72,573, and 27,300, shares, and $450,015, $396,309, and $280,000.
Common Stock Offering
In December 2007, NVE issued 12 million shares of its $1 par value common stock. Net proceeds from the issuance were $202.8 million. In December 2007, NVE contributed capital to NPC of approximately $65 million, and to SPPC of approximately $65 million. Both Utilities used the proceeds to repay indebtedness under their revolving credit facilities, and for general corporate purposes. Additionally, NVE contributed capital to NPC of approximately $146.6 million and to SPPC of approximately $20 million for general corporate purposes in 2008.
Common Stock Investment Plan
NVE offers a Common Stock Investment Plan (CSIP, or the Plan) for the purpose of promoting long-term ownership by providing a convenient method to purchase shares of our common stock and to reinvest cash dividends. New investors can purchase common stock directly from the company for as little as $250 for the first purchase. Existing shareholders can purchase additional
shares up to once per month for as little as $50. Shares are purchased on the first business day of each month with the exception of months in which a dividend is paid where purchases are scheduled to be made on the date of the dividend payment. Through this Plan, shareholders can also choose to reinvest all or a portion (specified in increments of 10%) of cash dividends to purchase additional shares of common stock.
Dividends
| | | Dividends declared per share | |
| | | 2009 | | | 2008 | |
| First Quarter | | $ | 0.10 | | | $ | 0.08 | |
| Second Quarter | | | 0.10 | | | | 0.08 | |
| Third Quarter | | | 0.10 | | | | 0.08 | |
| Fourth Quarter | | | 0.11 | | | | 0.10 | |
On February 2, 2010, NVE’s BOD declared a quarterly cash dividend of $0.11 per share payable on March 17, 2010, to common shareholders of record on March 2, 2010.
During 2009 and 2008, NPC paid dividends to NVE of $112.0 million and $54.9 million, respectively. During 2009 and 2008, SPPC paid dividends to NVE of $128.8 million and $141.5 million, respectively.
The difference between basic EPS and diluted EPS is due to potentially dilutive common shares resulting from stock options, the non-employee director stock plan, the employee stock purchase plan, and the performance and restricted stock plans.
The following table outlines the calculation for earnings per share (EPS):
| | | Year Ended December 31, | |
| | | 2009 | | | 2008 | | | 2007 | |
| Basic EPS | | | | | | | | | |
| Numerator ($000) | | | | | | | | | |
| | | | | | | | | | |
| Net income | | $ | 182,936 | | | $ | 208,887 | | | $ | 197,295 | |
| | | | | | | | | | | | | |
| Denominator | | | | | | | | | | | | |
| Weighted average number of common shares outstanding | | | 234,542,292 | | | | 234,031,750 | | | | 222,180,440 | |
| | | | | | | | | | | | | |
| Per Share Amounts | | | | | | | | | | | | |
| | | | | | | | | | | | | |
| Net income per share - basic | | $ | 0.78 | | | $ | 0.89 | | | $ | 0.89 | |
| | | | | | | | | | | | | |
| Diluted EPS | | | | | | | | | | | | |
| Numerator ($000) | | | | | | | | | | | | |
| | | | | | | | | | | | | |
| Net income | | $ | 182,936 | | | $ | 208,887 | | | $ | 197,295 | |
| | | | | | | | | | | | | |
Denominator (1) | | | | | | | | | | | | |
| Weighted average number of shares outstanding before dilution | | | 234,542,292 | | | | 234,031,750 | | | | 222,180,440 | |
| Stock options | | | 27,596 | | | | 39,556 | | | | 123,124 | |
| Non-Employee Director stock plan | | | 100,244 | | | | 63,636 | | | | 46,551 | |
| Employee stock purchase plan | | | 7,331 | | | | 4,615 | | | | 878 | |
| Restricted Shares | | | 12,389 | | | | 1,842 | | | | - | |
| Performance Shares | | | 490,836 | | | | 443,605 | | | | 203,031 | |
| | | | 235,180,688 | | | | 234,585,004 | | | | 222,554,024 | |
| | | | | | | | | | | | | |
| Per Share Amounts | | | | | | | | | | | | |
| | | | | | | | | | | | | |
| Net income per share - diluted | | $ | 0.78 | | | $ | 0.89 | | | $ | 0.89 | |
| | | | | | | | | | | | | |
(1) | The denominator does not include stock equivalents for all the options issued under the nonqualified stock option plan for the years ended December 31, 2009, 2008, and 2007, due to conversion prices being higher than market prices for all periods. Under this plan, an additional 679,272, 943,231, and 638,250 shares, respectively, would be included in each of these periods if the conditions for conversions were met. |