
Berkshire Hathaway Energy 2016 Fixed-Income Investor Conference A Berkshire Hathaway Company

Forward-Looking Statements This presentation contains statements that do not directly or exclusively relate to historical facts. These statements are "forward-looking statements" within the meaning of Section 27A of the Securities Act of 1933, as amended, and Section 21E of the Securities Exchange Act of 1934, as amended. Forward-looking statements can typically be identified by the use of forward-looking words, such as "will," "may," "could," "project," "believe," "anticipate," "expect," "estimate," "continue," "intend," "potential," "plan,“ "forecast" and similar terms. These statements are based upon Berkshire Hathaway Energy Company (“BHE”) and its subsidiaries, PacifiCorp and its subsidiaries, MidAmerican Funding, LLC and its subsidiaries, MidAmerican Energy Company, Nevada Power Company and its subsidiaries or Sierra Pacific Power Company and its subsidiaries (collectively, the “Registrants”), as applicable, current intentions, assumptions, expectations and beliefs and are subject to risks, uncertainties and other important factors. Many of these factors are outside the control of each Registrant and could cause actual results to differ materially from those expressed or implied by such forward-looking statements. These factors include, among others: – general economic, political and business conditions, as well as changes in, and compliance with, laws and regulations, including reliability and safety standards, affecting the Registrants' operations or related industries; – changes in, and compliance with, environmental laws, regulations, decisions and policies that could, among other items, increase operating and capital costs, reduce facility output, accelerate facility retirements or delay facility construction or acquisition; – the outcome of rate cases and other proceedings conducted by regulatory commissions or other governmental and legal bodies and the Registrants' ability to recover costs through rates in a timely manner; – changes in economic, industry, competition or weather conditions, as well as demographic trends, new technologies and various conservation, energy efficiency and distributed generation measures and programs, that could affect customer growth and usage, electricity and natural gas supply or the Registrants' ability to obtain long-term contracts with customers and suppliers; – performance, availability and ongoing operation of the Registrants' facilities, including facilities not operated by the Registrants, due to the impacts of market conditions, outages and repairs, transmission constraints, weather, including wind, solar and hydroelectric conditions, and operating conditions; – a high degree of variance between actual and forecasted load or generation that could impact the Registrants' hedging strategy and the cost of balancing its generation resources with its retail load obligations; – changes in prices, availability and demand for wholesale electricity, coal, natural gas, other fuel sources and fuel transportation that could have a significant impact on generating capacity and energy costs; – the financial condition and creditworthiness of the Registrants' significant customers and suppliers; – changes in business strategy or development plans; – availability, terms and deployment of capital, including reductions in demand for investment-grade commercial paper, debt securities and other sources of debt financing and volatility in the London Interbank Offered Rate, the base interest rate for the Registrants' credit facilities; – changes in the Registrant's respective credit ratings; – risks relating to nuclear generation, including unique operational, closure and decommissioning risks; – hydroelectric conditions and the cost, feasibility and eventual outcome of hydroelectric relicensing proceedings; – the impact of certain contracts used to mitigate or manage volume, price and interest rate risk, including increased collateral requirements, and changes in commodity prices, interest rates and other conditions that affect the fair value of certain contracts;

Forward-Looking Statements – the impact of inflation on costs and the ability of the respective Registrants to recover such costs in regulated rates; – fluctuations in foreign currency exchange rates, primarily the British pound and the Canadian dollar; – increases in employee healthcare costs; – the impact of investment performance and changes in interest rates, legislation, healthcare cost trends, mortality and morbidity on pension and other postretirement benefits expense and funding requirements; – changes in the residential real estate brokerage and mortgage industries and regulations that could affect brokerage and mortgage transactions; – unanticipated construction delays, changes in costs, receipt of required permits and authorizations, ability to fund capital projects and other factors that could affect future facilities and infrastructure additions; – the availability and price of natural gas in applicable geographic regions and demand for natural gas supply; – the impact of new accounting guidance or changes in current accounting estimates and assumptions on the consolidated financial results of the respective Registrants; – the ability to successfully integrate future acquired operations into its business; – the effects of catastrophic and other unforeseen events, which may be caused by factors beyond the control of each respective Registrant or by a breakdown or failure of the Registrants' operating assets, including storms, floods, fires, earthquakes, explosions, landslides, mining accidents, litigation, wars, terrorism, and embargoes; and – other business or investment considerations that may be disclosed from time to time in the Registrants' filings with the United States Securities and Exchange Commission (“SEC”) or in other publicly disseminated written documents. Further details of the potential risks and uncertainties affecting the Registrants are described in the Registrants’ filings with the SEC. Each Registrant undertakes no obligation to publicly update or revise any forward-looking statements, whether as a result of new information, future events or otherwise. The foregoing factors should not be construed as exclusive. This presentation includes certain non-Generally Accepted Accounting Principles (“GAAP”) financial measures as defined by the SEC’s Regulation G. Refer to the BHE Appendix in this presentation for a reconciliation of those non-GAAP financial measures to the most directly comparable GAAP measures.

2016 Fixed-Income Investor Conference Pat Goodman Executive Vice President and Chief Financial Officer Berkshire Hathaway Energy
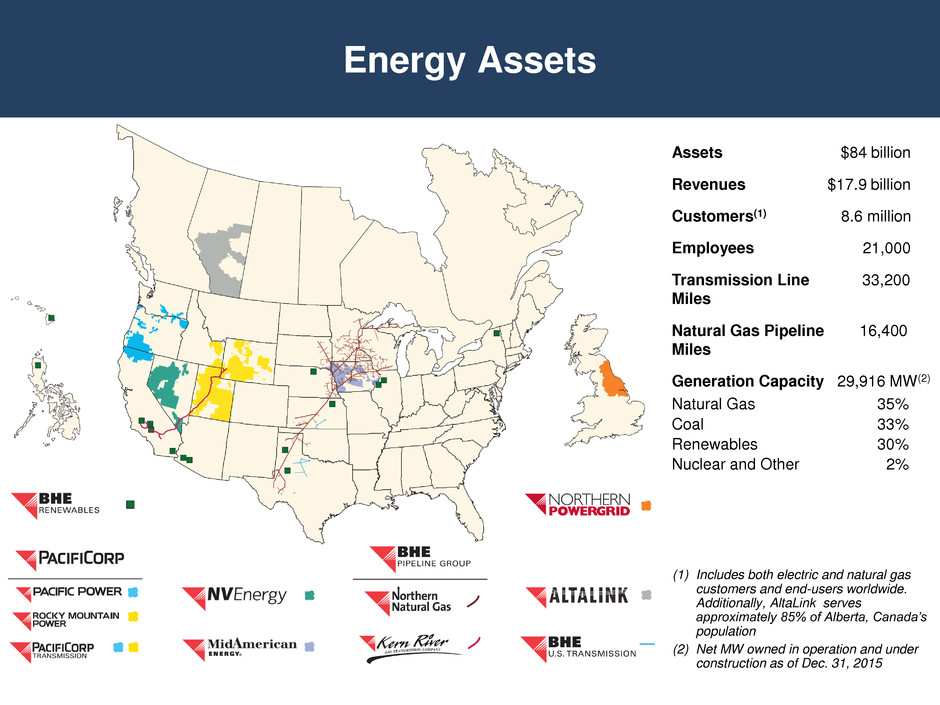
Energy Assets (1) Includes both electric and natural gas customers and end-users worldwide. Additionally, AltaLink serves approximately 85% of Alberta, Canada’s population (2) Net MW owned in operation and under construction as of Dec. 31, 2015 Assets $84 billion Revenues $17.9 billion Customers(1) 8.6 million Employees 21,000 Transmission Line 33,200 Miles Natural Gas Pipeline 16,400 Miles Generation Capacity 29,916 MW(2) Natural Gas 35% Coal 33% Renewables 30% Nuclear and Other 2%
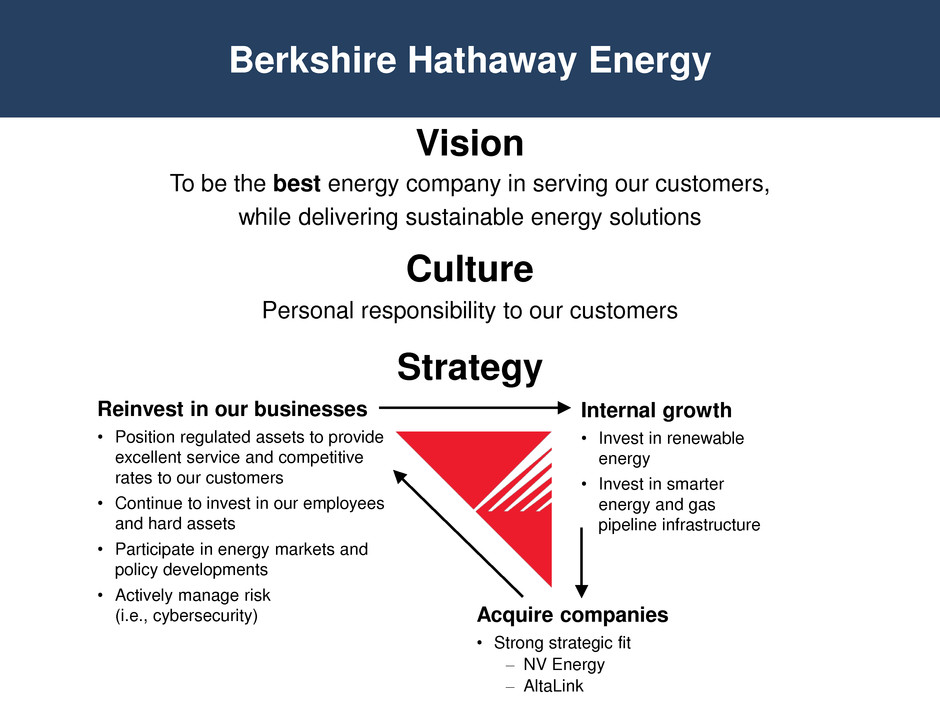
Berkshire Hathaway Energy Vision To be the best energy company in serving our customers, while delivering sustainable energy solutions Culture Personal responsibility to our customers Strategy Reinvest in our businesses • Position regulated assets to provide excellent service and competitive rates to our customers • Continue to invest in our employees and hard assets • Participate in energy markets and policy developments • Actively manage risk (i.e., cybersecurity) Internal growth • Invest in renewable energy • Invest in smarter energy and gas pipeline infrastructure Acquire companies • Strong strategic fit – NV Energy – AltaLink
BHE Competitive Advantage • Diversified portfolio of regulated assets – Weather, customer, regulatory, generation, economic and catastrophic risk diversity • Berkshire Hathaway ownership – Access to capital from Berkshire Hathaway allows us to take advantage of market opportunities – Berkshire Hathaway is a long-term holder of assets; its owner for life philosophy promotes stability and helps make BHE the buyer of choice in many circumstances – Tax appetite of Berkshire Hathaway has allowed us to receive significant cash tax benefits from our parent of $1.8 billion and $764 million in 2015 and 2014, respectively • No dividend requirement – Cash flow is retained in the business and used to help fund growth and strengthen our balance sheet
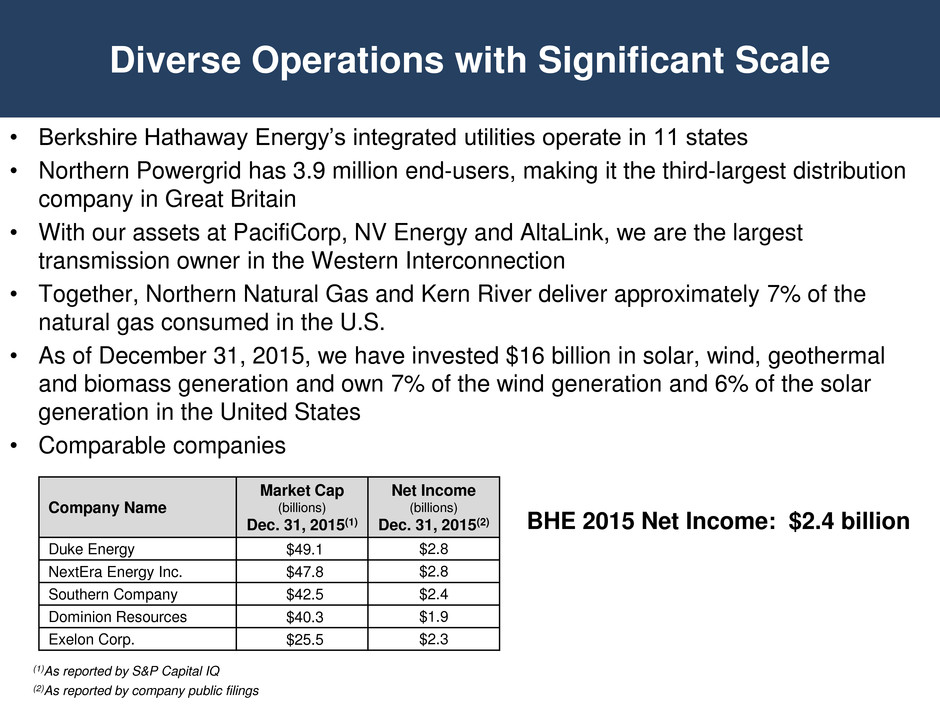
Diverse Operations with Significant Scale • Berkshire Hathaway Energy’s integrated utilities operate in 11 states • Northern Powergrid has 3.9 million end-users, making it the third-largest distribution company in Great Britain • With our assets at PacifiCorp, NV Energy and AltaLink, we are the largest transmission owner in the Western Interconnection • Together, Northern Natural Gas and Kern River deliver approximately 7% of the natural gas consumed in the U.S. • As of December 31, 2015, we have invested $16 billion in solar, wind, geothermal and biomass generation and own 7% of the wind generation and 6% of the solar generation in the United States • Comparable companies (1)As reported by S&P Capital IQ (2)As reported by company public filings BHE 2015 Net Income: $2.4 billion Company Name Market Cap (billions) Dec. 31, 2015(1) Net Income (billions) Dec. 31, 2015(2) Duke Energy $49.1 $2.8 NextEra Energy Inc. $47.8 $2.8 Southern Company $42.5 $2.4 Dominion Resources $40.3 $1.9 Exelon Corp. $25.5 $2.3
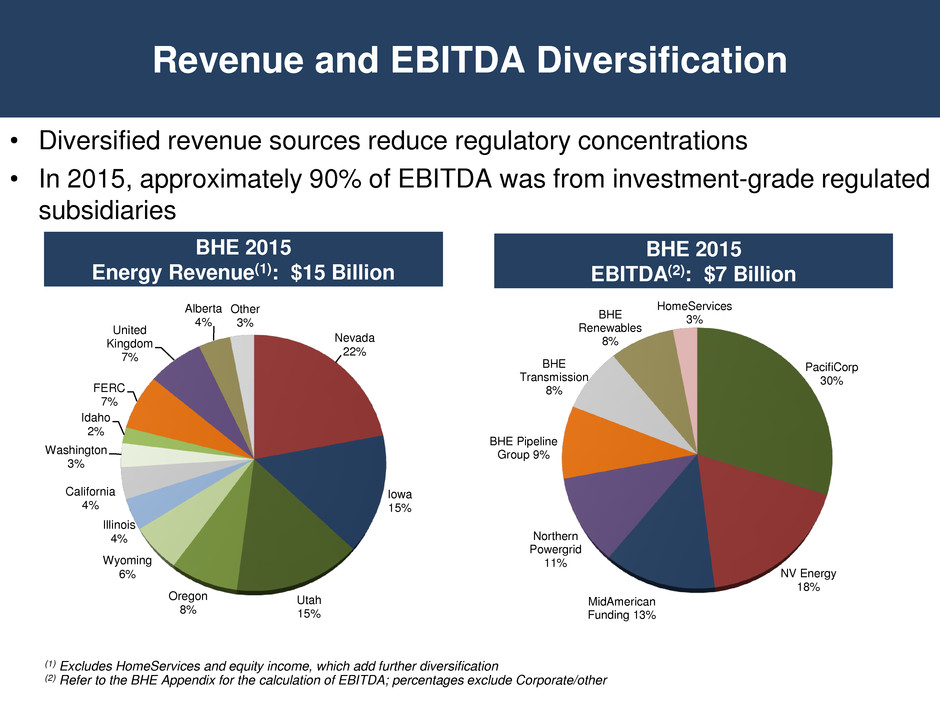
Revenue and EBITDA Diversification BHE 2015 Energy Revenue(1): $15 Billion BHE 2015 EBITDA(2): $7 Billion (1) Excludes HomeServices and equity income, which add further diversification (2) Refer to the BHE Appendix for the calculation of EBITDA; percentages exclude Corporate/other Nevada 22% Iowa 15% Utah 15% Oregon 8% Wyoming 6% Illinois 4% California 4% Washington 3% Idaho 2% FERC 7% United Kingdom 7% Alberta 4% Other 3% PacifiCorp 30% NV Energy 18% MidAmerican Funding 13% Northern Powergrid 11% BHE Pipeline Group 9% BHE Transmission 8% BHE Renewables 8% HomeServices 3% • Diversified revenue sources reduce regulatory concentrations • In 2015, approximately 90% of EBITDA was from investment-grade regulated subsidiaries
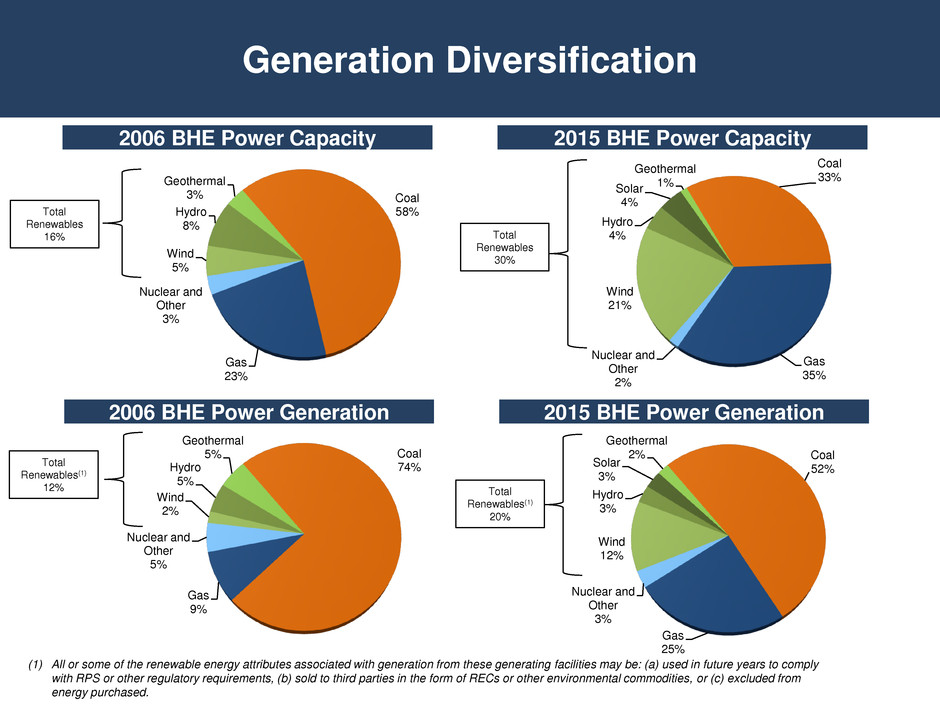
Coal 74% Gas 9% Nuclear and Other 5% Wind 2% Hydro 5% Geothermal 5% Coal 58% Gas 23% Nuclear and Other 3% Wind 5% Hydro 8% Geothermal 3% Generation Diversification Coal 52% Gas 25% Nuclear and Other 3% Wind 12% Hydro 3% Solar 3% Geothermal 2% 2006 BHE Power Capacity 2006 BHE Power Generation Total Renewables 16% Coal 33% Gas 35% Nuclear and Other 2% Wind 21% Hydro 4% Solar 4% Geothermal 1% 2015 BHE Power Capacity 2015 BHE Power Generation Total Renewables 30% Total Renewables(1) 12% Total Renewables(1) 20% (1) All or some of the renewable energy attributes associated with generation from these generating facilities may be: (a) used in future years to comply with RPS or other regulatory requirements, (b) sold to third parties in the form of RECs or other environmental commodities, or (c) excluded from energy purchased.
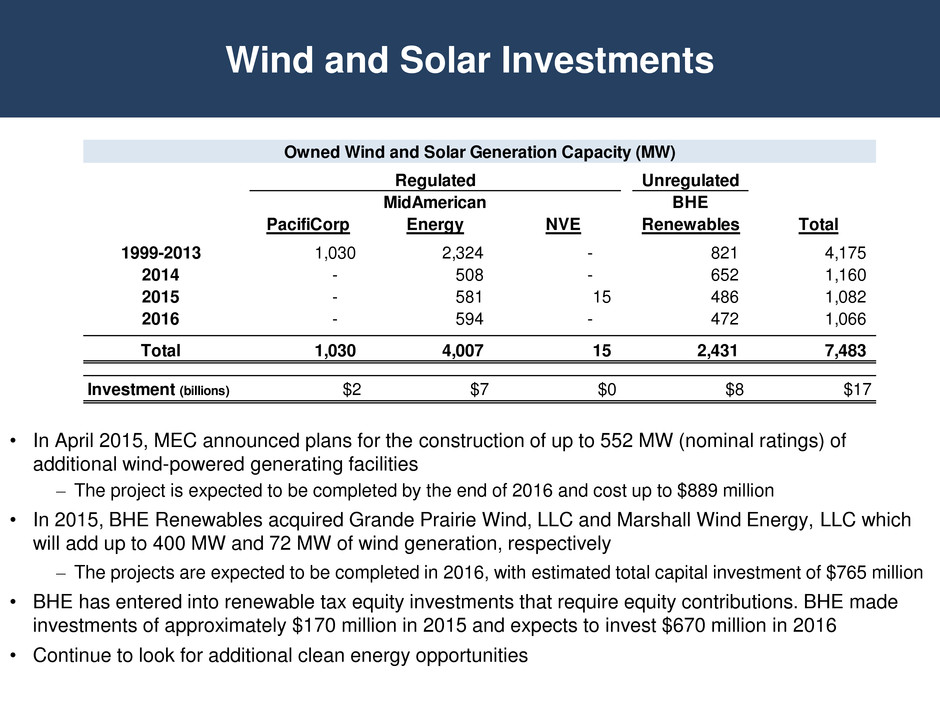
Wind and Solar Investments • In April 2015, MEC announced plans for the construction of up to 552 MW (nominal ratings) of additional wind-powered generating facilities – The project is expected to be completed by the end of 2016 and cost up to $889 million • In 2015, BHE Renewables acquired Grande Prairie Wind, LLC and Marshall Wind Energy, LLC which will add up to 400 MW and 72 MW of wind generation, respectively – The projects are expected to be completed in 2016, with estimated total capital investment of $765 million • BHE has entered into renewable tax equity investments that require equity contributions. BHE made investments of approximately $170 million in 2015 and expects to invest $670 million in 2016 • Continue to look for additional clean energy opportunities Owned Wind and Solar Generation Capacity (MW) Regulated Unregulated MidAmerican BHE PacifiCorp Energy NVE Renewables Total 1999-2013 1,030 2,324 - 821 4,175 2014 - 508 - 652 1,160 2015 - 581 15 486 1,082 2016 - 594 - 472 1,066 Total 1,030 4,007 15 2,431 7,483 Investment (billions) $2 $7 $0 $8 $17
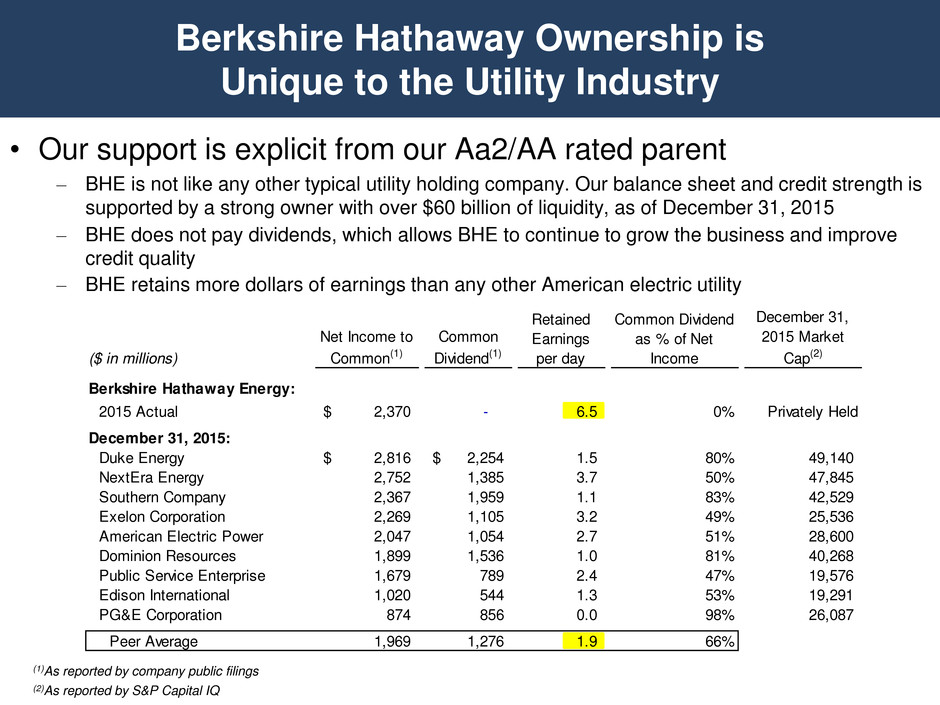
• Our support is explicit from our Aa2/AA rated parent – BHE is not like any other typical utility holding company. Our balance sheet and credit strength is supported by a strong owner with over $60 billion of liquidity, as of December 31, 2015 – BHE does not pay dividends, which allows BHE to continue to grow the business and improve credit quality – BHE retains more dollars of earnings than any other American electric utility Berkshire Hathaway Ownership is Unique to the Utility Industry (1)As reported by company public filings (2)As reported by S&P Capital IQ ($ in millions) Net Income to Common(1) Common Dividend(1) Retained Earnings per day Common Dividend as % of Net Income December 31, 2015 Market Cap(2) Berkshire Hathaway Energy: 2015 Actual 2,370$ - 6.5 0% Privately Held December 31, 2015: Duke Energy 2,816$ 2,254$ 1.5 80% 49,140 NextEra Energy 2,752 1,385 3.7 50% 47,845 Southern Company 2,367 1,959 1.1 83% 42,529 Exelo Corporation 2,269 1,105 3.2 49% 25,536 America Electric Power 2,047 1,054 2.7 51% 28,600 Dominion Resources 1,899 1,536 1.0 81% 40,268 Public Service Enterprise 1,679 789 2.4 47% 19,576 Edison International 1,020 544 1.3 53% 19,291 PG&E Corporation 874 856 0.0 98% 26,087 Peer Average 1,969 1,276 1.9 66%
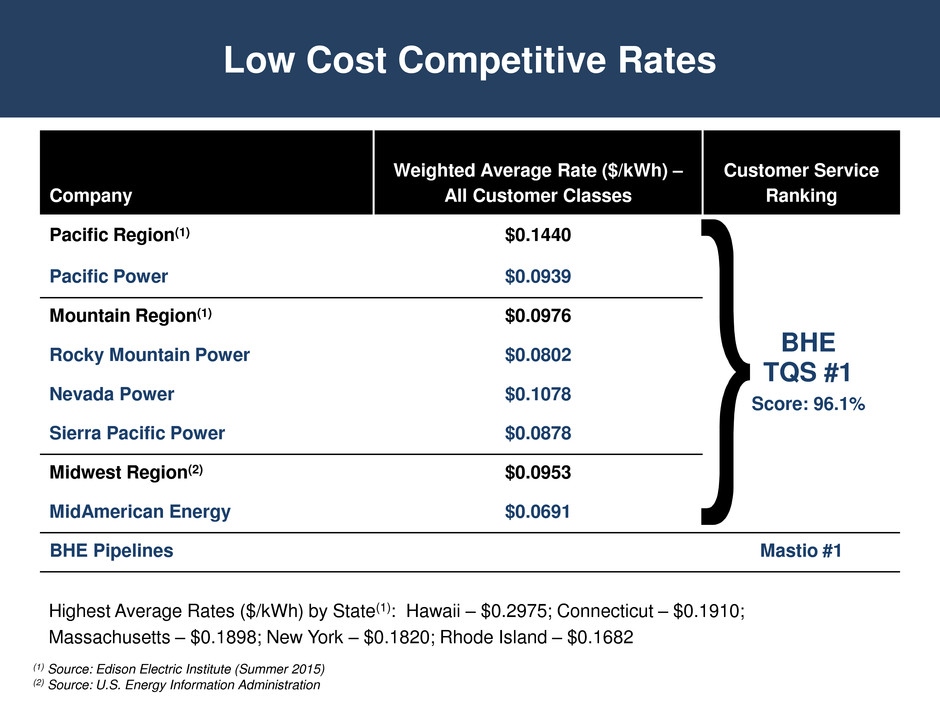
Low Cost Competitive Rates Highest Average Rates ($/kWh) by State(1): Hawaii – $0.2975; Connecticut – $0.1910; Massachusetts – $0.1898; New York – $0.1820; Rhode Island – $0.1682 Company Weighted Average Rate ($/kWh) – All Customer Classes Customer Service Ranking Pacific Region(1) $0.1440 Pacific Power $0.0939 Mountain Region(1) $0.0976 Rocky Mountain Power $0.0802 Nevada Power $0.1078 Sierra Pacific Power $0.0878 Midwest Region(2) $0.0953 MidAmerican Energy $0.0691 BHE Pipelines Mastio #1 BHE TQS #1 Score: 96.1% (1) Source: Edison Electric Institute (Summer 2015) (2) Source: U.S. Energy Information Administration
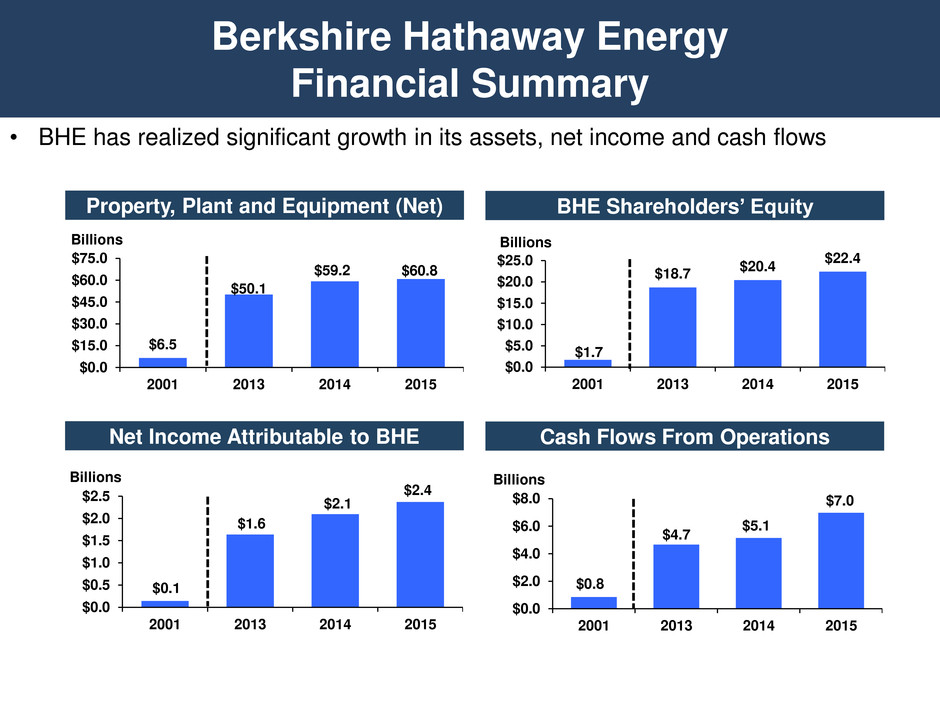
Berkshire Hathaway Energy Financial Summary • BHE has realized significant growth in its assets, net income and cash flows $6.5 $50.1 $59.2 $60.8 $0.0 $15.0 $30.0 $45.0 $60.0 $75.0 2001 2013 2014 2015 Billions $0.1 $1.6 $2.1 $2.4 $0.0 $0.5 $1.0 $1.5 $2.0 $2.5 2001 2013 2014 2015 Billions $0.8 $4.7 $5.1 $7.0 $0.0 $2.0 $4.0 $6.0 $8.0 2001 2013 2014 2015 Billions $1.7 $18.7 $20.4 $22.4 $0.0 $5.0 $10.0 $15.0 $20.0 $25.0 2001 2013 2014 2015 Billions Net Income Attributable to BHE BHE Shareholders’ Equity Property, Plant and Equipment (Net) Cash Flows From Operations
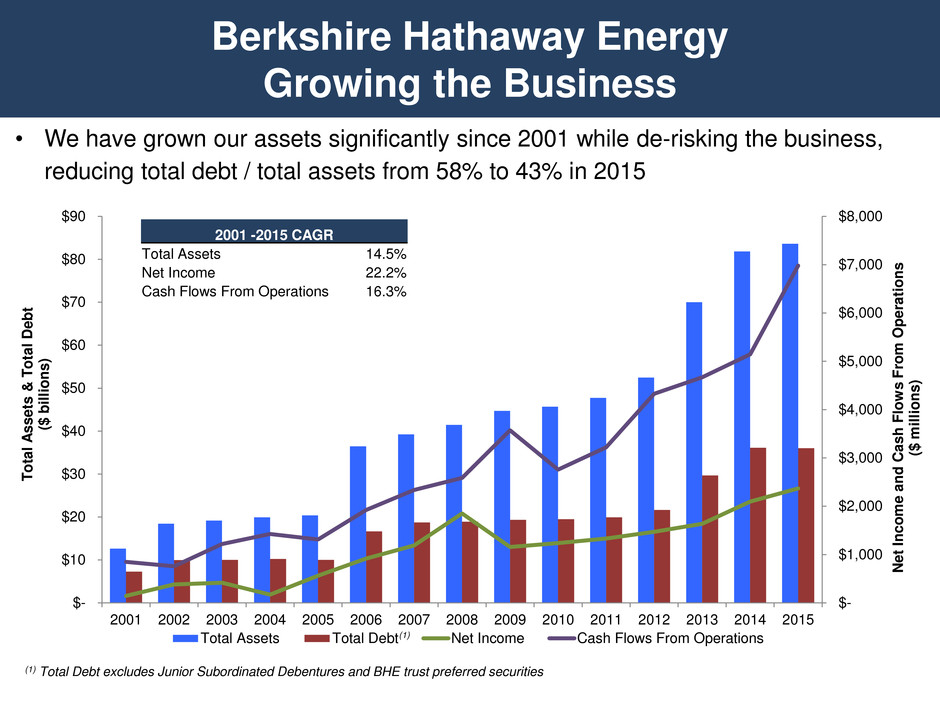
Berkshire Hathaway Energy Growing the Business $- $1,000 $2,000 $3,000 $4,000 $5,000 $6,000 $7,000 $8,000 $- $10 $20 $30 $40 $50 $60 $70 $80 $90 2001 2002 2003 2004 2005 2006 2007 2008 2009 2010 2011 2012 2013 2014 2015 N et I n c ome a n d C a s h Flo w s From O p e ra ti o n s ($ m il li o n s ) T ota l A s s ets & T ota l D e b t ($ bi ll io n s ) Total Assets Total Debt Net Income Cash Flows From Operations (1) Total Debt excludes Junior Subordinated Debentures and BHE trust preferred securities 2001 -2015 CAGR Total Assets 14.5% Net Income 22.2% Cash Flows From Operations 16.3% • We have grown our assets significantly since 2001 while de-risking the business, reducing total debt / total assets from 58% to 43% in 2015 (1)

2014 – 2015 Net Income Variance $415 $2,370 $(193) $47 $554 $139 $(316) $(371) $2,095 $- $500 $1,000 $1,500 $2,000 $2,500 $3,000 $3,500 2014 Net Income Operating revenue Cost of sales Operating expenses Depreciation expense Interest expense Income taxes Other 2015 Net Income Years Ended Dec. 31 ($ millions) 2015 2014 Variance PacifiCorp 697$ 700$ (3)$ 0% MidAmerican Funding 458 409 49 12% NV Energy 379 354 25 7% Northern Powergrid 422 412 10 2% BHE Pipeline Group 243 230 13 6% BHE Transmission 186 56 130 232% BHE Renewables 124 121 3 2% HomeServices 104 83 21 25% BHE and Other (243) (270) 27 10% Net income attributable to BHE 2,370$ 2,095$ 275$ 13%
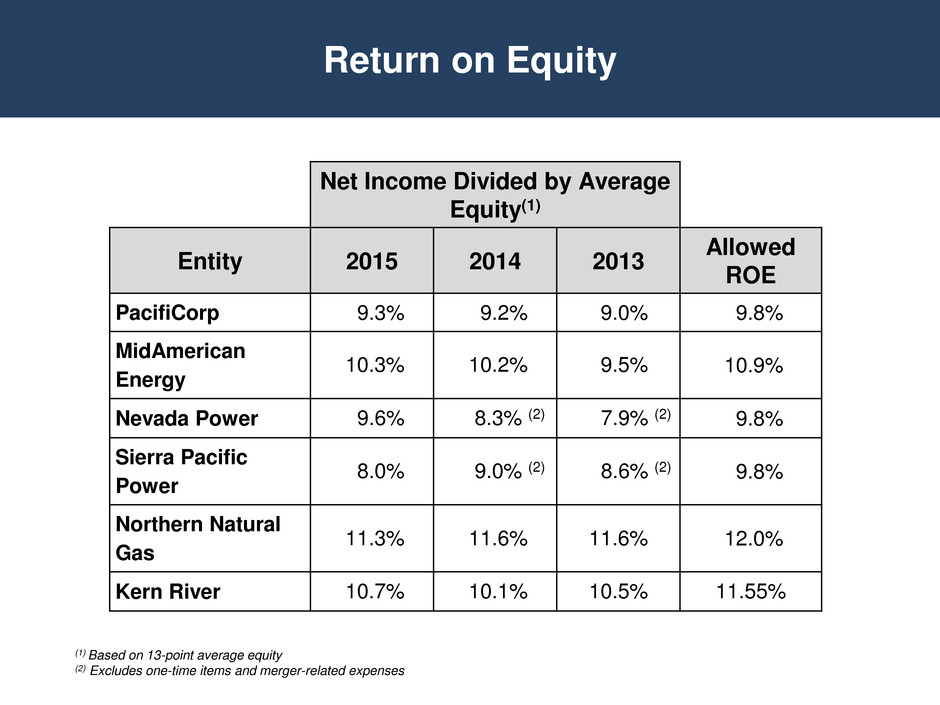
Return on Equity (1) Based on 13-point average equity (2) Excludes one-time items and merger-related expenses Net Income Divided by Average Equity(1) Entity 2015 2014 2013 Allowed ROE PacifiCorp 9.3% 9.2% 9.0% 9.8% MidAmerican Energy 10.3% 10.2% 9.5% 10.9% Nevada Power 9.6% 8.3% (2) 7.9% (2) 9.8% Sierra Pacific Power 8.0% 9.0% (2) 8.6% (2) 9.8% Northern Natural Gas 11.3% 11.6% 11.6% 12.0% Kern River 10.7% 10.1% 10.5% 11.55%
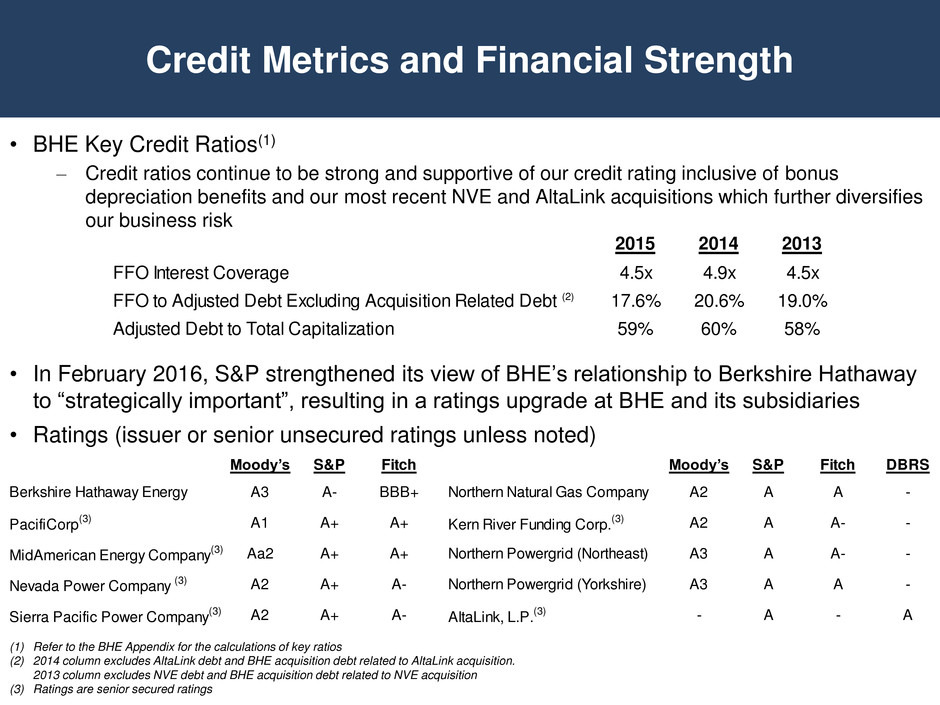
• BHE Key Credit Ratios(1) – Credit ratios continue to be strong and supportive of our credit rating inclusive of bonus depreciation benefits and our most recent NVE and AltaLink acquisitions which further diversifies our business risk • In February 2016, S&P strengthened its view of BHE’s relationship to Berkshire Hathaway to “strategically important”, resulting in a ratings upgrade at BHE and its subsidiaries • Ratings (issuer or senior unsecured ratings unless noted) Credit Metrics and Financial Strength (1) Refer to the BHE Appendix for the calculations of key ratios (2) 2014 column excludes AltaLink debt and BHE acquisition debt related to AltaLink acquisition. 2013 column excludes NVE debt and BHE acquisition debt related to NVE acquisition (3) Ratings are senior secured ratings 2015 2014 2013 FFO Interest Coverage 4.5x 4.9x 4.5x FFO to Adjusted Debt Excluding Acquisition Related Debt (2) 17.6% 20.6% 19.0% Adjusted Debt to Total Capitalization 59% 60% 58% Moody’s S&P Fitch Moody’s S&P Fitch DBRS Berk hire Ha haw y Energy A3 A- BBB+ Northern Natural Gas Company A2 A A - Pacif Corp (3) A1 A+ A+ Kern River Funding Corp. (3) A2 A A- - MidAmerican Energy Company (3) Aa2 A+ A+ Northern Powergrid (Northeast) A3 A A- - Nevada Power Company (3) A2 A+ A- Northern Powergrid (Yorkshire) A3 A A - Sierra Pacific Power Company (3) A2 A+ A- AltaLink, L.P. (3) - A - A
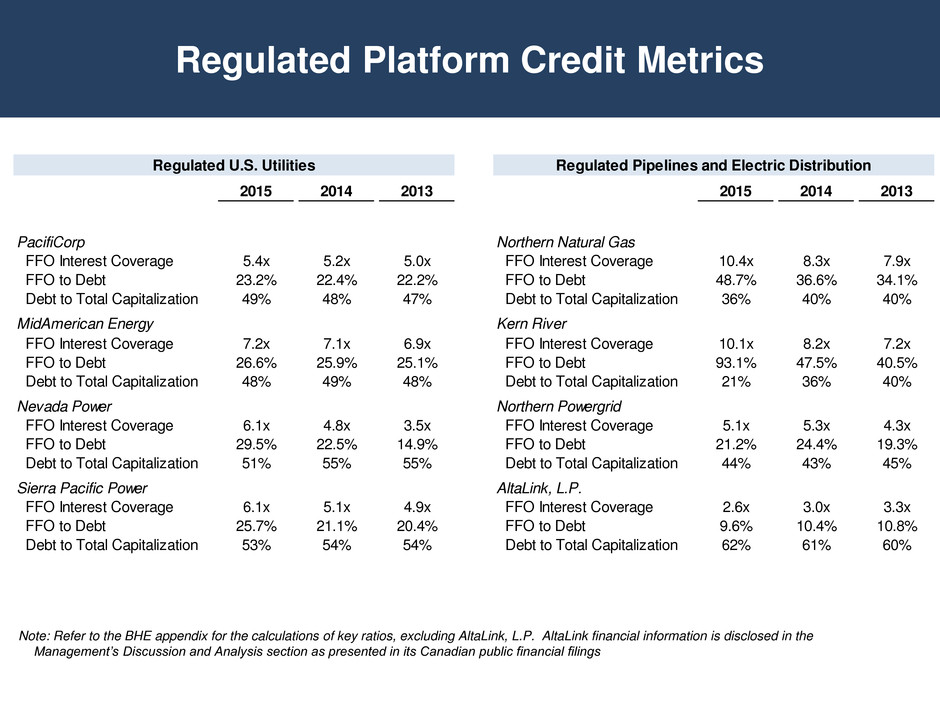
Regulated Platform Credit Metrics Note: Refer to the BHE appendix for the calculations of key ratios, excluding AltaLink, L.P. AltaLink financial information is disclosed in the Management’s Discussion and Analysis section as presented in its Canadian public financial filings Regulated U.S. Utilities Regulated Pipelines and Electric Distribution 2015 2014 2013 2015 2014 2013 PacifiCorp Northern Natural Gas FFO Interest Coverage 5.4x 5.2x 5.0x FFO Interest Coverage 10.4x 8.3x 7.9x FFO to Debt 23.2% 22.4% 22.2% FFO to Debt 48.7% 36.6% 34.1% Debt to Total Capitalization 49% 48% 47% Debt to Total Capitalization 36% 40% 40% MidAmerican Energy Kern River FFO Interest Coverage 7.2x 7.1x 6.9x FFO Interest Coverage 10.1x 8.2x 7.2x FFO to Debt 26.6% 25.9% 25.1% FFO to Debt 93.1% 47.5% 40.5% Debt to Total Capitalization 48% 49% 48% Debt to Total Capitalization 21% 36% 40% Nevada Power Northern Powergrid FFO Interest Coverage 6.1x 4.8x 3.5x FFO Interest Coverage 5.1x 5.3x 4.3x FFO to Debt 29.5% 22.5% 14.9% FFO to Debt 21.2% 24.4% 19.3% Debt to Total Capitalization 51% 55% 55% Debt to Total Capitalization 44% 43% 45% Sierra Pacific Power AltaLink, L.P. FFO Interest Coverage 6.1x 5.1x 4.9x FFO Interest Coverage 2.6x 3.0x 3.3x FFO to Debt 25.7% 21.1% 20.4% FFO to Debt 9.6% 10.4% 10.8% Debt to Total Capitalization 53% 54% 54% Debt to Total Capitalization 62% 61% 60%
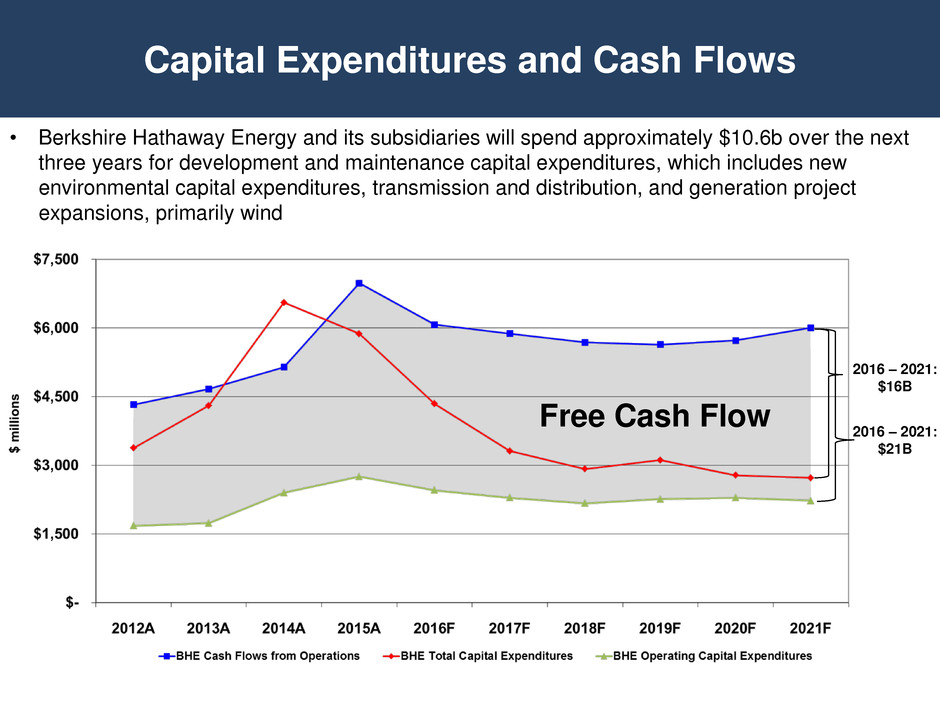
Free Cash Flow • Berkshire Hathaway Energy and its subsidiaries will spend approximately $10.6b over the next three years for development and maintenance capital expenditures, which includes new environmental capital expenditures, transmission and distribution, and generation project expansions, primarily wind Capital Expenditures and Cash Flows 2016 – 2021: $16B 2016 – 2021: $21B
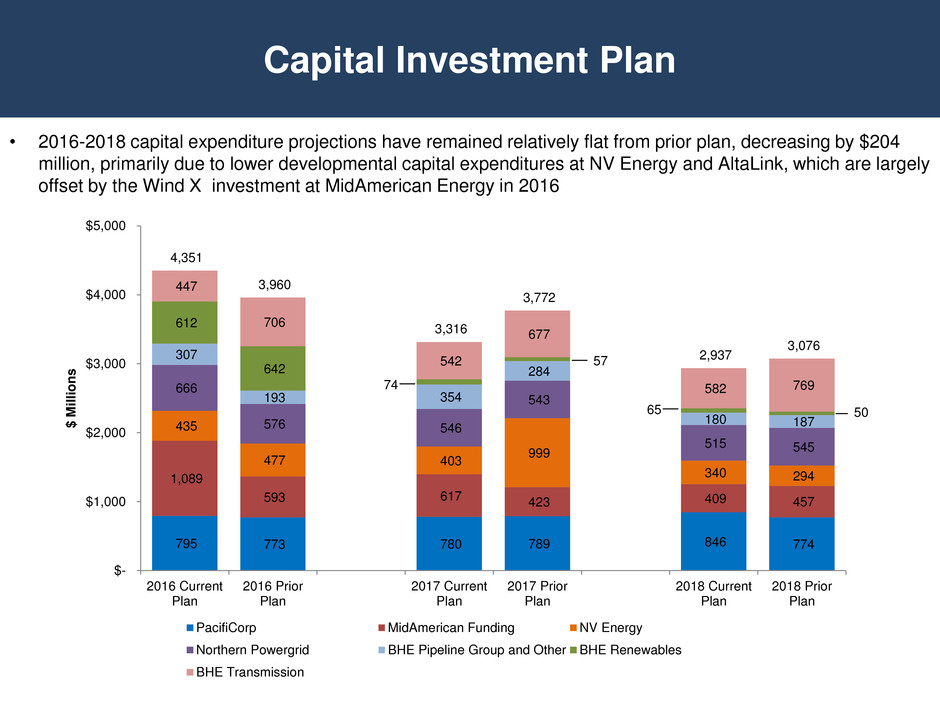
• 2016-2018 capital expenditure projections have remained relatively flat from prior plan, decreasing by $204 million, primarily due to lower developmental capital expenditures at NV Energy and AltaLink, which are largely offset by the Wind X investment at MidAmerican Energy in 2016 Capital Investment Plan 795 773 780 789 846 774 1,089 593 617 423 409 457 435 477 403 999 340 294 666 576 546 543 515 545 307 193 354 284 180 187 612 642 74 57 65 50 447 706 542 677 582 769 4,351 3,960 3,316 3,772 2,937 3,076 $- $1,000 $2,000 $3,000 $4,000 $5,000 2016 Current Plan 2016 Prior Plan 2017 Current Plan 2017 Prior Plan 2018 Current Plan 2018 Prior Plan $ M ill io n s PacifiCorp MidAmerican Funding NV Energy Northern Powergrid BHE Pipeline Group and Other BHE Renewables BHE Transmission
Financing Plan 2016 • Sierra Pacific Power Company – Anticipate an approximate $400 million debt financing in second quarter of 2016 due to $450 million maturing in May 2016 • AltaLink, L.P. – Anticipate up to a C$550 million debt financing mid-2016 • BHE Renewables – Anticipate nonrecourse project financings of approximately $90 million for the Marshall Wind project in the first half of 2016 and approximately $350 million for the Grande Prairie Wind project in late 2016

Questions

BHE Appendix
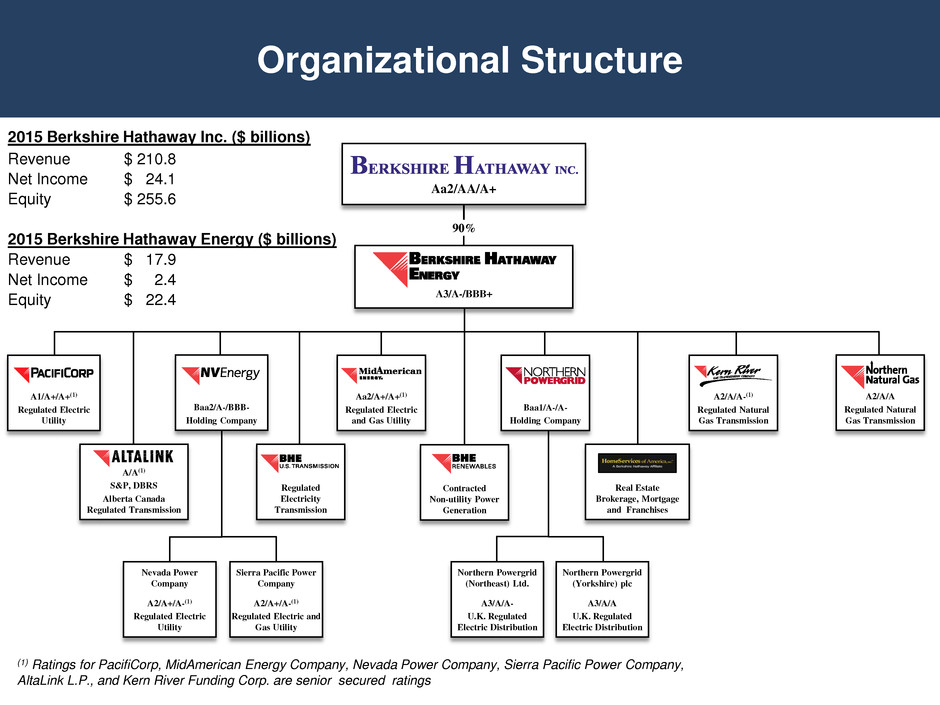
Organizational Structure 2015 Berkshire Hathaway Inc. ($ billions) Revenue $ 210.8 Net Income $ 24.1 Equity $ 255.6 2015 Berkshire Hathaway Energy ($ billions) Revenue $ 17.9 Net Income $ 2.4 Equity $ 22.4 A3/A-/BBB+ Aa2/AA/A+ 90% Nevada Power Company A2/A+/A-(1) Regulated Electric Utility Sierra Pacific Power Company A2/A+/A-(1) Regulated Electric and Gas Utility Real Estate Brokerage, Mortgage and Franchises Northern Powergrid (Northeast) Ltd. A3/A/A- U.K. Regulated Electric Distribution Regulated Electricity Transmission Contracted Non-utility Power Generation Northern Powergrid (Yorkshire) plc A3/A/A U.K. Regulated Electric Distribution A2/A/A-(1) Regulated Natural Gas Transmission A2/A/A Regulated Natural Gas Transmission Baa1/A-/A- Holding Company Aa2/A+/A+(1) Regulated Electric and Gas Utility Baa2/A-/BBB- Holding Company A1/A+/A+(1) Regulated Electric Utility A/A(1) S&P, DBRS Alberta Canada Regulated Transmission (1) Ratings for PacifiCorp, MidAmerican Energy Company, Nevada Power Company, Sierra Pacific Power Company, AltaLink L.P., and Kern River Funding Corp. are senior secured ratings
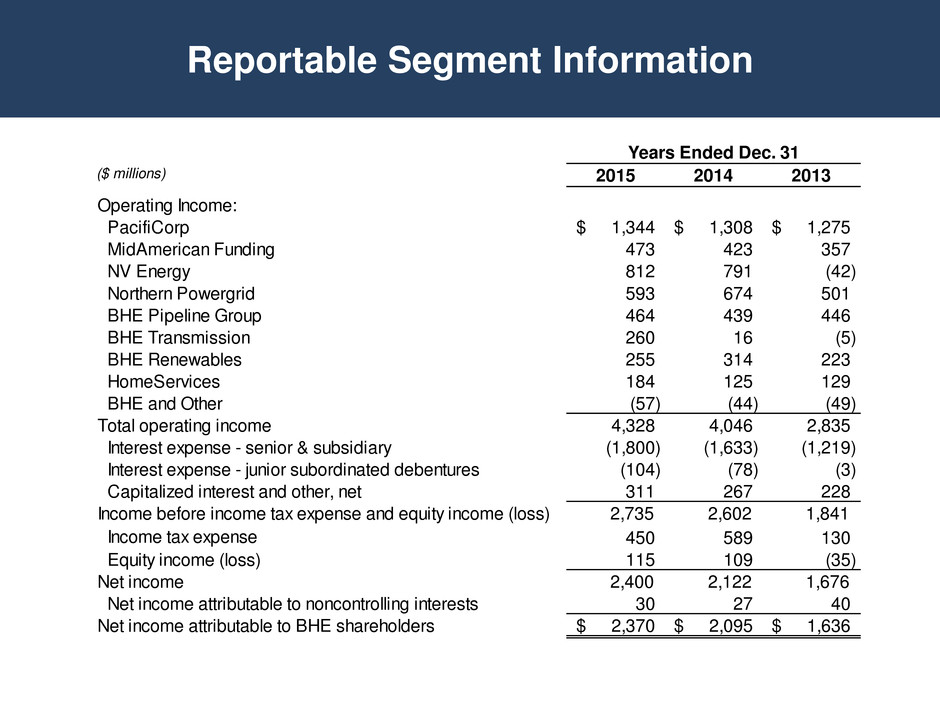
Reportable Segment Information Years Ended Dec. 31 ($ millions) 2015 2014 2013 Operating Income: PacifiCorp 1,344$ 1,308$ 1,275$ MidAmerican Funding 473 423 357 NV Energy 812 791 (42) Northern Powergrid 593 674 501 BHE Pipeline Group 464 439 446 BHE Transmission 260 16 (5) BHE Renewables 255 314 223 HomeServices 184 125 129 BHE and Other (57) (44) (49) Total operating income 4,328 4,046 2,835 Interest expense - senior & subsidiary (1,800) (1,633) (1,219) Interest expense - junior subordinated debentures (104) (78) (3) Capitalized interest and other, net 311 267 228 Income before income tax expense and equity income (loss) 2,735 2,602 1,841 Income tax expense 450 589 130 Equity income (loss) 115 109 (35) Net income 2,400 2,122 1,676 Net income attributable to noncontrolling interests 30 27 40 Net income attributable to BHE shareholders 2,370$ 2,095$ 1,636$
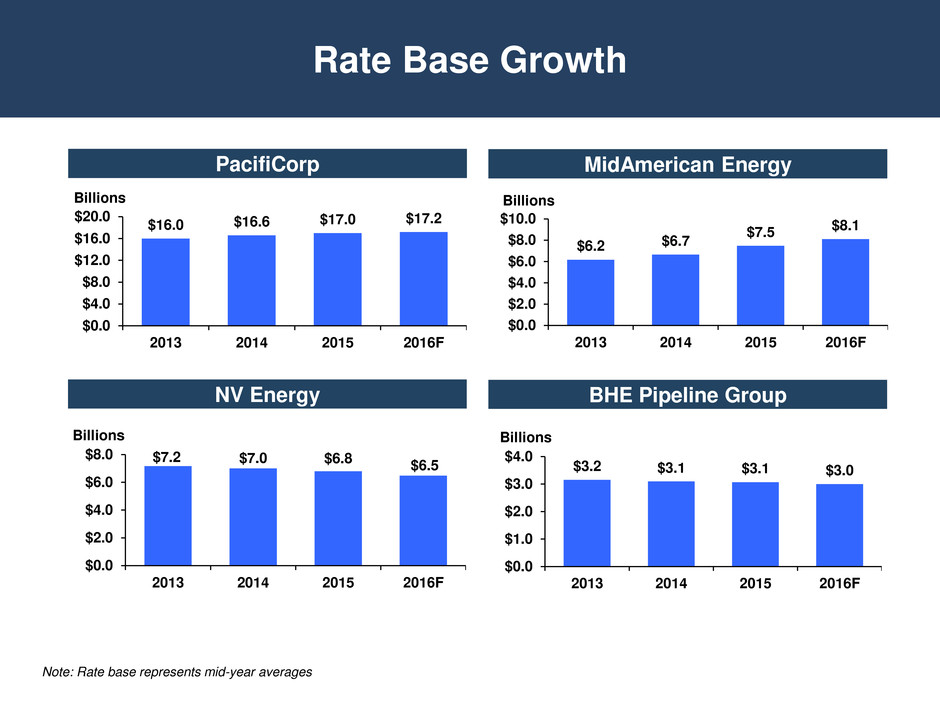
Rate Base Growth $16.0 $16.6 $17.0 $17.2 $0.0 $4.0 $8.0 $12.0 $16.0 $20.0 2013 2014 2015 2016F Billions $7.2 $7.0 $6.8 $6.5 $0.0 $2.0 $4.0 $6.0 $8.0 2013 2014 2015 2016F Billions $6.2 $6.7 $7.5 $8.1 $0.0 $2.0 $4.0 $6.0 $8.0 $10.0 2013 2014 2015 2016F Billions NV Energy MidAmerican Energy PacifiCorp BHE Pipeline Group $3.2 $3.1 $3.1 $3.0 $0.0 $1.0 $2.0 $3.0 $4.0 2013 2014 2015 2016F Billions Note: Rate base represents mid-year averages
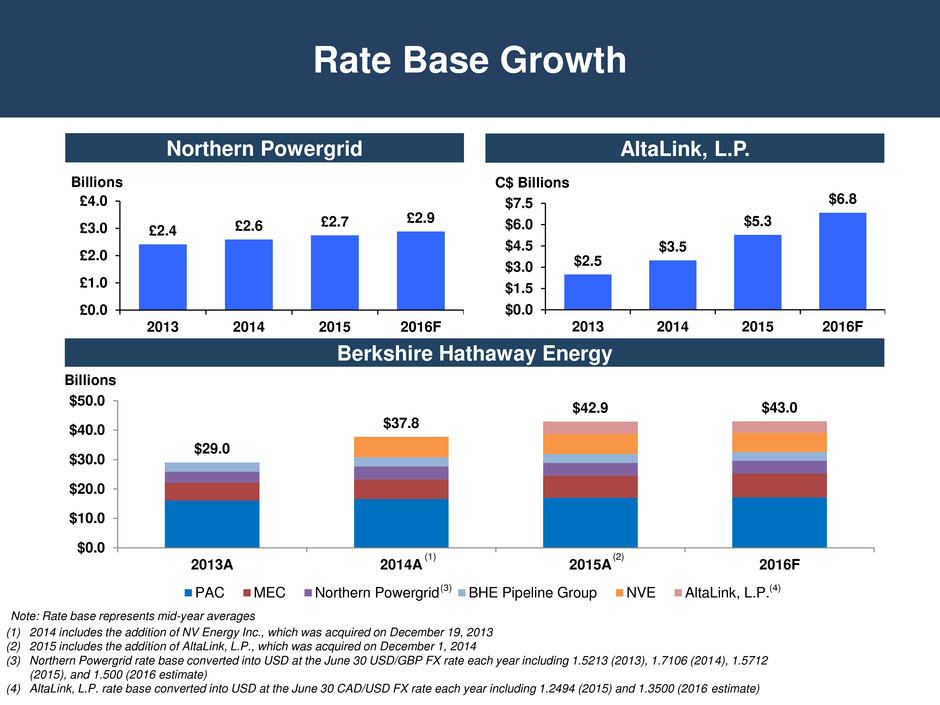
Rate Base Growth £2.4 £2.6 £2.7 £2.9 £0.0 £1.0 £2.0 £3.0 £4.0 2013 2014 2015 2016F Billions $2.5 $3.5 $5.3 $6.8 $0.0 $1.5 $3.0 $4.5 $6.0 $7.5 2013 2014 2015 2016F AltaLink, L.P. Northern Powergrid (1) 2014 includes the addition of NV Energy Inc., which was acquired on December 19, 2013 (2) 2015 includes the addition of AltaLink, L.P., which was acquired on December 1, 2014 (3) Northern Powergrid rate base converted into USD at the June 30 USD/GBP FX rate each year including 1.5213 (2013), 1.7106 (2014), 1.5712 (2015), and 1.500 (2016 estimate) (4) AltaLink, L.P. rate base converted into USD at the June 30 CAD/USD FX rate each year including 1.2494 (2015) and 1.3500 (2016 estimate) Note: Rate base represents mid-year averages Berkshire Hathaway Energy $29.0 $37.8 $42.9 $43.0 $0.0 $10.0 $20.0 $30.0 $40.0 $50.0 2013A 2014A 2015A 2016F PAC MEC Northern Powergrid BHE Pipeline Group NVE AltaLink, L.P. (1) (2) (3) (4) Billions C$ Billions
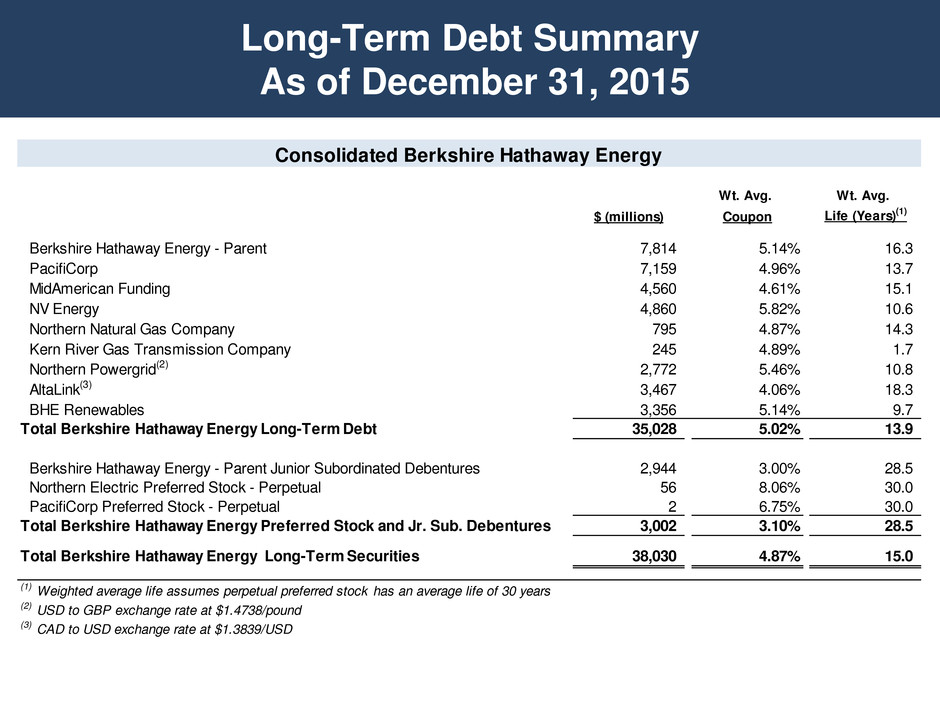
Long-Term Debt Summary As of December 31, 2015 Consolidated Berkshire Hathaway Energy Wt. Avg. Wt. Avg. $ (millions) Coupon Life (Years) (1) Berkshire Hathaway Energy - Parent 7,814 5.14% 16.3 PacifiCorp 7,159 4.96% 13.7 MidAmerican Funding 4,560 4.61% 15.1 NV Energy 4,860 5.82% 10.6 Northern Natural Gas Company 795 4.87% 14.3 Kern River Gas Transmission Company 245 4.89% 1.7 Northern Powergrid(2) 2,772 5.46% 10.8 AltaLink(3) 3,467 4.06% 18.3 BHE Renewables 3,356 5.14% 9.7 Total Berkshire Hathaway Energy Long-Term Debt 35,028 5.02% 13.9 Berkshire Hathaway Energy - Parent Junior Subordinated Debentures 2,944 3.00% 28.5 Northern Electric Preferred Stock - Perpetual 56 8.06% 30.0 PacifiCorp Preferred Stock - Perpetual 2 6.75% 30.0 Total Berkshire Hathaway Energy Preferred Stock and Jr. Sub. Debentures 3,002 3.10% 28.5 Total Berkshire Hathaway Energy Long-Term Securities 38,030 4.87% 15.0 (1) Weighted average life assumes perpetual preferred stock has an average life of 30 years (2) USD to GBP exchange rate at $1.4738/pound (3) CAD to USD exchange rate at $1.3839/USD
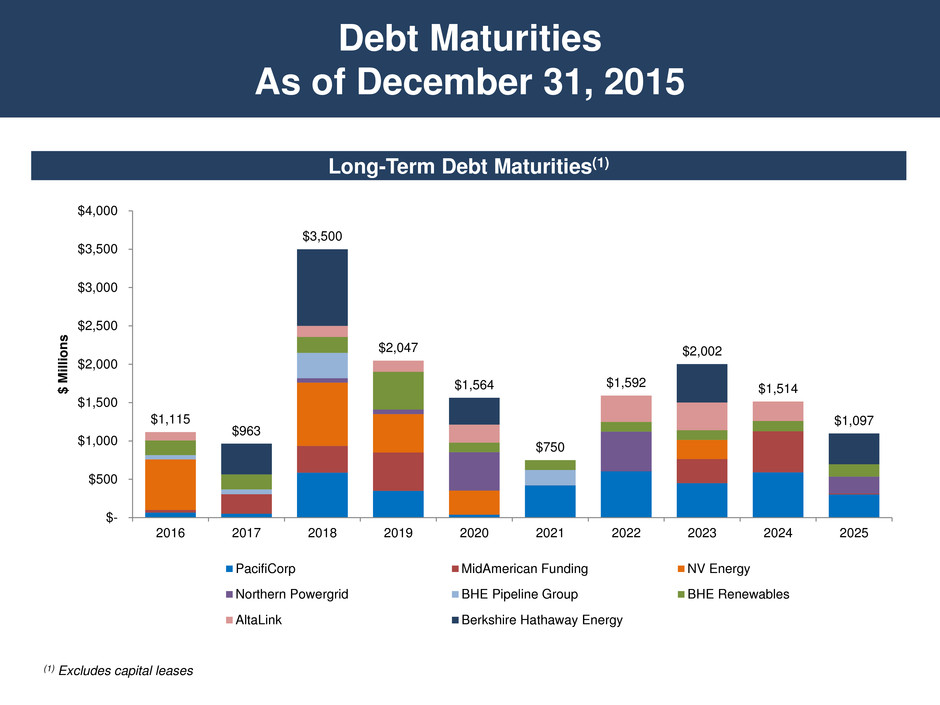
Debt Maturities As of December 31, 2015 Long-Term Debt Maturities(1) (1) Excludes capital leases $1,115 $963 $3,500 $2,047 $1,564 $750 $1,592 $2,002 $1,514 $1,097 $- $500 $1,000 $1,500 $2,000 $2,500 $3,000 $3,500 $4,000 2016 2017 2018 2019 2020 2021 2022 2023 2024 2025 $ M ill io n s PacifiCorp MidAmerican Funding NV Energy Northern Powergrid BHE Pipeline Group BHE Renewables AltaLink Berkshire Hathaway Energy

Jurisdictional Strength – Unemployment Rates Source: Bloomberg, Bureau of Labor and Statistics (1) Weighted average of Oregon, Utah and Wyoming 58.0% 60.0% 62.0% 64.0% 66.0% 68.0% 70.0% 2.0% 4.0% 6.0% 8.0% 10.0% 12.0% 14.0% 2009 2010 2011 2012 2013 2014 2015 U .S . L a b o r P ar ti cipat io n U n e mp lo y ment R ate s Iowa Nevada Alberta U.K. PAC Territory U.S. Labor Participation (1)
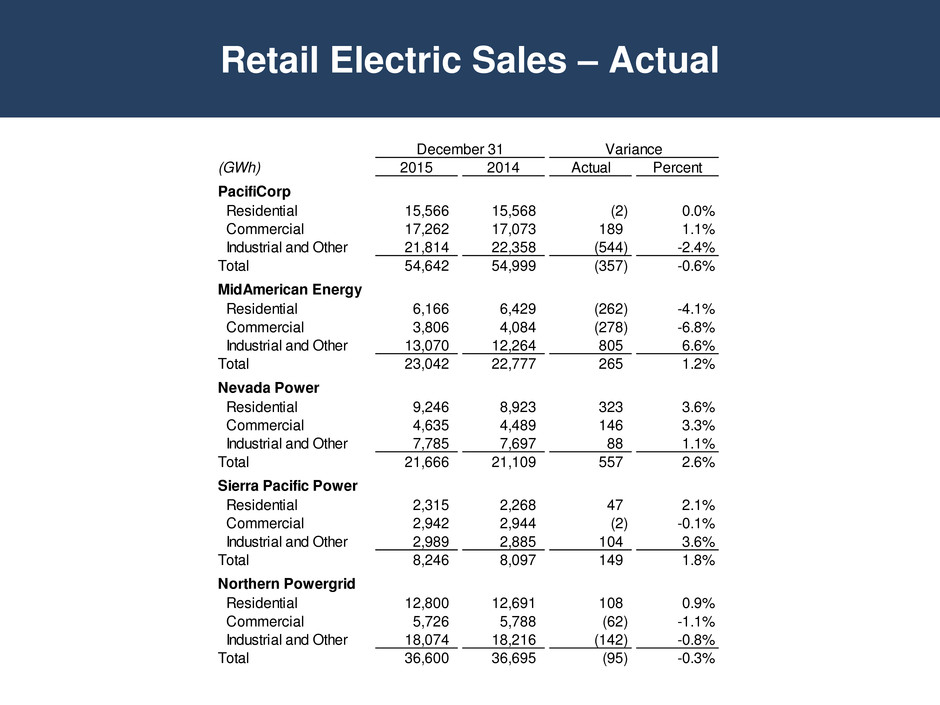
Retail Electric Sales – Actual December 31 Variance (GWh) 2015 2014 Actual Percent PacifiCorp Residential 15,566 15,568 (2) 0.0% Commercial 17,262 17,073 189 1.1% Industrial and Other 21,814 22,358 (544) -2.4% Total 54,642 54,999 (357) -0.6% MidAmerican Energy Residential 6,166 6,429 (262) -4.1% Commercial 3,806 4,084 (278) -6.8% Industrial and Other 13,070 12,264 805 6.6% Total 23,042 22,777 265 1.2% Nevada Power Residential 9,246 8,923 323 3.6% Commercial 4,635 4,489 146 3.3% Industrial and Other 7,785 7,697 88 1.1% Total 21,666 21,109 557 2.6% Sierra Pacific Power Residential 2,315 2,268 47 2.1% Commercial 2,942 2,944 (2) -0.1% Industrial and Other 2,989 2,885 104 3.6% Total 8,246 8,097 149 1.8% Northern Powergrid Residential 12,800 12,691 108 0.9% Commercial 5,726 5,788 (62) -1.1% Industrial and Other 18,074 18,216 (142) -0.8% Total 36,600 36,695 (95) -0.3%
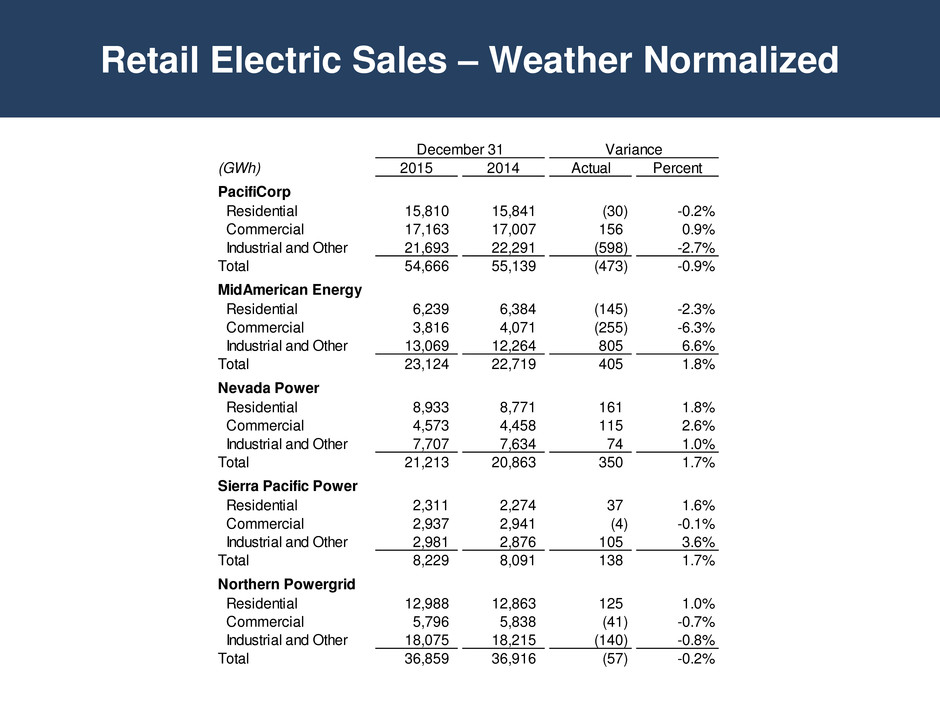
Retail Electric Sales – Weather Normalized December 31 Variance (GWh) 2015 2014 Actual Percent PacifiCorp Residential 15,810 15,841 (30) -0.2% Commercial 17,163 17,007 156 0.9% Industrial and Other 21,693 22,291 (598) -2.7% Total 54,666 55,139 (473) -0.9% MidAmerican Energy Residential 6,239 6,384 (145) -2.3% Commercial 3,816 4,071 (255) -6.3% Industrial and Other 13,069 12,264 805 6.6% Total 23,124 22,719 405 1.8% Nevada Power Residential 8,933 8,771 161 1.8% Commercial 4,573 4,458 115 2.6% Industrial and Other 7,707 7,634 74 1.0% Total 21,213 20,863 350 1.7% Sierra Pacific Power Residential 2,311 2,274 37 1.6% Commercial 2,937 2,941 (4) -0.1% Industrial and Other 2,981 2,876 105 3.6% Total 8,229 8,091 138 1.7% Northern Powergrid Residential 12,988 12,863 125 1.0% Commercial 5,796 5,838 (41) -0.7% Industrial and Other 18,075 18,215 (140) -0.8% Total 36,859 36,916 (57) -0.2%
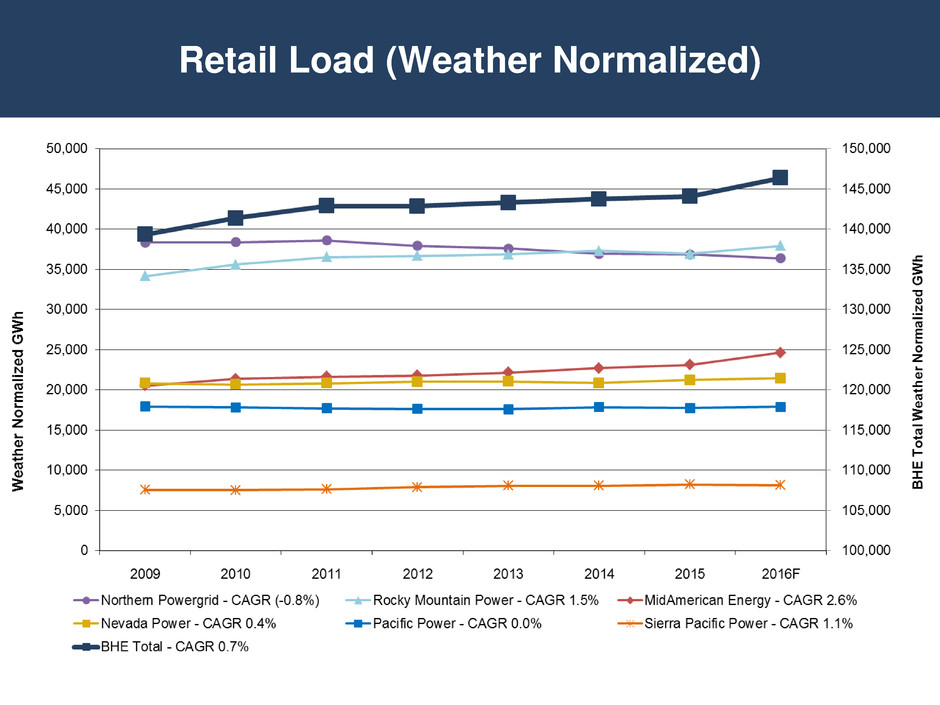
Retail Load (Weather Normalized)
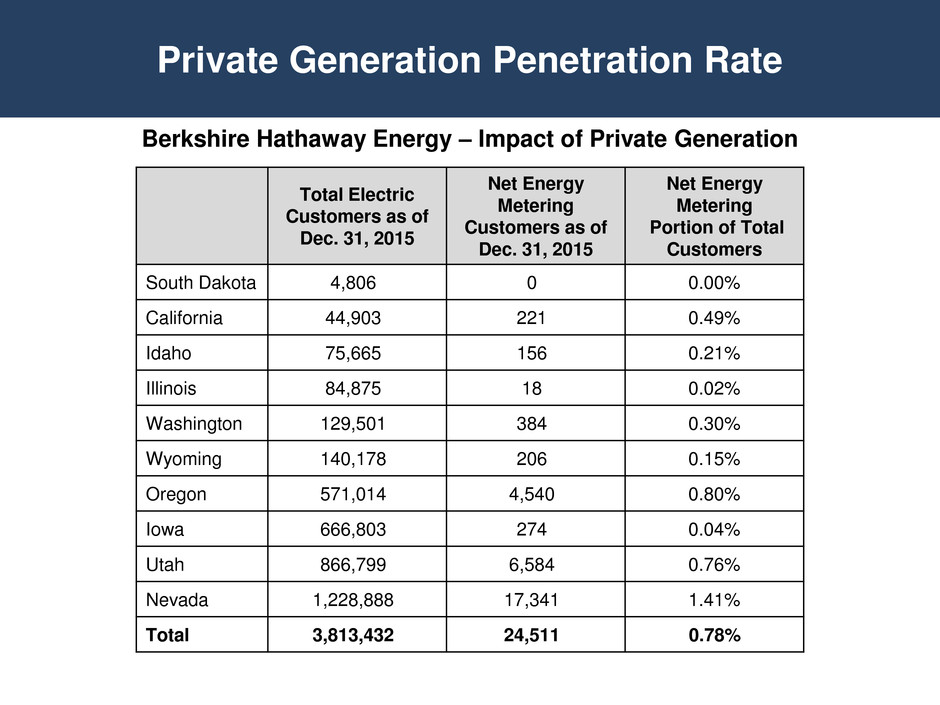
Private Generation Penetration Rate Total Electric Customers as of Dec. 31, 2015 Net Energy Metering Customers as of Dec. 31, 2015 Net Energy Metering Portion of Total Customers South Dakota 4,806 0 0.00% California 44,903 221 0.49% Idaho 75,665 156 0.21% Illinois 84,875 18 0.02% Washington 129,501 384 0.30% Wyoming 140,178 206 0.15% Oregon 571,014 4,540 0.80% Iowa 666,803 274 0.04% Utah 866,799 6,584 0.76% Nevada 1,228,888 17,341 1.41% Total 3,813,432 24,511 0.78% Berkshire Hathaway Energy – Impact of Private Generation

Private Generation – U.S. Average 0.00 0.50 1.00 1.50 2.00 2.50 Kil o w a tt/U s a g e Customer Power Demand Energy Company-Provided Power Grid Services 23.99 hours/day energy company provides all grid services Energy Company-Provided Power 10 hours/day energy company provides 100% of power needed Private Generation System-Provided Power 6.5 hours/day private generation system provides 100% of power needed Private Generation Energy Company and Private Generation System-Provided Power 7.5 hours/day both energy company and private generation system provides power 100% Energy Company Provided-Power Private generation peak 12-2 PM Customer power demand peak 6-8 PM Private generation customer uses power grid to export excess power 4am 8am 12pm 4pm 8pm 12am 100% Energy Company Provided-Power En e rg y De li v e ry Ch a rg e
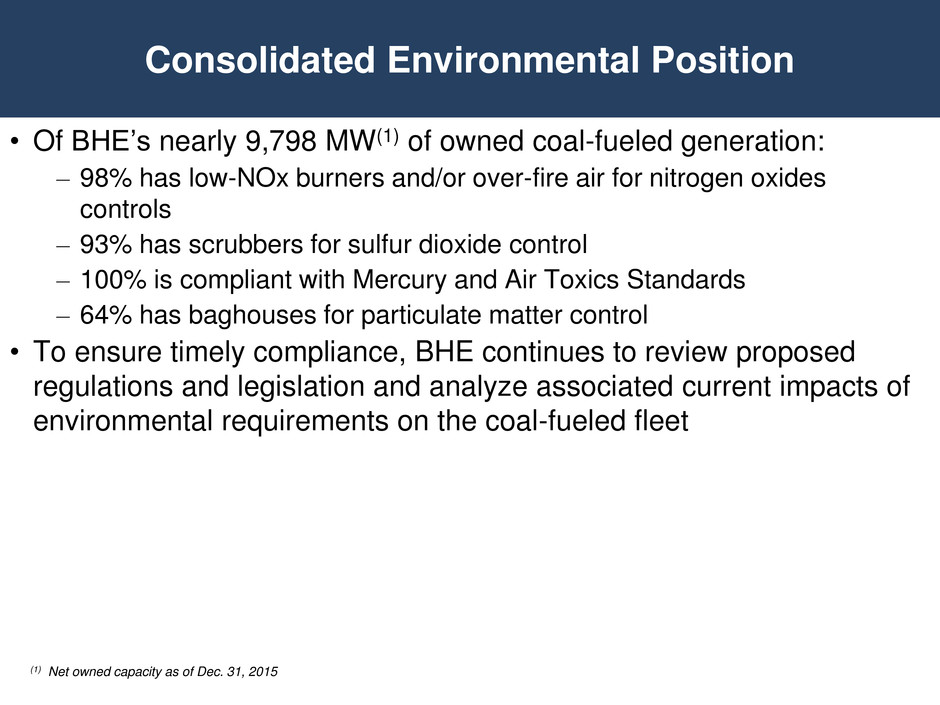
Consolidated Environmental Position • Of BHE’s nearly 9,798 MW(1) of owned coal-fueled generation: – 98% has low-NOx burners and/or over-fire air for nitrogen oxides controls – 93% has scrubbers for sulfur dioxide control – 100% is compliant with Mercury and Air Toxics Standards – 64% has baghouses for particulate matter control • To ensure timely compliance, BHE continues to review proposed regulations and legislation and analyze associated current impacts of environmental requirements on the coal-fueled fleet (1) Net owned capacity as of Dec. 31, 2015
Final Clean Power Plan • More aggressive renewable energy deployment in the determination of best system of emission reduction • Compliance tools changed – Only post-2012 renewable energy can generate emission-reduction credits in a rate-based program – Removed existing nuclear component so only incremental nuclear (new and uprates) can be utilized – New natural gas combined cycle cannot be used to average down an emission rate – In a mass-based program, the state must address new units based on concerns of “leakage” • The U.S. Supreme Court issued a stay February 9, 2016, of the implementation of the Clean Power Plan pending the outcome of the litigation pending in the D.C. Circuit Court of Appeals and through any action taken on appeal to the U.S. Supreme Court
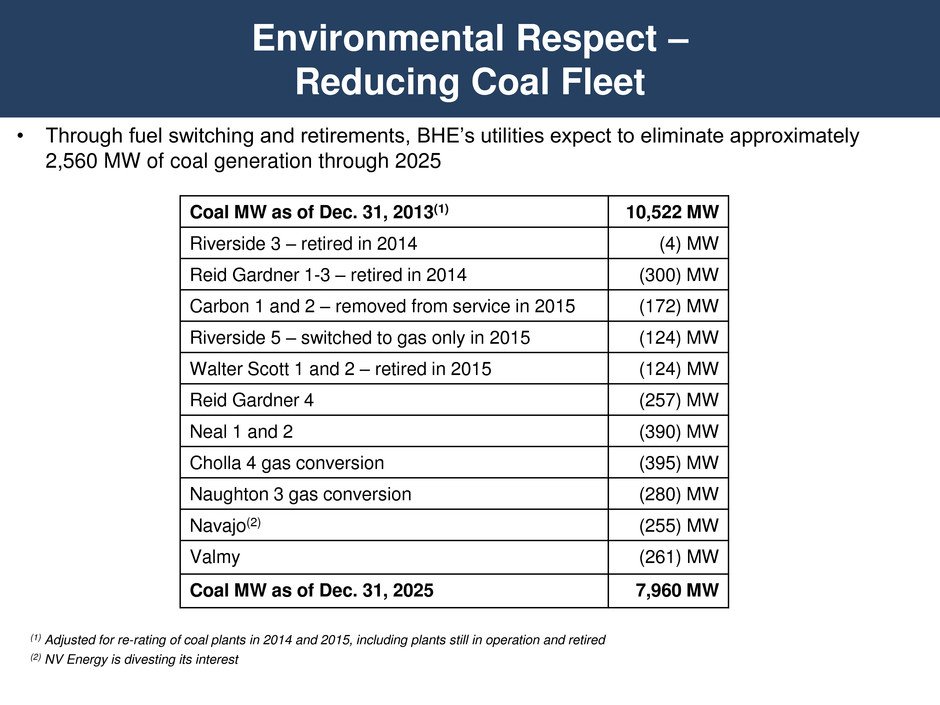
Environmental Respect – Reducing Coal Fleet Coal MW as of Dec. 31, 2013(1) 10,522 MW Riverside 3 – retired in 2014 (4) MW Reid Gardner 1-3 – retired in 2014 (300) MW Carbon 1 and 2 – removed from service in 2015 (172) MW Riverside 5 – switched to gas only in 2015 (124) MW Walter Scott 1 and 2 – retired in 2015 (124) MW Reid Gardner 4 (257) MW Neal 1 and 2 (390) MW Cholla 4 gas conversion (395) MW Naughton 3 gas conversion (280) MW Navajo(2) (255) MW Valmy (261) MW Coal MW as of Dec. 31, 2025 7,960 MW • Through fuel switching and retirements, BHE’s utilities expect to eliminate approximately 2,560 MW of coal generation through 2025 (1) Adjusted for re-rating of coal plants in 2014 and 2015, including plants still in operation and retired (2) NV Energy is divesting its interest
Other Regulations and Impacts • Coal Combustion Residuals – PacifiCorp operates 9 surface impoundments and 4 landfills – MidAmerican Energy owns or operates 9 surface impoundments and 4 landfills – NV Energy operates 2 active evaporative surface impoundments and 2 landfills • Effluent Limitation Guidelines – For BHE’s operating companies, impacted waste streams are limited to bottom ash transport water, fly ash transport water, combustion residual leachate and non-metal cleaning wastes – With minor exceptions, most of the new requirements are addressed by compliance with the coal combustion residuals rule • Revised Ozone Standards – Unit retirements and installation of NOx controls are expected to assist in achieving attainment – Revision from 75 ppb to 70 ppb is not expected to result in significant impacts on BHE’s operating companies

Deliver Reliable and Affordable Service Mastio Results Interstate Pipelines 2003 2016 Kern River 10 1 Northern Natural Gas 43 2 TQS Results 2015 Top 5 Utilities on Overall Customer Satisfaction Rank Utility Very Satisfied 1 Berkshire Hathaway Energy 96.1% 2 Southern Company 95.7% 3 We Energies 89.7% 4 Oklahoma Gas and Electric 86.4% 5 Consumers Energy 85.2% Top 3 for the 12th consecutive year No. 1 for the 11th consecutive year
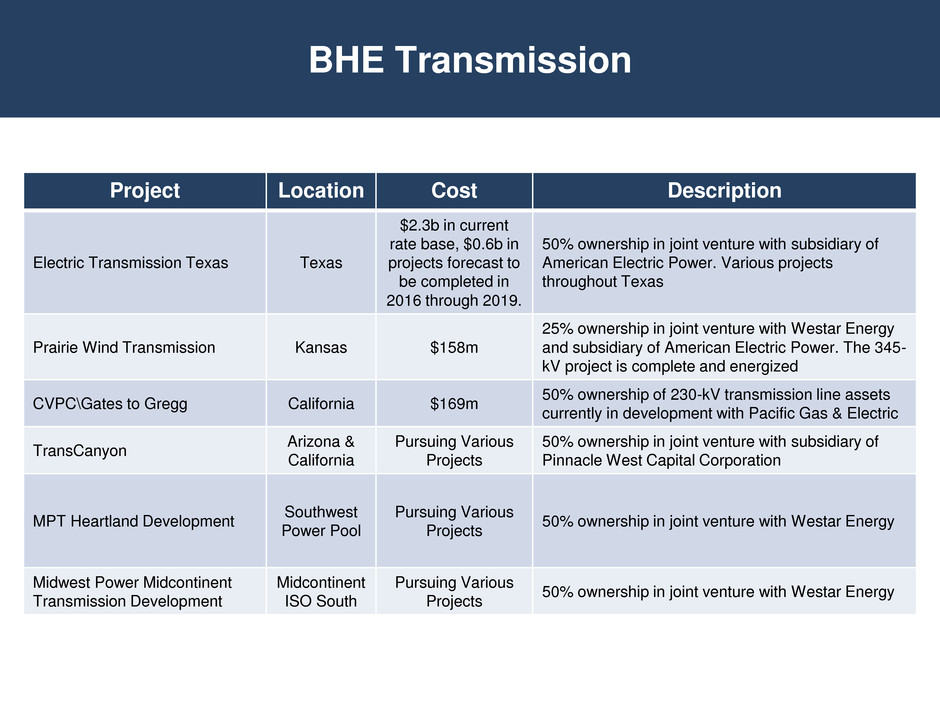
BHE Transmission Project Location Cost Description Electric Transmission Texas Texas $2.3b in current rate base, $0.6b in projects forecast to be completed in 2016 through 2019. 50% ownership in joint venture with subsidiary of American Electric Power. Various projects throughout Texas Prairie Wind Transmission Kansas $158m 25% ownership in joint venture with Westar Energy and subsidiary of American Electric Power. The 345- kV project is complete and energized CVPC\Gates to Gregg California $169m 50% ownership of 230-kV transmission line assets currently in development with Pacific Gas & Electric TransCanyon Arizona & California Pursuing Various Projects 50% ownership in joint venture with subsidiary of Pinnacle West Capital Corporation MPT Heartland Development Southwest Power Pool Pursuing Various Projects 50% ownership in joint venture with Westar Energy Midwest Power Midcontinent Transmission Development Midcontinent ISO South Pursuing Various Projects 50% ownership in joint venture with Westar Energy
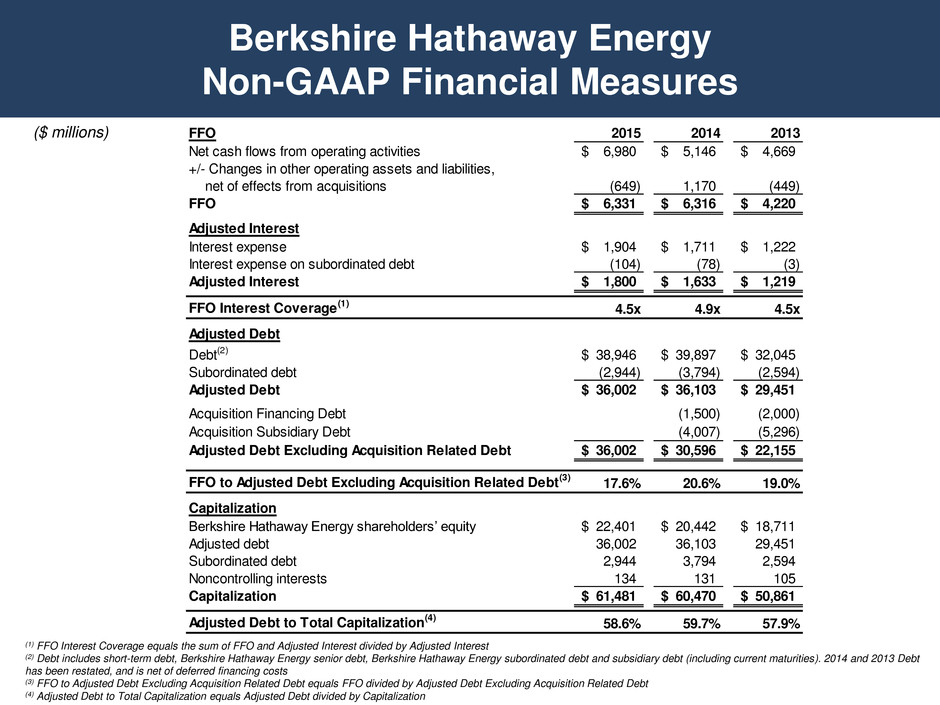
Berkshire Hathaway Energy Non-GAAP Financial Measures (1) FFO Interest Coverage equals the sum of FFO and Adjusted Interest divided by Adjusted Interest (2) Debt includes short-term debt, Berkshire Hathaway Energy senior debt, Berkshire Hathaway Energy subordinated debt and subsidiary debt (including current maturities). 2014 and 2013 Debt has been restated, and is net of deferred financing costs (3) FFO to Adjusted Debt Excluding Acquisition Related Debt equals FFO divided by Adjusted Debt Excluding Acquisition Related Debt (4) Adjusted Debt to Total Capitalization equals Adjusted Debt divided by Capitalization ($ millions) FFO 2015 2014 2013 Net cash flows from operating activities 6,980$ 5,146$ 4,669$ +/- Changes in other operating assets and liabilities, net of effects from acquisitions (649) 1,170 (449) FFO 6,331$ 6,316$ 4,220$ Adjusted Interest Interest expense 1,904$ 1,711$ 1,222$ Interest expense on subordinated debt (104) (78) (3) Adjusted Interest 1,800$ 1,633$ 1,219$ FFO Interest Coverage(1) 4.5x 4.9x 4.5x Adjusted Debt Debt(2) 38,946$ 39,897$ 32,045$ Subordinated debt (2,944) (3,794) (2,594) Adjusted Debt 36,002$ 36,103$ 29,451$ Acquisition Financing Debt (1,500) (2,000) Acquisition Subsidiary Debt (4,007) (5,296) Adjusted Debt Excluding Acquisition Related Debt 36,002$ 30,596$ 22,155$ FFO to Adjusted Debt Excluding Acquisition Related Debt(3) 17.6% 20.6% 19.0% Capitalization Berkshire Hathaway Energy shareholders’ equity 22,401$ 20,442$ 18,711$ Adjusted debt 36,002 36,103 29,451 Subordinated debt 2,944 3,794 2,594 Noncontrolling interests 134 131 105 Capitalization 61,481$ 60,470$ 50,861$ Adjusted Debt to Total Capitalization(4) 58.6% 59.7% 57.9%

Berkshire Hathaway Energy Non-GAAP Financial Measures ($ millions) BHE Consolidated EBITDA 12/31/2015 Net income attributable to BHE shareholders $2,370 Noncontrolling interests 30 Interest expense 1,904 Capitalized interest (74) Income tax expense 450 Depreciation and amortization 2,428 EBITDA $7,108
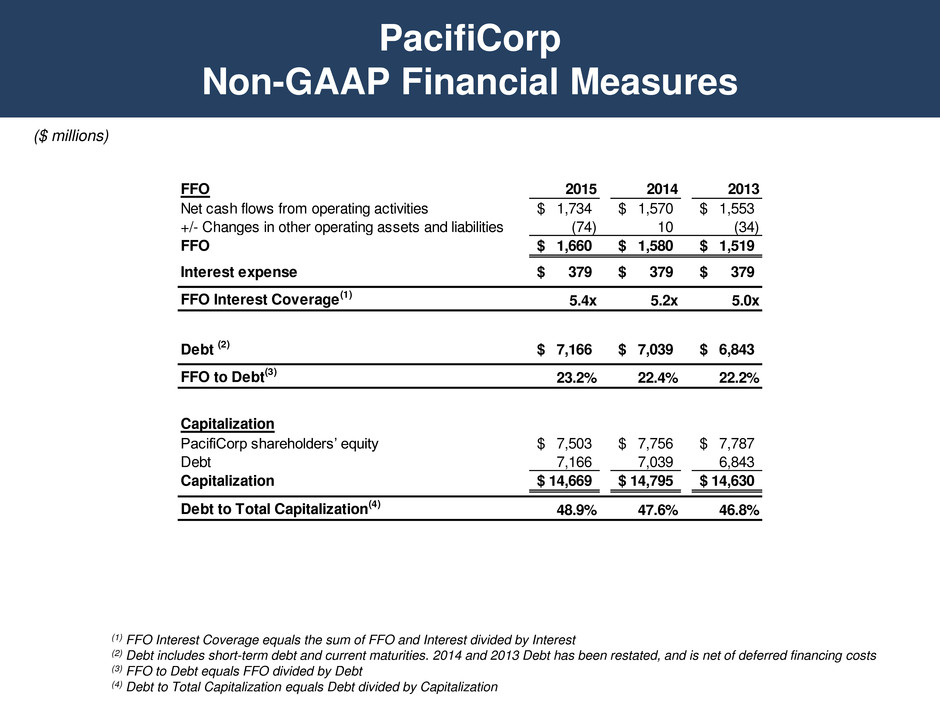
PacifiCorp Non-GAAP Financial Measures (1) FFO Interest Coverage equals the sum of FFO and Interest divided by Interest (2) Debt includes short-term debt and current maturities. 2014 and 2013 Debt has been restated, and is net of deferred financing costs (3) FFO to Debt equals FFO divided by Debt (4) Debt to Total Capitalization equals Debt divided by Capitalization ($ millions) FFO 2015 2014 2013 Net cash flows from operating activities 1,734$ 1,570$ 1,553$ +/- Changes in other operating assets and liabilities (74) 10 (34) FFO 1,660$ 1,580$ 1,519$ Interest expense 379$ 379$ 379$ FFO Interest Coverage(1) 5.4x 5.2x 5.0x Debt (2) 7,166$ 7,039$ 6,843$ FFO to Debt(3) 23.2% 22.4% 22.2% Capitalization PacifiCorp shareholders’ equity 7,503$ 7,756$ 7,787$ Debt 7,166 7,039 6,843 Capitalization 14,669$ 14,795$ 14,630$ Debt to Total Capitalization(4) 48.9% 47.6% 46.8%
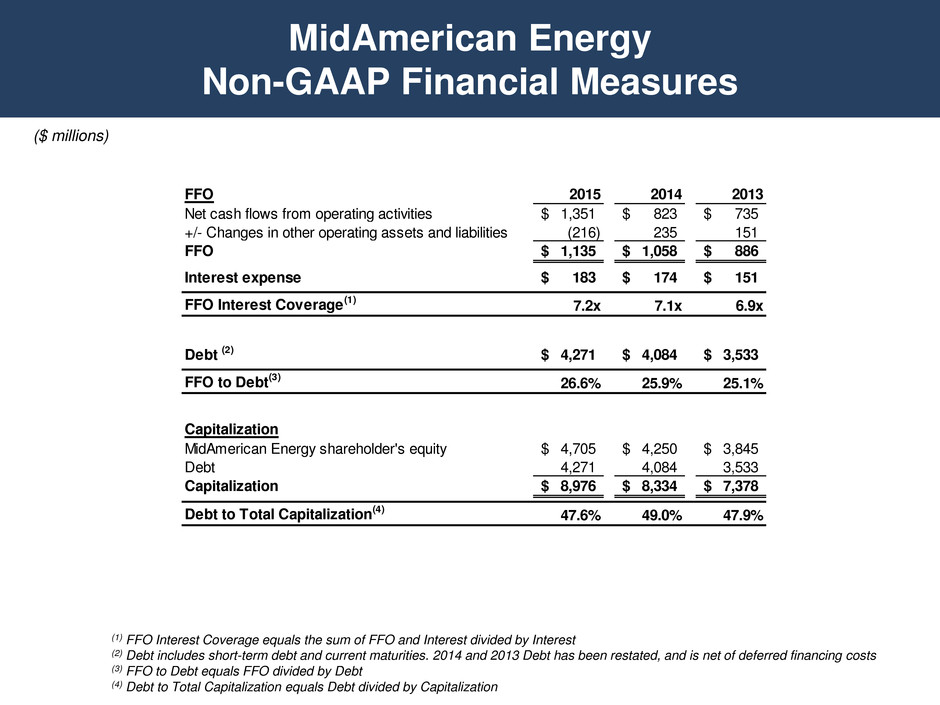
MidAmerican Energy Non-GAAP Financial Measures ($ millions) FFO 2015 2014 2013 Net cash flows from operating activities 1,351$ 823$ 735$ +/- Changes in other operating assets and liabilities (216) 235 151 FFO 1,135$ 1,058$ 886$ Interest expense 183$ 174$ 151$ FFO Interest Coverage(1) 7.2x 7.1x 6.9x Debt (2) 4,271$ 4,084$ 3,533$ FFO to Debt(3) 26.6% 25.9% 25.1% Capitalization MidAmerican Energy shareholder's equity 4,705$ 4,250$ 3,845$ Debt 4,271 4,084 3,533 Capitalization 8,976$ 8,334$ 7,378$ Debt to Total Capitalization(4) 47.6% 49.0% 47.9% (1) FFO Interest Coverage equals the sum of FFO and Interest divided by Interest (2) Debt includes short-term debt and current maturities. 2014 and 2013 Debt has been restated, and is net of deferred financing costs (3) FFO to Debt equals FFO divided by Debt (4) Debt to Total Capitalization equals Debt divided by Capitalization
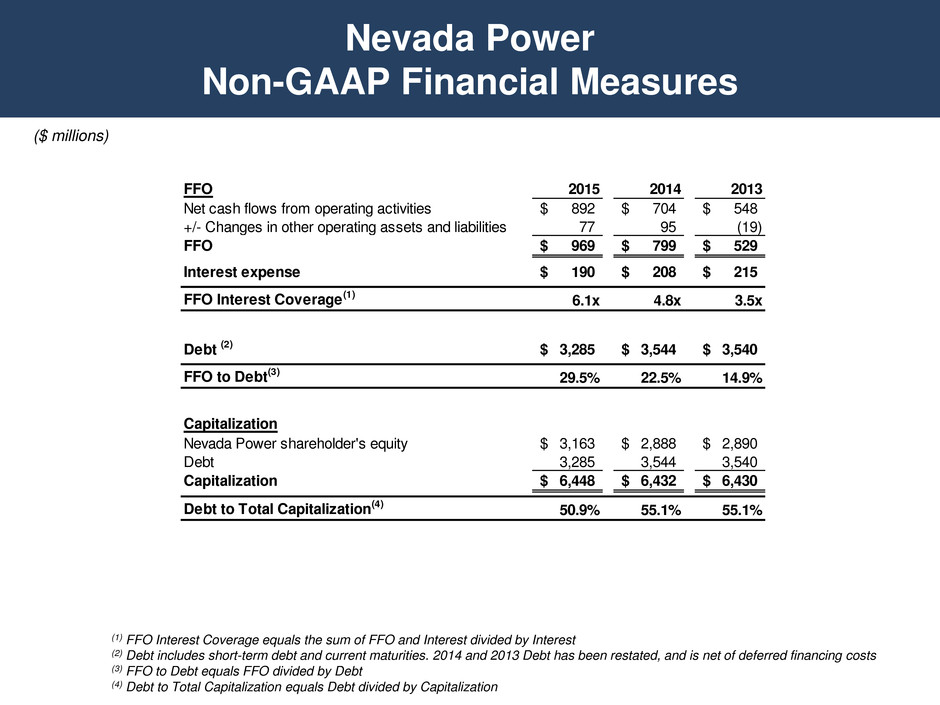
Nevada Power Non-GAAP Financial Measures ($ millions) FFO 2015 2014 2013 Net cash flows from operating activities 892$ 704$ 548$ +/- Changes in other operating assets and liabilities 77 95 (19) FFO 969$ 799$ 529$ Interest expense 190$ 208$ 215$ FFO Interest Coverage(1) 6.1x 4.8x 3.5x Debt (2) 3,285$ 3,544$ 3,540$ FFO to Debt(3) 29.5% 22.5% 14.9% Capitalization Nevada Power shareholder's equity 3,163$ 2,888$ 2,890$ Debt 3,285 3,544 3,540 Capitalization 6,448$ 6,432$ 6,430$ Debt to Total Capitalization(4) 50.9% 55.1% 55.1% (1) FFO Interest Coverage equals the sum of FFO and Interest divided by Interest (2) Debt includes short-term debt and current maturities. 2014 and 2013 Debt has been restated, and is net of deferred financing costs (3) FFO to Debt equals FFO divided by Debt (4) Debt to Total Capitalization equals Debt divided by Capitalization
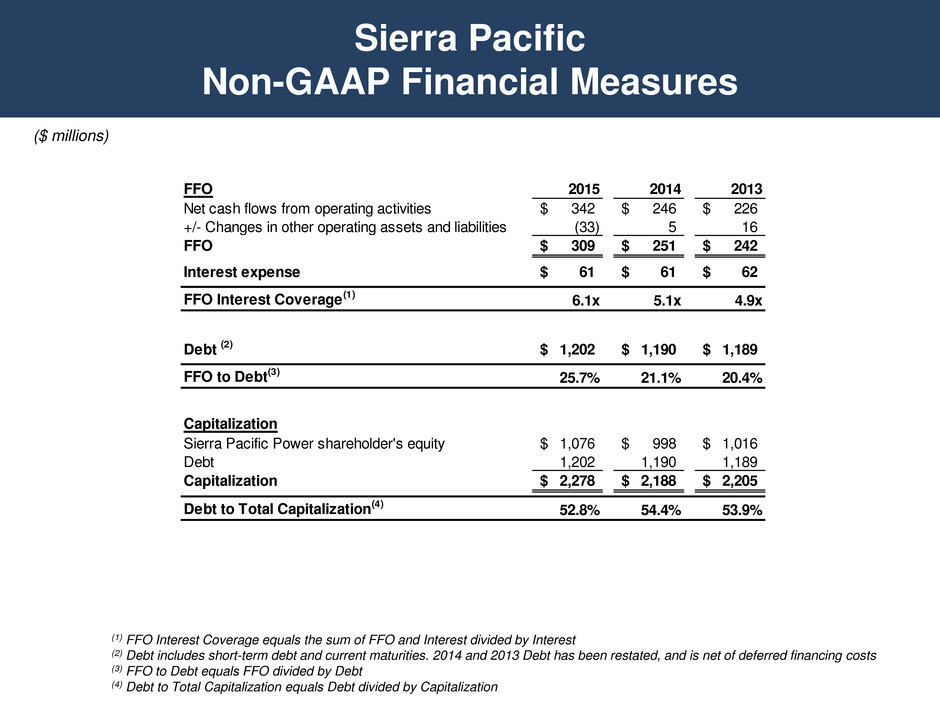
Sierra Pacific Non-GAAP Financial Measures ($ millions) FFO 2015 2014 2013 Net cash flows from operating activities 342$ 246$ 226$ +/- Changes in other operating assets and liabilities (33) 5 16 FFO 309$ 251$ 242$ Interest expense 61$ 61$ 62$ FFO Interest Coverage(1) 6.1x 5.1x 4.9x Debt (2) 1,202$ 1,190$ 1,189$ FFO to Debt(3) 25.7% 21.1% 20.4% Capitalization Sierra Pacific Power shareholder's equity 1,076$ 998$ 1,016$ Debt 1,202 1,190 1,189 Capitalization 2,278$ 2,188$ 2,205$ Debt to Total Capitalization(4) 52.8% 54.4% 53.9% (1) FFO Interest Coverage equals the sum of FFO and Interest divided by Interest (2) Debt includes short-term debt and current maturities. 2014 and 2013 Debt has been restated, and is net of deferred financing costs (3) FFO to Debt equals FFO divided by Debt (4) Debt to Total Capitalization equals Debt divided by Capitalization
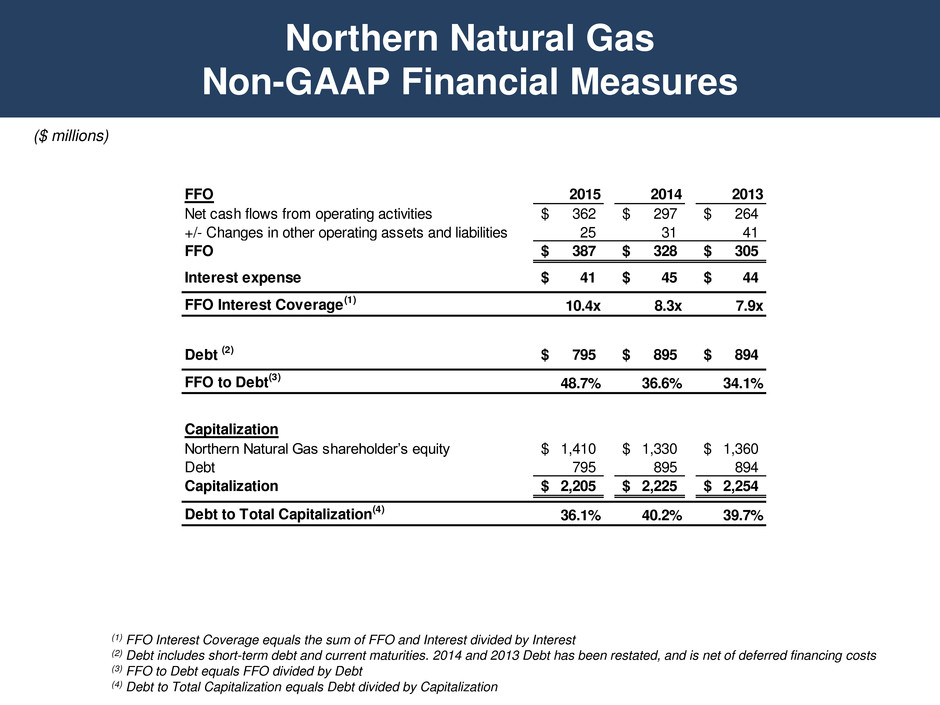
Northern Natural Gas Non-GAAP Financial Measures ($ millions) FFO 2015 2014 2013 Net cash flows from operating activities 362$ 297$ 264$ +/- Changes in other operating assets and liabilities 25 31 41 FFO 387$ 328$ 305$ Interest expense 41$ 45$ 44$ FFO Interest Coverage(1) 10.4x 8.3x 7.9x Debt (2) 795$ 895$ 894$ FFO to Debt(3) 48.7% 36.6% 34.1% Capitalization Northern Natural Gas shareholder’s equity 1,410$ 1,330$ 1,360$ Debt 795 895 894 Capitalization 2,205$ 2,225$ 2,254$ Debt to Total Capitalization(4) 36.1% 40.2% 39.7% (1) FFO Interest Coverage equals the sum of FFO and Interest divided by Interest (2) Debt includes short-term debt and current maturities. 2014 and 2013 Debt has been restated, and is net of deferred financing costs (3) FFO to Debt equals FFO divided by Debt (4) Debt to Total Capitalization equals Debt divided by Capitalization
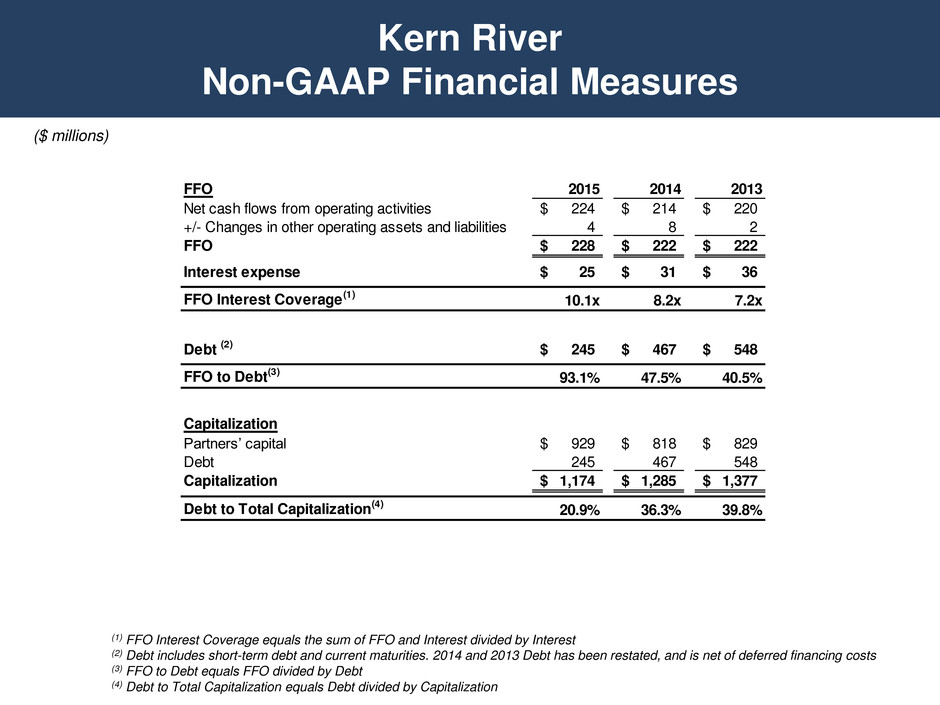
Kern River Non-GAAP Financial Measures ($ millions) FFO 2015 2014 2013 Net cash flows from operating activities 224$ 214$ 220$ +/- Changes in other operating assets and liabilities 4 8 2 FFO 228$ 222$ 222$ Interest expense 25$ 31$ 36$ FFO Interest Coverage(1) 10.1x 8.2x 7.2x Debt (2) 245$ 467$ 548$ FFO to Debt(3) 93.1% 47.5% 40.5% Capitalization Partners’ capital 929$ 818$ 829$ Debt 245 467 548 Capitalization 1,174$ 1,285$ 1,377$ Debt to Total Capitalization(4) 20.9% 36.3% 39.8% (1) FFO Interest Coverage equals the sum of FFO and Interest divided by Interest (2) Debt includes short-term debt and current maturities. 2014 and 2013 Debt has been restated, and is net of deferred financing costs (3) FFO to Debt equals FFO divided by Debt (4) Debt to Total Capitalization equals Debt divided by Capitalization
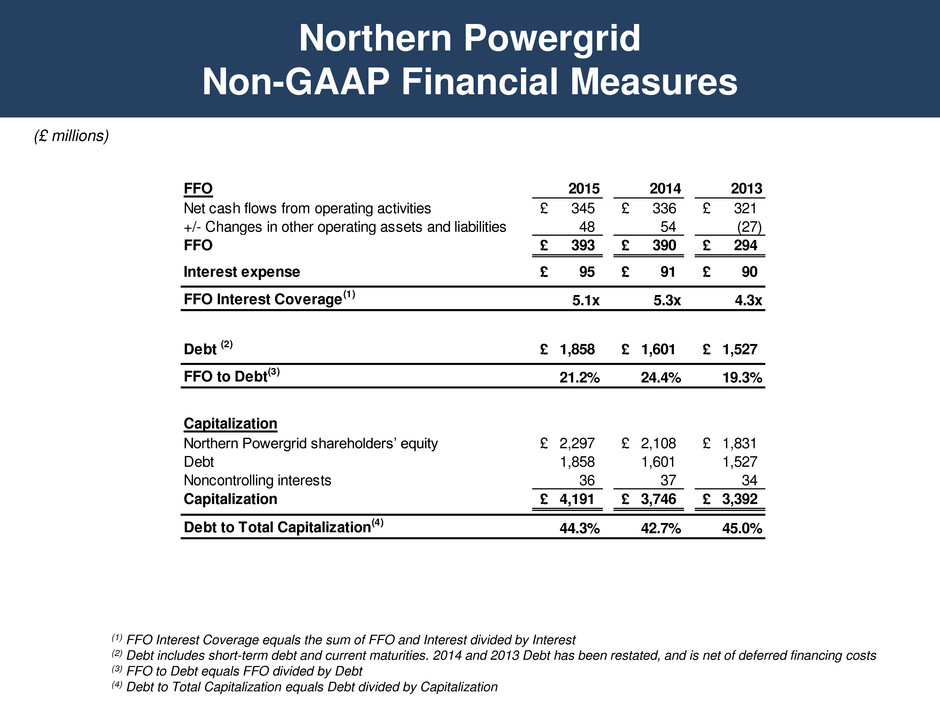
Northern Powergrid Non-GAAP Financial Measures (£ millions) FFO 2015 2014 2013 Net cash flows from operating activities 345£ 336£ 321£ +/- Changes in other operating assets and liabilities 48 54 (27) FFO 393£ 390£ 294£ Interest expense 95£ 91£ 90£ FFO Interest Coverage(1) 5.1x 5.3x 4.3x Debt (2) 1,858£ 1,601£ 1,527£ FFO to Debt(3) 21.2% 24.4% 19.3% Capitalization Northern Powergrid shareholders’ equity 2,297£ 2,108£ 1,831£ Debt 1,858 1,601 1,527 Noncontrolling interests 36 37 34 Capitalization 4,191£ 3,746£ 3,392£ Debt to Total Capitalization(4) 44.3% 42.7% 45.0% (1) FFO Interest Coverage equals the sum of FFO and Interest divided by Interest (2) Debt includes short-term debt and current maturities. 2014 and 2013 Debt has been restated, and is net of deferred financing costs (3) FFO to Debt equals FFO divided by Debt (4) Debt to Total Capitalization equals Debt divided by Capitalization

2016 Fixed-Income Investor Conference Bill Fehrman President and CEO MidAmerican Energy Company
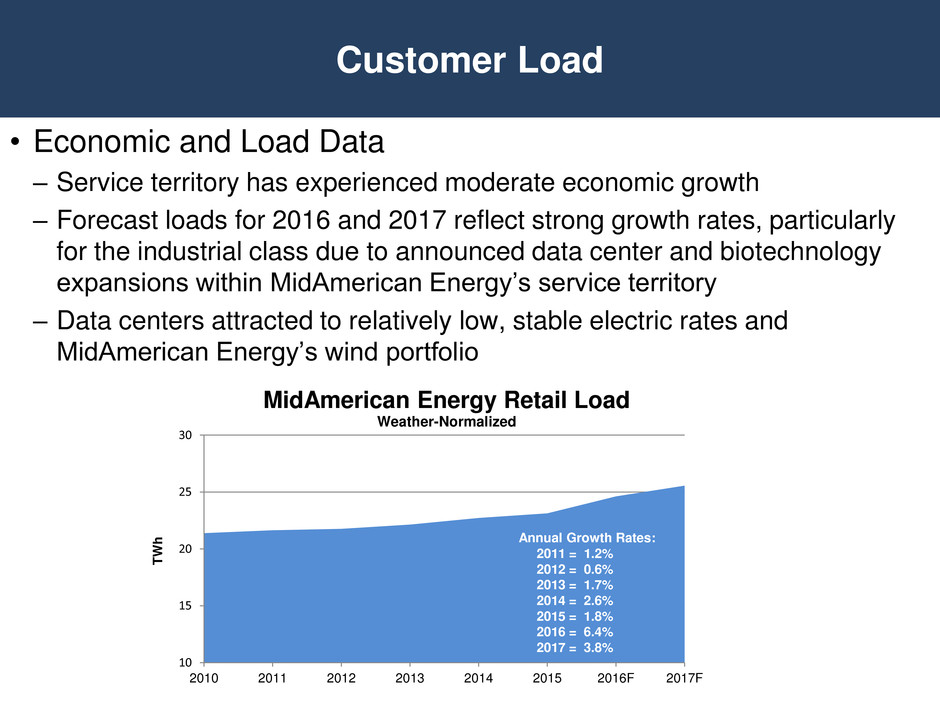
Customer Load • Economic and Load Data – Service territory has experienced moderate economic growth – Forecast loads for 2016 and 2017 reflect strong growth rates, particularly for the industrial class due to announced data center and biotechnology expansions within MidAmerican Energy’s service territory – Data centers attracted to relatively low, stable electric rates and MidAmerican Energy’s wind portfolio 10 15 20 25 30 2010 2011 2012 2013 2014 2015 2016F 2017F T W h MidAmerican Energy Retail Load Weather-Normalized Annual Growth Rates: 2011 = 1.2% 2012 = 0.6% 2013 = 1.7% 2014 = 2.6% 2015 = 1.8% 2016 = 6.4% 2017 = 3.8%
• All electric jurisdictions recently updated with new base rates • Final $45 million step-up related to Iowa base rate increase effective January 1, 2016 • All state jurisdictions have energy and transmission cost rider recovery mechanisms; Iowa and South Dakota energy riders include PTCs • Revenue sharing mechanism in Iowa reduces rate base for 80% of ROEs exceeding 11%; 100% sharing for ROE exceeding 14%; may file for base rate increase if ROE is projected to fall below 10% • No near-term need for electric base rate relief is expected • Managing capital and O&M spending to minimize the need for gas base rate relief • Gas capital tracker mechanism being pursued in Iowa Rate Status

• Forecast Iowa electric net plant with Wind IX and Wind X – 59% of Iowa electric net plant subject to rate-making principles – 11.9% weighted average return on equity – 24 years weighted average remaining life Iowa Electric Net Plant Subject to Rate-Making Principles Annual Growth Rates: 2010 = 4.2% 2011 = 1.2% 2012 = 0.6% 2013 = 1.7% 2014 = 6.7% 2015 = 3.4% Subject to Rate Principles Subject to General Rate Order $5,707 59% $3,999 41% 2016 Forecast Iowa Electric Net Plant ($ millions)

Capital Investment Plan • Operating capital varies with major power generation outages and system requirements • Development capital varies with the completion of major initiatives: – Wind generation projects 2013-2016 – Air quality environmental projects 2013-2014 – Multi-value transmission projects 2014-2018 ($ Millions) 2016-2018 Current Plan Prior Plan Operating $ 1,030 $ 1,032 Development 1,085 441 Total $ 2,115 $ 1,473 MidAmerican Energy Capital Expenditures $436 $539 $341 $351 $372 $307 $591 $988 $1,107 $738 $245 $102 - 200 400 600 800 1,000 1,200 1,400 1,600 2013 2014 2015 2016F 2017F 2018F ($ millions) Operating Development
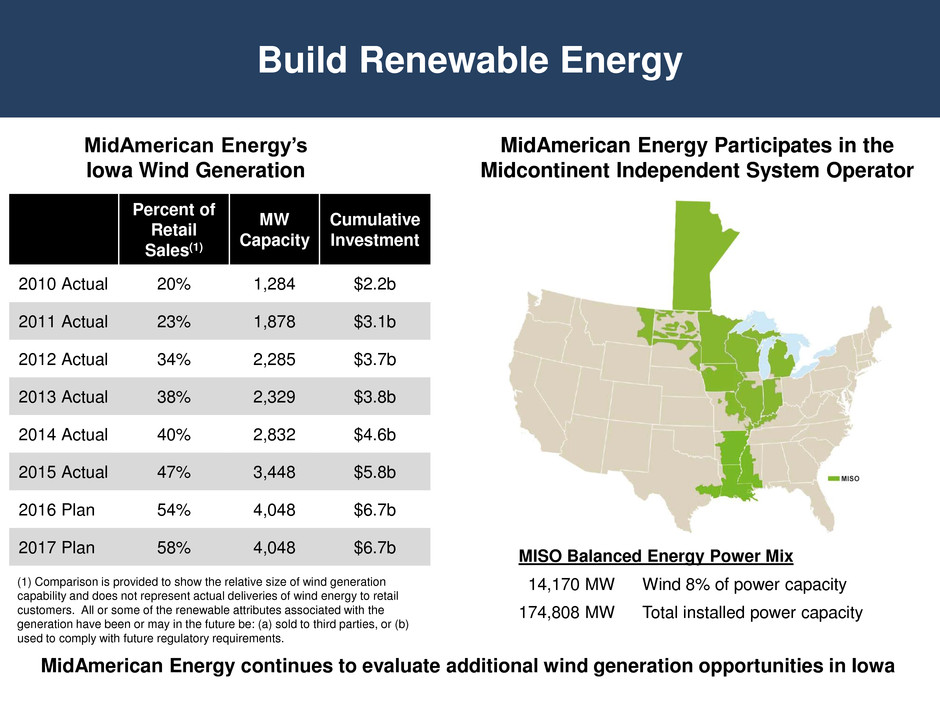
Build Renewable Energy Percent of Retail Sales(1) MW Capacity Cumulative Investment 2010 Actual 20% 1,284 $2.2b 2011 Actual 23% 1,878 $3.1b 2012 Actual 34% 2,285 $3.7b 2013 Actual 38% 2,329 $3.8b 2014 Actual 40% 2,832 $4.6b 2015 Actual 47% 3,448 $5.8b 2016 Plan 54% 4,048 $6.7b 2017 Plan 58% 4,048 $6.7b MidAmerican Energy’s Iowa Wind Generation MISO Balanced Energy Power Mix 14,170 MW Wind 8% of power capacity 174,808 MW Total installed power capacity MidAmerican Energy Participates in the Midcontinent Independent System Operator (1) Comparison is provided to show the relative size of wind generation capability and does not represent actual deliveries of wind energy to retail customers. All or some of the renewable attributes associated with the generation have been or may in the future be: (a) sold to third parties, or (b) used to comply with future regulatory requirements. MidAmerican Energy continues to evaluate additional wind generation opportunities in Iowa
• Quad Cities Station, 25% owned by MidAmerican and 75% owned and operated by Exelon • MidAmerican’s share is 456 MW • Operating license expires in 2032 • Exelon publicly reporting it is evaluating the possible early retirement of plant – No formal notice received regarding early retirement – Working closely with Exelon on a possible Illinois legislative solution • Plant is committed to operate through at least May 2018 • MidAmerican desires the plant to continue operation – Involved in ongoing, regular discussions with Exelon on status of the plant Quad Cities Nuclear Update

• MidAmerican Energy is constructing portions of four 345-kV multi-value projects (MVP) within the MISO footprint, totaling approximately 245 miles; approved by the MISO board in December 2011 • Expenditures predominantly in 2013-2018, totaling approximately $491 million, excluding equity AFUDC • MVPs are eligible for incentive rate treatment in MISO tariff, including construction work in progress in rate base and recovery of prudent costs incurred if projects are abandoned • MVP revenue requirements broadly recovered from all MISO load; approximately 96% recovered from other MISO participants • MVPs expected to provide multiple benefits, including improved reliability, reduced congestion and support for additional power generation development • All transmission investments utilize forward-looking rate treatment in MISO tariff, mitigating rate lag Transmission Development
MidAmerican Energy Appendix
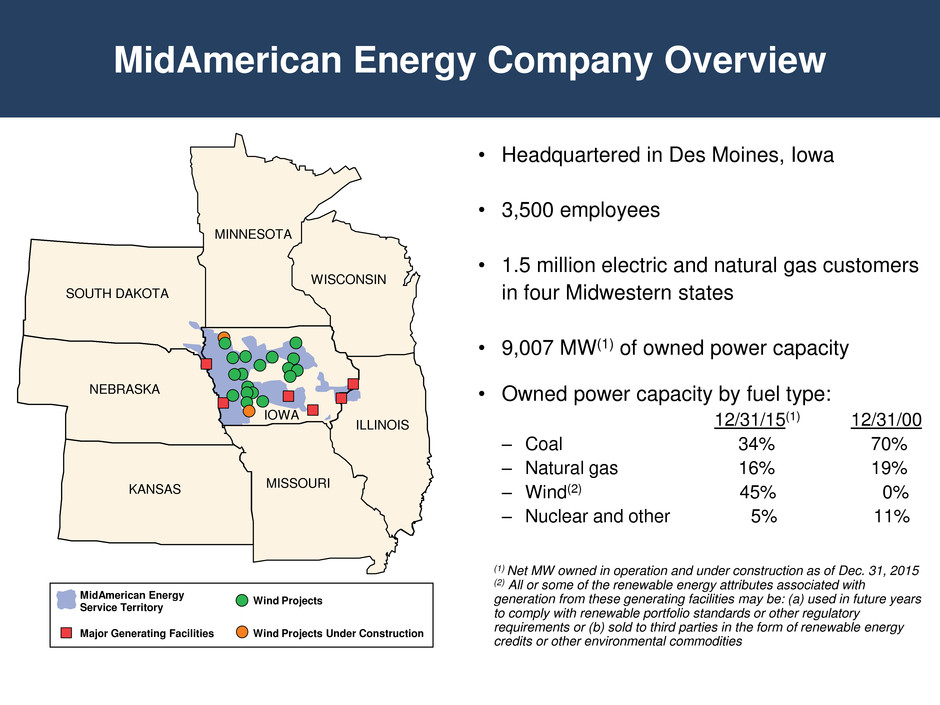
MidAmerican Energy Company Overview • Headquartered in Des Moines, Iowa • 3,500 employees • 1.5 million electric and natural gas customers in four Midwestern states • 9,007 MW(1) of owned power capacity • Owned power capacity by fuel type: 12/31/15(1) 12/31/00 – Coal 34% 70% – Natural gas 16% 19% – Wind(2) 45% 0% – Nuclear and other 5% 11% (1) Net MW owned in operation and under construction as of Dec. 31, 2015 (2) All or some of the renewable energy attributes associated with generation from these generating facilities may be: (a) used in future years to comply with renewable portfolio standards or other regulatory requirements or (b) sold to third parties in the form of renewable energy credits or other environmental commodities SOUTH DAKOTA NEBRASKA KANSAS MISSOURI ILLINOIS WISCONSIN MINNESOTA IOWA MidAmerican Energy Service Territory Major Generating Facilities Wind Projects Wind Projects Under Construction
• Private generation activities in Iowa – Iowa Utilities Board inquiry which is gathering information related to policy and technical issues: net energy metering, interconnection of private generation, customer awareness and protection – Inquiry on avoided costs • MidAmerican Energy’s approach to private generation in Iowa – Focused on keeping costs low for all customers – Avoid inter-class cross-subsidization through proper rate design – Considering how to add solar generation options for customers – Considering how to add energy storage to the system Private Generation in Iowa
Environmental Position • Of MidAmerican Energy’s 3,094(1) MW of owned coal-fueled generation: – Neal Energy Center Units 1 and 2 (390 MW) will retire in 2016 • By April 2016, 100% of MidAmerican Energy’s coal-fueled generation capacity equipped with nitrogen oxides controls, scrubbers, baghouses and mercury controls • Anticipated future projects – Ash pond closures – Bottom ash dry handling – Cooling water intake structure retrofits for fish handling • Projected environmental capital spend(2) – $196 million from 2016-2018 (1) Net owned capacity as of Dec. 31, 2015 (2) Environmental capital expenditures forecast excludes equity AFUDC
• Federal coal combustion residuals (“CCR”) rule requires owners and operators of ash ponds and landfills to meet certain operating criteria or close or retrofit CCR units that do not meet criteria • Updated federal wastewater discharge rules require coal-fueled power plants to achieve zero discharge of CCR-related waste streams by 2022. Many issues raised by this rule are already being addressed through compliance with the CCR rule • MidAmerican operates nine affected ash ponds: – Two inactive ash ponds were closed in October 2015 and are not subject to the CCR rule – Four inactive ash ponds will be closed by April 2018 in accordance with the CCR rule – Three ash ponds will remain active until dry bottom ash retrofit projects are completed in 2017 and 2018, and then will be closed under the CCR rule – Lined wastewater treatment ponds will be installed to manage remaining waste streams and comply with wastewater discharge requirements • MidAmerican operates four affected landfills and is evaluating opportunities to consolidate, replace or upgrade landfills to minimize regulatory risk Coal Ash and Wastewater Management
Clean Power Plan • MidAmerican is well-positioned to comply with the final Clean Power Plan if or when a final rule is approved • MidAmerican continues to engage in state and federal efforts to shape compliance with the potential Clean Power Plan, including implementation activities to ensure customers and costs are appropriately considered • The U.S. Supreme Court issued a stay February 9, 2016, of the implementation of the Clean Power Plan pending the outcome of the litigation pending in the D.C. Circuit Court of Appeals and through any action taken on appeal to the U.S. Supreme Court • MidAmerican is developing a comprehensive strategy to respond to this uncertainty, including how to work with regulators to ensure compliance decisions continue to recognize our investments to reduce our carbon footprint and minimize impacts to our customers
• Current recoveries for transmission service in MISO for MidAmerican Energy-owned regional transmission assets based on 12.38% return on equity • Two FERC complaint dockets seek to lower base ROE to 9.15% and 8.67% for periods beginning November 2013 and March 2015, respectively • Preliminary decision by administrative law judge in first complaint recommending 10.32% ROE (before incentive adders) pending before the FERC Commissioners • Second complaint hearing held in February 2016 • Immaterial refund reserve established for the period from November 2013 through December 31, 2015 • Final decision in the first case expected October 2016 and for the second case in April 2017 MISO ROE Proceedings

2016 Fixed-Income Investor Conference Paul Caudill President & CEO NV Energy
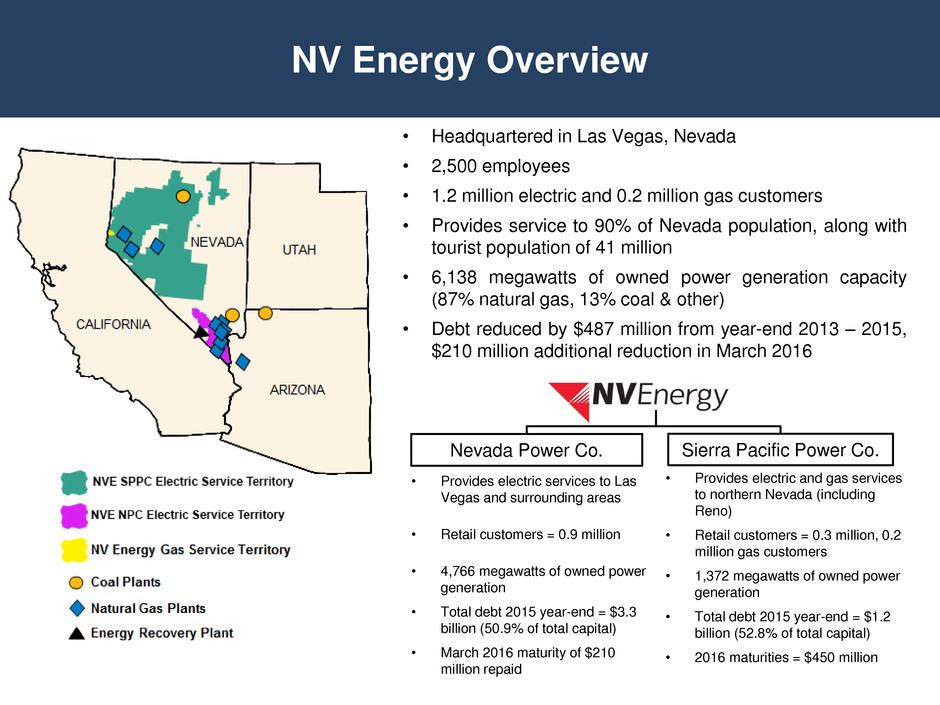
• Headquartered in Las Vegas, Nevada • 2,500 employees • 1.2 million electric and 0.2 million gas customers • Provides service to 90% of Nevada population, along with tourist population of 41 million • 6,138 megawatts of owned power generation capacity (87% natural gas, 13% coal & other) • Debt reduced by $487 million from year-end 2013 – 2015, $210 million additional reduction in March 2016 NV Energy Overview • Provides electric services to Las Vegas and surrounding areas • Retail customers = 0.9 million • 4,766 megawatts of owned power generation • Total debt 2015 year-end = $3.3 billion (50.9% of total capital) • March 2016 maturity of $210 million repaid • Provides electric and gas services to northern Nevada (including Reno) • Retail customers = 0.3 million, 0.2 million gas customers • 1,372 megawatts of owned power generation • Total debt 2015 year-end = $1.2 billion (52.8% of total capital) • 2016 maturities = $450 million Nevada Power Co. Sierra Pacific Power Co.

Customer Load System Load Comparison 2015 versus 2014 Nevada Power Co. • Commercial up 2.6% led by retail expansion • Residential up 1.8% due to customer growth • Industrial up 1.0% led by tourism and data center load Sierra Pacific Power Co. • Industrial up 3.7% led by data centers, tourism, and construction industry • Residential up 1.6% up due to customer growth • Large mining down 0.8% due to low metal prices • Commercial down 0.1% due to sluggish retail Load Forecast For 2016 And 2017 Nevada Power Co. • Increasing retail and manufacturing loads will help drive non-residential load growth Sierra Pacific Power Co. • Increasing data center and manufacturing loads will help drive non-residential load growth Key Drivers To System Load • No state income tax and low business tax rates • Lower unemployment rate of 6.4% in 2015 versus 7.1% in 2014, expectations for 5.7% in 2017 • Annual energy efficiency savings averaged about 218 gigawatt-hours over the last five years offsets somewhat new residential load growth 20.0 20.5 21.0 21.5 22.0 2010 2011 2012 2013 2014 2015 2016F 2017F T W h Nevada Power Co. Energy Retail Load (Weather-Normalized) 7.0 7.5 8.0 8.5 2010 2011 2012 2013 2014 2015 2016F 2017F T W h Sierra Pacific Power Co. Energy Retail Load (Weather-Normalized) Annual Growth Rate 2011 = 1.6% 2012 = 3.3% 2013 = 2.2% 2014 = 0.4% 2015 = 1.7% 2016 = (1.1)% 2017 = 2.9% Annual Growth Rate 2011 = 0.8% 2012 = 0.8% 2013 = 0.1% 2014 = (0.8%) 2015 = 1.7% 2016 = 1.0% 2017 = 1.1%
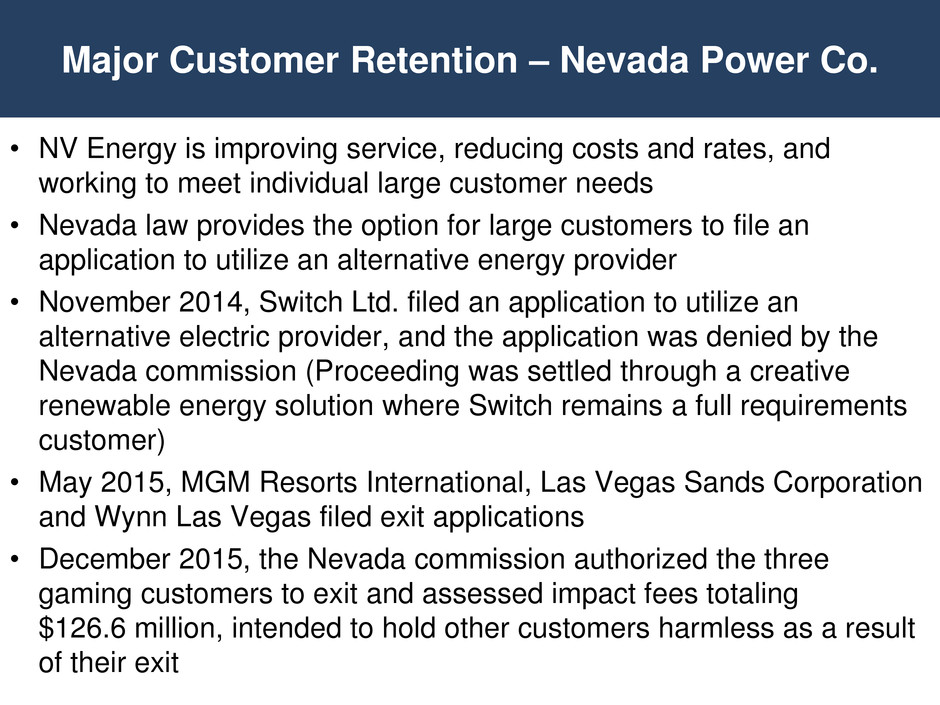
• NV Energy is improving service, reducing costs and rates, and working to meet individual large customer needs • Nevada law provides the option for large customers to file an application to utilize an alternative energy provider • November 2014, Switch Ltd. filed an application to utilize an alternative electric provider, and the application was denied by the Nevada commission (Proceeding was settled through a creative renewable energy solution where Switch remains a full requirements customer) • May 2015, MGM Resorts International, Las Vegas Sands Corporation and Wynn Las Vegas filed exit applications • December 2015, the Nevada commission authorized the three gaming customers to exit and assessed impact fees totaling $126.6 million, intended to hold other customers harmless as a result of their exit Major Customer Retention – Nevada Power Co.
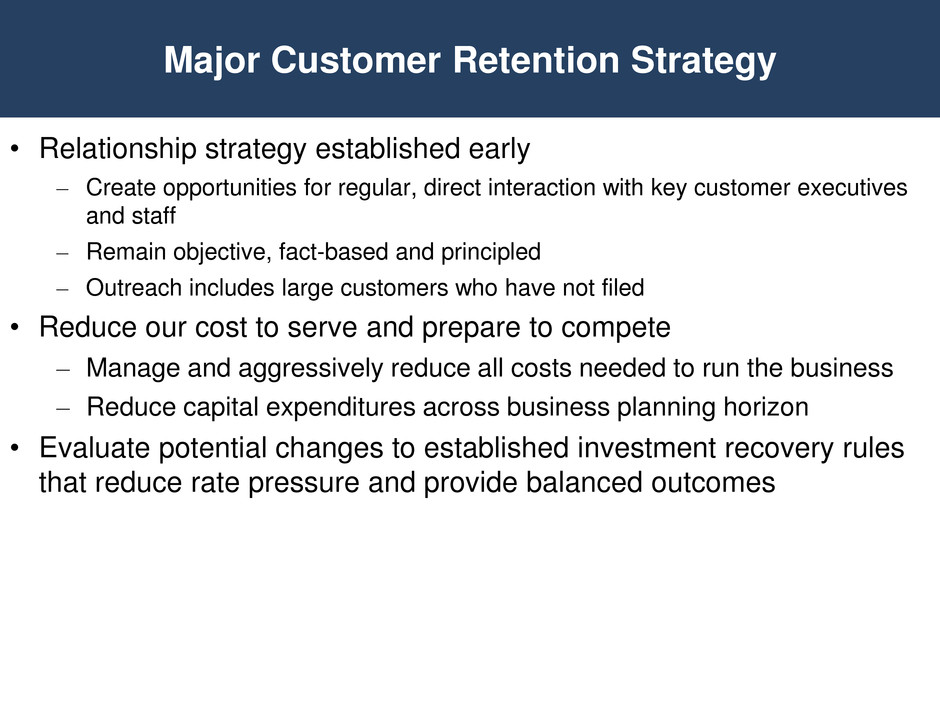
• Relationship strategy established early – Create opportunities for regular, direct interaction with key customer executives and staff – Remain objective, fact-based and principled – Outreach includes large customers who have not filed • Reduce our cost to serve and prepare to compete – Manage and aggressively reduce all costs needed to run the business – Reduce capital expenditures across business planning horizon • Evaluate potential changes to established investment recovery rules that reduce rate pressure and provide balanced outcomes Major Customer Retention Strategy
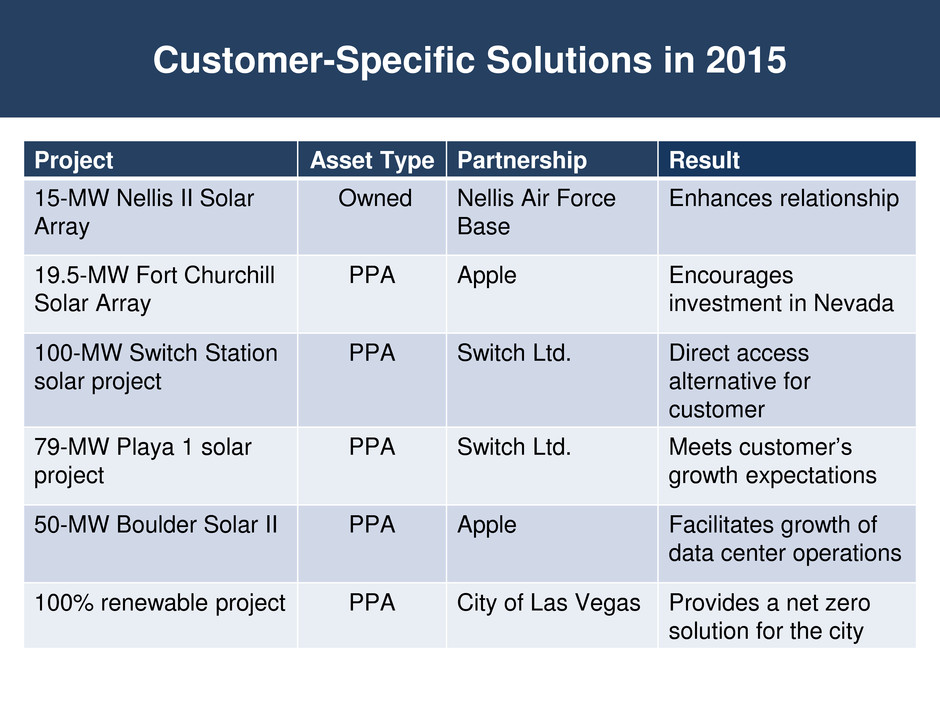
Project Asset Type Partnership Result 15-MW Nellis II Solar Array Owned Nellis Air Force Base Enhances relationship 19.5-MW Fort Churchill Solar Array PPA Apple Encourages investment in Nevada 100-MW Switch Station solar project PPA Switch Ltd. Direct access alternative for customer 79-MW Playa 1 solar project PPA Switch Ltd. Meets customer’s growth expectations 50-MW Boulder Solar II PPA Apple Facilitates growth of data center operations 100% renewable project PPA City of Las Vegas Provides a net zero solution for the city Customer-Specific Solutions in 2015
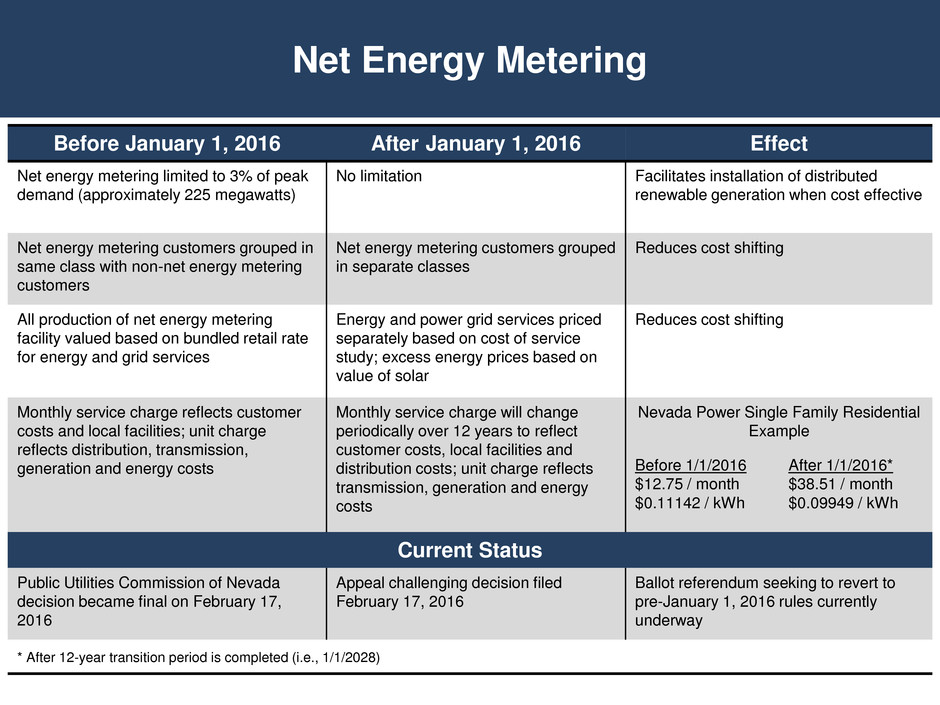
Net Energy Metering Before January 1, 2016 After January 1, 2016 Effect Net energy metering limited to 3% of peak demand (approximately 225 megawatts) No limitation Facilitates installation of distributed renewable generation when cost effective Net energy metering customers grouped in same class with non-net energy metering customers Net energy metering customers grouped in separate classes Reduces cost shifting All production of net energy metering facility valued based on bundled retail rate for energy and grid services Energy and power grid services priced separately based on cost of service study; excess energy prices based on value of solar Reduces cost shifting Monthly service charge reflects customer costs and local facilities; unit charge reflects distribution, transmission, generation and energy costs Monthly service charge will change periodically over 12 years to reflect customer costs, local facilities and distribution costs; unit charge reflects transmission, generation and energy costs Nevada Power Single Family Residential Example Before 1/1/2016 $12.75 / month $0.11142 / kWh After 1/1/2016* $38.51 / month $0.09949 / kWh Current Status Public Utilities Commission of Nevada decision became final on February 17, 2016 Appeal challenging decision filed February 17, 2016 Ballot referendum seeking to revert to pre-January 1, 2016 rules currently underway * After 12-year transition period is completed (i.e., 1/1/2028)
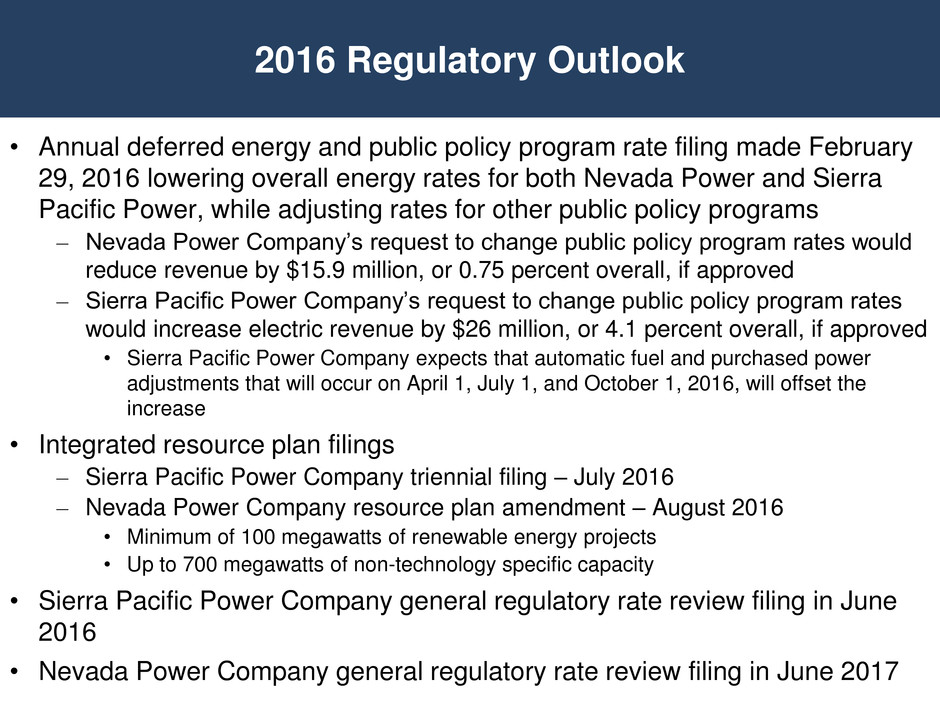
• Annual deferred energy and public policy program rate filing made February 29, 2016 lowering overall energy rates for both Nevada Power and Sierra Pacific Power, while adjusting rates for other public policy programs – Nevada Power Company’s request to change public policy program rates would reduce revenue by $15.9 million, or 0.75 percent overall, if approved – Sierra Pacific Power Company’s request to change public policy program rates would increase electric revenue by $26 million, or 4.1 percent overall, if approved • Sierra Pacific Power Company expects that automatic fuel and purchased power adjustments that will occur on April 1, July 1, and October 1, 2016, will offset the increase • Integrated resource plan filings – Sierra Pacific Power Company triennial filing – July 2016 – Nevada Power Company resource plan amendment – August 2016 • Minimum of 100 megawatts of renewable energy projects • Up to 700 megawatts of non-technology specific capacity • Sierra Pacific Power Company general regulatory rate review filing in June 2016 • Nevada Power Company general regulatory rate review filing in June 2017 2016 Regulatory Outlook
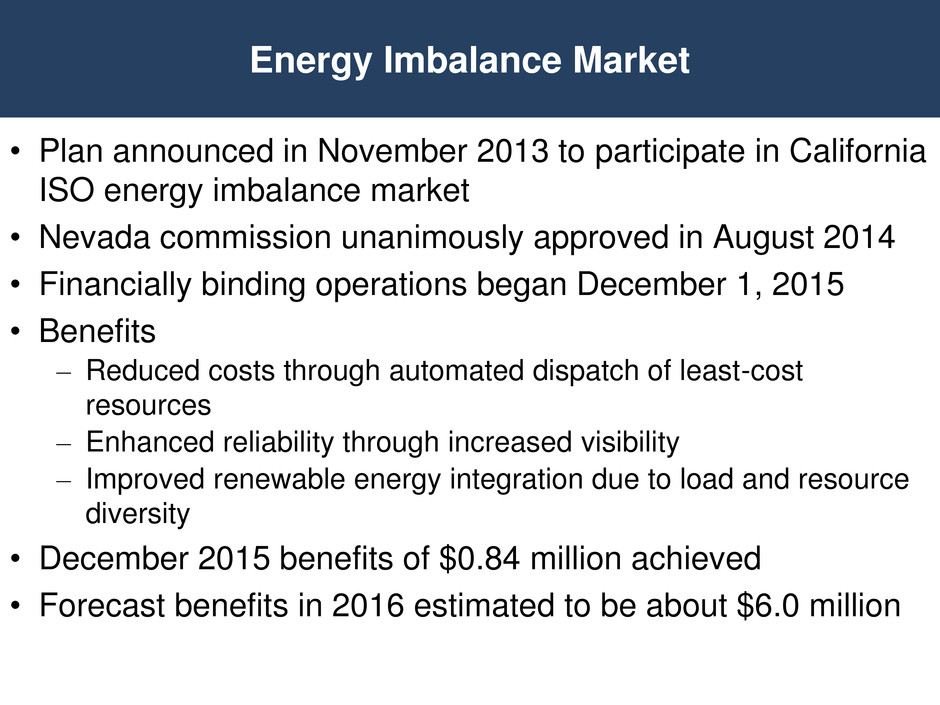
Energy Imbalance Market • Plan announced in November 2013 to participate in California ISO energy imbalance market • Nevada commission unanimously approved in August 2014 • Financially binding operations began December 1, 2015 • Benefits – Reduced costs through automated dispatch of least-cost resources – Enhanced reliability through increased visibility – Improved renewable energy integration due to load and resource diversity • December 2015 benefits of $0.84 million achieved • Forecast benefits in 2016 estimated to be about $6.0 million
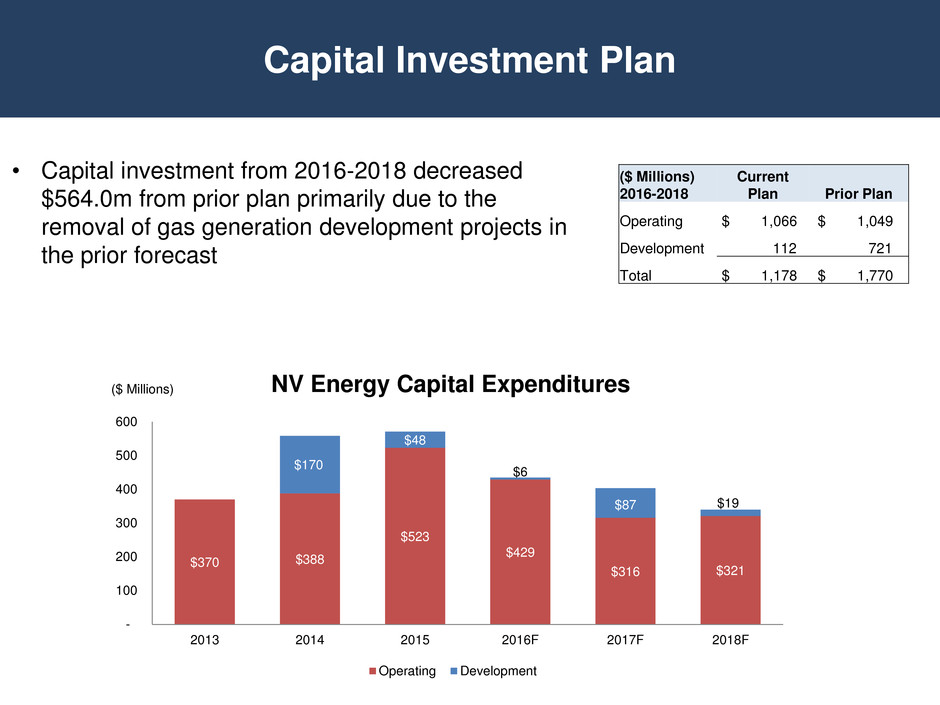
Capital Investment Plan • Capital investment from 2016-2018 decreased $564.0m from prior plan primarily due to the removal of gas generation development projects in the prior forecast $370 $388 $523 $429 $316 $321 $170 $48 $6 $87 $19 - 100 200 300 400 500 600 2013 2014 2015 2016F 2017F 2018F NV Energy Capital Expenditures Operating Development ($ Millions) ($ Millions) 2016-2018 Current Plan Prior Plan Operating $ 1,066 $ 1,049 Development 112 721 Total $ 1,178 $ 1,770
NV Energy Appendix
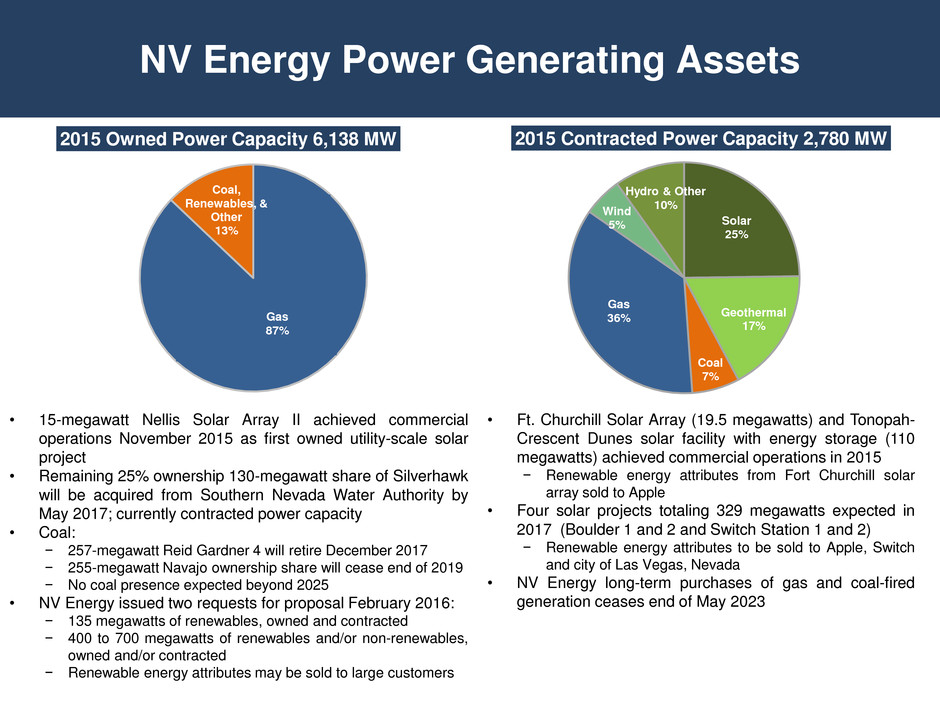
Solar 25% Geothermal 17% Coal 7% Gas 36% Wind 5% Hydro & Other 10% 2015 Contracted Power Capacity 2,780 MW NV Energy Power Generating Assets • Ft. Churchill Solar Array (19.5 megawatts) and Tonopah- Crescent Dunes solar facility with energy storage (110 megawatts) achieved commercial operations in 2015 − Renewable energy attributes from Fort Churchill solar array sold to Apple • Four solar projects totaling 329 megawatts expected in 2017 (Boulder 1 and 2 and Switch Station 1 and 2) − Renewable energy attributes to be sold to Apple, Switch and city of Las Vegas, Nevada • NV Energy long-term purchases of gas and coal-fired generation ceases end of May 2023 Gas 87% Coal, Renewables, & Other 13% 2015 Owned Power Capacity 6,138 MW • 15-megawatt Nellis Solar Array II achieved commercial operations November 2015 as first owned utility-scale solar project • Remaining 25% ownership 130-megawatt share of Silverhawk will be acquired from Southern Nevada Water Authority by May 2017; currently contracted power capacity • Coal: − 257-megawatt Reid Gardner 4 will retire December 2017 − 255-megawatt Navajo ownership share will cease end of 2019 − No coal presence expected beyond 2025 • NV Energy issued two requests for proposal February 2016: − 135 megawatts of renewables, owned and contracted − 400 to 700 megawatts of renewables and/or non-renewables, owned and/or contracted − Renewable energy attributes may be sold to large customers
Customer Retention Exit Fee • The payment of an up-front impact fee, comprised of a base tariff general rate (“BTGR”) component and a base tariff energy rate (“BTER”) component ‒ The BTGR component reflects investments NV Energy has made in generation, transmission and distribution facilities to serve its customers ‒ The BTER component reflects the increase in system energy costs that will occur if the applicants choose to purchase energy from an alternative provider • Payment of on-going fees (called “non-bypassable charges” by the Nevada commission) ‒ One element reflects the “out-of-the-money” portion of long-term renewable contracts entered into to meet Nevada’s renewable portfolio standard mandated by Nevada Legislature ‒ Another element reflects the cost of retiring coal-fired generation and remediating certain facilities pursuant to a state law passed in 2013
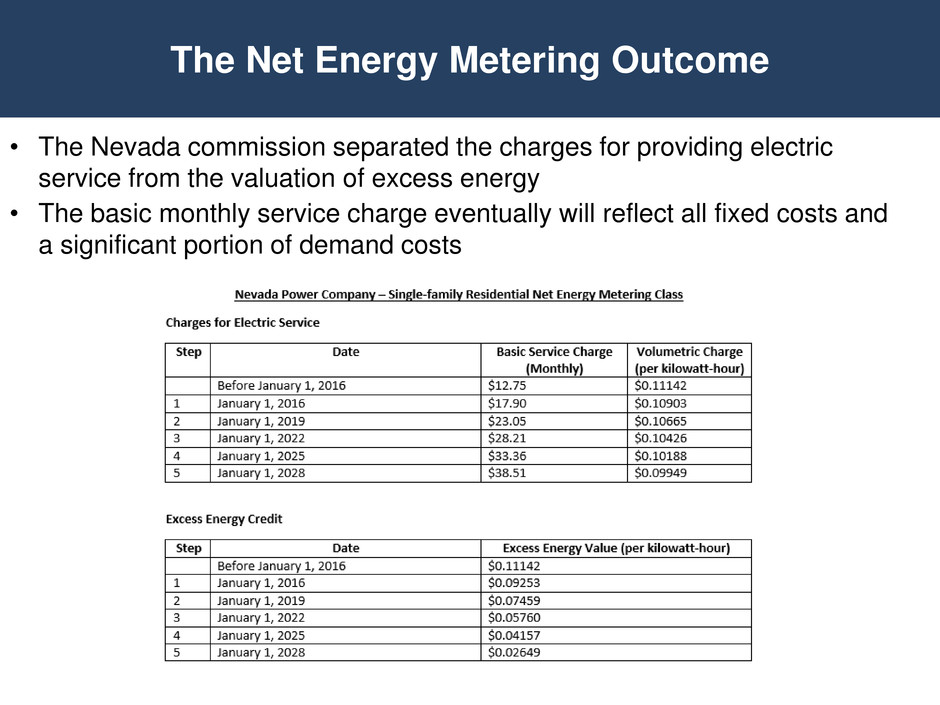
The Net Energy Metering Outcome • The Nevada commission separated the charges for providing electric service from the valuation of excess energy • The basic monthly service charge eventually will reflect all fixed costs and a significant portion of demand costs
NV Energy Environmental Position • NV Energy is reducing dependency on coal-fueled generation ‒ 300-megawatt Reid Gardner Units 1-3 retired in 2014 ‒ 257-megawatt Reid Gardner Unit 4 to be retired in 2017 ‒ 255-megawatt ownership of Navajo Units 1-3 ends in 2019 ‒ 261-megawatt North Valmy units anticipated to be retired in 2025 • Customers currently benefitting from 1,186 megawatts of utility-scale renewable energy resources • Clean Power Plan is viewed as an opportunity for state of Nevada • The U.S. Supreme Court issued a stay February 9, 2016, of the implementation of the Clean Power Plan pending the outcome of the litigation pending in the D.C. Circuit Court of Appeals and through any action taken on appeal to the U.S. Supreme Court

2016 Fixed-Income Investor Conference Stefan Bird Cindy Crane Pat Reiten President and CEO PacifiCorp Transmission President and CEO Rocky Mountain Power President and CEO Pacific Power
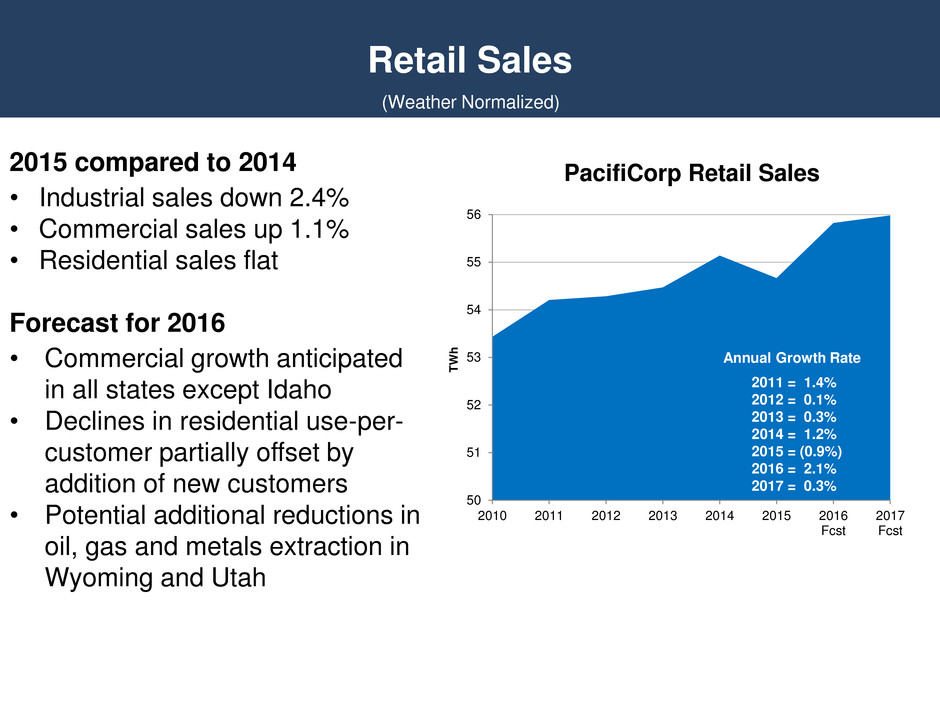
Retail Sales 2015 compared to 2014 • Industrial sales down 2.4% • Commercial sales up 1.1% • Residential sales flat Forecast for 2016 • Commercial growth anticipated in all states except Idaho • Declines in residential use-per- customer partially offset by addition of new customers • Potential additional reductions in oil, gas and metals extraction in Wyoming and Utah 50 51 52 53 54 55 56 2010 2011 2012 2013 2014 2015 2016 Fcst 2017 Fcst T W h PacifiCorp Retail Sales 2011 = 1.4% 2012 = 0.1% 2013 = 0.3% 2014 = 1.2% 2015 = (0.9%) 2016 = 2.1% 2017 = 0.3% Annual Growth Rate (Weather Normalized)

O&M Expense and Net Income • Operations and maintenance expense held flat consistent with flat revenue • Minimizes need for customer rate increases while continuing to improve safety, reliability and customer service $1,114 $1,057 $1,082 - 200 400 600 800 1,000 1,200 2013 2014 2015 PacifiCorp Operations & Maintenance Expense ($m) $682 $698 $695 - 100 200 300 400 500 600 700 800 2013 2014 2015 PacifiCorp Net Income ($m)
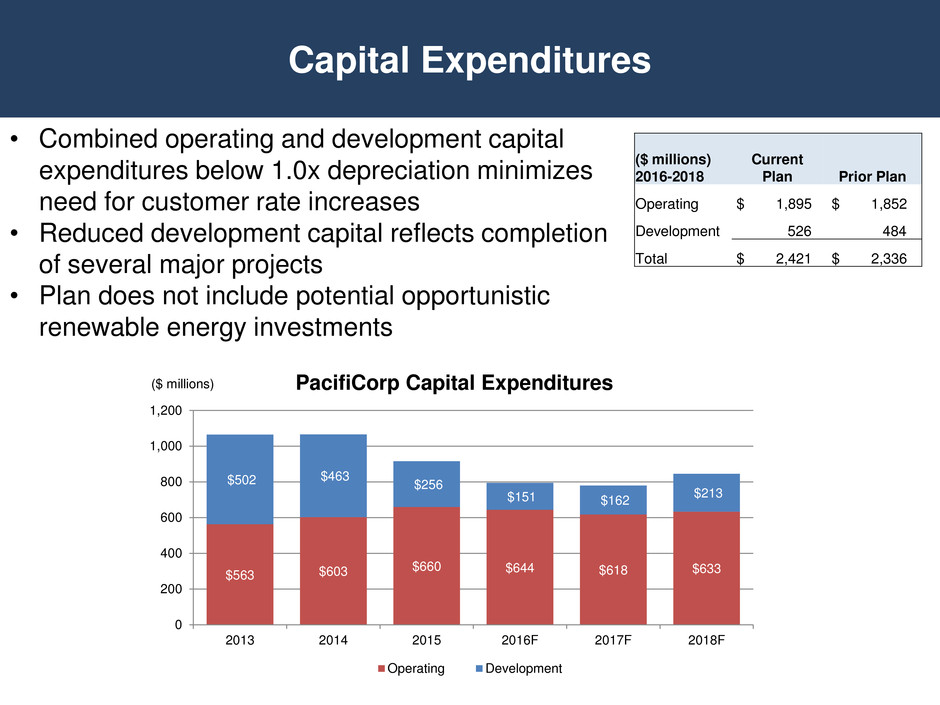
Capital Expenditures • Combined operating and development capital expenditures below 1.0x depreciation minimizes need for customer rate increases • Reduced development capital reflects completion of several major projects • Plan does not include potential opportunistic renewable energy investments ($ millions) 2016-2018 Current Plan Prior Plan Operating $ 1,895 $ 1,852 Development 526 484 Total $ 2,421 $ 2,336 $563 $603 $660 $644 $618 $633 $502 $463 $256 $151 $162 $213 0 200 400 600 800 1,000 1,200 2013 2014 2015 2016F 2017F 2018F PacifiCorp Capital Expenditures Operating Development ($ millions)
• Western U.S. Energy Imbalance Market Expansion • Oregon Clean Electricity and Coal Transition Plan • Utah Sustainable Transportation and Energy Plan Bold, Innovative Leadership
Pacific Power Stefan Bird President and CEO
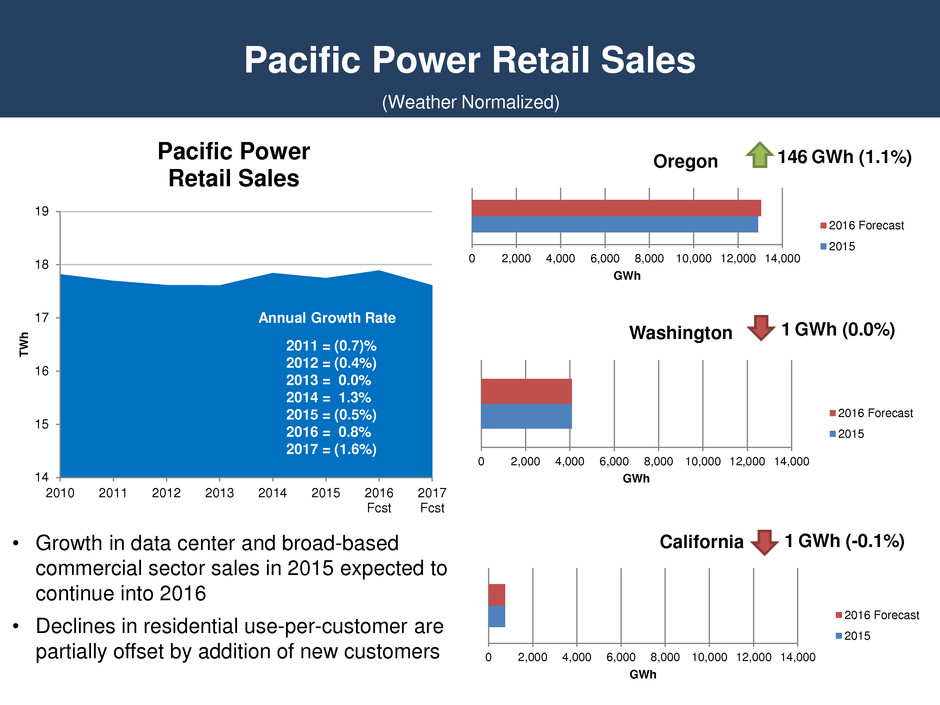
0 2,000 4,000 6,000 8,000 10,000 12,000 14,000 GWh Washington 2016 Forecast 2015 0 2,000 4,000 6,000 8,000 10,000 12,000 14,000 GWh Oregon 2016 Forecast 2015 Pacific Power Retail Sales • Growth in data center and broad-based commercial sector sales in 2015 expected to continue into 2016 • Declines in residential use-per-customer are partially offset by addition of new customers 146 GWh (1.1%) 1 GWh (0.0%) 1 GWh (-0.1%) 14 15 16 17 18 19 2010 2011 2012 2013 2014 2015 2016 Fcst 2017 Fcst T W h Pacific Power Retail Sales 2011 = (0.7)% 2012 = (0.4%) 2013 = 0.0% 2014 = 1.3% 2015 = (0.5%) 2016 = 0.8% 2017 = (1.6%) Annual Growth Rate (Weather Normalized) 0 2,000 4,000 6,000 8,000 10,000 12,000 14,000 GWh California 2016 Forecast 2015
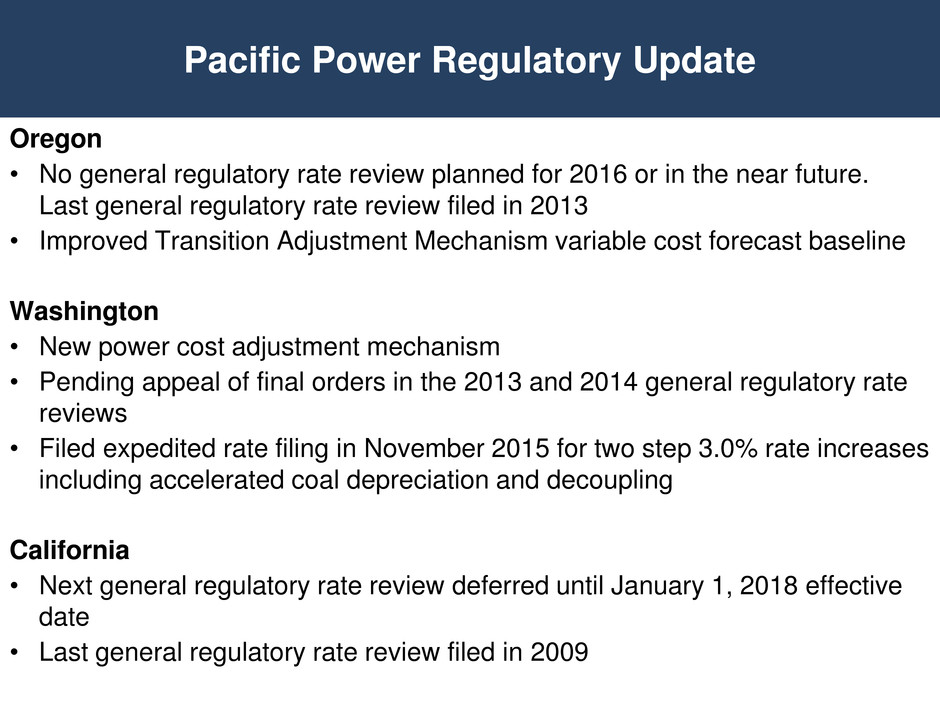
Oregon • No general regulatory rate review planned for 2016 or in the near future. Last general regulatory rate review filed in 2013 • Improved Transition Adjustment Mechanism variable cost forecast baseline Washington • New power cost adjustment mechanism • Pending appeal of final orders in the 2013 and 2014 general regulatory rate reviews • Filed expedited rate filing in November 2015 for two step 3.0% rate increases including accelerated coal depreciation and decoupling California • Next general regulatory rate review deferred until January 1, 2018 effective date • Last general regulatory rate review filed in 2009 Pacific Power Regulatory Update
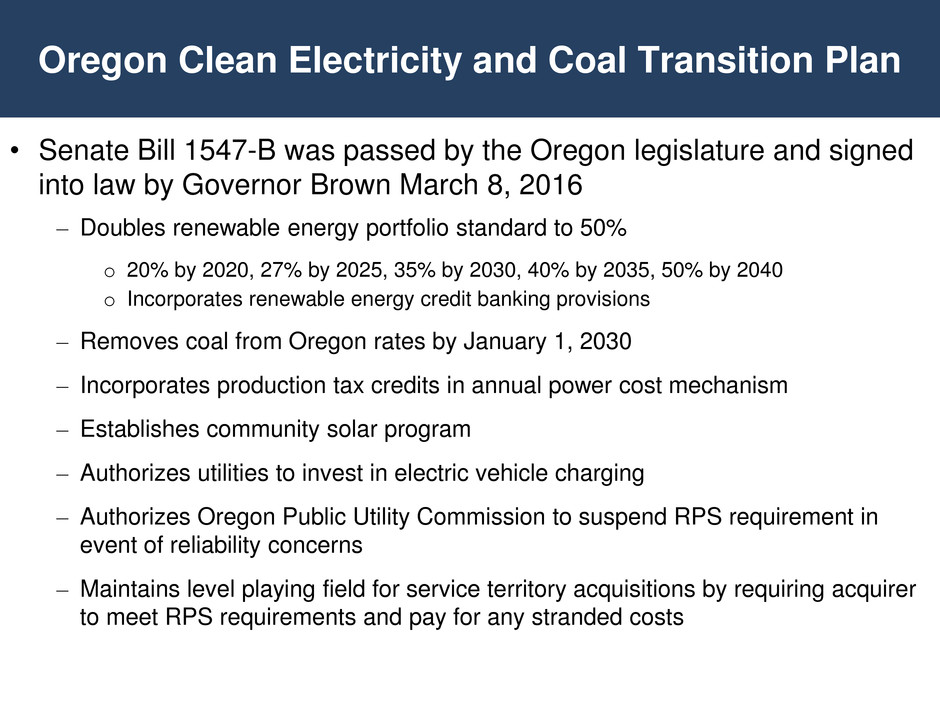
Oregon Clean Electricity and Coal Transition Plan • Senate Bill 1547-B was passed by the Oregon legislature and signed into law by Governor Brown March 8, 2016 – Doubles renewable energy portfolio standard to 50% o 20% by 2020, 27% by 2025, 35% by 2030, 40% by 2035, 50% by 2040 o Incorporates renewable energy credit banking provisions – Removes coal from Oregon rates by January 1, 2030 – Incorporates production tax credits in annual power cost mechanism – Establishes community solar program – Authorizes utilities to invest in electric vehicle charging – Authorizes Oregon Public Utility Commission to suspend RPS requirement in event of reliability concerns – Maintains level playing field for service territory acquisitions by requiring acquirer to meet RPS requirements and pay for any stranded costs

Rocky Mountain Power Cindy Crane President and CEO
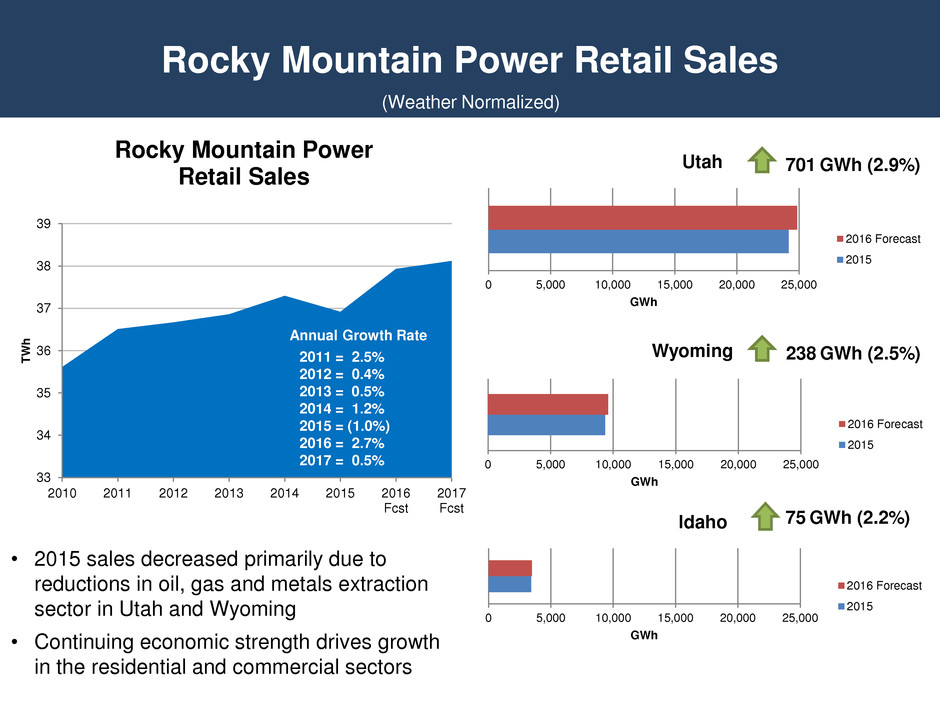
Rocky Mountain Power Retail Sales 701 GWh (2.9%) 238 GWh (2.5%) 75 GWh (2.2%) • 2015 sales decreased primarily due to reductions in oil, gas and metals extraction sector in Utah and Wyoming • Continuing economic strength drives growth in the residential and commercial sectors (Weather Normalized) 33 34 35 36 37 38 39 2010 2011 2012 2013 2014 2015 2016 Fcst 2017 Fcst T W h Rocky Mountain Power Retail Sales 2011 = 2.5% 2012 = 0.4% 2013 = 0.5% 2014 = 1.2% 2015 = (1.0%) 2016 = 2.7% 2017 = 0.5% Annual Growth Rate 0 5,000 10,000 15,000 20,000 25,000 GWh Utah 2016 Forecast 2015 0 5,000 10,000 15,000 20,000 25,000 GWh Wyoming 2016 Forecast 2015 0 5,000 10,000 15,000 20,000 25,000 GWh Idaho 2016 Forecast 2015
Rocky Mountain Power Regulatory Accomplishments Utah • Two-year rate plan in place through September 2016 • Favorable order received in Utah net energy metering docket; relies on cost of service study and limits consideration of cost and benefits to rate case test period • Implemented a subscriber solar program as a customer option Wyoming • General regulatory rate review increase of $16 million (9.5% ROE) effective January 2016 Idaho • Rate plan in place through 2017; 3.9% increase effective January 2016
Utah Sustainable Transportation and Energy Plan • Senate Bill 115 passed the Utah Senate on March 4 and the Utah House on March 10, and awaits the governor’s signature – Provides company 100% recovery of prudent net power costs with full Utah commission oversight o Effective June 1, 2016, two periodic reports by the Utah commission to the legislature, EBA sunset provision December 31, 2019 – Requires Commission to allow utility to establish a fund through a change in accounting for energy efficiency programs (DSM) o Authorization to capitalize DSM costs as a regulatory asset and mandates recovery of the amortization over 10 years. The difference between DSM collection rates and amortization expense funds a reserve for coal plant risk – Establishes and funds a five-year pilot program o Mandatory investments in electric vehicle infrastructure and cleaner coal research ($2.0 million and $1.0 million annual funding respectively) o Discretionary investments in utility programs ($3.4 million annual funding) – Authorizes a renewable energy tariff to retain existing customers and attract new businesses to Utah
Clean Power Plan • The U.S. Supreme Court issued a stay February 9, 2016, of the implementation of the Clean Power Plan pending the outcome of the litigation pending in the D.C. Circuit Court of Appeals and through any action taken on appeal to the U.S. Supreme Court • Prior to the stay, states were required to submit state plans implementing the Clean Power Plan by September 6, 2016, with an option to request an extension to September 2018; under the stay, those deadlines are now uncertain • PacifiCorp will continue to participate in stakeholder efforts in any of its states that continue along that path during the stay
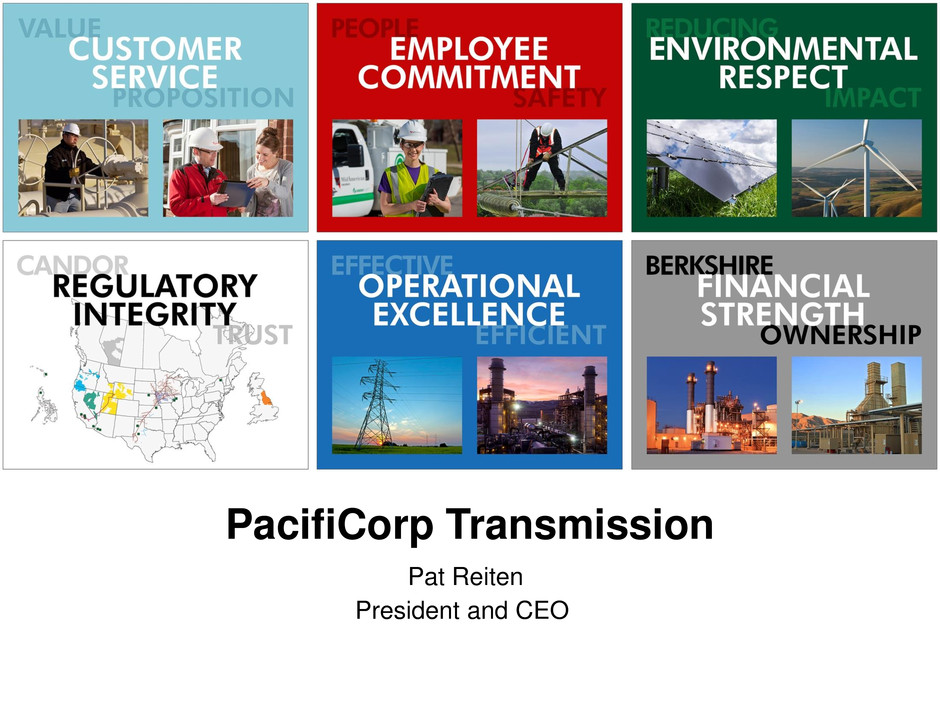
PacifiCorp Transmission Pat Reiten President and CEO
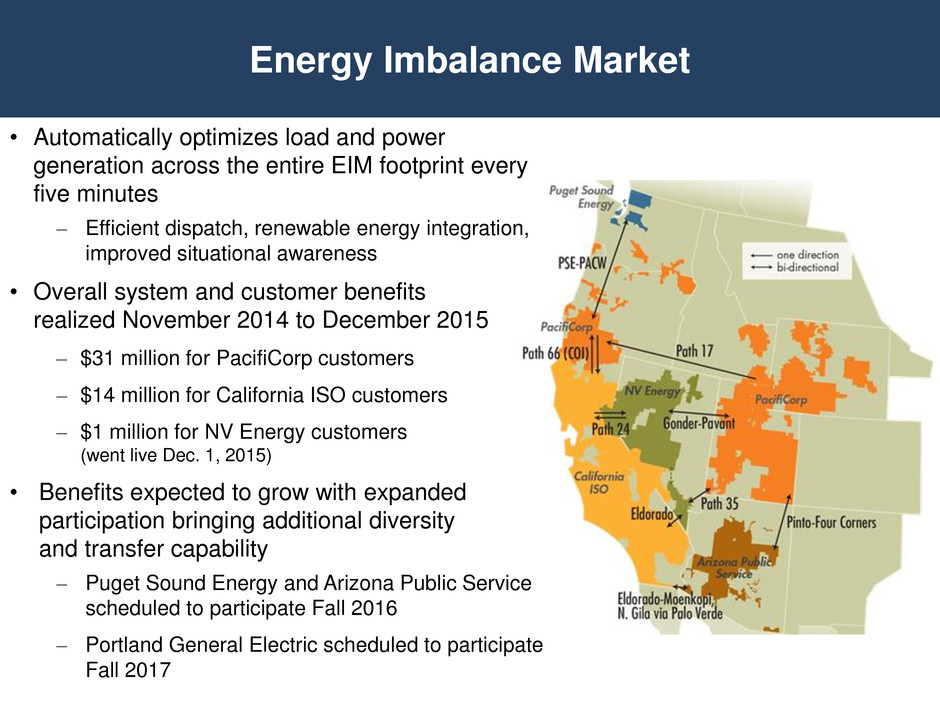
Energy Imbalance Market • Automatically optimizes load and power generation across the entire EIM footprint every five minutes – Efficient dispatch, renewable energy integration, improved situational awareness • Overall system and customer benefits realized November 2014 to December 2015 – $31 million for PacifiCorp customers – $14 million for California ISO customers – $1 million for NV Energy customers (went live Dec. 1, 2015) • Benefits expected to grow with expanded participation bringing additional diversity and transfer capability – Puget Sound Energy and Arizona Public Service scheduled to participate Fall 2016 – Portland General Electric scheduled to participate Fall 2017
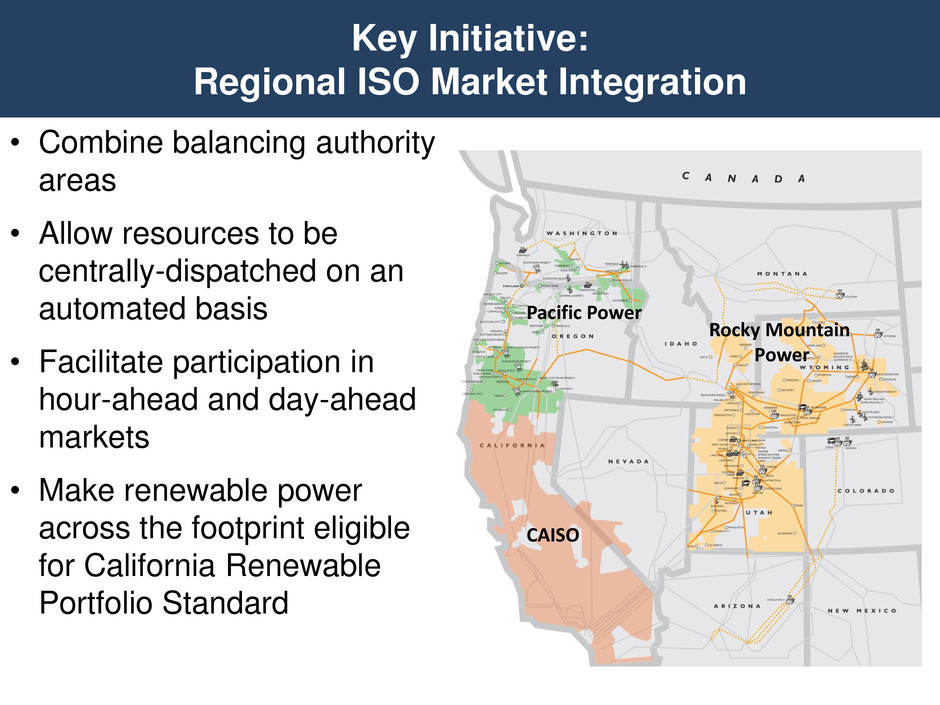
Key Initiative: Regional ISO Market Integration • Combine balancing authority areas • Allow resources to be centrally-dispatched on an automated basis • Facilitate participation in hour-ahead and day-ahead markets • Make renewable power across the footprint eligible for California Renewable Portfolio Standard Pacific Power Rocky Mountain Power CAISO
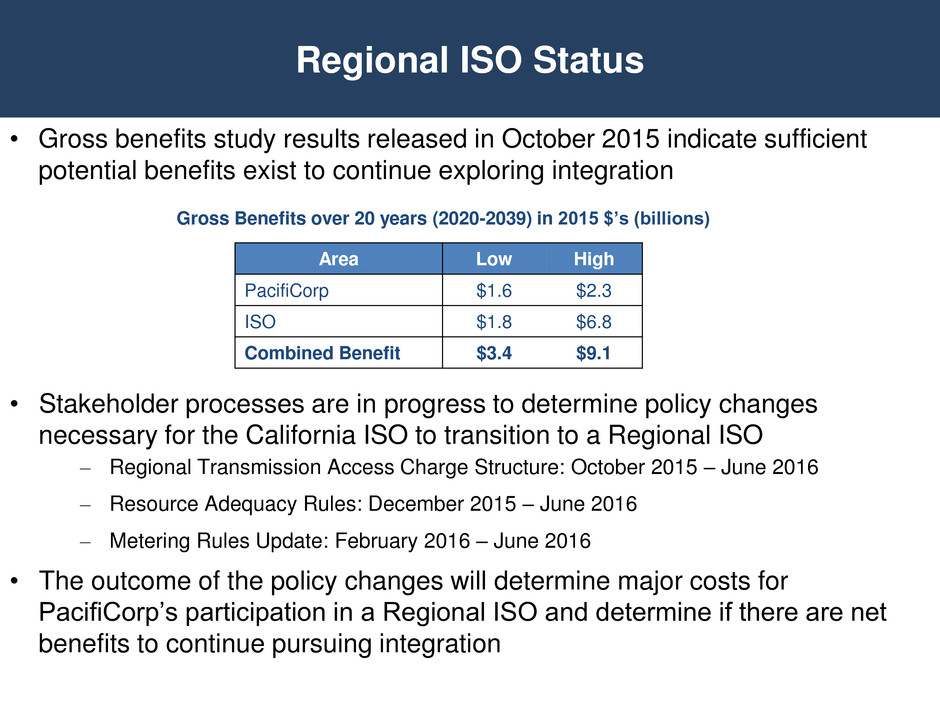
Regional ISO Status • Gross benefits study results released in October 2015 indicate sufficient potential benefits exist to continue exploring integration Gross Benefits over 20 years (2020-2039) in 2015 $’s (billions) • Stakeholder processes are in progress to determine policy changes necessary for the California ISO to transition to a Regional ISO – Regional Transmission Access Charge Structure: October 2015 – June 2016 – Resource Adequacy Rules: December 2015 – June 2016 – Metering Rules Update: February 2016 – June 2016 • The outcome of the policy changes will determine major costs for PacifiCorp’s participation in a Regional ISO and determine if there are net benefits to continue pursuing integration Area Low High PacifiCorp $1.6 $2.3 ISO $1.8 $6.8 Combined Benefit $3.4 $9.1
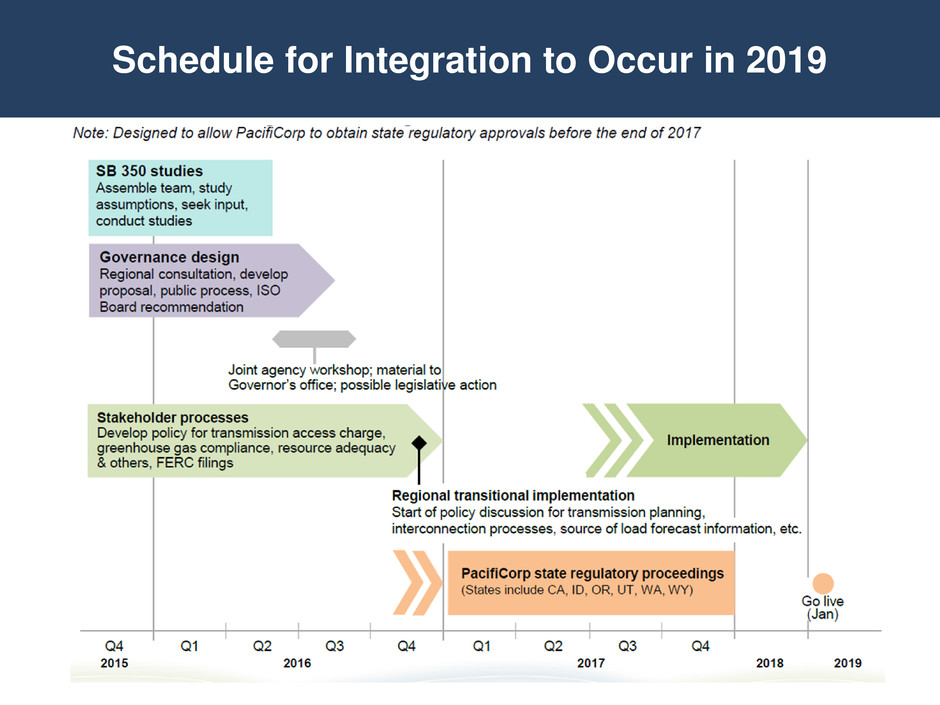
Schedule for Integration to Occur in 2019
PacifiCorp Appendix
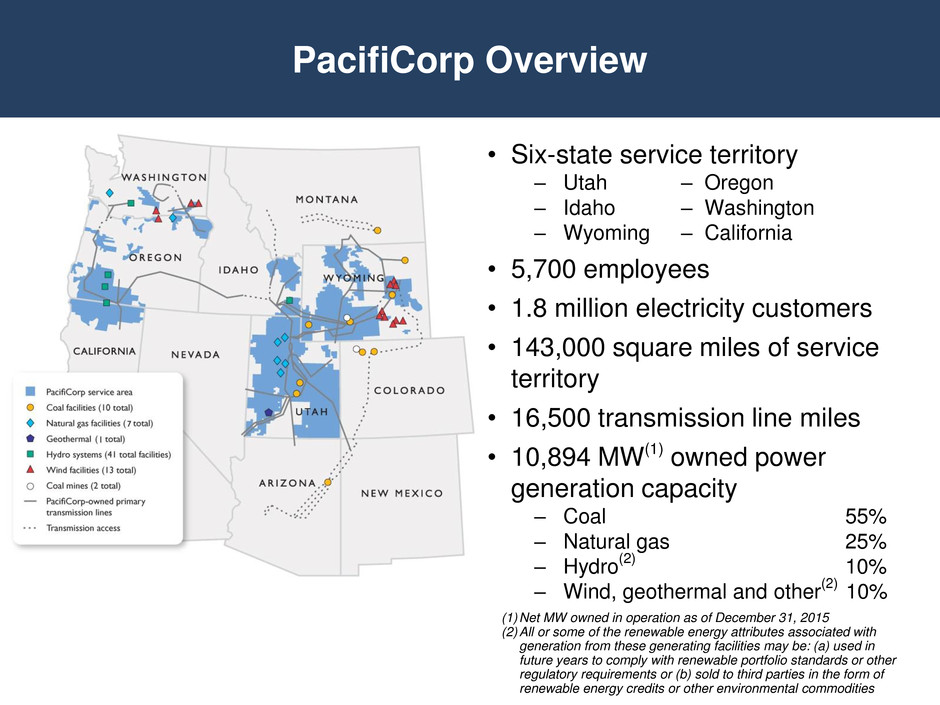
PacifiCorp Overview • Six-state service territory ‒ Utah – Oregon ‒ Idaho – Washington ‒ Wyoming – California • 5,700 employees • 1.8 million electricity customers • 143,000 square miles of service territory • 16,500 transmission line miles • 10,894 MW(1) owned power generation capacity ‒ Coal 55% ‒ Natural gas 25% ‒ Hydro (2) 10% ‒ Wind, geothermal and other (2) 10% (1) Net MW owned in operation as of December 31, 2015 (2)All or some of the renewable energy attributes associated with generation from these generating facilities may be: (a) used in future years to comply with renewable portfolio standards or other regulatory requirements or (b) sold to third parties in the form of renewable energy credits or other environmental commodities
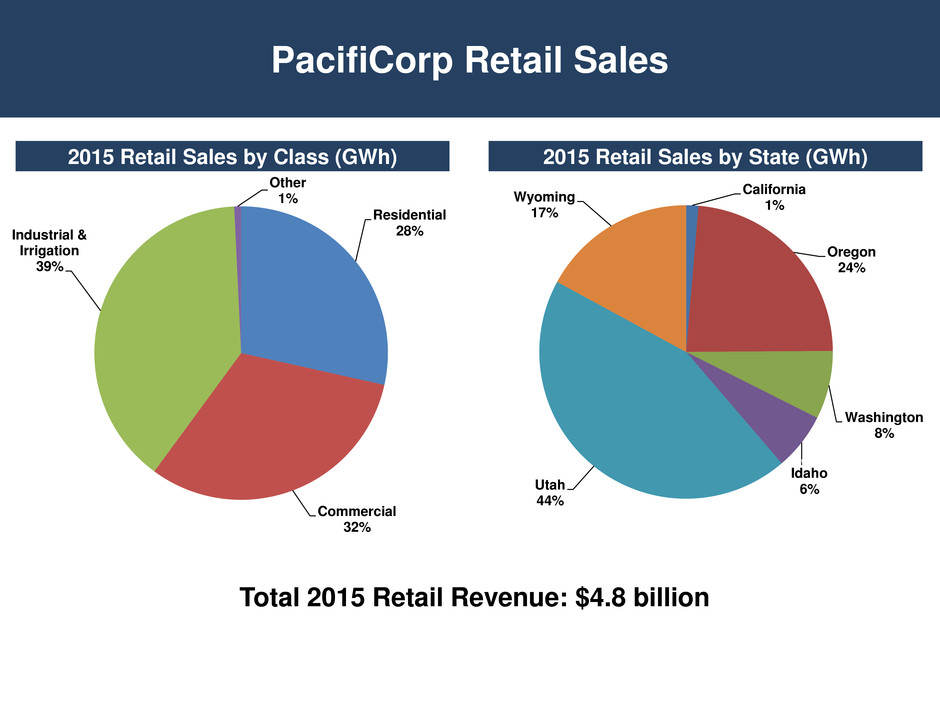
PacifiCorp Retail Sales 2015 Retail Sales by Class (GWh) 2015 Retail Sales by State (GWh) Total 2015 Retail Revenue: $4.8 billion Residential 28% Commercial 32% Industrial & Irrigation 39% Other 1% California 1% Oregon 24% Washington 8% Idaho 6% Utah 44% Wyoming 17%
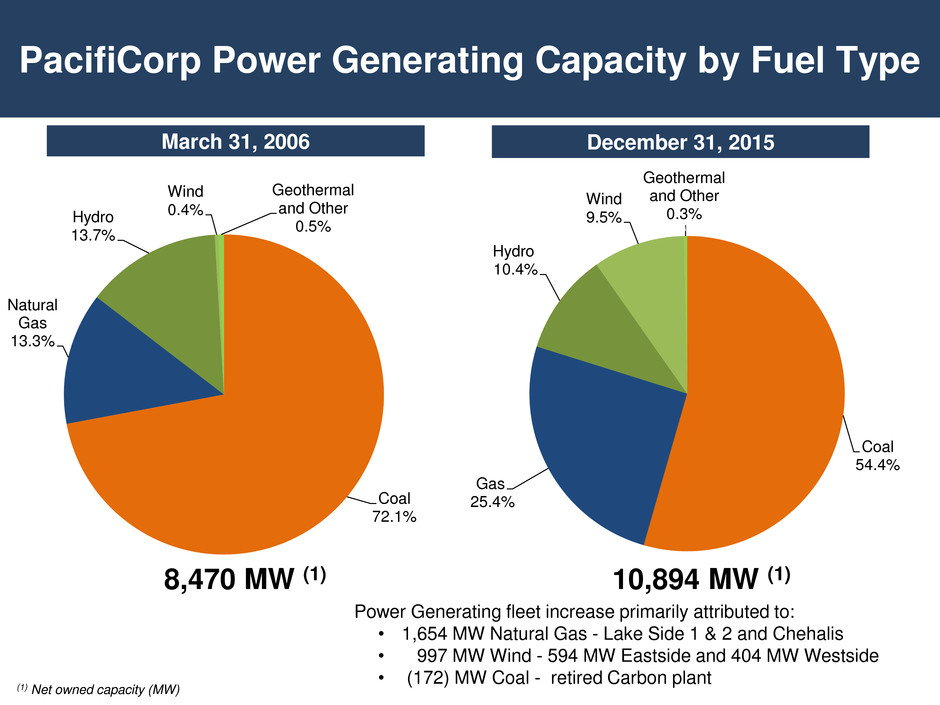
PacifiCorp Power Generating Capacity by Fuel Type March 31, 2006 December 31, 2015 8,470 MW (1) 10,894 MW (1) (1) Net owned capacity (MW) Power Generating fleet increase primarily attributed to: • 1,654 MW Natural Gas - Lake Side 1 & 2 and Chehalis • 997 MW Wind - 594 MW Eastside and 404 MW Westside • (172) MW Coal - retired Carbon plant Coal 72.1% Natural Gas 13.3% Hydro 13.7% Wind 0.4% Geothermal and Other 0.5% Coal 54.4% Gas 25.4% Hydro 10.4% Wind 9.5% Geothermal and Other 0.3%
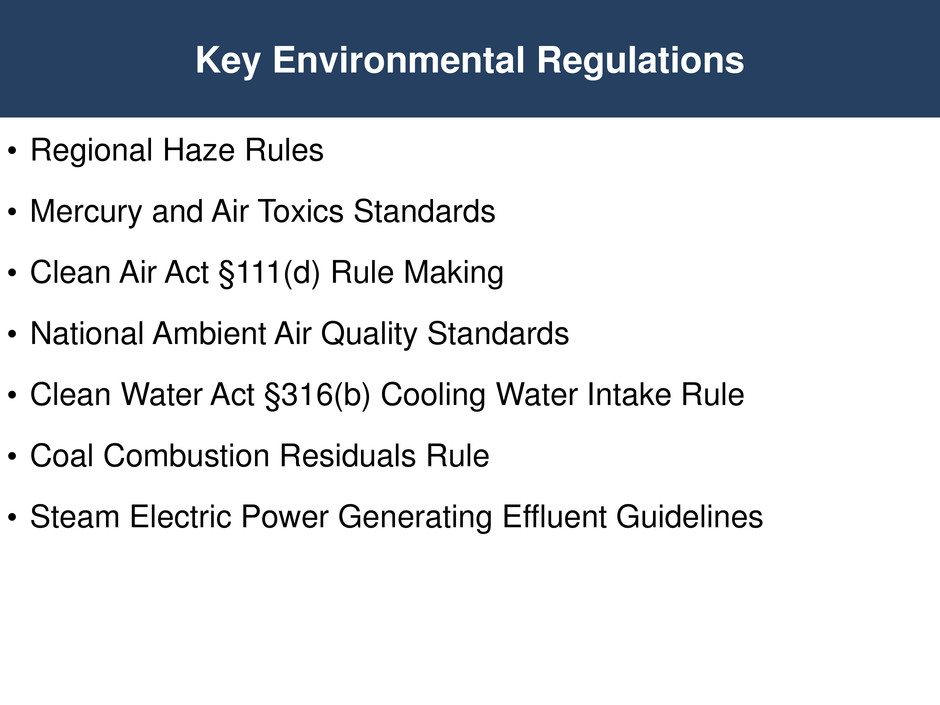
• Regional Haze Rules • Mercury and Air Toxics Standards • Clean Air Act §111(d) Rule Making • National Ambient Air Quality Standards • Clean Water Act §316(b) Cooling Water Intake Rule • Coal Combustion Residuals Rule • Steam Electric Power Generating Effluent Guidelines Key Environmental Regulations
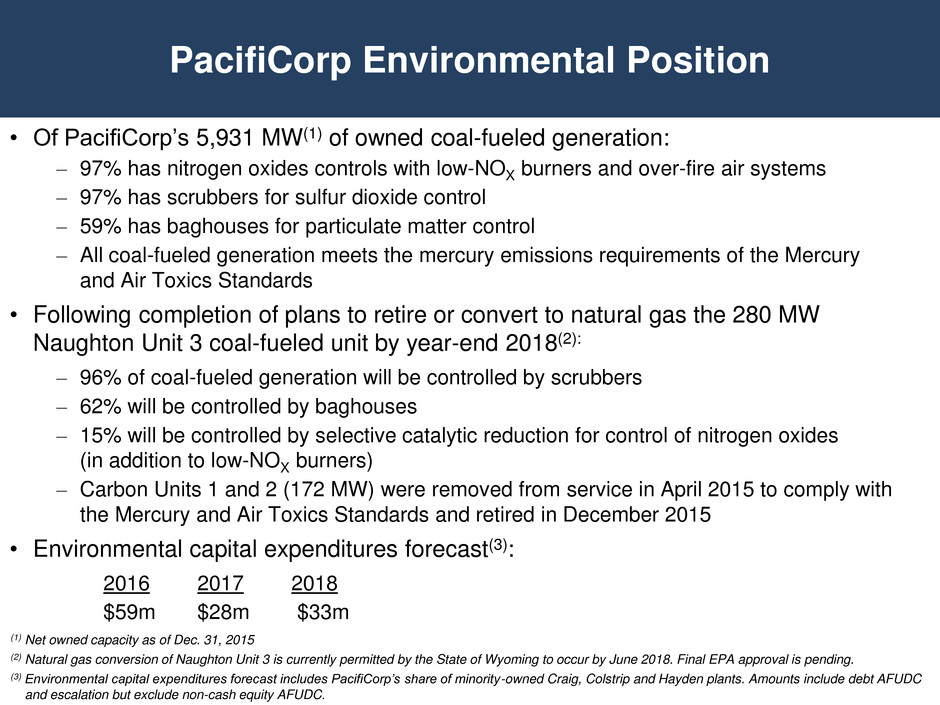
PacifiCorp Environmental Position • Of PacifiCorp’s 5,931 MW(1) of owned coal-fueled generation: – 97% has nitrogen oxides controls with low-NOX burners and over-fire air systems – 97% has scrubbers for sulfur dioxide control – 59% has baghouses for particulate matter control – All coal-fueled generation meets the mercury emissions requirements of the Mercury and Air Toxics Standards • Following completion of plans to retire or convert to natural gas the 280 MW Naughton Unit 3 coal-fueled unit by year-end 2018(2): – 96% of coal-fueled generation will be controlled by scrubbers – 62% will be controlled by baghouses – 15% will be controlled by selective catalytic reduction for control of nitrogen oxides (in addition to low-NOX burners) – Carbon Units 1 and 2 (172 MW) were removed from service in April 2015 to comply with the Mercury and Air Toxics Standards and retired in December 2015 • Environmental capital expenditures forecast(3): 2016 2017 2018 $59m $28m $33m (1) Net owned capacity as of Dec. 31, 2015 (2) Natural gas conversion of Naughton Unit 3 is currently permitted by the State of Wyoming to occur by June 2018. Final EPA approval is pending. (3) Environmental capital expenditures forecast includes PacifiCorp’s share of minority-owned Craig, Colstrip and Hayden plants. Amounts include debt AFUDC and escalation but exclude non-cash equity AFUDC.
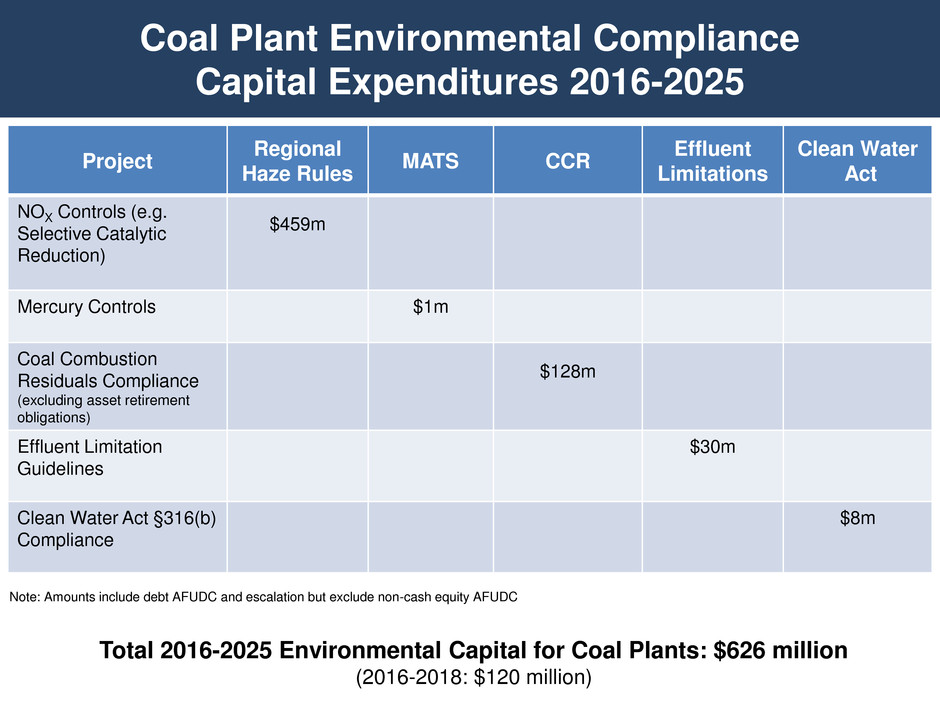
Project Regional Haze Rules MATS CCR Effluent Limitations Clean Water Act NOX Controls (e.g. Selective Catalytic Reduction) $459m Mercury Controls $1m Coal Combustion Residuals Compliance (excluding asset retirement obligations) $128m Effluent Limitation Guidelines $30m Clean Water Act §316(b) Compliance $8m Coal Plant Environmental Compliance Capital Expenditures 2016-2025 Total 2016-2025 Environmental Capital for Coal Plants: $626 million (2016-2018: $120 million) Note: Amounts include debt AFUDC and escalation but exclude non-cash equity AFUDC
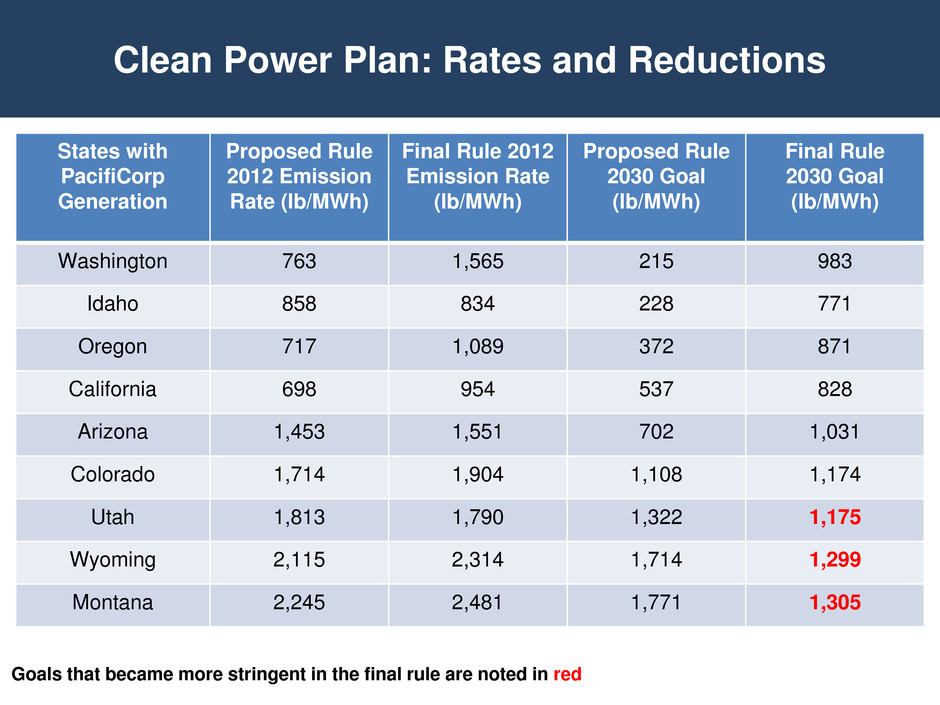
Clean Power Plan: Rates and Reductions Goals that became more stringent in the final rule are noted in red States with PacifiCorp Generation Proposed Rule 2012 Emission Rate (lb/MWh) Final Rule 2012 Emission Rate (lb/MWh) Proposed Rule 2030 Goal (lb/MWh) Final Rule 2030 Goal (lb/MWh) Washington 763 1,565 215 983 Idaho 858 834 228 771 Oregon 717 1,089 372 871 California 698 954 537 828 Arizona 1,453 1,551 702 1,031 Colorado 1,714 1,904 1,108 1,174 Utah 1,813 1,790 1,322 1,175 Wyoming 2,115 2,314 1,714 1,299 Montana 2,245 2,481 1,771 1,305
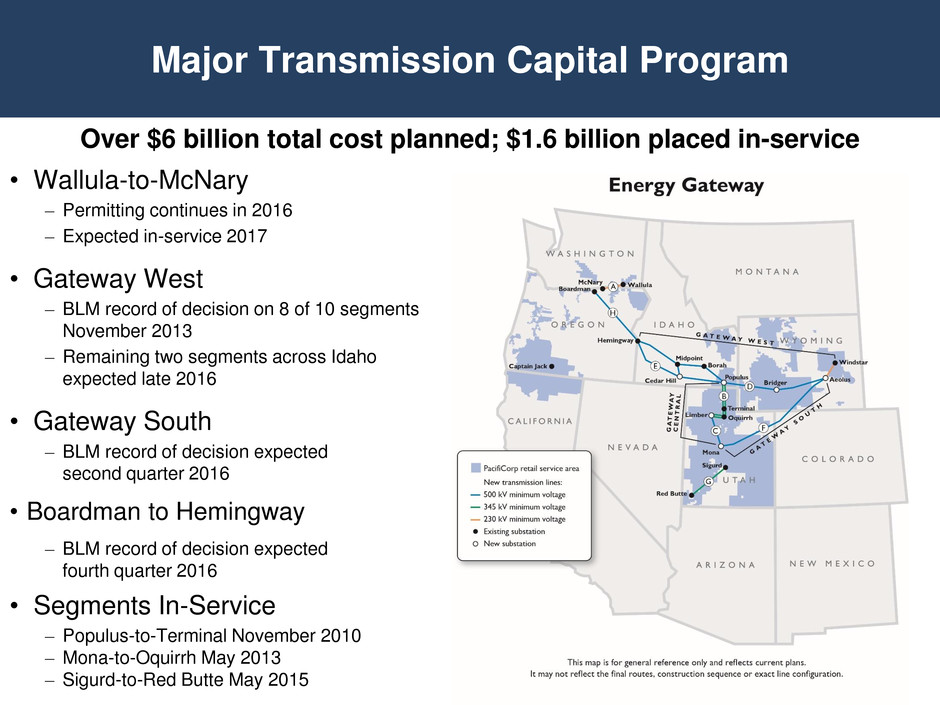
Major Transmission Capital Program • Wallula-to-McNary – Permitting continues in 2016 – Expected in-service 2017 • Gateway West – BLM record of decision on 8 of 10 segments November 2013 – Remaining two segments across Idaho expected late 2016 • Gateway South – BLM record of decision expected second quarter 2016 • Boardman to Hemingway – BLM record of decision expected fourth quarter 2016 • Segments In-Service – Populus-to-Terminal November 2010 – Mona-to-Oquirrh May 2013 – Sigurd-to-Red Butte May 2015 Over $6 billion total cost planned; $1.6 billion placed in-service

2016 Fixed-Income Investor Conference Mark Hewett President and CEO BHE Pipeline Group
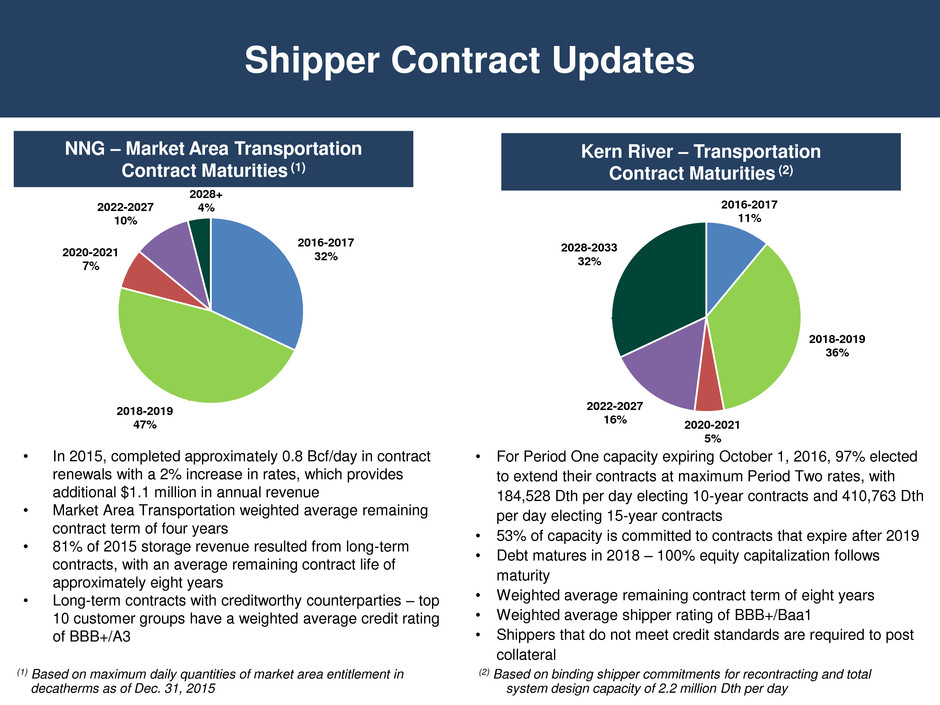
Shipper Contract Updates 2016-2017 32% 2018-2019 47% 2020-2021 7% 2022-2027 10% 2028+ 4% NNG – Market Area Transportation Contract Maturities (1) (2) Based on binding shipper commitments for recontracting and total system design capacity of 2.2 million Dth per day Kern River – Transportation Contract Maturities (2) (1) Based on maximum daily quantities of market area entitlement in decatherms as of Dec. 31, 2015 • In 2015, completed approximately 0.8 Bcf/day in contract renewals with a 2% increase in rates, which provides additional $1.1 million in annual revenue • Market Area Transportation weighted average remaining contract term of four years • 81% of 2015 storage revenue resulted from long-term contracts, with an average remaining contract life of approximately eight years • Long-term contracts with creditworthy counterparties – top 10 customer groups have a weighted average credit rating of BBB+/A3 • For Period One capacity expiring October 1, 2016, 97% elected to extend their contracts at maximum Period Two rates, with 184,528 Dth per day electing 10-year contracts and 410,763 Dth per day electing 15-year contracts • 53% of capacity is committed to contracts that expire after 2019 • Debt matures in 2018 – 100% equity capitalization follows maturity • Weighted average remaining contract term of eight years • Weighted average shipper rating of BBB+/Baa1 • Shippers that do not meet credit standards are required to post collateral 2016-2017 11% 2018-2019 36% 2020-2021 5% 2022-2027 16% 2028-2033 32%
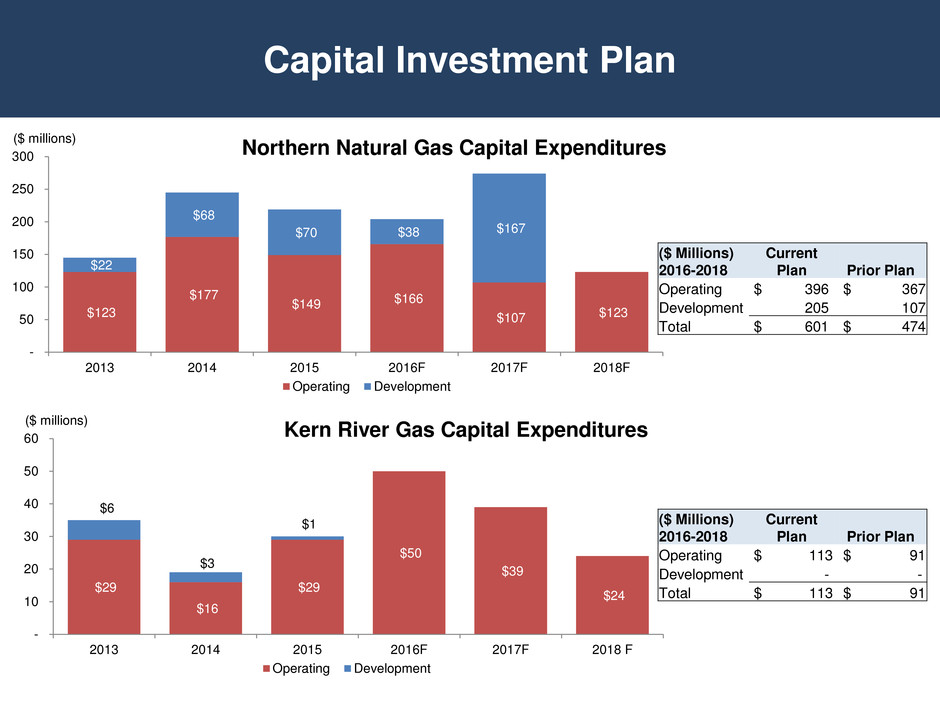
$123 $177 $149 $166 $107 $123 $22 $68 $70 $38 $167 - 50 100 150 200 250 300 2013 2014 2015 2016F 2017F 2018F Northern Natural Gas Capital Expenditures Operating Development ($ millions) Capital Investment Plan $29 $16 $29 $50 $39 $24 $6 $3 $1 - 10 20 30 40 50 60 2013 2014 2015 2016F 2017F 2018 F Kern River Gas Capital Expenditures Operating Development ($ millions) ($ Millions) 2016-2018 Current Plan Prior Plan Operating $ 396 $ 367 Development 205 107 Total $ 601 $ 474 ($ Millions) 2016-2018 Current Plan Prior Plan Operating $ 113 $ 91 Development - - Total $ 113 $ 91
• Focus on customer satisfaction – In March 2016, Mastio & Company announced the results of their annual survey; Kern River ranked No. 1 and Northern Natural Gas ranked No. 2 out of 42 interstate pipelines, Northern Natural Gas also ranked No. 1 among mega-pipelines in customer satisfaction. Pipeline Group has been ranked No. 1 for last 11 years • Location – Northern Natural Gas - Reticulated system – economically unfeasible to replicate – Northern Natural Gas - Optionality with Field Area – tremendous advantage for customers and pipeline to capture opportunities – Kern River - Directly connected to end-use markets in Nevada and California • Competitive pricing – Both pipelines have demonstrated over 10 years of rate stability with no Section 4 regulatory rate review since 2004 by actively managing and growing our business and solving business issues – Northern Natural Gas - Prices are competitive with other pipelines which minimizes level of discounting needed in competitive markets – Kern River - Period Two rates are the lowest delivered cost interstate pipeline options to southern California • Operational excellence – Northern Natural Gas - Long history of commitment to operational excellence and system reliability – Kern River - State of the art transmission system • Long term contracts with stable markets for both pipelines Competitive Advantages

Northern Natural Gas Financial Stability • Northern Natural Gas averaged a debt-equity ratio of 42%/58% from 2002-2015 • Interest coverage ratio has increased from 3.1x to 10.4x over same time period – Average interest coverage ratio for largest 12 MLPs in the Alerian MLP Index is 4.8x 0.0x 2.0x 4.0x 6.0x 8.0x 10.0x 12.0x $0 $100 $200 $300 $400 2002 2003 2004 2005 2006 2007 2008 2009 2010 2011 2012 2013 2014 2015 F F O / In te re s t Cash F lo w fr o m O p e rati o n s Cash Flow from Operations Interest Coverage ($ Millions)
BHE Pipeline Group Appendix
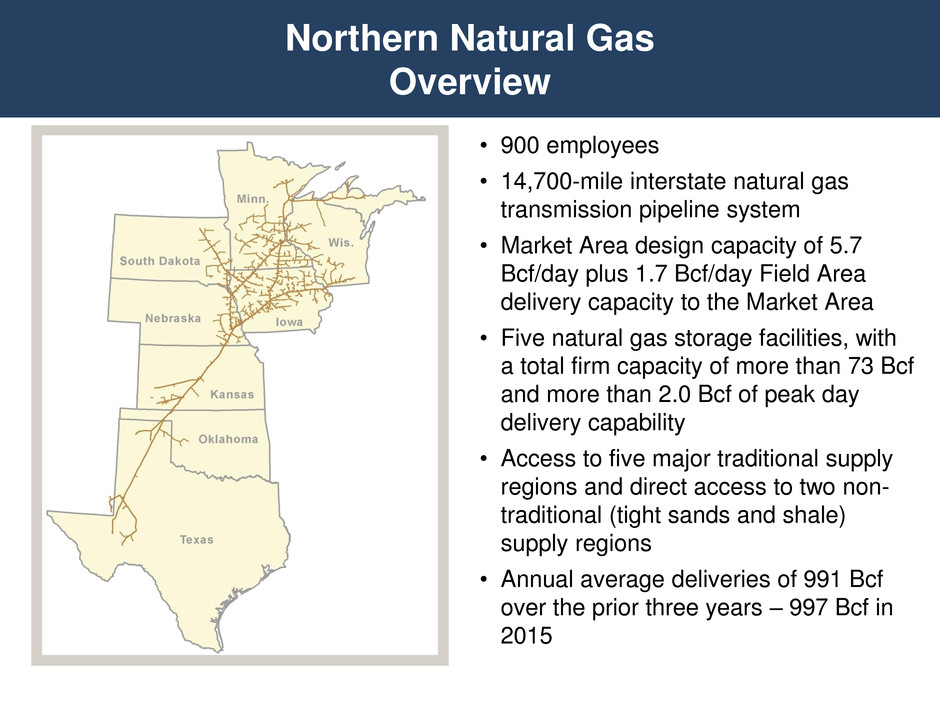
• 900 employees • 14,700-mile interstate natural gas transmission pipeline system • Market Area design capacity of 5.7 Bcf/day plus 1.7 Bcf/day Field Area delivery capacity to the Market Area • Five natural gas storage facilities, with a total firm capacity of more than 73 Bcf and more than 2.0 Bcf of peak day delivery capability • Access to five major traditional supply regions and direct access to two non- traditional (tight sands and shale) supply regions • Annual average deliveries of 991 Bcf over the prior three years – 997 Bcf in 2015 Northern Natural Gas Overview
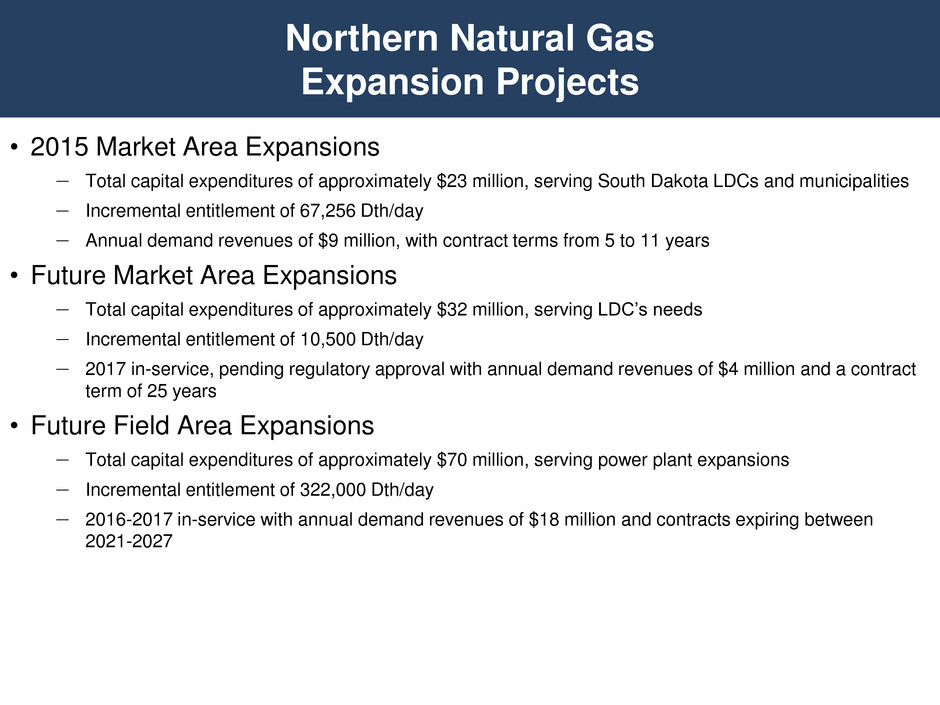
• 2015 Market Area Expansions – Total capital expenditures of approximately $23 million, serving South Dakota LDCs and municipalities – Incremental entitlement of 67,256 Dth/day – Annual demand revenues of $9 million, with contract terms from 5 to 11 years • Future Market Area Expansions – Total capital expenditures of approximately $32 million, serving LDC’s needs – Incremental entitlement of 10,500 Dth/day – 2017 in-service, pending regulatory approval with annual demand revenues of $4 million and a contract term of 25 years • Future Field Area Expansions – Total capital expenditures of approximately $70 million, serving power plant expansions – Incremental entitlement of 322,000 Dth/day – 2016-2017 in-service with annual demand revenues of $18 million and contracts expiring between 2021-2027 Northern Natural Gas Expansion Projects
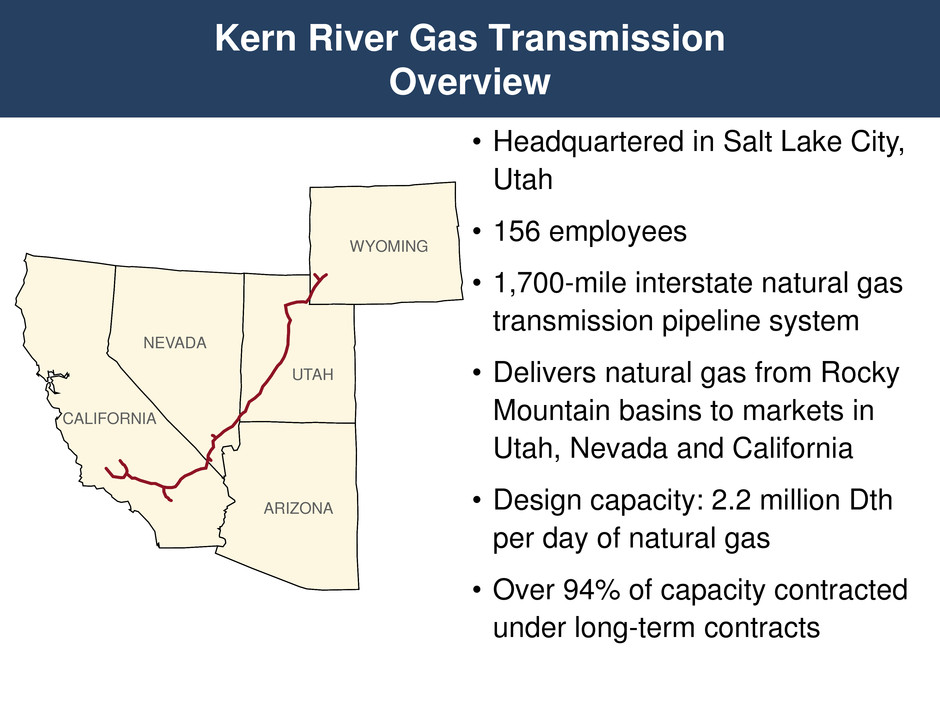
Kern River Gas Transmission Overview • Headquartered in Salt Lake City, Utah • 156 employees • 1,700-mile interstate natural gas transmission pipeline system • Delivers natural gas from Rocky Mountain basins to markets in Utah, Nevada and California • Design capacity: 2.2 million Dth per day of natural gas • Over 94% of capacity contracted under long-term contracts CALIFORNIA UTAH WYOMING ARIZONA NEVADA
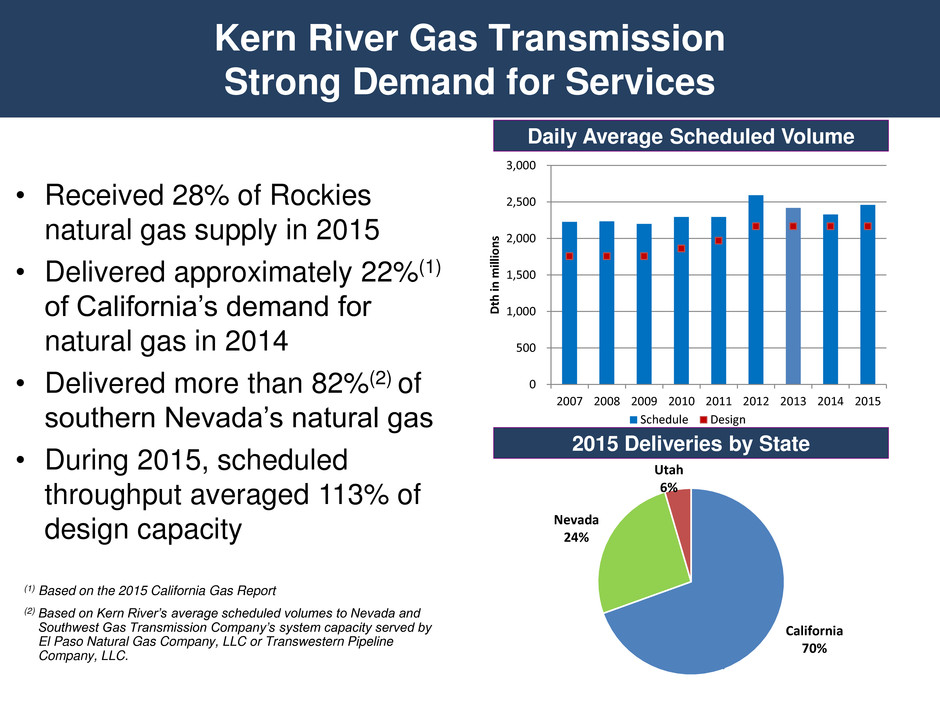
Kern River Gas Transmission Strong Demand for Services Daily Average Scheduled Volume 2015 Deliveries by State (1) Based on the 2015 California Gas Report (2) Based on Kern River’s average scheduled volumes to Nevada and Southwest Gas Transmission Company’s system capacity served by El Paso Natural Gas Company, LLC or Transwestern Pipeline Company, LLC. • Received 28% of Rockies natural gas supply in 2015 • Delivered approximately 22%(1) of California’s demand for natural gas in 2014 • Delivered more than 82%(2) of southern Nevada’s natural gas • During 2015, scheduled throughput averaged 113% of design capacity California 70% Nevada 24% Utah 6% 0 500 1,000 1,500 2,000 2,500 3,000 2007 2008 2009 2010 2011 2012 2013 2014 2015 D th in m ill io n s Schedule Design
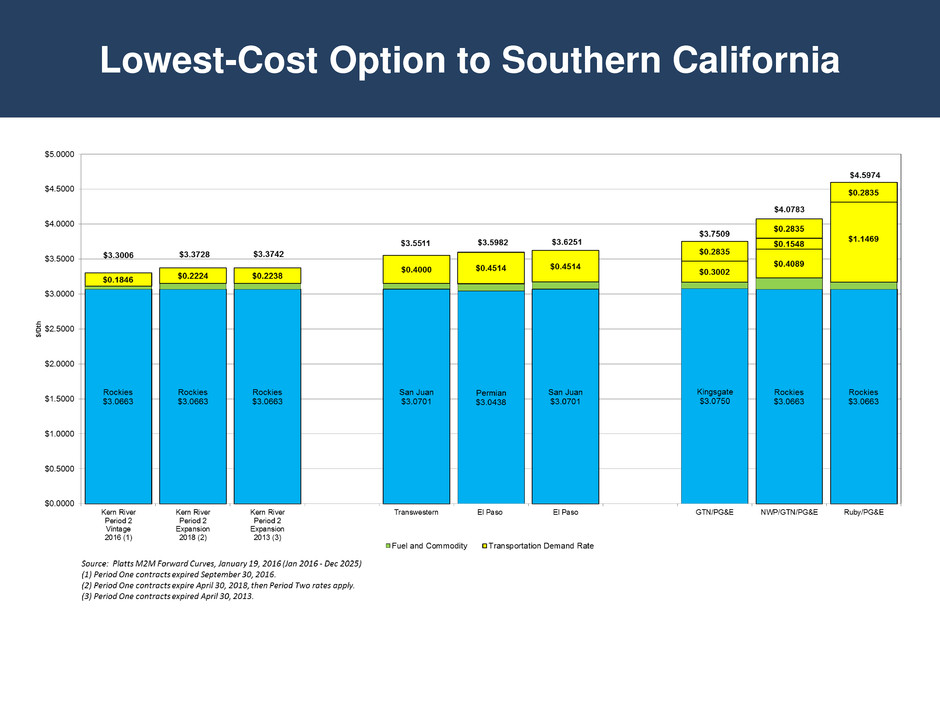
Lowest-Cost Option to Southern California

Scott Thon President and CEO AltaLink 2016 Fixed-Income Investor Conference
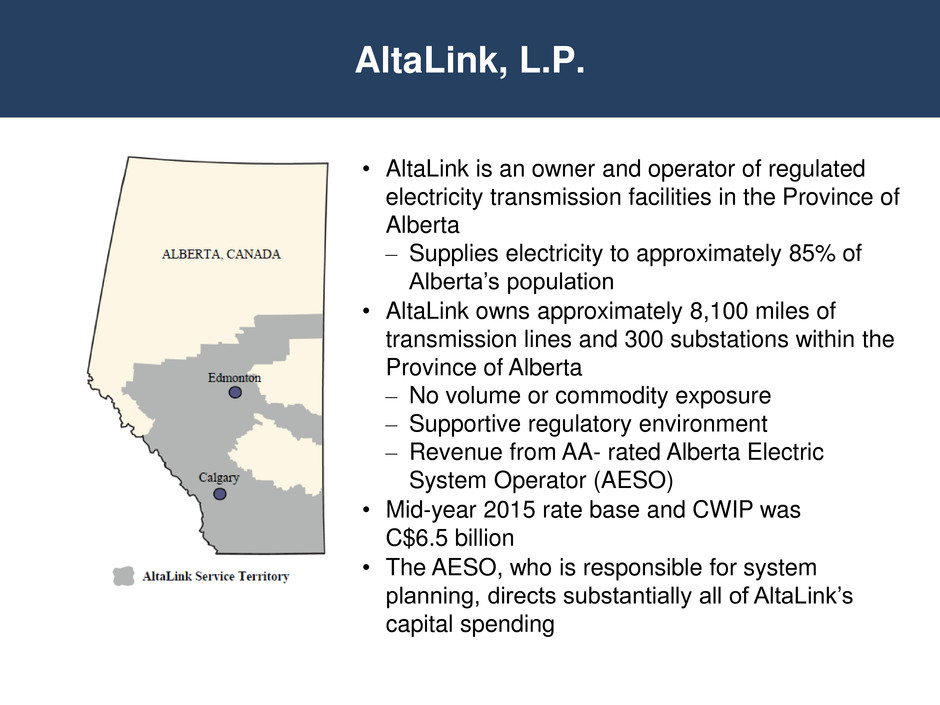
AltaLink, L.P. • AltaLink is an owner and operator of regulated electricity transmission facilities in the Province of Alberta – Supplies electricity to approximately 85% of Alberta’s population • AltaLink owns approximately 8,100 miles of transmission lines and 300 substations within the Province of Alberta – No volume or commodity exposure – Supportive regulatory environment – Revenue from AA- rated Alberta Electric System Operator (AESO) • Mid-year 2015 rate base and CWIP was C$6.5 billion • The AESO, who is responsible for system planning, directs substantially all of AltaLink’s capital spending
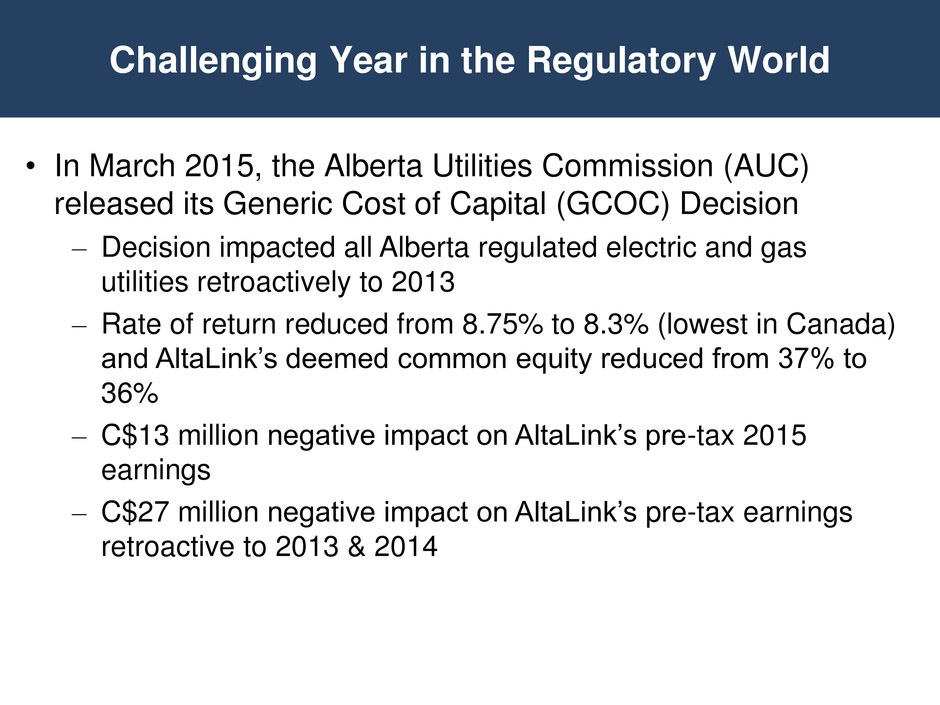
Challenging Year in the Regulatory World • In March 2015, the Alberta Utilities Commission (AUC) released its Generic Cost of Capital (GCOC) Decision – Decision impacted all Alberta regulated electric and gas utilities retroactively to 2013 – Rate of return reduced from 8.75% to 8.3% (lowest in Canada) and AltaLink’s deemed common equity reduced from 37% to 36% – C$13 million negative impact on AltaLink’s pre-tax 2015 earnings – C$27 million negative impact on AltaLink’s pre-tax earnings retroactive to 2013 & 2014
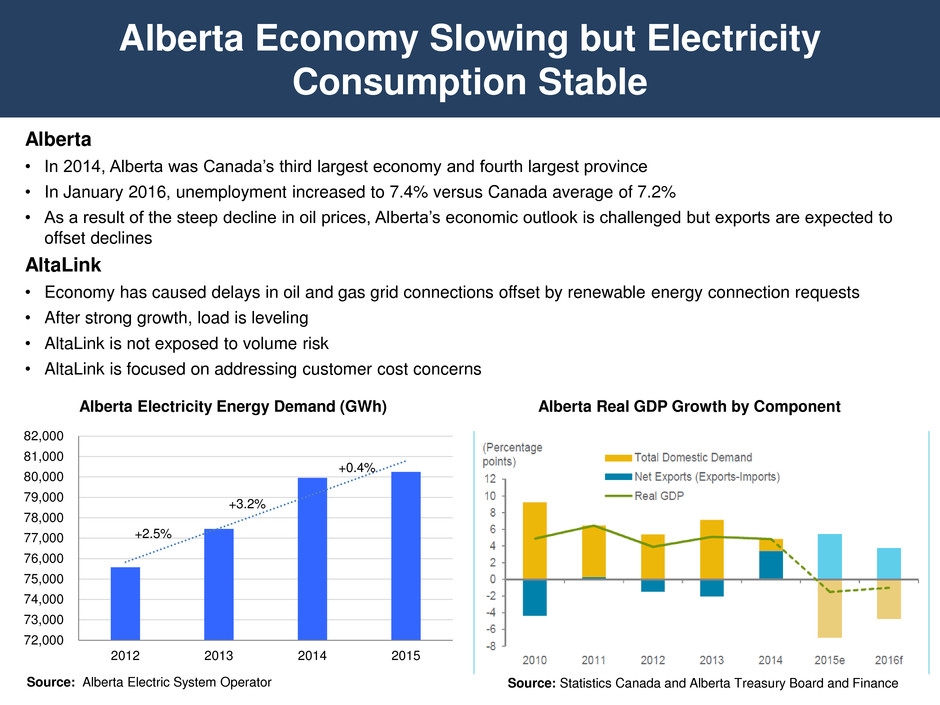
Alberta Economy Slowing but Electricity Consumption Stable Alberta Real GDP Growth by Component Alberta • In 2014, Alberta was Canada’s third largest economy and fourth largest province • In January 2016, unemployment increased to 7.4% versus Canada average of 7.2% • As a result of the steep decline in oil prices, Alberta’s economic outlook is challenged but exports are expected to offset declines AltaLink • Economy has caused delays in oil and gas grid connections offset by renewable energy connection requests • After strong growth, load is leveling • AltaLink is not exposed to volume risk • AltaLink is focused on addressing customer cost concerns Source: Alberta Electric System Operator G D P Source: Statistics Canada and Alberta Treasury Board and Finance 72,000 73,000 74,000 75,000 76,000 77,000 78,000 79,000 80,000 81,000 82,000 2012 2013 2014 2015 Alberta Electricity Energy Demand (GWh) +2.5% +3.2% +0.4%
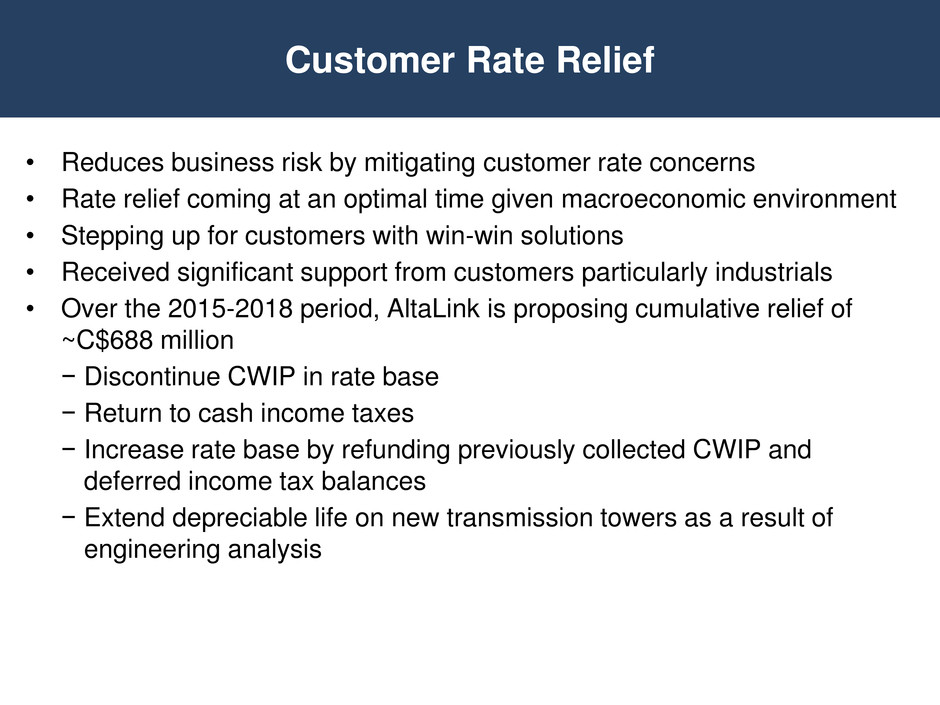
• Reduces business risk by mitigating customer rate concerns • Rate relief coming at an optimal time given macroeconomic environment • Stepping up for customers with win-win solutions • Received significant support from customers particularly industrials • Over the 2015-2018 period, AltaLink is proposing cumulative relief of ~C$688 million − Discontinue CWIP in rate base − Return to cash income taxes − Increase rate base by refunding previously collected CWIP and deferred income tax balances − Extend depreciable life on new transmission towers as a result of engineering analysis Customer Rate Relief
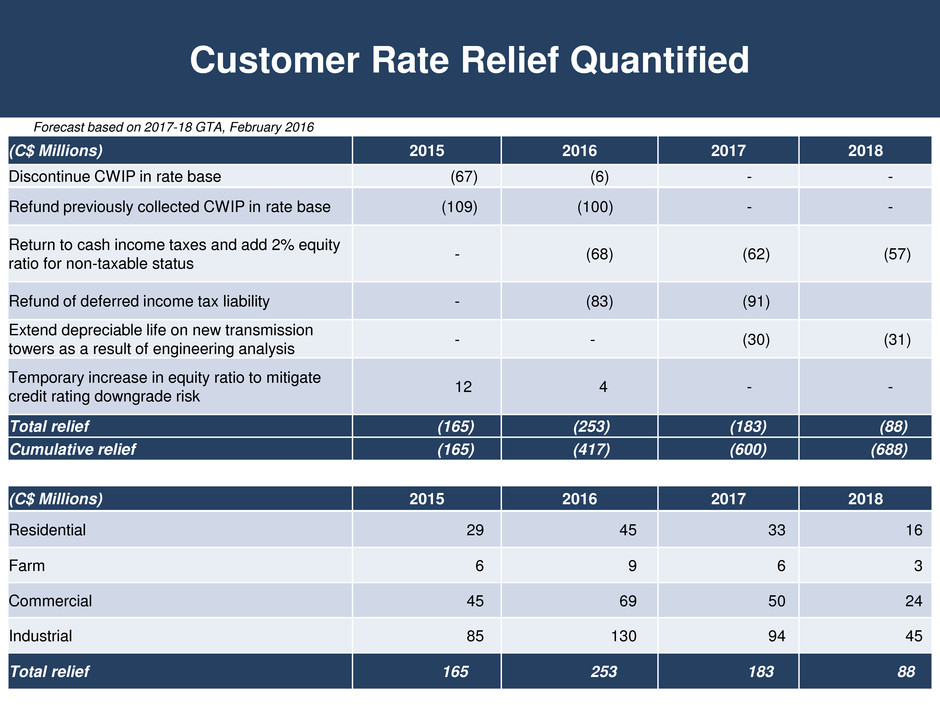
Customer Rate Relief Quantified (C$ Millions) 2015 2016 2017 2018 Discontinue CWIP in rate base (67) (6) - - Refund previously collected CWIP in rate base (109) (100) - - Return to cash income taxes and add 2% equity ratio for non-taxable status - (68) (62) (57) Refund of deferred income tax liability - (83) (91) Extend depreciable life on new transmission towers as a result of engineering analysis - - (30) (31) Temporary increase in equity ratio to mitigate credit rating downgrade risk 12 4 - - Total relief (165) (253) (183) (88) Cumulative relief (165) (417) (600) (688) (C$ Millions) 2015 2016 2017 2018 Residential 29 45 33 16 Farm 6 9 6 3 Commercial 45 69 50 24 Industrial 85 130 94 45 Total relief 165 253 183 88 Forecast based on 2017-18 GTA, February 2016
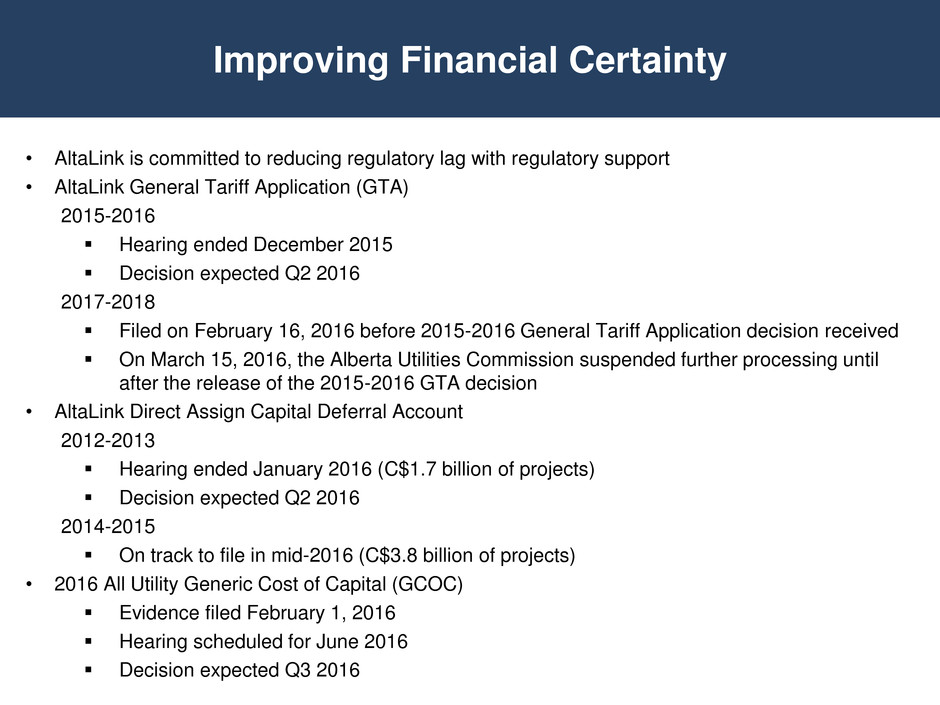
• AltaLink is committed to reducing regulatory lag with regulatory support • AltaLink General Tariff Application (GTA) 2015-2016 Hearing ended December 2015 Decision expected Q2 2016 2017-2018 Filed on February 16, 2016 before 2015-2016 General Tariff Application decision received On March 15, 2016, the Alberta Utilities Commission suspended further processing until after the release of the 2015-2016 GTA decision • AltaLink Direct Assign Capital Deferral Account 2012-2013 Hearing ended January 2016 (C$1.7 billion of projects) Decision expected Q2 2016 2014-2015 On track to file in mid-2016 (C$3.8 billion of projects) • 2016 All Utility Generic Cost of Capital (GCOC) Evidence filed February 1, 2016 Hearing scheduled for June 2016 Decision expected Q3 2016 Improving Financial Certainty
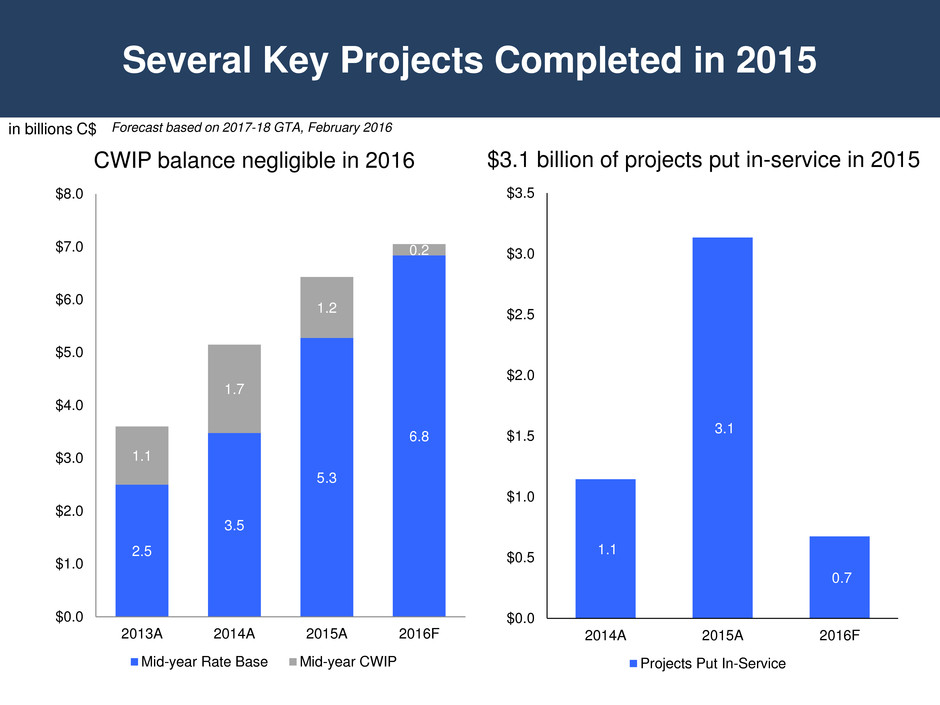
Several Key Projects Completed in 2015 CWIP balance negligible in 2016 $3.1 billion of projects put in-service in 2015 in billions C$ 2.5 3.5 5.3 6.8 1.1 1.7 1.2 0.2 $0.0 $1.0 $2.0 $3.0 $4.0 $5.0 $6.0 $7.0 $8.0 2013A 2014A 2015A 2016F Mid-year Rate Base Mid-year CWIP Forecast based on 2017-18 GTA, February 2016 1.1 3.1 0.7 $0.0 $0.5 $1.0 $1.5 $2.0 $2.5 $3.0 $3.5 2014A 2015A 2016F Projects Put In-Service
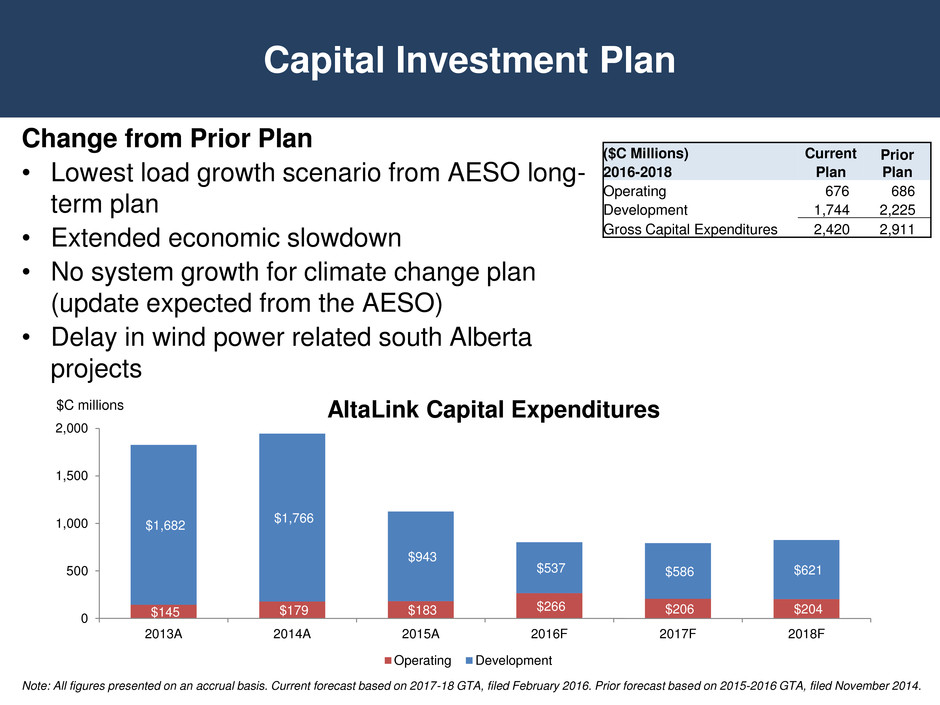
Capital Investment Plan Change from Prior Plan • Lowest load growth scenario from AESO long- term plan • Extended economic slowdown • No system growth for climate change plan (update expected from the AESO) • Delay in wind power related south Alberta projects ($C Millions) Current Prior Plan 2016-2018 Plan Operating 676 686 Development 1,744 2,225 Gross Capital Expenditures 2,420 2,911 AltaLink Capital Expenditures $C millions Note: All figures presented on an accrual basis. Current forecast based on 2017-18 GTA, filed February 2016. Prior forecast based on 2015-2016 GTA, filed November 2014. $145 $179 $183 $266 $206 $204 $1,682 $1,766 $943 $537 $586 $621 0 500 1,000 1,500 2,000 2013A 2014A 2015A 2016F 2017F 2018F Operating Development
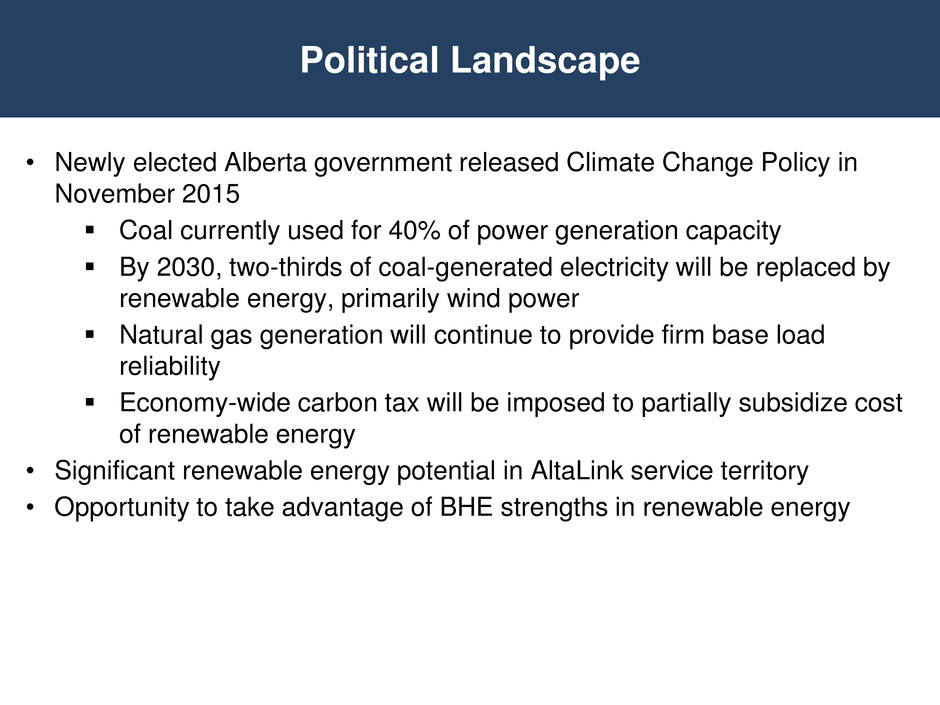
Political Landscape • Newly elected Alberta government released Climate Change Policy in November 2015 Coal currently used for 40% of power generation capacity By 2030, two-thirds of coal-generated electricity will be replaced by renewable energy, primarily wind power Natural gas generation will continue to provide firm base load reliability Economy-wide carbon tax will be imposed to partially subsidize cost of renewable energy • Significant renewable energy potential in AltaLink service territory • Opportunity to take advantage of BHE strengths in renewable energy as Sustainable Electricity Company
Summary Declining economy impacting oil and gas customers Climate Change Policy providing new opportunities Reducing regulatory lag is key to mitigating risk Rate relief addresses customer affordability concerns
AltaLink Appendix
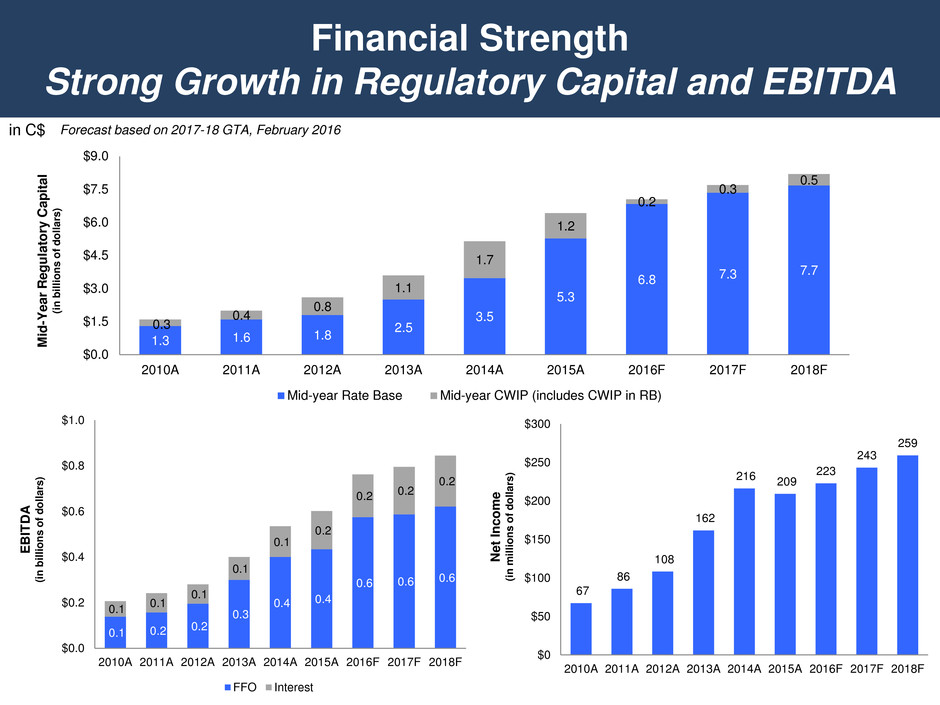
Financial Strength Strong Growth in Regulatory Capital and EBITDA E BI T D A (i n b il li ons o f do ll a rs ) M id -Y e a r Reg u lat o ry Capi ta l (i n b il li ons o f do ll a rs ) Ne t Inc o me (i n m il li ons o f do ll a rs ) in C$ 1.3 1.6 1.8 2.5 3.5 5.3 6.8 7.3 7.7 0.3 0.4 0.8 1.1 1.7 1.2 0.2 0.3 0.5 $0.0 $1.5 $3.0 $4.5 $6.0 $7.5 $9.0 2010A 2011A 2012A 2013A 2014A 2015A 2016F 2017F 2018F Mid-year Rate Base Mid-year CWIP (includes CWIP in RB) 67 86 108 162 216 209 223 243 259 $0 $50 $100 $150 $200 $250 $300 2010A 2011A 2012A 2013A 2014A 2015A 2016F 2017F 2018F Forecast based on 2017-18 GTA, February 2016 0.1 0.2 0.2 0.3 0.4 0.4 0.6 0.6 0.6 0.1 0.1 0.1 0.1 0.1 0.2 0.2 0.2 0.2 $0.0 $0.2 $0.4 $0.6 $0.8 $1.0 2010A 2011A 2012A 2013A 2014A 2015A 2016F 2017F 2018F FFO Interest
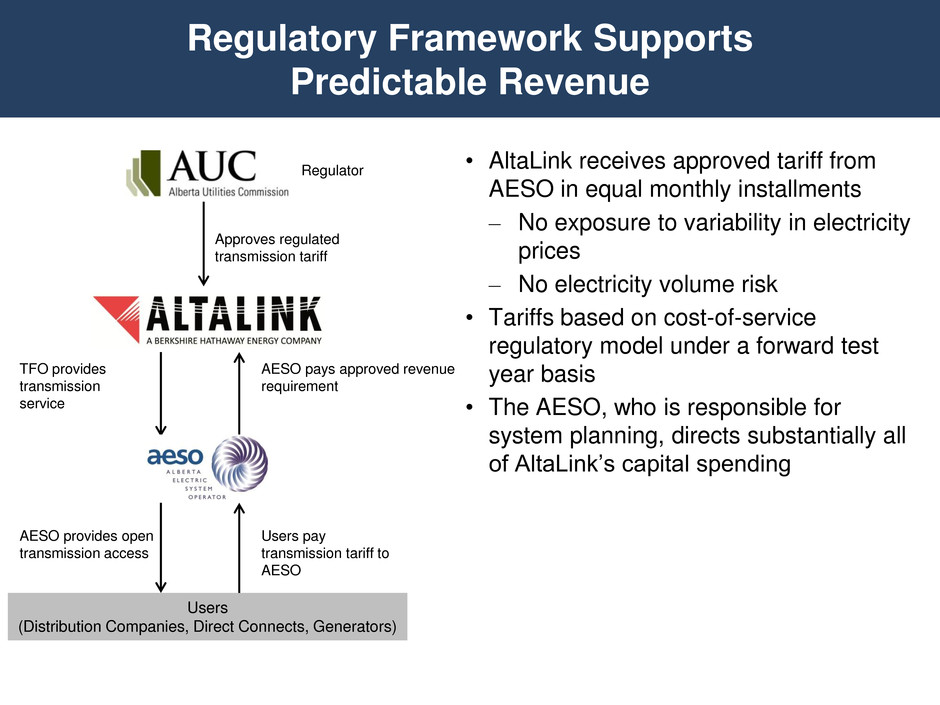
• AltaLink receives approved tariff from AESO in equal monthly installments – No exposure to variability in electricity prices – No electricity volume risk • Tariffs based on cost-of-service regulatory model under a forward test year basis • The AESO, who is responsible for system planning, directs substantially all of AltaLink’s capital spending Users (Distribution Companies, Direct Connects, Generators) Regulator Approves regulated transmission tariff TFO provides transmission service AESO provides open transmission access Users pay transmission tariff to AESO AESO pays approved revenue requirement Regulatory Framework Supports Predictable Revenue
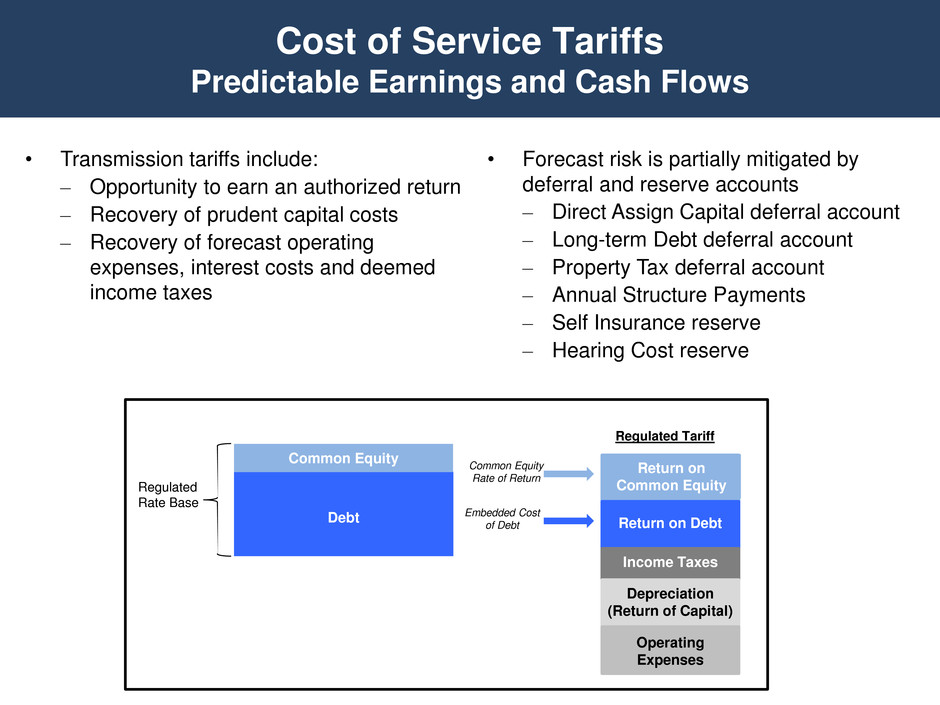
Cost of Service Tariffs Predictable Earnings and Cash Flows • Transmission tariffs include: – Opportunity to earn an authorized return – Recovery of prudent capital costs – Recovery of forecast operating expenses, interest costs and deemed income taxes Return on Common Equity Return on Debt Income Taxes Depreciation (Return of Capital) Operating Expenses Debt Common Equity Regulated Rate Base Regulated Tariff Common Equity Rate of Return Embedded Cost of Debt • Forecast risk is partially mitigated by deferral and reserve accounts – Direct Assign Capital deferral account – Long-term Debt deferral account – Property Tax deferral account – Annual Structure Payments – Self Insurance reserve – Hearing Cost reserve

AltaLink Regulatory Update 2017-2018 General Tariff Application (GTA) • On February 16, 2016, the 2017-2018 GTA was filed with the Alberta Utilities Commission (AUC) which included C$270 million of proposed rate relief during 2017-2018 • On March 15, 2016, the Alberta Utilities Commission suspended further processing until after the release of the 2015-2016 GTA decision 2015-2016 GTA • On November 18, 2014, the 2015-2016 GTA was filed with the AUC • An amendment to the GTA was filed on June 1, 2015, which included C$417 million of proposed rate relief during 2015-2016 including a request for higher equity thickness to solidify the capital structure • AltaLink filed an update to the GTA on October 16, 2015, which reduced capital expenditures by C$0.5 billion in 2015 and C$0.4 billion in 2016 • Hearing took place in December 2015 • Decision is expected May 2016 2012-2013 Direct Assign Capital Deferral Account • AltaLink is seeking approval for approximately C$1.7 billion of direct assign capital projects which entered service in 2012-2013. • Hearing ended in January 2016 • Decision is expected in Q2 2016
AltaLink Regulatory Update cont’d Other Regulatory EPCM Rates • In its November 2013 decision pertaining to ALP’s 2013-2014 GTA (Decision 2013-407), the AUC directed ALP to re-forecast the capital project expenditures for 2013 and 2014 EPCM services to reflect a two times labour multiplier and other approved mark-ups. While the AUC has not disallowed the new EPCM rates that ALP negotiated, there is a risk that, in a future direct assigned capital deferral account decision, the AUC may disallow a portion of the costs ALP has incurred for EPCM services in connection with capital projects executed under these relationship agreements. ALP applied to the Alberta Court of Appeal for Leave to appeal Decision 2013-407. The hearing of the application has been adjourned to August 2016. In Decision 2013-407, ALP has requested approval of the capital project expenditures, including the new competitively bid EPCM rates, in its 2012- 2013 direct assigned capital deferral account filing. ALP filed additional evidence supporting the new EPCM rates in 2015 as part of the 2012-13 DACDA. A decision on the 2013-13 DACDA is expected Q2 2016. Utility Asset Disposition Appeals • In November 2013, the AUC issued its Utility Asset Disposition (UAD) Decision in which it concluded, amongst other things, that in the case of the extraordinary retirement of an asset before it is fully depreciated, under or over recovery of capital investment on an extraordinary retirement is for the account of the utility and its shareholders. • AltaLink and other utilities appealed the AUC’s UAD Decision to the Alberta Court of Appeal, but the appeal was dismissed on September 18, 2015. • On November 17, 2015, AltaLink, Epcor and Enmax, filed a joint leave application to the Supreme Court of Canada (SCC) for appeal of the Alberta Court of Appeal’s UAD Decision. • On January 7, 2016 an Intervener filed a response to this application; AltaLink and Epcor subsequently filed a joint response to this intervener response on January 18, 2016. Southwest Project Audit • On July 30, 2012, we filed an application with the AUC for approval of, among other matters, the reconciliation of certain deferral accounts for the years 2010 and 2011 (2010-2011 DACDA), including the Southwest Transmission Development project (SW Project) which included total project costs of C$609 million. The AUC ordered an independent audit to be conducted for the SW Project. The AUC retained Midgard Consulting Inc. to perform the audit. The audit report was completed in April 2015. • A hearing with respect to the audit report was held on October 2, 2015. The AUC released its final decision on the Southwest project costs on January 20, 2016. The decision found AltaLink acted prudently on all accounts and no disallowances were issued.

2016 Fixed-Income Investor Conference Phil Jones President and CEO Northern Powergrid Holdings Company
Regulatory Price Control Overview • Revenues reduce and RAV grows as regulatory asset life transitions to 45 years • Inflation protection continues to apply • Incentives remain central on cost efficiency and output delivery • Reliability improvement and lower debt rates are our best value-creation opportunities • Efficient delivery of network outputs is crucial • To stay close to the regulator’s notional gearing, a £100 million dividend was paid in 2015 • Strong credit ratings compare well with the rest of the sector • Two formal appeals have raised the stakes on the quality of the regulator’s decision-making ‒ The Competition and Markets Authority upheld our appeal on one of the three grounds, increasing cost allowances by £32 million1 ‒ British Gas’ won on “half” of one of its six grounds, reducing our ED1 revenues by £14 million1 1 – 12/13 prices 2 – Plus RPI inflation 3 – ED1 indexed, figure stated for 2016-17 4 – Total activity costs (£ millions) - US GAAP 2015 2014 Revenues 746 780 Operating income 389 409 Capex 470 411 RAV 2,844 2,776 Interest cover 4.1x 4.4x Debt to RAV 62% 56% Regulatory parameters ED1 DPCR5 Allowed equity returns 2 6.0% 6.7% Allowed cost of debt 2,3 2.4% 3.6% Annual totex 4 vs DPCR5 95% 100% Average annual RAV 1 growth 1.2% 3.7% Regulatory asset life 20-45 years 20 years
Capital Investment Plan • Operating capital is aligned to our ED1 investment program to ensure we efficiently fulfill our output commitments • We began the ED1 period having completed the most significant capital investment program in our company’s history, this gives us a strong starting point in respect of our underlying asset health • Progressive capex is a key part of our ED1 capital investment program as we seek to build a smarter energy infrastructure (£ Millions) 2016-2018 Current Plan Prior Plan Operating £ 1,113 £ 1,038 Development 39 - Total £ 1,152 £ 1,038 £421 £377 £382 £409 £361 £343 £10 £35 £59 £35 £3 £1 - 100 200 300 400 500 2013 2014 2015 2016F 2017F 2018F Northern Powergrid Capital Expenditures Operating Development (£ millions)
95 100 105 110 115 120 125 GD P (2 00 5 = 1 00 ) UK USA Euro area 0% 2% 4% 6% 8% 10% 12% 14% Un em pl oy m en t r at e UK USA Euro area U.K and European Economic Outlook Euro area recession more protracted… • The contrasting fortunes in the USA, UK and the Eurozone illustrate the struggle the Euro area has to recover • Our view is that the EU’s general sluggishness affects our business plan indirectly: cheaper input prices reduce our costs while a lower inflation environment also creates a lower indexation uplift to revenues • Brexit is now a key uncertainty but does not directly affect the fundamentals of our business: – UK regulatory framework developed well ahead of EU legislation – Sustainability objectives largely independent of EU – Brexit would create some extra latitude on how low- carbon objectives are met – In any case, an exit would take years to resolve • Exchange rates affect our contribution to BHE and will almost certainly fluctuate on sentiment this year - but will be driven by economy over the longer term …reflected in unemployment close to peak Source: IMF, World Economic Outlook
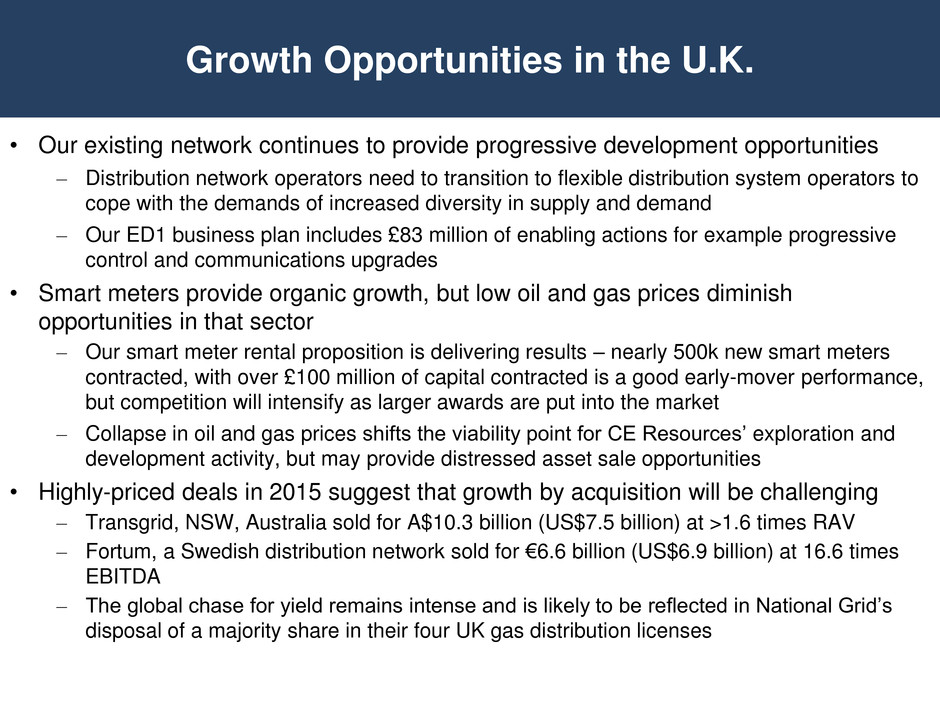
• Our existing network continues to provide progressive development opportunities – Distribution network operators need to transition to flexible distribution system operators to cope with the demands of increased diversity in supply and demand – Our ED1 business plan includes £83 million of enabling actions for example progressive control and communications upgrades • Smart meters provide organic growth, but low oil and gas prices diminish opportunities in that sector – Our smart meter rental proposition is delivering results – nearly 500k new smart meters contracted, with over £100 million of capital contracted is a good early-mover performance, but competition will intensify as larger awards are put into the market – Collapse in oil and gas prices shifts the viability point for CE Resources’ exploration and development activity, but may provide distressed asset sale opportunities • Highly-priced deals in 2015 suggest that growth by acquisition will be challenging – Transgrid, NSW, Australia sold for A$10.3 billion (US$7.5 billion) at >1.6 times RAV – Fortum, a Swedish distribution network sold for €6.6 billion (US$6.9 billion) at 16.6 times EBITDA – The global chase for yield remains intense and is likely to be reflected in National Grid’s disposal of a majority share in their four UK gas distribution licenses Growth Opportunities in the U.K.

2016 Fixed-Income Investor Conference Bill Fehrman President and CEO BHE Renewables
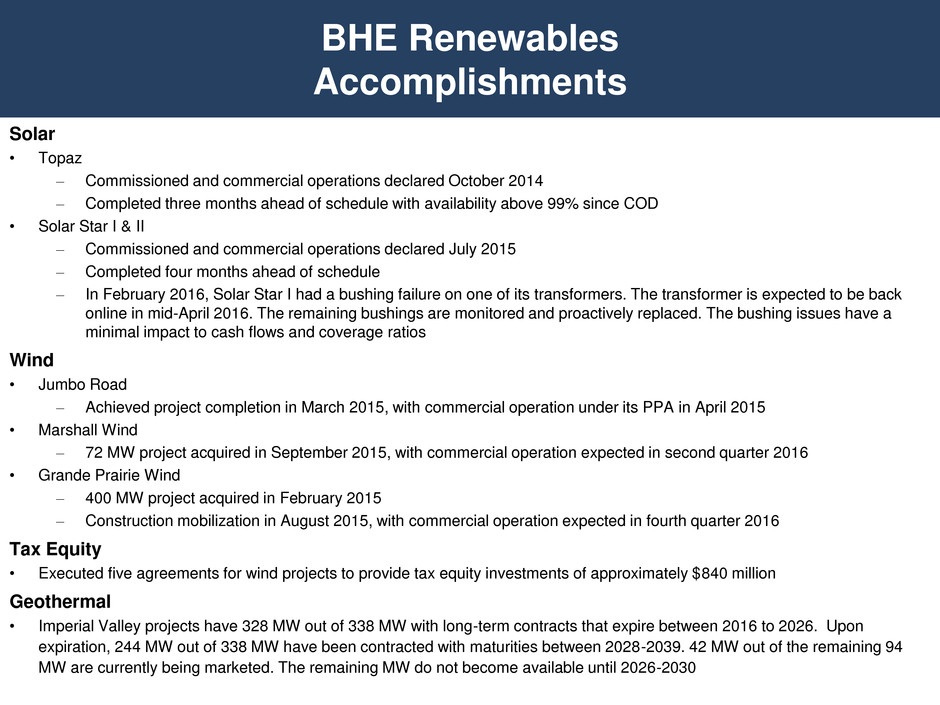
BHE Renewables Accomplishments Solar • Topaz – Commissioned and commercial operations declared October 2014 – Completed three months ahead of schedule with availability above 99% since COD • Solar Star I & II – Commissioned and commercial operations declared July 2015 – Completed four months ahead of schedule – In February 2016, Solar Star I had a bushing failure on one of its transformers. The transformer is expected to be back online in mid-April 2016. The remaining bushings are monitored and proactively replaced. The bushing issues have a minimal impact to cash flows and coverage ratios Wind • Jumbo Road – Achieved project completion in March 2015, with commercial operation under its PPA in April 2015 • Marshall Wind – 72 MW project acquired in September 2015, with commercial operation expected in second quarter 2016 • Grande Prairie Wind – 400 MW project acquired in February 2015 – Construction mobilization in August 2015, with commercial operation expected in fourth quarter 2016 Tax Equity • Executed five agreements for wind projects to provide tax equity investments of approximately $840 million Geothermal • Imperial Valley projects have 328 MW out of 338 MW with long-term contracts that expire between 2016 to 2026. Upon expiration, 244 MW out of 338 MW have been contracted with maturities between 2028-2039. 42 MW out of the remaining 94 MW are currently being marketed. The remaining MW do not become available until 2026-2030
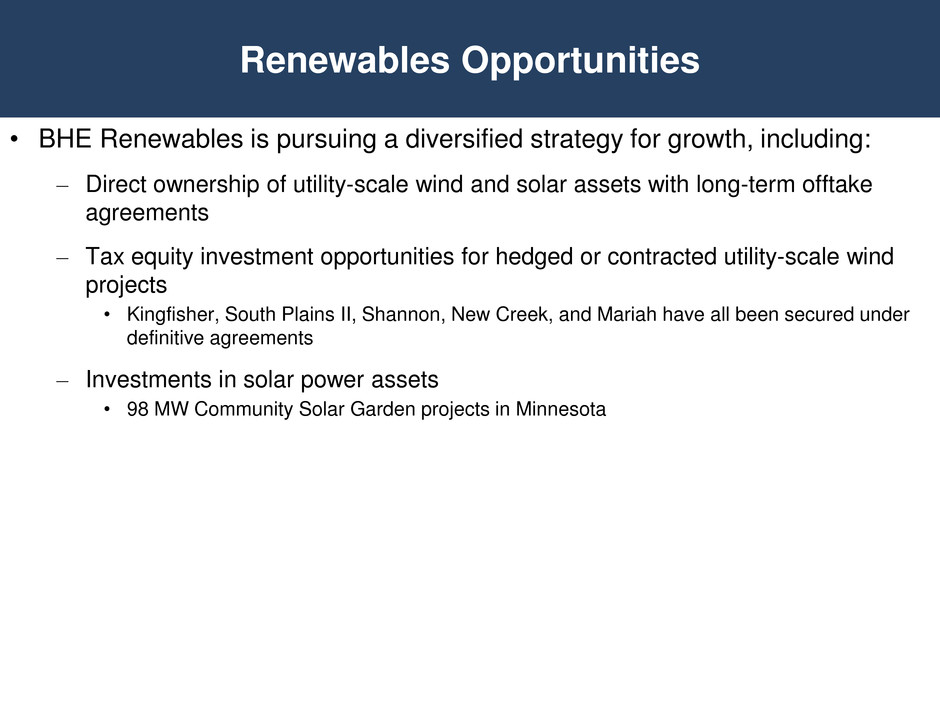
Renewables Opportunities • BHE Renewables is pursuing a diversified strategy for growth, including: – Direct ownership of utility-scale wind and solar assets with long-term offtake agreements – Tax equity investment opportunities for hedged or contracted utility-scale wind projects • Kingfisher, South Plains II, Shannon, New Creek, and Mariah have all been secured under definitive agreements – Investments in solar power assets • 98 MW Community Solar Garden projects in Minnesota
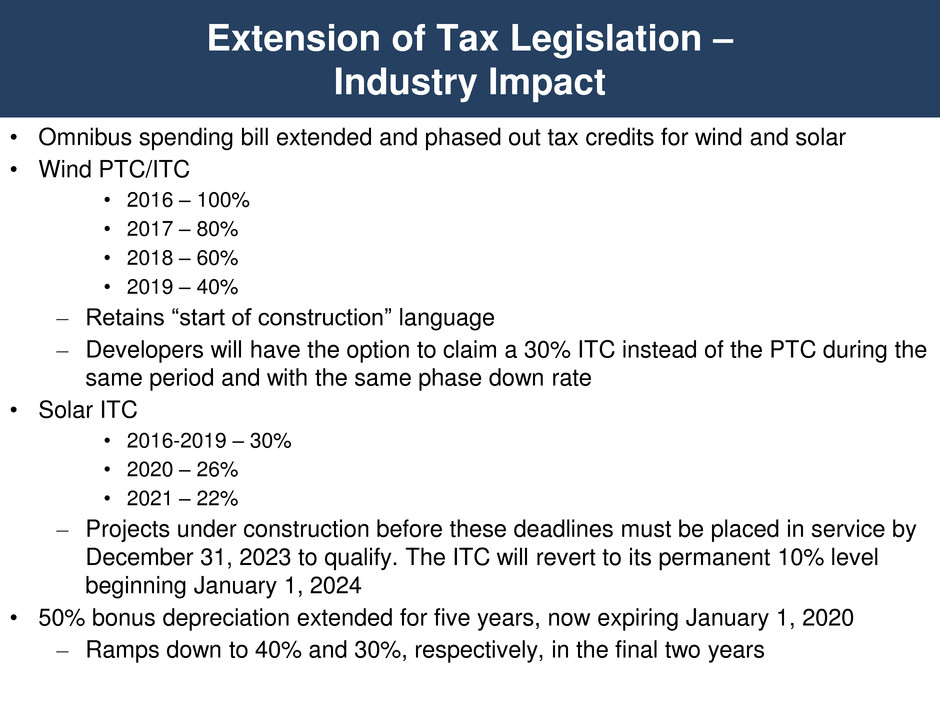
Extension of Tax Legislation – Industry Impact • Omnibus spending bill extended and phased out tax credits for wind and solar • Wind PTC/ITC • 2016 – 100% • 2017 – 80% • 2018 – 60% • 2019 – 40% – Retains “start of construction” language – Developers will have the option to claim a 30% ITC instead of the PTC during the same period and with the same phase down rate • Solar ITC • 2016-2019 – 30% • 2020 – 26% • 2021 – 22% – Projects under construction before these deadlines must be placed in service by December 31, 2023 to qualify. The ITC will revert to its permanent 10% level beginning January 1, 2024 • 50% bonus depreciation extended for five years, now expiring January 1, 2020 – Ramps down to 40% and 30%, respectively, in the final two years
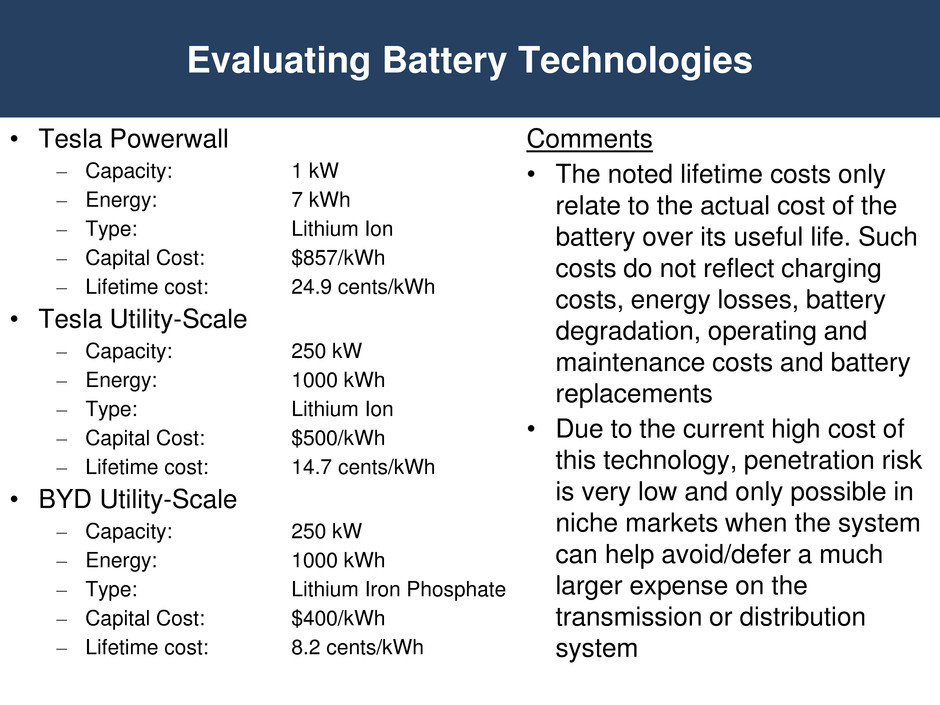
Evaluating Battery Technologies • Tesla Powerwall – Capacity: 1 kW – Energy: 7 kWh – Type: Lithium Ion – Capital Cost: $857/kWh – Lifetime cost: 24.9 cents/kWh • Tesla Utility-Scale – Capacity: 250 kW – Energy: 1000 kWh – Type: Lithium Ion – Capital Cost: $500/kWh – Lifetime cost: 14.7 cents/kWh • BYD Utility-Scale – Capacity: 250 kW – Energy: 1000 kWh – Type: Lithium Iron Phosphate – Capital Cost: $400/kWh – Lifetime cost: 8.2 cents/kWh Comments • The noted lifetime costs only relate to the actual cost of the battery over its useful life. Such costs do not reflect charging costs, energy losses, battery degradation, operating and maintenance costs and battery replacements • Due to the current high cost of this technology, penetration risk is very low and only possible in niche markets when the system can help avoid/defer a much larger expense on the transmission or distribution system
BHE Renewables Appendix
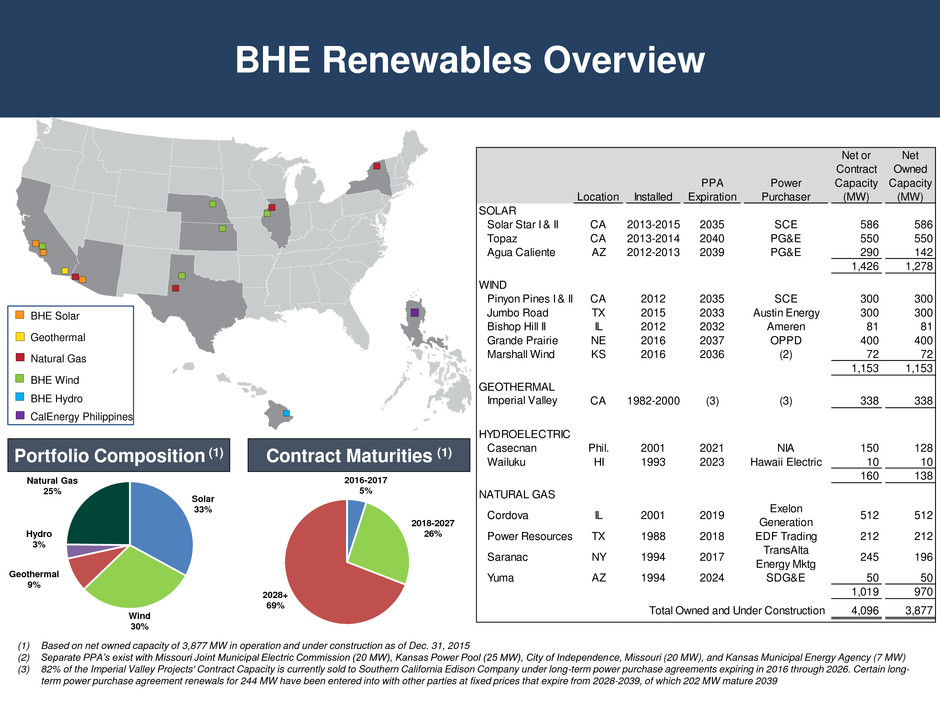
BHE Renewables Overview (1) Based on net owned capacity of 3,877 MW in operation and under construction as of Dec. 31, 2015 (2) Separate PPA’s exist with Missouri Joint Municipal Electric Commission (20 MW), Kansas Power Pool (25 MW), City of Independence, Missouri (20 MW), and Kansas Municipal Energy Agency (7 MW) (3) 82% of the Imperial Valley Projects' Contract Capacity is currently sold to Southern California Edison Company under long-term power purchase agreements expiring in 2016 through 2026. Certain long- term power purchase agreement renewals for 244 MW have been entered into with other parties at fixed prices that expire from 2028-2039, of which 202 MW mature 2039 BHE Solar Geothermal Natural Gas BHE Wind BHE Hydro CalEnergy Philippines Solar 33% Wind 30% Geothermal 9% Hydro 3% Natural Gas 25% Portfolio Composition (1) 2016-2017 5% 2018-2027 26% 2028+ 69% Contract Maturities (1) Location Installed PPA Expiration Power Purchaser Net or Contract Capacity (MW) Net Owned Capacity (MW) SOLAR Solar Star I & II CA 2013-2015 2035 SCE 586 586 Topaz CA 2013-2014 2040 PG&E 550 550 Agua Caliente AZ 2012-2013 2039 PG&E 290 142 1,426 1,278 WIND Pinyon Pines I & II CA 2012 2035 SCE 300 300 Jumbo Road TX 2015 2033 Austin Energy 300 300 Bishop Hill II IL 2012 2032 Ameren 81 81 Grande Prairie NE 2016 2037 OPPD 400 400 Marshall Wind KS 2016 2036 (2) 72 72 1,153 1,153 GEOTHERMAL Imperial Valley CA 1982-2000 (3) (3) 338 338 HYDROELECTRIC Casecnan Phil. 2001 2021 NIA 150 128 Wailuku HI 1993 2023 Hawaii Electric 10 10 160 138 NATURAL GAS Cordova IL 2001 2019 Exelon Generation 512 512 Power Resources TX 1988 2018 EDF Trading 212 212 Saranac NY 1994 2017 TransAlta Energy Mktg 245 196 Yuma AZ 1994 2024 SDG&E 50 50 1,019 970 Total Owned and Under Construction 4,096 3,877
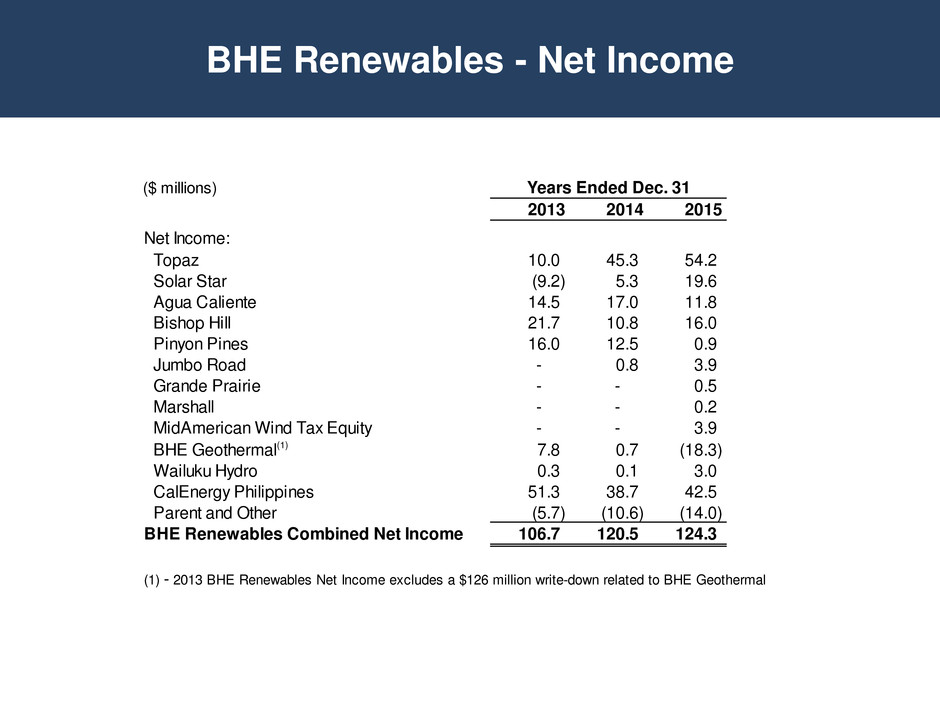
BHE Renewables - Net Income ($ millions) Years Ended Dec. 31 2013 2014 2015 Net Income: Topaz 10.0 45.3 54.2 Solar Star (9.2) 5.3 19.6 Agua Caliente 14.5 17.0 11.8 Bishop Hill 21.7 10.8 16.0 Pinyon Pines 16.0 12.5 0.9 Jumbo Road - 0.8 3.9 Grande Prairie - - 0.5 Marshall - - 0.2 MidAmerican Wind Tax Equity - - 3.9 BHE Geothermal(1) 7.8 0.7 (18.3) Wailuku Hydro 0.3 0.1 3.0 CalEnergy Philippines 51.3 38.7 42.5 Parent and Other (5.7) (10.6) (14.0) BHE Renewables Combined Net Income 106.7 120.5 124.3 (1) - 2013 BHE Renewables Net Income excludes a $126 million write-down related to BHE Geothermal

2016 Fixed-Income Investor Conference Greg Abel Chairman, President and CEO Berkshire Hathaway Energy
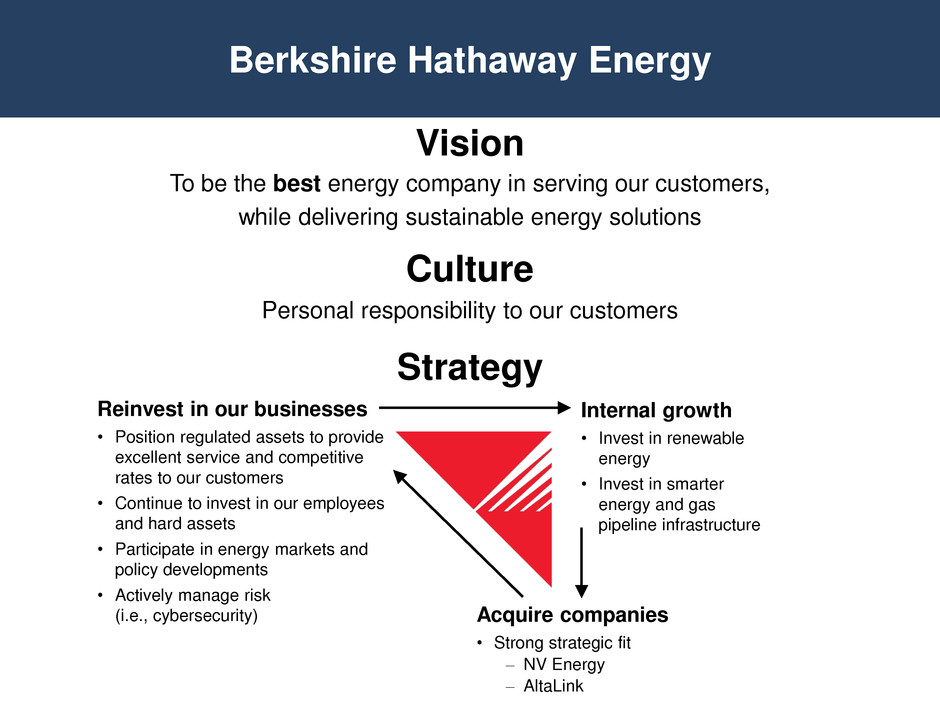
Berkshire Hathaway Energy Vision To be the best energy company in serving our customers, while delivering sustainable energy solutions Culture Personal responsibility to our customers Strategy Reinvest in our businesses • Position regulated assets to provide excellent service and competitive rates to our customers • Continue to invest in our employees and hard assets • Participate in energy markets and policy developments • Actively manage risk (i.e., cybersecurity) Internal growth • Invest in renewable energy • Invest in smarter energy and gas pipeline infrastructure Acquire companies • Strong strategic fit – NV Energy – AltaLink

Questions


