Exhibit 99.2
 Exhibit 99.2
Earnings Report to the
Financial Community NV Energy
Fourth Quarter 2012
Table of Contents
Page No.
Conference call slides 2-14
Quarterly EPS 15
Regulatory matters fact sheet 16
Financial statements and operating statistics 17-24
Non-GAAP financial measures 25-26
 Fourth Quarter 2012
Financial Results
February 22, 2013
NV Energy
 Safe Harbor Statement
This presentation may contain forward-looking statements within the meaning of the Private Securities Litigation Reform Act of 1995 regarding the future performance of NV Energy, Inc. and its subsidiaries, Nevada Power Company and Sierra Pacific Power Company both d/b/a NV Energy. Forward-looking statements include earnings guidance and estimates or forecasts of operating and financial metrics. These statements reflect current expectations of future conditions and events and as such are subject to a variety of risks, uncertainties and assumptions that could cause actual results to differ materially from current expectations. These risks, uncertainties and assumptions include, but are not limited to, NV Energy Inc.‘s ability to maintain access to the capital markets, NV Energy Inc.‘s ability to receive dividends from its subsidiaries, the financial performance of NV Energy Inc.‘s subsidiaries, particularly Nevada Power Company and Sierra Pacific Power Company both d/b/a NV Energy, and the discretion of NV Energy Inc.‘s Board of Directors with respect to the payment of future dividends based on its periodic review of factors that ordinarily affect dividend policy, such as current and prospective financial condition, earnings and liquidity, prospective business conditions, regulatory factors, and dividend restrictions in NV Energy Inc.‘s and its subsidiaries’ financing agreements. For Nevada Power Company and Sierra Pacific Power Company both d/b/a NV Energy, these risks and uncertainties include, but are not limited to, future economic conditions both nationally and regionally, changes in the rate of industrial, commercial and residential growth in their service territories, their ability to procure sufficient renewable energy sources in each compliance year to satisfy the Nevada Renewable Energy Portfolio Standard, changes in environmental laws and regulations, construction risks, including but not limited to those associated with the ON Line project, their ability to maintain access to the capital markets for general corporate purposes and to finance construction projects, employee workforce factors, unseasonable weather, drought, wildfire and other natural phenomena, explosions, fires, accidents, mechanical breakdowns that may occur while operating and maintaining an electric and natural gas system, their ability to purchase sufficient fuel, natural gas and power to meet their power demands and natural gas demands for Sierra Pacific Power Company d/b/a NV Energy, financial market conditions, and unfavorable rulings in their pending and future regulatory filings. Further risks, uncertainties and assumptions that may cause actual results to differ from current expectations pertain to weather conditions, customer and sales growth, plant outages, operations and maintenance expense, depreciation and allowance for funds used during construction, interest rates and expense, cash flow and regulatory matters. Additional cautionary statements regarding other risk factors that could have an effect on the future performance of NV Energy, Inc., Nevada Power Company and Sierra Pacific Power Company both d/b/a NV Energy are contained in their Annual Reports on Form 10-K for the year ended December 31, 2011, and quarterly reports on Form 10-Q for the periods ended March 31, 2012, June 30, 2012, and September 30, 2012 each filed with the Securities and Exchange Commission. NV Energy Inc., Nevada Power Company and Sierra Pacific Power Company both d/b/a NV Energy undertake no obligation to release publicly the result of any revisions to these forward-looking statements that may be made to reflect events or circumstances after the date hereof or to reflect the occurrence of unanticipated events.
IR Contacts
Max Kuniansky
Britta Carlson
Executive, Investor Relations
Manager, Investor and Shareholder Relations
(702) 402-5627
(702) 402-5624
mkuniansky@nvenergy.com
bcarlson@nvenergy.com
3
NV Energy
 Nevada Economy
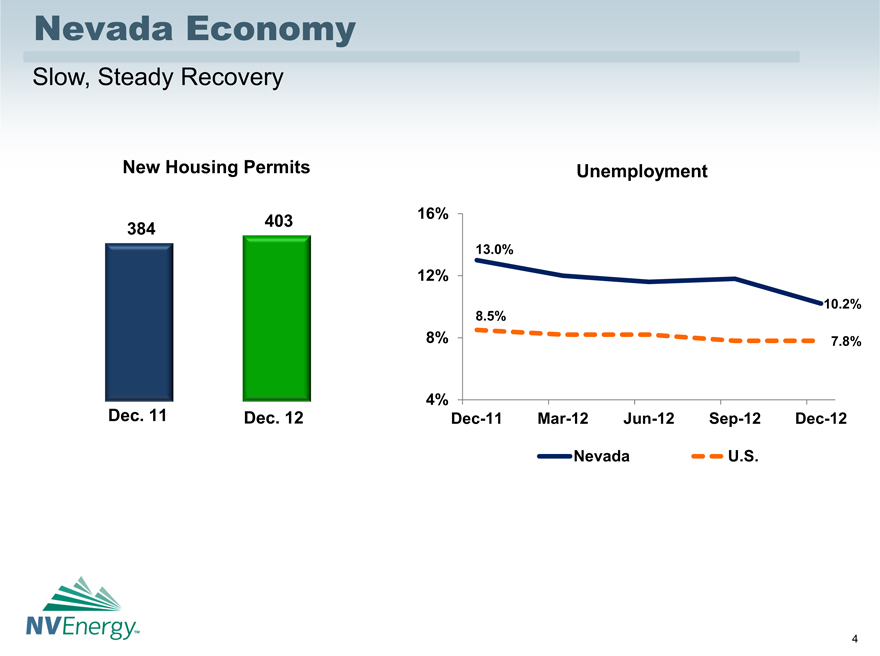
Slow, Steady Recovery
New Housing Permits
384
403
Dec. 11
Dec. 12
Unemployment
16%
13.0%
12%
10.2%
8.5%
8%
7.8%
4%
Dec-11
Mar-12
Jun-12
Sep-12
Dec-12
Nevada
U.S.
4
NV Energy
 Southern Nevada Economy
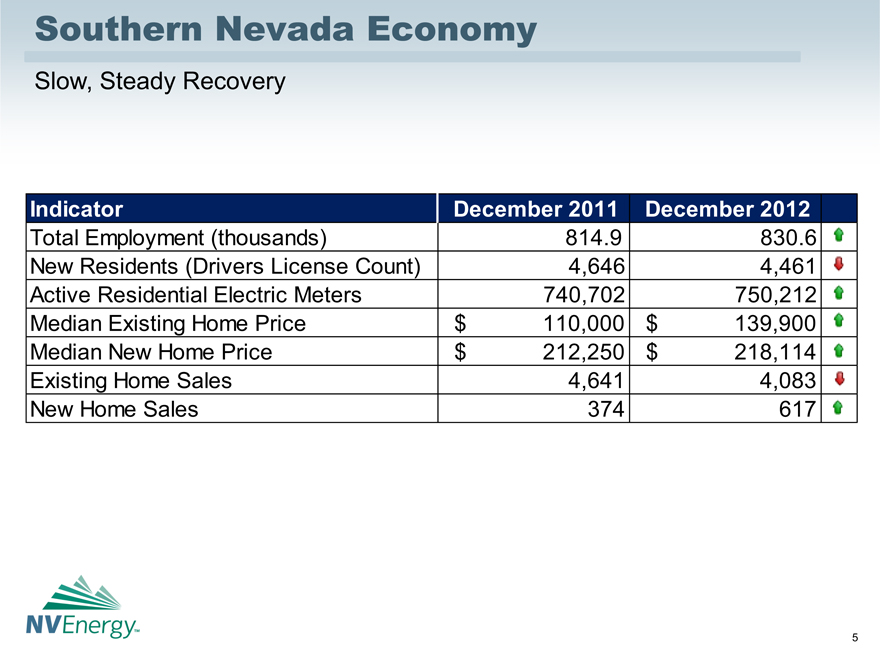
Slow, Steady Recovery
Indicator
December 2011
December 2012
Total Employment (thousands)
814.9
830.6
New Residents (Drivers License Count)
4,646
4,461
Active Residential Electric Meters
740,702
750,212
Median Existing Home Price
$110,000
$139,900
Median New Home Price
$212,250
$218,114
Existing Home Sales
4,641
4,083
New Home Sales
374
617
5
NV Energy
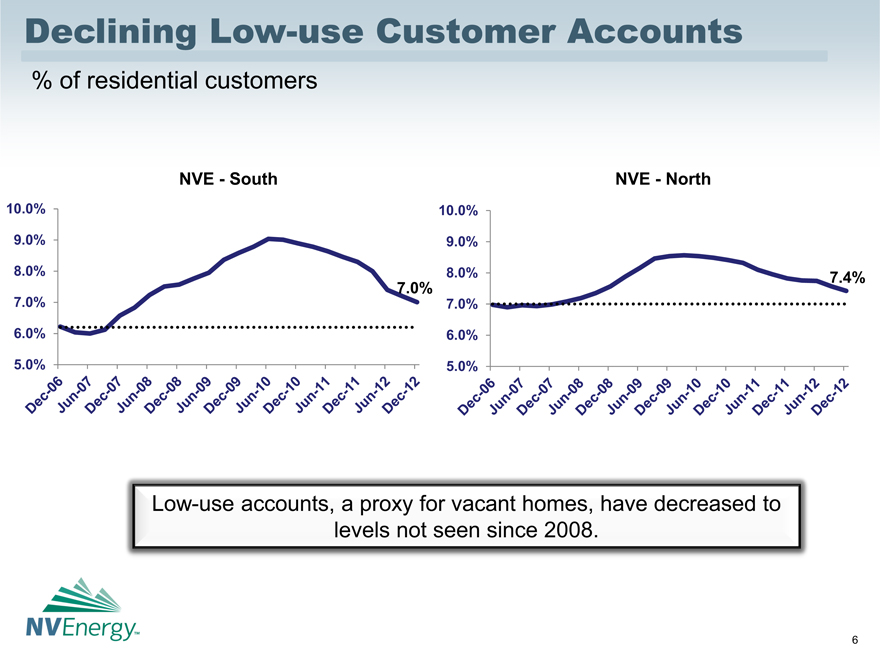 Declining Low-use Customer Accounts
% of residential customers
NVE—South
10.0%
9.0%
8.0%
7.0%
7.0%
6.0%
5.0%
Dec-06
Jun-07
Dec-07
Jun-08
Dec-08
Jun-09
Dec-09
Jun-10
Dec-10
Jun-11
Dec-11
Jun-12
Dec-12
NVE—North
10.0%
9.0%
8.0%
7.4%
7.0%
6.0%
5.0%
Dec-06
Jun-07
Dec-07
Jun-08
Dec-08
Jun-09
Dec-09
Jun-10
Dec-10
Jun-11
Dec-11
Jun-12
Dec-12
Low-use accounts, a proxy for vacant homes, have decreased to levels not seen since 2008.
6
NV Energy
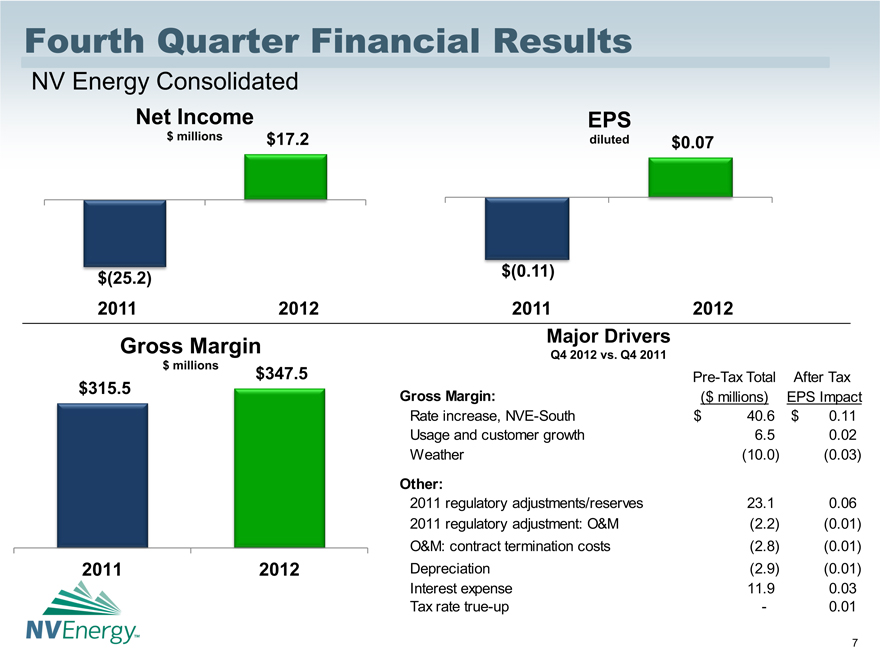 Fourth Quarter Financial Results
NV Energy Consolidated
Net Income
$ millions
$17.2
$(25.2)
2011
2012
Gross Margin
$ millions
$347.5
$315.5
2011
2012
EPS
diluted
$0.07
$(0.11)
2011
2012
Major Drivers
Q4 2012 vs. Q4 2011
Pre-Tax Total
After Tax
Gross Margin:
($ millions)
EPS Impact
Rate increase, NVE-South
$40.6
$0.11
Usage and customer growth
6.5
0.02
Weather
(10.0)
(0.03)
Other:
2011 regulatory adjustments/reserves
23.1
0.06
2011 regulatory adjustment: O&M
(2.2)
(0.01)
O&M: contract termination costs
(2.8)
(0.01)
Depreciation
(2.9)
(0.01)
Interest expense
11.9
0.03
Tax rate true-up
-
0.01
7
NV Energy
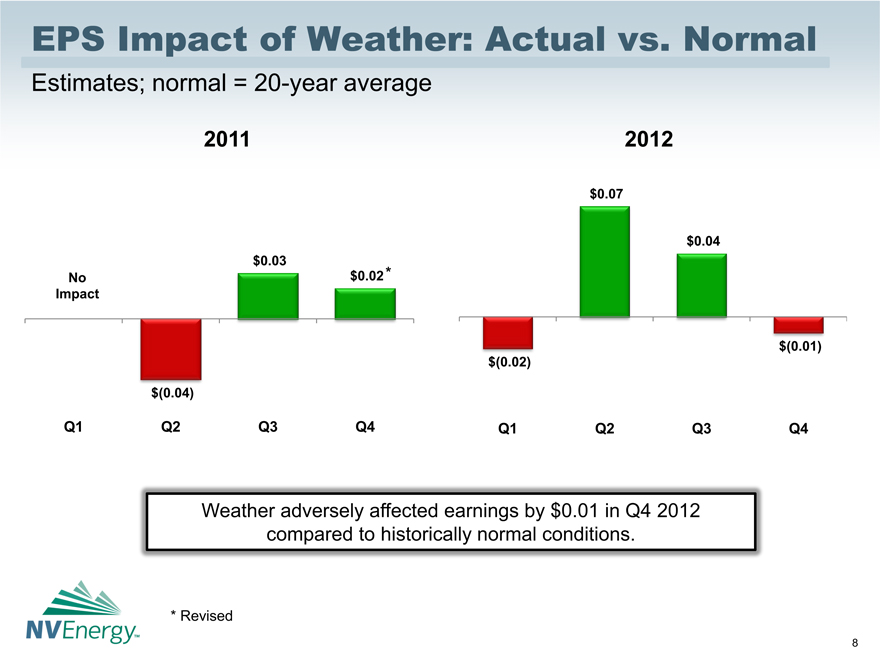 EPS Impact of Weather: Actual vs. Normal
Estimates; normal = 20-year average
2011
$0.03
No
$0.02 *
Impact
$(0.04)
Q1
Q2
Q3
Q4
2012
$0.07
$0.04
$(0.01)
$(0.02)
Q1
Q2
Q3
Q4
Weather adversely affected earnings by $0.01 in Q4 2012 compared to historically normal conditions.
* Revised
8
NV Energy
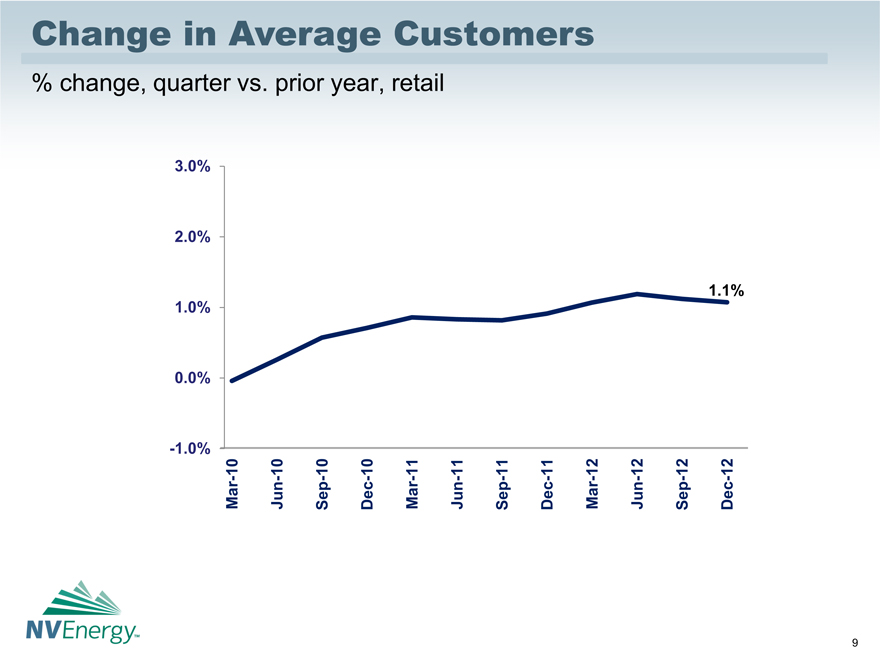 Change in Average Customers
% change, quarter vs. prior year, retail
3.0%
2.0%
1.0%
1.1%
0.0%
-1.0%
Mar-10
Jun-10
Sep-10
Dec-10
Mar-11
Jun-11
Sep-11
Dec-11
Mar-12
Jun-12
Sep-12
Dec-12
9
NV Energy
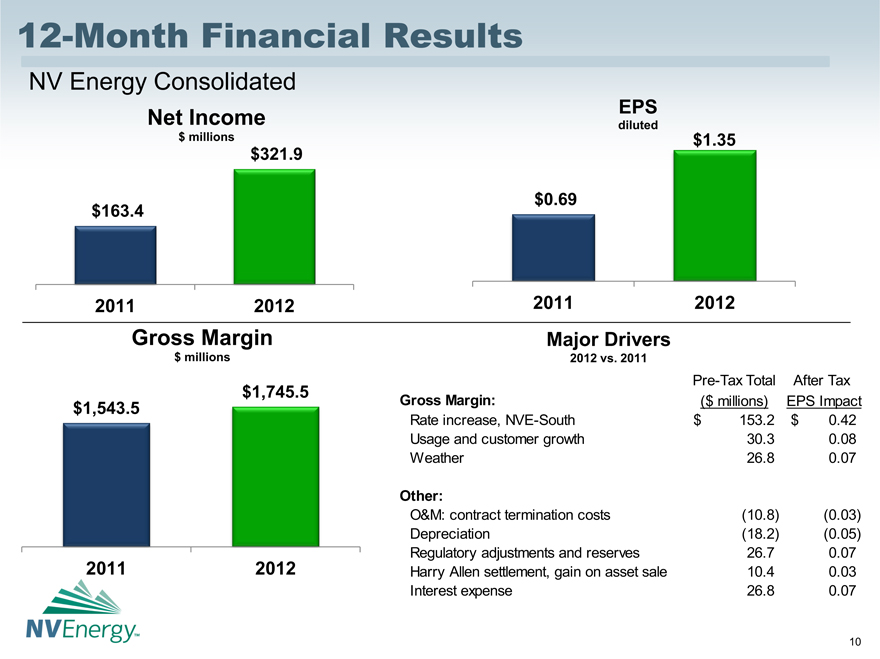 12-Month Financial Results
NV Energy Consolidated
Net Income
$ millions
$321.9
$163.4
2011
2012
Gross Margin
$ millions
$1,745.5
$1,543.5
2011
2012
EPS
diluted
$1.35
$0.69
2011
2012
Major Drivers
2012 vs. 2011
Pre-Tax Total
After Tax
Gross Margin:
($ millions)
EPS Impact
Rate increase, NVE-South
$153.2
$0.42
Usage and customer growth
30.3
0.08
Weather
26.8
0.07
Other:
O&M: contract termination costs
(10.8)
(0.03)
Depreciation
(18.2)
(0.05)
Regulatory adjustments and reserves
26.7
0.07
Harry Allen settlement, gain on asset sale
10.4
0.03
Interest expense
26.8
0.07
10
NV Energy
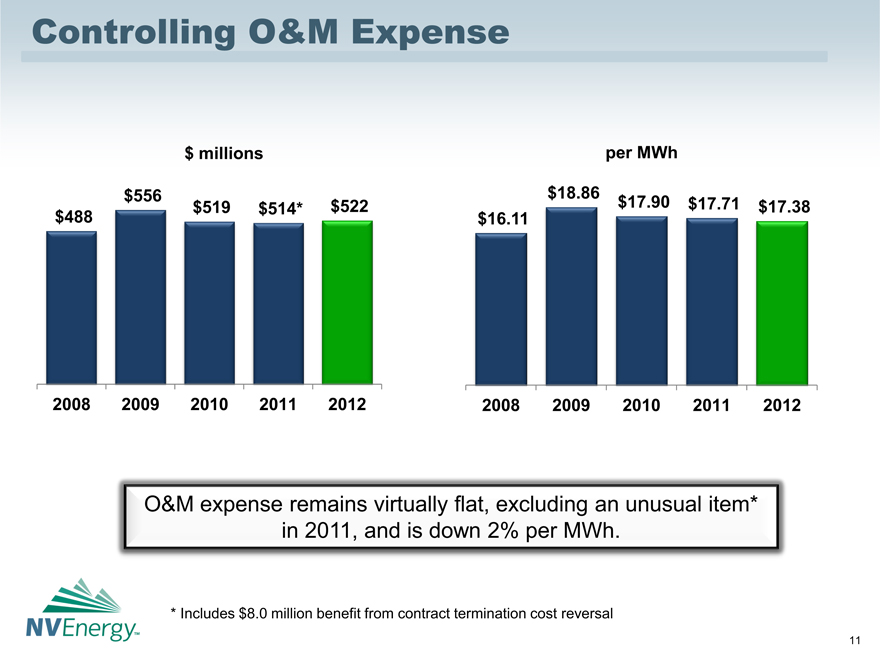 Controlling O&M Expense
$ millions
$556
$488
$519
$514*
$522
2008
2009
2010
2011
2012
per MWh
$18.86
$17.90
$17.71
$17.38
$16.11
2008
2009
2010
2011
2012
O&M expense remains virtually flat, excluding an unusual item* in 2011, and is down 2% per MWh.
* Includes $8.0 million benefit from contract termination cost reversal
11
NV Energy
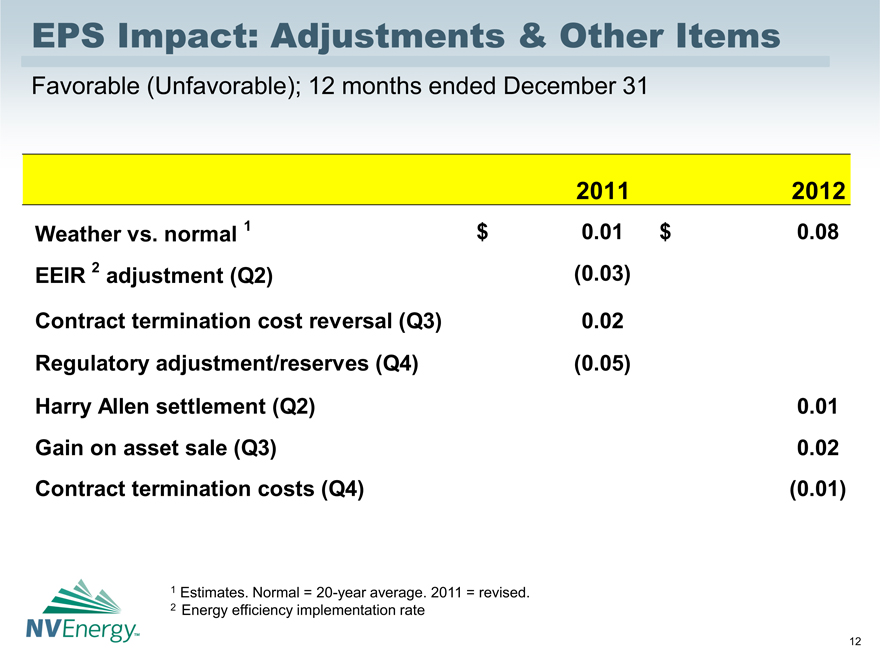 EPS Impact: Adjustments & Other Items
Favorable (Unfavorable); 12 months ended December 31
2011
2012
Weather vs. normal 1
$0.01
$0.08
EEIR 2 adjustment (Q2)
(0.03)
Contract termination cost reversal (Q3)
0.02
Regulatory adjustment/reserves (Q4)
(0.05)
Harry Allen settlement (Q2)
0.01
Gain on asset sale (Q3)
0.02
Contract termination costs (Q4)
(0.01)
1 Estimates. Normal = 20-year average. 2011 = revised.
2 Energy efficiency implementation rate
12
NV Energy
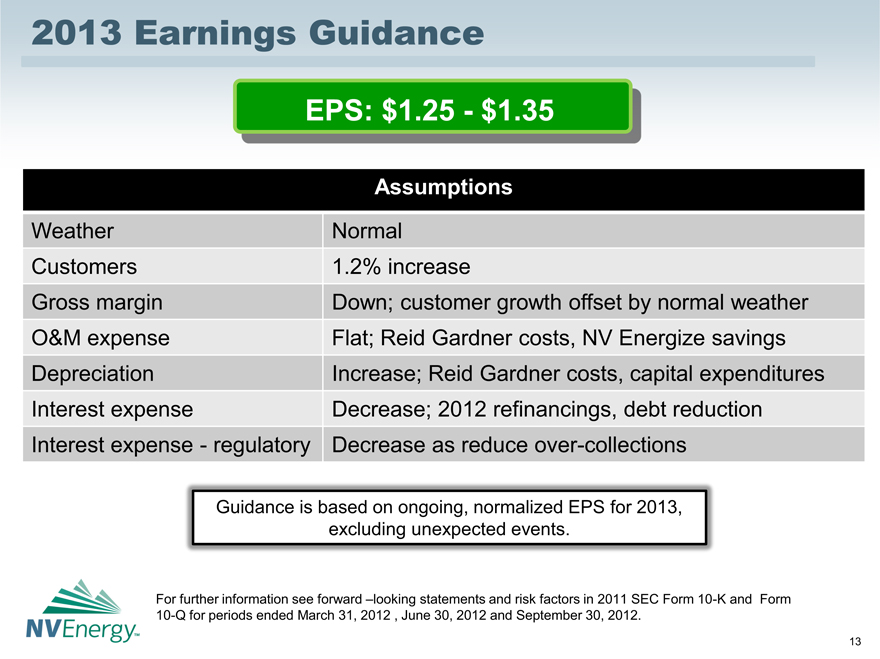 2013 Earnings Guidance
EPS: $1.25 - $1.35
Assumptions
Weather
Normal
Customers
1.2% increase
Gross margin
Down; customer growth offset by normal weather
O&M expense
Flat; Reid Gardner costs, NV Energize savings
Depreciation
Increase; Reid Gardner costs, capital expenditures
Interest expense
Decrease; 2012 refinancings, debt reduction
Interest expense - regulatory
Decrease as reduce over-collections
Guidance is based on ongoing, normalized EPS for 2013, excluding unexpected events.
For further information see forward –looking statements and risk factors in 2011 SEC Form 10-K and Form
10-Q for periods ended March 31, 2012 , June 30, 2012 and September 30, 2012.
13
NV Energy
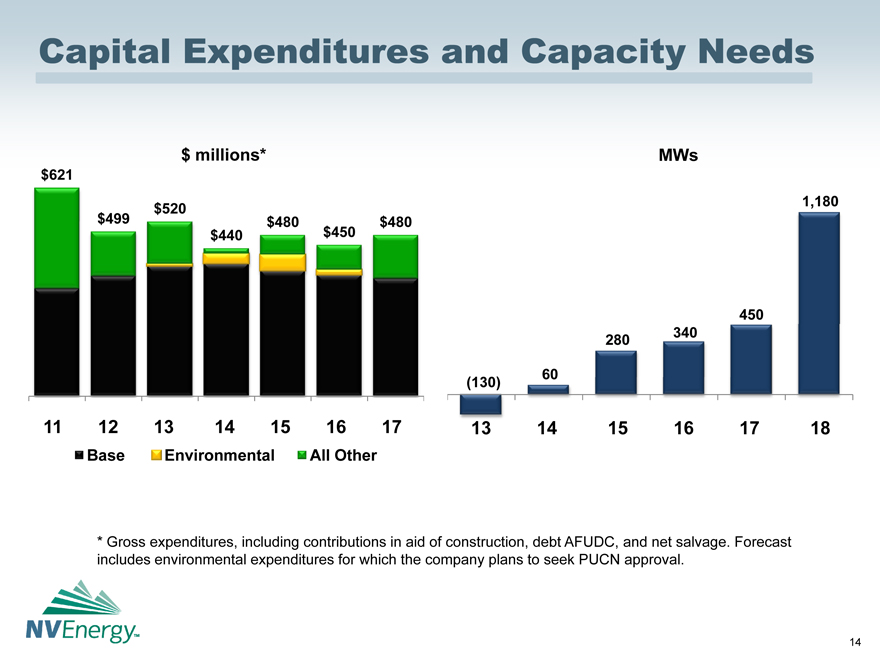
Capital Expenditures and Capacity Needs
$ millions*
$621
$520
$499
$480
$480
$440
$450
11
12
13
14
15
16
17
Base
Environmental
All Other
MWs
1,180
450
280
340
(130)
60
13
14
15
16
17
18
* Gross expenditures, including contributions in aid of construction, debt AFUDC, and net salvage. Forecast includes environmental expenditures for which the company plans to seek PUCN approval.
14
NV Energy
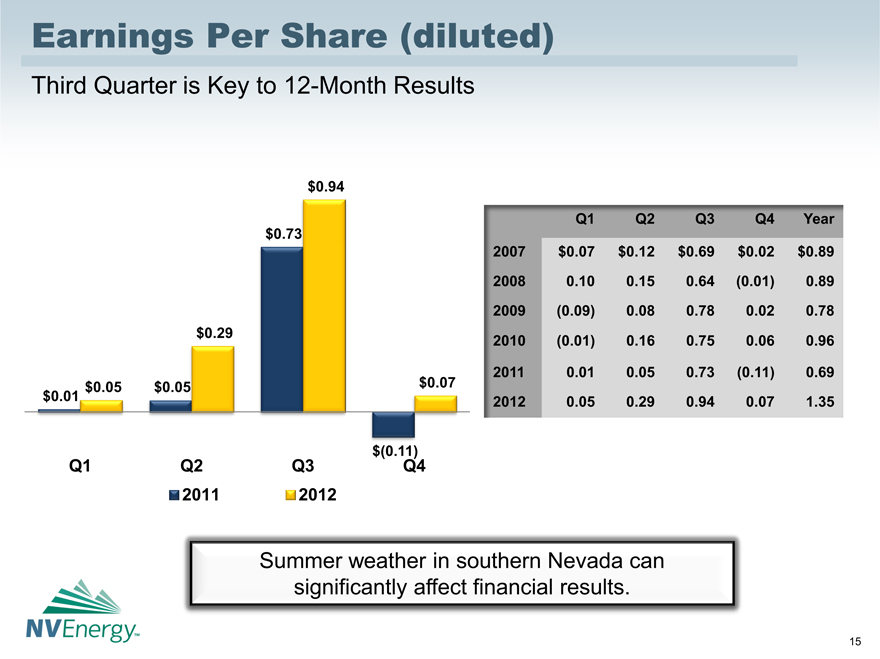 Earnings Per Share (diluted)
Third Quarter is Key to 12-Month Results
$0.94
$0.73
$0.29
$0.05
$0.05
$0.07
$0.01
$(0.11)
Q1
Q2
Q3
Q4
2011
2012
Q1
Q2
Q3
Q4
Year
2007
$0.07
$0.12
$0.69
$0.02
$0.89
2008
0.10
0.15
0.64
(0.01)
0.89
2009
(0.09)
0.08
0.78
0.02
0.78
2010
(0.01)
0.16
0.75
0.06
0.96
2011
0.01
0.05
0.73
(0.11)
0.69
2012
0.05
0.29
0.94
0.07
1.35
Summer weather in southern Nevada can significantly affect financial results.
15
NV Energy
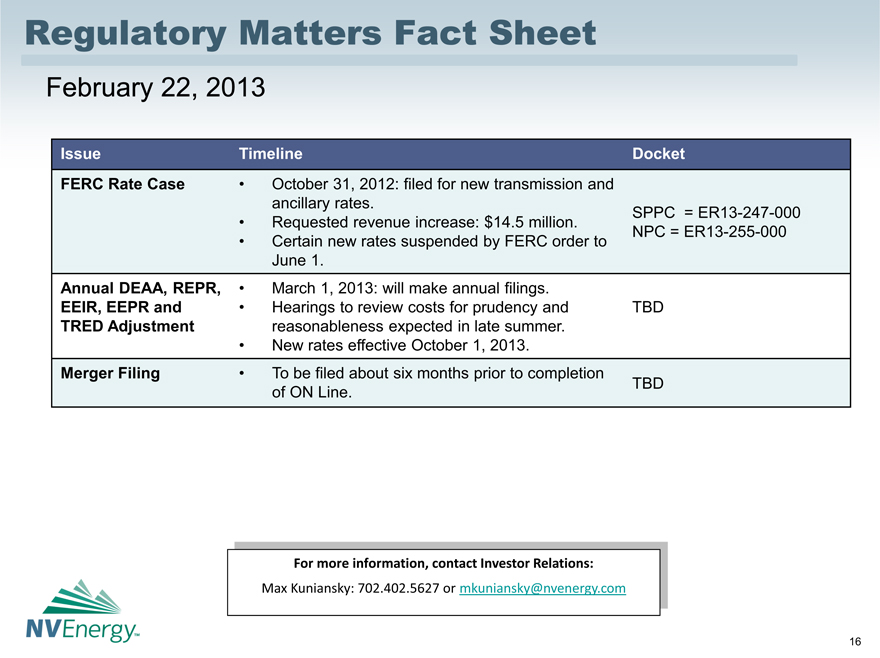 Regulatory Matters Fact Sheet
February 22, 2013
Issue
Timeline
Docket
FERC Rate Case
• October 31, 2012: filed for new transmission and ancillary rates.
SPPC = ER13-247-000
• Requested revenue increase: $14.5 million.
• Certain new rates suspended by FERC order to June 1.
NPC = ER13-255-000
Annual DEAA, REPR,.
• March 1, 2013: will make annual filings.
EEIR, EEPR and
• Hearings to review costs for prudency and
TBD
TRED Adjustment
reasonableness expected in late summer.
• New rates effective October 1, 2013.
Merger Filing
• To be filed about six months prior to completion of ON Line.
TBD
For more information, contact Investor Relations:
Max Kuniansky: 702.402.5627 or mkuniansky@nvenergy.com
16
NV Energy
NV ENERGY, INC.
CONSOLIDATED STATEMENTS OF COMPREHENSIVE INCOME
(Dollars in Thousands, Except Share Amounts)
| | | | | | | | | | | | | | | | |
| | | Three Months Ended
December 31, | | | Year Ended
December 31, | |
| | | 2012 | | | 2011 | | | 2012 | | | 2011 | |
OPERATING REVENUES | | $ | 600,571 | | | $ | 609,597 | | | $ | 2,979,177 | | | $ | 2,943,307 | |
| | | | |
OPERATING EXPENSES: | | | | | | | | | | | | | | | | |
Fuel for power generation | | | 164,445 | | | | 160,665 | | | | 565,381 | | | | 680,585 | |
Purchased power | | | 117,105 | | | | 115,202 | | | | 603,999 | | | | 633,874 | |
Gas purchased for resale | | | 27,861 | | | | 37,402 | | | | 74,352 | | | | 125,155 | |
Deferred energy | | | (76,443 | ) | | | (39,655 | ) | | | (106,728 | ) | | | (83,333 | ) |
Energy efficiency program costs | | | 20,068 | | | | 20,490 | | | | 96,677 | | | | 43,537 | |
Other operating expenses | | | 105,292 | | | | 102,996 | | | | 412,372 | | | | 411,115 | |
Maintenance | | | 33,535 | | | | 29,990 | | | | 109,725 | | | | 103,307 | |
Depreciation and amortization | | | 95,950 | | | | 91,492 | | | | 377,640 | | | | 357,937 | |
Taxes other than income | | | 16,239 | | | | 14,331 | | | | 60,696 | | | | 60,465 | |
| | | | | | | | | | | | | | | | |
Total Operating Expenses | | | 504,052 | | | | 532,913 | | | | 2,194,114 | | | | 2,332,642 | |
| | | | | | | | | | | | | | | | |
OPERATING INCOME | | | 96,519 | | | | 76,684 | | | | 785,063 | | | | 610,665 | |
| | | | |
OTHER INCOME (EXPENSE): | | | | | | | | | | | | | | | | |
Interest expense
(net of AFUDC-debt: $2,014, ($1,653), $7,493 and $8,718) | | | (73,322 | ) | | | (89,992 | ) | | | (299,484 | ) | | | (328,710 | ) |
Interest income (expense) on regulatory items | | | (1,518 | ) | | | (566 | ) | | | (7,721 | ) | | | (4,115 | ) |
AFUDC-equity | | | 2,480 | | | | (1,981 | ) | | | 9,146 | | | | 10,873 | |
Other income | | | 4,987 | | | | 4,207 | | | | 24,299 | | | | 10,558 | |
Other expense | | | (10,856 | ) | | | (25,324 | ) | | | (22,765 | ) | | | (48,924 | ) |
| | | | | | | | | | | | | | | | |
Total Other Income (Expense) | | | (78,229 | ) | | | (113,656 | ) | | | (296,525 | ) | | | (360,318 | ) |
| | | | | | | | | | | | | | | | |
Income (Loss) Before Income Tax Expense | | | 18,290 | | | | (36,972 | ) | | | 488,538 | | | | 250,347 | |
| | | | |
Income tax expense (benefit) | | | 1,126 | | | | (11,724 | ) | | | 166,592 | | | | 86,915 | |
| | | | | | | | | | | | | | | | |
| | | | |
NET INCOME (LOSS) | | | 17,164 | | | | (25,248 | ) | | | 321,946 | | | | 163,432 | |
| | | | |
Other comprehensive income (loss): | | | | | | | | | | | | | | | | |
Change in compensation retirement benefits liability and amortization (Net of taxes $1,084, $1,504, $838 and $202) | | | (2,062 | ) | | | (2,775 | ) | | | (1,598 | ) | | | (357 | ) |
Change in market value of risk management assets and liabilities (Net of taxes ($72), $369, $283 and $369) | | | 129 | | | | (686 | ) | | | (539 | ) | | | (686 | ) |
| | | | | | | | | | | | | | | | |
OTHER COMPREHENSIVE INCOME (LOSS) | | | (1,933 | ) | | | (3,461 | ) | | | (2,137 | ) | | | (1,043 | ) |
| | | | |
COMPREHENSIVE INCOME (LOSS) | | $ | 15,231 | | | $ | (28,709 | ) | | $ | 319,809 | | | $ | 162,389 | |
| | | | | | | | | | | | | | | | |
| | | | |
Amount per share basic and diluted | | | | | | | | | | | | | | | | |
Net income (loss) per share - basic | | $ | 0.07 | | | $ | (0.11 | ) | | $ | 1.37 | | | $ | 0.69 | |
Net income (loss) per share - diluted | | $ | 0.07 | | | $ | (0.11 | ) | | $ | 1.35 | | | $ | 0.69 | |
| | | | |
Weighted Average Shares of Common Stock Outstanding - basic | | | 235,404,790 | | | | 235,999,750 | | | | 235,840,558 | | | | 235,847,596 | |
| | | | | | | | | | | | | | | | |
Weighted Average Shares of Common Stock Outstanding - diluted | | | 237,987,115 | | | | 238,365,115 | | | | 237,883,881 | | | | 237,767,071 | |
| | | | | | | | | | | | | | | | |
Dividends Declared Per Share of Common Stock | | $ | 0.17 | | | $ | 0.13 | | | $ | 0.64 | | | $ | 0.49 | |
| | | | | | | | | | | | | | | | |
17
NV ENERGY, INC.
CONSOLIDATED BALANCE SHEETS
(Dollars in Thousands)
| | | | | | | | |
| | | December 31, | |
| | | 2012 | | | 2011 | |
ASSETS | | | | | | | | |
| | |
Current Assets: | | | | | | | | |
Cash and cash equivalents | | $ | 298,271 | | | $ | 145,944 | |
Accounts receivable less allowance for uncollectible accounts:
2012 - $8,748; 2011 - $8,150 | | | 373,099 | | | | 355,091 | |
Materials, supplies and fuel, at average cost | | | 138,337 | | | | 129,663 | |
Current income taxes receivable | | | — | | | | 82 | |
Deferred income taxes | | | 60,592 | | | | 104,958 | |
Other current assets | | | 40,750 | | | | 36,782 | |
| | | | | | | | |
Total Current Assets | | | 911,049 | | | | 772,520 | |
| | | | | | | | |
| | |
Utility Property: | | | | | | | | |
Plant in service | | | 12,031,053 | | | | 11,923,717 | |
Construction work-in-progress | | | 708,109 | | | | 487,427 | |
| | | | | | | | |
Total | | | 12,739,162 | | | | 12,411,144 | |
Less accumulated provision for depreciation | | | 3,313,188 | | | | 3,184,071 | |
| | | | | | | | |
Total Utility Property, Net | | | 9,425,974 | | | | 9,227,073 | |
| | |
Investments and other property, net | | | 56,660 | | | | 57,021 | |
| | |
Deferred Charges and Other Assets: | | | | | | | | |
Deferred energy | | | 87,072 | | | | 102,525 | |
Regulatory assets | | | 1,132,768 | | | | 1,218,128 | |
Regulatory asset for pension plans | | | 281,195 | | | | 215,656 | |
Other deferred charges and assets | | | 89,418 | | | | 74,206 | |
| | | | | | | | |
Total Deferred Charges and Other Assets | | | 1,590,453 | | | | 1,610,515 | |
| | | | | | | | |
| | |
TOTAL ASSETS | | $ | 11,984,136 | | | $ | 11,667,129 | |
| | | | | | | | |
(Continued)
18
NV ENERGY, INC.
CONSOLIDATED BALANCE SHEETS
(Dollars in Thousands)
| | | | | | | | |
| | | December 31, | |
| | | 2012 | | | 2011 | |
LIABILITIES AND SHAREHOLDERS’ EQUITY | | | | | | | | |
| | |
Current Liabilities: | | | | | | | | |
Current maturities of long-term debt | | $ | 356,283 | | | $ | 139,985 | |
Accounts payable | | | 332,245 | | | | 312,990 | |
Accrued expenses | | | 127,693 | | | | 128,144 | |
Deferred energy | | | 136,865 | | | | 245,164 | |
Other current liabilities | | | 66,221 | | | | 65,572 | |
| | | | | | | | |
Total Current Liabilities | | | 1,019,307 | | | | 891,855 | |
| | | | | | | | |
| | |
Long-term debt | | | 4,669,798 | | | | 5,008,931 | |
| | |
Commitments and Contingencies | | | | | | | | |
| | |
Deferred Credits and Other Liabilities: | | | | | | | | |
Deferred income taxes | | | 1,470,973 | | | | 1,338,511 | |
Deferred investment tax credit | | | 13,538 | | | | 16,140 | |
Accrued retirement benefits | | | 162,260 | | | | 92,351 | |
Regulatory liabilities | | | 550,687 | | | | 486,259 | |
Other deferred credits and liabilities | | | 540,202 | | | | 427,003 | |
| | | | | | | | |
Total Deferred Credits and Other Liabilities | | | 2,737,660 | | | | 2,360,264 | |
| | | | | | | | |
| | |
Shareholders’ Equity: | | | | | | | | |
Common stock, $1.00 par value; 350 million shares authorized; 235,999,750 issued for 2012 and 2011; 235,079,156 and 235,999,750 outstanding for 2012 and 2011, respectively | | | 236,000 | | | | 236,000 | |
Treasury stock at cost, 920,594 shares and 0 shares for 2012 and 2011, respectively | | | (16,804 | ) | | | — | |
Other paid-in capital | | | 2,712,943 | | | | 2,713,736 | |
Retained earnings | | | 635,303 | | | | 464,277 | |
Accumulated other comprehensive loss | | | (10,071 | ) | | | (7,934 | ) |
| | | | | | | | |
Total Shareholders’ Equity | | | 3,557,371 | | | | 3,406,079 | |
| | | | | | | | |
| | |
TOTAL LIABILITIES AND SHAREHOLDERS’ EQUITY | | $ | 11,984,136 | | | $ | 11,667,129 | |
| | | | | | | | |
(Concluded)
19
NV ENERGY, INC.
FREE CASH FLOW AND CONSOLIDATED OPERATING STATISTICS
(Unaudited)
FREE CASH FLOW
(dollars in thousands)
| | | | | | | | | | | | |
| | | Year Ended December 31, | |
| | | 2012 | | | 2011 | | | Change from
Prior Year | |
| | | |
Free Cash Flow* | | $ | 375,656 | | | $ | 37,862 | | | | N/A | |
| * | Free cash flow is a non-GAAP financial measure as defined by the SEC. See the “Non-GAAP Financial Measures” section for additional information and GAAP reconciliation. |
ELECTRIC SALES - MWh’s
(in thousands)
| | | | | | | | | | | | | | | | | | | | | | | | | | | | | | | | |
| | | Three Months Ended December 31, | | | Year Ended December 31, | |
| | | 2012 | | | 2011 | | | Change
from
Prior Year | | | Change in
Average
Customers | | | 2012 | | | 2011 | | | Change
from
Prior Year | | | Change in
Average
Customers | |
| | | | | | | | |
Residential | | | 2,025 | | | | 2,060 | | | | (1.7 | )% | | | 1.1 | % | | | 11,382 | | | | 10,754 | | | | 5.8 | % | | | 1.2 | % |
Commercial | | | 1,717 | | | | 1,733 | | | | (0.9 | )% | | | 1.1 | % | | | 7,430 | | | | 7,205 | | | | 3.1 | % | | | 0.5 | % |
Industrial | | | 2,532 | | | | 2,538 | | | | (0.2 | )% | | | 0.4 | % | | | 10,373 | | | | 10,218 | | | | 1.5 | % | | | (1.2 | )% |
| | | | | | | | | | | | | | | | | | | | | | | | | | | | | | | | |
TOTAL RETAIL | | | 6,274 | | | | 6,331 | | | | (0.9 | )% | | | 1.1 | % | | | 29,185 | | | | 28,177 | | | | 3.6 | % | | | 1.1 | % |
| | | | | | | | | | | | | | | | | | | | | | | | | | | | | | | | |
GAS SALES - Dth
(in thousands)
| | | | | | | | | | | | | | | | | | | | | | | | |
| | | Three Months Ended December 31, | | | Year Ended December 31, | |
| | | 2012 | | | 2011 | | | Change from
Prior Year | | | 2012 | | | 2011 | | | Change from
Prior Year | |
| | | | | | |
Residential | | | 2,912 | | | | 3,267 | | | | (10.9 | )% | | | 8,525 | | | | 9,585 | | | | (11.1 | )% |
Commercial | | | 1,259 | | | | 1,426 | | | | (11.7 | )% | | | 4,198 | | | | 4,654 | | | | (9.8 | )% |
Industrial | | | 446 | | | | 495 | | | | (9.9 | )% | | | 1,322 | | | | 1,542 | | | | (14.3 | )% |
| | | | | | | | | | | | | | | | | | | | | | | | |
TOTAL RETAIL | | | 4,617 | | | | 5,188 | | | | (11.0 | )% | | | 14,045 | | | | 15,781 | | | | (11.0 | )% |
| | | | | | | | | | | | | | | | | | | | | | | | |
ELECTRIC SOURCES - MWh’s
(in thousands)
| | | | | | | | | | | | | | | | | | | | | | | | |
| | | Three Months Ended December 31, | | | Year Ended December 31, | |
| | | 2012 | | | 2011 | | | Change from
Prior Year | | | 2012 | | | 2011 | | | Change from
Prior Year | |
Generated | | | 5,424 | | | | 5,011 | | | | 8.2 | % | | | 21,517 | | | | 19,488 | | | | 10.4 | % |
Purchased | | | 1,415 | | | | 1,864 | | | | (24.1 | )% | | | 9,861 | | | | 10,945 | | | | (9.9 | )% |
| | | | | | | | | | | | | | | | | | | | | | | | |
TOTAL | | | 6,839 | | | | 6,875 | | | | (0.5 | )% | | | 31,378 | | | | 30,433 | | | | 3.1 | % |
| | | | | | | | | | | | | | | | | | | | | | | | |
DEGREE DAYS
| | | | | | | | | | | | | | | | | | | | | | | | | | | | | | | | | | | | | | | | |
| | | Three Months Ended December 31, | | | Year Ended December 31, | |
| | | | | | | | | | | | % Change From | | | | | | | | | | | | % Change From | |
| | | 2012 | | | 2011 | | | Normal* | | | Prior Year | | | Normal | | | 2012 | | | 2011 | | | Normal* | | | Prior Year | | | Normal | |
SOUTH | | | | | | | | | | | | | | | | | | | | | | | | | | | | | | | | | | | | | | | | |
Heating | | | 673 | | | | 909 | | | | 845 | | | | (26.0 | )% | | | (20.4 | )% | | | 1,659 | | | | 2,040 | | | | 1,957 | | | | (18.7 | )% | | | (15.2 | )% |
Cooling | | | 261 | | | | 211 | | | | 186 | | | | 23.7 | % | | | 40.3 | % | | | 4,032 | | | | 3,540 | | | | 3,576 | | | | 13.9 | % | | | 12.8 | % |
| | | | | | | | | | |
NORTH | | | | | | | | | | | | | | | | | | | | | | | | | | | | | | | | | | | | | | | | |
Heating | | | 1,675 | | | | 1,911 | | | | 1,936 | | | | (12.3 | )% | | | (13.5 | )% | | | 4,352 | | | | 5,112 | | | | 4,948 | | | | (14.9 | )% | | | (12.0 | )% |
Cooling | | | 17 | | | | 4 | | | | 4 | | | | N/A | | | | N/A | | | | 1,272 | | | | 964 | | | | 882 | | | | 32.0 | % | | | 44.2 | % |
| * | Normal = 20-year average |
20
NEVADA POWER COMPANY
CONSOLIDATED STATEMENTS OF COMPREHENSIVE INCOME
(Dollars in Thousands)
| | | | | | | | | | | | | | | | |
| | | Three Months Ended
December 31, | | | Year Ended
December 31, | |
| | | 2012 | | | 2011 | | | 2012 | | | 2011 | |
| | | | |
OPERATING REVENUES | | $ | 394,076 | | | $ | 391,513 | | | $ | 2,145,241 | | | $ | 2,054,393 | |
| | | | |
OPERATING EXPENSES: | | | | | | | | | | | | | | | | |
Fuel for power generation | | | 121,888 | | | | 119,697 | | | | 407,687 | | | | 498,487 | |
Purchased power | | | 84,221 | | | | 77,519 | | | | 472,715 | | | | 477,226 | |
Deferred energy | | | (52,515 | ) | | | (15,026 | ) | | | (67,976 | ) | | | (16,300 | ) |
Energy efficiency program costs | | | 16,379 | | | | 16,841 | | | | 81,845 | | | | 37,292 | |
Other operating expenses | | | 67,236 | | | | 65,087 | | | | 267,720 | | | | 260,127 | |
Maintenance | | | 21,770 | | | | 19,198 | | | | 74,364 | | | | 64,320 | |
Depreciation and amortization | | | 68,625 | | | | 65,393 | | | | 269,721 | | | | 252,191 | |
Taxes other than income | | | 10,077 | | | | 9,045 | | | | 36,870 | | | | 37,254 | |
| | | | | | | | | | | | | | | | |
Total Operating Expenses | | | 337,681 | | | | 357,754 | | | | 1,542,946 | | | | 1,610,597 | |
| | | | | | | | | | | | | | | | |
OPERATING INCOME | | | 56,395 | | | | 33,759 | | | | 602,295 | | | | 443,796 | |
| | | | |
OTHER INCOME (EXPENSE): | | | | | | | | | | | | | | | | |
Interest expense
(net of AFUDC-debt: $1,416, ($2,192), $5,437 and $6,770) | | | (51,673 | ) | | | (58,917 | ) | | | (210,464 | ) | | | (221,953 | ) |
Interest income (expense) on regulatory items | | | (1,280 | ) | | | 43 | | | | (6,768 | ) | | | 722 | |
AFUDC-equity | | | 1,699 | | | | (2,681 | ) | | | 6,522 | | | | 8,298 | |
Other income | | | 3,221 | | | | 2,772 | | | | 17,418 | | | | 5,480 | |
Other expense | | | (5,990 | ) | | | (17,785 | ) | | | (13,152 | ) | | | (33,020 | ) |
| | | | | | | | | | | | | | | | |
Total Other Expense | | | (54,023 | ) | | | (76,568 | ) | | | (206,444 | ) | | | (240,473 | ) |
| | | | | | | | | | | | | | | | |
Income (Loss) Before Income Tax Expense | | | 2,372 | | | | (42,809 | ) | | | 395,851 | | | | 203,323 | |
| | | | |
Income tax expense (benefit) | | | 785 | | | | (13,744 | ) | | | 138,113 | | | | 70,737 | |
| | | | | | | | | | | | | | | | |
| | | | |
NET INCOME (LOSS) | | | 1,587 | | | | (29,065 | ) | | | 257,738 | | | | 132,586 | |
| | | | |
Other comprehensive income (loss): | | | | | | | | | | | | | | | | |
Change in compensation retirement benefits liability and amortization
(Net of taxes $311, $683, $208 and $129) | | | (581 | ) | | | (1,270 | ) | | | (389 | ) | | | (241 | ) |
| | | | | | | | | | | | | | | | |
| | | | |
COMPREHENSIVE INCOME (LOSS) | | $ | 1,006 | | | $ | (30,335 | ) | | $ | 257,349 | | | $ | 132,345 | |
| | | | | | | | | | | | | | | | |
21
NEVADA POWER COMPANY
OPERATING STATISTICS AND FINANCIAL HIGHLIGHTS
(unaudited)
ELECTRIC SALES - MWh’s
(in thousands)
| | | | | | | | | | | | | | | | | | | | | | | | | | | | | | | | |
| | | Three Months Ended December 31, | | | Year Ended December 31, | |
| | | 2012 | | | 2011 | | | Change
from
Prior Year | | | Change in
Average
Customers | | | 2012 | | | 2011 | | | Change
from
Prior Year | | | Change in
Average
Customers | |
| | | | | | | | |
Residential | | | 1,478 | | | | 1,502 | | | | (1.6 | )% | | | 1.3 | % | | | 9,098 | | | | 8,523 | | | | 6.7 | % | | | 1.4 | % |
Commercial | | | 1,020 | | | | 1,046 | | | | (2.5 | )% | | | 1.3 | % | | | 4,500 | | | | 4,353 | | | | 3.4 | % | | | 0.7 | % |
Industrial | | | 1,830 | | | | 1,860 | | | | (1.6 | )% | | | (0.1 | )% | | | 7,666 | | | | 7,653 | | | | 0.2 | % | | | (1.5 | )% |
| | | | | | | | | | | | | | | | | | | | | | | | | | | | | | | | |
TOTAL RETAIL | | | 4,328 | | | | 4,408 | | | | (1.8 | )% | | | 1.3 | % | | | 21,264 | | | | 20,529 | | | | 3.6 | % | | | 1.3 | % |
| | | | | | | | | | | | | | | | | | | | | | | | | | | | | | | | |
ELECTRIC SOURCES - MWh’s
(in thousands)
| | | | | | | | | | | | | | | | | | | | | | | | |
| | | Three Months Ended December 31, | | | Year Ended December 31, | |
| | | 2012 | | | 2011 | | | Change from
Prior Year | | | 2012 | | | 2011 | | | Change from
Prior Year | |
Generated | | | 4,231 | | | | 3,896 | | | | 8.6 | % | | | 16,495 | | | | 15,034 | | | | 9.7 | % |
Purchased | | | 391 | | | | 756 | | | | (48.3 | )% | | | 5,806 | | | | 6,577 | | | | (11.7 | )% |
| | | | | | | | | | | | | | | | | | | | | | | | |
TOTAL | | | 4,622 | | | | 4,652 | | | | (0.6 | )% | | | 22,301 | | | | 21,611 | | | | 3.2 | % |
| | | | | | | | | | | | | | | | | | | | | | | | |
22
SIERRA PACIFIC POWER COMPANY
CONSOLIDATED STATEMENTS OF COMPREHENSIVE INCOME
(Dollars in Thousands)
| | | | | | | | | | | | | | | | |
| | | Three Months Ended
December 31, | | | Year Ended
December 31, | |
| | | 2012 | | | 2011 | | | 2012 | | | 2011 | |
OPERATING REVENUES: | | | | | | | | | | | | | | | | |
Electric | | $ | 175,988 | | | $ | 170,955 | | | $ | 725,874 | | | $ | 716,417 | |
Gas | | | 30,503 | | | | 47,125 | | | | 108,046 | | | | 172,482 | |
| | | | | | | | | | | | | | | | |
Total Operating Revenues | | | 206,491 | | | | 218,080 | | | | 833,920 | | | | 888,899 | |
| | | | | | | | | | | | | | | | |
| | | | |
OPERATING EXPENSES: | | | | | | | | | | | | | | | | |
Fuel for power generation | | | 42,557 | | | | 40,968 | | | | 157,694 | | | | 182,098 | |
Purchased power | | | 32,884 | | | | 37,683 | | | | 131,284 | | | | 156,648 | |
Gas purchased for resale | | | 27,861 | | | | 37,402 | | | | 74,352 | | | | 125,155 | |
Deferral of energy - electric - net | | | (12,515 | ) | | | (19,521 | ) | | | (26,369 | ) | | | (65,445 | ) |
Deferral of energy - gas - net | | | (11,413 | ) | | | (5,108 | ) | | | (12,383 | ) | | | (1,588 | ) |
Energy efficiency program costs | | | 3,689 | | | | 3,649 | | | | 14,832 | | | | 6,245 | |
Other operating expenses | | | 35,478 | | | | 35,863 | | | | 139,692 | | | | 146,699 | |
Maintenance | | | 11,765 | | | | 10,792 | | | | 35,361 | | | | 38,987 | |
Depreciation and amortization | | | 27,325 | | | | 26,099 | | | | 107,919 | | | | 105,746 | |
Taxes other than income | | | 6,006 | | | | 5,246 | | | | 23,388 | | | | 22,921 | |
| | | | | | | | | | | | | | | | |
Total Operating Expenses | | | 163,637 | | | | 173,073 | | | | 645,770 | | | | 717,466 | |
| | | | | | | | | | | | | | | | |
OPERATING INCOME | | | 42,854 | | | | 45,007 | | | | 188,150 | | | | 171,433 | |
| | | | |
OTHER INCOME (EXPENSE): | | | | | | | | | | | | | | | | |
Interest expense (net of AFUDC-debt: $598, $539, $2,056 and $1,948) | | | (15,067 | ) | | | (16,854 | ) | | | (62,717 | ) | | | (67,435 | ) |
Interest expense on regulatory items | | | (239 | ) | | | (610 | ) | | | (954 | ) | | | (4,838 | ) |
AFUDC-equity | | | 781 | | | | 700 | | | | 2,624 | | | | 2,575 | |
Other income | | | 1,184 | | | | 1,296 | | | | 5,365 | | | | 3,972 | |
Other expense | | | (4,284 | ) | | | (7,221 | ) | | | (7,893 | ) | | | (14,624 | ) |
| | | | | | | | | | | | | | | | |
Total Other Income (Expense) | | | (17,625 | ) | | | (22,689 | ) | | | (63,575 | ) | | | (80,350 | ) |
| | | | | | | | | | | | | | | | |
Income Before Income Tax Expense | | | 25,229 | | | | 22,318 | | | | 124,575 | | | | 91,083 | |
| | | | |
Income tax expense | | | 6,625 | | | | 7,856 | | | | 40,221 | | | | 31,197 | |
| | | | | | | | | | | | | | | | |
| | | | |
NET INCOME | | | 18,604 | | | | 14,462 | | | | 84,354 | | | | 59,886 | |
| | | | |
Other comprehensive income (loss): | | | | | | | | | | | | | | | | |
Change in compensation retirement benefits liability and amortization
(Net of taxes $149, $556, $81 and ($645)) | | | (291 | ) | | | (995 | ) | | | (164 | ) | | | 1,236 | |
| | | | | | | | | | | | | | | | |
| | | | |
COMPREHENSIVE INCOME | | $ | 18,313 | | | $ | 13,467 | | | $ | 84,190 | | | $ | 61,122 | |
| | | | | | | | | | | | | | | | |
23
SIERRA PACIFIC POWER COMPANY
OPERATING STATISTICS AND FINANCIAL HIGHLIGHTS
(unaudited)
ELECTRIC SALES - MWh’s
(in thousands)
| | | | | | | | | | | | | | | | | | | | | | | | | | | | | | | | |
| | | Three Months Ended December 31, | | | Year Ended December 31, | |
| | | | | | | | | Change | | | Change in | | | | | | | | | Change | | | Change in | |
| | | | | | | | | from | | | Average | | | | | | | | | from | | | Average | |
| | | 2012 | | | 2011 | | | Prior Year | | | Customers | | | 2012 | | | 2011 | | | Prior Year | | | Customers | |
| | | | | | | | |
Residential | | | 547 | | | | 558 | | | | (2.0 | )% | | | 0.6 | % | | | 2,284 | | | | 2,231 | | | | 2.4 | % | | | 0.7 | % |
Commercial | | | 697 | | | | 687 | | | | 1.5 | % | | | 0.4 | % | | | 2,930 | | | | 2,852 | | | | 2.7 | % | | | — | % |
Industrial | | | 702 | | | | 678 | | | | 3.5 | % | | | 7.5 | % | | | 2,707 | | | | 2,565 | | | | 5.5 | % | | | 4.7 | % |
| | | | | | | | | | | | | | | | | | | | | | | | | | | | | | | | |
TOTAL RETAIL | | | 1,946 | | | | 1,923 | | | | 1.2 | % | | | 0.6 | % | | | 7,921 | | | | 7,648 | | | | 3.6 | % | | | 0.6 | % |
| | | | | | | | | | | | | | | | | | | | | | | | | | | | | | | | |
GAS SALES - Dth
(in thousands)
| | | | | | | | | | | | | | | | | | | | | | | | |
| | | Three Months Ended December 31, | | | Year Ended December 31, | |
| | | | | | | | | Change from | | | | | | | | | Change from | |
| | | 2012 | | | 2011 | | | Prior Year | | | 2012 | | | 2011 | | | Prior Year | |
| | | | | | |
Residential | | | 2,912 | | | | 3,267 | | | | (10.9 | )% | | | 8,525 | | | | 9,585 | | | | (11.1 | )% |
Commercial | | | 1,259 | | | | 1,426 | | | | (11.7 | )% | | | 4,198 | | | | 4,654 | | | | (9.8 | )% |
Industrial | | | 446 | | | | 495 | | | | (9.9 | )% | | | 1,322 | | | | 1,542 | | | | (14.3 | )% |
| | | | | | | | | | | | | | | | | | | | | | | | |
TOTAL RETAIL | | | 4,617 | | | | 5,188 | | | | (11.0 | )% | | | 14,045 | | | | 15,781 | | | | (11.0 | )% |
| | | | | | | | | | | | | | | | | | | | | | | | |
ELECTRIC SOURCES - MWh’s
(in thousands)
| | | | | | | | | | | | | | | | | | | | | | | | |
| | | Three Months Ended December 31, | | | Year Ended December 31, | |
| | | | | | | | | Change from | | | | | | | | | Change from | |
| | | 2012 | | | 2011 | | | Prior Year | | | 2012 | | | 2011 | | | Prior Year | |
Generated | | | 1,193 | | | | 1,115 | | | | 7.0 | % | | | 5,022 | | | | 4,454 | | | | 12.8 | % |
Purchased | | | 1,024 | | | | 1,108 | | | | (7.6 | )% | | | 4,055 | | | | 4,368 | | | | (7.2 | )% |
| | | | | | | | | | | | | | | | | | | | | | | | |
TOTAL | | | 2,217 | | | | 2,223 | | | | (0.3 | )% | | | 9,077 | | | | 8,822 | | | | 2.9 | % |
| | | | | | | | | | | | | | | | | | | | | | | | |
24
Non-GAAP Financial Measures
Free Cash Flow
“Free cash flow” meets the definition of a non-GAAP financial measure. NV Energy, Inc. defines free cash flow as net cash from operating activities less additions to utility plant (excluding AFUDC-equity). Since free cash flow is not a measure of liquidity calculated in accordance with GAAP, it should be considered in addition to, but not as a substitute for, the GAAP measure net cash from operating activities.
NV Energy, Inc. considers free cash flow to be a liquidity measure that provides useful information to management and investors about the amount of cash generated from operations after capital expenditures that may be available for increasing its common stock dividend payout ratio, strengthening its capital structure, and considering new investment opportunities.
NV Energy, Inc.’s definition of free cash flow is limited, in that it does not represent residual cash flows available for discretionary expenditures due to the fact that the measure does not deduct the payments required for debt service and other contractual obligations. The table below provides a reconciliation between GAAP net cash from operating activities and non-GAAP free cash flow (dollars in thousands).
| | | | | | | | | | | | |
| | | Year Ended December 31, | |
| | | 2012 | | | 2011 | | | Change from
Prior Year | |
| | | |
Net Cash from Operating Activities | | $ | 874,549 | | | $ | 658,378 | | | | 32.8 | % |
| | | |
Less Additions to Utility Plant (Excluding AFUDC-Equity) | | | (498,893 | ) | | | (620,516 | ) | | | (19.6 | )% |
| | | | | | | | | | | | |
| | | |
Free Cash Flow | | $ | 375,656 | | | $ | 37,862 | | | | N/A | |
| | | | | | | | | | | | |
Gross Margin
NV Energy, Inc. presents gross margin in order to aid the reader in determining how profitable the utilities’ electric and gas businesses are at the most fundamental level. Gross margin, which is a “non-GAAP financial measure” as defined in accordance with SEC rules, provides a measure of income available to support the other operating expenses of the business and is utilized by management in its analysis of its business.
NV Energy, Inc. believes presenting gross margin allows the reader to assess the impact of the utilities’ regulatory treatment and their overall regulatory environment on a consistent basis. Gross margin, as a percentage of revenue, is primarily impacted by the fluctuations in regulated utility electric and natural gas supply costs versus the fixed rates collected from utility customers. While these fluctuating costs impact gross margin as a percentage of revenue, they only impact gross margin amounts if the costs cannot be passed through to utility customers. Gross margin, which NV Energy, Inc. calculates as operating revenues less energy and energy efficiency program costs, provides a measure of income available to support the other operating expenses of the utilities. Gross margin changes are based primarily on the utilities’ general base rate adjustments (which are required to be filed by statute every three years). These non-GAAP measures should not be considered as substitutes for the GAAP measures. Reconciliations between GAAP operating income and gross margin are provided in the table below (dollars in thousands).
25
NV Energy, Inc.
Consolidated Gross Margin
| | | | | | | | | | | | | | | | | | | | | | | | |
| | | Three Months Ended December 31, | | | Year Ended December 31, | |
| | | 2012 | | | 2011 | | | Change from
Prior Year | | | 2012 | | | 2011 | | | Change from
Prior Year | |
Operating Revenues: | | $ | 600,571 | | | $ | 609,597 | | | | (1.5 | )% | | $ | 2,979,177 | | | $ | 2,943,307 | | | | 1.2 | % |
| | | | | | |
Energy Costs: | | | | | | | | | | | | | | | | | | | | | | | | |
Fuel for power generation | | | 164,445 | | | | 160,665 | | |
| 2.4
| %
| | | 565,381 | | | | 680,585 | | | | (16.9 | )% |
Purchased power | | | 117,105 | | | | 115,202 | | | | 1.7 | % | | | 603,999 | | | | 633,874 | | | | (4.7 | )% |
Gas purchased for resale | | | 27,861 | | | | 37,402 | | | | (25.5 | )% | | | 74,352 | | | | 125,155 | | | | (40.6 | )% |
Deferred energy | | | (76,443 | ) | | | (39,655 | ) | | | 92.8 | % | | | (106,728 | ) | | | (83,333 | ) | | | 28.1 | % |
Energy efficiency program costs | | | 20,068 | | | | 20,490 | | | | (2.1 | )% | | | 96,677 | | | | 43,537 | | | | 122.1 | % |
| | | | | | | | | | | | | | | | | | | | | | | | |
Total Costs | | $ | 253,036 | | | $ | 294,104 | | | | (14.0 | )% | | $ | 1,233,681 | | | $ | 1,399,818 | | | | (11.9 | )% |
| | | | | | | | | | | | | | | | | | | | | | | | |
| | | | | | |
Gross Margin | | $ | 347,535 | | | $ | 315,493 | | | | 10.2 | % | | $ | 1,745,496 | | | $ | 1,543,489 | | | | 13.1 | % |
| | | | | | | | | | | | | | | | | | | | | | | | |
| | | | | | |
Other operating expenses | | | 105,292 | | | | 102,996 | | | | | | | | 412,372 | | | | 411,115 | | | | | |
Maintenance | | | 33,535 | | | | 29,990 | | | | | | | | 109,725 | | | | 103,307 | | | | | |
Depreciation and amortization | | | 95,950 | | | | 91,492 | | | | | | | | 377,640 | | | | 357,937 | | | | | |
Taxes other than income | | | 16,239 | | | | 14,331 | | | | | | | | 60,696 | | | | 60,465 | | | | | |
| | | | | | | | | | | | | | | | | | | | | | | | |
| | | | | | |
Operating Income | | $ | 96,519 | | | $ | 76,684 | | | | 25.9 | % | | $ | 785,063 | | | $ | 610,665 | | | | 28.6 | % |
| | | | | | | | | | | | | | | | | | | | | | | | |
26