|
Earnings Report to the Financial Community Third Quarter 2013 Table of Contents Page No. Conference call slides 4 -7 Financial statements and operating statistics 8-15 Non-GAAP financial measures 16-17 Exhibit 99.2 |
|
Third Quarter 2013 Financial Results November 1, 2013 |
|
3 Safe Harbor Statement This presentation may contain forward-looking statements within the meaning of the Private Securities Litigation Reform Act of 1995 regarding the future performance of NV Energy, Inc. and its subsidiaries, Nevada Power Company and Sierra Pacific Power Company both doing business as NV Energy. Forward- looking statements include earnings guidance and estimates or forecasts of operating and financial metrics. These statements reflect current expectations of future conditions and events and as such are subject to a variety of risks, uncertainties and assumptions that could cause actual results to differ materially from current expectations. These risks, uncertainties and assumptions include, but are not limited to, the risk that the transaction between NV Energy, Inc. and MidAmerican will not be consummated due to a failure to satisfy the remaining closing conditions to the transaction, including the receipt of regulatory approvals from the PUCN and FERC on the terms and schedules contemplated by the parties; the risk that an event, effect or change occurs that gives rise to a termination of the definitive agreement entered into with MidAmerican; the risk that NV Energy Inc. or MidAmerican will be unable to perform certain obligations under the transaction agreements; the risk relating to unanticipated difficulties and/or expenditures relating to the transaction; the risk that legal proceedings against NV Energy, Inc. and others related to the definitive agreement entered into with MidAmerican will be successful; the risk that the proposed transaction disrupts current plans and operations and creates potential difficulties in employee retention; and the impact of delay or failure to complete the merger with MidAmerican on NV Energy, Inc.’s common stock price. Additional risks and uncertainties relating to NV Energy, Inc. include, but are not limited to, NV Energy Inc.'s ability to maintain access to the capital markets, NV Energy, Inc.'s ability to receive dividends from its subsidiaries, the financial performance of NV Energy, Inc.'s subsidiaries, particularly Nevada Power Company and Sierra Pacific Power Company both doing business as NV Energy, and the discretion of NV Energy, Inc.'s Board of Directors with respect to the payment of future dividends based on its periodic review of factors that ordinarily affect dividend policy, such as current and prospective financial condition, earnings and liquidity, prospective business conditions, regulatory factors, and dividend restrictions in NV Energy, Inc.'s and its subsidiaries' financing agreements. For Nevada Power Company and Sierra Pacific Power Company both doing business as NV Energy, these risks and uncertainties include, but are not limited to, future economic conditions, changes in the rate of industrial, commercial and residential growth in their service territories, their ability to procure sufficient renewable energy sources in each compliance year to satisfy the Nevada Renewable Energy Portfolio Standard, the effect of future or existing Nevada or federal laws or regulations affecting the electric industry, changes in environmental laws and regulations, construction risks, including but not limited to those associated with the ON Line project, their ability to maintain access to the capital markets for general corporate purposes and to finance construction projects, employee workforce factors, unseasonable weather, drought, wildfire and other natural phenomena, explosions, fires, accidents, vandalism, or mechanical breakdowns that may occur while operating and maintaining an electric and natural gas system, their ability to purchase sufficient fuel, natural gas and power to meet their power and natural gas demands for Sierra Pacific Power Company doing business as NV Energy, financial market conditions, and unfavorable rulings, penalties or findings in their rate or other cases. Further risks, uncertainties and assumptions that may cause actual results to differ from current expectations pertain to weather conditions, customer and sales growth, plant outages, operations and maintenance expense, depreciation and allowance for funds used during construction, interest rates and expense, cash flow and regulatory matters. Additional cautionary statements regarding other risk factors that could have an effect on the future performance of NV Energy, Inc., Nevada Power Company and Sierra Pacific Power Company both doing business as NV Energy are contained in their Annual Reports on Form 10-K for the year ended December 31, 2012, and Quarterly Reports on Form 10-Q for the period ended March 31, 2013 and June 30, 2013, as filed with the Securities and Exchange Commission. NV Energy, Inc., Nevada Power Company and Sierra Pacific Power Company both doing business as NV Energy undertake no obligation to release publicly the result of any revisions to these forward-looking statements that may be made to reflect events or circumstances after the date hereof or to reflect the occurrence of unanticipated events. IR Contacts Max Kuniansky Jessica Lucero Executive, Investor Relations Financial Analyst II (702) 402-5627 (702) 402-5612 mkuniansky@nvenergy.com jlucero@nvenergy.com |
|
4 Third Quarter Financial Results Major Drivers Q3 2013 vs. Q3 2012 NV Energy Consolidated Pre-Tax Total After Tax Gross Margin: ($ millions) EPS Impact Regulatory disallowance & reserves* $ (32.4) $ (0.09) Weather (20.4) (0.05) Customer growth & other 15.9 0.04 Other: Merger - related costs (7.9) (0.02) O&M expense (4.1) (0.01) Depreciation (2.3) (0.01) Gain on asset sale (2012) (5.5) (0.01) * Primarily related to base energy efficiency implementation rates |
|
5 Nine Month Financial Results Major Drivers 2013 vs. 2012 NV Energy Consolidated Pre-Tax Total After Tax Gross Margin: ($ millions) EPS Impact Regulatory disallowance & reserves* $ (32.4) $ (0.09) Weather (14.8) (0.04) Customer growth & other 28.8 0.08 Other: Merger - related costs (21.4) (0.06) O&M expense (0.4) - Depreciation (10.0) (0.02) * Primarily related to base energy efficiency implementation rates |
|
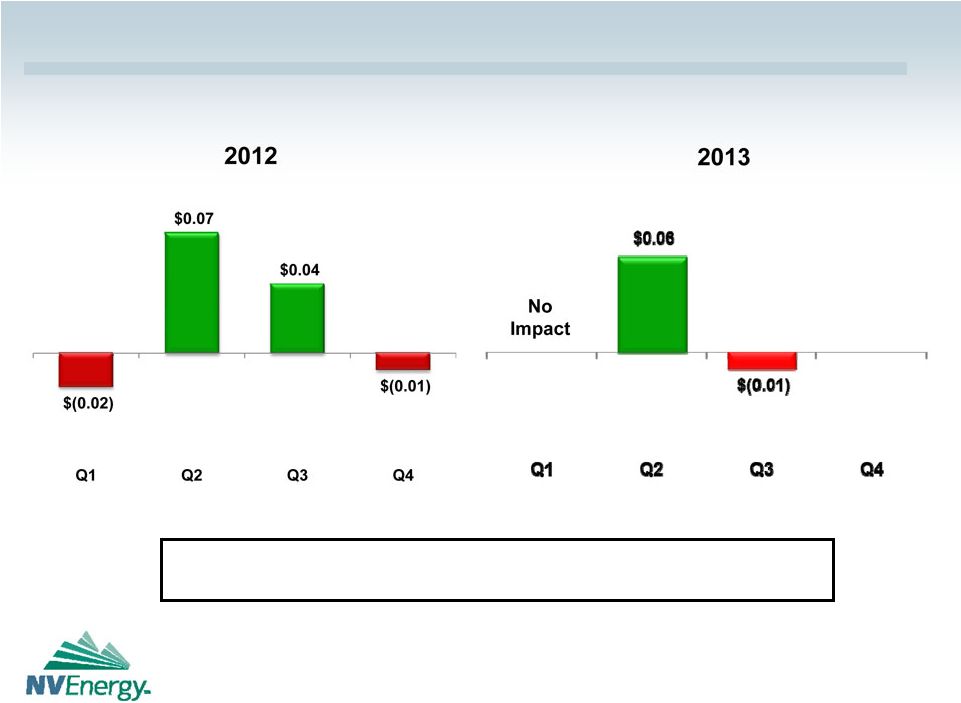
6 EPS Impact of Weather: Actual vs. Normal Weather was cooler than normal in southern Nevada in the third quarter of 2013, adversely impacting consolidated EPS by $0.01. Estimates; normal = 20-year average |
|
7 2013 Earnings Guidance EPS: $1.18- $1.22 Guidance is based on ongoing, normalized EPS for Q4 2013, excluding unexpected events. For further information see forward –looking statements and risk factors in 2012 SEC Form 10-K, March 31, 2013 Form 10-Q, and June 30, 2013 Form 10-Q. Assumptions Weather Q1-Q3 actual; Q4 normal Customers 1.2% increase Gross margin Q1-Q3 actual; Q4 forecast Regulatory disallowance and reserves, Q3 2013 Included Merger-related costs Included O&M expense Flat; Reid Gardner costs, NV Energize savings Depreciation Increase; Reid Gardner costs, capital expenditures Interest expense Decrease; 2012 refinancings, debt reduction Interest expense - regulatory Decrease due to under-collections |
NV ENERGY, INC.
CONSOLIDATED STATEMENTS OF COMPREHENSIVE INCOME
(Dollars in Thousands, Except Share Amounts)
(Unaudited)
| | | | | | | | | | | | | | | | |
| | | Three Months Ended
September 30, | | | Nine Months Ended
September 30, | |
| | | 2013 | | | 2012 | | | 2013 | | | 2012 | |
OPERATING REVENUES | | $ | 1,013,151 | | | $ | 1,026,488 | | | $ | 2,329,011 | | | $ | 2,378,606 | |
| | | | |
OPERATING EXPENSES: | | | | | | | | | | | | | | | | |
Fuel for power generation | | | 217,954 | | | | 171,316 | | | | 554,181 | | | | 400,936 | |
Purchased power | | | 205,970 | | | | 205,686 | | | | 498,141 | | | | 486,894 | |
Gas purchased for resale | | | 7,383 | | | | 5,382 | | | | 62,277 | | | | 46,491 | |
Deferred energy | | | (55,270 | ) | | | (29,036 | ) | | | (221,022 | ) | | | (30,285 | ) |
Energy efficiency program costs | | | 16,042 | | | | 32,584 | | | | 38,486 | | | | 76,609 | |
Regulatory disallowance | | | 17,335 | | | | — | | | | 17,335 | | | | — | |
Merger-related costs | | | 7,857 | | | | — | | | | 21,409 | | | | — | |
Other operating expenses | | | 106,068 | | | | 100,108 | | | | 317,538 | | | | 307,080 | |
Maintenance | | | 17,176 | | | | 19,014 | | | | 66,128 | | | | 76,190 | |
Depreciation and amortization | | | 96,801 | | | | 94,512 | | | | 291,687 | | | | 281,690 | |
Taxes other than income | | | 14,214 | | | | 15,682 | | | | 46,536 | | | | 44,457 | |
| | | | | | | | | | | | | | | | |
Total Operating Expenses | | | 651,530 | | | | 615,248 | | | | 1,692,696 | | | | 1,690,062 | |
| | | | | | | | | | | | | | | | |
OPERATING INCOME | | | 361,621 | | | | 411,240 | | | | 636,315 | | | | 688,544 | |
| | | | |
OTHER INCOME (EXPENSE): | | | | | | | | | | | | | | | | |
Interest expense
(net of AFUDC-debt: $1,957, $1,976, $5,770 and $5,479) | | | (74,438 | ) | | | (73,667 | ) | | | (221,305 | ) | | | (226,162 | ) |
Interest expense on regulatory items | | | (281 | ) | | | (2,024 | ) | | | (1,124 | ) | | | (6,203 | ) |
AFUDC-equity | | | 2,591 | | | | 2,415 | | | | 7,730 | | | | 6,666 | |
Other income | | | 3,239 | | | | 8,827 | | | | 10,872 | | | | 19,312 | |
Other expense | | | (3,829 | ) | | | (4,209 | ) | | | (12,116 | ) | | | (11,909 | ) |
| | | | | | | | | | | | | | | | |
Total Other Income (Expense) | | | (72,718 | ) | | | (68,658 | ) | | | (215,943 | ) | | | (218,296 | ) |
| | | | | | | | | | | | | | | | |
Income Before Income Tax Expense | | | 288,903 | | | | 342,582 | | | | 420,372 | | | | 470,248 | |
| | | | |
Income tax expense | | | 101,669 | | | | 119,412 | | | | 148,430 | | | | 165,466 | |
| | | | | | | | | | | | | | | | |
| | | | |
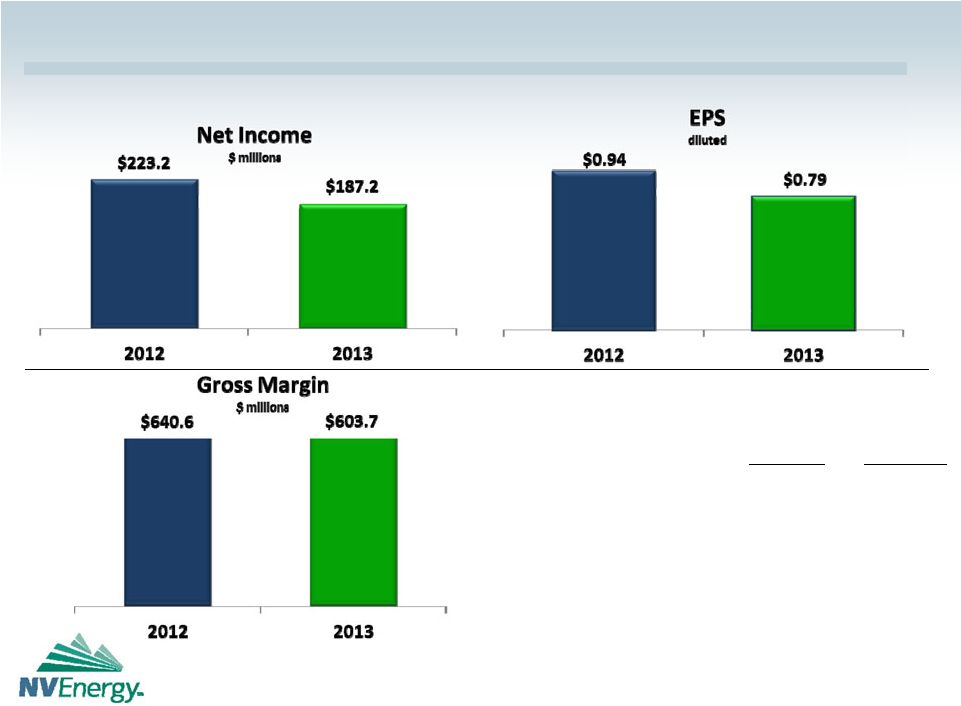
NET INCOME | | | 187,234 | | | | 223,170 | | | | 271,942 | | | | 304,782 | |
| | | | |
Other comprehensive income (loss) | | | | | | | | | | | | | | | | |
Change in compensation retirement benefits liability and amortization
(Net of taxes $(133), $(74), $(398) and $(246)) | | | 246 | | | | 155 | | | | 738 | | | | 464 | |
Change in market value of risk management assets and liabilities
(Net of taxes $(154), $91, $(261) and $355) | | | (11 | ) | | | (193 | ) | | | 485 | | | | (668 | ) |
Unrealized net gain/(loss) on investment
(Net of taxes $(49), $0, $(18) and $0) | | | 98 | | | | — | | | | 33 | | | | — | |
| | | | | | | | | | | | | | | | |
OTHER COMPREHENSIVE INCOME(LOSS) | | | 333 | | | | (38 | ) | | | 1,256 | | | | (204 | ) |
| | | | |
COMPREHENSIVE INCOME | | $ | 187,567 | | | $ | 223,132 | | | $ | 273,198 | | | $ | 304,578 | |
| | | | | | | | | | | | | | | | |
Amount per share basic and diluted | | | | | | | | | | | | | | | | |
Net income per share—basic | | $ | 0.79 | | | $ | 0.95 | | | $ | 1.16 | | | $ | 1.29 | |
Net income per share—diluted | | $ | 0.79 | | | $ | 0.94 | | | $ | 1.15 | | | $ | 1.28 | |
Weighted Average Shares of Common Stock Outstanding—basic | | | 235,578,310 | | | | 235,961,402 | | | | 235,421,933 | | | | 235,986,874 | |
| | | | | | | | | | | | | | | | |
Weighted Average Shares of Common Stock Outstanding—diluted | | | 237,605,514 | | | | 238,121,732 | | | | 237,339,039 | | | | 237,850,530 | |
| | | | | | | | | | | | | | | | |
Dividends Declared Per Share of Common Stock | | $ | 0.19 | | | $ | 0.17 | | | $ | 0.57 | | | $ | 0.47 | |
| | | | | | | | | | | | | | | | |
8
NV ENERGY, INC.
CONSOLIDATED BALANCE SHEETS
(Dollars in Thousands, Except Share Amounts)
(Unaudited)
| | | | | | | | |
| | | September 30,
2013 | | | December 31,
2012 | |
ASSETS | | | | | | | | |
| | |
Current Assets: | | | | | | | | |
Cash and cash equivalents | | $ | 373,026 | | | $ | 298,271 | |
Accounts receivable less allowance for uncollectible accounts:
2013—$9,643; 2012—$8,748 | | | 483,178 | | | | 373,099 | |
Materials, supplies and fuel, at average cost | | | 121,699 | | | | 138,337 | |
Deferred energy costs | | | 82,235 | | | | — | |
Deferred income taxes | | | 120,186 | | | | 60,592 | |
Other current assets | | | 49,041 | | | | 40,750 | |
| | | | | | | | |
Total Current Assets | | | 1,229,365 | | | | 911,049 | |
| | | | | | | | |
| | |
Utility Property: | | | | | | | | |
Plant in service | | | 12,195,312 | | | | 12,031,053 | |
Construction work-in-progress | | | 821,430 | | | | 708,109 | |
| | | | | | | | |
Total | | | 13,016,742 | | | | 12,739,162 | |
Less accumulated provision for depreciation | | | 3,526,824 | | | | 3,313,188 | |
| | | | | | | | |
Total Utility Property, Net | | | 9,489,918 | | | | 9,425,974 | |
| | |
Investments and other property, net | | | 65,354 | | | | 56,660 | |
| | |
Deferred Charges and Other Assets: | | | | | | | | |
Deferred energy | | | 85,055 | | | | 87,072 | |
Regulatory assets | | | 1,048,204 | | | | 1,132,768 | |
Regulatory asset for pension plans | | | 270,565 | | | | 281,195 | |
Other deferred charges and assets | | | 76,705 | | | | 89,418 | |
| | | | | | | | |
Total Deferred Charges and Other Assets | | | 1,480,529 | | | | 1,590,453 | |
| | | | | | | | |
| | |
TOTAL ASSETS | | $ | 12,265,166 | | | $ | 11,984,136 | |
| | | | | | | | |
(Continued)
9
NV ENERGY, INC.
CONSOLIDATED BALANCE SHEETS
(Dollars in Thousands, Except Share Amounts)
(Unaudited)
| | | | | | | | |
| | | September 30,
2013 | | | December 31,
2012 | |
LIABILITIES AND SHAREHOLDERS’ EQUITY | | | | | | | | |
| | |
Current Liabilities: | | | | | | | | |
Current maturities of long-term debt | | $ | 129,457 | | | $ | 356,283 | |
Accounts payable | | | 316,681 | | | | 332,245 | |
Accrued expenses | | | 104,781 | | | | 127,693 | |
Deferred energy | | | — | | | | 136,865 | |
Other current liabilities | | | 88,299 | | | | 66,221 | |
| | | | | | | | |
Total Current Liabilities | | | 639,218 | | | | 1,019,307 | |
| | | | | | | | |
| | |
Long-term debt | | | 4,791,809 | | | | 4,669,798 | |
| | |
Commitments and Contingencies | | | | | | | | |
| | |
Deferred Credits and Other Liabilities: | | | | | | | | |
Deferred income taxes | | | 1,680,896 | | | | 1,470,973 | |
Deferred investment tax credit | | | 11,623 | | | | 13,538 | |
Accrued retirement benefits | | | 144,696 | | | | 162,260 | |
Regulatory liabilities | | | 631,368 | | | | 550,687 | |
Other deferred credits and liabilities | | | 656,963 | | | | 540,202 | |
| | | | | | | | |
Total Deferred Credits and Other Liabilities | | | 3,125,546 | | | | 2,737,660 | |
| | | | | | | | |
| | |
Shareholders’ Equity: | | | | | | | | |
Common stock, $1.00 par value; 350 million shares authorized; 235,999,750 issued for 2013 and 2012; 235,581,074 and 235,079,156 outstanding for 2013 and 2012, respectively | | | 236,000 | | | | 236,000 | |
Treasury stock at cost, 418,675 shares and 920,594 shares for 2013 and 2012, respectively | | | (7,898 | ) | | | (16,804 | ) |
Other paid-in capital | | | 2,716,311 | | | | 2,712,943 | |
Retained earnings | | | 772,995 | | | | 635,303 | |
Accumulated other comprehensive loss | | | (8,815 | ) | | | (10,071 | ) |
| | | | | | | | |
Total Shareholders’ Equity | | | 3,708,593 | | | | 3,557,371 | |
| | | | | | | | |
| | |
TOTAL LIABILITIES AND SHAREHOLDERS’ EQUITY | | $ | 12,265,166 | | | $ | 11,984,136 | |
| | | | | | | | |
(Concluded)
10
NV ENERGY, INC.
FREE CASH FLOW AND CONSOLIDATED OPERATING STATISTICS
(Unaudited)
FREE CASH FLOW
(dollars in thousands)
| | | | | | | | | | | | |
| | | Nine Months Ended September 30, | |
| | | 2013 | | | 2012 | | | Change from
Prior Year | |
Free Cash Flow* | | $ | 285,908 | | | $ | 256,404 | | | | 11.5 | % |
| * | Free cash flow is a non-GAAP financial measure as defined by the SEC. See the “Non-GAAP Financial Measures” section for additional information and GAAP reconciliation. |
ELECTRIC SALES—MWh’s
(in thousands)
| | | | | | | | | | | | | | | | | | | | | | | | | | | | | | | | |
| | | Three Months Ended September 30, | | | Nine Months Ended September 30, | |
| | | 2013 | | | 2012 | | | Change from
Prior Year | | | Change in
Average
Customers | | | 2013 | | | 2012 | | | Change from
Prior Year | | | Change in
Average
Customers | |
Residential | | | 4,298 | | | | 4,419 | | | | (2.7 | )% | | | 1.1 | % | | | 9,386 | | | | 9,356 | | | | 0.3 | % | | | 0.9 | % |
Commercial | | | 2,180 | | | | 2,223 | | | | (1.9 | )% | | | 1.9 | % | | | 5,691 | | | | 5,713 | | | | (0.4 | )% | | | 1.8 | % |
Industrial | | | 2,779 | | | | 2,831 | | | | (1.8 | )% | | | (0.6 | )% | | | 7,848 | | | | 7,841 | | | | 0.1 | % | | | 0.1 | % |
| | | | | | | | | | | | | | | | | | | | | | | | | | | | | | | | |
TOTAL RETAIL | | | 9,257 | | | | 9,473 | | | | (2.3 | )% | | | 1.2 | % | | | 22,925 | | | | 22,910 | | | | 0.1 | % | | | 1.0 | % |
| | | | | | | | | | | | | | | | | | | | | | | | | | | | | | | | |
GAS SALES—Dth
(in thousands)
| | | | | | | | | | | | | | | | | | | | | | | | |
| | | Three Months Ended September 30, | | | Nine Months Ended September 30, | |
| | | 2013 | | | 2012 | | | Change from
Prior Year | | | 2013 | | | 2012 | | | Change from
Prior Year | |
Residential | | | 698 | | | | 642 | | | | 8.7 | % | | | 6,039 | | | | 5,613 | | | | 7.6 | % |
Commercial | | | 400 | | | | 374 | | | | 7.0 | % | | | 3,086 | | | | 2,939 | | | | 5.0 | % |
Industrial | | | 190 | | | | 153 | | | | 24.2 | % | | | 986 | | | | 876 | | | | 12.6 | % |
| | | | | | | | | | | | | | | | | | | | | | | | |
TOTAL RETAIL | | | 1,288 | | | | 1,169 | | | | 10.2 | % | | | 10,111 | | | | 9,428 | | | | 7.2 | % |
| | | | | | | | | | | | | | | | | | | | | | | | |
ELECTRIC SOURCES—MWh’s
(in thousands)
| | | | | | | | | | | | | | | | | | | | | | | | |
| | | Three Months Ended September 30, | | | Nine Months Ended September 30, | |
| | | 2013 | | | 2012 | | | Change from
Prior Year | | | 2013 | | | 2012 | | | Change from
Prior Year | |
Generated | | | 6,822 | | | | 6,617 | | | | 3.1 | % | | | 17,139 | | | | 16,093 | | | | 6.5 | % |
Purchased | | | 2,993 | | | | 3,363 | | | | (11.0 | )% | | | 7,394 | | | | 8,446 | | | | (12.5 | )% |
| | | | | | | | | | | | | | | | | | | | | | | | |
TOTAL | | | 9,815 | | | | 9,980 | | | | (1.7 | )% | | | 24,533 | | | | 24,539 | | | | — | % |
| | | | | | | | | | | | | | | | | | | | | | | | |
DEGREE DAYS
| | | | | | | | | | | | | | | | | | | | | | | | | | | | | | | | | | | | | | | | |
| | | Three Months Ended September 30, | | | Nine Months Ended September 30, | |
| | | | | | | | | | | | % Change From | | | | | | | | | | | | % Change From | |
| | | 2013 | | | 2012 | | | Normal* | | | Prior Year | | | Normal | | | 2013 | | | 2012 | | | Normal* | | | Prior Year | | | Normal | |
SOUTH | | | | | | | | | | | | | | | | | | | | | | | | | | | | | | | | | | | | | | | | |
Heating | | | — | | | | — | | | | — | | | | N/A | | | | N/A | | | | 1,084 | | | | 986 | | | | 1,105 | | | | 9.9 | % | | | (1.9 | )% |
Cooling | | | 2,164 | | | | 2,313 | | | | 2,222 | | | | (6.4 | )% | | | (2.6 | )% | | | 3,658 | | | | 3,771 | | | | 3,419 | | | | (3.0 | )% | | | 7.0 | % |
NORTH | | | | | | | | | | | | | | | | | | | | | | | | | | | | | | | | | | | | | | | | |
Heating | | | 85 | | | | 1 | | | | 66 | | | | N/A | | | | 28.8 | % | | | 2,859 | | | | 2,677 | | | | 3,014 | | | | 6.8 | % | | | (5.1 | )% |
Cooling | | | 914 | | | | 1,020 | | | | 725 | | | | (10.4 | )% | | | 26.1 | % | | | 1,177 | | | | 1,255 | | | | 905 | | | | (6.2 | )% | | | 30.1 | % |
| * | Normal = 20-year average |
11
NEVADA POWER COMPANY
CONSOLIDATED STATEMENTS OF COMPREHENSIVE INCOME
(Dollars in Thousands)
(Unaudited)
| | | | | | | | | | | | | | | | |
| | | Three Months Ended
September 30, | | | Nine Months Ended
September 30, | |
| | | 2013 | | | 2012 | | | 2013 | | | 2012 | |
OPERATING REVENUES | | $ | 786,142 | | | $ | 802,334 | | | $ | 1,695,129 | | | $ | 1,751,165 | |
| | | | |
OPERATING EXPENSES: | | | | | | | | | | | | | | | | |
Fuel for power generation | | | 163,127 | | | | 123,992 | | | | 412,904 | | | | 285,799 | |
Purchased power | | | 172,582 | | | | 171,687 | | | | 383,386 | | | | 388,494 | |
Deferred energy | | | (45,381 | ) | | | (22,685 | ) | | | (154,484 | ) | | | (15,461 | ) |
Energy efficiency program costs | | | 13,998 | | | | 28,492 | | | | 32,807 | | | | 65,466 | |
Regulatory disallowance | | | 11,866 | | | | — | | | | 11,866 | | | | — | |
Merger-related costs | | | 5,620 | | | | — | | | | 14,487 | | | | — | |
Other operating expenses | | | 70,844 | | | | 65,372 | | | | 208,336 | | | | 200,484 | |
Maintenance | | | 11,208 | | | | 12,533 | | | | 45,172 | | | | 52,594 | |
Depreciation and amortization | | | 68,849 | | | | 66,975 | | | | 207,915 | | | | 201,096 | |
Taxes other than income | | | 8,213 | | | | 9,743 | | | | 27,804 | | | | 26,793 | |
| | | | | | | | | | | | | | | | |
Total Operating Expenses | | | 480,926 | | | | 456,109 | | | | 1,190,193 | | | | 1,205,265 | |
| | | | | | | | | | | | | | | | |
OPERATING INCOME | | | 305,216 | | | | 346,225 | | | | 504,936 | | | | 545,900 | |
| | | | |
OTHER INCOME (EXPENSE): | | | | | | | | | | | | | | | | |
Interest expense
(net of AFUDC-debt: $1,520, $1,528, $4,763 and $4,021) | | | (52,856 | ) | | | (51,784 | ) | | | (155,758 | ) | | | (158,791 | ) |
Interest income (expense) on regulatory items | | | (194 | ) | | | (1,623 | ) | | | (1,177 | ) | | | (5,488 | ) |
AFUDC-equity | | | 1,959 | | | | 1,833 | | | | 6,151 | | | | 4,823 | |
Other income | | | 1,948 | | | | 7,096 | | | | 5,330 | | | | 14,197 | |
Other expense | | | (1,966 | ) | | | (2,823 | ) | | | (6,200 | ) | | | (7,162 | ) |
| | | | | | | | | | | | | | | | |
Total Other Income (Expense) | | | (51,109 | ) | | | (47,301 | ) | | | (151,654 | ) | | | (152,421 | ) |
| | | | | | | | | | | | | | | | |
Income Before Income Tax Expense | | | 254,107 | | | | 298,924 | | | | 353,282 | | | | 393,479 | |
| | | | |
Income tax expense | | | 89,665 | | | | 103,754 | | | | 124,730 | | | | 137,328 | |
| | | | | | | | | | | | | | | | |
| | | | |
NET INCOME | | | 164,442 | | | | 195,170 | | | | 228,552 | | | | 256,151 | |
| | | | |
Other comprehensive income | | | | | | | | | | | | | | | | |
Change in compensation retirement benefits liability and amortization
(Net of taxes $(52), $(33), $(156) and $(103)) | | | 96 | | | | 65 | | | | 290 | | | | 192 | |
| | | | | | | | | | | | | | | | |
| | | | |
COMPREHENSIVE INCOME | | $ | 164,538 | | | $ | 195,235 | | | $ | 228,842 | | | $ | 256,343 | |
| | | | | | | | | | | | | | | | |
12
NEVADA POWER COMPANY
CONSOLIDATED OPERATING STATISTICS
(Unaudited)
ELECTRIC SALES—MWh’s
(in thousands)
| | | | | | | | | | | | | | | | | | | | | | | | | | | | | | | | |
| | | Three Months Ended September 30, | | | Nine Months Ended September 30, | |
| | | 2013 | | | 2012 | | | Change from
Prior Year | | | Change in
Average
Customers | | | 2013 | | | 2012 | | | Change from
Prior Year | | | Change in
Average
Customers | |
Residential | | | 3,627 | | | | 3,752 | | | | (3.3 | )% | | | 1.3 | % | | | 7,592 | | | | 7,619 | | | | (0.4 | )% | | | 1.0 | % |
Commercial | | | 1,329 | | | | 1,374 | | | | (3.3 | )% | | | 1.7 | % | | | 3,423 | | | | 3,480 | | | | (1.6 | )% | | | 1.6 | % |
Industrial | | | 2,078 | | | | 2,145 | | | | (3.1 | )% | | | (0.6 | )% | | | 5,756 | | | | 5,836 | | | | (1.4 | )% | | | (0.1 | )% |
| | | | | | | | | | | | | | | | | | | | | | | | | | | | | | | | |
TOTAL RETAIL | | | 7,034 | | | | 7,271 | | | | (3.3 | )% | | | 1.3 | % | | | 16,771 | | | | 16,935 | | | | (1.0 | )% | | | 1.0 | % |
| | | | | | | | | | | | | | | | | | | | | | | | | | | | | | | | |
ELECTRIC SOURCES—MWh’s
(in thousands)
| | | | | | | | | | | | | | | | | | | | | | | | |
| | | Three Months Ended September 30, | | | Nine Months Ended September 30, | |
| | | 2013 | | | 2012 | | | Change from
Prior Year | | | 2013 | | | 2012 | | | Change from
Prior Year | |
Generated | | | 5,242 | | | | 5,105 | | | | 2.7 | % | | | 13,310 | | | | 12,264 | | | | 8.5 | % |
Purchased | | | 2,077 | | | | 2,392 | | | | (13.2 | )% | | | 4,225 | | | | 5,415 | | | | (22.0 | )% |
| | | | | | | | | | | | | | | | | | | | | | | | |
TOTAL | | | 7,319 | | | | 7,497 | | | | (2.4 | )% | | | 17,535 | | | | 17,679 | | | | (0.8 | )% |
| | | | | | | | | | | | | | | | | | | | | | | | |
13
SIERRA PACIFIC POWER COMPANY
CONSOLIDATED STATEMENTS OF COMPREHENSIVE INCOME
(Dollars in Thousands)
(Unaudited)
| | | | | | | | | | | | | | | | |
| | | Three Months Ended
September 30, | | | Nine Months Ended
September 30, | |
| | | 2013 | | | 2012 | | | 2013 | | | 2012 | |
OPERATING REVENUES: | | | | | | | | | | | | | | | | |
Electric | | $ | 213,463 | | | $ | 212,073 | | | $ | 560,392 | | | $ | 549,886 | |
Gas | | | 13,543 | | | | 12,077 | | | | 73,480 | | | | 77,543 | |
| | | | | | | | | | | | | | | | |
Total Operating Revenues | | | 227,006 | | | | 224,150 | | | | 633,872 | | | | 627,429 | |
| | | | | | | | | | | | | | | | |
| | | | |
OPERATING EXPENSES: | | | | | | | | | | | | | | | | |
Fuel for power generation | | | 54,827 | | | | 47,324 | | | | 141,277 | | | | 115,137 | |
Purchased power | | | 33,388 | | | | 33,999 | | | | 114,755 | | | | 98,400 | |
Gas purchased for resale | | | 7,383 | | | | 5,382 | | | | 62,277 | | | | 46,491 | |
Deferral of energy—electric—net | | | (7,925 | ) | | | (5,498 | ) | | | (44,223 | ) | | | (13,854 | ) |
Deferral of energy—gas—net | | | (1,964 | ) | | | (853 | ) | | | (22,315 | ) | | | (970 | ) |
Energy efficiency program costs | | | 2,044 | | | | 4,092 | | | | 5,679 | | | | 11,143 | |
Regulatory disallowance | | | 5,469 | | | | — | | | | 5,469 | | | | — | |
Merger-related costs | | | 2,008 | | | | — | | | | 5,528 | | | | — | |
Other operating expenses | | | 34,394 | | | | 34,128 | | | | 106,455 | | | | 104,214 | |
Maintenance | | | 5,968 | | | | 6,481 | | | | 20,956 | | | | 23,596 | |
Depreciation and amortization | | | 27,952 | | | | 27,537 | | | | 83,772 | | | | 80,594 | |
Taxes other than income | | | 5,944 | | | | 5,894 | | | | 18,414 | | | | 17,382 | |
| | | | | | | | | | | | | | | | |
Total Operating Expenses | | | 169,488 | | | | 158,486 | | | | 498,044 | | | | 482,133 | |
| | | | | | | | | | | | | | | | |
OPERATING INCOME | | | 57,518 | | | | 65,664 | | | | 135,828 | | | | 145,296 | |
| | | | |
OTHER INCOME (EXPENSE): | | | | | | | | | | | | | | | | |
Interest expense
(net of AFUDC-debt: $437, $448, $1,007 and $1,458) | | | (15,122 | ) | | | (15,298 | ) | | | (46,020 | ) | | | (47,650 | ) |
Interest expense on regulatory items | | | (87 | ) | | | (401 | ) | | | 53 | | | | (715 | ) |
AFUDC-equity | | | 632 | | | | 582 | | | | 1,579 | | | | 1,843 | |
Other income | | | 983 | | | | 1,399 | | | | 4,641 | | | | 4,181 | |
Other expense | | | (982 | ) | | | (998 | ) | | | (3,803 | ) | | | (3,609 | ) |
| | | | | | | | | | | | | | | | |
Total Other Income (Expense) | | | (14,576 | ) | | | (14,716 | ) | | | (43,550 | ) | | | (45,950 | ) |
| | | | | | | | | | | | | | | | |
Income Before Income Tax Expense | | | 42,942 | | | | 50,948 | | | | 92,278 | | | | 99,346 | |
| | | | |
Income tax expense | | | 13,691 | | | | 16,521 | | | | 30,347 | | | | 33,596 | |
| | | | | | | | | | | | | | | | |
| | | | |
NET INCOME | | | 29,251 | | | | 34,427 | | | | 61,931 | | | | 65,750 | |
| | | | |
Other comprehensive income | | | | | | | | | | | | | | | | |
Change in compensation retirement benefits liability and amortization
(Net of taxes $(32), $(22), $(95) and $(68)) | | | 59 | | | | 42 | | | | 176 | | | | 127 | |
| | | | | | | | | | | | | | | | |
| | | | |
COMPREHENSIVE INCOME | | $ | 29,310 | | | $ | 34,469 | | | $ | 62,107 | | | $ | 65,877 | |
| | | | | | | | | | | | | | | | |
14
SIERRA PACIFIC POWER COMPANY
CONSOLIDATED OPERATING STATISTICS
(Unaudited)
ELECTRIC SALES—MWh’s
(in thousands)
| | | | | | | | | | | | | | | | | | | | | | | | | | | | | | | | |
| | | Three Months Ended September 30, | | | Nine Months Ended September 30, | |
| | | 2013 | | | 2012 | | | Change from
Prior Year | | | Change in
Average
Customers | | | 2013 | | | 2012 | | | Change from
Prior Year | | | Change in
Average
Customers | |
Residential | | | 671 | | | | 667 | | | | 0.6 | % | | | 0.7 | % | | | 1,794 | | | | 1,737 | | | | 3.3 | % | | | 0.7 | % |
Commercial | | | 851 | | | | 849 | | | | 0.2 | % | | | 2.5 | % | | | 2,268 | | | | 2,233 | | | | 1.6 | % | | | 2.1 | % |
Industrial | | | 701 | | | | 686 | | | | 2.2 | % | | | — | % | | | 2,092 | | | | 2,005 | | | | 4.3 | % | | | 1.8 | % |
| | | | | | | | | | | | | | | | | | | | | | | | | | | | | | | | |
TOTAL RETAIL | | | 2,223 | | | | 2,202 | | | | 1.0 | % | | | 1.0 | % | | | 6,154 | | | | 5,975 | | | | 3.0 | % | | | 0.9 | % |
| | | | | | | | | | | | | | | | | | | | | | | | | | | | | | | | |
GAS SALES—Dth
(in thousands)
| | | | | | | | | | | | | | | | | | | | | | | | |
| | | Three Months Ended September 30, | | | Nine Months Ended September 30, | |
| | | 2013 | | | 2012 | | | Change from
Prior Year | | | 2013 | | | 2012 | | | Change from
Prior Year | |
Residential | | | 698 | | | | 642 | | | | 8.7 | % | | | 6,039 | | | | 5,613 | | | | 7.6 | % |
Commercial | | | 400 | | | | 374 | | | | 7.0 | % | | | 3,086 | | | | 2,939 | | | | 5.0 | % |
Industrial | | | 190 | | | | 153 | | | | 24.2 | % | | | 986 | | | | 876 | | | | 12.6 | % |
| | | | | | | | | | | | | | | | | | | | | | | | |
TOTAL RETAIL | | | 1,288 | | | | 1,169 | | | | 10.2 | % | | | 10,111 | | | | 9,428 | | | | 7.2 | % |
| | | | | | | | | | | | | | | | | | | | | | | | |
ELECTRIC SOURCES—MWh’s
(in thousands)
| | | | | | | | | | | | | | | | | | | | | | | | |
| | | Three Months Ended September 30, | | | Nine Months Ended September 30, | |
| | | 2013 | | | 2012 | | | Change from
Prior Year | | | 2013 | | | 2012 | | | Change from
Prior Year | |
Generated | | | 1,580 | | | | 1,512 | | | | 4.5 | % | | | 3,829 | | | | 3,829 | | | | — | % |
Purchased | | | 916 | | | | 971 | | | | (5.7 | )% | | | 3,169 | | | | 3,031 | | | | 4.6 | % |
| | | | | | | | | | | | | | | | | | | | | | | | |
TOTAL | | | 2,496 | | | | 2,483 | | | | 0.5 | % | | | 6,998 | | | | 6,860 | | | | 2.0 | % |
| | | | | | | | | | | | | | | | | | | | | | | | |
15
Non-GAAP Financial Measures
Free Cash Flow
“Free cash flow” meets the definition of a non-GAAP financial measure. NV Energy, Inc. defines free cash flow as net cash from operating activities less additions to utility plant (excluding AFUDC-equity). Since free cash flow is not a measure of liquidity calculated in accordance with GAAP, it should be considered in addition to, but not as a substitute for, the GAAP measure net cash from operating activities.
NV Energy, Inc. considers free cash flow to be a liquidity measure that provides useful information to management and investors about the amount of cash generated from operations after capital expenditures that may be available for increasing its common stock dividend payout ratio, strengthening its capital structure, and considering new investment opportunities.
NV Energy, Inc.‘s definition of free cash flow is limited, in that it does not represent residual cash flows available for discretionary expenditures due to the fact that the measure does not deduct the payments required for debt service and other contractual obligations. The table below provides a reconciliation between GAAP net cash from operating activities and non-GAAP free cash flow (dollars in thousands).
| | | | | | | | | | | | |
| | | Nine Months Ended September 30, | |
| | | 2013 | | | 2012 | | | Change from
Prior Year | |
Net Cash from Operating Activities | | $ | 553,706 | | | $ | 644,194 | | | | (14.0 | )% |
Less Additions to Utility Plant (Excluding AFUDC-Equity) | | | (267,798 | ) | | | (387,790 | ) | | | (30.9 | )% |
| | | | | | | | | | | | |
Free Cash Flow | | $ | 285,908 | | | $ | 256,404 | | | | 11.5 | % |
| | | | | | | | | | | | |
Gross Margin
NV Energy, Inc. presents gross margin in order to aid the reader in determining how profitable Nevada Power Company’s and Sierra Pacific Power Company’s (collectively, “the Utilities”) electric and gas businesses are at the most fundamental level. Gross margin, which is a “non-GAAP financial measure” as defined in accordance with SEC rules, provides a measure of income available to support the other operating expenses of the business and is utilized by management in its analysis of its business.
NV Energy, Inc. believes presenting gross margin allows the reader to assess the impact of the Utilities’ regulatory treatment and their overall regulatory environment on a consistent basis. Gross margin, as a percentage of revenue, is primarily impacted by the fluctuations in regulated utility electric and natural gas supply costs versus the fixed rates collected from utility customers. While these fluctuating costs impact gross margin as a percentage of revenue, they only impact gross margin amounts if the costs cannot be passed through to utility customers. Gross margin, which NV Energy, Inc. calculates as operating revenues less energy costs, energy efficiency program costs and regulatory disallowances, provides a measure of income available to support the other operating expenses of the Utilities. Gross margin changes are based primarily on the Utilities’ general base rate adjustments and regulatory disallowances (which are required to be filed by statute every three years). These non-GAAP measures should not be considered as substitutes for the GAAP measures. Reconciliations between GAAP operating income and gross margin are provided in the table below.
16
NV Energy, Inc.
Consolidated Gross Margin
(dollars in thousands)
| | | | | | | | | | | | | | | | | | | | | | | | |
| | | Three Months Ended September 30, | | | Nine Months Ended September 30, | |
| | | 2013 | | | 2012 | | | Change from
Prior Year | | | 2013 | | | 2012 | | | Change from
Prior Year | |
Operating Revenues: | | $ | 1,013,151 | | | $ | 1,026,488 | | | | (1.3 | )% | | $ | 2,329,011 | | | $ | 2,378,606 | | | | (2.1 | )% |
| | | |
Energy Costs: | | | | | | | | | | | | |
Fuel for power generation | | | 217,954 | | | | 171,316 | | | | 27.2 | % | | | 554,181 | | | | 400,936 | | | | 38.2 | % |
Purchased power | | | 205,970 | | | | 205,686 | | | | 0.1 | % | | | 498,141 | | | | 486,894 | | | | 2.3 | % |
Gas purchased for resale | | | 7,383 | | | | 5,382 | | | | 37.2 | % | | | 62,277 | | | | 46,491 | | | | 34.0 | % |
Deferred energy | | | (55,270 | ) | | | (29,036 | ) | | | 90.3 | % | | | (221,022 | ) | | | (30,285 | ) | | | 629.8 | % |
Energy efficiency program costs | | | 16,042 | | | | 32,584 | | | | (50.8 | )% | | | 38,486 | | | | 76,609 | | | | (49.8 | )% |
Regulatory disallowance | | | 17,335 | | | | — | | | | N/A | | | | 17,335 | | | | — | | | | N/A | |
| | | | | | | | | | | | | | | | | | | | | | | | |
Total Costs | | $ | 409,414 | | | $ | 385,932 | | | | 6.1 | % | | $ | 949,398 | | | $ | 980,645 | | | | (3.2 | )% |
| | | | | | | | | | | | | | | | | | | | | | | | |
| | | | | | |
Gross Margin | | $ | 603,737 | | | $ | 640,556 | | | | (5.7 | )% | | $ | 1,379,613 | | | $ | 1,397,961 | | | | (1.3 | )% |
| | | | | | | | | | | | | | | | | | | | | | | | |
| | | | | | |
Merger-related costs | | | 7,857 | | | | — | | | | | | | | 21,409 | | | | — | | | | | |
Other operating expenses | | | 106,068 | | | | 100,108 | | | | | | | | 317,538 | | | | 307,080 | | | | | |
Maintenance | | | 17,176 | | | | 19,014 | | | | | | | | 66,128 | | | | 76,190 | | | | | |
Depreciation and amortization | | | 96,801 | | | | 94,512 | | | | | | | | 291,687 | | | | 281,690 | | | | | |
Taxes other than income | | | 14,214 | | | | 15,682 | | | | | | | | 46,536 | | | | 44,457 | | | | | |
| | | | | | | | | | | | | | | | | | | | | | | | |
| | | | | | |
Operating Income | | $ | 361,621 | | | $ | 411,240 | | | | (12.1 | )% | | $ | 636,315 | | | $ | 688,544 | | | | (7.6 | )% |
| | | | | | | | | | | | | | | | | | | | | | | | |
17