UNITED STATES
SECURITIES AND EXCHANGE COMMISSION
Washington, D.C. 20549
___________________________________________________________
Form 10-K
| |
☑ | ANNUAL REPORT PURSUANT TO SECTION 13 OR 15(d) OF THE SECURITIES EXCHANGE ACT OF 1934 |
For the Fiscal Year Ended December 31, 2023
| |
☐ | TRANSITION REPORT PURSUANT TO SECTION 13 OR 15(d) OF THE SECURITIES EXCHANGE ACT OF 1934 |
For the transition period from to
Commission File Number 001-08454
ACCO Brands Corporation
(Exact Name of Registrant as Specified in Its Charter)
| | |
Delaware | | 36-2704017 |
(State or Other Jurisdiction of Incorporation or Organization) | | (I.R.S. Employer Identification Number) |
Four Corporate Drive
Lake Zurich, Illinois 60047
(Address of Registrant’s Principal Executive Office, Including Zip Code)
(847) 541-9500
(Registrant’s Telephone Number, Including Area Code)
Securities registered pursuant to Section 12(b) of the Act:
| | |
Title of Each Class | Trading Symbol(s) | Name of Each Exchange on Which Registered |
Common Stock, par value $.01 per share | ACCO | NYSE |
Securities registered pursuant to Section 12(g) of the Act: None
Indicate by check mark if the registrant is a well-known seasoned issuer, as defined in Rule 405 of the Securities Act. Yes ☑ No ☐
Indicate by check mark if the registrant is not required to file reports pursuant to Section 13 or Section 15(d) of the Act. Yes ☐ No ☑
Indicate by check mark whether the registrant: (1) has filed all reports required to be filed by Section 13 or 15(d) of the Securities Exchange Act of 1934 during the preceding 12 months (or for such shorter period that the registrant was required to file such reports), and (2) has been subject to such filing requirements for the past 90 days. Yes ☑ No ☐
Indicate by check mark whether the registrant has submitted electronically every Interactive Data File required to be submitted pursuant to Rule 405 of Regulation S-T during the preceding 12 months (or for such shorter period that the registrant was required to submit such files). Yes ☑ No ☐
Indicate by check mark whether the registrant is a large accelerated filer, an accelerated filer, a non-accelerated filer, a smaller reporting company, or an emerging growth company. See the definitions of "large accelerated filer," "accelerated filer," "smaller reporting company," and "emerging growth company" in Rule 12b-2 of the Exchange Act.
| | | |
Large accelerated filer | ☐ | Accelerated filer | ☑ |
Non-accelerated filer | ☐ | Smaller reporting company | ☐ |
| | Emerging growth company | ☐ |
If an emerging growth company, indicate by check mark if the registrant has elected not to use the extended transition period for complying with any new or revised financial accounting standards provided pursuant to Section 13(a) of the Exchange Act. ☐
Indicate by check mark whether the registrant has filed a report on and attestation to its management’s assessment of the effectiveness of its internal control over financial reporting under Section 404(b) of the Sarbanes-Oxley Act (15 U.S.C. 7262(b)) by the registered public accounting firm that prepared or issued its audit report. ☑
If securities are registered pursuant to Section 12(b) of the Act, indicate by check mark whether the financial statements of the registrant included in the filing reflect the correction of an error to previously issued financial statements. ☐
Indicate by check mark whether any of those error corrections are restatements that required a recovery analysis of incentive-based compensation received by any of the registrant's executive officers during the relevant recovery period pursuant to §240.10D-1(b). ☐
Indicate by check mark whether the registrant is a shell company (as defined in Rule 12b-2 of the Act). Yes ☐ No ☑
As of June 30, 2023, the aggregate market value of the shares of Common Stock held by non-affiliates of the registrant was approximately $479.8 million. As of February 15, 2024, the registrant had outstanding 94,928,320 shares of Common Stock.
DOCUMENTS INCORPORATED BY REFERENCE
Portions of the registrant’s definitive proxy statement to be issued in connection with registrant’s annual stockholders' meeting expected to be held on May 21, 2024, are incorporated by reference into Part III of this report.
Cautionary Statement Regarding Forward-Looking Statements
Certain statements contained in this Annual Report on Form 10-K other than statements of historical fact, particularly those anticipating future financial performance, business prospects, growth, strategies, business operations and similar matters, results of operations, liquidity and financial condition, and those relating to cost reductions and anticipated pre-tax savings and restructuring costs are "forward-looking statements" within the meaning of the Private Securities Litigation Reform Act of 1995. These statements are based on the beliefs and assumptions of management based on information available to us at the time such statements are made. These statements, which are generally identifiable by the use of the words "will," "believe," "expect," "intend," "anticipate," "estimate," "forecast," "project," "plan," and similar expressions, are subject to certain risks and uncertainties, are made as of the date hereof, and we undertake no duty or obligation to update them. Forward-looking statements are subject to the occurrence of events outside the Company's control and actual results and the timing of events may differ materially from those suggested or implied by such forward-looking statements due to numerous factors that involve substantial known and unknown risks and uncertainties. Investors and others are cautioned not to place undue reliance on forward-looking statements when deciding whether to buy, sell or hold the Company's securities.
Some of the factors that could affect our results or cause our plans, actions and results to differ materially from those expressed in the forward-looking statements contained in this Annual Report Form 10-K are detailed in "Part I, Item 1. Business" and "Part I, Item 1A. Risk Factors" as well as in "Part II, Item 7. Management’s Discussion and Analysis of Financial Condition and Results of Operations" of this Annual Report on Form 10-K and from time to time in our other Securities and Exchange Commission (the "SEC") filings.
Website Access to Securities and Exchange Commission Reports
The Company’s website can be found at www.accobrands.com. The information contained on or connected to our website is not incorporated by reference into this Annual Report on Form 10-K and should not be considered part of this or any other report we file with the SEC. The Company makes available free of charge on or through its website its Annual Reports on Form 10-K, Quarterly Reports on Form 10-Q, Current Reports on Form 8-K, and amendments to those reports filed or furnished pursuant to Section 13(a) or 15(d) of the Securities Exchange Act of 1934 as soon as practicable after the Company files them with, or furnishes them to, the SEC. We also make available the following documents, among others, on our Internet website: the Audit Committee Charter; the Compensation and Human Capital Committee Charter; the Nominating, Governance and Sustainability Committee Charter; our Corporate Governance Principles; and our Code of Conduct. The Company’s Code of Conduct applies to all of our directors, officers (including the Chief Executive Officer, Chief Financial Officer and Principal Accounting Officer) and employees. You may obtain a copy of any of the foregoing documents, free of charge, if you submit a written request to ACCO Brands Corporation, Four Corporate Drive, Lake Zurich, IL 60047, Attn: Investor Relations.
TABLE OF CONTENTS
PART I
ITEM 1. BUSINESS
As used in this Annual Report on Form 10-K for the fiscal year ended December 31, 2023, the terms "ACCO Brands," "ACCO," the "Company," "we," "us," and "our" refer to ACCO Brands Corporation, a Delaware corporation incorporated in 2005, and its consolidated domestic and international subsidiaries.
For a description of certain factors that may have had, or may in the future have, a significant impact on our business, results of operations or financial condition, see "Part I. Item 1A. Risk Factors" of this report.
Overview of the Company
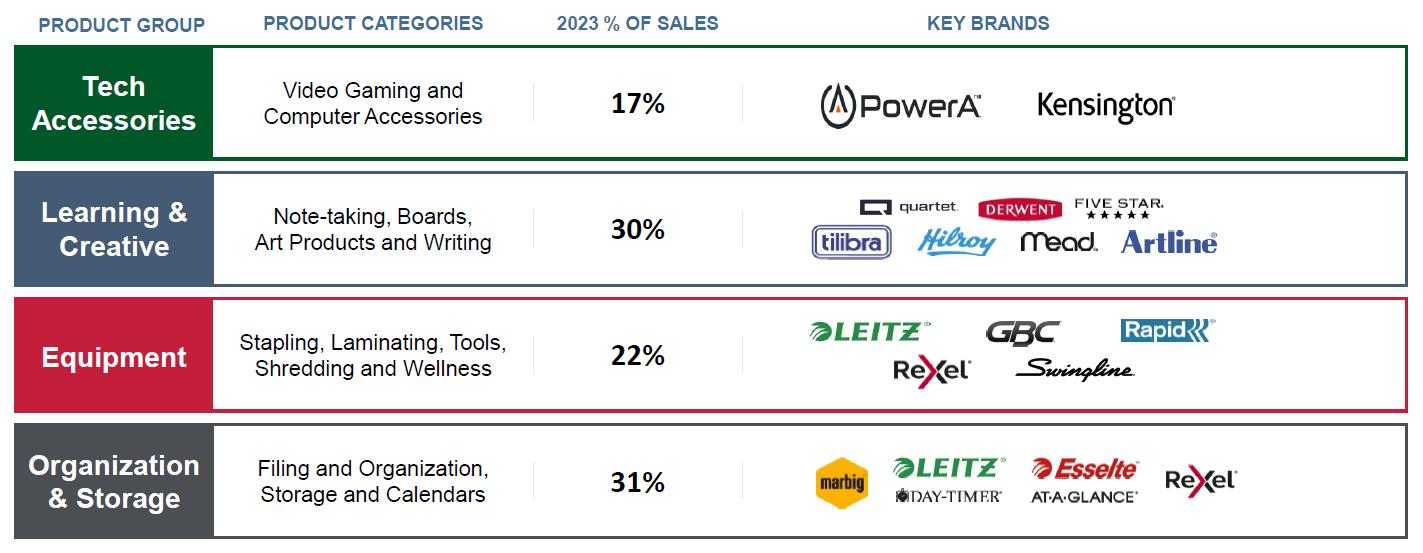
ACCO Brands is a leading global consumer, technology and business branded products company, providing well-known brands and innovative product solutions used in schools, homes and at work. Approximately 77 percent of our 2023 net sales came from brands that are in the No. 1 or No. 2 position in the product categories in which we compete. Our top 12 brands represented approximately $1.3 billion of our 2023 net sales. Through our strategy, we have expanded into higher growth product categories, while increasing our sales mix to higher growth channels including retail and mass merchants, e-tailers, and technology specialists. We have an experienced management team with a proven ability to grow brands, integrate acquisitions, manage seasonal businesses, run lean organizations and navigate challenging environments. Our products are sold primarily in the U.S., Europe, Australia, Canada, Brazil and Mexico.
Note: Artline® in Australia/N.Z. only
Business Strategy
The Company is currently executing a strategy that will enable us to achieve long-term sustainable organic growth and profit improvement. Our key strategic priorities are to:
•Drive sustainable organic sales growth by focusing on innovative new product development, strengthening our brand positioning, and increasing our presence in faster growing sales channels.
•Use our strong brand recognition and supply chain expertise to expand relationships with new and existing customers.
•Improve operating margins by introducing higher margin product offerings, rationalizing product assortments, improving operating productivity, and leveraging SG&A costs.
•Manage declining product categories which remain important profit and cash generators.
Through this strategy we have diversified and expanded our product portfolio, focusing on innovative consumer and end-user products for use in schools, homes and businesses, with an emphasis on faster growing product categories. Our Technology Accessories product group, which consists of our gaming and computer accessories, is one such higher growth category where we seek opportunities to expand sales globally.
Historically we have made acquisitions that have meaningfully expanded our portfolio of well-known brands, enhanced our competitive position from both a product and channel perspective, added scale to our operations and increased our geographic presence. More recently, we have prioritized the use of our operating cash flow to invest in internal capital projects to support our long-term growth, fund our quarterly dividend and reduce our debt. We will also consider opportunistic acquisitions that focus on growing product categories, including adjacencies.
Operating Segments
ACCO Brands has three operating business segments based in different geographic regions: North America, EMEA, and International. Each business segment designs, markets, sources, manufactures, and sells recognized consumer, technology and business branded products used in schools, homes and at work. Product designs are tailored to end-user preferences in each geographic region, and where possible, leverage common engineering, design, and sourcing.
| | | | | | |
Sales Percentage by Operating Segment | | 2023 | | 2022 | | 2021 |
ACCO Brands North America | | 48% | | 51% | | 51% |
ACCO Brands EMEA | | 30% | | 30% | | 33% |
ACCO Brands International | | 22% | | 19% | | 16% |
| | 100% | | 100% | | 100% |
For more information on our operating business segments see "Note 17. Information on Business Segments" to the consolidated financial statements contained in Part II, Item 8. of this report.
Beginning on January 1, 2024, the Company will reorganize its previously reported North America, EMEA and International operating segments into two operating segments, Americas and International. The Americas will include the U.S., Canada, Brazil, Mexico and Chile and the International reportable segment will include EMEA, Australia, New Zealand and Asia. This change will simplify and delayer the Company's operating structure and reduce costs through headcount reductions, supply change optimization, global footprint rationalization, and better leverage of our sourcing capabilities. The Company will recast prior period comparable results in early 2024 to reflect this operating segment change.
Seasonality
Historically, each of our segments has demand that varies based on certain seasonal drivers. For North America, the important seasonal selling periods are related to back-to-school and the holiday season. The North America back-to-school season mainly occurs in the second and third quarters. The holiday season drives significant sales of technology accessories. The EMEA segment experiences much less seasonality than the other segments, but the first and fourth quarters are typically stronger, with the second and third impacted by lower demand due to summer vacations. The International segment historically has strong back-to-school sales in the fourth quarter and into January as Brazil and Australia are in the Southern hemisphere. In Mexico, back-to-school historically straddles the second and third quarters.
As a result of the seasonal nature of the demand for our products, we expect to continue to generate a significant percentage of our sales and profit during the second, third, and fourth quarters, although the amounts generated in each of these quarters may vary due to changing customer behaviors. All our operating cash flow is generated in the second half of the year, as the cash inflows in the first and second quarters are consumed building working capital, and for making our annual performance-based compensation payments when earned. Our third and fourth quarter cash flow comes from completing the working capital cycle.
For further information on the seasonality of our net sales, earnings and cash flow, see "Part II. Item 7. Management's Discussion and Analysis of Financial Condition and Results of Operations - Summary of Cash Flow by Quarter and Full-Year."
Customers
We distribute our products through a wide variety of channels to ensure that our products are readily and conveniently available for purchase by consumers and other end-users, wherever they prefer to shop. These channels include mass retailers, e-tailers, discount, drug/grocery and variety chains, warehouse clubs, hardware and specialty stores, independent office product dealers, office superstores, wholesalers, contract stationers, and specialist technology businesses. We also sell directly through e-commerce sites and our direct sales organization.
Competition
ACCO Brands competes with numerous branded consumer products manufacturers, as well as many private label suppliers and importers, including various customers who import their own private label products directly from foreign sources. Examples of branded competitors include Bi-Silque, Blue Sky, Corsair, Dominion Blueline, Fellowes, Hamelin, Logitech, PDP, Razer, SteelSeries, and Targus, among others.
The Company meets competitive challenges by creating and maintaining leading brands and differentiated products that deliver superior value, performance, and benefits to consumers and other end-users. Our products are sold through diverse distribution channels. We further meet consumer and end-user needs by developing, producing, and procuring products at a competitive cost, enabling them to be sold at attractive selling prices. We also believe that our experience and skill in managing complex assortments and large seasonal demand is a competitive advantage, as is our strong relationships with technology and content providers in our technology accessories categories.
Product Development
We seek opportunities to invest in new products and adjacencies. Our innovation efforts focus on generating new, exciting, and differentiated products that meet consumer and other end-user needs and provide the opportunity to meaningfully grow sales and margins. Our commitment to understanding our consumers and end-users and designing products that fulfill their needs drives our product development strategy, which we believe will continue to be a key contributor to our success. Our products are developed by our internal research and development teams or through partnership initiatives with inventors, vendors and technology providers. Costs related to product development when paid directly by ACCO Brands are included in selling, general and administrative expenses.
Marketing and Demand Generation
We support our brands with a significant investment in targeted marketing and advertising, including on-shelf and in-store, and through digital and social media and consumer promotions that increase brand awareness, drive conversion, and highlight the innovation and differentiation of our products. We work with third-party vendors, such as Nielsen, Circana, GfK SE, NEWZOO and Kantar Group, to capture and analyze consumer buying habits and product trends.
Supply Chain
We have built a customer-focused business model with a flexible supply chain to ensure that we are able to supply our customers with value-added, high-quality products at an attractive price. We currently manufacture approximately 40 percent of our products in our own facilities located in the countries where we operate, and source the remaining 60 percent from lower cost countries, primarily in Asia. Using a combination of our own manufacturing and third-party sourcing also enables us to reduce costs and effectively manage our production assets by lowering capital investment and working capital requirements. Our overall strategy is to manufacture locally those products that would incur a relatively high freight and/or duty expense or that have high
customer service needs. Under our global footprint rationalization program, we will continue to rationalize our facilities as appropriate. We use third parties to source those products that require more direct labor to produce. We also look for opportunities to leverage our manufacturing facilities to improve operating efficiencies, as well as customer service.
Intellectual Property
Our products are marketed under a variety of trademarks. Some of our more significant trademarks include ACCO®, AT-A-GLANCE®, Barrilito®, Derwent®, Esselte®, Five Star®, Foroni®, GBC®, Hilroy®, Kensington®, Leitz®, Marbig®, Mead®, NOBO®, PowerA®, Quartet®, Rapid®, Rexel®, Swingline®, and Tilibra®. We own rights to these trademarks in various countries throughout the world. We protect these trademarks as appropriate through registrations in the U.S. and other jurisdictions. Depending on the jurisdiction, trademarks are generally valid as long as they are in use or their registrations are properly maintained and they have not been found to have become generic. Registrations of trademarks can generally be renewed indefinitely as long as the trademarks are in use. We also own numerous patents worldwide. Additionally, our gaming accessories business depends on maintaining our licensing rights with key gaming console manufacturers and video game publishers.
Human Capital Resources
As the Home of Great Brands Built by Great People, we believe our employees are our greatest assets and key enablers of our success. In alignment with our Vision, Values and Leadership Promise, we are intentional about providing a great work experience that attracts top talent and motivates them to stay and contribute to our winning team.
As of December 31, 2023, we had approximately 5,600 full-time and part-time employees worldwide, with approximately 4,100 employees based outside of the U.S. Approximately 500 manufacturing and distribution employees in our North America operating segment are covered by collective bargaining agreements. Outside the U.S., we have government-mandated collective bargaining arrangements in certain countries, particularly in Europe and Brazil. There have been no strikes or material labor disputes at any of our facilities during the past five years.
Diversity and Inclusion
At ACCO Brands, our values include respecting the individual and embracing diversity. We believe that an equitable and inclusive environment with diverse teams produces more creative solutions, results in improved and more innovative products and services, and is crucial to our efforts to attract and retain key talent. We also believe that our leadership should closely reflect the diversity of our employees. ACCO Brands’ diversity goals are to increase the percentage of director-level-and-above female leaders to 33 percent by 2025. For the total Company, we made excellent progress in 2023, moving from our 2019 baseline of 26.6 percent to reach our goal ending the year at 33.0 percent.
To continue to drive our diversity goals and build a culture of inclusion, we have established a multi-year roadmap and a governance model that engages leadership at all levels of the organization. We have also developed an enhanced diversity and inclusion dashboard to track our actions and outcomes. Our roadmap is focused on three key priorities: ensuring diverse candidate slates for all director-level-and-above job opportunities, integrating talent development and succession planning, and building manager capability to lead inclusively.
Talent Management
Building and sustaining strong talent is critical to our success. We know that offering the right mix of developmental roles and learning experiences will support our goal of building strong talent to lead the Company. At the same time, we recognize that building new capabilities may also require adding external talent in key roles to accelerate growth. This focus was key to our ability to fill 60 percent of our director-level and above open positions in 2023 with internal talent. Additionally, 18 percent of our director-level employees have mentors, while 54 percent have completed our "Raising the Bar" leadership development program. Throughout the year, we also deliver Company-required learning to ensure compliance with our Code of Conduct and other important policies.
Employee Health and Safety ("EHS")
We are committed to Mission Zero— pursuing continuous improvement in health and safety within all our locations and to attain our goal of zero accidents and zero incidents. We have implemented our Comprehensive Environmental and Safety Management Plan ("CESMP") as an overall management system for our manufacturing and distribution locations. CESMP audits are completed by our EHS teams to measure the proactive steps each location is taking to prevent injuries. We have been recognized as one of the safest companies in America and the U.K. on multiple occasions.
Community Involvement
We aim to give back to the communities where we live and work. Our corporate values include acting responsibly in our global communities through numerous employee volunteer and outreach initiatives. We encourage our employees to make a difference in our Company and in their communities by building on a fundamental commitment to integrity, teamwork, respect and inclusivity. We support a wide range of charities worldwide, the most significant of which is the City of Hope in the U.S. which has been ongoing for many years.
Sustainability/Environment
We continued to make progress on our three Planet, People and Products global sustainability goals relating to energy efficiency, diversity and third-party certification that we announced in 2020. These commitments are 1) improving the energy efficiency of our facilities, 2) increasing the percentage of female leaders globally, and 3) raising the percentage of our revenue generated from certified or sustainable products. We published our fifth annual ESG Report for 2022. We strive for greater efficiencies in the procurement, use and disposal of resources and are committed to reducing our greenhouse gas emissions. We also report key metrics which we have determined are significant to our business according to the Sustainability Accounting Standards Board (SASB) Materiality Matrix. These metrics are focused in the areas of Energy Management, Data Security, Workforce Diversity and Inclusion, Product Sourcing, Packaging and Marketing, and Labor Conditions in the Supply Chain.
Executive Leadership of the Company
As of February 23, 2024, the executive leadership team of the Company consisted of the following executive officers. Ages are as of December 31, 2023.
| | |
Mark C. Anderson, age 61 •2007 - present, Senior Vice President, Corporate Development •Joined the Company in 2007 Patrick H. Buchenroth, age 56 •2024 - present, Executive Vice President and President, Americas •2017 - 2023, Executive Vice President and President, ACCO Brands International •2013 - 2017, Senior Vice President and President, Emerging Markets •Joined the Company in 2002 Paul P. Daniel, age 58 •August 2022 - present, Senior Vice President and Chief Information Officer •February 2020 - August 2022, Vice President, Infrastructure and Operations •April 2017 - February 2020 - Vice President, Global IT Operations, Tate & Lyle PLC •Joined the Company in 2020 James M. Dudek, Jr., age 52 •2020 - present, Senior Vice President, Corporate Controller and Chief Accounting Officer •2017 - 2020, Vice President and Corporate Controller •2016 - 2017, Chief Accounting Officer, Innerworkings, Inc. •Joined the Company in 2017 Boris Elisman, age 61 •2023 - present, Executive Chairman •2021 - 2023, Chairman and Chief Executive Officer •2016 - 2021, Chairman, President and Chief Executive Officer •Joined the Company in 2004 Angela Jones, age 60 •2020 - present, Senior Vice President and Global Chief People Officer •2018 - 2020, Senior Vice President and Chief People Officer, Compass Minerals •2016 - 2018, Vice President, Human Resources Rembrandt Foods •Joined the Company in 2020 | | Gregory J. McCormack, age 60 •2024 - present - Senior Vice President, Global Operations and Supply Chain •2018 - 2023, Senior Vice President, Global Products and Operations •2013 - 2018, Senior Vice President, Global Products •Joined the Company in 1996 Cezary L. Monko, age 62 •2024 - present, Executive Vice President and President, International •2017 - 2023, Executive Vice President and President, ACCO Brands EMEA •2014 - 2017, President and Chief Executive Officer, Esselte •Joined the Company in 1992 Deborah A. O'Connor, age 61 •2022 - present, Executive Vice President and Chief Financial Officer •2020 - 2021, President and Chief Financial Officer, True Value Company •2015 - 2020, Senior Vice President and Chief Financial Officer, True Value Company •Joined the Company in 2022 Pamela R. Schneider, age 64 •2012 - present, Senior Vice President, General Counsel and Secretary •2010 - 2012, General Counsel, Accertify, Inc. •Joined the Company in 2012 Thomas W. Tedford, age 53 •2023 - present, President and Chief Executive Officer •2021 - 2023, President and Chief Operating Officer •2015 - 2021, Executive Vice President and President, ACCO Brands North America •Joined the Company in 2010 |
ITEM 1A. RISK FACTORS
The factors that are discussed below, as well as the matters that are generally set forth in this Annual Report on Form 10-K and the documents incorporated by reference herein, could materially and adversely affect the Company’s business, results of operations and financial condition. Additional risks and uncertainties that are not presently known to us or that are not deemed material also may materially adversely affect the Company’s business, results of operations and financial condition in the future.
Economic and Strategic Risks
A limited number of large customers account for a significant percentage of our net sales, and the loss of, or a substantial reduction in sales to, or gross profit from, or significant decline in the financial condition of one or more of these customers has and may continue to adversely impact our business and results of operations.
Our top ten customers accounted for 41.6 percent of our net sales for the year ended December 31, 2023. The loss of, or a significant reduction in sales to, or gross profit from, one or more of our top customers, or significant adverse changes to the terms on which we sell our products to one or more of our top customers, has and may continue to have a material adverse effect on our business, results of operations and financial condition.
The size, scale and relative competitive market position of certain large customers gives them significant leverage in business negotiations. Additionally, the competitive environment in which our large customers operate has made and will continue to make our business with them challenging and unpredictable.
Our customer concentration increases our customer credit risk. If any of our larger customers were to face liquidity issues, become insolvent or file for bankruptcy, we could be adversely impacted due to not only a reduction in future sales but also delays or defaults in the payment of existing accounts receivable balances. Such a result could adversely impact our cash flows, results of operations, and financial condition.
Sales of our products have been, and we expect they will continue to be, materially and adversely affected by general economic and business conditions globally and in the countries in which we operate, including high inflation, fear of recession and overall economic uncertainty or weakness.
Our business depends on discretionary spending, and, as a result, our sales and operating results are highly dependent on consumer and business confidence and the health of the economies in the countries in which we operate. During periods of economic uncertainty or weakness, we have experienced and may continue to experience lower demand from our reseller customers who often reduce inventories, both to reduce their own working capital investments and because demand for our products decreases as consumers switch to private label and other branded and/or generic products that compete on price and quality, or forgo purchases altogether. Overall, adverse economic conditions and sustained periods of economic uncertainty or weakness in one or more of the geographic markets in which we operate, whatever the cause, have negatively affected, and we expect will continue to negatively affect, our sales and profitability, results of operations, cash flow and financial condition.
The Company has foreign currency translation and transaction exposure that has, and is likely to continue to, materially affect the Company’s sales, results of operations, financial condition and liquidity.
Approximately 57 percent of our net sales for the year ended December 31, 2023, were transacted in a currency other than the U.S. dollar. Our primary exposure to currency movements relative to the U.S. dollar is in the Euro, the Swedish krona, the British pound, the Brazilian real, the Australian dollar, the Canadian dollar, and the Mexican peso. Currency exchange rates can be volatile especially in times of global, political and economic tension or uncertainty. Additionally, government actions such as currency devaluations, foreign exchange controls, imposition of tariffs or other trade restrictions, and price or profit controls can further negatively impact, and increase the volatility of, foreign currency exchange rates.
The fluctuations in the foreign currency rates relative to the U.S. dollar can cause translation, transaction, and other gains and losses in our non-U.S.-based businesses, which impact our sales, profitability and cash flow. Our primary exposure is from translation of our foreign operations' results. Generally, the strengthening of the U.S. dollar against foreign currencies negatively impacts the Company’s reported sales and operating margins. Conversely, the weakening of the U.S. dollar against foreign currencies generally has a positive effect.
We source approximately 60 percent of our products from lower cost countries, primarily in Asia using U.S. dollars. This creates transactional exposure in our foreign markets. The strengthening of the U.S. dollar against local foreign currencies increases our cost of goods and reduces our margins on products sold in local currency. When this occurs, we seek to raise prices in our foreign markets to recover the lost margin. Due to competitive pressures and the timing of these price increases relative to the changes in the foreign currency exchange rates, it is often difficult to increase prices fast enough to fully offset the cumulative impact of the foreign-exchange-related inflation on our cost of goods sold in these markets.
We use hedging instruments to mitigate transactional exposure to changes in foreign currencies. The effectiveness of our hedges in part depends on our ability to accurately forecast future cash flows, which is particularly difficult during periods of uncertain demand for our products and highly volatile exchange rates. For additional information, see "Part II, Item 7A. Quantitative and Qualitative Disclosures About Market Risk - Foreign Exchange Risk Management" of this report.
Challenges related to the highly competitive business environment in which we operate has, and may continue to have, a material adverse effect on our business, results of operations and financial condition.
We operate in a highly competitive environment characterized by large, sophisticated customers, low barriers to entry for certain of our products, and competition from a wide range of products and services (including private label products and electronic and digital products and services that can replace or render certain of our products obsolete). We have seen, and expect to continue to see, increased competition from private label brands, especially in periods of economic uncertainty and weakness when customers and consumers turn to alternative or lower cost products.
ACCO Brands competes with numerous branded consumer products manufacturers, as well as numerous private label suppliers and importers, including many of our customers who import their own private label products directly from foreign sources. Many of our competitors have strong, sought-after brands. Their ability to manufacture products locally at a lower cost or source them from other countries with lower production costs can give them a competitive advantage in terms of price under certain circumstances. In addition, as economic and competitive pressures cause our customers to close or reduce the size of their retail locations, and diversify their product offerings, the available retail space devoted to our products is further limited.
Our business has been, and we expect it will continue to be, affected by actions taken by our customers and competitors to compete more effectively. Such actions have, and in the future may, result in lost sales and lower margins, and adversely affect our business, results of operations, and financial condition.
Our success depends on our ability to develop and market innovative products that meet consumer and other end-user demands, including price expectations, and to expand into new and adjacent product categories that we believe will have higher long-term growth rates.
Our success depends on our ability to invest in innovation and product development and successfully anticipate, develop and market products that appeal to the changing needs and preferences of consumers and other end-users. Additionally, part of our strategy is to develop new, exciting and differentiated products in our technology accessories and learning and creative categories which we believe offer significant long-term growth opportunities. There can be no assurance that we will make the right investment choice or be successful in developing innovative products in these and other categories. If we are unable to successfully increase sales and margins by expanding our product assortment, our business, results of operations and financial condition could be adversely affected.
Our business and results of operations have been and may continue to be adversely affected by the long-term impacts of the COVID-19 global pandemic.
The long-term impacts of the COVID-19 pandemic, including the prevalence of hybrid work, and changes in the behavior of customers, consumers and end-users, has had, and will continue to have, a negative effect on our business and results of operations. During 2023, office occupancy rates stabilized at levels well below pre-pandemic levels and the rate of decline in the demand for our traditional paper-based and related products continues to accelerate. The extent of the impact of these trends on our future business and financial results depends on future developments that are uncertain. The continued longer-term impacts of the COVID-19 pandemic may also exacerbate other risks discussed in this "Part I, Item 1A. Risk Factors," any of which could have a material effect on the business, results of operations or financial condition of the Company.
Growth in emerging geographies may be difficult to achieve and exposes us to financial, operational, regulatory, compliance, and other risks not present, or not as prevalent, in more established markets.
The profitable growth of our business in emerging markets is a key element to our long-term growth strategy. Emerging markets generally involve more financial, operational, regulatory and compliance risks than more mature markets. As we expand and grow in these markets, we increase our exposure to these risks. These risks include currency transfer restrictions, currency fluctuations, changes in international trade and tax policies and regulations (including import and export restrictions), and a lack of well-established or reliable legal systems. Additionally, in some cases, emerging markets also have greater political and economic volatility, greater vulnerability to infrastructure and labor disruptions, and are more susceptible to corruption, civil unrest, military disruptions, terrorism, public health emergencies, severe weather conditions, and natural disasters. Weak or corrupt legal systems may affect our ability to protect and enforce our intellectual property, contractual and other rights. Further, these emerging markets are generally more remote from our headquarters' location and have different cultures that may make it be more difficult to impose corporate standards and procedures and the extraterritorial laws of the U.S. and other jurisdictions, including the U.S. Foreign Corrupt Practices Act, the U.K. Bribery Act and other similar laws.
If we are unable to profitably grow our existing emerging market businesses or expand into other emerging markets, achieve the return on capital we expect as a result of our investments, or effectively manage the risks inherent in operating in these markets, our business, results of operations and financial condition could be adversely affected.
Continued declines in the use of certain of our products have and will continue to adversely affect our business.
A number of our products and brands consist of paper-based and related products. As use of technology-based tools continues to rise worldwide and the nature of work and school evolves demand for many of our products, especially for our traditional paper-based and related products has declined. This trend was accelerated by the COVID-19 pandemic and we expect that demand for these products will continue to decline. The decline in the overall demand for certain of the products we sell has adversely impacted our business and results of operations, and we expect it will continue to do so.
Our school and technology accessories businesses are seasonal, which has impacted, and may in the future impact, our ability to accurately forecast our operating results and working capital requirements.
Historically, each of our segments has demand that varies based on certain seasonal drivers related to the product categories it sells as discussed in "Part I. Item 1. Business - Seasonality" of this report.
As a result of this seasonality, our inventory and working capital needs fluctuate significantly throughout the year. In addition, our customers often change their order patterns for the peak season, making forecasting of production schedules and inventory purchases more challenging. These fluctuations have impacted our ability to accurately forecast our inventory and working capital needs as well as our operating results. When we are unable to accurately forecast and prepare for customer orders or our working capital needs, or if there is a downturn in business or economic conditions during these periods, our business,
results of operations, liquidity and financial condition have been, and in the future could be, adversely affected. Additionally, because of these quarterly fluctuations, comparisons of our operating results across different fiscal quarters may not be meaningful.
The level of investment returns on pension plan assets and the assumptions used for valuation purposes have affected the Company's earnings, and could affect the Company’s earnings and cash flows in future periods. Changes in government regulations, as well as the significant unfunded liabilities, including the unfunded liabilities of the U.S. multi-employer pension plan in which we are a participant, could also affect the Company’s pension plan expenses and funding requirements.
As of December 31, 2023, the Company had $162.1 million recorded as pension liabilities in its Consolidated Balance Sheet. Funding obligations are determined by government regulations and are measured each year based on the value of assets and liabilities on a specific date. When the financial markets do not provide the long-term returns that are expected, or discount rates increase the present value of liabilities, the Company has been, and in the future could be, required to make larger contributions and/or record higher non-cash expenses related to its pension liabilities. The markets can be, and recently have been, very volatile, and therefore the Company’s estimate of future contribution requirements and/or non-cash expenses can change dramatically in relatively short periods of time. Similarly, changes in interest rates and legislation enacted by governmental authorities can impact the timing and amounts of contribution requirements and/or non-cash expenses. An adverse change in the funded status of the plans could significantly increase our required future contributions and/or non-cash expenses and adversely impact our liquidity.
We also participate in a multi-employer pension plan for our union employees at our Ogdensburg, New York facility. The plan has reported significant underfunded liabilities and declared itself in critical and declining status. As a result, the trustees of the plan adopted a rehabilitation plan in an effort to forestall insolvency. Our current contributions to this plan (which are not significant) could increase due to the shrinking contribution base resulting from the insolvency or withdrawal of other participating employers, the inability or the failure of withdrawing participating employers to pay their withdrawal liability, lower than expected returns on pension fund assets, and other funding deficiencies. The present value of our withdrawal liability payments could be significant and would be recorded as an expense in our Consolidated Statements of Income and as a liability on our Consolidated Balance Sheets in the first year of our withdrawal. See also "Note 5. Pension and Other Retiree Benefits" to the consolidated financial statements contained in Part II, Item 8. of this report.
Impairment of goodwill and indefinite-lived intangible assets have had, and could in the future have, a material adverse effect on our financial results.
We have approximately $1.4 billion of goodwill and other specifically identifiable intangible assets as of December 31, 2023. During the fourth quarter of 2023, we recorded a $89.5 million non-cash goodwill impairment charge related to our North America reporting unit. This follows a $98.7 million non-cash goodwill impairment charge related to our North America reporting unit recorded during the third quarter of 2022. Future events may occur that could adversely affect the reported value, or fair value, of our goodwill or indefinite-lived intangible assets that would require future impairment charges which would negatively impact our financial results. Such events may include, but are not limited to, strategic decisions made in response to changes in economic and competitive conditions, the impact of the economic environment on our sales and customer base, the unfavorable resolution of litigation, a material adverse change in our relationship with significant customers, or a sustained decline in our stock price. We continue to evaluate the impact of developments from our reporting units to assess whether impairment indicators are present. See also "Note 9. Goodwill and Identifiable Intangible Assets" to the consolidated financial statements contained in Part II, Item 8. of this report.
Our inability to secure, protect and maintain rights to intellectual property could have an adverse impact on our business. In particular, the success and future growth of our gaming accessories business depends on its ability to license the right to use the trademarks and other intellectual property of the major gaming console makers and video game publishers.
We consider our intellectual property rights, particularly and most notably our trademarks and trade names, but also our patents, trade secrets, trade dress, copyrights, and licensing agreements, to be an important and valuable part of our business. Our failure to obtain or adequately protect our intellectual property rights, or any change in law or other changes that serve to lessen or remove the current legal protections of our intellectual property, may diminish our competitiveness, dilute the value of our brands, cause confusion in the marketplace, and materially impact our sales and profitability.
Our gaming accessories business licenses trademarks and other intellectual property from the three major gaming console manufacturers and numerous video game publishers. The loss or non-renewal of one or more of these licenses would, in all likelihood, materially and adversely impact our sales, results of operations and financial condition. Additionally, our ability to expand our gaming accessories business into certain new geographies requires that we obtain additional licensing rights from the gaming console manufacturers and video game publishers. There can be no assurance that we will be able to obtain these additional licensing rights.
Operational Risks
Failure to successfully implement our multi-year restructuring and cost savings program could adversely affect our future results of operations and cash flow.
In January 2024, the Company announced a multi-year restructuring and cost savings program, with anticipated annualized pre-tax cost savings of at least $60 million when fully implemented in 2026. The program incorporates initiatives to simplify and delayer the Company's operating structure and reduce costs through headcount reductions, supply chain optimization, global footprint rationalization, and better leveraging of the Company's sourcing capabilities. We may not be able to successfully execute these initiatives in a timely manner or realize the anticipated cost savings and operational synergies. Failure to implement these initiatives and realize the anticipated cost savings and operational synergies as planned could adversely affect our future results of operations and cash flow. Further, the changes to our operating structure, including the leadership changes, have resulted in a significant amount of organization change which, could divert management's attention from other priorities, disrupt the Company's day-to-day operations and have a negative impact on employee morale and retention. If we are not able to effectively manage the restructuring process our business and financial results could suffer.
Our business, results of operations and cash flow have been, and may continue to be, adversely impacted by disruptions in the global supply chain.
We manufacture approximately 40 percent of the products we sell where we operate and purchase the remaining 60 percent from suppliers in lower cost countries, primarily in Asia. We also purchase component parts and raw materials for our manufactured products from third parties many of which are also imported from Asia. Additionally, we rely on international freight carriers and domestic trucking and rail lanes to import and distribute products to our customers throughout the world. We have experienced disruptions in our global supply chain due to insufficient freight carrier capacity, port delays and closures, the cost and availability of international and domestic freight carriers, labor shortages and geopolitical unrest. Although we saw a significant reduction in supply chain disruptions and deflation in transportation costs during 2023, recent geopolitical unrest in the Middle East is once again impacting our supply chain and adversely affecting our business operations. These events as well as further supply chain disruptions could adversely affect our operations, sales, profitability and cash flow.
Our operating results have been, and continue to be, adversely affected by inflation and changes in the cost or availability of raw materials, transportation, labor and other necessary supplies and services, including the cost of finished goods.
The price and availability of raw materials, transportation, labor, and other necessary supplies and services used in our business, as well as the cost of finished goods, can be volatile due to numerous factors beyond our control, including general economic and competitive conditions, inflation, supply chain disruptions, supplier business strategies, and political instability, war and other geopolitical tensions. In recent years, the global economy has experienced the highest levels of inflation in decades. Additionally, the global imbalance between the supply and demand for commodities, component parts, transportation and labor have impacted their availability and increased their cost. This has been exacerbated by the geopolitical unrest in Europe and the Middle East. As a result, we have experienced cost increases from our suppliers of raw materials, component parts and purchased finished goods, as well as increased labor, energy and commodity costs. During the fourth quarter of 2023, we began to see signs of moderating inflation. While we believe that inflationary costs for most raw materials, purchased finished goods, and freight and transportation will continue to moderate, there can be no assurance that inflation will abate.
During periods of inflation and rising costs, we manage this volatility through a variety of actions, including targeted advance or periodic purchases, future delivery purchases, long-term contracts, sales price increases and the use of certain derivative instruments. We implemented price increases in 2022 and throughout 2023, and will implement additional price increases if necessary to offset future inflationary and supply-chain related cost increases. Historically, we have not been able to raise prices fast enough to effectively mitigate the adverse impact of these cost increases on our margins and there can be no assurance that we will be able to do so in the future. Additionally, we have lost, and may continue to lose, sales due to increasing our selling prices to our customers. We have also seen customers and consumers purchase lower priced products which generate lower margins due to our price increases and we expect this trend may continue.
Outsourcing the development and production of certain of our products, our information technology systems and other administrative functions could materially adversely affect our business, results of operations and financial condition.
We outsource certain product development and manufacturing functions, such as product design and production, to third-party suppliers. This creates a number of risks, including decreased control over the engineering and manufacturing processes which can result in cost overruns, delayed deliveries or shortages, inferior product quality, and loss or misappropriation of trade secrets and intellectual property. Additionally, we rely on our suppliers to ensure that our products meet our design and product content specifications, and all applicable laws, including product safety, security, labor, sustainability and environmental laws. We also expect our suppliers to conform to our and our customers’ and licensors' codes of conduct and expectations with respect to product safety, product quality, social responsibility and environmental sustainability, and be responsive to our audits. Failure to meet any of these requirements may result in our having to cease doing business with a supplier or cease production at a particular facility, stop selling or recall non-conforming products, or having imported products detained at the port or subject to exclusion or seizure. Substitute suppliers might not be available or, if available, might be unwilling or unable to offer products on acceptable terms or in a timely manner. Moreover, if one or more of our suppliers is unable or unwilling to continue to provide products of acceptable quality, at acceptable cost or in a timely manner due to financial difficulties, insolvency or otherwise, including as a result of disruptions associated with circumstances outside their control, or if customer demand for our products increases, we may be unable to secure sufficient additional capacity from our current suppliers, or others, in a timely manner or on acceptable terms. Any of these events could result in unforeseen production delays and increased costs and negatively affect our ability to deliver our products to our customers, all of which could adversely affect our business, sales, results of operations, and financial condition.
We also outsource important portions of our information technology infrastructure and systems support to third-party service providers. Outsourcing of information technology services creates risks to our business, which are similar to those created by our product production outsourcing.
In addition, we outsource certain administrative functions, such as payroll processing and benefit plan administration, to third-party service providers and may outsource other functions in the future to achieve cost savings and efficiencies. If the service providers to whom we outsource these functions do not perform effectively or experience deficiencies or material weaknesses in their internal controls, we may not be able to achieve the expected cost savings and may incur additional costs to correct errors they make. Depending on the function involved, such issues may also lead to business disruption, processing inefficiencies, internal control deficiencies, loss of or damage to intellectual property, legal and regulatory exposure, or harm to employee morale.
Technology and Cybersecurity Risks
We rely extensively on information technology systems to operate, transact and otherwise manage our business. Any material failure, inadequacy, or interruption of that technology or its supporting infrastructure could materially adversely affect our business, results of operations and financial condition.
We rely extensively on our information technology systems, many of which are outsourced to third-party service providers. We depend on these systems and our third-party service providers to effectively manage our business and execute the production, distribution and sale of our products, as well as to manage and report our financial results and run other support functions. Although we have implemented service level agreements and have established monitoring controls, if our third-party service providers fail to perform their obligations in a timely manner or at satisfactory levels, our business could suffer. Additionally, if one or more of our information technology suppliers is unable or unwilling to continue to provide services at acceptable cost due to financial difficulties, insolvency or otherwise, our business could be adversely affected.
Further, our failure to properly maintain and successfully upgrade or replace any of these systems, especially our enterprise resource planning systems, could disrupt our business and our ability to service our customers or negatively impact our ability to report our financial results in a timely and accurate manner.
If our day-to-day business operations or our ability to service our customers is negatively impacted by the failure or disruption of our information technology systems, if we are unable to accurately and timely report our financial results, or if we conclude that we do not have effective internal control over financial reporting and effective disclosure controls and procedures, it could damage our reputation and adversely affect our business, results of operations and financial condition.
Security breaches could compromise our confidential and proprietary information, as well as any personally identifiable information we hold, and expose us to operational and legal risks that could cause our business and reputation to suffer and materially adversely affect our results of operations and financial condition.
We maintain information and applications necessary to conduct our business in data centers, on our networks and with third-party cloud services, including confidential and proprietary information, as well as personally identifiable information regarding our customers and employees. Our information technology infrastructure may be vulnerable to attacks by hackers or breached due to employee error, malfeasance, or other disruptions which creates the risk that our digital information could be stolen or tampered with or that our business operations could be materially and adversely impacted. This risk is heightened now that most of our office-based employees work remotely several days a week.
We maintain systems designed to prevent and monitor for such intrusion, tampering, and theft, and we continue to enhance and update these technologies as security threats evolve and become more sophisticated. We also obtain assurances from outsourced service providers regarding the sufficiency of their security procedures and, where appropriate, assess the protections employed by these third parties. Despite these efforts, there can be no assurance that we will successfully identify an incident of intrusion, tampering or theft in a timely manner or at all, and in advance of it impacting the Company, and any such impact could be material. Further, our costs to maintain and upgrade our security systems could increase significantly as cybersecurity threats increase.
Despite our efforts to secure and monitor our information technology systems, the possibility of intrusion, tampering, and theft cannot be eliminated entirely. We have from time to time experienced cybersecurity breaches, such as "phishing" attacks, business email compromises, employee or insider error, brute force attacks, unauthorized parties gaining access to our information technology systems, and similar incidents. To date these incidents have not had a material impact on our business, but there can be no assurance that future incidents will not cause material impacts. The techniques used to obtain unauthorized access, disable or degrade service, or sabotage systems change frequently and often are not recognized until launched against a target. Additionally, there can be no assurance that the actions we and our outsourced providers take will prevent a breach of, or attack on the information technology systems which support the day-to-day operation of our business or house our confidential, proprietary and personally identifiable information.
Any such intrusion, tampering or theft (and any resulting disclosure or use of confidential, proprietary or personally identifiable information) could compromise our network, the network or data center of a third-party hosting key operating systems or data, or to whom we have disclosed confidential, proprietary or personally identifiable information, or a third-party cloud service provider. Any of these impacts could result in a disruption to our information technology infrastructure, interruption of our business operations, violation of applicable privacy and other laws or standards, significant legal and financial exposure beyond the scope or limits of any insurance coverage (including legal claims and proceedings and regulatory enforcement actions and penalties), increased operating costs associated with remediation activities, and a loss of confidence in our security measures, all of which could harm our reputation with our customers, end-users, employees and other stakeholders and materially adversely affect our business and results of operations. Contractual provisions with third parties, including cloud service providers, may limit our ability to recover these losses.
In the event a significant cybersecurity event is detected, we maintain disclosure controls and procedures that are designed to enable us to promptly analyze the impact on our business, respond expediently, appropriately and effectively and repair any damage caused by such incident, as well as consider whether such incident should be disclosed publicly. The Company also employs technology designed to detect potential incidents of intrusion, tampering and theft before they impact the Company, and we continue to enhance and update these technologies. However, there can be no assurance that we will successfully identify such an incident in a timely manner or at all, and in advance of it impacting the Company, and any such impact could be material.
Merger and Acquisition Risks
Our strategy is partially based on growth through acquisitions. Failure to properly identify, value and manage acquisitions, and successfully integrate them may materially impact our business, results of operations and financial condition.
Our strategy is partially based on growth through acquisitions. We may not be successful in identifying suitable acquisition opportunities, prevailing against competing potential acquirers, negotiating appropriate acquisition terms, obtaining financing, or completing proposed acquisitions. In addition, an acquisition may not perform as anticipated, be accretive to earnings, or prove to be beneficial to our operations and cash flow. If we fail to effectively identify, value, consummate, or manage any acquired company, we may not achieve the financial results, including cost savings and synergies, anticipated at the time of its acquisition. An acquisition could also adversely impact our operating performance or cash flow due to the issuance of acquisition-related debt, pre-acquisition assumed liabilities, undisclosed facts about the business, expenses incurred to consummate the acquisition, increases in amortization due to the acquisition, or possible future impairments of goodwill or intangible assets associated with the acquisition.
We may face challenges in integrating our acquisitions with our existing operations and expanding the acquired business geographically. The process of integrating and expanding operations also could cause an interruption of, or loss of momentum in, the activities of one or more of our businesses due to the considerable time and attention needed for the process. If we are not able to effectively manage the integration process, or if any significant business activities are interrupted as a result thereof, our business and financial results could suffer.
The integration of any acquisition will involve changes to or implementation of critical information technology systems, modifications to our internal control systems, processes and accounting and financial systems, and the establishment of disclosure controls and procedures and internal control over financial reporting necessary to meet our obligations as a public company. If we are unable to successfully complete these tasks and accurately report our financial results in a timely manner and establish internal control over financial reporting and disclosure controls and procedures that are effective, our business, results of operations and financial condition, investor, supplier and customer confidence in our reported financial information, the market perception of our Company and/or the trading price of our common stock could be materially adversely affected.
Liquidity, Capital Resources and Capital Allocation Risks
Our existing borrowing arrangements limit our ability to engage in certain activities. If we are contractually restricted from pursuing activities or transactions that we believe are in our long-term best interests, or are unable to meet our obligations under our loan agreements, our business, results of operations and financial condition could be materially adversely affected.
The terms of our debt agreements limit our ability to engage in certain activities and transactions that may be in our and our stockholders' long-term interests. Among other things, the covenants and financial ratios and tests contained in our debt agreements restrict or limit our ability to incur additional indebtedness, grant certain liens on our assets, issue preferred stock or certain disqualified stock, make restricted payments (including dividends and share repurchases), make investments, sell our assets or merge with other companies, and enter into certain transactions with affiliates. We are also required to maintain specified financial ratios under certain circumstances and satisfy financial condition tests. Our ability to comply with these covenants and financial ratios and tests may be affected by events beyond our control, and we may not be able to continue to meet those covenants, ratios and tests.
Our debt service obligations require us to dedicate a portion of our cash flow from operating activities to make interest and principal payments on our indebtedness, which reduces the availability of our cash flow to fund working capital, capital expenditures, research and product development efforts, potential acquisitions and other general corporate purposes. A portion of our outstanding indebtedness bears interest at a floating rate which fluctuates with changes in interest rates.
Our ability to meet our debt obligations, including our financial covenants, and to refinance our existing indebtedness upon maturity, will depend upon our future operating performance, which will be affected by general economic, financial, competitive, regulatory, business, and other factors. Breach of any of the covenants, ratios, and tests contained in the agreements governing our indebtedness, or our inability to pay interest on, or principal of, our outstanding debt as it becomes due, could result in an event of default, in which case our lenders could declare all amounts outstanding to be immediately due and payable. If our lenders accelerate our indebtedness, or we are not able to refinance our debts at maturity, our assets may not be sufficient to repay in full such indebtedness and any other indebtedness that would become due as a result of such acceleration. If we then are unable to obtain replacement financing or any such replacement financing is on terms that are less favorable than the indebtedness being replaced, our liquidity, results of operations, and financial condition would be adversely affected.
We may not continue to pay dividends at historic rates, or at all, or engage in stock repurchases.
We have a history of paying quarterly dividends and engaging in stock repurchase programs; however, any determination to continue to pay cash dividends at recent rates or at all, or resume repurchasing our shares in the market, is contingent on a variety of factors, including our financial condition, results of operations, business requirements, and our board of directors' continuing determination that such dividends or share repurchases are in the best interests of our stockholders and in compliance with all applicable laws and agreements. Under certain circumstances, the terms of our debt agreements limit our ability to return
capital to stockholders through stock repurchases, dividends or otherwise. There is no assurance that we will continue to make dividend payments or repurchase stock.
Legal and Regulatory Risks
Product liability claims, recalls or regulatory actions could materially adversely affect our financial results or harm our reputation or brands.
Claims for losses or injuries purportedly caused by one of our products arise in the ordinary course of our business. Litigation or regulatory enforcement actions and the associated costs and potential for monetary judgments and penalties could have an adverse effect on our results of operations and financial condition. Additionally, product liability claims or regulatory actions, regardless of merit, could result in negative publicity that could harm our reputation in the marketplace or the value of our brands. We also may be, and in the past have been, required to recall and discontinue the sale of allegedly defective or unsafe products, which has resulted in lost sales and unplanned expenses. Any future recall or quality issue could result in lost sales, adverse publicity, and significant expenses, and adversely impact our results of operations or financial condition.
Litigation or legal proceedings could expose us to significant liabilities and damage our reputation.
We are party to various lawsuits and regulatory proceedings, primarily related to alleged patent infringement, as well as other claims incidental to our business. In addition, we may be unaware of third-party claims of intellectual property infringement relating to our technology, brands, or products, and we may face other claims related to business operations. Any litigation regarding patents or other intellectual property could be costly and time-consuming and might require us to pay monetary damages or enter into costly license agreements. We also may be subject to injunctions against development and sale of certain of our products.
It is the opinion of management that (other than the Brazil Tax Assessments described below) the ultimate resolution of currently outstanding matters will not have a material adverse effect on our financial condition, results of operations or cash flow. However, there is no assurance that we will ultimately be successful in our defense of any of these matters or that an adverse outcome in any matter will not affect our results of operations, financial condition, or cash flow. Further, future claims, lawsuits and legal proceedings could materially adversely affect our business, reputation, results of operations, and financial condition.
In connection with our May 1, 2012 acquisition of the Mead Consumer and Office Products business, we assumed all of the tax liabilities for its acquired foreign operations, including its operating entity in Brazil ("ACCO Brazil"). In December of 2012, the Federal Revenue Department of the Ministry of Finance of Brazil ("FRD") issued a tax assessment against ACCO Brazil, challenging the tax deduction of goodwill from ACCO Brazil’s taxable income for the year 2007 (the "First Assessment"). A second assessment challenging the deduction of goodwill from ACCO Brazil’s taxable income for the years 2008, 2009 and 2010 was issued by FRD in October 2013 (the "Second Assessment" and together with the First Assessment, the "Brazil Tax Assessments"). ACCO Brazil continues to dispute both of the Brazil Tax Assessments. If the FRD’s initial position is ultimately sustained, payment of the amount assessed would materially adversely affect our cash flow in the year of settlement. For additional details regarding the Brazil Tax Assessments, see "Note 11. Income Taxes – Brazil Tax Assessments" to the consolidated financial statements contained in Part II, Item 8. of this report.
Additional tax liabilities stemming from our global operations and changes in tax legislation, regulation and tax rates have, and may continue to, adversely affect our financial results.
We face a variety of risks of increased future taxation on our earnings as a corporate taxpayer in the countries in which we have operations. Moving funds between countries can produce adverse tax consequences. In addition, since our operations are global, we can face challenges in effectively gaining a tax benefit for costs incurred in one country that benefit our operations in other countries.
Changes in tax legislation or tax rates may occur in one or more jurisdictions in which we operate that may materially impact the cost of operating our business. Recent legislative changes in the United States include the 2017 Tax Cuts and Jobs Act and the 2022 Inflation Reduction Act, which have introduced limitations on business-related deductions and increased taxation of foreign earnings in the U.S., and a corporate minimum tax, all of which could increase our future tax expense.
In addition, the potential exists for significant legislative policy change in the taxation of multinational corporations, as has recently been the subject of the “Pillar One” and “Pillar Two” initiatives of the Organization for Economic Co-operation and Development, the European Union Anti-Tax Avoidance Directives, and legislation inspired or required by those initiatives. It is also possible that some governments will make significant changes to their tax policies in response to factors such as budgetary needs, feedback from the business community and the public view on applicable tax planning activities. Further, interpretations of existing tax law in various countries may change due to the regulatory and examination policies of the tax authorities and the decisions of courts.
Adverse or unanticipated tax consequences can negatively impact our performance. We are uncertain as to the ultimate results of these potential changes or what their effects will be on our business.
Laws, rules and regulations and self-regulatory requirements that affect our business, including the costs of compliance, as well as the impact of changes in such laws, could materially adversely affect our business, reputation and results of operations.
We are subject to national, state, provincial and/or local laws, rules and regulations, as well as self-regulatory requirements, in numerous countries due to the nature of our operations and the products we sell, including:
•Laws and regulations applicable to U.S. public companies with securities listed on the New York Stock Exchange;
•Laws relating to the discharge and emission of certain materials and waste, and laws establishing standards for their use, disposal, and management;
•Laws governing the content of toxic chemicals and materials in the products we sell;
•Laws relating to corporate governance, the environmental sustainability of our operations and products (including packaging) and the protection of human rights in our supply chain, including reporting obligations;
•International trade laws, including tariffs, trade sanctions and embargoes;
•Privacy and data security laws and self-regulatory requirements regarding the acceptance, processing, storage, and transmission of credit card data;
•Laws governing fair competition and marketing and advertising, including laws and regulations regarding "green" claims; and
•Anti-bribery, anti-corruption and anti-money laundering laws.
All of these legal frameworks are complex and change frequently. Moreover, the requirements of these and other laws can vary significantly from jurisdiction to jurisdiction. Additionally, laws relating to sustainability and human rights, including enhanced transparency and reporting obligations, are rapidly being adopted around the world. Capital and operating expenses required to establish and maintain compliance with all of these laws, rules and regulations and self-regulatory requirements can be significant, and violations may result in substantial fines, penalties, and civil damages as well as damage to our reputation. In addition, as we continue to expand our business into new markets and into new product categories, we increase the number of legal and self-regulatory requirements with which we are required to comply, which increases the complexity and costs of compliance, as well as the risks of noncompliance. Any significant increase in our costs to comply with applicable legal and self-regulatory requirements, or any liability arising from noncompliance, could have a material adverse effect on our business, results of operations, and financial condition.
Additionally, our future results of operations could be adversely impacted by changes in these laws. Changes in income tax laws could change our effective tax rate while changes in U.S. trade policies, including tariffs on imports from China and on commodities we use in our manufacturing operations, could affect our cost of products sold and margins.
General Risk Factors
Our success depends on our ability to attract and retain qualified personnel.
Our success depends on our ability to attract and retain qualified personnel at all levels and maintain a diverse, global workforce. The market for talent is currently extremely competitive and our current pay and benefits packages may not be sufficiently attractive. For our executives, we rely to a significant degree on performance-based incentive awards that pay out only if specified performance goals have been met. To the extent these performance goals are not met, and our incentive awards do not pay out, or pay out less than the targeted amount, it may motivate certain executive officers and more senior management employees to seek other opportunities. Our ability to maintain competitive pay and benefits and an attractive culture will affect our ability to attract and retain qualified personnel. The loss of key management personnel or other employees with highly sought-after expertise or our potential inability to attract qualified and diverse personnel in sufficient numbers to meet our business needs may adversely affect our ability to manage our overall operations and successfully implement our business strategy.
Our stock price is volatile.
The market price for our common stock has been volatile historically. Our stock price may be significantly affected by factors, including those described elsewhere in this "Part I, Item 1A. Risk Factors," as well as the following:
•quarterly fluctuations in our operating results compared with market expectations;
•changes in financial estimates by us or securities analysts and recommendations by securities analysts; and
•the composition of our stockholders, particularly the presence of "short sellers" or high frequency traders trading in our stock.
Volatility in our stock price could adversely affect our business and financing opportunities, which could hurt our operating results and reduce the percentage ownership of our existing stockholders.
Circumstances outside our control, including telecommunication failures, labor strikes, power and/or water shortages, acts of God, public health emergencies, including the occurrence of a pandemic, severe weather conditions, natural disasters, war, terrorism, and other geopolitical incidents have, and in the future could, materially and adversely impact our business, sales, results of operations and financial condition.
A disruption at one of our suppliers' manufacturing facilities, one of our offices, manufacturing or distribution locations, or elsewhere in our global supply chain due to circumstances outside our control, have, and in the future could, materially and adversely impact our business operations. Such a disruption could occur as a result of any number of events, including but not limited to, a major equipment failure, labor stoppages, transportation failures affecting the supply and shipment of materials and finished goods, unavailability of raw materials, severe weather conditions, natural disasters, civil and geopolitical unrest, fire, explosions, public health emergencies, including the occurrence of pandemics such as COVID-19, war or terrorism, and disruptions in utility and other services. Any such future disruptions could materially and adversely impact our business, sales, results of operations, and financial condition.
Political instability, civil unrest, war or terrorism, public health crises, including the occurrence of pandemics such as COVID-19, or other public health emergencies, and severe weather or natural disasters may also affect consumer and business confidence and the health of the economies in the countries in which we operate. Overall, adverse changes in economic conditions or sustained periods of economic uncertainty or weakness in one or more of the geographic markets in which we operate, whatever
the cause, have negatively affected our historical sales and profitability, and in the future could have an adverse effect on our sales, business, results of operations, cash flow and financial condition.
ITEM 1B. UNRESOLVED STAFF COMMENTS
None.
ITEM 1C. CYBERSECURITY
Risk Management and Strategy
The Company recognizes the importance of maintaining cybersecurity measures to safeguard our information systems and protect the confidentiality, integrity, and availability of our data. Our cybersecurity risk management is included within our overall enterprise risk management program.
We have implemented a risk-based cybersecurity program to identify, assess, prioritize and manage risks from cybersecurity threats. Our efforts are designed to maintain the confidentiality, integrity and availability of our information and operational technology systems and data stored on those systems. In general, we seek to address cybersecurity risks through a risk-based, cross-functional approach that is focused on preserving the confidentiality, security and availability of our information and information systems, and to mitigate and respond effectively to cybersecurity incidents and threats. As appropriate, the Company engages external parties, including consultants, legal counsel and audit firms to enhance its cybersecurity oversight and assist with incident response. Our cybersecurity program includes:
Technical Safeguards
We deploy technical safeguards that are designed to protect our information systems from cybersecurity threats, including firewalls, intrusion prevention and endpoint detection and response systems, regular monitoring and access controls, which are evaluated and improved through vulnerability assessments and cybersecurity threat intelligence.
Security Policy and Requirements
We have an Information Security Policy that details the overall risk-based framework and governance for the management and security of our information technology assets and information. The policy applies to everyone who accesses our data or information resources, including third parties we engage.
Cybersecurity Roadmap and Risk Assessment
We have a cybersecurity roadmap, which was first implemented in 2020, that provides a framework for prioritizing and managing our ongoing cybersecurity program. We conduct periodic risk assessments based on the National Institute of Standards and Technology ("NIST") cybersecurity framework to identify and assess our cybersecurity risks, vulnerabilities and information security maturity assessments to evaluate the maturity stage of the overall cybersecurity program. The results of these assessments are reported to the Audit Committee of the Board and we adjust our cybersecurity roadmap, policies, processes and practices as necessary based on the information provided by these assessments as well as the monitoring, testing and auditing noted below.
Incident Response and Recovery Planning
We have an established incident response and recovery plan based on the NIST cybersecurity framework. The plan specifies the process for identifying, classifying, documenting and responding to cybersecurity incidents, including escalation protocols to ensure the involvement of our executive leadership, including our CEO, CFO, CIO and General Counsel so that decisions regarding the public disclosure and reporting of any incident can be made by executive management in a timely manner.
Third-Party Risk Management
We use a risk-based approach to identifying and overseeing cybersecurity risks presented by third parties, including vendors and service providers, as well as the systems of third parties that could adversely impact our business in the event of a cybersecurity incident affecting those third-party systems.
Monitoring Testing and Auditing
We monitor the evolving cybersecurity landscape that could result in new or increased cybersecurity threats. We also engage in the periodic assessment and testing of our policies, standards, processes and practices. These efforts include audits, vulnerability and penetration testing, table-top exercises, social engineering campaigns and other internal and external assessments. We evaluate the effectiveness of our information technology-related internal controls annually.
Education and Awareness
The Company also regularly conducts mandatory cybersecurity training for its employees and all new hires are required to take cybersecurity training when they receive their Company computer. Failure to complete the training in a timely fashion results in their system access being suspended until completion. Management also regularly conducts "phishing" exercises to test the effectiveness of our training programs. The results of these exercises are reported to the Audit Committee. Employees also receive monthly newsletters highlighting cybersecurity developments as well as targeted email messages, as appropriate.
Insurance
The Company maintains cybersecurity insurance coverage in an amount that management believes to be appropriate for the Company's risk profile.
Governance
Audit Committee Oversight
Our Audit Committee oversees the Company's cybersecurity risks. Ms. Dvorak has a certificate in Cybersecurity Oversight from the National Association of Corporate Directors and Mr. Burton is a technology expert with experience in online fraud and cybersecurity. Both Ms. Dvorak and Mr. Burton are members of our Audit Committee.
Our Senior Vice President and Chief Information Officer and our Vice President, Global Cybersecurity, update the Audit Committee regularly regarding the status of ongoing cybersecurity initiatives and strategies and incident reports. Annually, they also present information regarding management's annual cybersecurity risk and maturity assessments, including changes to our cybersecurity roadmap as a result of these assessments. This annual briefing is also posted to the full Board, which also receives quarterly updates through the Audit Committee. The Audit Committee is notified and briefed regularly in the event of a cybersecurity incident, regardless of the ultimate severity of the situation. The Board and executive management participate in cybersecurity training and conduct tabletop exercises on a periodic basis.
Management Oversight
At a management level, our cybersecurity program is led by our Vice President, Global Cybersecurity who oversees a team with extensive knowledge and expertise. He is a Certified Information Security Professional and has over 20 years of cybersecurity experience and reports to our Chief Information Officer, who reports to our Chief Executive Officer. Our Vice President, Global Cybersecurity also chairs our Cybersecurity Management Committee which consists of senior business and functional leaders, including our Chief Information Officer and General Counsel. The Cybersecurity Management Committee is intended to provide cross-functional support for cybersecurity risk management and facilitate the response to any cybersecurity incidents.
Cyber Risks, Threats and Incidents
As a global company servicing customers in over 100 countries, we experience a variety of cybersecurity events and incidents. However, as of the date of this Annual Report on Form 10-K, we are not aware of any cybersecurity incident that has materially affected or is reasonably likely to materially affect our business, strategy, results of operations or financial condition; though there can be no assurance that a cybersecurity incident that could have a material impact on us will not occur in the future. For further details regarding the cybersecurity risks and uncertainties we face see Item 1A. "Risk Factors-Technology and Cybersecurity Risks" of this report.
ITEM 2. PROPERTIES
We have manufacturing facilities in North America, Europe, Brazil, Mexico and Australia, and maintain distribution centers in the regional markets we service. We lease our corporate and U.S. headquarters in Lake Zurich, Illinois. The following table lists our other principal facilities by segment as of December 31, 2023:
| | | |
Location | Functional Use | | Owned/Leased (number of properties) |
ACCO Brands North America: | | | |
Burlingame, California | Office | | Leased |
Booneville, Mississippi | Distribution/Manufacturing | | Owned |
Sidney, New York(a) | Distribution/Manufacturing | | Owned |
Kettering, Ohio | Office | | Leased |
Alexandria, Pennsylvania | Distribution/Manufacturing | | Owned |
Woodinville, Washington | Office | | Leased |
Mississauga, Canada | Distribution/Manufacturing/Office | | Leased |
Hong Kong | Office | | Leased |
Taipei, Taiwan | Office | | Leased |
| | | |
ACCO Brands EMEA: | | | |
Sint-Niklaas, Belgium | Distribution/Manufacturing | | Leased |
Shanghai, China | Manufacturing | | Leased |
Aylesbury, England | Office | | Leased |
Halesowen, England | Distribution | | Owned |
Lillyhall, England | Manufacturing | | Leased |
Saint-Ame, France | Distribution | | Owned |
Heilbronn, Germany | Distribution | | Owned |
Stuttgart, Germany | Office | | Leased |
Uelzen, Germany | Manufacturing | | Owned |
Gorgonzola, Italy | Distribution/Manufacturing | | Leased |
Kozienice, Poland | Distribution/Manufacturing | | Owned |
Warsaw, Poland | Office | | Leased |
Arcos de Valdevez, Portugal(a) | Manufacturing | | Owned |
Hestra, Sweden | Distribution/Manufacturing/Office | | Owned |
| | | |
ACCO Brands International: | | | |
Sydney, Australia | Distribution/Manufacturing/Office | | Owned/Leased (2) |
Bauru, Brazil | Distribution/Manufacturing/Office | | Owned (2) |
Sao Paulo, Brazil | Manufacturing/Office | | Leased (2) |
Tokyo, Japan | Office | | Leased |
Lerma, Mexico | Manufacturing/Office | | Owned |
Mexico City, Mexico | Office | | Leased |
Auckland, New Zealand | Distribution/Office | | Leased |
Singapore | Distribution/Office | | Leased (2) |
| | | |
(a) Scheduled to be closed in 2024 | | | |
We believe that the properties are suitable to the respective businesses and have production capacities adequate to meet the needs of our businesses.
ITEM 3. LEGAL PROCEEDINGS
We are party to various lawsuits and regulatory proceedings, primarily related to alleged patent infringement, as well as other claims incidental to our business. In addition, we may be unaware of third-party claims of intellectual property infringement relating to our technology, brands, or products, and we may face other claims related to business operations. Any litigation regarding patents or other intellectual property could be costly and time-consuming and might require us to pay monetary damages or enter into costly license agreements. We also may be subject to injunctions against development and sale of certain of our products.
It is the opinion of management that (other than the Brazil Tax Assessments) the ultimate resolution of currently outstanding matters will not have a material adverse effect on our financial condition, results of operations or cash flow. However, there is no assurance that we will ultimately be successful in our defense of any of these matters or that an adverse outcome in any matter will not affect our results of operations, financial condition, or cash flow. Further, future claims, lawsuits and legal proceedings could materially and adversely affect our business, reputation, results of operations, and financial condition. For additional details regarding the Brazil Tax Assessments, see "Note 11. Income Taxes – Brazil Tax Assessments" to the consolidated financial statements contained in Part II, Item 8. of this report.
ITEM 4. MINE SAFETY DISCLOSURES
Not applicable.
PART II
ITEM 5. MARKET FOR REGISTRANT’S COMMON EQUITY, RELATED STOCKHOLDER MATTERS AND ISSUER PURCHASES OF EQUITY SECURITIES
Common Stock Information
Our common stock is traded on the New York Stock Exchange ("NYSE") under the symbol "ACCO." As of February 15, 2024 we had approximately 7,610 record holders of our common stock.
Stock Performance Graph
The following graph compares the cumulative total stockholder return on our common stock to that of the S&P Office Services and Supplies (SuperCap1500) Index and the Russell 2000 Index assuming an investment of $100 in each from December 31, 2018 through December 31, 2023.
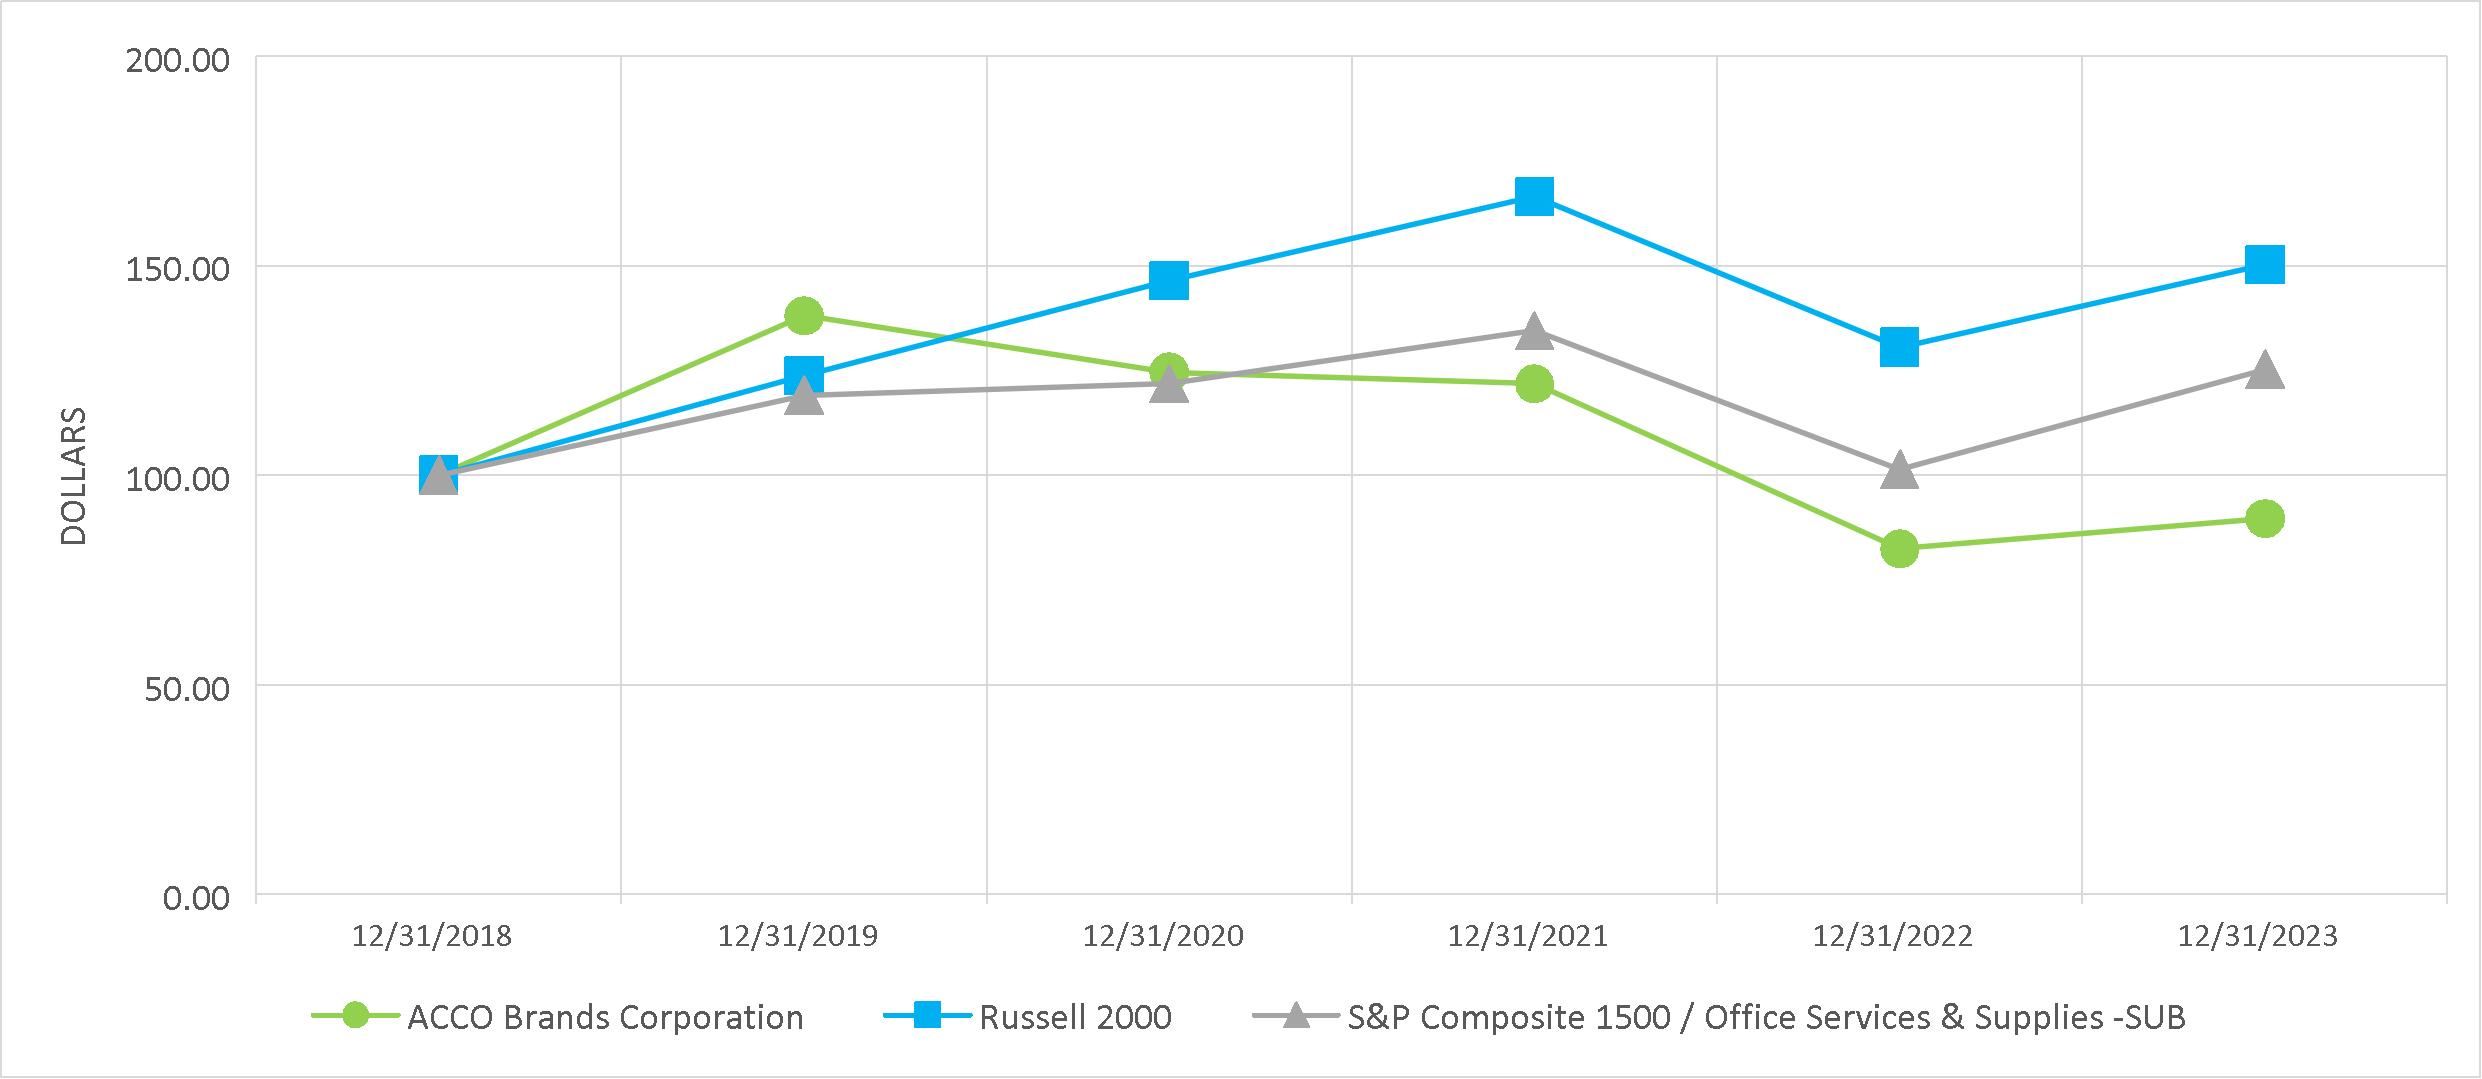
| | | | | | | | | | | | |
| | Cumulative Total Return |
| | 12/31/18 | | 12/31/19 | | 12/31/20 | | 12/31/21 | | 12/31/22 | | 12/31/23 |
ACCO Brands Corporation | | $100.00 | | $138.05 | | $124.63 | | $121.83 | | $82.45 | | $89.68 |
Russell 2000 | | 100.00 | | 123.72 | | 146.44 | | 166.50 | | 130.60 | | 150.31 |
S&P Office Services and Supplies
(SuperCap1500) | | 100.00 | | 119.09 | | 121.92 | | 134.46 | | 101.47 | | 125.28 |
Common Stock Purchases
The following table provides information about our purchases of equity securities during the quarter ended December 31, 2023:
| | | | | | | | | | | | | | | | |
Period | | Total Number
of Shares
Purchased | | | Average Price
Paid per Share | | | Total Number of
Shares Purchased as
Part of Publicly
Announced Plan or
Program(1) | | | Approximate Dollar
Value of Shares that
May Yet Be
Purchased Under the
Program(1) | |
October 1, 2023 to October 31, 2023 | | | — | | | $ | — | | | | — | | | $ | 105,645,579.0 | |
November 1, 2023 to November 30, 2023 | | | — | | | | — | | | | — | | | | 105,645,579.0 | |
December 1, 2023 to December 31, 2023 | | | — | | | | — | | | | — | | | | 105,645,579.0 | |
Total | | | — | | | $ | — | | | | — | | | $ | 105,645,579.0 | |
(1)On February 14, 2018, the Company announced that its Board of Directors authorized the repurchase of up to $100 million in shares of its common stock. On August 7, 2019, the Company announced that its Board of Directors had authorized the repurchase of up to an additional $100 million in shares of its common stock.
During the year ended December 31, 2023, we did not repurchase any of our common stock in the open market.
The number of shares to be purchased, if any, and the timing of purchases will be based on the Company's stock price, leverage ratios, cash balances, general business and market conditions, and other factors, including alternative investment opportunities and working capital needs. The Company may repurchase its shares, from time to time, through a variety of methods, including open-market purchases, privately negotiated transactions and block trades or pursuant to repurchase plans designed to comply with the Rule 10b5-1 of the Securities Exchange Act of 1934, as amended. Any stock repurchases will be subject to market conditions, SEC regulations and other considerations, and may be commenced or suspended at any time or from time to time, without prior notice. Accordingly, there is no guarantee as to the number of shares that will be repurchased or the timing of such repurchases.
Dividend Policy
In February 2018, the Company's Board of Directors approved the initiation of a dividend program under which the Company intends to pay a regular quarterly cash dividend. Dividend information for each quarter for the years ended December 31, 2023, 2022 and 2021 is summarized below:
| | | | | | | | | | | | |
| | 2023 | | | 2022 | | | 2021 | |
First quarter | | $ | 0.075 | | | $ | 0.075 | | | $ | 0.065 | |
Second quarter | | | 0.075 | | | | 0.075 | | | | 0.065 | |
Third quarter | | | 0.075 | | | | 0.075 | | | | 0.065 | |
Fourth quarter | | | 0.075 | | | | 0.075 | | | | 0.075 | |
Total | | $ | 0.300 | | | $ | 0.300 | | | $ | 0.270 | |
The continued declaration and payment of dividends is at the discretion of the Board of Directors and will be dependent upon, among other things, the Company's financial position, results of operations, cash flows and other factors. The Company currently believes its capital structure and cash resources can continue to support the funding of future dividends. Our long-term strategy remains to deploy cash to fund dividends, reduce debt, make acquisitions, and repurchase shares of our common stock.
ITEM 6. [RESERVED]
ITEM 7. MANAGEMENT’S DISCUSSION AND ANALYSIS OF FINANCIAL CONDITION AND RESULTS OF OPERATIONS
INTRODUCTION
Management’s Discussion and Analysis of Financial Condition and Results of Operations should be read in conjunction with the consolidated financial statements of ACCO Brands Corporation and the accompanying notes contained in Item 8. of this report. The following discussion and analysis are for the year ended December 31, 2023, compared with the same period in 2022 unless otherwise stated. For a discussion and analysis of the year ended December 31, 2022 compared with the same period in 2021, please refer to "Management’s Discussion and Analysis of Financial Condition and Results of Operations" included in Part II, Item 7. of our Annual Report on Form 10-K for the year ended December 31, 2022, filed with the Securities and Exchange Commission (the "SEC") on February 24, 2023.
Overview of the Company
ACCO Brands is a leading global consumer, technology and business branded products company, providing well-known brands and innovative product solutions used in schools, homes and at work. We have expanded into higher growth product categories, while increasing our sales mix to higher growth channels, including retail and mass merchants, e-tailers, and technology specialists. We have an experienced management team with a proven ability to grow brands, integrate acquisitions, manage seasonal businesses, run lean organizations and navigate challenging environments. Our products are sold primarily in the U.S., Europe, Australia, Canada, Brazil and Mexico.
ACCO Brands has three operating business segments based in different geographic regions: North America, EMEA, and International. Each business segment designs, markets, sources, manufactures, and sells recognized consumer, technology and business branded products used in schools, homes and at work. Product designs are tailored to end-user preferences in each geographic region, and where possible, leverage common engineering, design, and sourcing.
Our product categories include gaming and computer accessories; storage and organization; notebooks; shredding; laminating and binding machines; stapling; punching; planners; dry erase boards; and do-it-yourself tools, among others. We distribute our products through a wide variety of channels to ensure that our products are readily and conveniently available for purchase by consumers and other end-users, wherever they prefer to shop. These channels include mass retailers, e-tailers, discount, drug/grocery and variety chains, warehouse clubs, hardware and specialty stores, independent office product dealers, office superstores, wholesalers, contract stationers, and specialist technology businesses.
Overview of 2023 Financial Performance
During 2023, the Company continued to be impacted by softening global demand, reflecting a weaker macroeconomic environment. Inflationary pressures and higher interest rates have reduced both business and consumer discretionary spending, especially business IT spending. Lower than anticipated return to office trends also impacted year over year demand. In addition, major retailers in North America continued to focus on maintaining lower inventory levels.
In 2023, our net sales decreased $114.8 million, or 5.9 percent, compared to the prior year. The decrease was due to reduced volumes, reflecting the challenging macroeconomic environment, which led to lower global technology spending, and lower than anticipated return to office trends, partly offset by the benefit of global price increases, and favorable foreign exchange. Gross margin increased 420 basis points, or $46.0 million, compared to the prior-year period, primarily due to the cumulative effect of global price increases and cost reduction actions.
We reported operating income of $44.7 million in 2023 compared to $34.8 million in 2022. The increase was primarily due to the higher gross margin, and a lower non-cash goodwill impairment charge compared to the prior year, partially offset by higher restructuring charges and SG&A expenses,
We reported a net loss of $21.8 million, or $(0.23) per share, compared to a net loss of $13.2 million, or $(0.14) per share in the prior year. The reported net loss reflects higher interest and non-operating pension expenses.
Our operating cash flow for the year was cash provided of $128.7 million, compared to $77.6 million of cash provided in the prior year. Our seasonal operating cash flow followed our historic pattern of outflow in the first half followed by strong inflows in both quarters of the second half.
Consolidated Results of Operations for the Years Ended December 31, 2023 and 2022
| | | | | | | | | | | | | | | | | |
| | Year Ended
December 31, | | | Amount of Change |
(in millions, except per share data) | | 2023 | | | 2022 | | | $ | | | %/pts | | |
Net sales | | $ | 1,832.8 | | | $ | 1,947.6 | | | $ | (114.8 | ) | | | (5.9 | )% | |
Cost of products sold | | | 1,234.5 | | | | 1,395.3 | | | | (160.8 | ) | | | (11.5 | )% | |
Gross profit | | | 598.3 | | | | 552.3 | | | | 46.0 | | | | 8.3 | % | |
Gross profit margin | | | 32.6 | % | | | 28.4 | % | | | | | | 4.2 | | pts |
Selling, general and administrative expenses | | | 393.5 | | | | 376.7 | | | | 16.8 | | | | 4.5 | % | |
SG&A% to net sales | | | 21.5 | % | | | 19.3 | % | | | | | | 2.2 | | pts |
Amortization of intangibles | | | 43.4 | | | | 41.5 | | | | 1.9 | | | | 4.6 | % | |
Restructuring charges | | | 27.2 | | | | 9.6 | | | | 17.6 | | | NM | | |
Goodwill impairment | | | 89.5 | | | | 98.7 | | | | (9.2 | ) | | | (9.3 | )% | |
Change in fair value of contingent consideration | | | — | | | | (9.0 | ) | | | 9.0 | | | | (100.0 | )% | |
Operating income | | | 44.7 | | | | 34.8 | | | | 9.9 | | | | 28.4 | % | |
Operating income margin | | | 2.4 | % | | | 1.8 | % | | | | | | 0.6 | | pts |
Interest expense | | | 58.6 | | | | 45.6 | | | | 13.0 | | | | 28.5 | % | |
Interest income | | | (7.1 | ) | | | (8.3 | ) | | | 1.2 | | | | (14.5 | )% | |
Non-operating pension expense (income) | | | 1.8 | | | | (4.5 | ) | | | 6.3 | | | NM | | |
Other expense (income), net | | | 4.5 | | | | (12.9 | ) | | | 17.4 | | | NM | | |
(Loss) income before income tax | | | (13.1 | ) | | | 14.9 | | | | (28.0 | ) | | NM | | |
Income tax expense | | | 8.7 | | | | 28.1 | | | | (19.4 | ) | | | (69.0 | )% | |
Effective tax rate | | | (66.4 | )% | | | 188.6 | % | | | | | NM | | |
Net (loss) income | | | (21.8 | ) | | | (13.2 | ) | | | (8.6 | ) | | | 65.2 | % | |
Weighted average number of diluted shares outstanding: | | | 95.3 | | | | 95.3 | | | | - | | | | — | % | |
Diluted loss per share | | $ | (0.23 | ) | | $ | (0.14 | ) | | $ | (0.09 | ) | | | 64.3 | % | |
Comparable sales (Non-GAAP)(1) | | $ | 1,821.5 | | | $ | 1,947.6 | | | $ | (126.1 | ) | | | (6.5 | )% | |
Net Sales
For the year ended December 31, 2023, net sales decreased $114.8 million, or 5.9 percent. Favorable foreign exchange increased sales $11.3 million, or 0.6 percent. Comparable net sales decreased 6.5 percent. The sales declines were driven by lower volume of 13.3 percent across all three segments due to the challenging macroeconomic environment, lower than anticipated return to office trends and tight inventory management by our customers primarily in North America. Sales of technology accessories were most negatively impacted. The volume decline more than offset the benefit of global price increases which added 6.8 percent.
Cost of Products Sold
Cost of products sold includes all manufacturing, product sourcing and distribution costs, including depreciation related to assets used in manufacturing; procurement and distribution processes; allocation of certain information technology costs supporting those processes; inbound and outbound freight; shipping and handling costs; purchasing costs associated with materials and packaging used in the production processes; and inventory valuation adjustments.
For the year ended December 31, 2023, cost of products sold decreased $160.8 million, or 11.5 percent, primarily due to lower net sales and the favorable impact of global restructuring and cost reduction initiatives. Adverse foreign exchange increased cost of products sold by $5.3 million, or 0.4 percent.
Cost of products sold remains high from the inflationary impacts over the last few years. We are beginning to see moderating inflation, but there can be no assurance that it will abate.
Gross Profit
For the year ended December 31, 2023, gross profit increased $46.0 million, or 8.3 percent. Gross profit margin increased 420 basis points reflecting the cumulative effect of global price increases and lower cost of goods. Favorable foreign exchange increased gross profit by $6.0 million, or 1.1 percent.
Selling, General and Administrative Expenses
Selling, general and administrative expenses ("SG&A") include advertising, marketing, selling (including commissions), research and development, customer service, depreciation related to assets outside the manufacturing and distribution processes, and all other general and administrative expenses outside the manufacturing and distribution functions (e.g., finance, human resources, information technology).
For the year ended December 31, 2023, SG&A increased $16.8 million, or 4.5 percent, primarily due to higher people costs, including higher incentive compensation expense, partially offset by the impact of cost reduction actions. Adverse foreign exchange, increased SG&A by $1.4 million, or 0.4 percent.
Restructuring Charges
For the year ended December 31, 2023, restructuring charges were $27.2 million compared with $9.6 million in 2022. The higher restructuring expense in the current year was primarily for severance costs and other costs associated with our continuing footprint rationalization and cost reduction programs.
Change in Fair Value of Contingent Consideration
In the prior year, the change in fair value of contingent consideration from the PowerA earnout resulted in a benefit of $9.0 million that did not repeat.
Goodwill Impairment
For the year ended December 31, 2023, we recorded a non-cash goodwill impairment charge of $89.5 million for our North America reporting unit compared to $98.7 million in the prior year. Our goodwill balance could be at risk of further impairment if operating performance is not as expected.
See "Note 9. Goodwill and Identifiable Intangible Assets" to the consolidated financial statements contained in Part II, Item 8. of this report for more information.
Operating Income
For the year ended December 31, 2023, operating income increased $9.9 million to $44.7 million compared to $34.8 million in the prior year. The increase in operating income was primarily due to higher gross profit of $46.0 million and a lower non-cash goodwill impairment charge of $9.2 million, partially offset by a $17.6 million increase in restructuring expense and a $16.8 million increase in SG&A expense. Foreign exchange increased operating income $4.1 million, or 11.8 percent.
Interest Expense
For the year ended December 31, 2023, interest expense increased $13.0 million, primarily due to higher variable interest rates versus the prior year. The weighted average interest rate on $350.6 million of outstanding variable rate debt as of December 31, 2023, increased to 6.38 percent from 4.90 percent in the prior year. We expect higher interest expense to continue given the current interest rate environment.
Non-operating pension (expense) income
For the year ended December 31, 2023, non-operating pension expense was $1.8 million compared to income of $4.5 million for the year ended December 31, 2022. The increase in expense of $6.3 million was due to changes in assumptions used in our annual pension valuation, including higher interest rates.
Other Expense (Income), Net
For the year ended December 31, 2023, we reported other expense of $4.5 million, compared to other income of $12.9 million for the year ended December 31, 2022. The increase in expense of $17.4 million was primarily due to a $5.1 million charge in 2023 related to exiting certain product lines and a $9.9 million reduction in Brazil tax credits compared to the prior year.
Income Tax Expense
For the year ended December 31, 2023, we recorded income tax expense of $8.7 million on loss before taxes of $13.1 million. This compared with an income tax expense of $28.1 million on income before taxes of $14.9 million for the year ended December 31, 2022. The reduction in income tax expense was due primarily to the reduction in pretax book income, tax law changes allowing Brazilian taxes paid to be creditable for U.S. tax purposes of $6.3 million, and release of unrecognized tax benefits related to the Brazil Tax Assessments of $13.3 million.
See "Note 11. Income Taxes" to the Consolidated Financial Statements contained in Part II, Item 8. of this report for more information.
Net Income (Loss)/Diluted Income (Loss) per Share
For the year ended December 31, 2023, net loss was $21.8 million, or $(0.23) per share, compared to a net loss of $13.2 million, or $(0.14) per share, in the prior year.
Segment Net Sales and Operating Income for the Years Ended December 31, 2023 and 2022
ACCO Brands North America
| | | | | | | | | | | | | | | | | |
| | Year Ended
December 31, | | | Amount of Change |
(in millions) | | 2023 | | | 2022 | | | $ | | | %/pts | | |
Net sales | | $ | 887.2 | | | $ | 998.0 | | | $ | (110.8 | ) | | | (11.1 | )% | |
Segment operating loss⁽¹⁾ | | | (5.9 | ) | | | (4.9 | ) | | | (1.0 | ) | | | 20.4 | % | |
Segment operating loss margin | | | (0.7 | )% | | | (0.5 | )% | | | | | | (0.2 | ) | pts |
Comparable sales (Non-GAAP)⁽²⁾ | | $ | 891.1 | | | $ | 998.0 | | | $ | (106.9 | ) | | | (10.7 | )% | |
(1)Segment operating loss for North America includes goodwill impairment charges but excludes corporate costs. See "Note 17. Information on Business Segments" to the consolidated financial statements contained in Part II, Item 8. of this report for a reconciliation of total "Segment operating (loss) income" to "(Loss) income before income tax."
(2)See reconciliation to GAAP, contained in Part II, Item 7. "Supplemental Non-GAAP Financial Measures" of this report.
For the year ended December 31, 2023, net sales decreased $110.8 million, or 11.1 percent. Price increases added $44.1 million, or 4.4 percent, but were more than offset by volume which decreased $151.1 million, or 15.1 percent. The volume decline was due to a weaker macroeconomic environment, lower than anticipated return to office trends and retailers maintaining lower inventory levels, which resulted in lower demand for technology accessories and office products. Adverse foreign exchange reduced net sales $3.9 million, or 0.4 percent.
For the year ended December 31, 2023, operating loss increased $1.0 million to $5.9 million from $4.9 million in the prior year. The increase in operating loss was due to higher restructuring charges of $11.4 million related to our cost reduction and productivity programs, partly offset by a lower non-cash goodwill impairment charge in the current year of $89.5 million versus $98.7 million in the prior year.
ACCO Brands EMEA
| | | | | | | | | | | | | | | | | |
| | Year Ended
December 31, | | | Amount of Change |
(in millions) | | 2023 | | | 2022 | | | $ | | | %/pts | | |
Net sales | | $ | 547.2 | | | $ | 580.3 | | | $ | (33.1 | ) | | | (5.7 | )% | |
Segment operating income⁽¹⁾ | | | 38.7 | | | | 21.7 | | | | 17.0 | | | | 78.3 | % | |
Segment operating income margin | | | 7.1 | % | | | 3.7 | % | | | | | | 3.4 | | pts |
Comparable sales (Non-GAAP)⁽²⁾ | | $ | 541.7 | | | $ | 580.3 | | | $ | (38.6 | ) | | | (6.7 | )% | |
(1)Segment operating income for EMEA excludes corporate costs. See "Note 17. Information on Business Segments" to the consolidated financial statements contained in Part II, Item 8. of this report for a reconciliation of total "Segment (loss) operating income" to "(Loss) income before income tax."
(2)See reconciliation to GAAP, contained in Part II, Item 7. "Supplemental Non-GAAP Financial Measures" of this report.
For the year ended December 31, 2023, net sales decreased $33.1 million, or 5.7 percent. Favorable foreign exchange increased sales $5.5 million, or 1.0 percent. Comparable sales decreased 6.7 percent mainly due to lower volume, which was down $99.2 million, or 17.1 percent. The lower volume was partly offset by price increases of $60.6 million, or 10.4 percent. The lower volume reflects reduced demand, especially for technology accessories, due to a weaker macroeconomic environment.
For the year ended December 31, 2023, operating income increased $17.0 million, or 78.3 percent. Operating income increased primarily due to the cumulative effect of price increases and cost savings actions, which more than offset a $5.5 million increase in restructuring charges, negative fixed cost leverage and higher incentive compensation. Favorable foreign exchange increased operating income by $1.2 million, or 5.5 percent.
ACCO Brands International
| | | | | | | | | | | | | | | | | |
| | Year Ended
December 31, | | | Amount of Change |
(in millions) | | 2023 | | | 2022 | | | $ | | | %/pts | | |
Net sales | | $ | 398.4 | | | $ | 369.3 | | | $ | 29.1 | | | | 7.9 | % | |
Segment operating income⁽¹⁾ | | | 60.7 | | | | 50.5 | | | | 10.2 | | | | 20.2 | % | |
Segment operating income margin | | | 15.2 | % | | | 13.7 | % | | | | | | 1.5 | | pts |
Comparable sales (Non-GAAP)⁽²⁾ | | $ | 388.7 | | | $ | 369.3 | | | $ | 19.4 | | | | 5.3 | % | |
(1)Segment operating income for International excludes corporate costs. See "Note 17. Information on Business Segments" to the consolidated financial statements contained in Part II, Item 8. of this report for a reconciliation of total "Segment operating (loss) income" to "(Loss) income before income tax."
(2)See reconciliation to GAAP, contained in Part II, Item 7. "Supplemental Non-GAAP Financial Measures" of this report.
For the year ended December 31, 2023, net sales increased $29.1 million, or 7.9 percent. Favorable foreign exchange increased sales $9.7 million, or 2.6 percent. Comparable sales increased 5.3 percent, primarily due to price increases which added $27.6 million, or 7.5 percent, partly offset by lower volume of $8.1 million, or 2.2 percent. The lower volume reflects reduced demand due to a weaker macroeconomic environment in Australia and Asia, especially for technology accessories, partially offset by volume growth in Latin America.
For the year ended December 31, 2023, operating income increased $10.2 million, or 20.2 percent, primarily due to pricing and cost actions, partially offset by an increase in go-to-market spending, and people costs, including incentive compensation. Favorable foreign exchange increased operating income by $3.3 million, or 6.5 percent.
Liquidity and Capital Resources
Our primary liquidity needs are to support our working capital requirements, service indebtedness and fund capital expenditures, dividends, repurchase stock, and acquisitions. Our principal sources of liquidity are cash flows from operating activities, cash and cash equivalents held and seasonal borrowings under our $600 million multi-currency revolving credit facility (the "Revolving Facility"). As of December 31, 2023, there was $21.6 million in borrowings outstanding under the Revolving Facility ($7.3 million reported in "Current portion of long-term debt" and $14.3 million reported in "Long-term debt, net"), and the amount available for borrowings was $565.7 million (allowing for $12.7 million of letters of credit outstanding on that date). We had $66.4 million in cash on hand as of December 31, 2023.
Because of the seasonality of our business, all our operating cash flow is generated in the second half of the year, as the cash inflows in the first and second quarters are consumed building working capital and for making our annual performance-based compensation payments, when earned. Our third and fourth quarter cash flow comes from completing the working capital cycle. Our 2023 operating cash flow followed our historical seasonal pattern.
Debt
The $350.6 million of debt currently outstanding under our senior secured credit facilities has a weighted average interest rate of 6.75 percent as of December 31, 2023, and the $575.0 million outstanding principal amount of our senior unsecured notes due March 2029 ("Senior Unsecured Notes") has a fixed interest rate of 4.25 percent.
Effective November 7, 2022, the Company entered into a Sixth Amendment (the "Sixth Amendment") to its Third Amended and Restated Credit Agreement, as amended, among the Company, certain subsidiaries of the Company, Bank of America, N.A., as administrative agent, and the other lenders party thereto (the "Credit Agreement"). Pursuant to the Sixth Amendment, the Credit Agreement was amended to, among other things:
•increase the maximum Consolidated Leverage Ratio financial covenant from then current levels for each of the five fiscal quarters beginning December 31, 2022, and ending December 31, 2023, as follows:
| | |
Quarter Ended | | Maximum Consolidated Leverage Ratio |
December 2022 | | 4.50:1.00 |
March 2023 | | 5.00:1.00 |
June 2023 | | 5.00:1.00 |
September 2023 | | 4.75:1.00 |
December 2023 | | 4.25:1.00 |
•modify the maximum Consolidated Leverage Ratio financial covenant for all first and second fiscal quarters after December 31, 2023, from the current level of 4.00x to 4.50x, while maintaining the current level of 4.00x for all third and fourth fiscal quarters;
•limit the maximum Consolidated Leverage Ratio to 5.00:1.00 at any time, thereby capping any material acquisition step ups for the fiscal quarters ending March 31, 2023, June 30, 2023 and September 30, 2023;
•increase the Company’s flexibility under the restricted payments baskets; and
•change the U.S. dollar reference rate from LIBOR-based pricing to SOFR-based pricing, with no changes to existing margins.
The current maturity of the Credit Agreement, as amended, is March 31, 2026.
Financial Covenants
As of December 31, 2023, our Consolidated Leverage Ratio was approximately 3.42 to 1.00 versus our maximum covenant of 4.25 to 1.00. Our Interest Coverage Ratio was approximately 5.18 to 1.00 versus the minimum covenant of 3.00 to 1.00.
Other Covenants and Restrictions
The Credit Agreement, as amended, contains customary affirmative and negative covenants as well as events of default, including payment defaults, breach of representations and warranties, covenant defaults, cross-defaults, certain bankruptcy or insolvency events, certain ERISA-related events, changes in control or ownership and invalidity of any loan document. The Credit Agreement, as amended, also establishes limitations on the aggregate amount of Permitted Acquisitions and Investments (each as defined in the Credit Agreement, as amended) that the Company and its subsidiaries may make during the term of the Credit Agreement, as amended.
As of and for the periods ended December 31, 2023 and December 31, 2022, the Company was in compliance with all applicable loan covenants under its senior secured credit facilities and the Senior Unsecured Notes.
Guarantees and Security
Generally, obligations under the Credit Agreement, as amended, are guaranteed by certain of the Company's existing and future subsidiaries, and are secured by substantially all of the Company's and certain guarantor subsidiaries' assets, subject to certain exclusions and limitations.
For further information, see "Note 3. Long-term Debt and Short-term Borrowings" to the consolidated financial statements contained in Part II. Item 8. of this report.
Restructuring
The Company may implement restructuring, realignment or cost-reduction plans and activities, including those related to integrating acquired businesses.
During the year ended December 31, 2023, the Company recorded $27.2 million in restructuring expenses: $16.7 million of restructuring expense for our North America segment; $8.9 million for our EMEA segment; $1.0 million for our International segment; and $0.6 million for Corporate. Restructuring charges in 2023 were primarily for severance costs related to cost reduction initiatives.
On January 30, 2024, the Company announced a multi-year restructuring and cost savings program, with anticipated annualized pre-tax cost savings of at least $60.0 million. The program incorporates initiatives to simplify and delayer the Company's operating structure and reduce costs through headcount reductions, supply chain optimization, global footprint rationalization, and better leveraging the Company's sourcing capabilities. As a result of these actions, the Company will improve its speed of execution and bring key leaders closer to customers.
For further information, see "Note 10. Restructuring" to the consolidated financial statements contained in Part II. Item 8. of this report.
Cash Flow for the Years Ended December 31, 2023 and 2022
During the year ended December 31, 2023, our cash and cash equivalents increased $4.2 million compared to an increase of $21.0 million during the prior year. The following table summarizes our cash flows for the periods presented:
| | | | | | | | | | | | |
| | Year Ended December 31, | | | | |
(in millions) | | 2023 | | | 2022 | | | Amount of Change | |
Net cash flow (used in) provided by: | | | | | | | | | |
Operating activities | | $ | 128.7 | | | $ | 77.6 | | | $ | 51.1 | |
Investing activities | | | (11.2 | ) | | | (9.3 | ) | | | (1.9 | ) |
| | | | | | | | | |
Net (repayments) borrowings | | | (87.5 | ) | | | 16.9 | | | | (104.4 | ) |
Dividends paid | | | (28.5 | ) | | | (28.6 | ) | | | 0.1 | |
All other financing | | | (1.7 | ) | | | (36.6 | ) | | | 34.9 | |
Financing activities | | | (117.7 | ) | | | (48.3 | ) | | | (69.4 | ) |
Effect of foreign exchange rate changes on cash and cash equivalents | | | 4.4 | | | | 1.0 | | | | 3.4 | |
Net increase in cash and cash equivalents | | $ | 4.2 | | | $ | 21.0 | | | $ | (16.8 | ) |
Cash Flow from Operating Activities
Cash provided by operating activities during the twelve months ended December 31, 2023, increased $51.1 million compared to the prior year. The increase in cash provided by operating activities was driven by lower cash payments for operating expenses in 2023 compared to the prior year, which was partially offset by higher cash payments for interest and taxes and an increase in cash used for investments in our trade working capital, which includes accounts receivable, inventory and accounts payable.
Cash Flow from Investing Activities
Cash used by investing activities during the twelve months ended December 31, 2023, increased $1.9 million compared to the prior year. The increase was primarily due to proceeds from the sale of our Ogdensburg, New York facility of $6.6 million in
the prior year, exceeding proceeds from the sale of our facility in Japan of $2.2 million in the current year. Partially offsetting this was a reduction in capital expenditures of $2.7 million.
Cash Flow from Financing Activities
Cash used by financing activities during the twelve months ended December 31, 2023, increased $69.4 million compared to the prior year. During the current year we used $87.5 million of cash to pay down our net borrowings and during the prior year we had a cash inflow from an increase in debt of $16.9 million. During the prior year we used cash to repurchase shares of $19.4 million and paid a contingent earnout of $17.8 million.
Capitalization
The Company had 94.9 million and 94.3 million shares of common stock outstanding as of December 31, 2023, and 2022, respectively.
Adequacy of Liquidity Sources
Based on our 2024 business plan and current forecasts, we believe that cash flow from operations, our current cash balance and borrowings available under our Revolving Facility will be adequate to support our requirements for working capital, capital expenditures, dividend payments, share repurchases and debt service in both the short and long-term. Our future operating performance is dependent on many factors, some of which are beyond our control, including prevailing economic, financial and industry conditions. For further information on these risks, see "Part I, Item1A. Risk Factors" of this report.
Off-Balance-Sheet Arrangements and Contractual Financial Obligations
The Company does not have any material off-balance-sheet arrangements that have, or are reasonably likely to have, a current or future effect on our financial condition, changes in financial condition, revenues or expenses, results of operations, liquidity, capital expenditures or capital resources.
Our contractual obligations and related payments by period as of December 31, 2023 were as follows:
| | | | | | | | | | | | | | | | | | | | |
(in millions) | | 2024 | | | 2025 - 2026 | | | 2027 - 2028 | | | Thereafter | | | Total | |
Debt | | $ | 36.7 | | | $ | 313.9 | | | $ | — | | | $ | 575.0 | | | $ | 925.6 | |
Interest on debt(1) | | | 45.6 | | | | 71.9 | | | | 48.9 | | | | 5.1 | | | | 171.5 | |
Operating lease obligations(2) | | | 26.6 | | | | 44.2 | | | | 26.8 | | | | 25.5 | | | | 123.1 | |
Purchase obligations(3) | | | 102.1 | | | | 10.0 | | | | 0.3 | | | | 0.1 | | | | 112.5 | |
Transition Toll Tax(4) | | | 7.7 | | | | 9.6 | | | | — | | | | — | | | | 17.3 | |
Other long-term liabilities(5) | | | 16.0 | | | | 15.6 | | | | 15.7 | | | | 38.9 | | | | 86.2 | |
Total | | $ | 234.7 | | | $ | 465.2 | | | $ | 91.7 | | | $ | 644.6 | | | $ | 1,436.2 | |
(1)Interest calculated at December 31, 2023, rates for variable rate debt.
(2)For further information on leases, see "Note 4. Leases" to the consolidated financial statements contained in Item 8. of this report.
(3)Purchase obligations primarily consist of contracts and non-cancelable purchase orders for raw materials and finished goods.
(4)The U.S. Tax Cuts and Jobs Act requires companies to pay a one-time Transition Toll Tax, which is payable over eight years.
(5)Other long-term liabilities consist of estimated expected employer contributions for 2024, along with estimated future payments for pension and post-retirement plans that are not paid from assets held in a plan trust.
Due to the uncertainty with respect to the timing of future cash flows associated with our unrecognized tax benefits at December 31, 2023, we are unable to make reasonably reliable estimates of the period of cash settlement with the respective taxing authorities. Therefore, $28.0 million of unrecognized tax benefits have been excluded from the contractual obligations
table above. For further information, see "Note 11. Income Taxes" to the consolidated financial statements contained in Part II. Item 8. of this report.
Critical Accounting Policies
Our financial statements are prepared in conformity with generally accepted accounting principles in the U.S. ("GAAP"). Preparation of our financial statements requires us to make judgments, estimates and assumptions that affect the reported amounts of assets, liabilities, revenues and expenses presented for each reporting period in the financial statements and the related accompanying notes. Actual results could differ significantly from those estimates. We regularly review our assumptions and estimates, which are based on historical experience and, where appropriate, current business trends. We believe that the following discussion addresses our critical accounting policies, which require significant, subjective and complex judgments to be made by our management.
Revenue Recognition
Revenue is recognized when control of the promised goods or services is transferred to our customers in an amount reflective of the consideration we expect to receive in exchange for those goods or services. Taxes we collect concurrent with revenue producing activities are excluded from revenue. Incidental items incurred that are immaterial in the context of the contract are expensed.
At the inception of each contract, the Company assesses the products and services promised and identifies each distinct performance obligation. To identify the performance obligations, the Company considers all products and services promised regardless of whether they are explicitly stated or implied within the contract or by standard business practices.
For our products, we transfer control and recognize a sale primarily when we either ship the product from our manufacturing facility or distribution center, or upon delivery to a customer-specified location depending upon the terms in the customer agreement. In addition, we recognize revenue for private label products as the product is manufactured (or over time) when a contract has an enforceable right to payment. For consignment arrangements, revenue is not recognized until the products are sold to the end customer.
Customer programs and incentives ("Customer Program Costs") are a common practice in our industry. We incur Customer Program Costs to obtain favorable product placement, to promote sell-through of products and to maintain competitive pricing. The amount of consideration we receive and revenue we recognize is impacted by Customer Program Costs, including sales rebates; in-store promotional allowances; shared media and customer catalog allowances; other cooperative advertising arrangements; freight allowance programs offered to our customers; allowances for discounts and reserves for returns. We recognize Customer Program Costs, primarily as a deduction to gross sales, at the time that the associated revenue is recognized. Customer Program Costs are based on management's best estimates using the most likely amount method and is an amount that is probable of not being reversed. In the absence of a signed contract, estimates are based on historical or projected experience for each program type or customer. We adjust our estimate of revenue when the most likely amount of consideration we expect to receive changes.
Inventories
Inventories are priced at the lower of cost (principally first-in, first-out) or net realizable value. When necessary, the write-down of inventory to its net realizable value is recorded for obsolete or slow-moving inventory based on assumptions about future demand and marketability of products, the impact of new product introductions and specific identification of items, such as product discontinuance or engineering/material changes. These estimates could vary significantly, either favorably or unfavorably, from actual requirements if future economic conditions, customer inventory levels or competitive conditions differ from our expectations.
Intangible Assets
Intangible assets are comprised primarily of indefinite-lived and amortizable intangible assets acquired and arising from the application of purchase accounting. Indefinite-lived intangible assets are not amortized, but are evaluated at least annually to determine whether the indefinite useful life is appropriate. Certain of our trade names have been assigned an indefinite life as we currently anticipate that these trade names will contribute cash flows to ACCO Brands indefinitely. Amortizable intangible assets are amortized over their useful lives.
We test indefinite-lived intangibles for impairment annually, during the second quarter, and during any interim period when market or business events indicate there may be a potential adverse impact on a particular intangible. The test may be on a qualitative or quantitative basis as allowed by GAAP. We consider the implications of both external factors (e.g., market growth, pricing, competition, and technology) and internal factors (e.g., product costs, margins, support expenses, and capital investment) and their potential impact on cash flows in both the near and long term, as well as their impact on any identifiable intangible asset associated with the business. Based on recent business results, consideration of significant external and internal factors, and the resulting business projections, indefinite-lived intangible assets are reviewed to determine whether they are likely to remain indefinite-lived, or whether a finite life is more appropriate. In addition, based on events in the period and future expectations, management considers whether the potential for impairment exists. Finite lived intangibles are amortized over 5, 7, 10, 15, 23 or 30 years.
Effective January 1, 2023, we changed the indefinite-lived Leitz® trade name to an amortizable intangible asset and began amortizing the trade name on a straight-line basis over a life of 30 years. The change was made as a result of decisions regarding the Company's future use of the trade name.
Goodwill
Goodwill has been recorded on our balance sheet and represents the excess of the cost of an acquisition when compared with the fair value of the net assets acquired. The authoritative guidance on goodwill and other intangible assets requires that goodwill be tested for impairment at a reporting unit level. We have determined that our reporting units are North America, EMEA and International.
We test goodwill for impairment annually, during the second quarter, or any interim period when market or business events indicate there may be a potential adverse impact on goodwill. As permitted by GAAP, we may perform a qualitative assessment to determine if it is more likely than not that the fair value of a reporting unit is less than its carrying amount as a basis for determining whether it is necessary to perform a quantitative goodwill impairment test as required by GAAP. We performed our annual assessment in the second quarter of 2023, on a qualitative basis, and concluded that it was not more likely than not that the fair value of any reporting unit was less than its carrying amount.
During the fourth quarter of 2023, our forecasted cash flows for our North America reporting unit further declined, including lower demand for our technology accessories, due to a weaker macroeconomic environment, as well as tight inventory management by retail customers. As a result, we identified a triggering event indicating it was more likely than not that an impairment loss had been incurred. Accordingly, as of December 31, 2023, we completed an impairment assessment, on a quantitative basis, for goodwill for each of our three reporting units. The result of our assessment was that the fair value of the North America reporting unit did not exceed its carrying value resulting in an impairment charge of $89.5 million. The result of our assessments for the International and EMEA reporting units was that the fair value of each exceeded its carrying values by approximately ten percent and greater than fifty percent, respectively, and we concluded that no impairment existed.
Estimating the fair value of each reporting unit requires us to make assumptions and estimates regarding our future. We utilized a combination of both a discounted cash flows and market approach. The financial projections used in the valuation models reflected management's assumptions regarding revenue growth rates, economic and market trends, cost structure, discount rate, and other expectations about the anticipated short-term and long-term operating results for each of our three reporting units.
We believe the assumptions used in our goodwill impairment analysis are appropriate and result in reasonable estimates of the implied fair value of each reporting unit. However, given the economic environment and the uncertainties regarding the impact on our business, there can be no assurance that our estimates and assumptions, made for purposes of our goodwill impairment testing, will prove to be an accurate prediction of the future. If our assumptions regarding future performance are not achieved, we may be required to record additional goodwill impairment charges in future periods.
Employee Benefit Plans
We provide a range of benefits to our employees and retired employees, including pension, post-retirement, post-employment and health care benefits. We record annual amounts relating to these plans based on calculations specified by GAAP, which include various actuarial assumptions, including discount rates, assumed rates of return, mortality rate tables, compensation increases, turnover rates and health care cost trends. Actuarial assumptions are reviewed on an annual basis and modifications to these assumptions are made based on current rates and trends when it is deemed appropriate. As required by GAAP, the effect of our modifications and unrecognized actuarial gains and losses are generally recorded to a separate component of accumulated other comprehensive income (loss) ("AOCI") in stockholders’ equity and amortized over future periods. We believe that the assumptions utilized in recording our obligations under the plans are reasonable based on our experience. The actuarial assumptions used to record our plan obligations could differ materially from actual results due to changing economic and market conditions, higher or lower withdrawal rates or other factors which may impact the amount of retirement-related benefit expense recorded by us in future periods.
The discount rate assumptions used to determine the pension and post-retirement obligations of the benefit plans are based on a spot-rate yield curve that matches projected future benefit payments with the appropriate interest rate applicable to the timing of the projected future benefit payments. For the majority of the obligations, the assumed discount rates reflect market rates for high-quality corporate bonds currently available and were determined by constructing a yield curve based on a large population of high-quality corporate bonds. Where the corporate bond market is not sufficiently deep, government bond yields are used instead. The resulting discount rates reflect the matching of plan liability cash flows to the yield curves.
For the ACCO Europe Pension Plan, the Company’s discount rate assumption methodology was based on the yield curve that uses a dataset of bonds rated AA by at least one of the main rating agencies.
The expected long-term rate of return on plan assets reflects management’s expectations of long-term average rates of return on funds invested based on our investment profile to provide for benefits included in the projected benefit obligations. The expected return is based on the outlook for inflation, fixed income returns and equity returns, while also considering historical returns over the last 10 years, asset allocation and investment strategy.
We estimate the service and interest components of net periodic benefit cost (income) for pension and post-retirement benefits utilizing a full yield curve approach by applying the specific spot rates along the yield curve used in the determination of the benefit obligation to the relevant projected cash flows.
At the end of each calendar year an actuarial evaluation is performed to determine the funded status of our pension and post-retirement obligations and any actuarial gain or loss is recognized in AOCI and then amortized into the income statement in future periods, based on the average remaining lifetime or average remaining service expected.
Pension expense was $2.8 million and pension income was $3.1 million and $5.4 million for the years ended December 31, 2023, 2022, and 2021, respectively. Post-retirement income was $0.3 million for the year ended December 31, 2023, and $0.4 million for each of the years ended December 31, 2022 and 2021. The increase in pension expense was due to higher discount rates in our pension plans.
The weighted average assumptions used to determine benefit obligations for the years ended December 31, 2023, 2022, and 2021 were as follows:
| | | | | | | | | | | | | | | | | | |
| | Pension | | Post-retirement |
| | U.S. | | International | | |
| | 2023 | | 2022 | | 2021 | | 2023 | | 2022 | | 2021 | | 2023 | | 2022 | | 2021 |
Discount rate | | 5.0 % | | 5.1 % | | 2.9 % | | 4.2 % | | 4.5 % | | 1.8 % | | 4.8 % | | 3.8 % | | 2.4 % |
Rate of compensation increase | | N/A | | N/A | | N/A | | 2.9 % | | 3.0 % | | 3.0 % | | N/A | | N/A | | N/A |
The weighted average assumptions used to determine net periodic benefit cost for the years ended December 31, 2023, 2022 and 2021 were as follows:
| | | | | | | | | | | | | | | | | | |
| | Pension | | Post-retirement |
| | U.S. | | International | | |
| | 2023 | | 2022 | | 2021 | | 2023 | | 2022 | | 2021 | | 2023 | | 2022 | | 2021 |
Discount rate | | 5.1 % | | 2.9 % | | 3.1 % | | 4.5 % | | 1.8 % | | 1.0 % | | 5.0 % | | 2.4 % | | 2.2 % |
Expected long-term rate of return | | 7.5 % | | 6.5 % | | 6.8 % | | 6.9 % | | 4.0 % | | 4.0 % | | N/A | | N/A | | N/A |
Rate of compensation increase | | N/A | | N/A | | N/A | | 3.0 % | | 3.0 % | | 2.7 % | | N/A | | N/A | | N/A |
In 2024, we expect pension income of approximately $0.3 million and post-retirement expense of approximately $2.5 million.
A 25-basis point decrease (0.25 percent) in our discount rate assumption would lead to a decrease in our pension and post-retirement expense of approximately $0.2 million for 2024. A 25-basis point change in our long-term rate of return assumption would lead to an increase or decrease in pension and post-retirement expense of approximately $1.2 million for 2024.
Pension and post-retirement liabilities of $157.6 million as of December 31, 2023, increased from $155.5 million at December 31, 2022. The increase was primarily due to updated assumptions and foreign exchange, partly offset by cash contributions.
Income Taxes
Deferred tax liabilities or assets are established for temporary differences between financial and tax reporting bases and are subsequently adjusted to reflect changes in tax rates expected to be in effect when the temporary differences reverse. A valuation allowance is recorded to reduce deferred tax assets to an amount that is more likely than not to be realized. Facts and circumstances may change and cause us to revise our conclusions regarding our ability to realize certain net operating losses and other deferred tax attributes.
The amount of income taxes that we pay is subject to ongoing audits by federal, state and foreign tax authorities. Our estimate of the potential outcome of any uncertain tax position is subject to management’s assessment of relevant risks, facts and circumstances existing at that time. We believe that we have adequately provided for reasonably foreseeable outcomes related to these matters. However, our future results may include favorable or unfavorable adjustments to our estimated tax liabilities in the period any assessments are received, revised or resolved.
Recently Adopted Accounting Standards
For information on recently adopted accounting pronouncements, see "Note 2. Significant Accounting Policies, Recent Accounting Pronouncements and Adopted Accounting Standards" to the consolidated financial statements contained in Part II. Item 8. of this report.
SUPPLEMENTAL NON-GAAP FINANCIAL MEASURES
To supplement our consolidated financial statements presented in accordance with GAAP, we provide investors with certain non-GAAP financial measures, including comparable sales. Comparable sales represent net sales excluding the impact of
material acquisitions and with current-period foreign operation sales translated at prior-year currency rates. We sometimes refer to comparable sales as comparable net sales.
We use comparable sales both to explain our results to stockholders and the investment community and in the internal evaluation and management of our business. We believe comparable sales provide management and investors with a more complete understanding of our underlying operational results and trends, facilitate meaningful period-to-period comparisons and enhance an overall understanding of our past and future financial performance. Comparable sales should not be considered in isolation or as a substitute for, or superior to, GAAP net sales and should be read in connection with the Company's consolidated financial statements presented in accordance with GAAP and contained in Part II. Item 8 of this report.
The following tables provide a reconciliation of GAAP net sales as reported to non-GAAP comparable sales by segment:
| | | | |
| Comparable Sales - Year Ended December 31, 2023 |
| | | Non-GAAP |
| | | | |
(in millions) | GAAP Net Sales | | Currency Translation | Comparable Sales |
ACCO Brands North America | $887.2 | | $(3.9) | $891.1 |
ACCO Brands EMEA | 547.2 | | 5.5 | 541.7 |
ACCO Brands International | 398.4 | | 9.7 | 388.7 |
Total | $1,832.8 | | $11.3 | $1,821.5 |
| | | | |
| Amount of Change - Year Ended December 31, 2023 compared to the Year Ended December 31, 2022 |
| $ Change - Net Sales |
| | | Non-GAAP |
| | | | |
(in millions) | GAAP Net Sales Change | | Currency Translation | Comparable Sales |
ACCO Brands North America | $(110.8) | | $(3.9) | $(106.9) |
ACCO Brands EMEA | (33.1) | | 5.5 | (38.6) |
ACCO Brands International | 29.1 | | 9.7 | 19.4 |
Total | $(114.8) | | $11.3 | $(126.1) |
| | | | |
| % Change - Net Sales |
| | | Non-GAAP |
| | | | |
| GAAP Net Sales Change | | Currency Translation | Comparable Sales |
ACCO Brands North America | (11.1)% | | (0.4)% | (10.7)% |
ACCO Brands EMEA | (5.7)% | | 1.0% | (6.7)% |
ACCO Brands International | 7.9% | | 2.6% | 5.3% |
Total | (5.9)% | | 0.6% | (6.5)% |
ITEM 7A. QUANTITATIVE AND QUALITATIVE DISCLOSURES ABOUT MARKET RISK
We are exposed to various market risks, including changes in foreign currency exchange rates and interest rate changes. We enter into financial instruments to manage and reduce the impact of these risks, not for trading or speculative purposes. The counterparties to these financial instruments are major financial institutions.
See also "Part I. Item 1A. Risk Factors" of this report.
Foreign Exchange Risk Management
We enter into forward foreign currency contracts to reduce the effect of fluctuating foreign currencies, primarily on foreign inventory purchases and intercompany loans, which create foreign exchange exposure relative to the trading currency of the foreign operating unit. Our primary exposure to currency movements is in the Euro, the Swedish krona, the British pound, the Brazilian real, the Australian dollar, the Canadian dollar, and the Mexican peso. Principal currencies hedged against the U.S. dollar include the Euro, Australian dollar, Canadian dollar, Swedish krona and British pound. Increases and decreases in the fair market values of our forward contracts are expected to be offset by gains/losses in recognized net underlying foreign currency transactions or loans. Notional amounts of outstanding foreign currency forward exchange contracts were $182.5 million and $187.8 million at December 31, 2023, and 2022, respectively. The net fair value of these foreign currency contracts was $(0.4) million and $1.7 million at December 31, 2023, and 2022, respectively. At December 31, 2023, a 10-percent unfavorable exchange rate movement in our portfolio of foreign currency forward contracts would have reduced our unrealized gains $16.4 million. Consistent with the use of these contracts to neutralize the effect of exchange rate fluctuations, such unrealized losses or gains would be offset by corresponding gains or losses, respectively, in the remeasurement of the underlying transactions being hedged. When taken together, we believe these forward contracts and the offsetting underlying commitments do not create material market risk.
For further information related to outstanding foreign currency forward exchange contracts, see "Note 13. Derivative Financial Instruments" and "Note 14. Fair Value of Financial Instruments" to the consolidated financial statements contained in Part II, Item 8. of this report.
Interest Rate Risk Management
Amounts outstanding under the Credit Agreement, as amended, bear interest at a rate per annum equal to the Euro Rate (with a zero percent floor for Euro borrowings), the Australian BBSR Rate, the Canadian BA Rate or the Base Rate, as applicable and as each such rate is defined in the Credit Agreement, as amended, plus an "applicable rate." The applicable rate applied to outstanding Euro, Australian and Canadian dollar denominated loans and Base Rate loans is based on the Company’s Consolidated Leverage Ratio as follows:
| | | | | | |
Consolidated Leverage Ratio | | Applicable Rate on Euro/AUD/CDN Dollar Loans | | Applicable Rate on Base Rate Loans | | Undrawn Fee |
> 4.50 to 1.00 | | 2.50 % | | 1.50 % | | 0.500 % |
≤ 4.50 to 1.00 and > 4.00 to 1.00 | | 2.25 % | | 1.25 % | | 0.375 % |
≤ 4.00 to 1.00 and > 3.50 to 1.00 | | 2.00 % | | 1.00 % | | 0.350 % |
≤ 3.50 to 1.00 and > 3.00 to 1.00 | | 1.75 % | | 0.75 % | | 0.300 % |
≤ 3.00 to 1.00 and > 2.00 to 1.00 | | 1.50 % | | 0.50 % | | 0.250 % |
≤ 2.00 to 1.00 | | 1.25 % | | 0.25 % | | 0.200 % |
As of December 31, 2023, the applicable rate on Euro, Australian and Canadian dollar loans was 2.00 percent and the applicable rate on Base Rate loans was 1.00 percent. Undrawn amounts under the Revolving Facility are subject to a commitment fee rate of 0.20 percent to 0.50 percent per annum, depending on the Company’s Consolidated Leverage Ratio. As of December 31, 2023, the commitment fee rate was 0.35 percent.
The Senior Unsecured Notes have a fixed interest rate and, accordingly, are not exposed to market risk resulting from changes in interest rates. However, the fair market value of our long-term fixed interest rate debt is subject to interest rate risk. Generally, the fair market value of fixed interest rate debt will increase as interest rates fall and decrease as interest rates rise. In addition, fair market values will also reflect the credit markets' view of credit risk spreads and our risk profile. These interest rate changes may affect the fair market value of our fixed interest rate debt and any decisions we may make to repurchase the Senior Unsecured Notes, but do not impact our earnings or cash flow.
The following table summarizes information about our major debt components as of December 31, 2023, including the principal cash payments and interest rates.
Debt Obligations
| | | | | | | | | | | | | | | | | | | | | | | | | | | | | | | | |
| | Stated Maturity Date | | | | | | | |
(in millions) | | | 2024 | | | | 2025 | | | | 2026 | | | | 2027 | | | | 2028 | | | Thereafter | | | Total | | | Fair Value | |
Long term debt: | | | | | | | | | | | | | | | | | | | | | | | | |
Fixed rate Senior Unsecured Notes, due March 2029 | | $ | — | | | $ | — | | | $ | — | | | $ | — | | | $ | — | | | $ | 575.0 | | | $ | 575.0 | | | $ | 520.4 | |
Fixed interest rate | | | | | | | | | | | | | | | | | | 4.25 | % | | | | | | |
Euro Senior Secured Term Loan A, due March 2026 | | $ | 19.3 | | | $ | 24.3 | | | $ | 174.6 | | | $ | — | | | $ | — | | | $ | — | | | $ | 218.2 | | | $ | 218.2 | |
USD Senior Secured Term Loan A, due March 2026 | | $ | 6.9 | | | $ | 8.7 | | | $ | 62.4 | | | $ | — | | | $ | — | | | $ | — | | | $ | 78.0 | | | $ | 78.0 | |
Australian Dollar Senior Secured Term Loan A, due March 2026 | | $ | 2.9 | | | $ | 3.6 | | | $ | 26.0 | | | $ | — | | | $ | — | | | $ | — | | | $ | 32.5 | | | $ | 32.5 | |
U.S. Dollar Senior Secured Revolving Credit Facility, due March 2026 | | $ | 7.3 | | | $ | — | | | $ | — | | | $ | — | | | $ | — | | | $ | — | | | $ | 7.3 | | | $ | 7.3 | |
Australian Dollar Senior Secured Revolving Credit Facility, due March 2026 | | $ | — | | | $ | — | | | $ | 14.3 | | | $ | — | | | $ | — | | | $ | — | | | $ | 14.3 | | | $ | 14.3 | |
Average variable interest rate(1) | | | 6.35 | % | | | 6.35 | % | | | 6.35 | % | | | | | | | | | | | | | | | |
(1)Rates presented are as of December 31, 2023.
ITEM 8. FINANCIAL STATEMENTS AND SUPPLEMENTARY DATA
INDEX TO CONSOLIDATED FINANCIAL STATEMENTS
Report of Independent Registered Public Accounting Firm
To the Stockholders and Board of Directors
ACCO Brands Corporation:
Opinions on the Consolidated Financial Statements and Internal Control Over Financial Reporting
We have audited the accompanying consolidated balance sheets of ACCO Brands Corporation and subsidiaries (the Company) as of December 31, 2023 and 2022, the related consolidated statements of income (loss), comprehensive income (loss), stockholders’ equity, and cash flows for each of the years in the three-year period ended December 31, 2023, and the related notes and financial statement schedule II - Valuation and Qualifying Accounts and Reserves (collectively, the consolidated financial statements). We also have audited the Company’s internal control over financial reporting as of December 31, 2023, based on criteria established in Internal Control – Integrated Framework (2013) issued by the Committee of Sponsoring Organizations of the Treadway Commission.
In our opinion, the consolidated financial statements referred to above present fairly, in all material respects, the financial position of the Company as of December 31, 2023 and 2022, and the results of its operations and its cash flows for each of the years in the three-year period ended December 31, 2023, in conformity with U.S. generally accepted accounting principles. Also in our opinion, the Company maintained, in all material respects, effective internal control over financial reporting as of December 31, 2023 based on criteria established in Internal Control – Integrated Framework (2013) issued by the Committee of Sponsoring Organizations of the Treadway Commission.
Basis for Opinions
The Company’s management is responsible for these consolidated financial statements, for maintaining effective internal control over financial reporting, and for its assessment of the effectiveness of internal control over financial reporting, included in the accompanying Management's Report on Internal Control over Financial Reporting. Our responsibility is to express an opinion on the Company’s consolidated financial statements and an opinion on the Company’s internal control over financial reporting based on our audits. We are a public accounting firm registered with the Public Company Accounting Oversight Board (United States) (PCAOB) and are required to be independent with respect to the Company in accordance with the U.S. federal securities laws and the applicable rules and regulations of the Securities and Exchange Commission and the PCAOB.
We conducted our audits in accordance with the standards of the PCAOB. Those standards require that we plan and perform the audits to obtain reasonable assurance about whether the consolidated financial statements are free of material misstatement, whether due to error or fraud, and whether effective internal control over financial reporting was maintained in all material respects.
Our audits of the consolidated financial statements included performing procedures to assess the risks of material misstatement of the consolidated financial statements, whether due to error or fraud, and performing procedures that respond to those risks. Such procedures included examining, on a test basis, evidence regarding the amounts and disclosures in the consolidated financial statements. Our audits also included evaluating the accounting principles used and significant estimates made by management, as well as evaluating the overall presentation of the consolidated financial statements. Our audit of internal control over financial reporting included obtaining an understanding of internal control over financial reporting, assessing the risk that a material weakness exists, and testing and evaluating the design and operating effectiveness of internal control based on the assessed risk. Our audits also included performing such other procedures as we considered necessary in the circumstances. We believe that our audits provide a reasonable basis for our opinions.
Definition and Limitations of Internal Control Over Financial Reporting
A company’s internal control over financial reporting is a process designed to provide reasonable assurance regarding the reliability of financial reporting and the preparation of financial statements for external purposes in accordance with generally
accepted accounting principles. A company’s internal control over financial reporting includes those policies and procedures that (1) pertain to the maintenance of records that, in reasonable detail, accurately and fairly reflect the transactions and dispositions of the assets of the company; (2) provide reasonable assurance that transactions are recorded as necessary to permit preparation of financial statements in accordance with generally accepted accounting principles, and that receipts and expenditures of the company are being made only in accordance with authorizations of management and directors of the company; and (3) provide reasonable assurance regarding prevention or timely detection of unauthorized acquisition, use, or disposition of the company’s assets that could have a material effect on the financial statements.
Because of its inherent limitations, internal control over financial reporting may not prevent or detect misstatements. Also, projections of any evaluation of effectiveness to future periods are subject to the risk that controls may become inadequate because of changes in conditions, or that the degree of compliance with the policies or procedures may deteriorate.
Critical Audit Matters
The critical audit matters communicated below are matters arising from the current period audit of the consolidated financial statements that were communicated or required to be communicated to the audit committee and that: (1) relate to accounts or disclosures that are material to the consolidated financial statements and (2) involved our especially challenging, subjective, or complex judgments. The communication of critical audit matters does not alter in any way our opinion on the consolidated financial statements, taken as a whole, and we are not, by communicating the critical audit matters below, providing separate opinions on the critical audit matters or on the accounts or disclosures to which they relate.
Write-down of certain finished goods inventory for obsolete and slow-moving items
As discussed in Notes 2 and 7 to the consolidated financial statements, the finished goods inventory balance as of December 31, 2023 was $272.7 million. The Company records inventory at the lower of cost (principally first-in, first-out) or net realizable value. The write-down of inventory for obsolete and slow-moving inventory items (OSMI) is recorded based on write-down percentages applied to certain finished goods inventory.
We identified the evaluation of the write-down of certain finished goods inventory for OSMI as a critical audit matter, due to the subjective auditor judgment involved in evaluating the Company’s estimate of the OSMI write-down, specifically for finished goods inventory. The key assumption used in determining the OSMI write-down was the write-down percentages applied to certain finished good inventory.
The following are the primary procedures we performed to address this critical audit matter. We evaluated the design and tested the operating effectiveness of certain internal controls over the Company’s evaluation of the OSMI finished goods inventory write-down process, including controls over the write-down percentages applied to certain finished good inventory. We obtained the OSMI finished goods inventory write-down assessment, and tested that the OSMI write-down was recorded based on the write-down percentages applied to certain finished good inventory. We compared current year write-offs and write-down percentages used to the prior year OSMI reserve and to historical write-down percentages used. We also analyzed a sample of inventory items to evaluate whether the appropriate write down percentage was applied based on the nature and condition of the item.
Goodwill Impairment Assessment of North America Reporting Unit
As discussed in Note 9 to the consolidated financial statements, the carrying value of goodwill as of December 31, 2023 was $590 million, of which $258.5 million related to the North America reporting unit. The Company performs a goodwill impairment assessment on an annual basis during the second quarter of each fiscal year and whenever circumstances or other events occur that would more likely than not reduce the fair value of a reporting unit below its carrying amount. Reporting units are tested for impairment by comparing the fair value of each reporting unit with its carrying amount. If the fair value of a reporting unit exceeds the carrying value of the net assets assigned to it, goodwill is not considered impaired
and no further testing is required. If the carrying amount exceeds the fair value, an impairment loss is recorded. Management generally uses a combination of both a discounted cash flows and a market approach to estimate the fair value of reporting units. During 2023, the Company performed a qualitative assessment for its annual impairment evaluation as of May 31, 2023. During the fourth quarter of 2023, the Company identified a triggering event and performed a quantitative assessment as of December 31, 2023 and concluded that an impairment of $89.5 million relating to the North America reporting unit existed.
We identified the evaluation of the recoverability of the carrying value of goodwill for the North America reporting unit as of December 31, 2023 as a critical audit matter. Specifically, our evaluation of certain assumptions, including forecasted revenue projections and the discount rate, required a high degree of auditor judgment as they were based on subjective determinations of future market and economic conditions. The assumptions were challenging to audit as changes to the assumptions could have had a significant effect on the Company’s assessment of the fair value of the reporting unit and the amount of impairment recorded or whether an impairment existed. Additionally, the audit effort associated with the evaluation of the discount rate required specialized skills and knowledge.
The following are the primary procedures we performed to address this critical audit matter. We evaluated the design and tested the operating effectiveness of certain internal controls over the Company’s goodwill impairment assessment process including controls over the revenue projections and the discount rate. We evaluated the Company’s forecasted revenue growth rates for the North America reporting unit, by comparing it to the Company’s prior quantitative impairment forecast, historical growth rates including current year actual results, arrangements with customers, and inflation rate factors. In addition, we involved valuation professionals with specialized skills and knowledge, who assisted in evaluating the Company’s selection of the discount rate, by comparing it to discount rate ranges that were independently developed using publicly available market data. They also assisted in performing a sensitivity analysis to assess the impact of possible changes to the discount rate.
/s/ KPMG LLP
We have served as the Company’s auditor since 2009.
Chicago, Illinois
February 23, 2024
ACCO Brands Corporation and Subsidiaries
Consolidated Balance Sheets
| | | | | | | | |
| | December 31,
2023 | | | December 31,
2022 | |
(in millions) | |
| | | | |
Assets | | | | | | |
Current assets: | | | | | | |
Cash and cash equivalents | | $ | 66.4 | | | $ | 62.2 | |
Accounts receivable less allowances of $22.9 and $26.6, respectively | | | 430.7 | | | | 384.1 | |
Inventories | | | 327.5 | | | | 395.2 | |
Other current assets | | | 30.8 | | | | 40.8 | |
Total current assets | | | 855.4 | | | | 882.3 | |
Total property, plant and equipment | | | 599.6 | | | | 589.2 | |
Less: accumulated depreciation | | | (429.5 | ) | | | (404.1 | ) |
Property, plant and equipment, net | | | 170.1 | | | | 185.1 | |
Right of use asset, leases | | | 91.0 | | | | 88.8 | |
Deferred income taxes | | | 104.7 | | | | 99.7 | |
Goodwill | | | 590.0 | | | | 671.5 | |
Identifiable intangibles, net of accumulated amortization of $429.5 and $380.7, respectively | | | 815.7 | | | | 847.0 | |
Other non-current assets | | | 17.9 | | | | 20.3 | |
Total assets | | $ | 2,644.8 | | | $ | 2,794.7 | |
Liabilities and Stockholders' Equity | | | | | | |
Current liabilities: | | | | | | |
Notes payable | | $ | 0.2 | | | $ | 10.3 | |
Current portion of long-term debt | | | 36.5 | | | | 49.7 | |
Accounts payable | | | 183.7 | | | | 239.5 | |
Accrued compensation | | | 53.3 | | | | 38.3 | |
Accrued customer program liabilities | | | 104.0 | | | | 103.3 | |
Lease liabilities | | | 20.5 | | | | 21.2 | |
Other current liabilities | | | 143.8 | | | | 126.7 | |
Total current liabilities | | | 542.0 | | | | 589.0 | |
Long-term debt, net of debt issuance costs of $6.7 and $8.4, respectively | | | 882.2 | | | | 936.5 | |
Long-term lease liabilities | | | 76.8 | | | | 75.2 | |
Deferred income taxes | | | 125.6 | | | | 144.1 | |
Pension and post-retirement benefit obligations | | | 157.6 | | | | 155.5 | |
Other non-current liabilities | | | 73.6 | | | | 84.3 | |
Total liabilities | | | 1,857.8 | | | | 1,984.6 | |
Stockholders' equity: | | | | | | |
Common stock, $0.01 par value, 200,000,000 shares authorized; 99,819,679 and 98,851,581 shares issued and 94,925,652 and 94,260,926 outstanding, respectively | | | 1.0 | | | | 1.0 | |
Treasury stock, 4,894,027 and 4,590,655 shares, respectively | | | (45.1 | ) | | | (43.4 | ) |
Paid-in capital | | | 1,913.4 | | | | 1,897.2 | |
Accumulated other comprehensive loss | | | (526.3 | ) | | | (540.3 | ) |
Accumulated deficit | | | (556.0 | ) | | | (504.4 | ) |
Total stockholders' equity | | | 787.0 | | | | 810.1 | |
Total liabilities and stockholders' equity | | $ | 2,644.8 | | | $ | 2,794.7 | |
See notes to consolidated financial statements.
ACCO Brands Corporation and Subsidiaries
Consolidated Statements of (Loss) Income
| | | | | | | | | | | | |
| | Year Ended December 31, | |
(in millions, except per share data) | | 2023 | | | 2022 | | | 2021 | |
Net sales | | $ | 1,832.8 | | | $ | 1,947.6 | | | $ | 2,025.3 | |
Cost of products sold | | | 1,234.5 | | | | 1,395.3 | | | | 1,410.4 | |
Gross profit | | | 598.3 | | | | 552.3 | | | | 614.9 | |
Operating costs and expenses: | | | | | | | | | |
Selling, general and administrative expenses | | | 393.5 | | | | 376.7 | | | | 392.6 | |
Amortization of intangibles | | | 43.4 | | | | 41.5 | | | | 46.3 | |
Restructuring charges | | | 27.2 | | | | 9.6 | | | | 6.0 | |
Goodwill impairment | | | 89.5 | | | | 98.7 | | | | — | |
Change in fair value of contingent consideration | | | — | | | | (9.0 | ) | | | 19.0 | |
Total operating costs and expenses | | | 553.6 | | | | 517.5 | | | | 463.9 | |
Operating income | | | 44.7 | | | | 34.8 | | | | 151.0 | |
Non-operating expense (income): | | | | | | | | | |
Interest expense | | | 58.6 | | | | 45.6 | | | | 46.3 | |
Interest income | | | (7.1 | ) | | | (8.3 | ) | | | (1.9 | ) |
Non-operating pension expense (income) | | | 1.8 | | | | (4.5 | ) | | | (7.9 | ) |
Other expense (income), net | | | 4.5 | | | | (12.9 | ) | | | 3.1 | |
(Loss) income before income tax | | | (13.1 | ) | | | 14.9 | | | | 111.4 | |
Income tax expense | | | 8.7 | | | | 28.1 | | | | 9.5 | |
Net (loss) income | | $ | (21.8 | ) | | $ | (13.2 | ) | | $ | 101.9 | |
| | | | | | | | | |
Per share: | | | | | | | | | |
Basic (loss) income per share | | $ | (0.23 | ) | | $ | (0.14 | ) | | $ | 1.07 | |
Diluted (loss) income per share | | $ | (0.23 | ) | | $ | (0.14 | ) | | $ | 1.05 | |
| | | | | | | | | |
Weighted average number of shares outstanding: | | | | | | | | | |
Basic | | | 95.3 | | | | 95.3 | | | | 95.5 | |
Diluted | | | 95.3 | | | | 95.3 | | | | 97.1 | |
See notes to consolidated financial statements.
ACCO Brands Corporation and Subsidiaries
Consolidated Statements of Comprehensive (Loss) Income
| | | | | | | | | | | | |
| | Year Ended December 31, | |
(in millions) | | 2023 | | | 2022 | | | 2021 | |
Net (loss) income | | $ | (21.8 | ) | | $ | (13.2 | ) | | $ | 101.9 | |
Other comprehensive income (loss), net of tax: | | | | | | | | | |
Unrealized (loss) gain on derivative instruments, net of tax benefit (expense) of $0.6, $1.4 and $(3.0), respectively | | | (1.8 | ) | | | (2.9 | ) | | | 7.1 | |
Foreign currency translation adjustments, net of tax benefit (expense) of $0.8, $3.8 and $(2.3), respectively | | | 30.3 | | | | (37.9 | ) | | | (23.4 | ) |
Recognition of deferred pension and other post-retirement items, net of tax benefit (expense) of $4.7, $(15.5) and $(12.3), respectively | | | (14.5 | ) | | | 36.0 | | | | 45.0 | |
Other comprehensive income (loss), net of tax: | | | 14.0 | | | | (4.8 | ) | | | 28.7 | |
| | | | | | | | | |
Comprehensive (loss) income | | $ | (7.8 | ) | | $ | (18.0 | ) | | $ | 130.6 | |
See notes to consolidated financial statements.
ACCO Brands Corporation and Subsidiaries
Consolidated Statements of Cash Flows
| | | | | | | | | | | | |
| | Year Ended December 31, | |
(in millions) | | 2023 | | | 2022 | | | 2021 | |
Operating activities | | | | | | | | | |
Net (loss) income | | $ | (21.8 | ) | | $ | (13.2 | ) | | $ | 101.9 | |
Amortization of inventory step-up | | | — | | | | — | | | | 3.0 | |
Payments of contingent consideration | | | — | | | | (9.2 | ) | | | — | |
(Gain) loss on disposal of assets | | | (0.3 | ) | | | (3.6 | ) | | | 0.1 | |
Deferred income tax (benefit) expense | | | (20.1 | ) | | | 1.3 | | | | (21.0 | ) |
Change in fair value of contingent liability | | | — | | | | (9.0 | ) | | | 19.0 | |
Depreciation | | | 32.7 | | | | 37.9 | | | | 39.4 | |
Amortization of debt issuance costs | | | 3.0 | | | | 2.7 | | | | 2.8 | |
Amortization of intangibles | | | 43.4 | | | | 41.5 | | | | 46.3 | |
Stock-based compensation | | | 14.8 | | | | 9.5 | | | | 15.2 | |
Loss on debt extinguishment | | | — | | | | — | | | | 3.7 | |
Non-cash charge for goodwill impairment | | | 89.5 | | | | 98.7 | | | | — | |
Changes in operating assets and liabilities: | | | | | | | | | |
Accounts receivable | | | (38.6 | ) | | | 31.6 | | | | (77.6 | ) |
Inventories | | | 85.5 | | | | 23.2 | | | | (131.8 | ) |
Other assets | | | 5.9 | | | | 0.4 | | | | (1.2 | ) |
Accounts payable | | | (68.0 | ) | | | (66.0 | ) | | | 131.2 | |
Accrued expenses and other liabilities | | | 18.2 | | | | (57.5 | ) | | | 26.3 | |
Accrued income taxes | | | (15.5 | ) | | | (10.7 | ) | | | 2.3 | |
Net cash provided by operating activities | | | 128.7 | | | | 77.6 | | | | 159.6 | |
Investing activities | | | | | | | | | |
Additions to property, plant and equipment | | | (13.8 | ) | | | (16.5 | ) | | | (21.2 | ) |
Proceeds from the disposition of assets | | | 2.6 | | | | 7.2 | | | | — | |
Cost of acquisitions, net of cash acquired | | | — | | | | — | | | | 15.4 | |
Net cash used by investing activities | | | (11.2 | ) | | | (9.3 | ) | | | (5.8 | ) |
Financing activities | | | | | | | | | |
Proceeds from long-term borrowings | | | 121.9 | | | | 236.7 | | | | 659.7 | |
Repayments of long-term debt | | | (199.2 | ) | | | (220.5 | ) | | | (766.3 | ) |
Repayments of notes payable, net | | | (10.2 | ) | | | 0.7 | | | | 3.7 | |
Payment for debt premium | | | — | | | | — | | | | (9.8 | ) |
Payments for debt issuance costs | | | — | | | | (1.2 | ) | | | (10.5 | ) |
Dividends paid | | | (28.5 | ) | | | (28.6 | ) | | | (25.8 | ) |
Payments of contingent consideration | | | — | | | | (17.8 | ) | | | (0.4 | ) |
Repurchases of common stock | | | — | | | | (19.4 | ) | | | — | |
Payments related to tax withholding for stock-based compensation | | | (1.7 | ) | | | (2.5 | ) | | | (0.9 | ) |
Proceeds from the exercise of stock options | | | — | | | | 4.3 | | | | 3.1 | |
Net cash used by financing activities | | | (117.7 | ) | | | (48.3 | ) | | | (147.2 | ) |
Effect of foreign exchange rate changes on cash and cash equivalents | | | 4.4 | | | | 1.0 | | | | (2.0 | ) |
Net increase in cash and cash equivalents | | | 4.2 | | | | 21.0 | | | | 4.6 | |
Cash and cash equivalents | | | | | | | | | |
Beginning of the period | | $ | 62.2 | | | $ | 41.2 | | | $ | 36.6 | |
End of the period | | $ | 66.4 | | | $ | 62.2 | | | $ | 41.2 | |
Cash paid during the year for: | | | | | | | | | |
Interest | | $ | 55.6 | | | $ | 42.6 | | | $ | 37.6 | |
Income taxes | | $ | 44.3 | | | $ | 37.5 | | | $ | 28.0 | |
See notes to consolidated financial statements.
ACCO Brands Corporation and Subsidiaries
Consolidated Statements of Stockholders’ Equity
| | | | | | | | | | | | | | | | | | | | | | | | | | | | | | | | |
| | | | | | | | | | | | | | | | | Accumulated Other | | | | | | | |
| | Common Stock | | | Paid-in | | | Treasury Stock | | | Comprehensive | | | Accumulated | | | | |
(in millions) | | Shares | | | Value | | | Capital | | | Shares | | | Value | | | Income (Loss) | | | Deficit | | | Total | |
Balance at December 31, 2020 | | | 99.1 | | | $ | 1.0 | | | $ | 1,883.1 | | | | 4.2 | | | $ | (39.9 | ) | | $ | (564.2 | ) | | $ | (537.3 | ) | | $ | 742.7 | |
Net income | | | — | | | | — | | | | — | | | | — | | | | — | | | | — | | | | 101.9 | | | | 101.9 | |
Gain on derivative financial instruments, net of tax | | | — | | | | — | | | | — | | | | — | | | | — | | | | 7.1 | | | | — | | | | 7.1 | |
Translation impact, net of tax | | | — | | | | — | | | | — | | | | — | | | | — | | | | (23.4 | ) | | | — | | | | (23.4 | ) |
Pension and post-retirement adjustment, net of tax | | | — | | | | — | | | | — | | | | — | | | | — | | | | 45.0 | | | | — | | | | 45.0 | |
Stock-based compensation | | | — | | | | — | | | | 16.0 | | | | — | | | | — | | | | — | | | | (0.8 | ) | | | 15.2 | |
Common stock issued, net of shares withheld for employee taxes | | | 1.0 | | | | — | | | | 3.1 | | | | 0.1 | | | | (0.9 | ) | | | — | | | | — | | | | 2.2 | |
Dividends declared $0.270 per share | | | — | | | | — | | | | — | | | | — | | | | — | | | | — | | | | (25.8 | ) | | | (25.8 | ) |
Other | | | — | | | | — | | | | — | | | | — | | | | (0.1 | ) | | | — | | | | — | | | | (0.1 | ) |
Balance at December 31, 2021 | | | 100.1 | | | $ | 1.0 | | | $ | 1,902.2 | | | | 4.3 | | | $ | (40.9 | ) | | $ | (535.5 | ) | | $ | (462.0 | ) | | $ | 864.8 | |
Net loss | | | — | | | | — | | | | — | | | | — | | | | — | | | | — | | | | (13.2 | ) | | | (13.2 | ) |
Loss on derivative financial instruments, net of tax | | | — | | | | — | | | | — | | | | — | | | | — | | | | (2.9 | ) | | | — | | | | (2.9 | ) |
Translation impact, net of tax | | | — | | | | — | | | | — | | | | — | | | | — | | | | (37.9 | ) | | | — | | | | (37.9 | ) |
Pension and post-retirement adjustment, net of tax | | | — | | | | — | | | | — | | | | — | | | | — | | | | 36.0 | | | | — | | | | 36.0 | |
Common stock repurchases | | | (2.7 | ) | | | — | | | | (19.4 | ) | | | — | | | | — | | | | — | | | | — | | | | (19.4 | ) |
Stock-based compensation | | | — | | | | — | | | | 10.0 | | | | — | | | | — | | | | — | | | | (0.5 | ) | | | 9.5 | |
Common stock issued, net of shares withheld for employee taxes | | | 1.5 | | | | — | | | | 4.3 | | | | 0.3 | | | | (2.5 | ) | | | — | | | | — | | | | 1.8 | |
Dividends declared $0.300 per share | | | — | | | | — | | | | — | | | | — | | | | — | | | | — | | | | (28.6 | ) | | | (28.6 | ) |
Other | | | — | | | | — | | | | 0.1 | | | | — | | | | — | | | | — | | | | (0.1 | ) | | | — | |
Balance at December 31, 2022 | | | 98.9 | | | $ | 1.0 | | | $ | 1,897.2 | | | | 4.6 | | | $ | (43.4 | ) | | $ | (540.3 | ) | | $ | (504.4 | ) | | $ | 810.1 | |
Net loss | | | — | | | | — | | | | — | | | | — | | | | — | | | | — | | | | (21.8 | ) | | | (21.8 | ) |
Loss on derivative financial instruments, net of tax | | | — | | | | — | | | | — | | | | — | | | | — | | | | (1.8 | ) | | | — | | | | (1.8 | ) |
Translation impact, net of tax | | | — | | | | — | | | | — | | | | — | | | | — | | | | 30.3 | | | | — | | | | 30.3 | |
Pension and post-retirement adjustment, net of tax | | | — | | | | — | | | | — | | | | — | | | | — | | | | (14.5 | ) | | | — | | | | (14.5 | ) |
Stock-based compensation | | | — | | | | — | | | | 16.3 | | | | — | | | | — | | | | — | | | | (1.5 | ) | | | 14.8 | |
Common stock issued, net of shares withheld for employee taxes | | | 0.9 | | | | — | | | | — | | | | 0.3 | | | | (1.7 | ) | | | — | | | | — | | | | (1.7 | ) |
Dividends declared, $0.300 per share | | | — | | | | — | | | | — | | | | — | | | | — | | | | — | | | | (28.5 | ) | | | (28.5 | ) |
Other | | | — | | | | — | | | | (0.1 | ) | | | — | | | | — | | | | — | | | | 0.2 | | | | 0.1 | |
Balance at December 31, 2023 | | | 99.8 | | | $ | 1.0 | | | $ | 1,913.4 | | | | 4.9 | | | $ | (45.1 | ) | | $ | (526.3 | ) | | $ | (556.0 | ) | | $ | 787.0 | |
See notes to consolidated financial statements.
ACCO Brands Corporation and Subsidiaries
Notes to Consolidated Financial Statements
1. Basis of Presentation
As used in this Annual Report on Form 10-K for the fiscal year ended December 31, 2023, the terms "ACCO Brands," "ACCO," the "Company," "we," "us," and "our" refer to ACCO Brands Corporation, a Delaware corporation incorporated in 2005, and its consolidated domestic and international subsidiaries.
The management of ACCO Brands Corporation is responsible for the accuracy and internal consistency of the preparation of the consolidated financial statements and notes contained in this Annual Report on Form 10-K. The Company may, from time to time, reclassify certain amounts relating to its prior period disclosures to conform to its current period presentation within the notes to the consolidated financial statements.
The consolidated financial statements include the accounts of ACCO Brands Corporation and its domestic and international subsidiaries. Intercompany accounts and transactions have been eliminated in consolidation.
2. Significant Accounting Policies, Recent Accounting Pronouncements and Adopted Accounting Standards
Nature of Business
ACCO Brands is a designer, marketer and manufacturer of recognized consumer, technology and business branded products used in schools, homes and at work.
ACCO Brands has three operating business segments based in different geographic regions. Each business segment designs, markets, sources, manufactures, and sells recognized consumer, technology and business branded products used in schools, homes and at work. Product designs are tailored to end-user preferences in each geographic region, and where possible, leverage common engineering, design, and sourcing.
Our product categories include gaming and computer accessories; storage and organization; notebooks; shredding; laminating and binding machines; stapling; punching; planners; dry erase boards; and do-it-yourself tools, among others. Our portfolio includes both globally and regionally recognized brands.
We distribute our products through a wide variety of channels to ensure that our products are readily and conveniently available for purchase by consumers and other end-users, wherever they prefer to shop. These channels include mass retailers, e-tailers, discount, drug/grocery and variety chains, warehouse clubs, hardware and specialty stores, independent office product dealers, office superstores, wholesalers, contract stationers, and specialist technology businesses. We also sell directly through e-commerce sites and our direct sales organization.
Use of Estimates
Our financial statements are prepared in conformity with generally accepted accounting principles in the U.S. ("GAAP"). Preparation of our financial statements requires us to make judgments, estimates and assumptions that affect the reported amounts of assets, liabilities, revenues and expenses presented for each reporting period in the financial statements and the related accompanying notes. Actual results could differ significantly from those estimates. We regularly review our assumptions and estimates, which are based on historical experience and, where appropriate, current business trends.
Cash and Cash Equivalents
Highly liquid investments with an original maturity of three months or less are included in cash and cash equivalents.
ACCO Brands Corporation and Subsidiaries
Notes to Consolidated Financial Statements (Continued)
Accounts Receivable and Allowances for Sales/Pricing/Cash Discounts and Doubtful Accounts
Trade receivables are recorded at the stated amount, less allowances for sales/pricing/cash discounts and doubtful accounts. The allowance for sales/pricing/cash discounts represents estimated uncollectible receivables associated with the products previously sold to customers, and is recorded at the same time that the sales are recognized. The allowance is based on historical trends.
The allowance for doubtful accounts represents estimated uncollectible receivables associated with potential customer defaults on contractual obligations, usually due to a customer's potential insolvency. The allowance includes amounts for certain customers where a risk of default has been specifically identified. In addition, the allowance includes a provision for customer defaults on a general formulaic basis when it is determined the risk of some default is probable and estimable, but cannot yet be associated with a specific customer. The assessment of the likelihood of customer defaults is based on various factors, including the length of time the receivables are past due, historical experience and existing economic conditions.
The allowances are recorded as reductions to "Net sales" and "Accounts receivable, net."
Inventories
Inventories are priced at the lower of cost (principally first-in, first-out) or net realizable value. When necessary, the write-down of inventory to its net realizable value is recorded for obsolete or slow-moving inventory based on assumptions about future demand and marketability of products, the impact of new product introductions and specific identification of items, such as product discontinuance or engineering/material changes. These estimates could vary significantly, either favorably or unfavorably, from actual requirements if future economic conditions, customer inventory levels or competitive conditions differ from our expectations.
Property, Plant and Equipment
Property, plant and equipment are carried at cost. Depreciation is provided, principally on a straight-line basis, over the estimated useful lives of the assets. Gains or losses resulting from dispositions are included in operating income. Betterments and renewals, which improve and extend the life of an asset are capitalized; maintenance and repair costs are expensed. Purchased computer software is capitalized and amortized over the software’s useful life.
The following table shows estimated useful lives of property, plant and equipment:
| | |
Property, plant and equipment | | Useful Life |
Buildings | | 40 to 50 years |
Leasehold improvements | | Lesser of lease term or the life of the asset |
Machinery, equipment and furniture | | 3 to 10 years |
Computer software | | 5 to 10 years |
We capitalize interest for major capital projects. Capitalized interest is added to the cost of the underlying assets and is depreciated over the useful lives of those assets. We did not capitalize any interest for the years ended December 31, 2023, 2022, and 2021.
ACCO Brands Corporation and Subsidiaries
Notes to Consolidated Financial Statements (Continued)
Long-Lived Assets
We test long-lived assets for impairment whenever events or changes in circumstances indicate that the assets’ carrying amount may not be recoverable from its undiscounted future cash flow. When such events occur, we compare the sum of the undiscounted cash flow expected to result from the use and eventual disposition of the asset or asset group to the carrying amount of a long-lived asset or asset group. The cash flows are based on our best estimate at the time of future cash flow, derived from the most recent business projections. If this comparison indicates that there is an impairment, the amount of the impairment is typically calculated using discounted expected future cash flow. The discount rate applied to these cash flows is based on our weighted average cost of capital, computed by selecting market rates at the valuation dates for debt and equity that are reflective of the risks associated with an investment in our industry as estimated by using comparable publicly traded companies.
Intangible Assets
Intangible assets are comprised primarily of indefinite-lived and amortizable intangible assets acquired and arising from the application of purchase accounting. Indefinite-lived intangible assets are not amortized, but are evaluated at least annually to determine whether the indefinite useful life is appropriate. Certain of our trade names have been assigned an indefinite life as we currently anticipate that these trade names will contribute cash flows to ACCO Brands indefinitely. Amortizable intangible assets are amortized over their useful lives.
We test indefinite-lived intangibles for impairment annually, during the second quarter, and during any interim period when market or business events indicate there may be a potential adverse impact on a particular intangible. The test may be on a qualitative or quantitative basis as allowed by GAAP. We consider the implications of both external factors (e.g., market growth, pricing, competition, and technology) and internal factors (e.g., product costs, margins, support expenses, and capital investment) and their potential impact on cash flows in both the near and long term, as well as their impact on any identifiable intangible asset associated with the business. Based on recent business results, consideration of significant external and internal factors, and the resulting business projections, indefinite-lived intangible assets are reviewed to determine whether they are likely to remain indefinite-lived, or whether a finite life is more appropriate. In addition, based on events in the period and future expectations, management considers whether the potential for impairment exists. Finite lived intangibles are amortized over 5, 7, 10, 15, 23 or 30 years.
We performed our annual assessment, in the second quarter of 2023, on a qualitative basis, and concluded that it was not more likely than not that the fair value of any indefinite-lived intangible was less than its carrying amount. In addition, we have not identified a triggering event through December 31, 2023 that more likely than not would result in impairment.
Goodwill
Goodwill has been recorded on our balance sheet and represents the excess of the cost of an acquisition when compared with the fair value of the net assets acquired. The authoritative guidance on goodwill and other intangible assets requires that goodwill be tested for impairment at a reporting unit level. We have determined that our reporting units are ACCO Brands North America, ACCO Brands EMEA and ACCO Brands International.
We test goodwill for impairment annually, during the second quarter, or any interim period when market or business events indicate there may be a potential adverse impact on goodwill. As permitted by GAAP, we may perform a qualitative assessment to determine if it is more likely than not that the fair value of a reporting unit is less than its carrying amount as a basis for determining whether it is necessary to perform a quantitative goodwill impairment test as required by GAAP. We performed our
ACCO Brands Corporation and Subsidiaries
Notes to Consolidated Financial Statements (Continued)
annual assessment in the second quarter of 2023, on a qualitative basis, and concluded that it was not more likely than not that the fair value of any reporting unit was less than its carrying amount.
During the fourth quarter of 2023, our forecasted cash flows for our North America reporting unit further declined, including lower demand for our technology accessories, due to a weaker macroeconomic environment as well as tight inventory management by retail customers. As a result, we identified a triggering event indicating it was more likely than not that an impairment loss had been incurred. Accordingly, as of December 31, 2023, we completed an impairment assessment, on a quantitative basis, for goodwill for each of our three reporting units. The result of our assessment was that the fair value of the North America reporting unit did not exceed its carrying value resulting in an impairment charge of $89.5 million. The result of our assessment for the International and EMEA reporting units was that the fair value of each exceeded its carrying values by approximately ten percent and greater than fifty percent, respectively, and we concluded that no impairment existed.
Estimating the fair value of each reporting unit requires us to make assumptions and estimates regarding our future. We utilized a combination of both a discounted cash flows and market approach. The financial projections used in the valuation models reflected management's assumptions regarding revenue growth rates, economic and market trends, cost structure, discount rate, and other expectations about the anticipated short-term and long-term operating results for each of our three reporting units.
We believe the assumptions used in our goodwill impairment analysis are appropriate and result in reasonable estimates of the implied fair value of each reporting unit. However, given the economic environment and the uncertainties regarding the impact on our business, there can be no assurance that our estimates and assumptions, made for purposes of our goodwill impairment testing, will prove to be an accurate prediction of the future. If our assumptions regarding future performance are not achieved, we may be required to record additional goodwill impairment charges in future periods.
Employee Benefit Plans
We provide a range of benefits to our employees and retired employees, including pension, post-retirement, post-employment and health care benefits. We record annual amounts relating to these plans based on calculations specified by GAAP, which include various actuarial assumptions, including discount rates, assumed rates of return, mortality rate tables, compensation increases, turnover rates and health care cost trends. Actuarial assumptions are reviewed on an annual basis and modifications to these assumptions are made based on current rates and trends when it is deemed appropriate. As required by GAAP, the effect of our modifications and unrecognized actuarial gains and losses are generally recorded to a separate component of accumulated other comprehensive income (loss) ("AOCI") in stockholders’ equity and amortized over future periods.
Income Taxes
Deferred tax liabilities or assets are established for temporary differences between financial and tax reporting basis and are subsequently adjusted to reflect changes in tax rates expected to be in effect when the temporary differences reverse. A valuation allowance is recorded to reduce deferred tax assets to an amount that is more likely than not to be realized. Facts and circumstances may change and cause us to revise our conclusions regarding our ability to realize certain net operating losses and other deferred tax attributes.
The amount of income taxes that we pay is subject to ongoing audits by federal, state and foreign tax authorities. Our estimate of the potential outcome of any uncertain tax position is subject to management’s assessment of relevant risks, facts and circumstances existing at that time. We believe that we have adequately provided for reasonably foreseeable outcomes related to these matters. However, our future results may include favorable or unfavorable adjustments to our estimated tax liabilities in the period any assessments are received, revised or resolved.
ACCO Brands Corporation and Subsidiaries
Notes to Consolidated Financial Statements (Continued)
As of December 31, 2023, the Company has recorded $4.0 million of deferred taxes on approximately $249.2 million of unremitted earnings of non-U.S. subsidiaries that may be remitted to the U.S. The Company has approximately $272.7 million of additional unremitted earnings of non-U.S. subsidiaries, which are indefinitely reinvested and for which no deferred taxes have been provided.
Revenue Recognition
Revenue is recognized when control of the promised goods or services is transferred to our customers in an amount reflective of the consideration we expect to receive in exchange for those goods or services. Taxes we collect concurrent with revenue producing activities are excluded from revenue. Incidental items incurred that are immaterial in the context of the contract are expensed.
At the inception of each contract, the Company assesses the products and services promised and identifies each distinct performance obligation. To identify the performance obligations, the Company considers all products and services promised regardless of whether they are explicitly stated or implied within the contract or by standard business practices.
Products: For our products, we transfer control and recognize a sale primarily when we either ship the product from our manufacturing facility or distribution center, or upon delivery to a customer-specified location depending upon the terms in the customer agreement. In addition, we recognize revenue for private label products as the product is manufactured (or over time) when a contract has an enforceable right to payment. For consignment arrangements, revenue is not recognized until the products are sold to the end customer.
Customer Program Costs: Customer programs and incentives ("Customer Program Costs") are a common practice in our industry. We incur Customer Program Costs to obtain favorable product placement, to promote sell-through of products and to maintain competitive pricing. The amount of consideration we receive and revenue we recognize is impacted by Customer Program Costs, including sales rebates; in-store promotional allowances; shared media and customer catalog allowances; other cooperative advertising arrangements; freight allowance programs offered to our customers; and allowances for discounts. We recognize Customer Program Costs, primarily as a deduction to gross sales, at the time that the associated revenue is recognized. Customer Program Costs are based on management's best estimates using the most likely amount method and is an amount that is probable of not being reversed. In the absence of a signed contract, estimates are based on historical or projected experience for each program type or customer. We adjust our estimate of revenue when the most likely amount of consideration we expect to receive changes.
Service or Extended Maintenance Agreements ("EMAs"): Depending on the terms of the EMA, we may defer recognition of the consideration received for any unsatisfied obligations. We use an observable price to determine the stand-alone selling price for separate performance obligations or an estimated cost plus margin approach, for our separately priced service/maintenance agreements that extend mechanical and maintenance coverage beyond our base warranty coverage to our Print Finishing Solutions customers. These agreements range in duration from three to sixty months, however, most agreements are one year or less. We generally receive payment at inception of the EMAs and recognize revenue over the term of the agreement on a straight-line basis.
Shipping and Handling: Freight and distribution activities performed before the customer obtains control of the goods are not considered promised services under customer contracts and therefore are not distinct performance obligations. The Company has chosen to account for shipping and handling activities as a fulfillment activity, and therefore accrues the expense of freight and distribution in "Cost of products sold" when products are shipped.
ACCO Brands Corporation and Subsidiaries
Notes to Consolidated Financial Statements (Continued)
We reflect all amounts billed to customers for shipping and handling in net sales and the costs we incurred for shipping and handling (including costs to ship and move product from the seller’s place of business to the buyer’s place of business, as well as costs to store, move and prepare products for shipment) in cost of products sold.
Reserve for Sales Returns: The reserve for sales returns represents estimated uncollectible receivables associated with the potential return of products previously sold to customers, and is recorded at the same time that the sales are recognized. The reserve includes a general provision for product returns based on historical trends. In addition, the reserve includes amounts for currently authorized customer returns that are considered to be abnormal in comparison to the historical trends. We record the returns reserve, on a gross basis, as a reduction to "Net sales" and "Cost of products sold" with increases to "Other current liabilities" and "Inventories."
Cost of Products Sold
Cost of products sold includes all manufacturing, product sourcing and distribution costs, including depreciation related to assets used in the manufacturing, procurement and distribution process, allocation of certain information technology costs supporting those processes, inbound and outbound freight, shipping and handling costs, purchasing costs associated with materials and packaging used in the production processes, and inventory valuation adjustments.
Selling, General and Administrative Expenses
Selling, general and administrative expenses ("SG&A") include advertising, marketing, and selling (including commissions) expenses, research and development, customer service, depreciation related to assets outside the manufacturing and distribution processes and all other general and administrative expenses outside the manufacturing and distribution functions (e.g., finance, human resources, information technology, legal and other corporate expenses).
Advertising Expenses
Advertising expenses were $102.7 million, $108.8 million and $117.4 million for the years ended December 31, 2023, 2022 and 2021, respectively. These costs primarily include, but are not limited to, cooperative advertising and promotional allowances as described in "Customer Program Costs" above, and are principally expensed as incurred.
Warranty Reserves
We offer our customers various warranty terms based on the type of product that is sold. Estimated future obligations related to products sold under these warranty terms are provided by charges to cost of products sold in the same period in which the related revenue is recognized.
Research and Development Expenses
Research and development expenses were $25.8 million, $26.3 million and $26.6 million for the years ended December 31, 2023, 2022 and 2021, respectively, are classified as SG&A expenses and are charged to expense as incurred.
ACCO Brands Corporation and Subsidiaries
Notes to Consolidated Financial Statements (Continued)
Stock-Based Compensation
Our primary types of stock-based compensation consist of stock options, restricted stock unit awards and performance stock unit awards. Stock-based compensation cost is measured at the grant date, based on the fair value of the award, and is recognized as expense over the requisite service period. Where awards are made with non-substantive vesting periods (for example, where a portion of the award vests due to retirement eligibility), we estimate and recognize expense based on the period from the grant date to the date on which the employee is retirement eligible. The Company accounts for forfeitures as they occur.
Foreign Currency Translation
Foreign currency balance sheet accounts are translated into U.S. dollars at the rates of exchange at the balance sheet date. Income and expenses are translated at the average rates of exchange in effect during the period. The related translation adjustments are made directly to a separate component of AOCI in stockholders’ equity. Some transactions are made in currencies different from an entity’s functional currency; gains and losses on these foreign currency transactions are included in the income statement.
Derivative Financial Instruments
We recognize all derivatives as either assets or liabilities on the balance sheet and record those instruments at fair value. If the derivative is designated as a fair value hedge and is effective, the changes in the fair value of the derivative and of the hedged item attributable to the hedged risk are recognized in earnings in the same period. If the derivative is designated as a cash flow hedge, the effective portions of changes in the fair value of the derivative are recorded in AOCI and are recognized in the Consolidated Statements of Income when the hedged item affects earnings. Ineffective portions of changes in the fair value of cash flow hedges are recognized in earnings.
Certain forecasted transactions, and assets and liabilities are exposed to foreign currency risk. We continually monitor our foreign currency exposures in order to maximize the overall effectiveness of our foreign currency hedge positions. Principal currencies hedged against the U.S. dollar include the Euro, Australian dollar, Canadian dollar, Swedish krona, British pound and Japanese yen.
Recent Accounting Pronouncements
In November 2023, the Financial Accounting Standards Board ("FASB") issued ASU 2023-07, Segment Reporting (Topic 280): Improvements to Reportable Segment Disclosures, which requires a public entity to disclose significant segment expenses and other segment items on an annual and interim basis and to provide in interim periods all disclosures about a reportable segment’s profit or loss and assets that are currently required annually. The ASU does not change how a public entity identifies its operating segments, aggregates them, or applies the quantitative thresholds to determine its reportable segments. This ASU is effective for annual periods beginning after December 15, 2023, and for interim periods beginning after December 15, 2024, with early adoption permitted. We are evaluating the effect this guidance will have on our segment disclosures.
In December 2023, the FASB issued ASU 2023-09, Income Taxes (Topic 740): Improvements to Income Tax Disclosures, which enhances the income tax disclosures to provide information to better assess how an entity’s operations and related tax risks and tax planning and operational opportunities affect its tax rate and prospects for future cash flows. This ASU is effective for annual periods beginning after December 15, 2024, with early adoption permitted. We are evaluating the effect this guidance will have on our tax disclosures.
ACCO Brands Corporation and Subsidiaries
Notes to Consolidated Financial Statements (Continued)
There were no other recently issued accounting standards that are expected to have an impact on the Company’s financial condition, results of operations or cash flow.
Recently Adopted Accounting Standards
In March 2020, the FASB issued ASU 2020-04, Reference Rate Reform (Topic 848), which provides optional expedients and exceptions for applying current GAAP to contracts, hedging relationships, and other transactions affected by the transition from the use of LIBOR to an alternative reference rate. Effective in the fourth quarter of 2022, the Company adopted this standard. The adoption of this standard did not have a material impact on our consolidated financial statements.
In December 2019, the FASB issued ASU 2019-12, Income Taxes (Topic 740): Simplifying the Accounting for Income Taxes, which removes certain exceptions for investments, intraperiod allocations and interim calculations, and adds guidance to reduce complexity in accounting for income taxes. Effective January 1, 2021, the Company adopted this standard. The adoption of this standard did not have a material impact on our consolidated financial statements.
There were no other accounting standards that were adopted in 2023, 2022, and 2021 that had a material effect on the Company’s financial condition, results of operations or cash flow.
3. Long-term Debt and Short-term Borrowings
Notes payable and long-term debt, listed in order of the priority of security interests in assets of the Company, consisted of the following as of December 31, 2023 and 2022:
| | | | | | | | |
(in millions) | | December 31,
2023 | | | December 31,
2022 | |
Euro Senior Secured Term Loan A, due March 2026 (floating interest rate of 5.93% at December 31, 2023 and 3.90% at December 31, 2022) | | $ | 218.2 | | | $ | 227.4 | |
USD Senior Secured Term Loan A, due March 2026 (floating interest rate of 7.50% at December 31, 2023 and 6.40% at December 31, 2022) | | | 78.0 | | | | 84.4 | |
Australian Dollar Senior Secured Term Loan A, due March 2026 (floating interest rate of 6.42% at December 31, 2023 and 5.30% at December 31, 2022) | | | 32.5 | | | | 34.9 | |
U.S. Dollar Senior Secured Revolving Credit Facility, due March 2026 (floating interest rate of 7.40% at December 31, 2023 and 6.36% at December 31, 2022) | | | 7.3 | | | | 58.6 | |
Australian Dollar Senior Secured Revolving Credit Facility, due March 2026 (floating interest rate of 6.42% at December 31, 2023 and 5.18% at December 31, 2022) | | | 14.3 | | | | 14.2 | |
Senior Unsecured Notes, due March 2029 (fixed interest rate of 4.25%) | | | 575.0 | | | | 575.0 | |
Other borrowings | | | 0.3 | | | | 10.4 | |
Total debt | | | 925.6 | | | | 1,004.9 | |
Less: | | | | | | |
Current portion | | | 36.7 | | | | 60.0 | |
Debt issuance costs, unamortized | | | 6.7 | | | | 8.4 | |
Long-term debt, net | | $ | 882.2 | | | $ | 936.5 | |
The Company is party to a Third Amended and Restated Credit Agreement (the "Credit Agreement"), dated as of January 27, 2017, among the Company, certain subsidiaries of the Company, Bank of America, N.A., as administrative agent, and the other agents and various lenders party thereto. The Credit Agreement, as amended, provides for a senior secured credit facility, which consists of a €300.0 million (US$320.8 million based on January 27, 2017, exchange rates) term loan facility, an A$80.0 million (US$60.4 million based on January 27, 2017, exchange rates) term loan facility, a US$100.0 million term loan facility, and a US$600.0 million multi-currency revolving credit facility (the "Revolving Facility").
ACCO Brands Corporation and Subsidiaries
Notes to Consolidated Financial Statements (Continued)
From July 2018 to November 2022, the Company entered into six amendments (the "Amendments") to the Credit Agreement. The following are the key changes, among other things, to the Credit Agreement as a result of the Amendments:
•replaced the minimum fixed coverage ratio of 1.25:1.00 with a minimum Interest Coverage Ratio (as defined in the Credit Agreement) of 3.00:1.00;
•increase the maximum Consolidated Leverage Ratio financial covenant from current levels for each of the five fiscal quarters beginning December 31, 2022, and ending December 31, 2023, as follows:
| | |
Quarter Ended | | Maximum Consolidated Leverage Ratio |
December 2022 | | 4.50:1.00 |
March 2023 | | 5.00:1.00 |
June 2023 | | 5.00:1.00 |
September 2023 | | 4.75:1.00 |
December 2023 | | 4.25:1.00 |
•modify the maximum Consolidated Leverage Ratio financial covenant for all first and second fiscal quarters after December 31, 2023, from the current level of 4.00x to 4.50x, while maintaining the current level of 4.00x for all third and fourth fiscal quarters;
•limit the maximum Consolidated Leverage Ratio to 5.00:1.00 at any time, thereby capping any material acquisition step ups for the fiscal quarters ending March 31, 2023, June 30, 2023 and September 30, 2023;
•increase the Company’s flexibility under the restricted payments baskets; and
•change the U.S. dollar reference rate from LIBOR-based pricing to SOFR-based pricing, with no changes to existing margins.
The current maturity of the Credit Agreement, as amended, is March 31, 2026 and the current pricing is as follows:
| | | | | | |
Consolidated Leverage Ratio | | Applicable Rate on Euro/AUD/CDN Dollar Loans | | Applicable Rate on Base Rate Loans | | Undrawn Fee |
> 4.50 to 1.00 | | 2.50 % | | 1.50 % | | 0.500 % |
≤ 4.50 to 1.00 and > 4.00 to 1.00 | | 2.25 % | | 1.25 % | | 0.375 % |
≤ 4.00 to 1.00 and > 3.50 to 1.00 | | 2.00 % | | 1.00 % | | 0.350 % |
≤ 3.50 to 1.00 and > 3.00 to 1.00 | | 1.75 % | | 0.75 % | | 0.300 % |
≤ 3.00 to 1.00 and > 2.00 to 1.00 | | 1.50 % | | 0.50 % | | 0.250 % |
≤ 2.00 to 1.00 | | 1.25 % | | 0.25 % | | 0.200 % |
As of December 31, 2023, the applicable rate on Euro, Australian and Canadian dollar loans was 2.00 percent and the applicable rate on Base Rate loans was 1.00 percent. Undrawn amounts under the Revolving Facility are subject to a commitment fee rate of 0.20 percent to 0.50 percent per annum, depending on the Company's Consolidated Leverage Ratio. As of December 31, 2023, the commitment fee rate was 0.35 percent.
As of December 31, 2023, there was $21.6 million in borrowings outstanding under the Revolving Facility ($7.3 million reported in "Current portion of long-term debt" and $14.3 million reported in "Long-term debt, net"), and the amount available for borrowings was $565.7 million (allowing for $12.7 million of letters of credit outstanding on that date).
ACCO Brands Corporation and Subsidiaries
Notes to Consolidated Financial Statements (Continued)
Amortization
The outstanding principal amounts under the Term Loan Facility are payable in quarterly installments in an amount representing, on an annual basis, 1.875 percent of the initial aggregate principal amount of such loan facility and increasing to 2.50 percent in June 2025.
Dividends and Share Repurchases
Under the Credit Agreement, as amended, the Company may pay dividends and/or repurchase shares in an aggregate amount not to exceed the sum of: (i) the greater of $40.0 million and 1 percent of the Company’s Consolidated Total Assets (as defined in the Credit Agreement, as amended) during any fiscal year; plus (ii) an additional amount not to exceed $75.0 million during any fiscal year (provided the Company’s Consolidated Leverage Ratio after giving pro forma effect to the restricted payment would not be greater than A) 4.25x for the fiscal quarters ending December 31, 2022, March 31, 2023, June 30, 2023 and September 30, 2023, and B) 0.25x inside the applicable Consolidated Leverage Ratio financial covenant thereafter); plus (iii) an additional amount so long as the Consolidated Leverage Ratio after giving pro forma effect to the restricted payment would be less than or equal to 3.25x; plus (iv) any Net Equity Proceeds (as defined in the Credit Agreement, as amended).
Financial Covenants
As of December 31, 2023, our Consolidated Leverage Ratio was approximately 3.42 to 1.00 versus our maximum covenant of 4.25 to 1.00. Our Interest Coverage Ratio was approximately 5.18 to 1.00 versus the minimum financial covenant of 3.00 to 1.00.
Other Covenants and Restrictions
The Credit Agreement, as amended, contains customary affirmative and negative covenants as well as events of default, including payment defaults, breach of representations and warranties, covenant defaults, cross-defaults, certain bankruptcy or insolvency events, certain ERISA-related events, changes in control or ownership and invalidity of any loan document. The Credit Agreement, as amended, also establishes limitations on the aggregate amount of Permitted Acquisitions and Investments (each as defined in the Credit Agreement, as amended) that the Company and its subsidiaries may make during the term of the Credit Agreement, as amended.
Incremental Facilities
The Credit Agreement, as amended, permits the Company to seek increases in the size of the Revolving Facility and the Term Loan Facility prior to maturity by up to $500.0 million in the aggregate, subject to lender commitment and the conditions set forth in the Credit Agreement, as amended.
ACCO Brands Corporation and Subsidiaries
Notes to Consolidated Financial Statements (Continued)
Senior Unsecured Notes due March 2029 (the "Senior Unsecured Notes")
The Senior Unsecured Notes indenture contains covenants that could limit the ability of the Company and its restricted subsidiaries to, among other things: (i) incur additional indebtedness or issue disqualified stock or, in the case of the Company’s restricted subsidiaries, preferred stock; (ii) create liens; (iii) pay dividends, make certain investments or make other restricted payments; (iv) sell certain assets or merge with or into other companies; (v) enter into transactions with affiliates; and (vi) allow any restricted subsidiary to pay dividends, loans, or assets to the Company or other restricted subsidiaries. These covenants are subject to a number of important limitations and exceptions. The Senior Unsecured Notes indenture also provides for events of default, which, if any of them occurs, would permit or require the principal, premium, if any, and accrued but unpaid interest on all the then outstanding Senior Unsecured Notes to be immediately due and payable.
Compliance with Loan Covenants
As of and for the periods ended December 31, 2023, and December 31, 2022, the Company was in compliance with all applicable loan covenants under its senior secured credit facilities and the Senior Unsecured Notes.
Guarantees and Security
Generally, obligations under the Credit Agreement, as amended, are guaranteed by certain of the Company's existing and future subsidiaries, and are secured by substantially all of the Company's and certain guarantor subsidiaries' assets, subject to certain exclusions and limitations.
The Senior Unsecured Notes are irrevocably and unconditionally guaranteed, jointly and severally, on a senior unsecured basis by each of our existing and future domestic subsidiaries other than certain excluded subsidiaries. The Senior Unsecured Notes and the related guarantees rank equally in right of payment with all of the existing and future senior debt of the Company and the guarantors, senior in right of payment to all of the existing and future subordinated debt of the Company and the guarantors, and effectively subordinated to all of the existing and future secured indebtedness of the Company and the guarantors to the extent of the value of the assets securing such indebtedness. The Senior Unsecured Notes and the guarantees are and will be structurally subordinated to all existing and future liabilities, including trade payables, of each of the Company's subsidiaries that do not guarantee the notes.
4. Leases
The Company leases its corporate headquarters, various other facilities for distribution, manufacturing, and offices, as well as vehicles, forklifts and other equipment. The Company determines if an arrangement is a lease at inception. Leases are included in "Right of use asset, leases" ("ROU Assets"), and the current portion of the lease liability is included in "Lease liabilities" and the non-current portion is included in "Long-term lease liabilities" in the Consolidated Balance Sheet. The Company currently has an immaterial amount of financing leases and leases with terms of more than one month and less than 12 months. ROU Assets and lease liabilities are recognized based on the present value of lease payments over the lease term. Because most of the Company’s leases do not provide an implicit rate of return, the Company uses its incremental collateralized borrowing rate, on a regional basis, in determining the present value of lease payments. The incremental borrowing rate is dependent upon duration of the lease and has been segmented into three groups of time. All leases within the same region and the same group of time, share the same incremental borrowing rate. The Company has lease agreements with lease and non-lease components, which are combined for accounting purposes for all classes of assets except information technology equipment.
ACCO Brands Corporation and Subsidiaries
Notes to Consolidated Financial Statements (Continued)
The components of lease expense for the years ended December 31, 2023, 2022, and 2021, were as follows:
| | | | | | | | | | | | |
(in millions) | | 2023 | | | 2022 | | | 2021 | |
Operating lease cost | | $ | 28.6 | | | $ | 29.5 | | | $ | 29.7 | |
Sublease income | | | (2.5 | ) | | | (2.4 | ) | | | (1.9 | ) |
Total lease cost | | $ | 26.1 | | | $ | 27.1 | | | $ | 27.8 | |
Other information related to leases for the years ended December 31, 2023, and 2022 was as follows:
| | | | | | | | |
(in millions, except lease term and discount rate) | | 2023 | | | 2022 | |
Cash paid for amounts included in the measurement of lease liabilities: | | | | | | |
Operating cash flows from operating leases | | $ | 29.8 | | | $ | 30.5 | |
Right-of-use assets obtained in exchange for lease obligations: | | | | | | |
Operating leases | | $ | 23.2 | | | $ | 11.4 | |
| | | | | | |
Weighted average remaining lease term: | | | | | | |
Operating leases | | 6 years | | | | |
| | | | | | |
Weighted average discount rate: | | | | | | |
Operating leases | | | 5.2 | % | | | |
Future minimum lease payments, net of sub-lease income, for all non-cancelable leases as of December 31, 2023 were as follows:
| | | | |
(in millions) | | Operating
Leases | |
2024 | | $ | 26.6 | |
2025 | | | 24.4 | |
2026 | | | 19.8 | |
2027 | | | 14.5 | |
2028 | | | 12.3 | |
Thereafter | | | 25.5 | |
Total minimum lease payments | | | 123.1 | |
Less imputed interest | | | 25.8 | |
Future minimum payments for leases, net of sublease rental income and imputed interest | | $ | 97.3 | |
5. Pension and Other Retiree Benefits
We have a number of pension plans, principally in Germany, the U.K. and the U.S. The plans provide for payment of retirement benefits, primarily commencing between the ages of 60 and 65, and also for payment of certain disability and severance benefits. After meeting certain qualifications, an employee acquires a vested right to future benefits. The benefits payable under the plans are generally determined based on an employee’s length of service and earnings. The majority of these plans have been frozen and are no longer accruing additional service benefits. Cash contributions to the plans are made as necessary to ensure legal funding requirements are satisfied. The ACCO Brands Corporation Pension Plan was fully and permanently frozen as of December 31, 2021. In 2019, the Esselte U.K. plan was frozen and merged with the legacy ACCO U.K. plan, which was frozen on September 30, 2012.
As of December 31, 2016, all of our Canadian pension plans were frozen. Effective July 1, 2022, the Company announced its plan to terminate the Canadian pension plans. During 2023, we recognized a settlement cost of $0.7 million due as lump sum payments exceeded the settlement threshold. We expect the termination of the Canadian pension plans to be finalized in 2024.
ACCO Brands Corporation and Subsidiaries
Notes to Consolidated Financial Statements (Continued)
Our German Esselte Leitz Pension Plan had an unfunded liability of $109.9 million and $103.0 million for the years ended December 31, 2023, and 2022, respectively. As is customary, there are no plans to, and there is no requirement to, fund the German Pension Plan other than to meet the current liabilities.
We also provide post-retirement health care and life insurance benefits to certain employees and retirees in the U.S., U.K. and Canada. All but one of these benefit plans is no longer open to new participants. Many employees and retirees outside of the U.S. are covered by government health care programs.
The following table sets forth our defined benefit pension and post-retirement plans funded status and the amounts recognized in our Consolidated Balance Sheets:
| | | | | | | | | | | | | | | | | | | | | | | | |
| | Pension | | | Post-retirement | |
| | U.S. | | | International | | | | |
(in millions) | | | 2023 | | | | 2022 | | | | 2023 | | | | 2022 | | | | 2023 | | | | 2022 | |
Change in projected benefit obligation (PBO) | | | | | | | | | | | | | | | |
Projected benefit obligation at beginning of year | | $ | 162.3 | | | $ | 212.5 | | | $ | 441.1 | | | $ | 673.6 | | | $ | 3.2 | | | $ | 4.3 | |
Service cost | | | — | | | | — | | | | 0.5 | | | | 1.0 | | | | — | | | | — | |
Interest cost | | | 7.9 | | | | 4.9 | | | | 20.0 | | | | 9.6 | | | | 0.2 | | | | 0.1 | |
Actuarial loss (gain) | | | 3.2 | | | | (45.2 | ) | | | 14.6 | | | | (158.7 | ) | | | 0.1 | | | | (0.6 | ) |
Participants’ contributions | | | — | | | | — | | | | 0.1 | | | | 0.1 | | | | — | | | | — | |
Benefits paid | | | (10.8 | ) | | | (9.9 | ) | | | (27.0 | ) | | | (25.7 | ) | | | (0.3 | ) | | | (0.4 | ) |
Settlement | | | — | | | | — | | | | (3.9 | ) | | | — | | | | — | | | | — | |
Termination benefits | | | — | | | | — | | | | — | | | | 0.8 | | | | — | | | | — | |
Foreign exchange rate changes | | | — | | | | — | | | | 22.0 | | | | (59.6 | ) | | | 0.1 | | | | (0.2 | ) |
Projected benefit obligation at end of year | | | 162.6 | | | | 162.3 | | | | 467.4 | | | | 441.1 | | | | 3.3 | | | | 3.2 | |
Change in plan assets | | | | | | | | | | | | | | | | | | |
Fair value of plan assets at beginning of year | | | 140.2 | | | | 180.9 | | | | 306.4 | | | | 481.7 | | | | — | | | | — | |
Actual return on plan assets | | | 13.6 | | | | (33.3 | ) | | | 18.9 | | | | (117.2 | ) | | | — | | | | — | |
Employer contributions | | | 2.5 | | | | 2.5 | | | | 14.1 | | | | 13.4 | | | | 0.3 | | | | 0.4 | |
Participants’ contributions | | | — | | | | — | | | | 0.1 | | | | 0.1 | | | | — | | | | — | |
Benefits paid | | | (10.8 | ) | | | (9.9 | ) | | | (27.0 | ) | | | (25.7 | ) | | | (0.3 | ) | | | (0.4 | ) |
Settlement | | | — | | | | — | | | | (4.0 | ) | | | — | | | | — | | | | — | |
Foreign exchange rate changes | | | — | | | | — | | | | 16.4 | | | | (45.9 | ) | | | — | | | | — | |
Fair value of plan assets at end of year | | | 145.5 | | | | 140.2 | | | | 324.9 | | | | 306.4 | | | | — | | | | — | |
Funded status (Fair value of plan assets less PBO) | | $ | (17.1 | ) | | $ | (22.1 | ) | | $ | (142.5 | ) | | $ | (134.7 | ) | | $ | (3.3 | ) | | $ | (3.2 | ) |
Amounts recognized in the Consolidated Balance Sheets consist of: | | | | | | | | | | | | | | | | | | |
Other non-current assets | | $ | — | | | $ | — | | | $ | 2.5 | | | $ | 2.8 | | | $ | — | | | $ | — | |
Other current liabilities | | | — | | | | — | | | | 7.5 | | | | 6.9 | | | | 0.3 | | | | 0.4 | |
Pension and post-retirement benefit obligations | | | 17.1 | | | | 22.1 | | | | 137.5 | | | | 130.6 | | | | 3.0 | | | | 2.8 | |
Components of accumulated other comprehensive income (loss), net of tax: | | | | | | | | | | | | | | | | | | |
Unrecognized actuarial loss (gain) | | | 90.7 | | | | 91.3 | | | | 139.9 | | | | 120.6 | | | | (3.6 | ) | | | (4.2 | ) |
Unrecognized prior service cost | | | — | | | | — | | | | 5.2 | | | | 5.2 | | | | — | | | | — | |
Pension and post-retirement benefit obligations of $157.6 million as of December 31, 2023, increased from $155.5 million as of December 31, 2022. The increase was primarily due to updated assumptions and foreign exchange, partly offset by cash contributions.
The accumulated benefit obligation for all pension plans was $625.1 million and $598.1 million at December 31, 2023 and 2022, respectively.
ACCO Brands Corporation and Subsidiaries
Notes to Consolidated Financial Statements (Continued)
The following table sets out information for pension plans with an accumulated benefit obligation in excess of plan assets:
| | | | | | | | | | | | | | | | |
| | U.S. | | | International | |
(in millions) | | | 2023 | | | | 2022 | | | | 2023 | | | | 2022 | |
Accumulated benefit obligation | | $ | 162.6 | | | $ | 162.3 | | | $ | 437.4 | | | $ | 406.1 | |
Fair value of plan assets | | | 145.5 | | | | 140.2 | | | | 297.2 | | | | 273.7 | |
The following table sets out information for pension plans with a projected benefit obligation in excess of plan assets:
| | | | | | | | | | | | | | | | |
| | U.S. | | | International | |
(in millions) | | | 2023 | | | | 2022 | | | | 2023 | | | | 2022 | |
Projected benefit obligation | | $ | 162.6 | | | $ | 162.3 | | | $ | 442.1 | | | $ | 411.3 | |
Fair value of plan assets | | | 145.5 | | | | 140.2 | | | | 297.2 | | | | 273.7 | |
The components of net periodic benefit (income) cost for pension and post-retirement plans for the years ended December 31, 2023, 2022, and 2021, were as follows:
| | | | | | | | | | | | | | | | | | | | | | | | | | | | | | | | | | | | |
| | Year Ended December 31, | | | | |
| | Pension | | | Post-retirement | |
| | U.S. | | | International | | | | | | | | | | |
(in millions) | | 2023 | | | 2022 | | | 2021 | | | 2023 | | | 2022 | | | 2021 | | | 2023 | | | 2022 | | | 2021 | |
Service cost | | $ | — | | | $ | — | | | $ | 0.5 | | | $ | 0.5 | | | $ | 1.0 | | | $ | 1.5 | | | $ | — | | | $ | — | | | $ | — | |
Interest cost | | | 7.9 | | | | 4.9 | | | | 4.5 | | | | 20.0 | | | | 9.6 | | | | 6.3 | | | | 0.2 | | | | 0.1 | | | | 0.1 | |
Expected return on plan assets | | | (12.0 | ) | | | (10.9 | ) | | | (11.4 | ) | | | (21.5 | ) | | | (17.5 | ) | | | (19.3 | ) | | | — | | | | — | | | | — | |
Amortization of net loss (gain) | | | 2.2 | | | | 3.7 | | | | 3.6 | | | | 4.2 | | | | 5.0 | | | | 7.1 | | | | (0.5 | ) | | | (0.5 | ) | | | (0.5 | ) |
Amortization of prior service cost | | | — | | | | — | | | | 0.1 | | | | 0.3 | | | | 0.3 | | | | 0.3 | | | | — | | | | — | | | | — | |
Special termination benefit(1) | | | — | | | | — | | | | — | | | | — | | | | 0.8 | | | | — | | | | — | | | | — | | | | — | |
Curtailment loss(2) | | | — | | | | — | | | | 1.4 | | | | — | | | | — | | | | — | | | | — | | | | — | | | | — | |
Settlement loss | | | — | | | | — | | | | — | | | | 1.2 | | | | — | | | | — | | | | — | | | | — | | | | — | |
Net periodic benefit (income) cost (3) | | $ | (1.9 | ) | | $ | (2.3 | ) | | $ | (1.3 | ) | | $ | 4.7 | | | $ | (0.8 | ) | | $ | (4.1 | ) | | $ | (0.3 | ) | | $ | (0.4 | ) | | $ | (0.4 | ) |
(1)Special termination benefit of $0.8 million due to the plan wind-up of the ACCO Brands Canada Salaried and Hourly plans effective July 1, 2022. The plan wind-up is considered an irrevocable event that triggers special accounting, specifically a one-time special termination benefit. The plan wind-up is expected to be completed in 2024.
(2)Curtailment loss of $1.4 million due to the pension benefit freeze for the Sidney group under the ACCO Brands Corporation Pension Plan.
(3)The components of net periodic benefit (income) cost, other than service cost, are included in the line "Non-operating pension expense (income)" in the Consolidated Statements of Income (Loss).
Other changes in plan assets and benefit obligations that were recognized in accumulated other comprehensive income (loss) during the years ended December 31, 2023, 2022, and 2021 were as follows:
| | | | | | | | | | | | | | | | | | | | | | | | | | | | | | | | | | | | |
| | Pension | | | Post-retirement | |
| | U.S. | | | International | | | | | | | | | | |
(in millions) | | | 2023 | | | | 2022 | | | | 2021 | | | | 2023 | | | | 2022 | | | | 2021 | | | | 2023 | | | | 2022 | | | | 2021 | |
Current year actuarial loss (gain) | | $ | 1.6 | | | $ | (1.0 | ) | | $ | (10.3 | ) | | $ | 17.2 | | | $ | (23.9 | ) | | $ | (30.5 | ) | | $ | 0.1 | | | $ | (0.6 | ) | | $ | (0.5 | ) |
Amortization of actuarial (loss) gain | | | (2.2 | ) | | | (3.7 | ) | | | (3.6 | ) | | | (5.2 | ) | | | (5.1 | ) | | | (7.1 | ) | | | 0.5 | | | | 0.5 | | | | 0.5 | |
Amortization of prior service cost | | | — | | | | — | | | | (1.5 | ) | | | (0.3 | ) | | | (0.3 | ) | | | (0.3 | ) | | | — | | | | — | | | | — | |
Foreign exchange rate changes | | | — | | | | — | | | | — | | | | 7.5 | | | | (21.5 | ) | | | (4.1 | ) | | | (0.1 | ) | | | 0.2 | | | | — | |
Total recognized in other comprehensive (loss) income | | | (0.6 | ) | | | (4.7 | ) | | | (15.4 | ) | | | 19.2 | | | | (50.8 | ) | | | (42.0 | ) | | | 0.5 | | | | 0.1 | | | | — | |
Total recognized in net periodic benefit (income) cost and other comprehensive (loss) income | | $ | (2.5 | ) | | $ | (7.0 | ) | | $ | (16.7 | ) | | $ | 23.9 | | | $ | (51.6 | ) | | $ | (46.1 | ) | | $ | 0.2 | | | $ | (0.3 | ) | | $ | (0.4 | ) |
ACCO Brands Corporation and Subsidiaries
Notes to Consolidated Financial Statements (Continued)
Assumptions
The weighted average assumptions used to determine benefit obligations for the years ended December 31, 2023, 2022, and 2021 were as follows:
| | | | | | | | | | | | | | | | | | |
| | Pension | | Post-retirement |
| | U.S. | | International | | |
| | 2023 | | 2022 | | 2021 | | 2023 | | 2022 | | 2021 | | 2023 | | 2022 | | 2021 |
Discount rate | | 5.0 % | | 5.1 % | | 2.9 % | | 4.2 % | | 4.5 % | | 1.8 % | | 4.8 % | | 3.8 % | | 2.4 % |
Rate of compensation increase | | N/A | | N/A | | N/A | | 2.9 % | | 3.0 % | | 3.0 % | | N/A | | N/A | | N/A |
The weighted average assumptions used to determine net periodic benefit (income) cost for the years ended December 31, 2023, 2022, and 2021 were as follows:
| | | | | | | | | | | | | | | | | | |
| | Pension | | Post-retirement |
| | U.S. | | International | | |
| | 2023 | | 2022 | | 2021 | | 2023 | | 2022 | | 2021 | | 2023 | | 2022 | | 2021 |
Discount rate | | 5.1 % | | 2.9 % | | 3.1 % | | 4.5 % | | 1.8 % | | 1.0 % | | 5.0 % | | 2.4 % | | 2.2 % |
Expected long-term rate of return | | 7.5 % | | 6.5 % | | 6.8 % | | 6.9 % | | 4.0 % | | 4.0 % | | N/A | | N/A | | N/A |
Rate of compensation increase | | N/A | | N/A | | N/A | | 3.0 % | | 3.0 % | | 2.7 % | | N/A | | N/A | | N/A |
The weighted average health care cost trend rates used to determine post-retirement benefit obligations and net periodic benefit (income) cost as of December 31, 2023, 2022, and 2021were as follows:
| | | | | | |
| | Post-retirement |
| | 2023 | | 2022 | | 2021 |
Health care cost trend rate assumed for next year | | 9 % | | 6 % | | 6 % |
Rate that the cost trend rate is assumed to decline (the ultimate trend rate) | | 7 % | | 5 % | | 5 % |
Year that the rate reaches the ultimate trend rate | | 2031 | | 2030 | | 2030 |
Plan Assets
The investment strategy for the Company is to optimize investment returns through a diversified portfolio of investments, taking into consideration underlying plan liabilities and asset volatility. Each plan has a different target asset allocation, which is reviewed periodically and is based on the underlying liability structure. The target asset allocation for our U.S. plan is 37 percent in equity securities, 57 percent in fixed income securities and 6 percent in alternative assets. The target asset allocation for non-U.S. plans is set by the local plan trustees.
Our pension plan weighted average asset allocations as of December 31, 2023 and 2022 were as follows:
| | | | |
| 2023 | 2022 |
| U.S. | International | U.S. | International |
Asset category | | | | |
Equity securities | 37 % | 7 % | 35 % | 9 % |
Fixed income | 57 % | 63 % | 58 % | 56 % |
Real estate | 4 % | 3 % | 4 % | 3 % |
Other(4) | 2 % | 27 % | 3 % | 32 % |
Total | 100 % | 100 % | 100 % | 100 % |
(4)Multi-strategy hedge funds, commodity linked funds, private equity funds, and cash and cash equivalents for certain of our plans.
ACCO Brands Corporation and Subsidiaries
Notes to Consolidated Financial Statements (Continued)
U.S. Pension Plan Assets
The fair value measurements of our U.S. pension plan assets by asset category as of December 31, 2023 were as follows:
| | | | | | | | | | | | | | | | |
| | Quoted Prices in Active Markets for Identical Assets | | | Significant Other Observable Inputs | | | Significant Unobservable Inputs | | | Fair Value as of | |
(in millions) | | (Level 1) | | | (Level 2) | | | (Level 3) | | | December 31, 2023 | |
Mutual funds | | $ | 106.1 | | | $ | — | | | $ | — | | | $ | 106.1 | |
Exchange traded funds | | | 38.3 | | | | — | | | | — | | | | 38.3 | |
Common collective trust funds | | | — | | | | 1.1 | | | | — | | | | 1.1 | |
Total | | $ | 144.4 | | | $ | 1.1 | | | $ | — | | | $ | 145.5 | |
The fair value measurements of our U.S. pension plan assets by asset category as of December 31, 2022 were as follows:
| | | | | | | | | | | | | | | | |
| | Quoted Prices in Active Markets for Identical Assets | | | Significant Other Observable Inputs | | | Significant Unobservable Inputs | | | Fair Value as of | |
(in millions) | | (Level 1) | | | (Level 2) | | | (Level 3) | | | December 31, 2022 | |
Mutual funds | | $ | 105.3 | | | $ | — | | | $ | — | | | $ | 105.3 | |
Exchange traded funds | | | 33.8 | | | | — | | | | — | | | | 33.8 | |
Common collective trust funds | | | — | | | | 1.1 | | | | — | | | | 1.1 | |
Total | | $ | 139.1 | | | $ | 1.1 | | | $ | — | | | $ | 140.2 | |
Mutual funds and exchange traded funds: The fair values of mutual fund and common stock fund investments are determined by obtaining quoted prices on nationally recognized securities exchanges (level 1 inputs).
Common collective trusts: The fair values of participation units held in common collective trusts are based on their net asset values, as reported by the managers of the common collective trusts and as supported by the unit prices of actual purchase and sale transactions occurring as of or close to the financial statement date (level 2 inputs).
ACCO Brands Corporation and Subsidiaries
Notes to Consolidated Financial Statements (Continued)
International Pension Plans Assets
The fair value measurements of our international pension plans assets by asset category as of December 31, 2023 were as follows:
| | | | | | | | | | | | | | | | |
| | Quoted Prices in Active Markets for Identical Assets | | | Significant Other Observable Inputs | | | Significant Unobservable Inputs | | | Fair Value as of | |
(in millions) | | (Level 1) | | | (Level 2) | | | (Level 3) | | | December 31, 2023 | |
Cash and cash equivalents | | $ | 6.4 | | | $ | — | | | $ | — | | | $ | 6.4 | |
Equity securities | | | 20.4 | | | | 2.7 | | | | — | | | | 23.1 | |
Corporate debt securities | | | — | | | | 73.6 | | | | — | | | | 73.6 | |
Multi-strategy hedge funds | | | — | | | | 30.2 | | | | — | | | | 30.2 | |
Insurance contracts | | | — | | | | 4.1 | | | | — | | | | 4.1 | |
Real estate | | | — | | | | 3.7 | | | | — | | | | 3.7 | |
Government debt securities | | | — | | | | 131.3 | | | | — | | | | 131.3 | |
Investments measured at net asset value(5) | | | | | | | | | | | | |
Multi-strategy hedge funds | | | | | | | | | | | | 24.7 | |
Real estate | | | | | | | | | | | | 5.9 | |
Private equity | | | | | | | | | | | | 21.9 | |
Total | | $ | 26.8 | | | $ | 245.6 | | | $ | — | | | $ | 324.9 | |
(5)Certain investments that are measured at fair value using the net asset value per share practical expedient have not been categorized in the fair value hierarchy. The fair value amounts presented in these tables are intended to permit reconciliation of the fair value hierarchy to the amounts presented in the table that presents our defined benefit pension and post-retirement plans funded status.
The fair value measurements of our international pension plans assets by asset category as of December 31, 2022 were as follows:
| | | | | | | | | | | | | | | | |
| | Quoted Prices in Active Markets for Identical Assets | | | Significant Other Observable Inputs | | | Significant Unobservable Inputs | | | Fair Value as of | |
(in millions) | | (Level 1) | | | (Level 2) | | | (Level 3) | | | December 31, 2022 | |
Cash and cash equivalents | | $ | 16.6 | | | $ | — | | | $ | — | | | $ | 16.6 | |
Equity securities | | | 25.2 | | | | — | | | | — | | | | 25.2 | |
Corporate debt securities | | | — | | | | 61.0 | | | | — | | | | 61.0 | |
Multi-strategy hedge funds | | | — | | | | 32.1 | | | | — | | | | 32.1 | |
Insurance contracts | | | — | | | | 3.8 | | | | — | | | | 3.8 | |
Real estate | | | — | | | | 2.2 | | | | — | | | | 2.2 | |
Government debt securities | | | — | | | | 109.1 | | | | — | | | | 109.1 | |
Investments measured at net asset value(5) | | | | | | | | | | | | |
Multi-strategy hedge funds | | | | | | | | | | | | 30.2 | |
Real estate | | | | | | | | | | | | 6.0 | |
Private equity | | | | | | | | | | | | 20.2 | |
Total | | $ | 41.8 | | | $ | 208.2 | | | $ | — | | | $ | 306.4 | |
Equity securities and exchange traded funds: The fair values of equity securities are determined by obtaining quoted prices on nationally recognized securities exchanges (level 1 inputs).
Debt securities: Fixed income securities, such as corporate and government bonds and other debt securities, consist of index-linked securities. These debt securities are valued using quotes from independent pricing vendors based on recent trading
ACCO Brands Corporation and Subsidiaries
Notes to Consolidated Financial Statements (Continued)
activity and other relevant information, including market interest rate curves, referenced credit spreads, and estimated prepayment rates, where applicable (level 2 inputs).
Insurance contracts: Valued at contributions made, plus earnings, less participant withdrawals and administrative expenses, which approximate fair value (level 2 inputs).
Multi-strategy hedge funds: The fair values of participation units held in multi-strategy hedge funds are based on their net asset values, as reported by the managers of the funds and are based on the daily closing prices of the underlying investments (level 2 inputs).
Real estate: Real estate consists of managed real estate investment trust securities (level 2 inputs).
Cash Contributions
We contributed $16.9 million to our pension and post-retirement plans in 2023 and expect to contribute approximately $16.0 million in 2024.
The following table presents estimated future benefit payments to participants for the next ten fiscal years:
| | | | | | | | |
(in millions) | | Pension Benefits | | | Post-retirement Benefits | |
2024 | | $ | 40.1 | | | $ | 0.3 | |
2025 | | | 40.5 | | | | 0.3 | |
2026 | | | 40.5 | | | | 0.3 | |
2027 | | | 40.8 | | | | 0.3 | |
2028 | | | 41.7 | | | | 0.3 | |
Years 2029 - 2033 | | | 215.1 | | | | 1.3 | |
We also sponsor a number of defined contribution plans. Contributions are determined under various formulas. Costs related to such plans amounted to $12.5 million, $13.2 million and $12.7 million for the years ended December 31, 2023, 2022, and 2021, respectively.
Multi-Employer Pension Plan
We are a participant in a multi-employer pension plan. The plan has reported significant underfunded liabilities and declared itself in critical and declining status (red). As a result, the trustees of the plan adopted a rehabilitation plan ("RP") in an effort to forestall insolvency. Our required contributions to this plan could increase due to the shrinking contribution base resulting from the insolvency of or withdrawal of other participating employers, from the inability or the failure of withdrawing participating employers to pay their withdrawal liability, from lower than expected returns on pension fund assets, and from other funding deficiencies. In the event that we withdraw from participation in the plan, we will be required to make withdrawal liability payments for a period of 20 years or longer in certain circumstances. The present value of our withdrawal liability payments would be recorded as an expense in our Consolidated Statements of Income and as a liability on our Consolidated Balance Sheets in the first year of our withdrawal. The most recent Pension Protection Act ("PPA") zone status available in 2023 and 2022 is for the plan’s years ended December 31, 2022, and 2021, respectively. The zone status is based on information that we received from the plan and is certified by the plan’s actuary. Plans in the red zone (critical or critical and declining) are generally less than 65 percent funded, plans in the yellow zone (endangered) are less than 80 percent funded, and plans in the green zone (safe) are at least 80 percent funded.
ACCO Brands Corporation and Subsidiaries
Notes to Consolidated Financial Statements (Continued)
The Company's contributions are not more than 5 percent of the total contributions to the plan. Details regarding the plan are outlined in the table below.
| | | | | | | | | | | | | | | | | | |
| | EIN/Pension Plan | | Pension Protection Act Zone Status | | FIP/RP Status Pending | | Contributions Year Ended December 31, | | Surcharge | | Expiration Date of Collective-Bargaining |
Pension Fund | | Number | | 2023 | | 2022 | | Implemented | | 2023 | | 2022 | | 2021 | | Imposed | | Agreement |
PACE Industry Union-Management Pension Fund | | 11-6166763 / 001 | | Red | | Red | | Implemented | | $0.1 | | $0.1 | | $0.1 | | Yes | | 6/30/2028 |
6. Stock-Based Compensation
The 2022 ACCO Brands Corporation Incentive Plan (the "Plan") provides for stock-based awards generally in the form of stock options, restricted stock units ("RSUs") and performance stock units ("PSUs"), any of which may be granted alone or with other types of awards and dividend equivalents. The Plan authorizes the issuance of up to 15,994,631 shares to key employees and non-employee directors under the Plan.
Beginning in 2018, the Company initiated a cash dividend to stockholders and began accruing dividend equivalents ("DEs") on all outstanding RSUs and PSUs as permitted by the Plan. DEs entitle holders of RSUs and PSUs to the same dividend value per share as holders of common stock. RSUs and PSUs are credited with DEs that are converted to RSUs and PSUs at the fair market value of our common stock on the dates the dividend payments are made and are subject to the same terms and conditions as the underlying award. DEs credited to RSUs and PSUs will only be paid to the extent the awards vest and any performance goals are achieved.
We will satisfy the requirement for delivering shares of our common stock for the Plan by issuing new shares.
The following table summarizes the impact of all stock-based compensation expense on our Consolidated Statements of (Loss) Income for the years ended December 31, 2023, 2022, and 2021:
| | | | | | | | | | | | |
(in millions) | | 2023 | | | 2022 | | | 2021 | |
Selling, general and administrative expense | | $ | 14.8 | | | $ | 9.5 | | | $ | 15.2 | |
Income (loss) before income tax | | | (14.8 | ) | | | (9.5 | ) | | | (15.2 | ) |
Income tax benefit | | | (3.4 | ) | | | (2.2 | ) | | | (3.6 | ) |
Net income (loss) | | $ | (11.4 | ) | | $ | (7.3 | ) | | $ | (11.6 | ) |
There was no capitalization of stock-based compensation expense.
Stock-based compensation expense by award type for the years ended December 31, 2023, 2022, and 2021 was as follows:
| | | | | | | | | | | | |
(in millions) | | 2023 | | | 2022 | | | 2021 | |
Stock option compensation expense | | $ | 2.7 | | | $ | 3.7 | | | $ | 3.6 | |
RSU compensation expense | | | 6.4 | | | | 4.4 | | | | 5.3 | |
PSU compensation expense | | | 5.7 | | | | 1.4 | | | | 6.3 | |
Total stock-based compensation expense | | $ | 14.8 | | | $ | 9.5 | | | $ | 15.2 | |
ACCO Brands Corporation and Subsidiaries
Notes to Consolidated Financial Statements (Continued)
Stock Options
The exercise price of each stock option equals or exceeds the fair market price of our stock on the date of grant. Options granted beginning in 2020 can generally be exercised over a term of ten years and prior to 2020 options could generally be exercised over a term of seven years. Stock options outstanding as of December 31, 2023, generally vest ratably over three years from the grant date. There were no stock options granted during the year ended December 31, 2023. The fair value of each option award is estimated on the date of grant using the Black-Scholes option-pricing model and the weighted average assumptions as outlined in the following table:
| | | | |
| | Year Ended December 31, |
| | 2022 | | 2021 |
Weighted average expected lives | | 6.0 years | | 6.0 years |
Weighted average risk-free interest rate | | 1.89 % | | 0.93 % |
Weighted average expected volatility | | 41.7 % | | 41.3 % |
Expected dividend yield | | 3.60 % | | 3.07 % |
Weighted average grant date fair value | | $2.43 | | $2.45 |
The weighted average expected option term of the Company's "plain vanilla" stock options granted during the years ended December 31, 2022 and 2021 reflect the application of the simplified method, as prescribed by Staff Accounting Bulletin Topic 14. The simplified method was used as the Company does not believe it has sufficient historical exercise data to provide a reasonable basis for the expected term of its stock option grants. The simplified method will be used until such time as the Company has stock option exercise experience in which to reasonably determine the expected life. The risk-free interest rate for the expected term of the option is based on the U.S. Treasury yield curve in effect at the time of grant. Volatility is calculated using ACCO Brands' historic volatility.
A summary of the changes in stock options outstanding under the Plan during the year ended December 31, 2023 is presented below:
| | | | | | | | | | | | |
| | Number
Outstanding | �� | | Weighted Average Exercise Price | | | Weighted Average Remaining Contractual Term | | Aggregate
Intrinsic
Value |
Outstanding at December 31, 2022 | | | 6,728,615 | | | $ | 9.27 | | | | | |
Forfeited | | | (103,389 | ) | | $ | 9.70 | | | | | |
Outstanding at December 31, 2023 | | | 6,625,226 | | | $ | 9.26 | | | 5.3 years | | zero |
Exercisable shares at December 31, 2023 | | | 5,015,909 | | | $ | 9.55 | | | 4.4 years | | zero |
There were no options exercised during the year ended December 31, 2023. We received cash of $4.3 million and $3.1 million from the exercise of stock options during the years ended December 31, 2022 and 2021, respectively. The aggregate intrinsic value of options exercised during the years ended December 31, 2022 and 2021 totaled $0.5 million and $1.0 million, respectively.
The fair value of options vested during the years ended December 31, 2023, 2022, and 2021 was $3.4 million, $3.1 million and $2.7 million, respectively. As of December 31, 2023, we had unrecognized compensation expense related to stock options of $0.8 million, which will be recognized over a weighted-average period of 1.0 years.
ACCO Brands Corporation and Subsidiaries
Notes to Consolidated Financial Statements (Continued)
Stock Unit Awards
RSUs vest over a pre-determined period of time, generally three years from the date of grant. Stock-based compensation expense for the years ended December 31, 2023, 2022, and 2021 includes $1.3 million, $1.2 million and $0.7 million, respectively, of expense related to RSUs granted to non-employee directors as a component of their compensation. RSUs granted to non-employee directors prior to 2021 became fully vested on the grant date; after 2021 non-employee director RSUs fully vest on the first anniversary of the grant date.
PSUs also vest over a pre-determined period of time, generally not longer than three years, but are further subject to the achievement of certain business performance criteria being met during the three-year performance period. Based upon the level of achieved performance, the number of shares actually awarded can vary from 0 percent to 200 percent of the original grant.
There were 3,444,450 RSUs outstanding as of December 31, 2023. All outstanding RSUs as of December 31, 2023 vest within three years of their date of grant. Upon vesting, all of the RSU awards will be converted into the right to receive one share of common stock of the Company for each unit that vests. The cost of these awards is determined using the fair value of the shares on the date of grant, and compensation expense is generally recognized over the period during which the employee provides the requisite service to the Company.
A summary of the changes in the RSUs outstanding under the Plan during 2023 is presented below:
| | | | | | | | |
| | Stock
Units | | | Weighted Average Grant Date Fair Value | |
Outstanding at December 31, 2022 | | | 2,016,120 | | | $ | 8.43 | |
Granted | | | 1,969,191 | | | $ | 5.23 | |
Vested and distributed | | | (536,132 | ) | | $ | 8.26 | |
Forfeited and cancelled | | | (4,729 | ) | | $ | 8.46 | |
Outstanding at December 31, 2023 | | | 3,444,450 | | | $ | 6.63 | |
Vested and deferred at December 31, 2023(1) | | | 673,883 | | | $ | 8.65 | |
(1)Included in outstanding at December 31, 2023. Vested and deferred RSUs are primarily related to deferred compensation for non-employee directors.
For the years ended December 31, 2022 and 2021, we granted 695,057 and 362,750 RSUs, respectively. The weighted-average grant date fair value of our RSUs was $5.23, $8.15, and $8.78 for the years ended December 31, 2023, 2022, and 2021, respectively. The fair value of RSUs that vested during the years ended December 31, 2023, 2022, and 2021 was $4.4 million, $5.1 million and $4.2 million, respectively. As of December 31, 2023, we have unrecognized compensation expense related to RSUs of $8.2 million, which will be recognized over a weighted-average period of 2.0 years.
A summary of the changes in the PSUs outstanding under the Plan during 2023 is presented below:
| | | | | | | | |
| | Stock
Units | | | Weighted Average Grant Date Fair Value | |
Outstanding at December 31, 2022 | | | 673,169 | | | $ | 8.42 | |
Granted | | | 2,301,907 | | | $ | 5.39 | |
Vested | | | (336,077 | ) | | $ | 8.42 | |
Other - decrease due to performance of PSUs | | | (867,309 | ) | | $ | 4.34 | |
Outstanding at December 31, 2023 | | | 1,771,690 | | | $ | 6.48 | |
ACCO Brands Corporation and Subsidiaries
Notes to Consolidated Financial Statements (Continued)
For the years ended December 31, 2022 and 2021, we granted 1,170,884 and 1,667,012 PSUs, respectively. For the years ended December 31, 2023, 2022, and 2021, 336,077, 350,656 and zero PSUs vested, respectively. The weighted-average grant date fair value of our PSUs was $5.39, $8.88, and $8.42 for the years ended December 31, 2023, 2022, and 2021, respectively. The fair value of PSUs that vested during the years ended December 31, 2023, 2022, and 2021 was $2.8 million, $3.0 million and zero, respectively. Based on the level of achievement of the performance targets associated with the PSU awards, as of December 31, 2023, we have $5.0 million of unrecognized compensation expense, which will be recognized over a weighted-average period of 1.9 years.
7. Inventories
The components of inventories were as follows:
| | | | | | | | |
| | December 31, | |
(in millions) | | 2023 | | | 2022 | |
Raw materials | | $ | 50.1 | | | $ | 76.8 | |
Work in process | | | 4.7 | | | | 4.4 | |
Finished goods | | | 272.7 | | | | 314.0 | |
Total inventories | | $ | 327.5 | | | $ | 395.2 | |
8. Property, Plant and Equipment, Net
The components of net property, plant and equipment were as follows:
| | | | | | | | |
| | December 31 | |
(in millions) | | | 2023 | | | | 2022 | |
Land and improvements | | $ | 20.9 | | | $ | 20.6 | |
Buildings and improvements to leaseholds | | | 130.7 | | | | 125.3 | |
Machinery and equipment | | | 442.9 | | | | 439.5 | |
Construction in progress | | | 5.1 | | | | 3.8 | |
| | | 599.6 | | | | 589.2 | |
Less: accumulated depreciation | | | (429.5 | ) | | | (404.1 | ) |
Net property, plant and equipment (1) | | $ | 170.1 | | | $ | 185.1 | |
(1)Net property, plant and equipment as of December 31, 2023 and 2022 contained $37.9 million and $52.5 million of computer software assets, respectively, which are classified within machinery and equipment and construction in progress. Depreciation expense for software was $14.1 million, $13.9 million and $12.9 million for the years ended December 31, 2023, 2022, and 2021, respectively.
9. Goodwill and Identifiable Intangible Assets
Goodwill
We test goodwill for impairment at least annually and on an interim basis if an event or circumstance indicates that it is more likely than not that an impairment loss has been incurred. The result of our annual qualitative assessment performed during the second quarter, as of our measurement date of May 31, 2023, was that there were no triggering events that would make it more likely than not that an impairment loss to our goodwill had been incurred in our North America, International and EMEA reporting units.
During the fourth quarter of 2023, our forecasted cash flows for our North America reporting unit further declined, including lower demand for our technology accessories, due to a weaker macroeconomic environment as well as tight inventory
ACCO Brands Corporation and Subsidiaries
Notes to Consolidated Financial Statements (Continued)
management by retail customers. As a result, we identified a triggering event indicating it was more likely than not that an impairment loss had been incurred. Accordingly, as of December 31, 2023, we completed an impairment assessment, on a quantitative basis, for goodwill for each of our three reporting units. The result of our assessment was that the fair value of the North America reporting unit did not exceed its carrying value resulting in an impairment charge of $89.5 million. The result of our assessments for the International and EMEA reporting units was that the fair value of each exceeded its carrying values by approximately ten percent and greater than fifty percent, respectively, and we concluded that no impairment existed.
Estimating the fair value of each reporting unit requires us to make assumptions and estimates regarding our future. We utilized a combination of both a discounted cash flows and market approach. The financial projections used in the valuation models reflected management's assumptions regarding revenue growth rates, economic and market trends, cost structure, discount rate, and other expectations about the anticipated short-term and long-term operating results for each of our three reporting units.
We believe the assumptions used in our goodwill impairment analysis are appropriate and result in reasonable estimates of the implied fair value of each reporting unit. However, given the economic environment and the uncertainties regarding the impact on our business, there can be no assurance that our estimates and assumptions, made for purposes of our goodwill impairment testing, will prove to be an accurate prediction of the future. If our assumptions regarding future performance are not achieved, we may be required to record additional goodwill impairment charges in future periods.
Changes in the net carrying amount of goodwill by segment were as follows:
| | | | | | | | | | | | | | | | |
(in millions) | | ACCO Brands North America | | | ACCO Brands EMEA | | | ACCO Brands International | | | Total | |
Balance at December 31, 2021 | | $ | 446.7 | | | $ | 178.6 | | | $ | 177.2 | | | $ | 802.5 | |
Goodwill impairment | | | (98.7 | ) | | | — | | | | — | | | | (98.7 | ) |
Foreign currency translation | | | — | | | | (33.0 | ) | | | 0.7 | | | | (32.3 | ) |
Balance at December 31, 2022 | | $ | 348.0 | | | $ | 145.6 | | | $ | 177.9 | | | $ | 671.5 | |
Goodwill impairment | | | (89.5 | ) | | | — | | | | — | | | | (89.5 | ) |
Foreign currency translation | | | — | | | | 6.7 | | | | 1.3 | | | | 8.0 | |
Balance at December 31, 2023 | | $ | 258.5 | | | $ | 152.3 | | | $ | 179.2 | | | $ | 590.0 | |
ACCO Brands Corporation and Subsidiaries
Notes to Consolidated Financial Statements (Continued)
Identifiable Intangibles
The Company's gross carrying value and accumulated amortization by class of identifiable intangible assets as of December 31, 2023 and 2022 were as follows:
| | | | | | | | | | | | | | | | | | | | | | | | |
| | December 31, 2023 | | | December 31, 2022 | |
(in millions) | | Gross Carrying Amounts | | | Accumulated Amortization | | | Net Book Value | | | Gross Carrying Amounts | | | Accumulated Amortization | | | Net Book Value | |
Indefinite-lived intangible assets: | | | | | | | | | | | | | | | | | | |
Trade names(1) | | $ | 295.1 | | | $ | (44.5 | ) | | $ | 250.6 | | | $ | 410.6 | | | $ | (44.5 | ) | | $ | 366.1 | |
Amortizable intangible assets: | | | | | | | | | | | | | | | | | | |
Trade names | | | 497.1 | | | | (142.0 | ) | | | 355.1 | | | | 369.7 | | | | (123.0 | ) | | | 246.7 | |
Customer and contractual relationships | | | 362.4 | | | | (221.3 | ) | | | 141.1 | | | | 356.9 | | | | (198.2 | ) | | | 158.7 | |
Vendor relationships | | | 82.4 | | | | (16.7 | ) | | | 65.7 | | | | 82.4 | | | | (11.2 | ) | | | 71.2 | |
Patents | | | 8.2 | | | | (5.0 | ) | | | 3.2 | | | | 8.1 | | | | (3.8 | ) | | | 4.3 | |
Subtotal | | | 950.1 | | | | (385.0 | ) | | | 565.1 | | | | 817.1 | | | | (336.2 | ) | | | 480.9 | |
Total identifiable intangibles | | $ | 1,245.2 | | | $ | (429.5 | ) | | $ | 815.7 | | | $ | 1,227.7 | | | $ | (380.7 | ) | | $ | 847.0 | |
(1)Accumulated amortization prior to the adoption of authoritative guidance on goodwill and other intangible assets, at which time further amortization ceased.
The Company’s intangible amortization expense was $43.4 million, $41.5 million and $46.3 million for the years ended December 31, 2023, 2022, and 2021, respectively.
Estimated amortization expense for amortizable intangible assets for the next five years is as follows:
| | | | | | | | | | | | | | | | | | | | |
(in millions) | | 2024 | | | 2025 | | | 2026 | | | 2027 | | | 2028 | |
Estimated amortization expense(2) | | $ | 42.1 | | | $ | 40.5 | | | $ | 38.4 | | | $ | 36.0 | | | $ | 33.8 | |
(2)Actual amounts of amortization expense may differ from estimated amounts due to changes in foreign currency exchange rates, additional intangible asset acquisitions, impairment of intangible assets, accelerated amortization of intangible assets and other events.
We test indefinite-lived intangibles for impairment at least annually as of our measurement date of May 31st and on an interim basis if an event or circumstance indicates that it is more likely than not that an impairment loss has been incurred. We performed this annual assessment, on a qualitative basis, for our indefinite-lived trade names in the second quarter of 2023 and concluded that no impairment loss had been incurred.
Effective January 1, 2023, we changed the indefinite-lived Leitz® trade name to an amortizable intangible asset and began amortizing the trade name on a straight-line basis over a life of 30 years. The change was made as a result of decisions regarding the Company's future use of the trade name.
10. Restructuring
The Company recorded $27.2 million, $9.6 million and $6.0 million of restructuring charges for the years ended December 31, 2023, 2022 and 2021, respectively. Restructuring charges were primarily for severance costs related to cost reduction initiatives in our North America and EMEA segments in 2023 and for all segments in 2022 and 2021.
ACCO Brands Corporation and Subsidiaries
Notes to Consolidated Financial Statements (Continued)
The summary of the activity in the restructuring liability for the year ended December 31, 2023 was as follows:
| | | | | | | | | | | | | | | | | | | |
(in millions) | | Balance at December 31, 2022 | | | Provision | | | Cash Expenditures | | Non-cash Items/Currency Change | | | Balance at December 31, 2023 | |
Employee termination costs(1) | | $ | 8.7 | | | $ | 26.1 | | | $ | (7.6 | ) | $ | 0.3 | | | $ | 27.5 | |
Other(2) | | | — | | | | 1.1 | | | | (0.2 | ) | | — | | | | 0.9 | |
Total restructuring liability | | $ | 8.7 | | | $ | 27.2 | | | $ | (7.8 | ) | $ | 0.3 | | | $ | 28.4 | |
(1)We expect the remaining $27.5 million of employee termination costs to be substantially paid within the next twelve months.
(2)We expect the remaining $0.9 million in other costs to be substantially paid within the next twelve months.
The summary of the activity in the restructuring accounts for the year ended December 31, 2022 was as follows:
| | | | | | | | | | | | | | | | | | | | |
(in millions) | | Balance at December 31, 2021 | | | Provision | | | Cash Expenditures | | | Non-cash Items/Currency Change | | | Balance at December 31, 2022 | |
Employee termination costs | | $ | 3.4 | | | $ | 9.4 | | | $ | (4.0 | ) | | $ | (0.1 | ) | | $ | 8.7 | |
Termination of lease agreements | | | 1.1 | | | | (0.2 | ) | | | (0.9 | ) | | | — | | | | — | |
Other | | | — | | | | 0.4 | | | | (0.4 | ) | | | — | | | | — | |
Total restructuring liability | | $ | 4.5 | | | $ | 9.6 | | | $ | (5.3 | ) | | $ | (0.1 | ) | | $ | 8.7 | |
The summary of the activity in the restructuring accounts for the year ended December 31, 2021 was as follows:
| | | | | | | | | | | | | | | | | | | | |
(in millions) | | Balance at December 31, 2020 | | | Provision | | | Cash Expenditures | | | Non-cash Items/Currency Change | | | Balance at December 31, 2021 | |
Employee termination costs | | $ | 8.1 | | | $ | 5.2 | | | $ | (9.7 | ) | | $ | (0.2 | ) | | $ | 3.4 | |
Termination of lease agreements | | | 1.0 | | | | 0.7 | | | | (1.1 | ) | | | 0.5 | | | | 1.1 | |
Other | | | 0.2 | | | | 0.1 | | | | (0.2 | ) | | | (0.1 | ) | | | — | |
Total restructuring liability | | $ | 9.3 | | | $ | 6.0 | | | $ | (11.0 | ) | | $ | 0.2 | | | $ | 4.5 | |
Restructuring charges for the years ended December 31, 2023, 2022, and 2021 by reporting segment were as follows:
| | | | | | | | | | | | |
(in millions) | | 2023 | | | 2022 | | | 2021 | |
ACCO Brands North America | | $ | 16.7 | | | $ | 5.3 | | | $ | 4.4 | |
ACCO Brands EMEA | | | 8.9 | | | | 3.4 | | | | 0.5 | |
ACCO Brands International | | | 1.0 | | | | 0.7 | | | | 1.1 | |
Corporate | | | 0.6 | | | | 0.2 | | | | — | |
Total restructuring charges | | $ | 27.2 | | | $ | 9.6 | | | $ | 6.0 | |
11. Income Taxes
The components of (loss) income before income tax for the years ended December 31, 2023, 2022, and 2021 were as follows:
| | | | | | | | | | | | |
(in millions) | | 2023 | | | 2022 | | | 2021 | |
Domestic operations | | $ | (124.8 | ) | | $ | (80.1 | ) | | $ | (5.6 | ) |
Foreign operations | | | 111.7 | | | | 95.0 | | | | 117.0 | |
Total | | $ | (13.1 | ) | | $ | 14.9 | | | $ | 111.4 | |
ACCO Brands Corporation and Subsidiaries
Notes to Consolidated Financial Statements (Continued)
The reconciliation of income taxes computed at the U.S. federal statutory income tax rate of 21 percent to our effective income tax rate for the years ended December 31, 2023, 2022, and 2021 was as follows:
| | | | | | | | | | | | |
(in millions) | | 2023 | | | 2022 | | | 2021 | |
Income tax at U.S. statutory rate; 21% | | $ | (2.7 | ) | | $ | 3.1 | | | $ | 23.4 | |
Unrecognized tax expense (benefits) | | | 1.0 | | | | (7.6 | ) | | | (1.9 | ) |
Impact of final GILTI regulations for 2018 and 2019 | | | — | | | | — | | | | (1.0 | ) |
Statutory tax rate changes | | | 0.4 | | | | 0.6 | | | | (6.8 | ) |
Statutory tax law changes | | | (3.6 | ) | | | — | | | | (1.2 | ) |
State, local and other tax, net of federal benefit | | | (1.3 | ) | | | 1.6 | | | | 0.6 | |
Impact from foreign inclusions | | | (0.7 | ) | | | 4.0 | | | | 1.2 | |
U.S. effect of foreign dividends and withholding taxes | | | 3.9 | | | | 1.8 | | | | 1.2 | |
Foreign income taxed at a higher effective rate | | | 4.2 | | | | 3.1 | | | | 2.9 | |
Brazilian Tax Assessments impact | | | (13.3 | ) | | | 1.9 | | | | 0.5 | |
Increase (decrease) in valuation allowance | | | 5.4 | | | | 3.4 | | | | (11.4 | ) |
General business credit | | | (2.2 | ) | | | (1.9 | ) | | | (2.1 | ) |
Excess expense from stock-based compensation | | | 0.6 | | | | 0.5 | | | | 0.5 | |
Impairment of non-deductible goodwill | | | 18.8 | | | | 20.7 | | | | — | |
Impact of legal entity rationalization | | | — | | | | (4.1 | ) | | | — | |
Prior period tax return adjustment | | | (1.0 | ) | | | (0.1 | ) | | | (0.6 | ) |
Other (decrease) increase | | | (0.8 | ) | | | 1.1 | | | | 4.2 | |
Income taxes as reported | | $ | 8.7 | | | $ | 28.1 | | | $ | 9.5 | |
Effective tax rate | | | (66.4 | )% | | | 188.6 | % | | | 8.5 | % |
For 2023, we recorded income tax expense of $8.7 million on loss before taxes of $13.1 million, for an effective rate of (66.4) percent. The decrease in the effective rate versus 2022 was primarily due to the reduction in pretax book income, tax law changes allowing Brazilian taxes paid to be creditable for U.S. tax purposes, and the release of unrecognized tax benefits related to the Brazil Tax Assessments.
For 2022, we recorded income tax expense of $28.1 million on income before taxes of $14.9 million, for an effective rate of 188.6 percent. The increase in the effective rate versus 2021 was primarily due to the impact of impairment of non-deductible goodwill and the 2021 tax benefits for beneficial adjustments to deferred taxes resulting from statutory tax rate changes and the release of the valuation allowance on the foreign tax credit carryforward.
For 2021, we recorded income tax expense of $9.5 million on income before taxes of $111.4 million, for an effective rate of 8.5 percent.
The components of the income tax expense for the years ended December 31, 2023, 2022, and 2021 were as follows:
| | | | | | | | | | | | |
(in millions) | | 2023 | | | 2022 | | | 2021 | |
Current expense | | | | | | | | | |
Federal and other | | $ | 0.2 | | | $ | 1.8 | | | $ | 2.0 | |
Foreign | | | 28.6 | | | | 25.0 | | | | 28.5 | |
Total current income tax expense | | | 28.8 | | | | 26.8 | | | | 30.5 | |
Deferred expense (benefit) | | | | | | | | | |
Federal and other | | $ | (16.7 | ) | | $ | 6.8 | | | $ | (16.5 | ) |
Foreign | | | (3.4 | ) | | | (5.5 | ) | | | (4.5 | ) |
Total deferred income tax (benefit) expense | | | (20.1 | ) | | | 1.3 | | | | (21.0 | ) |
Total income tax expense | | $ | 8.7 | | | $ | 28.1 | | | $ | 9.5 | |
ACCO Brands Corporation and Subsidiaries
Notes to Consolidated Financial Statements (Continued)
The components of deferred tax assets (liabilities) as of December 31, 2023 and 2022 were as follows:
| | | | | | | | |
(in millions) | | 2023 | | | 2022 | |
Deferred tax assets | | | | | | |
Compensation and benefits | | $ | 23.0 | | | $ | 15.5 | |
Pension | | | 23.4 | | | | 23.2 | |
Inventory | | | 10.4 | | | | 10.1 | |
Other reserves | | | 18.9 | | | | 21.7 | |
Accounts receivable | | | 7.4 | | | | 9.7 | |
Foreign tax credit carryforwards | | | 6.4 | | | | 11.1 | |
Net operating loss carryforwards | | | 76.7 | | | | 89.2 | |
Interest expense carryforwards | | | 26.3 | | | | 17.0 | |
Section 174 capitalization | | | 17.3 | | | | 7.3 | |
General business tax credit carryforwards | | | 3.4 | | | | — | |
Other | | | 5.2 | | | | 0.6 | |
Gross deferred income tax assets | | | 218.4 | | | | 205.4 | |
Valuation allowance | | | (59.2 | ) | | | (51.9 | ) |
Net deferred tax assets | | | 159.2 | | | | 153.5 | |
Deferred tax liabilities | | | | | | |
Depreciation | | | (5.7 | ) | | | (8.9 | ) |
Unremitted non-U.S. earnings accrual | | | (4.0 | ) | | | (5.5 | ) |
Identifiable intangibles | | | (170.4 | ) | | | (182.9 | ) |
Other | | | — | | | | (0.6 | ) |
Gross deferred tax liabilities | | | (180.1 | ) | | | (197.9 | ) |
Net deferred tax liabilities | | $ | (20.9 | ) | | $ | (44.4 | ) |
A valuation allowance of $59.2 million and $51.9 million as of December 31, 2023 and 2022, respectively, has been established for deferred income tax assets. The $7.3 million increase in the valuation allowance in 2023 includes a $1.9 million increase resulting from foreign currency translation and an increase to our existing valuation allowance of $5.4 million. The valuation allowance is primarily related to net operating loss (the "NOL") carryforwards that may not be realized. Realization of the net deferred income tax assets is dependent upon generating sufficient taxable income prior to the expiration of the applicable carryforward periods. Although realization is not certain, management believes that it is more likely than not that the net deferred income tax assets will be realized. However, the amount of net deferred tax assets considered realizable could change in the near term if estimates of future taxable income during the applicable carryforward periods fluctuate.
As of December 31, 2023, the Company has state NOL tax benefits of $12.9 million which will expire between December 31, 2024 and December 31, 2033. As of December 31, 2023, the Company has $3.4 million of federal general business credit carryforwards which will expire on December 31, 2043. As of December 31, 2023, the Company had $6.4 million of foreign tax credit carryforwards which will expire on December 31, 2027. As of December 31, 2023, the Company has foreign NOLs of $281.3 million and tax benefits of $63.8 million, most of which have unlimited carryforward periods.
As of December 31, 2023, the Company has recorded $4.0 million of deferred taxes on approximately $249.2 million of unremitted earnings of non-U.S. subsidiaries that may be remitted to the U.S. The Company has approximately $272.7 million of additional unremitted earnings of non-U.S. subsidiaries, which are indefinitely reinvested and for which no deferred taxes have been provided.
ACCO Brands Corporation and Subsidiaries
Notes to Consolidated Financial Statements (Continued)
A reconciliation of the beginning and ending amount of unrecognized tax benefits for the years ended December 31, 2023, 2022, and 2021 was as follows:
| | | | | | | | | | | | |
(in millions) | | 2023 | | | 2022 | | | 2021 | |
Balance at beginning of year | | $ | 39.1 | | | $ | 43.3 | | | $ | 45.1 | |
Additions for tax positions of prior years | | | 3.6 | | | | 2.5 | | | | 4.5 | |
Reductions for tax positions of prior years | | | (17.7 | ) | | | (8.3 | ) | | | (4.2 | ) |
Increase (decrease) resulting from foreign currency translation | | | 3.0 | | | | 1.6 | | | | (2.1 | ) |
Balance at end of year | | $ | 28.0 | | | $ | 39.1 | | | $ | 43.3 | |
As of December 31, 2023, the amount of unrecognized tax benefits decreased to $28.0 million, all of which would impact our effective tax rate, if recognized. We expect the amount of unrecognized tax benefits to change within the next twelve months including releases of previously recorded reserves of approximately $1.5 to $2.5 million.
Interest and penalties related to unrecognized tax benefits are recognized within "Income tax expense" in the Consolidated Statements of Income. As of December 31, 2023, we have accrued a cumulative $15.8 million for interest and penalties on the unrecognized tax benefits primarily related to the Brazil Tax Assessments.
As of December 31, 2023, the U.S. federal statute of limitations remains open for the year 2019 and forward. Foreign and U.S. state jurisdictions have statutes of limitations generally ranging from 2 to 6 years. As of December 31, 2023, years still open to examination by foreign tax authorities in major jurisdictions include Australia (2018 forward), Brazil (2018 forward), Canada (2018 forward), Germany (2020 forward), Sweden (2021 forward) and the U.K. (2021 forward). We are currently under examination in various foreign jurisdictions.
Organisation for Economic Co-operation and Development (“OECD”) Global Anti-Base Erosion Model Rules (Pillar Two)
Legislatures and taxing authorities in many jurisdictions in which we operate may enact changes to, or seek to enforce, novel interpretations of their tax rules. These changes may include modifications that can be temporary or permanent. For example, the Organisation for Economic Cooperation and Development (the "OECD"), the European Union and other countries (including countries in which we operate) have committed to enacting substantial changes to numerous long-standing tax principles impacting how large multinational enterprises are taxed. In particular, the OECD's Pillar Two initiative introduces a 15% global minimum tax applied on a country-by-country basis and for which many jurisdictions have now committed to an effective enactment date starting January 1, 2024. Management is currently assessing the impact and materiality of these potential new rules as well as any other changes in domestic and international tax rules and regulations.
Brazil Tax Assessments
In connection with our May 1, 2012, acquisition of the Mead Consumer and Office Products business ("Mead C&OP"), we assumed all of the tax liabilities for the acquired foreign operations including ACCO Brazil. In December of 2012, the Federal Revenue Department of the Ministry of Finance of Brazil ("FRD") issued a tax assessment against ACCO Brazil, challenging the tax deduction of goodwill from ACCO Brazil's taxable income for the year 2007 (the "First Assessment"). A second assessment challenging the deduction of goodwill from ACCO Brazil's taxable income for the years 2008, 2009 and 2010 was issued by FRD in October 2013 (the "Second Assessment" and together with the First Assessment, the "Brazil Tax Assessments").
The final administrative appeal of the Second Assessment was decided against the Company in 2017. In 2018, we challenged this decision to the first judicial level. In the fourth quarter of 2022, this case was decided against the Company by the first level judicial court. We have appealed this decision to the second judicial level. In the event we do not prevail at the
ACCO Brands Corporation and Subsidiaries
Notes to Consolidated Financial Statements (Continued)
judicial level, we will be required to pay an additional penalty representing attorneys' costs and fees. Accordingly, in the first quarter of 2019, the Company recorded an additional reserve in the amount of $5.6 million. In connection with the judicial challenge, we were required to provide security to guarantee payment of the Second Assessment should we not prevail.
In the third quarter of 2020, the final administrative appeal of the First Assessment was decided against the Company and we determined that we would challenge this decision. In 2022, we challenged this adverse decision in the tax authority's lawsuit at the judicial level seeking to collect the tax. In connection with the judicial challenge, we were required to provide security to guarantee payment of the First Assessment should we not prevail.
We believe we have meritorious defenses and intend to vigorously contest both of the Brazil Tax Assessments; however, there can be no assurances that we will ultimately prevail. The ultimate outcome will not be determined until the Brazilian judicial process is complete. It is possible we could have a final decision regarding the Second Assessment in the next two years. If the FRD's initial position is ultimately sustained, payment of the amount assessed would materially and adversely affect our cash flow in the year of settlement.
Because there is no settled legal precedent on which to base a definitive opinion as to whether we will ultimately prevail, we consider the outcome of this dispute to be uncertain. Since it is not more likely than not that we will prevail, in 2012, we recorded a reserve in the amount of $44.5 million (at December 31, 2012 exchange rates) in consideration of this contingency, of which $43.3 million was recorded as an adjustment to the purchase price and which included the 2007-2012 tax years plus penalties and interest through December 2012.
During the third quarter of 2023, there was a change in Brazilian law which allowed us to seek cancellation of the 75 percent standard penalty that would be payable in the event we do not prevail in our actions challenging the Brazil Tax Assessments. Following completion of the necessary administrative procedures, during the fourth quarter of 2023, the Company reduced its reserve for this contingency by $13.3 million, representing the amount of the cancelled penalties, as well as interest and other fees related to those penalties.
We will continue to actively monitor administrative and judicial court decisions and evaluate their impact, if any, on our legal assessment of the ultimate outcome of our disputes. In addition, we will continue to accrue interest related to this contingency until such time as the outcome is known or until evidence is presented that we are more likely than not to prevail. During the years ended December 31, 2023, 2022, and 2021, we accrued additional interest as a charge to current income tax expense of $0.9 million, $1.5 million and $0.5 million, respectively. Our accrual through December 31, 2023, including tax, penalties and interest, is $21.7 million (at December 31, 2023 exchange rates, reported in "Other non-current liabilities").
ACCO Brands Corporation and Subsidiaries
Notes to Consolidated Financial Statements (Continued)
12. Earnings per Share
Total outstanding shares as of December 31, 2023, 2022, and 2021 were 94.9 million, 94.3 million and 95.8 million, respectively. Under our stock repurchase authorization, for each of the years ended December 31, 2023 and 2021, we did not repurchase and retire any shares. For the year ended December 31, 2022 there were 2.7 million shares repurchased and retired. For the years ended December 31, 2023, 2022, and 2021, we acquired 0.3 million, 0.3 million and 0.1 million shares, respectively, related to tax withholding in connection with stock-based compensation.
The calculation of basic earnings per share of common stock is based on the weighted-average number of shares of common stock outstanding in the year, or period, over which they were outstanding. Our calculation of diluted earnings per share of common stock assumes that any shares of common stock outstanding were increased by shares that would be issued upon exercise of those stock awards for which the average market price for the period exceeds the exercise price less the shares that could have been purchased by the Company with the related proceeds, including compensation expense measured but not yet recognized.
Our weighted-average shares outstanding for the years ended December 31, 2023, 2022, and 2021 were as follows:
| | | | | | | | | | | | |
| | Year Ended December 31, | |
(in millions) | | 2023 | | | 2022 | | | 2021 | |
Weighted-average number of shares of common stock outstanding - basic | | | 95.3 | | | | 95.3 | | | | 95.5 | |
Effect of dilutive securities: | | | | | | | | | |
Stock options | | | — | | | | — | | | | 0.1 | |
Restricted stock units | | | — | | | | — | | | | 1.5 | |
Weighted-average shares and assumed conversions - diluted(1) | | | 95.3 | | | | 95.3 | | | | 97.1 | |
(1)Due to the net loss during the twelve months ended December 31, 2023 and 2022, the denominator in the diluted earnings per share calculation does not include the effects of the stock awards for which the average market price for the period exceeds the exercised price, as it would result in a less dilutive computation. As a result, diluted earnings per share for the twelve months ended December 31, 2023 and 2022 are the same as basic earnings per share.
Awards of potentially dilutive shares of common stock, which have exercise prices that were higher than the average market price during the period, are not included in the computation of dilutive earnings per share as their effect would have been anti-dilutive. For the years ended December 31, 2023, 2022, and 2021, the number of anti-dilutive shares were approximately 9.9 million, 9.8 million and 8.3 million, respectively.
13. Derivative Financial Instruments
We are exposed to various market risks, including changes in foreign currency exchange rates and interest rate changes. We enter into financial instruments to manage and reduce the impact of these risks, not for trading or speculative purposes. The counterparties to these financial instruments are major financial institutions. We continually monitor our foreign currency exposures in order to maximize the overall effectiveness of our foreign currency hedge positions. Principal currencies hedged against the U.S. dollar include the Euro, Australian dollar, Canadian dollar, Swedish krona, British pound and Japanese yen. We are subject to credit risk, which relates to the ability of counterparties to meet their contractual payment obligations or the potential non-performance by counterparties to financial instrument contracts. Management continues to monitor the status of our counterparties and will take action, as appropriate, to further manage our counterparty credit risk. There are no credit contingency features in our derivative financial instruments.
When hedge accounting is applicable, on the date we enter into a derivative, the derivative is designated as a hedge of the identified exposure. We measure the effectiveness of our hedging relationships both at hedge inception and on an ongoing basis.
ACCO Brands Corporation and Subsidiaries
Notes to Consolidated Financial Statements (Continued)
Forward Currency Contracts
We enter into forward foreign currency contracts with third parties to reduce the effect of fluctuating foreign currencies, primarily on foreign denominated inventory purchases and intercompany loans. Our primary exposure to currency movements is in the Euro, the Swedish krona, the British pound, the Brazilian real, the Australian dollar, the Canadian dollar, and the Mexican peso.
Forward currency contracts are used to hedge foreign denominated inventory purchases for Europe, Australia, Canada, Japan and New Zealand, and are designated as cash flow hedges. Unrealized gains and losses on these contracts are deferred in AOCI until the contracts are settled and the underlying hedged transactions relating to inventory purchases are recognized, at which time the deferred gains or losses will be reported in the "Cost of products sold" line in the Consolidated Statements of Income. As of December 31, 2023 and 2022, we had cash flow foreign exchange contracts outstanding with a U.S. dollar equivalent notional value of $80.2 million and $108.3 million, respectively, which were designated as hedges.
Forward currency contracts used to hedge foreign denominated intercompany loans are not designated as hedging instruments. Gains and losses on these derivative instruments are recognized within "Other expense (income), net" in the Consolidated Statements of Income and are largely offset by the change in the current translated value of the hedged item. The periods of the forward foreign exchange contracts correspond to the periods of the hedged transactions, with some relating to intercompany loans which extend beyond December 2024. As of December 31, 2023 and 2022, we had foreign exchange contracts outstanding with a U.S. dollar equivalent notional value of $102.3 million and $79.5 million, respectively, which were not designated as hedges.
The following table summarizes the fair value of our derivative financial instruments as of December 31, 2023 and 2022:
| | | | | | | | | | | | | | | | | | | | |
| | Fair Value of Derivative Instruments | |
| | Derivative Assets | | | Derivative Liabilities | |
(in millions) | | Balance Sheet Location | | December 31,
2023 | | | December 31,
2022 | | | Balance Sheet Location | | December 31,
2023 | | | December 31,
2022 | |
Derivatives designated as hedging instruments: | | | | | | | | | | | | | | | | |
Foreign exchange contracts | | Other current assets | | $ | 0.3 | | | $ | 3.6 | | | Other current liabilities | | $ | 1.6 | | | $ | 1.9 | |
Derivatives not designated as hedging instruments: | | | | | | | | | | | | | | | | |
Foreign exchange contracts | | Other current assets | | | 1.0 | | | | 0.7 | | | Other current liabilities | | | 0.1 | | | | 0.7 | |
Foreign exchange contracts | | Other non-current assets | | | 3.2 | | | | 4.9 | | | Other non-current liabilities | | | 3.2 | | | | 4.9 | |
Total derivatives | | | | $ | 4.5 | | | $ | 9.2 | | | | | $ | 4.9 | | | $ | 7.5 | |
ACCO Brands Corporation and Subsidiaries
Notes to Consolidated Financial Statements (Continued)
The following tables summarize the pre-tax effect of the Company’s derivative financial instruments on the Consolidated Statements of Income for the years ended December 31, 2023, 2022, and 2021:
| | | | | | | | | | | | | | | | | | | | | | | | | | |
| | The Effect of Derivative Instruments in Cash Flow Hedging Relationships on the Consolidated Financial Statements | |
| | Amount of Gain (Loss) Recognized in AOCI (Effective Portion) | | | Location of (Gain) Loss Reclassified from AOCI to Income | | Amount of (Gain) Loss Reclassified from AOCI to Income (Effective Portion) | |
(in millions) | | 2023 | | | 2022 | | | 2021 | | | | | 2023 | | | 2022 | | | 2021 | |
Cash flow hedges: | | | | | | | | | | | | | | | | | | | | |
Foreign exchange contracts | | $ | 0.4 | | | $ | 9.8 | | | $ | 9.1 | | | Cost of products sold | | $ | (2.8 | ) | | $ | (14.0 | ) | | $ | 1.0 | |
| | | | | | | | | | | | | | |
| | The Effect of Derivatives Not Designated as Hedging Instruments on the Consolidated Statements of (Loss) Income | |
| | Location of (Gain) Loss Recognized in Income on Derivatives | | Amount of (Gain) Loss Recognized in Income | |
(in millions) | | | | 2023 | | | 2022 | | | 2021 | |
Foreign exchange contracts | | Other expense (income), net | | $ | 0.1 | | | $ | (3.7 | ) | | $ | — | |
14. Fair Value of Financial Instruments
In establishing a fair value, there is a fair value hierarchy that prioritizes the inputs to valuation techniques used to measure fair value. The basis of the fair value measurement is categorized in three levels, in order of priority, as described below:
| |
Level 1 | Unadjusted quoted prices in active markets for identical assets or liabilities |
Level 2 | Unadjusted quoted prices in active markets for similar assets or liabilities, or |
| Unadjusted quoted prices for identical or similar assets or liabilities in markets that are not active, or |
| Inputs other than quoted prices that are observable for the asset or liability |
Level 3 | Unobservable inputs for the asset or liability |
We utilize the best available information in measuring fair value. Financial assets and liabilities are classified in their entirety based on the lowest level of input that is significant to the fair value measurement.
We have determined that our financial assets and liabilities described in "Note 13. Derivative Financial Instruments" are Level 2 in the fair value hierarchy. The following table sets forth our financial assets and liabilities that were accounted for at fair value on a recurring basis as of December 31, 2023 and 2022:
| | | | | | | | |
(in millions) | | December 31,
2023 | | | December 31,
2022 | |
Assets: | | | | | | |
Forward currency contracts | | $ | 4.5 | | | $ | 9.2 | |
Liabilities: | | | | | | |
Forward currency contracts | | $ | 4.9 | | | $ | 7.5 | |
Our forward currency contracts are included in "Other current assets," "Other current liabilities," "Other non-current assets," or "Other non-current liabilities." The forward foreign currency exchange contracts are primarily valued based on the foreign currency spot and forward rates quoted by banks or foreign currency dealers. As such, these derivative instruments are classified within Level 2.
ACCO Brands Corporation and Subsidiaries
Notes to Consolidated Financial Statements (Continued)
The fair values of cash and cash equivalents, notes payable to banks, accounts receivable and accounts payable approximate carrying amounts due principally to their short maturities. The carrying amount of total debt was $925.6 million and $1,004.9 million, and the estimated fair value of total debt was $870.9 million and $910.0 million, each as of December 31, 2023 and 2022, respectively. The fair values are determined from quoted market prices, where available, and from using current interest rates based on credit ratings and the remaining terms of maturity.
Non-recurring Fair Value Measurements
On a non-recurring basis, we remeasure the fair value of the goodwill of our reporting units and our trade name indefinite-lived intangibles if an event or circumstance indicates that it is more likely than not that an impairment loss has been incurred. The fair value of our reporting units and trade names are considered Level 3 measurements. Level 3 measurements require significant unobservable inputs that are reflected in our assumptions. See "Note 8. Goodwill and Identifiable Intangible Assets" for more information.
15. Accumulated Other Comprehensive Income (Loss)
AOCI is defined as net (loss) income and other changes in stockholders’ equity from transactions and other events from sources other than stockholders. The components of, and changes in, AOCI were as follows:
| | | | | | | | | | | | | | | | |
(in millions) | | Derivative Financial Instruments | | | Foreign Currency Adjustments | | | Unrecognized Pension and Other Post-retirement Benefit Costs | | | Accumulated Other Comprehensive Income (Loss) | |
Balance at December 31, 2021 | | $ | 4.0 | | | $ | (342.2 | ) | | $ | (197.3 | ) | | $ | (535.5 | ) |
Other comprehensive income (loss) before reclassifications, net of tax | | | 7.0 | | | | (37.9 | ) | | | 29.1 | | | | (1.8 | ) |
Amounts reclassified from accumulated other comprehensive income (loss), net of tax | | | (9.9 | ) | | | — | | | | 6.9 | | | | (3.0 | ) |
Balance at December 31, 2022 | | $ | 1.1 | | | $ | (380.1 | ) | | $ | (161.3 | ) | | $ | (540.3 | ) |
Other comprehensive income (loss) before reclassifications, net of tax | | | 0.2 | | | | 30.3 | | | | (20.0 | ) | | | 10.5 | |
Amounts reclassified from accumulated other comprehensive income (loss), net of tax | | | (2.0 | ) | | | — | | | | 5.5 | | | | 3.5 | |
Balance at December 31, 2023 | | $ | (0.7 | ) | | $ | (349.8 | ) | | $ | (175.8 | ) | | $ | (526.3 | ) |
ACCO Brands Corporation and Subsidiaries
Notes to Consolidated Financial Statements (Continued)
The reclassifications out of AOCI for the years ended December 31, 2023, 2022, and 2021 were as follows:
| | | | | | | | | | | | | | |
| | Year ended December 31, | | | |
(in millions) | | 2023 | | | 2022 | | | 2021 | | | |
| | | | | | | | | | | |
Details about Accumulated Other Comprehensive Income (Loss) Components | | Amount Reclassified from Accumulated Other Comprehensive Income (Loss) | | | Location on Income Statement |
Gain (loss) on cash flow hedges: | | | | | | | | | | | |
Foreign exchange contracts | | $ | 2.8 | | | $ | 14.0 | | | $ | (1.0 | ) | | Cost of products sold |
Tax (expense) benefit | | | (0.8 | ) | | | (4.1 | ) | | | 0.2 | | | Income tax expense |
Net of tax | | $ | 2.0 | | | $ | 9.9 | | | $ | (0.8 | ) | | |
Defined benefit plan items: | | | | | | | | | | | |
Amortization of actuarial loss(1) | | $ | (5.9 | ) | | $ | (8.2 | ) | | $ | (10.2 | ) | | |
Amortization of prior service cost(1) | | | (0.3 | ) | | | (0.3 | ) | | | (1.8 | ) | | |
Total before tax | | | (6.2 | ) | | | (8.5 | ) | | | (12.0 | ) | | |
Tax benefit | | | 0.7 | | | | 1.6 | | | | 2.9 | | | Income tax expense |
Net of tax | | $ | (5.5 | ) | | $ | (6.9 | ) | | $ | (9.1 | ) | | |
| | | | | | | | | | | |
Total reclassifications for the period, net of tax | | $ | (3.5 | ) | | $ | 3.0 | | | $ | (9.9 | ) | | |
(1)These AOCI components are included in the computation of net periodic benefit (income) cost for pension and post-retirement plans (See "Note 5. Pension and Other Retiree Benefits" for additional details).
16. Revenue Recognition
Revenue is recognized when control of the promised goods or services is transferred to our customers in an amount reflective of the consideration we expect to be received in exchange for those goods or services. Taxes we collect concurrent with revenue producing activities are excluded from revenue. Incidental items incurred that are immaterial in the context of the contract are expensed.
At the inception of each contract, the Company assesses the products and services promised and identifies each distinct performance obligation. To identify the performance obligations, the Company considers all products and services promised regardless of whether they are explicitly stated or implied within the contract or by standard business practices.
Freight and distribution activities performed before the customer obtains control of the goods are not considered promised services under customer contracts and therefore are not distinct performance obligations. The Company has chosen to account for shipping and handling activities as a fulfillment activity, and therefore accrues the expense of freight and distribution in "Cost of products sold" when product is shipped.
Service or Extended Maintenance Agreements ("EMAs"). As of December 31, 2022, there was $2.8 million of unearned revenue associated with outstanding EMAs, primarily reported in "Other current liabilities." During the year ended December 31, 2023, $2.4 million of the unearned revenue was earned and recognized. As of December 31, 2023, the amount of unearned revenue from EMAs was $2.9 million. We expect to earn and recognize approximately $2.5 million of the unearned amount in the next 12 months and $0.4 million in periods beyond the next 12 months.
ACCO Brands Corporation and Subsidiaries
Notes to Consolidated Financial Statements (Continued)
The following tables present our net sales disaggregated by regional geography(1), based upon our reporting business segments for the years ended December 31, 2023, 2022, and 2021, and our net sales disaggregated by the timing of revenue recognition for the years ended December 31, 2023, 2022, and 2021:
| | | | | | | | | | | | |
(in millions) | | | 2023 | | | | 2022 | | | | 2021 | |
United States | | $ | 792.2 | | | $ | 889.2 | | | $ | 934.2 | |
Canada | | | 95.0 | | | | 108.8 | | | | 108.2 | |
ACCO Brands North America | | | 887.2 | | | | 998.0 | | | | 1,042.4 | |
| | | | | | | | | |
ACCO Brands EMEA(1) | | | 547.2 | | | | 580.3 | | | | 662.9 | |
| | | | | | | | | |
Australia/N.Z. | | | 118.5 | | | | 125.6 | | | | 140.3 | |
Latin America | | | 244.5 | | | | 197.5 | | | | 125.5 | |
Asia-Pacific | | | 35.4 | | | | 46.2 | | | | 54.2 | |
ACCO Brands International | | | 398.4 | | | | 369.3 | | | | 320.0 | |
Net sales(2) | | $ | 1,832.8 | | | $ | 1,947.6 | | | $ | 2,025.3 | |
(1)ACCO Brands EMEA is comprised largely of Europe, but also includes export sales to the Middle East and Africa.
(2)Net sales are attributed to geographic areas based on the location of the selling subsidiaries.
| | | | | | | | | | | | |
(in millions) | | 2023 | | | 2022 | | | 2021 | |
Product and services transferred at a point in time | | $ | 1,794.1 | | | $ | 1,899.5 | | | $ | 1,975.9 | |
Product and services transferred over time | | | 38.7 | | | | 48.1 | | | | 49.4 | |
Net sales | | $ | 1,832.8 | | | $ | 1,947.6 | | | $ | 2,025.3 | |
ACCO Brands Corporation and Subsidiaries
Notes to Consolidated Financial Statements (Continued)
17. Information on Business Segments
The Company has three operating business segments, each of which is comprised of different geographic regions. The Company's three operating segments are as follows:
| | | | | | |
Operating Segment | | Geography | | Primary Brands | | Primary Products |
ACCO Brands North America | | United States and Canada | | PowerA®, Five Star®, AT-A-GLANCE®, Quartet®, Kensington®, Swingline®, GBC®, Mead®, Hilroy® | | Computer and gaming accessories, school products, planners, storage and organization, dry erase boards and accessories, laminating, stapling and punching products. |
| | | | | | |
ACCO Brands EMEA | | Europe, Middle East and Africa | | Leitz®, Rapid®, Kensington®, Esselte®, Rexel®, PowerA®, GBC®, NOBO®, Derwent® | | Storage and organization products (lever-arch binders, sheet protectors, indexes), computer and gaming accessories, stapling, punching, shredding, laminating, do-it-yourself tools, dry erase boards and writing and art products |
| | | | | | |
ACCO Brands International | | Australia/N.Z., Latin America and Asia-Pacific | | Tilibra®, GBC®, Kensington®, Marbig®, Foroni®, Barrilito®, Artline®*, PowerA®, Spirax®
*Australia/N.Z. only | | School notebooks, storage and organization products (binders, sheet protectors and indexes), computer and gaming accessories, laminating, shredding, writing and arts products, janitorial supplies, dry erase boards and stapling and punching products |
Each business segment designs, markets, sources, manufactures, and sells recognized consumer, technology and business branded products used in schools, homes and at work. Product designs are tailored to end-user preferences in each geographic region, and where possible, leverage common engineering, design, and sourcing.
Our product categories include gaming and computer accessories; storage and organization; notebooks; shredding; laminating and binding machines; stapling; punching; planners; dry erase boards; and do-it-yourself tools, among others. Our portfolio includes both globally and regionally recognized brands.
Beginning on January 1, 2024, the Company will reorganize our previously reported North America, EMEA and International operating segments into two operating segments, Americas and International. The Americas will include the U.S., Canada, Brazil, Mexico and Chile and the International reportable segment will include EMEA, Australia, New Zealand and Asia. This change will simplify and delayer the Company's operating structure and reduce costs through headcount reductions, supply change optimization, global footprint rationalization, and better leverage of our sourcing capabilities. The Company will recast prior period comparable results in early 2024 to reflect this operating segment change.
ACCO Brands Corporation and Subsidiaries
Notes to Consolidated Financial Statements (Continued)
Customers
We distribute our products through a wide variety of channels to ensure that our products are readily and conveniently available for purchase by consumers and other end-users, wherever they prefer to shop. These channels include mass retailers, e-tailers, discount, drug/grocery and variety chains, warehouse clubs, hardware and specialty stores, independent office product dealers, office superstores, wholesalers, contract stationers, and specialist technology businesses. We also sell directly through e-commerce sites and our direct sales organization.
Net sales by reportable business segment for the years ended December 31, 2023, 2022, and 2021 were as follows:
| | | | | | | | | | | | |
(in millions) | | 2023 | | | 2022 | | | 2021 | |
ACCO Brands North America | | $ | 887.2 | | | $ | 998.0 | | | $ | 1,042.4 | |
ACCO Brands EMEA | | | 547.2 | �� | | | 580.3 | | | | 662.9 | |
ACCO Brands International | | | 398.4 | | | | 369.3 | | | | 320.0 | |
Net sales | | $ | 1,832.8 | | | $ | 1,947.6 | | | $ | 2,025.3 | |
Operating (loss) income by reportable business segment for the years ended December 31, 2023, 2022, and 2021 was as follows:
| | | | | | | | | | | | |
(in millions) | | 2023 | | | 2022 | | | 2021 | |
ACCO Brands North America | | $ | (5.9 | ) | | $ | (4.9 | ) | | $ | 121.9 | |
ACCO Brands EMEA | | | 38.7 | | | | 21.7 | | | | 61.7 | |
ACCO Brands International | | | 60.7 | | | | 50.5 | | | | 31.6 | |
Segment operating (loss) income | | | 93.5 | | | | 67.3 | | | | 215.2 | |
Change in fair value of contingent consideration | | | — | | | | 9.0 | | | | (19.0 | ) |
Corporate(1) | | | (48.8 | ) | | | (41.5 | ) | | | (45.2 | ) |
Operating income(2) | | | 44.7 | | | | 34.8 | | | | 151.0 | |
Interest expense | | | 58.6 | | | | 45.6 | | | | 46.3 | |
Interest income | | | (7.1 | ) | | | (8.3 | ) | | | (1.9 | ) |
Non-operating pension expense (income) | | | 1.8 | | | | (4.5 | ) | | | (7.9 | ) |
Other expense (income), net | | | 4.5 | | | | (12.9 | ) | | | 3.1 | |
(Loss) income before income tax | | $ | (13.1 | ) | | $ | 14.9 | | | $ | 111.4 | |
(1)Corporate operating loss in 2021 includes transaction costs of $0.2 million primarily for legal and due diligence expenditures associated with acquisitions.
(2)Operating income as presented in the segment table above is defined as i) net sales; ii) less cost of products sold; iii) less SG&A expenses; iv) less amortization of intangibles; v) less restructuring charges; and vi) less change in the fair value of contingent consideration.
ACCO Brands Corporation and Subsidiaries
Notes to Consolidated Financial Statements (Continued)
The following table presents the measure of reportable business segment assets used by the Company’s chief operating decision maker as of December 31, 2023 and 2022:
| | | | | | | | |
(in millions) | | 2023 | | | 2022 | |
ACCO Brands North America(3) | | $ | 401.4 | | | $ | 459.2 | |
ACCO Brands EMEA(3) | | | 217.1 | | | | 236.0 | |
ACCO Brands International(3) | | | 338.5 | | | | 308.4 | |
Total segment assets | | | 957.0 | | | | 1,003.6 | |
Unallocated assets | | | 1,684.2 | | | | 1,787.2 | |
Corporate(3) | | | 3.6 | | | | 3.9 | |
Total assets | | $ | 2,644.8 | | | $ | 2,794.7 | |
(3)Represents total assets, excluding goodwill and identifiable intangibles resulting from business acquisitions, intercompany balances, cash, deferred taxes, derivatives, prepaid pension assets, prepaid debt issuance costs and right of use asset, leases.
As a supplement to the presentation of reportable business segment assets presented above, the table below presents reportable business segment assets, including right of use asset, leases, the allocation of identifiable intangible assets and goodwill resulting from business combinations as of December 31, 2023 and 2022:
| | | | | | | | |
(in millions) | | 2023 | | | 2022 | |
ACCO Brands North America(4) | | $ | 1,190.7 | | | $ | 1,359.9 | |
ACCO Brands EMEA(4) | | | 568.7 | | | | 588.4 | |
ACCO Brands International(4) | | | 603.4 | | | | 573.8 | |
Total segment assets | | | 2,362.8 | | | | 2,522.1 | |
Unallocated assets | | | 278.4 | | | | 268.7 | |
Corporate(4) | | | 3.6 | | | | 3.9 | |
Total assets | | $ | 2,644.8 | | | $ | 2,794.7 | |
(4)Represents total assets, excluding intercompany balances, cash, deferred taxes, derivatives, prepaid pension assets, prepaid debt issuance costs.
Capital spend by reportable business segment for the years ended December 31, 2023, 2022, and 2021 was as follows:
| | | | | | | | | | | | |
(in millions) | | 2023 | | | 2022 | | | 2021 | |
ACCO Brands North America | | $ | 4.0 | | | $ | 8.8 | | | $ | 11.2 | |
ACCO Brands EMEA | | | 6.8 | | | | 4.7 | | | | 7.3 | |
ACCO Brands International | | | 4.5 | | | | 4.2 | | | | 2.7 | |
Total capital spend | | $ | 15.3 | | | $ | 17.7 | | | $ | 21.2 | |
Depreciation expense by reportable business segment for the years ended December 31, 2023, 2022, and 2021 was as follows:
| | | | | | | | | | | | |
(in millions) | | 2023 | | | 2022 | | | 2021 | |
ACCO Brands North America | | $ | 16.8 | | | $ | 20.1 | | | $ | 20.7 | |
ACCO Brands EMEA | | | 10.9 | | | | 12.6 | | | | 13.1 | |
ACCO Brands International | | | 5.0 | | | | 5.2 | | | | 5.6 | |
Total depreciation | | $ | 32.7 | | | $ | 37.9 | | | $ | 39.4 | |
ACCO Brands Corporation and Subsidiaries
Notes to Consolidated Financial Statements (Continued)
Property, plant and equipment, net by reportable business segment as of December 31, 2023, 2022 was as follows:
| | | | | | | | |
(in millions) | | 2023 | | | 2022 | |
U.S. | | $ | 68.2 | | | $ | 82.3 | |
Canada | | | 1.5 | | | | 1.7 | |
ACCO Brands North America | | | 69.7 | | | | 84.0 | |
| | | | | | |
ACCO Brands EMEA | | | 60.9 | | | | 62.9 | |
| | | | | | |
Australia/N.Z. | | | 9.5 | | | | 10.0 | |
Latin America | | | 29.1 | | | | 26.6 | |
Asia-Pacific | | | 0.9 | | | | 1.6 | |
ACCO Brands International | | | 39.5 | | | | 38.2 | |
Property, plant and equipment, net | | $ | 170.1 | | | $ | 185.1 | |
Top Customers
Net sales to our five largest customers totaled $609.0 million, $663.3 million and $720.9 million for the years ended December 31, 2023, 2022 and 2021, respectively. No customer exceeded 10 percent of net sales for the years ended December 31, 2023, 2022 and 2021.
As of December 31, 2023 and 2022, our top five trade accounts receivable totaled $138.1 million and $125.6 million, respectively.
18. Commitments and Contingencies
Pending Litigation - Brazil Tax Assessments
In connection with our May 1, 2012 acquisition of the Mead C&OP business, we assumed all of the tax liabilities for the acquired foreign operations including ACCO Brazil. For further information, see "Note 11. Income Taxes - Brazil Tax Assessments" for details on tax assessments issued by the FRD against ACCO Brazil challenging the tax deduction of goodwill from ACCO Brazil's taxable income for the years 2007 through 2010. If the FRD's initial position is ultimately sustained, payment of the amount assessed would materially and adversely affect our cash flow in the year of settlement.
Brazil Tax Credits
In May 2021, the Supreme Court of Brazil issued its final ruling in a leading case related to the computation of certain indirect taxes which provides that the indirect tax base should not include the gross amount of the value-added tax known as "ICMS." The Supreme Court further ruled that taxpayers can recognize future operating credits ("Tax Credits") for excess indirect tax payments from past periods due to the inclusion of ICMS in the indirect tax base to the extent the taxpayer had filed judicial challenges seeking to recover excess tax payments prior to March 15, 2017 and for any excess tax payments made after March 15, 2017.
ACCO Brazil filed legal actions requesting recovery of these excess tax payments by way of future Tax Credits covering various time periods prior to March 15, 2017. All of these cases have been finally decided in a court of law in favor of ACCO Brazil. During the first quarter of 2024, ACCO Brazil completed the necessary administrative steps which will allow it to benefit from additional Tax Credits and record a gain of approximately $1.9 million. The Tax Credits will be utilized against future tax obligations.
ACCO Brands Corporation and Subsidiaries
Notes to Consolidated Financial Statements (Continued)
Indústria Gráfica Foroni Ltda. ("Foroni"), in years prior to its acquisition by ACCO Brazil, also filed a legal action in Brazil to recover these excess indirect tax payments and this legal action has been finalized. Upon the expiration of the application status of limitations, we are required under agreements with the former owners of the Foroni business to remit certain recovered tax credits, less the applicable tax and expenses, to the extent the tax credits relate to a tax period prior to the acquisition date.
As of December 31, 2023 and 2022, we recorded $1.3 million and $11.1 million, respectively, which is included in "Other expense (income), net" on our Consolidated Statement of Income (Loss). Finalizing the remaining legal actions ACCO Brazil has filed will likely result in additional Tax Credits at some time in the future. The Tax Credits will be utilized against future tax obligations.
Other Pending Litigation
We are party to various lawsuits and regulatory proceedings, primarily related to alleged patent infringement, as well as other claims incidental to our business. In addition, we may be unaware of third-party claims of intellectual property infringement relating to our technology, brands, or products, and we may face other claims related to business operations. Any litigation regarding patents or other intellectual property could be costly and time-consuming and might require us to pay monetary damages or enter into costly license agreements. We also may be subject to injunctions against development and sale of certain of our products.
It is the opinion of management that (other than the Brazil Tax Assessments) the ultimate resolution of currently outstanding matters will not have a material adverse effect on our financial condition, results of operations or cash flow. However, there is no assurance that we will ultimately be successful in our defense of any of these matters or that an adverse outcome in any matter will not affect our results of operations, financial condition or cash flow. Further, future claims, lawsuits and legal proceedings could materially and adversely affect our business, reputation, results of operations and financial condition.
Unconditional Purchase Commitments
Future minimum payments under unconditional purchase commitments, primarily for inventory purchase commitments as of December 31, 2023 were as follows:
| | | | |
(in millions) | | | |
2024 | | $ | 102.1 | |
2025 | | | 6.9 | |
2026 | | | 3.1 | |
2027 | | | 0.2 | |
2028 | | | 0.1 | |
Thereafter | | | 0.1 | |
Total unconditional purchase commitments | | $ | 112.5 | |
ITEM 9. CHANGES IN AND DISAGREEMENTS WITH ACCOUNTANTS ON ACCOUNTING AND FINANCIAL DISCLOSURE
Not applicable.
ITEM 9A. CONTROLS AND PROCEDURES
(a) Management's Evaluation of Disclosure Controls and Procedures
We seek to maintain disclosure controls and procedures that are designed to ensure that information required to be disclosed in reports filed or submitted under the Securities Exchange Act of 1934, as amended (the "Exchange Act"), is recorded, processed, summarized, and reported within the time periods specified in the applicable Securities and Exchange Commission rules and forms, and that such information is accumulated and communicated to management, including our Chief Executive Officer and Chief Financial Officer, to allow timely decisions regarding required disclosures.
As of the end of the period covered by this Annual Report on Form 10-K, we carried out an evaluation under the supervision of the Chief Executive Officer and the Chief Financial Officer, and with the participation of our Disclosure Committee, of the effectiveness of the design and operation of our disclosure controls and procedures (as defined in Rules 13a-15(e) and 15d-15(e) under the Exchange Act). Based upon that evaluation, the Chief Executive Officer and the Chief Financial Officer have concluded that our disclosure controls and procedures were effective as of December 31, 2023.
(b) Changes in Internal Control over Financial Reporting
There were no changes in our internal control over financial reporting during the quarter ended December 31, 2023 that have materially affected or are reasonably likely to materially affect our internal control over financial reporting.
(c) Management’s Report on Internal Control over Financial Reporting
Our management is responsible for establishing and maintaining adequate internal control over financial reporting, as defined in Rules 13a-15(f) and 15d-15(f) under the Exchange Act. Our internal control over financial reporting is designed by and under the supervision of our Chief Executive Officer and Chief Financial Officer and effected by management and our board of directors to provide reasonable assurance regarding the reliability of the Company’s financial reporting and the preparation of financial statements for external purposes in accordance with generally accepted accounting principles in the U.S.
In designing and evaluating our internal control over financial reporting, management recognizes that any controls and procedures, no matter how well designed and operated, can provide only reasonable, and not absolute, assurance of achieving the desired control objective. Also, projections of any evaluation of the effectiveness of our internal control over financial reporting to future periods are subject to the risk that controls may become inadequate because of changes in conditions, or that the degree of compliance with the policies or procedures may deteriorate.
As required by Section 404 of the Sarbanes-Oxley Act of 2002, management assessed the effectiveness of the Company’s internal control over financial reporting as of December 31, 2023. In making this assessment, management used the criteria set forth by the Committee of Sponsoring Organizations of the Treadway Commission in Internal Control-Integrated Framework (2013). Our management concluded that our internal control over financial reporting was effective as of December 31, 2023.
The effectiveness of the Company’s internal control over financial reporting as of December 31, 2023 has been audited by KPMG LLP, an independent registered public accounting firm, as stated in their report, which is included in Item 8. of this report.
ITEM 9B. OTHER INFORMATION
During the three months ended December 31, 2023, no director or officer of the Company who is required to file reports under Section 16 of the Exchange Act informed us that he or she adopted, materially modified or terminated a “Rule 10b5-1 trading arrangement” or “non-Rule 10b5-1 trading arrangement,” as each term is defined in Item 408(a) of Regulation S-K.
ITEM 9C. DISCLOSURE REGARDING FOREIGN JURISDICTIONS THAT PREVENT INSPECTIONS
Not applicable.
PART III
ITEM 10. DIRECTORS, EXECUTIVE OFFICERS AND CORPORATE GOVERNANCE
Information required under this Item with respect to the executive officers of the Company is incorporated by reference to "Item 1. Business" of this Form 10-K. Except as provided below, all other information required by this Item is contained in the Company’s 2024 Definitive Proxy Statement, which is expected to be filed with the SEC prior to April 3, 2024, and is incorporated herein by reference.
Code of Conduct
The Company has adopted a code of conduct as required by the listing standards of the New York Stock Exchange and rules of the SEC. This code applies to all of the Company’s directors, officers and employees. The code of conduct is published and available at the Governance section of the Company’s internet website at www.accobrands.com. The Company will post on its website any amendments to, or waivers from, our code of conduct applicable to any of its directors or executive officers. The foregoing information will be available in print to any stockholder who requests such information from ACCO Brands Corporation, Four Corporate Drive, Lake Zurich, IL 60047, Attn: Office of the General Counsel.
ITEM 11. EXECUTIVE COMPENSATION
Information required under this Item is contained in the Company’s 2024 Definitive Proxy Statement, which is expected to be filed with the SEC prior to April 3, 2024, and is incorporated herein by reference.
ITEM 12. SECURITY OWNERSHIP OF CERTAIN BENEFICIAL OWNERS AND MANAGEMENT AND RELATED STOCKHOLDER MATTERS
Equity Compensation Plan Information
The following table gives information, as of December 31, 2023, about our common stock that may be issued upon the exercise of options and other equity awards under all compensation plans under which equity securities are reserved for issuance.
| | | | | | | |
Plan category | | Number of
securities to be
issued upon
exercise of
outstanding options,
warrants and
rights
(a) | | Weighted-
average exercise
price of
outstanding
options,
warrants and
rights
(b) | | Number of
securities
remaining
available for
future issuance
under equity
compensation
plans (excluding
securities
reflected in
column (a)
(c) | |
Equity compensation plans approved by security holders | | 6,625,226 | | $9.26 | | 7,327,731 | (1) |
Equity compensation plans not approved by security holders | | — | | — | | — | |
Total | | 6,625,226 | | $9.26 | | 7,327,731 | (1) |
(1)These are shares available for grant as of December 31, 2023 under the 2022 ACCO Brands Corporation Incentive Plan, as amended (the "Plan"), pursuant to which the Compensation and Human Capital Committee of the Board of Directors or the Board of Directors may make various stock-based awards, including grants of stock options, stock-settled appreciation rights, restricted stock, restricted stock units and performance stock units. In addition to these shares, shares covered by outstanding awards under the Plan that were forfeited or otherwise terminated may become available for grant under the Plan and, to the extent such shares have become available as of December 31, 2023, they are included in the table as available for grant.
Other information required under this Item is contained in the Company’s 2024 Definitive Proxy Statement, which is expected to be filed with the SEC prior to April 3, 2024, and is incorporated herein by reference.
ITEM 13. CERTAIN RELATIONSHIPS AND RELATED TRANSACTIONS, AND DIRECTOR INDEPENDENCE
Information required under this Item is contained in the Company’s 2024 Definitive Proxy Statement, which is expected to be filed with the SEC prior to April 3, 2024, and is incorporated herein by reference.
ITEM 14. PRINCIPAL ACCOUNTANT FEES AND SERVICES
Information required under this Item is contained in the Company’s 2024 Definitive Proxy Statement, which is expected to be filed with the SEC prior to April 3, 2024, and is incorporated herein by reference.
PART IV
ITEM 15. EXHIBITS AND FINANCIAL STATEMENT SCHEDULES
The following Exhibits are filed herewith or are incorporated by reference to exhibits previously filed with the SEC, as indicated in the description of each. We agree to furnish to the SEC upon request a copy of any instrument with respect to long-term debt not filed herewith as to which the total amount of securities authorized thereunder does not exceed 10 percent of our total assets on a consolidated basis.
(a)Financial Statements, Financial Statement Schedules and Exhibits
i.All Financial Statements
The following consolidated financial statements of the Company and its subsidiaries are filed as part of this report under Part II, Item 8. - Financial Statements and Supplementary Data:
ii.Financial Statement Schedule:
Schedule II - Valuation and Qualifying Accounts and Reserves for each of the years ended December 31, 2023, 2022 and 2021.
A list of exhibits filed or furnished with this Report on Form 10-K (or incorporated by reference to exhibits previously filed or furnished by the Company) is provided in the accompanying Exhibit Index.
ITEM 16. FORM 10-K SUMMARY
None.
EXHIBIT INDEX
| |
Number | Description of Exhibit |
| | |
Exhibit Number | | Description of Exhibit |
Certificate of Incorporation and Bylaws
| | |
3.1 | | Restated Certificate of Incorporation of ACCO Brands Corporation (incorporated by reference to Exhibit 3.1 to ACCO Brands Corporation's Quarterly Report on Form 10-Q filed with the SEC on October 30, 2019 (File No. 001-08454)) |
| | |
3.2 | | By-laws of ACCO Brands Corporation, as amended through December 5, 2022 (incorporated by reference to Exhibit 3.1 to ACCO Brands Corporation's Current Report on Form 8-K filed with the SEC on December 7, 2022 (File No. 001-08454)) |
Instruments defining the rights of security holders, including indentures
| | |
4.1 | | Indenture dated as of March 15, 2021, among the Company, as issuer, the guarantors named therein and Wells Fargo Bank, National Association, as trustee (incorporated by reference to Exhibit 4.1 to the Company’s Current Report on Form 8-K filed with the SEC on March 16, 2021 (File No. 001-08454)) |
| | |
4.2 | | Description of securities registered under Section 12 of the Exchange Act (incorporated by reference to Exhibit 4.2 to ACCO Brands Corporation's Annual Report on Form 10-K filed with the SEC on February 27, 2020 (File No. 001-08454)) |
Material Contracts
| | |
10.1 | | Third Amended and Restated Credit Agreement, dated as of January 27, 2017, among the Company, certain subsidiaries of the Company, Bank of America, N.A., as administrative agent, and the other agents and various lenders party hereto (incorporated by reference to Exhibit 10.11 to ACCO Brands Corporation's Annual Report on Form 10-K filed with the SEC on February 27, 2017 (File No. 001-08454)) |
| | |
10.2 | | First Amendment to the Third Amended and Restated Credit Agreement, dated as of July 26, 2018, among the Company, certain subsidiaries of the Company, Bank of America, N.A., as administrative agent and the other agents and various lenders party hereto (incorporated by reference to Exhibit 10.1 to ACCO Brands Corporation's Quarterly Report on Form 10-Q filed with the SEC on October 30, 2018 (File No. 001-08454)) |
| | |
10.3 | | Second Amendment to Third Amended and Restated Credit Agreement, dated as of May 23, 2019, among the Company, certain subsidiaries of the Company, Bank of America, N.A., as administrative agent, and the other lenders party thereto (incorporated by reference to Exhibit 10.1 to ACCO Brands Corporation's Current Report on Form 8-K filed with the SEC on May 23, 2019 (File No. 001-08454)) |
| | |
10.4 | | Third Amendment to Third Amended and Restated Credit Agreement, dated as of May 1, 2020, among the Company, certain subsidiaries of the Company, Bank of America, N.A., as administrative agent, and the other lenders party thereto (incorporated by reference to Exhibit 10.1 to ACCO Brands Corporation's Current Report on Form 8-K filed with the SEC on May 1, 2020 (File No. 001-08454)) |
| | |
10.5 | | Fourth Amendment to Third Amended and Restated Credit Agreement, dated as of November 10, 2020, among the Company, certain subsidiaries of the Company, Bank of America, N.A., as administrative agent, and the other lenders party thereto (incorporated by reference to Exhibit 10.1 to ACCO Brands Corporation's Current Report on Form 8-K filed with the SEC on November 12, 2020 (File No. 001-08454)) |
| | |
10.6 | | Fifth Amendment to Third Amended and Restated Credit Agreement, dated as of March 31, 2021, among the Company, certain subsidiaries of the Company, Bank of America, N.A., as administrative agent, and the other lenders party thereto (incorporated by reference to Exhibit 10.1 to the Company’s Current Report on Form 8-K filed with the SEC on April 1, 2021 (File No. 001-08454)) |
EXHIBIT INDEX
| |
Number | Description of Exhibit |
| | |
| | |
10.7 | | Sixth Amendment to Third Amended and Restated Credit Agreement, dated as of November 7, 2022, among the Company, certain subsidiaries of the Company, Bank of America, N.A., as administrative agent, and the other lenders party thereto (incorporated by reference to Exhibit 10.1 to the Company’s Current Report on Form 8-K filed with the SEC on November 7, 2022 (File No. 001-08454)) |
Executive Compensation Plans and Management Contracts
| | |
10.8 | | Form of Indemnification Agreement (incorporated by reference to Exhibit 10.1 to ACCO Brands Corporation's Current Report on Form 8-K filed with the SEC on December 24, 2008 (File No. 001-08454)) |
| | |
10.9 | | Amended and Restated ACCO Brands Deferred Compensation Plan for Non-Employee Directors, effective December 14, 2009 (incorporated by reference to Exhibit 10.41 to ACCO Brands Corporation's Annual Report on Form 10-K filed with the SEC on February 26, 2010 (File No. 001-089454)) |
| | |
10.10 | | 2011 Amended and Restated ACCO Brands Corporation Incentive Plan (incorporated by reference to Exhibit 10.1 to ACCO Brands Corporation's Current Report on Form 8-K filed with the SEC on May 20, 2011 (File No. 001-08454)) |
| | |
10.11 | | Amendment of 2011 Amended and Restated ACCO Brands Corporation Incentive Plan (incorporated by reference to Exhibit 10.1 to ACCO Brands Corporation's Current Report on Form 8-K filed with the SEC on April 24, 2012 (File No. 001-08454)) |
| | |
10.12 | | Amendment to Deferred Compensation Plan for Non-Employee Directors, effective January 1, 2014 (incorporated by reference to Exhibit 10.15 to ACCO Brands Corporation's Annual Report on Form 10-K filed with the SEC on February 25, 2014 (File No. 001-089454)) |
| | |
10.13 | | Form of 2011 Amended and Restated Incentive Plan Directors Restricted Stock Unit Award Agreement (incorporated by reference to Exhibit 10.16 to ACCO Brands Corporation's Annual Report on Form 10-K filed with the SEC on February 25, 2014 (File No. 001-089454)) |
| | |
10.14 | | Form of Non-qualified Stock Option Agreement under the 2011 Amended and Restated Incentive Plan (incorporated by reference to Exhibit 10.2 to ACCO Brands Corporation's Current Report on Form 8-K filed with the SEC on March 10, 2014 (File No. 001-08454)) |
| | |
10.15 | | Second Amendment of 2011 Amended and Restated ACCO Brands Corporation Incentive Plan (incorporated by reference to Exhibit 10.4 to ACCO Brands Corporation's Quarterly Report on Form 10-Q filed with the SEC on April 30, 2014 (File No. 001-08454)) |
| | |
10.16 | | ACCO Brands Corporation Incentive Plan, which is an amendment and restatement of the Amended and Restated ACCO Brands Corporation 2011 Incentive Plan, as amended (incorporated by reference to Exhibit 4.4 to ACCO Brands Corporation's Registration Statement on Form S-8 filed with the SEC on May 12, 2015 (File No. 001-08454)) |
| | |
10.17 | | Form of Directors Restricted Stock Unit Award Agreement under the ACCO Brands Corporation Incentive Plan (incorporated by reference to Exhibit 10.1 to ACCO Brands Corporation's Current Report on Form 8-K filed with the SEC on May 18, 2015 (File No. 001-08454)) |
| | |
10.18 | | Form of Restricted Stock Unit Award Agreement under the ACCO Brands Corporation Incentive Plan (incorporated by reference to Exhibit 10.2 to ACCO Brands Corporation's Current Report on Form 8-K filed with the SEC on May 18, 2015 (File No. 001-08454)) |
| | |
10.19 | | Form of Nonqualified Stock Option Award Agreement under the ACCO Brands Corporation Incentive Plan (incorporated by reference to Exhibit 10.4 to ACCO Brands Corporation's Current Report on Form 8-K filed with the SEC on May 18, 2015 (File No. 001-08454)) |
| | |
EXHIBIT INDEX
| |
Number | Description of Exhibit |
| | |
10.20 | | ACCO Brands Corporation Executive Severance Plan, as amended and restated effective January 1, 2019 (incorporated by reference to Exhibit 10.1 to ACCO Brands Corporation's Current Report on Form 8-K filed with the SEC on October 22, 2018 (File No. 001-09454)) |
| | |
10.21 | | ACCO Brands Corporation Nonqualified Deferred Compensation Plan (incorporated by reference to Exhibit 10.26 to ACCO Brands Corporation's Annual Report on Form 10-K filed with the SEC on February 27, 2019 (File No. 001-09454)) |
| | |
10.22 | | 2019 ACCO Brands Corporation Incentive Plan (incorporated by reference to Exhibit 99 to the Company’s Registration Statement on Form S-8 filed with the SEC on May 21, 2019) |
| | |
10.23 | | Form of Directors Restricted Stock Unit Award Agreement under the 2019 ACCO Brands Corporation Incentive Plan (incorporated by reference to Exhibit 10.3 to ACCO Brands Corporation's Quarterly Report on Form 10-Q filed with the SEC on July 31, 2019 (File No. 001-08454)) |
| | |
10.24 | | Form of Restricted Stock Unit Award Agreement under the 2019 ACCO Brands Corporation Incentive Plan (incorporated by reference to Exhibit 10.4 to ACCO Brands Corporation's Quarterly Report on Form 10-Q filed with the SEC on July 31, 2019 (File No. 001-08454)) |
| | |
10.25 | | Form of Performance Stock Unit Award Agreement under the 2019 ACCO Brands Corporation Incentive Plan (incorporated by reference to Exhibit 10.5 to ACCO Brands Corporation's Quarterly Report on Form 10-Q filed with the SEC on July 31, 2019 (File No. 001-08454)) |
| | |
10.26 | | Form of Nonqualified Stock Option Award Agreement under the 2019 ACCO Brands Corporation Incentive Plan (incorporated by reference to Exhibit 10.6 to ACCO Brands Corporation's Quarterly Report on Form 10-Q filed with the SEC on July 31, 2019 (File No. 001-08454)) |
| | |
10.27 | | Form of Nonqualified Stock Option Award Agreement under the 2019 ACCO Brands Corporation Incentive Plan (incorporated by reference to Exhibit 10.1 to ACCO Brands Corporation's Quarterly Report on Form 10-Q filed with the SEC on May 5, 2020 (File No. 001-08454)) |
| | |
10.28 | | Form of Nonqualified Stock Option Award Agreement - Non-U.S. Employees under the 2019 ACCO Brands Corporation Incentive Plan (incorporated by reference to Exhibit 10.2 to ACCO Brands Corporation's Quarterly Report on Form 10-Q filed with the SEC on May 5, 2020 (File No. 001-08454)) |
| | |
10.29 | | ACCO Brands Corporation Deferred Compensation Plan for Non-Employee Directors Restated Effective December 3, 2019 (incorporated by reference to Exhibit 10.31 to ACCO Brands Corporation's Annual Report on Form 10-K filed with the SEC on February 27, 2020 (File No. 001-08454)) |
| | |
10.30 | | Form of Cash-Based Award Agreement under the 2019 ACCO Brands Corporation Incentive Plan (incorporated by reference to Exhibit 10.1 to ACCO Brands Corporation's Quarterly Report on Form 10-Q filed with the SEC on July 30, 2021 (File No. 001-08454)) |
| | |
10.31 | | Form of Performance Stock Unit Award Agreement under the 2019 ACCO Brands Corporation Incentive Plan (incorporated by reference to Exhibit 10.2 to ACCO Brands Corporation's Quarterly Report on Form 10-Q filed with the SEC on July 30, 2021 (File No. 001-08454)) |
| | |
10.32 | | Form of Special Performance Stock Unit Award Agreement under the 2019 ACCO Brands Corporation Incentive Plan (incorporated by reference to Exhibit 10.3 to ACCO Brands Corporation's Quarterly Report on Form 10-Q filed with the SEC on July 30, 2021 (File No. 001-08454)) |
| | |
10.33 | | Offer Letter dated as of February 17, 2022 between ACCO Brands Corporation and Deborah A. O'Connor* |
| | |
EXHIBIT INDEX
| |
Number | Description of Exhibit |
| | |
10.34 | | 2022 ACCO Brands Corporation Incentive Plan (incorporated by reference to Exhibit 99 to the Company’s Registration Statement on Form S-8 filed with the SEC on May 17, 2022) |
| | |
10.35 | | Form of Nonqualified Stock Option Award Agreement under the 2022 ACCO Brands Corporation Incentive Plan (incorporated by reference to Exhibit 10.1 to ACCO Brands Corporation's Quarterly Report on Form 10-Q filed with the SEC on August 9, 2022 (File No. 001-08454)) |
| | |
10.36 | | Form of Performance Stock Unit Award Agreement under the 2022 ACCO Brands Corporation Incentive Plan (incorporated by reference to Exhibit 10.2 to ACCO Brands Corporation's Quarterly Report on Form 10-Q filed with the SEC on August 9, 2022 (File No. 001-08454)) |
| | |
10.37 | | Form of Restricted Stock Unit Award Agreement under the 2022 ACCO Brands Corporation Incentive Plan (incorporated by reference to Exhibit 10.3 to ACCO Brands Corporation's Quarterly Report on Form 10-Q filed with the SEC on August 9, 2022 (File No. 001-08454)) |
| | |
10.38 | | Form of Directors Restricted Stock Unit Award Agreement under the 2022 ACCO Brands Corporation Incentive Plan (incorporated by reference to Exhibit 10.4 to ACCO Brands Corporation's Quarterly Report on Form 10-Q filed with the SEC on August 9, 2022 (File No. 001-08454)) |
| | |
10.39 | | First Amendment to 2022 ACCO Brands Corporation Incentive Plan (incorporated by reference to Exhibit 10.1 to ACCO Brands Corporation’s Form 8-K filed with the SEC on May 19, 2023 (File No. 001-08454)) |
| | |
10.40 | | Employment Contract, dated January 29, 2024, between Mr. Cezary Monko and Esselte Polska Sp. z o o. (incorporated by reference to Exhibit 10.1 to ACCO Brands Corporation’s Form 8-K filed with the SEC on January 30, 2024 (File No. 001-08454)) |
Other Exhibits
| | |
19 | | ACCO Brands Corporation Insider Trading Compliance Policy and Procedures* |
| | |
21.1 | | Subsidiaries of the Registrant* |
| | |
23.1 | | Consent of KPMG LLP* |
| | |
24.1 | | Power of attorney* |
| | |
31.1 | | Certification of the Chief Executive Officer pursuant to Section 302 of the Sarbanes-Oxley Act of 2002* |
| | |
31.2 | | Certification of the Chief Financial Officer pursuant to Section 302 of the Sarbanes-Oxley Act of 2002* |
| | |
32.1 | | Certification of the Chief Executive Officer pursuant to Section 906 of the Sarbanes-Oxley Act of 2002* |
| | |
32.2 | | Certification of the Chief Financial Officer pursuant to Section 906 of the Sarbanes-Oxley Act of 2002* |
| | |
97 | | ACCO Brands Corporation Recoupment or Forfeiture of Incentive Payments Policy* |
| | |
101.INS | | Inline XBRL Instance Document - the instance document does not appear in the Interactive Data File because its XBRL tags are embedded within the Inline XBRL document |
| | |
101.SCH | | Inline XBRL Taxonomy Extension Schema Document |
| | |
101.CAL | | Inline XBRL Taxonomy Extension Calculation Linkbase Document |
EXHIBIT INDEX
| |
Number | Description of Exhibit |
| | |
| | |
101.DEF | | Inline XBRL Taxonomy Extension Definition Linkbase Document |
| | |
101.LAB | | Inline XBRL Taxonomy Extension Label Linkbase Document |
| | |
101.PRE | | Inline XBRL Taxonomy Extension Presentation Linkbase Document |
| | |
104 | | Cover Page Interactive Data File (formatted as Inline XBRL and contained in Exhibit 101) |
* Filed herewith.
SIGNATURES
Pursuant to the requirements of Section 13 or 15(d) of the Securities Exchange Act of 1934, the Registrant has duly caused this report to be signed on its behalf by the undersigned thereunto duly authorized.
| | |
| | REGISTRANT: |
| | |
| | ACCO BRANDS CORPORATION |
| |
| By: | /s/ Thomas W. Tedford |
| | Thomas W. Tedford |
| | President and Chief Executive Officer (principal executive officer) |
| | |
| By: | /s/ Deborah A. O'Connor |
| | Deborah A. O'Connor |
| | Executive Vice President and Chief Financial Officer (principal financial officer) |
| | |
| By: | /s/ James M. Dudek, Jr. |
| | James M. Dudek, Jr. |
| | Senior Vice President, Corporate Controller and Chief Accounting Officer (principal accounting officer) |
February 23, 2024
Pursuant to the requirements of the Securities Exchange Act of 1934, this report has been signed below by the following persons on behalf of the Registrant and in the capacities and on the dates indicated.
| | | | |
Signature | | Title | | Date |
| | | | |
/s/ Thomas W. Tedford | | President and Chief Executive Officer (principal executive officer) | February 23, 2024 |
Thomas W. Tedford | |
| | | | |
/s/ Deborah A. O'Connor | | Executive Vice President and Chief Financial Officer (principal financial officer) | | February 23, 2024 |
Deborah A. O'Connor | | | |
| | | | |
/s/ James M. Dudek, Jr. | | Senior Vice President, Corporate Controller and Chief Accounting Officer (principal accounting officer) | | February 23, 2024 |
James M. Dudek, Jr. | | | |
| | | | |
/s/ Joe B. Burton* | | Director | | February 23, 2024 |
Joe B. Burton | | | | |
| | | | |
/s/ Kathleen S. Dvorak* | | Director | | February 23, 2024 |
Kathleen S. Dvorak | | | | |
| | | | |
/s/ Boris Elisman* | | Director | | February 23, 2024 |
Boris Elisman | | | | |
| | | | |
Signature | | Title | | Date |
| | | | |
/s/ Pradeep Jotwani* | | Director | | February 23, 2024 |
Pradeep Jotwani | | | | |
| | | | |
/s/ Robert J. Keller* | | Director | | February 23, 2024 |
Robert J. Keller | | | | |
| | | | |
/s/ Thomas Kroeger* | | Director | | February 23, 2024 |
Thomas Kroeger | | | | |
| | | | |
/s/ Ron Lombardi* | | Director | | February 23, 2024 |
Ron Lombardi | | | | |
| | | | |
/s/ Graciela Monteagudo* | | Director | | February 23, 2024 |
Graciela Monteagudo | | | | |
| | | | |
/s/ E. Mark Rajkowski* | | Director | | February 23, 2024 |
E. Mark Rajkowski | | | | |
| | | | |
/s/ Beth Simermeyer* | | Director | | February 23, 2024 |
Beth Simermeyer | | | | |
| | | | |
/s/ Deborah A. O'Connor | | | | |
* Deborah A. O'Connor as Attorney-in-Fact | | | | |
ACCO Brands Corporation
VALUATION AND QUALIFYING ACCOUNTS AND RESERVES
SCHEDULE II
Allowances for Doubtful Accounts
Changes in the allowances for doubtful accounts were as follows:
| | | | | | | | | | | | |
| | Year Ended December 31, | |
(in millions) | | | 2023 | | | | 2022 | | | | 2021 | |
Balance at beginning of year | | $ | 9.1 | | | $ | 10.0 | | | $ | 11.4 | |
Additions charged to expense | | | 1.3 | | | | 0.5 | | | | 0.9 | |
Deductions - write offs | | | (1.6 | ) | | | (1.5 | ) | | | (1.9 | ) |
Foreign exchange changes | | | 0.5 | | | | 0.1 | | | | (0.4 | ) |
Balance at end of year | | $ | 9.3 | | | $ | 9.1 | | | $ | 10.0 | |
Allowances for Sales Discounts and Other Credits
Changes in the allowances for sales discounts and returns were as follows:
| | | | | | | | | | | | |
| | Year Ended December 31, | |
(in millions) | | | 2023 | | | | 2022 | | | | 2021 | |
Balance at beginning of year | | $ | 15.6 | | | $ | 15.2 | | | $ | 12.2 | |
Additions charged to expense | | | 8.1 | | | | 15.7 | | | | 28.9 | |
Deductions | | | (11.8 | ) | | | (13.8 | ) | | | (25.8 | ) |
Foreign exchange changes | | | (0.3 | ) | | | (1.5 | ) | | | (0.1 | ) |
Balance at end of year | | $ | 11.6 | | | $ | 15.6 | | | $ | 15.2 | |
Allowances for Cash Discounts
Changes in the allowances for cash discounts were as follows:
| | | | | | | | | | | | |
| | Year Ended December 31, | |
(in millions) | | | 2023 | | | | 2022 | | | | 2021 | |
Balance at beginning of year | | $ | 1.9 | | | $ | 2.4 | | | $ | 1.9 | |
Additions charged to expense | | | 20.7 | | | | 22.9 | | | | 22.8 | |
Deductions - discounts taken | | | (20.7 | ) | | | (23.3 | ) | | | (22.2 | ) |
Foreign exchange changes | | | 0.1 | | | | (0.1 | ) | | | (0.1 | ) |
Balance at end of year | | $ | 2.0 | | | $ | 1.9 | | | $ | 2.4 | |
ACCO Brands Corporation
VALUATION AND QUALIFYING ACCOUNTS AND RESERVES
SCHEDULE II (Continued)
Warranty Reserves
Changes in the reserve for warranty claims were as follows:
| | | | | | | | | | | | |
| | Year Ended December 31, | |
(in millions) | | | 2023 | | | | 2022 | | | | 2021 | |
Balance at beginning of year | | $ | 6.4 | | | $ | 5.7 | | | $ | 6.1 | |
Provision for warranties issued | | | 3.8 | | | | 5.3 | | | | 2.9 | |
Deductions - settlements made (in cash or in kind) | | | (4.5 | ) | | | (4.3 | ) | | | (2.9 | ) |
Foreign exchange changes | | | 0.3 | | | | (0.3 | ) | | | (0.4 | ) |
Balance at end of year | | $ | 6.0 | | | $ | 6.4 | | | $ | 5.7 | |
Income Tax Valuation Allowance
Changes in the deferred tax valuation allowances were as follows:
| | | | | | | | | | | | |
| | Year Ended December 31, | |
(in millions) | | | 2023 | | | | 2022 | | | | 2021 | |
Balance at beginning of year | | $ | 51.9 | | | $ | 52.4 | | | $ | 55.4 | |
Net increase to valuation allowance - expense (benefit) | | | 5.4 | | | | 3.2 | | | | (2.2 | ) |
Foreign exchange changes | | | 1.9 | | | | (3.7 | ) | | | (0.8 | ) |
Balance at end of year | | $ | 59.2 | | | $ | 51.9 | | | $ | 52.4 | |
See accompanying report of independent registered public accounting firm.