NYSE: FCF Acquisition of Centric Financial Corporation (OTCPK: CFCX) August 30, 2022

FORWARD-LOOKING STATEMENTS 2 This presentation contains “forw ard- looking statements” w ithin the meaning of the Private Securities Litigation Reform Act, relating to present or future trends or factors affecting the banking industry and, specif ically, the f inancial operations, markets and products of First Commonw ealth Financial Corporation (“First Commonw ealth”) and Centric Financial Corporation (“Centric”) and the proposed merger of Centric w ith and into First Commonw ealth (the “merger”). Forw ard-looking statements are typically identif ied by w ords such as “believe”, “plan”, “expect”, “anticipate”, “intend”, “outlook”, “estimate”, “forecast”, “w ill”, “should”, “project”, “goal”, and other similar w ords and expressions. These forw ard-looking statements involve certain risks and uncertainties. In addition to factors previously disclosed in First Commonw ealth reports f iled w ith the SEC and those identif ied elsew here in this presentation, the follow ing factors among others, could cause actual results to differ materially from forw ard- looking statements or historical performance: ■ ability to obtain regulatory approvals for the merger in a timely manner and without significant expense or other burdens; ■ ability to meet other closing conditions to the merger, including approval by Centric shareholders; ■ delay in closing the merger; ■ difficulties and delays in integrating the businesses of Centric and First Commonwealth or fully realizing cost savings and other benefits ; ■ business disruption following the merger; changes ■ in asset quality and credit risk; ■ the inability to sustain revenue and earnings growth; ■ changes in interest rates and capital markets; ■ inflation; ■ customer acceptance of First Commonwealth products and services; ■ customer borrowing, repayment, investment and deposit practices; ■ customer disintermediation; ■ the introduction, withdrawal, success and timing of business initiatives; ■ competitive conditions; ■ the inability to realize anticipated cost savings or revenues or to implement integration plans and other consequences associatedwith the merger; ■ economic conditions; and ■ the impact, extent and timing of technological changes, capital management activities, and the actions and policies of the federal and state bank regulatory authorities and legislative and regulatory actions and reforms. Forw ard-looking statements speak only as of the date on w hich they are made and First Commonw ealth undertakes no obligation to revise these forw ard-looking statements or to reflect events or circumstances after the date of this presentation.

ACQUISITION OF CENTRIC FINANCIAL CORPORATION: AN ATTRACTIVE ADDITION TO OUR PENNSYLVANIA FRANCHISE 3 Franchise Overview Source: S&P Global Market Intelligence Note: Financial data as of the quarter ended 6/30/2022 FCF Branches CFCX Branches CFCX LPO CFCX Headquarters Centric Highlights Headquarters Harrisburg, PA Founded 2007 Number of Locations 7 Branches / 1 LPO CEO Patricia A. Husic Total Assets $1.0 billion Gross Loans $0.9 billion Total Deposits $0.9 billion YTD ROAA 1.11%

TRANSACTION HIGHLIGHTS 4 Strategically Compelling Source: S&P Global Market Intelligence Note: Financial data as of the quarter ended 6/30/2022; Deposit market share data as of 6/30/2021 Financially Attractive Immediately accretive to EPS with minimal tangible book value per share dilution Short tangible book value per share earnback period of 2 years Incremental earnings more than offset the Durbin-related impact of crossing $10 billion in assets Enhances FCF’s ROAA, ROATCE and Efficiency Produces a >20% IRR All-stock transaction utilizes FCF’s currency and maintains strong capital ratios and balance sheet capacity for future acquisitions, organic growth and capital return to shareholders Continues First Commonwealth’s expansion strategy into higher growth, contiguous, demographically attractive metro markets through acquisitions with low risk relative to FCF’s size Geographically builds upon FCF’s knowledge of central and eastern Pennsylvania markets through its acquisition of 14 branches in central Pennsylvania in 2019, as well as its existing commercial real estate relationships and equipment finance team in eastern Pennsylvania Opportunity for FCF to build on Centric’s strong stand-alone financial performance by offering a more expansive product set to its customer base (e.g., larger commercial lending, consumer lending, SBA, treasury management, wealth management, insurance, etc.) Accelerates growth trajectory for FCF beyond the $10 billion asset threshold Centric’s CEO, Patricia A. Husic, will be appointed to FCF's Board of Directors and will remain active in Centric’s local market on behalf of FCF

A HISTORY OF SUCCESSFUL ACQUISITIONS 5 (1) Data as of 06/30/2022. Includes all OH based consumer loans, Commercial Real Estate loans with properties located in OH and C&I loans with borrowers headquartered in OH; excludes Paycheck Protection Program loans (2) Deal value at announcement Expansion efforts leverage our significant management experience in Ohio and Pennsylvania markets Acquired First Community Bank in Columbus, OH in October ‘15 Completed acquisition of 13 branches from FirstMerit in December ’16 Completed acquisition of DCB Financial Corp in April ’17 Completed acquisition of Foundation Bank in Cincinnati, OH in May ‘18 Completed acquisition of 14 former Santander branches in Central PA in September ’19 – Deposit balances have grown $82 million since conversion Opened equipment finance office in eastern PA in Q1 2022 Announced acquisition of Centric Financial Corporation in August 2022 Successful Expansion Efforts Recent Acquisition Overview Ohio Loan Portfolio ($MM)(1) Deal Value Total Loans Total Deposits Target $MM(2) Acquired $MM Acquired $MM First Community Bank 5/11/2015 10/1/2015 15 61 90 13 FirstMerit Branches 7/27/2016 12/2/2016 33 102 620 DCB Financial Corp. 10/3/2016 4/3/2017 106 383 484 Foundation Bank 1/10/2018 5/1/2018 58 185 141 Total Ohio Acquisitions $212 $731 $1,335 $2,643 $1,802 14 Santander Branches 4/22/2019 9/6/2019 $33 $100 $471 Centric Financial 8/30/2022 144 904 879 Total Pennsylvania Acquisitions $177 $1,137 $1,904 Announcemen t Date Completion Date Total Ohio Portfolio (1)
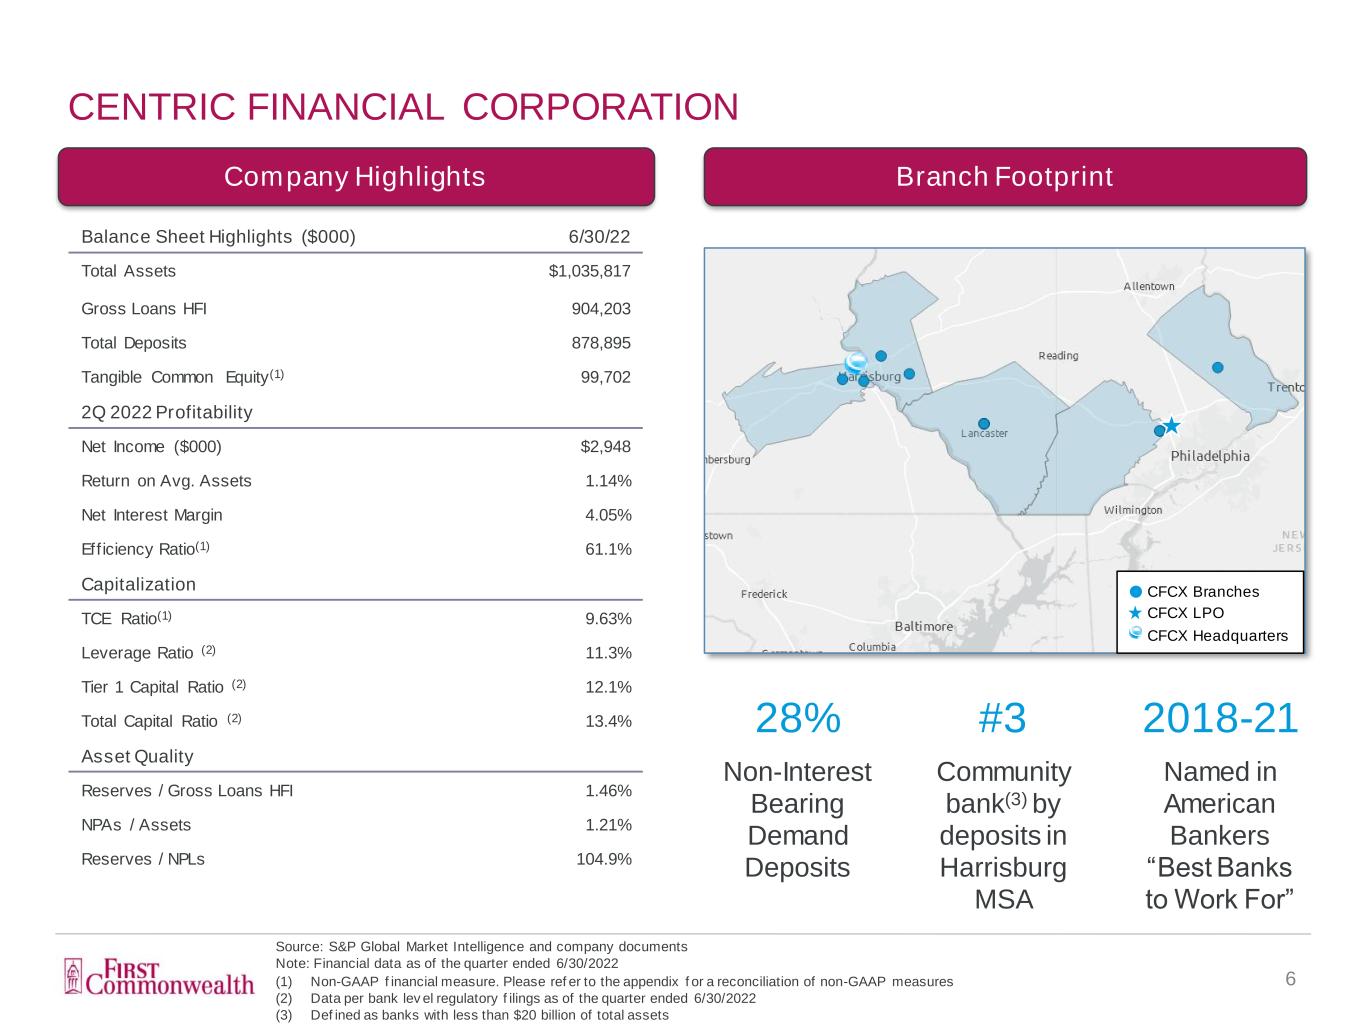
CENTRIC FINANCIAL CORPORATION 6 Source: S&P Global Market Intelligence and company documents Note: Financial data as of the quarter ended 6/30/2022 (1) Non-GAAP f inancial measure. Please ref er to the appendix f or a reconciliation of non-GAAP measures (2) Data per bank lev el regulatory f ilings as of the quarter ended 6/30/2022 (3) Def ined as banks with less than $20 billion of total assets Company Highlights CFCX Branches CFCX LPO CFCX Headquarters Balance Sheet Highlights ($000) 6/30/22 Total Assets $1,035,817 Gross Loans HFI 904,203 Total Deposits 878,895 Tangible Common Equity(1) 99,702 2Q 2022 Profitability Net Income ($000) $2,948 Return on Avg. Assets 1.14% Net Interest Margin 4.05% Efficiency Ratio(1) 61.1% Capitalization TCE Ratio(1) 9.63% Leverage Ratio (2) 11.3% Tier 1 Capital Ratio (2) 12.1% Total Capital Ratio (2) 13.4% Asset Quality Reserves / Gross Loans HFI 1.46% NPAs / Assets 1.21% Reserves / NPLs 104.9% Branch Footprint 28% Non-Interest Bearing Demand Deposits #3 Community bank(3) by deposits in Harrisburg MSA 2018-21 Named in American Bankers “Best Banks to Work For”

Demand Deposits 34% NOW & Other Trans. Accts 3% MMDA & Other Savings 58% Retail Time Deposits 3% Jumbo Time Deposits 2% Construction 6% Residential R.E. 21% Multifamily 5% Owner Occupied C.R.E. 6% Other C.R.E. 21%Commercial & Industrial 16% Consumer & Other 25% Demand Deposits 33% NOW & Other Trans. Accts 6% MMDA & Other Savings 56% Retail Time Deposits 3% Jumbo Time Deposits 2% Demand Deposits 28% NOW & Other Trans. Accts 26% MMDA & Other Savings 32% Retail Time Deposits 3% Jumbo Time Deposits 11% Construction 6% Residential R.E. 19% Multifamily 5% Owner Occupied C.R.E. 8% Other C.R.E. 22% Commercial & Industrial 17% Consumer & Other 23% Construction 9% Residential R.E. 10% Multifamily 5% Owner Occupied C.R.E. 22% Other C.R.E. 26% Commercial & Industrial 25% Consumer & Other 3% PRO FORMA LOAN AND DEPOSIT COMPOSITION 7 $7.1 bn $8.1 bn $0.9 bn $0.9 bn $8.0 bn $9.0 bn Pro Forma L o a n M ix D e p o s it M ix Source: S&P Global Market Intelligence Note: FCF loan and deposit data per GAAP filings as of the quarter ended 6/30/2022; CFCX loan and deposit data per company do cuments as of the quarter ended 6/30/2022; Excludes purchase accounting adjustments Note: Retail Time Deposits defined as time deposits < $100k and Jumbo Time Deposits defined as time deposits >= $100k
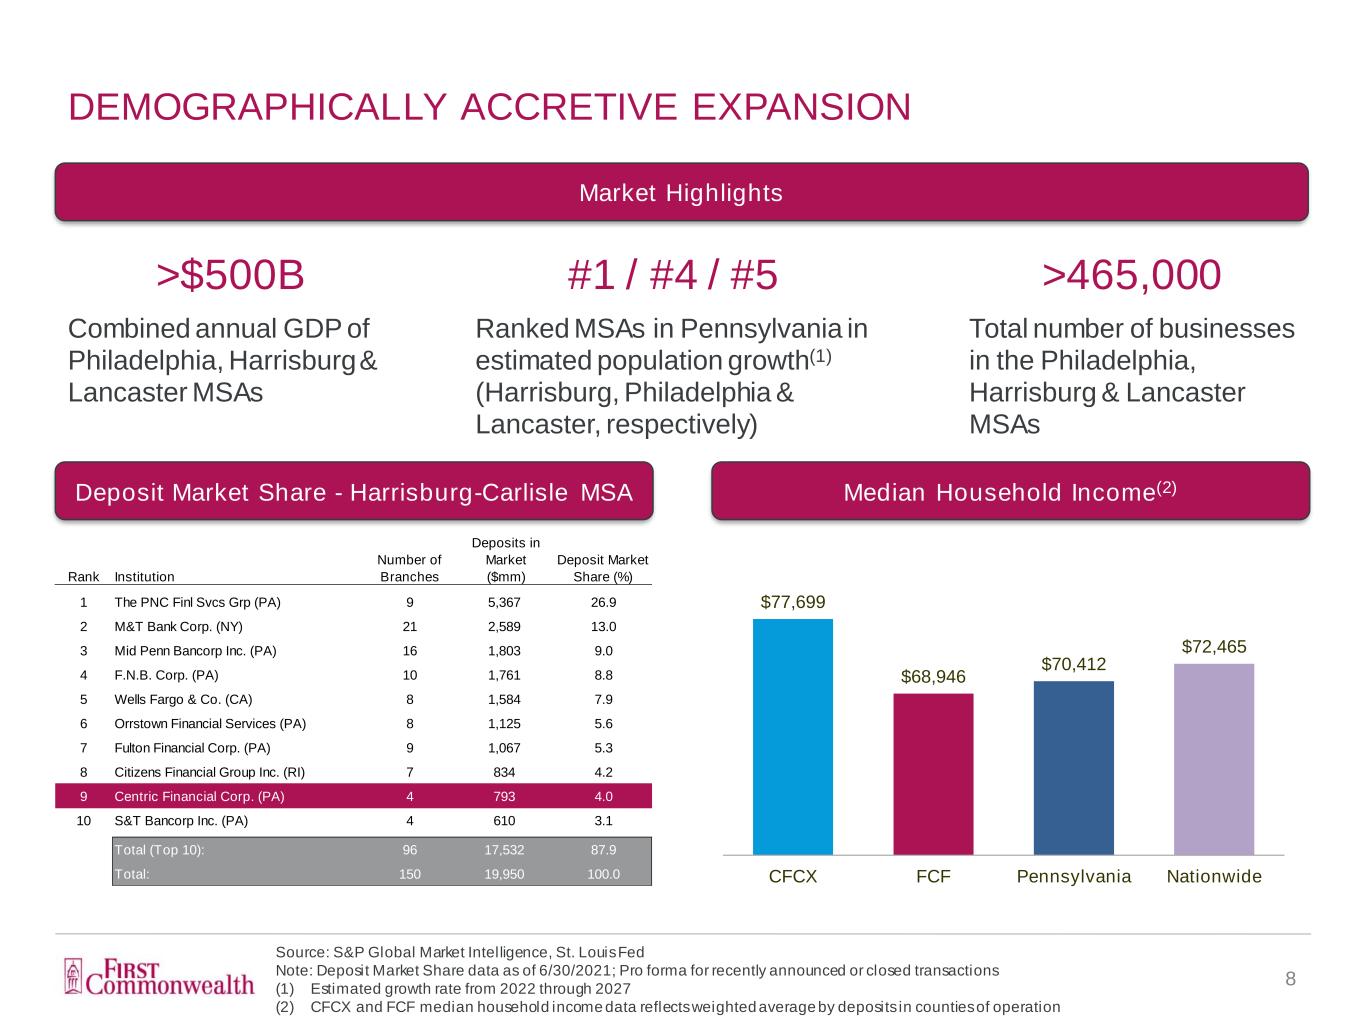
$77,699 $68,946 $70,412 $72,465 CFCX FCF Pennsylvania Nationwide DEMOGRAPHICALLY ACCRETIVE EXPANSION 8 Source: S&P Global Market Intelligence, St. Louis Fed Note: Deposit Market Share data as of 6/30/2021; Pro forma for recently announced or closed transactions (1) Estimated growth rate from 2022 through 2027 (2) CFCX and FCF median household income data reflects weighted average by deposits in counties of operation Market Highlights Median Household Income(2)Deposit Market Share - Harrisburg-Carlisle MSA Rank Institution Number of Branches Deposits in Market ($mm) Deposit Market Share (%) 1 The PNC Finl Svcs Grp (PA) 9 5,367 26.9 2 M&T Bank Corp. (NY) 21 2,589 13.0 3 Mid Penn Bancorp Inc. (PA) 16 1,803 9.0 4 F.N.B. Corp. (PA) 10 1,761 8.8 5 Wells Fargo & Co. (CA) 8 1,584 7.9 6 Orrstown Financial Services (PA) 8 1,125 5.6 7 Fulton Financial Corp. (PA) 9 1,067 5.3 8 Citizens Financial Group Inc. (RI) 7 834 4.2 9 Centric Financial Corp. (PA) 4 793 4.0 10 S&T Bancorp Inc. (PA) 4 610 3.1 Total (Top 10): 96 17,532 87.9 Total: 150 19,950 100.0 >$500B Combined annual GDP of Philadelphia, Harrisburg & Lancaster MSAs #1 / #4 / #5 Ranked MSAs in Pennsylvania in estimated population growth(1) (Harrisburg, Philadelphia & Lancaster, respectively) >465,000 Total number of businesses in the Philadelphia, Harrisburg & Lancaster MSAs

CROSSING $10 BILLION WITH THE CENTRIC ACQUISITION 9 First Commonwealth will cross $10 billion in assets upon closing of the Centric acquisition – Closing will take place no earlier than Jan. 1, 2023 – FCF’s crossing of $10 billion for Durbin Amendment purposes as a result of the acquisition is no sooner than FCF’s expected date of crossing organically – Centric’s earnings stream (inclusive of cost savings and accretion of marks) of approximately $24 million more than offsets the estimated standalone negative financial impact from Durbin of approximately $13 million annually FCF has been preparing to cross $10 billion organically for the last several years – Staffing and processes are ready in audit, compliance, risk management, CRA and technology – No material incremental investment expenses expected to be required Additional earnings offset provided by ramp up of equipment finance business line in 2H 2022 and in 2023 Organically Pro Forma with Centric Estimated Timing 2H 2023 At Close 1Q2023 Estimated Measurement Date for Durbin Purposes 12/31/2023 12/31/2023 Estimated Durbin Amendment Impact 2H 2024 2H 2024 Estimated 2024 Durbin Earnings Loss ($ Millions) ~ $6.5 ~ $6.6(1) Estimated 2025 Durbin Earnings Loss ($ Millions) ~ $13.0 ~ $13.1(1) Incremental Earnings ($ Millions)(2) $0.0 ~ $24.0 (1) Includes pro forma reduction in Centric’s interchange income (2) Based on management estimates. Includes cost savings 75% phased in in 2023 and fully phased in 2024, as well as purchase accounting adjustments. Assumes $14.4mm and $15.3mm in annual earnings for Centric Financial Corporation in 2023 and 2024, respectively Estimated Impact of Crossing $10B Incremental transaction earnings more than offset the earnings impact to FCF of crossing $10 billion
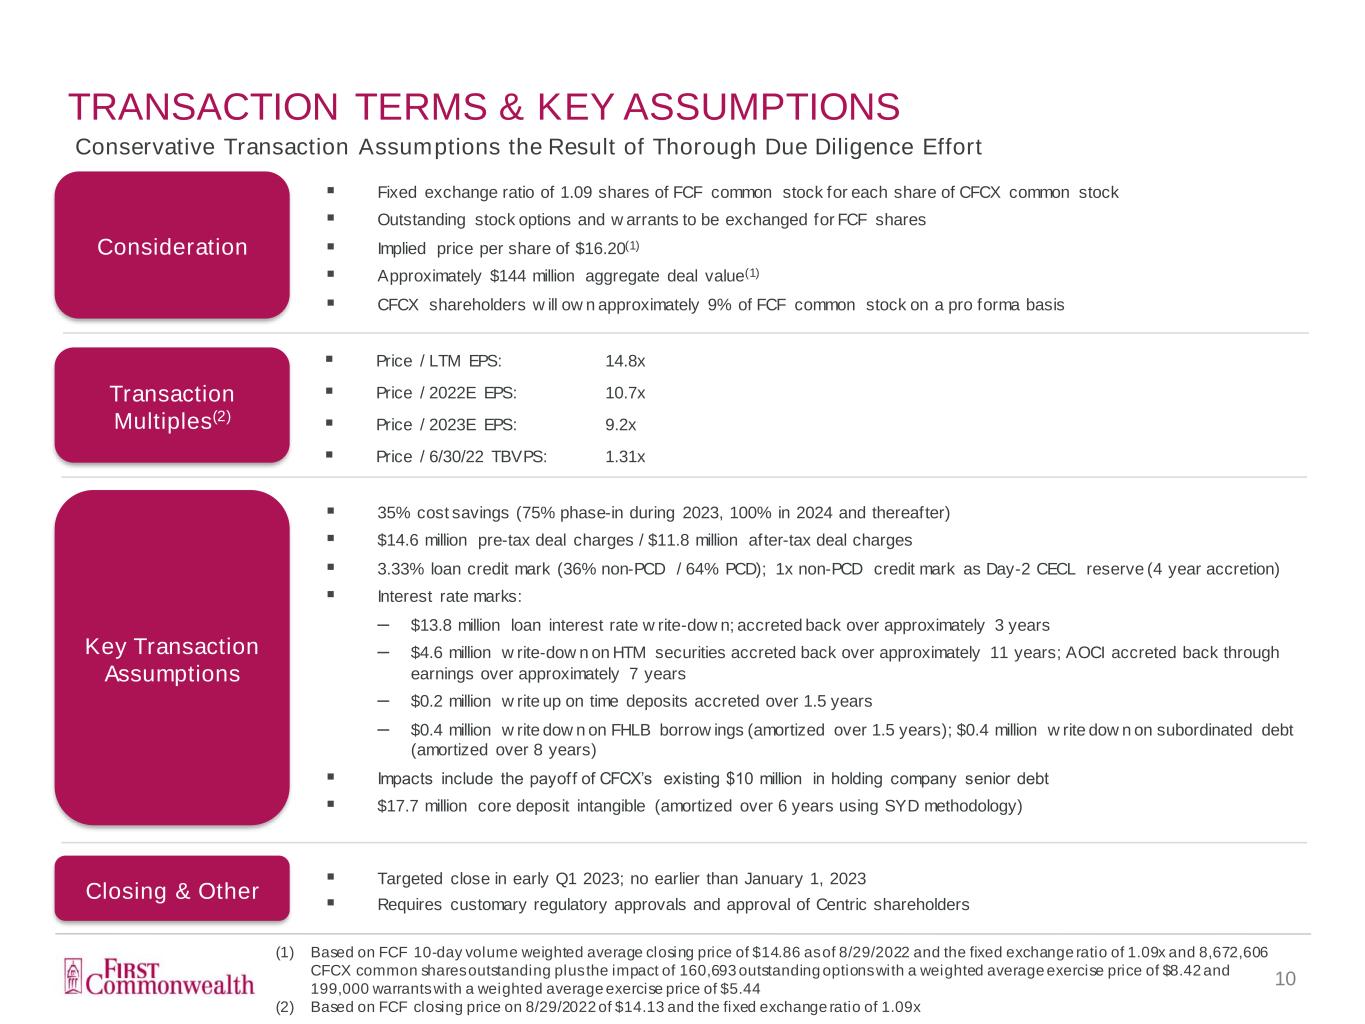
TRANSACTION TERMS & KEY ASSUMPTIONS 10 Consideration (1) Based on FCF 10-day volume weighted average closing price of $14.86 as of 8/29/2022 and the fixed exchange ratio of 1.09x and 8,672,606 CFCX common shares outstanding plus the impact of 160,693 outstanding options with a weighted average exercise price of $8.42 and 199,000 warrants with a weighted average exercise price of $5.44 (2) Based on FCF closing price on 8/29/2022 of $14.13 and the fixed exchange ratio of 1.09x Fixed exchange ratio of 1.09 shares of FCF common stock for each share of CFCX common stock Outstanding stock options and w arrants to be exchanged for FCF shares Implied price per share of $16.20(1) Approximately $144 million aggregate deal value(1) CFCX shareholders w ill ow n approximately 9% of FCF common stock on a pro forma basis Key Transaction Assumptions Closing & Other Targeted close in early Q1 2023; no earlier than January 1, 2023 Requires customary regulatory approvals and approval of Centric shareholders 35% cost savings (75% phase-in during 2023, 100% in 2024 and thereafter) $14.6 million pre-tax deal charges / $11.8 million after-tax deal charges 3.33% loan credit mark (36% non-PCD / 64% PCD); 1x non-PCD credit mark as Day-2 CECL reserve (4 year accretion) Interest rate marks: ‒ $13.8 million loan interest rate w rite-dow n; accreted back over approximately 3 years ‒ $4.6 million w rite-dow n on HTM securities accreted back over approximately 11 years; AOCI accreted back through earnings over approximately 7 years ‒ $0.2 million w rite up on time deposits accreted over 1.5 years ‒ $0.4 million w rite dow n on FHLB borrow ings (amortized over 1.5 years); $0.4 million w rite dow n on subordinated debt (amortized over 8 years) Impacts include the payoff of CFCX’s existing $10 million in holding company senior debt $17.7 million core deposit intangible (amortized over 6 years using SYD methodology) Transaction Multiples(2) Price / LTM EPS: 14.8x Price / 2022E EPS: 10.7x Price / 2023E EPS: 9.2x Price / 6/30/22 TBVPS: 1.31x Conservative Transaction Assumptions the Result of Thorough Due Diligence Effort
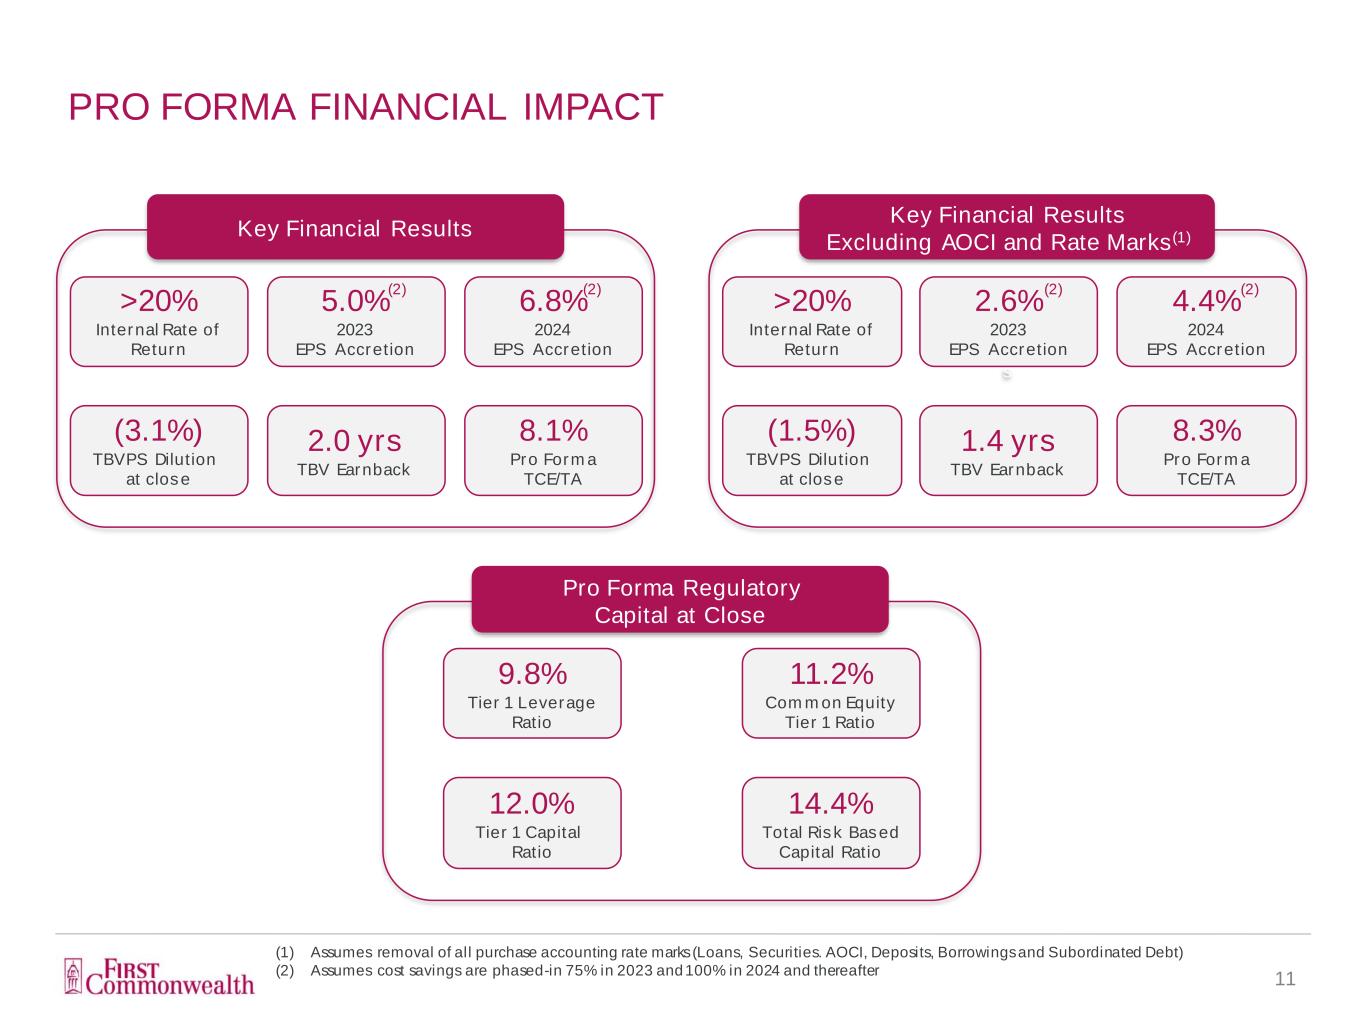
PRO FORMA FINANCIAL IMPACT 11 (1) Assumes removal of all purchase accounting rate marks (Loans, Securities. AOCI, Deposits, Borrowings and Subordinated Debt) (2) Assumes cost savings are phased-in 75% in 2023 and 100% in 2024 and thereafter Key Financial Results s Key Financial Results Excluding AOCI and Rate Marks(1) >20% Internal Rate of Return 5.0% 2023 EPS Accretion 6.8% 2024 EPS Accretion (3.1%) TBVPS Dilution at close 2.0 yrs TBV Earnback >20% Internal Rate of Return 2.6% 2023 EPS Accretion 4.4% 2024 EPS Accretion (1.5%) TBVPS Dilution at close 1.4 yrs TBV Earnback (2) (2) (2) (2) 8.1% Pro Forma TCE/TA 8.3% Pro Forma TCE/TA Pro Forma Regulatory Capital at Close 9.8% Tier 1 Leverage Ratio 11.2% Common Equity Tier 1 Ratio 14.4% Total Risk Based Capital Ratio 12.0% Tier 1 Capital Ratio

COMPREHENSIVE DUE DILIGENCE EFFORT 12 Credit & Lending Key Functional Area Diligence Regulatory, compliance and audit Legal Customer and market opportunities Product offerings Key talent, benefit & incentive plans Corporate culture Finance and balance sheet management Growth and earnings trajectory Technology systems, data processing and cyber security ‒ FCF and CFCX are on the same core system Key vendors and contracts Operations Reviewed approximately 56% of total loans outstanding ‒ 100% of criticized and classified loans ‒ 100% of NPAs ‒ Focus on loans over $350,000 (63% penetration) ‒ Sampling of loans under $350,000 Additional credit review focus on: ‒ Key relationships ‒ Hospitality lending ‒ SBA portfolio Detailed review of underwriting criteria and credit risk appetite Application of FCF’s CECL model to CFCX’s loan portfolio Our comprehensive due diligence review covered all functional areas of Centric and was coordinated with participation from key executives from FCF and CFCX, outside counsel and third party advisors
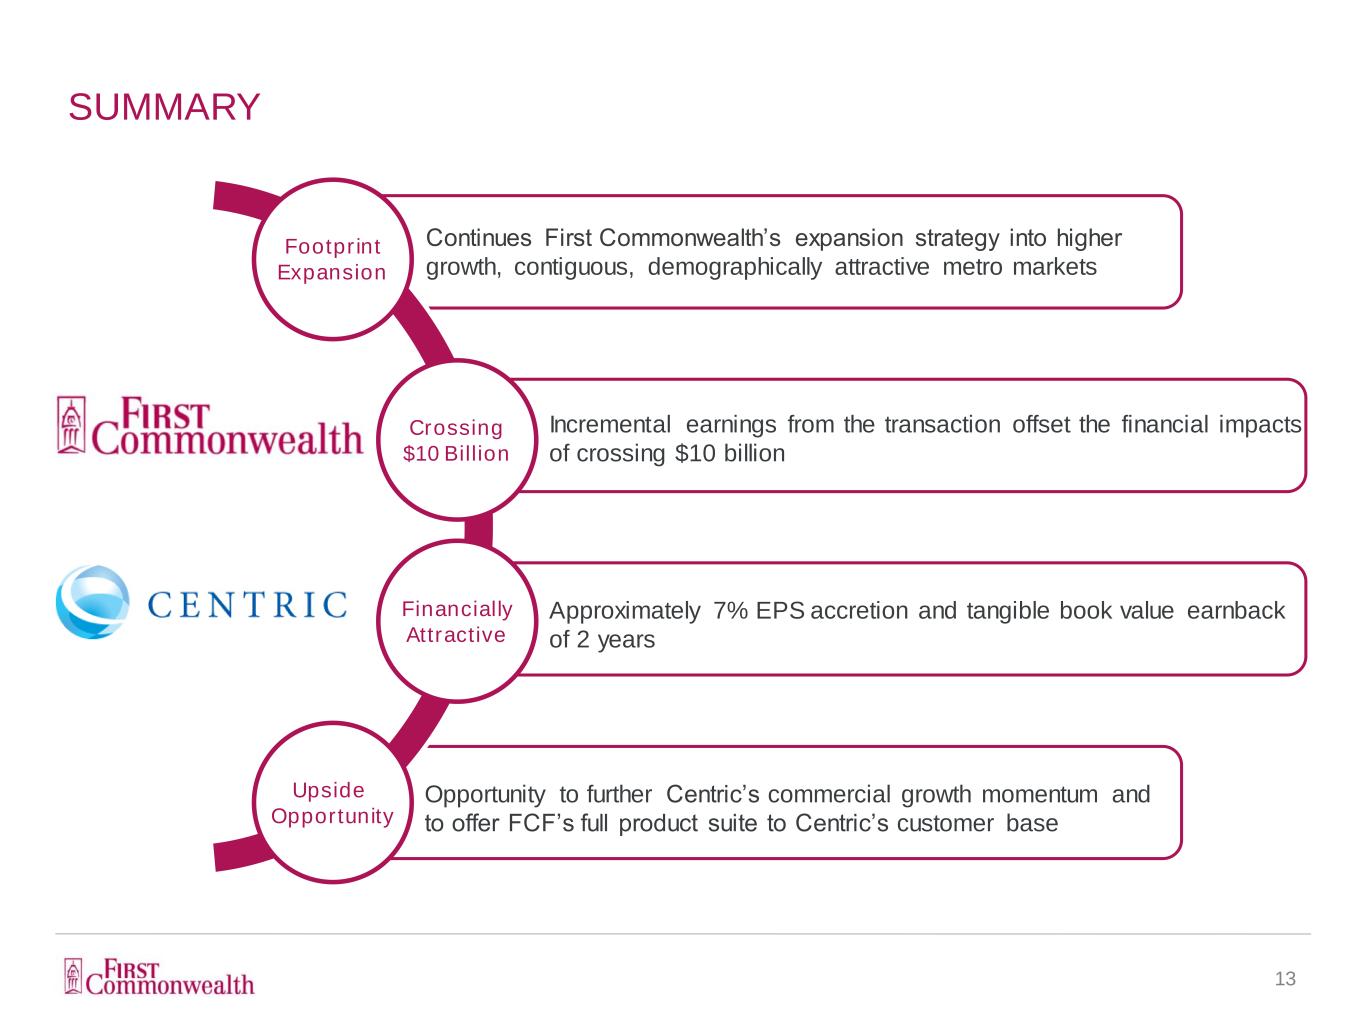
SUMMARY 13 Footprint Expansion Continues First Commonwealth’s expansion strategy into higher growth, contiguous, demographically attractive metro markets Crossing $10 Billion Incremental earnings from the transaction offset the financial impacts of crossing $10 billion Financially Attractive Approximately 7% EPS accretion and tangible book value earnback of 2 years Upside Opportunity Opportunity to further Centric’s commercial growth momentum and to offer FCF’s full product suite to Centric’s customer base

APPENDIX

CENTRIC FINANCIAL CORPORATION NON-GAAP MEASURES 15 (dollars in thousands except per share data) As of 6/30/22 GAAP Common Equity $100,194 Intangible Assets (492) Non-GAAP Tangible Common Equity $99,702 GAAP Total Assets $1,035,817 Intangible Assets (492) Non-GAAP Tangible Assets $1,035,325 Shares Outstanding 8,510,462 GAAP Book Value Per Share $11.77 Non-GAAP Tangible Book Value Per Share $11.72 GAAP Common Equity / Assets 9.67% Non-GAAP Tangible Common Equity / Tangible Assets 9.63% TCE Ratio and TBV Per Share Efficiency Ratio (dollars in thousands) Quarter Ended 6/30/22 GAAP Noninterest Expense $6,604 GAAP Net Interest Income $9,788 GAAP Noninterst Income 1,027 Non-GAAP Total Revenue $10,815 Non-GAAP Efficiency Ratio 61.1%
ADDITIONAL INFORMATION 16 Non-GAAP Financial Measures In addition to results presented in accordance w ith GAAP, this presentation contains certain non-GAAP financial measures. First Commonw ealth believes that providing certain non-GAAP financial measures provides investors w ith information useful in understanding performance trends and financial position. First Commonw ealth uses these measures for internal planning and forecasting purposes. First Commonw ealth and its securities analysts, investors and other interested parties, also use these measures to review peer company operating performance. First Commonw ealth believes that this presentation and discussion, together w ith the accompanying reconciliations, provides an understanding of factors and trends affecting First Commonw ealth’s businesses and allow s investors to view performance in a manner similar to management. These non-GAAP measures should not be considered a substitute for GAAP basis measures and results, and investors are strongly encouraged to review the consolidated f inancial statements in their entirety and not to rely on any single f inancial measure. Because non-GAAP financial measures are not standardized, it may not be possible to compare these financial measures w ith other companies’ non-GAAP f inancial measures having the same or similar names. A reconciliation of price to tangible book value and other ratios is included in the index to this presentation. Additional Information and Where to Find It In connection w ith the proposed transaction, First Commonw ealth w ill f ile a registration statement on Form S-4 w ith the SEC. The registration statement w ill include a proxy statement for Centric, and a prospectus of First Commonw ealth, that w ill be sent to Centric’s shareholders seeking certain approvals related to the proposed transaction. The information contained herein does not constitute an offer to sell or a solicitation of an offer to buy any securities or a solicitation of any vote or approval, nor shall there be any sale of securities in any jurisdiction in w hich such offer, solicitation or sale w ould be unlaw ful prior to registration or qualif ication under the securities law s of any such jurisdiction. INVESTORS AND SECURITY HOLDERS OF FIRST COMMONWEALTH AND CENTRIC AND THEIR RESPECTIV E AFFILIATES ARE URGED TO READ, WHEN AVAILABLE, THE REGISTRA TION STATEMENT ON FORM S-4, THE PROXY STATEMENT/PROSPECTUS TO BE INCLUDED WITHIN THE REGISTRA TION STATEMENT ON FORM S-4 AND ANY OTHER RELEVANT DOCUMENTS FILED OR TO BE FILED WITH THE SEC IN CONNECTION WITH THE PROPOSED TRANSACTION, AS WELL AS ANY AMENDMENTS OR SUPPLEMENTS TO THOSE DOCUMENTS, BECAUSE THEY WILL CONTAIN IMPORTANT INFORMATION ABOUT FIRST COMMONWEALTH, CENTRIC AND THE PROPOSED TRANSACTION. Investors and security holders w ill be able to obtain a free copy of the registration statement, including the proxy statement/prospectus, as w ell as other relevant documents f iled w ith the SEC containing information about First Commonw ealth, w ithout charge, at the SEC’s w ebsite (http://w ww.sec.gov). In addition, investors and security holders may obtain free copies of the documents First Commonw ealth has f iled w ith the SEC by contacting Matthew C. Tomb, Chief Risk Officer and General Counsel, First Commonw ealth Financial Corporation, 601 Philadelphia Street, Indiana, PA 15701, telephone: (800) 711-2265, and may obtain free copies of the proxy statement/prospectus by contacting Sandra L. Schultz, Chief Financial Officer, Centric Financial Corporation, 4320 Linglestow n Road, Harrisburg, PA 17112, telephone: (717) 657-7727.


