 1 Keefe, Bruyette & Woods 9 th Annual Community Bank Investor Conference July 28 – 30, 2008 time to be… First! ™ John J. Dolan President and CEO Edward J. Lipkus, III Executive V.P. and CFO Exhibit 99.1 |
 Today’s Agenda Company Overview Lines of Business Financials Conclusion Q&A 2 |
   FORWARD-LOOKING STATEMENTS The matters discussed in this presentation contain forward-looking statements that describe First Commonwealth’s future plans, strategies and expectations. All forward-looking statements are based on assumptions and involve risks and uncertainties, many of which are beyond the control of First Commonwealth and which may cause actual results, performance or achievements to differ materially from the results, performance or achievements contemplated by the forward-looking statements. Such risks and uncertainties include, among other things, the following: Competitive pressures among depository and other financial institutions nationally and in our market areas may increase significantly. Adverse changes in the economy or business conditions, either nationally or in our market areas, could increase credit related losses and expenses and/or limit growth. Increases in defaults by borrowers and other delinquencies could result in increases in our provision for losses on loans and related expenses. Fluctuations in interest rates and market prices could reduce our net interest margin and asset valuations and increase our expenses. The consequences of continued bank acquisitions and mergers in our market areas, resulting in fewer but much larger and financially stronger competitors, could increase competition for financial services to our detriment. Changes in legislative or regulatory requirements applicable to us and our subsidiaries could increase costs, limit certain operations and adversely affect results of operations. Changes in tax requirements, including tax rate changes, new tax laws and revised tax law interpretations may increase our tax expense or adversely affect our customers’ businesses. Other risks and uncertainties described in this report and the other reports that we file with the Securities and Exchange Commission, including our most recent Annual Report on Form 10-K. In light of these risks, uncertainties and assumptions, you should not place undue reliance on any forward- looking statements discussed in this presentation. First Commonwealth undertakes no obligation to publicly update or otherwise revise any forward-looking statements, whether as a result of new information, future events or otherwise. Forward-Looking Statement 3 |
 Company Overview Headquarters: Indiana, Pennsylvania Exchange: NYSE (FCF) Listing Date: June 10, 1992 Institutional Ownership: 36% Insider Ownership: 5% Full Service Financial Institution Commercial Consumer Wealth Management - Trust - Insurance - Financial Advisors Ownership information as of most recent filing 4 Price (07/24/08): $10.95 Market Cap: $802 million Total Assets: $6.3 billion Index Membership: Russell 2000 S&P Small Cap 600 |
      Company Overview 112 branches proudly serving 15 Western and Central Pennsylvania counties Four de novos scheduled for completion in 2008 - Including Squirrel Hill (Pittsburgh) which opened on March 10, 2008 5 |
 Company Overview Historical Legacy of Conservative Lending Practices - relationship driven lender - no sub-prime - well diversified loan portfolio - conservative investment portfolio Strong Dividend History Beginning Stages of Business Transformation 6 |
 Recent Fundamental Changes New Executive Leadership Team Performance Measurement - accountability - well defined goals - alignment of compensation - profitable sales driven culture into each line of business Internal Restructuring - align structure with strategy - provide role clarity - improved collaboration among all lines of business 7 |
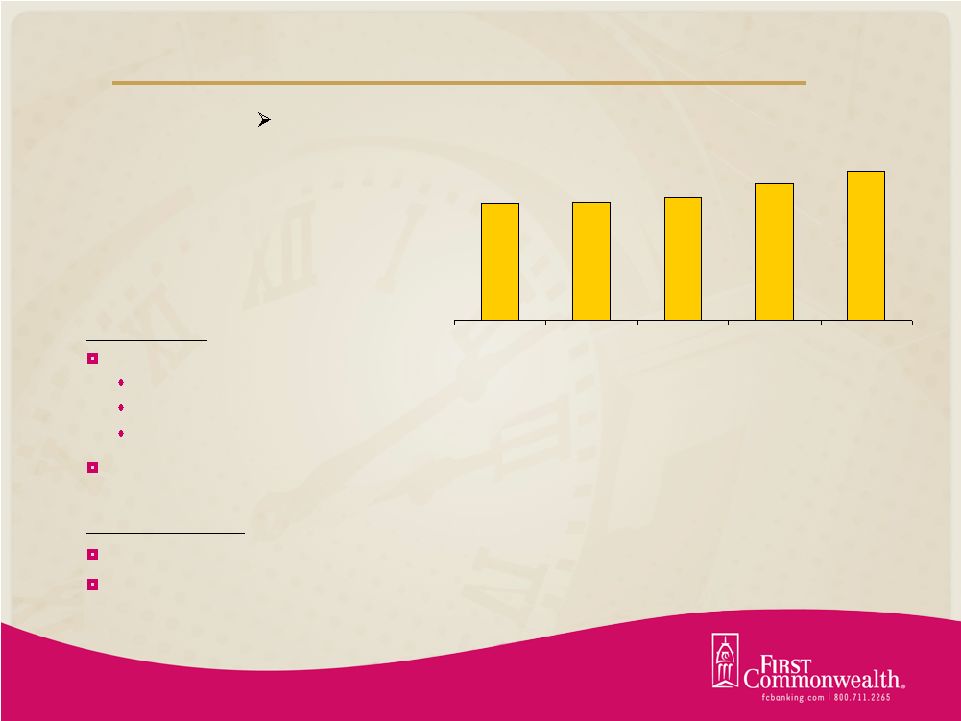 Commercial Services Strategies Develop 3 key core competencies Corporate finance capabilities Commercial real estate lending capabilities Regional/middle market lending capabilities Serve client needs in contiguous markets (LPO’s) Opportunities Enhanced cash management & product offerings Continued cross selling opportunities 8 $1,890 $1,911 $1,996 $2,204 $2,411 2Q07 3Q07 4Q07 1Q08 2Q08 $415 million growth in commercial loans year-to-date |
 Wealth Management 9 Strategies Hired several talented investment representatives Improved alliance with branches Opportunities Employee Benefits Cross-selling Product development Revenue increased 27% Y/Y Wealth Management Revenue (thousands) $2,148 $2,375 $2,581 $2,337 $2,809 $2,932 1Q07 2Q07 3Q07 4Q07 1Q08 2Q08 |
 Consumer Services 10 Strategies New leadership Development of new product offerings Sales blitzes Internal sales campaigns with coordinated marketing efforts Consumer Loans increased for the first time in several quarters 20% increase in checking account openings in June Opportunities Increase market penetration in Pittsburgh area Improve de novo branch performance Develop stronger small business model Core Deposit Growth YTD 8.6% 13.1% 8.3% 0% 5% 10% 15% 12/31/07 06/30/08 Non-interest Bearing DDA Interest Bearing DDA Savings Deposits |
 Financials 11 Year-to-Date Income Statement (thousands) 2008 2007 Net Interest Income (after provision) 79,475 $ 75,696 $ 3,779 $ 5% Non-Interest Income 26,545 23,827 2,718 11% Non-Interest Expense 77,741 74,652 3,089 4% Taxes 4,245 2,488 1,757 71% Net Income 24,034 $ 22,383 $ 1,651 $ 7% EPS (diluted) 0.33 $ 0.31 $ 0.02 $ 6% Six Months Ended June 30, Change |
 2.75 2.85 2.95 3.05 3.15 3.25 3.35 3.45 3.55 4Q06 1Q07 2Q07 3Q07 4Q07 1Q08 2Q08* Net Interest Margin 12 *Excludes loan prepayment fee which contributed 12bps to NIM (3.54%) Interest earning asset growth Lower cost of funds - higher priced CDs running off |
 Loans 13 Commercial Loan Growth (YTD) Commercial & Industrial 45% Construction 24% Real Estate 31% Total loans increased 11% YTD Commercial loans increased 21% YTD Total Loans (billions) $3.5 $3.6 $3.7 $3.7 $3.9 $4.1 FY04 FY05 FY06 FY07 1Q08 2Q08 |
 Asset Quality Responsible, relationship driven lender No direct subprime exposure Same conservative underwriting standards, regardless of where we are in the credit cycle All mortgage-backed securities in our investment portfolio are AAA rated and backed by U.S. government agencies 99% of our pooled trust preferred securities carry a Moody rating of A3 or better 14 |
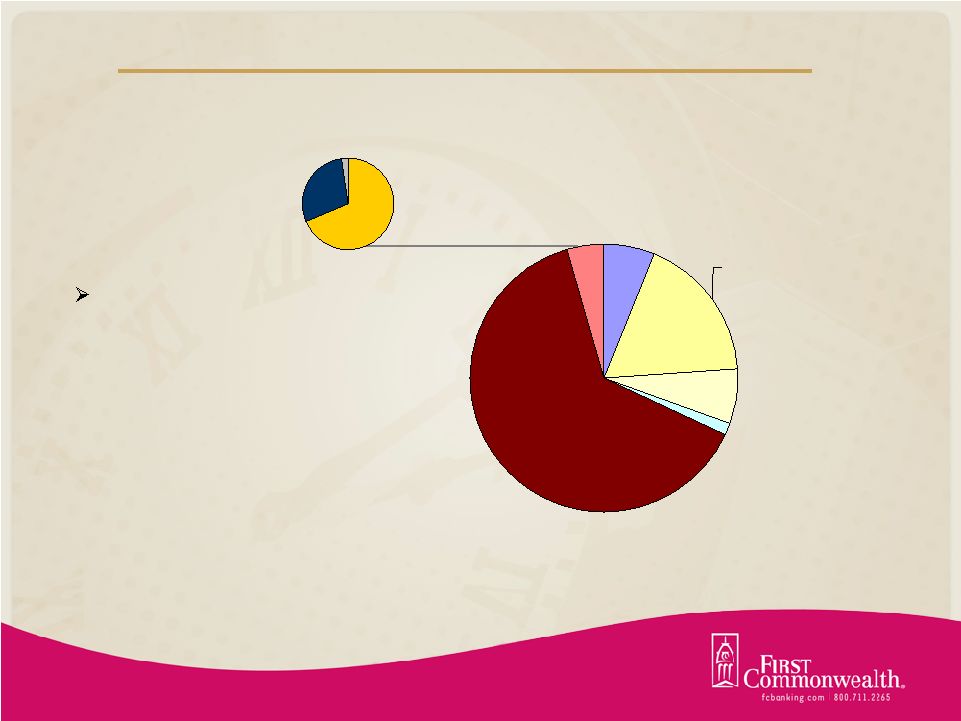 $1.6B U.S. Agency 6% Pooled Trust Preferred 7% Single Issue Trust Preferred 1% Agency MBS, CMO's 63% Equity Securities 5% Tax-Free Municipals 18% Investment Portfolio 15 As of 06/30/08 Bank Stock 29% Other Stock 2% FHLB Stock 69% Bank stocks consist exclusively of regional financial institutions |
 Investment Consideration We are a conservative financial institution with room to grow within our current footprint Execution = Results Improving fundamentals Near-term growth catalyst, long-term focus - increase internal capital generation 16 |
 Appendix |
 Market Demographics — Room to grow within our market Source: SNL Financial Ownership: Current Demographic Profile County Market Rank Number of Branches Company Deposits in Market ($000) Total Deposits in Market ($000) Deposit Market Share (%) Percent of Franchise (%) Median HH Income 2007 ($) HH Income Change 2000-2007 (%) Projected HH Income Change 2007-2012 (%) Allegheny 6 34 1,139,479 45,946,734 2.48 25.76 50,158 30.90 19.30 Westmoreland 2 17 840,892 6,498,393 12.94 19.01 47,325 27.52 17.37 Indiana 2 9 533,026 1,963,263 27.15 12.05 37,525 24.14 15.69 Cambria 3 10 435,457 2,496,886 17.44 9.85 38,634 28.07 18.50 Blair 4 7 254,620 1,876,345 13.57 5.76 41,586 26.04 18.30 Clearfield 2 5 252,269 1,276,665 19.76 5.70 38,911 24.26 15.50 Somerset 3 5 169,972 1,121,927 15.15 3.84 38,259 23.94 15.63 Lawrence 6 5 165,277 1,473,057 11.22 3.74 41,979 25.99 18.53 Jefferson 2 3 144,261 828,610 17.41 3.26 39,595 24.63 15.18 Butler 10 5 120,413 2,839,929 4.24 2.72 54,038 27.33 17.71 Elk 3 3 120,287 620,356 19.39 2.72 47,419 25.74 15.38 Bedford 4 3 95,238 634,075 15.02 2.15 40,031 22.92 13.61 Armstrong 5 2 77,966 1,019,163 7.65 1.76 39,217 24.44 15.49 Washington 13 3 53,805 3,471,290 1.55 1.22 48,684 29.18 19.03 Beaver 10 1 19,744 2,146,087 0.92 0.45 47,239 27.55 17.15 PA Totals 112 4,422,706 74,212,781 5.96 100 Weighted Average: Pennsylvania Franchise 44,309 27.29 17.49 Aggregate: Entire State of Pennsylvania 51,375 28.09 18.02 Aggregate: National 53,154 26.06 17.59 18 |
  Market Share Early signs of improvement — In 2006, we lost market share in 12 of our 15 counties — In 2007, our market share increased in 10 of these 15 counties Source: SNL Financial Ownership: Current Market Share Analysis - First Commonwealth Financial Corporation Corporate Headquarters: Indiana, Pennsylvania Pennsylvania (PA) Market Rank Branch Count Percent of Parent's Deposits 2007 2007 2007 2004 2005 2006 2007 County (%) (%) (%) change (%) change (%) change Allegheny 6 34 25.76 2.89 2.75 (0.14) 2.48 (0.27) 2.48 0.00 Westmoreland 2 17 19.01 12.39 12.95 0.56 12.82 (0.13) 12.94 0.12 Indiana 2 9 12.05 32.04 30.57 (1.47) 29.51 (1.06) 27.15 (2.36) Cambria 3 10 9.85 17.10 18.05 0.95 17.90 (0.15) 17.44 (0.46) Blair 4 7 5.76 11.40 11.63 0.23 11.91 0.28 13.57 1.66 Clearfield 2 5 5.70 20.06 20.29 0.23 19.44 (0.85) 19.76 0.32 Somerset 3 5 3.84 14.49 14.92 0.43 14.80 (0.12) 15.15 0.35 Lawrence 6 5 3.74 12.93 12.52 (0.41) 12.07 (0.45) 11.22 (0.85) Jefferson 2 3 3.26 17.56 17.21 (0.35) 16.33 (0.88) 17.41 1.08 Butler 10 5 2.72 5.28 5.24 (0.04) 4.17 (1.07) 4.24 0.07 Elk 3 3 2.72 18.54 18.92 0.38 18.92 0.00 19.39 0.47 Bedford 4 3 2.15 13.95 15.03 1.08 14.74 (0.29) 15.02 0.28 Armstrong 5 2 1.76 7.98 7.63 (0.35) 6.88 (0.75) 7.65 0.77 Washington 13 3 1.22 1.39 1.63 0.24 1.73 0.10 1.55 (0.18) Beaver 10 1 0.45 1.04 0.77 (0.27) 0.76 (0.01) 0.92 0.16 Total Market Share 19 |
 $0.00 $0.10 $0.20 $0.30 $0.40 $0.50 $0.60 $0.70 $0.80 Company Overview 1985 Present - We recognize the importance of our dividend to our shareholders “…the focus of our strategic initiatives is the achievement of earnings per share growth that supports our exceptionally strong dividend.” Dividend History John J. Dolan President and CEO 20 |
 • Strong dividend history • Attractive yield, especially in today’s interest rate environment Dividend Dividend Yield Increase earnings to return dividend payout ratio to a more “normalized” level 21 Source: SNL Financial 0% 1% 2% 3% 4% 5% 6% 7% 8% FY 00 FY 01 FY 02 FY 03 FY 04 FY 05 FY 06 FY 07 2Q08 YTD |
 Commercial Loans 22 Committed Balances by Industry June 30, 2008 6% 13% 5% 8% 37% 22% 3% 6% Construction Manufacturing Wholesale Trade Retail Trade Finance Insurance and Real Estate Services Public Administration Miscellaneous |
 Asset Quality 23 *Excludes one large credit placed into non-accrual during 2Q07 ($29,950) 0 5,000 10,000 15,000 20,000 25,000 30,000 2Q06 3Q06 4Q06 1Q07 2Q07 3Q07 4Q07 1Q08 2Q08 Non-Accrual Past Due +90 Days |
 FCF 21.7% KBW Regional Bank Index -29.8% Regional Peer Group -12.1% Total Return As of 07/24/08 12 Month Total Shareholder Return 24 Source: SNL Financial |
 Definitions Community Bank System, Inc. CBU F.N.B. Corporation FNB First Financial Bancorp. FFBC FirstMerit Corporation FMER Fulton Financial Corporation FULT Harleysville National Corporation HNBC National Penn Bancshares, Inc. NPBC NBT Bancorp Inc. NBTB Park National Corporation PRK Provident Bankshares Corporation PBKS S&T Bancorp, Inc. STBA Sun Bancorp, Inc. SNBC Susquehanna Bancshares, Inc. SUSQ United Bankshares, Inc. UBSI WesBanco, Inc. WSBC Regional Bank Peer Group 25 |
 Notes |