 KBW Regional Bank Conference Investor Presentation John J. Dolan President and CEO Edward J. Lipkus, III Executive V.P. and CFO T. Michael Price Bank President Exhibit 99.1 |
 Forward-Looking Statements This presentation will contain “forward-looking statements” within the meaning of the Private Securities Litigation Reform Act of 1995. Forward-looking statements can be identified by the fact that they do not relate strictly to historical or current facts and often include words such as “believe,” “expect,” “anticipate,” “intend,” “plan,” “estimate” or words of similar meaning, or future or conditional verbs such as “will,” “would,” “should,” “could” or “may.” Forward-looking statements describe First Commonwealth’s future plans, strategies and expectations. These plans, strategies and expectations are based on assumptions and involve risks and uncertainties, many of which are beyond the control of First Commonwealth and which may cause actual results, performance or achievements to differ materially from the results, performance or achievements contemplated by the forward-looking statements. Such risks and uncertainties include, among other things: Deepened or prolonged weakness in economic and business conditions, nationally and in First Commonwealth’s market areas, which could increase credit-related losses and expenses and limit growth Further declines in the market value of investment securities that are considered to be other-than-temporary, which would negatively impact First Commonwealth’s earnings and capital levels Increases in defaults by borrowers and other delinquencies, which could result in an increased provision for credit losses on loans and related expenses Reduced wholesale funding capacity or higher borrowing costs due to capital constraints at the Federal Home Loan Bank, which would reduce First Commonwealth’s liquidity and negatively impact earnings and net interest margin Fluctuations in interest rates and market prices, which could reduce net interest margin and asset valuations and increase expenses Changes in legislative or regulatory requirements applicable to First Commonwealth and its subsidiaries, which could increase costs, limit certain operations and adversely affect results of operations The inability to successfully execute First Commonwealth’s strategic growth initiatives, which could limit future revenue and earnings growth and other risks and uncertainties described in First Commonwealth’s reports filed with the Securities and Exchange Commission, including its most recent Annual Report on Form 10-K. Forward-looking statements speak only as of the date on which they are made. First Commonwealth undertakes no obligation to update any forward-looking statements to reflect circumstances or events that occur after the date of this presentation. 2 |
 Today’s Agenda Who is First Commonwealth? Winning Through Execution and Accountability Financials Conclusion 3 |
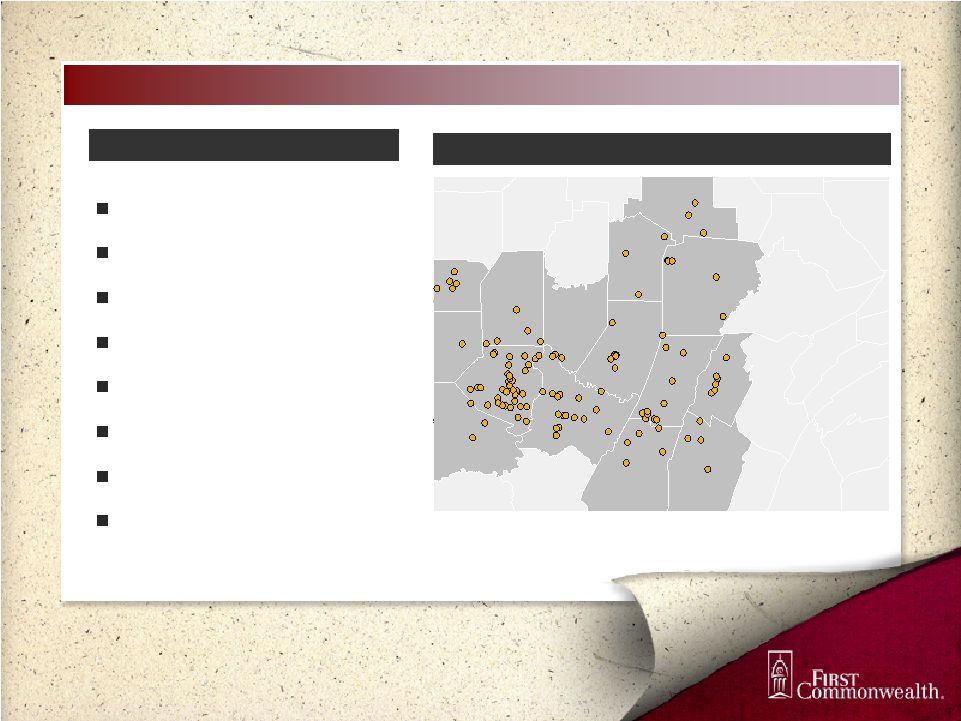 th Company Overview Branch Franchise Overview Pennsylvania’s 6 Largest Bank Headquartered in Indiana, PA 114 Branches Assets: $6,426 million Net Loans: $4,366 million Deposits: $4,280 million Tangible Equity: $483 million Market Cap: ~ $700 million (as of 02/27/2009) Information as of December 31, 2008, except market cap Cumberland Westmoreland Bedford Elk Jefferson Clearfield Cambria Blair Greene Somerset Cameron Venango Clarion Beaver Allegheny Fayette Indiana Lawrence Butler Washington Adams Armstrong Centre Clinton Forest Franklin Fulton Huntingdon Juniata L Mercer Mifflin Perry S U Pittsburgh 4 |
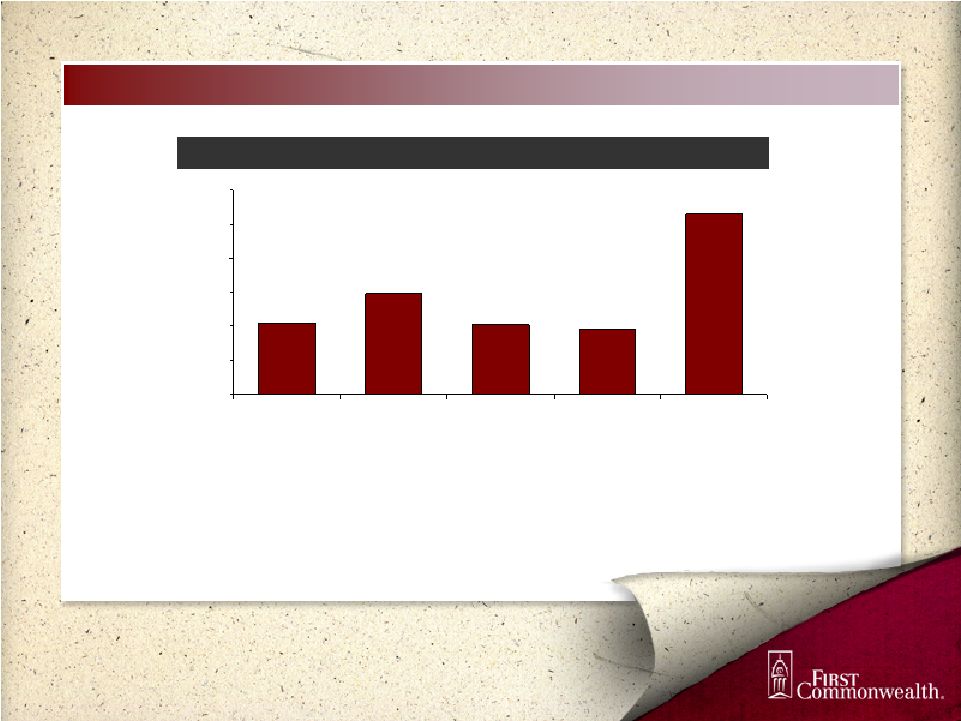
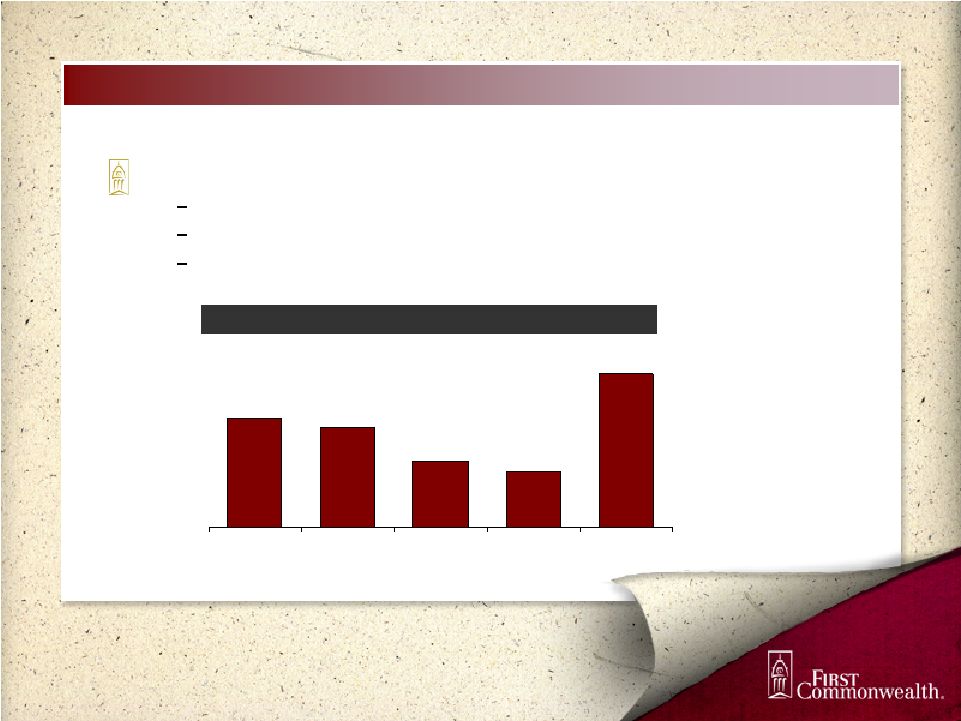 What Differentiates First Commonwealth? Strong Capital Position successful common equity capital raise in 4Q08 chose not to participate in the TARP ability to focus on market opportunities 6.9% 6.8% 6.2% 6.0% 7.7% Q4 2007 Q1 2008 Q2 2008 Q3 2008 Q4 2008 Tangible Common Equity Ratio Source: SNL Financial 5 |
 What Differentiates First Commonwealth? Improving Fundamentals - foundation for sustainable growth Historical Legacy of Conservative Lending Practices - relationship driven lender - no sub-prime - stable footprint - conservative investment portfolio Market Opportunities - PNC / NCC acquisition - small business 6 |
 Market Opportunities (1) Pro-forma market share, except PNC – NCC (2) Excludes all branches with deposits greater than $500 million Branch data as of June 30, 2008 Rank Institution Branches Deposits ($M) (2) Market Share (%) 1 National City Corp. (OH) 109 6,938 22.2% 2 PNC Financial Services Group (PA) 80 6,544 20.9% 3 Royal Bank of Scotland Group 99 4,611 14.7% 4 Dollar Bank FSB (PA) 27 2,606 8.3% 5 First Commonwealth Financial (PA) 42 1,196 3.8% 6 Huntington Bancshares Inc. (OH) 26 1,131 3.6% 7 F.N.B. Corp. (PA) 32 727 2.3% 8 Northwest Bancorp, Inc. (MHC) (PA) 27 912 2.9% 9 Parkvale Financial Corp. (PA) 30 897 2.9% 10 S&T Bancorp, Inc. (PA) 14 608 1.9% Totals (1-10) 486 26,169 83.7% Totals (All) 620 31,264 100.0% Source: SNL Financial 7 Dampened competitive environment as larger financial institutions focus internally Large bank competitors include PNC / National City, RBS Citizens, Fifth Third and M&T Enabling strategic hires at all levels New business being booked at higher spreads / better credit quality Meanwhile, First Commonwealth retains the scale to compete “above” smaller institutions that have same “community bank” feel but narrower product / service capabilities Allegheny, Butler and Washington Counties (1) |
 Focus on Optimizing Each Area of Business Accountability at every level of the organization Aligned scorecards with shareholder value Weekly accountability around activities and performance Building brand awareness Measuring and tracking brand recognition Disciplined approach to direct mail De novo strategy complements this effort Good momentum in retail banking Expanding and aligning incentives Building sales capacity Hands-on leadership style Progress in small business arena Leveraging Strengths in Commercial Banking Several strategic hires over the past two years Building out cash management and other fee based businesses 8 |
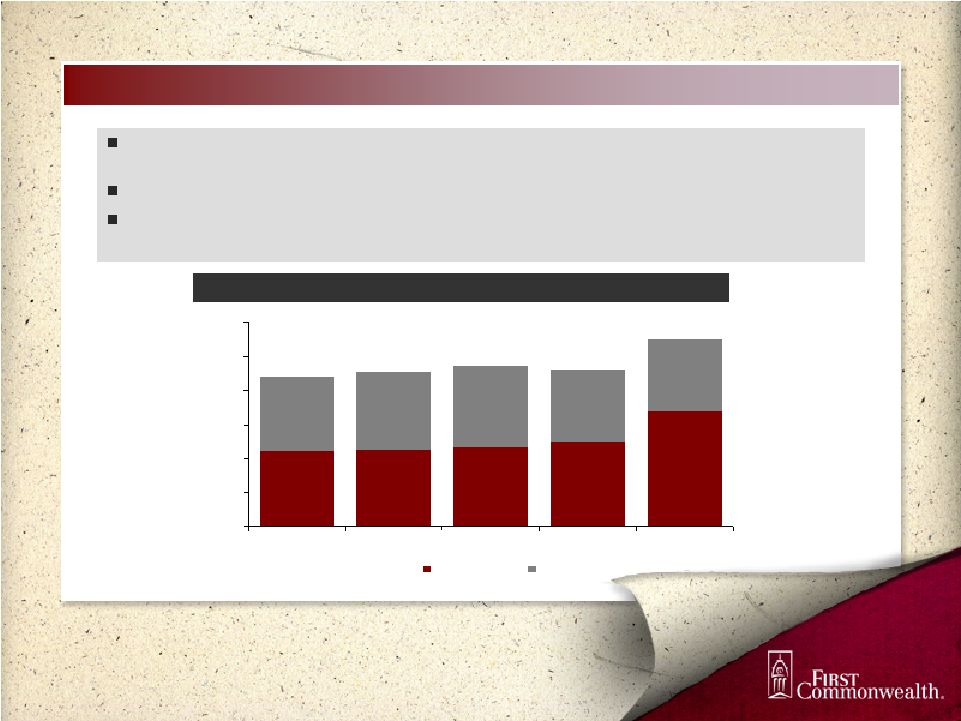 $1,796 $1,889 $1,996 $2,707 $1,740 $1,828 $1,895 $1,702 $1,711 $1,775 $0 $800 $1,600 $2,400 $3,200 $4,000 $4,800 2004 2005 2006 2007 2008 Commercial Consumer Strong Loan Growth Total Loans ($ millions) $3,515 $3,624 $3,784 $3,698 $4,418 2008 loan portfolio increase of $720 million (19.5 percent) with the same conservative lending standards Growth primarily due to capitalizing on commercial lending opportunities Successful consumer loan campaigns Note: Commercial loans include small business loans, which as of December 31, 2008 totaled $386 million 9 |
 Credit Quality Has Remained Stable NPAs / Loans + OREO Reserves / Loans Increase in Nonperforming Assets during 2007 primarily due to a single commercial relationship NCOs / Average Loans 0.36% 0.36% 0.36% 1.53% 1.34% 0.00% 1.00% 2.00% 3.00% 4.00% 2004 2005 2006 2007 2008 0.29% 0.28% 0.24% 0.28% 0.31% 0.00% 0.40% 0.80% 1.20% 2004 2005 2006 2007 2008 1.17% 1.09% 1.13% 1.15% 1.19% 0.50% 0.75% 1.00% 1.25% 1.50% 2004 2005 2006 2007 2008 10 |
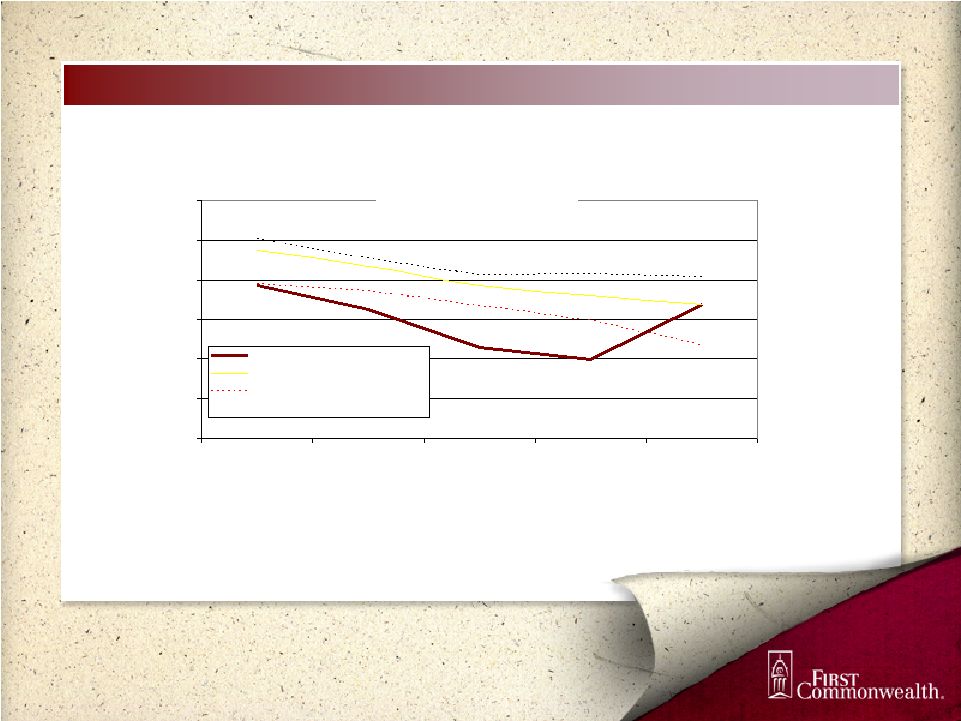
 Strong Market Essentials Western Pennsylvania has remained free of the “boom” and “bust” cycles of other markets The local economy and housing markets continue to exhibit slow – but stable – growth Moody’s ranks Pittsburgh’s CRE market as the strongest in the nation During the past two recessionary periods, Pittsburgh’s unemployment level fared better than the national average 1 Home Price and Employment data as of December 31, 2008 Source: Federal Housing Finance Agency Pennsylvania Department of Labor and Industry Pittsburgh, PA U.S. Employment Growth (Y/Y) Home Price Appreciation (Y/Y) (1) Pittsburgh MSA Indiana MSA Johnstown MSA Altoona MSA 11 - 8.2% 1.0% 0.2% -2.0% U.S. |
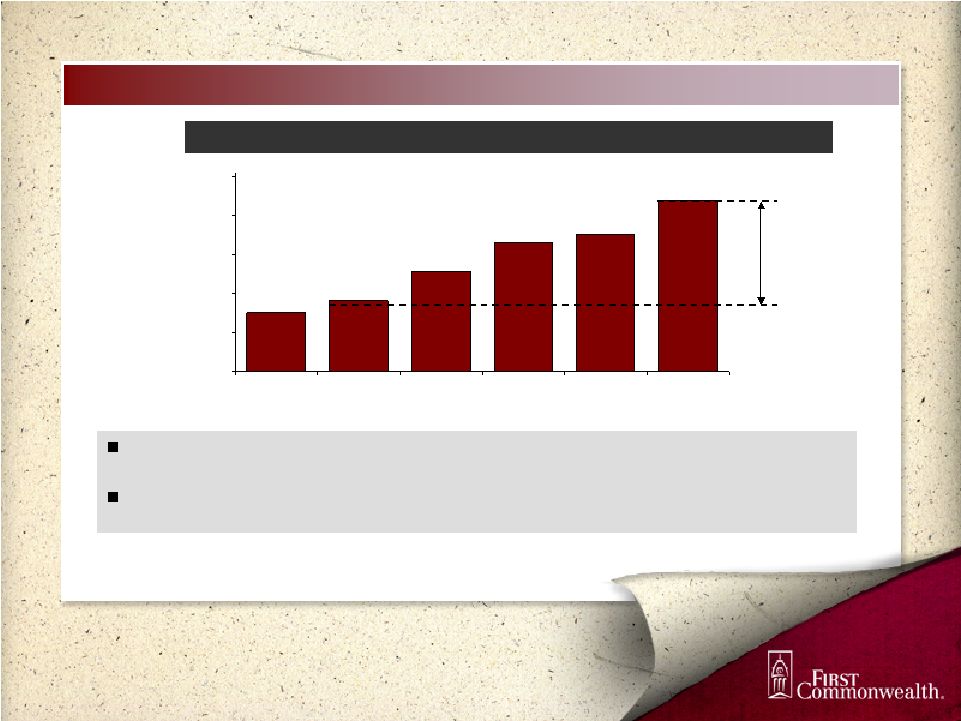 Commercial Lending Momentum $1,911 $2,707 $2,411 $2,204 $1,996 $2,465 $1,500 $1,775 $2,050 $2,325 $2,600 $2,875 Q3 2007 Q4 2007 Q1 2008 Q2 2008 Q3 2008 Q4 2008 $711 mm growth Note: Commercial loans include small business loans, which as of December 31, 2008 totaled $386 million Commercial Loans ($ millions) 12 $711 million or 36% (Y/Y) growth reflects higher spreads and better credit quality vs. existing portfolio Current dislocation in markets is yielding many opportunities to continue this momentum |
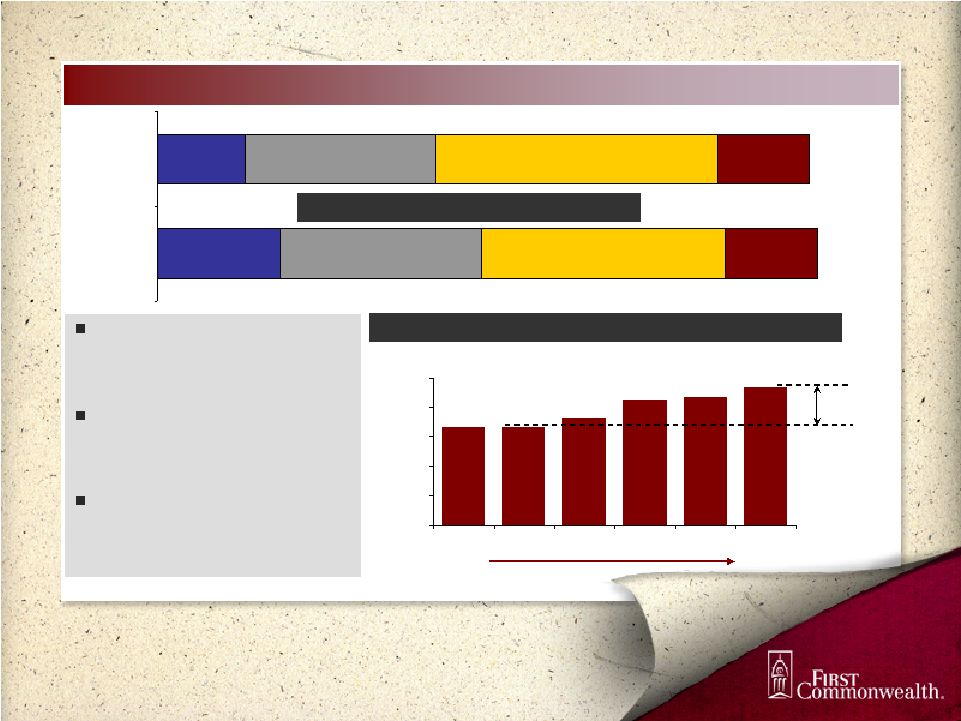 + $271 mm in one year % of total deposits 50% 57% Improving Deposit Mix $2,370 $2,167 $2,229 $2,352 $2,438 $2,165 $1,500 $1,700 $1,900 $2,100 $2,300 $2,500 Q3 2007 Q4 2007 Q1 2008 Q2 2008 Q3 2008 Q4 2008 Deposit Mix ($ millions) Transaction and Savings Deposit Growth ($ millions) Market conditions and improved retail banking strategy have facilitated core deposit growth Realizing progress from retail banking initiatives, combined with the benefit of a weakened competitive landscape Simultaneously managing down time deposit costs from single-service households 14% 29% 44% 13% 19% 31% 38% 12% 13 Jumbo CD's 827 Jumbo CD's 583 Retail CD's 1,353 Retail CD's 1,259 Interest-bearing DDA & Savings 1,644 Interest-bearing DDA & Savings 1,871 Non Interest-bearing 523 Non Interest-bearing 567 2007 2008 |
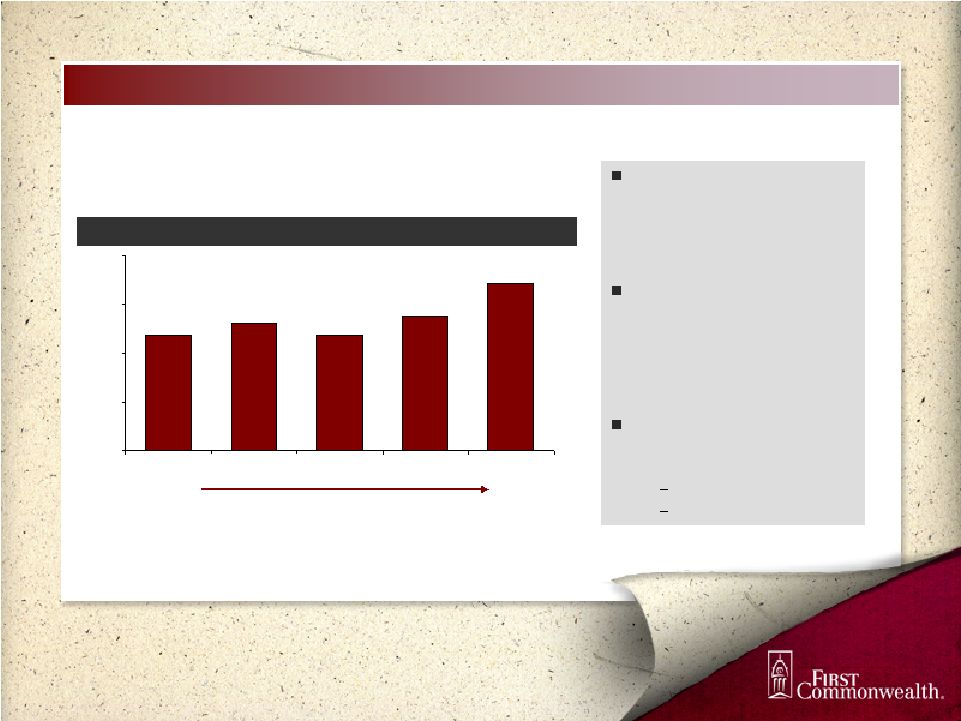 % of Oper. Revenue 20.7% 22.4% Growing Fee Income Businesses Total Noninterest Income ($ millions) (1) First Commonwealth’s Wealth Management business has experienced a 13.2% Y / Y increase in fee income Along with increased interchange and insurance commissions, noninterest income has grown to represent over 22% of operating revenue Slowing market fundamentals is creating headwinds Overdraft / NSF’s A.U.M. (1) Excludes net securities gains/losses and non-recurring revenue $43.6 $46.1 $43.6 $47.7 $54.3 $20 $30 $40 $50 $60 2004 2005 2006 2007 2008 14 |
 Avoided Certain Industry Pitfalls Same conservative lending standards during entire credit cycle Residential mortgage portfolio free of Subprime, Alt-A and other troubled categories Over 85% of commercial loan portfolio is in Pennsylvania No exposure to GSE preferred securities and private label CMO and MBS categories Loan Portfolio Securities Portfolio Data as of December 31, 2008 15 4% 2% 7% 18% 5% 64% U.S. Agency Tax-Free / Tax Municipals Pooled Trust Preferred Single Issue Trust Preferred Agency MBS, CMO's Equity Securities 11% 23% 9% 29% 28% ` Real Estate - Commercial Real Estate - Construction Commercial, Financial, Agricultural & Other Real Estate - Residential Loans to Individuals |
   Trust Preferred Securities Pre TSL VII is the only pool with $0 remaining in the projected excess subordination (2008 OTTI charges were $9 million) Excess subordinations range from 0.0% - 115.5% of original collateral Book Fair Deal Class Value Value Pre TSL I Senior 3,841 $ 4,212 $ 371 $ Pre TSL IV Mezzanine 1,830 905 (925) $ Pre TSL V Mezzanine 620 289 (331) $ Pre TSLVI Mezzanine 388 207 (181) $ Pre TSL VII Mezzanine 3,987 3,987 - $ Pre TSLVIII Mezzanine 5,980 2,272 (3,708) $ Pre TSL IX Mezzanine 3,000 1,194 (1,806) $ Pre TSL X Mezzanine 4,000 1,572 (2,428) $ Pre TSL XII Mezzanine 10,000 3,878 (6,122) $ Pre TSL XIII Mezzanine 17,540 6,881 (10,659) $ Pre TSL XIV Mezzanine 16,047 6,112 (9,935) $ MMCap I Senior 8,838 7,010 (1,828) $ MMCap I Mezzanine 1,065 541 (524) $ MM Cap IX Mezzanine 20,000 8,020 (11,980) $ Total 97,136 $ 47,080 $ (50,056) $ Unrealized Loss ($ thousands, 12/31/08) Pooled Trust Preferred Securites - Tranche Detail 16 |
 0.97% 0.95% 0.87% 0.78% 0.83% 0.60% 0.70% 0.80% 0.90% 1.00% 2004 2005 2006 2007 2008 11.44% 11.04% 9.63% 7.94% 8.88% 0.0% 2.0% 4.0% 6.0% 8.0% 10.0% 12.0% 14.0% 2004 2005 2006 2007 2008 Improving Profitability Return on Assets Return on Equity (1) ROA and ROE are based on core earnings result (1) (1) 17 |
 Expanding Net Interest Margin The recent shifts in loan and deposit mix has helped meaningfully expand net interest margin Have always fundamentally relied on margin to drive earnings 3.30% 3.28% 3.31% 3.34% 3.57% 3.0% 3.1% 3.2% 3.3% 3.4% 3.5% 3.6% 2004Y 2005Y 2006Y 2007Y 2008Y Net Interest Margin 18 |
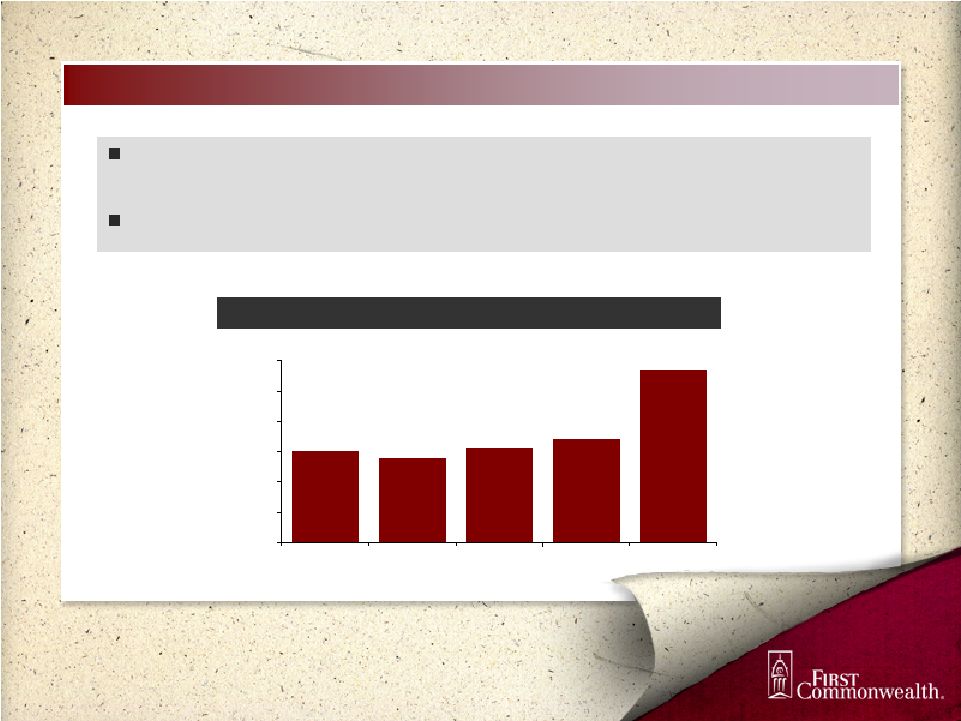
 Revenue Growth Operating Revenue ($ millions) $210.9 $219.5 $210.5 $209.1 $242.9 $190 $200 $210 $220 $230 $240 $250 2004 2005 2006 2007 2008 19 |
 Conclusion Capitalizing on opportunities in the current operating environment Disruptions in our footprint create numerous opportunities Execution is beginning to produce tangible results Strong momentum in “the basics” of consumer banking and commercial lending Free from many of the handcuffs plaguing other banking organizations 20 |
 First Commonwealth Financial Corporation Member NYSE: FCF Old Courthouse Square 22 North Sixth Street Indiana, Pennsylvania 15701 For More Information Contact: Edward J. Lipkus III, Executive Vice President and Chief Financial Officer First Commonwealth Financial Corporation (724) 349-7220 21 |
 Appendix 22 |
 Peer Comparisons 23.3% -51.7% 3.9% 1 Year Total Return First Commonwealth TARP Participants Regional Peers As of December 31, 2008 Source: SNL Financial 23 |
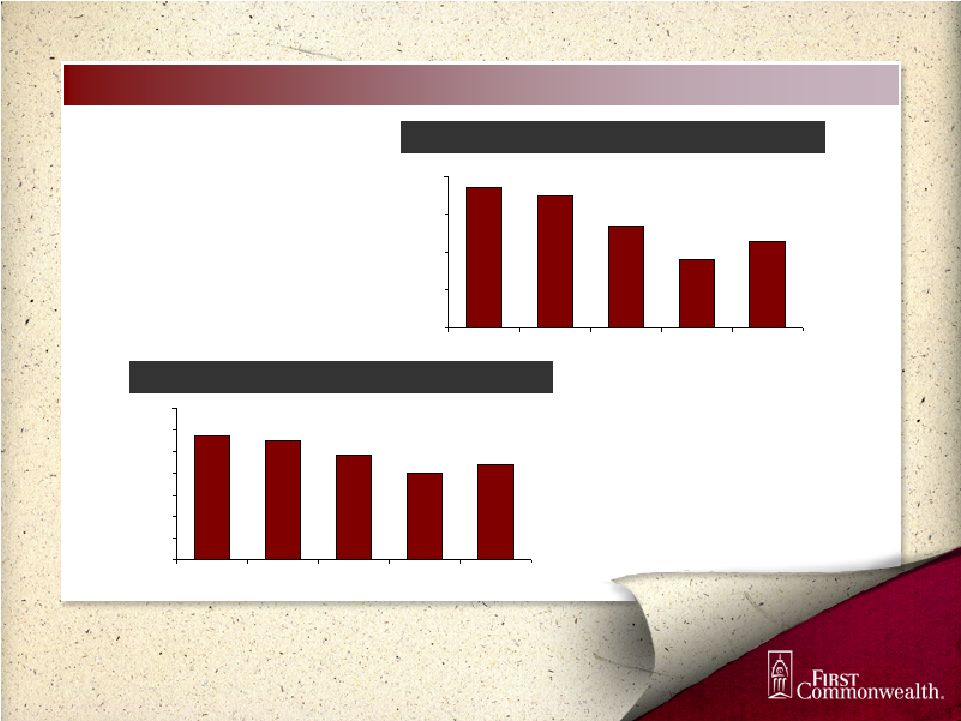
 Peer Comparisons (1/2) Source: SNL Financial 24 40.8% 43.8% 48.6% 50.1% 43.0% 20% 25% 30% 35% 40% 45% 50% 55% 60% 65% 2004 2005 2006 2007 2008 First Commonwealth Financial Corp. Peer Average Percentile (25th) Pecentile (75th) Time Deposits / Total Deposits |
 Peer Comparisons (2/2) Source: SNL Financial 25 DDA & Savings / Total Deposits 59.2% 56.3% 51.5% 49.9% 57.0% 40% 45% 50% 55% 60% 65% 70% 2004 2005 2006 2007 2008 First Commonwealth Financial Corp. Peer Average Percentile (25th) Pecentile (75th) |
 Peer Comparisons Regional Bank Peer Group Community Bank System, Inc. CBU F.N.B. Corporation FNB First Financial Bancorp. FFBC FirstMerit Corporation FMER Fulton Financial Corporation FULT Harleysville National Corporation HNBC National Penn Bancshares, Inc. NPBC NBT Bancorp Inc. NBTB Park National Corporation PRK Provident Bankshares Corporation PBKS S&T Bancorp, Inc. STBA Sun Bancorp, Inc. SNBC Susquehanna Bancshares, Inc. SUSQ United Bankshares, Inc. UBSI WesBanco, Inc. WSBC 26 |
 Shared National Credits Note: These balances include $104.5 million of loans that were granted to SNC clients since the last SNC examination report as of May 5, 2008. 27 Balance Non- Performing Specific Loan Loss Reserve Pennsylvania Real Estate-Commercial $ 0 $ 0 $ 0 Real Estate-Construction 0 0 0 Other Secured 147,183 0 0 Unsecured 71,516 0 0 Total $ 218,699 $ 0 $ 0 Florida Real Estate-Commercial $ 0 $ 0 $ 0 Real Estate-Construction 24,277 6,800 5,300 Other Secured 0 0 0 Unsecured 19,119 0 0 Total $ 43,396 $ 6,800 $ 5,300 Other Real Estate-Commercial $ 5,000 $ 0 $ 0 Real Estate-Construction 36,880 5,015 2,446 Other Secured 43,955 0 0 Unsecured 10,000 0 0 Total $ 95,835 $ 5,015 $ 2,446 Grand Total $ 357,930 $ 11,815 $ 7,746 (dollars in thousands) Shared National Credits (SNC) |
 Reconciliation of GAAP to Non-GAAP 28 GAAP non-interest income Less: net securities (losses) gains Less: gain on sale of branches Core non-interest income GAAP net income Less: net securities (losses) gains (after tax) Less: gain on sale of branches (after tax) Add: merger and related expenses (after tax) Add: (Gain) loss on extinguishment of debt (after tax) Add: restructuring charges (after tax) Add: low income housing partnership impairment (after tax) Core net income 2004 2005 2006 2007 2008 $47,649 $50,225 $44,247 $48,870 $42,831 4,077 (7,673) 697 1,174 (11,494) 11,832 $43,572 $46,066 $43,550 $47,696 $54,325 38,652 57,836 52,954 46,250 43,087 2,650 (4,987) 453 763 (7,471) 7,691 1,381 19,172 (267) 3,534 784 $56,555 $58,666 $52,234 $45,487 $51,342 Reconciliation of GAAP to Non-GAAP (dollars in thousands, except share data) For the Year Ended |
 Notes 29 |