Exhibit 99.1

Investor Presentation JUNE 2018 onelibertyproperties.com
◆ 2 TABLE OF CONTENTS DESCRIPTION PAGE Table of Contents 2 Safe Harbor Disclosure 3 Company Overview 4 Experienced Management Team 5 Attractive Portfolio Fundamentals 6 Portfolio Detail 7 Diversified Portfolio 8 Diversified Tenant Base 9 Financial Summary 10 Targeting Long Term Total Return 11 Growth in Operations 12 - 13 Growth Oriented Balance Sheet 14 Mortgage Debt Maturities 15 Lease Maturity Profile 16 Stable Occupancy 17 Strong Rental Income Growth 18 Acquisition Track Record 19 Recent Acquisitions 20 DESCRIPTION PAGE Recent Dispositions 21 Recent Mortgages 22 Case Studies: Acquisition – Pennsburg, PA 23 Disposition – Greenwood Village, CO 24 Summary 25 APPENDIX Case Studies: Acquisition – Cleveland, OH 27 Acquisition – El Paso, TX 28 Blend and Extend – Office Depot 29 Top Tenant Profiles: Havertys Furniture 31 LA Fitness 32 Northern Tool & Equipment 33 Office Depot 34 Regal Entertainment Group 35 GAAP Reconciliation to FFO & AFFO 36
◆ 3 The statements in this presentation, including targets and assumptions, state the Company’s and management’s hopes, intentions, beliefs, expectations or projections of the future and are forward - looking statements. It is important to note that the Company’s actual results could differ materially from those projected in such forward - looking statements. Factors that could cause actual results to differ materially from current expectations include the key assumptions contained within this presentation, general economic conditions, local real estate conditions, increases in interest rates, tenant defaults, non - renewals and/or bankruptcies, and increases in operating costs and real estate taxes. Additional information concerning factors that could cause actual results to differ materially from those forward - looking statements is contained in the Company’s SEC filings , and in particular the sections of such documents captioned “Risk Factors” and “Management’s Discussion and Analysis of Financial Condition and Results of Operations”. Copies of the SEC filings may be obtained from the Company or the SEC. The Company does not undertake to publicly update or revise any forward - looking statements included in this presentation, whether as a result of new information, future events or otherwise. SAFE HARBOR
◆ 4 Fundamentals – focused real estate company Disciplined track record through various economic cycles Active net lease strategy Experienced management team Alignment of interests through significant insider ownership COMPANY OVERVIEW
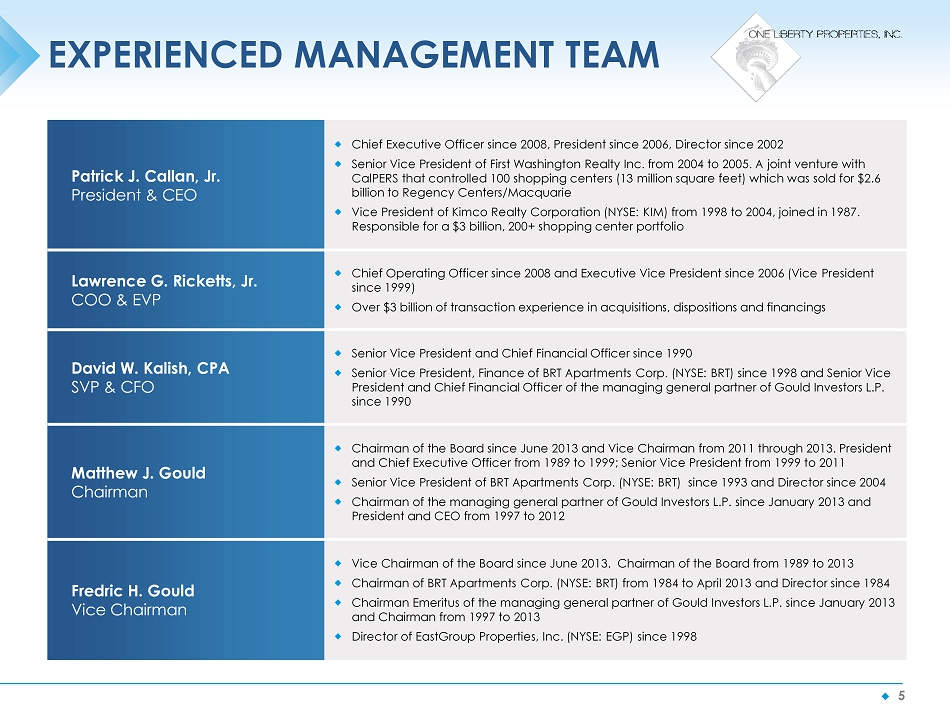
◆ 5 Patrick J. Callan, Jr. President & CEO Chief Executive Officer since 2008, President since 2006, Director since 2002 Senior Vice President of First Washington Realty Inc. from 2004 to 2005. A joint venture with CalPERS that controlled 100 shopping centers (13 million square feet) which was sold for $2.6 billion to Regency Centers/Macquarie Vice President of Kimco Realty Corporation (NYSE: KIM) from 1998 to 2004, joined in 1987. Responsible for a $3 billion, 200+ shopping center portfolio Lawrence G. Ricketts, Jr. COO & EVP Chief Operating Officer since 2008 and Executive Vice President since 2006 (Vice President since 1999) Over $3 billion of transaction experience in acquisitions, dispositions and financings David W. Kalish, CPA SVP & CFO Senior Vice President and Chief Financial Officer since 1990 Senior Vice President, Finance of BRT Apartments Corp. (NYSE: BRT) since 1998 and Senior Vice President and Chief Financial Officer of the managing general partner of Gould Investors L.P. since 1990 Matthew J. Gould Chairman Chairman of the Board since June 2013 and Vice Chairman from 2011 through 2013. President and Chief Executive Officer from 1989 to 1999; Senior Vice President from 1999 to 2011 Senior Vice President of BRT Apartments Corp. (NYSE: BRT) since 1993 and Director since 2004 Chairman of the managing general partner of Gould Investors L.P. since January 2013 and President and CEO from 1997 to 2012 Fredric H. Gould Vice Chairman Vice Chairman of the Board since June 2013. Chairman of the Board from 1989 to 2013 Chairman of BRT Apartments Corp. (NYSE: BRT) from 1984 to April 2013 and Director since 1984 Chairman Emeritus of the managing general partner of Gould Investors L.P. since January 2013 and Chairman from 1997 to 2013 Director of EastGroup Properties, Inc. (NYSE: EGP) since 1998 EXPERIENCED MANAGEMENT TEAM
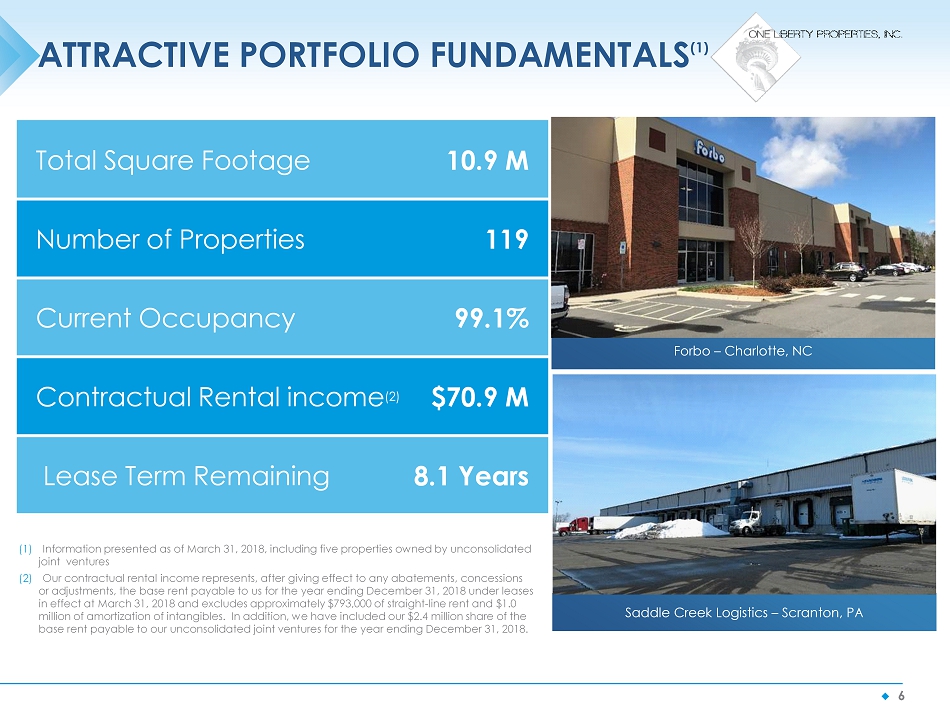
◆ 6 Total Square Footage 10.9 M Number of Properties 119 Current Occupancy 99.1% Contractual Rental income (2) $70.9 M Lease Term Remaining 8.1 Years Forbo – Charlotte, NC Saddle Creek Logistics – Scranton, PA (1) Information presented as of March 31, 2018, including five properties owned by unconsolidated joint ventures (2) Our contractual rental income represents, after giving effect to any abatements, concessions or adjustments, the base rent payable to us for the year ending December 31, 2018 under leases in effect at March 31, 2018 and excludes approximately $793,000 of straight - line rent and $1.0 million of amortization of intangibles. In addition, we have included our $2.4 million share of the base rent payable to our unconsolidated joint ventures for the year ending December 31, 2018. ATTRACTIVE PORTFOLIO FUNDAMENTALS (1)

◆ 7 Type of Property Number of Properties Contractual Rental Income (1) % of Contractual Rental Income Retail – General 39 $ 17,409,545 24.6% – Furniture 14 6,109,004 8.6 – Supermarket 3 2,718,682 3.8 – Office Supply 7 2,406,728 3.4 Industrial 30 26,414,936 37.3 Restaurants 16 3,499,213 4.9 Health & Fitness 3 3,049,876 4.3 Theater 2 (2) 2,402,003 (3) 3.4 Other (4) 5 6,856,707 9.7 119 $70,866,694 100.0% PORTFOLIO DETAIL (1) Our contractual rental income represents, after giving effect to any abatements, concessions or adjustments, the base rent pa yab le to us for the year ending December 31, 2018 under leases in effect at March 31, 2018 and excludes approximately $793,000 of straight - line rent and $1.0 mi llion of amortization of intangibles. In addition, we have included our $2.4 million share of the base rent payable to our unconsolidated joint ventu res for the year ending December 31, 2018. (2) Though we have three theaters, one is part of a multi - tenant shopping center property in Manahawkin, NJ and is therefore exclude d from this column (3) The contractual rental income associated with the theater in Manahawkin, NJ is included (4) Other is comprised of an assisted living facility, an office, and ground leases of apartment complexes
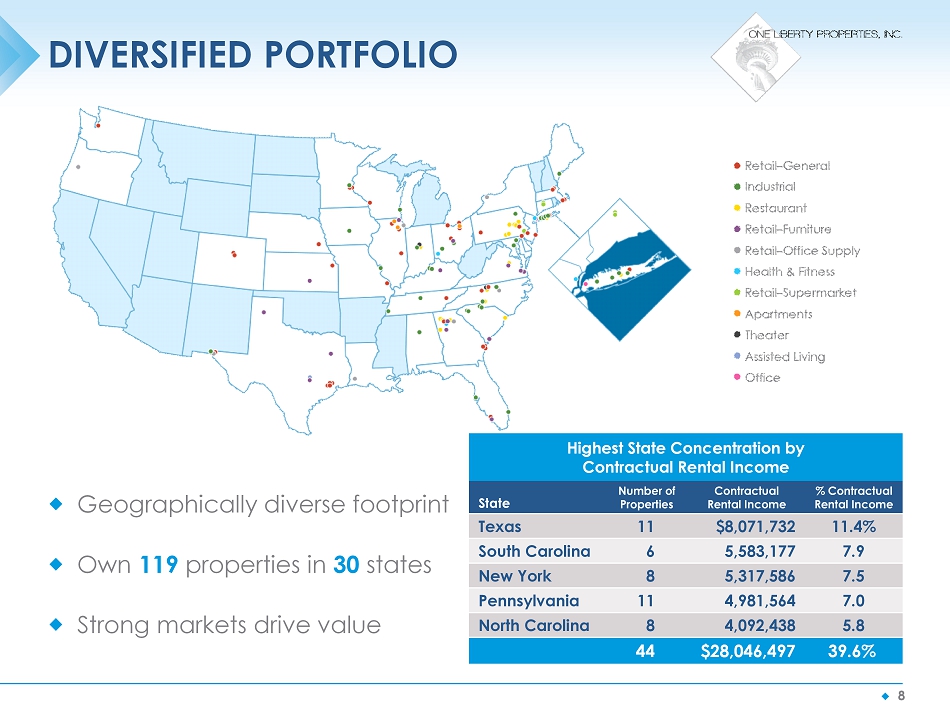
◆ 8 Geographically diverse footprint Own 119 properties in 30 states Strong markets drive value Highest State Concentration by Contractual Rental Income State Number of Properties Contractual Rental Income % Contractual Rental Income Texas 11 $8,071,732 11.4% South Carolina 6 5,583,177 7.9 New York 8 5,317,586 7.5 Pennsylvania 11 4,981,564 7.0 North Carolina 8 4,092,438 5.8 44 $28,046,497 39.6% DIVERSIFIED PORTFOLIO
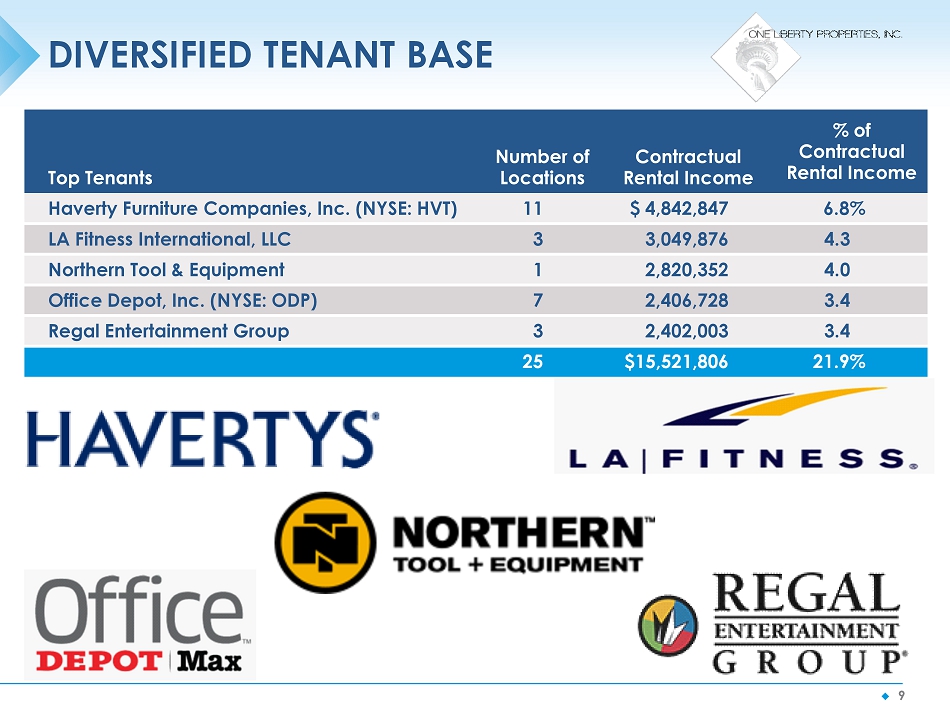
◆ 9 DIVERSIFIED TENANT BASE Top Tenants Number of Locations Contractual Rental Income % of Contractual Rental Income Haverty Furniture Companies, Inc. (NYSE: HVT) 11 $ 4,842,847 6.8% LA Fitness International , LLC 3 3,049,876 4.3 Northern Tool & Equipment 1 2,820,352 4.0 Office Depot, Inc. (NYSE: ODP) 7 2,406,728 3.4 Regal Entertainment Group 3 2,402,003 3.4 25 $15,521,806 21.9%
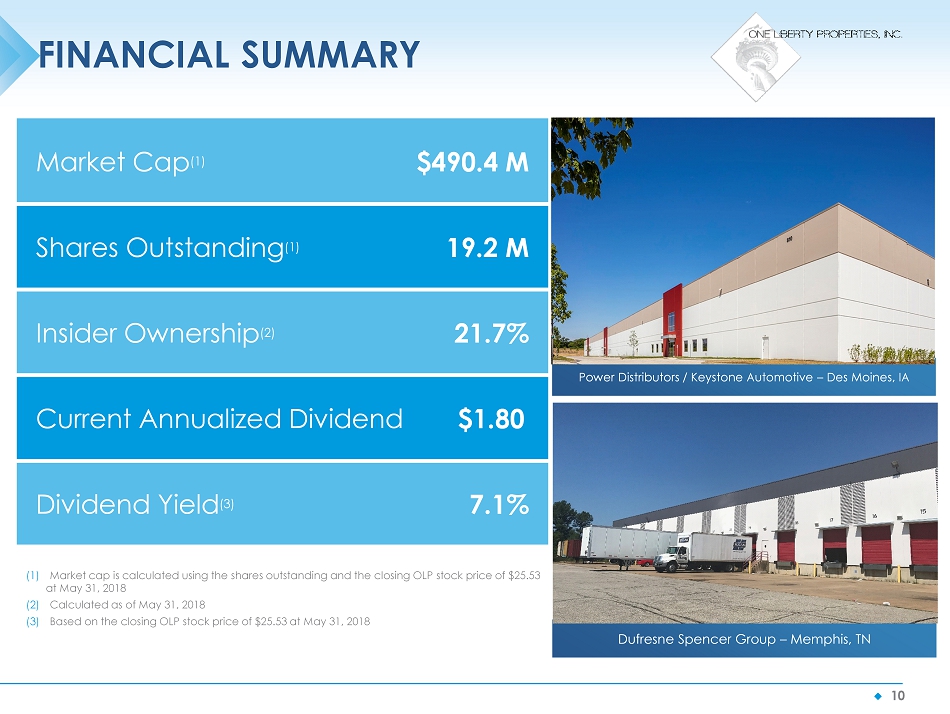
◆ 10 Power Distributors / Keystone Automotive – Des Moines, IA Dufresne Spencer Group – Memphis, TN FINANCIAL SUMMARY Market Cap (1) $ 490.4 M Shares Outstanding (1) 19.2 M Insider Ownership (2) 21.7% Current Annualized Dividend $1.80 Dividend Yield (3) 7.1% (1) Market cap is calculated using the shares outstanding and the closing OLP stock price of $25.53 at May 31, 2018 (2) Calculated as of May 31, 2018 (3) Based on the closing OLP stock price of $25.53 at May 31, 2018
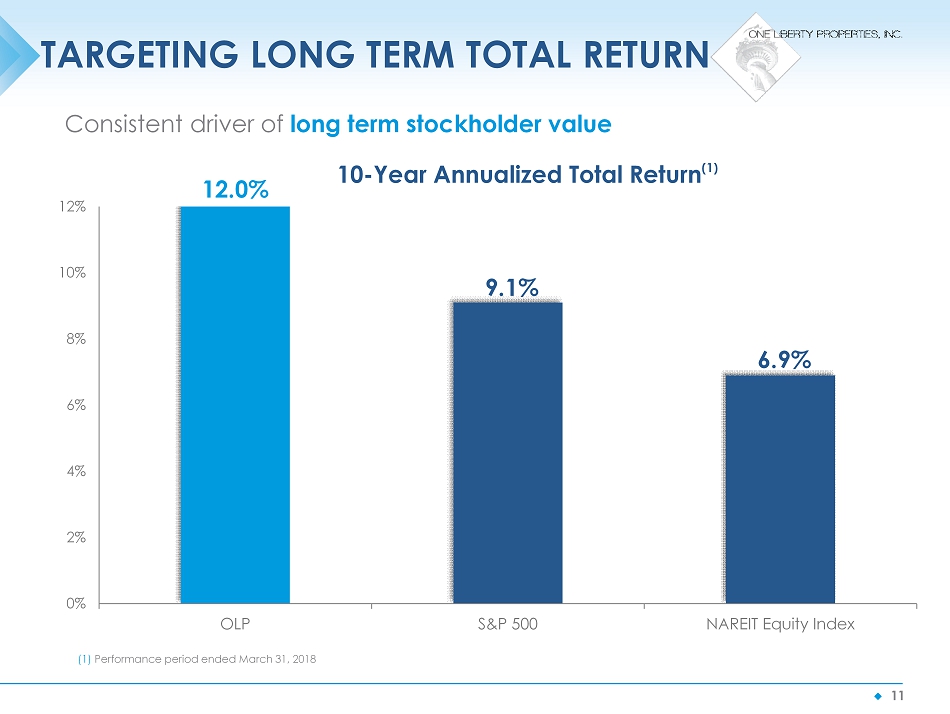
◆ 11 TARGETING LONG TERM TOTAL RETURN Consistent driver of long term stockholder value 12.0% 9.1% 6.9% 0% 2% 4% 6% 8% 10% 12% OLP S&P 500 NAREIT Equity Index 10 - Year Annualized Total Return (1) (1) Performance period ended March 31, 2018
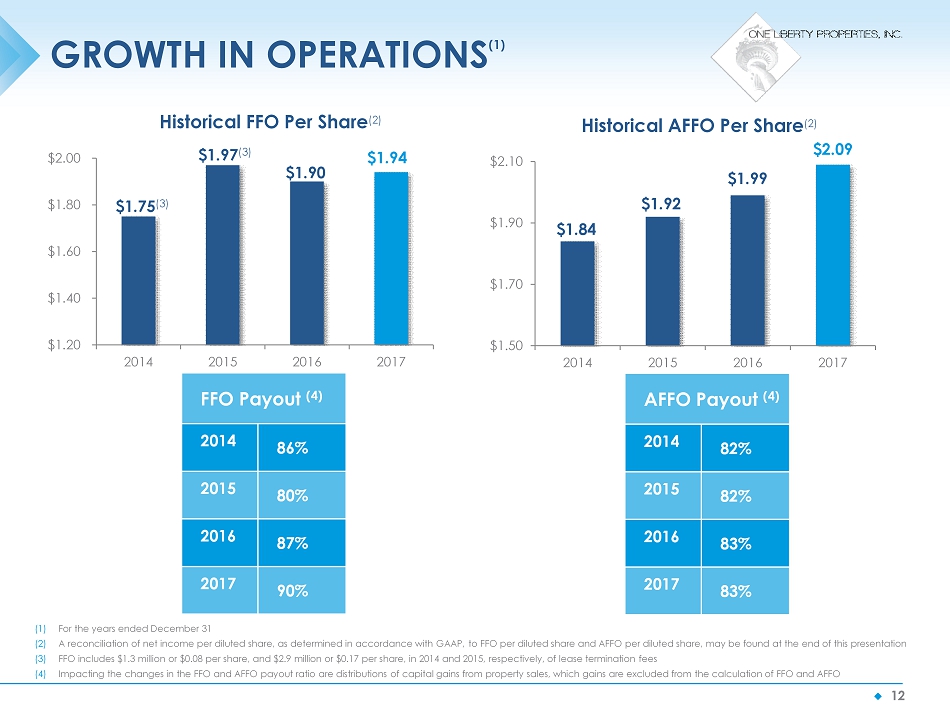
◆ 12 GROWTH IN OPERATIONS (1) $1.75 (3) $1.97 (3) $1.90 $1.94 $1.20 $1.40 $1.60 $1.80 $2.00 2014 2015 2016 2017 Historical FFO Per Share (2) $1.84 $1.92 $1.99 $2.09 $1.50 $1.70 $1.90 $2.10 2014 2015 2016 2017 Historical AFFO Per Share (2) (1) For the years ended December 31 (2) A reconciliation of net income per diluted share, as determined in accordance with GAAP, to FFO per diluted share and AFFO pe r d iluted share, may be found at the end of this presentation (3) FFO includes $1.3 million or $0.08 per share, and $2.9 million or $0.17 per share, in 2014 and 2015, respectively, of lease t erm ination fees (4) Impacting the changes in the FFO and AFFO payout ratio are distributions of capital gains from property sales, which gains are excluded from the calculation of FFO and AFFO FFO Payout (4) 2014 86% 2015 80% 2016 87% 2017 90% AFFO Payout (4) 2014 82% 2015 82% 2016 83% 2017 83%
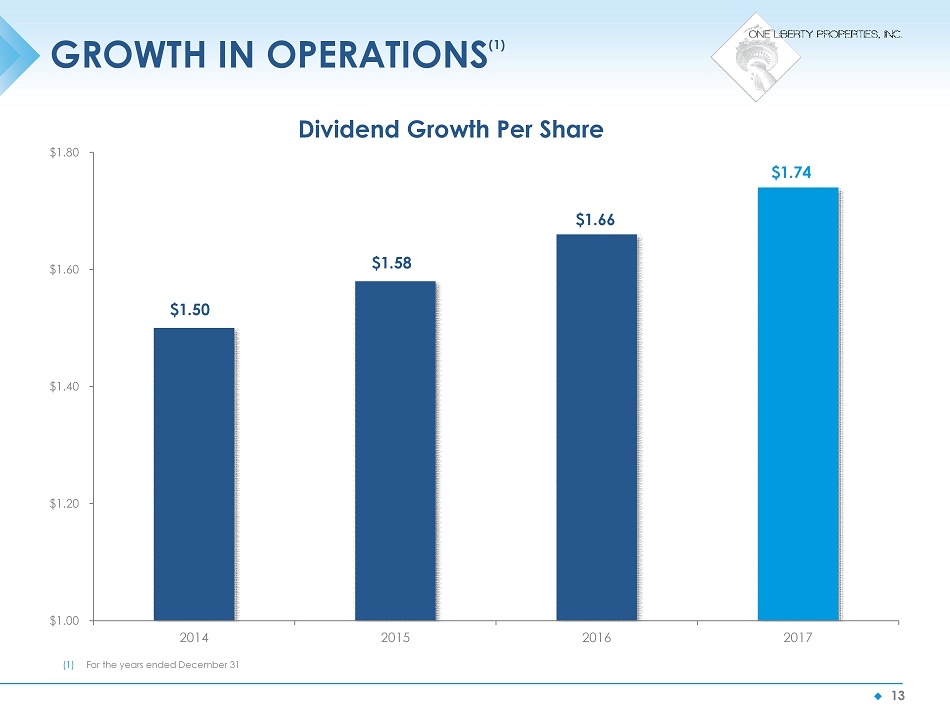
◆ 13 GROWTH IN OPERATIONS (1) $1.50 $1.58 $1.66 $1.74 $1.00 $1.20 $1.40 $1.60 $1.80 2014 2015 2016 2017 Dividend Growth Per Share (1) For the years ended December 31
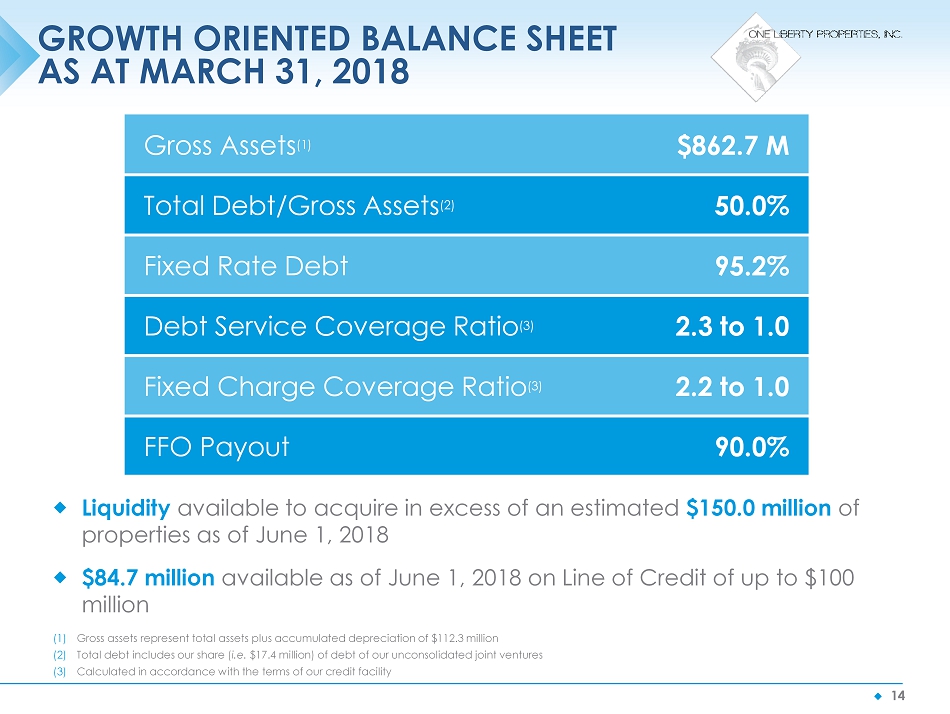
◆ 14 GROWTH ORIENTED BALANCE SHEET AS AT MARCH 31, 2018 Gross Assets (1) $862.7 M Total Debt/Gross Assets (2) 50.0% Fixed Rate Debt 95.2% Debt Service Coverage Ratio (3) 2.3 to 1.0 Fixed Charge Coverage Ratio (3) 2.2 to 1.0 FFO Payout 90.0% Liquidity available to acquire in excess of an estimated $150.0 million of properties as of June 1, 2018 $84.7 million available as of June 1, 2018 on Line of Credit of up to $100 million (1) Gross assets represent total assets plus accumulated depreciation of $112.3 million (2) Total debt includes our share ( i.e. $17.4 million) of debt of our unconsolidated joint ventures (3) Calculated in accordance with the terms of our credit facility
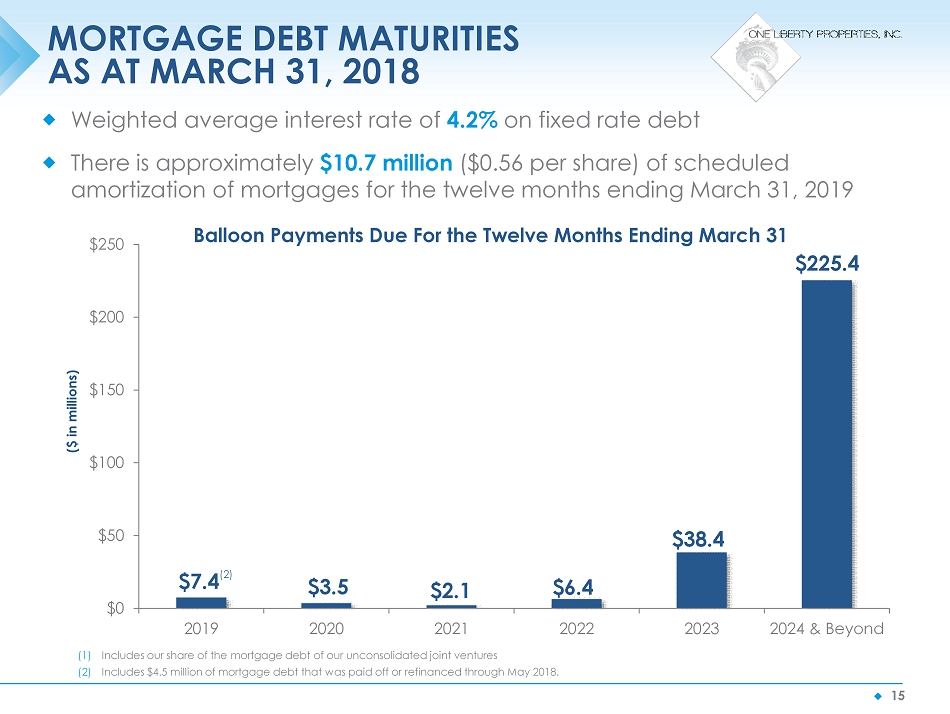
◆ 15 MORTGAGE DEBT MATURITIES AS AT MARCH 31, 2018 Weighted average interest rate of 4.2% on fixed rate debt There is approximately $10.7 million ($ 0.56 per share) of scheduled amortization of mortgages for the twelve months ending March 31, 2019 $7.4 (2) $3.5 $2.1 $6.4 $38.4 $225.4 $0 $50 $100 $150 $200 $250 2019 2020 2021 2022 2023 2024 & Beyond ($ in millions) Balloon Payments Due For the Twelve Months Ending March 31 (1) Includes our share of the mortgage debt of our unconsolidated joint ventures (2) Includes $4.5 million of mortgage debt that was paid off or refinanced through May 2018.
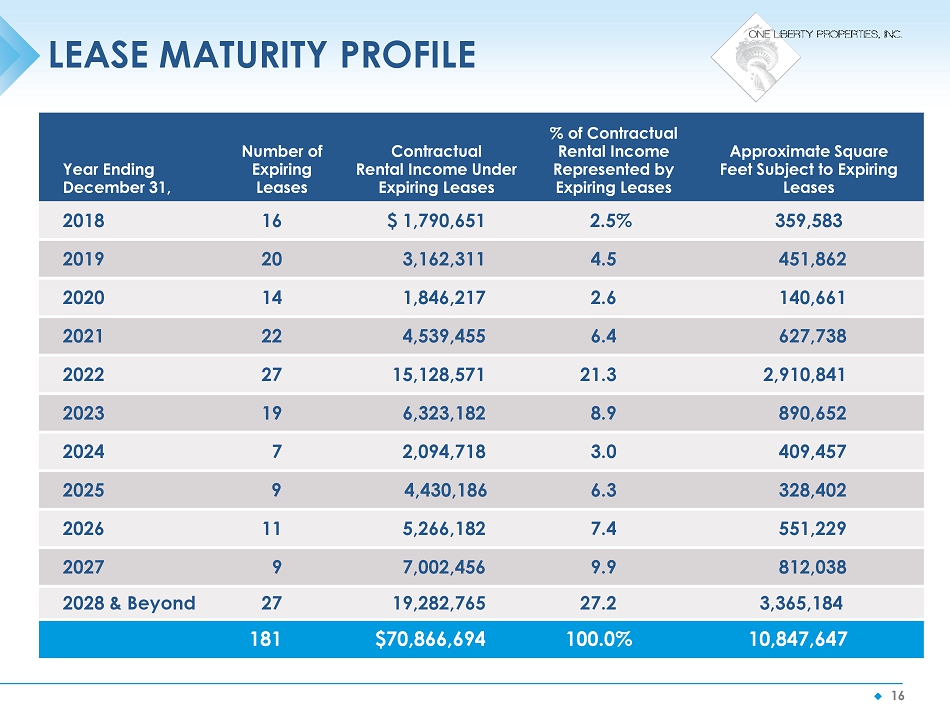
◆ 16 LEASE MATURITY PROFILE (1) Our contractual rental income represents, after giving effect to any abatements, concessions or adjustments, the base rent pa yab le to us for the year ending December 31, 2018 under leases in effect at March 31, 2018 and excludes approximately $793,000 of straight - line rent and $1.0 mi llion of amortization of intangibles. In addition, we have included our $2.4 million share of the base rent payable to our unconsolidated joint ventu res for the year ending December 31, 2018. (2) Though we have three theaters, one is part of a multi - tenant shopping center property in Manahawkin, NJ and is therefore exclude d from this column (3) The contractual rental income associated with the theater in Manahawkin, NJ is included in this row Year Ending December 31 , Number of Expiring Leases Contractual Rental Income Under Expiring Leases % of Contractual Rental Income Represented by Expiring Leases Approximate Square Feet Subject to Expiring Leases 2018 16 $ 1,790,651 2.5% 359,583 2019 20 3,162,311 4.5 451,862 2020 14 1,846,217 2.6 140,661 2021 22 4,539,455 6.4 627,738 2022 27 15,128,571 21.3 2,910,841 2023 19 6,323,182 8.9 890,652 2024 7 2,094,718 3.0 409,457 2025 9 4,430,186 6.3 328,402 2026 11 5,266,182 7.4 551,229 2027 9 7,002,456 9.9 812,038 2028 & Beyond 27 19,282,765 27.2 3,365,184 181 $70,866,694 100.0% 10,847,647
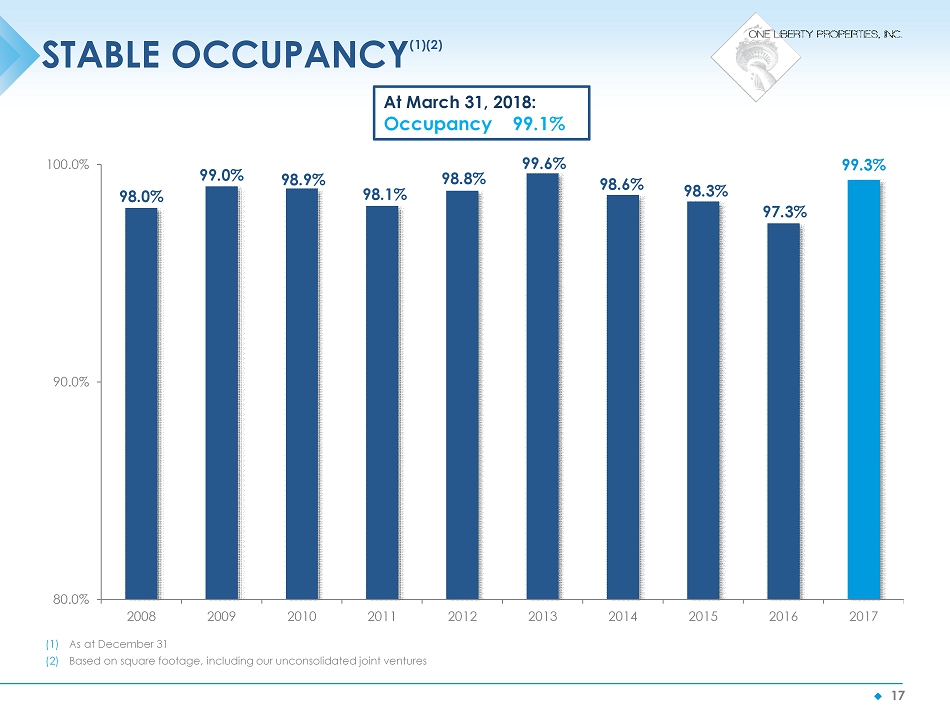
◆ 17 STABLE OCCUPANCY (1)(2) 98.0% 99.0% 98.9% 98.1% 98.8% 99.6% 98.6% 98.3% 97.3% 99.3% 80.0% 90.0% 100.0% 2008 2009 2010 2011 2012 2013 2014 2015 2016 2017 (1) As at December 31 (2) Based on square footage, including our unconsolidated joint ventures At March 31, 2018: Occupancy 99.1%
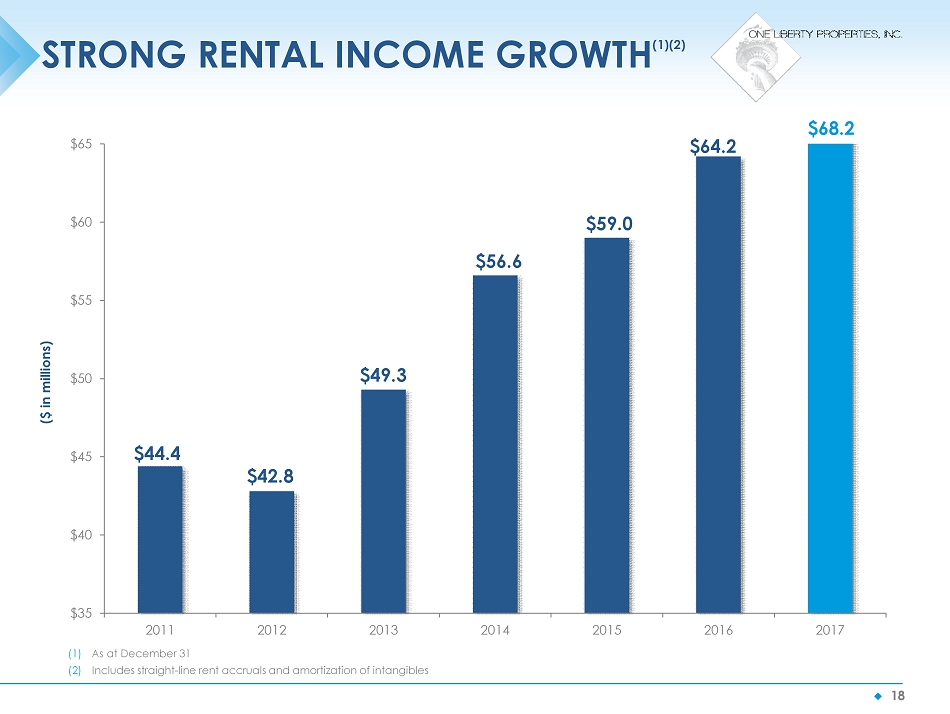
◆ 18 STRONG RENTAL INCOME GROWTH (1 )(2) $44.4 $42.8 $49.3 $56.6 $59.0 $64.2 $68.2 $35 $40 $45 $50 $55 $60 $65 2011 2012 2013 2014 2015 2016 2017 ($ in millions) (1) As at December 31 (2) Includes straight - line rent accruals and amortization of intangibles
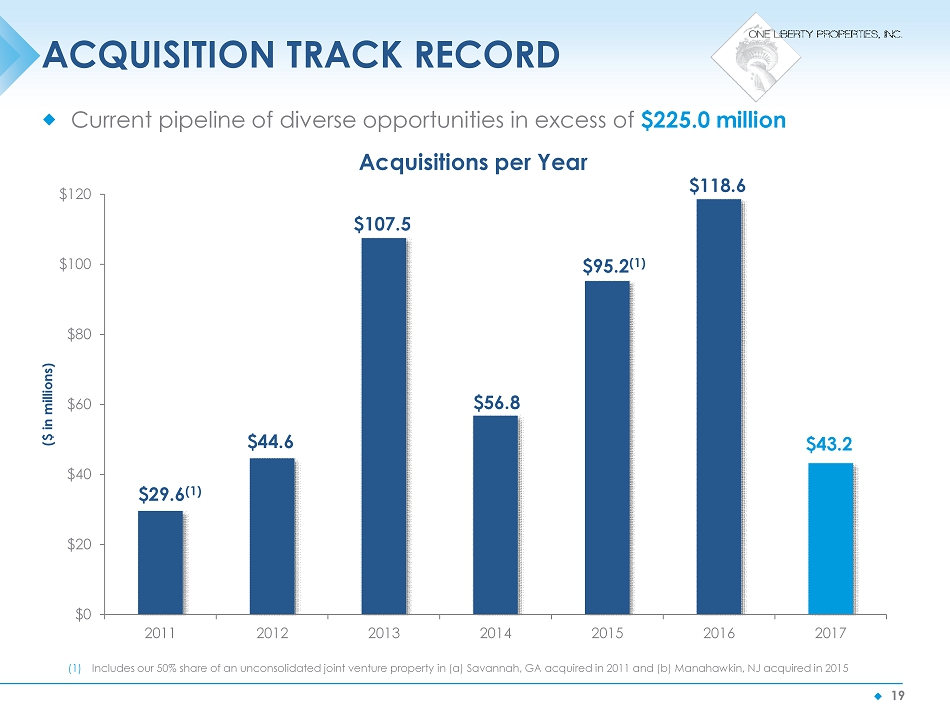
◆ 19 ACQUISITION TRACK RECORD Current pipeline of diverse opportunities in excess of $225.0 million $29.6 (1) $44.6 $107.5 $56.8 $95.2 (1) $118.6 $43.2 $0 $20 $40 $60 $80 $100 $120 2011 2012 2013 2014 2015 2016 2017 ($ in millions) Acquisitions per Year (1) Includes our 50% share of an unconsolidated joint venture property in (a) Savannah, GA acquired in 2011 and (b) Manahawkin, N J a cquired in 2015
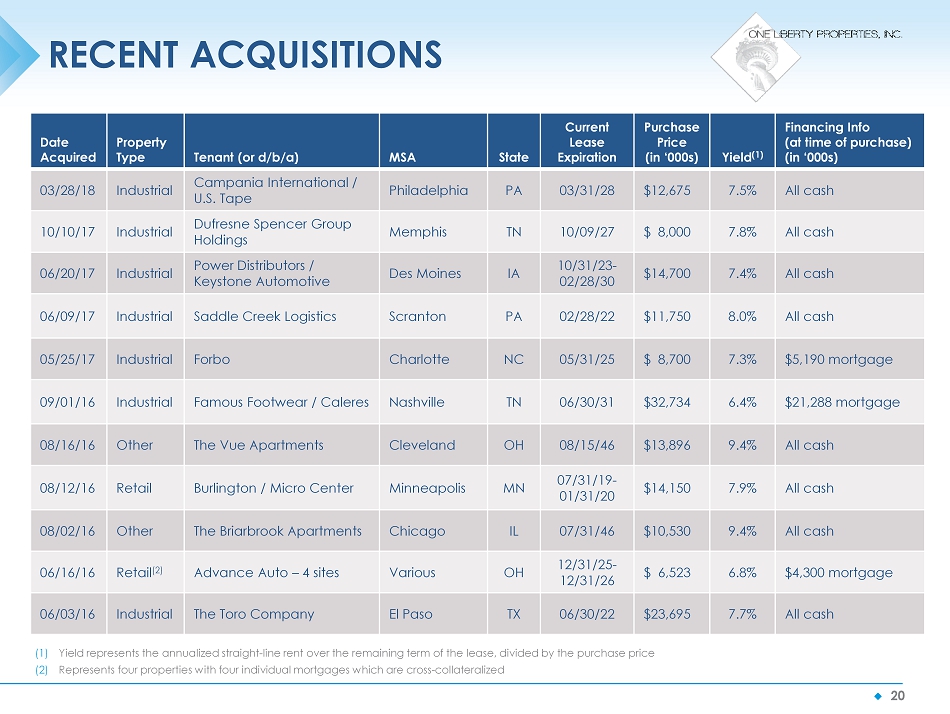
◆ 20 RECENT ACQUISITIONS Date Acquired Property Type Tenant (or d/b/a) MSA State Current Lease Expiration Purchase Price (in ‘000s) Yield (1) Financing Info (at time of purchase) (in ‘000s) 03/28/18 Industrial Campania International / U.S. Tape Philadelphia PA 03/31/28 $12,675 7.5% All cash 10/10/17 Industrial Dufresne Spencer Group Holdings Memphis TN 10/09/27 $ 8,000 7.8% All cash 06/20/17 Industrial Power Distributors / Keystone Automotive Des Moines IA 10/31/23 - 02/28/30 $14,700 7.4% All cash 06/09/17 Industrial Saddle Creek Logistics Scranton PA 02/28/22 $11,750 8.0% All cash 05/25/17 Industrial Forbo Charlotte NC 05/31/25 $ 8,700 7.3% $5,190 mortgage 09/01/16 Industrial Famous Footwear / Caleres Nashville TN 06/30/31 $32,734 6.4% $21,288 mortgage 08/16/16 Other The Vue Apartments Cleveland OH 08/15/46 $13,896 9.4% All cash 08/12/16 Retail Burlington / Micro Center Minneapolis MN 07/31/19 - 01/31/20 $14,150 7.9% All cash 08/02/16 Other The Briarbrook Apartments Chicago IL 07/31/46 $10,530 9.4% All cash 06/16/16 Retail (2) Advance Auto – 4 sites Various OH 12/31/25 - 12/31/26 $ 6,523 6.8% $4,300 mortgage 06/03/16 Industrial The Toro Company El Paso TX 06/30/22 $23,695 7.7% All cash (1) Yield represents the annualized straight - line rent over the remaining term of the lease, divided by the purchase price (2) Represents four properties with four individual mortgages which are cross - collateralized
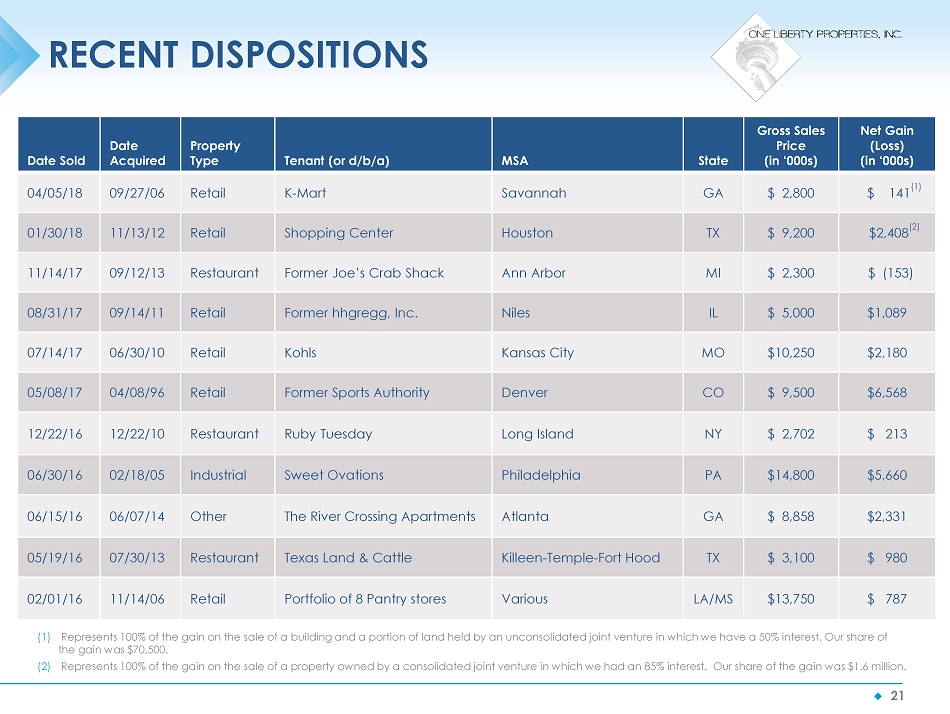
◆ 21 RECENT DISPOSITIONS Date Sold Date Acquired Property Type Tenant (or d/b/a) MSA State Gross Sales Price (in ‘000s) Net Gain (Loss) (in ‘000s) 04/05/18 09/27/06 Retail K - Mart Savannah GA $ 2,800 $ 141 (1) 01/30/18 11/13/12 Retail Shopping Center Houston TX $ 9,200 $2,408 (2) 11/14/17 09/12/13 Restaurant Former Joe’s Crab Shack Ann Arbor MI $ 2,300 $ (153) 08/31/17 09/14/11 Retail Former hhgregg, Inc. Niles IL $ 5,000 $1,089 07/14/17 06/30/10 Retail Kohls Kansas City MO $10,250 $2,180 05/08/17 04/08/96 Retail Former Sports Authority Denver CO $ 9,500 $6,568 12/22/16 12/22/10 Restaurant Ruby Tuesday Long Island NY $ 2,702 $ 213 06/30/16 02/18/05 Industrial Sweet Ovations Philadelphia PA $14,800 $5,660 06/15/16 06/07/14 Other The River Crossing Apartments Atlanta GA $ 8,858 $2,331 05/19/16 07/30/13 Restaurant Texas Land & Cattle Killeen - Temple - Fort Hood TX $ 3,100 $ 980 02/01/16 11/14/06 Retail Portfolio of 8 Pantry stores Various LA/MS $13,750 $ 787 (1) Represents 100% of the gain on the sale of a building and a portion of land held by an unconsolidated joint venture in which we have a 50% interest. Our share of the gain was $70,500. (2) Represents 100% of the gain on the sale of a property owned by a consolidated joint venture in which we had an 85% interest. Ou r share of the gain was $1.6 million.
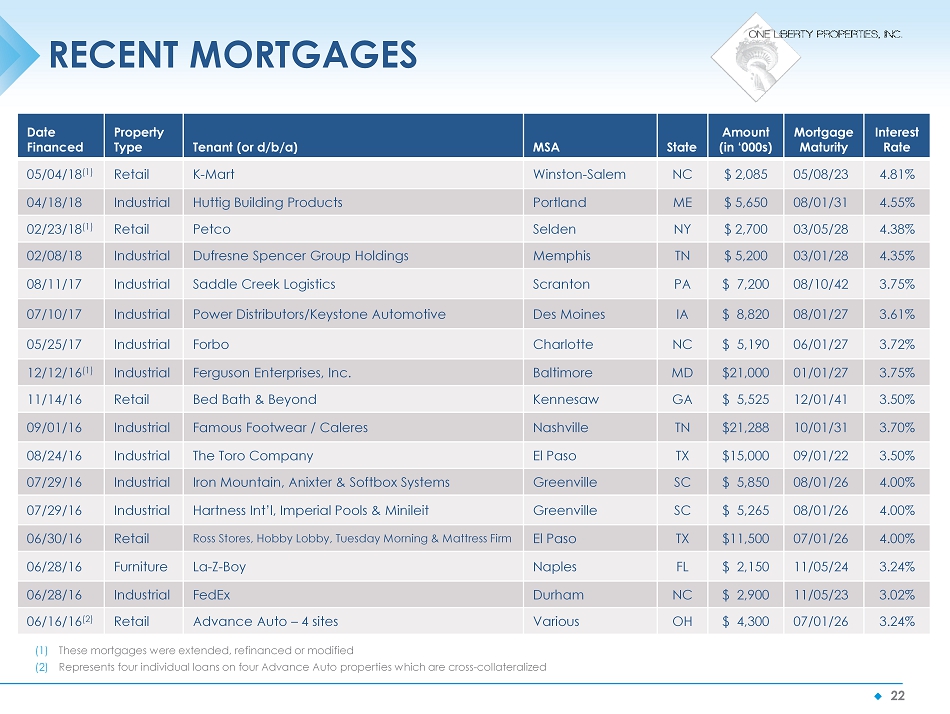
◆ 22 RECENT MORTGAGES Date Financed Property Type Tenant (or d/b/a) MSA State Amount (in ‘000s) Mortgage Maturity Interest Rate 05/04/18 (1) Retail K - Mart Winston - Salem NC $ 2,085 05/08/23 4.81% 04/18/18 Industrial Huttig Building Products Portland ME $ 5,650 08/01/31 4.55% 02/23/18 (1) Retail Petco Selden NY $ 2,700 03/05/28 4.38% 02/08/18 Industrial Dufresne Spencer Group Holdings Memphis TN $ 5,200 03/01/28 4.35% 08/11/17 Industrial Saddle Creek Logistics Scranton PA $ 7,200 08/10/42 3.75% 07/10/17 Industrial Power Distributors/Keystone Automotive Des Moines IA $ 8,820 08/01/27 3.61% 05/25/17 Industrial Forbo Charlotte NC $ 5,190 06/01/27 3.72% 12/12/16 (1) Industrial Ferguson Enterprises, Inc. Baltimore MD $21,000 01/01/27 3.75% 11/14/16 Retail Bed Bath & Beyond Kennesaw GA $ 5,525 12/01/41 3.50% 09/01/16 Industrial Famous Footwear / Caleres Nashville TN $21,288 10/01/31 3.70% 08/24/16 Industrial The Toro Company El Paso TX $15,000 09/01/22 3.50% 07/29/16 Industrial Iron Mountain, Anixter & Softbox Systems Greenville SC $ 5,850 08/01/26 4.00% 07/29/16 Industrial Hartness Int’l, Imperial Pools & Minileit Greenville SC $ 5,265 08/01/26 4.00% 06/30/16 Retail Ross Stores, Hobby Lobby, Tuesday Morning & Mattress Firm El Paso TX $11,500 07/01/26 4.00% 06/28/16 Furniture La - Z - Boy Naples FL $ 2,150 11/05/24 3.24% 06/28/16 Industrial FedEx Durham NC $ 2,900 11/05/23 3.02% 06/16/16 (2) Retail Advance Auto – 4 sites Various OH $ 4,300 07/01/26 3.24% (1) These mortgages were extended, refinanced or modified (2) Represents four individual loans on four Advance Auto properties which are cross - collateralized
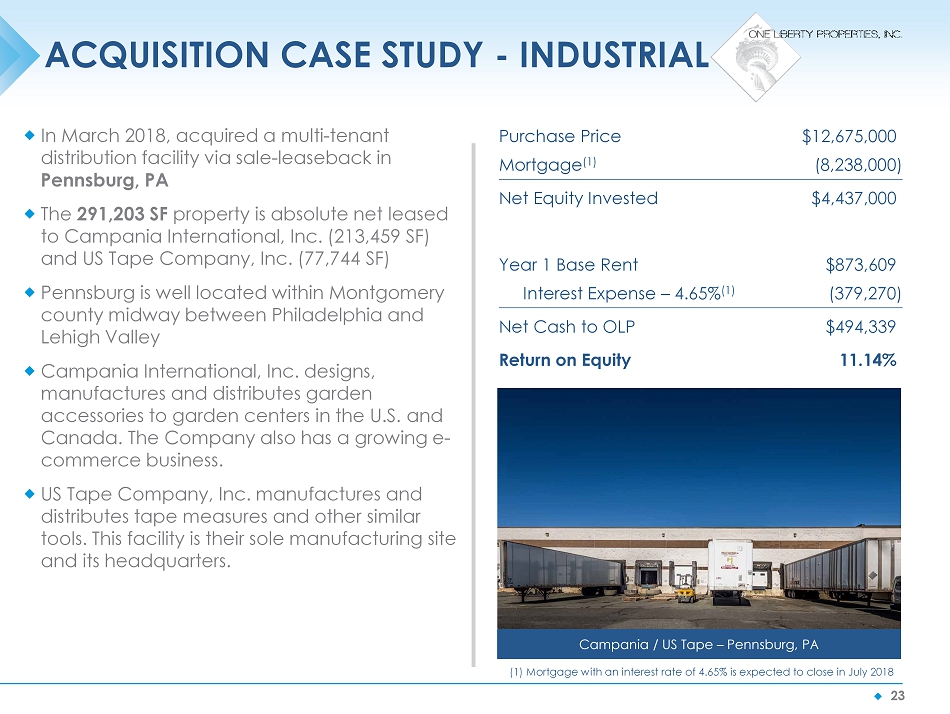
◆ 23 ACQUISITION CASE STUDY - INDUSTRIAL In March 2018, acquired a multi - tenant distribution facility via sale - leaseback in Pennsburg, PA The 291,203 SF property is absolute net leased to Campania International, Inc. (213,459 SF) and US Tape Company, Inc. (77,744 SF ) Pennsburg is well located within Montgomery county midway between Philadelphia and Lehigh Valley Campania International, Inc. designs, manufactures and distributes garden accessories to garden centers in the U.S. and Canada. The Company also has a growing e - commerce business. US Tape Company, Inc. manufactures and distributes tape measures and other similar tools. This facility is their sole manufacturing site and its headquarters. Purchase Price $12,675,000 Mortgage (1) (8,238,000) Net Equity Invested $4,437,000 Year 1 Base Rent $873,609 Interest Expense – 4.65% (1) ( 379,270) Net Cash to OLP $ 494,339 Return on Equity 11.14% Campania / US Tape – Pennsburg, PA (1) Mortgage with an interest rate of 4.65% is expected to close in July 2018
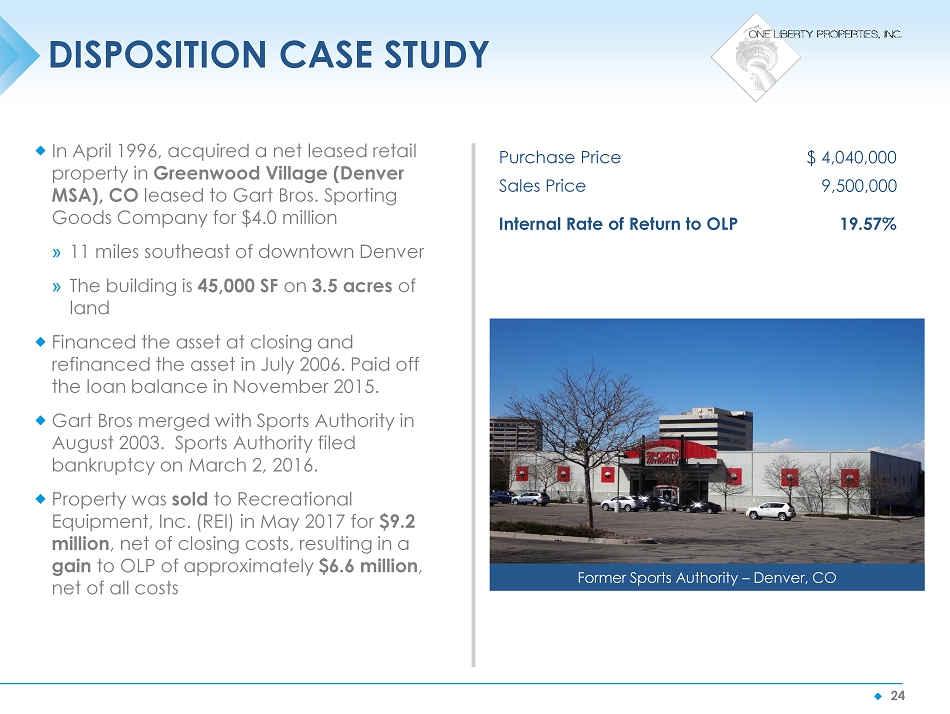
◆ 24 DISPOSITION CASE STUDY In April 1996, acquired a net leased retail property in Greenwood Village (Denver MSA), CO leased to Gart Bros. Sporting Goods Company for $4.0 million » 11 miles southeast of downtown Denver » The building is 45,000 SF on 3.5 acres of land Financed the asset at closing and refinanced the asset in July 2006. Paid off the loan balance in November 2015. Gart Bros merged with Sports Authority in August 2003. Sports Authority filed bankruptcy on March 2, 2016. Property was sold to Recreational Equipment, Inc. (REI) in May 2017 for $9.2 million , net of closing costs, resulting in a gain to OLP of approximately $6.6 million , net of all costs Purchase Price $ 4,040,000 Sales Price 9,500,000 Internal Rate of Return to OLP 19.57% Former Sports Authority – Denver, CO
◆ 25 Fundamentals – focused real estate company Disciplined track record through various economic cycles Active net lease strategy Experienced management team Alignment of interests through significant insider ownership SUMMARY – WHY OLP?
APPENDIX
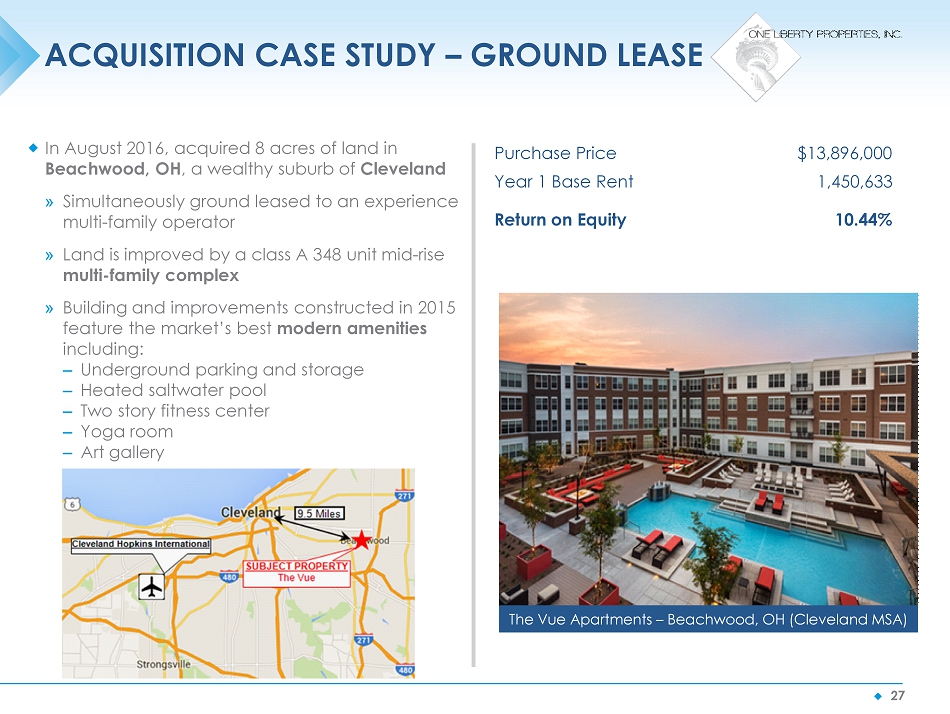
◆ 27 ACQUISITION CASE STUDY – GROUND LEASE In August 2016, acquired 8 acres of land in Beachwood, OH , a wealthy suburb of Cleveland » Simultaneously ground leased to an experience multi - family operator » Land is improved by a class A 348 unit mid - rise multi - family complex » Building and improvements constructed in 2015 feature the market’s best modern amenities including: – Underground parking and storage – Heated saltwater pool – Two story fitness center – Yoga room – Art gallery Purchase Price $13,896,000 Year 1 Base Rent 1,450,633 Return on Equity 10.44% The Vue Apartments – Beachwood, OH (Cleveland MSA)
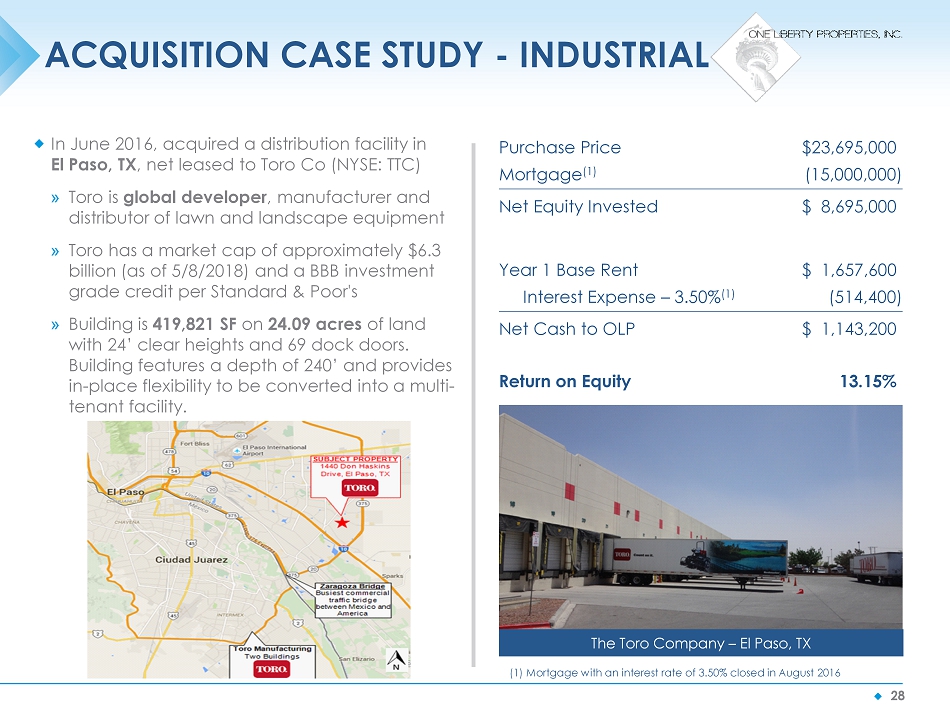
◆ 28 ACQUISITION CASE STUDY - INDUSTRIAL In June 2016, acquired a distribution facility in El Paso, TX , net leased to Toro Co (NYSE: TTC) » Toro is global developer , manufacturer and distributor of lawn and landscape equipment » Toro has a market cap of approximately $6.3 billion (as of 5/8/2018) and a BBB investment grade credit per Standard & Poor's » Building is 419,821 SF on 24.09 acres of land with 24’ clear heights and 69 dock doors. Building features a depth of 240’ and provides in - place flexibility to be converted into a multi - tenant facility. Purchase Price $23,695,000 Mortgage (1) (15,000,000) Net Equity Invested $ 8,695,000 Year 1 Base Rent $ 1,657,600 Interest Expense – 3.50% (1) (514,400) Net Cash to OLP $ 1,143,200 Return on Equity 13.15% The Toro Company – El Paso, TX (1) Mortgage with an interest rate of 3.50% closed in August 2016
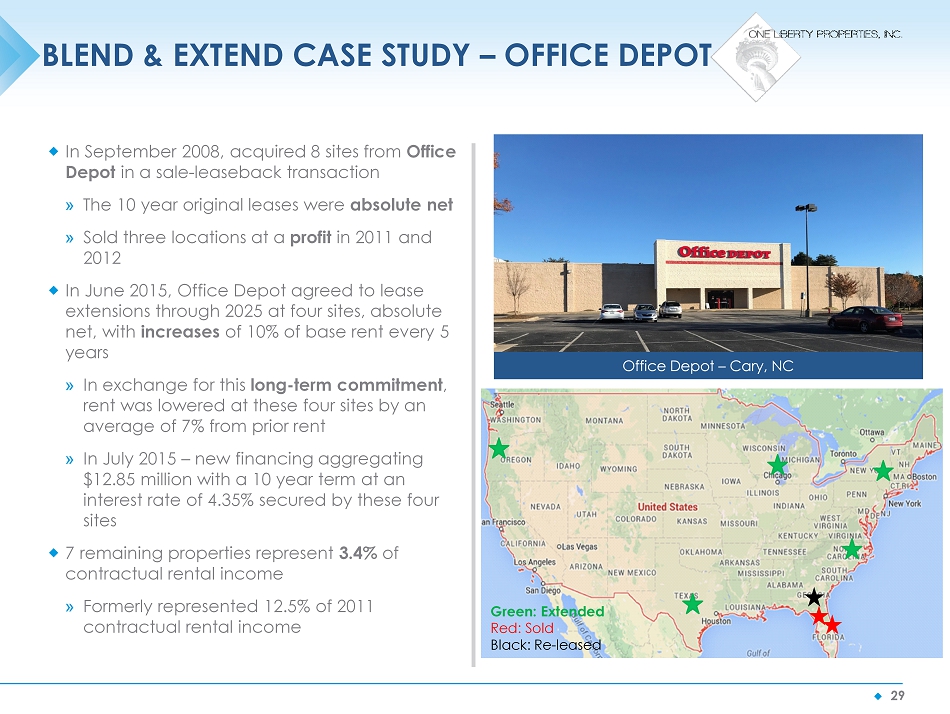
◆ 29 BLEND & EXTEND CASE STUDY – OFFICE DEPOT In September 2008, acquired 8 sites from Office Depot in a sale - leaseback transaction » The 10 year original leases were absolute net » Sold three locations at a profit in 2011 and 2012 In June 2015, Office Depot agreed to lease extensions through 2025 at four sites, absolute net, with increases of 10% of base rent every 5 years » In exchange for this long - term commitment , rent was lowered at these four sites by an average of 7% from prior rent » In July 2015 – new financing aggregating $12.85 million with a 10 year term at an interest rate of 4.35% secured by these four sites 7 remaining properties represent 3.4% of contractual rental income » Formerly represented 12.5% of 2011 contractual rental income Office Depot – Cary, NC Green: Extended Red: Sold Black: Re - leased
TOP TENANTS’ PROFILES
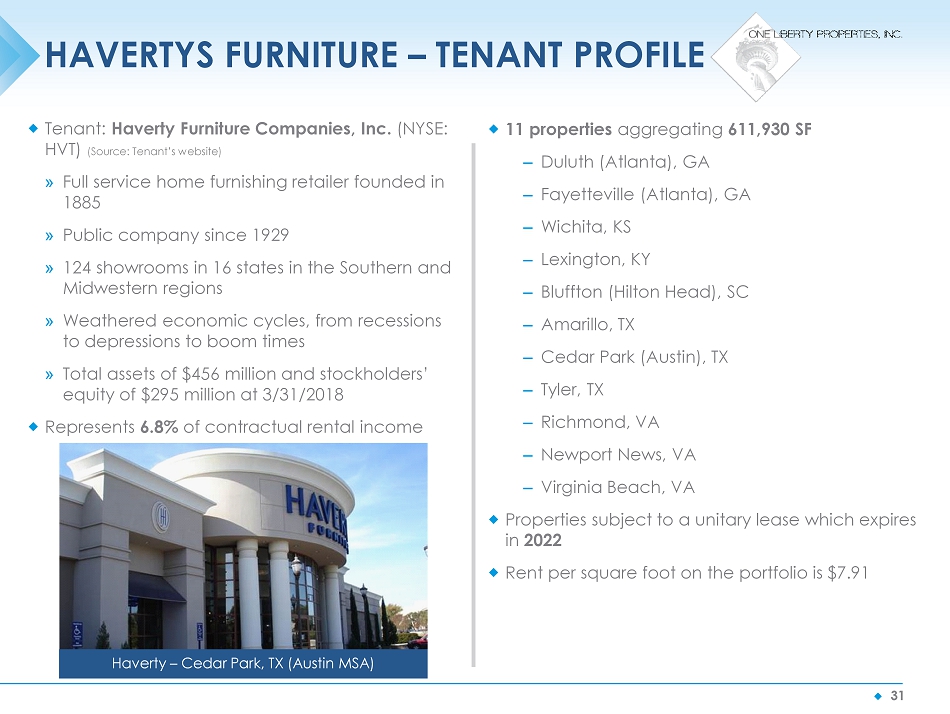
◆ 31 HAVERTYS FURNITURE – TENANT PROFILE Tenant: Haverty Furniture Companies, Inc. (NYSE: HVT) (Source: Tenant’s website) » Full service home furnishing retailer founded in 1885 » Public company since 1929 » 124 showrooms in 16 states in the Southern and Midwestern regions » Weathered economic cycles, from recessions to depressions to boom times » Total assets of $456 million and stockholders’ equity of $295 million at 3/31/2018 Represents 6.8% of contractual rental income Haverty – Cedar Park, TX (Austin MSA) 11 properties aggregating 611,930 SF – Duluth (Atlanta), GA – Fayetteville (Atlanta), GA – Wichita, KS – Lexington, KY – Bluffton (Hilton Head), SC – Amarillo, TX – Cedar Park (Austin), TX – Tyler, TX – Richmond, VA – Newport News, VA – Virginia Beach, VA Properties subject to a unitary lease which expires in 2022 Rent per square foot on the portfolio is $7.91
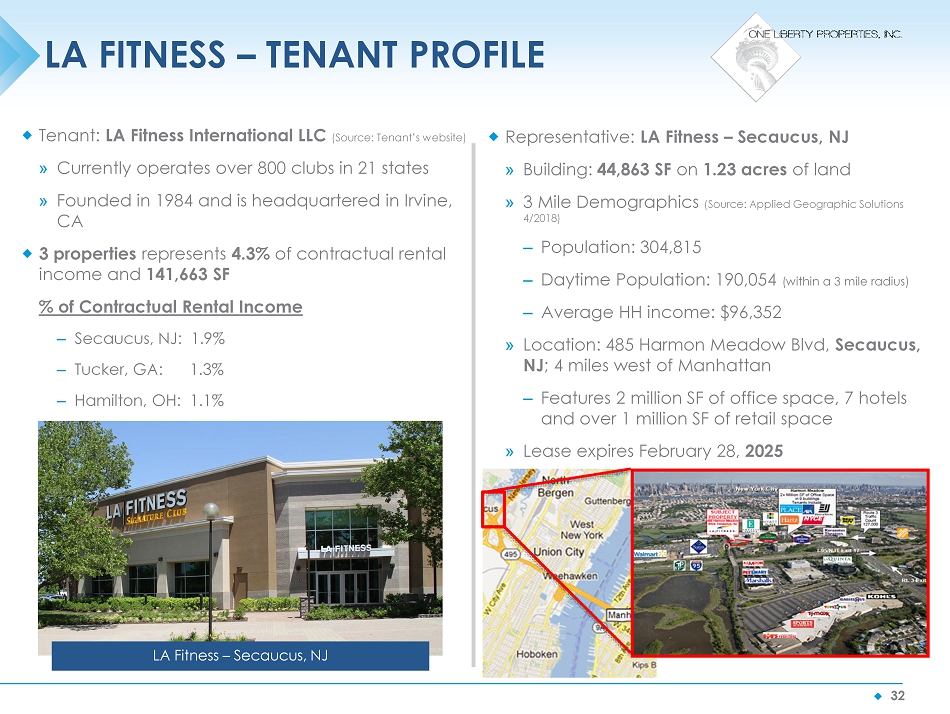
◆ 32 LA FITNESS – TENANT PROFILE Tenant: LA Fitness International LLC (Source: Tenant’s website) » Currently operates over 800 clubs in 21 states » Founded in 1984 and is headquartered in Irvine, CA 3 properties represents 4.3% of contractual rental income and 141,663 SF % of Contractual Rental Income – Secaucus, NJ: 1.9% – Tucker, GA: 1.3% – Hamilton, OH: 1.1% LA Fitness – Secaucus, NJ Representative: LA Fitness – Secaucus, NJ » Building: 44,863 SF on 1.23 acres of land » 3 Mile Demographics (Source: Applied Geographic Solutions 4/2018) – Population: 304,815 – Daytime Population: 190,054 (within a 3 mile radius) – Average HH income: $96,352 » Location: 485 Harmon Meadow Blvd, Secaucus, NJ ; 4 miles west of Manhattan – Features 2 million SF of office space, 7 hotels and over 1 million SF of retail space » Lease expires February 28, 2025
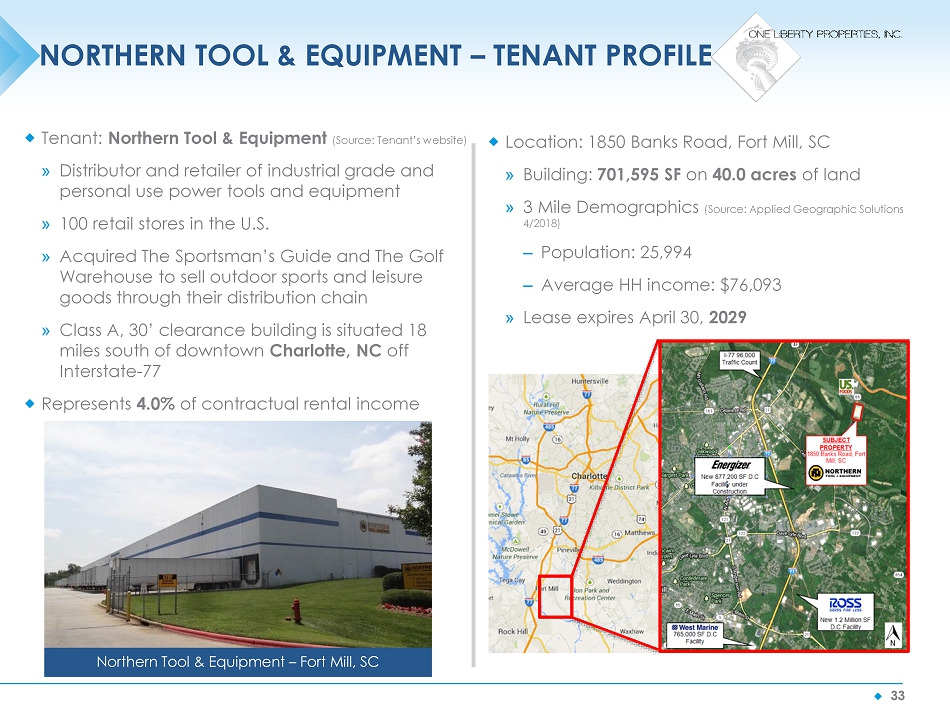
◆ 33 NORTHERN TOOL & EQUIPMENT – TENANT PROFILE Tenant: Northern Tool & Equipment (Source: Tenant’s website) » Distributor and retailer of industrial grade and personal use power tools and equipment » 100 retail stores in the U.S. » Acquired The Sportsman’s Guide and The Golf Warehouse to sell outdoor sports and leisure goods through their distribution chain » Class A, 30’ clearance building is situated 18 miles south of downtown Charlotte, NC off Interstate - 77 Represents 4.0% of contractual rental income Northern Tool & Equipment – Fort Mill, SC Location: 1850 Banks Road, Fort Mill, SC » Building: 701,595 SF on 40.0 acres of land » 3 Mile Demographics (Source: Applied Geographic Solutions 4/2018) – Population: 25,994 – Average HH income: $76,093 » Lease expires April 30, 2029
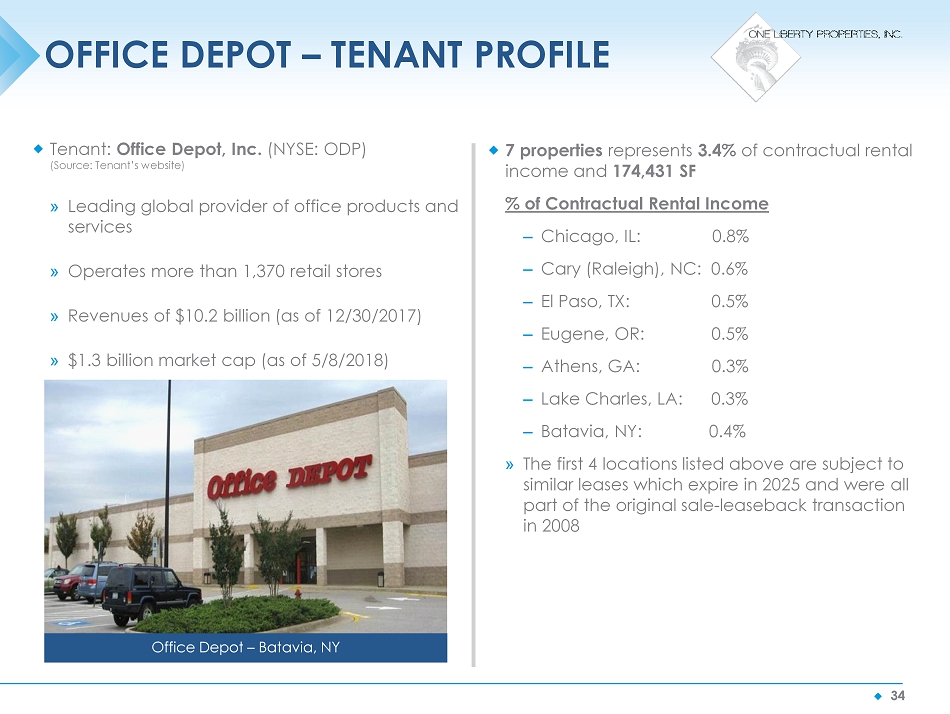
◆ 34 OFFICE DEPOT – TENANT PROFILE Tenant: Office Depot, Inc. (NYSE: ODP) (Source: Tenant’s website) » Leading global provider of office products and services » Operates more than 1,370 retail stores » Revenues of $10.2 billion (as of 12/30/2017) » $1.3 billion market cap (as of 5/8/2018) Office Depot – Batavia, NY 7 properties represents 3.4% of contractual rental income and 174,431 SF % of Contractual Rental Income – Chicago, IL: 0.8% – Cary (Raleigh), NC: 0.6% – El Paso, TX: 0.5% – Eugene, OR: 0.5% – Athens, GA: 0.3% – Lake Charles, LA: 0.3% – Batavia, NY: 0.4% » The first 4 locations listed above are subject to similar leases which expire in 2025 and were all part of the original sale - leaseback transaction in 2008
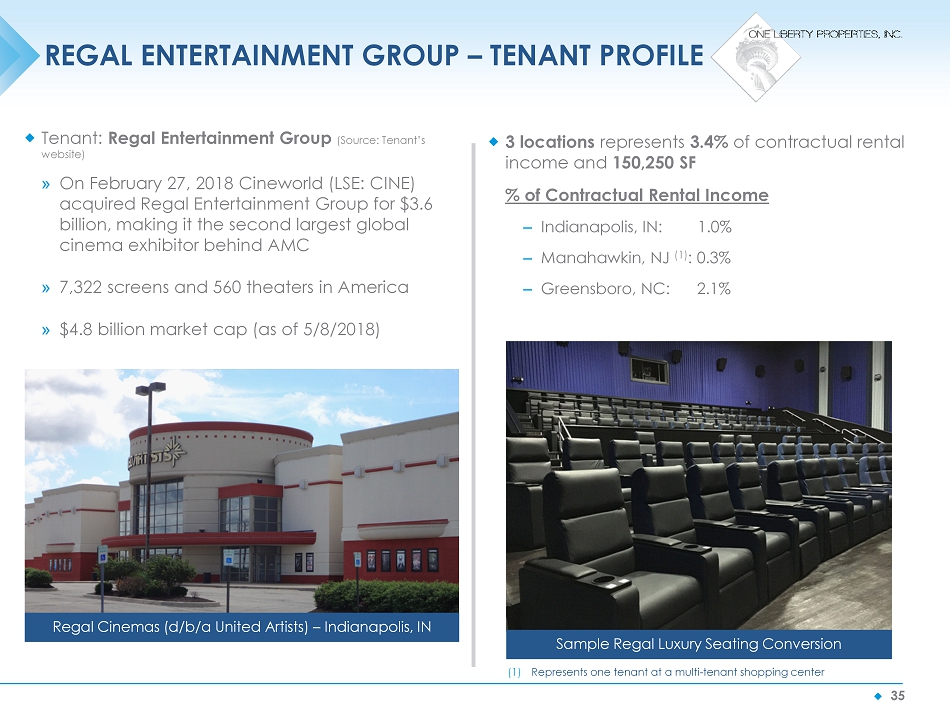
◆ 35 REGAL ENTERTAINMENT GROUP – TENANT PROFILE Tenant: Regal Entertainment Group (Source: Tenant’s website) » On February 27, 2018 Cineworld (LSE: CINE) acquired Regal Entertainment Group for $3.6 billion, making it the second largest global cinema exhibitor behind AMC » 7,322 screens and 560 theaters in America » $4.8 billion market cap (as of 5/8/2018) Regal Cinemas (d/b/a United Artists) – Indianapolis, IN 3 locations represents 3.4% of contractual rental income and 150,250 SF % of Contractual Rental Income – Indianapolis, IN: 1.0% – Manahawkin, NJ (1) : 0.3% – Greensboro, NC: 2.1% Sample Regal Luxury Seating Conversion (1) Represents one tenant at a multi - tenant shopping center
◆
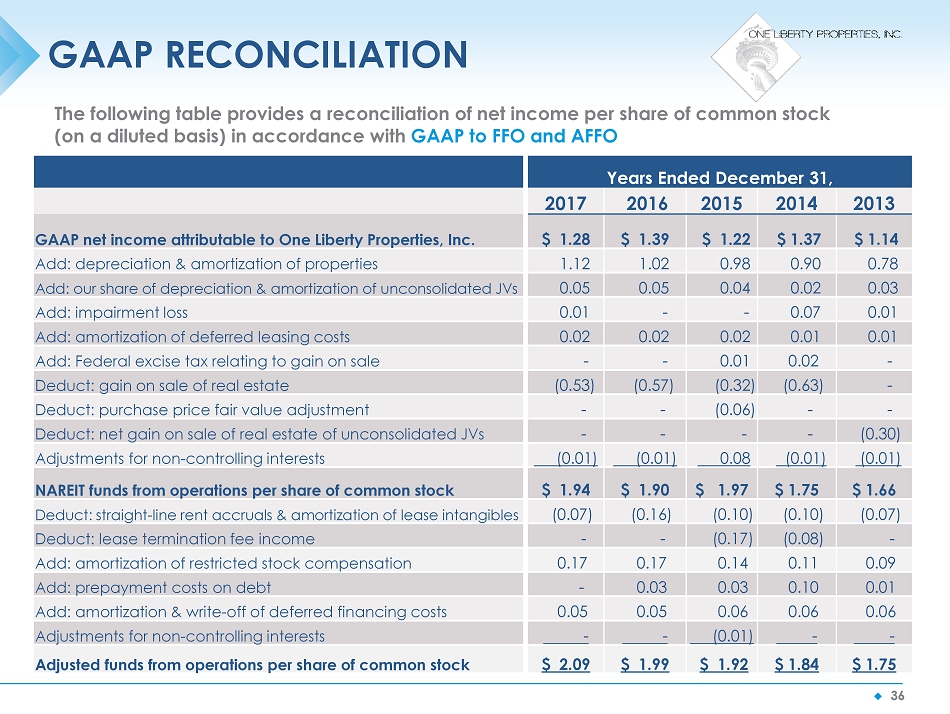
36 GAAP RECONCILIATION The following table provides a reconciliation of net income per share of common stock (on a diluted basis) in accordance with GAAP to FFO and AFFO Years Ended December 31, 2017 2016 2015 2014 2013 GAAP n et income attributable to One Liberty Properties, Inc. $ 1.28 $ 1.39 $ 1.22 $ 1.37 $ 1.14 Add: depreciation & amortization of properties 1.12 1.02 0.98 0.90 0.78 Add: our share of depreciation & amortization of unconsolidated JVs 0.05 0.05 0.04 0.02 0.03 Add: impairment loss 0.01 - - 0.07 0.01 Add: amortization of deferred leasing costs 0.02 0.02 0.02 0.01 0.01 Add: Federal excise tax relating to gain on sale - - 0.01 0.02 - Deduct: gain on sale of real estate (0.53) (0.57) (0.32) (0.63) - Deduct: purchase price fair value adjustment - - (0.06) - - Deduct: net gain on sale of real estate of unconsolidated JVs - - - - (0.30) Adjustments for non - controlling interests (0.01) (0.01) 0.08 (0.01) (0.01) NAREIT f unds from operations per share of common stock $ 1.94 $ 1.90 $ 1.97 $ 1.75 $ 1.66 Deduct: straight - line rent accruals & amortization of lease intangibles (0.07) (0.16) (0.10) (0.10) (0.07) Deduct: lease termination fee income - - (0.17) (0.08) - Add: amortization of restricted stock compensation 0.17 0.17 0.14 0.11 0.09 Add: prepayment costs on debt - 0.03 0.03 0.10 0.01 Add: amortization & write - off of deferred financing costs 0.05 0.05 0.06 0.06 0.06 Adjustments for non - controlling interests - - (0.01) - - Adjusted funds from operations per share of common stock $ 2.09 $ 1.99 $ 1.92 $ 1.84 $ 1.75