Exhibit 99.1

◆ 1 INVESTOR PRESENTATION DECEMBER 2019 onelibertyproperties.com
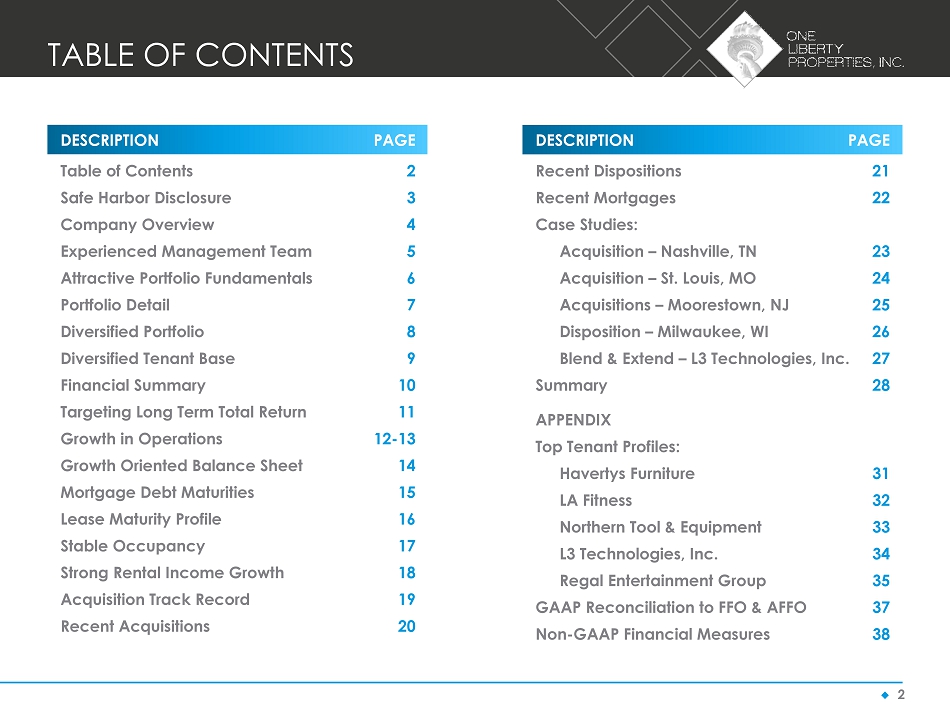
◆ 2 DESCRIPTION PAGE Table of Contents 2 Safe Harbor Disclosure 3 Company Overview 4 Experienced Management Team 5 Attractive Portfolio Fundamentals 6 Portfolio Detail 7 Diversified Portfolio 8 Diversified Tenant Base 9 Financial Summary 10 Targeting Long Term Total Return 11 Growth in Operations 12 - 13 Growth Oriented Balance Sheet 14 Mortgage Debt Maturities 15 Lease Maturity Profile 16 Stable Occupancy 17 Strong Rental Income Growth 18 Acquisition Track Record 19 Recent Acquisitions 20 DESCRIPTION PAGE Recent Dispositions 21 Recent Mortgages 22 Case Studies: Acquisition – Nashville, TN 23 Acquisition – St. Louis, MO 24 Acquisitions – Moorestown, NJ 25 Disposition – Milwaukee, WI 26 Blend & Extend – L3 Technologies, Inc. 27 Summary 28 APPENDIX Top Tenant Profiles: Havertys Furniture 31 LA Fitness 32 Northern Tool & Equipment 33 L3 Technologies, Inc. 34 Regal Entertainment Group 35 GAAP Reconciliation to FFO & AFFO 37 Non - GAAP Financial Measures 38 TABLE OF CONTENTS

◆ 3 The statements in this presentation, including targets and assumptions, state the Company’s and management’s hopes, intentions, beliefs, expectations or projections of the future and are forward - looking statements. It is important to note that the Company’s actual results could differ materially from those projected in such forward - looking statements. Factors that could cause actual results to differ materially from current expectations include the key assumptions contained within this presentation, general economic conditions, local real estate conditions, increases in interest rates, tenant defaults, non - renewals and/or bankruptcies, and increases in operating costs and real estate taxes. Additional information concerning factors that could cause actual results to differ materially from those forward - looking statements is contained in the Company’s SEC filings , and in particular the sections of such documents captioned “Risk Factors” and “Management’s Discussion and Analysis of Financial Condition and Results of Operations”. Copies of the SEC filings may be obtained from the Company or the SEC. The Company does not undertake to publicly update or revise any forward - looking statements, included in this presentation, whether as a result of new information, future events or otherwise. SAFE HARBOR

◆ 4 Fundamentals – focused real estate company Disciplined track record over various economic cycles Active net lease strategy - emphasis on industrial properties Experienced management team Alignment of interests - significant insider ownership COMPANY OVERVIEW
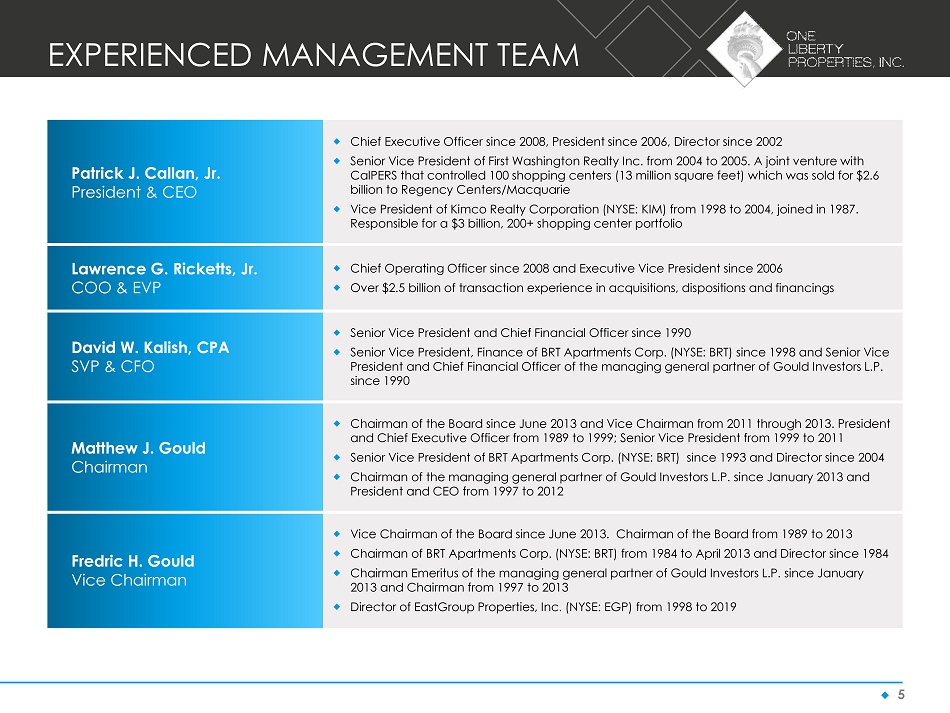
◆ 5 Patrick J. Callan, Jr. President & CEO Chief Executive Officer since 2008, President since 2006, Director since 2002 Senior Vice President of First Washington Realty Inc. from 2004 to 2005. A joint venture with CalPERS that controlled 100 shopping centers (13 million square feet) which was sold for $2.6 billion to Regency Centers/Macquarie Vice President of Kimco Realty Corporation (NYSE: KIM) from 1998 to 2004, joined in 1987. Responsible for a $3 billion, 200+ shopping center portfolio Lawrence G. Ricketts, Jr. COO & EVP Chief Operating Officer since 2008 and Executive Vice President since 2006 Over $2.5 billion of transaction experience in acquisitions, dispositions and financings David W. Kalish, CPA SVP & CFO Senior Vice President and Chief Financial Officer since 1990 Senior Vice President, Finance of BRT Apartments Corp. (NYSE: BRT) since 1998 and Senior Vice President and Chief Financial Officer of the managing general partner of Gould Investors L.P. since 1990 Matthew J. Gould Chairman Chairman of the Board since June 2013 and Vice Chairman from 2011 through 2013. President and Chief Executive Officer from 1989 to 1999; Senior Vice President from 1999 to 2011 Senior Vice President of BRT Apartments Corp. (NYSE: BRT) since 1993 and Director since 2004 Chairman of the managing general partner of Gould Investors L.P. since January 2013 and President and CEO from 1997 to 2012 Fredric H. Gould Vice Chairman Vice Chairman of the Board since June 2013. Chairman of the Board from 1989 to 2013 Chairman of BRT Apartments Corp. (NYSE: BRT) from 1984 to April 2013 and Director since 1984 Chairman Emeritus of the managing general partner of Gould Investors L.P. since January 2013 and Chairman from 1997 to 2013 Director of EastGroup Properties, Inc. (NYSE: EGP) from 1998 to 2019 EXPERIENCED MANAGEMENT TEAM
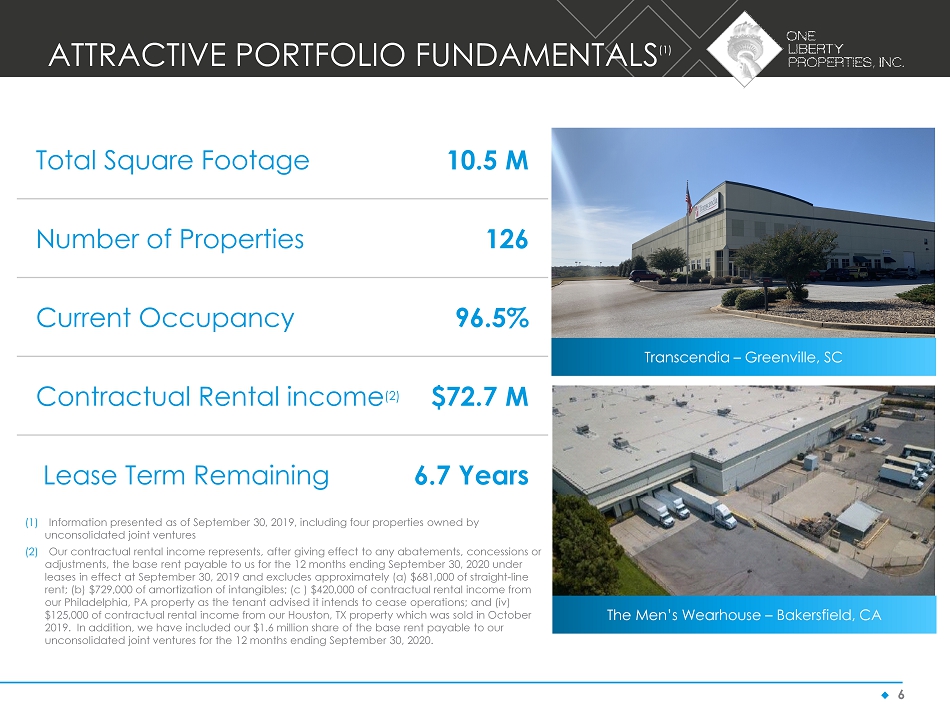
◆ 6 Total Square Footage 10.5 M Number of Properties 126 Current Occupancy 96.5% Contractual Rental income (2) $72.7 M Lease Term Remaining 6.7 Years Transcendia – Greenville, SC The Men’s Wearhouse – Bakersfield, CA (1) Information presented as of September 30, 2019, including four properties owned by unconsolidated joint ventures (2) Our contractual rental income represents, after giving effect to any abatements, concessions or adjustments, the base rent payable to us for the 12 months ending September 30, 2020 under leases in effect at September 30, 2019 and excludes approximately (a) $681,000 of straight - line rent; (b) $729,000 of amortization of intangibles; (c ) $420,000 of contractual rental income from our Philadelphia, PA property as the tenant advised it intends to cease operations; and (iv) $125,000 of contractual rental income from our Houston, TX property which was sold in October 2019. In addition, we have included our $1.6 million share of the base rent payable to our unconsolidated joint ventures for the 12 months ending September 30, 2020. ATTRACTIVE PORTFOLIO FUNDAMENTALS (1)
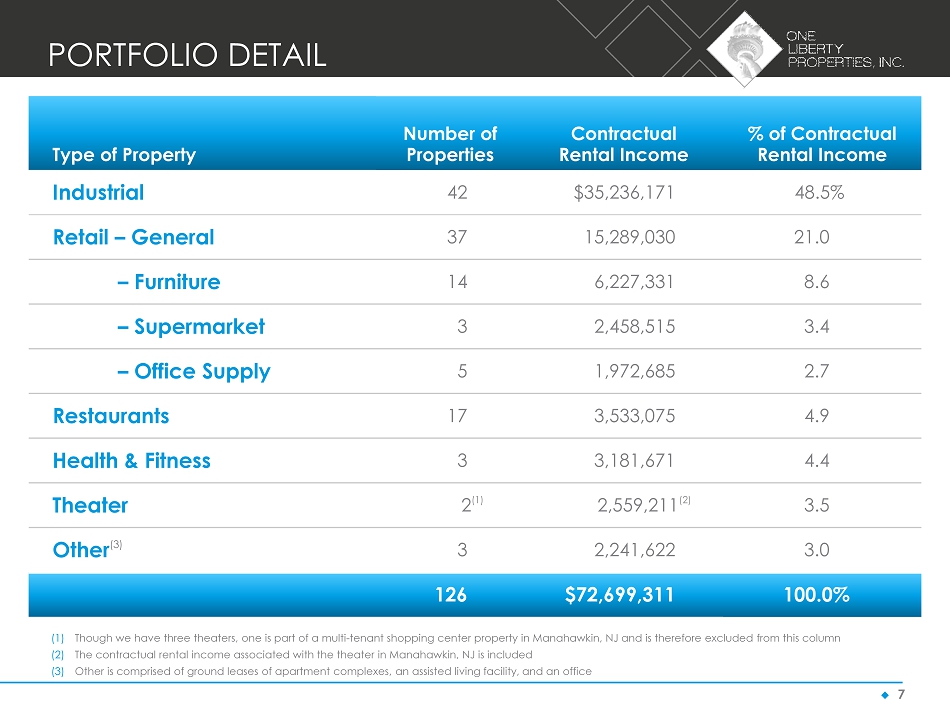
◆ 7 (1) Though we have three theaters, one is part of a multi - tenant shopping center property in Manahawkin, NJ and is therefore exclude d from this column (2) The contractual rental income associated with the theater in Manahawkin, NJ is included (3) Other is comprised of ground leases of apartment complexes, an assisted living facility, and an office PORTFOLIO DETAIL Type of Property Number of Properties Contractual Rental Income % of Contractual Rental Income Industrial 42 $35,236,171 48.5% Retail – General 37 15,289,030 21.0 – Furniture 14 6,227,331 8.6 – Supermarket 3 2,458,515 3.4 – Office Supply 5 1,972,685 2.7 Restaurants 17 3,533,075 4.9 Health & Fitness 3 3,181,671 4.4 Theater 2 (1) 2,559,211 (2) 3.5 Other (3) 3 2,241,622 3.0 126 $72,699,311 100.0%

◆ 8 Geographically diverse footprint Own 126 properties in 31 states Strong markets drive value DIVERSIFIED PORTFOLIO Highest State Concentration by Contractual Rental Income State Number of Properties Contractual Rental Income % Contractual Rental Income New York 8 $6,239,040 8.6% South Carolina 7 6,041,445 8.3 Texas 11 6,020,937 8.3 Pennsylvania 12 5,460,597 7.5 New Jersey 5 4,769,325 6.6 43 $28,531,344 39.3%
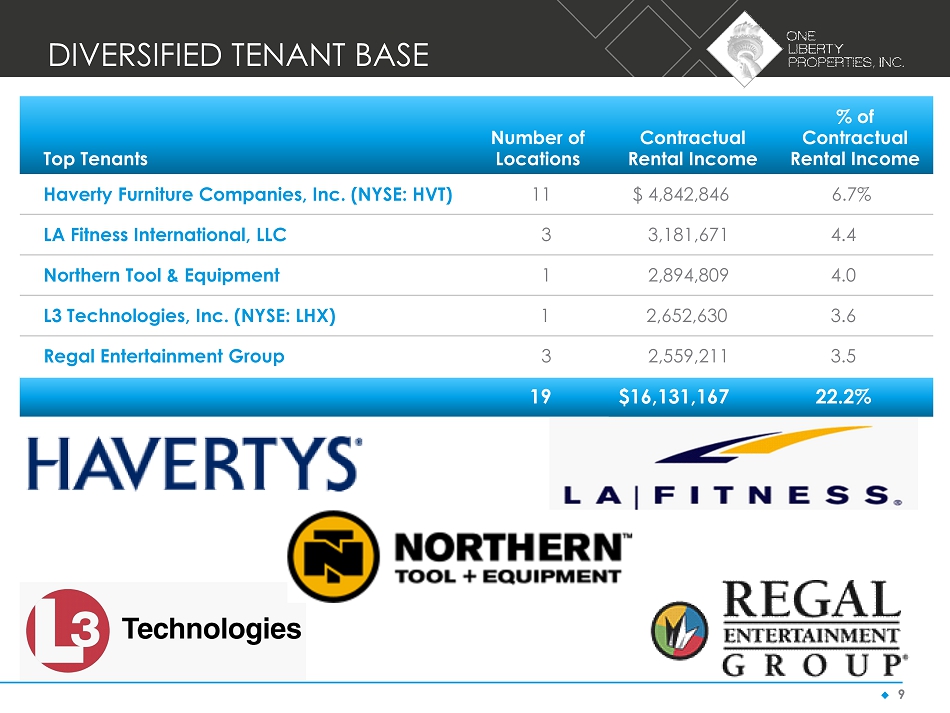
◆ 9 DIVERSIFIED TENANT BASE Top Tenants Number of Locations Contractual Rental Income % of Contractual Rental Income Haverty Furniture Companies, Inc. (NYSE: HVT) 11 $ 4,842,846 6.7% LA Fitness International, LLC 3 3,181,671 4.4 Northern Tool & Equipment 1 2,894,809 4.0 L3 Technologies, Inc. (NYSE: LHX) 1 2,652,630 3.6 Regal Entertainment Group 3 2,559,211 3.5 19 $16,131,167 22.2%
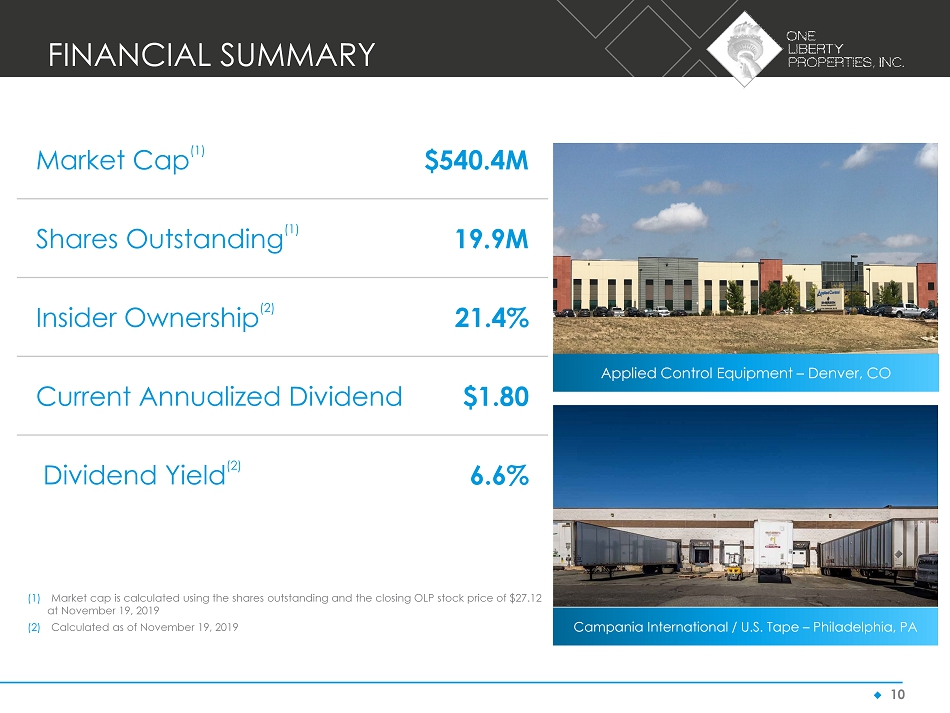
◆ 10 Market Cap (1) $ 540.4M Shares Outstanding (1) 19.9M Insider Ownership (2) 21.4% Current Annualized Dividend $1.80 Dividend Yield (2) 6.6% Applied Control Equipment – Denver, CO Campania International / U.S. Tape – Philadelphia, PA (1) Market cap is calculated using the shares outstanding and the closing OLP stock price of $27.12 at November 19, 2019 (2) Calculated as of November 19, 2019 FINANCIAL SUMMARY

◆ 11 (1) Performance period ended September 30, 2019 Consistent driver of long - term stockholder value TARGETING LONG TERM TOTAL RETURN 20.1% 13.2% 13.0% 0% 5% 10% 15% 20% 25% OLP NAREIT Equity Index S&P 500 10 - YEAR ANNUALIZED TOTAL STOCKHOLDER RETURN (1)

◆ 12 GROWTH IN OPERATIONS (1) $1.97 (3) $1.90 $1.94 $2.02 (3) $1.40 $1.60 $1.80 $2.00 2015 2016 2017 2018 Historical FFO Per Share (2) $1.92 $1.99 $2.09 $2.13 $1.60 $1.80 $2.00 $2.20 2015 2016 2017 2018 Historical AFFO Per Share (2) FFO Payout (4) 2015 80% 2016 87% 2017 90% 2018 89% AFFO Payout (4) 2015 82% 2016 83% 2017 83% 2018 85% For the Nine Months Ended September 30, 2019: FFO - $1.35 AFFO - $1.46 (1) For the years ended December 31 (2) A reconciliation of net income per diluted share, as determined in accordance with GAAP, to FFO per diluted share and AFFO pe r d iluted share, may be found at the end of this presentation (3) FFO includes lease termination fees of $2.9 million or $0.17 per share in 2015 and $372,000 or $0.02 per share in 2018 (4) Impacting the changes in the FFO and AFFO payout ratio are distributions of capital gains from property sales, which gains ar e e xcluded from the calculation of FFO and AFFO
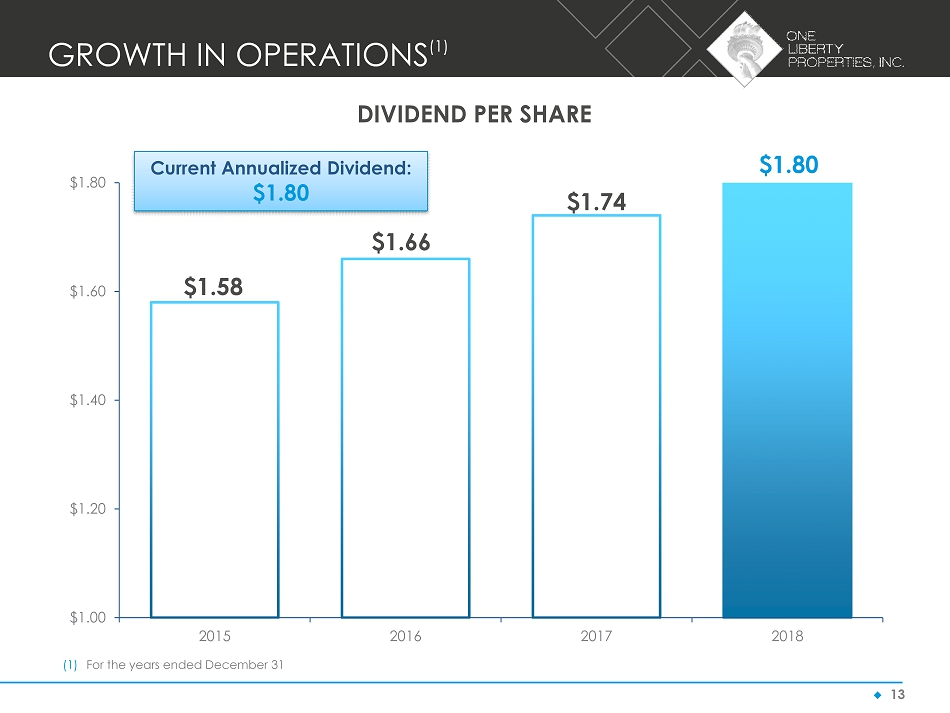
◆ 13 GROWTH IN OPERATIONS (1) $1.58 $1.66 $1.74 $1.80 $1.00 $1.20 $1.40 $1.60 $1.80 2015 2016 2017 2018 DIVIDEND PER SHARE (1) For the years ended December 31 Current Annualized Dividend: $1.80

◆ 14 GROWTH ORIENTED BALANCE SHEET AS AT SEPTEMBER 30, 2019 (1) Gross assets represent total assets plus accumulated depreciation of $133.5 million (2) Total debt includes our share ( i.e. $11.7 million) of debt of our unconsolidated joint venture (3) Calculated in accordance with the terms of our credit facility Liquidity available to acquire in excess of an estimated $150.0 million of properties as of November 20, 2019 $77.4 million available as of November 20, 2019 on Line of Credit Gross Assets (1) $918.6 M Total Debt/Gross Assets (2) 51.2% Fixed Rate Debt 95.9% Debt Service Coverage Ratio (3) 2.1 to 1.0 Fixed Charge Coverage Ratio (3) 1.8 to 1.0 AFFO Payout Ratio 92.5%
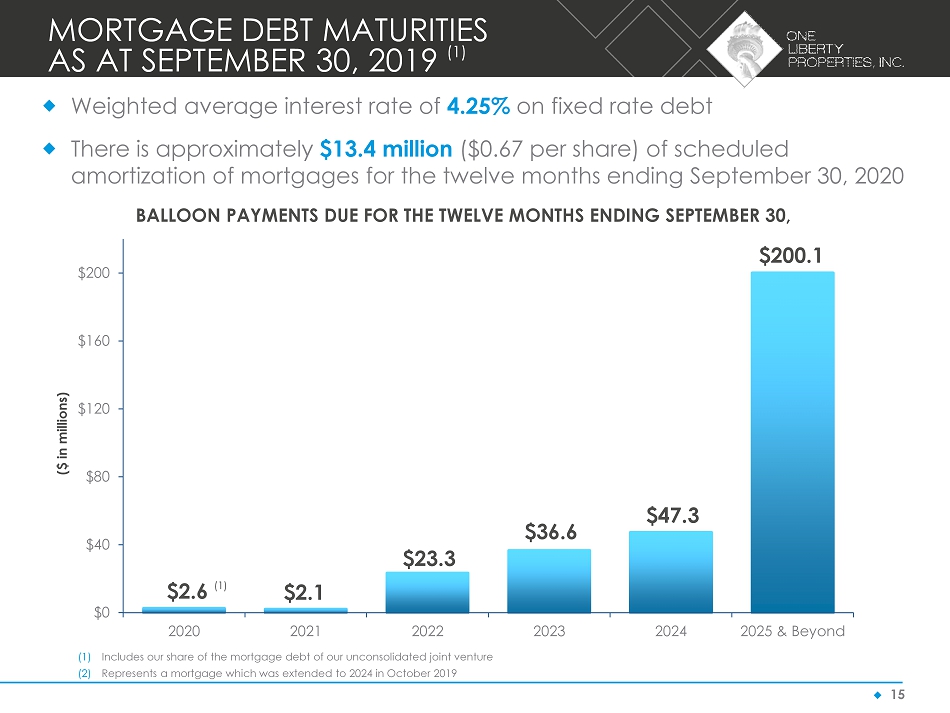
◆ 15 MORTGAGE DEBT MATURITIES AS AT SEPTEMBER 30, 2019 (1) $2.6 (1) $2.1 $23.3 $36.6 $47.3 $200.1 $0 $40 $80 $120 $160 $200 2020 2021 2022 2023 2024 2025 & Beyond ($ in millions) BALLOON PAYMENTS DUE FOR THE TWELVE MONTHS ENDING SEPTEMBER 30, Weighted average interest rate of 4.25% on fixed rate debt There is approximately $13.4 million ($0.67 per share) of scheduled amortization of mortgages for the twelve months ending September 30, 2020 (1) Includes our share of the mortgage debt of our unconsolidated joint venture (2) Represents a mortgage which was extended to 2024 in October 2019
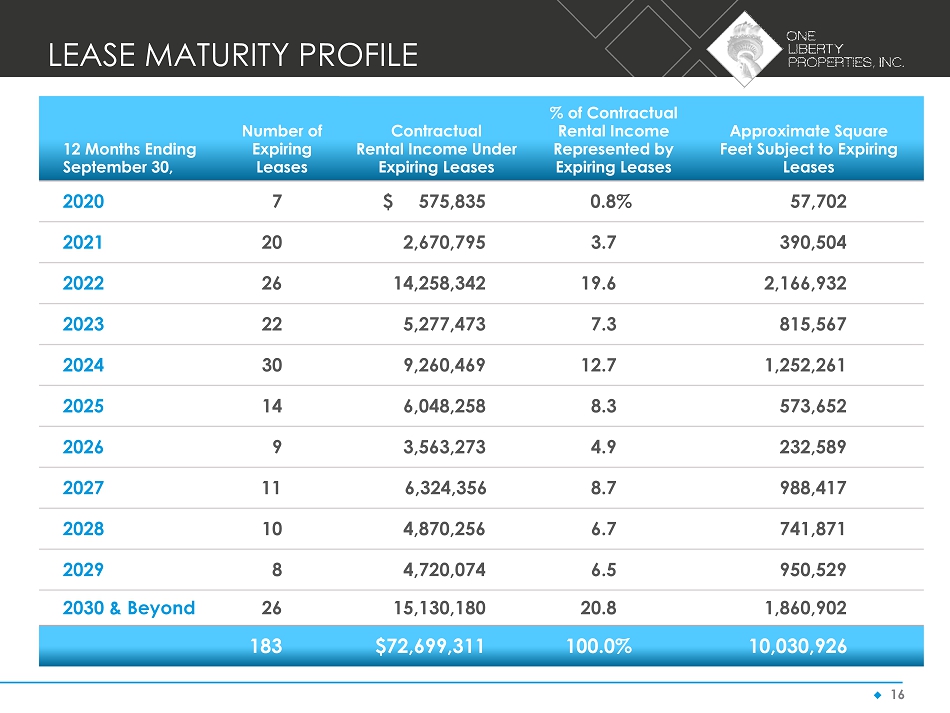
◆ 16 LEASE MATURITY PROFILE 12 Months Ending September 30 , Number of Expiring Leases Contractual Rental Income Under Expiring Leases % of Contractual Rental Income Represented by Expiring Leases Approximate Square Feet Subject to Expiring Leases 2020 7 $ 575,835 0.8% 57,702 2021 20 2,670,795 3.7 390,504 2022 26 14,258,342 19.6 2,166,932 2023 22 5,277,473 7.3 815,567 2024 30 9,260,469 12.7 1,252,261 2025 14 6,048,258 8.3 573,652 2026 9 3,563,273 4.9 232,589 2027 11 6,324,356 8.7 988,417 2028 10 4,870,256 6.7 741,871 2029 8 4,720,074 6.5 950,529 2030 & Beyond 26 15,130,180 20.8 1,860,902 183 $72,699,311 100.0% 10,030,926
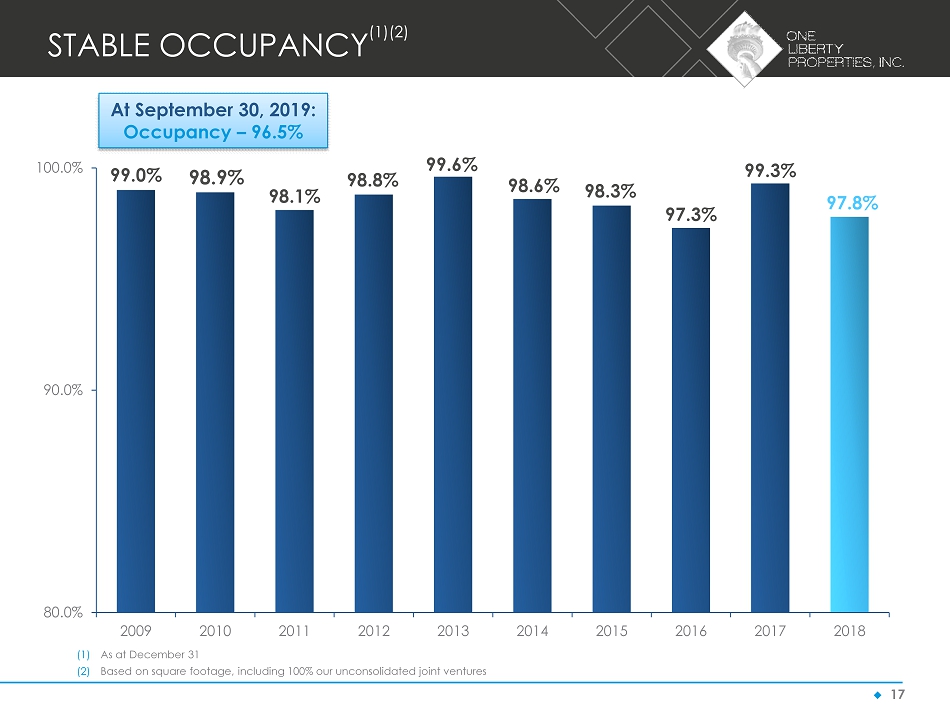
◆ 17 STABLE OCCUPANCY (1)(2) 99.0% 98.9% 98.1% 98.8% 99.6% 98.6% 98.3% 97.3% 99.3% 97.8% 80.0% 90.0% 100.0% 2009 2010 2011 2012 2013 2014 2015 2016 2017 2018 (1) As at December 31 (2) Based on square footage, including 100% our unconsolidated joint ventures At September 30, 2019: Occupancy – 96.5%
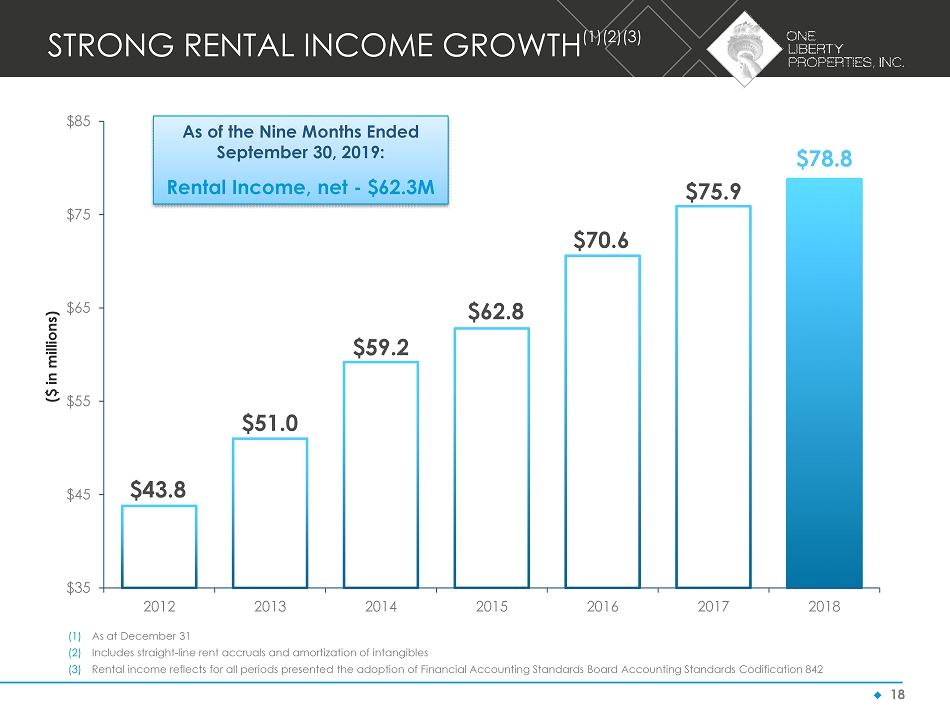
◆ 18 STRONG RENTAL INCOME GROWTH (1)(2)(3) $43.8 $51.0 $59.2 $62.8 $70.6 $75.9 $78.8 $35 $45 $55 $65 $75 $85 2012 2013 2014 2015 2016 2017 2018 ($ in millions) As of the Nine Months Ended September 30, 2019: Rental Income, net - $62.3M (1) As at December 31 (2) Includes straight - line rent accruals and amortization of intangibles (3) Rental income reflects for all periods presented the adoption of Financial Accounting Standards Board Accounting Standards Co dif ication 842
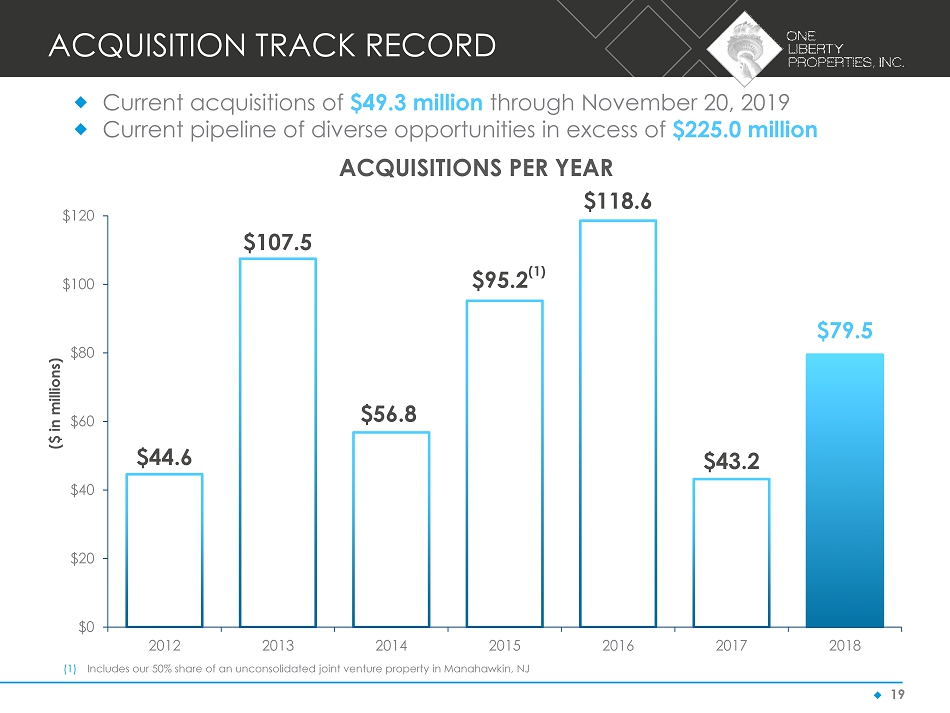
◆ 19 ACQUISITION TRACK RECORD $44.6 $107.5 $56.8 $95.2 (1) $118.6 $43.2 $79.5 $0 $20 $40 $60 $80 $100 $120 2012 2013 2014 2015 2016 2017 2018 ($ in millions) ACQUISITIONS PER YEAR Current acquisitions of $49.3 million through November 20, 2019 Current pipeline of diverse opportunities in excess of $225.0 million (1) Includes our 50% share of an unconsolidated joint venture property in Manahawkin, NJ

◆ 20 RECENT ACQUISITIONS Date Acquired Property Type Tenant (or d/b/a) MSA State Current Lease Expiration Purchase Price (in ‘000s) Yield (1) Financing at purchase (in ‘000s) 10/23/19 Industrial The Door Mill Phoenix AZ 06/30/24 $ 3,000 7.3% All cash 10/03/19 Industrial Cosentino North America Savannah GA 03/31/29 $ 6,400 7.2% All cash 09/13/19 Industrial Continental Hydraulics Minneapolis MN 02/28/33 $ 8,000 7.3% All cash 07/24/19 Industrial Nissan North America, Inc. Troup County GA 12/31/28 $ 5,200 6.6% All cash 06/26/19 Industrial International Flora Technologies Phoenix AZ 06/30/29 $ 8,650 7.4% All cash 06/18/19 Industrial Betz Mechanical Supply / Philly Motors Philadelphia PA 05/31/24 - 09/17/28 $ 6,200 7.6% All cash 05/30/19 Industrial Echo, Inc. Chicago IL 01/31/24 $ 3,800 7.8% All cash 05/30/19 Industrial Zwanenberg Food Group / Metro Carpets Nashville TN 03/31/23 - 10/31/24 $ 8,000 7.0% All cash 12/21/18 Industrial Transcendia, Inc. Greenville SC 09/30/23 $ 6,830 6.8% All cash 12/11/18 Industrial Dufresne Spencer Group Holdings St. Louis MO 12/31/23 $10,000 7.2% All cash 12/06/18 Industrial Men’s Wearhouse Kern County CA 02/29/24 $10,850 8.1% All cash 11/28/18 Industrial 21 st Century Cabinetry / Novacart , Inc. Moorestown NJ 09/30/27 - 11/30/23 $13,498 8.5% All cash 11/01/18 Industrial Xerimis , Inc. Moorestown NJ 02/29/28 $ 7,350 8.0% All cash 10/19/18 Industrial Applied Control Equipment Denver CO 10/18/30 $12,800 8.3% All cash (1) Yield represents the annualized straight - line rent over the remaining term of the lease, divided by the purchase price

◆ 21 RECENT DISPOSITIONS Date Sold Date Acquired Property Type Tenant (or d/b/a) MSA State Gross Sales Price (in ‘000s) Net Gain (Loss) (in ‘000s) 10/21/19 06/30/98 Retail Aaron’s Inc. Houston TX $ 1,675 $ 218 08/29/19 08/02/16 Other The Briarbrook Apartments Wheaton IL $12,035 $1,499 08/23/19 05/19/04 Office Supply Office Depot / JoAnn Stores Athens GA $ 6,050 $1,045 06/20/19 03/22/13 Retail K - Mart Winston - Salem NC $ 5,500 $1,099 (1) 12/13/18 03/31/15 Retail Shopko Lincoln NE $10,000 ($1,731) 09/14/18 03/24/15 Other The Meadows Apartments Lake County IL $ 8,459 $4,585 07/31/18 08/13/04 Industrial Caterpillar Mining Milwaukee WI $13,275 $3,973 (2) 04/05/18 09/27/06 Retail K - Mart Savannah GA $ 2,800 $ 141 (3) 01/30/18 11/13/12 Retail Shopping Center Houston TX $ 9,200 $2,408 (4) (1) Represents 100% of the gain on the sale of a property owned by a consolidated joint venture in which we had an 90% interest. Ou r share of the gain was $677,000. (2) Represents 100% of the gain on the sale of property held by an unconsolidated joint venture in which we have a 50% interest. Our share of the gain was $2.0 million. (3) Represents 100% of the gain on the sale of a building and a portion of land held by an unconsolidated joint venture in which we have a 50% interest. Our share of the gain was $71,000. (4) Represents 100% of the gain on the sale of a property owned by a consolidated joint venture in which we had an 85% interest. Ou r share of the gain was $1.6 million.
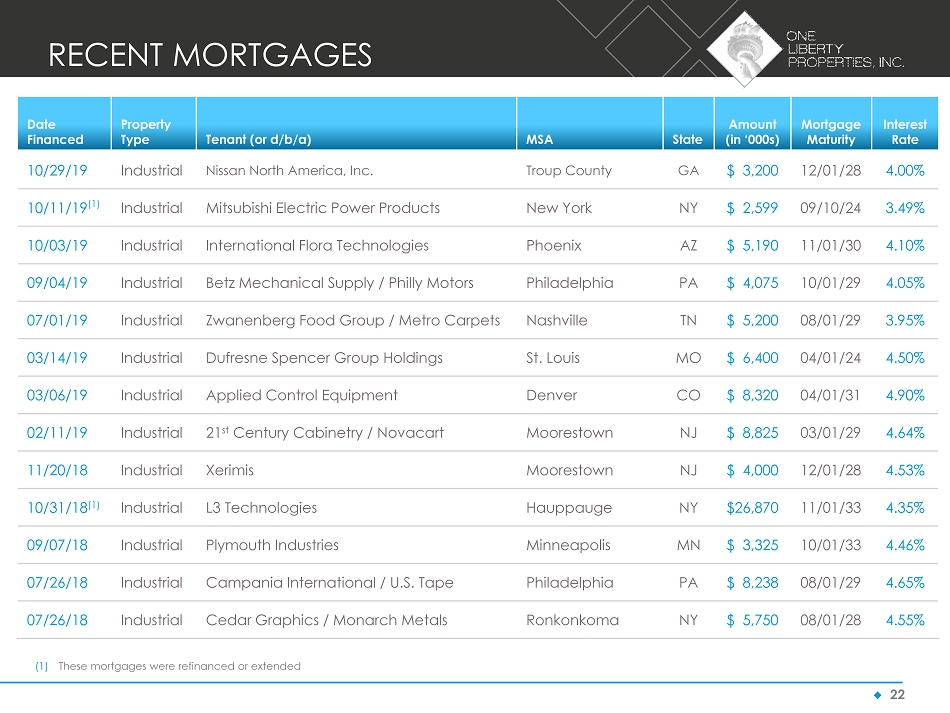
◆ 22 RECENT MORTGAGES Date Financed Property Type Tenant (or d/b/a) MSA State Amount (in ‘000s) Mortgage Maturity Interest Rate 10/29/19 Industrial Nissan North America, Inc. Troup County GA $ 3,200 12/01/28 4.00% 10/11/19 (1) Industrial Mitsubishi Electric Power Products New York NY $ 2,599 09/10/24 3.49% 10/03/19 Industrial International Flora Technologies Phoenix AZ $ 5,190 11/01/30 4.10% 09/04/19 Industrial Betz Mechanical Supply / Philly Motors Philadelphia PA $ 4,075 10/01/29 4.05% 07/01/19 Industrial Zwanenberg Food Group / Metro Carpets Nashville TN $ 5,200 08/01/29 3.95% 03/14/19 Industrial Dufresne Spencer Group Holdings St. Louis MO $ 6,400 04/01/24 4.50% 03/06/19 Industrial Applied Control Equipment Denver CO $ 8,320 04/01/31 4.90% 02/11/19 Industrial 21 st Century Cabinetry / Novacart Moorestown NJ $ 8,825 03/01/29 4.64% 11/20/18 Industrial Xerimis Moorestown NJ $ 4,000 12/01/28 4.53% 10/31/18 (1) Industrial L3 Technologies Hauppauge NY $26,870 11/01/33 4.35% 09/07/18 Industrial Plymouth Industries Minneapolis MN $ 3,325 10/01/33 4.46% 07/26/18 Industrial Campania International / U.S. Tape Philadelphia PA $ 8,238 08/01/29 4.65% 07/26/18 Industrial Cedar Graphics / Monarch Metals Ronkonkoma NY $ 5,750 08/01/28 4.55% (1) These mortgages were refinanced or extended

◆ 23 Zwanenberg Food & Metro Carpet – Nashville, TN ACQUISITION CASE STUDY – INDUSTRIAL ZWANENBERG FOOD & METRO CARPET (1) Mortgage with an interest rate of 3.95% closed in July 2019 In May 2019, acquired a two tenant industrial warehouse facility in Nashville, TN. The 99,500 SF property is net leased to Zwanenberg Food Group and Metro Carpets. The infill property is well located within the Nashville metro, approximately 2.5 miles from both the airport and the downtown area. The building has frontage on Elm Hill Pike, a major thoroughfare of Nashville. The 24’ clear concrete masonry building was built in 1974. It features 16 loading docks. Zwanenberg recently expanded within the building committing through March 2023. Metro Carpets owns the adjacent building and recently extended their lease through October 2024. Both leases feature ~3% annual increases. Purchase Price $ 8,000,000 Mortgage (1) (5,200,000) Net Equity Invested $ 2,800,000 Year 1 Base Rent $ 530,000 Interest Expense – 3.95% (1) (204,000) Net Cash to OLP $ 326,000 Return on Equity 11.64%

◆ 24 Dufresne Spencer Group – St. Louis, MO ACQUISITION CASE STUDY – INDUSTRIAL DUFRESNE SPENCER GROUP (1) Mortgage with an interest rate of 4.50% closed in March 2019 In December 2018, acquired a single tenant industrial warehouse facility in St. Louis, MO . The 119,680 SF property is net leased to Dufresne Spencer Group, the largest Ashley Furniture franchisee. The property is well located in Green Park, approximately 10 miles from downtown St. Louis, with excellent access to Interstate 55 and Interstate 270. The 38’ clear tilt wall construction warehouse was built in 2008 and features modern industrial amenities. The tenant operates over 40 Ashley Furniture stores in 9 states. The subject facility services 6 stores located in St. Louis. The base rent increases by 10% in the option period which begins in 2023. Purchase Price $10,000,000 Mortgage (1) (6,400,000) Net Equity Invested $ 3,600,000 Year 1 Base Rent $ 720,000 Interest Expense – 4.50% (1) (285,100) Net Cash to OLP $ 434,900 Return on Equity 12.08%
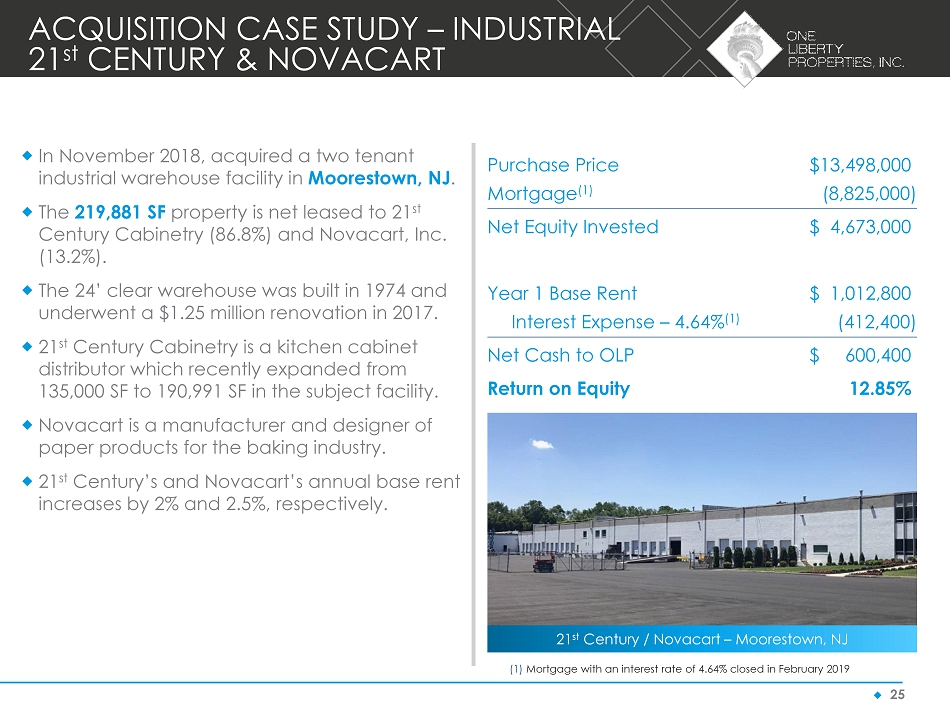
◆ 25 21 st Century / Novacart – Moorestown, NJ ACQUISITION CASE STUDY – INDUSTRIAL 21 st CENTURY & NOVACART (1) Mortgage with an interest rate of 4.64% closed in February 2019 In November 2018, acquired a two tenant industrial warehouse facility in Moorestown, NJ . The 219,881 SF property is net leased to 21 st Century Cabinetry (86.8%) and Novacart, Inc. (13.2%). The 24’ clear warehouse was built in 1974 and underwent a $1.25 million renovation in 2017. 21 st Century Cabinetry is a kitchen cabinet distributor which recently expanded from 135,000 SF to 190,991 SF in the subject facility. Novacart is a manufacturer and designer of paper products for the baking industry. 21 st Century’s and Novacart’s annual base rent increases by 2% and 2.5%, respectively. Purchase Price $13,498,000 Mortgage (1) (8,825,000) Net Equity Invested $ 4,673,000 Year 1 Base Rent $ 1,012,800 Interest Expense – 4.64% (1) (412,400) Net Cash to OLP $ 600,400 Return on Equity 12.85%
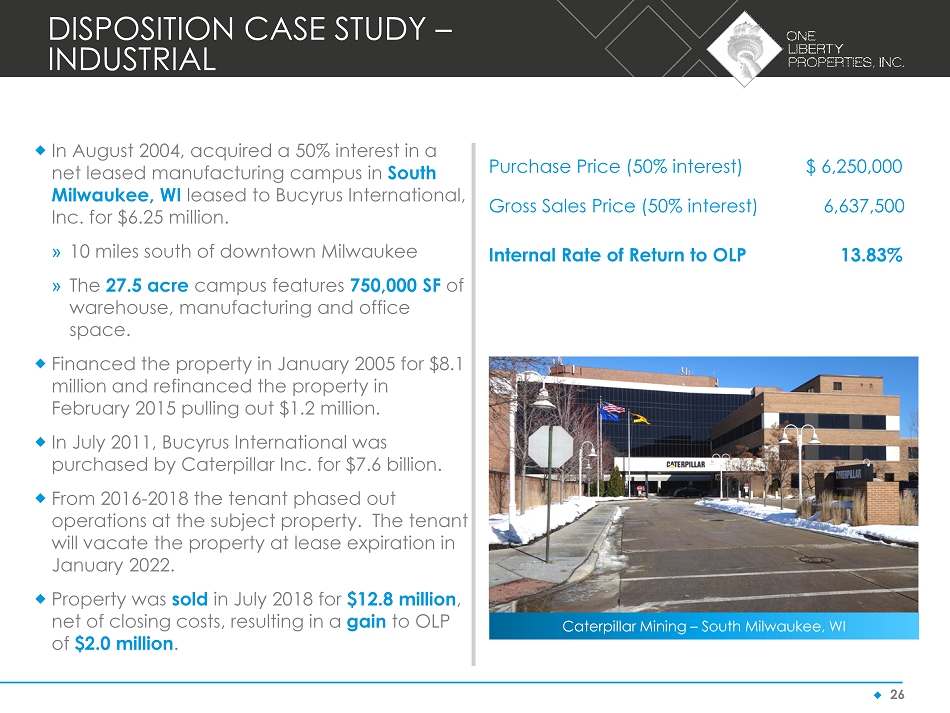
◆ 26 Caterpillar Mining – South Milwaukee, WI DISPOSITION CASE STUDY – INDUSTRIAL In August 2004, acquired a 50% interest in a net leased manufacturing campus in South Milwaukee, WI leased to Bucyrus International, Inc. for $6.25 million. » 10 miles south of downtown Milwaukee » The 27.5 acre campus features 750,000 SF of warehouse, manufacturing and office space. Financed the property in January 2005 for $8.1 million and refinanced the property in February 2015 pulling out $1.2 million. In July 2011, Bucyrus International was purchased by Caterpillar Inc. for $7.6 billion. From 2016 - 2018 the tenant phased out operations at the subject property. The tenant will vacate the property at lease expiration in January 2022. Property was sold in July 2018 for $12.8 million , net of closing costs, resulting in a gain to OLP of $2.0 million . Purchase Price (50% interest) $ 6,250,000 Gross Sales Price (50% interest) 6,637,500 Internal Rate of Return to OLP 13.83%
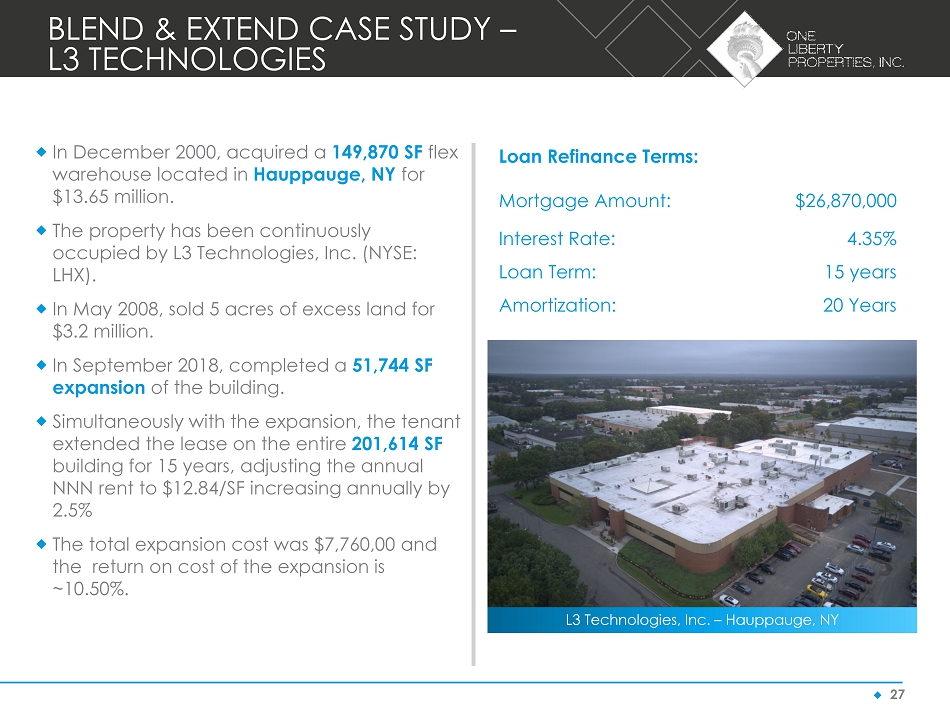
◆ 27 L3 Technologies, Inc. – Hauppauge, NY BLEND & EXTEND CASE STUDY – L3 TECHNOLOGIES Loan Refinance Terms: Mortgage Amount: $26,870,000 Interest Rate: 4.35% Loan Term: 15 years Amortization: 20 Years In December 2000, acquired a 149,870 SF flex warehouse located in Hauppauge, NY for $13.65 million. The property has been continuously occupied by L3 Technologies, Inc. (NYSE: LHX). In May 2008, sold 5 acres of excess land for $3.2 million. In September 2018, completed a 51,744 SF expansion of the building. Simultaneously with the expansion, the tenant extended the lease on the entire 201,614 SF building for 15 years, adjusting the annual NNN rent to $12.84/SF increasing annually by 2.5% The total expansion cost was $7,760,00 and the return on cost of the expansion is ~10.50%.

◆ 28 SUMMARY - WHY OLP? Fundamentals – focused real estate company Disciplined track record over various economic cycles Active net lease strategy - emphasis on industrial properties Experienced management team Alignment of interests - significant insider ownership
◆ 29 APPENDIX

◆ 30 TOP TENANTS’ PROFILES
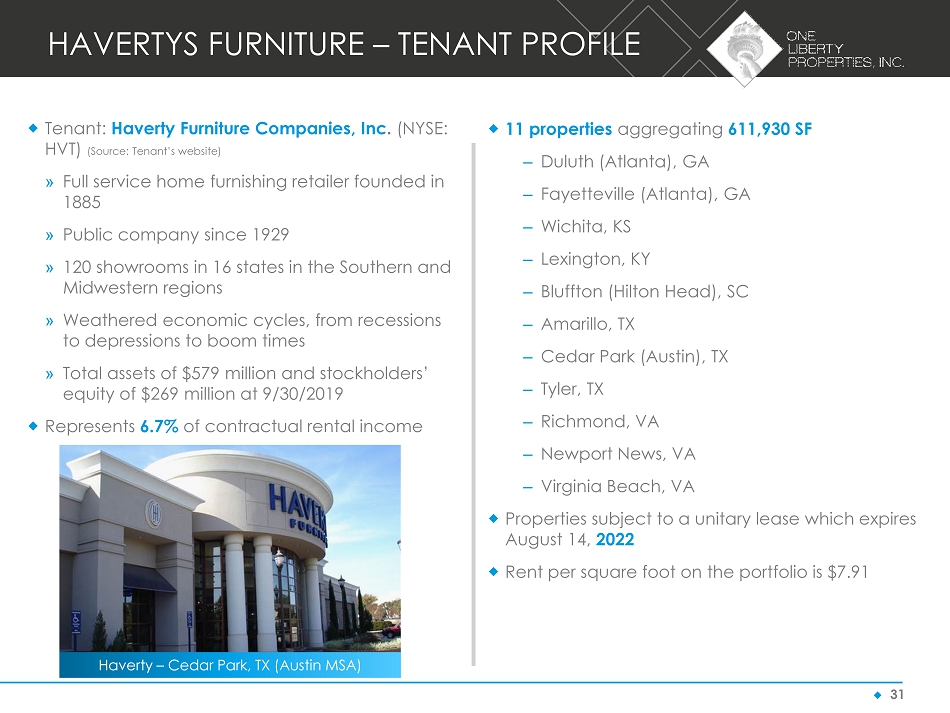
◆ 31 Haverty – Cedar Park, TX (Austin MSA) HAVERTYS FURNITURE – TENANT PROFILE Tenant: Haverty Furniture Companies, Inc . (NYSE: HVT) (Source: Tenant’s website) » Full service home furnishing retailer founded in 1885 » Public company since 1929 » 120 showrooms in 16 states in the Southern and Midwestern regions » Weathered economic cycles, from recessions to depressions to boom times » Total assets of $579 million and stockholders’ equity of $269 million at 9/30/2019 Represents 6.7% of contractual rental income 11 properties aggregating 611,930 SF – Duluth (Atlanta), GA – Fayetteville (Atlanta), GA – Wichita, KS – Lexington, KY – Bluffton (Hilton Head), SC – Amarillo, TX – Cedar Park (Austin), TX – Tyler, TX – Richmond, VA – Newport News, VA – Virginia Beach, VA Properties subject to a unitary lease which expires August 14, 2022 Rent per square foot on the portfolio is $7.91
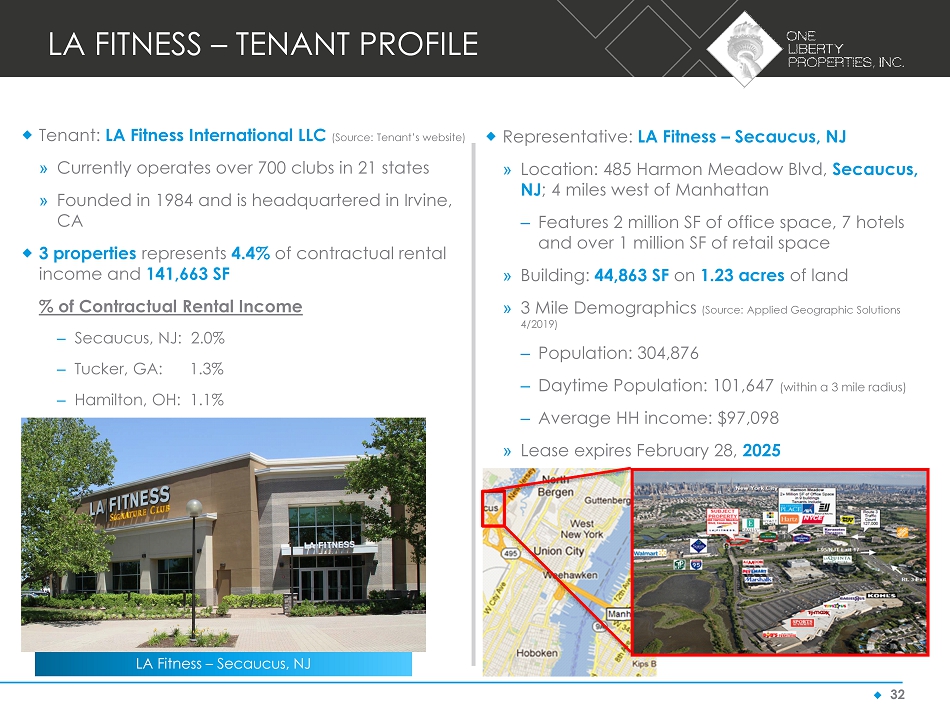
◆ 32 LA Fitness – Secaucus, NJ LA FITNESS – TENANT PROFILE Tenant: LA Fitness International LLC (Source: Tenant’s website) » Currently operates over 700 clubs in 21 states » Founded in 1984 and is headquartered in Irvine, CA 3 properties represents 4.4% of contractual rental income and 141,663 SF % of Contractual Rental Income – Secaucus, NJ: 2.0% – Tucker, GA: 1.3% – Hamilton, OH: 1.1% Representative: LA Fitness – Secaucus, NJ » Location: 485 Harmon Meadow Blvd, Secaucus, NJ ; 4 miles west of Manhattan – Features 2 million SF of office space, 7 hotels and over 1 million SF of retail space » Building: 44,863 SF on 1.23 acres of land » 3 Mile Demographics (Source: Applied Geographic Solutions 4/2019) – Population: 304,876 – Daytime Population: 101,647 (within a 3 mile radius) – Average HH income: $97,098 » Lease expires February 28, 2025

◆ 33 Northern Tool & Equipment – Fort Mill, SC NORTHERN TOOL & EQUIPMENT – TENANT PROFILE Tenant: Northern Tool & Equipment (Source: Tenant’s website) » Distributor and retailer of industrial grade and personal use power tools and equipment » Over 100 retail stores in the U.S. » Acquired The Sportsman’s Guide and The Golf Warehouse to sell outdoor sports and leisure goods through their distribution chain » Class A, 30’ clearance building is situated 18 miles south of downtown Charlotte, NC off Interstate - 77 Represents 4.0% of contractual rental income Location: 1850 Banks Road, Fort Mill, SC » Building: 701,595 SF on 40.0 acres of land » 3 Mile Demographics (Source: Applied Geographic Solutions 4/2019) – Population: 29,125 – Average HH income: $75,686 » Lease expires April 30, 2029

◆ 34 L3 Technologies, Inc. – Hauppauge, NY L3 TECHNOLOGIES – TENANT PROFILE Tenant: L3 Technologies, Inc. (Source: Tenant’s website) » US based defense technology company » On June 29, 2019, L3 Technologies and Harris Corporation merged to form L3 Harris Technologies - the 6 th largest US defense company by revenues – The merged company currently has a market cap of $45 billion » Represents 3.6% of contractual rental income Location: 435 Moreland Road, Hauppauge, NY » Building: 201,614 SF on 12.4 acres » 3 Mile Demographics (Source: Applied Geographic Solutions 4/2019) – Population: 83,393 – Average HH income: $133,400 » Lease expires September 30 , 2033

◆ 35 Regal Cinemas (d/b/a United Artists) – Indianapolis, IN REGAL ENTERTAINMENT GROUP – TENANT PROFILE Tenant: Regal Entertainment Group (Source: Tenant’s website) » On February 27, 2018 Cineworld (LSE: CINE) acquired Regal Entertainment Group for $3.6 billion, making it the second largest global cinema exhibitor behind AMC » 7,211 screens and 549 theaters in America » $2.8 billion market cap (as of 11/20/2019) 3 locations represents 3.5% of contractual rental income and 150,520 SF % of Contractual Rental Income – Indianapolis, IN: 1.0% – Manahawkin, NJ (1) : 0.3% – Greensboro, NC: 2.2% Sample Regal Luxury Seating Conversion (1) Represents one tenant at a multi - tenant shopping center
◆ 36 GAAP RECONCILIATION

◆ 37 GAAP RECONCILIATION The following table provides a reconciliation of net income per share of common stock (on a diluted basis) in accordance with GAAP to FFO and AFFO 9 Months Ended September 30, Years Ended December 31, 2019 2018 2017 2016 2015 GAAP n et income attributable to One Liberty Properties, Inc. $0.64 $ 1.05 $ 1.28 $ 1.39 $ 1.22 Add: depreciation & amortization of properties 0.83 1.24 1.12 1.02 0.98 Add: our share of depreciation & amortization of unconsolidated JVs 0.02 0.04 0.05 0.05 0.04 Add: impairment loss - - 0.01 - - Add: amortization of deferred leasing costs 0.02 0.02 0.02 0.02 0.02 Add: Federal excise tax relating to gain on sale - - - - 0.01 Deduct: gain on sale of real estate (0.18) (0.27) (0.53) (0.57) (0.32) Deduct: equity in earnings from sale of unconsolidated JV properties - (0.10) - - - Deduct: purchase price fair value adjustment - - - - (0.06) Adjustments for non - controlling interests 0.02 0.04 (0.01) (0.01) 0.08 NAREIT f unds from operations per share of common stock $1.35 $ 2.02 $ 1.94 $ 1.90 $ 1.97 Deduct: straight - line rent accruals & amortization of lease intangibles (0.08) (0.07) (0.07) (0.16) (0.10) Deduct: our share of straight - line rent accruals & amortization of lease intangibles of unconsolidated JVs - (0.03) - - - Deduct: lease termination fee income - (0.02) - - (0.17) Add: amortization of restricted stock compensation 0.14 0.18 0.17 0.17 0.14 Add: prepayment costs on debt 0.01 - - 0.03 0.03 Add: amortization & write - off of deferred financing costs 0.04 0.05 0.05 0.05 0.06 Adjustments for non - controlling interests - - - - (0.01) Adjusted funds from operations per share of common stock $1.46 $ 2.13 $ 2.09 $ 1.99 $ 1.92
◆ 38 NON - GAAP FINANCIAL MEASURES One Liberty computes FFO in accordance with the “White Paper on Funds from Operations” issued by the National Association of Real Estate Investment Trusts (“NAREIT”) and NAREIT’s related guidance. FFO is defined in the White Paper as net income (calculated in accordance with GAAP), excluding depreciation and amortization related to real estate, gains and losses from the sale of certain real estate assets, gains and losses from change in control, impairment write - downs of certain real estate assets and investments in entities where the impairment is directly attributable to decreases in the value of depreciable real estate held by the entity. Adjustments for unconsolidated partnerships and joint ventures are calculated to reflect funds from operations on the same basis. In computing FFO, One Liberty does not add back to net income the amortization of costs in connection with its financing activities or depreciation of non - real estate assets. One Liberty computes adjusted funds from operations, or AFFO, by adjusting from FFO for straight - line rent accruals and amortization of lease intangibles, deducting lease termination fees and gain on extinguishment of debt and adding back amortization of restricted stock compensation, amortization of costs in connection with its financing activities (including its share of its unconsolidated joint ventures) and debt prepayment costs. Since the NAREIT White Paper does not provide guidelines for computing AFFO, the computation of AFFO may vary from one REIT to another. One Liberty believes that FFO and AFFO are useful and standard supplemental measures of the operating performance for equity REITs and are used frequently by securities analysts, investors and other interested parties in evaluating equity REITs, many of which present FFO and AFFO when reporting their operating results. FFO and AFFO are intended to exclude GAAP historical cost depreciation and amortization of real estate assets, which assumes that the value of real estate assets diminish predictability over time. In fact, real estate values have historically risen and fallen with market conditi ons . As a result, management believes that FFO and AFFO provide a performance measure that when compared year over year, should reflect the impact to operations from trends in occupancy rates, rental rates, operating costs, interest costs and other matters without the inclusion of depreciation and amortization, providing a perspective that may not be necessarily apparent from net income. Management also considers FFO and AFFO to be useful in evaluating potential property acquisitions. FFO and AFFO do not represent net income or cash flows from operating, investing or financing activities as defined by GAAP. FFO and AFFO should not be an alternative to net income as a reliable measure of our operating performance nor as an alternative to cash flows as measures of liquidity. FFO and AFFO do not measure whether cash flow is sufficient to fund all of the Company’s cash needs.