Exhibit 99.1
ڏ 1 INVESTOR PRESENTATION APRIL 2022 1liberty.com

◆ 2 TABLE OF CONTENTS DESCRIPTION PAGE Table of Contents Safe Harbor Disclosure Company Overview Experienced Management Team Attractive Portfolio Fundamentals Portfolio Detail Diversified Portfolio Diversified Tenant Base Financial Summary Operational Metrics Growth Oriented Balance Sheet Mortgage Debt Maturities Lease Maturity Profile Stable Occupancy Steady Rental Income Acquisition Track Record 2 3 4 5 6 7 8 9 10 11 12 13 14 15 16 17 DESCRIPTION PAGE 18 19 20 Recent Acquisitions Opportunistic Dispositions Recent Mortgages Case Studies: Acquisition – Fort Myers, FL Acquisition – Omaha, NE Acquisition – Monroe, NC Disposition – West Hartford, CT Summary APPENDICES Top Tenant Profiles: Havertys Furniture FedEx LA Fitness Northern Tool & Equipment NARDA Holdings, Inc. GAAP Reconciliation to FFO & AFFO Non - GAAP Financial Measures 21 22 23 24 25 28 29 30 31 32 34 35

ڏ 3 This presentation contains certain forward - looking statements within the meaning of Section 27 A of the Securities Act of 1933 , as amended, and Section 21 E of the Securities Exchange Act of 1934 , as amended . We intend such forward - looking statements to be covered by the safe harbor provision for forward - looking statements contained in the Private Securities Litigation Reform Act of 1995 and include this statement for purposes of complying with these safe harbor provisions . Forward - looking statements, which are based on certain assumptions and describe our future plans, strategies and expectations, are generally identifiable by use of the words “may,” “will,” “could,” “believe,” “expect,” “intend,” “anticipate,” “estimate,” “project,” or similar expressions or variations thereof and include, without limitations, statements regarding our future estimated rental income, funds from operations, adjusted funds from operations and our dividend . You should not rely on forward - looking statements since they involve known and unknown risks, uncertainties and other factors which are, in some cases, beyond our control and which could materially affect our results of operations, financial condition, cash flows, performance or achievements . Currently, a significant risk and uncertainty we face is the adverse effect of the resurgence of the COVID - 19 pandemic, and the various governmental responses thereto, on our and our tenants’ financial condition, results of operations, cash flows and performance, and the pandemic’s impact on the real estate market, global economy and financial markets . Additional uncertainties, risks and factors which may cause actual results to differ materially from current expectations are contained in our SEC filings, and, in particular, the sections of our Annual Report on Form 10 - K for the year ended December 31 , 2021 , and Quarterly Reports on Form 10 - Q filed thereafter captioned “Risk Factors”, “Cautionary Note Regarding Forward Looking Statements”, and “Management’s Discussion and Analysis of Financial Condition and Results of Operations” . Copies of the SEC filings may be obtained from us or the SEC . We do not undertake to publicly update or revise any forward - looking statements included in this presentation, whether as a result of new information, future events or otherwise . ◆ 3 SAFE HARBOR
ڏ 4 ◆ 4 COMPANY OVERVIEW Fundamentals – focused real estate company Disciplined track record over various economic cycles Active net lease strategy – continued emphasis on industrial properties Experienced management team Alignment of interests - significant insider ownership

◆ 5 EXPERIENCED MANAGEMENT TEAM Patrick J. Callan, Jr. President & CEO Chief Executive Officer since 2008, President since 2006, Director since 2002 Senior Vice President of First Washington Realty Inc. from 2004 to 2005. A joint venture with CalPERS that controlled 100 shopping centers (13 million square feet) which was sold for $2.6 billion to Regency Centers/Macquarie Vice President of Kimco Realty Corporation (NYSE: KIM) from 1998 to 2004, joined in 1987. Responsible for a $3 billion, 200+ shopping center portfolio Lawrence G. Ricketts, Jr. COO & EVP Chief Operating Officer since 2008 and Executive Vice President since 2006 Over $2.5 billion of transaction experience in acquisitions, dispositions and financings David W. Kalish, CPA SVP & CFO Senior Vice President and Chief Financial Officer since 1990 Senior Vice President, Finance of BRT Apartments Corp. (NYSE: BRT) since 1998 and Senior Vice President and Chief Financial Officer of the managing general partner of Gould Investors L.P. since 1990 Matthew J. Gould Chairman Chairman of the Board since June 2013 and Vice Chairman from 2011 through 2013. President and Chief Executive Officer from 1989 to 1999; Senior Vice President from 1999 to 2011 Senior Vice President of BRT Apartments Corp. (NYSE: BRT) since 1993 and Director since 2004 Chairman of the managing general partner of Gould Investors L.P. since January 2013 and President and CEO from 1997 to 2012 Fredric H. Gould Vice Chairman Vice Chairman of the Board since June 2013. Chairman of the Board from 1989 to 2013 Chairman of BRT Apartments Corp. (NYSE: BRT) from 1984 to April 2013 and Director since 1984 Chairman Emeritus of the managing general partner of Gould Investors L.P. since January 2013 and Chairman from 1997 to 2013 Director of EastGroup Properties, Inc. (NYSE: EGP) from 1998 to 2019
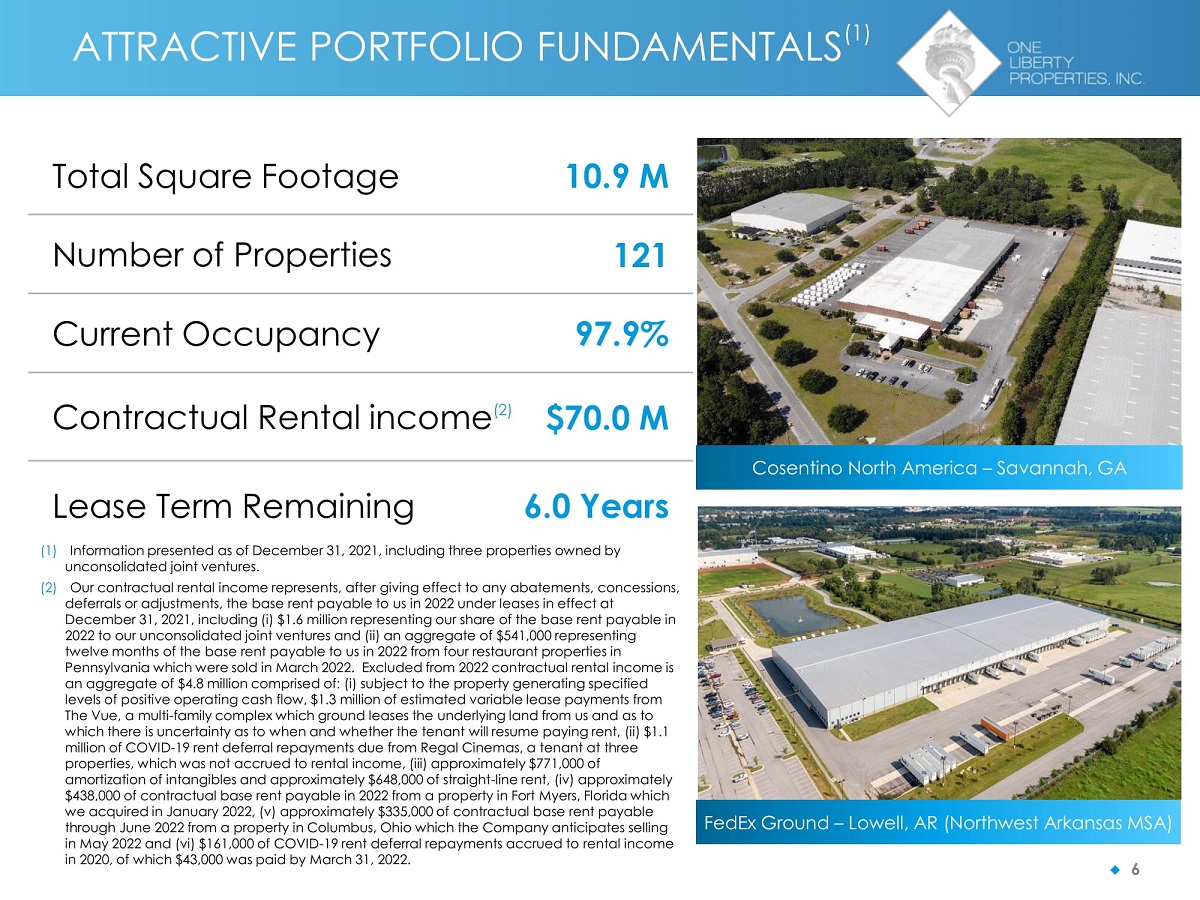
◆ 6 Total Square Footage 10.9 M Number of Properties 121 Current Occupancy 97.9% Contractual Rental income (2) $70.0 M Lease Term Remaining 6.0 Years ATTRACTIVE PORTFOLIO FUNDAMENTALS (1) (1) Information presented as of December 31, 2021, including three properties owned by unconsolidated joint ventures. (2) Our contractual rental income represents, after giving effect to any abatements, concessions, deferrals or adjustments, the base rent payable to us in 2022 under leases in effect at December 31, 2021, including (i) $1.6 million representing our share of the base rent payable in 2022 to our unconsolidated joint ventures and (ii) an aggregate of $541,000 representing twelve months of the base rent payable to us in 2022 from four restaurant properties in Pennsylvania which were sold in March 2022. Excluded from 2022 contractual rental income is an aggregate of $4.8 million comprised of: (i) subject to the property generating specified levels of positive operating cash flow, $1.3 million of estimated variable lease payments from The Vue, a multi - family complex which ground leases the underlying land from us and as to which there is uncertainty as to when and whether the tenant will resume paying rent, (ii) $1.1 million of COVID - 19 rent deferral repayments due from Regal Cinemas, a tenant at three properties, which was not accrued to rental income, (iii) approximately $771,000 of amortization of intangibles and approximately $648,000 of straight - line rent, (iv) approximately $438,000 of contractual base rent payable in 2022 from a property in Fort Myers, Florida which we acquired in January 2022, (v) approximately $335,000 of contractual base rent payable through June 2022 from a property in Columbus, Ohio which the Company anticipates selling in May 2022 and (vi) $161,000 of COVID - 19 rent deferral repayments accrued to rental income in 2020, of which $43,000 was paid by March 31, 2022. Cosentino North America – Savannah, GA FedEx Ground – Lowell, AR (Northwest Arkansas MSA)

(1) Includes $541,000 of contractual rental income from 4 Wendy’s restaurant properties which were sold in March 2022 (2) Though we have three theaters, one is part of a multi - tenant shopping center property in Manahawkin, NJ and is therefore excluded from this column (3) The contractual rental income associated with the theater in Manahawkin, NJ is included (4) Other is comprised of a veterinary hospital, an office and a ground lease for The Vue, an apartment complex. ◆ 7 PORTFOLIO DETAIL Type of Property Number of Properties Contractual Rental Income % of Contractual Rental Income Industrial 49 $39,476,238 56.4% Retail – General 30 12,981,313 18.6 – Furniture 14 4,845,145 6.9 – Office Supply 5 2,085,527 3.0 Restaurants 15 (1) 3,525,769 5.0 Health & Fitness 3 3,238,489 4.6 Theater 2 (2) 2,136,903 (3) 3.1 Other (4) 3 1,669,922 2.4 121 $69,959,306 100.0%
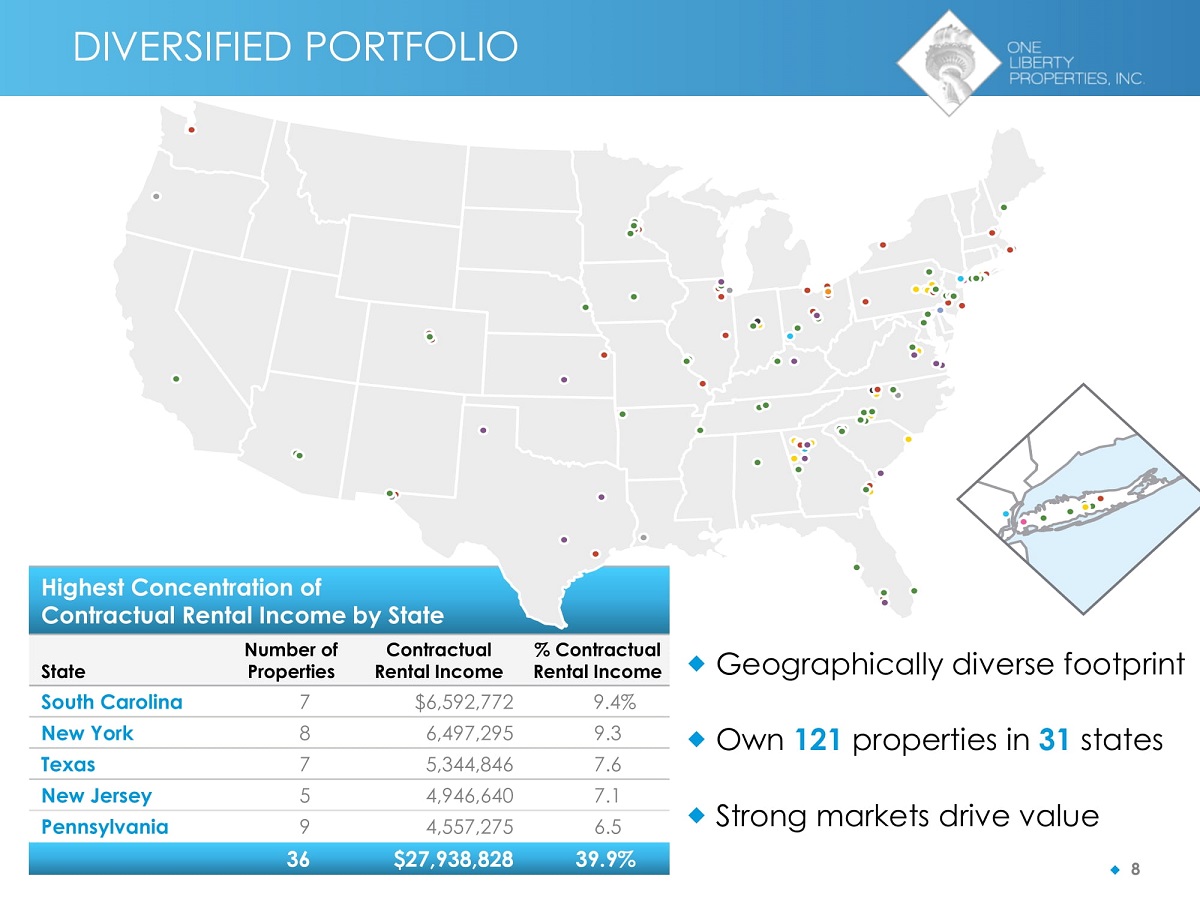
Geographically diverse footprint Own 121 properties in 31 states Strong markets drive value ◆ 8 DIVERSIFIED PORTFOLIO Highest Concentration of Contractual Rental Income by State State Number of Properties Contractual Rental Income % Contractual Rental Income South Carolina 7 $6,592,772 9.4% New York 8 6,497,295 9.3 Texas 7 5,344,846 7.6 New Jersey 5 4,946,640 7.1 Pennsylvania 9 4,557,275 6.5 36 $27,938,828 39.9%
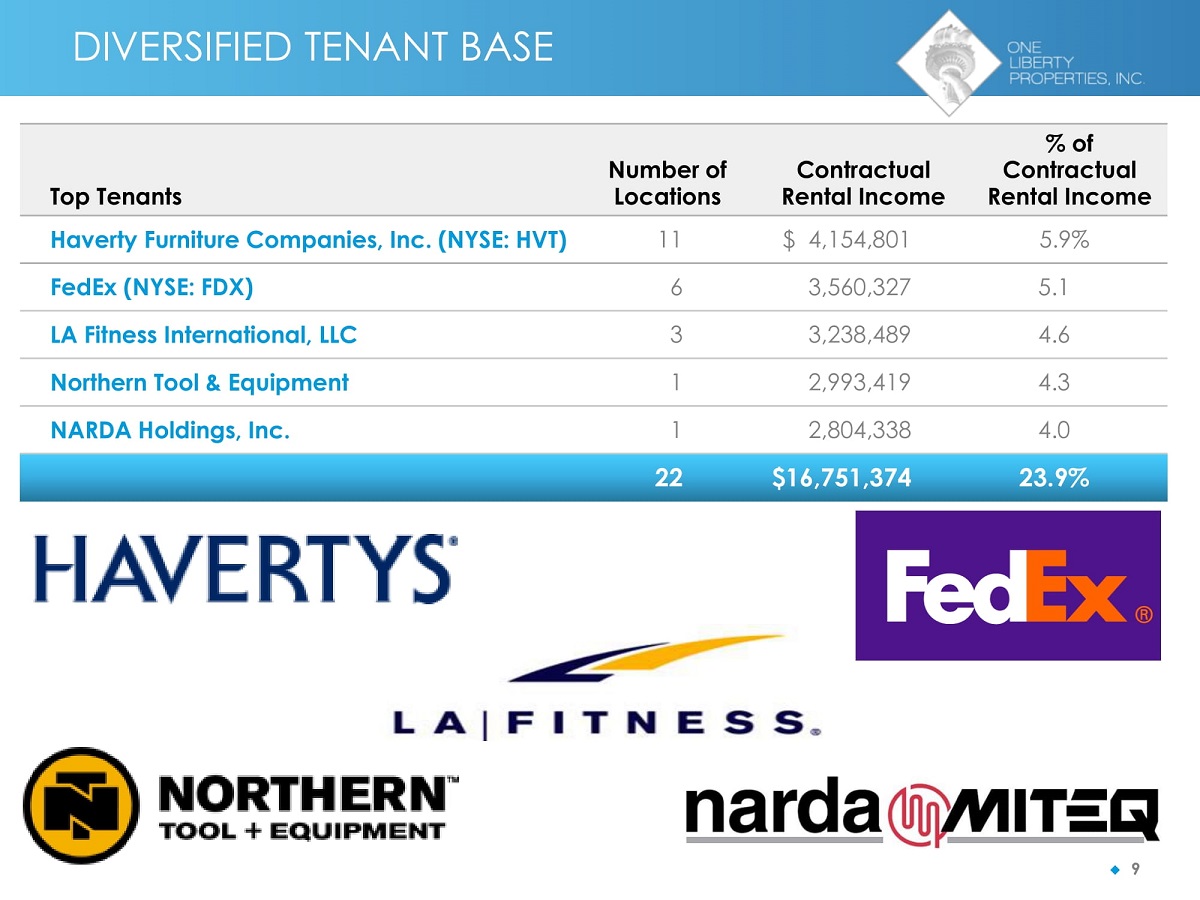
◆ 9 DIVERSIFIED TENANT BASE Top Tenants Number of Locations Contractual Rental Income % of Contractual Rental Income Haverty Furniture Companies, Inc. (NYSE: HVT) 11 $ 4,154,801 5.9% FedEx (NYSE: FDX) 6 3,560,327 5.1 LA Fitness International, LLC 3 3,238,489 4.6 Northern Tool & Equipment 1 2,993,419 4.3 NARDA Holdings, Inc. 1 2,804,338 4.0 22 $16,751,374 23.9%

◆ 10 FINANCIAL SUMMARY Market Cap (1) $647.1 M Shares Outstanding (1) 21.1 M Insider Ownership (2) 22.8% Current Annualized Dividend $1.80 Dividend Yield (3) 5.9% (1) Market cap is calculated using the shares outstanding and the closing OLP stock price of $30.63 at April 14, 2022 (2) Calculated as of April 14, 2022 (3) Calculated using the closing OLP stock price of $30.63 at April 14, 2022 Applied Control Equipment – Denver, CO Campania International / U.S. Tape – Philadelphia, PA

◆ 11 OPERATIONAL METRICS (1)(2) $0.88 $1.33 $1.85 $0.00 $0.40 $0.80 $1.20 $1.05 $1.60 $2.00 2018 2019 2020 2021 Historical Net Income Per Share $1.98 $1.90 $1.95 $1.60 $1.80 $2.00 $2.20 $2.13 2018 2019 2020 2021 Historical AFFO Per Share AFFO Payout (3) 2018 85% 2019 91% 2020 95% 2021 92% (1) For the years ended December 31 (2) A reconciliation of net income per diluted share, as determined in accordance with GAAP, to AFFO per diluted share, may be found at the end of this presentation (3) Impacting the changes in the AFFO payout ratio are distributions of gains on property sales, which gains are excluded from the calculation of AFFO
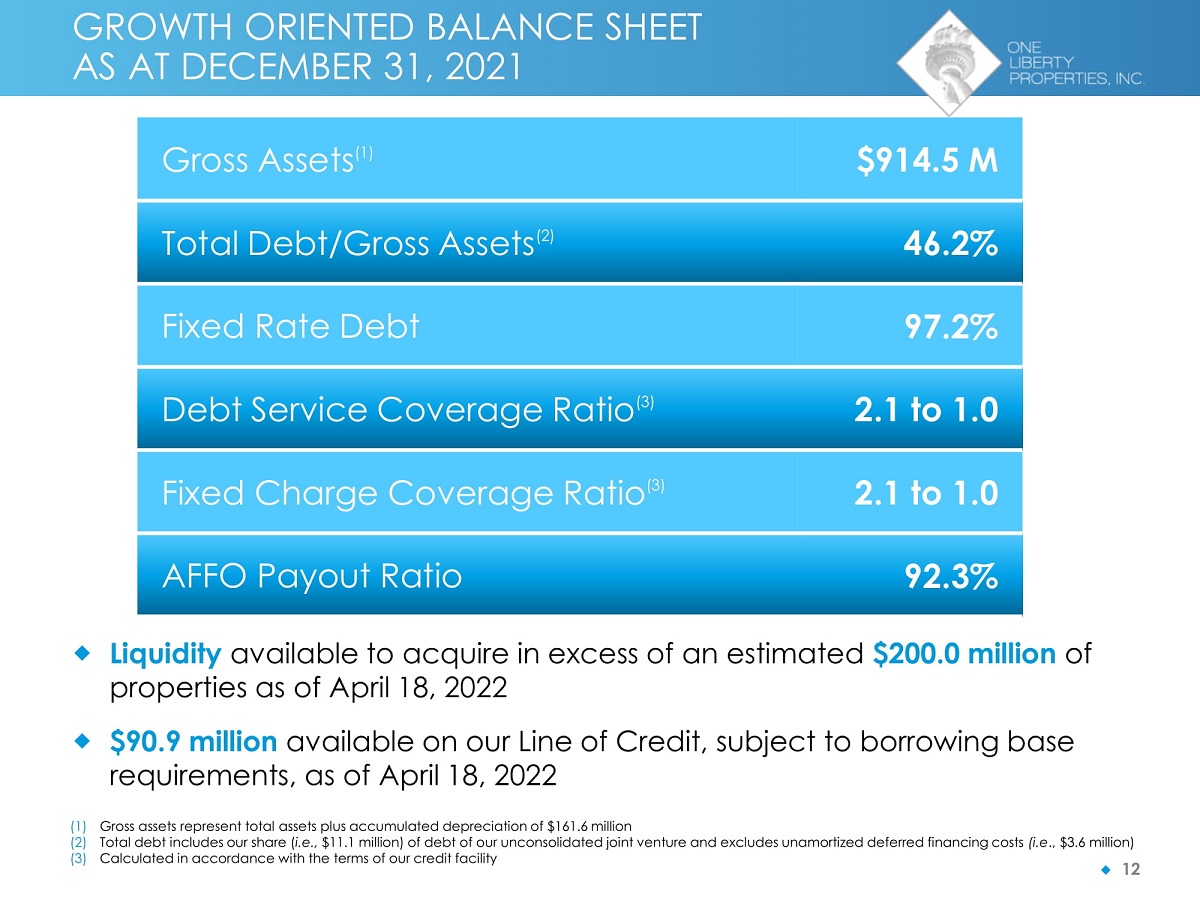
◆ 12 GROWTH ORIENTED BALANCE SHEET AS AT DECEMBER 31, 2021 Gross Assets (1) $914.5 M Total Debt/Gross Assets (2) 46.2% Fixed Rate Debt 97.2% Debt Service Coverage Ratio (3) 2.1 to 1.0 Fixed Charge Coverage Ratio (3) 2.1 to 1.0 AFFO Payout Ratio 92.3% Liquidity available to acquire in excess of an estimated $200.0 million of properties as of April 18, 2022 $90.9 million available on our Line of Credit, subject to borrowing base requirements, as of April 18, 2022 (1) Gross assets represent total assets plus accumulated depreciation of $161.6 million (2) Total debt includes our share ( i.e., $11.1 million) of debt of our unconsolidated joint venture and excludes unamortized deferred financing costs (i.e ., $3.6 million) (3) Calculated in accordance with the terms of our credit facility
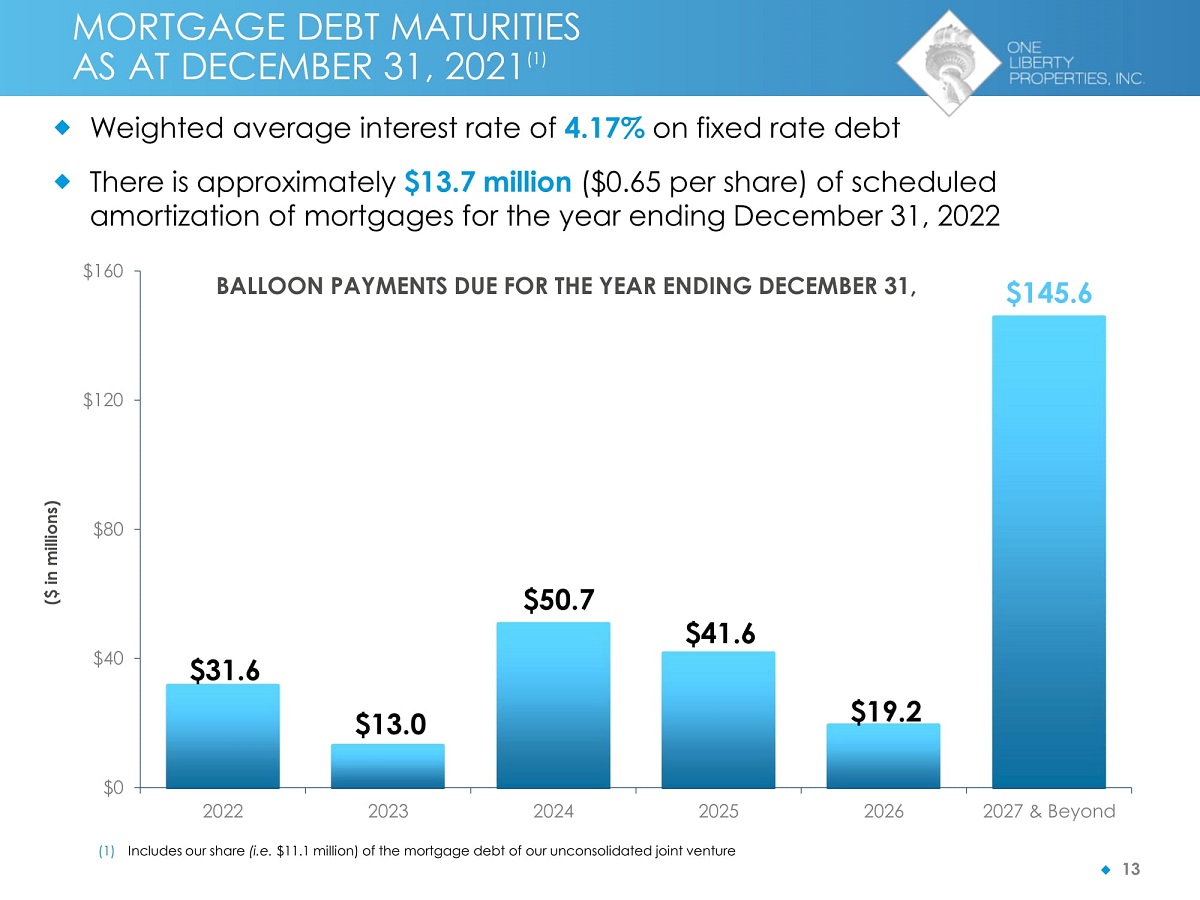
◆ 13 MORTGAGE DEBT MATURITIES AS AT DECEMBER 31, 2021 (1) Weighted average interest rate of 4.17% on fixed rate debt There is approximately $13.7 million ($0.65 per share) of scheduled amortization of mortgages for the year ending December 31, 2022 $31.6 $13.0 $50.7 $41.6 $19.2 $145.6 $0 2022 2023 2024 2025 (1) Includes our share (i.e. $11.1 million) of the mortgage debt of our unconsolidated joint venture $40 $80 $120 $160 2026 2027 & Beyond ($ in millions) BALLOON PAYMENTS DUE FOR THE YEAR ENDING DECEMBER 31,
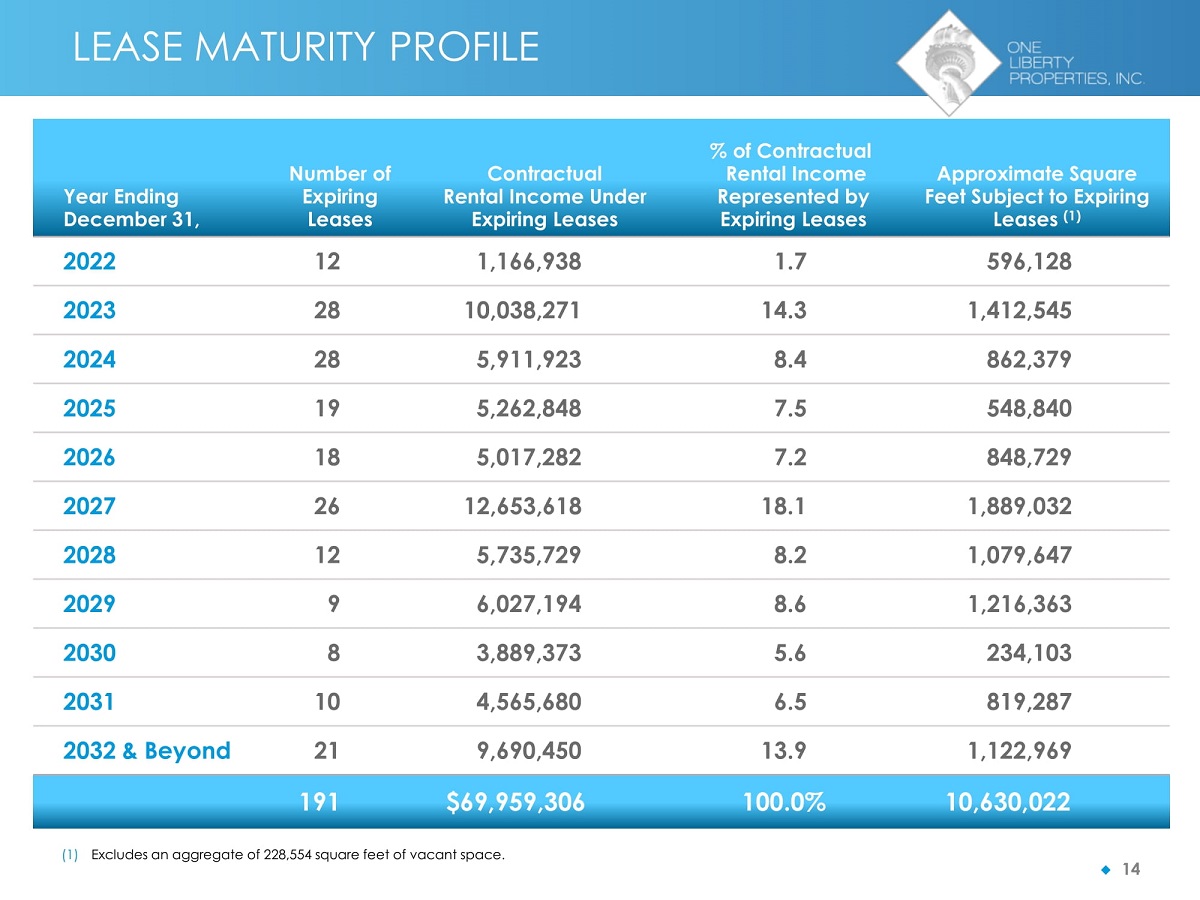
◆ 14 LEASE MATURITY PROFILE Year Ending December 31, Number of Expiring Leases Contractual Rental Income Under Expiring Leases % of Contractual Rental Income Represented by Expiring Leases Approximate Square Feet Subject to Expiring Leases (1) 2022 12 1,166,938 1.7 596,128 2023 28 10,038,271 14.3 1,412,545 2024 28 5,911,923 8.4 862,379 2025 19 5,262,848 7.5 548,840 2026 18 5,017,282 7.2 848,729 2027 26 12,653,618 18.1 1,889,032 2028 12 5,735,729 8.2 1,079,647 2029 9 6,027,194 8.6 1,216,363 2030 8 3,889,373 5.6 234,103 2031 10 4,565,680 6.5 819,287 2032 & Beyond 21 9,690,450 13.9 1,122,969 191 $69,959,306 100.0% 10,630,022 (1) Excludes an aggregate of 228,554 square feet of vacant space.
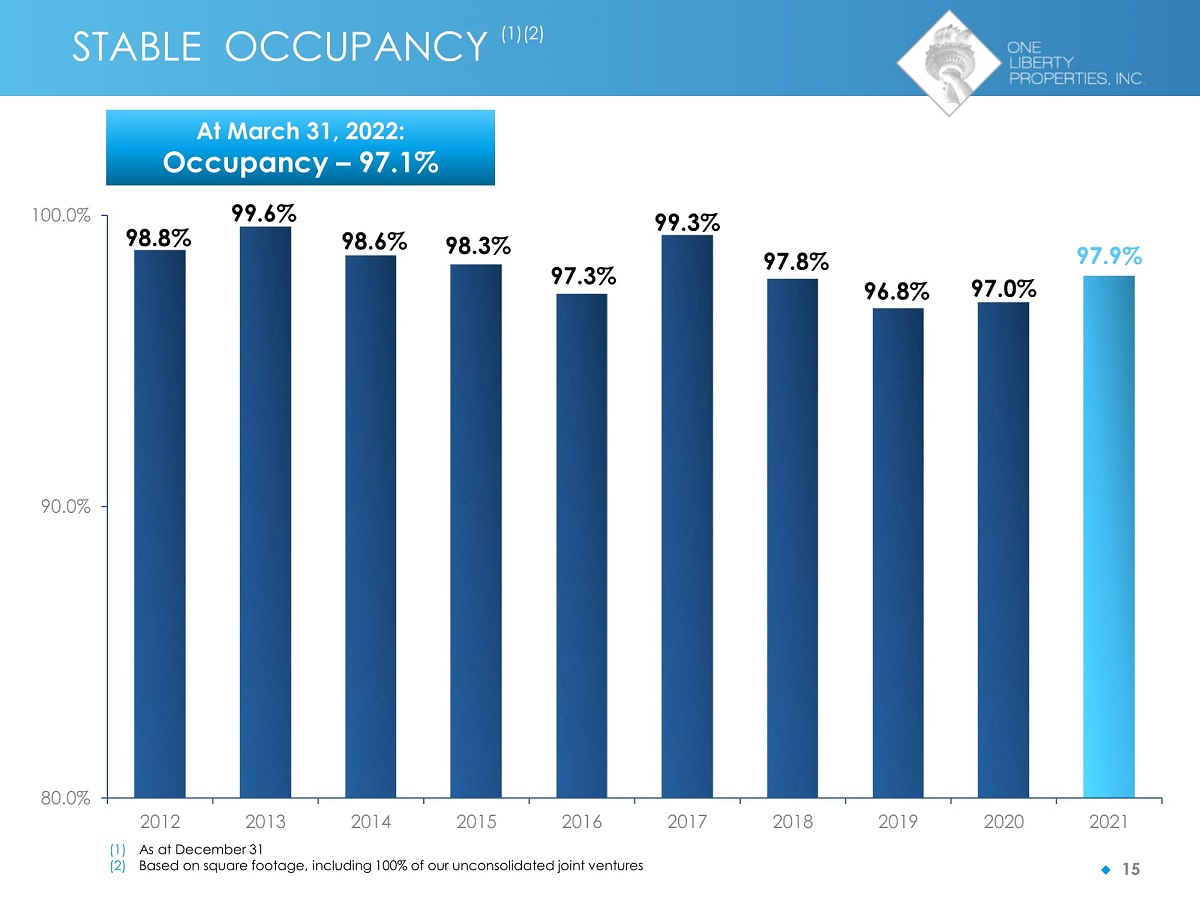
◆ 15 STABLE OCCUPANCY (1)(2) 98.8% 99.6% 98.6% 98.3% 97.3% 99.3% 97.8% 96.8% 97.0% 97.9% 80.0% 90.0% 100.0% 2012 2013 2014 2015 2016 (1) As at December 31 (2) Based on square footage, including 100% of our unconsolidated joint ventures 2017 2018 2019 2020 2021 At March 31, 2022: Occupancy – 97.1%
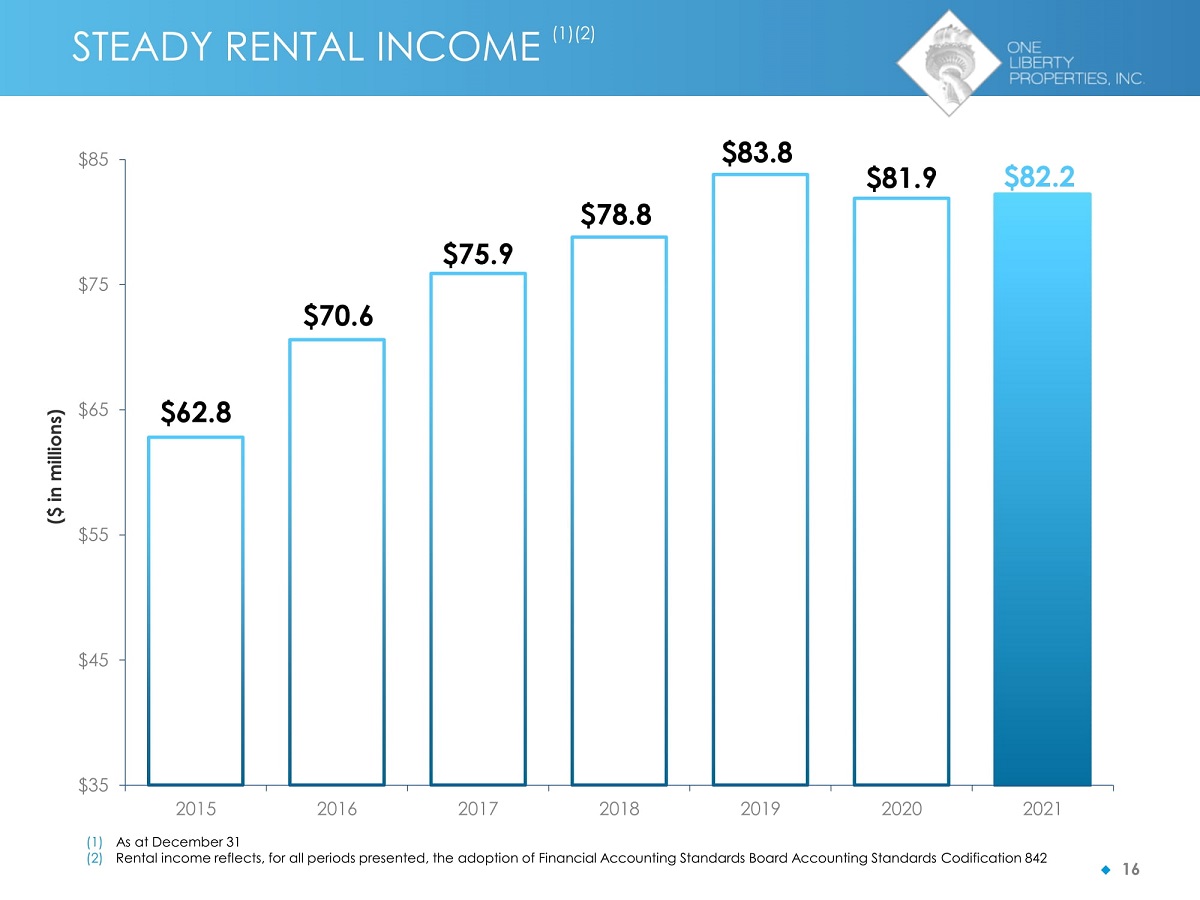
◆ 16 STEADY RENTAL INCOME (1)(2) $62.8 $70.6 $78.8 $75.9 $83.8 $81.9 $82.2 $35 $45 $55 $65 $75 $85 2015 2016 2017 2018 2019 2020 2021 (1) As at December 31 (2) Rental income reflects, for all periods presented, the adoption of Financial Accounting Standards Board Accounting Standards Codification 842 ($ in millions)

2021 ◆ 17 ACQUISITION TRACK RECORD $56.8 (1) $95.2 $118.6 $43.2 $79.5 $49.3 $28.3 $24.3 $0 $20 $40 $60 $80 $100 $120 2014 2015 2016 2017 (1) Includes our 50% share of an unconsolidated joint venture property in Manahawkin, NJ 2018 2019 2020 ($ in millions) ACQUISITIONS PER YEAR

◆ 18 RECENT ACQUISITIONS (1) Date Acquired Property Type Tenant (or d/b/a) MSA State Current Lease Expiration Purchase Price (in ‘000s) Yield (2) 01/05/22 Industrial Conditioned Air Company of Naples, LLC Fort Myers FL 07/31/30 $ 8,100 6.2% 11/12/21 Industrial Home Depot U.S.A., Inc. Omaha NE 12/31/23 $ 7,975 6.8% 09/29/21 Industrial Carroll’s LLC / Advanced Hurricane Technology, Inc. Fort Myers FL 10/31/24 / 06/30/26 $ 9,355 7.1% 05/27/21 Industrial Pureon, Inc. Charlotte NC 05/31/27 $ 7,000 7.8% 02/24/20 Industrial FedEx Northwest Arkansas AR 07/23/27 $19,150 6.4% 02/20/20 Industrial Creative Office Environments Richmond VA 09/30/34 $ 9,100 7.8% 10/23/19 Industrial The Door Mill Phoenix AZ 06/30/24 $ 3,000 7.3% 10/03/19 Industrial Cosentino North America Savannah GA 03/31/29 $ 6,400 7.2% 09/13/19 Industrial Continental Hydraulics Minneapolis MN 02/28/33 $ 8,000 7.3% 07/24/19 Industrial Nissan North America, Inc. Troup County GA 12/31/28 $ 5,200 6.6% 06/26/19 Industrial International Flora Technologies Phoenix AZ 06/30/29 $ 8,650 7.4% (1) See “ - Recent Mortgages” for concurrent or subsequent financing on certain properties (2) Yield represents the annualized straight - line rent over the remaining term of the lease, divided by the purchase price

◆ 19 OPPORTUNISTIC DISPOSITIONS Date Sold Date Acquired Property Type Tenant (or d/b/a) MSA State Gross Sales Price (in ‘000s) Net Gain (in ‘000s) 03/22/22 07/30/10 Restaurant Wendy’s Lebanon PA $ 2,555 $ 1,200 03/22/22 07/30/10 Restaurant Wendy’s Reading PA $ 2,525 $ 1,184 03/22/22 07/30/10 Restaurant Wendy’s Reading PA $ 2,485 $ 1,175 03/22/22 08/31/10 Restaurant Wendy’s Allentown PA $ 2,435 $ 1,090 TOTALS – THREE MONTHS ENDED MARCH 31, 2022 $10,000 $ 4,649 12/27/21 08/31/10 Restaurant Wendy’s York PA $ 2,885 $ 1,364 12/27/21 08/31/10 Restaurant Wendy’s York PA $ 2,815 $ 1,331 07/12/21 09/27/06 Restaurant Texas Roadhouse Savannah GA $ 2,692 $ 1,610 (1) 07/01/21 10/24/14 Retail Vacant Philadelphia PA $ 8,300 $ 1,299 (2) 06/17/21 10/07/10 Retail Whole Foods West Hartford CT $ 40,510 $21,469 TOTALS – YTD 2021 $57,202 $27,073 12/15/20 11/17/10 Retail PetSmart Houston TX $ 4,013 $ 1,067 12/15/20 11/17/10 Retail Guitar Center Houston TX $ 5,212 $ 1,645 07/01/20 03/31/04 Retail CarMax Knoxville TN $ 18,000 $10,316 03/02/20 06/18/08 Retail Lanier Realty, Inc. Savannah GA $ 825 $ 242 (3) 02/11/20 11/30/04 Retail Hobby Lobby La Crosse County WI $ 7,115 $ 4,252 TOTALS – YTD 2020 $35,165 $17,522 (1) Represents 100% of the gain on the sale of a portion of the land owned by an unconsolidated joint venture in which we have a 50% interest. Our share of the gain was approximately $805,000. (2) Represents 100% of the gain on the sale of a property owned by a consolidated joint venture in which we had a 90% interest. Our share of the gain was approximately $1.2 million. (3) Represents 100% of the gain on the sale of a property owned by an unconsolidated joint venture in which we had a 50% interest. Our share of the gain was $121,000.
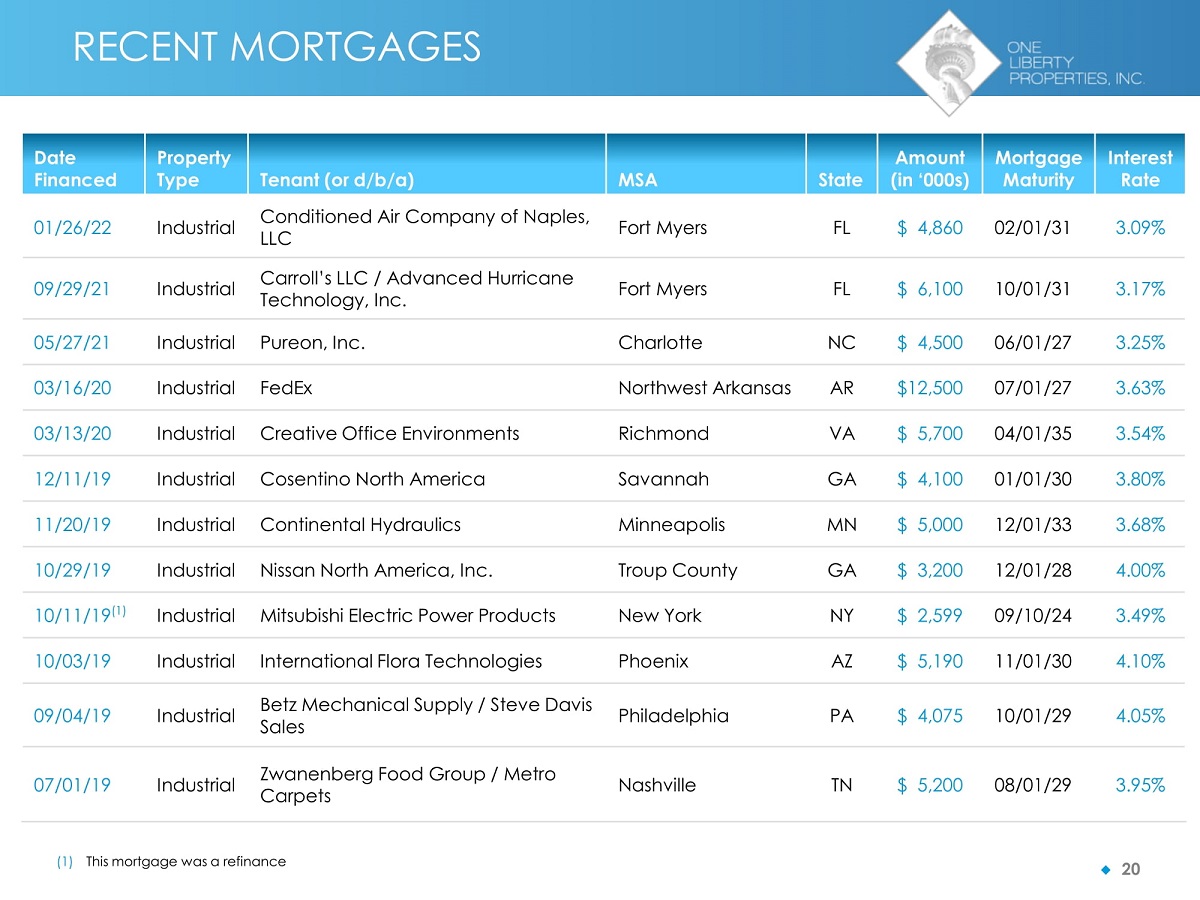
◆ 20 RECENT MORTGAGES Date Financed Property Type Tenant (or d/b/a) MSA State Amount (in ‘000s) Mortgage Maturity Interest Rate 01/26/22 Industrial Conditioned Air Company of Naples, LLC Fort Myers FL $ 4,860 02/01/31 3.09% 09/29/21 Industrial Carroll’s LLC / Advanced Hurricane Technology, Inc. Fort Myers FL $ 6,100 10/01/31 3.17% 05/27/21 Industrial Pureon, Inc. Charlotte NC $ 4,500 06/01/27 3.25% 03/16/20 Industrial FedEx Northwest Arkansas AR $12,500 07/01/27 3.63% 03/13/20 Industrial Creative Office Environments Richmond VA $ 5,700 04/01/35 3.54% 12/11/19 Industrial Cosentino North America Savannah GA $ 4,100 01/01/30 3.80% 11/20/19 Industrial Continental Hydraulics Minneapolis MN $ 5,000 12/01/33 3.68% 10/29/19 Industrial Nissan North America, Inc. Troup County GA $ 3,200 12/01/28 4.00% 10/11/19 (1) Industrial Mitsubishi Electric Power Products New York NY $ 2,599 09/10/24 3.49% 10/03/19 Industrial International Flora Technologies Phoenix AZ $ 5,190 11/01/30 4.10% 09/04/19 Industrial Betz Mechanical Supply / Steve Davis Sales Philadelphia PA $ 4,075 10/01/29 4.05% 07/01/19 Industrial Zwanenberg Food Group / Metro Carpets Nashville TN $ 5,200 08/01/29 3.95% (1) This mortgage was a refinance
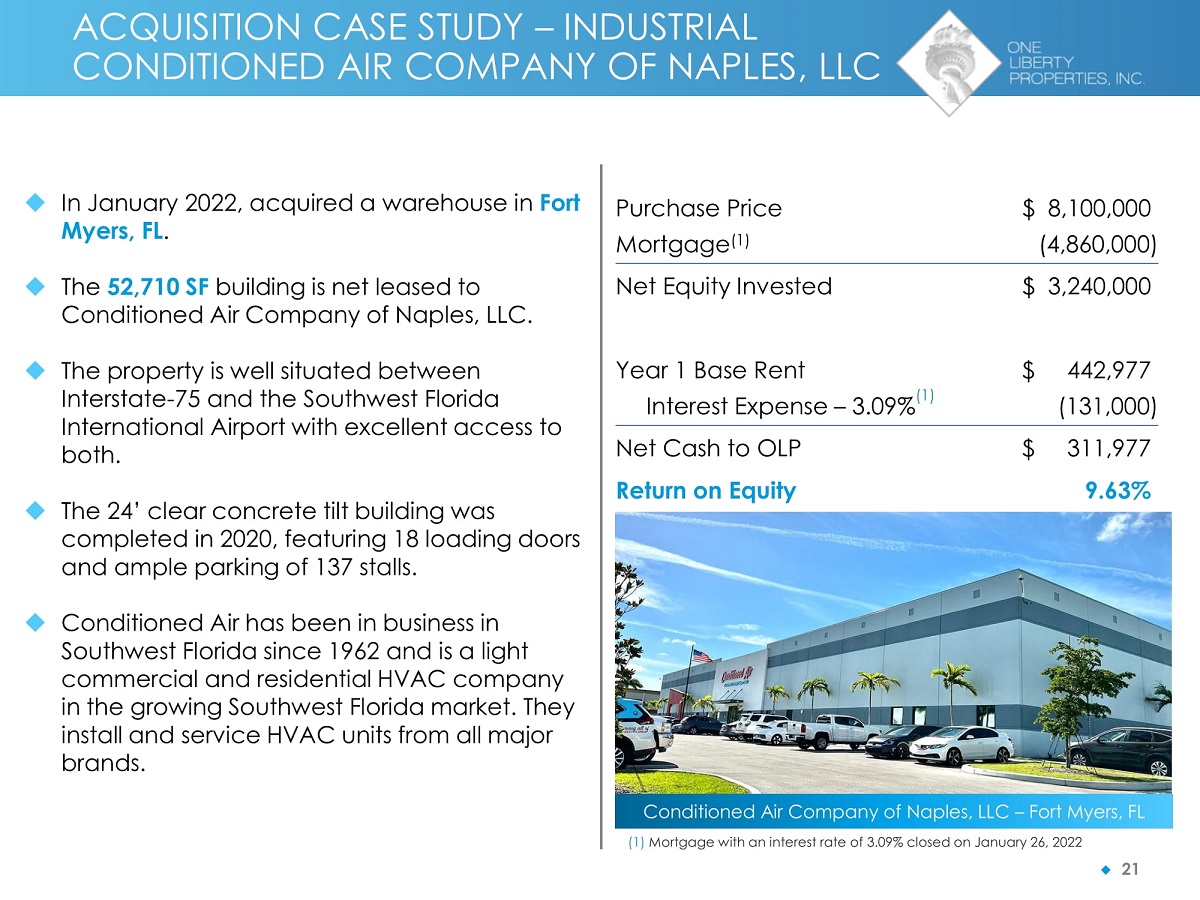
ACQUISITION CASE STUDY – INDUSTRIAL CONDITIONED AIR COMPANY OF NAPLES, LLC Purchase Price $ 8,100,000 Mortgage (1) (4,860,000) Net Equity Invested $ 3,240,000 Year 1 Base Rent $ 442,977 Interest Expense – 3.09% (1) (131,000) Net Cash to OLP $ 311,977 Return on Equity 9.63% In January 2022, acquired a warehouse in Fort Myers, FL . The 52,710 SF building is net leased to Conditioned Air Company of Naples, LLC. The property is well situated between Interstate - 75 and the Southwest Florida International Airport with excellent access to both. The 24’ clear concrete tilt building was completed in 2020, featuring 18 loading doors and ample parking of 137 stalls. Conditioned Air has been in business in Southwest Florida since 1962 and is a light commercial and residential HVAC company in the growing Southwest Florida market. They install and service HVAC units from all major brands. Conditioned Air Company of Naples, LLC – Fort Myers, FL (1) Mortgage with an interest rate of 3.09% closed on January 26, 2022 ◆ 21
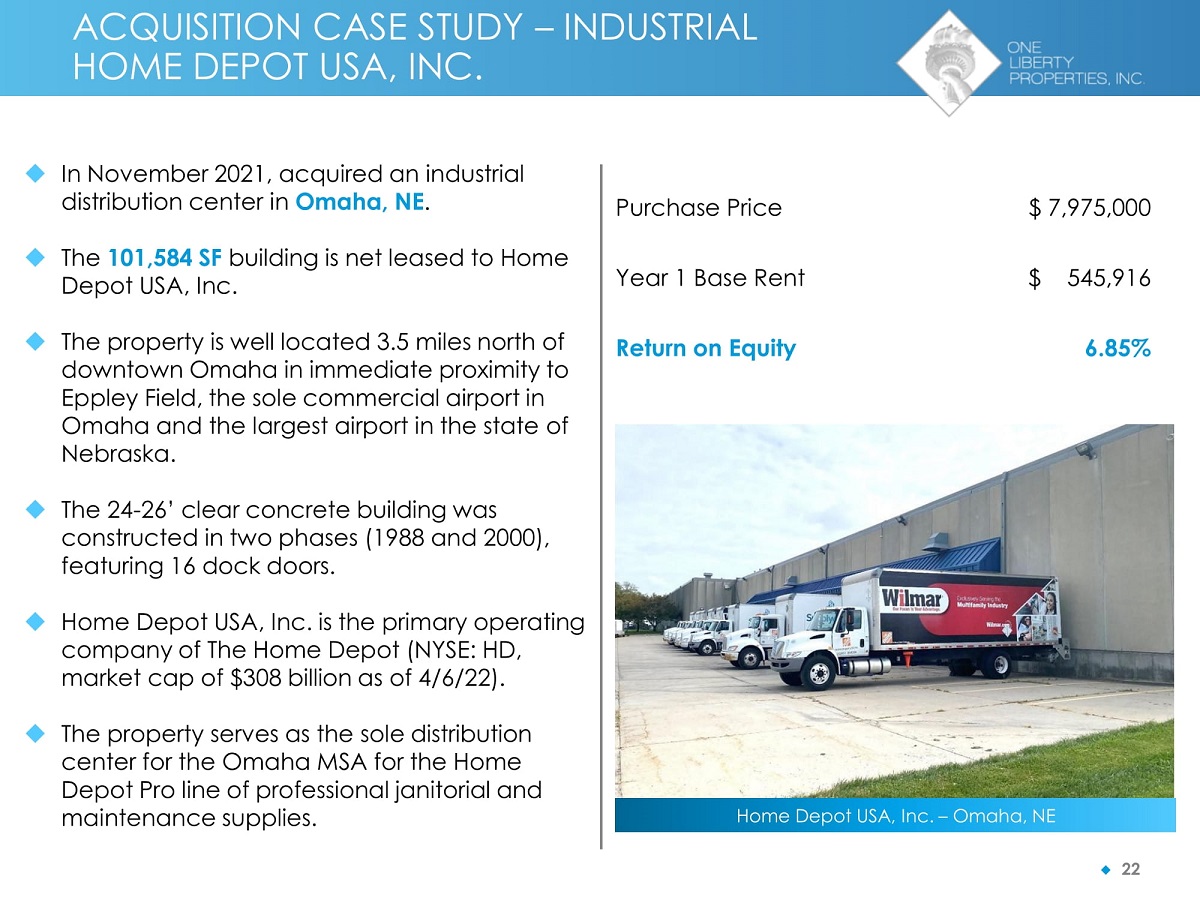
◆ 22 ACQUISITION CASE STUDY – INDUSTRIAL HOME DEPOT USA, INC. Purchase Price $ 7,975,000 Year 1 Base Rent $ 545,916 Return on Equity 6.85% In November 2021, acquired an industrial distribution center in Omaha, NE . The 101,584 SF building is net leased to Home Depot USA, Inc. The property is well located 3.5 miles north of downtown Omaha in immediate proximity to Eppley Field, the sole commercial airport in Omaha and the largest airport in the state of Nebraska. The 24 - 26’ clear concrete building was constructed in two phases (1988 and 2000), featuring 16 dock doors. Home Depot USA, Inc. is the primary operating company of The Home Depot (NYSE: HD, market cap of $308 billion as of 4/6/22). The property serves as the sole distribution center for the Omaha MSA for the Home Depot Pro line of professional janitorial and maintenance supplies. Home Depot USA, Inc. – Omaha, NE

(1) Mortgage with an interest rate of 3.25% closed simultaneously with the acquisition ◆ 23 ACQUISITION CASE STUDY – INDUSTRIAL PUREON, INC. Purchase Price $ 7,000,000 Mortgage (1) (4,500,000) Net Equity Invested $ 2,500,000 Year 1 Base Rent $ 506,760 Interest Expense – 3.25% (1) (144,500) Net Cash to OLP $ 362,260 Return on Equity 14.49% In May 2021, acquired an industrial building in Monroe, NC (Charlotte MSA). The 93,170 SF building is net leased to Pureon, Inc. The property is well located in the rapidly growing Charlotte suburb of Monroe – 7 miles south of the I - 485 beltway. The 24 ’ concrete tilt building was completed in 1998 , featuring 8 dock doors and 1 drive - in door . Pureon (FKA Eminess Technologies) is a manufacturer of advanced high quality surface polishing materials for high tech industries including semi - conductors, optics, electronics, medical devices and luxury goods industries. » In 2020, the tenant extended their lease for 7 years at this facility. » The lease provides for 3.0% annual rent increases. Pureon, Inc. – Monroe, NC (Charlotte MSA)
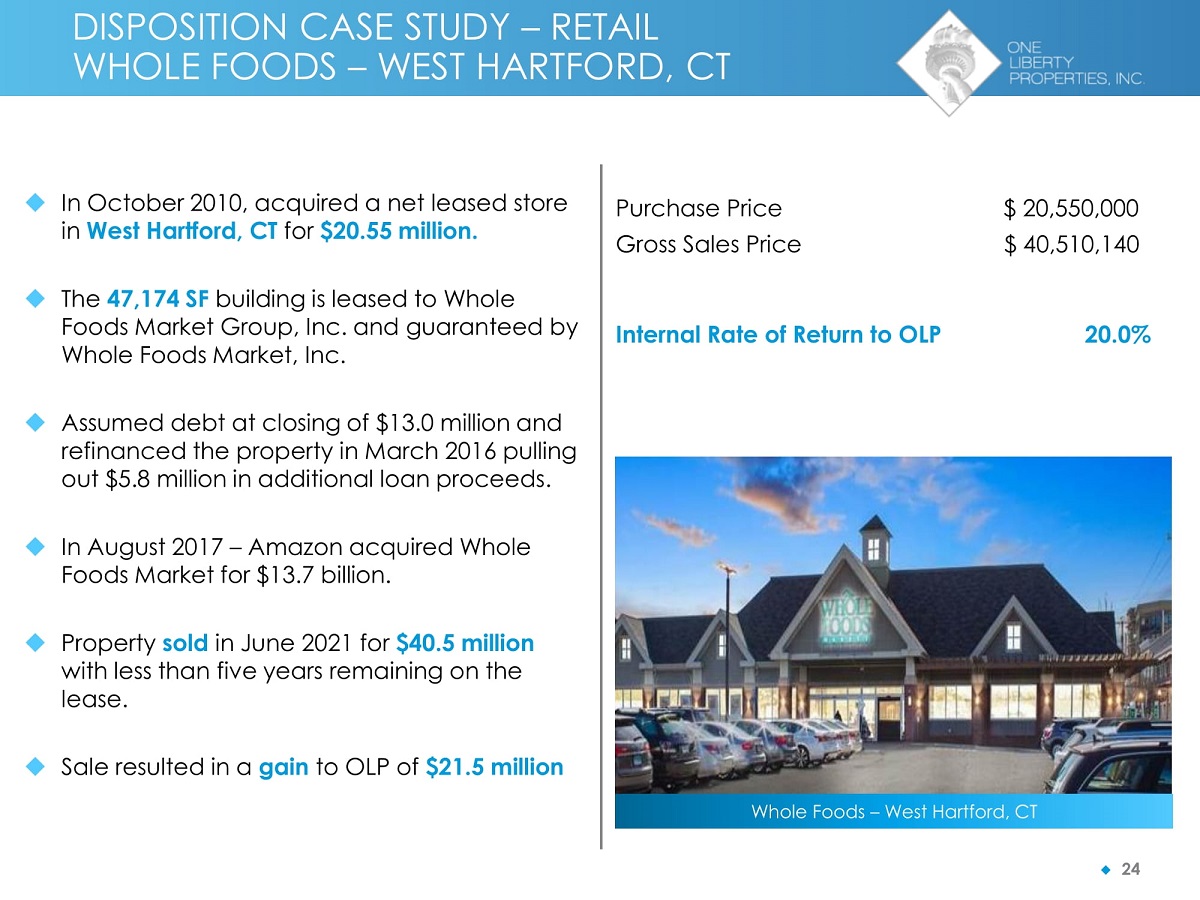
DISPOSITION CASE STUDY – RETAIL WHOLE FOODS – WEST HARTFORD, CT In October 2010, acquired a net leased store in West Hartford, CT for $20.55 million. The 47,174 SF building is leased to Whole Foods Market Group, Inc. and guaranteed by Whole Foods Market, Inc. Assumed debt at closing of $13.0 million and refinanced the property in March 2016 pulling out $5.8 million in additional loan proceeds. In August 2017 – Amazon acquired Whole Foods Market for $13.7 billion. Property sold in June 2021 for $40.5 million with less than five years remaining on the lease. Sale resulted in a gain to OLP of $21.5 million Whole Foods – West Hartford, CT ◆ 24 Purchase Price $ 20,550,000 Gross Sales Price $ 40,510,140 Internal Rate of Return to OLP 20.0%

ڏ 25 ◆ 25 SUMMARY – WHY OLP? Fundamentals – focused real estate company Disciplined track record over various economic cycles Active net lease strategy – continued emphasis on industrial properties Experienced management team Alignment of interests - significant insider ownership

ڏ 26 APPENDICES

ڏ 27 TOP TENANTS’ PROFILES

In June 2021 and February 2022, Havertys signed new leases which, among other things, extended the leases of ten of the eleven properties beyond their August 2022 scheduled expiration. » Generally, the lease extensions run for four to nine years from the August 2022 expiration date. » OLP agreed to invest up to $3.1M for tenant improvements, of which $1.5M was paid in June 2021. (1) The lease on this property expires August 2022 and management’s intention ◆ 28 HAVERTYS FURNITURE – TENANT PROFILE Tenant: Haverty Furniture Companies, Inc . (NYSE: HVT) (Source: Tenant’s website) » Full - service home furnishing retailer founded in 1885 » Public company since 1929 » 120 showrooms in 16 states in the Southern and Midwestern regions » Weathered economic cycles, from recessions to depressions to boom times » Total assets of $686 million and stockholders’ equity of $256 million at 12/31/2021 Haverty – Cedar Park, TX (Austin MSA) Represents 5.9% of contractual rental income 11 properties aggregating 611,930 SF Duluth (Atlanta), GA Wichita, KS Lexington, KY Amarillo, TX Virginia Beach, VA Fayetteville (Atlanta), GA (1) Cedar Park (Austin), TX Tyler, TX Richmond, VA Newport News, VA Bluffton (Hilton Head), SC is to sell this property.
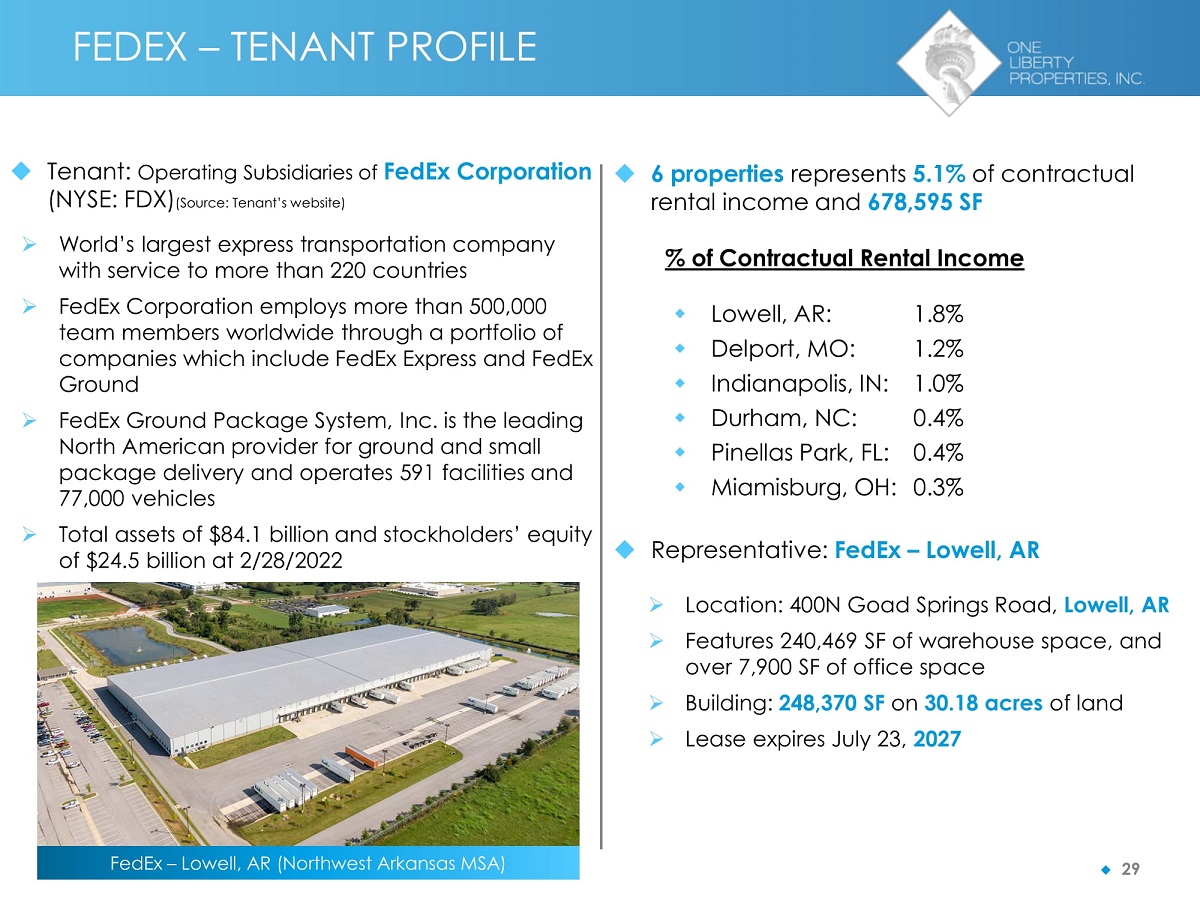
◆ 29 FEDEX – TENANT PROFILE Tenant: Operating Subsidiaries of FedEx Corporation (NYSE: FDX) (Source: Tenant’s website) » World’s largest express transportation company with service to more than 220 countries » FedEx Corporation employs more than 500,000 team members worldwide through a portfolio of companies which include FedEx Express and FedEx Ground » FedEx Ground Package System, Inc. is the leading North American provider for ground and small package delivery and operates 591 facilities and 77,000 vehicles » Total assets of $84.1 billion and stockholders’ equity of $24.5 billion at 2/28/2022 6 properties represents 5.1% of contractual rental income and 678,595 SF % of Contractual Rental Income 1.8% 1.2% 1.0% 0.4% 0.4% Lowell, AR: Delport, MO: Indianapolis, IN: Durham, NC: Pinellas Park, FL: Miamisburg, OH: 0.3% Representative: FedEx – Lowell, AR » Location: 400N Goad Springs Road, Lowell, AR » Features 240,469 SF of warehouse space, and over 7,900 SF of office space » Building: 248,370 SF on 30.18 acres of land » Lease expires July 23, 2027 FedEx – Lowell, AR (Northwest Arkansas MSA)
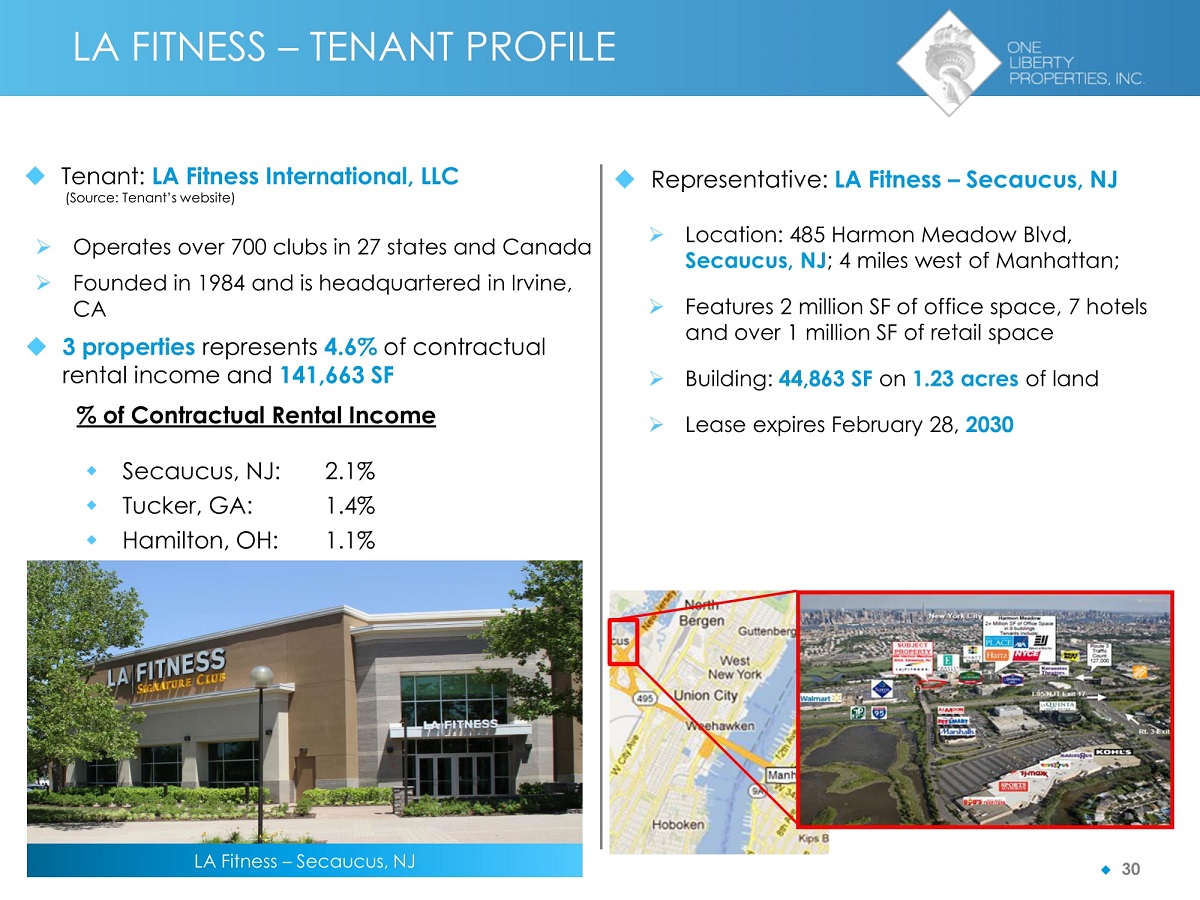
◆ 30 LA FITNESS – TENANT PROFILE Tenant: LA Fitness International, LLC (Source: Tenant’s website) » Operates over 700 clubs in 27 states and Canada » Founded in 1984 and is headquartered in Irvine, CA 3 properties represents 4.6% of contractual rental income and 141,663 SF % of Contractual Rental Income Representative: LA Fitness – Secaucus, NJ » Location: 485 Harmon Meadow Blvd, Secaucus, NJ ; 4 miles west of Manhattan; » Features 2 million SF of office space, 7 hotels and over 1 million SF of retail space » Building: 44,863 SF on 1.23 acres of land » Lease expires February 28, 2030 LA Fitness – Secaucus, NJ Secaucus, NJ: Tucker, GA: Hamilton, OH: 2.1% 1.4% 1.1%
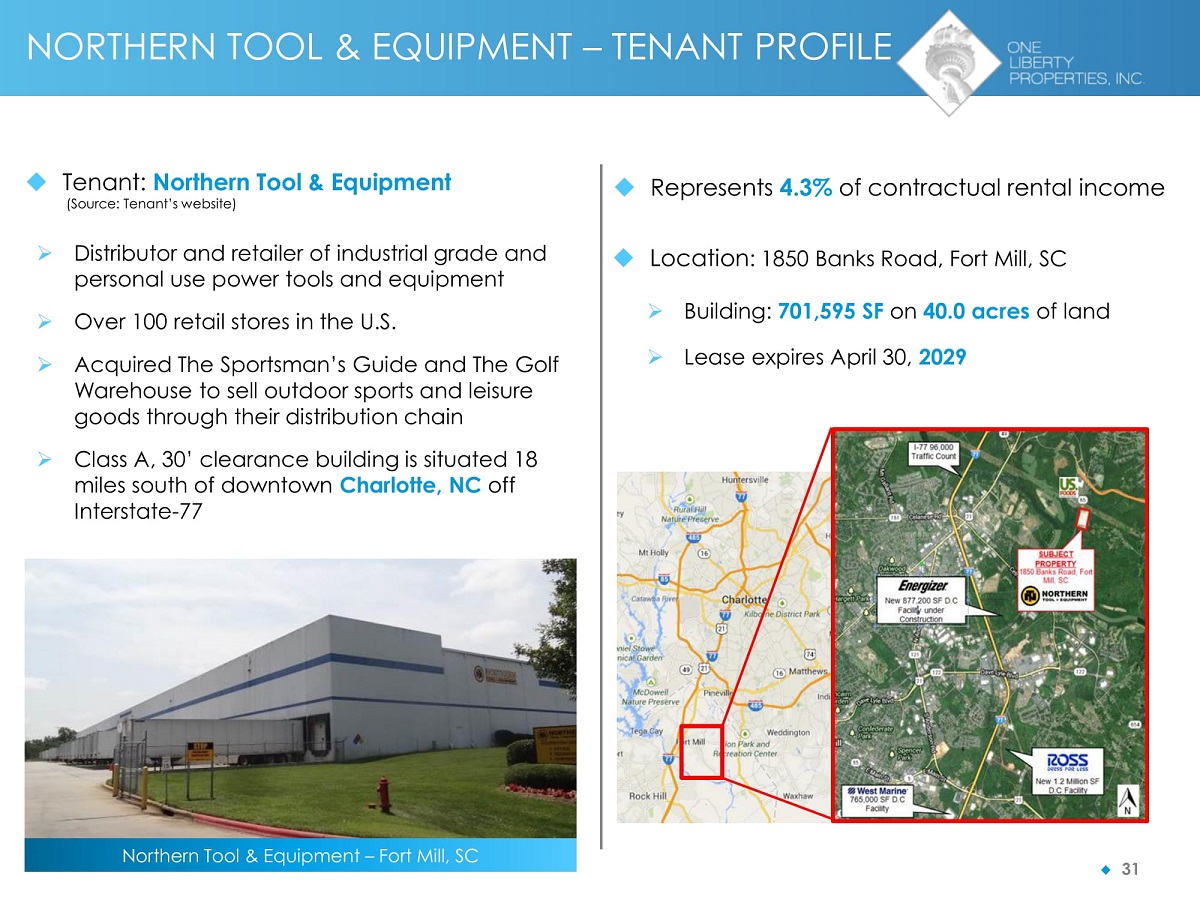
◆ 31 NORTHERN TOOL & EQUIPMENT – TENANT PROFILE Tenant: Northern Tool & Equipment (Source: Tenant’s website) » Distributor and retailer of industrial grade and personal use power tools and equipment » Over 100 retail stores in the U.S. » Acquired The Sportsman’s Guide and The Golf Warehouse to sell outdoor sports and leisure goods through their distribution chain » Class A, 30’ clearance building is situated 18 miles south of downtown Charlotte, NC off Interstate - 77 Represents 4.3% of contractual rental income Location : 1850 Banks Road, Fort Mill, SC » Building: 701,595 SF on 40.0 acres of land » Lease expires April 30, 2029 Northern Tool & Equipment – Fort Mill, SC
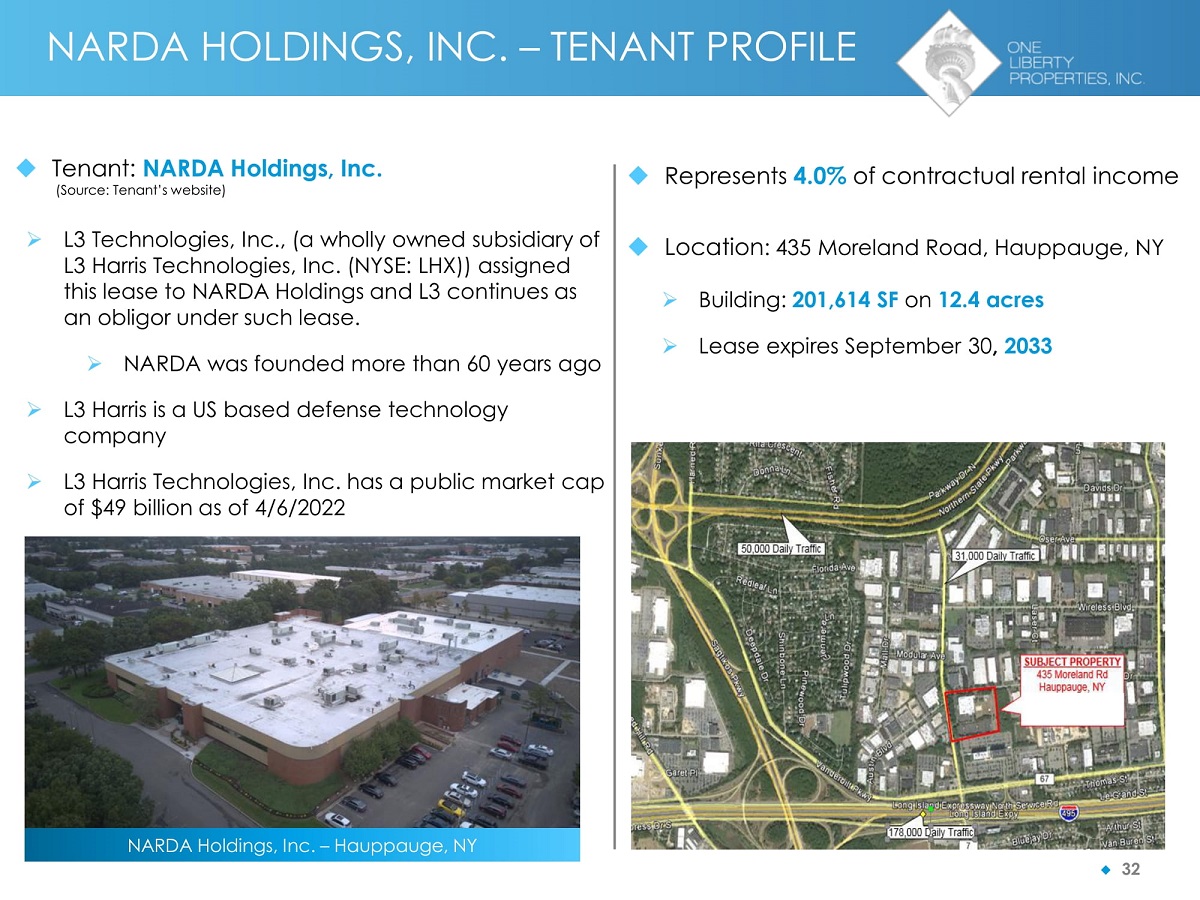
◆ 32 NARDA HOLDINGS, INC. – TENANT PROFILE Tenant: NARDA Holdings, Inc. (Source: Tenant’s website) » L3 Technologies, Inc., (a wholly owned subsidiary of L3 Harris Technologies, Inc. (NYSE: LHX)) assigned this lease to NARDA Holdings and L3 continues as an obligor under such lease. » NARDA was founded more than 60 years ago » L3 Harris is a US based defense technology company » L3 Harris Technologies, Inc. has a public market cap of $49 billion as of 4/6/2022 Represents 4.0% of contractual rental income Location : 435 Moreland Road, Hauppauge, NY » Building: 201,614 SF on 12.4 acres » Lease expires September 30 , 2033 NARDA Holdings, Inc. – Hauppauge, NY
ڏ 33 GAAP RECONCILIATION
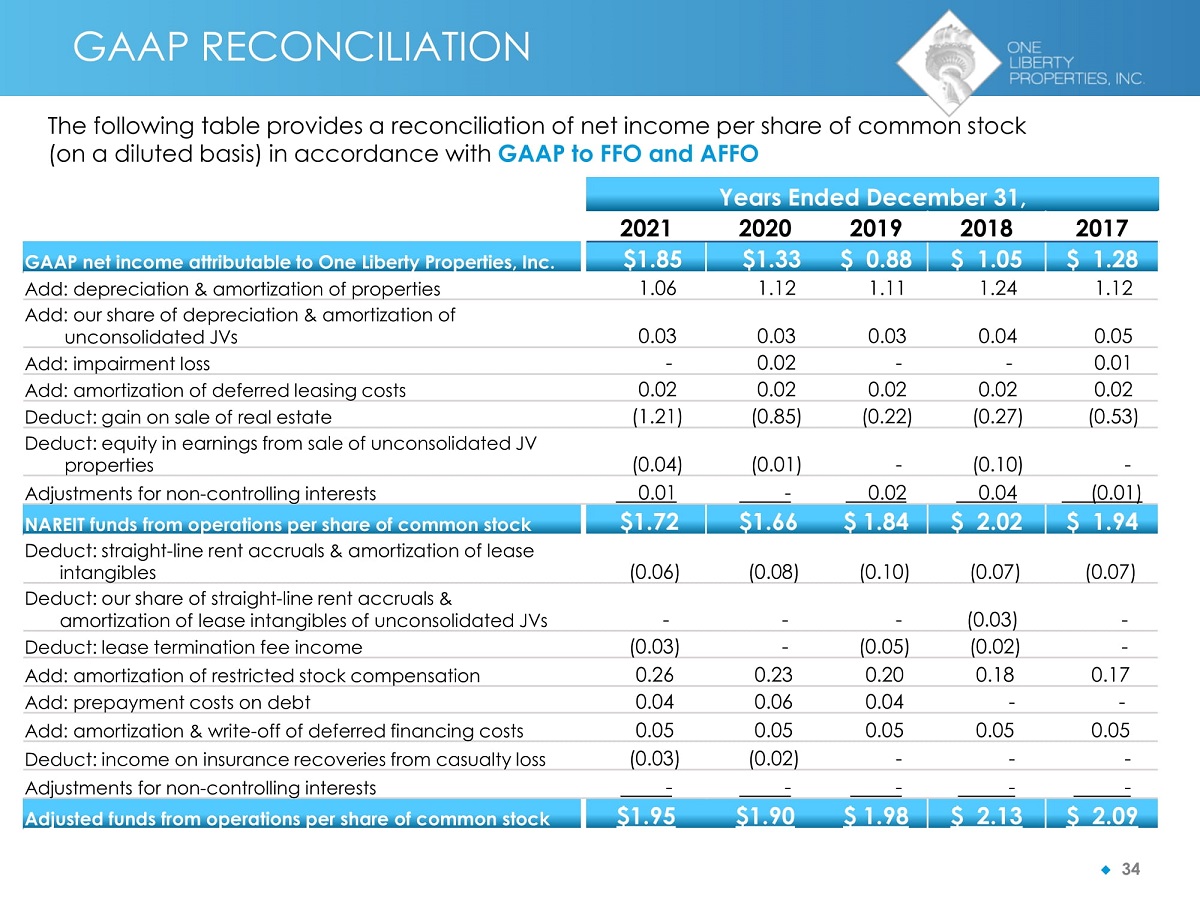
GAAP RECONCILIATION The following table provides a reconciliation of net income per share of common stock (on a diluted basis) in accordance with GAAP to FFO and AFFO Years Ended December 31, 2021 2020 2019 2018 2017 GAAP net income attributable to One Liberty Properties, Inc. $1.85 $1.33 $ 0.88 $ 1.05 $ 1.28 Add: depreciation & amortization of properties 1.06 1.12 1.11 1.24 1.12 Add: our share of depreciation & amortization of unconsolidated JVs 0.03 0.03 0.03 0.04 0.05 Add: impairment loss - 0.02 - - 0.01 Add: amortization of deferred leasing costs 0.02 0.02 0.02 0.02 0.02 Deduct: gain on sale of real estate (1.21) (0.85) (0.22) (0.27) (0.53) Deduct: equity in earnings from sale of unconsolidated JV properties (0.04) (0.01) - (0.10) - Adjustments for non - controlling interests 0.01 - 0.02 0.04 (0.01) NAREIT funds from operations per share of common stock $1.72 $1.66 $ 1.84 $ 2.02 $ 1.94 Deduct: straight - line rent accruals & amortization of lease intangibles (0.06) (0.08) (0.10) (0.07) (0.07) Deduct: our share of straight - line rent accruals & amortization of lease intangibles of unconsolidated JVs - - - (0.03) - Deduct: lease termination fee income (0.03) - (0.05) (0.02) - Add: amortization of restricted stock compensation 0.26 0.23 0.20 0.18 0.17 Add: prepayment costs on debt 0.04 0.06 0.04 - - Add: amortization & write - off of deferred financing costs 0.05 0.05 0.05 0.05 0.05 Deduct: income on insurance recoveries from casualty loss (0.03) (0.02) - - - Adjustments for non - controlling interests - - - - - Adjusted funds from operations per share of common stock $1.95 $1.90 $ 1.98 $ 2.13 $ 2.09 ◆ 34
ڏ 35 One Liberty compute funds from operations, or FFO, in accordance with the “White Paper on Funds From Operations” issued by the National Association of Real Estate Investment Trusts (“NAREIT”) and NAREIT’s related guidance. FFO is defined in the White Paper as net income (calculated in accordance with GAAP), excluding depreciation and amortization related to real estate, gains and losses from the sale of certain real estate assets, gains and losses from change in control, impairment write - downs of certain real estate assets and investments in entities where the impairment is directly attributable to decreases in the value of depreciable real estate held by the entity. Adjustments for unconsolidated partnerships and joint ventures are calculated to reflect FFO on the same basis. In computing FFO, One Liberty does not add back to net income the amortization of costs in connection with its financing activities or depreciation of non - real estate assets. One Liberty computes adjusted funds from operations, or AFFO, by adjusting from FFO for our straight - line rent accruals and amortization of lease intangibles, deducting lease termination fees and adding back amortization of restricted stock and restricted stock unit compensation expense, amortization of costs in connection with its financing activities (including our share of our unconsolidated joint ventures), income on insurance recoveries from casualties and debt prepayment costs. Since the NAREIT White Paper does not provide guidelines for computing AFFO, the computation of AFFO may vary from one REIT to another. One Liberty believes that FFO and AFFO are useful and standard supplemental measures of the operating performance for equity REITs and are used frequently by securities analysts, investors and other interested parties in evaluating equity REITs, many of which present FFO and AFFO when reporting their operating results. FFO and AFFO are intended to exclude GAAP historical cost depreciation and amortization of real estate assets, which assumes that the value of real estate assets diminish predictability over time. In fact, real estate values have historically risen and fallen with market conditions. As a result, management believes that FFO and AFFO provide a performance measure that when compared year over year, should reflect the impact to operations from trends in occupancy rates, rental rates, operating costs, interest costs and other matters without the inclusion of depreciation and amortization, providing a perspective that may not be necessarily apparent from net income. Management also considers FFO and AFFO to be useful in evaluating potential property acquisitions. FFO and AFFO do not represent net income or cash flows from operations as defined by GAAP. FFO and AFFO should not be considered an alternative to net income as a reliable measure of our operating performance; nor should FFO and AFFO be considered an alternative to cash flows from operating, investing or financing activities (as defined by GAAP) as measures of liquidity. FFO and AFFO do not measure whether cash flow is sufficient to fund all of our cash needs, including principal amortization, capital improvements and distributions to stockholders. Management recognizes that there are limitations in the use of FFO and AFFO. In evaluating our performance, management is careful to examine GAAP measures such as net income and cash flows from operating, investing and financing activities. ◆ 35 NON - GAAP FINANCIAL MEASURES