Exhibit 99.1

INVESTOR P R E S E N T A T I O N SEPTEMBE R 2024

O N E L I B E R T Y P R O P E R T I E S , I N C . I N V E S T O R P R E S E N T A T I O N 2 TABLE OF CONTENTS PAGE DESCRIPTION PAGE DESCRIPTION 19 - 20 O p po r t un i st i c D i s po s i t i o n s 2 Ta b l e of Con t ents 21 R ec ent M ortg a g e s 3 S afe H ar bo r D i s c l o su r e Ca s e St u d i es: 4 Co mp any O v er v i ew 22 A c q u i s i tion – Cou n c i l Bluff s, I A 5 E xp er i e n c e d M an a g e m ent Team 23 Le a s i n g & F i na n c i ng – St. L ou i s, M O 6 A t t r a c t i v e P o rtf o li o Fu n damenta l s 24 Le a s i n g – B e n s alem , P A 7 P ortf o li o D eta i l 25 Summary 8 I n du st r i a l Fo c u s ed P o rtf o li o APPENDICES T o p Tenant P rofi l es: FedEx 28 Northern Tool & Equipment 29 NARDA Holdings, Inc. 30 Havertys Furniture 31 LA Fitness 32 GAAP Reconciliation to FFO & AFFO 34 Non - GAAP Financial Measures 35 Geographically Diversified Portfolio 9 Diversified Tenant Base 10 Financial Summary 11 Operational Metrics 12 Growth Positioned Balance Sheet 13 Mortgage Debt Maturities 14 Lease Maturity Profile 15 Stable Occupancy 16 Acquisition Track Record 17 Recent Industrial Acquisitions 18 2

I N V E S T O R P R E S E N T A T I O N O N E L I B E R T Y P R O P E R T I E S , I N C . 3 3 SAFE HARBOR This presentation contains certain forward - looking statements within the meaning of Section 27 A of the Securities Act of 1933 , as amended, and Section 21 E of the Securities Exchange Act of 1934 , as amended . We intend such forward - looking statements to be covered by the safe harbor provision for forward - looking statements contained in the Private Securities Litigation Reform Act of 1995 and include this statement for purposes of complying with these safe harbor provisions . Forward - looking statements, which are based on certain assumptions and describe our future plans, strategies and expectations, are generally identifiable by use of the words “may,” “will,” “could,” “believe,” “expect,” “intend,” “anticipate,” “estimate,” “project,” or similar expressions or variations thereof and include, without limitations, statements regarding our future estimated rental income, funds from operations, adjusted funds from operations and our dividend . You should not rely on forward - looking statements since they involve known and unknown risks, uncertainties and other factors which are, in some cases, beyond our control and which could materially affect our results of operations, financial condition, cash flows, performance or achievements . Uncertainties, risks and factors which may cause actual results to differ materially from current expectations are contained in our SEC filings, and, in particular, the sections of our Annual Report on Form 10 - K for the year ended December 31 , 2023 , and Quarterly Reports on Form 10 - Q filed thereafter captioned “Risk Factors”, “Cautionary Note Regarding Forward Looking Statements”, and “Management’s Discussion and Analysis of Financial Condition and Results of Operations” . Copies of the SEC filings may be obtained from us or the SEC . We do not undertake to publicly update or revise any forward - looking statements included in this presentation, whether as a result of new information, future events or otherwise .
4 1. R e a l Estat e fundamentals focused com p any 2. Focused on i ndu s t r i al pr o pert i es 3. D i s c i p l i ned track r e c ord through e c onom i c cy cl e s 4. Alignment of interest – significant insider ownership COMPANY OVERVIEW
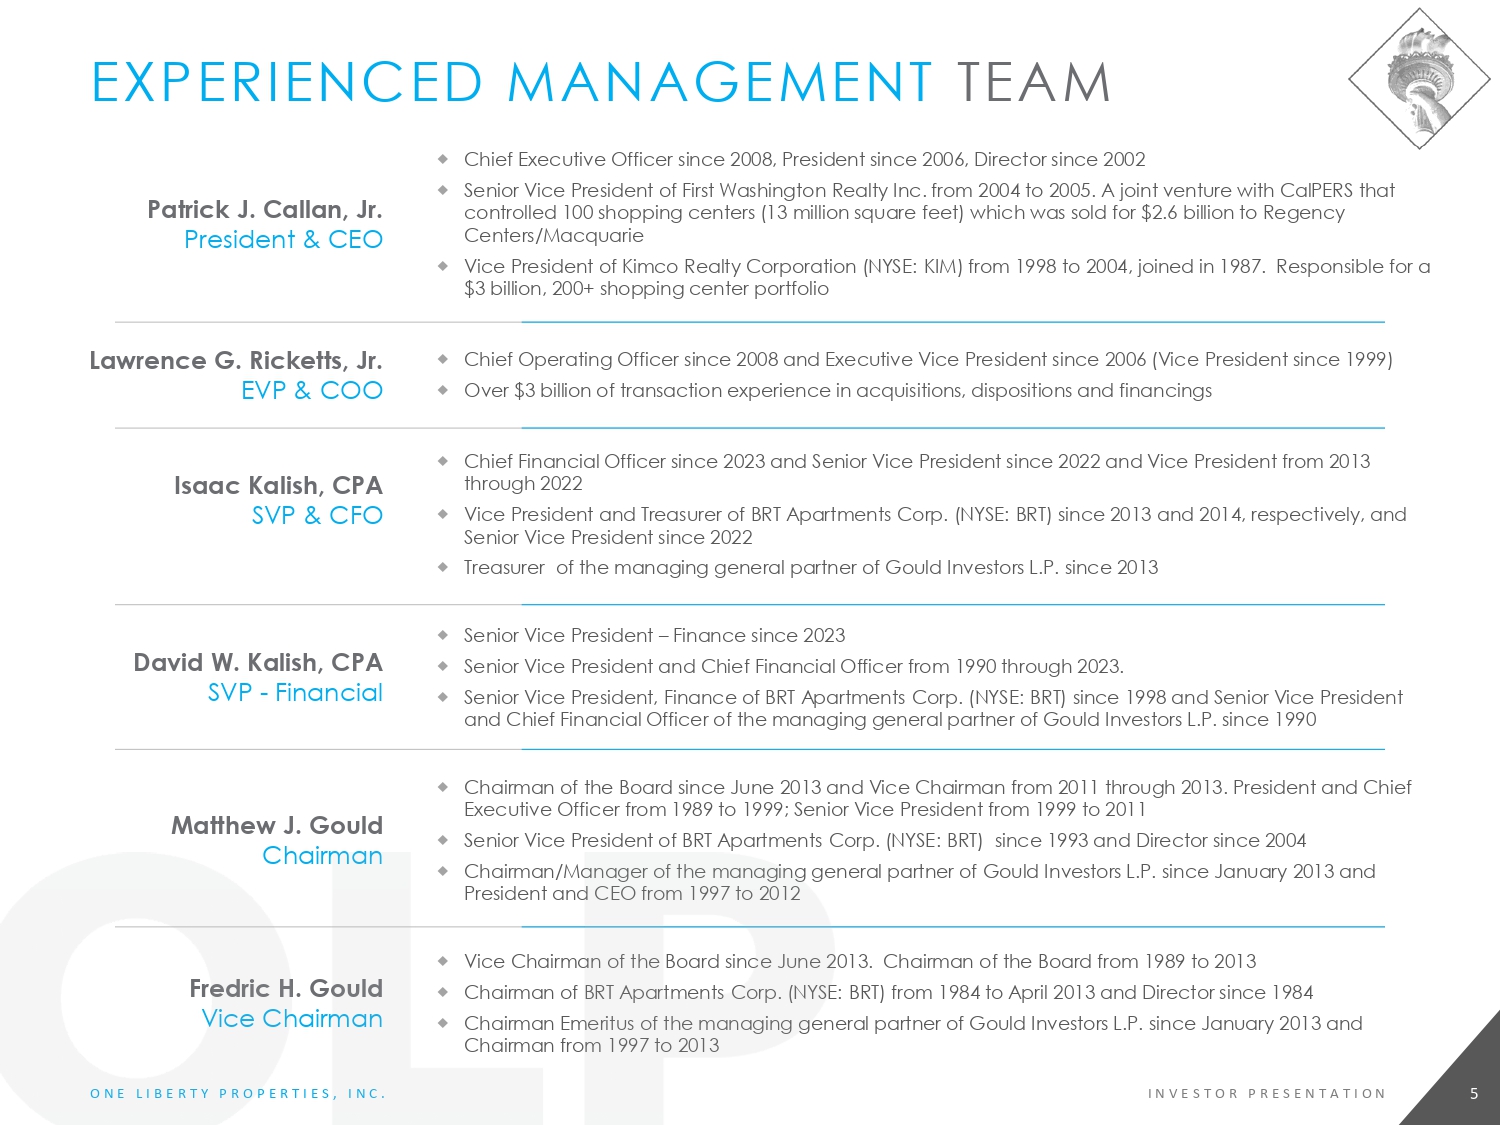
⬥ Chief Executive Officer since 2008, President since 2006, Director since 2002 ⬥ Senior Vice President of First Washington Realty Inc. from 2004 to 2005. A joint venture with CalPERS that controlled 100 shopping centers (13 million square feet) which was sold for $2.6 billion to Regency Centers/Macquarie ⬥ Vice President of Kimco Realty Corporation (NYSE: KIM) from 1998 to 2004, joined in 1987. Responsible for a $3 billion, 200+ shopping center portfolio Patric k J. Callan, Jr. Pres i d ent & C E O ⬥ Chief Operating Officer since 2008 and Executive Vice President since 2006 (Vice President since 1999) ⬥ Over $3 billion of transaction experience in acquisitions, dispositions and financings Lawrenc e G . Ricketts , Jr. E V P & COO ⬥ Chief Financial Officer since 2023 and Senior Vice President since 2022 and Vice President from 2013 through 2022 ⬥ Vice President and Treasurer of BRT Apartments Corp. (NYSE: BRT) since 2013 and 2014, respectively, and Senior Vice President since 2022 ⬥ Treasurer of the managing general partner of Gould Investors L.P. since 2013 Isa a c K alish, CPA S V P & C F O ⬥ S en i or V i ce Pre s i d ent – F i n a nce s i nce 2023 ⬥ Senior Vice President and Chief Financial Officer from 1990 through 2023. ⬥ Senior Vice President, Finance of BRT Apartments Corp. (NYSE: BRT) since 1998 and Senior Vice President and Chief Financial Officer of the managing general partner of Gould Investors L.P. since 1990 Davi d W. Kalish , CPA S V P - F ina nc ia l ⬥ Chairman of the Board since June 2013 and Vice Chairman from 2011 through 2013. President and Chief Executive Officer from 1989 to 1999; Senior Vice President from 1999 to 2011 ⬥ Senior Vice President of BRT Apartments Corp. (NYSE: BRT) since 1993 and Director since 2004 ⬥ Chairman/Manager of the managing general partner of Gould Investors L.P. since January 2013 and President and CEO from 1997 to 2012 Matthew J. Go uld Chairman ⬥ Vice Chairman of the Board since June 2013. Chairman of the Board from 1989 to 2013 ⬥ Chairman of BRT Apartments Corp. (NYSE: BRT) from 1984 to April 2013 and Director since 1984 ⬥ Chairman Emeritus of the managing general partner of Gould Investors L.P. since January 2013 and Chairman from 1997 to 2013 Fredric H . Gould V i ce C h air m a n EXPERIENCED MANAGEMENT TEAM 5 O N E L I B E R T Y P R O P E R T I E S , I N C . I N V E S T O R P R E S E N T A T I O N
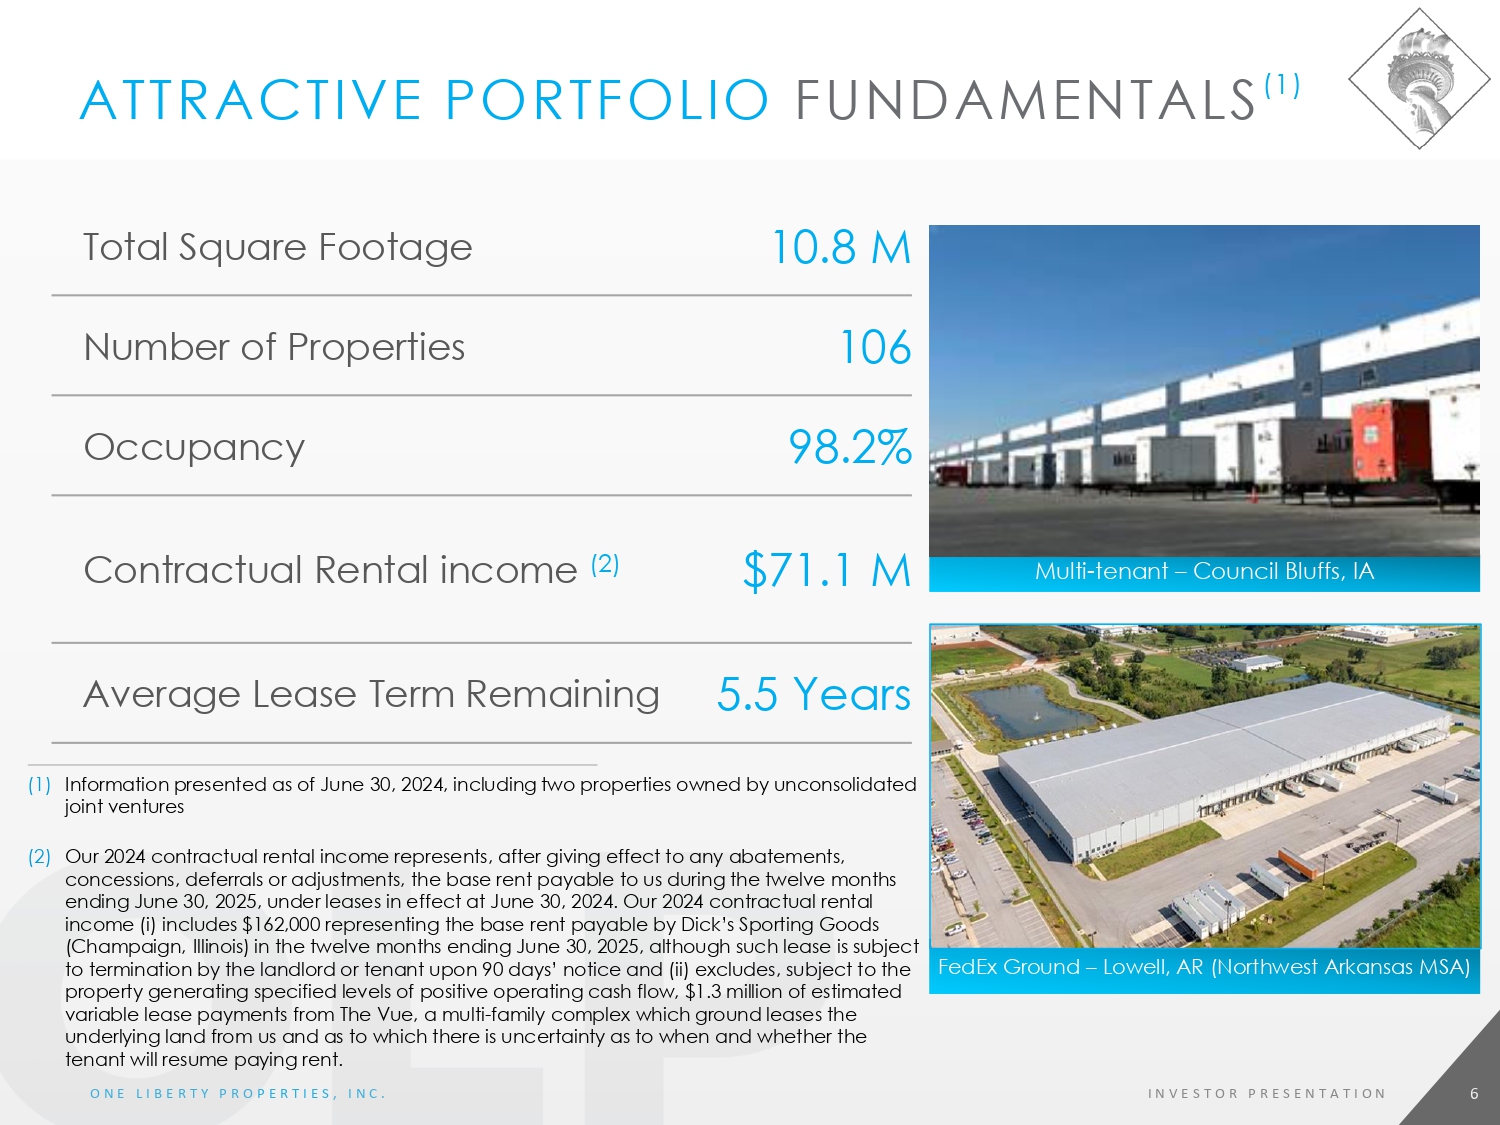
FedEx Ground – Lowell, AR (Northwest Arkansas MSA) M u l t i - tenant – Counc i l B l uff s , I A 1 0 . 8 M T o t a l Squ a re Foo t a ge 106 Numb e r of Prop e r t i e s 98.2% Occupancy $ 7 1 . 1 M Co n t r a c t u a l R en t a l i n come ( 2 ) 5 . 5 Y ears Av e r a ge L ea s e T e rm R e ma i n i n g A TT R A C T I V E P O R T F O L I O F U N D A M E N T A L S ( 1 ) (1) Information presented as of June 30, 2024, including two properties owned by unconsolidated j o i nt v en t u r es (2) Our 2024 contractual rental income represents, after giving effect to any abatements, concessions, deferrals or adjustments, the base rent payable to us during the twelve months ending June 30, 2025, under leases in effect at June 30, 2024. Our 2024 contractual rental income (i) includes $162,000 representing the base rent payable by Dick’s Sporting Goods (Champaign, Illinois) in the twelve months ending June 30, 2025, although such lease is subject to termination by the landlord or tenant upon 90 days’ notice and (ii) excludes, subject to the property generating specified levels of positive operating cash flow, $1.3 million of estimated variable lease payments from The Vue, a multi - family complex which ground leases the underlying land from us and as to which there is uncertainty as to when and whether the tenant will resume paying rent. 6 O N E L I B E R T Y P R O P E R T I E S , I N C . I N V E S T O R P R E S E N T A T I O N

% o f 2024 Con tr actual Rental Income 2024 Con tr actual Renta l Income ( 1) N umbe r of Properties Type o f P r ope r ty 67.7% $48,096,061 56 Industrial 15.6 11,076,980 25 Re t a i l – Gener al 4.9 3,496,357 9 Re t a i l – Furn i t ure 2.8 1,965,195 5 Re t a i l – O ff i c e Su pp l y 9.0 6,444,883 11 Other (2) 100.0% $71,079,476 106 Total: (1) See “ - Attractive Portfolio Fundamentals” for explanation of 2024 Contractual Rental Income (2) Other consists of the following property types: Health & Fitness, Restaurant, Theater, Office, Veterinary hospital, and Apartments PORTFOLIO DETAIL 7 O N E L I B E R T Y P R O P E R T I E S , I N C . I N V E S T O R P R E S E N T A T I O N
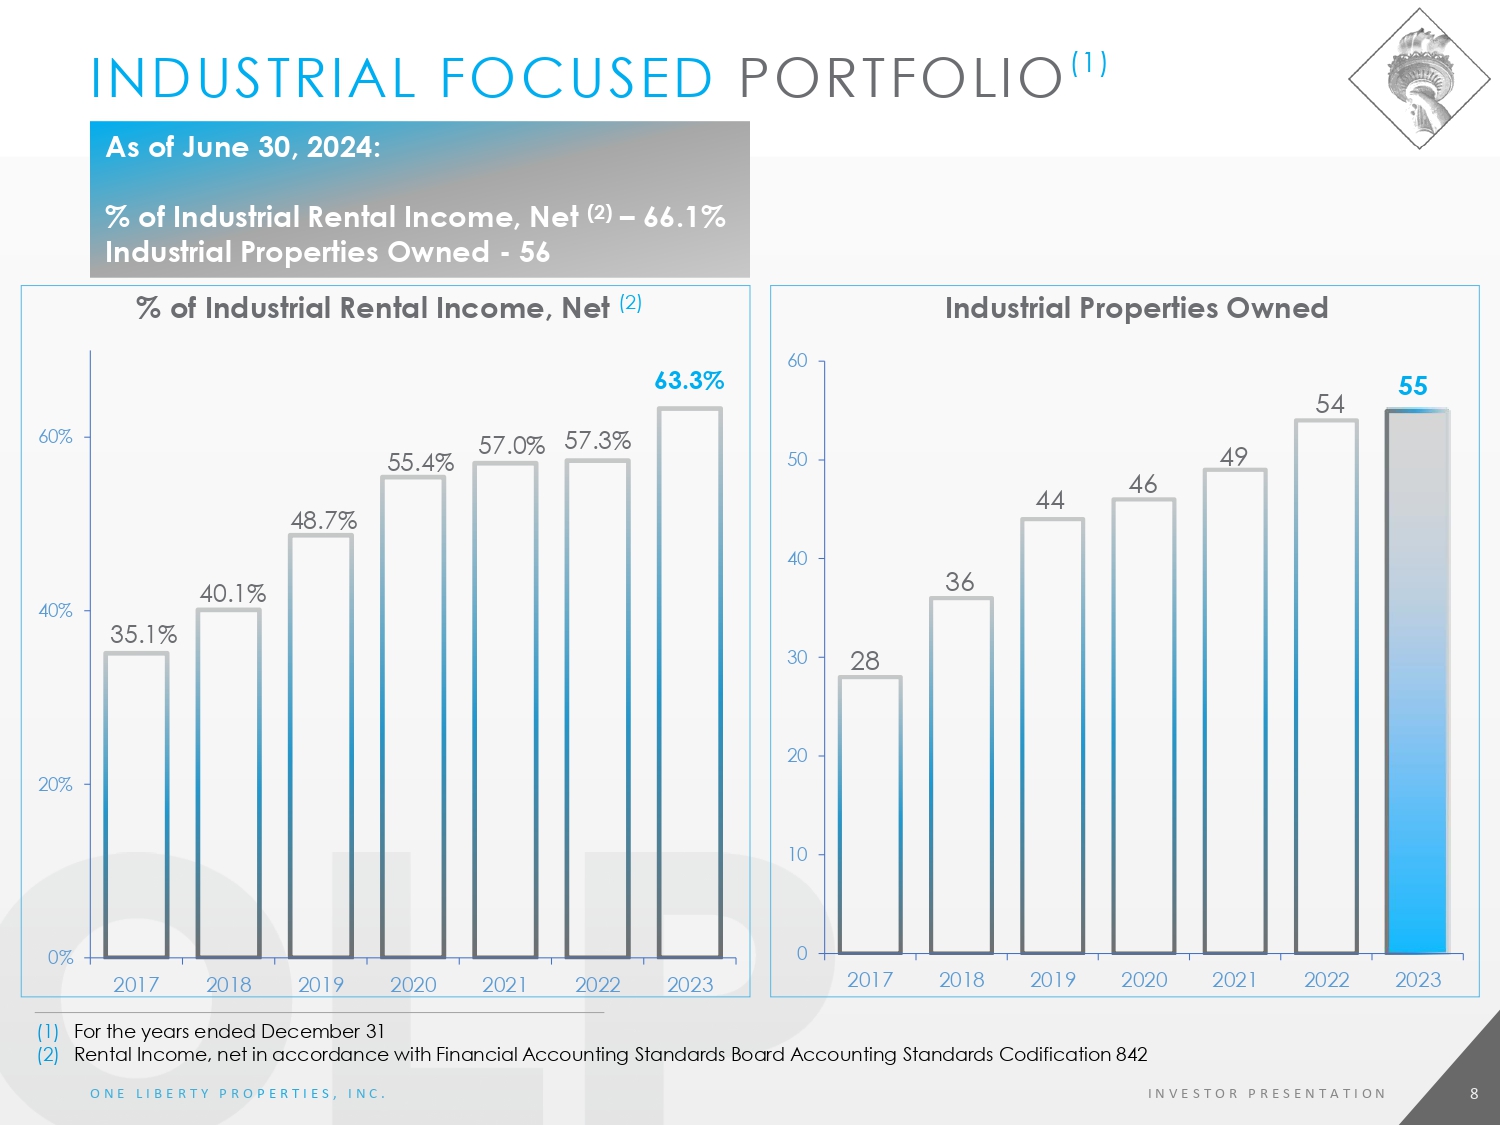
I N D U S T R I A L F O C U S E D P O R T F O L I O ( 1 ) 35 . 1 % 40 . 1 % 48 . 7 % 55 . 4 % 57 . 0 % 57 . 3 % 63.3% 0% 2 0 % 4 0 % 6 0 % 20 1 7 20 1 8 20 1 9 20 2 0 20 2 1 20 2 2 20 2 3 % o f Ind u s t r ial R enta l Income , N e t ( 2) (1) F or the y e a r s e n d e d D e c e m be r 31 (2) Rental Income, net in accordance with Financial Accounting Standards Board Accounting Standards Codification 842 28 36 44 46 49 54 55 0 10 20 30 40 50 60 20 1 7 20 1 8 20 1 9 20 2 0 20 2 1 20 2 2 20 2 3 Ind u s t r ial P r ope r ties Owned A s o f J u n e 30 , 2024 : % of Industrial Rental Income, Net (2) – 66.1% Ind u s t r ial P r ope r ties Ow ne d - 56 8 O N E L I B E R T Y P R O P E R T I E S , I N C . I N V E S T O R P R E S E N T A T I O N
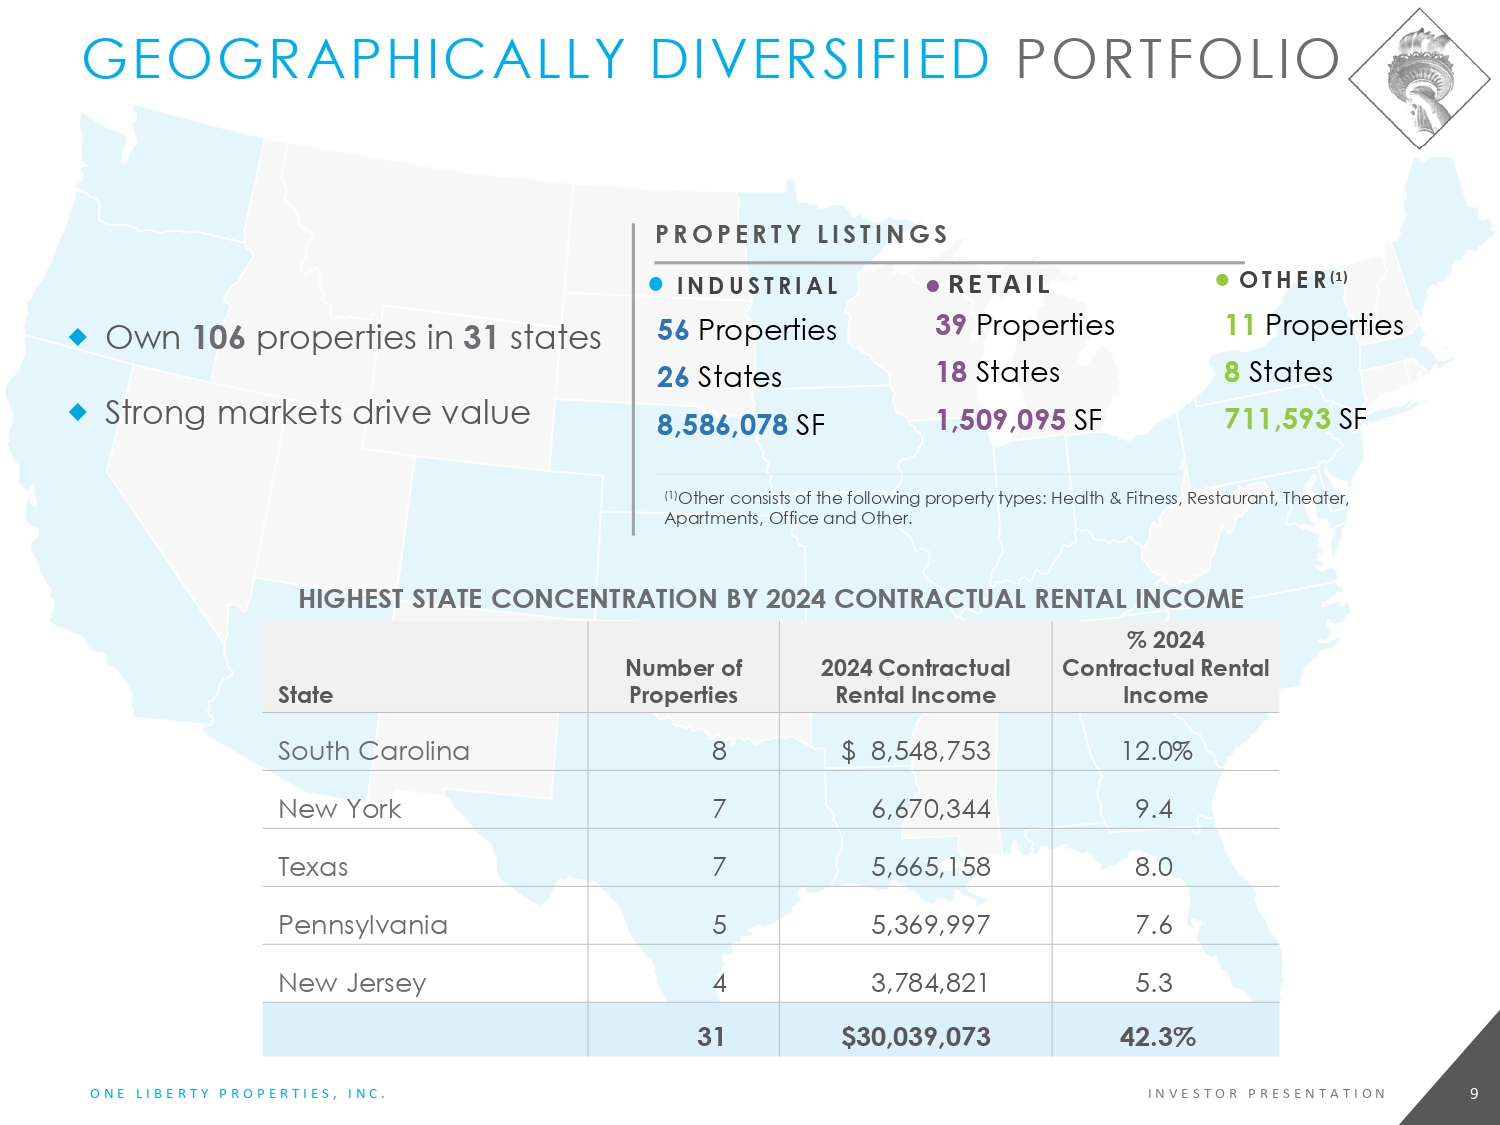
H IG H EST S T ATE CONCEN T R AT I ON B Y 202 4 CONTRACT UA L R EN T AL IN C OME % 2024 Cont rac t ua l R en t al Income 2024 Cont rac t u a l Ren tal Inco m e N um be r of Properties State 12.0% $ 8,548,753 8 S ou t h C aro l i na 9.4 6,670,344 7 New Y ork 8.0 5,665,158 7 Texas 7.6 5,369,997 5 Pennsylvania 5.3 3,784,821 4 New Je r sey 42.3% $30,039,073 31 ⬥ O w n 10 6 pro p e r t i e s i n 3 1 s t a t e s ⬥ S t rong ma rke t s dri v e v a l ue PROPERTY LISTINGS I N D U S T R I A L 5 6 P r o pert i es 26 S t a t es 8 , 5 86 , 0 7 8 SF R E T A I L 3 9 P r o pert i es 1 8 S t a t es 1 , 5 09 , 0 9 5 SF O T H E R (1) 1 1 P r o pert i es 8 S t a t es 711 , 5 93 SF (1) Other consists of the following property types: Health & Fitness, Restaurant, Theater, Apartments, Office and Other. GEOGRAPHICALLY DIVERSIFIED PORTFOLIO 9 O N E L I B E R T Y P R O P E R T I E S , I N C . I N V E S T O R P R E S E N T A T I O N

% o f 2024 Contractual Renta l Income 2024 Contractual Renta l Income N umbe r of Locations Top Ten a nts 5.3% $3,735,618 5 FedEx ( N Y SE : FDX) 4.4 3,106,909 1 Nor t h ern Tool & E qui p m e n t 4.2 2,982,908 1 N A RDA H o l d i n g s , I n c . 4.0 2,815,962 7 Ha v er t y s Fur n i t u r e Com pa n i e s , I n c. ( N Y SE : H V T) 3.5 2,525,989 2 LA F i tn e s s I nt e rn a t i on a l , LLC 21.4% $15,167,386 16 Total: DIVERSIFIED TENANT BASE Ha ve r t y s Fu r nitu r e 10 O N E L I B E R T Y P R O P E R T I E S , I N C . I N V E S T O R P R E S E N T A T I O N

Campania International / U.S. Tape – Philadelphia, PA A pp li e d C ontrol E q u i p me nt – D en v e r , CO $ 5 88. 8 M M a rk e t C a p ( 1 ) 2 1 . 4 M Sh a r e s O u t s t an d i n g ( 1) 2 5 . 5 % I n s i de r O w ne r s h i p ( 2 ) $1.80 Cur ren t A nn u a l i zed D i v ide n d 6 . 5 % D i v ide n d Y i e ld ( 3 ) FINANCIAL SUMMARY (1) Market cap is calculated using the shares outstanding and the closing OLP stock price of $27 . 54 a t Sep t e m be r 30 , 2 024 (2) Calculated as of September 30, 2024 (3) Calculated using the closing OLP stock price of $27.54 at September 30, 2024 11 O N E L I B E R T Y P R O P E R T I E S , I N C . I N V E S T O R P R E S E N T A T I O N

OPERATIONAL METRICS (1) $1 . 9 0 $1 . 9 5 $1 . 9 8 $1 . 9 9 $ 1 . 8 0 $ 2 . 0 0 20 2 0 20 2 1 20 2 2 20 2 3 H i s to r ical A FFO P e r Sha r e (2) AFFO Payout (3) 90% 2023 91% 2022 92% 2021 95% 2020 (1) A reconciliation of net income per diluted share, as determined in accordance with GAAP, to AFFO per diluted share, may be found at the end of this presentation (2) F or t he y e a rs e nd e d D e c e mb e r 31 (3) Impacting the changes in the AFFO payout ratio are distributions of gains on property sales, which gains are excluded from the calculation of AFFO Si x Months Ended Ju n e 3 0 , 2024 : 12 O N E L I B E R T Y P R O P E R T I E S , I N C . I N V E S T O R P R E S E N T A T I O N AFFO per share - $0.95 AFFO P ayou t (3) - 95%

$944. 5 M Gros s A ss e t s ( 1 ) 44.4% T o t a l Deb t /Gr o s s A ss e t s ( 2) 100.0% Fi x ed Ra t e Debt 2. 3 to 1.0 Deb t Ser v ic e Co v erage Ra t i o ( 3 ) 2. 7 to 1.0 F i xed Char g e Co v era g e R a t io ( 3 ) BALANCE SHEET – POSITIONED FOR GROWTH AS AT JUNE 30,2024 ⬥ Liquidity available to acquire in excess of an estimated $ 250 million of pro p er t i es a s of Sep t em be r 3 0 , 20 2 4 ⬥ $100.0 million available on our Line of Credit, subject to borrowing base requi r em en t s , a s of Sep t em be r 3 0 , 20 2 4 (1) Gross assets represent total assets plus accumulated depreciation of $185.2 million (2) Total debt excludes unamortized deferred financing costs and intangible mortgage assets (i.e ., $3.6 million and $736,000, respectively) (3) Calculated in accordance with the terms of our credit facility 13 O N E L I B E R T Y P R O P E R T I E S , I N C . I N V E S T O R P R E S E N T A T I O N

MORTGAGE DEBT MATURITIES AS AT JUNE 30, 2024 $ 5 0 . 7 ( 1) $ 4 1 . 5 $ 3 2 . 9 $ 3 8 . 4 $0 $ 4 0 $ 8 0 $ 1 2 0 $3.7 2025 2026 2027 2 0 2 8 2 0 2 9 2 0 3 0 & B ey o nd ($ in m ill ion s ) ⬥ W ei g h t ed a v erage i nt er e s t ra t e of 4 . 4 1 % on f i x e d ra t e debt ⬥ There is approximately $11.3 million of scheduled amortization of mor t g a g es f or t he t we l v e m on t hs endi n g J une 3 0 , 2 0 25 BA LL O O N PA YME N TS DU E FO R THE TW EL V E MO NT H S E N DI N G JUNE 3 0 , $200 $172.5 $160 (1) The Company paid off or refinanced $20.2 million as of September 30, 2024 14 O N E L I B E R T Y P R O P E R T I E S , I N C . I N V E S T O R P R E S E N T A T I O N
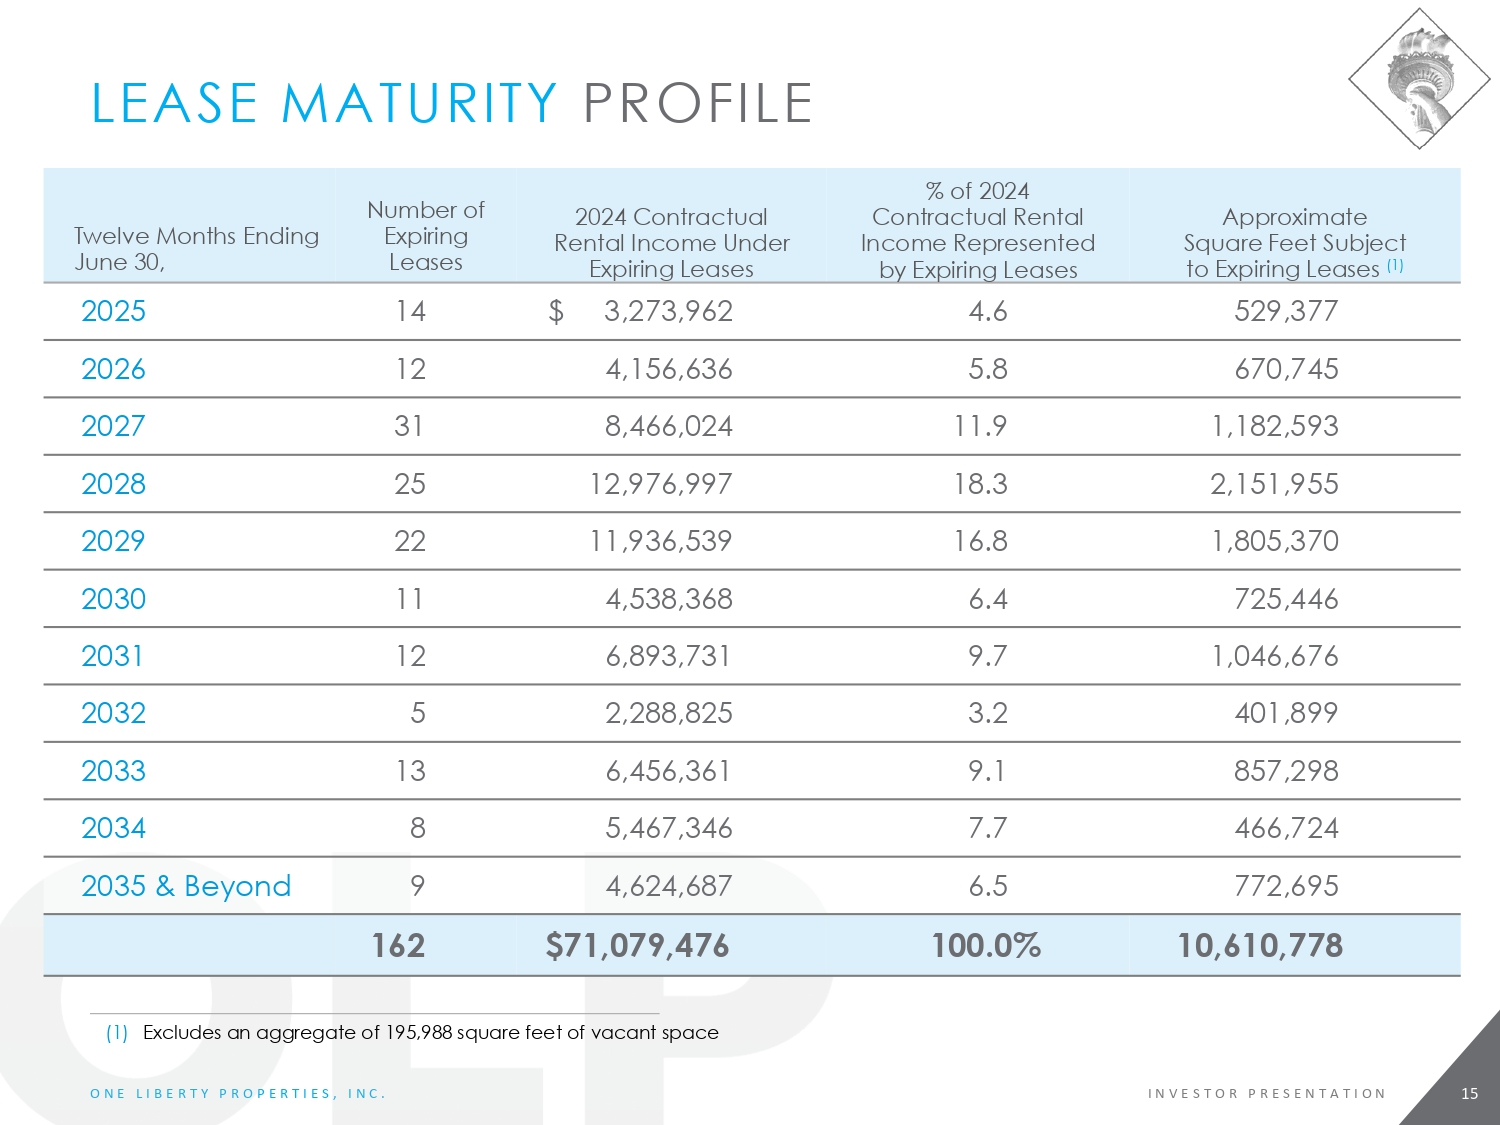
Approximate Squ a re F eet Su b je c t to Ex pi r i ng L eases ( 1) % of 2024 Con t r a c tual Ren tal I nco m e Re p r e s e n t ed b y E xp i r i ng Leases 202 4 Con t r a c tual Ren ta l I nco m e Und e r E xp i r i ng Leases Nu mb er of Expiring Leases T w e l v e M o n t h s E nding J une 3 0, 529,377 4.6 $ 3,273,962 14 2025 670,745 5.8 4,156,636 12 2026 1,182,593 11.9 8,466,024 31 2027 2,151,955 18.3 12,976,997 25 2028 1,805,370 16.8 11,936,539 22 2029 725,446 6.4 4,538,368 11 2030 1,046,676 9.7 6,893,731 12 2031 401,899 3.2 2,288,825 5 2032 857,298 9.1 6,456,361 13 2033 466,724 7.7 5,467,346 8 2034 772,695 6.5 4,624,687 9 2 0 3 5 & Bey o n d 10,610,778 100.0% $71,079,476 162 LEASE MATURITY PROFILE (1) Excludes an aggregate of 195,988 square feet of vacant space 15 O N E L I B E R T Y P R O P E R T I E S , I N C . I N V E S T O R P R E S E N T A T I O N

STABLE OCCUPANCY (1)(2) A t September 30 , 2024 : O ccupanc y – 99 . 1 % 9 7 . 3 % 99.3% 9 7 . 8 % 9 6 . 8 % 97.0% 9 7 . 9 % 9 8 . 4 % 98 . 8 % 80 . 0 % 90 . 0 % 10 0 . 0 % 2 0 2 0 20 2 1 20 2 2 20 2 3 2016 2017 2018 2019 (1) A s a t D e c e m be r 31 (2) Based on square footage, including 100% of our unconsolidated joint ventures 16 O N E L I B E R T Y P R O P E R T I E S , I N C . I N V E S T O R P R E S E N T A T I O N

ACQUISITION TRACK RECORD $79 .5 $49 .3 $28 .3 $24 .3 $56 .5 $13 .4 $44.7 (1) $0 $20 $40 $60 $80 $1 0 0 $1 2 0 20 2 1 20 2 2 20 2 3 20 2 4 ($ in m ill ion s ) ACQUISITIONS PE R YEAR 2018 2019 2020 (1) Represents acquisitions completed through September 30, 2024. 17 O N E L I B E R T Y P R O P E R T I E S , I N C . I N V E S T O R P R E S E N T A T I O N
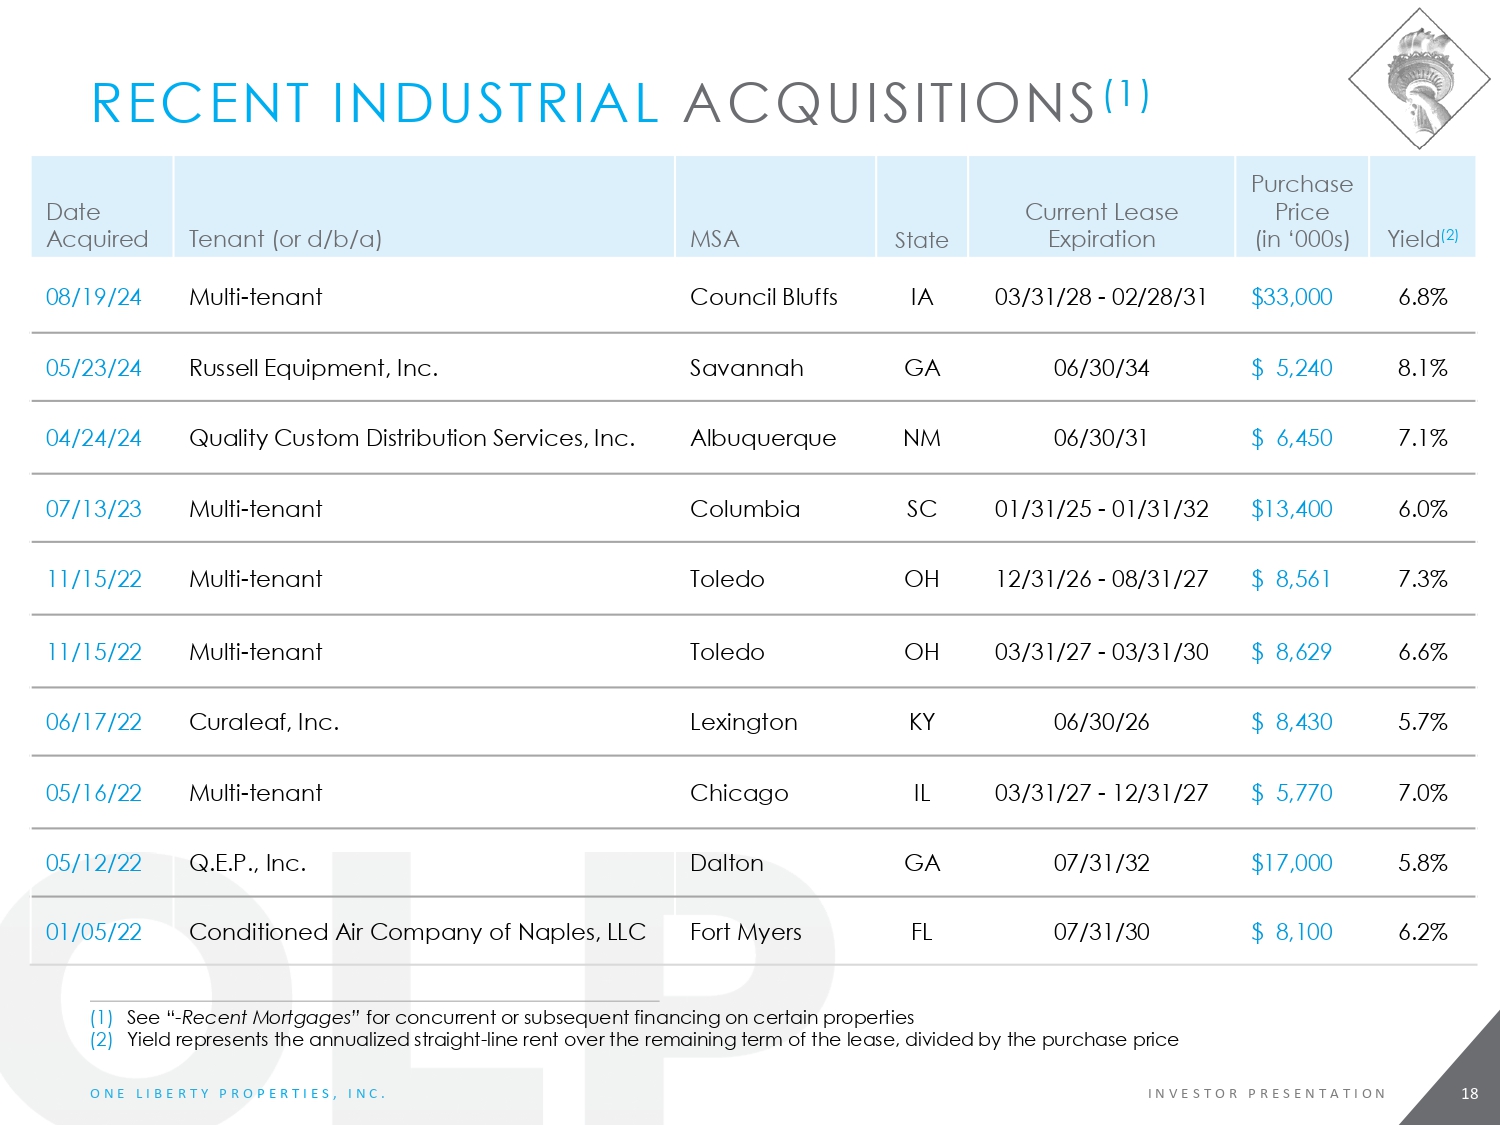
RECENT INDUSTRIAL ACQUISITIONS (1) (1) See “ - Recent Mortgages” for concurrent or subsequent financing on certain properties (2) Yield represents the annualized straight - line rent over the remaining term of the lease, divided by the purchase price Yield (2) P urchase Price ( i n ‘000 s) Cu r rent Lease Expiration State MSA Tenant ( or d/b/a) Date A c q u i red 6.8% $33,000 03/31/2 8 - 02/28/31 IA Counc i l B l uffs Multi - tenant 08/19/24 8.1% $ 5,240 06/30/34 GA Savannah Ru s sell Eq u i pment , I nc. 05/23/24 7.1% $ 6,450 06/30/31 NM Albuquerque Qua li ty Cu s t o m D i str i b ution S er v i c e s , I nc. 04/24/24 6.0% $13,400 01/31/2 5 - 01/31/32 SC Columbia Multi - tenant 07/13/23 7.3% $ 8,561 12/31/2 6 - 08/31/27 OH Toledo Multi - tenant 11/15/22 6.6% $ 8,629 03/31/2 7 - 03/31/30 OH Toledo Multi - tenant 11/15/22 5.7% $ 8,430 06/30/26 KY Lexington Cu r a l e a f, I nc. 06/17/22 7.0% $ 5,770 03/31/2 7 - 12/31/27 IL Chicago Multi - tenant 05/16/22 5.8% $17,000 07/31/32 GA Dalton Q . E .P. , I nc. 05/12/22 6.2% $ 8,100 07/31/30 FL Fort M y e r s Conditio n ed A i r Co mp any of Nap l es, LLC 01/05/22 18 O N E L I B E R T Y P R O P E R T I E S , I N C . I N V E S T O R P R E S E N T A T I O N

OPPORTUNISTIC DISPOSITIONS (1) Excludes an impairment charge of $1.1 million recognized during the second quarter of 2024 (2) Represents 100% of the gain on the sale of a portion of the property owned by a consolidated joint venture in which we had a 95% interest. Our share of the gain was approximately $873,000. (3) Represents 100% of the gain on the sale of a portion of the property owned by a consolidated joint venture in which we have a 90% interest. Our share of the gain was a pp ro x i ma t e l y $1 . 6 m i l l i o n . Net Ga i n / ( Loss ) ( i n ‘000 s) Gros s S a l es Price ( i n ‘000 s) State MSA Tenant ( or d/b/a) P roperty T y pe Date A c q u i red D ate Sold $ 921 $ 4,750 MN Minneapolis Hob by Lobby Retail 05/21/14 09/23/24 $ 1,177 $ 4,425 IL L ak e Coun t y Former E ch o , I nc. Industrial 05/30/19 08/29/24 $ 17 (1) $ 4,350 OH Cincinnati Former LA F i t n ess H e a l th & F i t n ess 08/09/11 08/15/24 $ 2,072 $ 6,700 GA Atlanta Former B ed B ath & Beyond Retail 09/26/08 06/28/24 $ 978 (2) $ 2,793 MO Ca p e G ir a r de a u Walgreens Retail 10/25/12 06/10/24 $ 43 $ 1,300 KS Lawrence Urb a n Outf i t t e r s Retail 02/07/12 06/07/24 $ 1,884 $ 6,600 KS Wichita Havertys Retail 04/07/06 06/06/24 $ 1,507 $ 2,793 OH Dayton FedEx Industrial 12/26/12 05/09/24 $ 964 $ 2,834 GA Atlanta Applebee’s Restaurant 03/12/12 05/06/24 $ 1,784 (3) $ 2,900 CO Lakewood H ac i enda Colorado Retail 02/25/15 03/06/24 $11,347 $39,445 T O TAL – NINE M ONT H S ENDED SE P TEM BE R 30 , 202 4 $24,747 NET PROCEEDS ON SALES – NINE MONTHS ENDED SEPTEMBER 30, 2024 19 O N E L I B E R T Y P R O P E R T I E S , I N C . I N V E S T O R P R E S E N T A T I O N 202 4 SALE S T O DATE

OPPORTUNISTIC DISPOSITIONS (Continued) (1) Represents our 50% share of the loss on the sale of a property owned by an unconsolidated joint venture. Excludes our 50% share of an impairment charge, or $850,000, recognized during the third quarter of 2023. (2) Represents 100% of the gain on the sale of a property owned by a consolidated joint venture in which we have a 90% interest. Our share of the gain was approximately $2 . 0 m i lli o n. Net G a i n/ ( L os s ) ( i n ‘000 s) G ross Sa l es Price ( i n ‘000 s) State MSA Tenant ( or d/b/a) P ropert y Type Date A c q u i red D ate Sold $ 3,997 $ 7,300 FL Fort M y e r s B arnes & N ob l e Retail 11/07/96 12/21/23 $ 1,727 $ 5,500 VA V i rg i nia B e a c h Havertys Retail 04/07/06 12/15/23 $ (108) (1) $ 18 , 250 NJ Manahawkin Various Retail 06/15/15 12/15/23 $ 989 $ 2,903 GA Atlanta Applebee's Restaurant 05/17/12 12/07/23 $ 1,325 $ 3,758 GA Atlanta Applebee's Restaurant 03/12/12 12/05/23 $ 1,256 $ 3,542 GA Atlanta Applebee's Restaurant 03/12/12 12/05/23 $ 265 $ 3,200 VA Richmond T G I Fr i days Restaurant 12/03/13 11/17/23 $ 226 $ 2,200 IN Indianapolis Chu c k E Cheese Restaurant 01/23/14 11/15/23 $ 2,177 (2) $ 3,333 CO Lakewood Ra i s i ng Canes Land 02/25/15 11/14/23 $ 332 $ 3,250 NC Greensboro TG I Fr i da y s Restaurant 12/03/13 09/20/23 $ 3,180 $ 6,000 GA Atlanta Havertys Retail 04/07/06 05/31/23 $ 1,534 $ 4,200 NY New Y ork T G I Fr i days Restaurant 11/10/05 02/28/23 $16,900 $63,436 T O TAL – YEA R EN D ED D ECEM B ER 3 1, 2023 $46,601 NET P RO CEEDS ON SA L ES – YEA R EN D ED D ECEM B ER 3 1, 2023 20 O N E L I B E R T Y P R O P E R T I E S , I N C . I N V E S T O R P R E S E N T A T I O N 202 3 SALES
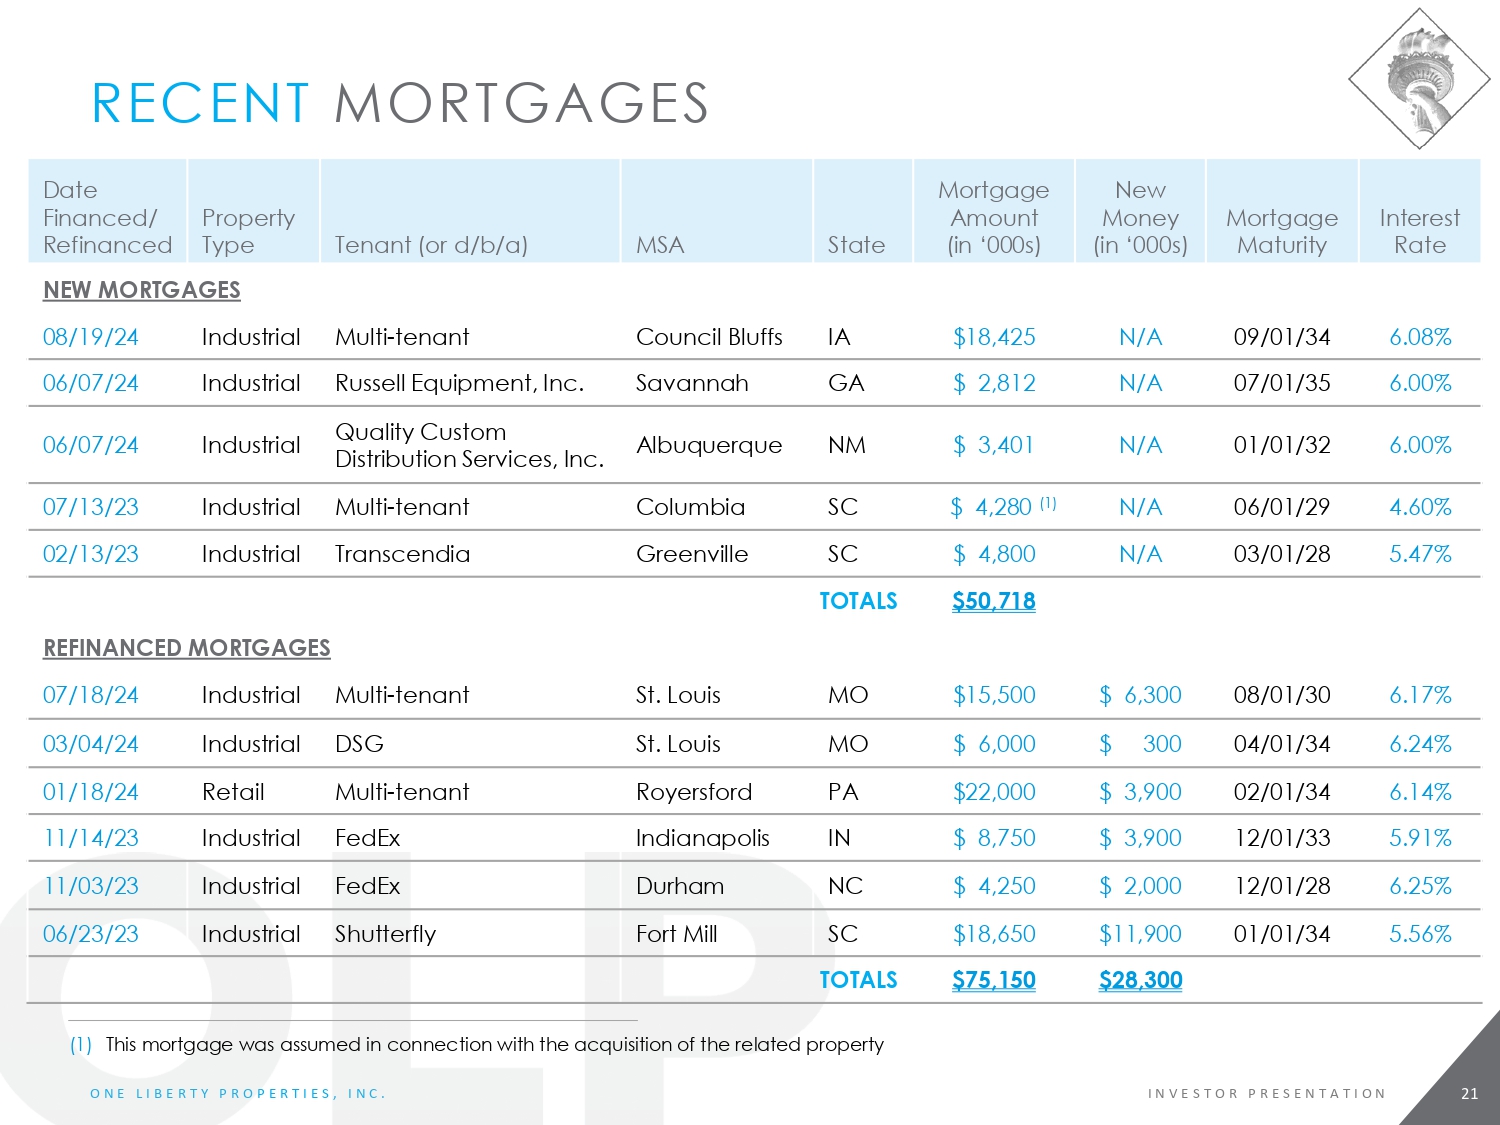
RECENT MORTGAGES I n t e r e st Rate M ortgage Maturity New Money ( i n ‘000 s) M ortgage Amount ( i n ‘000 s) State MSA Tenant ( or d/b/a) P ropert y Type Date Financed/ Ref i nan ce d NEW MO R T G A G ES 6.08% 09/01/34 N/A $18,425 IA Counc i l B l uffs Multi - tenant Industrial 08/19/24 6.00% 07/01/35 N/A $ 2,812 GA Savannah Ru s sell Eq u i pment , I nc. Industrial 06/07/24 6.00% 01/01/32 N/A $ 3,401 NM Albuquerque Qua li ty Cu s t o m D i str i b ution S er v i c e s, I nc. Industrial 06/07/24 4.60% 06/01/29 N/A $ 4 , 28 0 ( 1) SC Columbia Multi - tenant Industrial 07/13/23 5.47% 03/01/28 N/A $ 4,800 SC Greenville Transcendia Industrial 02/13/23 $50,718 TOTALS R EFINANCED MO R T G A G ES 6.17% 08/01/30 $ 6,300 $15,500 MO St . Louis Multi - tenant Industrial 07/18/24 6.24% 04/01/34 $ 300 $ 6,000 MO St . Louis DSG Industrial 03/04/24 6.14% 02/01/34 $ 3,900 $22,000 PA Royersford Multi - tenant Retail 01/18/24 5.91% 12/01/33 $ 3,900 $ 8,750 IN Indianapolis FedEx Industrial 11/14/23 6.25% 12/01/28 $ 2,000 $ 4,250 NC Durham FedEx Industrial 11/03/23 5.56% 01/01/34 $11,900 $18,650 SC Fort M il l Shutterfly Industrial 06/23/23 $28,300 $75,150 TOTALS (1) This mortgage was assumed in connection with the acquisition of the related property 21 O N E L I B E R T Y P R O P E R T I E S , I N C . I N V E S T O R P R E S E N T A T I O N

ACQUISITION CASE STUDY – INDUSTRIAL RIVER ROAD LOGISTICS BUILDING I I n dus t r i a l bu i l d i n g i n Cou n ci l Bluffs , IA ( O m aha M S A ) – a c qu ired i n 2 0 2 4 . The 302,347 SF building is net leased to three tenants. The Cla s s A c o n cre t e til t bu i l d i n g w as constructed in 2023, features 32’ clear and 32 l o a d i n g do o rs ( abi l i t y t o ad d 2 4 i n t h e fut u r e ) . Loc a t ed d i rec t l y adja c e n t t o a fou r - w ay i n t ercha n ge o f I n t er s t a t e 8 0 an d I n t er s t a t e 2 9 . The i n - p l a c e bas e re n t pe r s quar e f o o t o f $7.12/SF is below market . The leases increase ann ua l l y be t wee n 2 . 0 % - 3 . 0 % . River Road Logistics Building I – Council Bluffs, IA (Omaha MSA) $ 33,000,000 P u rcha s e P r i ce (18,425,000) Mortgage $ 14,575,000 Net E qu i t y I n v e s t ed $ 2,152,000 Y ear 1 Bas e Re n t (1,120,000) I n t ere s t Expen s e – 6 . 0 8% $ 1,032,000 Net Ca s h t o OLP 7.97% 5 - Year Cash on Cash Return 22 O N E L I B E R T Y P R O P E R T I E S , I N C . I N V E S T O R P R E S E N T A T I O N
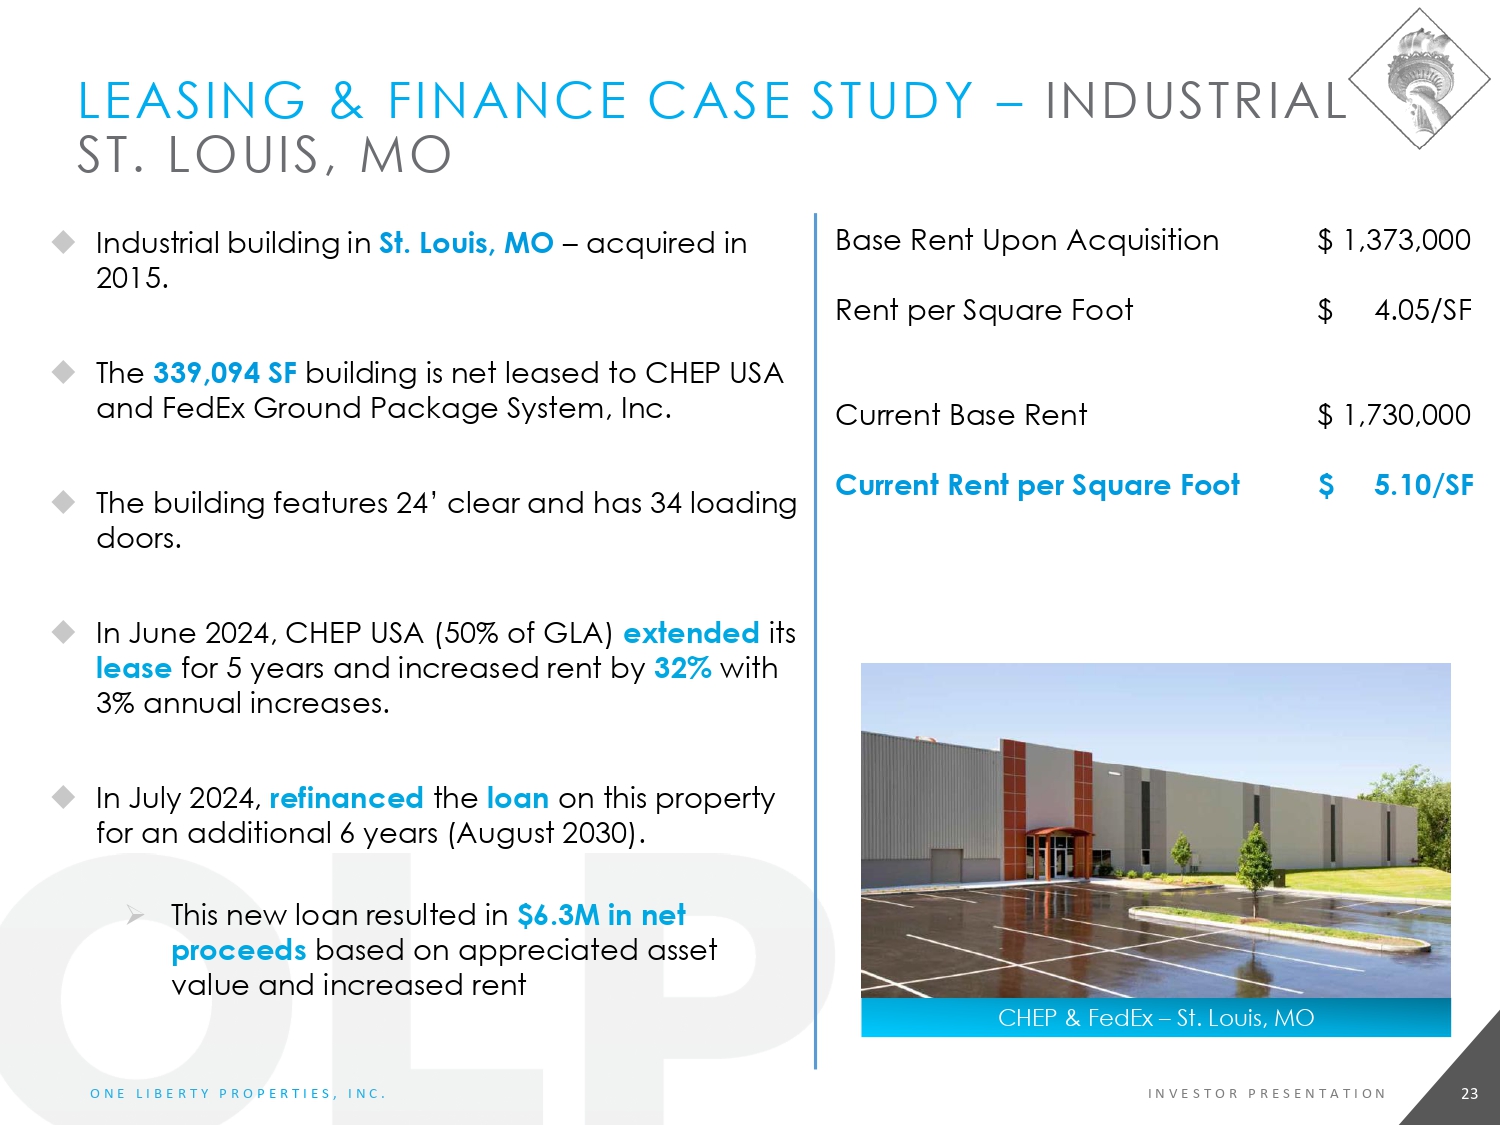
LEASING & FINANCE CASE STUDY – INDUSTRIAL ST. LOUIS, MO I n dus t r i a l bu i l d i n g i n St . L oui s , MO – a c q u i red i n 2015. The 339,094 SF building is net leased to CHEP USA an d FedEx Groun d Pack age Sys t em, I n c. The building features 24’ clear and has 34 loading doors. I n J u n e 2 0 2 4 , CHEP U S A ( 5 0 % of GL A ) e x ten d e d it s lea s e f o r 5 year s an d i n creased re n t by 32 % w it h 3 % ann ual i n c rea s es . In July 2024, refinanced the loan on this property for an additional 6 years (August 2030). » Th i s n ew l o a n re s u l t ed i n $6 . 3 M in net p r oc e ed s base d o n ap p rec i a t ed as s et v a l ue an d i n creased re n t CH E P & F edEx – St . L oui s , M O Ba s e Re n t U p o n A cq u i s i t i o n $ 1 , 3 7 3 , 0 00 Re n t pe r Squar e F o o t $ 4 . 0 5/ S F 23 O N E L I B E R T Y P R O P E R T I E S , I N C . I N V E S T O R P R E S E N T A T I O N Cu r re n t Ba s e Re n t $ 1 , 7 3 0 , 0 00 $ 5.10/SF C u rr en t Ren t pe r S q u a r e Foot
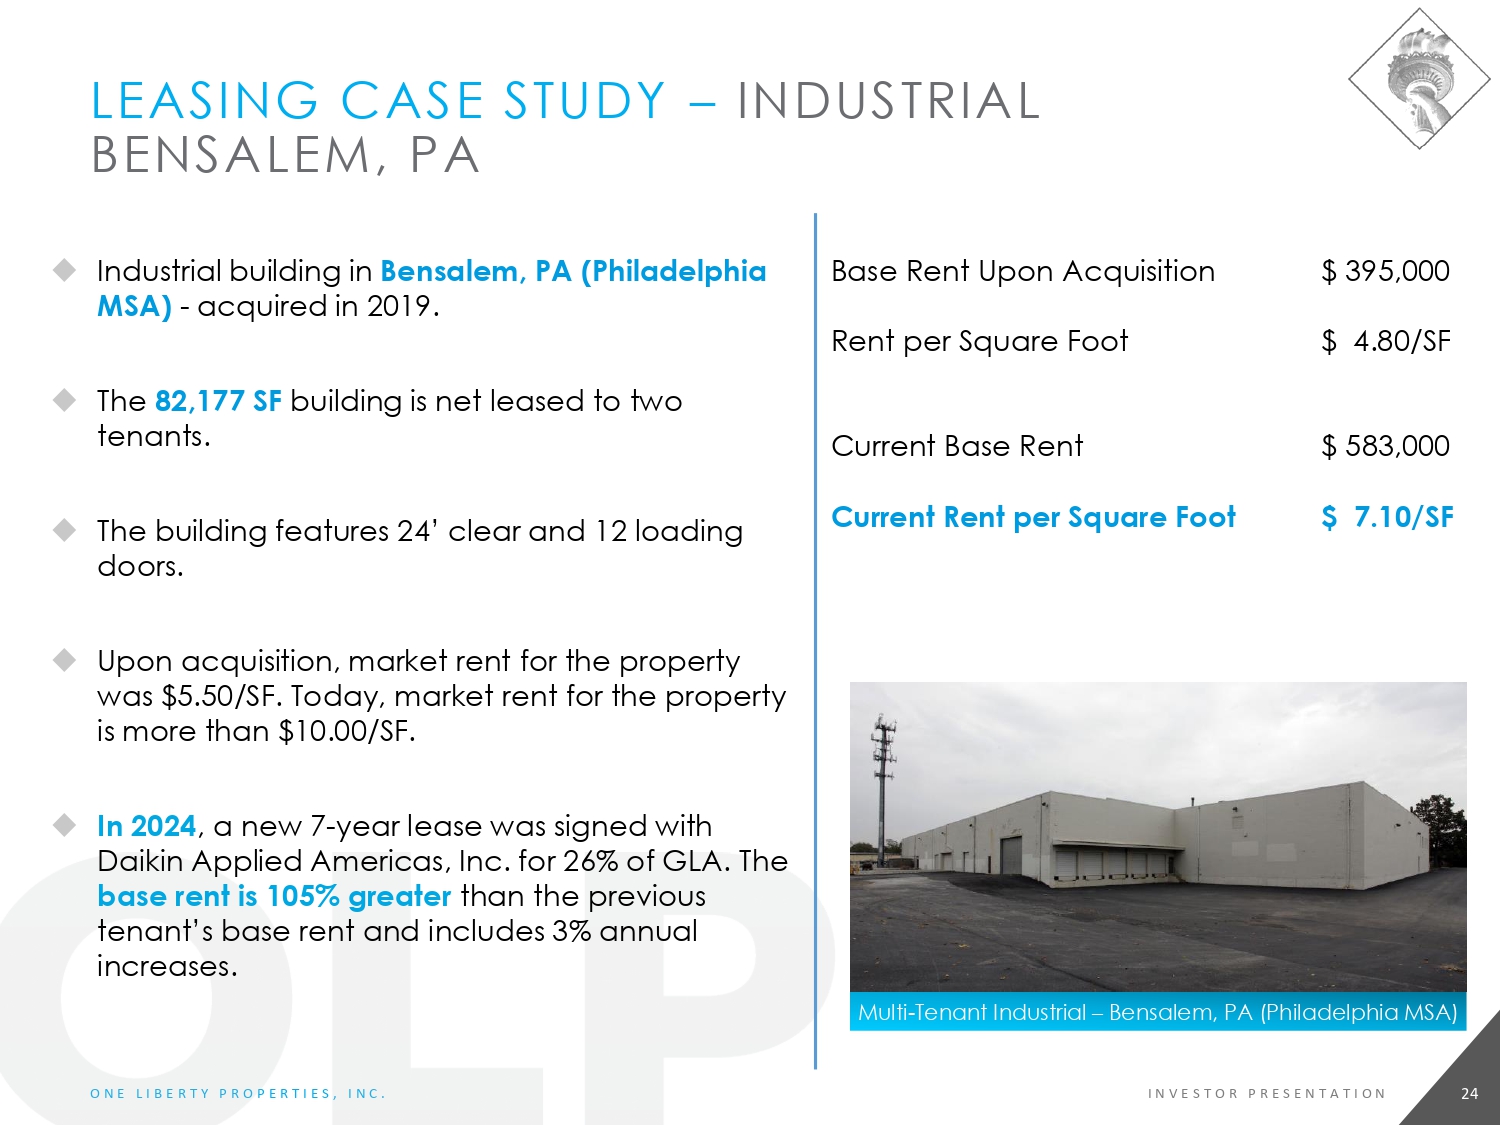
LEASING CASE STUDY – INDUSTRIAL BENSALEM, PA Industrial building in Bensalem, PA (Philadelphia MSA) - a c qu ired i n 2 0 1 9 . The 82,177 SF building is net leased to two tenants. The bu i l d i n g fea t u r es 2 4 ’ cl ear an d 1 2 l o a d i n g doors. U p o n a c qu i s i t i o n , mark et re n t f o r t h e pr o pert y was $5.50/SF. Today, market rent for the property i s m o re t h a n $ 1 0 . 0 0/ S F. In 202 4 , a n ew 7 - yea r l ea s e w a s s i gned w it h Da i k i n A p p l i ed A mer i c as , I n c. f o r 2 6 % o f GL A . The b a s e r en t is 1 05 % g r eate r t h a n t h e pre v i o us t e n an t ’ s bas e re n t an d i n c l udes 3 % ann ual increases. Multi - Tenant Industrial – Bensalem, PA (Philadelphia MSA) Ba s e Re n t U po n A cq u i s i t i o n 24 O N E L I B E R T Y P R O P E R T I E S , I N C . I N V E S T O R P R E S E N T A T I O N $ 395 , 000 Re n t pe r Squar e F o o t $ 4.80/SF Cu r re n t Ba s e Re n t $ 583 , 0 00 C u r r en t Ren t p e r Sq u a r e Foot $ 7.10/SF
25 1. R e a l Estat e fundamentals focused com p any 2. Focused on i ndu s t r i al pr o pert i es 3. D i s c i p l i ned track r e c ord through e c onom i c cy cl e s 4. Alignment of interest – significant insider ownership S U MM A R Y – W H Y O L P ?

A PP E N D I C E S
TOP T E N A N T S ’ PROFILES Ha ve r t y s Fu r nitu r e
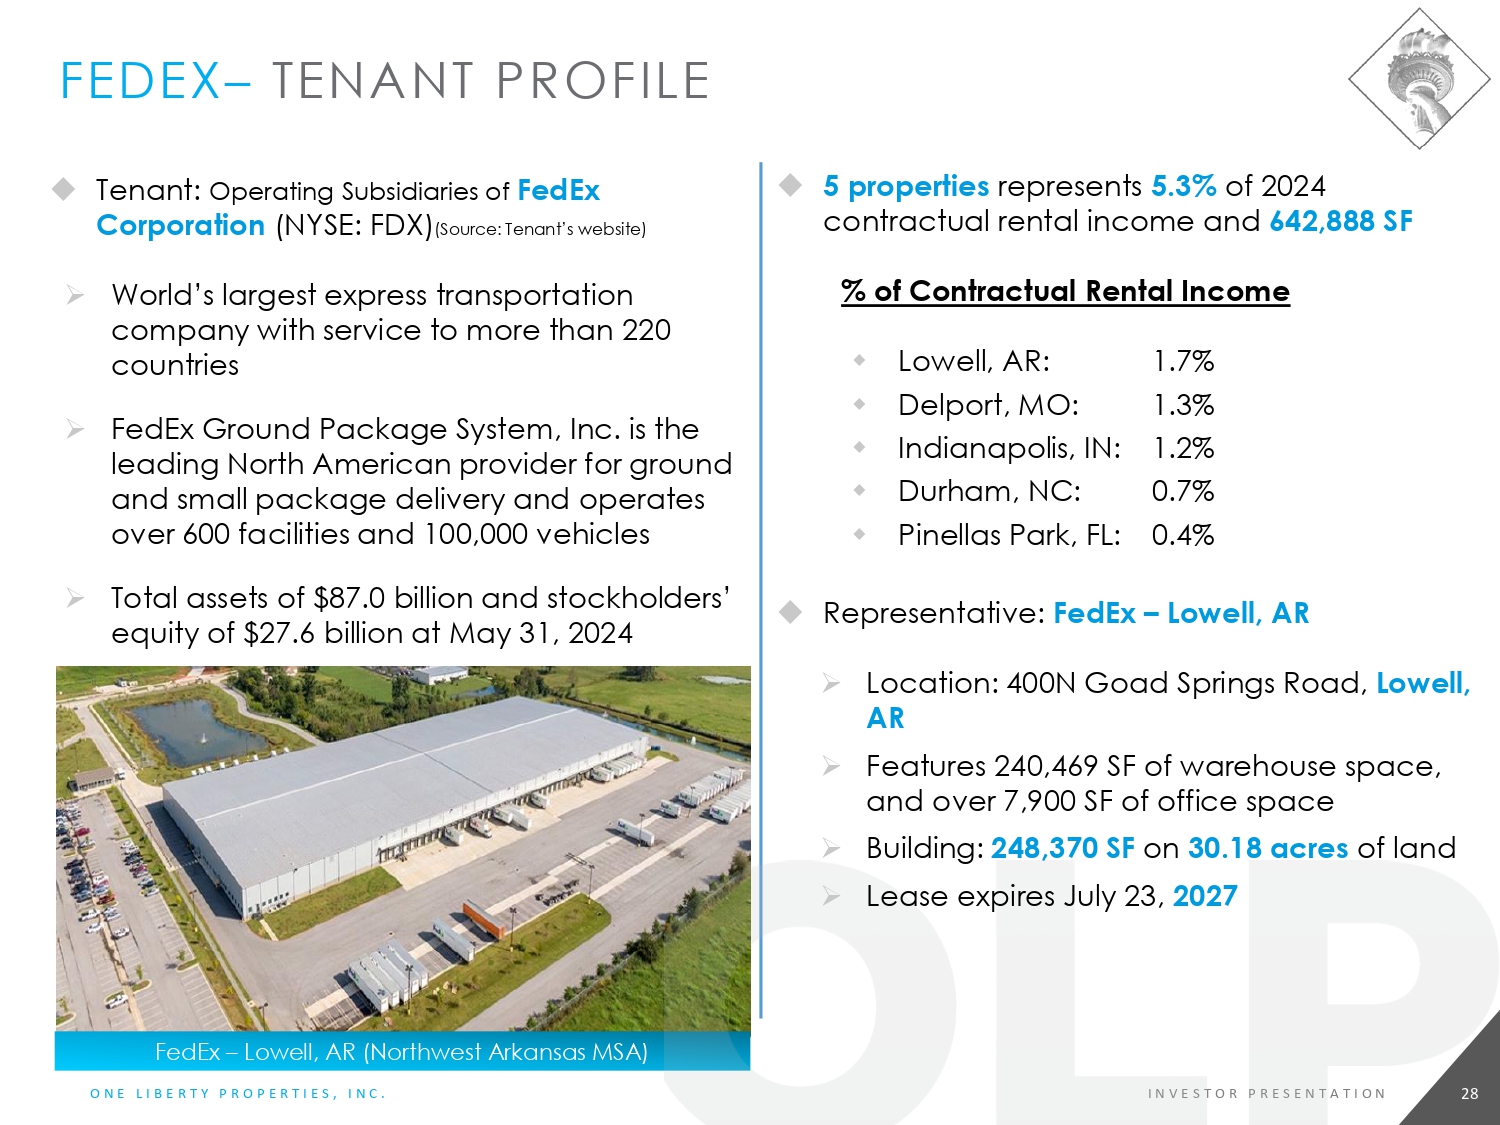
FEDEX – TENANT PROFILE FedEx – Lowell, AR (Northwest Arkansas MSA) Tena n t : Oper a t ing S u bsi d ia ries o f FedEx Co r po r ati o n ( N Y SE : FDX ) ( S ou r c e : T e na n t ’ s w e b s it e ) » W o r l d’ s l arges t expre s s t ra n s p o r t a t i o n c o mp an y w it h s er v i c e t o m o re t h a n 2 20 countries » FedEx G r o u n d Pack age Sys t em, I n c. i s t h e leading North American provider for ground an d sma l l pac k age d e l i ver y an d o per a t es o v er 6 00 fa c i l i ti es an d 1 0 0 , 0 00 v e h i c l es » Total assets of $87.0 billion and stockholders’ equ i t y o f $ 2 7 . 6 b i l li o n a t M a y 3 1 , 2 0 24 28 O N E L I B E R T Y P R O P E R T I E S , I N C . I N V E S T O R P R E S E N T A T I O N 5 p r ope r ties repre s e n t s 5 . 3 % o f 2 0 24 contractual rental income and 642,888 SF % o f Con t r actu a l Renta l I ncome Lo w e l l , A R: De l p o r t , M O: I n d i ana po li s , I N : Dur h am , N C: P i n e l l a s Pa r k, FL: 1 . 7 % 1 . 3 % 1 . 2 % 0 . 7 % 0 . 4 % Repre s e n t a t i v e: FedEx – L o w ell , A R » Loc a t i o n : 4 0 0 N Go a d Spr i n gs R o ad , L o w ell, AR » Fea t u r es 2 4 0 , 4 69 S F o f w are h o u s e s pa c e, an d o v er 7 , 9 00 S F of o f f i c e s pa c e » B uil d i n g : 248 , 3 70 SF on 30 . 1 8 a c r e s o f l and » Lea s e exp i res J u l y 2 3 , 2027

NORTHERN TOOL & EQUIPMENT – TENANT PROFILE N o r t h e r n T o ol & E q u i pmen t – F ort M ill , SC Tena n t : N or t he r n Tool & Equi p ment ( S ou r c e : T e na n t ’ s w e b s it e ) » Distributor and retailer of industrial grade and p e r s o na l u s e p o w er t o o l s a nd eq u i p m e nt » O v er 1 20 r e t a i l s t or e s i n t he U . S. » C l a s s A , 3 0 ’ c l ea r a n ce b u i l d i ng i s s i t u at ed 18 m i l es s o u t h of d o w n t o w n Charlott e, NC of f Interstate - 77 29 O N E L I B E R T Y P R O P E R T I E S , I N C . I N V E S T O R P R E S E N T A T I O N Represents 4.4% of 2024 contractual rental income Location : 1850 Banks Road, Fort Mill, SC » Bui l d i n g : 701 , 5 95 SF o n 40 .0 ac r e s o f l and » Lea s e exp i res A pr i l 3 0 , 2029
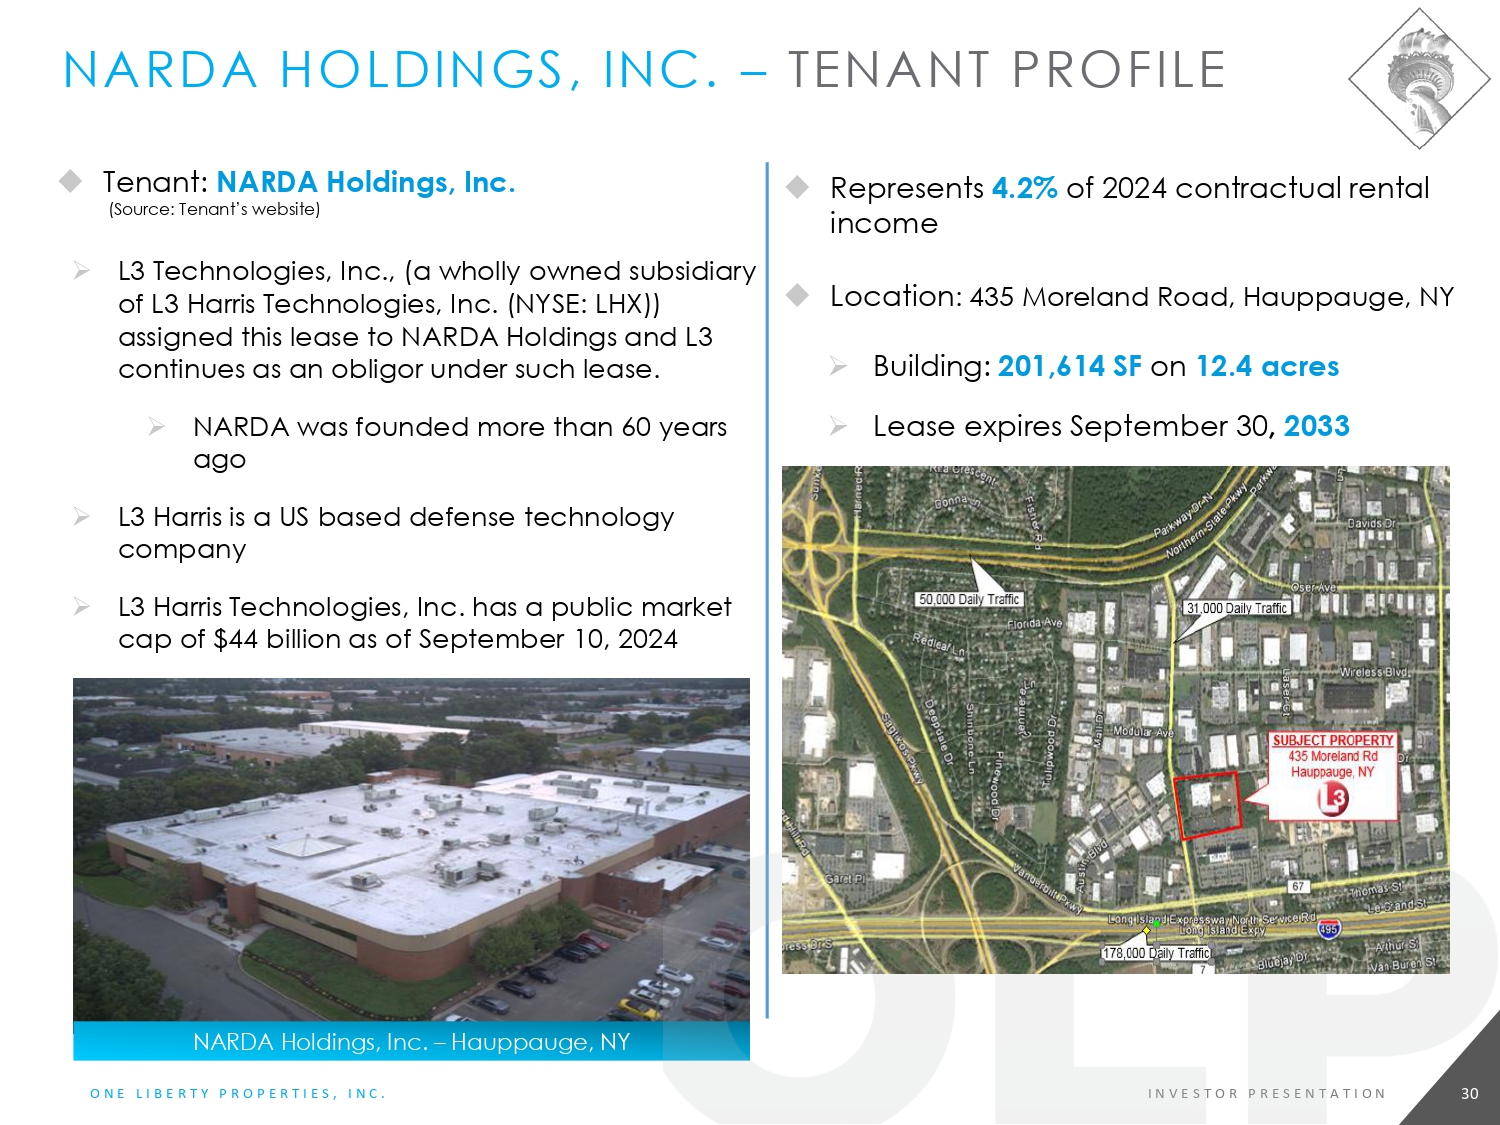
NARDA HOLDINGS, INC. – TENANT PROFILE NARDA Holdings, Inc. – Hauppauge, NY 30 O N E L I B E R T Y P R O P E R T I E S , I N C . I N V E S T O R P R E S E N T A T I O N T enan t : N A RD A H oldi n gs , Inc. ( S o u r c e : T e n a n t ’ s w e b s it e ) » L3 Technologies, Inc., (a wholly owned subsidiary o f L 3 H a rr i s T ec h n o l o g i es, I n c . ( N Y S E : L H X ) ) a ss i g ned t h i s l ea s e t o N A R D A H o l d i ng s a nd L 3 c o nt in u es a s a n o b l i g o r u n d er s u ch l ea se. » N A R D A w a s fo u nded mo r e t ha n 60 y ea r s ago » L3 H a rr i s i s a U S b a sed defe n s e t ec h n o l o g y company » L3 H a rr i s T ec h n o l o g i es, I n c . h a s a p u b l i c ma r ket c a p o f $44 b i ll i o n a s o f S e p t emb er 10 , 2024 Represents 4.2% of 2024 contractual rental income Loc a t i o n : 4 35 Mo r ela nd R o a d , H a u pp a u ge, NY » Bui l d i n g : 201 , 6 14 S F o n 12 .4 acres » Lea s e exp i res Sep t emb er 30 , 2033
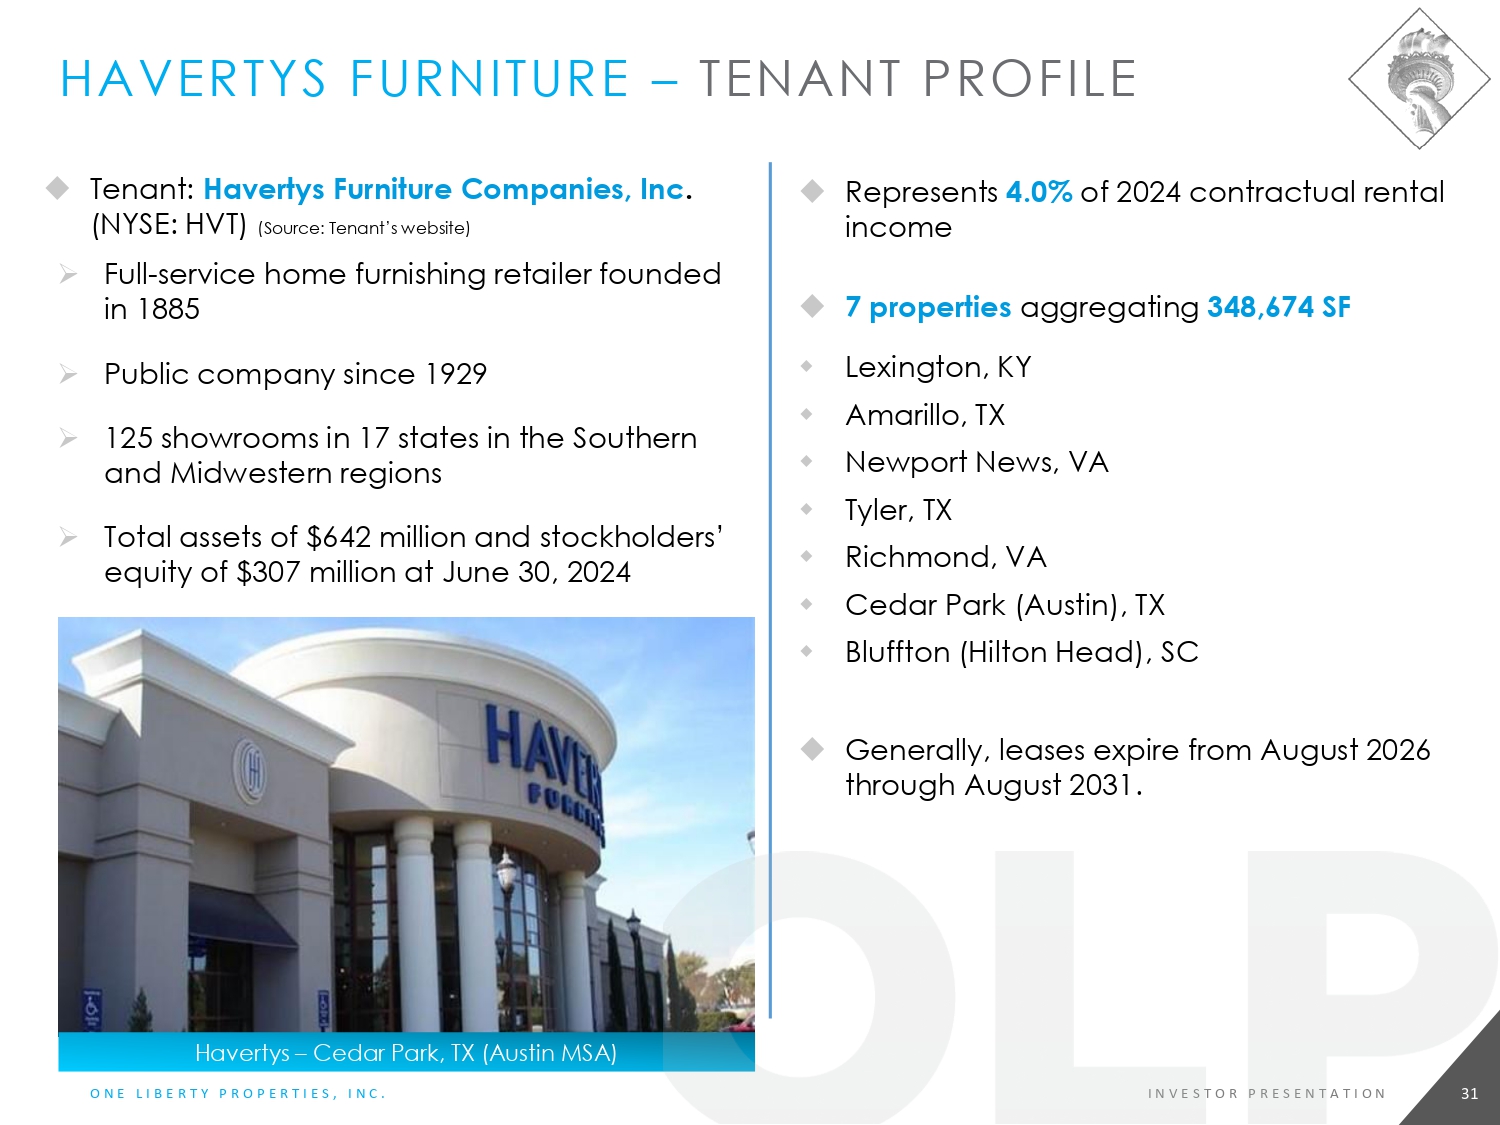
HAVERTYS FURNITURE – TENANT PROFILE Ha v er t y s – Ce dar P a r k, TX ( A us ti n M S A) O N E L I B E R T Y P R O P E R T I E S , I N C . 31 I N V E S T O R P R E S E N T A T I O N Tena n t : H av e r tys F u r nit u r e Comp a nie s , In c . (NYSE: HVT) (Source: Tenant’s website) » Ful l - s e r vi c e h ome fur n i s h i n g r e t a i l er fo u n d e d i n 1 8 85 » P u b l i c c o m p an y s i n ce 1 9 29 » 1 25 s h o w ro o m s i n 1 7 s t a t es i n t h e Sou t h ern an d M i dw es t ern reg i o n s » Total assets of $642 million and stockholders’ equ i t y o f $ 3 0 7 m i l li o n a t J u n e 3 0 , 2 0 24 Represents 4.0% of 2024 contractual rental income 7 properties aggregating 348,674 SF Lex i ngt o n, KY A m ar i ll o , T X N e w p o rt N e w s , V A T y l er, TX R i c h m o nd, V A Ceda r Park ( A us t in ) , T X B l uff t o n ( H i lt o n H e ad ) , SC Gene r a l l y , l eases exp i re fro m A ugust 2 0 26 t h r o ug h A ug ust 2031 .

LA FITNESS – TENANT PROFILE L A F i t n es s – S e c auc u s , NJ O N E L I B E R T Y P R O P E R T I E S , I N C . 32 I N V E S T O R P R E S E N T A T I O N Tenant: LA Fitness International, LLC ( S ou r c e : T e na n t ’ s w e b s it e ) » O p e r at es o v er 5 70 c l u b s i n 2 2 s t at es a n d C a na da » Founded in 1984 and is headquartered in Irvine, CA 2 p r ope r ties repre s e n t s 3 . 5 % o f 2 0 24 contractual rental income and 103,663 SF % o f 2024 C on t r a ct u a l Rent a l Income Secaucus , N J : Tuc k er, G A : 2 . 1 % 1 . 4 % Representative: LA Fitness – Secaucus, NJ » Loc a t i o n : 4 85 Harm o n M eadow B l vd, Secaucus, NJ ; 4 miles west of Manhattan; » Features 2 million SF of office space, 7 hotels and over 1 million SF of retail space » Bui l d i n g : 44 , 8 63 SF o n 1 . 2 3 ac r e s o f l and » Lea s e exp i res Feb r u ary 29 , 2040
GAAP RECONCILIATION
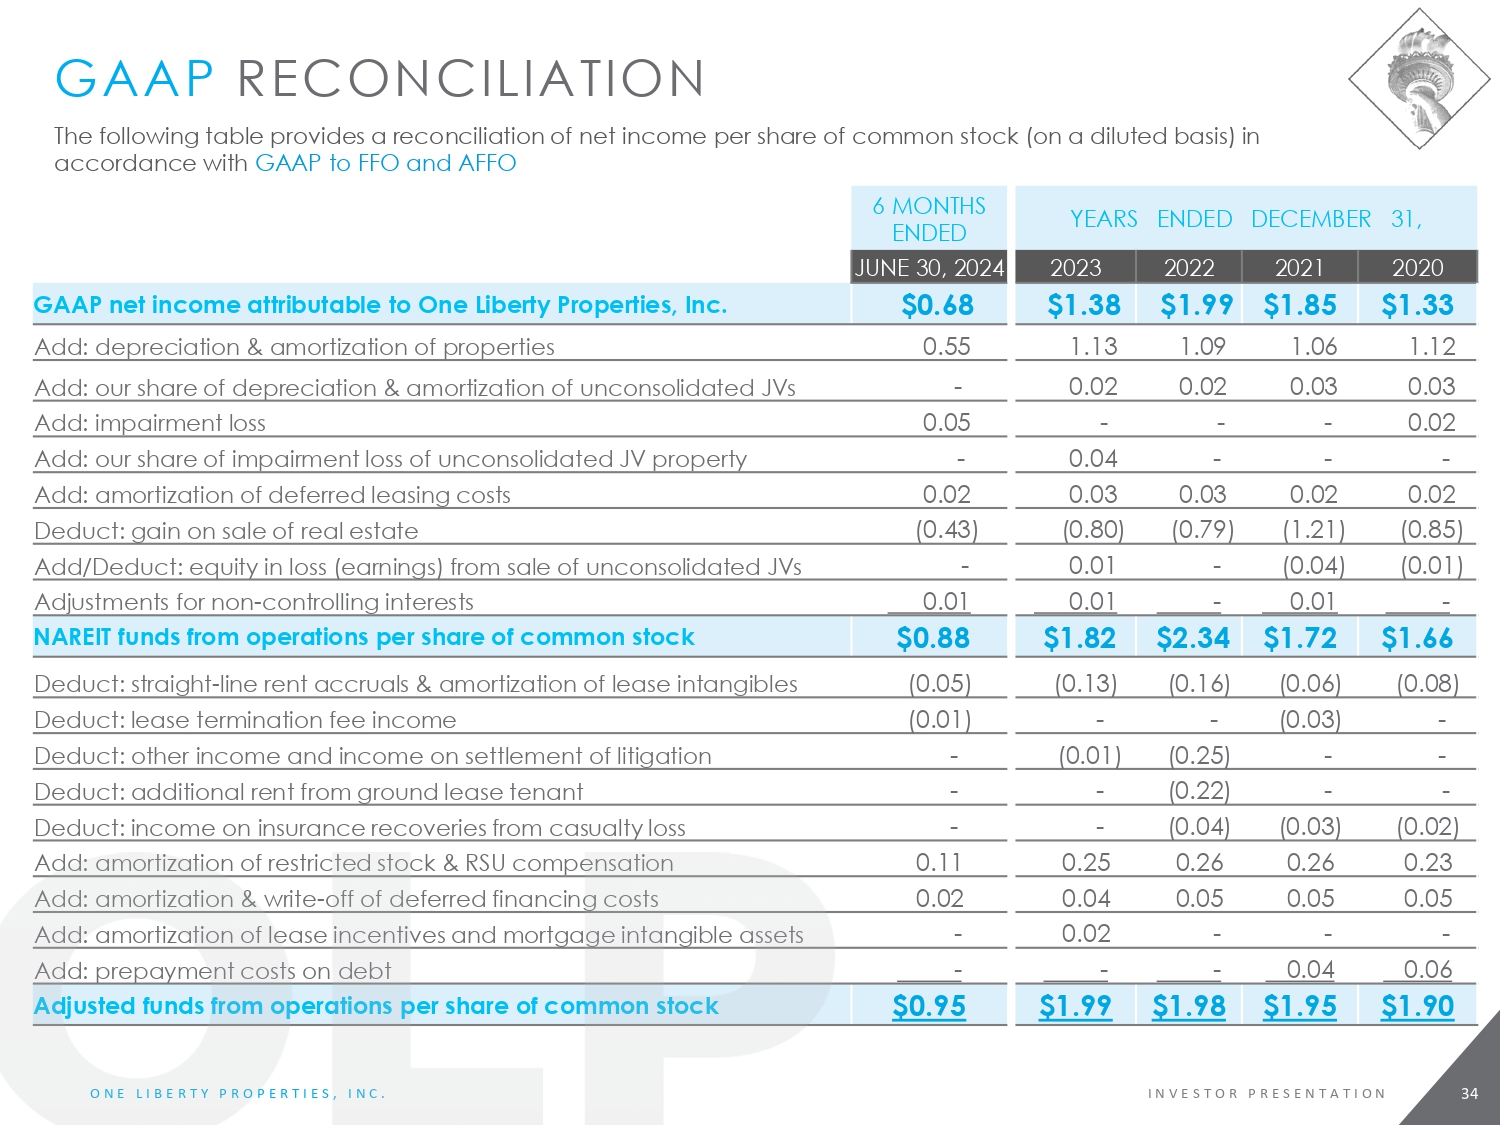
YEARS ENDED DECEMBER 31, 6 M O NTH S ENDED 2020 2021 2022 2023 J U N E 30 , 2024 $1.33 $1.85 $1.99 $1.38 $0.68 GAAP n e t in co me att ri b uta b le to One Li be rty P r o p e rti e s, In c . 1.12 1.06 1.09 1.13 0.55 Add: depreciation & amortization of properties 0.03 0.03 0.02 0.02 - Add: our share of depreciation & amortization of unconsolidated JVs 0.02 - - - 0.05 A dd : i mp a i r m ent l oss - - - 0.04 - Add: our share of impairment loss of unconsolidated JV property 0.02 0.02 0.03 0.03 0.02 A dd : a m o rt i za t i o n o f defe rr e d l eas i ng c osts (0.85) (1.21) (0.79) (0.80) (0.43) D edu c t: ga i n on s a l e of real estate (0.01) (0.04) - 0.01 - Add/Deduct: equity in loss (earnings) from sale of unconsolidated JVs - 0.01 - 0.01 0.01 A d just m ents for n on - co n trol li ng i n t e r ests $1.66 $1.72 $2.34 $1.82 $0.88 NAREIT funds from operations per share of common stock (0.08) (0.06) (0.16) (0.13) (0.05) Deduct: straight - line rent accruals & amortization of lease intangibles - (0.03) - - (0.01) Deduct: lease termination fee income - - (0.25) (0.01) - Deduct: other income and income on settlement of litigation - - (0.22) - - Deduct: additional rent from ground lease tenant (0.02) (0.03) (0.04) - - Deduct: income on insurance recoveries from casualty loss 0.23 0.26 0.26 0.25 0.11 Add: amortization of restricted stock & RSU compensation 0.05 0.05 0.05 0.04 0.02 Add: amortization & write - off of deferred financing costs - - - 0.02 - Add: amortization of lease incentives and mortgage intangible assets 0.06 0.04 - - - A dd : p r ep ay me nt costs on de bt $1.90 $1.95 $1.98 $1.99 $0.95 Adjusted funds from operations per share of common stock The following table provides a reconciliation of net income per share of common stock (on a diluted basis) in accordance with GAAP to FFO and AFFO GAAP RECONCILIATION
I N V E S T O R P R E S E N T A T I O N O N E L I B E R T Y P R O P E R T I E S , I N C . 35 35 NON - GAAP FINANCIAL MEASURES One Liberty compute funds from operations, or FFO, in accordance with the “White Paper on Funds From Operations” issued by the National Association of Real Estate Investment Trusts (“NAREIT”) and NAREIT’s related guidance. FFO is defined in the White Paper as net income (calculated in accordance with GAAP), excluding depreciation and amortization related to real estate, gains and losses from the sale of certain real estate assets, gains and losses from change in control, impairment write - downs of certain real estate assets and investments in entities where the impairment is directly attributable to decreases in the value of depreciable real estate held by the entity. Adjustments for unconsolidated partnerships and joint ventures are calculated to reflect FFO on the same basis. In computing FFO, One Liberty does not add back to net income the amortization of costs in connection with its financing activities or depreciation of non - real estate assets. One Liberty computes adjusted funds from operations, or AFFO, by adjusting from FFO for our straight - line rent accruals and amortization of lease intangibles, deducting from income, additional rent from ground lease tenant, income on settlement of litigation, income on insurance recoveries from casualties, lease termination and assignment fees, and adding back amortization of restricted stock and restricted stock unit compensation expense, amortization of costs in connection with its financing activities (including our share of our unconsolidated joint ventures), debt prepayment costs and amortization of lease incentives and mortgage intangible assets. Since the NAREIT White Paper does not provide guidelines for computing AFFO, the computation of AFFO may vary from one REIT to another. One Liberty believes that FFO and AFFO are useful and standard supplemental measures of the operating performance for equity REITs and are used frequently by securities analysts, investors and other interested parties in evaluating equity REITs, many of which present FFO and AFFO when reporting their operating results. FFO and AFFO are intended to exclude GAAP historical cost depreciation and amortization of real estate assets, which assumes that the value of real estate assets diminish predictability over time. In fact, real estate values have historically risen and fallen with market conditions. As a result, management believes that FFO and AFFO provide a performance measure that when compared year over year, should reflect the impact to operations from trends in occupancy rates, rental rates, operating costs, interest costs and other matters without the inclusion of depreciation and amortization, providing a perspective that may not be necessarily apparent from net income. Management also considers FFO and AFFO to be useful in evaluating potential property acquisitions. FFO and AFFO do not represent net income or cash flows from operations as defined by GAAP. FFO and AFFO should not be considered an alternative to net income as a reliable measure of our operating performance; nor should FFO and AFFO be considered an alternative to cash flows from operating, investing or financing activities (as defined by GAAP) as measures of liquidity. FFO and AFFO do not measure whether cash flow is sufficient to fund all of our cash needs, including principal amortization, capital improvements and distributions to stockholders. Management recognizes that there are limitations in the use of FFO and AFFO. In evaluating our performance, management is careful to examine GAAP measures such as net income and cash flows from operating, investing and financing activities.