UNITED STATES
SECURITIES AND EXCHANGE COMMISSION
Washington, D.C. 20549
_____________
FORM 10-K
______________________
(Mark One)
ý
ANNUAL REPORT PURSUANT TO SECTION 13 OR 15(d)
OF THE SECURITIES EXCHANGE ACT OF 1934.
For the Fiscal Year Ended December 31, 2006
OR
¨
TRANSITION REPORT PURSUANT TO SECTION 13 OR 15(d)
OF THE SECURITIES EXCHANGE ACT OF 1934.
For the transition period from to
Commission File Number: 2-81353
___________
CENTER BANCORP, INC.
(Exact name of Registrant as specified in its charter)
____________________
| | |
| | |
New Jersey | | 52-1273725 |
(State or Other Jurisdiction of
Incorporation or Organization) | | (IRS Employer
Identification Number) |
2455 Morris Avenue, Union, NJ 07083-0007
(Address of Principal Executive Offices, Including Zip Code)
(908) 688-9500
(Registrant’s telephone number, including area code)
Securities registered pursuant to Section 12(b) of the Exchange Act: None
Securities registered pursuant to Section 12(g) of the Exchange Act:
Common stock, no par value
(Title of class)
Indicate by checkmark if the registrant is a well-known seasoned issuer, as defined in Rule 405 of the Securities Act. Yes ¨ or No ý
Indicate by checkmark if the registrant is not required to file reports pursuant to Section 13 or 15(d) of the Act. Yes ¨ or No ý
Indicate by check mark whether the registrant (1) has filed all reports required to be filed by Section 13 or 15 (d) of the Securities Exchange Act of 1934 during the preceding 12 months (or for such shorter period that the registrant was required to file such reports), and (2) has been subject to such filing requirements for the past 90 days. Yes ý or No ¨
Indicate by check mark if disclosure of delinquent filers pursuant to Item 405 of Regulation S-K is not contained herein, and will not be contained, to the best of Registrant’s knowledge, in definitive proxy or information statements incorporated by reference in Part III of the Form 10-K or any amendment to the Form 10-K. ¨
Indicate by check mark whether the registrant is a large accelerated filer, an accelerated filer, or a non-accelerated filer. See definition of “accelerated filer and large accelerated filer” in Rule 12b-2 of the Securities Exchange Act of 1934).
| | |
Large accelerated filer ¨ | Accelerated filer ý | Non-accelerated ¨ |
Indicate by check mark whether the registrant is a shell company (as defined in Rule 12b-2 of the Act) Yes ¨ or No ý
The aggregate market value of the voting and non-voting common equity held by non-affiliates computed by reference to the price at which the common equity was last sold or the average bid and ask price of such common equity, as of the last business day of the registrant’s most recently completed second fiscal quarter – $178.0 million
Shares outstanding on February 28, 2007
Common stock, no par value: 13,248,406 shares
Documents Incorporated by reference
Definitive proxy statement in connection with the 2007 Annual Stockholders Meeting to be filed with the Commission pursuant to Regulation 14A will be incorporated by reference in Part III.
| | | | |
| | | | | Page |
| | | | |
| | | | |
| | | | |
| | | | |
| | | | |
| | | | |
| | | | |
| | | | |
| | | | | |
| | | | |
| | | | |
| | | | |
| | | | |
| | | | |
| | | | |
| | | Center Bancorp, Inc. and Subsidiaries: | | |
| | | | | |
| | | | | |
| | | | | |
| | | | | |
| | | | | |
| | | | | |
| | | | |
| | | | |
| | | | |
| | | | | |
| | | | |
| | | | |
| | | | |
| | | | |
| | | | |
| | | | |
| | | | | |
| | | | |
| | | | |
| | | | | |
CENTER BANCORP, INC.
FORM 10-K
PART I A) Historical Development of Business
This report, in Item 1, Item 7 and else where includes forward-looking statements within the meaning of Sections 27A of the Securities Act of 1933, as amended, and 21E of the Securities Exchange Act of 1934, as amended, that involve inherent risks and uncertainties. This report contains certain forward-looking statements with respect to the financial condition, results of operations, plans, objectives, future performance and business of Center Bancorp Inc. and its subsidiaries including statements preceded by, followed by or that include words or phrases such as “believes,” “expects,” “anticipates,” “plans,” “trend,” “objective,” “continue,” “remain,” “pattern” or similar expressions or future or conditional verbs such as “will,” “would,” “should,” “could,” “might,” “can,” “may” or similar expressions. There are a number of important factors that could cause future results to differ materially from historical performance and these forward-looking statements. Factors that might cause such a difference include, but are not limited to: (1) competitive pressures among depository institutions may increase significantly; (2) changes in the interest rate environment may reduce interest margins; (3) prepayment speeds, loan origination and sale volumes, charge-offs and loan loss provisions may vary substantially from period to period; (4) general economic conditions may be less favorable than expected; (5) political developments, wars or other hostilities may disrupt or increase volatility in securities markets or other economic conditions; (6) legislative or regulatory changes or actions may adversely affect the businesses in which Center Bancorp, Inc. is engaged; (7) changes and trends in the securities markets may adversely impact Center Bancorp; (8) a delayed or incomplete resolution of regulatory issues could adversely impact our planning; (9) the impact on reputation risk created by the developments discussed above on such matters as business generation and retention, funding and liquidity could be significant; and (10) the outcome of regulatory and legal investigations and proceedings may not be anticipated. Further information on other factors that could affect the financial results of Center Bancorp, Inc. are included in Item 1A of this Annual Report on Form 10-K and in Center Bancorp’s other filings with the Securities and Exchange Commission. These documents are available free of charge at the Commission’s website at http://www.sec.gov and/or from Center Bancorp. Center Bancorp, Inc. assumes no obligation to update forward-looking statements at any time.
Center Bancorp, Inc., a one-bank holding company, was incorporated in the state of New Jersey on November 12, 1982. Center Bancorp, Inc. commenced operations on May 1, 1983, upon the acquisition of all outstanding shares of The Union Center National Bank (the “Bank”) its principal subsidiary. The holding company’s sole activity, at this time, is to act as a holding company for the Bank and its subsidiaries. As used herein, the term “Corporation” shall refer to Center Bancorp, Inc. and its direct and indirect subsidiaries and the term “Parent Corporation” shall refer to Center Bancorp, Inc. on an unconsolidated basis. In addition to its principal subsidiary, Center Bancorp, Inc. owns 100 percent of the voting shares of Center Bancorp, Inc. Statutory Trust II, through which it issued trust preferred securities. Center Bancorp, Inc. Statutory Trust II is not a consolidated subsidiary. See Note 12 of the consolidated financial statements.
The Corporation’s wholly owned subsidiaries are all included in the consolidated financial statements of Center Bancorp, Inc. These subsidiaries include an advertising subsidiary; an insurance subsidiary offering annuity products property and casualty, life and health insurance; various investment subsidiaries which hold, maintain and manage investment assets for the Corporation. The Corporation’s subsidiaries also include real estate investment trust subsidiaries (the “REIT” subsidiaries) which own real estate related investments and a REIT subsidiary that owns some of the real estate loans and related real estate investments. All subsidiaries mentioned above are directly or indirectly wholly-owned by the Corporation, except that the Corporation owns less than 100 percent of the preferred stock of the REIT subsidiaries. Each REIT must have 100 or more shareholders to qualify as a REIT, and therefore, each REIT has issued less than 20 percent of their outstanding non-voting preferred stock to individuals, most of whom are non-senior management Union Center National Bank employees.
During the fourth quarter of 2006, the Corporation effected an internal entity reorganization and adopted a plan of liquidation for its REIT subsidiary.
During 2001 and 2003, the Corporation formed statutory business trusts, which exist for the exclusive purpose of (i) issuing trust securities representing undivided beneficial interests in the assets of a trust; (ii) investing the gross
3
proceeds of the trust securities in junior subordinated deferrable interest debentures (subordinated debentures) of the Corporation; and (iii) engaging in only those activities necessary or incidental thereto. These subordinated debentures and the related income effects are not eliminated in the consolidated financial statements as the statutory business trusts are not consolidated in accordance with Financial Accounting Standards Board (“FASB”) interpretation No. 46 “Consolidation of Variable Interest Entities.” Distributions on the subordinated debentures owned by the subsidiary trusts have been classified as interest expense in the Consolidated Statements of Income.
The Corporation issued $10.3 million in 2001 and $5.2 million in 2003 of subordinated debentures. On December 18, 2006 the Corporation redeemed $10.3 million of subordinated debentures and dissolved Center Bancorp, Inc. Statutory Trust I. At December 31, 2006, the $5.2 million still outstanding of these securities are included as a component of Tier 1 Capital for regulatory purposes. The Tier 1 leverage capital ratio was 8.64 percent at December 31, 2006.
During 2002, the Bank established two investment subsidiaries to hold portions of its securities portfolio and in January of 2003, established an insurance subsidiary for the sale of insurance and annuity products.
On September 29, 2004 the Parent issued 888,888 shares of the Parent’s common stock to a limited number of accredited investors in a private placement of its securities. The shares were issued at a purchase price of $11.25 per share. Net proceeds to the Parent were approximately $9.4 million, after commissions and expenses. On June 30, 2005, the Corporation issued an additional 1,904,761 shares of the holding company’s common stock to a limited number of accredited investors in a private placement of its securities. The shares were issued at a purchase price of $10.50 per share. Net proceeds to the holding company were approximately $18.9 million, after commissions and expenses.
The Corporation utilized the net proceeds from each offering for working capital purposes. In addition, Center Bancorp will also use such proceeds to increase capital levels, to fund branch expansion, for strategic acquisitions which could include non-bank financial services companies, for new hires to expand its commercial lending business and to make payments with respect to outstanding trust preferred securities.
The shares sold in the offerings were not initially registered under the Securities Act of 1933. The shares were restricted from being offered or sold in the United States absent registration or an applicable exemption from registration requirements. Pursuant to the terms of agreements entered into with the investors, the Parent has registered the shares for resale by the investors.
The Corporation completed the acquisition of Red Oak Bank as of the close of business on May 20, 2005. Red Oak Bank was a State chartered commercial bank and operated one full service branch location in Hanover Township, Morris County, New Jersey. The acquisition presented the Corporation with the strategic opportunity to enhance shareholder value, market share and earnings growth. The opportunities included increasing the Corporation’s loan portfolio, strengthening and expanding the Corporation’s presence in the affluent and desirable business areas of the Morris County marketplace, which compliments the Corporation’s existing footprint in that market, through additional retail and commercial banking product offerings, increasing deposit share and further building the Corporation’s core deposit funding base, as well as enhancing the Corporation’s opportunities for earning asset generation.
Pursuant to the terms of the Agreement and Plan of Merger, 50% of Red Oak Bank’s common stock was converted into Center Bancorp, Inc. common stock at an exchange rate of .9227 of the Corporation’s shares per each Red Oak Bank share and 50% was converted into $12.06 in cash for each Red Oak Bank share. The aggregate consideration paid in the merger consisted of $13.3 million in cash and 1,015,816 shares of the Corporation’s common stock. The cash portion of the merger consideration was funded through the sale of securities available for sale and cash from continuing operations. The Corporation additionally converted remaining stock options covering 56,266 shares of Red Oak Bank common stock outstanding at the time of the merger, these options were exchanged for options covering 54,514 shares of Center Bancorp, Inc. common stock.
As a result of the Red Oak Bank acquisition, the Corporation acquired assets having a fair value of $115.3 million, including $89.6 million of net loans, $5.4 million of investment securities and $2.4 million of cash and cash equivalents, and assumed $70.7 million of deposits, $17.1 million of borrowings, and $792,000 of other liabilities.
4
The acquisition was accounted for as a purchase and the excess cost over the fair value of net assets acquired (“goodwill”) in the transaction was $14.7 million. Under the provisions of Statement of Financial Accounting Standards (“SFAS”) No. 142, goodwill is not being amortized in connection with this transaction and the goodwill will not be deductible for income tax purposes. The Corporation also recorded a core deposit intangible of $702,617 in connection with the acquisition, which is being amortized on a 10-year sum of the digits method.
SEC Reports and Corporate Governance
The Corporation makes its Annual Report on Form 10-K, Quarterly Reports on Form 10-Q and Current Reports on Form 8-K and amendments thereto available on its website at www.centerbancorp.com without charge as soon as reasonably practicable after filing or furnishing them to the SEC. Also available on the website are Center Bancorp’s corporate code of ethics that applies to all of Center Bancorp’s employees including principal officers and directors and charters for the Audit Committee and Nominating and Corporate Governance Committee Charter as well as a copy of Center Bancorp’s Corporate Governance Guidelines.
Center Bancorp, Inc. filed the certifications of the Chief Executive Officer and Chief Financial Officer required pursuant to Section 302 of the Sarbanes-Oxley Act of 2002 with respect to Center Bancorp’s Annual Report on Form 10-K as exhibits to this Report. Center Bancorp’s CEO submitted the required annual CEO’s Certification regarding the NASDAQ’s corporate governance listing standards, Section 12(a) CEO Certification to the NASDAQ within the required timeframe after the 2006 annual shareholders’ meeting.
Additionally, the Corporation will provide without charge, a copy of its Annual Report on Form 10-K to any shareholder by mail. Requests should be sent to Center Bancorp, Inc, Attention: Shareholder Relations, 2455 Morris Avenue, Union, New Jersey, 07083.
B) Narrative Description of Business
The Bank offers a broad range of lending, depository and related financial services to commercial, industrial and governmental customers. In 1999, the Bank obtained full trust powers, enabling it to offer a variety of trust services to its customers. In the lending area, the Bank’s services include short and medium term loans, lines of credit, letters of credit, working capital loans, real estate construction loans and mortgage loans. In the depository area, the Bank offers demand deposits, savings accounts and time deposits. In addition, the Bank offers collection services, wire transfers, night depository and lock box services.
The Bank offers a broad range of consumer banking services, including interest bearing and non-interest bearing checking accounts, savings accounts, money market accounts, certificates of deposit, IRA accounts, Automated Teller Machine (“ATM”) accessibility using Star Systems, Inc. service, secured and unsecured loans, mortgage loans, home equity lines of credit, safe deposit boxes, Christmas club accounts, vacation club accounts, money orders and traveler’s checks.
The Bank offers various money market services. It deals in U.S. Treasury and U.S. Governmental agency securities, certificates of deposits, commercial paper and repurchase agreements.
Competitive pressures affect the Corporation’s manner of conducting business. Competition stems not only from other commercial banks but also from other financial institutions such as savings banks, savings and loan associations, mortgage companies, leasing companies and various other financial service and advisory companies. Many of the financial institutions operating in the Corporation’s primary market are substantially larger and offer a wider variety of products and services than the Corporation.
SUPERVISION AND REGULATION
The banking industry is highly regulated. Statutory and regulatory controls increase a bank holding company’s cost of doing business and limit the options of its management to deploy assets and maximize income. The following discussion is not intended to be a complete list of all the activities regulated by the banking laws or of the impact of such laws and regulations on the Corporation or its Bank subsidiary. It is intended only to briefly summarize some material provisions.
5
Bank Holding Company Regulation
Center Bancorp, Inc. is a bank holding company within the meaning of the Bank Holding Company Act of 1956 (the “Holding Company Act”). As a bank holding company, the Corporation is supervised by the Board of Governors of the Federal Reserve System (“FRB”) and is required to file reports with the FRB and provide such additional information as the FRB may require.
The Holding Company Act prohibits the Corporation, with certain exceptions, from acquiring direct or indirect ownership or control of more than five percent of the voting shares of any company which is not a bank and from engaging in any business other than that of banking, managing and controlling banks or furnishing services to subsidiary banks, except that it may, upon application, engage in, and may own shares of companies engaged in, certain businesses found by the FRB to be so closely related to banking “as to be a proper incident thereto.” The Holding Company Act requires prior approval by the FRB of the acquisition by Center Bancorp, Inc. of more than five percent of the voting stock of any other bank. Satisfactory capital ratios and Community Reinvestment Act ratings and anti-money laundering policies are generally prerequisites to obtaining federal regulatory approval to make acquisitions. The policy of the FRB provides that a bank holding company is expected to act as a source of financial strength to its subsidiary bank and to commit resources to support the subsidiary bank in circumstances in which it might not do so absent that policy. Acquisitions through Union Center National Bank require approval of the Office of the Comptroller of the Currency of the United States (“OCC”). The Holding Company Act does not place territorial restrictions on the activities of non-bank subsidiaries of bank holding companies. The Gramm-Leach-Bliley Act, discussed below, allows the Corporation to expand into insurance, securities, merchant banking activities, and other activities that are financial in nature.
The Riegle-Neal Interstate Banking and Branching Efficiency Act of 1994 (“Interstate Banking and Branching Act”) enables bank holding companies to acquire banks in states other than its home state, regardless of applicable state law. The Interstate Banking and Branching Act also authorizes banks to merge across state lines, thereby creating interstate banks with branches in more than one state. Under the legislation, each state had the opportunity to “opt-out” of this provision. Furthermore, a state may “opt-in” with respect to de novo branching, thereby permitting a bank to open new branches in a state in which the bank does not already have a branch. Without de novo branching, an out-of-state commercial bank can enter the state only by acquiring an existing bank or branch. The vast majority of states have allowed interstate banking by merger but have not authorized de novo branching.
New Jersey enacted legislation to authorize interstate banking and branching and the entry into New Jersey of foreign country banks. New Jersey did not authorize de novo branching into the state. However, under federal law, federal savings banks which meet certain conditions may branch de novo into a state, regardless of state law.
The Parent Corporation is required to file with the Federal Reserve Board an annual report and such additional information as the Federal Reserve Board may require pursuant to the Holding Company Act. In addition, the Federal Reserve Board makes periodic examinations of bank holding companies and their subsidiaries. The Holding Company Act requires each bank holding company to obtain the prior approval of the Federal Reserve Board before it may acquire substantially all of the assets of any bank, or before it may acquire ownership or control of any voting shares of any bank, if, after such acquisition, it would own or control, directly or indirectly, more than 5 percent of the voting shares of such bank. The Holding Company Act limits the activities which may be engaged in by the Corporation and its subsidiaries to those of banking, the ownership and acquisition of assets and securities of banking organizations, and the management of banking organizations, and to certain non-banking activities which the Federal Reserve Board finds, by order or regulation, to be so closely related to banking or managing or controlling a bank as to be a proper incident thereto.
The Federal Reserve Board is empowered to differentiate between activities by a bank holding company or a subsidiary thereof and activities commenced by acquisition of a going concern. With respect to non-banking activities, the Federal Reserve Board has by regulation determined that several non-banking activities are closely related to banking within the meaning of the Holding Company Act and thus may be performed by bank holding companies.
Regulation of Bank Subsidiary
The operations of the Bank are subject to requirements and restrictions under federal law, including requirements to maintain reserves against deposits, restrictions on the types and amounts of loans that may be granted, limitations on the types of investments that may be made and the types of services, which may be offered.
6
Various consumer laws and regulations also affect the operations of the Bank. Approval of the Comptroller of the Currency is required for branching, bank mergers in which the continuing bank is a national bank and in connection with certain fundamental corporate changes affecting the Bank. There are various legal limitations, including Sections 23A and 23B of the Federal Reserve Act, which govern the extent to which a bank subsidiary may finance or otherwise supply funds to its holding company or its holding company’s non-bank subsidiaries. Under federal law, no bank subsidiary may, subject to certain limited exceptions, make loans or extensions of credit to, or investments in the securities of, its parent or the non-bank subsidiaries of its parent (other than direct subsidiaries of such bank which are not financial subsidiaries) or take their securities as collateral for loans to any borrower. Each bank subsidiary is also subject to collateral security requirements for any loans or extensions of credit permitted by such exceptions.
FIRREA
Under the Financial Institutions Reform, Recovery, and Enforcement Act of 1989 (“FIRREA”), a depository institution insured by the Federal Deposit Insurance Corp (“FDIC”) can be held liable for any loss incurred by, or reasonably expected to be incurred by, the FDIC in connection with (i) the default of a commonly controlled FDIC-insured depository institution or (ii) any assistance provided by the FDIC to a commonly controlled FDIC-insured depository institution in danger of default. These provisions have commonly been referred to as FIRREA’s “cross guarantee” provisions. Further, under FIRREA, the failure to meet capital guidelines could subject a bank to a variety of enforcement remedies available to federal regulatory authorities.
FIRREA also imposes certain independent appraisal requirements upon a bank’s real estate lending activities and further imposes certain loan-to-value restrictions on a bank’s real estate lending activities. The bank regulators have promulgated regulations in these areas.
FDICIA
The Federal Deposit Insurance Corporation Improvement Act of 1991 (“FDICIA”) among other things requires federal banking agencies to broaden the scope of regulatory corrective action taken with respect to banks that do not meet minimum capital requirements and to take such actions promptly in order to minimize losses to the FDIC. Under FDICIA, federal banking agencies have established five capital tiers: “well capitalized”, “adequately capitalized”, and “undercapitalized”, “significantly undercapitalized” and “critically undercapitalized”.
Under regulations adopted pursuant to these provisions, for an institution to be well capitalized it must have a total risk-based capital ratio of at least 10 percent, a Tier I risk-based capital ratio of at least 6 percent and a Tier I leverage ratio of at least 5 percent and not be subject to any specific capital order or directive. For an institution to be adequately capitalized, it must have a total risk-based capital ratio of at least 8 percent, a Tier I risk-based capital ratio of at least 4 percent and a Tier I leverage ratio of at least 4 percent (or in some cases 3 percent). Under the regulations, an institution will be deemed to be undercapitalized if the bank has a total risk-based capital ratio that is less than 8 percent, a Tier I risk-based capital ratio that is less than 4 percent or a Tier I leverage ratio of less than 4 percent (or in some cases 3 percent).
An institution will be deemed to be significantly undercapitalized if the bank has a total risk-based capital ratio that is less than 6 percent, a Tier I risk-based capital ratio that is less than 3 percent, or a Tier I leverage ratio of less than 3 percent and will be deemed to be critically undercapitalized if it has a ratio of tangible equity to total assets that is equal to or less than 2 percent. An institution may be deemed to be in a lower capitalization category if it receives an unsatisfactory examination rating.
FDICIA also directs that each federal banking agency prescribe standards for depository institutions and depository institution holding companies relating to internal controls, information systems, internal audit systems, loan documentation, credit underwriting, interest rate exposure, asset growth, a maximum ratio of classified assets to capital, a minimum ratio of market value to book value for publicly traded shares (if feasible) and such other standards as the agency deems appropriate.
FDICIA also contains a variety of other provisions that could affect the operations of the Corporation, including reporting requirements, regulatory standards for real estate lending, “truth in savings” provisions, the requirement that depository institutions give 90 days notice to customers and regulatory authorities before closing any branch, limitations on credit exposure between banks, restrictions on loans to a bank’s insiders and guidelines governing regulatory examinations.
7
Insurance Funds
The Corporation is a member of the Bank Insurance Fund (“BIF”) of the FDIC. The FDIC also maintains another insurance fund, the Savings Association Insurance Fund (“SAIF”), which primarily covers savings and loan association deposits but also covers deposits that are acquired by a BIF-insured institution from a savings and loan association. As of the most recent quarterly assessment preformed by the FDIC, the Corporation had approximately $749.6 million of deposits subject to assessment at December 31, 2006, with respect to which it pays SAIF FICO Assessments.
The Gramm-Leach-Bliley Financial Modernization Act of 1999
The Gramm-Leach-Bliley Financial Modernization Act of 1999 became effective in early 2000. The Modernization Act:
·
allows bank holding companies meeting management, capital, and Community Reinvestment Act standards to engage in a substantially broader range of non-banking activities than previously was permissible, including insurance underwriting and making merchant banking investments in commercial and financial companies; if a bank holding company elects to become a financial holding company, it files a certification, effective in 30 days, and thereafter may engage in certain financial activities without further approvals;
·
allows insurers and other financial services companies to acquire banks;
·
removes various restrictions that previously applied to bank holding company ownership of securities firms and mutual fund advisory companies; and
·
establishes the overall regulatory structure applicable to bank holding companies that also engage in insurance and securities operations.
The Modernization Act also modified other financial laws, including laws related to financial privacy and community reinvestment.
Community Reinvestment
Under the Community Reinvestment Act (“CRA”), as implemented by OCC regulations, a national bank has a continuing and affirmative obligation consistent with its safe and sound operation to help meet the credit needs of its entire community, including low and moderate income neighborhoods. The CRA does not establish specific lending requirements or programs for financial institutions nor does it limit an institution’s discretion to develop the types of products and services that it believes are best suited to its particular community, consistent with the CRA. The CRA requires the OCC, in connection with its examination of a national bank, to assess the bank’s record of meeting the credit needs of its community and to take such record into account in its evaluation of certain applications by such bank.
USA Patriot Act
In response to the events of September 11, 2001, the Uniting and Strengthening America by Providing Appropriate Tools Required to Intercept and Obstruct Terrorism Act of 2001 (the “USA PATRIOT Act”), was signed into law on October 26, 2001. The USA PATRIOT Act gives the federal government powers to address terrorist threats through domestic security measures, surveillance powers, information sharing, and anti-money laundering requirements. By way of amendments to the Bank Secrecy Act, the USA PATRIOT Act encourages information sharing among bank regulatory agencies and law enforcement bodies. Further, certain provisions of the USA PATRIOT Act impose affirmative obligations on a broad range of financial institutions, including banks, thrifts, brokers, dealers, credit unions, money transfer agents and parties registered under the Commodity Exchange Act.
Among other requirements, the USA PATRIOT Act imposes the following requirements with respect to financial institutions:
·
All financial institutions must establish anti-money laundering programs that include, at a minimum: (i) internal policies, procedures, and controls; (ii) specific designation of an anti-money laundering compliance officer; (iii) ongoing employee training programs; and (iv) an independent audit function to test the anti-money laundering program.
8
·
The Secretary of the Department of Treasury, in conjunction with other bank regulators, is authorized to issue regulations that provide for minimum standards with respect to customer identification at the time new accounts are opened.
·
Financial institutions that establish, maintain, administer, or manage private banking accounts or correspondence accounts in the United States for non-United States persons or their representatives (including foreign individuals visiting the United States) are required to establish appropriate, specific and, where necessary, enhanced due diligence policies, procedures, and controls designed to detect and report money laundering.
·
Financial institutions are prohibited from establishing, maintaining, administering or managing correspondent accounts for foreign shell banks (foreign banks that do not have a physical presence in any country), and will be subject to certain record keeping obligations with respect to correspondent accounts of foreign banks.
·
Bank regulators are directed to consider a holding company’s effectiveness in combating money laundering when ruling on Federal Reserve Act and Bank Merger Act applications.
The Federal banking agencies have begun to propose and implement regulations pursuant to the USA PATRIOT Act. These proposed and interim regulations would require financial institutions to adopt the policies and procedures contemplated by the USA PATRIOT Act.
Sarbanes-Oxley Act of 2002
On July 30, 2002, President Bush signed into law the Sarbanes-Oxley Act of 2002, or the SOA. The stated goals of the SOA are to increase corporate responsibility, to provide for enhanced penalties for accounting and auditing improprieties by publicly traded companies and to protect investors by improving the accuracy and reliability of corporate disclosures pursuant to the securities laws.
The SOA generally applies to all companies, both U.S. and non-U.S., that file or are required to file periodic reports with the Securities and Exchange Commission (the “SEC”) under the Securities Exchange Act of 1934, or Exchange Act.
The SOA includes specific disclosure requirements and corporate governance rules, requires the SEC and securities exchanges to adopt extensive additional disclosure, corporate governance and other related rules and mandates further studies of certain issues by the SEC. The SOA addresses, among other matters:
·
Audit committees for all reporting companies;
·
Certification of certain publicly filed documents by the chief executive officer and the chief financial officer;
·
The forfeiture of bonuses or other incentive-based compensation and profits from the sale of an issuer’s securities by directors and senior officers in the twelve month period following initial publication of financial statements that later require restatement;
·
A prohibition on insider trading during pension plan black out periods;
·
Disclosure of off-balance sheet transactions;
·
A prohibition on personal loans to directors and officers (subject to certain exceptions, including exceptions which permit under certain circumstances described below, loans by financial institutions to their directors and officers);
·
Expedited filing requirements for Form 4’s;
·
Disclosure of a code of ethics and filing a Form 8-K for a change in or waiver of such code;
·
“Real time” filing of periodic reports;
·
The formation of a public accounting oversight board;
·
Auditor independence; and
·
Various increased criminal penalties for violations of securities laws.
9
Proposed Legislation
From time to time proposals are made in the U.S. Congress and before various bank regulatory authorities, which would alter the policies of and place restrictions on different types of banking operations. It is impossible to predict the impact, if any, of potential legislative trends on the business of the Corporation and the Bank.
Loans to Related Parties
The Corporation’s authority to extend credit to its directors and executive officers, as well as to entities controlled by such persons, is currently governed by the requirements of the National Bank Act, the SOA and Regulation O of the FRB. Among other things, these provisions require that extensions of credit to insiders (i) be made on terms that are substantially the same as, and follow credit underwriting procedures that are not less stringent than, those prevailing for comparable transactions with unaffiliated persons and that do not involve more than the normal risk of repayment or present other unfavorable features and (ii) not exceed certain limitations on the amount of credit extended to such persons, individually and in the aggregate, which limits are based, in part, on the amount of the Corporation’s capital. In addition, the Corporation’s Board of Directors must approve extensions of credit in excess of certain limits. Under the SOA, the Corporation and its subsidiaries, other than Union Center National Bank, may not extend or arrange for any personal loans to its directors and executive officers.
C) Dividend Restrictions
Most of the revenue of the Corporation available for payment of dividends on its capital stock will result from amounts paid to the Parent Corporation by the Bank. There are a number of statutory and regulatory restrictions applicable to the payment of dividends by national banks and bank holding companies. First, the Bank must obtain the approval of the Comptroller of the Currency (the “Comptroller”) if the total dividends declared by the Bank in any year will exceed the total of the Bank’s net profits (as defined and interpreted by regulation) for that year and retained profits (as defined) for the preceding two years, less any required transfers to surplus. Second, the Bank cannot pay dividends unless, after the payment of such dividends, capital would be unimpaired and remaining surplus would equal 100% of capital. Third, the authority of Federal regulators to monitor the levels of capital maintained by the Corporation and the Bank (see Item 7 of this Annual Report on Form 10-K and the discussion of FDICIA above), as well as the authority of such regulators to prohibit unsafe or unsound practices, could limit the amount of dividends which the Parent Corporation and the Bank may pay. Regulatory pressures to reclassify and charge-off loans and to establish additional loan loss reserves also can have the effect of reducing current operating earnings and thus impacting an institution’s ability to pay dividends. Regulatory authorities have indicated that bank holding companies which are experiencing high levels of non-performing loans and loan charge-offs should review their dividend policies. Reference is also made to Note 18 of the Notes to the Corporation’s Consolidated Financial Statements and to Item 5 of this Annual Report on Form 10-K.
Lending Guidelines Real Estate Credit Management
Credit risks are an inherent part of the lending function. The Corporation has set in place specific policies and guidelines to limit credit risks. The following describes the Corporation’s credit management policy and describes certain risk elements in its earning assets portfolio.
Credit Management
The maintenance of comprehensive and effective credit policies is a paramount objective of the Corporation. Credit procedures are enforced at each individual branch office and are maintained at the senior administrative level as well as through internal control procedures.
Prior to extending credit, the Corporation’s credit policy generally requires a review of the borrower’s credit history, repayment capacity, collateral and purpose of each loan. Requests for most commercial and consumer loans are to be accompanied by financial statements and other relevant financial data for evaluation. After the granting of a loan or lending commitment, this financial data is typically updated and evaluated by the credit staff on a periodic basis for the purpose of identifying potential problems. Construction financing requires a periodic submission by the borrowers of sales/leasing status reports regarding their projects, as well as, in some cases, inspections of the project sites by independent engineering firms and/or independent consultants. Advances are normally made only upon the satisfactory completion of periodic phases of construction.
10
Certain lending authorities are granted to loan officers based upon each officer’s position and experience. However, large dollar loans and lending lines are reported to and are subject to the approval of the Bank’s loan committees and/or board of directors. Either the president or another senior officer of the Bank chairs loan committees.
The Corporation has established its own internal loan-to-value (“LTV”) limits for real estate loans. In general, except as described below, these internal limits are not permitted to exceed the following supervisory limits:
| | | |
Loan Category | | Loan-to-Value Limit | |
| | | | |
| Raw Land | | 65 | % |
| Land Development | | 75 | % |
| Commercial, Multifamily and Other Non-residential construction | | 80 | % |
| Construction: One to Four Family Residential | | 85 | % |
| Improved Property (excluding One to Four Family Residential) | | 85 | % |
| Owner-Occupied One to Four Family and Home Equity * | | 90 | % |
——————
*
For a permanent mortgage or home equity loan on owner occupied one to four family residential property with an LTV that exceeds 90 percent at origination, private mortgage insurance or readily marketable collateral is to be obtained. “Readily marketable collateral” means insured deposits, financial instruments and bullion in which the bank has a perfected interest. Financial instruments and bullion are to be salable under ordinary circumstances with reasonable promptness at a fair market value.
It may be appropriate in individual cases to originate loans with loan-to-value ratios in excess of the supervisory loan-to-value limits, based on support provided by other credit factors. The President of the Bank must approve such non-conforming loans. The Bank must identify all non-conforming loans and their aggregate amount must be reported at least quarterly to the Directors’ Loan Committee. Non-conforming loans should not exceed 100% of capital, or 30% with respect to non 1 to 4 family residential loans.
Collateral margin guidelines are based on cost, market or other appraised value to maintain a reasonable amount of collateral protection in relation to the inherent risk in the loan. This does not mitigate the fundamental analysis of cash flow from the conversion of assets in the normal course of business or from operations to repay the loan. It is merely designed to provide a cushion to minimize the risk of loss if the ultimate collection of the loan becomes dependent on the liquidation of security pledged.
The Corporation also seeks to minimize lending risk through loan diversification. The composition of the Corporation’s commercial loan portfolio reflects and is highly dependent upon the economy and industrial make-up of the region it serves. Effective loan diversification spreads risk to many different industries, thereby reducing the impact of downturns in any specific industry on overall loan profitability.
Credit quality is monitored through an internal review process, which includes a credit Risk Grading System that facilitates the early detection of problem loans. Under this grading system all commercial loans and commercial mortgage loans are graded in accordance with the risk characteristics inherent in each loan. Problem loans include “Watch List” loans, non-accrual loans, and loans which conform to the regulatory definitions of criticized and classified loans.
A Problem Asset Report is prepared monthly and is examined by the senior management of the Bank, the Corporation’s Loan and Discount Committee and Board of Directors. This review is designed to enable management to take such actions as are considered necessary to identify and remedy problems on a timely basis.
The Bank’s internal loan review process is complimented by an independent loan review conducted throughout the year, under the mandate and approval of the Corporation’s Board of Directors. In addition, regularly scheduled audits performed by the Bank’s internal audit function are designed to ensure the integrity of the credit and risk monitoring systems currently in place.
11
Risk Elements
Risk elements include non-performing loans, loans past due ninety days or more as to interest or principal payments but not placed on a non-accrual status, potential problem loans, other real estate owned, net, and other non-performing interest-earning assets.
An investment in Center Bancorp’s common stock involves risks. Stockholders should carefully consider the risks described below, together with all other information contained in this Annual Report on Form 10-K, before making any purchase or sale decisions regarding Center Bancorp’s common stock. If any of the following risks actually occur, our business, financial condition or operating results may be harmed. In that case, the trading price of Center Bancorp’s common stock may decline, and stockholders may lose part or all of their investment in Center Bancorp’s common stock.
We are subject to interest rate risk and variations in interest rates may negatively impact our financial performance.
We are unable to predict actual fluctuations of market interest rates with complete accuracy. Rate fluctuations are affected by many factors, including:
·
inflation;
·
recession;
·
a rise in unemployment;
·
tightening money supply; and
·
domestic and international disorder and instability in domestic and foreign financial markets.
Changes in the interest rate environment may reduce profits. We expect that we will continue to realize income from the differential or “spread” between the interest we earn on loans, securities and other interest-earning assets, and the interest we pay on deposits, borrowings and other interest-bearing liabilities. Net interest spreads are affected by the difference between the maturities and repricing characteristics of interest-earning assets and interest-bearing liabilities. At present, we are somewhat vulnerable to increases in interest rates because if rates increase significantly, our interest-earning assets may not reprice as rapidly as our interest-bearing liabilities. Changes in levels of market interest rates could materially and adversely affect our net interest spread, asset quality, levels of prepayments and cash flows as well as the market value of our securities portfolio and overall profitability.
Union Center National Bank’s ability to pay dividends is subject to regulatory limitations which, to the extent that our holding company requires such dividends in the future, may affect our holding company’s ability to honor its obligations and pay dividends.
As a holding company, we are a separate legal entity from Union Center National Bank and its subsidiaries and do not have significant operations of our own. We currently depend on Union Center National Bank’s cash and liquidity to pay our operating expenses and dividends to shareholders. We cannot assure you that in the future Union Center National Bank will have the capacity to pay the necessary dividends and that we will not require dividends from Union Center National Bank to satisfy our obligations. The availability of dividends from Union Center National Bank is limited by various statutes and regulations. It is possible, depending upon our and Union Center National Bank’s financial condition and other factors, that bank regulators could assert that payment of dividends or other payments by Union Center National Bank are an unsafe or unsound practice. In the event that Union Center National Bank is unable to pay dividends, we may not be able to service our obligations as they become due, or pay dividends on our common stock. Consequently, the inability to receive dividends from Union Center National Bank could adversely affect our financial condition, results of operations, cash flows and prospects.
Union Center National Bank’s allowance for loan losses may not be adequate to cover actual losses.
Like all financial institutions, Union Center National Bank maintains an allowance for loan losses to provide for loan defaults and non-performance. If Union Center National Bank’s allowance for loan losses is not adequate to cover actual loan losses, future provisions for loan losses could materially and adversely affect our operating results.
12
Union Center National Bank’s allowance for loan losses is determined by analyzing historical loan losses, current trends in delinquencies and charge-offs, plans for problem loan resolution, the opinions of its regulators, changes in the size and composition of the loan portfolio and industry information. Union Center National Bank also considers the impact of economic events, the outcome of which are uncertain. The amount of future losses is susceptible to changes in economic, operating and other conditions, including changes in interest rates, that may be beyond our control, and these losses may exceed current estimates. Federal regulatory agencies, as an integral part of their examination process, review Union Center National Bank’s loans and allowance for loan losses. While we believe that Union Center National Bank’s allowance for loan losses in relation to its current loan portfolio is adequate to cover current losses, we cannot assure you that Union Center National Bank will not need to increase its allowance for loan losses or that regulators will not require it to increase this allowance. Either of these occurrences could materially and adversely affect our earnings and profitability.
Union Center National Bank is subject to various lending and other economic risks that could adversely impact our results of operations and financial condition.
Changes in economic conditions, particularly an economic slowdown, could hurt Union Center National Bank’s business. Union Center National Bank’s business is directly affected by political and market conditions, broad trends in industry and finance, legislative and regulatory changes, changes in governmental monetary and fiscal policies and inflation, all of which are beyond our control. A deterioration in economic conditions, particularly within New Jersey, could result in the following consequences, any of which could hurt our business materially:
·
loan delinquencies may increase;
·
problem assets and foreclosures may increase;
·
demand for our products and services may decline; and
·
collateral for loans made by Union Center National Bank may decline in value, in turn reducing Union Center National Bank’s clients’ borrowing power.
A downturn in the real estate market could hurt our business. If there is a significant decline in real estate values in New Jersey, the collateral for Union Center National Bank’s loans will provide less security. As a result, Union Center National Bank’s ability to recover on defaulted loans by selling the underlying real estate would be diminished, and Union Center National Bank would be more likely to suffer losses on defaulted loans.
Union Center National Bank may suffer losses in its loan portfolio despite its underwriting practices.
Union Center National Bank seeks to mitigate the risks inherent in its loan portfolio by adhering to specific underwriting practices. Although we believe that Union Center National Bank’s underwriting criteria are appropriate for the various kinds of loans that it makes, Union Center National Bank may incur losses on loans that meet its underwriting criteria, and these losses may exceed the amounts set aside as reserves in its allowance for loan losses.
Union Center National Bank faces strong competition from other financial institutions, financial service companies and other organizations offering services similar to the services that Union Center National Bank provides.
Many competitors offer the same types of loans and banking services that Union Center National Bank offers or similar types of such services. These competitors include other national banks, savings associations, regional banks and other community banks. Union Center National Bank also faces competition from many other types of financial institutions, including finance companies, brokerage firms, insurance companies, credit unions, mortgage banks and other financial intermediaries. In this regard, Union Center National Bank’s competitors include other state and national banks and major financial companies whose greater resources may afford them a marketplace advantage by enabling them to maintain numerous banking locations, offer a broader suite of services and mount extensive promotional and advertising campaigns. Our inability to compete effectively would adversely affect our business.
If we do not successfully integrate any entities that we may acquire in the future, the combined company may be adversely affected.
The success of our enterprise after acquisitions that we may consummate in the future will depend, in part, on our ability to integrate the acquired entities into our existing franchise, including, in certain circumstances, our
13
ability to centralize certain administrative functions and eliminate unnecessary duplication of other functions. We may experience difficulties in accomplishing this integration or in effectively managing the combined company. Any actual cost savings or revenue enhancements that we may anticipate will depend on future expense levels and operating results, the timing of certain events and general industry, regulatory and business conditions. Many of these events will be beyond our control, and we cannot provide assurances that the integration of businesses that we may acquire will be successful.
Item 1B. Unresolved Staff Comments None
The Bank’s operations are located at nine sites in Union County, New Jersey, consisting of five sites in Union Township, one in Springfield Township, one in Berkeley Heights, one in Vauxhall and one in Summit, New Jersey. The Bank also has five sites in Morris County, New Jersey, consisting of one site in Madison, one site in Boonton/Mountain Lakes, and three sites in Morristown, New Jersey. The principal office is located at 2455 Morris Avenue, Union, New Jersey. The principal office is a two story building constructed in 1993. On October 9, 2004, the Bank opened a 19,555 square foot office facility on Springfield Road in Union New Jersey, which serves as the Bank’s Operations and Data Center. On October 1, 2004 the Corporation signed an agreement to purchase premises at 44 North Avenue Cranford, New Jersey to be used to construct a full service branch facility. Subsequently the Corporation exercised its option to cancel that contract on January 12, 2007. On October 28, 2005, the Corporation signed an agreement to lease a branch facility to be constructed at 209 Ridgedale Avenue, Florham Park, New Jersey.
Six of the locations are owned by the Bank and eight of the locations are (or in the case of Florham Park, will be) leased by the Bank. The lease of the Five Points Branch located at 356 Chestnut Street, Union, New Jersey expires November 30, 2007 and is subject to renewal at the Bank’s option. The lease of the Career Center Branch located in Union High School expires October 31, 2008. The lease of the Madison office located at 300 Main Street, Madison, New Jersey expires June 6, 2010 and is subject to renewal at the Bank’s option. The lease of the Millburn Mall Branch located at 2933 Vauxhall Road, Vauxhall, New Jersey expires January 31, 2013 and is subject to renewal at the Bank’s option. The lease of the Morristown office located at 86 South Street, Suite 2A, Morristown, New Jersey expires February 28, 2008 and is subject to renewal at the Bank’s option. The lease on the Red Oak banking Center located at 190 Park Avenue, Morristown, New Jersey expires October 28, 2015 and is subject to renewal at the Bank’s option. The lease of the Summit branch located at 392 Springfield Avenue, Summit, New Jersey expires March 31, 2009 and is subject to renewal at the Bank’s option. The lease for the Boonton/Mountain Lakes office located at Ely Place, Boonton, New Jersey expires 15 years from the commencement or date of occupancy, August 29, 2006, and is subject to renewal at the Bank’s option. In 2005 the Corporation signed an agreement to lease a Bank branch to be built at 209 Ridgedale Avenue, Florham Park, New Jersey. The Drive In/Walk Up located at 2022 Stowe Street, Union, New Jersey is adjacent to a part of the Center Office facility. The Bank has five off-site ATM locations. One at is located at Union Hospital, 100 Galloping Hill Road, Union, New Jersey, three are located at New Jersey Transit stations; and one is located at the Boys and Girls Club of Union, 1050 Jeanette Avenue, Union, New Jersey.
Item 3. Legal Proceedings There are no significant pending legal proceedings involving the Parent Corporation or the Bank other than those arising out of routine operations. Management does not anticipate that the ultimate liability, if any, arising out of such litigation will have a material effect on the financial condition or results of operations of the Parent Corporation and Bank on a consolidated basis. Such statement constitutes a forward-looking statement under the Private Securities Litigation Reform Act of 1995. Actual results could differ materially from this statement as a result of various factors, including the uncertainties arising in proving facts within the judicial process.
Item 4. Submission of Matters to a Vote of Security Holders The Corporation had no matter submitted to a vote of security holders during the fourth quarter of 2006.
14
Item 4A. Executive Officers of the Registrant The following table sets forth the name and age of each executive officer of the Parent Corporation, the period during which each such person has served as an officer of the Parent Corporation or the Bank and each such person’s business experience (including all positions with the Parent Corporation and the Bank) for the past five years:
| | | | |
Name and Age | | Officer Since | | Business Experience |
| | | | | |
John J. Davis
Age – 64 | | 1982 the Parent Corporation
1977 the Bank | | President & Chief Executive Officer
of the Parent Corporation and the Bank |
| | | | | |
Anthony C. Weagley
Age – 45 | | 1996 the Parent Corporation
1985 the Bank | | Vice President & Treasurer of the Parent Corporation
Senior Vice President & Cashier (1996–Present),
Vice President & Cashier (1991–1996) and
Assistant Vice President (1991–1997) of the Bank |
| | | | | |
Charles E. Nunn
Age – 54 | | 2004 the Parent Corporation
2004 the Bank | | Vice President of the Parent Corporation and
Senior Vice President of the Bank (2004–Present)
Senior Vice President of UnitedTrust Bank (1996–2004) |
| | | | | |
John F. McGowan
Age – 60 | | 1998 the Parent Corporation
1996 the Bank | | Vice President of the Parent Corporation
Senior Vice President (1998–Present) of the Bank |
| | | | | |
Lori A. Wunder
Age – 42 | | 1998 the Parent Corporation
1995 the Bank | | Vice President of the Parent Corporation
Senior Vice President (1998–Present)
Vice President (1997–1998)
Assistant Vice President (1996–1997) and
Assistant Cashier (1995–1996) of the Bank |
| | | | | |
Julie D’Aloia
Age – 45 | | 1999 the Parent Corporation
1998 the Bank | | Vice President & Secretary (2001–Present) and
Corporate Secretary (1998–2000) of the Parent Corporation
Senior Vice President & Secretary (2001– Present); Assistant-To-The-President of the Bank and
Corporate Secretary (1995–1998) of the Bank |
| | | | | |
Mark S. Cardone
Age – 43 | | 2001 the Parent Corporation
2001 the Bank | | Vice President of the Parent Corporation
Senior Vice President & Branch Administrator
Of the Bank (2001–Present)
Vice President of Fleet Bank (1996–2001) |
| | | | | |
Christopher M. Gorey
Age – 51 | | 2006 the Parent Corporation
2006 the Bank | | Vice President of the Parent Corporation
Senior Vice President and Senior Credit Officer
Of the Bank (2006–Present)
Vice President of the Bank (1999–2006) |
15
Item 5. Market for the Registrant’s Common Stock, Related Stockholder Matters and Issuer Purchases of Equity Securities Security Market Information
The common stock of the Parent Corporation is traded on the NASDAQ Global Select Market. The Corporation’s symbol is CNBC. As of December 31, 2006, the Corporation had 717 common registered stockholders of record. This does not include beneficial owners for whom CEDE & Company or others act as nominees. On December 31, 2006, the closing low market bid and asked price was $15.79–$15.82, respectively.
The following table sets forth the high and low bid price, and the dividends declared, on a share of the Corporation’s common stock for the periods presented. All amounts are adjusted for prior stock splits and stock dividends.
| | | | | | | | | | | | | | | | | | |
| | | Common Stock Price | | Common Dividends Declared |
2006 | | 2005 | 2006 | | 2005 |
High Bid | | Low Bid | | High Bid | | Low Bid |
| | | | | | | | | | | | | | | | | | | |
| Fourth Quarter | | $ | 16.22 | | $ | 15.60 | | $ | 11.85 | | $ | 10.70 | | $ | 0.0900 | | $ | 0.0900 |
| Third Quarter | | $ | 16.39 | | $ | 14.10 | | $ | 11.83 | | $ | 10.84 | | $ | 0.0900 | | $ | 0.0900 |
| Second Quarter | | $ | 14.25 | | $ | 11.70 | | $ | 12.00 | | $ | 10.95 | | $ | 0.0900 | | $ | 0.0900 |
| First Quarter | | $ | 12.17 | | $ | 10.85 | | $ | 12.04 | | $ | 10.89 | | $ | 0.0900 | | $ | 0.0857 |
| | | | | | | | | | | | | | | $ | 0.3600 | | $ | 0.3557 |
Share Repurchase Program
The Parent Corporation announced on March 27, 2006 that it’s Board of Directors approved an increase in its current share buyback program to 5% of the outstanding shares, enhancing its current authorization by 405,548 shares. The total buyback authorization was increased to 671,802 shares. Repurchases may be made from time to time as, in the opinion of management, market conditions warrant, in the open market or in privately negotiated transactions. Shares repurchased will be added to the corporate treasury and will be used for future stock dividends and other issuances. As of December 31, 2006, Center Bancorp had 13.2 million shares of common stock outstanding. As of December 31, 2006, the Parent Corporation had purchased 326,908 common shares at an average cost per share of $11.95 under the above-mentioned stock buyback program. The repurchased shares were recorded as Treasury Stock, which resulted in a decrease in stockholder’s equity.
Information concerning the stock repurchases for the twelve months ended December 31, 2006 is set forth below.
| | | | | | | | | |
Period | | (a)
Total Number of Shares (or Units) Purchased | | (b)
Average Price Paid per Share (or Unit) | | (c)
Total Number of Shares (or Units) Purchased as Part of Publicly Announced Plans or Programs | | (d)
Maximum Number (or Approximate Dollar Value) of Shares (or Units) That May Yet Be Purchased Under the Plans or Programs |
| | | | | | | | | |
| Balance December 31, 2005 | | 57,330 | | $ | 9.38 | | 57,330 | | 614,472 |
| January 1, through March 31, 2006 | | — | | | — | | — | | 614,472 |
| April 1, through June 30, 2006 | | 208,304 | | $ | 12.36 | | 265,634 | | 406,168 |
| July 1, through September 30, 2006 | | 61,274 | | $ | 12.95 | | 326,908 | | 344,894 |
| October 1, December 1 through December 31, 2006 | | 0 | | | — | | — | | 344,894 |
| Balance at December 31, 2006 | | 326,908 | | $ | 11.95 | | 326,908 | | 344,894 |
Stock Compensation Plan Information
For information related to stock based compensation and other benefit plans see Note 11 of the Notes to Consolidated Financial Statements. The following table gives information about the Parent Corporation’s Common Stock that may be issued upon the exercise of options, warrants and rights under the Parent Corporation’s 1999 Incentive Plan, 1993 Employee Stock Option Plan, 1993 Outside Director Stock Option Plan and 2003 Non-Employee Director Stock Option Plan as of December 31, 2006. These plans were the Corporation’s only equity compensation plans in existence as of December 31, 2006.
16
| | | | | | |
Plan Category | | Number of
Securities to be
Issued Upon
Exercise of
Outstanding
Options,
Warrants and
Rights
(a) | | Weighted-Average
Exercise Price of
Outstanding
Options, Warrants
and Rights
(b) | | Number of
Securities Remaining
Available for
Future Issuance
Under Equity
Compensation
Plans (Excluding
Securities Reflected
in Column (a))
(c) |
| | | | | | | |
| Equity Compensation Plans Approved by Shareholders | | 250,978 | | $6.37 – $15.88 | | 672,461 |
| Equity Compensation Plans Not Approved by Shareholders | | — | | — | | — |
| Total | | 250,978 | | $6.37 – $15.88 | | 672,461 |
Dividends
Federal laws and regulations contain restrictions on the ability of the Parent Corporation and Union Center National Bank to pay dividends. For information regarding restrictions on dividends, see Part I, Item 1, “Business—Dividend Limitations” and Part II, Item 8, “Financial Statements and Supplementary Data—Dividend Restrictions, Note 18 of the Notes to Consolidated Financial Statements.” In addition, under the terms of the trust preferred securities issued by Center Bancorp, Inc, Statutory Trust II, the Parent Corporation can not pay dividends on its common stock if the Corporation defers payments on the junior subordinated debentures which provide the cash flow for the payments on the trust preferred securities.
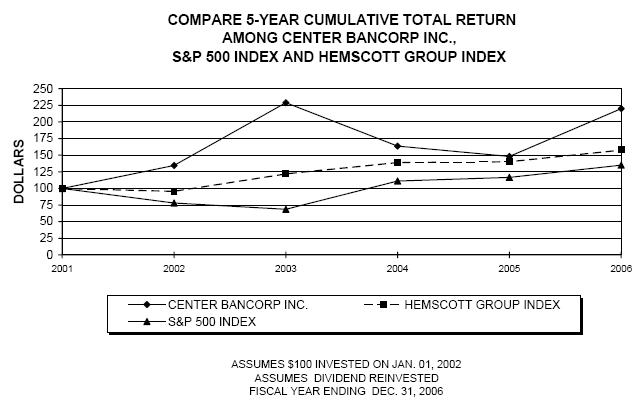
Stockholders Return Comparison
Set forth below is a line graph presentation comparing the cumulative stockholder return on the Corporation’s Common Stock, on a dividend reinvested basis, against the cumulative total returns of the Standard & Poor’s 500 Stock Index and the Hemscott, Inc. General Industry Group Index for the period from January 1, 2002 through December 31, 2006.
COMPARISON OF CUMULATIVE TOTAL RETURN OF ONE OR MORE
COMPANIES, PEER GROUPS, INDUSTRY INDEXES AND/OR BROAD MARKETS
| | | | | | | | | | | | |
| | | FISCAL YEAR ENDING |
COMPANY/INDEX/MARKET | | 12/31/2001 | | 12/31/2002 | | 12/31/2003 | | 12/31/2004 | | 12/30/2005 | | 12/29/2006 |
| | | | | | | | | | | | | |
| Center Bancorp Inc | | 100.00 | | 134.60 | | 228.89 | | 163.69 | | 148.20 | | 219.90 |
| Regional-Mid-Atlantc Bnks | | 100.00 | | 95.63 | | 121.89 | | 139.01 | | 140.08 | | 157.76 |
| S&P Composite | | 100.00 | | 77.90 | | 100.25 | | 111.15 | | 116.61 | | 135.03 |
17
Item 6. Selected Financial Data SUMMARY OF SELECTED STATISTICAL INFORMATION AND FINANCIAL DATA
| | | | | | | | | | | | | | | | |
| | | Years Ended December 31, | |
| | | 2006 | | 2005 | | 2004 | | 2003 | | 2002 | |
| | | (Dollars in Thousands, Except per Share Data) | |
Summary of Income | | | | | | | | | | | | | | | | |
| Interest income(1) | | $ | 53,325 | | $ | 50,503 | | $ | 40,049 | | $ | 35,919 | | $ | 40,469 | |
| Interest expense | | | 28,974 | | | 23,296 | | | 13,968 | | | 12,726 | | | 14,522 | |
| Net interest income(1) | | | 24,351 | | | 27,207 | | | 26,081 | | | 23,193 | | | 25,947 | |
| Provision for loan losses | | | 57 | | | — | | | 752 | | | 522 | | | 360 | |
Net interest income after provision
for loan losses | | | 24,294 | | | 27,207 | | | 25,329 | | | 22,671 | | | 25,587 | |
| Other income | | | 633 | | | 3,836 | | | 3,388 | | | 3,247 | | | 3,335 | |
| Other expense | | | 24,358 | | | 22,213 | | | 19,471 | | | 18,336 | | | 17,198 | |
| Income before income tax expense | | | 569 | | | 8,830 | | | 9,246 | | | 7,582 | | | 11,724 | |
| Income tax (benefit) expense | | | (3,329 | ) | | 1,184 | | | 1,624 | | | 1,163 | | | 3,721 | |
| Net income | | $ | 3,898 | | $ | 7,646 | | $ | 7,622 | | $ | 6,419 | | $ | 8,003 | |
Statement of Financial Condition Data | | | | | | | | | | | | | | | | |
| Investments | | $ | 381,733 | | $ | 517,730 | | $ | 571,127 | | $ | 512,875 | | $ | 533,350 | |
| Total loans | | | 550,414 | | | 505,826 | | | 377,304 | | | 349,525 | | | 229,051 | |
| Goodwill and other intangibles | | | 17,312 | | | 17,437 | | | 2,091 | | | 2,091 | | | 2,091 | |
| Total assets | | | 1,051,384 | | | 1,114,829 | | | 1,009,015 | | | 922,289 | | | 823,436 | |
| Deposits | | | 726,771 | | | 700,601 | | | 702,272 | | | 632,921 | | | 616,351 | |
| Borrowings | | | 206,434 | | | 293,963 | | | 216,357 | | | 214,724 | | | 140,431 | |
| Stockholders’ equity | | $ | 97,613 | | $ | 99,489 | | $ | 68,643 | | $ | 54,180 | | $ | 51,054 | |
Dividends | | | | | | | | | | | | | | | | |
| Cash dividends | | $ | 4,808 | | $ | 4,518 | | $ | 3,238 | | $ | 3,014 | | $ | 2,747 | |
| Dividend payout ratio | | | 123.35 | % | | 59.09 | % | | 42.48 | % | | 46.95 | % | | 34.32 | % |
Cash Dividends Per Share(2) | | | | | | | | | | | | | | | | |
| Cash dividends | | $ | 0.36 | | $ | 0.36 | | $ | 0.34 | | $ | 0.32 | | $ | 0.31 | |
Earnings Per Share(2) | | | | | | | | | | | | | | | | |
| Basic | | $ | 0.29 | | $ | 0.63 | | $ | 0.79 | | $ | 0.69 | | $ | 0.86 | |
| Diluted | | $ | 0.29 | | $ | 0.63 | | $ | 0.78 | | $ | 0.68 | | $ | 0.86 | |
Weighted Average Common Shares Outstanding | | | | | | | | | | | | | | | | |
| Basic | | | 13,294,937 | | | 12,074,870 | | | 9,679,880 | | | 9,344,122 | | | 9,253,814 | |
| Diluted | | | 13,371,750 | | | 12,119,291 | | | 9,737,706 | | | 9,441,972 | | | 9,328,213 | |
Operating Ratios | | | | | | | | | | | | | | | | |
| Return on average assets | | | 0.37 | % | | 0.69 | % | | 0.81 | % | | 0.74 | % | | 1.07 | % |
| Average stockholders’ equity to average assets | | | 9.21 | % | | 7.79 | % | | 6.14 | % | | 5.96 | % | | 6.46 | % |
| Return on average equity | | | 4.04 | % | | 8.91 | % | | 13.17 | % | | 12.35 | % | | 16.58 | % |
| Return on tangible average stockholders’ equity(3) | | | 4.93 | % | | 10.34 | % | | 13.67 | % | | 12.87 | % | | 17.33 | % |
Book Value | | | | | | | | | | | | | | | | |
| Book value per common share(2) | | $ | 7.37 | | $ | 7.41 | | $ | 6.59 | | $ | 5.77 | | $ | 5.50 | |
| Tangible book value per common share(3) | | $ | 6.06 | | $ | 6.11 | | $ | 6.39 | | $ | 5.54 | | $ | 5.27 | |
Non-Financial Information | | | | | | | | | | | | | | | | |
| Common stockholders of record | | | 717 | | | 767 | | | 529 | | | 527 | | | 542 | |
| Staff-Full time equivalent | | | 214 | | | 202 | | | 192 | | | 191 | | | 182 | |
18
——————
Notes to Selected Financial Data
(1)
In this report a number of amounts related to net interest income and net interest margin are presented on a tax equivalent basis using a 34 percent federal tax rate. The Corporation believes that this presentation provides comparability of net interest income and net interest margin arising from both taxable and tax-exempt sources and is consistent with industry practice and SEC rules.
(2)
All per common share amounts reflect all prior stock splits and dividends.
(3)
Tangible book value, which is a non-GAAP measure, is computed by dividing stockholders’ equity less goodwill and other intangible assets by common shares outstanding, as follows:
| | | | | | | | | | | | | | | |
| | | 2006 | | 2005 | | 2004 | | 2003 | | 2002 |
| | | (Dollars in Thousands, Except per Share Data) |
| Common shares outstanding | | | 13,248,406 | | | 13,431,628 | | | 10,418,474 | | | 9,391,664 | | | 9,283,833 |
| Stockholders’ equity | | $ | 97,613 | | $ | 99,489 | | $ | 68,643 | | $ | 54,180 | | $ | 51,054 |
| Less: Goodwill and other intangible assets | | | 17,312 | | | 17,437 | | | 2,091 | | | 2,091 | | | 2,091 |
| Tangible Stockholders’ Equity | | $ | 80,301 | | $ | 82,052 | | $ | 66,552 | | $ | 52,089 | | $ | 48,963 |
| Tangible Book Value | | $ | 6.06 | | $ | 6.11 | | $ | 6.39 | | $ | 5.54 | | $ | 5.27 |
| All per common share amounts reflect all prior stock splits and dividends. | | | | | | | | | | | | | | | |
Return on average tangible stockholders’ equity, which is a non-GAAP measure, is computed by dividing net income by average stockholders’ equity less average goodwill and average other intangible assets, as follows:
| | | | | | | | | | | | | | | | | |
| | | 2006 | | 2005 | | 2004 | | 2003 | | 2002 | |
| | | (Dollars in Thousands, Except per Share Data) | |
| Net Income | | $ | 3,898 | | $ | 7,646 | | $ | 7,622 | | $ | 6,419 | | $ | 8,003 | |
| Average Stockholders’ equity | | $ | 96,505 | | $ | 85,772 | | $ | 57,854 | | $ | 51,959 | | $ | 48,258 | |
| Less: Average Goodwill and other intangible assets | | | 17,378 | | | 11,814 | | | 2,091 | | | 2,091 | | | 2,091 | |
| Average Tangible Stockholders’ Equity | | $ | 79,127 | | $ | 73,958 | | $ | 55,763 | | $ | 49,868 | | $ | 46,167 | |
| Return on Average Tangible stockholders’ Equity | | | 4.93 | % | | 10.34 | % | | 13.67 | % | | 12.87 | % | | 17.33 | | % |
Item 7. Management’s Discussion and Analysis (“MD&A”) of Financial Condition and Results of Operations The purpose of this analysis is to provide the reader with information relevant to understanding and assessing The Corporation’s results of operations for each of the past three years and financial condition for each of the past two years. In order to fully appreciate this analysis the reader is encouraged to review the consolidated financial statements and accompanying notes thereto appearing under Item 8 of this report, and statistical data presented in this document.
Cautionary Statement Concerning Forward-Looking Statements
See Item 1 of this Annual Report on Form 10-K for information regarding forward looking statements.
Critical Accounting Policies and Estimates
The accounting and reporting policies followed by Center Bancorp, Inc. and its subsidiaries (the “Corporation”) conform, in all material respects, to U.S. generally accepted accounting principles. In preparing the consolidated financial statements, management has made estimates, judgments and assumptions that affect the reported amounts of assets and liabilities as of the dates of the consolidated statements of condition and results of operations for the periods indicated. Actual results could differ significantly from those estimates.
The Corporation’s accounting policies are fundamental to understanding Management’s Discussion and Analysis (“MD&A”) of financial condition and results of operations. The most significant accounting policies followed by the Corporation are presented in Note 1 of the Notes to Consolidated Financial Statements. The Corporation has identified its policies on the allowance for loan losses, income tax liabilities and goodwill and other identifiable intangible assets to be critical because management must make subjective and/or complex judgments about matters that are inherently uncertain and could be most subject to revision as new information becomes
19
available. Additional information on these policies can be found in Note 1 of the Notes to Consolidated Financial Statements.
The allowance for loan losses represents management’s estimate of probable credit losses inherent in the loan portfolio. Determining the amount of the allowance for loan losses is considered a critical accounting estimate because it requires significant judgment and the use of estimates related to the amount and timing of expected future cash flows on impaired loans, estimated losses on pools of homogeneous loans based on historical loss experience, and consideration of current economic trends and conditions, all of which may be susceptible to significant change. The loan portfolio also represents the largest asset type on the Consolidated Statements of Condition.
The evaluation of the adequacy of the allowance for loan losses includes, among other factors, an analysis of historical loss rates by loan category applied to current loan totals. However, actual loan losses may be higher or lower than historical trends, which vary. Actual losses on specified problem loans, which also are provided for in the evaluation, may vary from estimated loss percentages, which are established based upon a limited number of potential loss classifications. The allowance for loan losses is established through a provision for loan losses charged to expense. Management believes that the current allowance for loan losses will be adequate to absorb loan losses on existing loans that may become uncollectible based on the evaluation of known and inherent risks in the loan portfolio. The evaluation takes into consideration such factors as changes in the nature and size of the portfolio, overall portfolio quality, and specific problem loans and current economic conditions which may affect the borrowers’ ability to pay. The evaluation also details historical losses by loan category and the resulting loan loss rates which are projected for current loan total amounts. Loss estimates for specified problem loans are also detailed. All of the factors considered in the analysis of the adequacy of the allowance for loan losses may be subject to change. To the extent actual outcomes differ from management estimates, additional provisions for loan losses may be required that could materially adversely impact earnings in future periods. Additional information can be found in Note 1 of the Notes to Consolidated Financial Statements.
The objectives of accounting for income taxes are to recognize the amount of taxes payable or refundable for the current year and deferred tax liabilities and assets for the future tax consequences of events that have been recognized in an entity’s financial statements or tax returns. Judgment is required in assessing the future tax consequences of events that have been recognized in the Corporation’s consolidated financial statements or tax returns. Fluctuations in the actual outcome of these future tax consequences could impact the Corporation’s consolidated financial condition or results of operations. Notes 1 and 12 of the Notes to Consolidated Financial Statements include additional discussion on the accounting for income taxes.
The Corporation accounts for goodwill and other identifiable intangible assets in accordance with SFAS No. 142, “Goodwill and intangible assets.” SFAS No. 142 includes requirements to test goodwill and indefinite lived intangible assets for impairment rather than amortize them. The Corporation has tested the goodwill and at December 31, 2006, there was no goodwill impairment.
Introduction
The following introduction to Management’s Discussion and Analysis highlights the principal factors that contributed to the Corporation’s earnings performance in 2006.
The year of 2006 was an extremely challenging one for the banking industry and for the Corporation. Interest rates increased as a result of actions taken by the Federal Reserve, which raised short-term interest rates 100 basis points during 2006. Short term interest rates rose more than longer term ones and market driven longer term interest rates remained mostly unchanged at relatively lower levels resulting in a flat yield curve and at times inverted yield curve. This resulted in a compression of the Corporation’s net interest margin which is the primary source of income. The Corporation has taken action throughout the year to stem the decline in margin and to reduce further exposure to the flat yield curve. Should the yield curve remain flat or inverted, we expect this net interest margin compression to continue into 2007 and likely to hinder the growth of net interest income and net income. Further, as a result of the current adverse interest rate environment, the Corporation does not expect its earning assets to grow substantially in 2007. We intend to continue to use a substantial portion of the proceeds of maturing investments to fund new loan growth or repay borrowings.
As a result of the interest rate compression, the Corporation’s net income in 2006 declined to $3.9 million or $0.29 per fully diluted common share, compared with net income of $7.6 million or $0.63 per fully diluted common share in 2005. A substantial portion of our earnings in 2006 arose from tax benefits.
20
Earnings for 2006, in addition to the interest rate compression, were impacted by decreases in non-interest income, primarily from lower service charge fees and other fee income, and increased operating overhead offset in part by a reduced effective tax rate. Other expense for the twelve-months ended December 31, 2006 totaled $24.4 million, an increase of $2.15 million, or 9.66%, over the comparable period in 2005. Higher operating expenses during the twelve-month period resulted primarily from an increase in other general and administrative expenses as well as certain specific customer-related expenses. Other general and administrative expense increased $1.7 million, reflecting increases in professional consulting, compliance, audit fees, insurance and stationary and printing expense and certain increased expenses amounting to $294,000 related to customer third party services. Amortization of core deposit intangibles accounted for $120,000 of other expense in the current twelve month period and $75,000 in the comparable period in 2005. The decreased tax rate resulted from income tax reductions, tax planning benefits and a business entity restructuring undertaken by the Corporation in 2006 with its subsidiary companies.
Total non-interest revenue decreased as a percentage of total revenue in 2006 largely due to net losses on securities sold for the period. This revenue, exclusive of gains on securities sold (which decreased $2.9 million during 2006), decreased $288,000 or 8.26 percent in 2006 as compared with 2005. The change from the comparable period in 2005 was driven primarily by the $163,000 decline in service charges and a $177,000 decline in other income. The decline in other income was attributable to a decline in letter of credit income and loan fees.
Total assets at December 31, 2006, were $1.051 billion, a decrease of 5.69 percent from assets of $1.1 billion at December 31, 2005. The reduction in assets, in part, reflects the balance sheet restructuring announced in the first quarter of 2006. The Corporation utilized a portion of the cash flows generated from the sales of securities to fund increased loans and to reduce short-term borrowings.
Loan growth continued in 2006 and the portfolio grew year over year by approximately $68.0 million on average or a 14.96 percent increase from 2005. A strong commercial real estate and residential housing market prevailed throughout the year in our market in New Jersey, despite the uncertain economic climate at both the state and national levels. We are encouraged by the strength of loan demand and positive momentum gained this past year in growing that segment of earning-assets.
Asset quality continues to remain high and credit culture conservative. During 2006, the Corporation did not experience any substantial problems within its loan portfolio. Despite the continued high quality of the Corporation’s assets, the Corporation made a provision of $56,525 to the allowance for loan losses. At December 31, 2006, the total allowance for loan and lease losses amounted to 0.90 percent of total loans.
Deposit growth was mixed in 2006 reflective of the changes in short-term interest rates. The growth in average deposits included a shift to more costly interest-bearing accounts, principally money market deposits. At December 31, 2006, total deposits for the Corporation were $726.8 million. Non-interest-bearing core deposits, a low-cost source of funding, continue to be a key-funding source. At December 31, 2006, this source of funding amounted to $136.4 million or 14.5 percent of total funding sources and 18.8 percent of total deposits.
More volatile rate sensitive deposits, principally certificates of deposits $100,000 and greater, decreased to 11.5 percent of total deposits at December 31, 2006 from 22.0 percent one year earlier. The geographic expansion of the Corporation into desirable markets (such as Morristown and Boonton in Morris County, New Jersey) over the past several years has contributed to the growth in market share, as well as increased loan demand and growth in deposits. Additional expansion plans include a new branch location in Florham Park, New Jersey. This expansion is expected to enhance the Corporation’s ability to continue to grow and expand its product lines and to further build the value of the franchise.
Total stockholders’ equity decreased 1.9 percent over 2005 to $97.6 million, and represented 9.28 percent of total assets at year-end. Book value per common share (total stockholders’ equity divided by the number of shares outstanding) decreased to $7.37 as compared with $7.41 a year ago primarily as a result of the issuance of stock for the acquisition of Red Oak Bank and the private placement of common stock in 2005 coupled with the repurchase of shares by the Corporation during 2006, and change in other comprehensive income. Tangible book value (which excludes goodwill and other intangibles from stockholders’ equity) decreased to $6.06 from $6.11 a year ago; see item 6 of this Annual Report on Form 10-K for a reconciliation of tangible book value (which is a non-GAAP financial measure) to book value. Return on average stockholders’ equity for the year ended December 31, 2006 was 4.04 percent compared to 8.91 percent for 2005. This decrease in return was attributable to in part additional shares issued in June 2005 and May 2005. The Tier I Leverage capital ratio decreased to 8.64 percent of total assets at December 31, 2006, as compared with 9.07 percent at December 31, 2005.
21
A key element of the Corporation’s performance is its strong capital base, which includes $5.2 million in subordinated debentures as of December 31, 2006 compared to $15.5 million at December 31, 2005. The Statutory Trust I subsidiary redeemed $10.3 million of floating rate capital trust pass through securities due December 18, 2031 on December 18, 2006. The most recent issuance of $5.0 million in floating rate MMCapS(SM) Securities occurred on December 19, 2003. The Corporation has used the net proceeds of this issuance for working capital and other general corporate purposes, including capital contributions to the Corporation’s banking subsidiary to support its growth strategies. These securities presently are included as a component of Tier I capital for regulatory capital purposes. In accordance with FASB Interpretation No. 46, these securities are classified as subordinated debentures on the Consolidated Statements of Condition.
The Corporation’s risk-based capital ratios at December 31, 2006 were 13.18 percent for Tier I capital and 13.92 percent for total risk-based capital. These ratios substantially exceed the regulatory minimum of 4 percent for Tier I risk-based capital and 8 percent for total risk-based capital under regulatory guidelines. Total Tier I capital decreased to approximately $88.0 million at December 31, 2006 from $102.2 million at December 31, 2005. The decrease in Tier 1 capital primarily reflects the Corporation’s redemption of $10.3 million in trust preferred securities by its subsidiary Center Bancorp, Inc. Statutory Trust I on December 18, 2006.
For the year ended December 31, 2006, the Corporation’s return on average stockholders’ equity (“ROE”) was 4.04 percent and its return on average assets (“ROA”) was 0.37 percent. ROA includes intangible assets arising from the Red Oak Bank acquisition during 2005. The Corporation’s return on average tangible stockholders’ equity (“ROATE”) was 4.93 percent for 2006. The comparable ratios for the year ended December 31, 2005, were ROE of 8.91 percent, ROA of 0.69 percent, and ROATE of 10.34 percent. See the discussion and reconciliation of ROATE, which is a non-GAAP measure, under Item 6 of this Annual Report on Form 10-K.
The Corporation announced an increase in its common stock buyback program on March 28, 2006, under which the Parent Corporation was authorized to purchase up to 671,802 shares of Center Bancorp’s outstanding common stock. Under the program, repurchases may be made from time to time as, in the opinion of management, market conditions warrant, in the open market or in privately negotiated transactions. As of December 31, 2006 the Corporation has repurchased 326,908 shares under the program at an average cost of $11.95 per share.
The following sections discuss the Corporation’s Results of Operations, Asset and Liability Management, Liquidity and Capital Resource.
Results of Operations
Net income for the year ended December 31, 2006 was $3,898,000 as compared to $7,646,000 earned in 2005 and $7,622,000 earned in 2004. Net income decreased by 49.02 percent, while basic and fully diluted earnings per share decreased by 53.97 percent, for the year ended December 31, 2006. The decline in the Corporation’s earnings per share in 2006 as compared to 2005 resulted from the earnings results depicted above and additional shares outstanding due to the acquisition of Red Oak Bank and issuance of common shares in a private placement on June 30, 2005. This compared to an increase of 0.31 percent in net income and decreases in basic and diluted earnings per share of 20.25 percent and 19.23 percent, respectively, for the year ended December 31, 2005, as compared to the year ended December 31, 2004. All common share and per share information for all periods presented have been retroactively restated for common stock splits and common stock dividends distributed to common stockholders during the periods presented.
The return on average assets was 0.37 percent for the year ended December 31, 2006, as compared with 0.69 percent for 2005 and 0.81 percent for 2004, while the return on tangible average stockholders’ equity was 4.93 percent, 10.34 percent and 13.67 percent, respectively. See item 6 of this Annual Report on Form 10-K for a reconciliation to return on average stockholders’ equity.
Earnings performance for the year ended December 31, 2006, reflected continued adherence to the Corporation’s strategic initiatives. These initiatives are designed to sharpen our business focus and strengthen our financial performance, emphasizing the importance of core relationship business and a conservative credit culture. Earnings for the year reflect an increase in interest income due, in part, to higher interest rates in 2006 compared to 2005, higher yielding interest-earning assets and a reduction in income tax expense. This was substantially offset by an increase in interest expense associated with the rise in interest-bearing liabilities, a reduction of the investment portfolio, a decrease in non-interest revenue, an increase in non-interest expense and the provision for loan losses.
22
Net Interest Income
Historically, the most significant component of the Corporation’s earnings has been net interest income, which is the difference between the interest earned in the portfolio of earning-assets (principally loans and investments) and the interest paid for deposits and borrowings, which support these assets. There were several factors that affected net interest income during 2006, including the volume, pricing, mix and maturity of earning assets and interest-bearing liabilities and interest rate fluctuations.
The following table presents the components of net interest income (on a tax-equivalent basis) for the past three years.
| | | | | | | | | | | | | | | | | | | | | | | | | | | | |
| | | 2006 | | 2005 | | 2004 | |
| | | Amount | | Increase (Decrease) From Prior Year | | Percent Change | | Amount | | Increase (Decrease) From Prior Year | | Percent
Change | | Amount | | Increase (Decrease) From Prior Year | | Percent Change | |
| | | (Dollars in Thousands) | |
| Interest income: | | | | | | | | | | | | | | | | | | | |
| Investments | | $ | 22,977 | | $ | (4,713 | ) | | (17.02 | ) | $ | 27,690 | | $ | 4,206 | | | 17.91 | | $ | 23,484 | | $ | 1,260 | | | 5.67 | |
| Loans, including fees | | | 31,999 | | | 6,670 | | | 26.33 | | | 25,329 | | | 6,800 | | | 36.70 | | | 18,529 | | | 3,398 | | | 22.46 | |
| Federal funds sold and securities purchased under agreement to resell | | | 547 | | | 518 | | | 100.00 | | | 29 | | | 29 | | | 100.00 | | | — | | | — | | | 0.00 | |
| Total interest income | | | 55,523 | | | 2,475 | | | 4.67 | | | 53,048 | | | 11,035 | | | 26.27 | | | 42,013 | | | 4,658 | | | 12.47 | |
| Interest expense: | | | | | | | | | | | | | | | | | | | | | | | | | | | | |
| Certificates $100 or more | | | 4,930 | | | 1,102 | | | 28.79 | | | 3,828 | | | 2,550 | | | 199.53 | | | 1,278 | | | 817 | | | 177.22 | |
| Deposits | | | 13,075 | | | 5,304 | | | 68.25 | | | 7,771 | | | 1,634 | | | 26.63 | | | 6,137 | | | (575 | ) | | (8.57 | ) |
| Borrowings | | | 10,969 | | | (728 | ) | | (6.22 | ) | | 11,697 | | | 5,144 | | | 78.50 | | | 6,553 | | | 1,000 | | | 18.01 | |
| Total interest expense | | | 28,974 | | | 5,678 | | | 24.37 | | | 23,296 | | | 9,328 | | | 66.78 | | | 13,968 | | | 1,242 | | | 9.76 | |
| Net interest income on a fully tax-equivalent basis | | | 26,549 | | | (3,203 | ) | | (10.77 | ) | | 29,752 | | | 1,707 | | | 6.09 | | | 28,045 | | | 3,416 | | | 13.87 | |
| Tax-equivalent adjustment | | | (2,198 | ) | | 347 | | | (13.63 | ) | | (2,545 | ) | | (581 | ) | | 29.58 | | | (1,964 | ) | | (528 | ) | | 36.77 | |
| Net interest income | | $ | 24,351 | | $ | (2,856 | ) | | (10.50 | ) | $ | 27,207 | | $ | 1,126 | | | 4.32 | | $ | 26,081 | | $ | 2,888 | | | 12.45 | |
Note: The tax-equivalent adjustment was computed based on an assumed statutory Federal income tax rate of 34 percent. Adjustments were made for interest earned on tax advantaged instruments.
Net interest income is directly affected by changes in the volume and mix of interest-earning assets and interest-bearing liabilities, which support those assets, as well as changes in the rates earned and paid. Net interest income is presented in this financial review on a tax equivalent basis by adjusting tax-exempt income (primarily interest earned on various obligations of state and political subdivisions) by the amount of income tax which would have been paid had the assets been invested in taxable issues, and then in accordance with the Corporation’s consolidated financial statements. Accordingly, the net interest income data presented in this financial review differ from the Corporation’s net interest income components of the Consolidated Financial Statements presented elsewhere in this report.
Net interest income on a fully tax-equivalent basis, for the year ended December 31, 2006 decreased $3.2 million or 10.77 percent, from $29.8 million for 2005. The Corporation’s net interest margin decreased 14 basis points to 2.75 percent from 2.89 percent. From 2004 to 2005, net interest income on a tax equivalent basis increased by $1.7 million, although the net interest margin decreased by 30 basis points
The change in net interest income from 2005-2006 was primarily attributable to the change that occurred in the interest rate yield curve that impacted financial institutions during 2006. During the twelve months ended December 31, 2006, a 91 basis point increase in the average interest rates paid on total interest-bearing liabilities was offset only in part by a 59 basis point increase in the average yield on interest-earning assets from 5.16 percent in 2005 to 5.75 percent for 2006. The change in average yield on both interest-earning assets and interest-bearing liabilities reflected the increase in interest rates that occurred in 2006 as opposed to the lower interest rate environment in 2005 coupled with the impact of the sustained flatness of the yield curve.
For the year ended December 31, 2006, interest-earning assets decreased by $62.2 million on average to $965.9 million, as compared with the year ended December 31, 2005. The 2006 change in average interest-earning asset volume was primarily due to decreased volumes of investment securities which is consistent with the balance sheet strategies implemented by management in the first quarter of 2006 and increased loans. Increased average loan
23
volume in 2006 was funded in part with more expensive interest-bearing liabilities, principally higher rate money market and time deposit products such as time certificates of deposit.
For the year ended December 31, 2005, interest-earning assets increased by $148.1 million on average to $1.0 billion, as compared with an $880.0 million average volume for the year ended December 31, 2004. The 2005 change in average interest-earning asset volume was primarily due to increased volumes of loans and investment securities which were funded in part with more expensive interest-bearing liabilities, principally higher rate time deposit products such as Certificates of Deposit, coupled with increased volumes of other borrowings.
The factors underlying the year-to-year changes in net interest income are reflected in the tables presented below and on page 24, each of which have been presented on a tax-equivalent basis (assuming a 34 percent tax rate). The table on page 26 (Average Statements of Condition with Interest and Average Rates) shows the Corporation’s consolidated average balance of assets, liabilities and stockholders’ equity, the amount of income produced from interest-earning assets and the amount of expense incurred from interest-bearing liabilities, and net interest income as a percentage of average interest-earning assets.
Net Interest Margin
The following table quantifies the impact on net interest income (on a tax-equivalent basis) resulting from changes in average balances and average rates over the past three years. Any change in interest income or expense attributable to both changes in volume and changes in rate has been allocated in proportion to the relationship of the absolute dollar amount of change in each category.
Analysis of Variance in Net Interest Income Due to Volume and Rates
| | | | | | | | | | | | | | | | | | | |
| | | 2006/2005 Increase (Decrease) Due to Change in: | | 2005/2004 Increase (Decrease) Due to Change in: | |
| | | Average
Volume | | Average
Rate | | Net
Change | | Average
Volume | | Average
Rate | | Net
Change | |
| | | | (Dollars in Thousands) | |
| Interest-earning assets: | | | | | | | | | | | | | | | | | | | |
| Investment securities: | | | | | | | | | | | | | | | | | | | |
| Taxable | | $ | (5,070 | ) | $ | 1,733 | | $ | (3,337 | ) | $ | 796 | | $ | 1,235 | | $ | 2,031 | |
| Non-Taxable | | | (2,160 | ) | | 784 | | | (1,376 | ) | | 2,152 | | | 23 | | | 2,175 | |
| Loans, net of unearned discounts | | | 4,015 | | | 2,655 | | | 6,670 | | | 4,848 | | | 1,952 | | | 6,800 | |
| Federal funds sold and securities purchased under agreement to resell | | | 467 | | | 51 | | | 518 | | | 29 | | | — | | | 29 | |
| Total interest-earning assets | | | (2,748 | ) | | 5,223 | | | 2,475 | | | 7,825 | | | 3,210 | | | 11,035 | |
| Interest-bearing liabilities: | | | | | | | | | | | | | | | | | | | |
| Money market deposits | | | 875 | | | 1,546 | | | 2,421 | | | (23 | ) | | 1,008 | | | 985 | |
| Savings deposits | | | (377 | ) | | 574 | | | 197 | | | (278 | ) | | 520 | | | 242 | |
| Time deposits | | | 169 | | | 3,015 | | | 3,184 | | | 1,286 | | | 920 | | | 2,206 | |
| Other interest-bearing deposits | | | 4 | | | 600 | | | 604 | | | 353 | | | 398 | | | 751 | |
| Borrowings and subordinated debentures | | | (3,091 | ) | | 2,363 | | | (728 | ) | | 1,761 | | | 3,383 | | | 5,144 | |
| Total interest-bearing liabilities | | | (2,420 | ) | | 8,098 | | | 5,678 | | | 3,099 | | | 6,229 | | | 9,328 | |
| Change in net interest income | | $ | (328 | ) | $ | (2,875 | ) | $ | (3,203 | ) | $ | 4,726 | | $ | (3,019 | ) | $ | 1,707 | |
Interest income on a fully tax-equivalent basis for the year ended December 31, 2006 increased by approximately $2.5 million or 4.67 percent as compared with the year ended December 31, 2005. This increase primarily reflects a favorable change in the mix of average-earning assets and improved yield on those components of earning assets. The Corporation’s loan portfolio increased on average $68.0 million to $522.3 million from $454.4 million in 2005, primarily driven by growth in commercial loans and commercial real estate.
The loan portfolio represented approximately 54.1 percent of the Corporation’s interest earning assets (on average) during the twelve-months of 2006 and 44.2 percent in 2005. Average investment securities volume decreased during 2006 by $139.7 million compared to 2005, reflecting the repositioning of the Corporation’s balance sheet in March of 2006. The average yield on interest-earning assets increased from 5.16 percent in 2005 to 5.75 percent in 2006. The volume of Federal Funds sold and securities purchased under agreement to resell
24
increased by $9.4 million on average as compared with 2005. The average yield on such assets increased to 5.19% as compared to 2.66% in 2005.
The increase in the volume of loans in 2006 primarily reflected increases in commercial loans and mortgages and residential mortgage loans. This increase in loans and the decrease in investment securities were principally funded by increased levels of high yield interest-bearing money market deposits and time deposits. The increase in average yield on total interest-earning assets contributed $5.2 million to the increase in interest income, as compared with a $2.7 million reduction attributable to volume decreases in certain interest-earning assets.
Interest income (fully tax-equivalent) increased by $11.0 million from 2004 to 2005 primarily due to an increase in the volume of average interest-earning assets. The yield contributed $3.2 million and the loan and investment security volumes added $7.8 million to the increase in interest income for the period.
Interest expense for the year ended December 31, 2006 was principally impacted by rate related factors. The rate related changes reflected increased expense on interest-bearing demand deposits, time deposits and short-term borrowings in 2006 offset in part by the decline in average volume of borrowings during 2006. For the year ended December 31, 2006, interest expense increased $5.7 million or 24.4 percent as compared with 2005. Interest-bearing liabilities in total decreased on average $62.8 million, primarily in savings deposits and short-term borrowings. The reduction in average volume offset $2.4 million of interest expense in 2006, while the increase in rates on interest-bearing liabilities contributed $8.1 million to the increase in interest expense for 2006.
For the year ended December 31, 2005, interest expense increased $9.3 million or 66.78 percent as compared with 2004. Total interest-bearing liabilities increased on average $123.4 million, primarily in time deposits, interest-bearing demand and short-term borrowings. The growth in average volume contributed $3.1 million to the change in cost, while the increase in rates on interest-bearing liabilities contributed $6.2 million to the increase in interest expense for 2005.
The Corporation’s net interest spread on a tax-equivalent basis (i.e., the average yield on average interest-earning assets, calculated on a tax equivalent basis, minus the average rate paid on interest-bearing liabilities) decreased 32 basis points to 2.17 percent in 2006 from 2.49 percent for the year ended December 31, 2005. The decrease in 2006 reflected a compression of spreads between yields earned on loans and investments and rates paid for supporting funds. During 2006, spreads narrowed due in part to monetary policy promulgated by the Federal Reserve Open Market Committee increasing the target Federal Funds Rate 100 basis points from 4.25 percent at December 31, 2005 to 5.25 percent at December 31, 2006 coupled with the flattening and inversion of the yield curve that occurred during the twelve months ended December 31, 2006.
The Federal Reserve increased rates four times during 2006 for a total of 100 basis points and increased rates eight times in 2005 for 200 basis points. The net interest spread decreased 42 basis points in 2005 as compared with 2004, primarily as a result of the Federal Funds Rate increase during the period from a 44-year low of 1.00 percent at June 29, 2004.
The cost of total average interest-bearing liabilities increased to 3.58 percent, a change of 91 basis points, for the year ended December 31, 2006, from 2.67 percent for the year ended December 31, 2005 which followed a change of 81 basis points from 1.86 percent for the year ended December 31, 2004.
The contribution of non-interest-bearing sources (i.e., the differential between the average rate paid on all sources of funds and the average rate paid on interest-bearing sources) increased to 52 basis points, an increase of 15 basis points from 2005 to 2006. Comparing 2005 and 2004, there was an increase of 10 basis point to 37 basis points on average from 27 basis points on average during the year ended December 31, 2004.
25
AVERAGE STATEMENTS OF CONDITION WITH INTEREST AND AVERAGE RATES
| | | | | | | | | | | | | | | | | | | | | | | | | |
| | | Years Ended December 31, | |
| | | 2006 | | 2005 | | 2004 | |
(Tax-Equivalent Basis) | | Average
Balance | | Income/ Expense | | Yield/ Rate | | Average Balance | | Income/ Expense | | Yield/ Rate | | Average Balance | | Income/ Expense | | Yield/ Rate | |
| | | (Dollars in Thousands) | |
ASSETS | | | | | | | | | | | | | | | | | | | |
| Interest-earning assets: | | | | | | | | | | | | | | | | | | | |
| Investment securities:(1) | | | | | | | | | | | | | | | | | | | |
| Taxable | | $ | 312,001 | | $ | 15,752 | | 5.05 | % | $ | 412,427 | | $ | 19,199 | | 4.66 | % | $ | 397,517 | | $ | 17,393 | | 4.38 | % |
| Non-taxable | | | 112,831 | | | 6,718 | | 5.95 | % | | 150,149 | | | 8,094 | | 5.39 | % | | 110,225 | | | 5,919 | | 5.37 | % |
| Loans, net of unearned income:(2) | | | 522,352 | | | 31,999 | | 6.13 | % | | 454,372 | | | 25,329 | | 5.57 | % | | 365,104 | | | 18,529 | | 5.07 | % |
| Federal funds sold and securities purchased under agreement to resell | | | 10,539 | | | 547 | | 5.19 | % | | 1,091 | | | 29 | | 2.66 | % | | — | | | — | | 0.00 | % |
| Restricted investment in bank stocks | | | 8,167 | | | 507 | | 6.21 | % | | 10,080 | | | 397 | | 3.94 | % | | 7,124 | | | 172 | | 2.41 | % |
| Total interest-earning assets | | | 965,890 | | | 55,523 | | 5.75 | % | | 1,028,119 | | | 53,048 | | 5.16 | % | | 879,970 | | | 42,013 | | 4.77 | % |
| Non-interest-earning assets: | | | | | | | | | | | | | | | | | | | | | | | | | |
| Cash and due from banks | | | 20,711 | | | | | | | | 19,418 | | | | | | | | 20,006 | | | | | | |
| Bank owned life insurance | | | 20,225 | | | | | | | | 18,200 | | | | | | | | 16,857 | | | | | | |
| Intangible assets | | | 17,378 | | | | | | | | 11,814 | | | | | | | | 2,091 | | | | | | |
| Other assets | | | 28,405 | | | | | | | | 28,620 | | | | | | | | 26,129 | | | | | | |
| Allowance for loan losses | | | (4,932 | ) | | | | | | | (4,534 | ) | | | | | | | (3,414 | ) | | | | | |
| Total non-interest earning assets | | | 81,787 | | | | | | | | 73,518 | | | | | | | | 61,669 | | | | | | |
| Total assets | | $ | 1,047,677 | | | | | | | $ | 1,101,637 | | | | | | | $ | 941,639 | | | | | | |
LIABILITIES & STOCKHOLDERS’ EQUITY | | | | | | | | | | | | | | | | |
| Interest-bearing liabilities: | | | | | | | | | | | | | | | | | | | | | | | | | |
| Money market deposits | | $ | 126,502 | | $ | 4,384 | | 3.47 | % | $ | 92,875 | | | 1,963 | | 2.11 | % | $ | 95,071 | | | 978 | | 1.03 | % |
| Savings deposits | | | 90,768 | | | 1,807 | | 1.99 | % | | 114,305 | | | 1,610 | | 1.41 | % | | 139,406 | | | 1,368 | | 0.98 | % |
| Time deposits | | | 232,803 | | | 9,950 | | 4.27 | % | | 227,249 | | | 6,766 | | 2.98 | % | | 181,094 | | | 4,560 | | 2.52 | % |
| Other interest-bearing deposits | | | 119,231 | | | 1,864 | | 1.56 | % | | 118,881 | | | 1,260 | | 1.06 | % | | 77,203 | | | 509 | | .66 | % |
Short term borrowings
and FHLB advances | | | 226,004 | | | 9,655 | | 4.27 | % | | 304,364 | | | 10,624 | | 3.49 | % | | 241,536 | | | 5,811 | | 2.41 | % |
| Subordinated debentures | | | 15,070 | | | 1,314 | | 8.72 | % | | 15,465 | | | 1,073 | | 6.94 | % | | 15,465 | | | 742 | | 4.80 | % |
| Total interest-bearing liabilities | | | 810,378 | | | 28,974 | | 3.58 | % | | 873,139 | | | 23,296 | | 2.67 | % | | 749,775 | | | 13,968 | | 1.86 | % |
| Non-interest-bearing liabilities: | | | | | | | | | | | | | | | | | | | | | | | | | |
| Demand deposits | | | 135,761 | | | | | | | | 134,837 | | | | | | | | 127,617 | | | | | | |
| Other non-interest-bearing deposits | | | 1,470 | | | | | | | | 2,813 | | | | | | | | 763 | | | | | | |
| Other liabilities | | | 3,563 | | | | | | | | 5,076 | | | | | | | | 5,630 | | | | | | |
| Total non-interest-bearing liabilities | | | 140,794 | | | | | | | | 142,726 | | | | | | | | 134,010 | | | | | | |
| Stockholders’ equity | | | 96,505 | | | | | | | | 85,772 | | | | | | | | 57,854 | | | | | | |
| Total liabilities and stockholders’ equity | | $ | 1,047,677 | | | | | | | $ | 1,101,637 | | | | | | | $ | 941,639 | | | | | | |
Net interest income
(tax-equivalent basis) | | | | | $ | 26,549 | | | | | | | $ | 29,752 | | | | | | | $ | 28,045 | | | |
| Net interest spread | | | | | | | | 2.17 | % | | | | | | | 2.49 | % | | | | | | | 2.91 | % |
| Net interest income as percent of earning assets (margin) | | | | | | | | 2.75 | % | | | | | | | 2.89 | % | | | | | | | 3.19 | % |
| Tax-equivalent adjustment(3) | | | | | | (2,198 | ) | | | | | | | (2,545 | ) | | | | | | | (1,964 | ) | | |
| Net interest income | | | | | $ | 24,351 | | | | | | | $ | 27,207 | | | | | | | $ | 26,081 | | | |
——————
(1)
Average balances for available-for-sale securities are based on amortized cost.
(2)
Average balances for loans include loans on non-accrual status.
(3)
The tax-equivalent adjustment was computed based on a statutory Federal income tax rate of 34 percent.
26
Investment Portfolio
For the year ended December 31, 2006, the average volume of investment securities decreased by $137.7 million to approximately $424.8 million or 44.0 percent of average earning assets. At December 31, 2006, the total investment portfolio amounted to $381.7 million, a decrease of $136.0 million from December 31, 2005. The decrease in the average volume of investment securities largely reflects a repositioning of the Corporation’s balance sheet in the first quarter of 2006 coupled with a continued decline in the volume of cash flow from the portfolio that was reinvested into the portfolio. At December 31, 2006, the principal components of the investment portfolio are U.S. Treasury and U.S. Government Agency Obligations, Federal Agency Obligations including Mortgage-backed securities, Obligations of U.S. states and political subdivision, corporate bonds and notes, and other debt securities.
The volume related factors during the twelve-month period ended December 31, 2006 decreased revenue by $7.2 million, while rate related changes resulted in an increase in revenue of $2.5 million. The tax-equivalent yield on investments increased by 44 basis points to 5.29 percent from a yield of 4.85 percent during the year ended December 31, 2005. The 44 basis points increase in the tax equivalent yield in investments was attributable to a higher interest rate environment in 2006, coupled with a change in mix in the portfolio to higher yielding tax-free securities. There was some portfolio extension where risk is relatively minimal within the portfolio, resulting in wider spreads, specifically with tax-free municipal securities added to the portfolio during 2006. This favorably impacted the portfolio yield, as compared with 2005. The yield on the portfolio benefited from the impact of the higher interest rate environment on purchases made to replace securities, which had matured, were prepaid, or were called.
The impact of repricing activity on investment yields was also favorably impacted by the change in rates during 2006, due to the fact that a large percentage of the increased volume on average during 2006 was invested into shorter maturities and repriced into a higher rate environment during the year. The cash flow from the sale of investment securities was in part invested back into the portfolio.
Securities available-for-sale is a part of the Corporation’s interest rate risk management strategy and may be sold in response to changes in interest rates, changes in prepayment risk, liquidity management and other factors. During 2006, approximately $188.0 million in securities were sold from the Corporation’s available-for-sale portfolio, a portion of which funded increases in loan volume and a portion of which reduced the volume of short-term borrowings related to the repositioning of the Corporation’s balance sheet in March of 2006. At that time the Corporation sold from its available for sale portfolio, as part of the restructuring, $86.3 million of available-for-sale securities, which were yielding less than 4 percent. The sale resulted in an after-tax charge of approximately $2.4 million. The proceeds from the sale of securities were utilized to reduce the Corporation’s short-term borrowings and wholesale funding sources by $85.0 million. As a result of this de-leveraging, short-term borrowings were reduced to $98.5 million at March 23, 2006. The Corporation’s sales from its available-for-sale portfolio were made in the ordinary course of business. A sale of $517,000 from the Corporation’s held-to-maturity portfolio was made with a gain on sale in the amount of $29,404 in anticipation of an imminent call of the security permissible in accordance with FASB No. 115.
At December 31, 2006 the net unrealized loss carried as a component of other comprehensive income and included in stockholders’ equity, net of tax, amounted to a net unrealized loss of $2.5 million as compared with a net unrealized loss of $4.4 million at December 31, 2005, resulting from an increase in interest rates fostered by the Federal Open Market Committee’s actions to continue to increase the Federal Funds target rate to mitigate inflation risk. For additional information regarding the Corporation’s investment portfolio, see Note 7 of the Notes to the Consolidated Financial Statements.
27
The following table illustrates the maturity distribution and weighted average yield on a tax-equivalent basis for investment securities at December 31, 2006, on a contractual maturity basis.
| | | | | | | | | | | | | | | | |
| | | U.S. Treasury & Agency Securities | | Federal Agency Obligations | | Obligations of U.S. States & Political Subdivisions | | Other debt and equity Securities | | Total | |
| | | (Dollars in Thousands) | |
| Due in 1 year or less | | | | | | | | | | | |
| Amortized Cost | | $ | 0 | | | 1,008 | | $ | 669 | | $ | 39,706 | | $ | 41,383 | |
| Market Value | | | 0 | | | 1,005 | | | 689 | | $ | 40,009 | | | 41,703 | |
| Weighted Average Yield | | | 0 | % | | 3.77 | % | | 7.42 | % | | 4.28 | % | | 4.32 | % |
| Due after one year through five years | | | | | | | | | | | | | | | | |
| Amortized Cost | | $ | 100 | | | 11,675 | | $ | 11,170 | | $ | 19,159 | | $ | 42,104 | |
| Market Value | | | 100 | | | 11,351 | | | 11,042 | | | 19,568 | | | 42,061 | |
| Weighted Average Yield | | | 4.76 | % | | 4.09 | % | | 3.59 | % | | 5.51 | % | | 4.60 | % |
| Due after five years through ten years | | | | | | | | | | | | | | | | |
| Amortized Cost | | $ | 49 | | | 47,512 | | $ | 33,350 | | $ | 4,030 | | $ | 84,941 | |
| Market Value | | | 50 | | | 46,270 | | | 32,962 | | | 3,954 | | | 83,236 | |
| Weighted Average Yield | | | 0.00 | % | | 4.66 | % | | 3.63 | % | | 5.26 | % | | 4.29 | % |
| Due after ten years | | | | | | | | | | | | | | | | |
| Amortized Cost | | $ | 462 | | | 77,204 | | $ | 41,793 | | $ | 98,038 | | $ | 217,497 | |
| Market Value | | | 479 | | | 74,564 | | | 41,945 | | | 97,515 | | | 214,503 | |
| Weighted Average Yield | | | 7.14 | % | | 4.29 | % | | 4.11 | % | | 5.78 | % | | 4.94 | % |
| Total | | | | | | | | | | | | | | | | |
| Amortized Cost | | $ | 611 | | | 137,399 | | $ | 86,982 | | $ | 160,933 | | $ | 385,925 | |
| Market Value | | | 629 | | | 133,190 | | | 86,638 | | | 161,046 | | | 381,503 | |
| Weighted Average Yield | | | 6.70 | % | | 4.40 | % | | 3.88 | % | | 5.34 | % | | 4.69 | % |
For information regarding the carrying value of the investment portfolio, see Note 7 of the Notes to the Consolidated Financial Statements.
The securities listed in the table above are either rated investment grade by Moody’s and/or Standard and Poor’s or have shadow credit ratings from a credit agency supporting investment grade and conform to the Corporation’s investment policy guidelines. There were no municipal securities of any single issuer exceeding 10 percent of stockholders’ equity at the end of 2006.
The following table sets forth the book value of the Corporation’s investment securities, both available for sale and held to maturity, as of December 31 for each of the last three years.
| | | | | | | | | | |
| | | 2006 | | 2005 | | 2004 | |
| | | (Dollars in Thousands) | |
| U.S. Treasury & Agency Securities | | $ | 611 | | $ | 1,710 | | $ | 5,772 | |
| Federal Agency Obligations | | | 137,399 | | | 248,834 | | | 280,931 | |
| Obligations of U.S. States and political subdivisions | | | 86,982 | | | 105,578 | | | 102,216 | |
| Other debt securities | | | 140,285 | | | 153,597 | | | 31,514 | |
| Other equity securities | | | 20,648 | | | 14,752 | | | 150,162 | |
| Total Book Value | | $ | 385,925 | | $ | 524,471 | | $ | 570,595 | |
For other information regarding the Corporation’s investment securities portfolio, see Note 7 of the Notes to the Consolidated Financial Statements.
Loan Portfolio
Lending is one of the Corporation’s primary business activities. The Corporation’s loan portfolio consists of both retail and commercial loans, serving the diverse customer base in its market area. The composition of the Corporation’s loan portfolio continues to change due to the local economy. Factors such as the economic climate, interest rates, real estate values and employment all contribute to these changes. Loan growth has been generated through business development efforts and entry, through branching, into new markets.
28
Loan growth during 2006 occurred primarily in the commercial related categories of the loan portfolio. At December 31, 2006 total loans amounted to $550.4 million, an increase of 8.81 percent or $44.6 million as compared to December 31, 2005. The increase in interest on loans for the twelve months ended December 31, 2006, was the result of the increase in interest rates as compared with 2005, lessened to some extent by the competitive rate pricing structure maintained by the Corporation to attract new loans and further by the heightened competition for lending relationships that exists in the Corporation’s market. The Federal Reserve Open Market Committee increased the target Federal Funds Rate four times during 2006 to 5.25 percent from 4.25 percent at December 31, 2005. Loan growth during the year ended December 31, 2005 occurred primarily in residential mortgage loans and in the commercial loan portfolio. The Red Oak Bank merger in May 2005 contributed to the mix and net growth of the loan portfolio. Growth also resulted from the Corporation’s business development efforts, heightened visibility of its products and aggressive marketing campaigns on its home equity, 7/1 adjustable rate residential mortgage and 10-year residential mortgage loan products.
Total average loan volume increased $68.0 million or 14.96 percent in 2006, while portfolio yield increased by 56 basis points as compared with 2005. The increased total average loan volume was due primarily to increased customer activity, new lending relationships and new markets. The volume related factors during the period, contributed increased revenue of $4.0 million, while the rate related changes contributed $2.7 million. Total average loan volume increased to $522.4 million with a net interest yield of 6.13 percent, as compared to $454.4 million with a yield of 5.57 percent for the year ended December 31, 2005. The Corporation seeks to create growth in commercial lending by offering products and competitive pricing and by capitalizing on the positive trends in its market area. Products are offered to meet the financial requirements of the Corporation’s clients. It is the objective of the Corporation’s credit policies to diversify the commercial loan portfolio to limit concentrations in any single industry.
The following table presents information regarding the components of the Corporation’s loan portfolio on the dates indicated.
| | | | | | | | | | | | | | | | |
| | | Years Ended December 31, | |
| | | 2006 | | 2005 | | 2004 | | 2003 | | 2002 | |
| | | (Dollars in Thousands) | |
| Commercial | | $ | 280,223 | | $ | 243,847 | | $ | 150,281 | | $ | 127,307 | | $ | 104,481 | |
| Real estate residential mortgage | | | 269,486 | | | 261,028 | | | 221,893 | | | 214,482 | | | 119,674 | |
| Installment | | | 705 | | | 951 | | | 5,130 | | | 7,736 | | | 4,896 | |
| Total | | | 550,414 | | | 505,826 | | | 377,304 | | | 349,525 | | | 229,051 | |
| Less: | | | | | | | | | | | | | | | | |
| Allowance for loan losses | | | 4,960 | | | 4,937 | | | 3,781 | | | 3,002 | | | 2,498 | |
| Net total | | $ | 545,454 | | $ | 500,889 | | $ | 373,523 | | $ | 346,523 | | $ | 226,553 | |
Since 2002, demand for the Bank’s commercial loan, commercial real estate and real estate mortgage products has improved.
The increase in commercial loan and commercial real estate loans in 2006 was a result of the expansion of the Corporation’s markets, increased lending limits, more aggressive business development and marketing programs coupled with positive market trends, Consumer real estate products lagged as the market conditions changed and the refinancing boom which started in 2005 peaked and started to wane in 2006.
In 2005 increases were also as a result of continued business demand coupled with the loans acquired from the merger with Red Oak Bank. In 2006 the increase in residential mortgage loans is attributable to the prevailing interest rate environment that spurred increased refinancing activity in the market over the past several years.
Average commercial loans, which include commercial real estate, increased to $260.7 million or by approximately $54.3 million or 26.3 percent in 2006 as compared with 2005. The Corporation seeks to create growth in the commercial lending sector by offering products and competitive pricing and by capitalizing on the positive trends in its market area. Over the last several years the expansion of the Bank’s marketplace and increased capital base have aided in this growth. Products are offered to meet the financial requirements of the Corporation’s clients. It is the objective of the Corporation’s credit policies to diversify the commercial loan portfolio to limit concentrations in any single industry.
29
The Corporation’s commercial loan portfolio includes, in addition to real estate development, loans to the manufacturing, services, automobile, professional and retail trade sectors, and to specialized borrowers, including high technology businesses. A large proportion of the Corporation’s commercial loans have interest rates which reprice with changes in short-term market interest rates or mature in one year or less.
Average commercial real estate loans, which amounted to $129.0 million in 2006, increased $22.0 million or 20.6 percent as compared with average commercial real estate loans of $107.0 million in 2005 (which reflected a 19.4 percent increase over 2004). The Corporation’s long-term mortgage portfolio includes both residential and commercial financing. Growth during the past two years largely reflected brisk activity in mortgage financing. The interest rates on a portion of the Corporation’s commercial mortgages adjust to changes in indices such as the 5-year Treasury Notes, and the Federal Home Loan Bank of New York 5-year advance rate. Interest rate changes usually occur at each five year anniversary of the loan.
Average volume of residential mortgage loans in 2006 remained stable compared to 2005, the stability in average volume was attributable to the slowdown in the housing market in 2006 and to some extent the sale of loans carrying more unusual terms and conditions that the Corporation did not want to retain in its portfolio, such as forty year terms and interest only loans. During 2002 through 2004, residential loan growth was affected by refinancing activity, competition among lenders and lower interest rates. In 2004 and 2005, this was mitigated to some extent, by the promotion of variable interest rate products including a 10-year amortizing mortgage, 7/1 adjustable rate mortgage and an aggressive promotional campaign for home equity lines of credit, which resulted in increased volumes in these categories of loans. The momentum of 2004 carried over into the beginning of 2005 as more variable rate products were promoted, including 3/1 and 5/1 adjustable rate mortgages. Fixed rate home equity loans became a popular choice for homeowners during 2005 as interest rates began to rise and consumers looked to lock in fixed rates. However, that enthusiasm diminished in 2006, contributing to some of the slowing of growth.
Average construction loans and other temporary mortgage financing increased from 2005 to 2006 by $30.5 million to $56.1 million. The average volume of such loans increased by $16.3 million from 2004 to 2005. The change in construction and other temporary mortgage lending has been generated by the market activity of the Corporation’s customers, several of whom engage in residential and commercial development throughout New Jersey. Interest rates on such mortgages are generally tied to key short-term market interest rates. Funds are typically advanced to the builder or developer during various stages of construction and upon completion of the project it is contemplated that the loans will be repaid by cash flows derived from sales within the project or, where appropriate, conversion to permanent financing.
Loans to individuals include personal loans, student loans, and home improvement loans, as well as financing for automobiles and other vehicles. Such loans averaged $927,000 in 2006, as compared with $1.5 million in 2005 and $5.6 million in 2004. The decrease in loans to individuals during 2006 and 2005 was due to decreases in volumes of new personal loans (single-pay), and in part by declines in volumes of new automobile loans, as a result of aggressive marketing campaigns by automobile manufacturers.
Home equity loans, inclusive of home equity lines, as well as traditional secondary mortgage loans, have become popular with consumers due to their tax advantages over other forms of consumer borrowing.
Home equity loans and secondary mortgages averaged $33.4 million in 2006, a decrease of $12.0 million or 26.5 percent as compared with average home equity loans of $45.4 million in 2005 and $41.9 million in 2004. Interest rates on floating rate home equity lines are generally tied to the prime rate while most other loans to individuals, including fixed rate home equity loans, are medium-term (ranging between one-to-ten years) and carry fixed interest rates. The decrease in home equity lines outstanding during 2006 was due in part to prime rate increases totaling 3.00 percentage points since the beginning of 2005 in reaction to the Federal Reserve’s increasing the Federal Funds target rate eight times in 2005 and four times in 2006 a quarter point each time, which prompted consumers to seek fixed rate loans. The floating rate home equity lines became less attractive and consumers were prone to convert these loan balances into fixed rate loan products, such as home equity loans and refinanced first mortgage loans, or to simply pay them off.
At December 31, 2006, the Corporation had total lending commitments outstanding of $146.7 million, of which approximately 46.4 percent were for commercial loans, commercial real estate loans and construction loans.
30
The maturities of loans at December 31, 2006 are listed below.
| | | | | | | | | | | | | |
| | | At December 31, 2006, Maturing | |
| | | In One Year Or Less | | After One Year Through Five Years | | After Five Years | | Total | |
| | | (Dollars in Thousands) | |
| Construction loans | | $ | 58,437 | | $ | 11,894 | | $ | — | | $ | 70,331 | |
| Commercial real estate loans | | | 13,837 | | | 101,440 | | | 31,718 | | | 146,995 | |
| Commercial loans | | | 34,094 | | | 20,986 | | | 7,817 | | | 62,897 | |
| All other loans | | | 6,647 | | | 69,150 | | | 194,394 | | | 270,191 | |
| Total | | $ | 113,015 | | $ | 203,470 | | $ | 233,929 | | $ | 550,414 | |
| Loans with: | | | | | | | | | | | | | |
| Fixed rates | | | 22,032 | | | 37,662 | | | 178,233 | | | 237,927 | |
| Variable rates | | | 90,983 | | | 165,808 | | | 55,696 | | | 312,487 | |
| Total | | $ | 113,015 | | $ | 203,470 | | $ | 233,929 | | $ | 550,414 | |
For additional information regarding loans, see Note 8 of the Notes to the Consolidated Financial Statements.
Allowance for Loan Losses and Related Provision
The purpose of the allowance for loan losses (“allowance”) is to absorb the impact of losses inherent in the loan portfolio. Additions to the allowance are made through provisions charged against current operations and through recoveries made on loans previously charged-off. The Corporation’s allowance was increased by the amount of Red Oak Bank’s allowance at the time of the acquisition of that Bank in May 2005, which increase amounted to $1.2 million. The allowance for loan losses is maintained at an amount considered adequate by management to provide for potential credit losses based upon a periodic evaluation of the risk characteristics of the loan portfolio. In establishing an appropriate allowance, an assessment of the individual borrowers, a determination of the value of the underlying collateral, a review of historical loss experience and an analysis of the levels and trends of loan categories, delinquencies and problem loans are considered. Such factors as the level and trend of interest rates and current economic conditions and peer group statistics are also reviewed. At year-end 2006, the level of the allowance was $4,960,000 as compared to a level of $4,937,000 at December 31, 2005. The Corporation made provisions of $57,000 in 2006 compared with none in 2005 and provisions of $752,000 in 2004. The level of the allowance during the respective annual periods of 2006 and 2005 reflects the credit quality within the loan portfolio the loan volume recorded during the periods and the Corporation’s focus on the changing composition of the commercial and residential real estate loan portfolios.
At December 31, 2006, the allowance for loan losses amounted to 0.90 percent of total loans. In management’s view, the level of the allowance at December 31, 2006, is adequate to cover losses inherent in the loan portfolio. Management’s judgment regarding the adequacy of the allowance constitutes a “Forward Looking Statement” under the Private Securities Litigation Reform Act of 1995. Actual results could differ materially from management’s analysis, based principally upon the factors considered by management in establishing the allowance.
Although management uses the best information available, the level of the allowance for loan losses remains an estimate, which is subject to significant judgment and short-term change. Various regulatory agencies, as an integral part of their examination process, periodically review the Corporation’s allowance for loan losses. Such agencies may require the Corporation to increase the allowance based on their analysis of information available to them at the time of their examination. Furthermore, the majority of the Corporation’s loans are secured by real estate in the State of New Jersey. Future adjustments to the allowance may be necessary due to economic factors impacting New Jersey real estate as well as operating, regulatory and other conditions beyond the Corporation’s control. The allowance for loan losses as a percentage of total loans amounted to 0.90 percent, 0.98 percent and 1.00 percent at December 31, 2006, 2005 and 2004, respectively.
Net charge-offs were $34,000 in 2006 and $54,000 in 2005. Net recoveries were $27,000 in 2004. During 2006, the Corporation experienced an increase in the volume of charge-offs in the installment loan portfolios compared to 2005 and 2004 levels, attributable to the increase in interest rates and a higher level of personal bankruptcies.
31
Five-Year Statistical Allowance for Loan Losses
The following table reflects the relationship of loan volume, the provision and allowance for loan losses and net charge-offs (recoveries) for the past five years.
| | | | | | | | | | | | | | | | |
| | | Years Ended December 31, | |
| | | 2006 | | 2005 | | 2004 | | 2003 | | 2002 | |
| | | (Dollars in Thousands) | |
| Average loans outstanding | | $ | 522,352 | | $ | 454,372 | | $ | 365,104 | | $ | 276,457 | | $ | 222,819 | |
| Total loans at end of period | | $ | 550,414 | | $ | 505,826 | | $ | 377,304 | | $ | 349,525 | | $ | 229,051 | |
| Analysis of the Allowance for Loan Losses | | | | | | | | | | | | | | | | |
| Balance at the beginning of year | | $ | 4,937 | | $ | 3,781 | | $ | 3,002 | | $ | 2,498 | | $ | 2,191 | |
| Charge-offs: | | | | | | | | | | | | | | | | |
| Commercial | | | — | | | 49 | | | — | | | — | | | 48 | |
| Installment loans | | | 79 | | | 33 | | | 11 | | | 39 | | | 69 | |
| Total charge-offs | | | 79 | | | 82 | | | 11 | | | 39 | | | 117 | |
| Recoveries: | | | | | | | | | | | | | | | | |
| Commercial | | | 19 | | | — | | | — | | | — | | | 48 | |
| Installment loans | | | 26 | | | 28 | | | 38 | | | 21 | | | 16 | |
| Total recoveries | | | 45 | | | 28 | | | 38 | | | 21 | | | 64 | |
| Net charge-offs (recoveries) | | | 34 | | | 54 | | | (27 | ) | | 18 | | | 53 | |
Addition of Red Oak Bank’s
allowance – May 20, 2005 | | | — | | | 1,210 | | | — | | | — | | | — | |
| Provision for loan losses | | | 57 | | | — | | | 752 | | | 522 | | | 360 | |
| Balance at end of year | | $ | 4,960 | | $ | 4,937 | | $ | 3,781 | | $ | 3,002 | | $ | 2,498 | |
| Ratio of net charge-offs during the year to average loans outstanding during the year | | | 0.01 | % | | 0.01 | % | | N/M | | | 0.01 | % | | 0.02 | % |
| Allowance for loan losses as a percentage of total loans at end of year | | | 0.90 | % | | 0.98 | % | | 1.00 | % | | 0.86 | % | | 1.09 | % |
Implicit in the lending function is the fact that loan losses will be experienced and that the risk of loss will vary with the type of loan being made, the creditworthiness of the borrower and prevailing economic conditions. The allowance for loan losses has been allocated below according to the estimated amount deemed to be reasonably necessary to provide for the possibility of losses being incurred within the following categories of loans at December 31, for each of the past five years.
The table below shows, for three types of loans, the amounts of the allowance allocable to such loans and the percentage of such loans to total loans. The percentage of loans to total loans is based upon the classification of loans shown on page 32 of this report.
| | | | | | | | | | | | | | | | | | | | | | | | | |
| | | Commercial | | Real Estate Mortgage | | Installment | | Unallocated | | | |
| | | Amount
of
Allowance | | Loans
to Total
Loans
% | | Amount
of
Allowance | | Loans
to Total
Loans
% | | Amount
of Allowance | | Loans
to Total
Loans
% | | Amount
of
Allowance | | Total | |
| | | (Dollars in Thousands) | |
| 2006 | | $ | 3,972 | | | 50.9 | | $ | 707 | | | 49.0 | | $ | 45 | | | 0.1 | | $ | 236 | | $ | 4,960 | |
| 2005 | | $ | 3,453 | | | 48.2 | | $ | 594 | | | 51.6 | | $ | 55 | | | 0.2 | | $ | 835 | | $ | 4,937 | |
| 2004 | | $ | 2,561 | | | 39.8 | | $ | 744 | | | 58.8 | | $ | 8 | | | 1.4 | | $ | 468 | | $ | 3,781 | |
| 2003 | | $ | 1,763 | | | 38.6 | | $ | 986 | | | 59.2 | | $ | 80 | | | 2.2 | | $ | 173 | | $ | 3,002 | |
| 2002 | | $ | 1,846 | | | 45.8 | | $ | 494 | | | 52.3 | | $ | 46 | | | 1.9 | | $ | 112 | | $ | 2,498 | |
Asset Quality
The Corporation manages asset quality and credit risk by maintaining diversification in its loan portfolio and through review processes that include analysis of credit requests and ongoing examination of outstanding loans and delinquencies, with particular attention to portfolio dynamics and mix. The Corporation strives to identify loans experiencing difficulty early enough to correct the problems, to record charge-offs promptly based on realistic
32
assessments of current collateral values, and to maintain an adequate allowance for loan losses at all times. These practices have protected the Corporation during economic downturns and periods of uncertainty.
It is generally the Corporation’s policy to discontinue interest accruals once a loan is past due as to interest or principal payments for a period of ninety days. When a loan is placed on non-accrual status, interest accruals cease and uncollected accrued interest is reversed and charged against current income. Payments received on non-accrual loans are applied against principal. A loan may only be restored to an accruing basis when it again becomes well secured and in the process of collection or all past due amounts have been collected. Accruing loans past due 90 days or more are generally well secured and in the process of collection.
Non-performing and Past Due Loans, OREO
Non-performing loans include non-accrual loans and troubled debt restructuring. Non-accrual loans represent loans on which interest accruals have been suspended. It is the Corporation’s general policy to consider the charge-off of loans when they become contractually past due ninety days or more as to interest or principal payments or when other internal or external factors indicate that collection of principal or interest is doubtful. Troubled debt restructurings represent loans on which a concession was granted to a borrower, such as a reduction in interest rate, which is lower than the current market rate for new debt with similar risks. At December 31, 2006, 2005, 2004, 2003 and 2002 the Corporation did not have any other real estate owned (OREO) or troubled debt restructuring.
The following table sets forth, as of the dates indicated, the amount of the Corporation’s non-accrual loans, accruing loans past due 90 days or more and other real estate owned. The Corporation had no restructured loans on any of such dates.
| | | | | | | | | | | | | | | | | |
| | | At December 31, | |
| | | 2006 | | 2005 | | 2004 | | 2003 | | 2002 | |
| | | (Dollars in Thousands) | |
| Non-accrual loans | | $ | 475 | | $ | 387 | | $ | — | | $ | 26 | | $ | 229 | |
| Troubled debt restructuring | | | — | | | — | | | — | | | — | | | — | |
| Other real estate owned | | | — | | | — | | | — | | | — | | | — | |
| Total non-performing assets | | $ | 475 | | $ | 387 | | $ | — | | $ | 26 | | $ | 229 | |
| Accruing loans past due 90 days or more | | | 225 | | | 179 | | | — | | | — | | | — | |
| Total non-performing assets and accruing loans past due 90 days or more | | $ | 700 | | $ | 566 | | $ | — | | $ | 26 | | $ | 229 | |
The increase in non-accrual loans of $88,000 in 2006 was primarily related to two business loans and three consumer loans. All of these loans are real estate secured. In 2005 non-accrual loans increased $387,000 from none reported at December 31, 2004, which were comprised of four commercial loans and two residential loans. The accruing loans past due 90 days or more at December 31, 2006 consisted of one real estate secured commercial loan.
Interest income on impaired loans totaled $0 in 2006, $29,469 in 2005 and $11,905 in 2004.
Accruing loans which are contractually past due 90 days or more as to principal or interest payments are as follows:
| | | | | | | | | | | | | | | | |
| | | December 31, | |
| | | 2006 | | 2005 | | 2004 | | 2003 | | 2002 | |
| | | (Dollars in Thousands) | |
| Commercial | | $ | 225 | | $ | 179 | | $ | — | | $ | — | | $ | — | |
| Installment | | | — | | | — | | | — | | | — | | | — | |
| Total accruing loans 90 days or more past due | | $ | 225 | | $ | 179 | | $ | — | | $ | — | | $ | — | |
Other known “potential problem loans” (as defined by SEC regulations) as of December 31, 2006 have been identified and internally risk rated as other assets especially mentioned or substandard. Such loans amounted to $2,089,000, $4,923,000 and $207,000 at December 31, 2006, 2005 and 2004 respectively. The Corporation has no foreign loans.
At December 31, 2006, other than the loans set forth above, the Corporation is not aware of any loans which present serious doubts as to the ability of its borrowers to comply with present loan repayment terms and which are expected to fall into one of the categories set forth in the tables or description above.
33
In general, it is the policy of management to consider the charge-off of loans at the point that they become past due in excess of 90 days, with the exception of loans that are secured by cash or marketable securities or mortgage loans, which are in the process of foreclosure.
With respect to concentrations of credit within the Corporation’s portfolio of credits at December 31, 2006, $39.1 million of the commercial loan portfolio or 14.0 percent of $280.2 million, represented outstanding working capital loans to various real estate developers. All but $14.2 million of these loans are secured by mortgages on land and on buildings under construction.
For additional information regarding risk elements in the Corporation’s loan portfolio, see Note 8 of the Notes to Consolidated Financial Statements.
Other Income
The following table presents the principal categories of non-interest income for each of the years in the three-year period ended December 31, 2006.
| | | | | | | | | | | | | | | | | | | |
| | | Years Ended December 31, | |
| | | 2006 | | 2005 | | % Change | | 2005 | | 2004 | | % Change | |
| | | (Dollars in Thousands) | |
| Service charges, commissions and fees | | $ | 1,759 | | $ | 1,922 | | | (8.48 | ) | $ | 1,922 | | $ | 1,948 | | | (1.33 | ) |
| Other income | | | 454 | | | 631 | | | (28.05 | ) | | 631 | | | 499 | | | 26.45 | |
| Annuity & insurance commissions | | | 205 | | | 193 | | | 6.22 | | | 193 | | | 59 | | | 227.12 | |
| Bank Owned Life Insurance | | | 780 | | | 740 | | | 5.41 | | | 740 | | | 734 | | | .82 | |
| Net (losses) gains on securities sold | | | (2,565 | ) | | 350 | | | (832.86 | ) | | 350 | | | 148 | | | 136.49 | |
| Total other non-interest income | | $ | 633 | | $ | 3,836 | | | (83.50 | ) | $ | 3,836 | | $ | 3,388 | | | 13.22 | |
For the year ended December 31, 2006, total other non-interest income, exclusive of net losses on securities sold, reflects a decrease of $288,000 or 8.26 percent from 2005. Total other income, including gains (losses) on securities sold decreased $3.2 million for the twelve-months of 2006 compared with the comparable period in 2005. The declines stem primarily from the securities losses during the first quarter of 2006 and declines in service charges, commissions and fess coupled with declines in other income. The $163,000 or 8.48% decline in service charges is related to lower overdraft fees and service charge income on deposit accounts as compared with 2005. The $177,000 decline in other income is related to decreased commissions and related one-time commissions on check book charges in 2005.
During 2006, the Corporation recorded net losses of $2.6 million on securities sold from the available-for-sale investment portfolio compared to net gains of $350,000 and $148,000 recorded in 2005 and 2004. The sales in 2006 were made as part of the Corporation’s decision to reposition its statement of condition to improve the Corporation’s inertest rate profile; the proceeds from the sales were used principally to reduce borrowings. In 2005 and in 2004 the sales of securities were made in the normal course of business and proceeds were reinvested into the securities and loan portfolios.
Other Expense
Total non-interest expense includes salary and employee benefits, net occupancy expense and premises and equipment expense, stationery and printing, marketing and advertising and other operating expense. Other operating includes such expenses as telephone, computer, and insurance, legal, professional and consulting, audit and the amortization of core deposit intangibles. Such expense in 2005 includes a partial year of the operating expenses of Red Oak Bank since its acquisition on May 20, 2005. These expenses include the costs related to one branch acquired which was also Red Oak Bank’s administration building; other increased costs resulting from the acquisition include occupancy and bank premises expense, increased audit, marketing and advertising expenses and increased computer related expenses related to the integration of Red Oak Bank into Union Center National Bank.
34
The following table presents the principal categories of non-interest expense for each of the years in the three-year period ended December 31, 2006.
| | | | | | | | | | | | | | | | | | | |
| | | Year Ended December 31, | |
| | | 2006 | | 2005 | | % Change | | 2005 | | 2004 | | % Change | |
| | | (Dollars in Thousands) | |
| Salaries and employee benefits | | $ | 12,290 | | $ | 12,108 | | | 1.50 | | $ | 12,108 | | $ | 10,140 | | | 19.41 | |
| Occupancy, net | | | 2,309 | | | 2,165 | | | 6.65 | | | 2,165 | | | 1,943 | | | 11.43 | |
| Premises and equipment | | | 1,940 | | | 1,990 | | | (2.51 | ) | | 1,990 | | | 1,852 | | | 7.45 | |
| Stationery and printing | | | 692 | | | 628 | | | 10.19 | | | 628 | | | 539 | | | 16.51 | |
| Marketing and advertising | | | 731 | | | 644 | | | 13.51 | | | 644 | | | 529 | | | 21.74 | |
| Computer | | | 741 | | | 594 | | | 24.75 | | | 594 | | | 451 | | | 31.71 | |
| Other | | | 5,655 | | | 4,084 | | | 38.47 | | | 4,084 | | | 4,017 | | | 1.67 | |
| Total other non-interest expense | | $ | 24,358 | | $ | 22,213 | | | 9.66 | | $ | 22,213 | | $ | 19,471 | | | 14.08 | |
Total non-interest expense increased $2.15 million or 9.66 percent in 2006 from 2005 as compared with an increase of $2.7 million or 14.08 percent from 2004 to 2005. The level of operating expenses during 2006 increased in several expense categories, although the principal increase ($1.7 million) involved general operating expenses.
Prudent management of operating expenses has and will continue to be a key objective of management in an effort to improve earnings performance. The Corporation’s ratio of other expenses to average assets increased to 2.32 percent in 2006 compared to 2.02 percent in 2005 and 2.07 percent in 2004.
Salaries and employee benefits increased $182,000 or 1.50 percent in 2006 compared to 2005 and increased $2.0 million or 19.41% from 2004 to 2005. The increase from 2004 to 2005 was primarily attributable to the increase in staffing levels to 202 full time equivalent from 192 at December 31, 2004. The increase reflects staffing positions which were previously vacant and filled and the retention of eight full-time equivalent employees in the acquisition of Red Oak Bank. The Corporation recorded a credit of $478,000 to benefits expense representing a reduction in the Corporation’s obligation related to certain long-term benefit plans. Salaries and employee benefits accounted for 50.46 percent of total other non-interest expense in 2006, as compared to 54.51 percent and 52.08 percent in 2005 and 2004, respectively.
Staffing levels overall increased to 214 full-time equivalent employees at December 31, 2006 compared to 202 full-time equivalent employees at December 31, 2005 and 192 at December 31, 2004. The increase in 2006 primarily reflects the increased staffing for the new Boonton/ Mountain Lakes office in October of 2006. The increase in 2006 also reflects increases in compensation cost attributable to stock options accounted for under FASB 125(R) which amounted to $159,831 in 2006, offset with reductions in overtime and incentive bonus expense. The increase in 2005 reflects staffing positions which were previously vacant and eight full-time equivalent employees retained in the acquisition of Red Oak Bank.
Occupancy and bank premises and equipment expense for the year ended December 31, 2006 increased $94,000, or 2.26 percent over 2005. The increase in occupancy and bank premises and equipment expense in 2006 is primarily attributable to higher operating costs (utilities, rent, real estate taxes, general repair and maintenance) of the Corporation’s expanded facilities, coupled with higher equipment maintenance and repair and depreciation expenses. The increase in such expenses of $360,000, or 9.49 percent, in 2005 over 2004 was also attributable to the increased costs of expanded bank facilities, including the addition of Red Oak Bank.
Stationery and printing expenses for the year increased $64,000, or 10.2 percent, compared to 2005, in part related to increased business activity and growth experienced from 2005, primarily the merger with Red Oak Bank. These costs increased $89,000 or 16.51 percent in 2005 from 2004, again reflecting primarily the merger with Red Oak Bank and increased business activity.
Marketing and advertising expenses for the year ended December 31, 2006 increased $87,000, or 13.51 percent, over the comparable twelve-month period in 2005. The increase in 2006 was primarily related to increased advertising and promotional expense incurred with marketing new deposit accounts and the opening of the new Boonton/Mountain Lakes office. These expenses, which increased $115,000 or 21.74 percent in 2005 when compared with 2004 levels, reflected the acquisition of Red Oak Bank in 2005.
35
The increase of $147,000 and $143,000 in computer expense during both 2006 and 2005 were related to increases in expanded customer service platforms and related expense for software and service fees to vendor providers coupled with expanded business activity.
Other expenses increased by approximately $1.6 million or 38.47 percent compared to 2005. Higher operating expenses during the twelve-month period resulted primarily from an increase in other general and administrative expenses as well as certain specific customer-related expenses. The increase included several extraordinary one-time expenses which accounted for 29 percent of the increase in such expense in 2006; $294,000 related to customer corporate analysis charges and $162,000 related to the write-off of expenses incurred due to the abandonment of the previous Cranford branch site under development. Other expense items which increased during the period included increases in professional consulting, compliance, audit fees and insurance expense for the twelve-month period. Amortization of core deposit intangibles accounted for $120,000 of other expense in the current twelve-month period and $75,000 in the comparable period in 2005.
Provision for Income Taxes
The Corporation’s provision for income taxes decreased from 2005 to 2006, primarily as a result of a decline of $8.3 million of pre-tax income as compared to 2005, the recognition of a pre-tax net loss on securities sales of $3.7 million which occurred in March 2006, coupled with a change in the Corporation’s business entity structure, which resulted in the recognition of a $1.4 million tax benefit in the fourth quarter of 2006. The Corporation recorded an income tax benefit of $3.3 million for the twelve months ended December 31, 2006 as compared with tax expense of $1.2 million for the comparable twelve-month period in 2005. The effective tax rates for the Corporation for the years ended December 31, 2006, 2005 and 2004 were (247.4) percent, 13.41 percent and 17.56 percent, respectively. The effective tax rate continues to be less than the combined statutory Federal tax rate of 34 percent and the New Jersey State tax rate of 9 percent. The Corporation adjusts its expected annual tax rate on a quarterly basis based on the current projections of non-deductible expenses, tax- exempt interest income, increase in the cash surrender value of bank owned life insurance and pre-tax net earnings.
Tax-exempt interest income on a fully tax equivalent basis decreased by $1.4 million, or 17.0 percent from 2005 to 2006, and increased by $2.2 million or 36.75 percent from 2004 to 2005. The Corporation recorded income related to the cash surrender value of bank owned life insurance as a component of other income in the amount of $780,000, $740,000 and $734,000 for 2006, 2005 and 2004, respectively.
Recent Accounting Pronouncements
Note 4 of the Consolidated Financial Statements discusses new accounting policies adopted by the Corporation during 2006 and the expected impact of accounting policies recently issued or proposed but not yet required to be adopted. To the extent the adoption of new accounting standards materially affects financial condition results of operations, or liquidity, the impacts are discussed in the applicable sections of the financial review and notes to the consolidated financial statements.
Share-Based Payments. Statement of Financial Accounting Standards No. 123(R), “Share-Based Payment” (“SFAS No. 123 (R)”), which was effective for the Corporation on January 1, 2006, requires entities to measure the cost of employee services received in exchange for an award of equity instruments based on the grant-date fair value of the award (with limited exceptions). The cost is recognized as an expense over the period during which the employee is required to provide service in exchange for the award, which is usually the vesting period. As a result of SFAS No. 123(R), the Company will recognize the grant-date fair value of options as compensation expense on a straight-line basis over the applicable vesting period. This accounting treatment differs significantly from the previous accounting for fixed stock options under APB Opinion No. 25, which generally required expense recognition only when the exercise price of the option was less than the market price of the underlying stock on the grant date. As required by SFAS No. 123(R), the Corporation will estimate the fair value of stock options on each grant date, using an appropriate valuation model such as the Black-Scholes option pricing model.
The adoption of SFAS No. 123(R) did not have a material impact on the Consolidated Financial Statements of the Corporation for the full year 2006. Estimated future levels of compensation expense recognized related to stock based awards would be impacted by new awards, modifications to awards, or cancellation of awards after the adoption of SFAS No. 123(R).
As a result of the Corporation’s adopting SFAS No. 123R, the impact to the Consolidated Financial Statements for the twelve-months ended December 31 2006, for income before income taxes and net income, was $160,000 and $105,000 lower, respectively.
36
Emerging Issues Task Force (“EITF”) Issue.
Emerging Issues Task Force (EITF) Issue 03-1, “The Meaning of Other-Than-Temporary Impairment and Its Application to Certain Investments.” EITF 03-1 provides guidance for determining when an investment is considered impaired, whether impairment is other-than-temporary, and measurement of an impairment loss. An investment is considered impaired if the fair value of the investment is less than its cost. Generally, an impairment is considered other-than-temporary unless: (i) the investor has the ability and intent to hold an investment for a reasonable period of time sufficient for an anticipated recovery of fair value up to (or beyond) the cost of the investment; and (ii) evidence indicating that the cost of the investment is recoverable within a reasonable period of time outweighs evidence to the contrary. If impairment is determined to be other-than-temporary, then an impairment loss should be recognized equal to the difference between the investment’s cost and its fair value. Certain disclosure requirements of EITF 03-1 were adopted in 2004 and the Corporation began presenting the new disclosure requirements in its Consolidated Financial Statements for the year ended December 31, 2004. The recognition and measurement provisions were initially effective for other-than-temporary impairment evaluations in reporting periods beginning after June 15, 2005. However, in September 2005, the effective date of these provisions was delayed until the finalization of a FASB Staff Position (FSP) to provide additional implementation guidance.
In June 2005, the FASB decided not to provide additional guidance on the meaning of other-than-temporary impairment, but directed its staff to issue proposed FSP EITF 03-1-a, “Implementation Guidance for the Application of Paragraph 16 of EITF Issue No. 03-1,” as final. The final FSP will supersede EITF Issue No. 03-1, “The Meaning of Other-Than-Temporary Impairment and Its Application to Certain Investments,” and EITF Topic No. D-44, “Recognition of Other-Than-Temporary Impairment upon the Planned Sale of a Security Whose Cost Exceeds Fair Value.” The final FSP (retitled FSP FAS 115-1, “The Meaning of Other-Than-Temporary Impairment and Its Application to Certain Investments”) will replace the guidance set forth in paragraphs 10-18 of Issue 03-1 with references to existing other-than-temporary impairment guidance, such as FASB Statement No. 115, “Accounting for Certain Investments in Debt and Equity Securities”, SEC Staff Accounting Bulletin No. 59, “Accounting for Noncurrent Marketable Equity Securities”, and APB Opinion No. 18, “The Equity Method of Accounting for Investments in Common Stock.”
FASB Staff Position No. FAS 115-1 and FAS 124-1. “The Meaning of Other-Than-Temporary Impairment and Its Application to Certain Investments” (the “FSP”), was issued on November 3, 2006 and addresses the determination of when an investment is considered impaired; whether the impairment is other than temporary; and how to measure an impairment loss. The FSP also addresses accounting considerations subsequent to the recognition of an other-than-temporary impairment on a debt security, and requires certain disclosures about unrealized losses that have not been recognized as other-than-temporary impairments. The FSP replaces the impairment guidance in EITF Issue No. 03-1 with references to existing authoritative literature concerning other-than-temporary determinations (principally Statement of Financial Accounting Standards No. 115 and SEC Staff Accounting Bulletin 59). Under the FSP, impairment losses must be recognized in earnings equal to the entire difference between the security’s cost and its fair value at the financial statement date, without considering partial recoveries subsequent to that date. The FSP also requires that an investor recognize an other-than-temporary impairment loss when a decision to sell a security has been made and the investor does not expect the fair value of the security to fully recover prior to the expected time of sale. The FSP is effective for reporting periods beginning after December 15, 2006. The Corporation does not expect that the application of the FSP will have a material impact on its consolidated financial condition, results of operations or financial statement disclosures.
FIN 48
In July 2006, the Financial Accounting Standards Board (FASB) issued FASB Interpretation No. 48, “Accounting for Uncertainty in Income Taxes—an interpretation of FASB Statement No. 109” (FIN 48), which clarifies the accounting for uncertainty in tax positions. This Interpretation requires that companies recognize in their financial statements the impact of a tax position, if that position is more likely than not of being sustained on audit, based on the technical merits of the position. The provisions of FIN 48 are effective for fiscal years beginning after December 15, 2006, with the cumulative effect of the change in accounting principle recorded as an adjustment to opening retained earnings. Management has evaluated the impact of adopting FIN 48 on the Corporation’s financial statements and does not expect that the application of FIN 48 will have a material impact on its consolidated financial condition, results of operations or financial statements disclosures.
37
SFAS No. 156
In March 2006, the Financial Accounting Standards Board issued Statement of Financial Accounting Standards (“SFAS”) No. 156, “Accounting for Servicing of Financial Assets.” SFAS No. 140, Accounting for Transfers and Servicing of Financial Assets and Extinguishments of Liabilities, establishes, among other things, the accounting for all separately recognized servicing assets and servicing liabilities. SFAS No. 156 amends SFAS No. 140 to require that all separately recognized servicing assets and servicing liabilities be initially measured at fair value, if practicable. This statement permits, but does not require, the subsequent measurement of separately recognized servicing assets and servicing liabilities at fair value. An entity that uses derivative instruments to mitigate the risks inherent in servicing assets and servicing liabilities is required to account for those derivative instruments at fair value. Under this Statement, an entity can elect subsequent fair value measurement to account for its separately recognized servicing assets and servicing liabilities. By electing that option, an entity may simplify its accounting because this Statement permits income statement recognition of the potential offsetting changes in fair value of those servicing assets and servicing liabilities and derivative instruments in the same accounting period. The Statement is effective in the first fiscal year beginning after September 15, 2006 with earlier adoption permitted. The Corporation adopted FASB No. 154 as of December 31, 2006 and there was no impact to the Corporation’s consolidated financial position, results of operations and cash flows.
SFAS No. 157
In September 2006, the FASB issued SFAS No. 157, “Fair Value Measurements” (SFAS No. 157). SFAS No. 157 establishes a common definition for fair value to be applied to US GAAP guidance requiring use of fair value, establishes a framework for measuring fair value, and expands disclosure about such fair value measurements. SFAS No. 157 is effective for fiscal years beginning after November 15, 2007. The Corporation is currently assessing the impact of SFAS No. 157 on its consolidated financial position and results of operations.
SFAS No. 158
In September 2006, the FASB issued SFAS No. 158, “Employers’ Accounting for Defined Benefit Pension and Other Postretirement Plans—An Amendment of FASB No. 87, 88, 106 and 132(R)” (“SFAS 158”). SFAS 158 requires that the funded status of defined benefit postretirement plans be recognized on a company’s balance sheet, and that changes in the funded status be reflected in other comprehensive income, effective for fiscal years ending after December 15, 2006. SFAS 158 also requires companies to measure the funded status of such plans as of the date of their fiscal year-end, effective for fiscal years ending after December 15, 2008. The Corporation expects to adopt the measurement provisions of SFAS 158 effective October 31, 2009. Based upon the December 31, 2006 balance sheet and pension disclosures, the impact of adopting SFAS 158 at December 31, 2006 resulted in an increase in the accumulated other comprehensive loss of $815,000, net of taxes.
SAB 108
In September 2006, the SEC issued SAB No. 108, “Considering the Effects of Prior Year Misstatements when Quantifying Misstatements in Current Year Financial Statements” (“SAB 108”). SAB 108 provides guidance on the consideration of the effects of prior year misstatements in quantifying current year misstatements for the purpose of a materiality assessment. SAB 108 establishes an approach that requires quantification of financial statement errors based on the effects of each of the company’s balance sheet and statement of operations and the related financial statement disclosures. Early application of the guidance in SAB 108 is encouraged in any report for an interim period of the first fiscal year ending after November 15, 2006, and will be adopted by the Corporation in the first quarter of fiscal 2007. The Corporation does not expect the adoption of SAB 108 to have a material impact on its consolidated results of operations and financial condition.
Asset and Liability Management
Asset and Liability management encompasses an analysis of market risk, the control of interest rate risk (interest sensitivity management) and the ongoing maintenance and planning of liquidity and capital. The composition of the Corporation’s statement of condition is planned and monitored by the Asset and Liability Committee (“ALCO”). In general, management’s objective is to optimize net interest income and minimize market risk and interest rate risk by monitoring these components of the statement of condition.
38
Short-term interest rate exposure analysis is supplemented with an interest sensitivity gap model. The Corporation utilizes interest sensitivity analysis to measure the responsiveness of net interest income to changes in interest rate levels. Interest rate risk arises when an earning-asset matures or when its interest rate changes in a time period different than that of a supporting interest-bearing liability, or when an interest-bearing liability matures or when its interest rate changes in a time period different than that of an earning-asset that it supports. While the Corporation matches only a small portion of specific assets and liabilities, total earning assets and interest-bearing liabilities are grouped to determine the overall interest rate risk within a number of specific time frames. The difference between interest sensitive assets and interest sensitive liabilities is referred to as the interest sensitivity gap. At any given point in time, the Corporation may be in an asset-sensitive position, whereby its interest-sensitive assets exceed its interest-sensitive liabilities, or in a liability-sensitive position, whereby its interest-sensitive liabilities exceed its interest-sensitive assets, depending in part on management’s judgment as to projected interest rate trends.
The Corporation’s rate sensitivity position in each time frame may be expressed as assets less liabilities, as liabilities less assets, or as the ratio between rate sensitive assets (“RSA”) and rate sensitive liabilities (“RSL”). For example, a short funded position (liabilities repricing before assets) would be expressed as a net negative position, when period gaps are computed by subtracting repricing liabilities from repricing assets. When using the ratio method, a RSA/RSL ratio of 1 indicates a balanced position, a ratio greater than 1 indicates an asset sensitive position and a ratio less than 1 indicates a liability sensitive position.
A negative gap and/or a rate sensitivity ratio less than 1, tends to expand net interest margins in a falling rate environment and to reduce net interest margins in a rising rate environment. Conversely, when a positive gap occurs, generally margins expand in a rising rate environment and contract in a falling rate environment. From time to time, the Corporation may elect to deliberately mismatch liabilities and assets in a strategic gap position.
At December 31, 2006, the Corporation reflects a negative interest sensitivity gap (or an interest sensitivity ratio of .53:1.00) at the cumulative one-year position. During all of 2006 and 2005, the Corporation had a negative interest sensitivity gap. The rising rates and a flattening of the yield curve during 2006 affected net interest margins. Based on management’s perception that interest rates will continue to be volatile, projected increased levels of prepayments on the earning-asset portfolio and current level of interest rates, emphasis has been, and is expected to continue to be, placed on interest-sensitivity matching with the objective of stabilizing the net interest spread during 2007. However, no assurance can be given that this objective will be met.
The following table depicts the Corporation’s interest rate sensitivity position at December 31, 2006:
| | | | | | | | | | | | | | | | | | | | | | | | | | | | |
| | | Expected Maturity/Principal Repayment December 31, | |
| | | Average Interest Rate | | Year End 2007 | | Year End 2008 | | Year End 2009 | | Year End 2010 | | Year End 2011 | | 2012 and Thereafter | | Total Balance | | Estimated Fair Value | |
| | | (Dollars in Thousands) | |
| INTEREST-EARNING ASSETS: | | | | | | | | | | | | | | | | | | | | | | | | | | | | |
| Loans | | | 6.38 | % | $ | 199,109 | | $ | 102,115 | | $ | 67,982 | | $ | 58,305 | | $ | 31,078 | | $ | 86,865 | | $ | 545,454 | | $ | 541,672 | |
| Restricted Investment in bank stocks | | | 6.21 | % | | 7,805 | | | 0 | | | 0 | | | 0 | | | 0 | | | 0 | | | 7,805 | | | 7,805 | |
| Fed Funds Sold | | | 5.25 | % | | 10,275 | | | 0 | | | 0 | | | 0 | | | 0 | | | 0 | | | 10,275 | | | 10,275 | |
| Investments | | | 4.62 | % | | 104,899 | | | 58,358 | | | 38,340 | | | 31,671 | | | 31,394 | | | 117,071 | | | 381,733 | | | 381,503 | |
| Total interest-earning assets | | | | | $ | 322,088 | | $ | 160,473 | | $ | 106,322 | | $ | 89,976 | | $ | 62,472 | | $ | 203,936 | | $ | 945,267 | | $ | 941,255 | |
| INTEREST-BEARING LIABILITIES: | | | | | | | | | | | | | | | | | | | | | | | | | | | | |
| Time certificates of deposit of $100 or greater | | | 4.80 | % | $ | 80,858 | | $ | 999 | | $ | 1,450 | | $ | 316 | | $ | 0 | | $ | 0 | | $ | 83,623 | | $ | 83,516 | |
| Time certificates of deposit of less than $100 | | | 4.60 | % | | 107,650 | | | 4,849 | | | 1,927 | | | 1,115 | | | 11 | | | 3 | | | 115,555 | | | 115,285 | |
| Other interest-bearing deposits | | | 3.04 | % | | 263,789 | | | 0 | | | 0 | | | 0 | | | 0 | | | 127,351 | | | 391,140 | | | 391,140 | |
| Subordinated Debentures | | | 8.12 | % | | 5,155 | | | 0 | | | 0 | | | 0 | | | 0 | | | 0 | | | 5,155 | | | 4,444 | |
| Securities sold under agreements to repurchase and Fed Funds Purchased | | | 3.94 | % | | 97,443 | | | 0 | | | 0 | | | 0 | | | 0 | | | 0 | | | 97,443 | | | 97,691 | |
| Term Borrowings | | | 4.66 | % | | 47,468 | | | 1,245 | | | 152 | | | 50,126 | | | 10,000 | | | 0 | | | 108,991 | | | 109,858 | |
| Total interest-bearing liabilities | | | | | $ | 602,363 | | $ | 7,093 | | $ | 3,529 | | $ | 51,557 | | $ | 10,011 | | $ | 127,354 | | $ | 801,907 | | $ | 801,934 | |
| Cumulative interest-earning assets | | | | | | 322,088 | | | 482,561 | | | 588,883 | | | 678,859 | | | 741,331 | | | 945,267 | | | 945,267 | | | | |
| Cumulative interest-bearing liabilities | | | | | | 602,363 | | | 609,456 | | | 612,985 | | | 664,542 | | | 674,553 | | | 801,907 | | | 801,907 | | | | |
| Rate sensitivity gap | | | | | | (280,275 | ) | | 153,380 | | | 102,793 | | | 38,419 | | | 52,461 | | | 76,582 | | | 143,360 | | | | |
| Cumulative rate sensitivity gap | | | | | $ | (280,275 | ) | $ | (126,895 | ) | $ | (24,102 | ) | $ | 14,317 | | $ | 66,778 | | $ | 143,360 | | $ | 143,360 | | | | |
| Cumulative gap ratio | | | | | | 0.53 | % | | 0.79 | % | | 0.96 | % | | 1.02 | % | | 1.10 | % | | 1.18 | % | | 1.18 | % | | | |
39
Estimates of Fair Value
The estimation of fair value is significant to a number of the Corporation’s assets, including loans held for sale, and available for sale investment securities. These are all recorded at either fair value or lower of cost or fair value. Fair values are volatile and may be influenced by a number of factors. Circumstances that could cause estimates of the fair value of certain assets and liabilities to change include a change in prepayment speeds, discount rates, or market interest rates. Fair values for most available for sale investment securities are based on quoted market prices. If quoted market prices are not available, fair values are based on judgments regarding future expected loss experience, current economic condition risk characteristics of various financial instruments, and other factors.
These estimates are subjective in nature, involve uncertainties and matters of significant judgment and therefore cannot be determined with precision. Changes in assumptions could significantly affect the estimates.
Impact of Inflation and Changing Prices
The financial statements and notes thereto presented elsewhere herein have been prepared in accordance with generally accepted accounting principles, which require the measurement of financial position and operating results in terms of historical dollars without considering the change in the relative purchasing power of money over time due to inflation. The impact of inflation is reflected in the increased cost of the operations; unlike most industrial companies, nearly all of the Corporation’s assets and liabilities are monetary. As a result, interest rates have a greater impact on performance than do the effects of general levels of inflation. Interest rates do not necessarily move in the same direction or to the same extent as the prices of goods and services.
Liquidity
The liquidity position of the Corporation is dependent on successful management of its assets and liabilities so as to meet the needs of both deposit and credit customers. Liquidity needs arise principally to accommodate possible deposit outflows and to meet customers’ requests for loans. Scheduled principal loan repayments, maturing investments, short-term liquid assets and deposit in-flows, can satisfy such needs. The objective of liquidity management is to enable the Corporation to maintain sufficient liquidity to meet its obligations in a timely and cost-effective manner.
Management monitors current and projected cash flows, and adjusts positions as necessary to maintain adequate levels of liquidity. By using a variety of potential funding sources and staggering maturities, the risk of potential funding pressure is reduced. Management also maintains a detailed liquidity contingency plan designed to respond adequately to situations which could lead to liquidity concerns.
Management believes that the Corporation has the funding capacity to meet the liquidity needs arising from potential events. In addition to pledgeable securities, the Corporation also maintains borrowing capacity through the Federal Discount Window and the Federal Home Loan Bank of New York secured with loans and marketable securities.
Liquidity is measured and monitored for the Corporation’s bank subsidiary, Union Center National Bank (the “Bank”). The Corporation reviews its net short-term mismatch. This measures the ability of the Corporation to meet obligations should access to Bank dividends be constrained. At December 31, 2006, the Parent Corporation had $5.3 million in cash and short-term investments compared to $18.5 million at December 31, 2005. The change in cash at the Parent Corporation level was due in part to the use of funds for the Corporation’s common stock buyback program and the redemption of $10.3 million of subordinated debt. Expenses at the Parent Corporation are moderate and management believes that the Parent Corporation has adequate liquidity to fund its obligations.
Certain provisions of long-term debt agreements, primarily subordinated debt, prevent the Corporation from creating liens on, disposing of or issuing voting stock of subsidiaries. As of December 31, 2006 the Corporation was in compliance with all covenants and provisions of these agreements.
Management monitors current and projected cash flows, and adjusts positions as necessary to maintain adequate levels of liquidity. By using a variety of potential funding sources and staggering maturities, the risk of potential funding pressure is somewhat reduced. Management also maintains a detailed liquidity contingency plan designed to adequately respond to situations which could lead to liquidity concerns.
40
Anticipated cash-flows at December 31, 2006, projected to December 31, 2007, indicates that the Bank’s liquidity should remain strong, with an approximate projection of $185.4 million in anticipated cash flows over the next twelve months. This projection represents a forward-looking statement under the Private Securities Litigation Reform Act of 1995. Actual results could differ materially from this projection depending upon a number of factors, including the liquidity needs of the Bank’s customers, the availability of sources of liquidity and general economic conditions.
Deposits
Total deposits increased to $726.8 million on December 31, 2006 from $700.6 million at December 31, 2005, an increase of $26.2 million, or 3.74 percent.
Total non-interest-bearing deposits decreased from $139.9 million to $136.4 million, a decrease of $3.5 million or 2.47 percent. Time, savings and interest-bearing transaction accounts increased from $406.3 million on December 31, 2005 to $506.7 million at December 31, 2006, an increase of $100.4 million or 24.7 percent. During 2006 the Corporation experienced a shift in its deposit mix to more costly interest-bearing deposits, driven by the changes that occurred in interest rates. In 2005, the Corporation acquired $62.7 million in interest-bearing transaction accounts from the Red Oak Bank acquisition. Time deposits $100,000 and over decreased $70.8 million to $83.6 million. The Red Oak Bank acquisition contributed $42.0 million in time deposits including $13.0 million in time deposits $100,000 and over.
The Corporation derives a significant proportion of its liquidity from its core deposit base. For the twelve-month period ended December 31, 2006, core deposits, comprised of total demand deposits, savings and money market accounts, increased by $75.8 million or 16.78 percent from December 31, 2005 to $527.5 million. At December 31, 2006, core deposits were 72.6 percent of total deposits compared to 64.5 percent at year-end 2005. Alternatively, the Corporation uses a more stringent calculation for the management of its liquidity positions internally which consists of total demand and savings accounts (excluding money market accounts greater than $100,000) and excludes time deposits as part of core deposits as a percentage of total deposits. This number represented 49.58 percent of total deposits at December 31, 2006 as compared with 47.78 percent at December 31, 2005.
More volatile rate sensitive deposits, concentrated in certificates of deposit $100,000 and greater, decreased to 11.51 percent of total deposits from 22.04 percent at December 31, 2005. This change was due primarily to increased rates and enhanced market competition for certificates of deposit $100,000 and greater in 2006 compared to 2005. As such, the Corporation elected to reduce it’s reliance on this segment of deposits in the current rate environment.
Core Deposit Mix
The following table depicts the Corporation’s core deposit mix at December 31, 2006 and 2005.
| | | | | | | | | | | | | | | | |
| | | December 31, | | Net Change
Volume 2006
vs. 2005 | |
2006 | | 2005 |
Amount | | Percentage | | Amount | | Percentage |
| | | (Dollars in Thousands) | |
| Demand Deposits | | $ | 136,284 | | | 37.8 | | $ | 139,723 | | | 41.7 | | $ | (3,439 | ) |
| Interest-Bearing Demand | | | 107,359 | | | 29.8 | | | 100,610 | | | 30.1 | | | 6,749 | |
| Regular Savings | | | 58,389 | | | 16.2 | | | 72,624 | | | 21.7 | | | (14,235 | ) |
| Money Market Deposits under $100 | | | 58,290 | | | 16.2 | | | 21,775 | | | 6.5 | | | 36,515 | |
| Total core deposits | | $ | 360,322 | | | 100.0 | | $ | 334,732 | | | 100.0 | | $ | 25,590 | |
| Total deposits | | $ | 726,771 | | | | | $ | 700,601 | | | | | $ | 26,170 | |
| Core deposits to total deposits | | | 49.58 | % | | | | | 47.78 | % | | | | | | |
Short-Term Borrowings
Short-term borrowings can be used to satisfy daily funding needs. Balances in those accounts fluctuate on a day-to-day basis. The Corporation’s principal short-term funding sources are Federal funds purchased and securities sold under agreement to repurchase. Average short-term borrowings, including federal funds purchased, during 2006 amounted to approximately $96.4 million, a decrease of $22.7 million or 19.1 percent from 2005.
41
The following table is a summary of securities sold under repurchase agreements for each of the last three years.
| | | | | | | | | | |
| | | December 31, | |
| | | 2006 | | 2005 | | 2004 | |
| | | (Dollars in Thousands) | |
| Securities sold under repurchase agreements: | | | | | | | |
| Average interest rate: | | | | | | | |
| At year end | | | 4.20 | % | | 2.44 | % | | 1.29 | % |
| For the year | | | 3.78 | % | | 0.82 | % | | 0.80 | % |
| Average amount outstanding during the year: | | $ | 96,381 | | $ | 119,079 | | $ | 105,449 | |
| Maximum amount outstanding at any month end: | | $ | 103,447 | | $ | 160,842 | | $ | 131,791 | |
| Amount outstanding at year end: | | $ | 97,443 | | $ | 75,693 | | $ | 84,757 | |
Cash Flows
The consolidated statements of cash flows present the changes in cash and cash equivalents from operating, investing and financing activities. During 2006, cash and cash equivalents (which increased overall by $25.0 million) were provided on a net basis by operating and investing activities and used on a net basis by a reduction in financing activities. Cash flows from operating activities, primarily net income and cash flow resulting from an increase in other liabilities, and investing activities, primarily a net decrease in securities, offset in part by a net increase in loans, were used in financing activities, reflecting a reduction in borrowings, redemption of subordinated debentures and payment of dividends.
During 2005, cash and cash equivalents (which increased overall by $7.3 million) were provided on a net basis by operating and financing activities and used on a net basis by investing activities. Cash flows from operating activities, primarily net income, and financing activities, primarily a net increase in borrowings and proceeds from the issuance of Parent Corporation’s common stock, were used in investing activities, primarily the increased volume of loans and property and equipment.
During 2004, cash and cash equivalents (which decreased overall by $4.5 million) were provided on a net basis by operating and financing activities, primarily net deposit inflows and proceeds from the issuance of Parent Corporation’s common stock, and were used in investing activities, primarily the increased volume of investment securities, loans and property and equipment.
Contractual Obligations and other Commitments
The following table summarizes our contractual obligations at December 31, 2006 and the effect such obligations are expected to have on our liquidity and cash flows in future periods.
| | | | | | | | | | | | | | | | |
| | | Total | | Less Than 1 Year | | 1-3 Years | | 4-5 Years | | After 5 Years | |
| | | (Dollars in Thousands) | |
Contractual obligations | | | | | | | | | | | |
| Operating lease obligations | | $ | 6,590 | | $ | 736 | | $ | 1,571 | | $ | 1,661 | | $ | 2,622 | |
| Total contracted cost obligations | | $ | 6,590 | | $ | 736 | | $ | 1,571 | | $ | 1,661 | | $ | 2,622 | |
Other Long-term Liabilities/Long-term Debt | | | | | | | | | | | | | | | | |
| Time Deposits | | | 199,178 | | | 188,509 | | | 9,226 | | | 1,443 | | | — | |
| Overnight Federal funds purchased | | | — | | | — | | | — | | | — | | | — | |
| Federal Home Loan Bank advances and repurchase agreements | | | 206,434 | | | 144,911 | | | 1,397 | | | 60,126 | | | — | |
| Expected contributions under defined benefit plans | | | 850 | | | 850 | | | — | | | — | | | — | |
| Subordinated debentures | | | 5,155 | | | — | | | 5,155 | | | — | | | — | |
| Total Other Long-term Liabilities/Long-term Debt | | $ | 411,617 | | $ | 334,270 | | $ | 15,778 | | $ | 61,569 | | $ | — | |
| Other Commercial Commitments – Off balance sheet | | | | | | | | | | | | | | | | |
| Letter of credit | | | 18,379 | | | 18,190 | | | 189 | | | — | | | — | |
| Other commercial commitments – Off balance sheet | | | 67,949 | | | 59,217 | | | 5,297 | | | — | | | 3,435 | |
| Total off balance sheet arrangements and contractual obligations | | $ | 86,328 | | $ | 77,407 | | $ | 5,486 | | $ | — | | $ | 3,435 | |
| Total contractual obligations and other commitments | | $ | 505,435 | | $ | 412,413 | | $ | 22,835 | | $ | 63,230 | | $ | 6,057 | |
For further information see Note 19 of Notes to Consolidated Financial Statements.
42
Stockholders’ Equity
Stockholders’ equity averaged $96.5 million during 2006, an increase of $10.7 million or 12.51 percent, as compared to 2005. At December 31, 2006, stockholders’ equity totaled $97.6 million, a decrease of $1.9 million from December 31, 2005.
The Corporation’s dividend reinvestment and optional stock purchase plan coupled with option activity contributed $658,000 in new capital during 2006. Book value per share at year-end 2006 was $7.37 compared to $7.41 at year-end 2005. Tangible book value at year-end 2006 was $6.06 compared to $6.11 at year end 2005; see item 6 for a reconciliation of this non-GAAP financial measure to book value. The decline in 2006 as compared to 2005 reflects the change in goodwill and other intangible assets, the reduction in capital as a result of the repurchase of shares and changes in other comprehensive income.
As of December 31, 2006 the Corporation has purchased 326,908 common shares at an average cost per share of $11.95 under the stock buyback program announced on January 24, 2002, as amended on March 27, 2006, for the repurchase of up to 671,802 shares of the Corporation’s outstanding common stock. The repurchased shares were recorded as Treasury Stock, which resulted in a decrease in stockholders’ equity.
Capital
The maintenance of a solid capital foundation continues to be a primary goal for the Corporation. Accordingly, capital plans and dividend policies are monitored on an ongoing basis. The most important objective of the capital planning process is to balance effectively the retention of capital to support future growth and the goal of providing stockholders with an attractive long-term return on their investment.
Risk-Based Capital/Leverage
The Tier I leverage capital at December 31, 2006 (defined as tangible stockholders’ equity for common stock and Trust Preferred Capital Securities) amounted to $88.0 million or 8.37 percent of total assets. At December 31, 2006, the Corporation’s Tier I risk-based capital amounted to $88.0 million or 8.64 percent of total assets. Tier I capital excludes the effect of SFAS No. 115, which amounted to $2.5 million of net unrealized losses, after tax, on securities available-for-sale (reported as a component of accumulated other comprehensive income which is included in stockholders’ equity), and goodwill and intangible assets of $17.3 million as of December 31, 2006. For information on goodwill and intangible assets, see Note 2 to the Consolidated Financial Statements.
United States bank regulators have issued guidelines establishing minimum capital standards related to the level of assets and off balance-sheet exposures adjusted for credit risk. Specifically, these guidelines categorize assets and off balance-sheet items into four risk-weightings and require banking institutions to maintain a minimum ratio of capital to risk-weighted assets. At December 31, 2006, the Corporation’s Tier 1 and total risk-based capital ratios were 13.14 percent and 13.88 percent, respectively. These ratios are well above the minimum guidelines of capital to risk-adjusted assets in effect as of December 31, 2006. For information on risk-based capital and regulatory guidelines for the Parent Corporation and its bank subsidiary, see Note 13 to the Consolidated Financial Statements.
The foregoing capital ratios are based in part on specific quantitative measures of assets, liabilities and certain off-balance sheet items as calculated under regulatory accounting practices. Capital amounts and classifications are also subject to qualitative judgments by the bank regulators regarding capital components, risk weightings and other factors. As of December 31, 2006, management believes that each of the Bank and the Parent Corporation meet all capital adequacy requirements to which it is subject.
Subordinated Debentures
On December 19, 2003, Center Bancorp Statutory Trust II, a statutory business trust and wholly-owned subsidiary of Center Bancorp, Inc., issued $5.0 million of, MMCapS capital securities to investors due on January 23, 2034. The capital securities presently qualify as Tier I capital. The trust loaned the proceeds of this offering to the Corporation and received in exchange $5.2 million of the Parent Corporation’s subordinated debentures. The subordinate debentures are redeemable in whole or part, prior to maturity but after January 23, 2009. The floating interest rate on the subordinate debentures is three-month LIBOR plus 2.85% and reprices quarterly. The rate at December 31, 2006 was 8.23%.
43
On December 18, 2001, Center Bancorp Statutory Trust I, a statutory business trust and wholly-owned subsidiary of Center Bancorp, Inc., issued $10.0 million of floating rate capital trust pass through securities to investors due on December 18, 2031. The trust loaned the proceeds of this offering to the Corporation and received in exchange $10.3 million of the Parent Corporation’s subordinated debentures. The subordinated debentures were redeemed in whole on December 18, 2006. Prior to redemption on December 18, 2006, the floating interest rate on the subordinated debentures was three-month LIBOR plus 3.85% and repriced quarterly. The rate at redemption was 8.99%.
The additional capital raised with respect to the issuance of the floating rate capital pass through securities was used to bolster the Corporation’s capital and for general corporate purposes, including capital contributions to Union Center National Bank. Additional information regarding the capital treatment of these securities is contained by reference to Note 14 of the Notes to the Consolidated Financial Statements.
Looking Forward
One of the Corporation’s primary objectives is to achieve balanced asset and revenue growth, and at the same time expand market presence and diversify its financial products. However, it is recognized that objectives, no matter how focused, are subject to factors beyond the control of the Corporation, which can impede its ability to achieve these goals. The following factors should be considered when evaluating the Corporation’s ability to achieve its objectives:
The financial market place is rapidly changing. Banks are no longer the only place to obtain loans, nor the only place to keep financial assets. The banking industry has lost market share to other financial service providers. The future is predicated on the Corporation’s ability to adapt its products, provide superior customer service and compete in an ever-changing marketplace.
Net interest income, the primary source of earnings, is impacted favorably or unfavorably by changes in interest rates. Although the impact of interest rate fluctuations is mitigated by ALCO strategies, significant changes in interest rates can have a material adverse impact on profitability.
The ability of customers to repay their obligations is often impacted by changes in the regional and local economy. Although the Corporation sets aside loan loss provisions toward the allowance for loan losses when the Board determines such action to be appropriate, significant unfavorable changes in the economy could impact the assumptions used in the determination of the adequacy of the allowance.
Technological changes will have a material impact on how financial service companies compete for and deliver services. It is recognized that these changes will have a direct impact on how the marketplace is approached and ultimately on profitability. The Corporation has taken steps to improve its traditional delivery channels. However, continued success will likely be measured by the ability to anticipate and react to future technological changes.
This “Looking Forward” description constitutes a forward-looking statement under the Private Securities Litigation Reform Act of 1995. Actual results could differ materially from those projected in the Corporation’s forward-looking statements due to numerous known and unknown risks and uncertainties, including the factors referred to above, in Item 1A if this Annual Report on Form 10K and in other sections of this Annual Report on Form 10K.
Item 7A. Quantitative and Qualitative Disclosures about Market Risk Interest Sensitivity
Market Risk
The Corporation’s profitability is affected by fluctuations in interest rates. A sudden and substantial increase or decrease in interest rates may adversely affect the Corporation’s earnings to the extent that the interest rates borne by assets and liabilities do not similarly adjust. The Corporation’s primary objective in managing interest rate risk is to minimize the adverse impact of changes in interest rates on the Corporation’s net interest income and capital, while structuring the Corporation’s asset-liability structure to obtain the maximum yield-cost spread on that structure. The Corporation relies primarily on its asset-liability structure to control interest rate risk. The Corporation continually evaluates interest rate risk management opportunities, including the use of derivative financial
44
instruments. The management of the Corporation believes that hedging instruments currently available are not cost-effective, and, therefore, has focused its efforts on increasing the Corporation’s yield-cost spread through wholesale and retail growth opportunities.
The Corporation monitors the impact of changes in interest rates on its net interest income using several tools. One measure of the Corporation’s exposure to differential changes in interest rates between assets and liabilities is the Corporation’s analysis of its interest rate sensitivity. This test measures the impact on net interest income and on net portfolio value of an immediate change in interest rates in 100 basis point increments. Net portfolio value is defined as the net present value of assets, liabilities and off-balance sheet contracts.
The primary tool used by management to measure and manage interest rate exposure is a simulation model. Use of the model to perform simulations reflecting changes in interest rates over one and two-year time horizons has enabled management to develop and initiate strategies for managing exposure to interest rate risk. In its simulations, management estimates the impact on net interest income of various changes in interest rates. Projected net interest income sensitivity to movements in interest rates is modeled based on both an immediate rise and fall in interest rates (“rate shock”), as well as gradual changes in interest rates over a 12-month time period. The model is based on the actual maturity and repricing characteristics of interest-rate sensitive assets and liabilities. The model incorporates assumptions regarding earning-asset and deposit growth, prepayments, interest rates and other factors.
Management believes that both individually and taken together, these assumptions are reasonable, but the complexity of the simulation modeling process results in a sophisticated estimate, not an absolutely precise calculation of exposure. For example, estimates of future cash flows must be made for instruments without contractual maturity or payment schedules.
In prior years, the low level of interest rates had necessitated a modification of the Corporation’s standard rate scenario of a movement down 200 basis points over 12 months to down 100 basis points over a 12-month period. However given the recent rise in rates for the year ended December 31, 2006 the Corporation has returned to a -200 basis point change down over a 12-month period. Based on the results of the interest simulation model as of December 31, 2006, and assuming that management does not take action to alter the outcome, the Corporation would expect an increase of 10.7 percent in net interest income if interest rates decreased 200 basis points from the current rates in an immediate and parallel shock over a 12-month period. In a rising rate environment, based on the results of the model as of December 31, 2006, the Corporation would expect a decrease of 8.07 percent in net interest income if interest rates increased by 200 basis points from current rates in an immediate and parallel shock over a twelve month period.
The rising rates and a flattening of the yield curve during 2006 affected net interest margins. Based on management’s perception that interest rates will continue to be volatile, projected increased levels of prepayments on the earning-asset portfolio and the current level of interest rates, emphasis has been, and is expected to continue to be, placed on interest-sensitivity matching with the objective of stabilizing the net interest spread during 2007. However, no assurance can be given that this objective will be met.
Equity price risk
We are also exposed to equity price risk inherent in our portfolio of publicly traded equity securities, which had an estimated fair value of $4.1 million at December 31, 2006 and $3.9 million at December 31, 2005. We monitor our equity investments for impairment on a periodic basis. In the event that the carrying value of the equity investment exceeds its fair value, and we determine the decline in value to be other than temporary, we reduce the carrying value to its current fair value.
45
Item 8. Financial Statements and Supplementary Data All Financial Statements:
The following financial statements are filed as part of this report under Item 8 — “Financial Statements and Supplementary Data.”
| | |
| | | Page |
| | | |
| Reports of Independent Registered Public Accounting Firm | | F-2-F-4 |
| Management’s Report on Internal Control Over Financial Reporting | | F-5 |
| Consolidated Statements of Condition | | F-6 |
| Consolidated Statements of Income | | F-7 |
| Consolidated Statements of Changes in Stockholders’ Equity | | F-8 |
| Consolidated Statements of Cash Flows | | F-9 |
| Notes to Consolidated Financial Statements | | F-10 |
F-1
REPORT OF INDEPENDENT REGISTERED PUBLIC ACCOUNTING FIRM The Board of Directors and Stockholders
Center Bancorp, Inc.:
We have audited the accompanying consolidated statement of condition of Center Bancorp, Inc. and subsidiaries (the “Corporation”) as of December 31, 2006, and the related consolidated statements of income, changes in stockholders’ equity, and cash flows for the year then ended. These consolidated financial statements are the responsibility of the Corporation’s management. Our responsibility is to express an opinion on these consolidated financial statements based on our audit. The consolidated financial statements of Center Bancorp, Inc. and subsidiaries as of December 31, 2005 and for the two years then ended, were audited by other auditors whose report thereon, dated March 8, 2006, expressed an unqualified opinion.
We conducted our audits in accordance with the standards of the Public Company Accounting Oversight Board (United States). Those standards require that we plan and perform the audit to obtain reasonable assurance about whether the financial statements are free of material misstatement. An audit includes examining, on a test basis, evidence supporting the amounts and disclosures in the financial statements. An audit also includes assessing the accounting principles used and significant estimates made by management, as well as evaluating the overall financial statement presentation. We believe that our audit provides a reasonable basis for our opinion.
In our opinion, the consolidated financial statements referred to above present fairly, in all material respects, the financial position of Center Bancorp, Inc. and subsidiaries as of December 31, 2006 and the results of their operations and their cash flows for the year ended December 31, 2006 in conformity with accounting principles generally accepted in the United States of America.
As discussed in Note 1 to the consolidated financial statements, the Corporation changed its method of accounting for share-based payments in 2006. As discussed in Note 1 to the consolidated financial statements, the Corporation changed its method of accounting for Defined Benefit Pension and Other Postretirement Plans in 2006.
We also have audited, in accordance with the standards of the Public Company Accounting Oversight Board (United States), the effectiveness of Center Bancorp, Inc. and subsidiaries’ internal control over financial reporting as of December 31, 2006, based on criteria established in Internal Control — Integrated Framework issued by the Committee of Sponsoring Organizations of the Treadway Commission (COSO), and our report dated March 14, 2007 expressed an unqualified opinion on management’s assessment of internal control over financial reporting and an unqualified opinion on the effectiveness of internal control over financial reporting.
Beard Miller Company LLP
Reading, Pennsylvania
March 14, 2007
F-2
REPORT OF INDEPENDENT REGISTERED PUBLIC ACCOUNTING FIRM
The Board of Directors and Stockholders Center Bancorp, Inc.:
We have audited management’s assessment, included in the accompanying Management’s Report on Internal Control Over Financial Reporting that Center Bancorp, Inc. and subsidiaries (the Corporation) maintained effective internal control over financial reporting as of December 31, 2006, based on criteria established in Internal Control
— Integrated Framework issued by the Committee of Sponsoring Organizations of the Treadway Commission (COSO). The Corporation’s management is responsible for maintaining effective internal control over financial reporting and for its assessment of the effectiveness of internal control over financial reporting. Our responsibility is to express an opinion on management’s assessment and an opinion on the effectiveness of the Corporation’s internal control over financial reporting based on our audit.
We conducted our audit in accordance with the standards of the Public Company Accounting Oversight Board (United States). Those standards require that we plan and perform the audit to obtain reasonable assurance about whether effective internal control over financial reporting was maintained in all material respects. Our audit included obtaining an understanding of internal control over financial reporting, evaluating management’s assessment, testing and evaluating the design and operating effectiveness of internal control, and performing such other procedures as we considered necessary in the circumstances. We believe that our audit provides a reasonable basis for our opinion.
A company’s internal control over financial reporting is a process designed to provide reasonable assurance regarding the reliability of financial reporting and the preparation of financial statements for external purposes in accordance with accounting principles generally accepted in the United States of America. A company’s internal control over financial reporting includes those policies and procedures that (1) pertain to the maintenance of records that, in reasonable detail, accurately and fairly reflect the transactions and dispositions of the assets of the company; (2) provide reasonable assurance that transactions are recorded as necessary to permit preparation of financial statements in accordance with accounting principles generally accepted in the United States of America, and that receipts and expenditures of the company are being made only in accordance with authorizations of management and directors of the company; and (3) provide reasonable assurance regarding prevention or timely detection of unauthorized acquisition, use, or disposition of the company’s assets that could have a material effect on the financial statements.
Because of its inherent limitations, internal control over financial reporting may not prevent or detect misstatements. Also, projections of any evaluation of effectiveness to future periods are subject to the risk that controls may become inadequate because of changes in conditions, or that the degree of compliance with the policies or procedures may deteriorate.
In our opinion, management’s assessment that Center Bancorp, Inc. maintained effective internal control over financial reporting as of December 31, 2006, is fairly stated, in all material respects, based on the criteria established in Internal Control – Integrated Framework issued by the Committee of Sponsoring Organizations of the Treadway Commission (COSO). Also, in our opinion, Center Bancorp, Inc. maintained, in all material respects, effective internal control over financial reporting as of December 31, 2006, based on the COSO criteria established in Internal Control — Integrated Framework issued by the Committee of Sponsoring Organizations of the Treadway Commission (COSO).
We also have audited, in accordance with the standards of the Public Company Accounting Oversight Board (United States), the consolidated statement of condition of Center Bancorp, Inc. and subsidiaries as of December 31, 2006, and the related consolidated statement of income, changes in stockholders’ equity and cash flows for the year ended December 31, 2006 and our report dated March 14, 2007 expressed an unqualified opinion.
Beard Miller Company LLP
Reading, Pennsylvania
March 14, 2007
F-3
REPORT OF INDEPENDENT REGISTERED PUBLIC ACCOUNTING FIRM
The Board of Directors and Stockholders
Center Bancorp, Inc.:
We have audited the accompanying consolidated statement of condition of Center Bancorp, Inc. and subsidiaries (the “Corporation”) as of December 31, 2005, and the related consolidated statements of income, changes in stockholders’ equity, and cash flows for each of the years in the two-year period ended December 31, 2005. These consolidated financial statements are the responsibility of the Corporation’s management. Our responsibility is to express an opinion on these consolidated financial statements based on our audits.
We conducted our audits in accordance with the standards of the Public Company Accounting Oversight Board (United States). Those standards require that we plan and perform the audit to obtain reasonable assurance about whether the financial statements are free of material misstatement. An audit includes examining, on a test basis, evidence supporting the amounts and disclosures in the financial statements. An audit also includes assessing the accounting principles used and significant estimates made by management, as well as evaluating the overall financial statement presentation. We believe that our audits provide a reasonable basis for our opinion.
In our opinion, the consolidated financial statements referred to above present fairly, in all material respects, the financial position of Center Bancorp, Inc. and subsidiaries as of December 31, 2005, and the results of their operations and their cash flows for each of the years in the two-year period ended December 31, 2005, in conformity with U.S. generally accepted accounting principles.
/s/ KPMG LLP
Short Hills, New Jersey
March 14, 2006
F-4
MANAGEMENT’S REPORT ON INTERNAL CONTROL OVER FINANCIAL REPORTING
The Corporation’s management is responsible for establishing and maintaining adequate internal control over financial reporting as defined in Rules 13a-15(f) of the Exchange Act. The Corporation’s internal control system is a process designed to provide reasonable assurance to the Corporation’s management, Board of Directors and shareholders regarding the reliability of financial reporting and the preparation and fair presentation of financial statements for external reporting purposes in accordance with U.S. generally accepted accounting principles. Our internal control over financial reporting includes policies and procedures that pertain to the maintenance of records that, in reasonable detail, accurately and fairly reflect transactions and dispositions of assets; provide reasonable assurances that transactions are recorded as necessary to permit preparation of financial statements in accordance with U.S. generally accepted accounting principles and that receipts and expenditures are being made only in accordance with authorizations of management and the directors of the Corporation; and provide reasonable assurance regarding prevention or timely detection of unauthorized acquisition, use or disposition of the Corporation’s assets that could have a material effect on our financial statements.
All internal control systems, no matter how well designed, have inherent limitations. Therefore, even those systems determined to be effective can provide only reasonable assurance with respect to financial statement preparation and presentation. Also, projections of any evaluation of effectiveness to future periods are subject to the risk that controls may become inadequate because of changes in conditions, or that the degree of compliance with the policies or procedures may deteriorate.
As part of the Corporation’s program to comply with Section 404 of the Sarbanes-Oxley Act of 2002, our management assessed the effectiveness of the Corporation’s internal control over financial reporting as of December 31, 2006. In making this assessment, management used the control criteria framework of the Committee of Sponsoring Organizations (“COSO”) of the Treadway Commission published in its report entitled Internal Control — Integrated Framework. Management’s assessment included an evaluation of the design of the Corporation’s internal control over financial reporting and testing of the operational effectiveness of its internal control over financial reporting. Management reviewed the results of its assessment with the Audit Committee.
Based on this assessment, management determined that, as of December 31, 2006, the Corporation’s internal control over financial reporting was effective to provide reasonable assurance regarding the reliability of financial reporting and the preparation of financial statements for external purposes in accordance with accounting principles generally accepted in the United States of America.
Beard Miller Company LLP, the independent registered public accounting firm that audited the Corporation’s consolidated financial statements included in this Annual Report on Form 10-K, has issued an audit report on management’s assessment of the effectiveness of the Corporation’s internal control over financial reporting as of December 31, 2006. The report, which expresses opinions on management’s assessment and on the effectiveness of the Corporation’s internal control over financial reporting as of December 31, 2006, is included in this item under the heading “Report of Independent Registered Public Accounting Firm.”
CENTER BANCORP, INC.
| | | | |
Signature | | Title | | Date |
| | | | |
| /s/ John J. Davis | | President and Chief Executive Officer | | March 14, 2007 |
| John J. Davis | | | | |
| | | |
| /s/ Anthony C. Weagley | Treasurer and Chief Financial Officer | March 14, 2007 |
| Anthony C. Weagley | | |
| | | |
F-5
CENTER BANCORP, INC AND SUBSIDIARIES CONSOLIDATED STATEMENTS OF CONDITION
| | | | | | | |
| | | December 31, | |
| | | 2006 | | 2005 | |
| | | (Dollars in Thousands) | |
ASSETS | | | | | | | |
| Cash and due from banks (Note 6) | | $ | 34,088 | | $ | 19,343 | |
| Federal funds sold and securities purchased under agreement to resell | | | 10,275 | | | — | |
| Total cash and cash equivalents | | | 44,363 | | | 19,343 | |
| Investment securities available-for-sale | | | 250,603 | | | 377,216 | |
| Investment securities held to maturity (approximate market value of $130,900 in 2006 and $140,628 in 2005) | | | 131,130 | | | 140,514 | |
| Total investment securities (Notes 7 and 10) | | | 381,733 | | | 517,730 | |
| Loans, net of unearned income (Note 8) | | | 550,414 | | | 505,826 | |
| Less – Allowance for loan losses (Note 8) | | | 4,960 | | | 4,937 | |
| Net loans | | | 545,454 | | | 500,889 | |
| Restricted investment in bank stocks, at cost | | | 7,805 | | | 10,954 | |
| Premises and equipment, net (Note 9) | | | 18,829 | | | 18,343 | |
| Accrued interest receivable | | | 4,932 | | | 5,875 | |
| Bank owned life insurance (Note 1) | | | 21,368 | | | 18,588 | |
| Other assets (Note 12) | | | 9,588 | | | 5,670 | |
| Goodwill and other intangible assets (Note 3) | | | 17,312 | | | 17,437 | |
Total assets | | $ | 1,051,384 | | $ | 1,114,829 | |
| | | | | | | | |
LIABILITIES | | | | | | | |
| Deposits: | | | | | | | |
| Non-interest-bearing | | $ | 136,453 | | $ | 139,911 | |
| Interest-bearing: | | | | | | | |
| Time deposits $100 and over ( Note 16) | | | 83,623 | | | 154,409 | |
| Interest-bearing transaction, savings and time deposits $100 and less | | | 506,695 | | | 406,281 | |
| Total deposits | | | 726,771 | | | 700,601 | |
| Overnight Federal funds and securities sold under agreement to repurchase (Note 10) | | | 29,443 | | | 98,193 | |
| Short-term borrowings (Note 10) | | | 2,000 | | | 23,900 | |
| Long-term borrowings (Note 10) | | | 174,991 | | | 171,870 | |
| Subordinated debentures (Note 14) | | | 5,155 | | | 15,465 | |
| Accounts payable and accrued liabilities (Notes 11 and 12) | | | 15,411 | | | 5,311 | |
| Total liabilities | | | 953,771 | | | 1,015,340 | |
Commitments and contingencies (Note 19) | | | | | | | |
| | | | | | | | |
STOCKHOLDERS’ EQUITY (Notes 2, 5, 13 and 18) | | | | | | | |
| Preferred Stock, no par value: | | | | | | | |
| Authorized 5,000,000 shares; none issued | | | — | | | — | |
| Common stock, no par value: | | | | | | | |
| Authorized 20,000,000 shares; issued 14,467,962 shares at December 31, 2006 and 2005; outstanding 13,248,406 and 13,431,628 shares at December 31, 2006 and 2005, respectively | | | 65,592 | | | 65,592 | |
| Additional paid-in capital | | | 4,535 | | | 3,787 | |
| Retained earnings | | | 37,527 | | | 38,453 | |
| Treasury stock, at cost (1,219,556 and 1,036,334 shares in 2006 and 2005, respectively) | | | (6,631 | ) | | (3,701 | ) |
| Accumulated other comprehensive loss | | | (3,410 | ) | | (4,642) | |
Total stockholders’ equity | | | 97,613 | | | 99,489 | |
Total liabilities and stockholders’ equity | | $ | 1,051,384 | | $ | 1,114,829 | |
See the accompanying notes to the consolidated financial statements.
F-6
CENTER BANCORP, INC. AND SUBSIDIARIES CONSOLIDATED STATEMENTS OF INCOME
| | | | | | | | | | |
| | | Years Ended December 31, | |
| | | 2006 | | 2005 | | 2004 | |
| | | (Dollars in Thousands, Except Per Share Data) | |
| Interest income: | | | |
| Interest and fees on loans | | $ | 31,999 | | $ | 25,329 | | $ | 18,529 | |
| Interest and dividends on investment securities: | | | | | | | | | | |
| Taxable interest income | | | 15,521 | | | 18,849 | | | 16,459 | |
| Non-taxable interest income | | | 3,874 | | | 4,001 | | | 3,596 | |
| Dividends | | | 1,384 | | | 2,295 | | | 1,465 | |
| Interest on federal funds sold and securities purchased under agreement to resell | | | 547 | | | 29 | | | — | |
| Total interest income | | | 53,325 | | | 50,503 | | | 40,049 | |
| Interest expense: | | | | | | | | | | |
| Interest on certificates of deposit $100 and over | | | 4,930 | | | 3,828 | | | 1,278 | |
| Interest on other deposits | | | 13,075 | | | 7,771 | | | 6,137 | |
| Interest on borrowings | | | 10,969 | | | 11,697 | | | 6,553 | |
| Total interest expense | | | 28,974 | | | 23,296 | | | 13,968 | |
| Net interest income | | | 24,351 | | | 27,207 | | | 26,081 | |
| Provision for loan losses (Note 8) | | | 57 | | | — | | | 752 | |
| Net interest income, after provision for loan losses | | | 24,294 | | | 27,207 | | | 25,329 | |
| Other income: | | | | | | | | | | |
| Service charges, commissions and fees | | | 1,759 | | | 1,922 | | | 1,948 | |
| Other income | | | 454 | | | 631 | | | 499 | |
| Annuity and Insurance | | | 205 | | | 193 | | | 59 | |
| Bank owned life insurance (Note 1) | | | 780 | | | 740 | | | 734 | |
| Net gain (loss) on securities sold (Note 7) | | | (2,565 | ) | | 350 | | | 148 | |
| Total other income | | | 633 | | | 3,836 | | | 3,388 | |
| Other expense: | | | | | | | | | | |
| Salaries and employee benefits (Note 11 and 2) | | | 12,290 | | | 12,108 | | | 10,140 | |
| Occupancy, net (Note 9) | | | 2,309 | | | 2,165 | | | 1,943 | |
| Premises and equipment (Notes 9 and 19) | | | 1,940 | | | 1,990 | | | 1,852 | |
| Stationery and printing | | | 692 | | | 628 | | | 539 | |
| Marketing and advertising | | | 731 | | | 644 | | | 529 | |
| Computer expense | | | 741 | | | 594 | | | 451 | |
| Other | | | 5,655 | | | 4,084 | | | 4,017 | |
| Total other expense | | | 24,358 | | | 22,213 | | | 19,471 | |
| Income before income tax expense (benefit) | | | 569 | | | 8,830 | | | 9,246 | |
| Income tax expense (benefit) (Note 12) | | | (3,329 | ) | | 1,184 | | | 1,624 | |
| Net income | | $ | 3,898 | | $ | 7,646 | | $ | 7,622 | |
| Earnings per share: (Note 10) | | | | | | | | | | |
| Basic | | $ | .29 | | $ | .63 | | $ | .79 | |
| Diluted | | $ | .29 | | $ | .63 | | $ | .78 | |
| Weighted average common shares outstanding: | | | | | | | | | | |
| Basic | | | 13,294,937 | | | 12,074,870 | | | 9,679,880 | |
| Diluted | | | 13,371,750 | | | 12,119,291 | | | 9,737,706 | |
See the accompanying notes to the consolidated financial statements.
F-7
CENTER BANCORP, INC. AND SUBSIDIARIES CONSOLIDATED STATEMENTS OF CHANGES IN STOCKHOLDERS’ EQUITY
| | | | | | | | | | | | | | | | | | | | | | |
| | | Years Ended December 31, 2006, 2005, and 2004 | |
| | | Common
Stock
Amount | | Additional
Paid In
Capital | | Retained
Earnings | | Treasury
Stock | | Restricted
Stock | | Accumulated
Other
Comprehensive
Income (Loss) | | Total
Stock-
holders’
Equity | |
| | | (In Thousands, Except Share Data) | |
| | | | | | | | | | | | | | | | | | | | | | | |
Balance, December 31, 2003 | | $ | 19,405 | | $ | 4,677 | | $ | 33,268 | | $ | (3,978 | ) | $ | (14 | ) | $ | 822 | | $ | 54,180 | |
Cash dividends declared
($0.34 per share) | | | | | | | | | (3,238 | ) | | | | | | | | | | | (3,238 | ) |
| Private Placement: Common stock | | | 10,631 | | | (542 | ) | | (679 | ) | | | | | | | | | | | 9,410 | |
| Issuance of common stock | | | 405 | | | | | | | | | | | | | | | | | | 405 | |
| Exercise of stock options | | | | | | 342 | | | | | | 203 | | | | | | | | | 545 | |
| Restricted stock award | | | | | | | | | | | | | | | 14 | | | | | | 14 | |
| Net income | | | | | | | | | 7,622 | | | | | | | | | | | | 7,622 | |
| Other comprehensive (loss) | | | | | | | | | | | | | | | | | | (295 | ) | | (295 | ) |
Balance, December 31, 2004 | | $ | 30,441 | | $ | 4,477 | | $ | 36,973 | | $ | (3,775 | ) | $ | 0 | | $ | 527 | | $ | 68,643 | |
Cash dividends declared
($0.36 per share) | | | | | | | | | (4,518 | ) | | | | | | | | | | | (4,518 | ) |
| Private Placement: Common stock | | | 21,619 | | | (1,120 | ) | | (1,621 | ) | | | | | | | | | | | 18,878 | |
| Issuance of common stock | | | 255 | | | | | | (27 | ) | | | | | | | | | | | 228 | |
| Exercise of stock option | | | | | | 355 | | | | | | 44 | | | | | | | | | 399 | |
| Common stock issued in Red Oak Bank Acquisition | | | 13,277 | | | | | | | | | | | | | | | | | | 13,277 | |
| Restricted stock award | | | | | | 75 | | | | | | 30 | | | | | | | | | 105 | |
| Net income | | | | | | | | | 7,646 | | | | | | | | | | | | 7,646 | |
| Other comprehensive (loss) | | | | | | | | | | | | | | | | | | (5,169 | ) | | (5,169 | ) |
Balance, December 31, 2005 | | $ | 65,592 | | $ | 3,787 | | $ | 38,453 | | $ | (3,701 | ) | $ | 0 | | $ | (4,642 | ) | $ | 99,489 | |
Cash dividends declared
($0.36 per share) | | | | | | | | | (4,808 | ) | | | | | | | | | | | (4,808 | ) |
| Purchase of treasury stock | | | | | | | | | | | | (3,366) | | | | | | | | | (3,366 | ) |
| Issuance of common stock | | | | | | | | | (16 | ) | | | | | | | | | | | (16 | ) |
| Exercise of stock option | | | | | | 238 | | | | | | 436 | | | | | | | | | 674 | |
| Net impact to initially apply SFAS No. 158, net of income tax of ($543) | | | | | | | | | | | | | | | | | | (815 | ) | | (815 | ) |
| Stock based compensation | | | | | | 160 | | | | | | | | | | | | | | | 160 | |
| Tax benefit related to stock based-compensation | | | | | | 350 | | | | | | | | | | | | | | | 350 | |
| Net income | | | | | | | | | 3,898 | | | | | | | | | | | | 3,898 | |
| Other comprehensive income | | | | | | | | | | | | | | | | | | 2,047 | | | 2,047 | |
Balance, December 31, 2006 | | $ | 65,592 | | $ | 4,535 | | $ | 37,527 | | $ | (6,631 | ) | $ | 0 | | $ | (3,410 | ) | $ | 97,613 | |
See the accompanying notes to the consolidated financial statements.
F-8
CENTER BANCORP, INC AND SUBSIDIARIES CONSOLIDATED STATEMENTS OF CASH FLOWS
| | | | | | | | | | |
| | | Years Ended December 31, | |
| | | 2006 | | 2005 | | 2004 | |
| | | (Dollars In Thousands) | |
CASH FLOWS FROM OPERATING ACTIVITIES: | | | | | | | |
| Net income | | $ | 3,898 | | $ | 7,646 | | $ | 7,622 | |
Adjustments to Reconcile Net Income to Net Cash Provided by Operating Activities: | | | | | | | | | | |
| Depreciation and amortization | | | 1,852 | | | 1,827 | | | 1,580 | |
| Provision for loan losses | | | 57 | | | — | | | 752 | |
| Provision for deferred taxes | | | 5,280 | | | 4,628 | | | 106 | |
| Stock-based compensation expense | | | 160 | | | — | | | — | |
| Net losses (gains) on sale of investment securities available-for-sale | | | 2,660 | | | (350 | ) | | (148 | ) |
| Net gains on sale of investment securities held-to-maturity | | | (95 | ) | | — | | | — | |
| Decrease (increase) in accrued interest receivable | | | 943 | | | (1,342 | ) | | (48 | ) |
| Increase in other assets | | | (9,519 | ) | | (3,097 | ) | | (890 | ) |
| Increase (decrease) in other liabilities | | | 881 | | | (1,758 | ) | | 1,279 | |
| Increase in cash surrender value of bank owned life insurance | | | (780 | ) | | (740 | ) | | (734 | ) |
| Amortization of premium and accretion of discount on investment securities, net | | | 210 | | | 452 | | | 656 | |
Net cash provided by operating activities | | | 5,547 | | | 7,266 | | | 10,175 | |
CASH FLOWS FROM INVESTING ACTIVITIES: | | | | | | | | | | |
| Proceeds from maturities of investment securities available-for-sale | | | 220,415 | | | 300,541 | | | 149,951 | |
| Proceeds from maturities, calls and paydowns of securities held to maturity | | | 10,793 | | | 32,315 | | | 37,902 | |
| Net (purchases) sales of restricted investment in bank stock | | | 3,149 | | | (3,589 | ) | | (200 | ) |
| Proceeds from sales of investment securities available-for-sale | | | 188,018 | | | 59,427 | | | 52,524 | |
| Proceeds from sales of investment securities held to maturity | | | 517 | | | — | | | — | |
| Purchase of securities available-for-sale | | | (273,744 | ) | | (297,133 | ) | | (292,397 | ) |
| Purchase of securities held to maturity | | | (2,000 | ) | | (44,089 | ) | | (7,445 | ) |
| Net increase in loans | | | (44,622 | ) | | (37,741 | ) | | (27,000 | ) |
| Property and equipment expenditures, net | | | (2,218 | ) | | (1,997 | ) | | (3,592 | ) |
| Cash consideration paid to acquire Red Oak Bank | | | — | | | (13,279 | ) | | — | |
| Cash and cash equivalents acquired from Red Oak Bank | | | — | | | 2,433 | | | — | |
| Purchase of bank owned life insurance | | | (2,000 | ) | | — | | | (2,500 | ) |
Net cash provided by (used in) investing activities | | | 98,308 | | | (3,112 | ) | | (92,757 | ) |
CASH FLOWS FROM FINANCING ACTIVITIES: | | | | | | | | | | |
| Net (decrease) increase in deposits | | | 26,170 | | | (72,346 | ) | | 69,351 | |
| Net (decrease) increase in short-term borrowings | | | (13,102 | ) | | 26,735 | | | 1,633 | |
| Proceeds from FHLB advances | | | 20,000 | | | 192,439 | | | 50,000 | |
| Payment on FHLB advances | | | (94,427 | ) | | (158,659 | ) | | (50,000 | ) |
| Redemption of subordinated debentures | | | (10,310 | ) | | — | | | — | |
| Dividends paid | | | (4,808 | ) | | (4,518 | ) | | (3,238 | ) |
| Proceeds from issuance of common stock | | | (16 | ) | | 19,106 | | | 10,360 | |
| Tax benefits from stock based compensation | | | 350 | | | — | | | — | |
| Exercise of stock options | | | 674 | | | 399 | | | — | |
| Purchase of treasury stock | | | (3,366 | ) | | — | | | — | |
Net cash (used in) provided by financing activities | | | (78,835 | ) | | 3,156 | | | 78,106 | |
| Net increase (decrease) in cash and cash equivalents | | | 25,020 | | | 7,310 | | | (4,476 | ) |
| Cash and cash equivalents at beginning of year | | | 19,343 | | | 12,033 | | | 16,509 | |
| Cash and cash equivalents at end of year | | $ | 44,363 | | $ | 19,343 | | $ | 12,033 | |
SUPPLEMENTAL DISCLOSURES OF CASH FLOW INFORMATION: | | | | | | | | | | |
| Noncash investment activities: | | | | | | | | | | |
| Trade date accounting settlement for investments | | $ | 8,083 | | $ | — | | $ | — | |
| Cash paid during year for: | | | | | | | | | | |
| Interest paid on deposits and borrowings | | $ | 28,594 | | $ | 23,228 | | $ | 13,921 | |
| Income taxes | | $ | 297 | | $ | 1,221 | | $ | 1,650 | |
SUPPLEMENTAL DISCLOSURES OF CASH FLOW INFORMATION AT DATE OF ACQUISITION: | | | | | | | | | | |
| Fair Value of assets acquired | | $ | — | | $ | 115,307 | | $ | — | |
| Goodwill and deposit intangible | | $ | — | | $ | 15,416 | | $ | — | |
| Liabilities assumed | | $ | — | | $ | 88,556 | | $ | — | |
| Common stock issued for the Red Oak Bank acquisition, net | | $ | — | | $ | 13,277 | | $ | — | |
See the accompanying notes to the consolidated financial statements.
F-9
CENTER BANCORP, INC AND SUBSIDIARIES NOTES TO CONSOLIDATED FINANCIAL STATEMENTS
Note 1 — Summary of Significant Accounting Policies
Principles of Consolidation
The consolidated financial statements of Center Bancorp, Inc. (the “Parent Corporation”) are prepared on the accrual basis and include the accounts of the Parent Corporation and its wholly owned subsidiary, Union Center National Bank (the “Bank” and collectively with the Parent Corporation and its other direct and indirect subsidiaries, the “Corporation”). All significant inter-company accounts and transactions have been eliminated from the accompanying consolidated financial statements.
Business
The Parent Corporation is a bank holding company whose principal activity is the ownership and management of Union Center National Bank as mentioned above. The Bank provides a full range of banking services to individual and corporate customers through branch locations in Union and Morris counties, New Jersey. Additionally, the Bank originates residential mortgage loans and services such loans for others. The Bank is subject to competition from other financial institutions and the regulations of certain federal and state agencies and undergoes periodic examinations by those regulatory authorities.
Basis of Financial Statement Presentation
The consolidated financial statements have been prepared in conformity with U.S. generally accepted accounting principles.
Use of Estimates
In preparing the consolidated financial statements, management is required to make estimates and assumptions that affect the reported amounts of assets and liabilities as of the date of the statement of condition and revenues and expenses for the reported periods. Actual results could differ significantly from those estimates.
Cash and Cash Equivalents
Cash and cash equivalents include cash on hand, cash and due from banks, and federal funds sold and securities purchased under agreement to resell which are generally available within one day.
Investment Securities
The Corporation accounts for its investment securities in accordance with Statement of Financial Accounting Standards (“SFAS”) No. 115 “Accounting for Certain Investment in Debt and Equity Securities.” Investments are classified into the following categories: (1) held to maturity securities, for which the Corporation has both the positive intent and ability to hold until maturity, which are reported at amortized cost; (2) trading securities, which are purchased and held principally for the purpose of selling in the near term and are reported at fair value with unrealized gains and losses included in earnings; and (3) available-for-sale securities, which do not meet the criteria of the other two categories and which management believes may be sold prior to maturity due to changes in interest rates, prepayment, risk, liquidity or other factors, and are reported at fair value, with unrealized gains and losses, net of applicable income taxes, reported as a component of accumulated other comprehensive income, which is included in stockholders’ equity and excluded from earnings.
Investment securities are adjusted for amortization of premiums and accretion of discounts, which are recognized on a level yield method, as adjustments to interest income. Investment securities gains or losses are determined using the specific identification method.
The Bank adopted the disclosure requirements of EITF 03-1 “The Meaning of other than Temporary Impairment and its Application to Certain Investments” as of December 31, 2004. EITF 03-1 includes certain disclosures regarding quantitative and qualitative disclosures for investment securities accounted for under FASB 115, “Accounting for Certain Investments in Debt and Equity Securities” that are impaired at the balance sheet date, but an other-than temporary impairment has not been recognized.
F-10
CENTER BANCORP, INC AND SUBSIDIARIES
NOTES TO CONSOLIDATED FINANCIAL STATEMENTS
Note 1 — Summary of Significant Accounting Policies – (continued)
Loans
Loans are stated at their principal amounts less net deferred loan origination fees. Interest income is credited as earned except when a loan becomes past due 90 days or more and doubt exists as to the ultimate collection of interest or principal; in those cases the recognition of income is discontinued. When a loan is placed on non-accrual status, interest accruals cease and uncollected accrued interest is reversed and charged against current income.
Payments received on non-accrual loans are applied against principal. A loan may only be restored to an accruing basis when it again becomes well secured and in the process of collection or all past due amounts have been collected. Loan origination fees and certain direct loan origination costs are deferred and recognized over the life of the loan as an adjustment to the loan’s yield using the level yield method.
Allowance for Loan Losses
The allowance for loan losses (“allowance”) is maintained at a level determined adequate to provide for potential loan losses. The allowance is increased by provisions charged to operations and reduced by loan charge-offs, net of recoveries. The allowance is based on management’s evaluation of the loan portfolio considering economic conditions, the volume and nature of the loan portfolio, historical loan loss experience and individual credit situations.
Material estimates that are particularly susceptible to significant change in the near-term relate to the determination of the allowance for loan losses. In connection with the determination of the allowance for loan losses, management obtains independent appraisals for significant properties.
The ultimate collectability of a substantial portion of the Bank’s loan portfolio is susceptible to changes in the real estate market and economic conditions in the State of New Jersey and the impact of such conditions on the creditworthiness of the borrowers.
Management believes that the allowance for loan losses is adequate. While management uses available information to recognize loan losses, future additions to the allowance may be necessary based on changes in economic conditions. In addition, various regulatory agencies, as an integral part of their examination process, periodically review the Bank’s allowance for loan losses. Such agencies may require the Bank to recognize additions to the allowance based on their judgments about information available to them at the time of their examinations.
The Corporation accounts for impaired loans in accordance with SFAS No. 114 “Accounting by Creditors for Impairment of a Loan”, as amended by SFAS No. 118 “Accounting by Creditors for Impairment of a Loan — Income Recognition and Disclosures.” The value of impaired loans is based on the present value of expected future cash flows discounted at the loan’s effective interest rate or, as a practical expedient, at the loan’s observable market price or at the fair value of the collateral if the loan is collateral dependent.
The Corporation has defined its population of impaired loans to include, at a minimum, non-accrual loans and loans internally classified as substandard or below, in each instance above an established dollar threshold of $200,000. All loans below the established dollar threshold are considered homogenous and are collectively evaluated for impairment.
Reserve for Unfunded Commitments
The reserve for unfunded commitments is maintained at a level believed by management to be sufficient to absorb estimated probable losses related to unfunded credit facilities and is included in other liabilities in the consolidated statements of condition. The determination of the adequacy of the reserve is based upon an evaluation of the unfunded credit facilities, including an assessment of historical commitment utilization experience, and credit risk. Net adjustments to the reserve for unfunded commitments are included in non-interest expense.
F-11
CENTER BANCORP, INC AND SUBSIDIARIES
NOTES TO CONSOLIDATED FINANCIAL STATEMENTS
Note 1 — Summary of Significant Accounting Policies – (continued)
Premises and Equipment
Land is carried at cost and bank premises and equipment at cost less accumulated depreciation based on estimated useful lives of assets, computed principally on a straight-line basis. Expenditures for maintenance and repairs are charged to operations as incurred; major renewals and betterments are capitalized. Gains and losses on sales or other dispositions are recorded as a component of other income or other expenses.
Other Real Estate Owned
Other real estate owned (“OREO”), representing property acquired through foreclosure are held for sale and are initially recorded at fair value less cost to sell at the date of foreclosure, establishing a new cost basis. Subsequent to foreclosures, valuations are periodically performed by management and the assets are carried at the lower of carrying amount or fair value less cost to sell. Costs relating to holding the assets are charged to expenses.
Mortgage Servicing
The Corporation performs various servicing functions on loans owned by others. A fee, usually based on a percentage of the outstanding principal balance of the loan, is received for those services. At December 31, 2006 and 2005, the Corporation was servicing approximately $13.4 million and $15.0 million, respectively, of loans for others.
The Corporation accounts for its transfers and servicing of financial assets in accordance with SFAS No. 140, “Accounting for Transfers and Servicing of Financial Assets and Extinguishments of Liabilities.” The Corporation originates mortgages under plans to sell those loans and service the loans owned by the investor. The Corporation records mortgage servicing rights and the loans based on relative fair values at the date of sale. The balance of mortgage servicing rights at December 31, 2006 and 2005 are immaterial to the consolidated financial statements.
Loans Held for Sale
Mortgage loans originated and intended for sale in the secondary market are carried at the lower of aggregated costs or estimated fair value. Gains and losses on sales of loans are also accounted for in accordance with SFAS No. 134 “Accounting for Mortgage Securities retained after Securitizations or Mortgage Loans Held for Sale by a Mortgage Banking Enterprise.” At December 31, 2006, the Corporation held approximately $1.5 million in loans held for sale and held none at December 31, 2005.
Employee Benefit Plans
The Corporation has a non-contributory pension plan covering all eligible employees. The Corporation’s policy is to fund at least the minimum contribution required by the Employee Retirement Income Security Act of 1974. The costs associated with the plan are accrued based on actuarial assumptions and included in non-interest expense.
The Corporation follows the disclosure provisions of SFAS No. 132 “Employers” Disclosures about Pensions and Other Post Retirement Benefits which was revised in December 2004. SFAS No. 132 as revised, which required additional employers’ disclosures about pension and other post retirement benefit plans after December 31, 2004. Certain disclosures related to estimated future benefit payments are effective for fiscal years ended after June 15, 2005. Net pension expense consists of service costs, interest cost, return on pension assets and amortization of unrecognized initial net assets.
SFAS No. 158
In September 2006, the FASB issued SFAS No. 158, “Employers’ Accounting for Defined Benefit Pension and Other Postretirement Plans — An Amendment of FASB No. 87, 88, 106 and 132(R)” (“SFAS 158”). SFAS 158 requires that the funded status of defined benefit postretirement plans be recognized on the company’s balance sheet, and changes in the funded status be reflected in other comprehensive income, effective for fiscal years ending after
F-12
CENTER BANCORP, INC AND SUBSIDIARIES
NOTES TO CONSOLIDATED FINANCIAL STATEMENTS
Note 1 — Summary of Significant Accounting Policies – (continued)
December 15, 2006. SFAS 158 also requires companies to measure the funded status of the plan as of the date of its fiscal year-end, effective for fiscal years ending after December 15, 2008. The Corporation expects to adopt the measurement provisions of SFAS 158 effective December 31, 2009. Based upon the December 31, 2006 balance sheet and pension disclosures, the impact of adopting SFAS 158 resulted in a pretax increase in the accumulated other comprehensive loss of $815,000.
Stock-Based Compensation
Effective January 1, 2006, the Corporation adopted the fair value recognition provisions of Statement of Financial Accounting Standards (“SFAS”) No. 123R using the modified prospective transition method and therefore has not restated results for prior periods. Under this transition method, stock-based compensation expense for the twelve-months ended December 31, 2006 includes compensation expense for all stock-based compensation awards granted, but not yet vested, as of December 31, 2005, based on the grant date fair value estimated in accordance with the original provisions of SFAS No. 123 “Accounting for stock-based compensation”. The stock-based compensation expense for all stock-based compensation awards granted after that date is based on the grant-date fair value estimated in accordance with the provisions of SFAS No. 123R. The Corporation will recognize these expenses on a straight-line method over the requisite service period of the stock award, which is the vesting term. Prior to the adoption of SFAS No. 123R, the Corporation recognized stock-based compensation expense in accordance with APB Opinion No. 25. Prior to the adoption of SFAS No. 123R, the Corporation presented all tax benefits of deductions resulting from the exercise of stock options or the issuance of shares under other stock based compensation programs as operating cash flows in the statement of cash flow. SFAS No. 123 requires the cash flows resulting from the tax benefits of deductions in excess of the compensation cost be recognized for stock-based awards to be classified as financing cash flows. In March of 2005, the Securities and Exchange Commission (the “SEC”) issued a Staff Accounting Bulletin No. 107 (“SAB 107”) regarding the SEC’s interpretation of SFAS No. 123R and the valuation of share-based payments for public companies. The Corporation has applied the provisions of SAB 107 in its adoption of SFAS No. 123R. See Note 2 and 11 of the Consolidated Financial Statements for a further discussion.
Earnings Per Share
Basic Earnings per Share (“EPS”) is computed by dividing income available to common shareholders by the weighted-average number of common shares outstanding. Diluted EPS includes any additional common shares as if all potentially dilutive common shares were issued (e.g. stock options). The Corporation’s weighted average common shares outstanding for diluted EPS include the effect of stock options outstanding using the Treasury Stock Method, which are not included in the calculation of basic EPS.
Earnings per common share have been computed based on the following:
| | | | | | | | | | |
| | | Years Ended December 31, | |
| | | 2006 | | 2005 | | 2004 | |
| | | (In Thousands, Except Per Share Amounts) | |
| | | | | | | | | | | |
| Net income | | $ | 3,898 | | $ | 7,646 | | $ | 7,622 | |
| Average number of common shares outstanding | | | 13,295 | | | 12,075 | | | 9,680 | |
| Effect of dilutive options | | | 77 | | | 44 | | | 57 | |
| Effect of restricted stock awards | | | 0 | | | 0 | | | 1 | |
| Average number of common shares outstanding used to calculate diluted earnings per common share | | | 13,372 | | | 12,119 | | | 9,738 | |
| Net income per share | | | | | | | | | | |
| Basic | | $ | .29 | | $ | .63 | | $ | .79 | |
| Diluted | | $ | .29 | | $ | .63 | | $ | .78 | |
F-13
CENTER BANCORP, INC AND SUBSIDIARIES
NOTES TO CONSOLIDATED FINANCIAL STATEMENTS
Note 1 — Summary of Significant Accounting Policies – (continued)
Treasury Stock
The Corporation announced on March 27, 2006 that its Board of Directors approved an increase in its current share buyback program to 5% of outstanding shares, enhancing its current authorization by 405,548 shares. The total buyback authorization was increased to 671,802 shares. Repurchases may be made from time to time as, in the opinion of management, market conditions warrant, in the open market or in privately negotiated transactions. Shares repurchased will be added to the corporate treasury and will be used for future stock dividends and other issuances. As of December 31, 2006, Center Bancorp had 13.2 million shares of common stock outstanding. As of December 31, 2006, the Corporation has purchased 326,908 common shares at an average cost per share of $11.95 under the stock buyback program amended on March 27, 2006. The repurchased shares were recorded as Treasury Stock, which resulted in a decrease in stockholders’ equity.
Treasury stock is recorded using the cost method and accordingly is presented as a reduction of stockholders’ equity.
Goodwill
Goodwill represents the excess of the cost of an acquisition over fair value of net assets required. Goodwill is at least tested annually for impairment. No impairment of goodwill was recorded for the years ended December 31, 2006 and 2005.
Comprehensive Income
Total comprehensive income includes all changes in equity during a period from transactions and other events and circumstances from non-owner sources. The Corporation’s other comprehensive income is comprised of unrealized holding gains and losses on securities available-for-sale and an additional minimum pension liability.
Disclosure of comprehensive income for the years ended 2006, 2005, and 2004 is presented in the Consolidated Statements of Changes in Stockholders’ Equity and presented in detail in Note 5.
Bank Owned Life Insurance
During 2001, the Corporation invested $12.5 million in Bank Owned Life Insurance (“BOLI”) to help offset the rising cost of employee benefits, and made subsequent investments in 2006 of $2.0 million and $2.5 million in 2004. The change in the cash surrender value of the BOLI was recorded as a component of other income and amounted to $780,000 in 2006, $740,000 in 2005 and $734,000 in 2004.
Income Taxes
The Corporation recognizes deferred tax liabilities and assets for the expected future tax consequences of events that have been included in the financial statements or tax returns. Under this method, deferred tax liabilities and assets are determined based on the difference between financial statement and tax bases of assets and liabilities, using enacted tax rates expected to be applied to taxable income in the years in which the differences are expected to be settled.
Advertising Costs
The Corporation recognizes its marketing and advertising cost as incurred. Advertising costs were $731,000, $644,000 and $529,000 for the years ended December 31, 2006, 2005 and 2004, respectively.
F-14
CENTER BANCORP, INC AND SUBSIDIARIES
NOTES TO CONSOLIDATED FINANCIAL STATEMENTS
Note 1 — Summary of Significant Accounting Policies – (continued)
Reclassifications
Certain reclassifications have been made in the consolidated financial statements for 2005 and 2004 to conform to the classifications presented in 2006.
Note 2 — Stock Based Compensation
At December 31, 2006, the Corporation has four stock-based compensation plans, which are described more fully below. Through December 31, 2005, the Corporation accounted for those plans under the recognition and measurement principles of APB Opinion No. 25, “Accounting for Stock Issued to Employees, and related interpretations.” No stock-based employee compensation cost related to stock options is reflected in net income for the years ended December 31, 2004 and 2005, as all options granted under those plans had an exercise price equal to the market value of the underlying common stock on the date of grant.
Stock Option Plans
At December 31 2006, the Corporation maintained two stock-based compensation plans from which new grants could be issued. The Corporation’s Stock Option Plans permit Parent Corporation common stock to be issued to key employees and directors of the Corporation and its subsidiaries. The options granted under the plans are intended to be either Incentive Stock Options or Non-qualified Options. Under the 1999 Employee Stock Incentive Plan, an aggregate of 217,291 shares remain available under the plan and are authorized for issuance. Under the 2004 Non-Employee Director Stock Option Plan an aggregate total of 455,170 shares remain. Such shares may be treasury shares, newly issued shares or a combination thereof.
Options have been granted to purchase common stock principally at the fair market value of the stock at the date of grant. Options are exercisable starting one year after the date of grant and generally expire ten years from the date of grant.
The following table illustrates the effect on net income and earnings per share if the Corporation had applied the fair value recognition provisions of FASB Statement No. 123R, accounting for Stock-Based Compensation, to the Corporation’s stock option plans for the years ended December 31, 2004 and 2005.
| | | | | | | |
| | | Years Ended December 31, | |
| | | 2005 | | 2004 | |
| | | (In Thousands, Except Per Share Amounts) | |
| | | | | | | | |
| Net Income, as reported | | $ | 7,646 | | $ | 7,622 | |
| Add: compensation expense recognized for restricted stock award, net of related tax effect | | $ | 69 | | $ | 9 | |
| Deduct: Total Stock-based employee compensation expense determined under fair value based method for all awards, net of related tax effects | | | 462 | | | 101 | |
| Pro forma net income | | $ | 7,253 | | $ | 7,530 | |
| Earnings per share: | | | | | | | |
| Basic – as reported | | $ | .63 | | $ | .79 | |
| Basic – pro forma | | $ | .60 | | $ | .78 | |
| Diluted – as reported | | $ | .63 | | $ | .78 | |
| Diluted – pro forma | | $ | .60 | | $ | .77 | |
F-15
CENTER BANCORP, INC AND SUBSIDIARIES
NOTES TO CONSOLIDATED FINANCIAL STATEMENTS
Note 2 — Stock Based Compensation – (continued)
The total compensation expense related to equity compensation plans was $160,000 for the twelve months ended December 31 2006. Prior to December 31, 2005, the Corporation accounted for those plans under the recognition and measurement provisions of APB 25. Accordingly, the Corporation generally recognized compensation expense only when it granted options with a discounted exercise price. As a result, during that period, no stock-based employee compensation expense or any resulting compensation expense was recognized ratably over the associated service period, which was generally the option vesting term.
Effective January 1, 2006, the Corporation adopted the fair value recognition provisions of SFAS No. 123R, using the modified prospective transition method and therefore has not restated prior period results. Under this transition method, stock-based compensation expense for the twelve-months of fiscal 2006 included compensation expense for all stock-based compensation awards granted prior to, but not yet vested as of, December 31, 2005, based on the grant date fair value estimated in accordance with the original provisions of SFAS No. 123. Stock-based compensation expense for all share-based payment awards granted after December 31, 2005 is based on the grant-date fair value estimated in accordance with the provisions of SFAS No. 123R. The Corporation recognizes these compensation costs net of a forfeiture rate and recognizes the compensation costs for only those shares expected to vest on a straight-line basis over the requisite service period of the award, which is generally the option vesting term of 3 years. The Corporation estimated the forfeiture rate for the twelve-months of fiscal 2006 based on its historical experience during the preceding seven fiscal years.
As a result of the Corporation’s adopting SFAS No. 123R, the impact to the Consolidated Financial Statements for the twelve-months ended December 31 2006, for income before income taxes and net income, was $160,000 and $105,000 lower, respectively.
Under the principal option plans, the Corporation may grant certain employees restricted stock awards. Restricted stock awards are non-vested stock awards. Restricted stock awards are independent of option grants and are generally subject to forfeiture if employment terminates prior to the release of the restrictions. Such awards generally vest within 30 days to five years from the date of grant. During that period, ownership of the shares cannot be transferred. Restricted stock has the same cash dividend and voting rights as other common stock and is considered to be currently issued and outstanding. The Corporation expenses the cost of the restricted stock awards, which is determined to be the fair market value of the shares at the date of grant, ratably over the period during which the restrictions lapse.
In light of new accounting guidance under SFAS No. 123R, which began in the first quarter of fiscal 2006, the Corporation reviewed its assumptions used in estimating the fair value of employee options granted. As part of this review, management concluded that it would use historical volatility. There were no grants of restricted stock for the twelve-months ended December 31, 2006. In 2005, 8,500 shares of restricted stock were awarded.
There were grants totaling 31,500 of common stock options issued during the twelve-months ended December 31, 2006. For the twelve-months ended December 31, 2006, 2005 and 2004 the fair value of share-based payment awards was estimated using the Black-Scholes option-pricing model with the following assumptions and weighted average fair values:
| | | | | | | | | | | | | | |
| | | | | December 31,
2006 | | | | December 31,
2005 | | | | December 31,
2004 | | |
| | | | | | | | | | | | | | |
| | Weighted average fair value of grants | | $ | 5.53 | | | $ | 4.07 | | | $ | 3.43 | | |
| | Risk-free interest rate | | | 5.03 | % | | | 3.90 | % | | | 4.11 | % | |
| | Dividend yield | | | 2.70 | % | | | 3.08 | % | | | 2.73 | % | |
| | Expected volatility | | | 49.5 | % | | | 30.1 | % | | | 35.8 | % | |
| | Expected life in months | | | 72 | | | | 72 | | | | 72 | | |
F-16
CENTER BANCORP, INC AND SUBSIDIARIES
NOTES TO CONSOLIDATED FINANCIAL STATEMENTS
Note 2 — Stock Based Compensation – (continued)
Option activity under the principal option plans as of December 31, 2006 and changes during the twelve-months ended December 31, 2006 were as follows:
| | | | | | | | | | | |
| | | Shares | | Weighted-
Average
Exercise
Price | | Weighted-
Average
Remaining
Contractual
Term | | Aggregate
Intrinsic
Value | |
| | | (In Thousands) | | | | | (In Years) | | | (In Thousands) | |
| | | | | | | | | | | |
| Outstanding at December 31, 2005 | | 377,894 | | $ | 5.41-15.88 | | | | $ | 2,282 | |
| Granted | | 31,500 | | | 13.17 | | | | | 83 | |
| Exercised | | 86,356 | | | 5.41-11.19 | | | | | 598 | |
| Forfeited/cancelled/expired | | — | | | — | | | | | — | |
| Outstanding at December 31, 2006 | | 323,038 | | $ | 5.41-15.88 | | 10.65 | | $ | 1,673 | |
| Exercisable at December 31, 2006 | | 250,978 | | $ | 6.37-15.88 | | 6.23 | | $ | 1,399 | |
The aggregate intrinsic value of options above represents the total pretax intrinsic value (the difference between the Parent Corporation’s closing stock price on the last trading day of the twelve-months of fiscal 2006 and the exercise price, multiplied by the number of in-the-money options) that would have been received by the option holders had all option holders exercised their options on December 31, 2006. This amount changes based on the fair market value of the Parent Corporation’s stock.
As of December 31, 2006, $289,162 of total unrecognized compensation cost related to stock options is expected to be recognized over a weighted-average period of 1.9 years.
Changes in options outstanding during the past three years were as follows:
| | | | | | | |
Stock Option Plan | | Shares | | Exercise
Price Range
Per Share | |
� 60; | | | | | | |
| Outstanding, December 31, 2003 (176,867 shares exercisable) | | 261,503 | | $ | 4.51 to | $15.88 | |
| Granted during 2004 | | 34,650 | | | $11.03 | |
| Exercised during 2004 | | (55,135 | ) | $ | 4.51 to | $6.37 | |
| Expired or canceled during 2004 | | (3,835 | ) | | $6.37 | |
| Outstanding, December 31, 2004 (170,059 shares exercisable) | | 237,183 | | $ | 4.51 to | $15.88 | |
| Granted during 2005 | | 152,854 | | $ | 6.42 to | $11.19 | |
| Exercised during 2005 | | (12,138 | ) | $ | 4.51 to | $6.38 | |
| Expired or canceled during 2005 | | (5 | ) | | $6.37 | |
| Outstanding, December 31, 2005 (308,520 shares exercisable) | | 377,894 | | $ | 5.41 to | $15.88 | |
| Granted during 2006 | | 31,500 | | | $13.17 | |
| Exercised during 2006 | | (86,356 | ) | $ | 5.41 to | $11.19 | |
| Expired or canceled during 2006 | | — | | | — | |
| Outstanding, December 31, 2006 (250,978 shares exercisable) | | 323,038 | | $ | 5.41 to | $15.88 | |
F-17
CENTER BANCORP, INC AND SUBSIDIARIES
NOTES TO CONSOLIDATED FINANCIAL STATEMENTS
Note 2 — Stock Based Compensation – (continued)
The following table summarizes the fair value of the stock options granted during the three years ended December 31, 2006, 2005 and 2004.
| | | | | | | | | | | | | | | |
| | | 2006 | | 2005 | | 2004 |
| | | Options Granted | | Weighted Average Fair Value | | Options Granted | | Weighted Average Fair Value | | Options Granted | | Weighted Average Fair Value |
| | | | | | | | | | | | | | | | |
| Incentive stock options | | — | | $ | — | | 54,514 | | $ | 4.98 | | — | | $ | — |
| Non-qualifying stock options | | — | | $ | — | | 65,260 | | $ | 3.28 | | — | | $ | — |
| Director’s plan | | 31,500 | | $ | 5.53 | | 33,080 | | $ | 3.28 | | 34,650 | | $ | 3.43 |
| Total | | 31,500 | | $ | 5.53 | | 152,854 | | $ | 4.07 | | 34,650 | | $ | 3.43 |
Note 3 — Goodwill and Other Intangible Assets
Goodwill
Goodwill allocated to the Corporation as of December 31, 2006 and 2005, and changes in the carrying amount of goodwill during the fiscal year ended December 31, 2006, are as follows:
| | | | | |
| | | | | |
| | | | | (Dollars in
Thousands) | |
| | Balance as of December 31, 2004 | | $ | 2,091 | |
| | Acquisition activity | | | 14,713 | |
| | Balance as of December 31, 2005 | | | 16,804 | |
| | Acquisition activity | | | — | |
| | Balance as of December 31, 2006 | | $ | 16,804 | |
The current year and estimated future amortization expense for amortized intangible assets was $75,000, $120,000 for the years 2005 and 2006 receptively, and $107,522, $94,747, $81,972, $69,197 and $56,422, respectively for the subsequent five year period 2007, 2008, 2009, 2010 and 2011.
Based on the results of its annual impairment tests, the Corporation determined that no impairment of goodwill existed as of December 31, 2006 or 2005. However, future goodwill impairment tests could result in a charge to earnings. The Corporation will continue to evaluate goodwill on an annual basis as of the beginning of its fourth fiscal quarter and whenever events and changes in circumstances indicate that there may be a potential impairment.
F-18
CENTER BANCORP, INC AND SUBSIDIARIES
NOTES TO CONSOLIDATED FINANCIAL STATEMENTS
Note 3 — Goodwill and Other Intangible Assets – (continued)
| | | | | | | | | | | |
| | | | Gross Carrying Amount | | Accumulated Amortization | | Net Carrying Amount | |
| | | | (Dollars in Thousands) | |
| | | | | | | | | | | |
| | As of December 31, 2006: | | | | | | | | | | |
| | Core deposits | | $ | 703 | | $ | (195 | ) | $ | 508 | |
| | Other | | | 5 | | | (5 | ) | | 0 | |
| | Total intangible assets | | | 708 | | | (200 | ) | | 508 | |
| | As of December 31, 2005: | | | | | | | | | | |
| | Core deposits | | | 703 | | | (75 | ) | | 628 | |
| | Other | | | 24 | | | (19 | ) | | 5 | |
| | Total intangible assets | | $ | 727 | | $ | (94 | ) | $ | 633 | |
Acquisitions
The Corporation completed the acquisition of Red Oak Bank as of the close of business on May 20, 2005. Red Oak Bank was a State chartered commercial bank and operated one full service branch location in Hanover Township, Morris County, New Jersey. The acquisition presented the Corporation with the strategic opportunity to enhance shareholder value, market share and earnings growth. The opportunities included increasing the Corporation’s loan portfolio, strengthening and expanding the Corporation’s presence in affluent and desirable business areas of the Morris County marketplace which complemented the Corporation’s existing footprint in that market through additional retail and commercial banking product offerings, increasing deposit share and further building the Corporation’s core deposit funding base, as well as enhancing the Corporation’s opportunities for earning asset generation.
Pursuant to the terms of the Agreement and Plan of Merger, 50% of Red Oak Bank’s common stock was converted into Parent Corporation’s common stock at an exchange rate of .9227 Parent Corporation’s shares per each Red Oak Bank share and 50% was converted into $12.06 in cash for each Red Oak Bank share. The aggregate consideration paid in the merger consisted of $13.3 million in cash and 1,015,816 shares of the Parent’s Corporation’s common stock. The cash portion of the merger consideration was funded through the sale of securities available for sale and cash from continuing operations. The Corporation additionally converted remaining stock options covering 56,266 shares of Red Oak Bank common stock outstanding at the time of the merger and were exchanged for options covering 54,514 shares of common stock.
As a result of the Red Oak Bank acquisition, the Corporation acquired assets having a fair value of $115.3 million, including $89.6 million of net loans, $5.4 million of investment securities and $2.4 million of cash and cash equivalents, and assumed $70.7 million of deposits, $17.1 million of borrowings, and $792,000 of other liabilities.
The acquisition was accounted for as a purchase and the excess cost over the fair value of net assets acquired (“goodwill”) in the transaction was $14.7 million. Under the provisions of Statement of Financial Accounting Standards (“SFAS”) No. 142, goodwill is not being amortized in connection with this transaction and the goodwill will not be deductible for income tax purposes. The Corporation also recorded a core deposit intangible of $702,617 in connection with the acquisition, which is being amortized on a 10-year sum of the digits method. The amortization of premiums and discounts resulting from the fair value adjustments of assets and liabilities amounted to approximately $323,342 for the year ended December 31, 2005. The results of operations for 2005 include Red Oak Bank’s results of operations from May 20, 2005 forward.
F-19
CENTER BANCORP, INC AND SUBSIDIARIES
NOTES TO CONSOLIDATED FINANCIAL STATEMENTS
Note 3 — Goodwill and Other Intangible Assets – (continued)
The following table presents data with respect to the net fair values of assets and liabilities acquired in the Red Oak Bank acquisition:
| | | | | | |
| | | | | At May 20,
2005 | | |
| | | | | (Dollars in
Thousands) | | |
| | ASSETS | | | | | |
| | Cash and due from banks | | $ | 2,433 | | |
| | Securities | | | 5,404 | | |
| | Loans, net | | | 89,626 | | |
| | Fixed assets | | | 476 | | |
| | Other assets | | | 1,952 | | |
| | Core deposit intangible | | | 703 | | |
| | Goodwill | | | 14,713 | | |
| | Total assets | | | 115,307 | | |
| | | | | | | |
| | LIABILITIES | | | | | |
| | Deposits | | | 70,674 | | |
| | Borrowings | | | 17,090 | | |
| | Other liabilities | | | 792 | | |
| | Total liabilities | | | 88,556 | | |
| | Net assets acquired | | $ | 26,751 | | |
The net deferred tax liability resulting from adjustments of net assets acquired, including the creation of the core deposit intangible amounted to $524,740. Transaction and acquisition costs have been determined in accordance with purchase accounting. Estimated costs in connection with the acquisition and included as a component of goodwill amounted to $634,764, all of which were paid as of December 31, 2005.
Note 4 — Recent Accounting Pronouncements
FIN 48
In July 2006, the Financial Accounting Standards Board (FASB) issued FASB Interpretation No. 48, “Accounting for Uncertainty in Income Taxes — an interpretation of FASB Statement No. 109” (FIN 48), which clarifies the accounting for uncertainty in tax positions. This Interpretation requires that companies recognize in their financial statements the impact of a tax position, if that position is more likely than not of being sustained on audit, based on the technical merits of the position. The provisions of FIN 48 are effective for fiscal years beginning after December 15, 2006, with the cumulative effect of the change in accounting principle recorded as an adjustment to opening retained earnings. Management is currently evaluating the impact of adopting FIN 48 on the Corporation’s financial statements and does not expect that the application of FIN 48 will have a material impact on its consolidated financial condition, results of operations for financial statements disclosures.
SFAS No. 154
In May 2006, the FASB issued Statement of Financial Accounting Standards (SFAS) No.154, “Accounting for Changes and Error Corrections, a replacement of APB Opinion No. 20 and FASB Statement No. 3.” SFAS 154 requires retrospective application to prior periods’ financial statements for changes in accounting principle, unless it is impracticable to determine either the period specific effects or the cumulative effect of the change.
SFAS 154 also requires that retrospective application of a change in accounting principle be limited to the direct effects of the change. Indirect effects of a change in accounting principle, such as a change in nondiscretionary profit-sharing payments resulting from an accounting change, should be recognized in the period of the accounting change. SFAS 154 also requires that a change in depreciation, amortization, or depletion method for long-lived,
F-20
CENTER BANCORP, INC AND SUBSIDIARIES
NOTES TO CONSOLIDATED FINANCIAL STATEMENTS
Note 4 — Recent Accounting Pronouncements – (continued)
non-financial assets be accounted for as a change in accounting estimate affected by a change in accounting principle. SFAS 154 is effective for accounting changes and corrections of errors made in fiscal years beginning after December 15, 2006. Early adoption is permitted for accounting changes and corrections of errors made in fiscal years beginning after the date this Statement is issued. The Corporation adopted FASB No. 154 as of December 31, 2006 and there was no impact to its consolidated financial position, results of operations and cash flows.
SFAS No. 156
In March 2006, the Financial Accounting Standards Board issued Statement of Financial Accounting Standards (“SFAS”) No. 156, “Accounting for Servicing of Financial Assets.” SFAS No. 140, Accounting for Transfers and Servicing of Financial Assets and Extinguishments of Liabilities, establishes, among other things, the accounting for all separately recognized servicing assets and servicing liabilities. SFAS No. 156 amends SFAS No. 140 to require that all separately recognized servicing assets and servicing liabilities be initially measured at fair value, if practicable. This statement permits, but does not require, the subsequent measurement of separately recognized servicing assets and servicing liabilities at fair value. An entity that uses derivative instruments to mitigate the risks inherent in servicing assets and servicing liabilities is required to account for those derivative instruments at fair value. Under this Statement, an entity can elect subsequent fair value measurement to account for its separately recognized servicing assets and servicing liabilities. By electing that option, an entity may simplify its accounting because this Statement permits income statement recognition of the potential offsetting changes in fair value of those servicing assets and servicing liabilities and derivative instruments in the same accounting period. The Statement is effective in the first fiscal year beginning after September 15, 2006 with earlier adoption permitted. The Corporation has adopted Statement No. 156 and there was no impact on its consolidated financial statements.
SFAS No. 157
In September 2006, the FASB issued SFAS No. 157, “Fair Value Measurements” (SFAS No. 157). SFAS No. 157 establishes a common definition for fair value to be applied to US GAAP guidance requiring use of fair value, establishes a framework for measuring fair value, and expands disclosure about such fair value measurements. SFAS No. 157 is effective for fiscal years beginning after November 15, 2007. The Corporation is currently assessing the impact of SFAS No. 157 on its consolidated financial position and results of operations.
SAB 108
In September 2006, the SEC issued SAB No. 108, “Considering the Effects of Prior Year Misstatements when Quantifying Misstatements in Current Year Financial Statements” (“SAB 108”). SAB 108 provides guidance on the consideration of the effects of prior year misstatements in quantifying current year misstatements for the purpose of a materiality assessment.
SAB 108 establishes an approach that requires quantification of financial statement errors based on the effects of each of the company’s balance sheet and statement of operations and the related financial statement disclosures. Early application of the guidance in SAB 108 is encouraged in any report for an interim period of the first fiscal year ending after November 15, 2006, and will be adopted by the Corporation in the first quarter of fiscal 2007. The Corporation does not expect the adoption of SAB 108 to have a material impact on its consolidated results of operations and financial condition
Meaning of Other-Than-Temporary Impairment:
At its November 12-13, 2003 meeting, the Emerging Issues Task Force (“EITF”) reached a consensus on the issue 03-01, “The Meaning of Other-Than-Temporary Impairment and Its Application to Certain Investments,” that certain quantitative and qualitative disclosures should be required for debt and marketable equity securities classified as available-for-sale or held-to-maturity under SFAS No.115 and SFAS No.124 that are impaired at the balance sheet date but for which an other than temporary impairment has not been recognized. Certain disclosure requirements of EITF 03-01 were adopted in 2003 and the Corporation began presenting the new disclosure requirements in its consolidated financial statements for the year ended December 31, 2003.
F-21
CENTER BANCORP, INC AND SUBSIDIARIES
NOTES TO CONSOLIDATED FINANCIAL STATEMENTS
Note 4 — Recent Accounting Pronouncements – (continued)
The recognition and measurement provisions were initially effective for other-than-temporary impairment evaluations in reporting periods beginning after June 15, 2004. However, in September 2004, the effective date of these provisions was delayed until the finalization of an FASB Staff Position (FSP) to provide additional implementation guidance.
On November 3, 2006, FSP FAS Nos. 115-1 and FAS 124-1 “The Meaning of Other-Than-Temporary Impairment and Its Application to Certain Investments,” was issued. The FSP also addresses accounting considerations subsequent to the recognition of other-than-temporary impairment on a debt security, and requires certain disclosures about unrealized losses that have not been recognized as other-than-temporary impairments.
The FSP replaces the impairment guidance in EITF Issue No. 03-1 with references to existing authoritative literature concerning other-than-temporary determinations (principally Statement of Financial Accounting Standards No. 115 and SEC Staff Accounting Bulletin 59). Under the FSP, impairment losses must be recognized in earnings equal to the entire difference between the security’s cost and its fair value at the financial statement date, without considering partial recoveries subsequent to that date. The FSP also requires that an investor recognize other-than-temporary impairment losses when a decision to sell a security has been made and the investor does not expect the fair value of the security to fully recover prior to the expected time of sale. The FSP is effective for reporting periods beginning after December 15, 2006. The Corporation does not expect that the adoption of the FSP in 2007 will have a material impact on its consolidated financial condition, results of operations or financial statement disclosures.
Future Application of Accounting Pronouncements
In February 2006, the Financial Accounting Standards Board (the “FASB”) issued SFAS No. 155, “Accounting for Certain Hybrid Financial Instruments, an amendment of FASB Statements No. 133 and 140.” SFAS No. 155 permits, but does not require, fair value accounting for hybrid financial instruments that contain an embedded derivative that would otherwise require bifurcation in accordance with SFAS No. 133, “Accounting for Derivative Instruments and Hedging Activities.” SFAS No. 155 also eliminated the temporary exemption for interests in securitized financial assets provided for by SFAS No. 133, Derivatives Implementation Group (“DIG”) Issue D1, “Application of Statement 133 to Beneficial Interests in Securitized Financial Assets.” However, in January 2007, the FASB issued interpretive guidance in SFAS No. 133, DIG Issue B40, “Application of Paragraph 13(b) to Securitized Interests in Prepayable Financial Assets.” In DIG Issue B40, the FASB concluded that a securitized interest in prepayable financial assets was not subject to the bifurcation requirements of SFAS No. 155 provided that the interest met both the following criteria: (1) the right to accelerate the settlement of the securitized interest cannot be controlled by the investor; and (2) the securitized interest itself does not contain an embedded derivative for which bifurcation would be required other than an embedded derivative that results solely from the embedded call options in the underlying financial assets. The guidance in DIG Issue B40 is effective upon the adoption of SFAS No. 155. SFAS No. 155 is effective for all financial instruments acquired or issued after December 31, 2006 as well as to those hybrid financial instruments that had been previously bifurcated under SFAS No. 133. As of December 31, 2006, the Company did not have any hybrid financial instruments which were previously bifurcated under SFAS No. 133. Furthermore, the guidance provided for in DIG Issue B40 is expected to allow the Company to continue to purchase mortgage-backed securities without applying the bifurcation requirements of SFAS No. 155. As a result, the adoption of SFAS No. 155 is not expected to have a material impact on the Company’s statements of income and condition.
In July 2006, the FASB issued Staff Position (“FSP”) No. 13-2 “Accounting for a Change or Projected Change in the Timing of Cash Flows Relating to Income Taxes Generated by a Leveraged Lease Transaction,” which amends SFAS No. 13, “Accounting for Leases.” Under the provisions of FSP No. 13-2, a material revision in the timing of expected cash flows of a leveraged lease requires a recalculation of the original lease assumptions. This guidance will be effective for fiscal years beginning after December 15, 2006. The adoption of this guidance did not have any effect on the Corporation’s financial condition or results of operations.
In September 2006, the FASB ratified the consensus reached by the Emerging Issues Task Force (“EITF”) on Issue No. 06-5, “Accounting for Purchases of Life Insurance – Determining the Amount That Could Be Realized in Accordance with FASB Technical Bulletin No. 85-4, Accounting for Purchases of Life Insurance.” FASB Technical
F-22
CENTER BANCORP, INC AND SUBSIDIARIES
NOTES TO CONSOLIDATED FINANCIAL STATEMENTS
Note 4 — Recent Accounting Pronouncements – (continued)
Bulletin No. 85-4 requires that the amount that could be realized under the insurance contract as of the date of the statement of condition should be reported as an asset. Since the issuance of FASB Technical Bulletin No. 85-4, there has been diversity in practice in the calculation of the amount that could be realized under insurance contracts. EITF Issue No. 06-5 concludes that the Company should consider any additional amounts (e.g., cash stabilization reserves and deferred acquisition cost taxes) included in the contractual terms of the insurance policy other than the cash surrender value in determining the amount that could be realized in accordance with FASB Technical Bulletin No. 85-4. The Company’s adoption of EITF Issue No. 06-5 on January 1, 2007 is not expected to have a material impact on the Company’s statements of income and condition.
Note 5 – Comprehensive Income
Total comprehensive income includes all changes in equity during a period from transactions and other events and circumstances from non-owner sources. The Corporation’s other comprehensive income (loss) is comprised of unrealized holding gains and losses on securities available-for-sale and the effects of the pension liability.
Disclosure of comprehensive income for the twelve-months ended December 31, 2006 and 2005 is presented in the Consolidated Statements of Changes in Stockholders’ Equity. The table below provides a reconciliation of the components of other comprehensive income to the disclosure provided in the statement of changes in stockholder’s equity.
The changes in the components of other comprehensive income, net of taxes, were as follows for the following fiscal years ended December 31:
| | | | | | | | | | |
| | | Before
Tax Amount | | Tax Benefit
(Expense) | | Net of
Tax Amount | |
| | | (Dollars in Thousands) | |
For the year ended 2006: | | | | | | | | | | |
| Net unrealized gains on available for sale securities | | | | | | | | | | |
| Net unrealized holding gains arising during period | | $ | (16 | ) | $ | 6 | | $ | (10 | ) |
| Less reclassification adjustment for net losses arising during the period | | | (2,565 | ) | | (640 | ) | | (1,925 | ) |
| Net unrealized gains | | $ | 2,549 | | $ | (634 | ) | $ | 1,915 | |
| Change in minimum pension liability | | | 219 | | | (87 | ) | | 132 | |
| Other comprehensive income, net | | $ | 2,768 | | $ | (721 | ) | $ | 2,047 | |
| | | | | | | | | | | |
For the year ended 2005: | | | | | | | | | | |
| Net unrealized losses on available for sale securities | | | | | | | | | | |
| Net unrealized holding losses arising during period | | $ | (7,981 | ) | $ | 2,752 | | $ | (5,229 | ) |
| Less reclassification adjustment for net gains arising during the period | | | 350 | | | (119 | ) | | 231 | |
| Net unrealized losses | | | (7,631 | ) | | 2,633 | | | (4,998 | ) |
| Change in minimum pension liability | | | (171 | ) | | 0 | | | (171 | ) |
| Other comprehensive loss, net | | $ | (7,802 | ) | $ | 2,633 | | $ | (5,169 | ) |
| | | | | | | | | | |
| | | Before
Tax Amount | | Tax Benefit
(Expense) | | Net of
Tax Amount | |
| | | (Dollars in Thousands) | |
For the year ended 2004: | | | | | | | | | | |
| Net unrealized losses on available for sale securities | | | | | | | | | | |
| Net unrealized holding losses arising during period | | $ | (509 | ) | $ | 173 | | $ | (336 | ) |
| Less reclassification adjustment for net gains arising during the period | | | 148 | | | (50 | ) | | 98 | |
| Net unrealized losses | | | (361 | ) | | 123 | | | (238 | ) |
| Change in minimum pension liability | | | (57 | ) | | 0 | | | (57 | ) |
| Other comprehensive loss, net | | $ | (418 | ) | $ | 123 | | $ | (295 | ) |
F-23
CENTER BANCORP, INC AND SUBSIDIARIES
NOTES TO CONSOLIDATED FINANCIAL STATEMENTS
Note 6 — Cash and Due from Banks
The subsidiary bank, Union Center National Bank, maintained cash balances reserved to meet regulatory requirements of the Federal Reserve Board of approximately $249,000 and $253,000 at December 31, 2006 and 2005, respectively.
Note 7 — Investment Securities
The following tables present information related to the Corporation’s portfolio of securities held to maturity and available-for-sale at December 31, 2006 and 2005.
| | | | | | | | | | | | | |
| | | December 31, 2006 | |
| | | Amortized
Cost | | Gross
Unrealized
Gains | | Gross
Unrealized
Losses | | Estimated
Fair
Value | |
| | | (Dollars in Thousands) | |
Securities Held-to-Maturity: | | | | | | | | | |
| U.S. Treasury and Agency Securities | | $ | 511 | | $ | 18 | | $ | — | | $ | 529 | |
| Federal Agency Obligations | | | 30,056 | | | 17 | | | 531 | | | 29,542 | |
| Obligations of U.S. States and political subdivisions | | | 58,780 | | | 549 | | | 348 | | | 58,981 | |
| Other debt securities | | | 41,783 | | | 815 | | | 750 | | | 41,848 | |
| | | $ | 131,130 | | $ | 1,399 | | $ | 1,629 | | $ | 130,900 | |
| | | | | | | | | | | | | |
| | | December 31, 2006 | |
| | | Amortized
Cost | | Gross
Unrealized
Gains | | Gross
Unrealized
Losses | | Estimated
Fair
Value | |
| | | (Dollars in Thousands) | |
Securities Available-for-Sale: | | | | | | | | | |
| U.S. Treasury and Agency Securities | | $ | 100 | | $ | — | | $ | — | | $ | 100 | |
| Federal Agency Obligations | | | 107,343 | | | — | | | 3,694 | | | 103,649 | |
| Obligations of U.S. States and political subdivisions | | | 28,202 | | | 32 | | | 578 | | | 27,656 | |
| Other debt securities | | | 98,502 | | | 253 | | | 916 | | | 97,839 | |
| Other equity securities | | | 20,648 | | | 711 | | | — | | | 21,359 | |
| | | $ | 254,795 | | $ | 996 | | $ | 5,188 | | $ | 250,603 | |
F-24
CENTER BANCORP, INC AND SUBSIDIARIES
NOTES TO CONSOLIDATED FINANCIAL STATEMENTS
Note 7 — Investment Securities – (continued)
| | | | | | | | | | | | | |
| | | December 31, 2005 | |
| | | Amortized
Cost | | Gross
Unrealized
Gains | | Gross
Unrealized
Losses | | Estimated
Fair
Value | |
| | | (Dollars in Thousands) | |
Securities Held-to-Maturity: | | | | | | | | | |
| U.S. Treasury and Agency Securities | | $ | 1,122 | | $ | 56 | | $ | — | | $ | 1,178 | |
| Federal Agency Obligations | | | 33,577 | | | 91 | | | 443 | | | 33,225 | |
| Obligations of U.S. States and political subdivisions | | | 60,004 | | | 542 | | | 747 | | | 59,799 | |
| Other debt securities | | | 45,811 | | | 1,219 | | | 604 | | | 46,426 | |
| | | $ | 140,514 | | $ | 1,908 | | $ | 1,794 | | $ | 140,628 | |
| | | | | | | | | | | | | |
| | | December 31, 2005 | |
| | | Amortized
Cost | | Gross
Unrealized
Gains | | Gross
Unrealized
Losses | | Estimated
Fair
Value | |
| | | (Dollars in Thousands) | |
Securities Available-for-Sale: | | | | | | | | | |
| U.S. Treasury and Agency Securities | | $ | 588 | | $ | — | | $ | 6 | | $ | 582 | |
| Federal Agency Obligations | | | 215,257 | | | — | | | 5,878 | | | 209,379 | |
| Obligations of U.S. States and political subdivisions | | | 45,574 | | | 140 | | | 909 | | | 44,805 | |
| Other debt securities | | | 107,786 | | | 778 | | | 1,012 | | | 107,552 | |
| Other equity securities | | | 14,752 | | | 238 | | | 92 | | | 14,898 | |
| | | $ | 383,957 | | $ | 1,156 | | $ | 7,897 | | $ | 377,216 | |
A portion of the Corporation’s investment securities are classified as available-for-sale, approximately 65.65% at December 31, 2006. The available-for-sale securities are reported at fair value with unrealized gains or losses included in equity, net of taxes. Accordingly, the carrying value of such securities reflects their fair value at the balance sheet date. Fair value is based on quoted market price. The remainder of the portfolio is classified as held-to-maturity and reported at amortized cost.
The following table presents information for investments in securities held-to-maturity and securities available-for-sale at December 31, 2006, based on scheduled maturities. Actual maturities can be expected to differ from scheduled maturities due to prepayment or early call options of the issuer. Equity securities held in the available-for-sale portfolio are included in the due in one year or less category in the table below.
| | | | | | | | | | | | | |
| | | Held-to-Maturity | | Available-for-Sale | |
| | | Amortized
Cost | | Estimated
Fair
Value | | Amortized
Cost | | Estimated
Fair
Value | |
| | | (Dollars in Thousands) | |
| | | | | | | | | | | | | |
| Due in one year or less | | $ | 11 | | $ | 11 | | $ | 41,372 | | $ | 41,692 | |
| Due after one year through five years | | | 13,578 | | | 13,657 | | | 28,526 | | | 28,404 | |
| Due after five years through ten years | | | 38,130 | | | 37,692 | | | 46,811 | | | 45,545 | |
| Due after ten years | | | 79,411 | | | 79,540 | | | 138,086 | | | 134,962 | |
| Total | | $ | 131,130 | | $ | 130,900 | | $ | 254,795 | | $ | 250,603 | |
During 2006, securities sold from the Corporation’s available-for-sale portfolio amounted to approximately $188.0 million. The gross realized losses on securities sold amounted to $4.3 million, while the gross realized gains amounted to $1.7 million in 2006. Securities sold from the Corporation’s available-for-sale portfolio during 2005 amounted to $59.4 million with gross realized gains of $672,702 and gross realized losses of $322,508. Securities sold from the Corporation’s available-for-sales portfolio during 2004 amounted to $52.5 million with a gross realized gain of $428,472 and gross realized losses of $280,260.
F-25
CENTER BANCORP, INC AND SUBSIDIARIES
NOTES TO CONSOLIDATED FINANCIAL STATEMENTS
Note 7 — Investment Securities – (continued)
During the fourth quarter of 2006 the Corporation recorded a sale from its held-to-maturity portfolio of $517,000 and a realized gain of $29,404, in anticipation of an imminent call of the security permissible in accordance with FASB No. 115.
As part of a restructuring in 2006, the Corporation sold $86.3 million of available-for-sale securities, which were yielding less than 4 percent. The sale resulted in an after-tax charge of approximately $2.4 million, which resulted in the Corporation’s recording a loss for the first quarter of 2006. The proceeds from the sale of securities were utilized to reduce the Corporation’s short-term borrowings and wholesale funding sources by $85.0 million. As a result of this deleveraging, short-term borrowings were reduced to $98.5 million at March 23, 2006. Of this remaining amount, approximately $41 million of short-term borrowings constitutes commercial sweep accounts and are considered core deposits of the Bank.
Temporarily Impaired Investments
Investments whose value is considered to be other-than-temporarily impaired are written down to fair value as a charge to realized losses. The cost basis of these written down investments is adjusted to fair value at the date the determination of impairment is made. The new cost basis is not adjusted for subsequent recoveries in value. At December 31, 2006, there were no securities that reflected other-than-temporary impairment and no such write-downs occurred during 2006. The Corporation does not believe that the unrealized losses, which comprised 182 investment securities, as of December 31, 2006, represent an other than temporary impairment. The gross unrealized losses associated with U.S. Treasury and Agency securities and Federal agency obligations, mortgage-backed securities, other taxable securities and tax-exempt securities are not considered to be other-than-temporary because their unrealized losses are related to changes in interest rates and do not affect the expected cash flows of the underlying collateral or issuer. The Corporation has the intent and ability to hold the investment securities for a period of time necessary to recover the amortized cost.
The Corporation reviews all securities for potential recognition of other-than-temporary impairment. The Corporation maintains a watch list for the identification and monitoring of securities experiencing problems that required a heightened level of review. This could include credit rating downgrades.
The Corporation’s assessment of whether an investment in the portfolio of assets is other-than-temporary includes factors such as whether the issuer has defaulted on scheduled payments, announced restructuring and/or filed for bankruptcy, has disclosed severe liquidity problems that cannot be resolved, disclosed deteriorating financial condition or sustained significant losses.
Factors affecting the market price include credit risk, market risk, interest rates, economic cycles, and liquidity risk. The magnitude of any unrealized loss may be affected by the relative concentration of the Corporation’s investments in any one issuer or industry. The Corporation has established policies to reduce exposure through diversification of concentration of the investment portfolio including limits on concentrations to any one issuer. The Corporation believes the investment portfolio is prudently diversified.
The decline in value is related to a change in interest rates and subsequent change in credit spreads required for these issues affecting market price. All issues are performing and are expected to continue to perform in accordance with their respective contractual terms and conditions. Short to intermediate average durations and in certain cases monthly principal payments should reduce further market value exposure to increases in rates.
In determining that the securities giving rise to the previously mentioned unrealized losses were not other than temporary, the Corporation evaluated the factors cited above, which the Corporation considers when assessing whether a security is other than temporarily impaired. In making these evaluations the Corporation must exercise considerable judgment. Accordingly there can be no assurance that the actual results will not differ from the Corporation’s judgments and that such differences may not require the future recognition of other-than-temporary impairment charges that could have a material affect on the Corporation’s financial position and results of operations. In addition, the value of, and the realization of any loss on, an investment security is subject to numerous risks as cited above.
F-26
CENTER BANCORP, INC AND SUBSIDIARIES
NOTES TO CONSOLIDATED FINANCIAL STATEMENTS
Note 7 — Investment Securities – (continued)
The following tables indicates gross unrealized losses and fair value, aggregated by investment category and the length of time individual securities have been in a continuous unrealized loss position at December 31, 2006 and 2005:
| | | | | | | | | | | | | | | | | | | |
| | | December 31, 2006 | |
| | | Total | | Less Than 12 Months | | 12 Months or Longer | |
| | | Fair
Value | | Unrealized
Losses | | Fair
Value | | Unrealized
Losses | | Fair
Value | | Unrealized
Losses | |
| | | (Dollars in Thousands) | |
Held-to-Maturity: | | | |
| U.S. Treasury obligations and direct obligations of US government | | $ | 15,223 | | $ | (375 | ) | $ | — | | $ | — | | $ | 15,223 | | $ | (375 | ) |
| Federal agency CMO’s | | | 29,993 | | | (770 | ) | | 6,959 | | | (4 | ) | | 23,034 | | | (766 | ) |
| Federal agency MBS’s | | | 539 | | | (2 | ) | | 539 | | | (2 | ) | | — | | | — | |
| Corporate bonds | | | 5,899 | | | (135 | ) | | — | | | — | | | 5,899 | | | (135 | ) |
| Municipal tax exempt obligations | | | 23,627 | | | (347 | ) | | 4,231 | | | (16 | ) | | 19,396 | | | (331 | ) |
| Other equity securities | | | — | | | — | | | — | | | — | | | — | | | — | |
| Total temporarily impaired securities | | $ | 75,281 | | $ | (1,629 | ) | $ | 11,729 | | $ | (22 | ) | $ | 63,552 | | $ | (1,607 | ) |
| | | | | | | | | | | | | | | | | | | |
| | | December 31, 2006 | |
| | | Total | | Less Than 12 Months | | 12 Months or Longer | |
| | | Fair
Value | | Unrealized
Losses | | Fair
Value | | Unrealized
Losses | | Fair
Value | | Unrealized
Losses | |
| | | (Dollars in Thousands) | |
Available-for-Sale: | | | |
U.S. Treasury obligations and direct
obligations of US government | | $ | 8,863 | | $ | (406 | ) | $ | 100 | | $ | — | | $ | 8,763 | | $ | (406 | ) |
| Federal agency CMO’s | | | 101,331 | | | (3,512 | ) | | 1,751 | | | (40 | ) | | 99,580 | | | (3,472 | ) |
| Federal agency MBS’s | | | 15,578 | | | (505 | ) | | — | | | — | | | 15,578 | | | (505 | ) |
| Corporate bonds | | | 12,081 | | | (187 | ) | | 7,137 | | | (74 | ) | | 4,944 | | | (113 | ) |
| Municipal tax exempt obligations | | | 23,019 | | | (578 | ) | | 2,565 | | | (4 | ) | | 20,454 | | | (574 | ) |
| Other equity securities | | | — | | | — | | | — | | | — | | | — | | | — | |
| Total temporarily impaired securities | | $ | 160,872 | | $ | (5,188 | ) | $ | 11,553 | | $ | (118 | ) | $ | 149,319 | | $ | (5,070 | ) |
| | | | | | | | | | | | | | | | | | | |
| | | December 31, 2005 | |
| | | Total | | Less Than 12 Months | | 12 Months or Longer | |
| | | Fair
Value | | Unrealized
Losses | | Fair
Value | | Unrealized
Losses | | Fair
Value | | Unrealized
Losses | |
| | | (Dollars in Thousands) | |
Held-to-Maturity: | | | |
| U.S. Treasury obligations and direct obligations of U.S. government | | $ | 15,303 | | $ | (318 | ) | $ | 8,074 | | $ | (72 | ) | $ | 7,229 | | $ | (246 | ) |
| Federal agency CMO’s | | | 27,233 | | | (666 | ) | | 22,113 | | | (512 | ) | | 5,120 | | | (154 | ) |
| Federal agency MBS’s | | | — | | | — | | | — | | | — | | | — | | | — | |
| Corporate bonds | | | 5,973 | | | (63 | ) | | 4,026 | | | (13 | ) | | 1,947 | | | (50 | ) |
| Municipal tax exempt obligations | | | 33,967 | | | (747 | ) | | 21,641 | | | (318 | ) | | 12,326 | | | (429 | ) |
| Total temporarily impaired securities | | $ | 82,476 | | $ | (1,794 | ) | $ | 55,854 | | $ | (915 | ) | $ | 26,622 | | $ | (879 | ) |
F-27
CENTER BANCORP, INC AND SUBSIDIARIES
NOTES TO CONSOLIDATED FINANCIAL STATEMENTS
Note 7 — Investment Securities – (continued)
| | | | | | | | | | | | | | | | | | | |
| | | December 31, 2005 | |
| | | Total | | Less Than 12 Months | | 12 Months or Longer | |
| | | Fair
Value | | Unrealized
Losses | | Fair
Value | | Unrealized
Losses | | Fair
Value | | Unrealized
Losses | |
| | | (Dollars in Thousands) | |
Available-for-Sale | | | |
| U.S. Treasury obligations and direct obligations of US government | | $ | 17,847 | | $ | (547 | ) | $ | 7,161 | | $ | (82 | ) | $ | 10,686 | | $ | (465 | ) |
| Federal agency CMO’s | | | 172,355 | | | (4,691 | ) | | 62,255 | | | (1,216 | ) | | 110,100 | | | (3,475 | ) |
| Federal agency MBS’s | | | 49,261 | | | (1,474 | ) | | 26,909 | | | (580 | ) | | 22,352 | | | (894 | ) |
| Asset backed securities | | | 24,030 | | | (38 | ) | | 24,030 | | | (38 | ) | | — | | | — | |
| Corporate bonds | | | 6,478 | | | (146 | ) | | 4,054 | | | (71 | ) | | 2,424 | | | (75 | ) |
| Municipal tax exempt obligations | | | 27,401 | | | (909 | ) | | 9,753 | | | (160 | ) | | 17,648 | | | (749 | ) |
| Other equity securities | | | 1,716 | | | (92 | ) | | 1,716 | | | (92 | ) | | — | | | — | |
| Total temporarily impaired securities | | $ | 299,088 | | $ | (7,897 | ) | $ | 135,878 | | $ | (2,239 | ) | $ | 163,210 | | $ | (5,658 | ) |
Investment securities having a carrying value of approximately $179.5 million and $190.9 million at December 31, 2006 and 2005, respectively, were pledged to secure public deposits, short-term borrowings, and FHLB advances and for other purposes required or permitted by law.
Note 8 — Loans and the Allowance for Loan Losses
The following table sets forth the composition of the Corporation’s loan portfolio net of deferred fees at December 31, 2006 and 2005, respectively:
| | | | | | | |
| | | 2006 | | 2005 | |
| | | (Dollars in Thousands) | |
| | | | | | | |
| Real estate – residential mortgage | | $ | 269,486 | | $ | 261,028 | |
| Real estate – commercial | | | 206,044 | | | 164,841 | |
| Commercial and industrial | | | 74,179 | | | 79,006 | |
| Installment | | | 705 | | | 951 | |
| Total | | $ | 550,414 | | $ | 505,826 | |
At December 31, 2006 and 2005 loans to officers and directors aggregated approximately $5,064,856 and $4,077,255, respectively. During the year ended December 31, 2006, the Corporation made new loans to officers and directors in the amount of $3,195,928; payments by such persons during 2006 aggregated $2,208,327. Management is of the opinion that the above loans were made on the same terms and conditions as those prevailing for comparable transactions with non-related borrowers.
A summary of the activity in the allowance for loan losses is as follows:
| | | | | | | | | | |
| | | 2006 | | 2005 | | 2004 | |
| | | (Dollars in Thousands) | |
| | | | | | | | | | |
| Balance at the beginning of year | | $ | 4,937 | | $ | 3,781 | | $ | 3,002 | |
| Provision for loan losses | | | 57 | | | — | | | 752 | |
| Addition of Red Oak Bank’s Allowance – May 20, 2005 | | | — | | | 1,210 | | | — | |
| Loans charged-off | | | (79 | ) | | (82 | ) | | (11 | ) |
| Recoveries on loans previously charged-off | | | 45 | | | 28 | | | 38 | |
| Balance at the end of year | | $ | 4,960 | | $ | 4,937 | | $ | 3,781 | |
F-28
CENTER BANCORP, INC AND SUBSIDIARIES
NOTES TO CONSOLIDATED FINANCIAL STATEMENTS
Note 8 — Loans and the Allowance for Loan Losses – (continued)
Total non-performing assets are comprised of the outstanding balances of accruing loans, which are 90 days, or more past due as to principal or interest payments, non-accrual loans and other real estate owned. Total non-performing assets at December 31, 2006, 2005 and 2004 were as follows:
| | | | | | | | | | |
| | | 2006 | | 2005 | | 2004 | |
| | | (Dollars in Thousands) | |
| | | | | | | | | | |
| Loans past due in excess of 90 days and still accruing | | $ | 225 | | $ | 179 | | $ | — | |
| Non-accrual loans | | | 475 | | | 387 | | | — | |
| Other real estate owned | | | — | | | — | | | — | |
| Total non-performing assets | | $ | 700 | | $ | 566 | | $ | — | |
The amount of interest income that would have been recorded on non-accrual loans in 2006, 2005 and 2004 had payments remained in accordance with the original contractual terms was $27,871, $28,905 and $0 respectively, no interest income was received on these types of assets in 2006, 2005 and 2004.
At December 31, 2006, total impaired loans were approximately $469,872 as compared to $299,850 at December 31, 2005 and $205,529 at December 31, 2004. The reserves allocated to such loans in 2006, 2005 and 2004 were $0, $44,000, and $1,000 respectively. Although classified as substandard at December 31, 2006, the impaired loans were current with respect to principal and interest payments. The Corporation’s total average impaired loans were $188,591 during 2006, $196,775 during 2005, and $230,043 during 2004.
At December 31, 2006, there were no commitments to lend additional funds to borrowers whose loans were non-accrual or contractually past due in excess of 90 days and still accruing interest.
The policy of the Corporation is to generally grant commercial, mortgage and installment loans to New Jersey residents and businesses within its trading area. The borrowers’ abilities to repay their obligations are dependent upon various factors including the borrowers’ income and net worth, cash flows generated by the borrowers’ underlying collateral, value of the underlying collateral, and priority of the Bank’s lien on the property. Such factors are dependent upon various economic conditions and individual circumstances beyond the control of the Corporation. The Corporation is therefore subject to risk of loss. The Corporation believes its lending policies and procedures adequately minimize the potential exposure to such risks and that adequate provisions for loan losses are provided for all known and inherent risks. Collateral and/or personal guarantees are required for virtually all loans.
Note 9 — Premises and Equipment
Premises and equipment are summarized as follows:
| | | | | | | | | |
| | | Estimated
Useful Life | | 2006 | | 2005 | |
| | | (Dollars in Thousands) | |
| | | | | | | | | |
| Land | | | | $ | 3,447 | | $ | 3,447 | |
| Buildings | | 5-40 Yrs | | | 14,208 | | | 13,773 | |
| Furniture, fixtures and equipment | | 2-20 Yrs | | | 15,406 | | | 14,079 | |
| Leasehold improvements | | 5-30 Yrs | | | 2,130 | | | 1,812 | |
| Subtotal | | | | | 35,191 | | | 33,111 | |
| Less accumulated depreciation and amortization | | | | | 16,362 | | | 14,768 | |
| Total | | | | $ | 18,829 | | $ | 18,343 | |
Depreciation expense for the three years ended December 31, 2006 amounted to $1,732,000 in 2006, $1,752,000 in 2005 and $1,580,000 in 2004, respectively.
F-29
CENTER BANCORP, INC AND SUBSIDIARIES
NOTES TO CONSOLIDATED FINANCIAL STATEMENTS
Note 10 — Borrowed Funds
Short-term borrowings at December 31, 2006 and 2005 consisted of the following:
| | | | | | | |
| | | 2006 | | 2005 | |
| | | (Dollars in Thousands) | |
| | | | | | | |
| Overnight Federal Funds Purchased | | $ | 0 | | $ | 40,000 | |
| Securities sold under agreements to repurchase | | | 29,443 | | | 58,193 | |
| Federal Home Loan Bank short-term and overnight advances | | | 2,000 | | | 23,900 | |
| Total Short-Term Borrowings | | $ | 31,443 | | $ | 122,093 | |
The weighted average interest rate for short-term borrowings at December 31, 2006 and 2005 was 3.46 percent and 3.24 percent, respectively.
Long-term borrowings at December 31, 2006 and 2005 consisted of the following:
| | | | | | | |
| | | 2006 | | 2005 | |
| | | (Dollars in Thousands) | |
| | | | | | | |
| Federal Home Loan Bank Advances | | $ | 106,991 | | $ | 154,370 | |
| Securities sold under agreements to repurchase | | | 68,000 | | | 17,500 | |
| Total Long-Term Borrowings | | $ | 174,991 | | $ | 171,870 | |
Securities sold under agreements to repurchase had average balances of $96.4 million and $119.1 million for the years ended December 31, 2006 and 2005, respectively. The maximum amount outstanding at any month end during 2006 and 2005 was $103.4 million and $160.8 million, respectively. The average interest rate paid on securities sold under agreements to repurchase were 3.78 percent and 2.65 percent for the years ended December 31, 2006 and 2005, respectively. Overnight federal funds purchased averaged $12.7 million during 2006 as compared to $27.6 million during 2005.
The weighted average interest rates on long term borrowings at December 31, 2006 and 2005 were 4.61 percent and 4.11 percent, respectively. The maximum amount outstanding at any month end during 2006 and 2005 was $206.9 million and $168.7 million, respectively. The average interest rates paid on Federal Home Loan Bank advances were 4.63 percent and 4.13 percent for the years ended December 31, 2006 and 2005, respectively.
At December 31, 2006 and 2005, the advances from the Federal Home Loan Bank of New York (“FHLB”) amounted to $109.0 million and $157.4 million, respectively. The FHLB advances had a weighted average interest rate of 4.65 percent and 4.08 percent at December 31, 2006 and 2005, respectively. These advances are secured by pledges of FHLB stock, 1–4 family residential mortgages and U.S. Government and Federal Agency obligations. The advances are subject to quarterly call provisions at the discretion of the FHLB and at December 31, 2006 and 2005, are contractually scheduled for repayment as follows:
| | | | | | | |
| | | 2006 | | 2005 | |
| | | (Dollars in Thousands) | |
| | | | | |
| 2006 | | $ | — | | $ | 3,000 | |
| 2007 | | | 2,000 | | | 2,000 | |
| 2008 | | | 1,422 | | | 1,644 | |
| 2009 | | | — | | | 25,000 | |
| 2010 | | | 50,569 | | | 65,726 | |
| 2011 | | | 10,000 | | | 10,000 | |
| 2012 | | | 5,000 | | | 5,000 | |
| 2015 | | | 20,000 | | | 45,000 | |
| 2016 | | | 20,000 | | | — | |
| Total: | | $ | 108,991 | | $ | 157,370 | |
F-30
CENTER BANCORP, INC AND SUBSIDIARIES
NOTES TO CONSOLIDATED FINANCIAL STATEMENTS
Note 10 — Borrowed Funds – (continued)
The securities sold under repurchase agreements to other counterparties included in long-term debt totaled $68.0 million at December 31, 2006 and $17.5 million at December 31, 2005. The weighted average rate at December 31, 2006 was 4.51 and 3.53 percent, respectively. The schedule for contractual repayment is as follows:
| | | | | | | |
| | | 2006 | | 2005 | |
| | | (Dollars in Thousands) | |
| | | | | |
| 2008 | | $ | — | | $ | 17,500 | |
| 2011 | | | 27,000 | | | — | |
| 2013 | | | 41,000 | | | — | |
| Total: | | $ | 68,000 | | $ | 17,500 | |
Note 11 — Pension and Other Benefits
Defined Benefit Plans
The Corporation maintains a non-contributory pension plan for substantially all of its employees. The benefits are based on years of service and the employee’s compensation over the prior five-year period. The plan’s benefits are payable in form of a ten year certain and life annuity. The plan is intended to be a tax-qualified defined benefit plan under Section 401(a) of the Internal Revenue Code. The Pension Plan, which has been in effect since March 15, 1950, generally covers employees of Union Center National Bank and the Parent Corporation who have attained age 21 and completed one year of service. The normal retirement (age 65) pension payable under the Pension Plan is generally equal to 44% of a participant’s highest average compensation over a 5-year period.
In addition, the Corporation has a non-qualified retirement plan that is designed to supplement the pension plan for key employees. The plan is known as the Union Center National Bank Benefit Equalization Plan, or “BEP”.
The BEP is a nonqualified, unfunded supplemental retirement plan, which is designed to replace the benefits that cannot be provided under the terms of the Pension Plan solely due to certain compensation and benefit limits placed on tax-qualified pension plans under the Internal Revenue Code.
In 1999, the Corporation adopted a Director’s Retirement Plan, which is designed to provide retirement benefits for members of the Board of Directors. The expense associated with the plan amounted to $79,000 in 2006, $76,000 in 2005 and $93,000 for 2004, and is included in other expense.
The following table sets forth changes in projected benefit obligation, changes in fair value of plan assets, funded status, and amounts recognized in the consolidated statements of condition for the Corporation’s pension plans at December 31, 2006 and 2005.
| | | | | | | |
Change in Benefit Obligation | | 2006 | | 2005 | |
| | | (Dollars in Thousands) | |
| | | | | | | |
| Projected benefit obligation at beginning of year | | $ | 10,797 | | $ | 10,146 | |
| Service cost | | | 976 | | | 776 | |
| Interest cost | | | 621 | | | 599 | |
| Actuarial loss (gain) | | | 875 | | | (444 | ) |
| Benefits paid | | | (366 | ) | | (280 | ) |
| Projected benefit obligation at end of year | | $ | 12,903 | | $ | 10,797 | |
| Change in Plan Assets | | | | | | | |
| Fair value of plan assets at beginning year | | $ | 7,332 | | $ | 6,599 | |
| Actual return on plan assets | | | 1,084 | | | 313 | |
| Employer contributions | | | 750 | | | 700 | |
| Benefits paid | | | (366 | ) | | (280 | ) |
| Fair value of plan assets at end of year | | $ | 8,800 | | $ | 7,332 | |
| Funded status | | $ | (4,103 | ) | $ | (3,465 | ) |
| Unrecognized net asset | | | — | | | — | |
| Unrecognized prior service cost | | | 27 | | | 36 | |
| Unrecognized net actuarial loss | | | 1,493 | | | 1,248 | |
| Accrued benefit cost | | $ | (2,583 | ) | $ | (2,181 | ) |
F-31
CENTER BANCORP, INC AND SUBSIDIARIES
NOTES TO CONSOLIDATED FINANCIAL STATEMENTS
Note 11 — Pension and Other Benefits – (continued)
The net periodic pension cost for 2006, 2005 and 2004 includes the following components:
| | | | | | | | | | |
| | | 2006 | | 2005 | | 2004 | |
| | | (Dollars in Thousands) | |
| | | | | | | | | | |
| Service cost | | $ | 1,000 | | $ | 796 | | $ | 725 | |
| Interest cost | | | 621 | | | 599 | | | 561 | |
| Expected return on plan assets | | | (592 | ) | | (533 | ) | | (442 | ) |
| Net amortization and deferral | | | 124 | | | 91 | | | 97 | |
| Net periodic pension expense | | $ | 1,153 | | $ | 953 | | $ | 941 | |
The following table presents the assumptions used to calculate the projected benefit obligation in each of the last three years.
| | | | | | | | | | |
| | | 2006 | | 2005 | | 2004 | |
| | | (Dollars in Thousands) | |
| | | | | | | | | | |
| Discount rate | | | 5.75 | % | | 5.75 | % | | 6.00 | % |
| Rate of compensation increase | | | 4.25 | % | | 4.25 | % | | 4.50 | % |
| Expected long-term rate of return on plan assets | | | 7.50 | % | | 7.50 | % | | 7.50 | % |
The Corporation implemented SFAS No. 158, “Employers’ Accounting for Defined Benefit Pension and Other Postretirement Plans – an amendment of FASB Statements No. 87, 88 106, and 132(R)” at December 31, 2006. SFAS No. 158 requires the funded status of pension plans to be recorded in the balance sheet as an asset for plans with an over funded status and a liability for plans with an under funded status. The Corporation recognized under funded status of its pension plans as liability, respectively, in the Consolidated Balance Sheet as of December 31, 2006.
The following table summarizes the incremental effect of applying SFAS No. 158 on individual line items in the Consolidated Balance Sheet as of December 31, 2006:
| | | | | | | | | | |
| | | Before
Application
of SFAS
No. 158 | | Adjustment | | After
Application
of SFAS
No. 158 | |
| | | (Dollars in Thousands) | |
| | | | | | | | | |
| Financial statement line item: | | | | | | | | | | |
| Reserve for income taxes | | $ | 2,888 | | | (543 | ) | $ | 2,345 | |
| Liability for pension benefits | | | 1,209 | | | 1,358 | | | 2,567 | |
| Total other liabilities | | | 14,596 | | | 815 | | | 15,411 | |
| Accumulated other comprehensive loss | | | (2,595 | ) | | (815 | ) | | (3,410 | ) |
| Total stockholders’ equity | | $ | 98,428 | | | (815 | ) | $ | 97,613 | |
F-32
CENTER BANCORP, INC AND SUBSIDIARIES
NOTES TO CONSOLIDATED FINANCIAL STATEMENTS
Note 11 — Pension and Other Benefits – (continued)
The following information is provided at December 31:
| | | | | | | |
| | | 2006 | | 2005 | |
| | | (Dollars in Thousands) | |
| | | | | | | |
Information for Plans With an Accumulated Benefit Obligation
in Excess of Plan Assets | | | | | | | |
| Projected benefit obligation | | $ | 12,903 | | $ | 10,797 | |
| Accumulated benefit obligation | | | 10,684 | | | 8,962 | |
| Fair value of plan assets | | | 8,800 | | | 7,332 | |
Assumptions | | | | | | | |
Weighted average assumptions used to determine
benefit obligation at December 31 | | | | | |
| Discount rate | | | 5.75 | % | | 5.75 | % |
| Rate of compensation increase | | | 4.25 | % | | 4.25 | % |
Weighted average assumptions used to determine
Net periodic benefit cost for years ended December 31 | | | | | |
| Discount rate | | | 5.75 | % | | 6.00 | % |
| Expected long-term return on plan assets | | | 7.50 | % | | 7.50 | % |
| Rate of compensation increase | | | 4.25 | % | | 4.50 | % |
The process of determining the overall expected long-term rate of return on plan assets begins with a review of appropriate investment data, including current yields on fixed income securities, historical investment data, historical plan performance and forecasts of inflation and future total returns for the various asset classes. This data forms the basis for the construction of a best-estimate range of real investment return for each asset class. An average, weighted real-return range is computed reflecting the Plan’s expected asset mix, and that range, when combined with an expected inflation range, produces an overall best-estimate expected return range. Specific factors such as the Plan’s investment policy, reinvestment risk and investment volatility are taken into consideration during the construction of the best estimate real return range, as well as in the selection of the final return assumption from within the range.
Plan Assets
The Union Center National Bank Pension Trust’s weighted-average asset allocation at December 31, 2006, 2005 and 2004, by asset category, is as follows:
| | | | | | | | | | |
Asset Category | | 2006 | | 2005 | | 2004 | |
| | | | | | | | | | |
| Equity securities | | | 79 | % | | 76 | % | | 79 | % |
| Debt and/or fixed income securities | | | 21 | % | | 23 | % | | 20 | % |
| Other | | | 0 | % | | 1 | % | | 1 | % |
| Total | | | 100 | % | | 100 | % | | 100 | % |
The general investment policy of the Pension Trust is for the fund to experience growth in assets that will allow the market value to exceed the value of benefit obligations over time. Appropriate diversification on a total fund basis is achieved by following an allowable range of commitment within asset category, as follows:
| | | | | | | |
| | | Range | | Target | |
| | | | | | | |
| Equity securities | | | 15–80 | % | | 75 | % |
| Debt and/or fixed income securities | | | 20–65 | % | | 25 | % |
| International equity | | | 0–10 | % | | 0 | % |
| Short term | | | 10–40 | % | | 0-5 | % |
F-33
CENTER BANCORP, INC AND SUBSIDIARIES
NOTES TO CONSOLIDATED FINANCIAL STATEMENTS
Note 11 — Pension and Other Benefits – (continued)
The investment manager is not authorized to purchase, acquire or otherwise hold certain types of market securities (subordinated bonds, commodities, real estate investment trusts, limited partnerships, naked puts, naked calls, stock index futures, oil, gas or mineral exploration ventures or unregistered securities) or to employ certain types of market techniques (margin purchases or short sales) or to mortgage, pledge, hypothecate, or in any manner transfer as security for indebtedness, any security owned or held by the Plan.
Cash Flows
Contributions
The Bank expects to contribute $850,000 to its Pension Trust in 2007.
Estimated Future Benefit Payments
The following benefit payments, which reflect expected future service, as appropriate, that are expected to be paid in each year 2007, 2008, 2009, 2010, 2011 and years 2012-2016, respectively are $392,003, $618,764, $694,831, $704,231, $765,416 and $5,176,410.
401K Benefit Plan
The Corporation maintains a 401K employee savings plan to provide for defined contributions which covers substantially all employees of the Corporation. The Corporation’s contributions to the plan are limited to fifty percent of a matching percentage of each employee’s contribution up to six percent of the employee’s salary. For 2006, 2005 and 2004, employer contributions amounted to $152,450, $134,367 and $124,000, respectively.
Note 12 — Income Taxes
The current and deferred amounts of income tax expense (benefit) for the years ended December 31, 2006, 2005 and 2004, respectively, are as follows:
| | | | | | | | | | |
| | | 2006 | | 2005 | | 2004 | |
| | (Dollars in Thousands) | |
Current: | | | | | | | | | | |
| Federal | | $ | (6,553 | ) | $ | (2,266 | ) | $ | 1,354 | |
| State | | | (2,056 | ) | | (1,178 | ) | | 164 | |
| | | | (8,609 | ) | | (3,444 | ) | | 1,518 | |
Deferred: | | | | | | | | | | |
| Federal | | | 4,090 | | | 3,778 | | | 341 | |
| State | | | 1,190 | | | 850 | | | (235 | ) |
| | | | 5,280 | | | 4,628 | | | 106 | |
| Income tax expense (benefit) | | $ | (3,329 | ) | $ | 1,184 | | $ | 1,624 | |
During the fourth quarter of 2006, the Corporation effected an internal entity reorganization of its subsidiary companies which resulted in a $2.6 million federal tax benefit of which $1.4 million is reflected in the current net tax benefit.
F-34
CENTER BANCORP, INC AND SUBSIDIARIES
NOTES TO CONSOLIDATED FINANCIAL STATEMENTS
Note 12 — Income Taxes – (continued)
Reconciliation between the amount of reported income tax expense and the amount computed by applying the statutory Federal income tax rate is as follows:
| | | | | | | | | | |
| | | 2006 | | 2005 | | 2004 | |
| | (Dollars in Thousands) | |
| | | | | | | | | | | |
| Income before income tax expense | | $ | 569 | | $ | 8,830 | | $ | 9,246 | |
| Federal statutory rate | | | 34 | % | | 34 | % | | 34 | % |
| Computer “expected” Federal income tax expense | | | 193 | | | 3,002 | | | 3,144 | |
| State tax net of Federal tax benefit | | | (572 | ) | | (216 | ) | | (47 | ) |
| Bank owned life insurance | | | (265 | ) | | (252 | ) | | (249 | ) |
| Tax-exempt interest and dividends | | | (1,332 | ) | | (1,206 | ) | | (1,235 | ) |
| Business entity restructuring | | | (1,400 | ) | | — | | | — | |
| Other, net | | | 47 | | | (144 | ) | | 11 | |
| Income tax expense | | $ | (3,329 | ) | $ | 1,184 | | $ | 1,624 | |
The tax effects of temporary differences that give rise to significant portions of the deferred tax asset and deferred tax liability at December 31, 2006 and 2005 are presented below:
| | | | | | | |
| | | 2006 | | 2005 | |
| | | (Dollars in Thousands) | |
Deferred tax assets: | | | | | | | |
| Allowance for loan losses | | $ | 1,600 | | $ | 1,550 | |
| Employee benefit plans | | | 1,394 | | | 1,265 | |
| Unrealized loss on securities available-for-sale and tax benefits related to adoption of SFAS 158 and other comprehensive income | | | 2,293 | | | 2,327 | |
| Other | | | 518 | | | 316 | |
| Federal NOL | | | 5,258 | | | 1,480 | |
| NJ NOL and AMA credits | | | 1,479 | | | 871 | |
| Total gross deferred tax asset | | $ | 12,542 | | $ | 7,809 | |
Deferred tax liabilities: | | | | | | | |
| Depreciation | | $ | 287 | | $ | 412 | |
| Market discount accretion | | | 510 | | | 581 | |
| Deferred fee expense-mortgages | | | 547 | | | 599 | |
| Purchase accounting | | | 292 | | | 504 | |
| Other | | | 67 | | | 120 | |
| Total gross deferred tax liabilities | | | 1,703 | | | 2,216 | |
| Net deferred tax asset | | $ | 10,839 | | $ | 5,593 | |
Based on the Corporation’s historical and current pre-tax earnings and the availability of net operating loss carry-backs on a Federal basis, management believes it is more likely than not that the Corporation will realize the benefit of the net deductible temporary differences existing at December 31, 2006 and 2005, respectively.
At December 31, 2006, the Corporation has federal income tax loss carryforwards of approximately $15.5 million, which have expirations beginning in the year 2023 and has state income tax loss carryforwards of approximately $23.7 million which have expirations beginning in the year 2011.
In assessing the realization of deferred tax assets, management considers whether it is more likely than not that some portion or all of the deferred tax assets will not be realized. The ultimate realization of deferred tax assets is dependant upon the generation of future taxable income during periods in which those temporary differences become deductible, Management considers the scheduled reversal of deferred tax liabilities, the projected future taxable income, and tax planning strategies in making this assessment. During 2006 and 2005, based on the level of historical taxable income and projections for future taxable income over the periods in which the deferred tax assets are deductible, the Corporation believes the net deferred tax assets are more likely than not to be realized.
F-35
CENTER BANCORP, INC AND SUBSIDIARIES
NOTES TO CONSOLIDATED FINANCIAL STATEMENTS
Note 13 — Stockholders’ Equity and Regulatory Requirements
On June 30, 2005, the Parent Corporation issued 1,904,761 shares of its common stock to a limited number of accredited investors in a private placement of its securities. The shares were issued at a purchase price of $10.50 per share. Net proceeds to the Parent Corporation were approximately $18.9 million, after commissions and expenses.
On September 29, 2004, the Parent Corporation issued 888,888 shares its common stock to a limited number of accredited investors in a private placement of its securities. The shares were issued at a purchase price of $11.25 per share. Net proceeds to the Parent Corporation were approximately $9.4 million, after commissions and expenses.
Regulatory Capital
Federal Deposit Insurance Corporation (“FDIC”) regulations require banks to maintain minimum levels of regulatory capital. Under the regulations in effect at December 31, 2006, the Bank was required to maintain (i) a minimum leverage ratio of Tier I capital to total adjusted assets of 4.00%, and (ii) minimum ratios of Tier I and total capital to risk-weighted assets of 4.00% and 8.00%, respectively.
Under its prompt corrective action regulations, the FDIC is required to take certain supervisory actions with respect to an undercapitalized institution. Such actions could have a direct material effect on the institution’s financial statements. The regulations establish a framework for the classification of financial institutions into five categories: well capitalized, adequately capitalized, undercapitalized, significantly undercapitalized and critically undercapitalized. Generally, an institution is considered well capitalized if it has a leverage (Tier I) capital ratio of at least 5.00%; a Tier I risk-based capital ratio of at least 6.00%; and a total risk-based capital ratio of at least 10.00%.
The foregoing capital ratios are based in part on specific quantitative measures of assets, liabilities and certain off-balance sheet items as calculated under regulatory accounting practices. Capital amounts and classifications are also subject to qualitative judgments by the FDIC about capital components, risk weightings and other factors.
As of December 31, 2006, management believes that the Bank meets all capital adequacy requirements to which it is subject and is a well-capitalized institution under the prompt corrective action regulations.
The following is a summary of the Bank’s and the Parent Corporation’s actual capital amounts and ratios as of December 31, 2006 and 2005, compared to the FDIC minimum capital adequacy requirements and the FDIC requirements for classification as a well-capitalized institution.
F-36
CENTER BANCORP, INC AND SUBSIDIARIES
NOTES TO CONSOLIDATED FINANCIAL STATEMENTS
Note 13 — Stockholders’ Equity and Regulatory Requirements – (continued)
| | | | | | | | | | | | | | | | | | | |
| | | FDIC Requirements | |
| | | Union Center
National
Bank Actual | | Minimum Capital
Adequacy | | For Classification
as Well Capitalized | |
| | | Amount | | Ratio | | Amount | | Ratio | | Amount | | Ratio | |
| | | (Dollars in Thousands) | |
| | | | | | | | | | | | | | | | | | | | |
| December 31, 2006 Leverage (Tier 1) capital | | $ | 82,113 | | | 8.12 | % | $ | 41,250 | | | 4.00 | % | $ | 50,697 | | | 5.00 | % |
Risk-Based Capital: | | | | | | | | | | | | | | | | | | | |
| Tier 1 | | | 82,113 | | | 12.37 | % | | 26,558 | | | 4.00 | % | | 39,837 | | | 6.00 | % |
| Total | | | 87,073 | | | 13.11 | % | | 53,116 | | | 8.00 | % | | 66,396 | | | 10.00 | % |
| December 31, 2005 Leverage (Tier 1) capital | | $ | 82,379 | | | 7.43 | % | $ | 45,221 | | | 4.00 | % | $ | 55,654 | | | 5.00 | % |
Risk-Based Capital: | | | | | | | | | | | | | | | | | | | |
| Tier 1 | | | 82,379 | | | 12.82 | % | | 25,698 | | | 4.00 | % | | 38,547 | | | 6.00 | % |
| Total | | | 87,316 | | | 13.59 | % | | 51,397 | | | 8.00 | % | | 64,246 | | | 10.00 | % |
| | | | | | | | | | | | | | | | | | | |
| | | Parent Corporation
Actual | | Minimum Capital
Adequacy | | For Classification
as Well Capitalized | |
| | | Amount | | Ratio | | Amount | | Ratio | | Amount | | Ratio | |
| | | (Dollars in Thousands) | |
| | | | | | | | | | | | | | | | | | | | |
| December 31, 2006 Leverage (Tier 1) capital | | $ | 87,955 | | | 8.64 | % | $ | 41,524 | | | 4.00 | % | $ | 51,040 | | | 5.00 | % |
Risk-Based Capital: | | | | | | | | | | | | | | | | | | | |
| Tier 1 | | | 87,955 | | | 13.14 | % | | 26,699 | | | 4.00 | % | | 40,048 | | | 6.00 | % |
| Total | | | 92,915 | | | 13.88 | % | | 53,398 | | | 8.00 | % | | N/A | | | N/A | |
| December 31, 2005 Leverage (Tier 1) capital | | $ | 102,159 | | | 9.07 | % | $ | 45,913 | | | 4.00 | % | $ | 56,519 | | | 5.00 | % |
Risk-Based Capital: | | | | | | | | | | | | | | | | | | | |
| Tier 1 | | | 102,159 | | | 15.51 | % | | 26,340 | | | 4.00 | % | | 39,509 | | | 6.00 | % |
| Total | | | 107,096 | | | 16.26 | % | | 52,679 | | | 8.00 | % | | N/A | | | N/A | |
The Corporation issued $10.3 million in 2001 and $5.2 million in 2003 of subordinated debentures. In December 2006 the Corporation redeemed $10.3 million in subordinated debt. These securities are included as a component of Tier 1 Capital for regulatory purposes.
On March 1, 2005, the Federal Reserve adopted a final rule that allows the continued inclusion of outstanding and prospective issuances of trust preferred securities in the Tier I Capital of bank holding companies, subject to stricter quantitative limits and qualitative standards. The new quantitative limits become effective after a five-year transition period ending March 31, 2009. Under the final rules, trust preferred securities and other restricted core capital elements are limited to 25% of all core capital elements. Amounts of restricted core capital elements in excess of these limits may be included in Tier II Capital. At December 31, 2005, the only restricted core capital element owned by the Corporation is trust preferred securities. Based on a preliminary review of the final rule, the Corporation believes that its trust preferred issues qualify as Tier I Capital. However, in the event that the trust preferred issues do not qualify as Tier I Capital, the Corporation would remain well capitalized.
Note 14 — Subordinated Debentures
During 2001 and 2003, the Corporation formed statutory business trusts, which exist for the exclusive purpose of (i) issuing Trust Securities representing undivided beneficial interests in the assets of the Trust; (ii) investing the gross proceeds of the Trust securities in junior subordinated deferrable interest debentures (subordinated debentures) of the Corporation; and (iii) engaging in only those activities necessary or incidental thereto. These subordinated
F-37
CENTER BANCORP, INC AND SUBSIDIARIES
NOTES TO CONSOLIDATED FINANCIAL STATEMENTS
Note 14 — Subordinated Debentures – (continued)
debentures and the related income effects are not eliminated in the consolidated financial statements as the statutory business trusts are not consolidated in accordance with FASB interpretation No. 46(R) “Consolidation of Variable Interest Entities.” Distributions on the subordinated debentures owned by the subsidiary trusts below have been classified as interest expense in the Consolidated Statements of Income.
The following table summarizes the mandatorily redeemable trust preferred securities of the Corporation’s subsidiary trusts at December 31, 2006.
On December 18, 2006 the Corporation dissolved its Statutory Trust I, in connection with the redemption of $10.3 million of subordinated debentures.
| | | | | | | | | | |
Issuance
Date | | Securities
Issued | | Liquidation
Value | | Coupon Rate | | Maturity | | Redeemable by
Issuer Beginning |
| | | | | | | | | | | |
| 12/19/03 | | $5,000,000 | | $1,000 per Capital Security | | Floating 3-month LIBOR + 285 Basis Points | | 01/23/2034 | | 01/23/2009 |
Note 15 — Fair Value of Financial Instruments
Statement of Financial Accounting Standards No. 107, “Disclosures about Fair Value of Financial Instruments” (SFAS 107), requires that the Corporation disclose estimated fair values for its financial instruments. Fair value estimates, methods, and assumptions are set forth below for the Corporation’s financial instruments:
The carrying amounts for cash and cash-equivalents approximate fair value because they mature in 90 days or less and do not present unanticipated credit concerns. The fair value of investment securities is estimated based on bid quotations received from securities dealers. Stock of the Federal Home Loan Bank of New York, Federal Reserve Bank of New York and Atlantic Central Bankers Bank is carried at cost.
Fair values are estimated for portfolios of loans with similar financial characteristics. Loans are segregated by type such as commercial, real estate-mortgage, and installment loans.
The fair value of performing loans, except residential mortgages, is calculated by discounting scheduled cash flows through the estimated maturity using estimated market discount rates that reflect the credit and interest rate risk inherent in the loan. The estimate of maturity is based on the historical experience of the Bank with prepayments for each loan classification, modified as required by an estimate of the effect of current economic and lending conditions. For performing residential mortgage loans, fair value is estimated by discounting contractual cash flows adjusted for prepayment estimates using discount rates based on secondary market sources adjusted to reflect differences in servicing and credit costs.
The carrying amounts of accrued interest receivable approximate fair value.
The fair value of deposits with no stated maturity, such as non-interest-bearing demand deposits, savings and interest-bearing checking accounts, and money market and checking accounts, is equal to the amount payable on demand as of December 31, 2006 and 2005. The fair value of certificates of deposit is based on the discounted value of contractual cash flows. The discount rate is estimated using the rates currently offered for deposits of similar remaining maturities.
Short-term borrowings that mature within six months have fair values equal to their carrying value.
The fair value of FHLB advances is based on the discounted value of estimated cash flows. The discount rate is estimated using the rates currently offered for similar advances.
The fair value of subordinated debentures is estimated by discounting the estimated future cash flows using market discount rates of financial instruments with similar characteristics, terms and remaining maturity.
F-38
CENTER BANCORP, INC AND SUBSIDIARIES
NOTES TO CONSOLIDATED FINANCIAL STATEMENTS
Note 15 — Fair Value of Financial Instruments – (continued)
The fair value of commitments to extend credits is estimated using the fees currently charged to enter into similar agreements, taking into account the remaining terms of the agreements and the present creditworthiness of the counterparties. For fixed rate loan commitments, fair value also considers the difference between current levels of interest rate and the committed rates. The fair value of financial standby letters of credit is based on fees currently charged for similar agreements or on the estimated cost to terminate them or otherwise settle the obligations with the counterparties.
The fair values related to commitment and letters of credit are deemed immaterial and omitted from the disclosure below.
Fair value estimates are made at a specific point in time, based on relevant market information and information about the financial instrument. These estimates do not reflect any premium or discount that could result from offering for sale at one time the Corporation’s entire holdings of a particular financial instrument.
Because no market exists for a significant portion of the Bank’s financial instruments, fair value estimates are based on judgments regarding future expected loss experience, current economic conditions, risk characteristics of various financial instruments, and other factors. These estimates are subjective in nature, involve uncertainties and matters of significant judgment and therefore cannot be determined with precision. Changes in assumptions could significantly affect the estimates.
Fair value estimates are based on existing on-and-off-balance sheet financial instruments without attempting to estimate the value of anticipated future business and the value of assets and liabilities that are not considered financial instruments. Other significant assets and liabilities that are not considered financial assets or liabilities include deferred tax assets and liabilities, goodwill, and premises and equipment. In addition, the tax ramifications related to the realization of the unrealized gains and losses can have a significant effect on fair value estimates and have not been considered.
The estimated fair value of the Corporation’s financial instruments is as follows:
| | | | | | | | | | | | |
| | | December 31, |
| | | 2006 | | 2005 |
| | | Carrying Amount | | Fair
Value | | Carrying Amount | | Fair
Value |
| | | (Dollars in Thousands) |
| FINANCIAL ASSETS: | | | | | | | | | | | | |
| Cash and cash equivalents | | $ | 44,363 | | $ | 44,363 | | $ | 19,343 | | $ | 19,343 |
| Investments available-for-sale | | | 250,603 | | | 250,603 | | | 377,216 | | | 377,216 |
| Investments held to maturity | | | 131,130 | | | 130,900 | | | 140,514 | | | 140,628 |
| Net loans | | | 545,454 | | | 541,672 | | | 500,889 | | | 492,267 |
| Accrued interest receivable | | | 4,932 | | | 4,932 | | | 5,875 | | | 5,875 |
| FINANCIAL LIABILITIES: | | | | | | | | | | | | |
| Non-interest-bearing deposits | | | 136,453 | | | 136,453 | | | 139,911 | | | 139,911 |
| Interest-bearing deposits | | | 590,318 | | | 589,941 | | | 560,690 | | | 559,491 |
| Federal funds purchased, securities sold under agreement to repurchase and FHLB advances | | | 206,434 | | | 207,549 | | | 293,963 | | | 295,035 |
| Subordinated debentures | | | 5,155 | | | 5,040 | | | 15,465 | | | 15,465 |
| Accrued interest payable | | | 1,817 | | | 1,817 | | | 1,437 | | | 1,437 |
F-39
CENTER BANCORP, INC AND SUBSIDIARIES
NOTES TO CONSOLIDATED FINANCIAL STATEMENTS
Note 16 — Deposits
The table below provides information regarding the aggregate of amount and maturity of time certificates of deposit of $100,000 or more as of December 31, 2006.
| | | | | |
| | (Dollars in Thousands) | | Amount | |
| | | | | |
| | Due in 0 to 3 Months | | $ | 43,063 | |
| | Due in 4 to 6 Months | | | 31,538 | |
| | Due in 7 to 12 Months | | | 6,257 | |
| | Due in 2008 | | | 999 | |
| | Due in 2009 | | | 1,450 | |
| | Due in 2010 | | | 316 | |
| | Total | | $ | 83,623 | |
Note 17 — Parent Corporation Only Financial Statements
The Parent Corporation operates its wholly owned subsidiary, Union Center National Bank. The earnings of this subsidiary is recognized by the Corporation using the equity method of accounting. Accordingly, earnings are recorded as increases in the Corporation’s investment in the subsidiaries and dividends paid reduce the investment in the subsidiaries. The ability of the Parent Corporation to pay dividends will largely depend upon the dividends paid to it by the Bank. Dividends payable by the Bank to the Corporation are restricted under supervisory regulations (see Note 18).
Condensed financial statements of the Parent Corporation only are as follows:
| | | | | | | |
CONDENSED STATEMENTS OF CONDITION | | | |
| | | At December 31, | |
| | | 2006 | | 2005 | |
| | | (Dollars in Thousands) | |
| | | | | | | |
ASSETS | | | | | | | |
| Cash and cash equivalents | | $ | 529 | | $ | 3,330 | |
| Investment in subsidiary | | | 96,732 | | | 95,113 | |
| Securities available for sale | | | 4,698 | | | 15,236 | |
| Other assets | | | 1,320 | | | 2,095 | |
| Total assets | | $ | 103,279 | | $ | 115,774 | |
| | | | | | | | |
LIABILITIES AND STOCKHOLDERS’ EQUITY | | | | | | | |
| Other liabilities | | $ | 511 | | $ | 820 | |
| Subordinated debentures | | | 5,155 | | | 15,465 | |
| Stockholders’ equity | | | 97,613 | | | 99,489 | |
| Total liabilities and stockholders’ equity | | $ | 103,279 | | $ | 115,774 | |
| | | | | | | | | | |
CONDENSED STATEMENTS OF INCOME | | | | | |
| | | For Years Ended
December 31, | |
| | | 2006 | | 2005 | | 2004 | |
| | (Dollars in Thousands) | |
| Income | | | | | | | | | | |
| Dividend income from subsidiary | | $ | 4,770 | | $ | 6,055 | | $ | 3,238 | |
| Other income | | | 684 | | | 334 | | | 78 | |
| Management fees | | | 266 | | | 315 | | | 227 | |
| Total Income | | | 5,720 | | | 6,704 | | | 3,543 | |
| Expenses | | | (1,866 | ) | | (1,357 | ) | | (1,087 | ) |
| Income before equity in earnings of subsidiary | | | 3,854 | | | 5,347 | | | 2,456 | |
| Undistributed equity in earnings of subsidiary | | | 44 | | | 2,299 | | | 5,166 | |
| Net Income | | $ | 3,898 | | $ | 7,646 | | $ | 7,622 | |
F-40
CENTER BANCORP, INC AND SUBSIDIARIES
NOTES TO CONSOLIDATED FINANCIAL STATEMENTS
Note 17 — Parent Corporation Only Financial Statements – (continued)
| | | | | | | | | | |
CONDENSED STATEMENTS OF CASH FLOWS | | | |
| | | For Years Ended December 31 | |
| | | 2006 | | 2005 | | 2004 | |
| | | (Dollars in Thousands) | |
| Operating Activities: | | | | | | | | | | |
| Net income | | $ | 3,898 | | $ | 7,646 | | $ | 7,622 | |
Adjustments to reconcile net income to net cash
provided by operating activities: | | | | | | | | | | |
| (Gain)Loss on securities sold | | | (315 | ) | | 0 | | | 0 | |
| Undistributed equity in earnings of subsidiary | | | (44 | ) | | (2,299 | ) | | (5,166 | ) |
| Decrease (increase) in other assets | | | 291 | | | (439 | ) | | (117 | ) |
| (Decrease) increase in other liabilities | | | (892 | ) | | 459 | | | (282 | ) |
| Stock based compensation | | | 160 | | | 0 | | | 0 | |
| Amortization of premium and accretion of discount on investment securities, net | | | 39 | | | 0 | | | 0 | |
| Net cash provided by operating activities | | | 3,137 | | | 5,367 | | | 2,057 | |
| Investing Activities: | | | | | | | | | | |
| Purchases of available-for-sale securities | | | (13,300 | ) | | (46,635 | ) | | (11,094 | ) |
| Maturity of available-for-sale securities | | | 24,838 | | | 42,585 | | | 0 | |
| Cash consideration paid to acquire Red Oak Bank | | | 0 | | | (13,279 | ) | | 0 | |
| Investments in subsidiary | | | 0 | | | 0 | | | (4,000 | ) |
| Net cash provided by (used in) investing activities | | | 11,538 | | | (17,329 | ) | | (15,094 | ) |
| Financing Activities: | | | | | | | | | | |
| Cash dividends | | | (4,808 | ) | | (4,518 | ) | | (3,238 | ) |
| Proceeds from exercise of stock options | | | 674 | | | 399 | | | 559 | |
| Repurchase of treasury stock | | | (3,366 | ) | | 0 | | | 0 | |
| Proceeds from redemption/issuance of common stock | | | (16 | ) | | 19,105 | | | 9,815 | |
| Proceeds from redemption/issuance of subordinated debentures | | | (10,310) | | | 0 | | | 0 | |
| Excess tax benefits from stock based compensation | | | 350 | | | 0 | | | 0 | |
| Net cash (used in) provided by financing activities | | | (17,476 | ) | | 14,986 | | | 7,136 | |
| Increase (decrease) in cash and cash equivalents | | | (2,801 | ) | | 3,024 | | | (5,901 | ) |
| Cash and cash equivalents at beginning of year | | | 3,330 | | | 306 | | | 6,207 | |
| Cash and cash equivalents at the end of year | | $ | 529 | | $ | 3,330 | | $ | 306 | |
Note 18 — Dividends and Other Restrictions
Certain restrictions, including capital requirements, exist on the availability of undistributed net profits of the Bank for the future payment of dividends to the Parent Corporation. A dividend may not be paid if it would impair the capital of the Bank. Furthermore, prior approval by the Comptroller of the Currency is required if the total of dividends declared in a calendar year exceeds the total of the Bank’s net profits for that year combined with the retained profits for the two preceding years. At December 31, 2006, approximately $11.962 million was available for the payment of dividends.
Note 19 — Commitments, Contingencies and Concentrations of Credit Risk
In the normal course of business, the Corporation has outstanding commitments and contingent liabilities, such as commitments to extend credit, including loan commitments of $146.7 million ($144.8 million subject to variable rate indices and $1.9 million fixed rate commitments) as of December 31, 2006. As of December 31, 2005, the Corporation had outstanding commitments and contingent liabilities such as commitments to extend credit; including loan commitments of $12.2 million ($11.9 million subject to variable rate indices and $0.3 million fixed rate commitments). Standby letters of credit, which are not reflected in the accompanying, consolidated financial statements, totaled $18.4 million and $17.8 million as of December 31, 2006 and 2005, respectively. Commitments
F-41
CENTER BANCORP, INC AND SUBSIDIARIES
NOTES TO CONSOLIDATED FINANCIAL STATEMENTS
Note 19 — Commitments, Contingencies and Concentrations of Credit Risk – (continued)
to extend credit and standby letters of credit generally do not exceed one year. These financial instruments involve, to varying degrees, elements of credit risk in excess of the amounts recognized in the consolidated financial statements. The commitment or contract amount of these financial instruments is an indicator of the Corporation’s level of involvement in each type of instrument as well as the exposure to credit loss in the event of non-performance by the other party to the financial instrument.
The Corporation controls the credit risk of these financial instruments through credit approvals, limits and monitoring procedures. To minimize potential credit risk, the Corporation generally requires collateral and other credit-related terms and conditions from the customer. In the opinion of management, the financial condition of the Corporation will not be materially affected by the final outcome of these commitments and contingent liabilities.
A substantial portion of the Bank’s loans is represented by one to four family residential first mortgage loans secured by real estate located in New Jersey. Accordingly, the collectability of a substantial portion of the loan portfolio of the Bank is susceptible to changes in the real estate market.
In October 2004, the Corporation’s subsidiary Union Center National Bank, entered into an agreement to purchase a future banking site at 44 North Avenue, Cranford, New Jersey, 07016 for a purchase price of $1,400,000. In January 2007, the Corporation terminated this agreement. In October 2005, Union Center National Bank entered into a lease rental agreement for property located at 209 Ridgedale Avenue, Florham Park, New Jersey for a new branch location.
Other expenses include rentals for premises and equipment of $680,702 in 2006, $534,537 in 2005 and $401,616 in 2004. At December 31, 2005, the Corporation was obligated under a number of non-cancelable leases for premises and equipment, many of which provide for increased rentals based upon increases in real estate taxes and the cost of living index. These leases, most of which have renewal provisions, are principally operating leases. Minimum rentals under the terms of these leases for the years 2007 through 2011 are $735,615, $773,285, $798,050, $819,379 and $841,710, respectively. Minimum rentals due 2011 and after are $2,621,971.
The Corporation is subject to claims and lawsuits that arise in the ordinary course of business. Based upon the information currently available in connection with such claims, it is the opinion of management that the disposition or ultimate determination of such claims will not have a material adverse impact on the consolidated financial position, results of operations, or liquidity of the Corporation.
Note 20 — Quarterly Financial Information Center Bancorp, Inc. (Unaudited)
| | | | | | | | | | | | | |
| | | 2006 | |
| | | 4th Quarter | | 3rd Quarter | | 2nd Quarter | | 1st Quarter | |
| | | | (Dollars in Thousands, Except per Share Data) |
| Total interest income | | $ | 13,408 | | $ | 13,632 | | $ | 13,054 | | $ | 13,231 | |
| Total interest expense | | | 7,717 | | | 7,680 | | | 6,746 | | | 6,831 | |
| Net interest income | | | 5,691 | | | 5,952 | | | 6,308 | | | 6,400 | |
| Provision for loan losses | | | 57 | | | 0 | | | 0 | | | 0 | |
| Total other income net of gains (losses) on securities sold | | | 817 | | | 795 | | | 796 | | | 790 | |
| Net gains (losses) on securities sold | | | 801 | | | 212 | | | 77 | | | (3,655 | )(1) |
| Other expense | | | 6,656 | | | 5,735 | | | 5,766 | | | 6,201 | |
| Provision for income taxes (benefit) | | | (1,695 | ) | | (78 | ) | | 43 | | | (1,599 | ) |
| Income (loss) before income taxes (benefit) | | | 596 | | | 1,224 | | | 1,415 | | | (2,666 | ) |
| Net income (loss) | | | 2,291 | | | 1,302 | | | 1,372 | | | (1,067 | ) |
| Earnings per share: | | | | | | | | | | | | | |
| Basic | | $ | 0.17 | | $ | 0.10 | | $ | 0.10 | | $ | (0.08 | ) |
| Diluted | | $ | 0.17 | | $ | 0.10 | | $ | 0.10 | | $ | (0.08 | ) |
| Weighted average common shares outstanding: | | | | | | | | | | | | | |
| Basic | | | 13,236,360 | | | 13,234,443 | | | 13,276,568 | | | 13,435,226 | |
| Diluted | | | 13,314,543 | | | 13,323,107 | | | 13,353,176 | | | 13,435,226 | |
——————
(1)
On March 23, 2006 as part of the restructuring, the Corporation sold approximately $86.3 million of available-for-sale securities, which were yielding less than 4 percent from its securities portfolio. The sale resulted in an after-tax charge of approximately $2.4 million and loss in the first quarter period ended March 31, 2006 of $(.08) per common share.
F-42
CENTER BANCORP, INC AND SUBSIDIARIES
NOTES TO CONSOLIDATED FINANCIAL STATEMENTS
Note 20 — Quarterly Financial Information Center Bancorp, Inc. (Unaudited) – (continued)
| | | | | | | | | | | | | |
| | | 2005 | |
| | | 4th Quarter | | 3rd Quarter | | 2nd Quarter | | 1st Quarter | |
| | | | (Dollars in Thousands, Except per Share Data) |
| | | | | | | | | | | | | |
| Total interest income | | $ | 13,636 | | $ | 13,574 | | $ | 12,337 | | $ | 10,956 | |
| Total interest expense | | | 6,848 | | | 6,419 | | | 5,488 | | | 4,541 | |
| Net interest income | | | 6,788 | | | 7,155 | | | 6,849 | | | 6,415 | |
| Provision for loan losses | | | 0 | | | 0 | | | 0 | | | 0 | |
| Total other income net of gains (losses) on securities sold | | | 810 | | | 970 | | | 891 | | | 815 | |
| Net gains (losses) on securities sold | | | (12 | ) | | 326 | | | 23 | | | 13 | |
| Other expense | | | 5,514 | | | 5,937 | | | 5,423 | | | 5,339 | |
| Income before income taxes | | | 2,072 | | | 2,514 | | | 2,340 | | | 1,904 | |
| Provision for income taxes | | | 140 | | | 478 | | | 407 | | | 159 | |
| Net income | | | 1,932 | | | 2,036 | | | 1,933 | | | 1,745 | |
| Earnings per share: | | | | | | | | | | | | | |
| Basic | | $ | 0.14 | | $ | 0.15 | | $ | 0.18 | | $ | 0.17 | |
| Diluted | | $ | 0.14 | | $ | 0.15 | | $ | 0.18 | | $ | 0.17 | |
| Weighted average common shares outstanding: | | | | | | | | | | | | | |
| Basic | | | 13,429,606 | | | 13,427,251 | | | 10,962,507 | | | 10,432,315 | |
| Diluted | | | 13,471,205 | | | 13,472,086 | | | 11,005,043 | | | 10,477,434 | |
F-43
Item 9. Changes In and Disagreements with Accountants on Accounting and Financial Disclosures As reported in its current Report on Form 8-K with the SEC, On May 5, 2006, the Audit Committee of the Board of Directors of Center Bancorp, Inc. (the “Corporation”) approved the dismissal of KPMG LLP (“KPMG”) as the Corporation’s principal accountants and appointed Beard Miller Company LLP as the Corporation’s principal accountants.
During the years ended December 31, 2004 and 2005, and during the subsequent period through the date on which such current report was filed, there were (1) no disagreements with KPMG on any matter of accounting principles or practices, financial statement disclosure, or auditing scope or procedures which disagreements, if not resolved to the satisfaction of KPMG, would have caused KPMG to make reference to the subject matter of such disagreements in connection with KPMG’s report on the Corporation’s financial statements for the years ended December 31, 2004 and 2005 or (2) other than with respect to the material weakness described below, no “reportable events” (as defined in Item 304(a)(v) of regulation S-K). Further, the audit reports of KPMG on the consolidated financial statements of Center Bancorp, Inc. and subsidiary as of and for the years ended December 31, 2005 and 2004 did not contain an adverse opinion or disclaimer of opinion, and were not qualified or modified as to uncertainty, audit scope or accounting principles.
KPMG’s audit report on the consolidated financial statements of Center Bancorp, Inc. and subsidiary as of and for the years ended December 31, 2005 and 2004 contained the following statement:
“We also have audited, in accordance with the standards of the Public Company Accounting Oversight Board (United States), the effectiveness of Center Bancorp, Inc. and subsidiaries’ internal control over financial reporting as of December 31, 2005, based on criteria established in Internal Control—Integrated Framework issued by the Committee of Sponsoring Organizations of the Treadway Commission (COSO), and our report dated March 8, 2006 expressed an unqualified opinion on management’s assessment of, and an adverse opinion on the effective operation of, internal control over financial reporting.”
In connection with its preparation of its consolidated financial statements as of and for the years ended December 31, 2005 and 2004, the Corporation identified a material weakness in internal control over financial reporting as of December 31, 2005 related to accounting for income taxes. Specifically, the Corporation did not employ an adequate number of skilled personnel in its tax department to prepare the reconciliation of internal tax schedules to the general ledger and supporting documentation in a timely manner, and there was inadequate and ineffective analysis and management review of the relevant documentation supporting the deferred tax accounts related to the accounting for an acquisition of a business. As a result, material misstatements were identified in the Corporation’s deferred tax assets and liabilities and income tax expense accounts. Further, there was more than a remote likelihood that a material misstatement of the Corporation’s interim or annual financial statements would not be prevented or detected. The Audit Committee discussed this material weakness with KPMG. KPMG was authorized by the Parent Corporation to fully respond to the inquiries on Beard Miller Company LLP concerning the material weakness.
The Corporation requested KPMG to furnish a letter, pursuant to Item 304(a)(3) SEC’s Regulation 8-k, addressed to the Securities and Exchange Commission, stating whether it agrees with the above statements. A copy of that letter was filed with the SEC on May 17, 2006.
During the Corporation’s recent fiscal years ended December 31, 2005 and December 31, 2004, and in the subsequent interim period through May 5, 2006 the Corporation did not consult with Beard Miller Company LLP regarding (1) the application of accounting principles to a specified transaction or the type of audit opinion that might be rendered on the Corporation’s financial statements or (2) any of the matters or events set forth in Item 304(a)(2)(ii) of Regulation S-K.
Item 9A. Controls and Procedures (a) Evaluation of Disclosure Controls and Procedures
The Corporation maintains disclosure controls and procedures that are designed to ensure that information required to be disclosed in its reports filed or submitted pursuant to the Securities Exchange Act of 1934, as amended (“Exchange Act”), is recorded, processed, summarized and reported within the time periods specified in the Securities and Exchange Commission’s rules and forms, and that information required to be disclosed by the
45
Corporation in its Exchange Act reports is accumulated and communicated to management, including the Corporation’s Chief Executive Officer and Chief Financial Officer, to allow timely decisions regarding required disclosure.
Under the supervision and with the participation of its management, including the Corporation’s Chief Executive Officer and Chief Financial Officer, the Corporation evaluated the effectiveness of the design and operation of the Corporation’s disclosure controls and procedures pursuant to Exchange Act Rule 13a-15(e) and 15d-15(e) as of December 31, 2006. Based upon that evaluation, the Corporation’s Chief Executive Officer and Chief Financial Officer concluded that the Corporation’s disclosure controls and procedures were effective as of such date described below in Management’s Report on Internal Control Over Financial Reporting (Item 9A(b)).
There have been no significant changes in the Corporation’s internal controls or in other factors that could significantly affect internal controls subsequent to the date of the evaluation.
(b) Management’s Report on Internal Control Over Financial Reporting
The Corporation’s management is responsible for establishing and maintaining adequate internal control over financial reporting as defined in Rules 13a-15(f) of the Exchange Act. The Corporation’s internal control system is a process designed to provide reasonable assurance to the Corporation’s management, Board of Directors and shareholders regarding the reliability of financial reporting and the preparation and fair presentation of financial statements for external reporting purposes in accordance with U.S. generally accepted accounting principles.
Our internal control over financial reporting includes policies and procedures that pertain to the maintenance of records that, in reasonable detail, accurately and fairly reflect transactions and dispositions of assets; provide reasonable assurances that transactions are recorded as necessary to permit preparation of financial statements in accordance with U.S. generally accepted accounting principles and that receipts and expenditures are being made only in accordance with authorizations of management and the directors of the Corporation; and provide reasonable assurance regarding prevention or timely detection of unauthorized acquisition, use or disposition of the Corporation’s assets that could have a material effect on our financial statements.
All internal control systems, no matter how well designed, have inherent limitations. Therefore, even those systems determined to be effective can provide only reasonable assurance with respect to financial statement preparation and presentation. Also, projections of any evaluation of effectiveness to future periods are subject to the risk that controls may become inadequate because of changes in conditions, or that the degree of compliance with the policies or procedures may deteriorate.
As part of the Corporation’s program to comply with Section 404 of the Sarbanes-Oxley Act of 2002, our management assessed the effectiveness of the Corporation’s internal control over financial reporting as of December 31, 2006. In making this assessment, management used the control criteria framework of the Committee of Sponsoring Organizations (“COSO”) of the Treadway Commission published in its report entitled Internal Control - Integrated Framework. Based on the Corporation’s evaluation under the framework in internal control- Integrated Framework, the Parent Corporation’s management concluded that the Corporation’s internal control over financial reporting was effective as a December 31, 2006.
Our management’s assessment of the effectiveness of our internal control over financial reporting as of December 31, 2006 has been audited by Beard Miller Company LLP, an independent registered public accounting firm, as stated in their report which is included herein.
(c) Attestation Report of Independent Registered Public Accounting Firm
The Board of Directors and Stockholders
Center Bancorp, Inc.
We have audited management’s assessment, included in the accompanying Management’s Report on Internal Control Over Financial Reporting (Item 9A(b)) that Center Bancorp, Inc. and subsidiaries (the Company) did not maintain effective internal control over financial reporting as of December 31, 2005, because of the effect of a material weakness identified in management’s assessment, based on criteria established in Internal Control—Integrated Framework issued by the Committee of Sponsoring Organizations of the Treadway Commission (COSO). The Corporation’s management is responsible for maintaining effective internal control over financial reporting and for its assessment of the effectiveness of internal control over financial reporting. Our responsibility is to express an
46
opinion on management’s assessment and an opinion on the effectiveness of the Corporation’s internal control over financial reporting based on our audit.
We conducted our audit in accordance with the standards of the Public Company Accounting Oversight Board (United States). Those standards require that we plan and perform the audit to obtain reasonable assurance about whether effective internal control over financial reporting was maintained in all material respects. Our audit included obtaining an understanding of internal control over financial reporting, evaluating management’s assessment, testing and evaluating the design and operating effectiveness of internal control, and performing such other procedures as we considered necessary in the circumstances. We believe that our audit provides a reasonable basis for our opinion.
A company’s internal control over financial reporting is a process designed to provide reasonable assurance regarding the reliability of financial reporting and the preparation of financial statements for external purposes in accordance with U.S. generally accepted accounting principles. A company’s internal control over financial reporting includes those policies and procedures that (1) pertain to the maintenance of records that, in reasonable detail, accurately and fairly reflect the transactions and dispositions of the assets of the company; (2) provide reasonable assurance that transactions are recorded as necessary to permit preparation of financial statements in accordance with U.S. generally accepted accounting principles, and that receipts and expenditures of the company are being made only in accordance with authorizations of management and directors of the company; and (3) provide reasonable assurance regarding prevention or timely detection of unauthorized acquisition, use, or disposition of the company’s assets that could have a material effect on the financial statements.
Because of its inherent limitations, internal control over financial reporting may not prevent or detect misstatements. Also, projections of any evaluation of effectiveness to future periods are subject to the risk that controls may become inadequate because of changes in conditions, or that the degree of compliance with the policies or procedures may deteriorate.
We also have audited, in accordance with the standards of the Public Company Accounting Oversight Board (United States), the consolidated balance sheets of Center Bancorp, Inc. and subsidiaries as of December 31, 2005 and 2004, and the related consolidated statements of operations, changes in stockholders’ equity and cash flows for each of the years in the three year period ended December 31, 2006.
In our opinion, management’s assessment that the Corporation did maintain effective internal control over financial reporting as of December 31, 2006, is fairly stated, in all material respects, based on criteria established in Internal Control — Integrated Framework issued by the Committee of Sponsoring Organizations of the Treadway Commission (COSO).
(d) Changes in Internal Controls Over Financial Reporting
There were no changes in the Corporation’s internal control over financial reporting, as such term is defined in Rules 13a-15(f) and 15d-15(f) under the Exchange Act, during the last fiscal quarter of the period covered by this report that have materially affected, or are reasonably likely to materially affect, the Corporation’s internal control over financial reporting, subsequent to December 31, 2006.
Item 9B. Other Information None.
47
Item 10. Directors and Corporate Governance The Corporation responds to this item by incorporating herein by reference the material responsive to such item in the Corporation’s definitive proxy statement for its 2007 Annual Meeting of Stockholders. Certain information on Executive Officers of the registrant is included in Part I, Item 4A of this report, which is also incorporated herein by reference.
The Corporation maintains a code of ethics applicable to the Corporation’s chief executive officer, senior financial professional personnel (including the Corporation’s chief financial officer, principal accounting officer or controller and persons performing similar transactions), all other executive officers and all directors. The Corporation also maintains a code of conduct applicable to all other employees. Copies of both codes were filed as exhibits to the Corporation’s Annual Report on Form 10-K for the year ended December 31, 2005. The corporation will provide copies of such codes to any person without charge, upon request to Anthony C. Weagley, Vice President and Treasurer, Center Bancorp, Inc., 2455 Morris Avenue, Union, NJ 07083.
Item 11. Executive Compensation The Corporation responds to this item by incorporating herein by reference the material responsive to such item in the Corporation’s definitive proxy statement for its 2007 Annual Meeting of Stockholders.
Item 12. Security Ownership of Certain Beneficial Owners and Management The Corporation responds to this item by incorporating herein by reference the material responsive to such item in the Corporation’s definitive proxy statement for its 2007 Annual Meeting of Stockholders.
Item 13. Certain Relationships and Related Transactions The Corporation responds to this item by incorporating herein by reference the material responsive to such item in the Corporation’s definitive proxy statement for its 2007 Annual Meeting of Stockholders.
Item 14. Principal Accountant Fees and Services The Corporation responds to this item by incorporating herein by reference the material responsive to such item in the Corporation’s definitive proxy statement for its 2007 Annual Meeting of Stockholders.
48
Item 15. Exhibits, Financial Statement Schedules a.
(1) Financial Statements and Schedules:
The following Financial Statements and Supplementary Data are filed as part of this annual report:
Consolidated Statements of Condition
Consolidated Statements of Income
Consolidated Statements of Changes in Stockholders’ Equity
Consolidated Statements of Cash Flows
Notes to Consolidated Financial Statements
Report of Independent Registered Public Accounting Firm
b.
Exhibits (numbered in accordance with Item 601 of Regulation S-K) filed herewith incorporated by reference as part of this annual report.
| | |
Exhibit No. | | Description |
| | | |
| 2.1 | | Amended and Restated Agreement and plan of Merger dated as of December 17,2004, by and between the Registrant and Red Oak Bank, is incorporated by reference to the Registrants Current Report on Form 8-K dated March 8, 2005. |
| 3.1 | | Certificate of Incorporation of the Registrant is incorporated by reference to exhibit 3.1 to the Registrant’s Quarterly Report on Form 10-Q for the quarter ended March 31, 2002. |
| 3.2 | | By-Laws of the Registrant is incorporated by reference to exhibit 3.2 to the Registrant’s Annual Report on Form 10K for the year ended December 31, 1998. |
| 10.1 | | Amended and restated employment agreement among the Registrant, its bank subsidiary and John F. McGowan, effective as of January 1, 2007. |
| 10.2 | | Amended and restated employment agreement among the Registrant, its bank subsidiary and John J. Davis effective January 1, 2007, is incorporated by reference to exhibit 10.1 to the Registrant’s current Report on Form 8-K filed with the SEC on February 26, 2007. |
| 10.3 | | The Registrant’s 1993 Employee Stock Option Plan is incorporated by reference to exhibit 10.3 to the Registrant’s Annual Report on Form 10-K for the year ended December 31, 1993. |
| 10.4 | | The Registrant’s 1993 Outside Director Stock Option Plan is incorporated by reference to exhibit 10.4 to the Registrant’s Annual Report on Form 10-K for the year ended December 31, 1993. |
| 10.5 | | Supplemental Executive Retirement Plans (“SERPS”) are incorporated by reference to exhibit 10.5 to the Registrant’s Annual Report on Form 10-K for the year ended December 31, 1994. |
| 10.6 | | The Registrant’s Annual Incentive Plan. |
| 10.7 | | Amended and restated employment agreement among the Registrant, its bank subsidiary and Anthony C. Weagley, effective as of January 1, 2007 is incorporated by reference to exhibit 10.2 to the Registrant’s current Report on Form 8-K filed with the SEC on February 26, 2007. |
| 10.8 | | Amended and restated employment agreement among the Registrant, its bank subsidiary and Lori A. Wunder, effective as of January 1, 2007 is incorporated by reference to exhibit 10.3 to the Registrant’s current Report on Form 8-K filed with the SEC on February 26, 2007. |
| 10.9 | | A change in control agreement among the Registrant, its bank subsidiary and Charles E. Nunn, Jr., effective as of January 1, 2007, is incorporated by reference to exhibit 10.5 the Registrants current Report on Form 8-K filed with the SEC on February 26, 2007. |
| 10.10 | | Directors’ Retirement Plan is incorporated by reference to exhibit 10.10 to the Registrant’s Annual Report on Form 10K for the year ended December 31, 1998. |
| 10.11 | | Center Bancorp, Inc. 1999 Stock Incentive Plan is incorporated by reference to exhibit 10.11 to the Registrant’s Annual Report on Form 10K for the year ended December 31, 1999. |
49
| | |
Exhibit No. | | Description |
| | | |
| 10.12 | | Registrant’s Placement Agreement dated December 12, 2003 with Sandler O’Neill & Partners, L.P. to issue and sell $5 million aggregate liquidation amount of floating rate MMCapS(SM) Securities is incorporated by reference to Exhibit 10.15 of the Registrant’s Annual Report on Form 10-K for the year ended December 31, 2003. |
| 10.13 | | Indenture dated as of December 19, 2003, between the Registrant and Wilmington Trust Company relating to $5.0 million aggregate principal amount of floating rate debentures is incorporated by reference to Exhibit 10.16 of the Registrant’s Annual Report on Form 10-K for the year ended December 31, 2003. |
| 10.14 | | Amended and restated Declaration of Trust of Center Bancorp Statutory Trust II, dated as of December 19, 2003 is incorporated by reference to Exhibit 10.17 of the Registrant’s Annual Report on Form 10-K for the year ended December 31, 2003. |
| 10.15 | | Guarantee agreement between Registrant and Wilmington Trust Company dated as of December 19, 2003 is incorporated by reference to Exhibit 10.18 of the Registrant’s Annual Report on Form 10-K for the year ended December 31, 2003. |
| 10.16 | | Senior Officer Protection Plan is incorporated by reference to Exhibit 10.19 of the Registrant’s Annual Report on Form 10-K for the year ended December 31, 2003. |
| 10.17 | | Stock Purchase Agreement, dated September 29, 2004, relating to a September 2004 private placement of securities, is incorporated by reference to Exhibit 10.1 to the Registrant’s Current Report on Form 8-K dated October 1, 2004. |
| 10.18 | | Registration Rights Agreement, dated September 29, 2004, relating to securities issued in a September 2004 private placement of securities, is incorporated by reference to Exhibit 10.2 to the Registrant’s Current Report on Form 8-K dated October 1, 2004. |
| 10.19 | | The Registrant’s 2003 Non-Employee Director Stock Option Plan is incorporated by reference to Exhibit C to the Registrant’s proxy statement for its 2004 annual meeting of shareholders. |
| 10.20 | | Amended and restated employment Agreement among the Registrant, its bank subsidiary and Julie D’Aloia, effective as of January 1, 2007. |
| 10.21 | | Amended and restated employment Agreement among the Registrant, its bank subsidiary and Mark S. Cardone, effective as of January 1, 2007, is incorporated by reference to Exhibit 10.4 to the Registrants current Report on Form 8-K filed with the SEC on February 26, 2007. |
| 10.22 | | Stock Purchase Agreement, dated June 30, 2005, relating to a June 2005 private placement of securities, is incorporated by reference to Exhibit 10.1 to the Registrant’s Current Report on Form 8-K dated June 30, 2005. |
| 10.23 | | Registration Rights Agreement, dated June 30, 2005, relating to securities issued in a June 2005 private placement of securities, is incorporated by reference to Exhibit 10.2 to the Registrant’s Current Report on Form 8-K dated June 30, 2005. |
| 10.24 | | Change in control agreement among the Registrant, its bank subsidiary and Christopher M. Gorey, dated as of January 1, 2007. |
| 10.25 | | Open Market Share Purchase Incentive Plan is incorporated by reference to exhibit 10.1 to registrant’s current report on Form 8-K dated January 26, 2006. |
| 10.26 | | Deferred Compensation Plan. |
| 11.1 | | Statement regarding computation of per share earnings is omitted because the computation can be clearly determined from the material incorporated by reference in this Report. |
| 14.1 | | Code of Ethics is incorporated by reference to Exhibit 14.1 of the Registrant’s Annual Report on Form 10-K for the year ended December 31, 2003. |
| 16.1 | | Letter from KPMG LLP dated May 16, 2006 is incorporated by reference to Exhibit 16.1 to the Registrant’s current Report on Form 8-K filed with the SEC on May 17, 2006. |
| 21.1 | | Subsidiaries of the Registrant. |
50
| | |
Exhibit No. | | Description |
| | | |
| 23.1 | | Consent of Independent Registered Public Accounting Firm. |
| 23.2 | | Consent of KPMG LLP |
| 24.1 | | Power of Attorney. |
| 31.1 | | Personal certification of the chief executive officer pursuant to section 302 of the Sarbanes-Oxley Act of 2002. |
| 31.2 | | Personal certification of the chief financial officer pursuant to section 302 of the Sarbanes-Oxley Act of 2002. |
| 32.1 | | Personal certification of the chief executive officer pursuant to section 906 of the Sarbanes-Oxley Act of 2002. |
| 32.2 | | Personal certification of the chief financial officer pursuant to section 906 of the Sarbanes-Oxley Act of 2002. |
| 99.1 | | Code of conduct is incorporated by reference to Exhibit 99.1 to the Registrant’s Annual Report on Form 10-K for the year ended December 31, 2003. |
c. Financial Statement Schedules
All financial statement schedules are omitted because they are either inapplicable or not required, or because the required information is included in the Consolidated Financial Statements or notes thereto.
51
Pursuant to the requirements of Section 13 or 15(d) of the Securities Exchange Act of 1934, Center Bancorp Inc. has duly caused this report to be signed on its behalf by the undersigned, thereunto duly authorized.
| | |
| March 15, 2007 | CENTER BANCORP, INC. |
| | | |
| | By: | /s/ JOHN J. DAVIS |
| | | John J. Davis |
| | | President and Chief Executive Officer |
Pursuant to the requirements of the Securities Exchange Act of 1934, the following persons on behalf of the Registrant, in the capacities described below on March 15, 2007, have signed this report below.
| | | |
| | | | |
| /s/ ALEXANDER BOL * | | | /s/ HUGO BARTH, III * |
| Alexander A. Bol | | | Hugo Barth, III |
| Director and Chairman of the Board | | | Director |
| | | | |
| /s/ JOHN J. DAVIS * | | | /s/ DONALD G. KEIN * |
| John J. Davis | | | Donald G. Kein |
President and Chief Executive Officer
and Director | | | Director |
| | | | |
| /s/ JAMES J. KENNEDY * | | | /s/ HERBERT SCHILLER * |
| James J. Kennedy | | | Herbert Schiller |
| Director | | | Director |
| | | | |
| /s/ PAUL LOMAKIN, JR. * | | | /s/ NORMAN F. SCHROEDER * |
| Paul Lomakin, Jr. | | | Norman F. Schroeder |
| Director | | | Director |
| | | | |
| /s/ EUGENE V. MALINOWSKI * | | | /s/ BRENDA CURTIS * |
| Eugene V. Malinowski | | | Brenda Curtis |
| Director | | | Director |
| | | | |
| /s/ KENNETH W. BATTIATO* | | | /s/ STEPHEN J. LaMONT * |
| Kenneth W. Battiato | | | Stephen J. LaMont |
| Director | | | Director |
| | | | |
| /s/ WILLIAM THOMPSON * | | | /s/ JOHN DeLANEY * |
| William Thompson | | | John DeLaney |
| Director | | | Director |
| | | | |
| * /s/ ANTHONY C. WEAGLEY | | | /s/ ANTHONY C. WEAGLEY |
| Anthony C. Weagley | | | Anthony C. Weagley |
| Attorney-in-Fact | | | Vice President & Treasurer
(Chief Accounting and Financial Officer) |
CENTER BANCORP, INC.
EXHIBIT INDEX
| | |
Exhibit No. | | Description |
| | | |
| 2.1 | | Amended and Restated Agreement and plan of Merger dated as of December 17,2004, by and between the Registrant and Red Oak Bank, is incorporated by reference to the Registrants Current Report on Form 8-K dated March 8, 2005. |
| 3.1 | | Certificate of Incorporation of the Registrant is incorporated by reference to exhibit 3.1 to the Registrant’s Quarterly Report on Form 10-Q for the quarter ended March 31, 2002. |
| 3.2 | | By-Laws of the Registrant is incorporated by reference to exhibit 3.2 to the Registrant’s Annual Report on Form 10K for the year ended December 31, 1998. |
| 10.1 | | Amended and restated employment agreement among the Registrant, its bank subsidiary and John F. McGowan, effective as of January 1, 2007. |
| 10.2 | | Amended and restated employment agreement among the Registrant, its bank subsidiary and John J. Davis effective January 1, 2007, is incorporated by reference to exhibit 10.1 to the Registrant’s current Report on Form 8-K filed with the SEC on February 26, 2007. |
| 10.3 | | The Registrant’s 1993 Employee Stock Option Plan is incorporated by reference to exhibit 10.3 to the Registrant’s Annual Report on Form 10-K for the year ended December 31, 1993. |
| 10.4 | | The Registrant’s 1993 Outside Director Stock Option Plan is incorporated by reference to exhibit 10.4 to the Registrant’s Annual Report on Form 10-K for the year ended December 31, 1993. |
| 10.5 | | Supplemental Executive Retirement Plans (“SERPS”) are incorporated by reference to exhibit 10.5 to the Registrant’s Annual Report on Form 10-K for the year ended December 31, 1994. |
| 10.6 | | The Registrant’s Annual Incentive Plan. |
| 10.7 | | Amended and restated employment agreement among the Registrant, its bank subsidiary and Anthony C. Weagley, effective as of January 1, 2007 is incorporated by reference to exhibit 10.2 to the Registrant’s current Report on Form 8-K filed with the SEC on February 26, 2007. |
| 10.8 | | Amended and restated employment agreement among the Registrant, its bank subsidiary and Lori A. Wunder, effective as of January 1, 2007 is incorporated by reference to exhibit 10.3 to the Registrant’s current Report on Form 8-K filed with the SEC on February 26, 2007. |
| 10.9 | | A change in control agreement among the Registrant, its bank subsidiary and Charles E. Nunn, Jr., effective as of January 1, 2007, is incorporated by reference to exhibit 10.5 the Registrants current Report on Form 8-K filed with the SEC on February 26, 2007. |
| 10.10 | | Directors’ Retirement Plan is incorporated by reference to exhibit 10.10 to the Registrant’s Annual Report on Form 10K for the year ended December 31, 1998. |
| 10.11 | | Center Bancorp, Inc. 1999 Stock Incentive Plan is incorporated by reference to exhibit 10.11 to the Registrant’s Annual Report on Form 10K for the year ended December 31, 1999. |
| 10.12 | | Registrant’s Placement Agreement dated December 12, 2003 with Sandler O’Neill & Partners, L.P. to issue and sell $5 million aggregate liquidation amount of floating rate MMCapS(SM) Securities is incorporated by reference to Exhibit 10.15 of the Registrant’s Annual Report on Form 10-K for the year ended December 31, 2003. |
| 10.13 | | Indenture dated as of December 19, 2003, between the Registrant and Wilmington Trust Company relating to $5.0 million aggregate principal amount of floating rate debentures is incorporated by reference to Exhibit 10.16 of the Registrant’s Annual Report on Form 10-K for the year ended December 31, 2003. |
| 10.14 | | Amended and restated Declaration of Trust of Center Bancorp Statutory Trust II, dated as of December 19, 2003 is incorporated by reference to Exhibit 10.17 of the Registrant’s Annual Report on Form 10-K for the year ended December 31, 2003. |
| | |
Exhibit No. | | Description |
| | | |
| 10.15 | | Guarantee agreement between Registrant and Wilmington Trust Company dated as of December 19, 2003 is incorporated by reference to Exhibit 10.18 of the Registrant’s Annual Report on Form 10-K for the year ended December 31, 2003. |
| 10.16 | | Senior Officer Protection Plan is incorporated by reference to Exhibit 10.19 of the Registrant’s Annual Report on Form 10-K for the year ended December 31, 2003. |
| 10.17 | | Stock Purchase Agreement, dated September 29, 2004, relating to a September 2004 private placement of securities, is incorporated by reference to Exhibit 10.1 to the Registrant’s Current Report on Form 8-K dated October 1, 2004. |
| 10.18 | | Registration Rights Agreement, dated September 29, 2004, relating to securities issued in a September 2004 private placement of securities, is incorporated by reference to Exhibit 10.2 to the Registrant’s Current Report on Form 8-K dated October 1, 2004. |
| 10.19 | | The Registrant’s 2003 Non-Employee Director Stock Option Plan is incorporated by reference to Exhibit C to the Registrant’s proxy statement for its 2004 annual meeting of shareholders. |
| 10.20 | | Stock Purchase Agreement, dated September 29, 2004, relating to a September 2004 private placement of securities, is incorporated by reference to Exhibit 10.1 to the Registrant’s Current Report on Form 8-K dated October 1, 2004. |
| 10.21 | | Registration Rights Agreement, dated September 29, 2004, relating to securities issued in a September 2004 private placement of securities, is incorporated by reference to Exhibit 10.2 to the Registrant’s Current Report on Form 8-K dated October 1, 2004. |
| 10.22 | | The Registrant’s 2003 Non-Employee Director Stock Option Plan is incorporated by reference to Exhibit C to the Registrant’s proxy statement for its 2004 annual meeting of shareholders. |
| 10.23 | | Employment Agreement between the Registrant and Julie D’Aloia, dated as of January 1, 2001. Is incorporated by reference to exhibit 10.23 to the Registrant’s Annual Report on Form 10-K for the year ended December 31, 2004. |
| 10.24 | | Employment Agreement between the Registrant and Mark S. Cardone, dated as of January 1, 2003, is incorporated by reference to exhibits 10.24 to the Registrants Annual Report o Form 10-K for the year ended December 31, 2005. |
| 10.25 | | Stock Purchase Agreement, dated June 30, 2005, relating to a June 2005 private placement of securities, is incorporated by reference to Exhibit 10.1 to the Registrant’s Current Report on Form 8-K dated June 30, 2005. |
| 10.26 | | Registration Rights Agreement, dated June 30, 2005, relating to securities issued in a June 2005 private placement of securities, is incorporated by reference to Exhibit 10.2 to the Registrant’s Current Report on Form 8-K dated June 30, 2005. |
| 11.1 | | Statement regarding computation of per share earnings is omitted because the computation can be clearly determined from the material incorporated by reference in this Report. |
| 13.1 | | Parts of Registrant’s Annual Report to Shareholders for the year ended December 31, 2005. |
| 14.1 | | Code of Ethics is incorporated by reference to Exhibit 14.1 of the Registrant’s Annual Report on Form 10-K for the year ended December 31, 2003. |
| 21.1 | | Subsidiaries of the Registrant. |
| 23.1 | | Consent of Independent Registered Public Accounting Firm. |
| 24.1 | | Power of Attorney. |
| 31.1 | | Personal certification of the chief executive officer pursuant to section 302 of the Sarbanes-Oxley Act of 2002. |
| 31.2 | | Personal certification of the chief financial officer pursuant to section 302 of the Sarbanes-Oxley Act of 2002. |
| | |
Exhibit No. | | Description |
| | | |
| 32.1 | | Personal certification of the chief executive officer pursuant to section 906 of the Sarbanes-Oxley Act of 2002. |
| 32.2 | | Personal certification of the chief financial officer pursuant to section 906 of the Sarbanes-Oxley Act of 2002. |
| 99.1 | | Code of conduct is incorporated by reference to Exhibit 99.1 to the Registrant’s Annual Report on Form 10-K for the year ended December 31, 2003. |
| 10.20 | | Amended and restated employment Agreement among the Registrant, its bank subsidiary and Julie D’Aloia, effective as of January 1, 2007. |
| 10.21 | | Amended and restated employment Agreement among the Registrant, its bank subsidiary and Mark S. Cardone, effective as of January 1, 2007, is incorporated by reference to Exhibit 10.4 to the Registrants current Report on Form 8-K filed with the SEC on February 26, 2007. |
| 10.22 | | Stock Purchase Agreement, dated June 30, 2005, relating to a June 2005 private placement of securities, is incorporated by reference to Exhibit 10.1 to the Registrant’s Current Report on Form 8-K dated June 30, 2005. |
| 10.23 | | Registration Rights Agreement, dated June 30, 2005, relating to securities issued in a June 2005 private placement of securities, is incorporated by reference to Exhibit 10.2 to the Registrant’s Current Report on Form 8-K dated June 30, 2005. |
| 10.24 | | Change in control agreement among the Registrant, its bank subsidiary and Christopher M. Gorey, dated as of January 1, 2007. |
| 10.25 | | Open Market Share Purchase Incentive Plan. |
| 10.26 | | Deferred Compensation Plan. |
| 11.1 | | Statement regarding computation of per share earnings is omitted because the computation can be clearly determined from the material incorporated by reference in this Report. |
| 14.1 | | Code of Ethics is incorporated by reference to Exhibit 14.1 of the Registrant’s Annual Report on Form 10-K for the year ended December 31, 2003. |
| 16.1 | | Letter from KPMG LLP dated May 16, 2006 is incorporated by reference to Exhibit 16.1 to the Registrant’s current Report on Form 8-K filed with the SEC on May 17, 2006. |
| 21.1 | | Subsidiaries of the Registrant. |
| 23.1 | | Consent of Independent Registered Public Accounting Firm. |
| 23.2 | | Consent of KPMG LLP |
| 24.1 | | Power of Attorney. |
| 31.1 | | Personal certification of the chief executive officer pursuant to section 302 of the Sarbanes-Oxley Act of 2002. |
| 31.2 | | Personal certification of the chief financial officer pursuant to section 302 of the Sarbanes-Oxley Act of 2002. |
| 32.1 | | Personal certification of the chief executive officer pursuant to section 906 of the Sarbanes-Oxley Act of 2002. |
| 32.2 | | Personal certification of the chief financial officer pursuant to section 906 of the Sarbanes-Oxley Act of 2002. |
| 99.1 | | Code of conduct is incorporated by reference to Exhibit 99.1 to the Registrant’s Annual Report on Form 10-K for the year ended December 31, 2003. |