 The PNC Financial Services Group, Inc. BancAnalysts Association of Boston 26 th Annual Conference November 8, 2007 Exhibit 99.1 |
 This presentation contains forward-looking statements regarding our outlook or expectations relating to PNC’s future business, operations, financial condition, financial performance and asset quality. Forward-looking statements are necessarily subject to numerous assumptions, risks and uncertainties, which change over time. The forward-looking statements in this presentation are qualified by the factors affecting forward-looking statements identified in the more detailed Cautionary Statement included in the Appendix, which is included in the version of the presentation materials posted on our corporate website at www.pnc.com/investorevents. We provide greater detail regarding these factors in our 2006 Form 10-K, including in the Risk Factors and Risk Management sections, and in our current quarter 2007 Form 10-Q and other SEC reports (accessible on the SEC’s website at www.sec.gov and on or through our corporate website). Future events or circumstances may change our outlook or expectations and may also affect the nature of the assumptions, risks and uncertainties to which our forward-looking statements are subject. The forward-looking statements in this presentation speak only as of the date of this presentation. We do not assume any duty and do not undertake to update those statements. In this presentation, we will sometimes refer to adjusted results to help illustrate the impact of the deconsolidation of BlackRock near the end of third quarter 2006 and the impact of certain types of items. Adjusted results reflect, as applicable, the following types of adjustments: (1) 2006 periods reflect the impact of the deconsolidation of BlackRock by adjusting as if we had recorded our BlackRock investment on the equity method prior to its deconsolidation; (2) adjusting the 2006 periods to exclude the impact of the third quarter 2006 gain on the BlackRock/MLIM transaction and losses on the repositioning of PNC’s securities and mortgage loan portfolios; (3) adjusting fourth quarter 2006 and the 2007 periods to exclude the net mark-to-market adjustments on PNC’s remaining BlackRock LTIP shares obligation and, as applicable, the gain PNC recognized in first quarter 2007 in connection with the company’s transfer of BlackRock shares to satisfy a portion of its BlackRock LTIP shares obligation; (4) adjusting all 2007 and 2006 periods to exclude, as applicable, integration costs related to acquisitions and to the BlackRock/MLIM transaction; and (5) adjusting, as appropriate, for the tax impact of these adjustments. We have provided these adjusted amounts and reconciliations so that investors, analysts, regulators and others will be better able to evaluate the impact of these items on our results for the periods presented, in addition to providing a basis of comparability for the impact of the BlackRock deconsolidation given the magnitude of the impact of deconsolidation on various components of our income statement and balance sheet. We believe that information as adjusted for the impact of the specified items may be useful due to the extent to which these items are not indicative of our ongoing operations as the result of our management activities on those operations. While we have not provided other adjustments for the periods discussed, this is not intended to imply that there could not have been other similar types of adjustments, but any such adjustments would not have been similar in magnitude to the amount of the adjustments shown. In certain discussions, we may also provide revenue information on a taxable-equivalent basis by increasing the interest income earned on tax-exempt assets to make it fully equivalent to interest income earned on taxable investments. We believe this adjustment may be useful when comparing yields and margins for all earning assets. This presentation may also include a discussion of other non-GAAP financial measures, which, to the extent not so qualified therein or in the Appendix, is qualified by GAAP reconciliation information available on our corporate website at www.pnc.com under “About PNC – Investor Relations.” Cautionary Statement Regarding Forward-Looking Information and Adjusted Information |
 State of the markets PNC is well-positioned for this environment Leveraging our position to capture opportunities Key Take-aways |
 Media Outlets Paint a Gloomy Picture “Another Subprime Lender Files for Bankruptcy” February 2007, MoneyNews “Cash Sources Dry Up for Subprime Mortgage Lenders” March 2007, USAToday “Those Who Profited from Subprimes Now Suffer Too” August 2007, MotherJones “Bond Funds Could Get Hit by Mortgage Mess” September 2007, MSNBC.com “The Real Credit Crunch Has Only Just Begun” September 2007, Money Week “Backlog of Leveraged Loans Still Unnerves Credit Markets” October 2007, Wall Street Journal Estimated credit Estimated credit and liquidity and liquidity related charges related charges in 3Q07 in 3Q07 $35 Billion $35 Billion “PIK-Toggle Notes…Risky Debt Issuances Stage Revival” October 2007, Wall Street Journal |
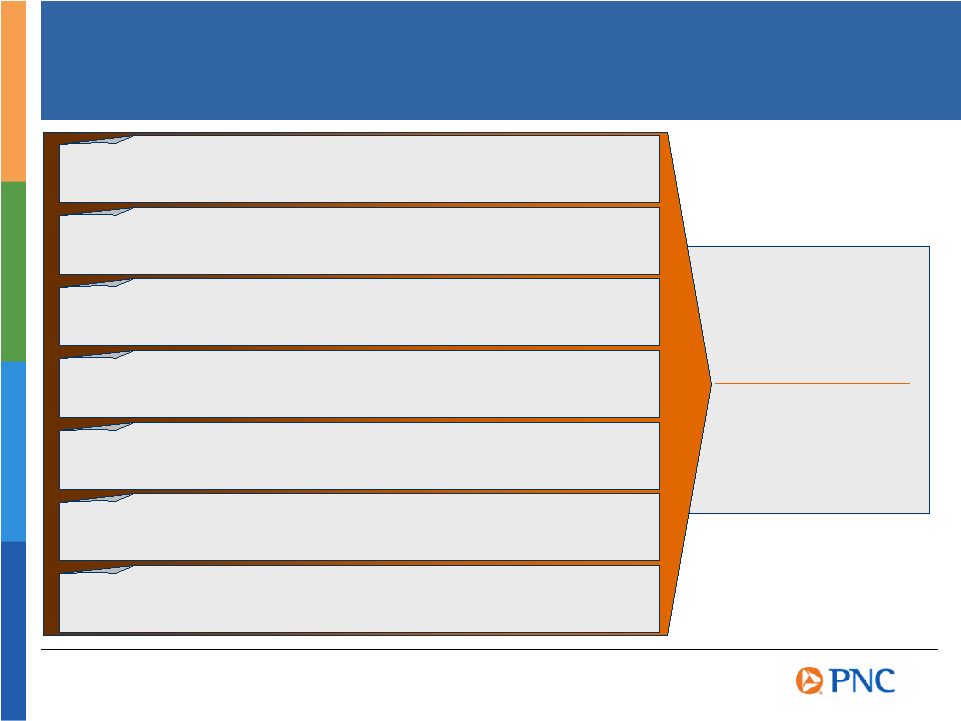
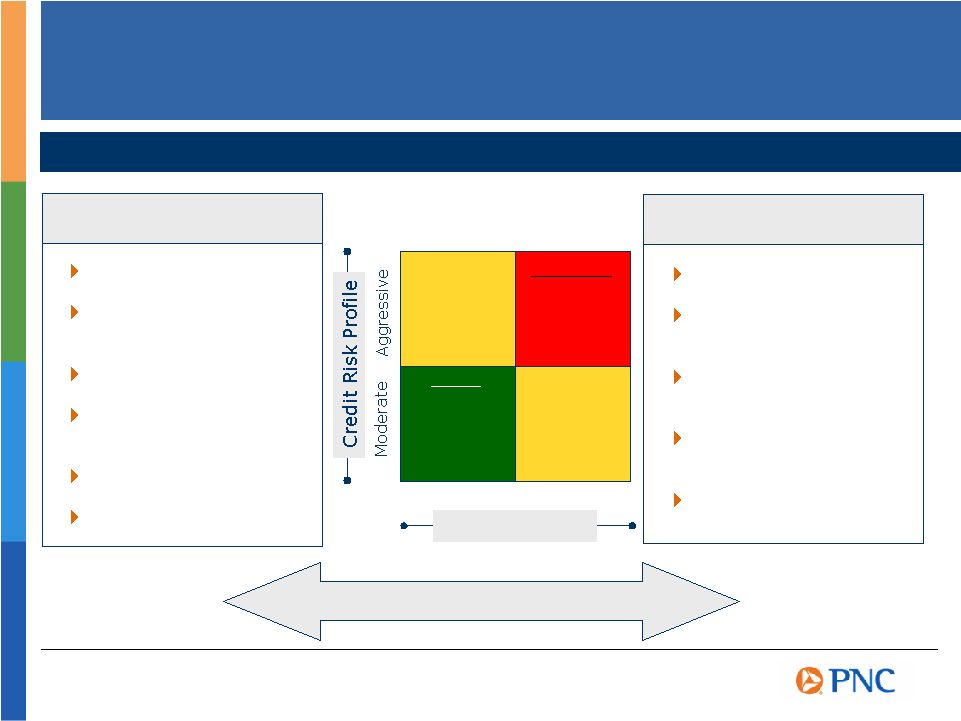 Assessing One’s Current Position Credit Factors Liquidity Factors Liquidity Profile Subprime/Alt-A Commercial real estate Leveraged lending Warehouse/ syndications Structures SIVs Loans to deposits Contingent funding exposure Securities book profile Capital generation ability Access to the discount window Strategy and Business Mix Dictate Ability to Respond High Low Flexible Core funded Positive operating leverage Total return focus High fee mix Estimated 3Q07 Related Costs for the Industry >$5B >$5B >$30B >$30B Less flexible Focus on NIM High cost funding Negative operating leverage NII dependent |
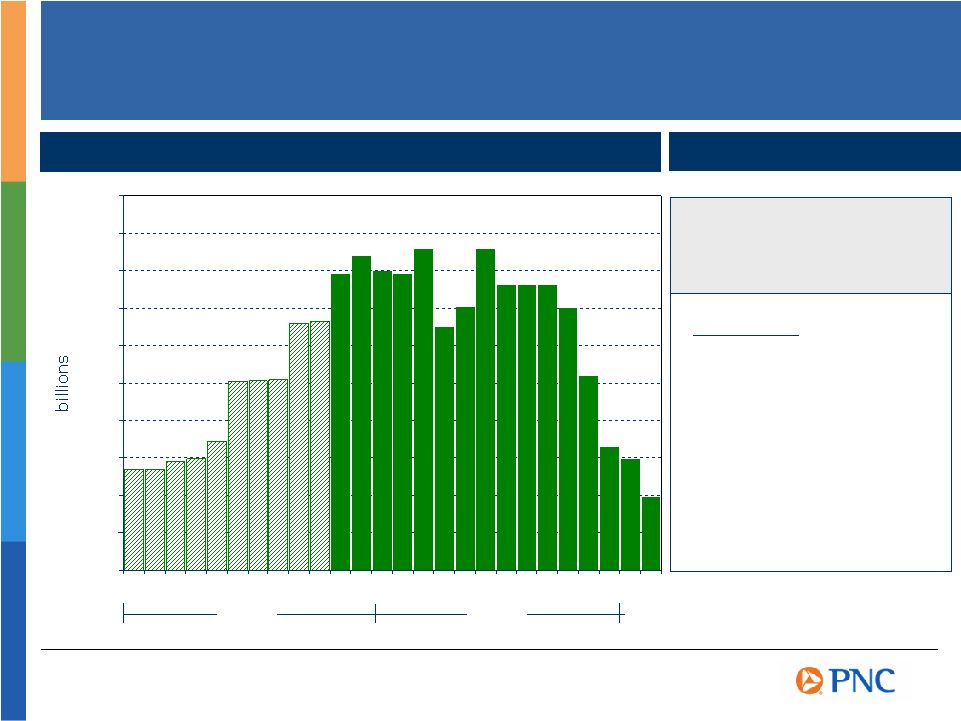 $0 $5 $10 $15 $20 $25 $30 $35 $40 $45 $50 J F M A M J J A S O N D J F M A M J J A S O N D J F Average Default Rate of Adjustable-Rate Subprime RMBS Originated 2000-2006 (% Unpaid Principal Balance) 2009 Subprime Mortgage Resets – Still Early in the Cycle Estimated Subprime Loans with Higher Rate Resets… Sources: LoanPerformance, Deutsche Bank, BlackRock, Intex, FBR ABS Research 2007 2008 12 mos. 3.2 % 24 mos. 6.8 36 mos. 11.5 48 mos. 14.6 60 mos. 19.1 72 mos. 20.4 Seasoning and a Sense of Foreboding |
 0 2 4 6 8 10 12 14 Default Rates are Still at a Low Point U.S. Speculative-Grade Bond Default Rate 1983 1985 1989 1991 1993 1999 1995 1997 2001 2003 1987 2005 2007 Long-term average 4.54% Source: Standard & Poor’s Global Fixed Income Research Recession U.S. Speculative-grade default rate (%) |
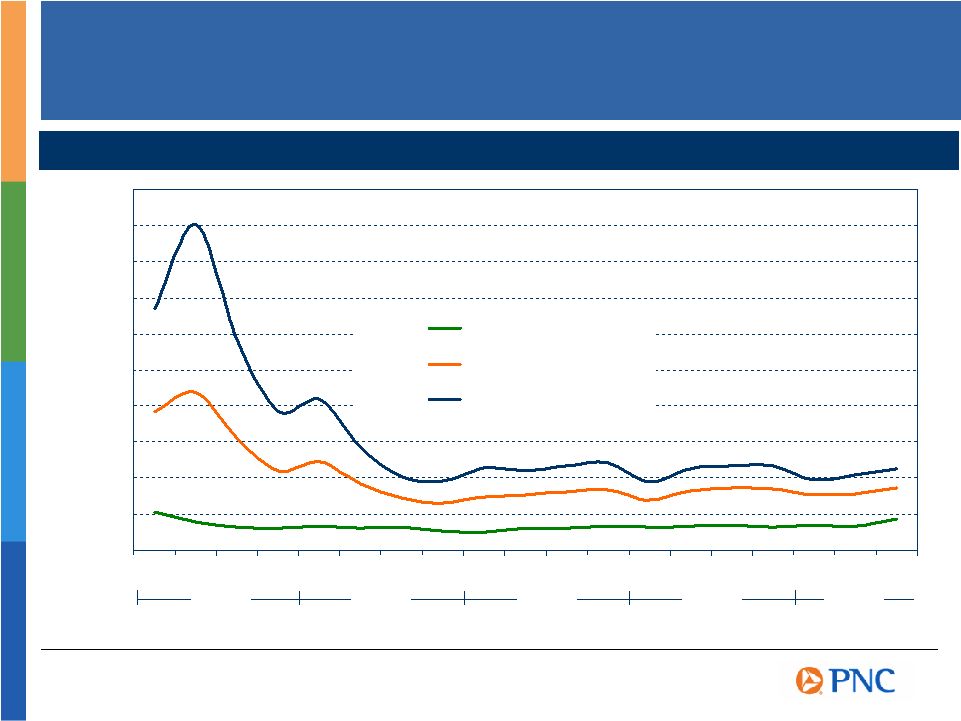 0 200 400 600 800 1,000 1,200 1,400 1,600 1,800 2,000 1Q 2Q 3Q 4Q 1Q 2Q 3Q 4Q 1Q 2Q 3Q 4Q 1Q 2Q 3Q 4Q 1Q 2Q 3Q 10 Year BBB 10 Year B 10 Year CCC Pricing – No Bargains Yet Spread Between Corporate Debt and 10-Year Treasury, bps Source: RiskMetrics Group 2003 2004 2005 2006 2007 |
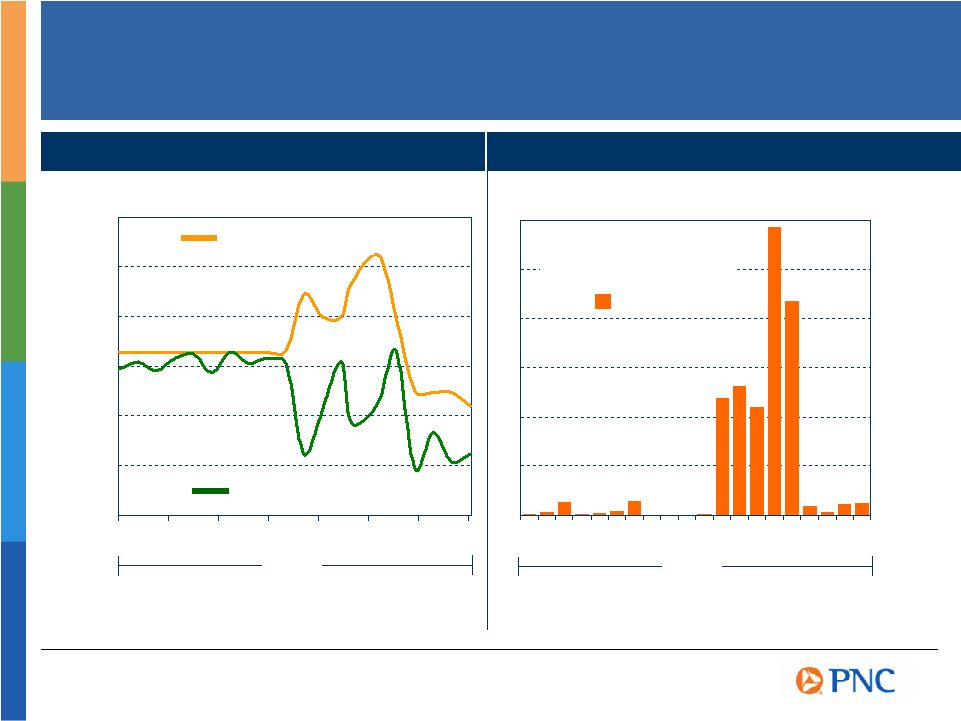 4.50% 4.75% 5.00% 5.25% 5.50% 5.75% 6.00% Fed Funds Ongoing Liquidity Pressures 1 Month LIBOR Source: SNL DataSource $0 $500 $1,000 $1,500 $2,000 $2,500 $3,000 Diverging Yields Liquidity Needs Weekly average primary credit borrowings from the Fed millions Source: Federal Reserve June 4 July August September October 22 2007 June July August September October 2007 |
 State of the markets PNC is well-positioned for this environment Leveraging our position to capture opportunities Key Take-aways PNC |
 WFC 7.92 % NCC 7.33 BBT 7.11 RF 6.95 KEY 6.92 CMA 6.91 USB 6.90 WB 6.88 FITB 6.74 STI 6.62 PNC 6.37 Moderate Risk Profile Reflected in Absolute Yields Focus on Total Risk-adjusted Returns PNC For the three months ended September 30, 2007. Source: SNL DataSource, PNC as reported 3Q07 Focus on Risk-adjusted Lending 3Q07 Yield on Total Loans Yield on Interest Earning Assets WFC 8.35 % BBT 7.70 NCC 7.50 RF 7.39 WB 7.38 USB 7.33 KEY 7.28 CMA 7.13 FITB 6.99 PNC 6.89 STI 6.79 |
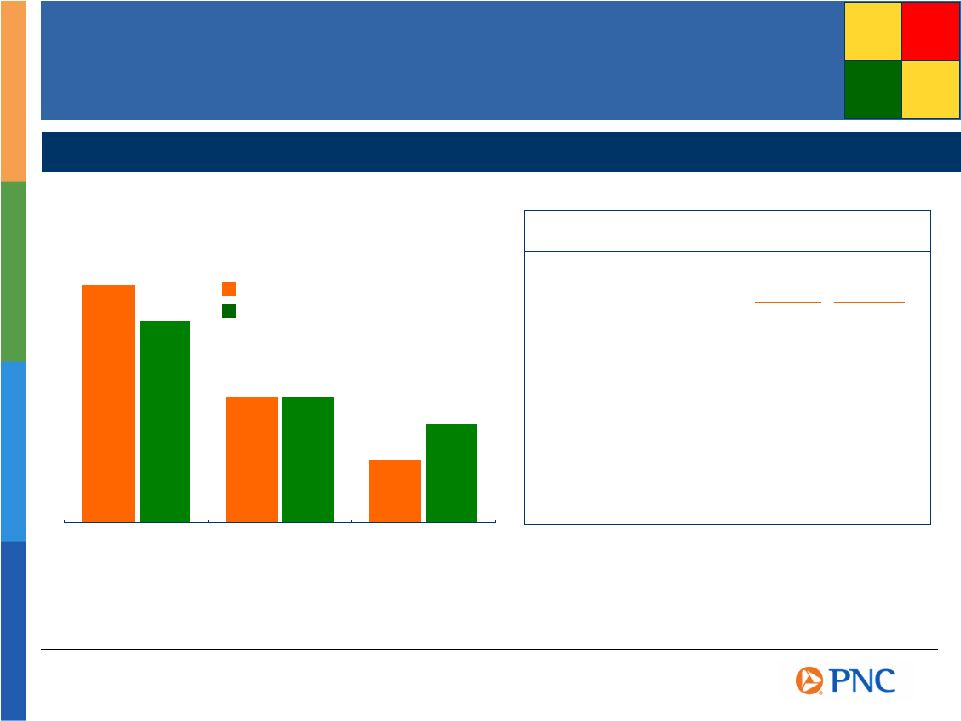 Maintaining a Moderate Credit Risk Profile – A Closer Look PNC 53% 28% 14% 45% 28% 22% Composition of Loans for Third Quarter 2007 Source: Company reports, peer average reflects average of super-regional banks as defined in Appendix excluding PNC, except as noted below. (1) RF and FITB excluded due to unavailability of information. (2) KEY and FITB excluded due to unavailability of information. Major Loan Category Comparison¹ % of Total Average Loans Peer Average PNC Securities² 5.42% 5.42% Loans¹: Commercial 7.42% 7.40% (includes commercial real estate) Consumer 6.66% 8.01% Residential Mortgage 6.07% 7.00% PNC Peer Average Average Yields Commercial (includes commercial real estate) Consumer Residential Mortgage |
 High Quality Consumer Loan Portfolio Auto 5% Residential Mortgage 35% Composition of Consumer Loan and Residential Mortgage Portfolio As of September 30, 2007 Home Equity Portfolio Credit Statistics First lien positions 39% In-footprint exposure 93% Weighted average: Loan to value 72% FICO scores 726 Net charge-offs¹ 0.18% 90 days past due 0.30% Other 8% Home Equity 52% Residential Mortgage Portfolio Credit Statistics Weighted average: Loan to value 67% FICO scores 747 Net charge-offs¹ 0.01% 90 days past due 1.20% (1) For the three months ended September 30, 2007. |
 WB 0.19 % RF 0.27 PNC 0.30 CMA 0.32 STI 0.35 KEY 0.35 BBT 0.41 USB 0.54 NCC 0.54 FITB 0.60 WFC 1.02 USB 318 % PNC 251 RF 182 CMA 176 BBT 171 KEY 168 WFC 142 WB 117 FITB 117 NCC 113 STI 93 Credit Discipline Reflected in Reserves and Losses Proactively Assessing Credits PNC For the three months ended September 30, 2007. Source: SNL DataSource, PNC as reported 3Q07 Managing the Risk 3Q07 Net Charge-offs to Average Loans Reserves to Nonperforming Assets |
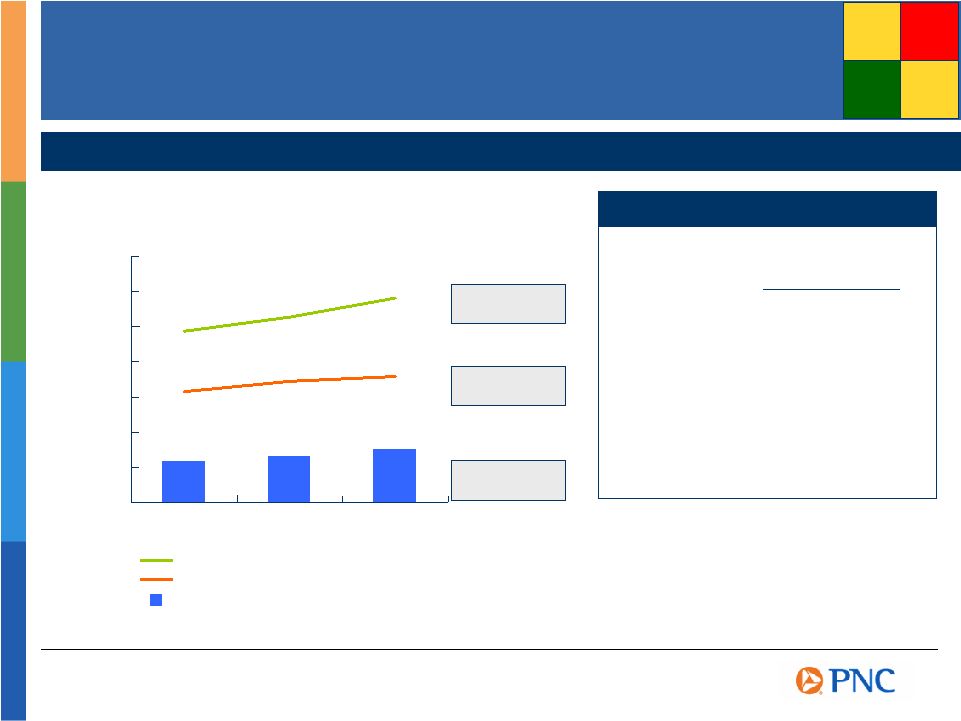 $0 $1 $2 $3 $4 $5 $6 $7 2004 2005 2006 Revenue 9% Creating Positive Operating Leverage Generating Capital by Growing Revenues Faster Than Expenses billions Compound Annual Growth Rate (2004 – 2006) Adjusted Revenue (as reported $5.5 billion, $6.3 billion, $8.6 billion for 2004, 2005, 2006, respectively) Adjusted Noninterest Expense (as reported $3.7 billion, $4.3 billion, $4.4 billion for 2004, 2005, 2006, respectively) Adjusted Net Income (as reported $1.2 billion, $1.3 billion, $2.6 billion for 2004, 2005, 2006, respectively) Net Income 12% $1.2 $1.3 $1.5 Expense 7% Revenue +20% Expense +15% Net Income +19% Trend Continues¹ (1) As reported: revenue (28%), expense (11%), net income (42%). Adjusted amounts are reconciled to GAAP in the Appendix. Nine months ended September 30, as adjusted 2007 vs 2006 PNC |
 RF 3.90 % PNC 3.99 USB 4.01 FITB 4.04 STI 4.08 WFC 4.14 BBT 4.20 CMA 4.29 WB 4.34 KEY 4.40 NCC 4.46 Cost of Interest Bearing Liabilities² 3Q07 PNC 58 % USB 52 FITB 48 WFC 46 WB 42 STI 42 BBT 42 KEY 41 RF 39 NCC 37 CMA 30 Building a Diversified Business Mix PNC High Fee Income Contribution YTD07 (1) For the nine months ended September 30, 2007. (2) For the three months ended September 30, 2007. (3) Reconciled to GAAP in the Appendix. Source: SNL DataSource, PNC as reported Low Cost Funding Mix Noninterest Income to Total Revenue¹ 50% without PFPC and BlackRock³ |
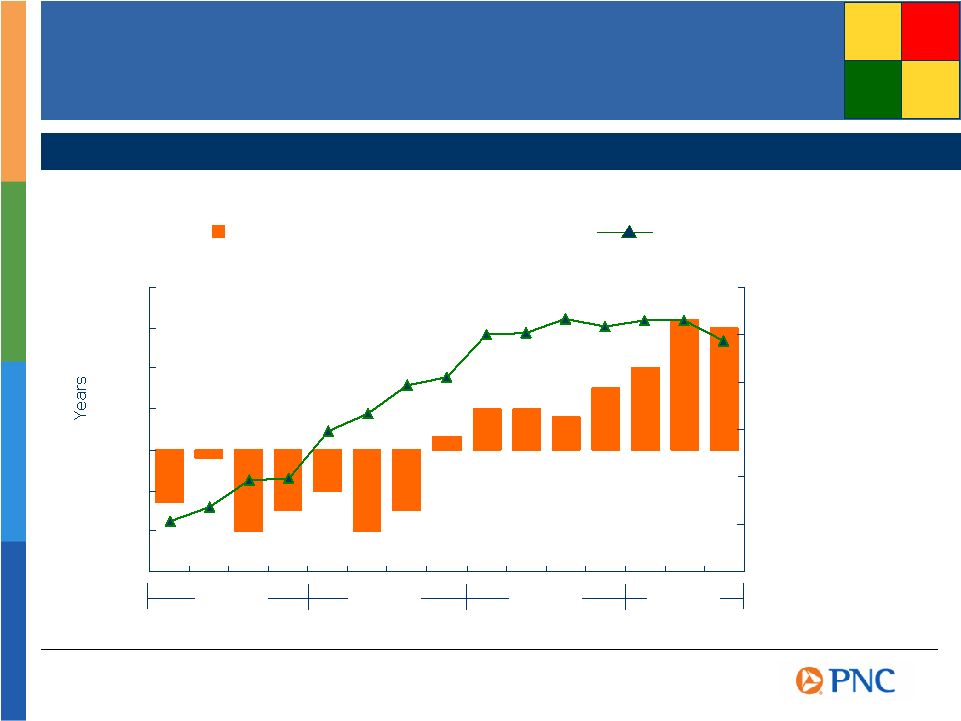 (3) (2) (1) 0 1 2 3 4 0.0% 1.0% 2.0% 3.0% 4.0% 5.0% 6.0% Proactively Managing the Balance Sheet Aligning the Balance Sheet with Expectations PNC Duration of Equity (At Quarter End) Fed Fund Effective Rate (At Quarter End) 2004 PNC 2005 2006 2007 Source: SNL DataSource, PNC as reported |
 State of the markets PNC is well-positioned for this environment Leveraging our position to capture opportunities Key Take-aways |
 Opportunities to Capture Value Remaining focused on client-related business Affinity toward asset-based lending Leveraging Midland Loan Services Exercising patience and finding pockets of value |
 Summary We’ve executed on our strategies We’re well-positioned for the current environment Liquidity Profile High Low PNC PNC |
 Cautionary Statement Regarding Forward-Looking Information Appendix We make statements in this presentation, and we may from time to time make other statements, regarding our outlook or expectations for earnings, revenues, expenses and/or other matters regarding or affecting PNC that are forward-looking statements within the meaning of the Private Securities Litigation Reform Act. Forward-looking statements are typically identified by words such as “believe,” “expect,” “anticipate,” “intend,” “outlook,” “estimate,” “forecast,” “will”, “project” and other similar words and expressions. Forward-looking statements are subject to numerous assumptions, risks and uncertainties, which change over time. Forward-looking statements speak only as of the date they are made. We do not assume any duty and do not undertake to update our forward-looking statements. Because forward-looking statements are subject to assumptions and uncertainties, actual results or future events could differ, possibly materially, from those that we anticipated in our forward-looking statements, and future results could differ materially from our historical performance. Our forward-looking statements are subject to the following principal risks and uncertainties. We provide greater detail regarding some of these factors in our Form 10-K for the year ended December 31, 2006, including in the Risk Factors and Risk Management sections of that report, and in our current quarter 2007 Form 10-Q and other SEC reports. Our forward-looking statements may also be subject to other risks and uncertainties, including those that we may discuss elsewhere in this presentation or in our filings with the SEC, accessible on the SEC’s website at www.sec.gov and on or through our corporate website at www.pnc.com under “About PNC – Investor Relations – Financial Information.” •Our businesses and financial results are affected by business and economic conditions, both generally and specifically in the principal markets in which we operate. In particular, our businesses and financial results may be impacted by — •Changes in interest rates and valuations in the debt, equity and other financial markets. •Disruptions in the liquidity and other functioning of financial markets, including such disruptions in the markets for real estate and other assets commonly securing financial products. •Actions by the Federal Reserve and other government agencies, including those that impact money supply and market interest rates. •Changes in our customers’, suppliers’ and other counterparties’ performance in general and their creditworthiness in particular. •Changes in customer preferences and behavior, whether as a result of changing business and economic conditions or other factors. •A continuation of recent turbulence in significant portions of the global financial markets could impact our performance, both directly by affecting our revenues and the value of our assets and liabilities and indirectly by affecting the economy generally. •Our operating results are affected by our liability to provide shares of BlackRock common stock to help fund certain BlackRock long-term incentive plan (“LTIP”) programs, as our LTIP liability is adjusted quarterly (“marked-to-market”) based on changes in BlackRock’s common stock price and the number of remaining committed shares, and we recognize gain or loss on such shares at such times as shares are transferred for payouts under the LTIP programs. •Competition can have an impact on customer acquisition, growth and retention, as well as on our credit spreads and product pricing, which can affect market share, deposits and revenues. |
 •Our ability to implement our business initiatives and strategies could affect our financial performance over the next several years. •Legal and regulatory developments could have an impact on our ability to operate our businesses or our financial condition or results of operations or our competitive position or reputation. Reputational impacts, in turn, could affect matters such as business generation and retention, our ability to attract and retain management, liquidity, and funding. These legal and regulatory developments could include: (a) the unfavorable resolution of legal proceedings or regulatory and other governmental inquiries; (b) increased litigation risk from recent regulatory and other governmental developments; (c) the results of the regulatory examination process, our failure to satisfy the requirements of agreements with governmental agencies, and regulators’ future use of supervisory and enforcement tools; (d) legislative and regulatory reforms, including changes to laws and regulations involving tax, pension, education lending, and the protection of confidential customer information; and (e) changes in accounting policies and principles. •Our business and operating results are affected by our ability to identify and effectively manage risks inherent in our businesses, including, where appropriate, through the effective use of third-party insurance, derivatives, and capital management techniques. •Our ability to anticipate and respond to technological changes can have an impact on our ability to respond to customer needs and to meet competitive demands. •The adequacy of our intellectual property protection, and the extent of any costs associated with obtaining rights in intellectual property claimed by others, can impact our business and operating results. •Our business and operating results can also be affected by widespread natural disasters, terrorist activities or international hostilities, either as a result of the impact on the economy and capital and other financial markets generally or on us or on our customers, suppliers or other counterparties specifically. •Also, risks and uncertainties that could affect the results anticipated in forward-looking statements or from historical performance relating to our equity interest in BlackRock, Inc. are discussed in more detail in BlackRock’s 2006 Form 10-K, including in the Risk Factors section, and in BlackRock’s other filings with the SEC, accessible on the SEC’s website and on or through BlackRock’s website at www.blackrock.com. We grow our business from time to time by acquiring other financial services companies, including our pending Sterling Financial Corporation (“Sterling”) acquisition. Acquisitions in general present us with risks other than those presented by the nature of the business acquired. In particular, acquisitions may be substantially more expensive to complete (including as a result of costs incurred in connection with the integration of the acquired company) and the anticipated benefits (including anticipated cost savings and strategic gains) may be significantly harder or take longer to achieve than expected. In some cases, acquisitions involve our entry into new businesses or new geographic or other markets, and these situations also present risks resulting from our inexperience in these new areas. As a regulated financial institution, our pursuit of attractive acquisition opportunities could be negatively impacted due to regulatory delays or other regulatory issues. Regulatory and/or legal issues related to the pre-acquisition operations of an acquired business may cause reputational harm to PNC following the acquisition and integration of the acquired business into ours and may result in additional future costs arising as a result of those issues. Any annualized, proforma, estimated, third party or consensus numbers in this presentation are used for illustrative or comparative purposes only and may not reflect actual results. Any consensus earnings estimates are calculated based on the earnings projections made by analysts who cover that company. The analysts’ opinions, estimates or forecasts (and therefore the consensus earnings estimates) are theirs alone, are not those of PNC or its management, and may not reflect PNC’s, Sterling’s or other company’s actual or anticipated results. Cautionary Statement Regarding Forward-Looking Information (continued) Appendix |
 The PNC Financial Services Group, Inc. and Sterling Financial Corporation will be filing a proxy statement/prospectus and other relevant documents concerning the merger with the United States Securities and Exchange Commission (the “SEC”). WE URGE INVESTORS TO READ THE PROXY STATEMENT/PROSPECTUS AND ANY OTHER DOCUMENTS TO BE FILED WITH THE SEC IN CONNECTION WITH THE MERGER OR INCORPORATED BY REFERENCE IN THE PROXY STATEMENT/PROSPECTUS BECAUSE THEY WILL CONTAIN IMPORTANT INFORMATION. Investors will be able to obtain these documents free of charge at the SEC’s web site at http://www.sec.gov. In addition, documents filed with the SEC by The PNC Financial Services Group, Inc. will be available free of charge from Shareholder Relations at (800) 843-2206. Documents filed with the SEC by Sterling Financial Corporation will be available free of charge from Sterling Financial Corporation by contacting Shareholder Relations at (877) 248-6420. The directors, executive officers, and certain other members of management and employees of Sterling Financial Corporation are participants in the solicitation of proxies in favor of the merger from the shareholders of Sterling Financial Corporation. Information about the directors and executive officers of Sterling Financial Corporation is included in the proxy statement for its May 8, 2007 annual meeting of shareholders, which was filed with the SEC on April 2, 2007. Additional information regarding the interests of such participants will be included in the proxy statement/prospectus and the other relevant documents filed with the SEC when they become available. Additional Information About The PNC/Sterling Financial Corporation Transaction Appendix |
 Non-GAAP to GAAP Reconcilement Income Statement Summary – For the Nine Months Ended September 30 Appendix NINE MONTHS ENDED In millions As Reported Adjustments As Adjusted (a) As Reported Adjustments As Adjusted (b) Net interest income $2,122 $2,122 $1,679 ($10) $1,669 Net interest income: % Change As Reported % Change As Adjusted Loans 806 806 682 (10) 672 18% 20% Deposits 1,316 1,316 997 997 32% 32% Noninterest Income 2,956 $4 2,960 5,358 (2,777) 2,581 (45%) 15% Total revenue 5,078 4 5,082 7,037 (2,787) 4,250 (28%) 20% Loan net interest income as a % of total revenue 15.9% 15.9% 9.7% 15.8% Deposit net interest income as a % of total revenue 25.9% 25.9% 14.2% 23.5% Noninterest income as a % of total revenue 58.2% 58.2% 76.1% 60.7% Provision for credit losses 127 127 82 82 Noninterest income 2,956 4 2,960 5,358 (2,777) 2,581 Noninterest expense 3,083 (67) 3,016 3,474 (856) 2,618 (11%) 15% Income before minority interest and income taxes 1,868 71 1,939 3,481 (1,931) 1,550 Minority interest in income of BlackRock 47 (47) Income taxes 579 23 602 1,215 (788) 427 Net income $1,289 $48 $1,337 $2,219 ($1,096) $1,123 (42%) 19% OPERATING LEVERAGE - NINE MONTHS ENDED As Reported As Adjusted Total revenue (28%) 20% Noninterest expense (11%) 15% Operating leverage (17%) 5% (a) Amounts adjusted to exclude the impact of the following pretax items: (1) the gain of $83 million recognized in connection with PNC's transfer of BlackRock shares to satisfy a portion of our BlackRock LTIP shares obligation, (2) the net mark-to-market adjustment totaling $82 million on our remaining BlackRock LTIP shares obligation, and (3) acquisition and BlackRock/MLIM transaction integration costs totaling $72 million. The net tax impact of these items is reflected in the adjustment to income taxes. (b) Amounts adjusted to exclude the impact of the following pretax items: (1) the gain of $2.078 billion on the BlackRock/MLIM transaction, (2) the loss of $196 million on the securities portfolio rebalancing, (3) BlackRock/MLIM transaction integration costs of $91 million for the first nine months of 2006, and (4) the mortgage loan portfolio repositioning loss of $48 million. The net tax impact of these items is reflected in the adjustment to income taxes. We believe that information as adjusted for the impact of these items may be useful due to the extent to which these items are not indicative of our ongoing operations as the result of our management activities. Additionally, the amounts are also adjusted as if we had recorded our investment in BlackRock on the equity method. We believe that providing amounts adjusted as if we had recorded our investment in BlackRock on the equity method for all periods presented helps provide a basis of comparability for the impact of the BlackRock deconsolidation given the magnitude of the impact on various components of our consolidated income statement. 2006 to 2007 Change September 30, 2007 September 30, 2006 |
 Non-GAAP to GAAP Reconcilement Income Statement Summary – 2004 to 2006 Appendix BlackRock For the year ended December 31, 2006 PNC Deconsolidation and BlackRock PNC In millions As Reported Adjustments (a) Other Adjustments Equity Method As Adjusted Net interest income $2,245 $(10) $2,235 Provision for credit losses 124 124 Noninterest income 6,327 $(1,812) (1,087) $144 3,572 Noninterest expense 4,443 (91) (765) 3,587 Income before minority interest and income taxes 4,005 (1,721) (332) 144 2,096 Minority interest in income of BlackRock 47 18 (65) Income taxes 1,363 (658) (130) 7 582 Net income $2,595 $(1,081) $(137) $137 $1,514 For the year ended December 31, 2005 BlackRock PNC Deconsolidation and BlackRock PNC In millions As Reported Other Adjustments Equity Method As Adjusted Net interest income $2,154 $(12) $2,142 Provision for credit losses 21 21 Noninterest income 4,173 (1,214) $163 3,122 Noninterest expense 4,306 (853) 3,453 Income before minority interest and income taxes 2,000 (373) 163 1,790 Minority interest in income of BlackRock 71 (71) Income taxes 604 (150) 11 465 Net income $1,325 $(152) $152 $1,325 (a) Includes the impact of the following items, all on a pretax basis, and adjustment for the tax impact thereof: $2,078 million gain on BlackRock/MLIM transaction, $196 million securities portfolio rebalancing loss, $101 million of BlackRock/MLIM transaction integration costs, $48 million mortgage loan portfolio repositioning loss, and $12 million net loss related to our BlackRock LTIP shares obligation. |
 Non-GAAP to GAAP Reconcilement Income Statement Summary – 2004 to 2006 (continued) Appendix For the year ended December 31, 2004 BlackRock PNC Deconsolidation and BlackRock PNC In millions As Reported Other Adjustments Equity Method As Adjusted Net interest income $1,969 $(14) $1,955 Provision for credit losses 52 52 Noninterest income 3,572 (745) $101 2,928 Noninterest expense 3,712 (564) 3,148 Income before minority interest and income taxes 1,777 (195) 101 1,683 Minority interest in income of BlackRock 42 (42) Income taxes 538 (59) 7 486 Net income $1,197 $(94) $94 $1,197 In millions 2004 2005 2006 CAGR Adjusted net interest income $1,955 $2,142 $2,235 Adjusted noninterest income 2,928 3,122 3,572 Adjusted total revenue 4,883 5,264 5,807 9% Adjusted noninterest expense 3,148 3,453 3,587 7% Adjusted net income $1,197 $1,325 $1,514 12% In millions 2004 2005 2006 CAGR Net interest income, as reported $1,969 $2,154 $2,245 Noninterest income, as reported 3,572 4,173 6,327 Total revenue, as reported 5,541 6,327 8,572 24% Noninterest expense, as reported 3,712 4,306 4,443 9% Net income, as reported $1,197 $1,325 $2,595 47% |
 Non-GAAP to GAAP Reconcilement Noninterest Income/Total Revenue Appendix Nine Months Ending September 30, 2007 Dollars in millions Retail Banking Corporate & Institutional Banking Other Banking and Other BlackRock PFPC Total Net interest income (expense) $1,517 $571 $48 $2,136 ($14) $2,122 Noninterest income 1,280 558 260 2,098 $227 631 2,956 Total Revenue $2,797 $1,129 $308 $4,234 $227 $617 $5,078 Noninterest income as a % of total revenue 46% 49% 84% 50% 100% 102% 58% |
 The PNC Financial Services Group, Inc. PNC BB&T Corporation BBT Comerica CMA Fifth Third Bancorp FITB KeyCorp KEY National City Corporation NCC Regions Financial RF SunTrust Banks, Inc. STI U.S. Bancorp USB Wachovia Corporation WB Wells Fargo & Company WFC Ticker Peer Group of Super-Regional Banks Appendix |