The PNC Financial Services Group, Inc. Second Quarter 2010 Earnings Conference Call July 22, 2010 Exhibit 99.2 |
2 Cautionary Statement Regarding Forward-Looking Information and Adjusted Information This presentation includes “snapshot” information about PNC used by way of illustration. It is not intended as a full business or financial review and should be viewed in the context of all of the information made available by PNC in its SEC filings. The presentation also contains forward-looking statements regarding our outlook or expectations relating to PNC’s future business, operations, financial condition, financial performance, capital and liquidity levels, and asset quality. Forward-looking statements are necessarily subject to numerous assumptions, risks and uncertainties, which change over time. The forward-looking statements in this presentation are qualified by the factors affecting forward-looking statements identified in the more detailed Cautionary Statement included in the Appendix, which is included in the version of the presentation materials posted on our corporate website at www.pnc.com/investorevents. We provide greater detail regarding some of these factors in our 2009 Form 10-K and 1st quarter 2010 Form 10-Q, including in the Risk Factors and Risk Management sections of those reports, and in our subsequent SEC filings (accessible on the SEC’s website at www.sec.gov and on or through our corporate website at www.pnc.com/secfilings). We have included web addresses here and elsewhere in this presentation as inactive textual references only. Information on these websites is not part of this document. Future events or circumstances may change our outlook or expectations and may also affect the nature of the assumptions, risks and uncertainties to which our forward- looking statements are subject. The forward-looking statements in this presentation speak only as of the date of this presentation. We do not assume any duty and do not undertake to update those statements. In this presentation, we will sometimes refer to adjusted results to help illustrate the impact of certain types of items, such as the acceleration of accretion of the remaining issuance discount on our TARP preferred stock in connection with the first quarter 2010 redemption of such stock, our fourth quarter 2009 gain related to BlackRock’s acquisition of Barclays Global Investors (the “BLK/BGI gain”), and integration costs in the 2010 and 2009 periods. This information supplements our results as reported in accordance with GAAP and should not be viewed in isolation from, or a substitute for, our GAAP results. We believe that this additional information and the reconciliations we provide may be useful to investors, analysts, regulators and others as they evaluate the impact of these respective items on our results for the periods presented due to the extent to which the items are not indicative of our ongoing operations. In certain discussions, we may also provide information on yields and margins for all interest-earning assets calculated using net interest income on a taxable- equivalent basis by increasing the interest income earned on tax-exempt assets to make it fully equivalent to interest income earned on taxable investments. We believe this adjustment may be useful when comparing yields and margins for all earning assets. We may also provide information on pretax pre-provision earnings (total revenue less noninterest expense), as we believe that pretax pre-provision earnings is useful as a tool to help evaluate the ability to provide for credit costs through operations. This presentation may also include discussion of other non-GAAP financial measures, which, to the extent not so qualified therein or in the Appendix, is qualified by GAAP reconciliation information available on our corporate website at www.pnc.com under “About PNC–Investor Relations.” |
3 Significant 2Q10 Achievements Delivered strong financial results Balance sheet remains well-positioned Businesses continued to perform well; continued to grow clients and deepen relationships Successfully completed the conversion of more than 6 million customers and 1,300 branches across 9 states from National City Bank to PNC Closed the sale of PNC Global Investment Servicing 1 PNC Continues to Build a Great Company. PNC Continues to Build a Great Company. (1) Transaction closed on July 1, 2010. (2) 1Q10 adjusted for the impact of the accelerated accretion of the remaining issuance discount in connection with the redemption of our TARP preferred stock. Both quarters adjusted for after-tax integration costs. Further information is provided in the Appendix. $2.91 $1.31 $1.60 Adjusted diluted EPS 2 $2.15 $.66 $1.47 Diluted EPS from net income 1.12% 1.02% 1.22% Return on average assets Net income $1.5 billion $671 million $803 million 2Q10 YTD10 1Q10 |
4 Higher Quality, Differentiated Balance Sheet $265.4 26.5 .6 13.3 $42.5 $182.5 10.7 45.4 $126.4 $265.4 50.5 157.3 $57.6 March 31, 2010 14.1 Other .6 Preferred equity $261.7 Total liabilities and equity $40.5 Borrowed funds 10.4 Other time/savings $178.8 Total deposits 27.7 Common equity 42.7 Retail CDs $125.7 Transaction deposits 53.7 Other assets 154.3 Total loans $261.7 Total assets $53.7 June 30, 2010 Investment securities Category (billions) Loans/assets 59% Investment securities/assets 21% Loans/deposits 86% Duration of equity 1 (3.0) years June 30, 2010 key statistics (1) Estimated. |
5 Key Take-Aways $1.7 $1.9 Pretax pre-provision earnings 2 (billions) Strong earnings $1.60 $1.47 2Q10 1Q10 $1.31 Adjusted earnings per diluted common share 1 $.66 Reported earnings per diluted common share 2% (8%) Nonperforming loans - change from prior quarter Stabilization of credit quality, reserve level adequacy 101% $823 2Q10 1Q10 92% Allowance for loan and lease losses 3 to NPLs $751 Provision for credit losses (millions) Improvement in the quality of our capital structure 9.0% 4 8.4% 4 2Q10 1Q10 Proforma Tier 1 common ratio 5 7.9% Tier 1 common ratio (1) 1Q10 adjusted for the impact of the accelerated accretion of the remaining issuance discount in connection with the redemption of our TARP preferred stock. Both quarters adjusted for after-tax integration costs. Further information is provided in the Appendix. (2) Total revenue less noninterest expense. Further information is provided in the Appendix. (3) Includes impairment reserves attributable to purchased impaired loans. NPLs do not include purchased impaired loans or loans held for sale. See notes to slide 8. (4) Estimated. (5) Proforma ratio reflects the estimated impact of the sale of PNC Global Investment Servicing, which closed on July 1, 2010. Further information is provided in the Appendix. |
6 Pretax Pre-Provision Earnings 1 More Than Doubled Credit Costs $3.9 $2.0 $1.9 $.8 2Q10 2Q10 noninterest income mix (1) Total revenue less noninterest expense. (2) For the six months ended June 30, 2010, total revenue was $7.675 billion, noninterest expense was $4.115 billion and provision was $1.574 billion. Further information is provided in the Appendix. Asset management $243 Consumer services $315 Corporate services $261 Residential mortgage $179 Deposit service charges $209 17% 21% 14% 18% 12% Other $270 18% Categories in millions Total revenue Noninterest expense Pretax pre-provision earnings¹ Provision $.8 Net income YTD 2010 pretax pre- provision earnings 1,2 of $3.6 billion exceeded provision by 2.26x $1.5 billion |
7 Initial Cost Save Objectives Exceeded – New Target of $1.8 Billion Highlights Successfully captured $1.6 billion in annualized acquisition-related cost savings through 2Q10, well ahead of our original target amount and schedule Established a new goal of $1.8 billion in annualized acquisition-related cost saves by the end of 2010 Continued to successfully manage expense base in 2Q10 while investing for the future $800 million captured in 2009 $800 million captured through 2Q10 PNC acquisition-related cost saves annualized 12/31/08 – 12/31/09 1/1/10 – 6/30/10 New goal 4Q10 $1.8 billion $1.6 billion |
8 Overall Credit Quality Continued to Stabilize (1) Excludes loans that are government insured/guaranteed, primarily residential mortgages. (2) Loans acquired from National City that were impaired are not included as they were recorded at estimated fair value when acquired and are currently considered performing loans due to the accretion of interest in purchase accounting. Does not include loans held for sale or foreclosed and other assets. (3) Net charge-offs to average loans percentages are annualized. (4) Includes impairment reserves attributable to purchased impaired loans. 110% 94% 89% 92% 101% Allowance/NPLs² $1,087 $914 $1,049 $751 $823 Provision for credit losses 27% 3.46% 2.18% $840 (8%) $5,281 $647 $1,780 2Q10 1.89% 1.59% 2.09% 1.77% NCOs/average loans³ $795 $650 $835 $691 Total net charge-offs Credit costs and net charge-offs (millions, except %) 28% 3.38% 2% $5,761 $846 $2,482 1Q10 40% 23% 11% Change from prior quarter 32% 3.22% $5,671 $884 $2,388 4Q09 Allowance 4 and marks on purchased impaired loans 2.77% 2.99% Allowance/loans 38% 37% Marks as a % of outstanding purchased impaired loans Nonperforming loans² (millions, except %) Accruing loans past due 1,2 (millions) $2,195 $2,380 30 – 89 days $1,043 $875 90 days or more $4,156 $5,126 Total nonperforming loans 2Q09 3Q09 |
9 Further Improvement in Quality of Capital Structure Tier 1 common capital ratio Ratios as of quarter end. (1) Estimated. (2) Proforma ratio reflects the estimated impact of the sale of PNC Global Investment Servicing, which closed on July 1, 2010. Further information is provided in the Appendix. (3) Tier 1 risk-based capital ratio was 10.5% and Tier 1 common capital ratio was 5.3% as of 2Q09. Estimated Tier 1 risk-based capital ratio as of 2Q10 was 10.8%. 4Q09 2Q10 1 7.9% Highlights Improved quality of capital - Common as a % of Tier 1 capital 3 increased to 78% 1 from 50% in 2Q09 Capital priorities - Maintain strong capital levels - Support our clients - Invest in our businesses - Return capital to shareholders when appropriate 9.0% Pro- forma 1,2 6.0% 1Q10 8.4% |
10 Framework for Success Execute on and deliver the PNC business model Capitalize on integration opportunities Emphasize continuous improvement culture Leverage credit that meets our risk/return criteria Focus on cross selling PNC’s deep product offerings Focus “front door” on risk-adjusted returns Leverage “back door” credit liquidation capabilities Maximize credit portfolio value Reposition deposit gathering strategies Action Plans 1.12% $1.6 billion 37% 2.0% 86% June 30, 2010 1.50%+ $1.8 billion >50% 0.3%-0.5% 80%-90% Strategic Objective Return on average assets (six months ended) Key Metrics Loans to deposits ratio (as of) Provision to average loans (provision for six months ended, annualized) Noninterest income/total revenue (six months ended) Acquisition-related cost savings (2Q10 annualized run rate) Executing our strategies PNC Business Model Staying core funded Returning to a moderate risk profile Growing high quality, diverse revenue streams Creating positive operating leverage = original goal achieved. = new goal established in 2Q10; original goals for annualized acquisition-related cost savings and return on average assets were $1.2 billion and 1.30%+, respectively. |
11 Summary PNC Continues to Build a Great Company. PNC Continues to Build a Great Company. The continued execution of PNC’s business model resulted in a strong first half of 2010 The completed National City branch conversions position PNC to achieve substantial revenue growth PNC is well-positioned to achieve its strategic financial objectives |
12 Cautionary Statement Regarding Forward-Looking Information Appendix |
13 Cautionary Statement Regarding Forward-Looking Information (continued) Appendix |
14 Cautionary Statement Regarding Forward-Looking Information (continued) Appendix |
15 Impact of Sale of PNC Global Investment Servicing 1 1.1 Net intangible assets 1.3 Goodwill and other intangible assets Elimination of net intangible assets: Less: (1.7) Book equity / intercompany debt (billions) $1.4 (0.2) 0.3 (0.3) 0.6 $2.3 Estimated PNC tangible capital improvement Eligible deferred income taxes on goodwill and other intangible assets After-tax gain Income taxes Pretax gain Sales price Estimated gain and capital enhancement Appendix (1) The transaction closed on July 1, 2010. |
16 Risk-Based Capital Ratios 9.7% 4.8% Ratios as of December 31, 2008 3 1.4 1.4 Net impact of July 1, 2010 sale of GIS 2 11.4% 9.0% Proforma ratios as of June 30, 2010 1 $24.8 $19.7 Proforma 10.8% 8.4% Ratios as of June 30, 2010 1 $18.3 Tier 1 common $23.4 June 30, 2010 - Capital Tier 1 risk-based $ in billions (1) Estimated. (2) The sale of PNC Global Investment Servicing (“GIS”) closed on July 1, 2010. We believe that the disclosure of these ratios reflecting the impact of the sale of GIS provides additional meaningful information regarding the risk-based capital ratios at that date and the impact of this event on these ratios. (3) December 31, 2008 is the closing date of our acquisition of National City. Appendix |
17 Non-GAAP to GAAP Reconcilement Appendix In millions except per share data Adjustments, pretax Income taxes (benefit) 1 Net income Net income attributable to common shareholders Diluted EPS from net income Net income and diluted EPS, as reported $803 $786 $1.47 Adjustments: Integration costs $100 ($35) 65 65 .13 Net income and diluted EPS, as adjusted $868 $851 $1.60 In millions except per share data Adjustments, pretax Income taxes (benefit) 1 Net income Net income attributable to common shareholders Diluted EPS from net income Net income and diluted EPS, as reported $671 $333 $.66 Adjustments: Integration costs $113 ($40) 73 73 .15 TARP preferred stock accelerated discount accretion 2 250 .50 Net income and diluted EPS, as adjusted $744 $656 $1.31 In millions except per share data Adjustments, pretax Income taxes (benefit) 1 Net income Net income attributable to common shareholders Diluted EPS from net income Net income and diluted EPS, as reported $207 $65 $.14 Adjustments: Integration costs $125 ($34) 91 91 .20 Net income and diluted EPS, as adjusted $298 $156 $.34 For the three months ended June 30, 2009 (1) Calculated using a marginal federal income tax rate of 35% and includes applicable income tax adjustments. (2) Represents accelerated accretion of the remaining issuance discount on redemption of the TARP preferred stock in February 2010. PNC believes that information adjusted for the impact of certain items may be useful due to the extent to which the items are not indicative of our ongoing operations. For the three months ended March 31, 2010 For the three months ended June 30, 2010 |
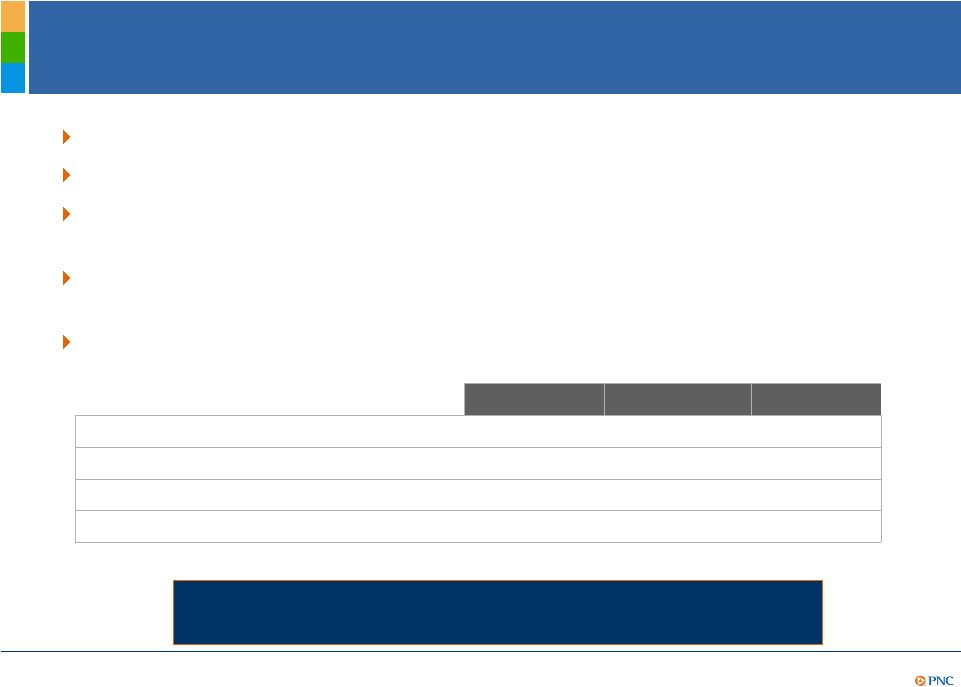
18 Non-GAAP to GAAP Reconcilement Appendix In millions except per share data Adjustments, pretax Income taxes (benefit) 1 Net income Net income attributable to common shareholders Diluted EPS from net income Net income and diluted EPS, as reported $1,474 $1,119 $2.15 Adjustments: Integration costs $213 ($75) 138 138 .27 TARP preferred stock accelerated discount accretion 2 250 .49 Net income and diluted EPS, as adjusted $1,612 $1,507 $2.91 In millions except per share data Adjustments, pretax Income taxes (benefit) 1 Net income Net income attributable to common shareholders Diluted EPS from net income Net income and diluted EPS, as reported $737 $525 $1.16 Adjustments: Integration costs $177 ($52) 125 125 .28 Net income and diluted EPS, as adjusted $862 $650 $1.44 For the six months ended June 30, 2009 (1) Calculated using a marginal federal income tax rate of 35% and includes applicable income tax adjustments. (2) Represents accelerated accretion of the remaining issuance discount on redemption of the TARP preferred stock in February 2010. PNC believes that information adjusted for the impact of certain items may be useful due to the extent to which the items are not indicative of our ongoing operations. For the six months ended June 30, 2010 Three months ended Six months ended June 30, 2010 March 31, 2010 June 30, 2010 in millions Total revenue $3,912 $3,763 $7,675 Noninterest expense 2,002 2,113 4,115 Pretax pre-provision earnings $1,910 $1,650 $3,560 Provision $823 $751 $1,574 Excess of pretax pre-provision earnings over provision $1,087 $899 $1,986 Pretax pre-provision earnings/provision 2.32 2.20 2.26 PNC believes that pretax pre-provision earnings is useful as a tool to help evaluate the ability to provide for credit costs through operations. |
19 Non-GAAP to GAAP Reconcilement Appendix In millions except per share data Adjustments, pretax Income taxes (benefit) 1 Net income Net income attributable to common shareholders Diluted EPS from net income Net income and diluted EPS, as reported $1,107 $1,011 $2.17 Adjustments: Gain on BlackRock/BGI transaction ($1,076) $389 (687) (687) (1.49) Integration costs 155 (54) 101 101 .22 Net income and diluted EPS, as adjusted $521 $425 $.90 (1) Calculated using a marginal federal income tax rate of 35%. The after-tax gain on the BlackRock/BGI transaction also reflects the impact of state income taxes. For the three months ended December 31, 2009 PNC believes that information adjusted for the impact of certain items may be useful due to the extent to which the items are not indicative of our ongoing operations. |
20 Peer Group of Banks Appendix The PNC Financial Services Group, Inc. PNC BB&T Corporation BBT Bank of America Corporation BAC Capital One Financial, Inc. COF Comerica Inc. CMA Fifth Third Bancorp FITB JPMorgan Chase JPM KeyCorp KEY M&T Bank MTB Regions Financial Corporation RF SunTrust Banks, Inc. STI U.S. Bancorp USB Wells Fargo & Co. WFC Ticker |