 The PNC Financial Services Group, Inc. Third Quarter 2010 Earnings Conference Call October 21, 2010 Exhibit 99.2 |
 2 Cautionary Statement Regarding Forward-Looking Information and Adjusted Information This presentation includes “snapshot” information about PNC used by way of illustration. It is not intended as a full business or financial review and should be viewed in the context of all of the information made available by PNC in its SEC filings. The presentation also contains forward- looking statements regarding our outlook or expectations relating to PNC’s future business, operations, financial condition, financial performance, capital and liquidity levels, and asset quality. Forward-looking statements are necessarily subject to numerous assumptions, risks and uncertainties, which change over time. The forward-looking statements in this presentation are qualified by the factors affecting forward-looking statements identified in the more detailed Cautionary Statement included in the Appendix, which is included in the version of the presentation materials posted on our corporate website at www.pnc.com/investorevents. We provide greater detail regarding some of these factors in our 2009 Form 10-K and 2010 Form 10- Qs, including in the Risk Factors and Risk Management sections of those reports, and in our subsequent SEC filings (accessible on the SEC’s website at www.sec.gov and on or through our corporate website at www.pnc.com/secfilings). We have included web addresses here and elsewhere in this presentation as inactive textual references only. Information on these websites is not part of this presentation. Future events or circumstances may change our outlook or expectations and may also affect the nature of the assumptions, risks and uncertainties to which our forward-looking statements are subject. The forward-looking statements in this presentation speak only as of the date of this presentation. We do not assume any duty and do not undertake to update those statements. In this presentation, we will sometimes refer to adjusted results to help illustrate the impact of certain types of items, such as the acceleration of accretion of the remaining issuance discount on our TARP preferred stock in connection with the first quarter 2010 redemption of such stock, our fourth quarter 2009 gain related to BlackRock’s acquisition of Barclays Global Investors (the “BLK/BGI gain”), our third quarter 2010 gain related to the sale of PNC Global Investment Servicing Inc. (“GIS”), and integration costs in the 2010 and 2009 periods. This information supplements our results as reported in accordance with GAAP and should not be viewed in isolation from, or a substitute for, our GAAP results. We believe that this additional information and the reconciliations we provide may be useful to investors, analysts, regulators and others as they evaluate the impact of these respective items on our results for the periods presented due to the extent to which the items are not indicative of our ongoing operations. In certain discussions, we may also provide information on yields and margins for all interest-earning assets calculated using net interest income on a taxable-equivalent basis by increasing the interest income earned on tax-exempt assets to make it fully equivalent to interest income earned on taxable investments. We believe this adjustment may be useful when comparing yields and margins for all earning assets. We may also adjust yields and margins for the ratio of annualized provision for credit related losses to average interest-earning assets. We believe such adjustments are useful as a tool to help evaluate the amount of credit related risk associated with interest-earning assets. We may also provide information on pretax pre-provision earnings (total revenue less noninterest expense), as we believe that pretax pre-provision earnings is useful as a tool to help evaluate the ability to provide for credit costs through operations. This presentation may also include discussion of other non-GAAP financial measures, which, to the extent not so qualified therein or in the Appendix, is qualified by GAAP reconciliation information available on our corporate website at www.pnc.com under “About PNC–Investor Relations.” |
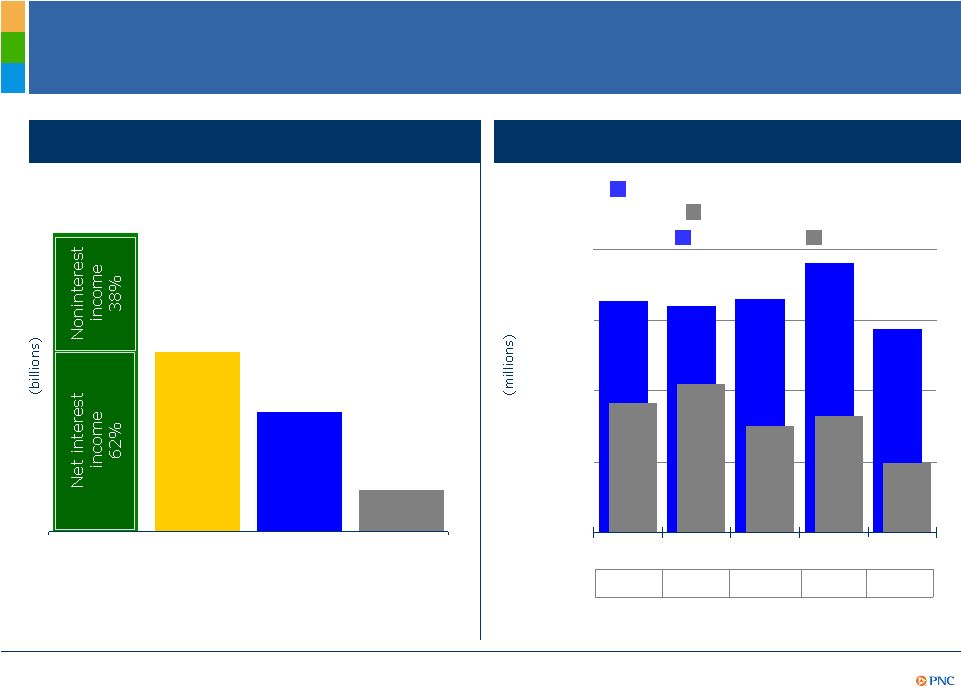
 3 Continuing to Build a Great Company Continued to deliver strong financial results in a challenging environment High quality and well-positioned balance sheet; increased bank liquidity and strengthened capital Credit quality improvement Businesses continued to grow clients and deepen relationships (1) 3Q10 adjusted for after-tax integration costs and the after-tax gain on the sale of GIS. YTD10 also adjusted for the impact of the accelerated accretion of the remaining issuance discount in connection with the redemption of our TARP preferred stock in 1Q10. Further information is provided in the Appendix. Diluted EPS from net income Return on average assets Net income As reported $4.24 $2.07 1.30% 1.65% $2.6 billion $1,103 million YTD10 3Q10 Diluted EPS from net income Return on average assets Net income As adjusted $4.47 $1.56 1.23% 1.27% $2.5 billion $837 million YTD10 3Q10 3Q10 highlights 1 |
 4 Focused on Growing Our Businesses Retail Banking Corporate & Institutional Banking Asset Management Residential Mortgage Grew checking relationships by 53,000 during 3Q10 vs. 20,000 during 2Q10 Online bill payment active customers up 8% vs. 2Q10 Customer and employee engagement remain high Continued to add clients at a record pace YTD10 Treasury Management revenue up 9% vs. YTD09 YTD10 Capital Markets revenue up 19% vs. YTD09 Outperformed sales and client acquisition goals Assets under administration over $200 billion at September 30, 2010 Referrals from other business segments in newly acquired markets up 40% vs. 2Q10 Loan originations of $2.7 billion up 17% from last quarter YTD10 servicing fees up 15% vs. YTD09 Expenses down 29% YTD10 vs. YTD09 (1) Represents consolidated PNC amounts. 1 1 |
 5 Key Financial Take-Aways 2.3x $1.60 $1.47 2Q10 3.0x $1.56 $2.07 3Q10 1.8x Pretax pre-provision earnings /provision Strong earnings, improved provision coverage ratio $1.12 $1.00 3Q09 Adjusted earnings per diluted common share Reported earnings per diluted common share 104% $823 2Q10 108% $486 3Q10 Improved credit quality, reserve level adequacy 94% $914 3Q09 Allowance for loan and lease losses to NPLs Provision for credit losses (millions) $52.77 8.3% 2Q10 $55.91 9.6% 3Q10 Increased capital and higher book value $45.52 5.5% 3Q09 Book value per common share Tier 1 common ratio (1) 3Q10 adjusted for the after-tax gain on the sale of GIS. All quarters adjusted for after-tax integration costs. (2) Total revenue less noninterest expense. (3) Includes impairment reserves attributable to purchased impaired loans. NPLs do not include purchased impaired loans or loans held for sale. See notes to slide 7. (4) Estimated. Further information related to (1), (2) and (3) is provided in the Appendix. 1 2 3 4 |
 6 High Quality, Differentiated Balance Sheet Change from: ($1.6) 1.7 - (3.0) (0.7) 0.4 (0.1) (2.0) $2.5 ($1.6) (7.1) (4.2) $9.7 June 30, 2010 $260.1 29.4 .6 11.1 39.8 179.2 10.3 40.7 $128.2 $260.1 46.5 150.1 $63.5 Sept. 30, 2010 (2.6) Other (7.3) Preferred equity ($9.7) Total liabilities and equity 0.5 Borrowed funds (1.8) Other time/savings (7.7) Total deposits 7.4 Common equity (7.9) Retail CDs $2.0 Transaction deposits (9.7) Other assets (7.4) Total loans ($9.7) Total assets $7.4 Dec. 31, 2009 Investment securities Category (billions) Loans to deposits ratio of 84% Added high quality, short- duration securities to portfolio Loan decline driven by loan pay-offs, sales, net charge-offs and ongoing soft demand Continued to grow transaction deposits while reducing higher cost brokered and retail CDs Significant improvement in common equity Highlights |
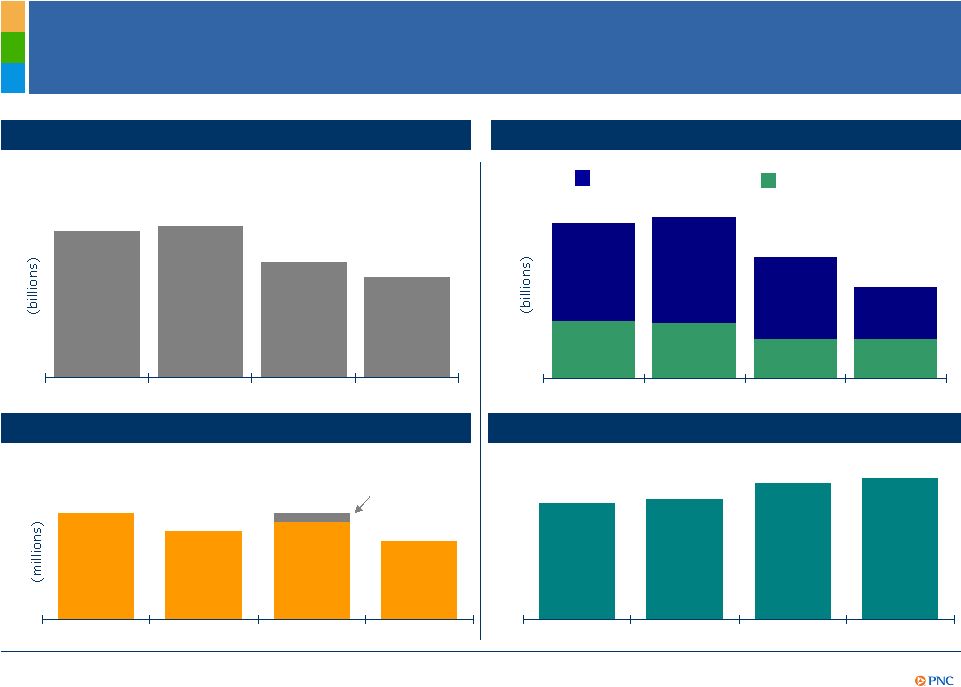 7 Credit Quality Improvement Accruing loans past due 1,3 Nonperforming loans 1,2 Net charge-offs 4Q09 1Q10 2Q10 3Q10 Allowance 4 to NPLs 1,2 Loan sales impact $75 (1) Loans acquired from National City that were impaired are not included as they were recorded at estimated fair value when acquired and are currently considered performing loans due to the accretion of interest in purchase accounting. (2) Does not include loans held for sale or foreclosed and other assets. (3) Excludes loans that are government insured/guaranteed, primarily residential mortgages. (4) Includes impairment reserves attributable to purchased impaired loans. $5.7 $5.8 $5.1 $4.8 4Q09 1Q10 2Q10 3Q10 $2.4 $2.5 $1.9 $1.4 $.9 $.8 $.6 $.6 4Q09 1Q10 2Q10 3Q10 30-89 Days 90 Days + $614 $840 $691 $835 4Q09 1Q10 2Q10 3Q10 89% 92% 104% 108% |
 8 4.24% 4.35% 1.80% 1.34% 1.47% 0.86% 3.96% 4.05% 2.90% 3.10% 2.88% 2.25% 4Q09 1Q10 2Q10 3Q10 Net Interest Income, Provision and Credit Risk-Adjusted Net Interest Margin (1) Net interest margin less (annualized provision/average interest-earning assets). Further information is provided in the Appendix. (2) Purchase accounting adjustments of $29 million and $64 million identified on page 14 of our 2Q10 Form 10-Q. (3) The 3Q10 impact of loan sales. (4) Additional provision in 2Q10 associated with seriously delinquent loans in the Distressed Assets Portfolio. (5) Additional 2Q10 provision identified on page 10 of our second quarter 2010 Form 10-Q. (6) Refer to the economic assumptions in the Cautionary Statement in the Appendix. Margin trend Net interest margin Credit risk-adjusted NIM Net interest income $2,435 2Q10 ($93) ($56) ($71) 3Q10 $2,215 2Q10 adjustments² Provision Looking ahead to 4Q10 6 $823 2Q10 3Q10 Loan sales³ Annualized provision/average interest-earning assets $486 We expect net interest income and net interest margin to trend down but at a much slower pace than the 2Q10 to 3Q10 decrease We are optimistic that provision will remain stable or decline We expect a relatively stable credit risk- adjusted net interest margin Other ($100) ($109) ($128) Loan dispositions 5 Other 2Q10 item 4 ($337) ($220) 1 1 1 |
 9 Pretax Pre-Provision Earnings Continued to Significantly Exceed Credit Costs $3.6 $2.2 $1.4 $.5 3Q10 (1) Total revenue less noninterest expense. (2) Pretax pre-provision earnings less provision. Represents income from continuing operations before income taxes and noncontrolling interests on our Consolidated Income Statement. (3) Excludes the BLK/BGI gain of $1.1 billion. Including the BLK/BGI gain, pretax pre-provision earnings were $2.7 billion, the coverage ratio was 2.6x, and pretax earnings were $1.6 billion. Further information related to (1), (2) and (3) is provided in the Appendix. Total revenue Noninterest expense Pretax pre- provision earnings Provision Pretax pre-provision earnings /provision trend $0 $500 $1,000 $1,500 $2,000 3Q09 4Q093 1Q10 2Q10 3Q10 Pretax pre-provision earnings Provision 1.8x 1.5x 2.2x 2.3x 3.0x $1,087 $954 $899 $552 3 $725 Pretax earnings X= as a multiple of 1 1 2 1 1 |
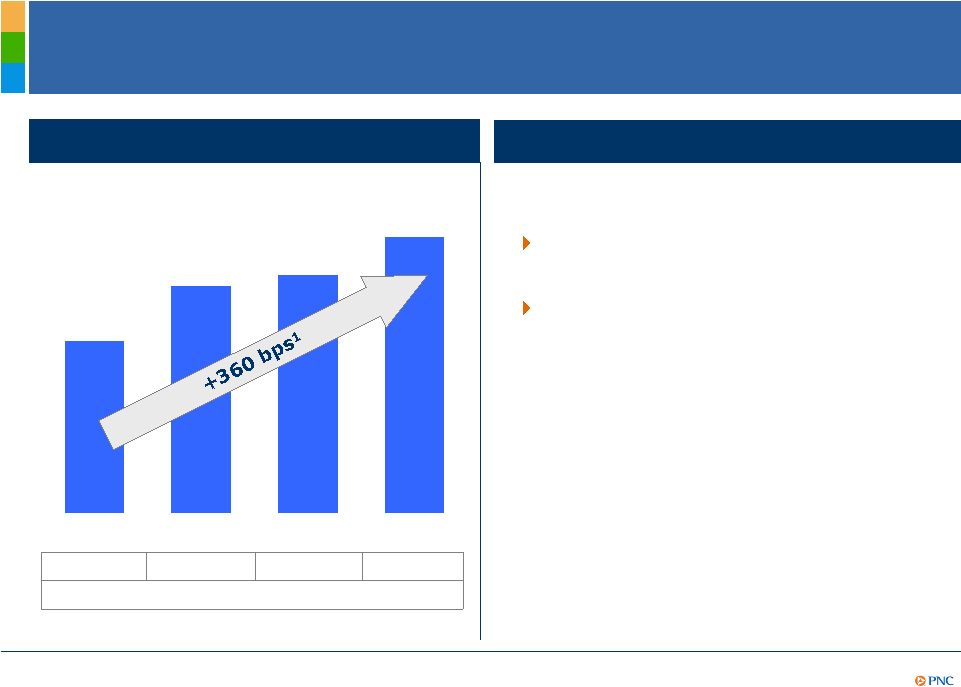 10 Increased Capital and High Quality Structure Tier 1 common capital ratio Ratios and book value per common share as of quarter end. (1) Estimated. 4Q09 2Q10 7.9% Highlights Further improvement in quality of capital Capital priorities - Maintain strong capital levels - Support our clients - Invest in our businesses - Basel III clarity - Return capital to shareholders when appropriate 9.6% 3Q10 6.0% 1Q10 8.3% Book value per common share $55.91 $52.77 $50.32 $47.68 1 |
 11 Framework for Success Execute on and deliver the PNC business model Capitalize on integration opportunities Emphasize continuous improvement culture Leverage credit that meets our risk/return criteria Focus on cross selling PNC’s deep product offerings Focus “front door” on risk-adjusted returns Leverage “back door” credit liquidation capabilities Maximize credit portfolio value Reposition deposit gathering strategies Action Plans $1.7 billion 38% 1.78% 84% Sept. 30, 2010 1.50%+ $1.8 billion >50% 0.3%-0.5% 80%-90% Strategic Objective Return on average assets (nine months ended) Key Metrics Loans to deposits ratio (as of) Provision to average loans (provision for nine months ended, annualized) Noninterest income/total revenue (nine months ended) Acquisition- related cost savings (3Q10 annualized run rate) Executing our strategies PNC Business Model Staying core funded Returning to a moderate risk profile Growing high quality, diverse revenue streams Creating positive operating leverage = original goal achieved. = new goal established in 2Q10; original goals for annualized acquisition-related cost savings and return on average assets were $1.2 billion and 1.30%+, respectively. (1) Adjusted for after-tax integration costs, the after-tax gain on the sale of GIS, and the impact of the accelerated accretion of the remaining issuance discount in connection with the redemption of our TARP preferred stock in 1Q10. Further information is provided in the Appendix. 1 1.30% reported 1.23% adjusted |
 12 Summary PNC Continues to Build a Great Company. PNC Continues to Build a Great Company. The execution of PNC’s business model continued to deliver strong results PNC is focused on quality growth across the franchise with a proven disciplined approach PNC is well-positioned to achieve greater shareholder value |
 13 Cautionary Statement Regarding Forward-Looking Information Appendix This presentation includes “snapshot” information about PNC used by way of illustration and is not intended as a full business or financial review. It should not be viewed in isolation but rather in the context of all of the information made available by PNC in its SEC filings. We also make statements in this presentation, and we may from time to time make other statements, regarding our outlook or expectations for earnings, revenues, expenses, capital levels, liquidity levels, asset quality and/or other matters regarding or affecting PNC that are forward-looking statements within the meaning of the Private Securities Litigation Reform Act. Forward-looking statements are typically identified by words such as “believe,” “plan,” “expect,” “anticipate,” “intend,” “outlook,” “estimate,” “forecast,” “will,” “should,” “project,” “goal” and other similar words and expressions. Forward-looking statements are subject to numerous assumptions, risks and uncertainties, which change over time. Forward-looking statements speak only as of the date they are made. We do not assume any duty and do not undertake to update our forward-looking statements. Actual results or future events could differ, possibly materially, from those that we anticipated in our forward-looking statements, and future results could differ materially from our historical performance. Our forward-looking statements are subject to the following principal risks and uncertainties. We provide greater detail regarding some of these factors in our 2009 Form 10-K and 2010 Form 10-Qs, including in the Risk Factors and Risk Management sections of those reports, and in our subsequent SEC filings. Our forward-looking statements may also be subject to other risks and uncertainties, including those that we may discuss elsewhere in this presentation or in our filings with the SEC, accessible on the SEC’s website at www.sec.gov and on or through our corporate website at www.pnc.com/secfilings. We have included these web addresses as inactive textual references only. Information on these websites is not part of this document. •Our businesses and financial results are affected by business and economic conditions, both generally and specifically in the principal markets in which we operate. In particular, our businesses and financial results may be impacted by: o Changes in interest rates and valuations in the debt, equity and other financial markets; o Disruptions in the liquidity and other functioning of financial markets, including such disruptions in the markets for real estate and other assets commonly securing financial products; o Actions by the Federal Reserve and other government agencies, including those that impact money supply and market interest rates; o Changes in our customers’, suppliers’ and other counterparties’ performance in general and their creditworthiness in particular; o A slowing or failure of the moderate economic recovery that began last year; o Continued effects of the aftermath of recessionary conditions and the uneven spread of the positive impacts of the recovery on the economy in general and our customers in particular, including adverse impact on loan utilization rates as well as delinquencies, defaults and customer ability to meet credit obligations; o Changes in levels of unemployment; and o Changes in customer preferences and behavior, whether as a result of changing business and economic conditions, climate-related physical changes or legislative and regulatory initiatives, or other factors. •A continuation of turbulence in significant portions of the US and global financial markets, particularly if it worsens, could impact our performance, both directly by affecting our revenues and the value of our assets and liabilities and indirectly by affecting our counterparties and the economy generally. |
 14 Cautionary Statement Regarding Forward-Looking Information (continued) Appendix •We will be impacted by the extensive reforms enacted in the Dodd-Frank Wall Street Reform and Consumer Protection Act. Further, as much of that Act will require the adoption of implementing regulations by a number of different regulatory bodies, the precise nature, extent and timing of many of these reforms and the impact on us is still uncertain. •Financial industry restructuring in the current environment could also impact our business and financial performance as a result of changes in the creditworthiness and performance of our counterparties and by changes in the competitive and regulatory landscape. •Our results depend on our ability to manage current elevated levels of impaired assets. •Given current economic and financial market conditions, our forward-looking financial statements are subject to the risk that these conditions will be substantially different than we are currently expecting. These statements are based on our current view that the moderate economic recovery that began last year will continue throughout the rest of 2010 and slowly gather momentum in 2011 amidst continued low interest rates. •Legal and regulatory developments could have an impact on our ability to operate our businesses or our financial condition or results of operations or our competitive position or reputation. Reputational impacts, in turn, could affect matters such as business generation and retention, our ability to attract and retain management, liquidity, and funding. These legal and regulatory developments could include: o Changes resulting from legislative and regulatory responses to the current economic and financial industry environment; o Other legislative and regulatory reforms, including broad-based restructuring of financial industry regulation as well as changes to laws and regulations involving tax, pension, bankruptcy, consumer protection, and other aspects of the financial institution industry; o Unfavorable resolution of legal proceedings or other claims and regulatory and other governmental investigations or other inquiries. In addition to matters relating to PNC’s business and activities, such matters may also include proceedings, claims, investigations, or inquiries relating to pre-acquisition business and activities of acquired companies such as National City; o The results of the regulatory examination and supervision process, including our failure to satisfy the requirements of agreements with governmental agencies; o Changes in accounting policies and principles; o Changes resulting from legislative and regulatory initiatives relating to climate change that have or may have a negative impact on our customers’ demand for or use of our products and services in general and their creditworthiness in particular; and o Changes to regulations governing bank capital, including as a result of the so-called “Basel 3” initiatives. •Our business and operating results are affected by our ability to identify and effectively manage risks inherent in our businesses, including, where appropriate, through the effective use of third-party insurance, derivatives, and capital management techniques, and by our ability to meet evolving regulatory capital standards. •The adequacy of our intellectual property protection, and the extent of any costs associated with obtaining rights in intellectual property claimed by others, can impact our business and operating results. •Our ability to anticipate and respond to technological changes can have an impact on our ability to respond to customer needs and to meet competitive demands. •Our ability to implement our business initiatives and strategies could affect our financial performance over the next several years. •Our expansion with our National City acquisition in geographic markets and into business operations in areas in which we did not have significant experience or presence prior to 2009 presents greater risks and uncertainties than were present for us in other recent acquisitions. •Competition can have an impact on customer acquisition, growth and retention, as well as on our credit spreads and product pricing, which can affect market share, deposits and revenues. |
 15 Cautionary Statement Regarding Forward-Looking Information (continued) Appendix •Our business and operating results can also be affected by widespread disasters, terrorist activities or international hostilities, either as a result of the impact on the economy and capital and other financial markets generally or on us or on our customers, suppliers or other counterparties specifically. •Also, risks and uncertainties that could affect the results anticipated in forward-looking statements or from historical performance relating to our equity interest in BlackRock, Inc. are discussed in more detail in BlackRock’s filings with the SEC, including in the Risk Factors sections of BlackRock’s reports. BlackRock’s SEC filings are accessible on the SEC’s website and on or through BlackRock’s website at www.blackrock.com. This material is referenced for informational purposes only and should not be deemed to constitute a part of this document. We grow our business in part by acquiring from time to time other financial services companies. Acquisitions present us with risks in addition to those presented by the nature of the business acquired. These include risks and uncertainties related both to the acquisition transactions themselves and to the integration of the acquired businesses into PNC after closing. Acquisitions may be substantially more expensive to complete (including unanticipated costs incurred in connection with the integration of the acquired company) and the anticipated benefits (including anticipated cost savings and strategic gains) may be significantly harder or take longer to achieve than expected. Acquisitions may involve our entry into new businesses or new geographic or other markets, and these situations also present risks resulting from our inexperience in those new areas. As a regulated financial institution, our pursuit of attractive acquisition opportunities could be negatively impacted due to regulatory delays or other regulatory issues. Regulatory and/or legal issues relating to the pre-acquisition operations of an acquired business may cause reputational harm to PNC following the acquisition and integration of the acquired business into ours and may result in additional future costs or regulatory limitations arising as a result of those issues. Any annualized, proforma, estimated, third party or consensus numbers in this presentation are used for illustrative or comparative purposes only and may not reflect actual results. Any consensus earnings estimates are calculated based on the earnings projections made by analysts who cover that company. The analysts’ opinions, estimates or forecasts (and therefore the consensus earnings estimates) are theirs alone, are not those of PNC or its management, and may not reflect PNC’s or other company’s actual or anticipated results. |
 16 Non-GAAP to GAAP Reconcilement Appendix In millions except per share data Adjustments, pretax Income taxes (benefit) 1 Net income Net income attributable to common shareholders Diluted EPS from net income Average Assets Return on Avg. Assets Net income, diluted EPS, and return on avg. assets, as reported $1,103 $1,094 $2.07 $264,579 1.65% Adjustments: Gain on sale of GIS $(639) $311 (328) (328) (.62) Integration costs 96 (34) 62 62 .11 Net income, diluted EPS, and return on avg. assets, as adjusted $837 $828 $1.56 $264,579 1.27% In millions except per share data Adjustments, pretax Income taxes (benefit) 1 Net income Net income attributable to common shareholders Diluted EPS from net income Net income and diluted EPS, as reported $803 $786 $1.47 Adjustment: Integration costs $100 ($35) 65 65 .13 Net income and diluted EPS, as adjusted $868 $851 $1.60 In millions except per share data Adjustments, pretax Income taxes (benefit) 1 Net income Net income attributable to common shareholders Diluted EPS from net income Net income and diluted EPS, as reported $559 $467 $1.00 Adjustment: Integration costs $89 ($31) 58 58 .12 Net income and diluted EPS, as adjusted $617 $525 $1.12 For the three months ended September 30, 2010 For the three months ended June 30, 2010 For the three months ended September 30, 2009 PNC believes that information adjusted for the impact of certain items may be useful due to the extent to which the items are not indicative of our ongoing operations. (1) Calculated using a marginal federal income tax rate of 35% and includes applicable income tax adjustments. The after-tax gain on the sale of GIS also reflects the impact of state income taxes. |
 17 Non-GAAP to GAAP Reconcilement Appendix In millions except per share data Adjustments, pretax Income taxes (benefit) 1 Net income Net income attributable to common shareholders Diluted EPS from net income Average Assets Return on Avg. Assets Net income, diluted EPS, and return on avg. assets, as reported $2,577 $2,213 $4.24 $265,355 1.30% Adjustments: Gain on sale of GIS $(639) $311 (328) (328) (.63) Integration costs 309 (108) 201 201 .38 TARP preferred stock accelerated discount accretion 2 250 .48 Net income, diluted EPS, and return on avg. assets, as adjusted $2,450 $2,336 $4.47 $265,355 1.23% In millions except per share data Adjustments, pretax Income taxes (benefit) 1 Net income Net income attributable to common shareholders Diluted EPS from net income Net income and diluted EPS, as reported $1,296 $992 $2.17 Adjustment: Integration costs $266 ($83) 183 183 .40 Net income and diluted EPS, as adjusted $1,479 $1,175 $2.57 (2) Represents accelerated accretion of the remaining issuance discount on redemption of the preferred stock in February 2010. For the nine months ended September 30, 2010 For the nine months ended September 30, 2009 PNC believes that information adjusted for the impact of certain items may be useful due to the extent to which the items are not indicative of our ongoing operations. (1) Calculated using a marginal federal income tax rate of 35% and includes applicable income tax adjustments. The after-tax gain on the sale of GIS also reflects the impact of state income taxes. |
 18 Non-GAAP to GAAP Reconcilement Appendix For the three months ended Sept. 30, 2010 June 30, 2010 Mar. 31, 2010 Dec. 31, 2009 Sept. 30, 2009 In millions except ratio and per share data Total revenue $3,598 $3,912 $3,763 $4,886 $3,853 Noninterest expense 2,158 2,002 2,113 2,209 2,214 Pretax pre-provision earnings $1,440 $1,910 $1,650 $2,677 $1,639 Provision $486 $823 $751 $1,049 $914 Income from continuing operations before income taxes and noncontrolling interests (Pretax earnings) $954 $1,087 $899 $1,628 $725 Pretax pre-provision earnings/provision 3.0 2.3 2.2 2.6 1.8 Gain on BLK/BGI transaction $1,076 Pretax earnings excluding BLK/BGI gain $1,601 Pretax pre-provision earnings excluding BLK/BGI gain/provision 1.5 For the three months ended Sept. 30, 2010 June 30, 2010 Mar. 31, 2010 Dec. 31, 2009 Sept. 30, 2009 Net interest margin 3.96% 4.35% 4.24% 4.05% 3.76% Provision for credit losses $486 $823 $751 $1,049 $914 Avg. interest earning assets $223,677 $224,580 $226,992 $230,998 $235,694 Annualized provision/Avg. interest earning assets 0.86% 1.47% 1.34% 1.80% 1.54% Credit risk-adjusted net interest margin (1) 3.10% 2.88% 2.90% 2.25% 2.22% For the nine months ended Sept. 30, 2010 Sept. 30, 2009 Net interest margin 4.18% 3.72% Provision for credit losses $2,060 $2,881 Avg. interest earning assets $225,071 $241,010 Annualized provision/Avg. interest earning assets 1.22% 1.60% Credit risk-adjusted net interest margin (1) 2.96% 2.12% (1) The adjustment represents annualized provision for credit losses divided by average interest-earning assets. PNC believes that pretax pre-provision earnings, a non-GAAP measure, is useful as a tool to help evaluate the ability to provide for credit costs through operations, and that information adjusted for the impact of the BLK/BGI gain may be useful to the extent to which that item is not indicative of our ongoing operations. PNC believes that credit risk-adjusted net interest margin, a non-GAAP measure, is useful as a tool to help evaluate the amount of credit related risk associated with interest-earning assets. |
 19 Peer Group of Banks Appendix The PNC Financial Services Group, Inc. PNC BB&T Corporation BBT Bank of America Corporation BAC Capital One Financial, Inc. COF Comerica Inc. CMA Fifth Third Bancorp FITB JPMorgan Chase JPM KeyCorp KEY M&T Bank MTB Regions Financial Corporation RF SunTrust Banks, Inc. STI U.S. Bancorp USB Wells Fargo & Co. WFC Ticker |