 The PNC Financial Services Group, Inc. First Quarter 2011 Earnings Conference Call April 21, 2011 Exhibit 99.2 * * * * * |
 2 Cautionary Statement Regarding Forward-Looking Information and Adjusted Information This presentation includes “snapshot” information about PNC used by way of illustration. It is not intended as a full business or financial review and should be viewed in the context of all of the information made available by PNC in its SEC filings. The presentation also contains forward-looking statements regarding our outlook or expectations for earnings, revenues, expenses, capital levels, liquidity levels, asset quality and/or other matters regarding or affecting PNC and its future business and operations. Forward-looking statements are necessarily subject to numerous assumptions, risks and uncertainties, which change over time. The forward-looking statements in this presentation are qualified by the factors affecting forward-looking statements identified in the more detailed Cautionary Statement included in the Appendix, which is included in the version of the presentation materials posted on our corporate website at www.pnc.com/investorevents. We provide greater detail regarding some of these factors in our 2010 Form 10-K, including in the Risk Factors and Risk Management sections of that report, and in our subsequent SEC filings (accessible on the SEC’s website at www.sec.gov and on or through our corporate website at www.pnc.com/secfilings). We have included web addresses here and elsewhere in this presentation as inactive textual references only. Information on these websites is not part of this presentation. Future events or circumstances may change our outlook or expectations and may also affect the nature of the assumptions, risks and uncertainties to which our forward-looking statements are subject. The forward-looking statements in this presentation speak only as of the date of this presentation. We do not assume any duty and do not undertake to update those statements. In this presentation, we will sometimes refer to adjusted results to help illustrate the impact of certain types of items, such as our third quarter 2010 gain related to the sale of PNC Global Investment Servicing Inc. (“GIS”). This information supplements our results as reported in accordance with GAAP and should not be viewed in isolation from, or a substitute for, our GAAP results. We believe that this additional information and the reconciliations we provide may be useful to investors, analysts, regulators and others as they evaluate the impact of these respective items on our results for the periods presented due to the extent to which the items are not indicative of our ongoing operations. We may also provide information on pretax pre-provision earnings (total revenue less noninterest expense), as we believe that pretax pre-provision earnings, a non-GAAP measure, is useful as a tool to help evaluate the ability to provide for credit costs through operations. Where applicable, we provide GAAP reconciliations for such additional information. In certain discussions, we may also provide information on yields and margins for all interest-earning assets calculated using net interest income on a taxable-equivalent basis by increasing the interest income earned on tax-exempt assets to make it fully equivalent to interest income earned on taxable investments. We believe this adjustment may be useful when comparing yields and margins for all earning assets. We may also use annualized, proforma, estimated or third party numbers for illustrative or comparative purposes only. These may not reflect actual results. This presentation may also include discussion of other non-GAAP financial measures, which, to the extent not so qualified therein or in the Appendix, is qualified by GAAP reconciliation information available on our corporate website at www.pnc.com under “About PNC–Investor Relations.” |
 3 Today’s Discussion 1Q11 strategic achievements – strong results and capital actions Building momentum in our businesses – client growth and new product launches Key financial take-aways – strong balance sheet, strong earnings and solid returns 2011 outlook remains positive PNC Continues to Build a Great Company. PNC Continues to Build a Great Company. |
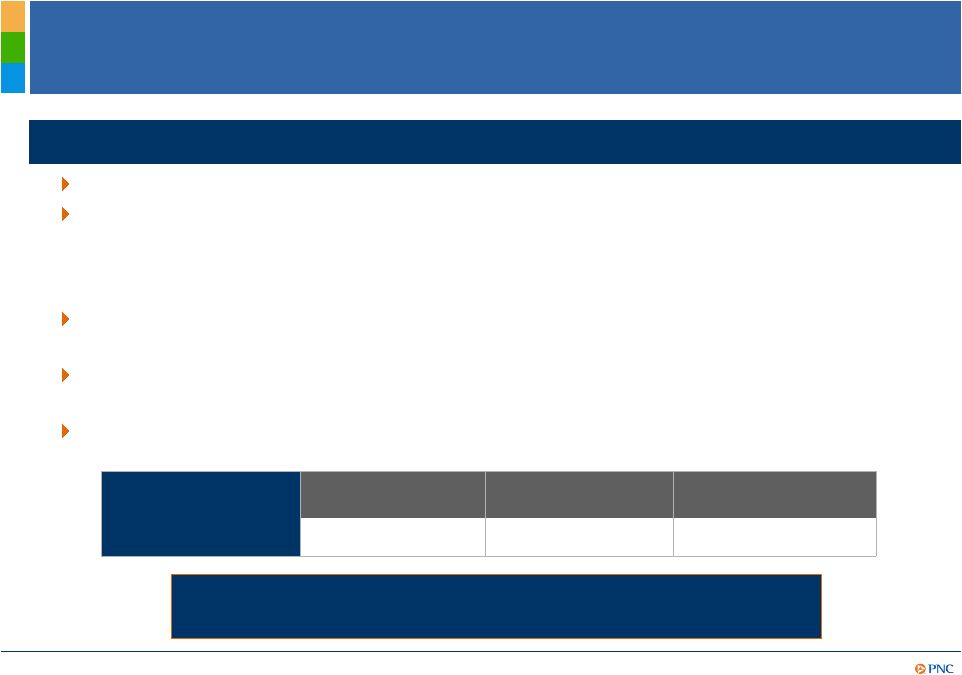 4 Significant 1Q11 Achievements PNC Is Positioned to Deliver Even Greater Shareholder Value. PNC Is Positioned to Deliver Even Greater Shareholder Value. 1Q11 financial summary Net income Diluted EPS from net income Return on average assets $832 million $1.57 1.29% Delivered strong financial results through the execution of our business model Record capital levels - Increased quarterly common stock dividend 250% to $0.35 per share for 2Q11 - Confirmed 25 million share repurchase program; plan to repurchase up to $500 million in 2011 Businesses continued to grow clients, deepen relationships and launch new products Continued to maintain a high quality balance sheet, poised to support client growth Actively managed our risk positions toward a moderate profile 1Q11 highlights (1) Subject to market and general economic conditions, economic and regulatory capital conditions, alternative uses of capital, regulatory and contractual limitations, and potential impact on credit ratings. 1 |
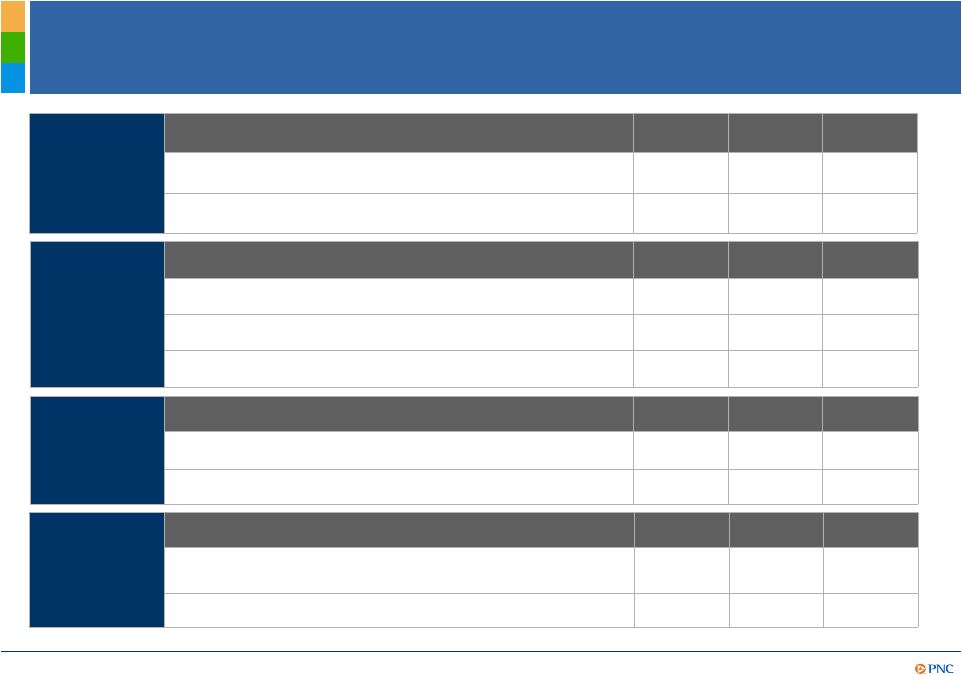
 5 Focused on Growing Our Businesses Retail Banking Corporate & Institutional Banking Asset Management Residential Mortgage Grew checking relationships by 56,000 during 1Q11 Reached a definitive agreement to acquire 19 branches and approximately $350 million of deposits from BankAtlantic Bancorp in the Tampa, Florida area 1 Launched new deposit products line-up and new credit card products Beginning to see growth in loans and commitments and increased utilization - Average loans increased $1.2 billion in 1Q11 vs. 4Q10 On track to reach goal of adding 1,000 new clients in 2011 Good pipeline activity in treasury management, M&A advisory and syndications Grew assets under administration to $219 billion at March 31, 2011 Continued aggressive hiring to drive growth across the footprint Investing in innovation and technology – piloting Wealth Insight tool Loan originations of $3.2 billion up 60% from 1Q10, but down from 4Q10 1Q11 servicing fees up 9% and loans sales revenue up 27% vs. 4Q10 Positive operating leverage 2 (1) Subject to customary closing conditions. (2) A period to period dollar or percentage change when revenue growth exceeds expense growth. PNC is a 2011 Gallup Great Workplace Award Winner. PNC is a 2011 Gallup Great Workplace Award Winner. |
 6 Financial Performance Strong Earnings 1Q11 4Q10 1Q10 Net income ($ millions) $832 $820 $671 Earnings per diluted share $1.57 $1.50 $0.66 Valuation Drivers 1Q11 4Q10 1Q10 Tier 1 common capital ratio¹ 10.3% 9.8% 7.9% Book value per common share $58.01 $56.29 $50.32 Operating Leverage 1Q11 4Q10 1Q10 Revenue ($ millions) $3,631 $3,903 $3,763 Provision ($ millions) $421 $442 $751 Noninterest expense ($ millions) $2,070 $2,340 $2,113 Performance Measures 1Q11 4Q10 1Q10 Return on average assets 1.29% 1.23% 1.02% Return on Tier 1 common capital 1,3 15.4% 15.4% 15.5% (1) 1Q11 Tier 1 common capital ratio is estimated. (2) At period end. (3) Return on Tier 1 common capital calculated as annualized net income divided by Tier 1 common capital. Further information is provided in the Appendix. 2 |
 7 A Higher Quality, Differentiated Balance Sheet Category (billions) Mar. 31, 2011 Dec. 31, 2010 Investment securities $61.0 $64.3 Core commercial loans 62.0 60.7 Core commercial real estate 15.8 16.4 Core consumer loans 57.7 58.7 Distressed loans² 13.9 14.8 Total loans 149.4 150.6 Other assets 49.0 49.4 Total assets $259.4 $264.3 Transaction deposits $134.5 $134.7 Retail CDs, time, savings 47.5 48.7 Total deposits 182.0 183.4 Borrowed funds, other 46.3 50.7 Preferred equity .6 .6 Common equity 30.5 29.6 Total liabilities and equity $259.4 $264.3 Securities impacted by principal prepayments and sales Core commercial loan growth offset by continued distressed runoff and soft consumer loan demand Continued reduction in high cost brokered and retail CDs Core funded – loans to deposits ratio of 82% Strengthened common equity Highlights (1) Excludes loans assigned to the Distressed Assets Portfolio business segment. (2) Represents loans assigned to the Distressed Assets Portfolio business segment. 1 1 1 |
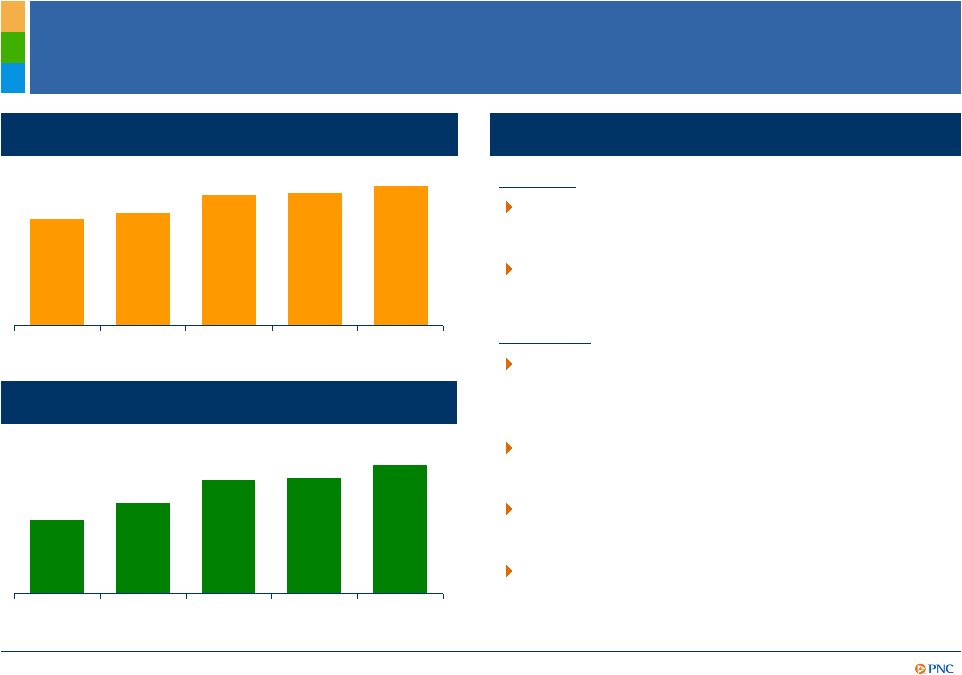
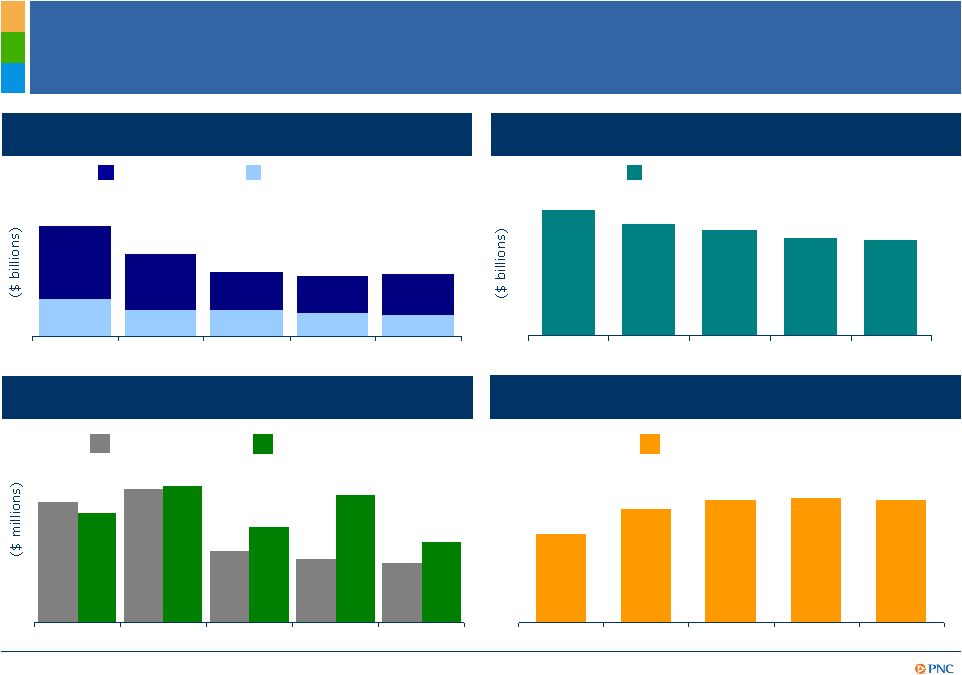 8 Credit Trends Continue to Improve $751 $486 $442 $421 $840 $614 $791 $823 $691 $533 1Q10 2Q10 3Q10 4Q10 1Q11 Provision Net charge-offs Allowance to NPL’s 104% 92% 108% 109% 108% 1Q10 2Q10 3Q10 4Q10 1Q11 Provision and net charge-offs Coverage Accruing loans past due 1,2 30-89 Days 90 Days + Nonperforming loans 1,3 $2.5 $1.9 $1.4 $1.4 $1.4 $.8 $.6 $.6 $.5 $.5 1Q10 2Q10 3Q10 4Q10 1Q11 1Q10 2Q10 3Q10 4Q10 1Q11 Total nonperforming loans $5.8 $5.1 $4.8 $4.5 As of quarter end except net charge-offs, which are for the quarter. (1) Loans acquired from National City that were impaired are not included as they were recorded at estimated fair value when acquired and are currently considered performing loans due to the accretion of interest in purchase accounting. (2) Excludes loans that are government insured/guaranteed, primarily residential mortgages. (3) Does not include loans held for sale or foreclosed and other assets. $4.4 |
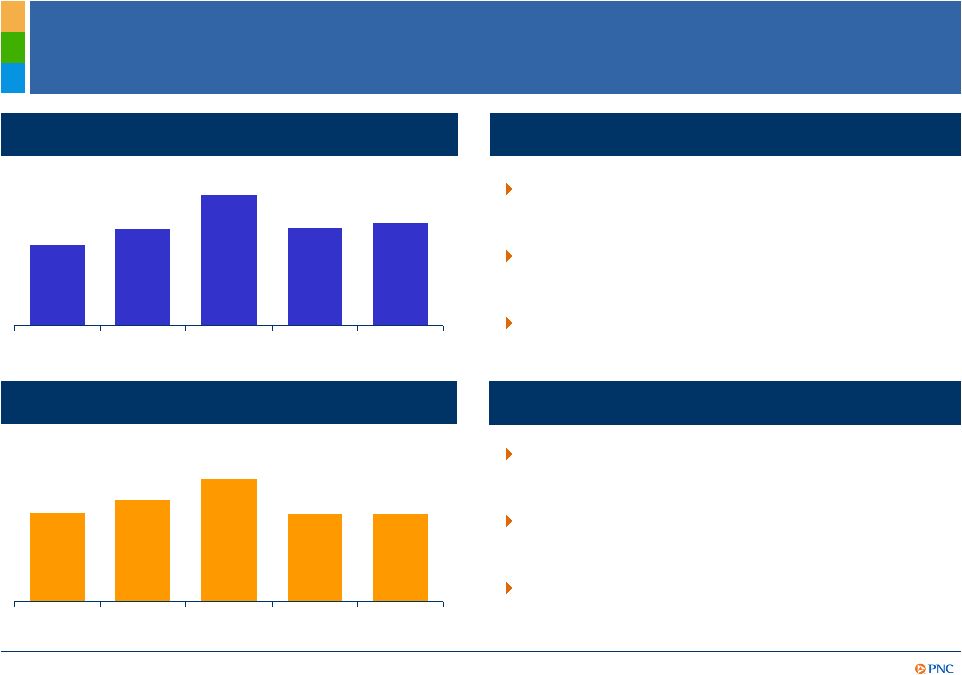
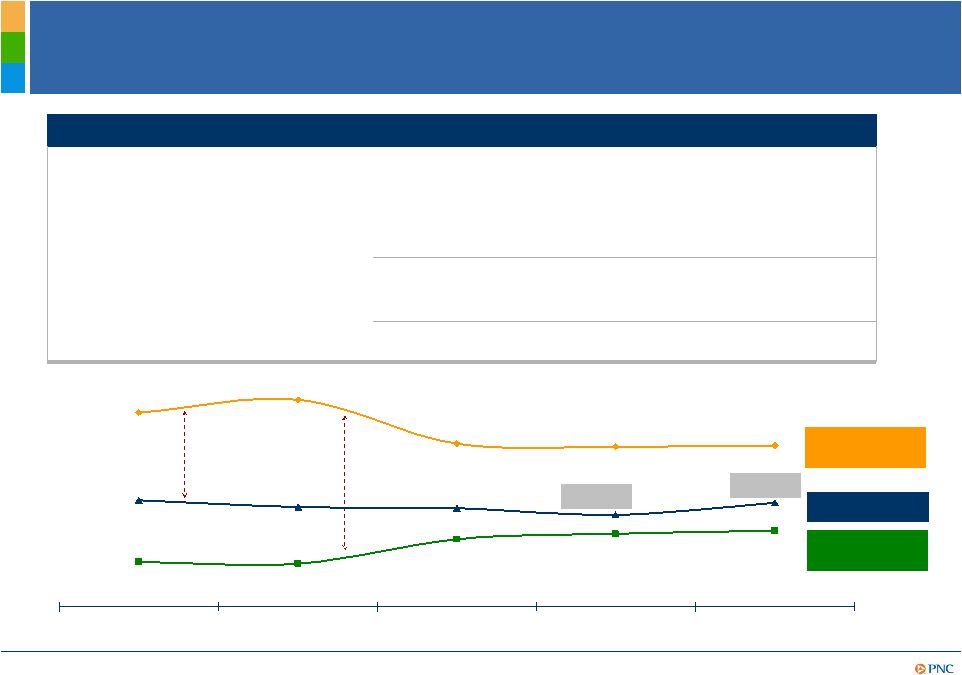 9 3.94% 3.96% 4.35% 3.93% 4.24% 3.43% 3.32% 3.38% 3.39% 3.45% 3.18% 2.88% 3.15% 3.10% 2.90% 1Q10 2Q10 3Q10 4Q10 1Q11 Net interest margin Provision- adjusted NIM 5 Core 1 and Provision-Adjusted 2 Net Interest Income Trends (1) Core net interest income is total net interest income, as reported, less related purchase accounting accretion (scheduled and cash recoveries). (2) Reflects cash received in excess of recorded investment from sales or payoffs of impaired commercial loans. (3) Provision- adjusted net interest income is total net interest income, as reported, less provision. (4) Net interest margin less (annualized purchase accounting accretion/average interest-earning assets). (5) Net interest margin less (annualized provision/average interest-earnings assets). Further information on (4) and (5) is provided in the Appendix. (millions) 1Q10 2Q10 3Q10 4Q10 1Q11 Core NII $1,939 $1,895 $1,890 $1,857 $1,895 Scheduled purchase accounting accretion 365 376 214 211 200 Cash recoveries 75 164 111 133 81 Total NII $2,379 $2,435 $2,215 $2,201 $2,176 Provision 751 823 486 442 421 Provision-adjusted NII $1,628 $1,612 $1,729 $1,759 $1,755 Core NIM 4 Purchase accounting accretion Provision 2 3 1 |
  10 Client Growth and Sales Momentum Provide Opportunities to Increase Noninterest Revenue Highlights (millions) 1Q10 2Q10 3Q10 4Q10 1Q11 Asset management 1 $259 $243 $249 $303 $263 Consumer services 296 315 328 322 311 Corporate services 268 261 183 370 217 Residential mortgage 147 179 216 157 195 Deposit service charges 200 209 164 132 123 BlackRock transaction gain - - - 160 - Other 2 214 270 243 258 346 Total noninterest income $1,384 $1,477 $1,383 $1,702 $1,455 Asset management fees impacted in comparison by higher 4Q10 BlackRock contribution. Strong Asset Management Group contribution in 1Q11 Consumer services increased in 1Q11 versus 1Q10 due to customer growth and increased volume; seasonal decline versus 4Q10 Corporate services impacted by commercial MSR impairment in 1Q11 versus recovery in 4Q10; strong M&A advisory fees in 4Q10 Residential mortgage improved primarily due to higher loan sales revenue and net MSR hedging gains Deposit service charges reflect regulatory³ impact versus 1Q10 and seasonal declines versus 4Q10 Other revenue increased versus 4Q10 due to lower repurchase reserves in 1Q11 (1) Asset management fees include the Asset Management Group and BlackRock (2) “Other” includes net gains on sales of securities, net other- than-temporary impairments, and other. (3) Regulatory impact reflects Regulation E. |
  11 Well–Controlled Expenses While Investing for Growth Highlights $2,002 638 65 168 172 $959 2Q10 $2,158 789 81 152 177 $959 3Q10 $2,070 681 40 167 193 $989 1Q11 $2,340 $2,113 Total noninterest expense 194 187 Occupancy 176 172 Equipment 70 50 Marketing 748 $956 1Q10 Other Personnel (millions) 868 $1,032 4Q10 Personnel expense declined versus 4Q10 primarily due to lower incentive compensation Marketing expense declined in 1Q11 due to elevated costs associated with launching in new markets in 2010 Other expense declined primarily due to higher mortgage foreclosure expenses in Q4 Expenses performed better than expected in 1Q11 due to reversal of a portion of indemnification liability for Visa litigation of $38 million PNC is Committed to Disciplined Expense Management. PNC is Committed to Disciplined Expense Management. |
 12 Strengthened Capital to Record Levels Tier 1 common ratio and book value per share as of quarter end. (1) Estimated. (2) See note (1) on Slide 4. PNC’s capital management actions / priorities Actions: Increased quarterly common stock dividend 250% to $0.35 for 2Q11 Confirmed share repurchase program; plan to repurchase up to $500 million in 2011 2 Priorities: Maintain ample capacity to meet the needs of our clients and support organic business growth Continue to invest in innovative products and services Deploy capital for acquisitions that meet our strategic criteria Ensure capital adequacy in times of uncertainty and regulatory compliance 10.3% 9.8% 9.6% 8.3% 7.9% 1Q10 2Q10 3Q10 4Q10 1Q11¹ Tier 1 common ratio $58.01 $56.29 $55.91 $52.77 $50.32 1Q10 2Q10 3Q10 4Q10 1Q11 Book value per share |
 13 Generating Solid Returns on a Higher Quality Balance Sheet ROAA highlights Declining credit costs more than offsetting reductions in purchase accounting accretion Average assets declined $4.6 billion since 1Q10 3Q10 benefitted from gain on sale of GIS 2 Impact of higher earnings more than offset by increased Tier 1 common capital Tier 1 common capital increased 25% since 1Q10 3Q10 benefitted from gain on sale of GIS 2 1.29% 1.23% 1.65% 1.22% 1.02% 1Q10 2Q10 3Q10 4Q10 1Q11 Return on average assets Return on Tier 1 common capital 1 15.4% 15.4% 21.4% 17.7% 15.5% 1Q10 2Q10 3Q10 4Q10 1Q11 (1) 1Q11 Tier 1 common capital is estimated. Return on Tier 1 common capital calculated as annualized net income divided by Tier 1 common capital. (2) See Appendix for 3Q10 returns as adjusted for the $328 million after-tax gain on the sale of GIS. Further information on (1) and (2) is provided in the Appendix. Return on Tier 1 common capital highlights |
 14 Outlook 1 – Full Year 2011 vs. 2010 Balance Sheet Income Statement Commercial loan growth is expected Continue to shift deposit mix towards transaction accounts Core NII expected to increase by more than $100 million Purchase accounting accretion expected to decline by $700 million, resulting in lower NII Provision expected to decline by at least $800 million Provision-adjusted NII and margin expected to increase Noninterest income expected to increase in the low-to-mid single digits, excluding the expected incremental negative impact of approximately $400 million due to overdraft and interchange regulatory limits Noninterest expenses expected to decline 2 (1) Refer to assumptions in the Cautionary Statement in the Appendix. (2) Subject to legal and regulatory contingencies. See Note 22 Legal Proceedings included in Item 8 and Risk Factors Item 1A of PNC’s 2010 Form 10-K. |
 15 Summary PNC Continues to Build a Great Company. PNC Continues to Build a Great Company. 1Q11 strategic achievements – strong results and capital actions Building momentum in our businesses – client growth and new product launches Key financial take-aways – strong balance sheet, strong earnings and solid returns 2011 outlook remains positive |
 16 Cautionary Statement Regarding Forward-Looking Information Appendix This presentation includes “snapshot” information about PNC used by way of illustration and is not intended as a full business or financial review. It should not be viewed in isolation but rather in the context of all of the information made available by PNC in its SEC filings. We also make statements in this presentation, and we may from time to time make other statements, regarding our outlook or expectations for earnings, revenues, expenses, capital levels, liquidity levels, asset quality and/or other matters regarding or affecting PNC and its future business and operations that are forward-looking statements within the meaning of the Private Securities Litigation Reform Act. Forward-looking statements are typically identified by words such as “believe,” “plan,” “expect,” “anticipate,” “intend,” “outlook,” “estimate,” “forecast,” “will,” “should,” “project,” “goal” and other similar words and expressions. Forward-looking statements are subject to numerous assumptions, risks and uncertainties, which change over time. Forward-looking statements speak only as of the date they are made. We do not assume any duty and do not undertake to update our forward- looking statements. Actual results or future events could differ, possibly materially, from those that we anticipated in our forward-looking statements, and future results could differ materially from our historical performance. Our forward-looking statements are subject to the following principal risks and uncertainties. We provide greater detail regarding some of these factors in our 2010 Form 10-K, including in the Risk Factors and Risk Management sections of that report, and in our subsequent SEC filings. Our forward-looking statements may also be subject to other risks and uncertainties, including those that we may discuss elsewhere in this presentation or in our filings with the SEC, accessible on the SEC’s website at www.sec.gov and on or through our corporate website at www.pnc.com/secfilings. We have included these web addresses as inactive textual references only. Information on these websites is not part of this document. •Our businesses and financial results are affected by business and economic conditions, both generally and specifically in the principal markets in which we operate. In particular, our businesses and financial results may be impacted by: o Changes in interest rates and valuations in the debt, equity and other financial markets. o Disruptions in the liquidity and other functioning of financial markets, including such disruptions in the markets for real estate and other assets commonly securing financial products. o Actions by the Federal Reserve and other government agencies, including those that impact money supply and market interest rates. o Changes in our customers’, suppliers’ and other counterparties’ performance in general and their creditworthiness in particular. o A slowing or failure of the moderate economic recovery that began in mid-2009 and continued throughout 2010 and into 2011. o Continued effects of the aftermath of recessionary conditions and the uneven spread of the positive impacts of the recovery on the economy in general and our customers in particular, including adverse impact on loan utilization rates as well as delinquencies, defaults and customer ability to meet credit obligations. o Changes in levels of unemployment. o Changes in customer preferences and behavior, whether as a result of changing business and economic conditions, climate-related physical changes or legislative and regulatory initiatives, or other factors. •Turbulence in significant portions of the US and global financial markets could impact our performance, both directly by affecting our revenues and the value of our assets and liabilities and indirectly by affecting our counterparties and the economy generally. |
 17 Cautionary Statement Regarding Forward-Looking Information (continued) Appendix •We will be impacted by the extensive reforms provided for in the Dodd-Frank Wall Street Reform and Consumer Protection Act (“Dodd-Frank Act”) and ongoing reforms impacting the financial institutions industry generally. Further, as much of the Dodd-Frank Act will require the adoption of implementing regulations by a number of different regulatory bodies, the precise nature, extent and timing of many of these reforms and the impact on us is still uncertain. •Financial industry restructuring in the current environment could also impact our business and financial performance as a result of changes in the creditworthiness and performance of our counterparties and by changes in the competitive and regulatory landscape. •Our results depend on our ability to manage current elevated levels of impaired assets. •Given current economic and financial market conditions, our forward-looking financial statements are subject to the risk that these conditions will be substantially different than we are currently expecting. These statements are based on our current view that the moderate economic recovery that began in mid-2009 and continued throughout 2010 will transition into a self-sustaining economic expansion in 2011 pushing the unemployment rate lower amidst continued low interest rates. •Legal and regulatory developments could have an impact on our ability to operate our businesses or our financial condition or results of operations or our competitive position or reputation. Reputational impacts, in turn, could affect matters such as business generation and retention, our ability to attract and retain management, liquidity, and funding. These legal and regulatory developments could include: o Changes resulting from legislative and regulatory responses to the current economic and financial industry environment. o Other legislative and regulatory reforms, including broad-based restructuring of financial industry regulation (such as that under the Dodd-Frank Act) as well as changes to laws and regulations involving tax, pension, bankruptcy, consumer protection, and other aspects of the financial institution industry. o Unfavorable resolution of legal proceedings or other claims and regulatory and other governmental investigations or other inquiries. In addition to matters relating to PNC’s business and activities, such matters may also include proceedings, claims, investigations, or inquiries relating to pre-acquisition business and activities of acquired companies, such as National City. These matters may result in monetary judgments or settlements or other remedies, including fines, penalties, restitution or alterations in our business practices and in additional expenses and collateral costs. o The results of the regulatory examination and supervision process, including our failure to satisfy the requirements of agreements with governmental agencies. o Changes in accounting policies and principles. o Changes resulting from legislative and regulatory initiatives relating to climate change that have or may have a negative impact on our customers’ demand for or use of our products and services in general and their creditworthiness in particular. o Changes to regulations governing bank capital, including as a result of the Dodd-Frank Act and of the Basel III initiatives. •Our business and operating results are affected by our ability to identify and effectively manage risks inherent in our businesses, including, where appropriate, through the effective use of third-party insurance, derivatives, and capital management techniques, and by our ability to meet evolving regulatory capital standards. •The adequacy of our intellectual property protection, and the extent of any costs associated with obtaining rights in intellectual property claimed by others, can impact our business and operating results. •Our ability to anticipate and respond to technological changes can have an impact on our ability to respond to customer needs and to meet competitive demands. •Our ability to implement our business initiatives and strategies could affect our financial performance over the next several years. |
 18 Cautionary Statement Regarding Forward-Looking Information (continued) Appendix •Competition can have an impact on customer acquisition, growth and retention, as well as on our credit spreads and product pricing, which can affect market share, deposits and revenues. •Our business and operating results can also be affected by widespread disasters, terrorist activities or international hostilities, either as a result of the impact on the economy and capital and other financial markets generally or on us or on our customers, suppliers or other counterparties specifically. •Also, risks and uncertainties that could affect the results anticipated in forward-looking statements or from historical performance relating to our equity interest in BlackRock, Inc. are discussed in more detail in BlackRock’s filings with the SEC, including in the Risk Factors sections of BlackRock’s reports. BlackRock’s SEC filings are accessible on the SEC’s website and on or through BlackRock’s website at www.blackrock.com. This material is referenced for informational purposes only and should not be deemed to constitute a part of this document. We grow our business in part by acquiring from time to time other financial services companies, financial services assets and related deposits. Acquisitions present us with risks in addition to those presented by the nature of the business acquired. These include risks and uncertainties relate d both to the acquisition transactions themselves and to the integration of the acquired businesses into PNC after closing. Acquisitions may be substantially more expensive to complete (including unanticipated costs incurred in connection with the integration of the acquired company) and the anticipated benefits (including anticipated cost savings and strategic gains) may be significantly harder or take longer to achieve than expected. Acquisitions may involve our entry into new businesses or new geographic or other markets, and these situations also present risks resulting from our inexperience in those new areas. As a regulated financial institution, our pursuit of attractive acquisition opportunities could be negatively impacted due to regulatory delays or other regulatory issues. In addition, regulatory and/or legal issues relating to the pre-acquisition operations of an acquired business may cause reputational harm to PNC following the acquisition and integration of the acquired business into ours and may result in additional future costs or regulatory limitations arising as a result of those issues. Any annualized, proforma, estimated, third party or consensus numbers in this presentation are used for illustrative or comparative purposes only and may not reflect actual results. Any consensus earnings estimates are calculated based on the earnings projections made by analysts who cover that company. The analysts’ opinions, estimates or forecasts (and therefore the consensus earnings estimates) are theirs alone, are not those of PNC or its management, and may not reflect PNC’s or other company’s actual or anticipated results. |
 19 Non-GAAP to GAAP Reconcilement Appendix In millions Adjustments, pretax Income taxes (benefit)1 Net income Average Assets Return on Avg. Assets Net income and return on avg. assets, as reported $832 Reported net income, if annualized $3,374 $262,554 1.29% In millions Adjustments, pretax Income taxes (benefit)1 Net income Average Assets Return on Avg. Assets Net income and return on avg. assets, as reported $820 Reported net income, if annualized $3,253 $263,558 1.23% In millions Adjustments, pretax Income taxes (benefit)1 Net income Average Assets Return on Avg. Assets Net income and return on avg. assets, as reported $1,103 Reported net income, if annualized $4,376 $264,579 1.65% Adjustments: Gain on sale of GIS ($639) $311 (328) Adjusted net income $775 Adjusted net income, if annualized $3,075 $264,579 1.16% For the three months ended March 31, 2011 For the three months ended December 31, 2010 For the three months ended September 30, 2010 PNC believes that information adjusted for the impact of certain items may be useful due to the extent to which the items are not indicative of our ongoing operations. (1) Calculated using a marginal federal income tax rate of 35% and includes applicable income tax adjustments. The after-tax gain on the sale of GIS also reflects the impact of state income taxes. |
 20 Non-GAAP to GAAP Reconcilement Appendix In millions Mar. 31, 2011 Dec. 31, 2010 Sept. 30, 2010 June 30, 2010 Mar. 31, 2010 Tier 1 common capital $21,970 $21,188 $20,437 $18,173 $17,562 Reported net income 832 820 1,103 803 671 Reported net income, if annualized 3,374 3,253 4,376 3,221 2,721 Adjustments: After-tax gain on sale of GIS (328) Adjusted net income 775 Adjusted net income, if annualized 3,075 Return on tier 1 common capital 15.4% 15.4% 21.4% 17.7% 15.5% Adjusted return on tier 1 common capital 15.0% As of or for the three months ended PNC believes that return on tier 1 common capital is useful as a tool to help measure and assess a company's use of common equity and that such information adjusted for the impact of the GIS gain may be useful due to the extent to which that item is not indicative of our ongoing operations. After-tax adjustments are calculated using a marginal federal income tax rate of 35% and include applicable income tax adjustments. The after-tax gain on the sale of GIS also reflects the impact of state income taxes. The pre-tax gain on the sale of GIS was $639 million. In millions Adjustments, pretax Income taxes (benefit)1 Net income Average Assets Return on Avg. Assets Net income and return on avg. assets, as reported $803 Reported net income, if annualized $3,221 $264,366 1.22% In millions Adjustments, pretax Income taxes (benefit)1 Net income Average Assets Return on Avg. Assets Net income and return on avg. assets, as reported $671 Reported net income, if annualized $2,721 $267,148 1.02% PNC believes that information adjusted for the impact of certain items may be useful due to the extent to which the items are not indicative of our ongoing operations. (1) Calculated using a marginal federal income tax rate of 35% and includes applicable income tax adjustments. For the three months ended March 31, 2010 For the three months ended June 30, 2010 |
 21 Non-GAAP to GAAP Reconcilement Appendix For the three months ended $ in millions Mar. 31, 2011 Dec. 31, 2010 Sept. 30, 2010 June 30, 2010 Mar. 31, 2010 Net interest margin, as reported 3.94% 3.93% 3.96% 4.35% 4.24% Provision for credit losses $421 $442 $486 $823 $751 Provision for credit losses, if annualized $1,707 $1,754 $1,928 $3,301 $3,046 Avg. interest earning assets $224,095 $223,795 $223,677 $224,580 $226,992 Annualized provision/Avg. interest earning assets 0.76% 0.78% 0.86% 1.47% 1.34% Provision-adjusted net interest margin (1) 3.18% 3.15% 3.10% 2.88% 2.90% For the three months ended $ in millions Mar. 31, 2011 Dec. 31, 2010 Sept. 30, 2010 June 30, 2010 Mar. 31, 2010 Net interest margin, as reported 3.94% 3.93% 3.96% 4.35% 4.24% Purchase accounting accretion (1) $281 $344 $325 $540 $440 Purchase accounting accretion, if annualized $1,140 $1,365 $1,289 $2,166 $1,784 Avg. interest earning assets $224,095 $223,795 $223,677 $224,580 $226,992 Annualized purchase accounting accretion/Avg. interest earning assets 0.51% 0.61% 0.58% 0.96% 0.79% Core net interest margin (2) 3.43% 3.32% 3.38% 3.39% 3.45% PNC believes that provision-adjusted net interest margin, a non-GAAP measure, is useful as a tool to help evaluate the amount of credit related risk associated with interest-earning assets. (1) The adjustment represents annualized provision for credit losses divided by average interest-earning assets. (1) Purchase accounting accretion is scheduled purchase accounting accretion plus cash recoveries. (2) PNC believes that core net interest margin, a non-GAAP measure, is useful as a tool to help evaluate the impact of purchase accounting accretion on net interest margin. The adjustment represents annualized purchase accounting accretion divided by average interest-earning assets. |
 22 Non-GAAP to GAAP Reconcilement Appendix In millions except per share data Dec. 31, 2008 Dec. 31, 2010 Mar. 31, 2011 Dec. 31, 2010 Mar. 31, 2011 Common shareholders' equity $17,490 $29,595 $30,485 Common shares outstanding 443 526 526 Book value per common share $39.44 $56.29 $58.01 Intangible assets $11,688 $10,753 $10,764 Common shareholders' equity less intangi $5,802 $18,842 $19,721 Common shares outstanding 443 526 526 Tangible book value per common share $13.10 $35.82 $37.49 174% 186% As of Change from Dec. 31, 2008 to PNC believes that tangible book value per common share, a non-GAAP measure, is useful as a tool to help evaluate the amount, on a per share basis, of intangible assets included in book value per common share. |
 23 Peer Group of Banks Appendix The PNC Financial Services Group, Inc. PNC BB&T Corporation BBT Bank of America Corporation BAC Capital One Financial, Inc. COF Comerica Inc. CMA Fifth Third Bancorp FITB JPMorgan Chase JPM KeyCorp KEY M&T Bank MTB Regions Financial Corporation RF SunTrust Banks, Inc. STI U.S. Bancorp USB Wells Fargo & Co. WFC Ticker |