 The PNC Financial Services Group, Inc. Barclays London Conference May 23, 2011 Exhibit 99.1 |
 2 Cautionary Statement Regarding Forward-Looking Information and Adjusted Information |
 3 Today’s Discussion PNC’s powerful franchise and proven business model are designed to deliver strong results Delivered strong financial performance and positioned for even greater shareholder value Client momentum is building across our businesses PNC Continues to Build a Great Company. PNC Continues to Build a Great Company. |
 4 PNC’s Powerful Franchise (1) Rankings source: SNL DataSource; Banks headquartered in U.S. Assets rank excludes Morgan Stanley and Goldman Sachs. |
 5 PNC’s Successful Business Model Staying core funded and disciplined in our deposit pricing Returning to a moderate risk profile Leveraging customer relationships and our strong brand to grow high quality, diverse revenue streams Focus on creating positive operating leverage 1 while investing in innovation Remaining disciplined with our capital Executing on our strategies (1) A period to period dollar or percentage change when revenue growth exceeds expense growth. |
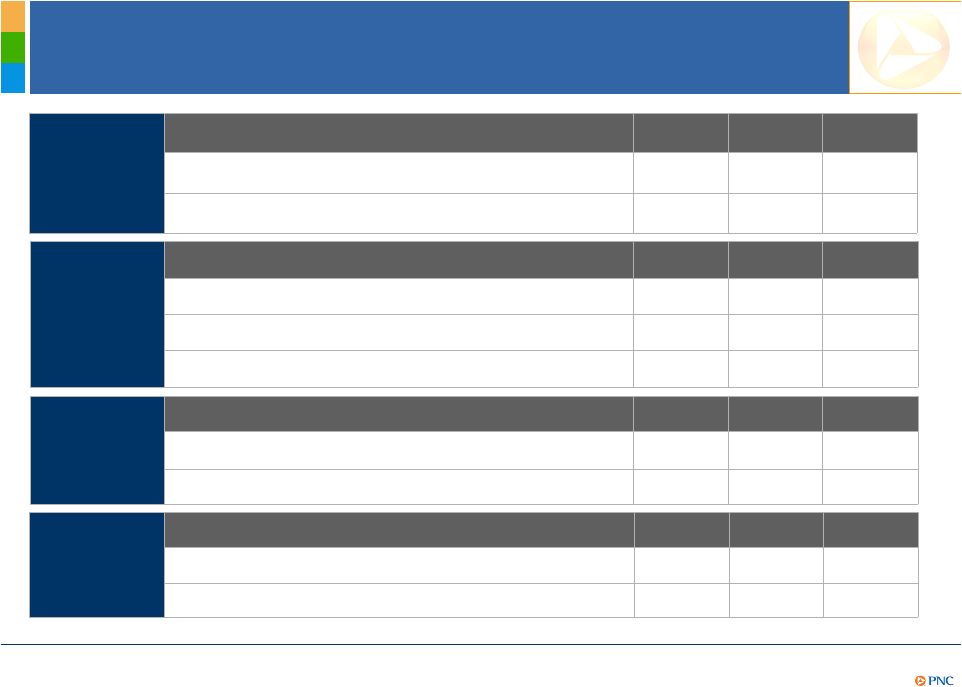
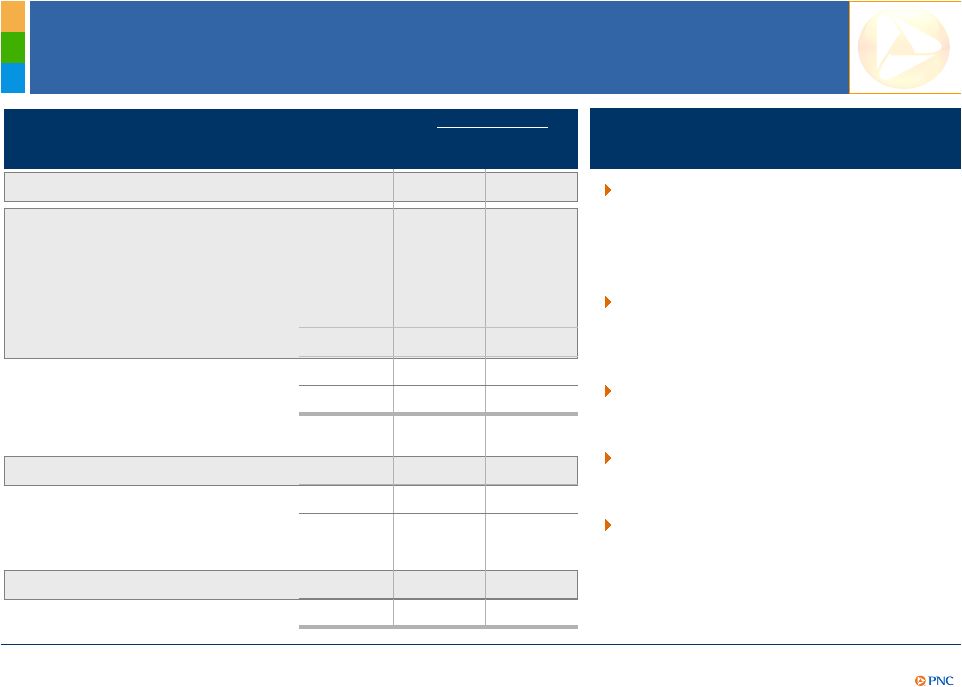 6 A Higher Quality, Differentiated Balance Sheet Change from: Category (billions) Mar. 31, 2011 Dec. 31, 2010 Dec. 31, 2008 Investment securities $61 ($3) $18 Core commercial loans¹ 62 1 (12) Core commercial real estate¹ 16 (1) (6) Core consumer loans¹ 58 (1) 5 Distressed portfolio loans² 14 (1) (13) Total loans 149 (1) (26) Other assets 49 (1) (24) Total assets $259 ($5) ($32) Transaction deposits $135 $-- $24 Retail CDs, time, savings 47 (1) (35) Total deposits 182 ($1) ($11) Borrowed funds, other 46 (5) (27) Preferred equity 1 -- (7) Common equity 30 1 13 Total liabilities and equity $259 ($5) ($32) Core commercial loan growth over year end 2010 offset by continued distressed runoff and soft consumer loan demand Continued reduction and repricing of high cost brokered and retail CDs Core funded – loans to deposits ratio of 82% Significant reduction in borrowed funds Strengthened common equity Highlights Designed to Deliver Strong Results (1) Excludes loans assigned to the Distressed Assets Portfolio business segment. (2) Represents loans assigned to the Distressed Assets Portfolio business segment. |
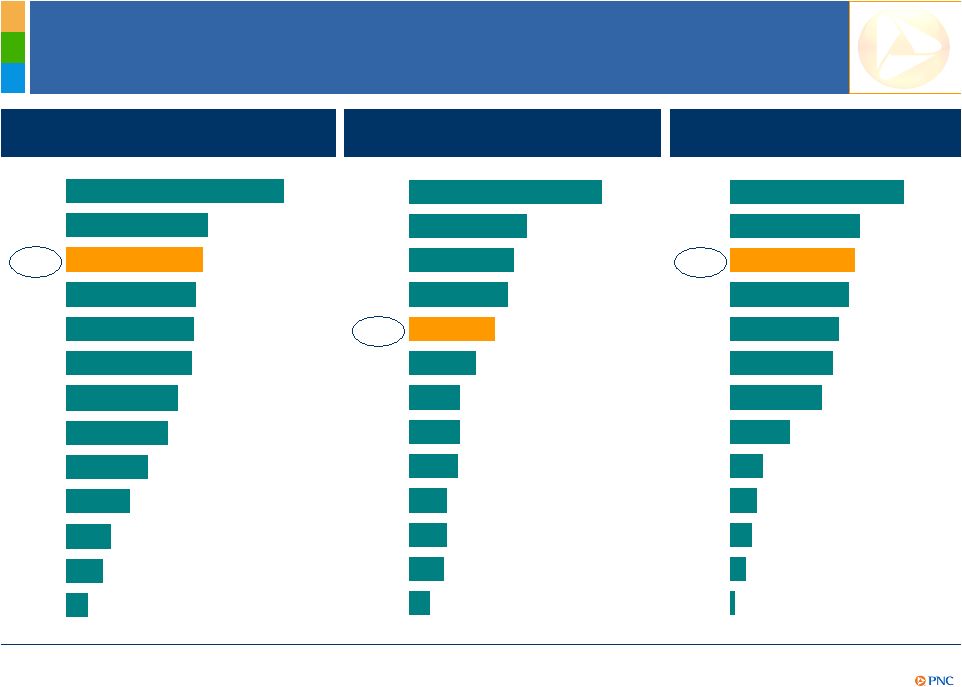
 7 Relative Balance Sheet Strength 1Q11 loans/deposits 68% 80% 82% 84% 90% 91% 93% 94% 94% 94% 96% 99% 103% JPM KEY PNC RF WFC BAC STI CMA USB FITB BBT COF MTB 1Q11 Tier 1 common ratio 1Q11 reserves/loans 4.34% 4.29% 4.16% 4.08% 3.84% 3.56% 3.19% 2.80% 2.80% 2.64% 2.52% 2.44% 2.17% 1.73% JPM PNC BAC COF RF FITB PNC KEY WFC USB BBT STI CMA MTB 10.7% 10.4% 10.3% 10.0% 9.3% 9.1% 9.0% 8.9% 8.6% 8.4% 8.2% 7.9% 6.4% KEY CMA PNC JPM BBT STI FITB WFC BAC COF USB RF MTB Includes purchased impaired loan marks¹ Designed to Deliver Strong Results Peer Source: SNL DataSource and company reports. Ratios as of quarter end. (1) 1Q11 reserves/loans would be 4.29% if adjusted to include the remaining marks on purchased impaired loans. Further information is provided in the Appendix. Others have made acquisitions and have marks on purchased impaired loans. No adjustments have been made for those peers. |
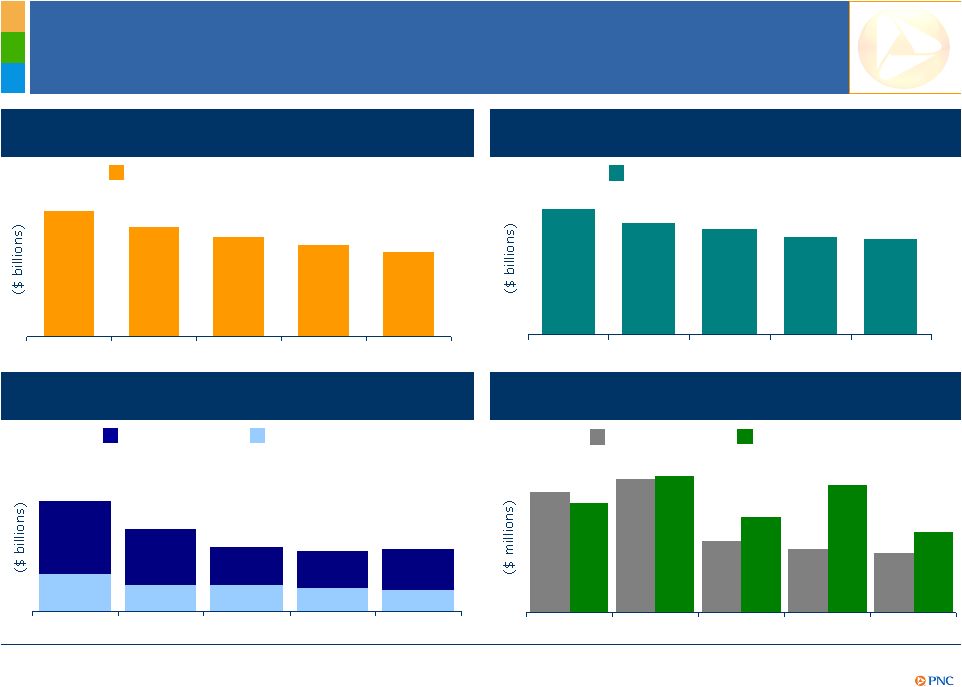 8 Credit Trends Continue to Improve $751 $486 $442 $421 $840 $614 $791 $823 $691 $533 1Q10 2Q10 3Q10 4Q10 1Q11 Accruing loans past due 1,2 Provision and net charge-offs Criticized commercial loans 30-89 Days 90 Days + Nonperforming loans 1,3 $2.5 $1.9 $1.4 $1.4 $1.4 $.8 $.6 $.6 $.5 $.5 1Q10 2Q10 3Q10 4Q10 1Q11 1Q10 2Q10 3Q10 4Q10 1Q11 Total nonperforming loans $5.8 $5.1 $4.8 $4.5 $4.4 Designed to Deliver Strong Results $16.4 $18.8 $15.0 $13.7 $12.7 1Q10 2Q10 3Q10 4Q10 1Q11 Criticized Commercial loans 4 Provision Net charge-offs As of quarter end except net charge-offs, which are for the quarter. (1) Loans acquired from National City that were impaired are not included as they were recorded at estimated fair value when acquired and are currently considered performing loans due to the accretion of interest in purchase accounting. (2) Excludes loans that are government insured/guaranteed, primarily residential mortgages. (3) Does not include loans held for sale or foreclosed and other assets. (4) Criticized loans are ones that we consider “special mention,” “substandard’” or “doubtful”. |
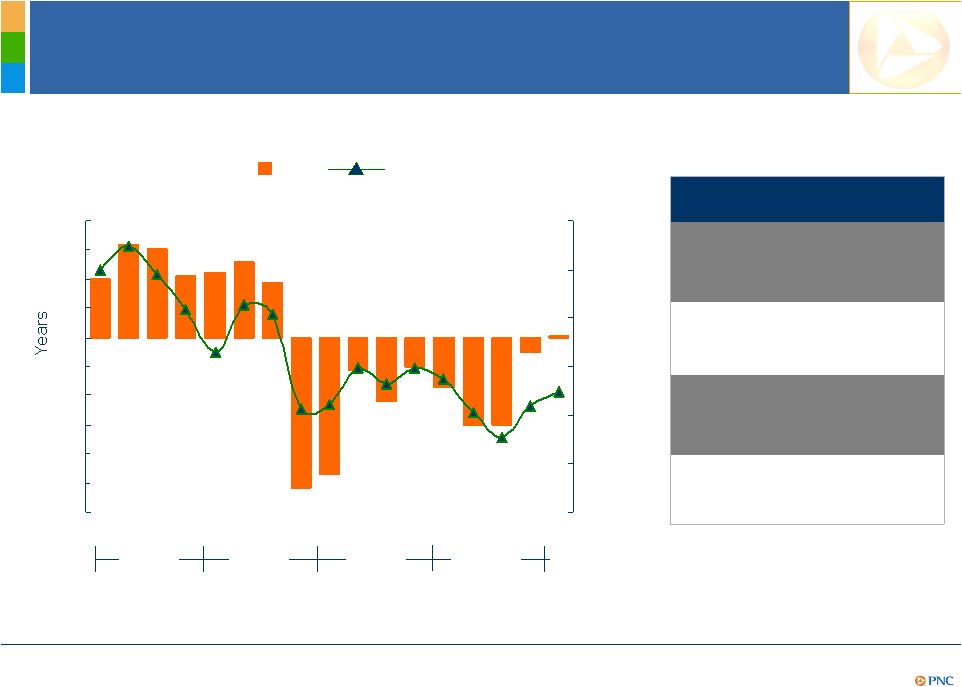 9 (6) (5) (4) (3) (2) (1) 0 1 2 3 4 0% 1% 2% 3% 4% 5% 6% PNC’s Balance Sheet Is Positioned for Higher Interest Rates PNC Duration of Equity (At Quarter End) 5-Yr LIBOR Swaps (At Quarter End) 2007 2008 2009 PNC 1Q11 NII Sensitivity Effect on NII in 1st year from gradual interest rate change over following 12 months 100 bps increase +1.1% 100 bps decrease (0.9%)¹ Effect on NII in 2nd year from gradual interest rate change over preceding 12 months 100 bps increase +3.4% 100 bps decrease (3.4%)¹ Q1 Q2 Q3 Q4 2010 (1) Given the inherent limitations in certain of these measurement tools and techniques, results become less meaningful as interest rates approach zero. Q1 Q3 Q4 Q1 Q2 Q3 Q4 Q1 Q2 Q3 Q4 Q2 Q1 2011 Designed to Deliver Strong Results |
 10 Financial Performance Strong Earnings 1Q11 4Q10 1Q10 Net income ($ millions) $832 $820 $671 Earnings per diluted share $1.57 $1.50 $0.66 Valuation Drivers 1Q11 4Q10 1Q10 Tier 1 common capital ratio 10.3% 9.8% 7.9% Book value per common share¹ $58.01 $56.29 $50.32 Operating Leverage 1Q11 4Q10 1Q10 Revenue ($ millions) $3,631 $3,903 $3,763 Provision ($ millions) $421 $442 $751 Noninterest expense ($ millions) $2,070 $2,340 $2,113 Performance Measures 1Q11 4Q10 1Q10 Return on average assets 1.29% 1.23% 1.02% Return on Tier 1 common capital¹ 15.4% 15.4% 15.5% (1) Return on Tier 1 common capital calculated as annualized net income divided by Tier 1 common capital. Further information is provided in the Appendix. Delivered Strong Financial Performance |
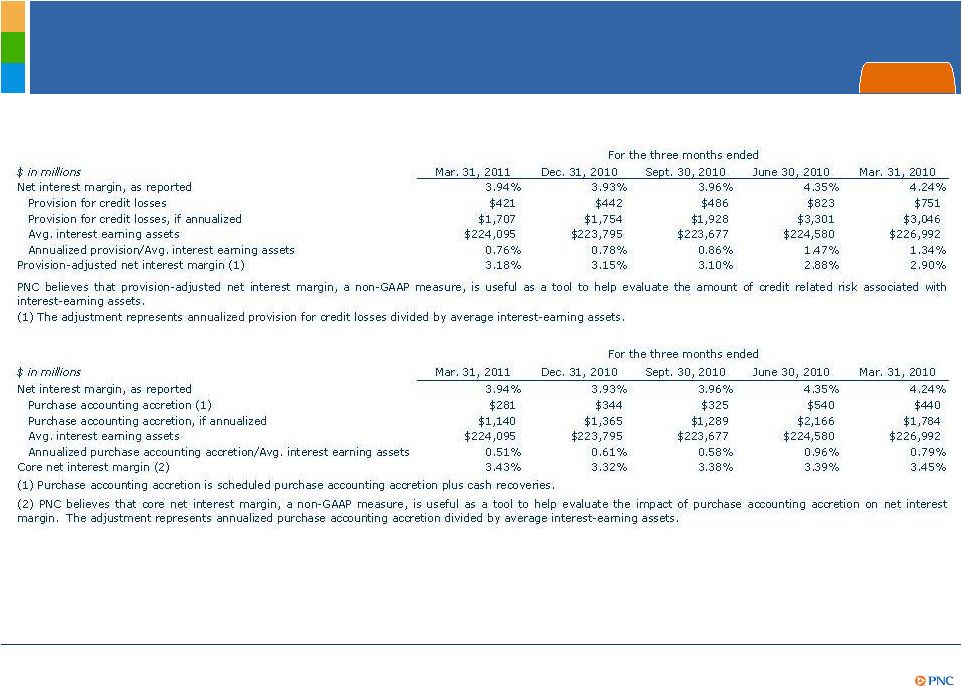
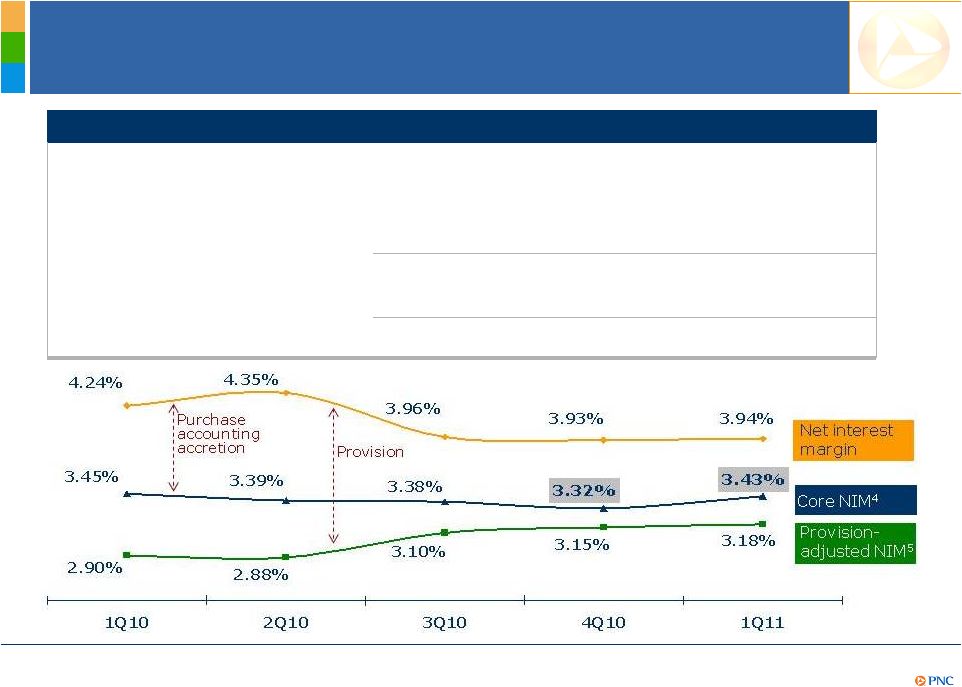 11 Core 1 and Provision-Adjusted 2 Net Interest Income Trends (millions) 1Q10 2Q10 3Q10 4Q10 1Q11 Core NII¹ $1,939 $1,895 $1,890 $1,857 $1,895 Scheduled purchase accounting accretion 365 376 214 211 200 Cash recoveries² 75 164 111 133 81 Total NII $2,379 $2,435 $2,215 $2,201 $2,176 Provision 751 823 486 442 421 Provision-adjusted NII³ $1,628 $1,612 $1,729 $1,759 $1,755 Delivered Strong Financial Performance (1) Core net interest income is total net interest income, as reported, less related purchase accounting accretion (scheduled and cash recoveries). (2) Reflects cash received in excess of recorded investment from sales or payoffs of impaired commercial loans. (3) Provision- adjusted net interest income is total net interest income, as reported, less provision. (4) Net interest margin less (annualized purchase accounting accretion/average interest-earning assets). (5) Net interest margin less (annualized provision/average interest-earnings assets). Further information on (4) and (5) is provided in the Appendix. |
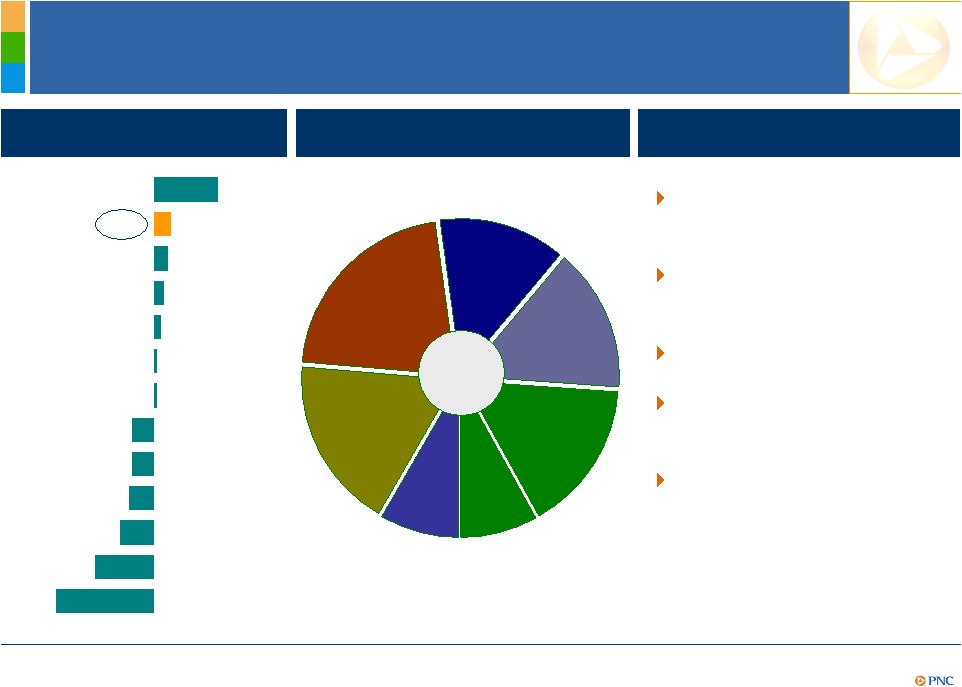 12 Diversified Sources of Fee Income 1Q YoY change in noninterest income 18% 5% 4% 3% 2% 1% 1% -6% -6% -7% -9% -16% -27% COF JPM WFC FITB BBT BAC STI PNC CMA KEY MTB RF USB Noninterest income Mar. 31, 2011 Client expansion and deepening relationships Introduction of innovative new products Expanded distribution Enhancing sales and service model Work to manage impact of ongoing regulatory reforms $1.5B Asset management Consumer services Corporate services Deposit service charges 18% 21% 13% 15% 8% Other 1 16% Residential Mortgage Peer source: SNL DataSource. Noninterest income is from continuing operations. (1) Other in this chart includes net gains on sales of securities, net OTTI and remaining other. Growth strategies Equity Mgmt/ Trading 9% Delivered Strong Financial Performance |
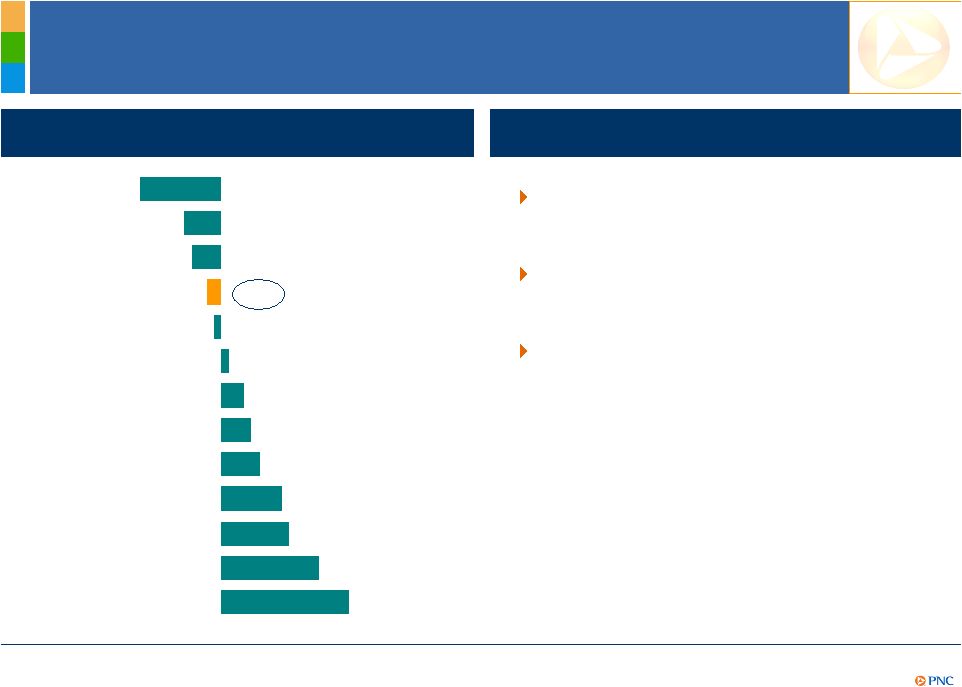 13 Focus on Well-Managed Expenses Expense management strategies Expense management is subject to legal and regulatory contingencies. See Note 16 Legal included in Part I, Item 1 of PNC’s 1Q11 Form 10-Q. Also refer to the economic assumptions in the Cautionary Statement in the Appendix. YoY change in noninterest expense -11% -5% -4% -2% -1% 1% 3% 4% 5% 8% 9% 13% 17% KEY FITB RF PNC JPM MTB CMA BBT WFC USB STI BAC COF Focusing on continuous improvement – dedicated resources Balancing need for growth with pace of investment Investing in talent and innovative products for future growth Delivered Strong Financial Performance |
 14 Delivering Strong Returns 1Q11 return on average assets 1Q11 return on Tier 1 common capital¹ 1.34% 1.29% 1.23% 1.21% 1.19% 1.06% 0.96% 0.77% 0.60% 0.43% 0.35% 2.05% 0.21% COF USB PNC WFC MTB KEY JPM FITB CMA BBT STI BAC RF Peer Source: SNL DataSource and company reports. (1) Return on Tier 1 common capital calculated as annualized net income divided by Tier 1 common capital. Further information is provided in the Appendix. (2) As of May 9, 2011; Annualized dividend yield calculated as annualized dividend divided by market price. 34.5% 21.0% 18.8% 17.7% 15.4% 12.0% 9.1% 9.1% 8.7% 6.8% 6.7% 6.2% 3.8% COF USB JPM WFC PNC FITB MTB KEY BBT CMA BAC STI RF 2.4% 2.3% 2.2% 2.0% 1.9% 1.7% 1.1% 0.6% 0.5% 0.4% 0.3% 3.2% 0.1% MTB BBT PNC JPM USB FITB WFC CMA RF KEY COF BAC STI Delivered Strong Financial Performance Annualized dividend yield² |
 15 Outlook 1 – Full Year 2011 vs. 2010 Balance Sheet Income Statement Commercial loan growth is expected Continue to shift deposit mix towards transaction accounts Core NII expected to increase by $100 million or more Purchase accounting accretion expected to decline by as much as $700 million, resulting in lower NII Provision expected to decline by at least $800 million Provision-adjusted NII and margin expected to increase Noninterest income expected to increase in the low-to-mid single digits, excluding the expected incremental negative impact of approximately $400 million due to overdraft and interchange regulatory limits Noninterest expenses expected to decline, subject to legal and regulatory contingencies² (1) Refer to the Cautionary Statement in the Appendix. (2) See Note 22 Legal Proceedings included in Item 8 and Risk Factors Item 1A of PNC’s 2010 Form 10-K and Note 16 Legal Proceedings in PNC’s 1Q11 Form 10-Q. Positioned for Greater Shareholder Value |
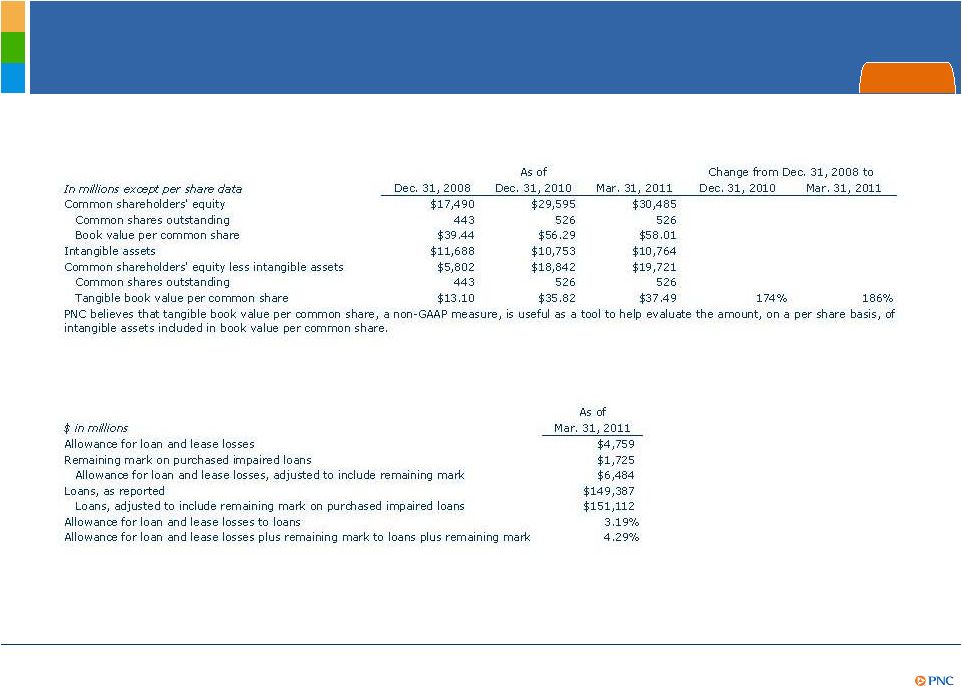
 16 A Demonstrated Ability to Achieve Greater Shareholder Value Achieving greater shareholder value As of quarter end. (1) Tangible book value per share calculated as book value per share less total intangible assets per share. PNC believes that tangible book value, a non-GAAP measure, is useful as a tool to help evaluate the amount, on a per share basis, of intangible assets included in book value per common share. Further information is provided in the Appendix. 4Q08 1Q11 4Q08 1Q11 Book value per share Tangible book value per share¹ $39.44 $58.01 $13.10 $37.49 4Q08 1Q11 Stock price $49.00 $62.99 Positioned for Greater Shareholder Value |
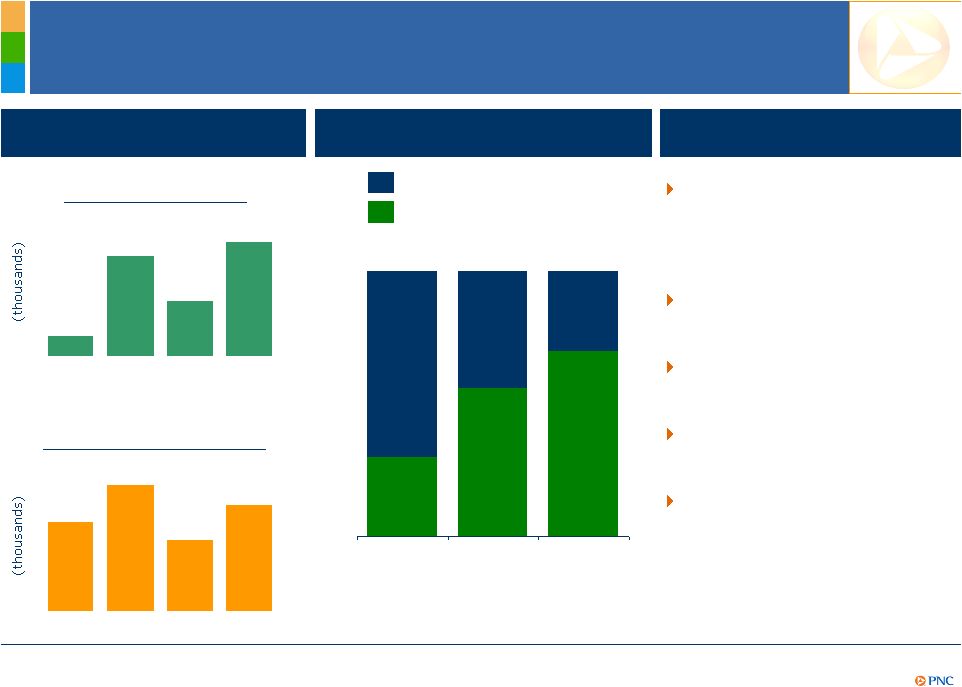 17 Strong Momentum – Retail Banking Growth in Checking relationships Growth in Online bill payment active customers Retail Banking Mix of checking relationships 12/31/10 Goal Free checking Relationship checking Recent results (one month post launch) 100% 0% Growth strategies Expand market share and share of wallet by providing customers with more choices and rewards Focus on winning in the payments space Launch of integrated deposit products Enhance credit card offerings Expand branch distribution network and channels 2Q10 3Q10 4Q10 1Q11 +10 +49 +27 +56 2Q10 3Q10 4Q10 1Q11 +44 +72 +35 +52 Building Momentum |
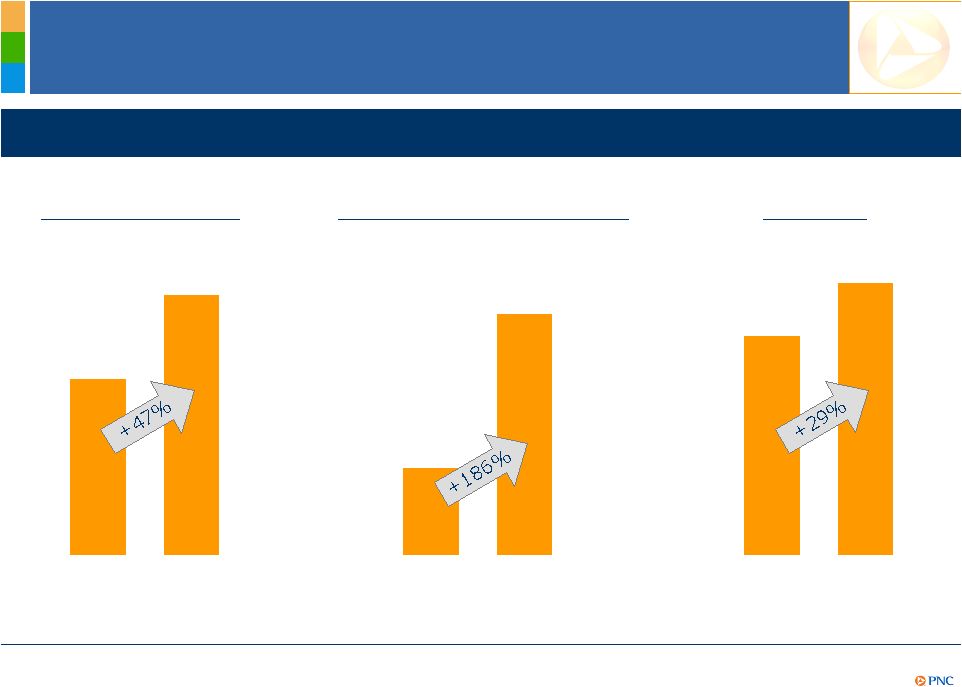
  18 Strong Momentum – Asset Management Group Referral sales¹ +126% $105B 1Q10 1Q11 1Q11 vs. 1Q10 Assets under management $110B Equity Fixed income Liquidity/other +$6B +$1B ($2B) Growth strategies Expanding distribution and talent in newly acquired and high growth markets Leveraging cross-sell opportunities from Retail and Corporate bank referral network Investing in innovation and technology – piloting Wealth Insight tool Asset Management Group Building Momentum (1) Referral sales are new sales to clients who were referred to AMG by Retail Banking or Corporate and Institutional Banking. |
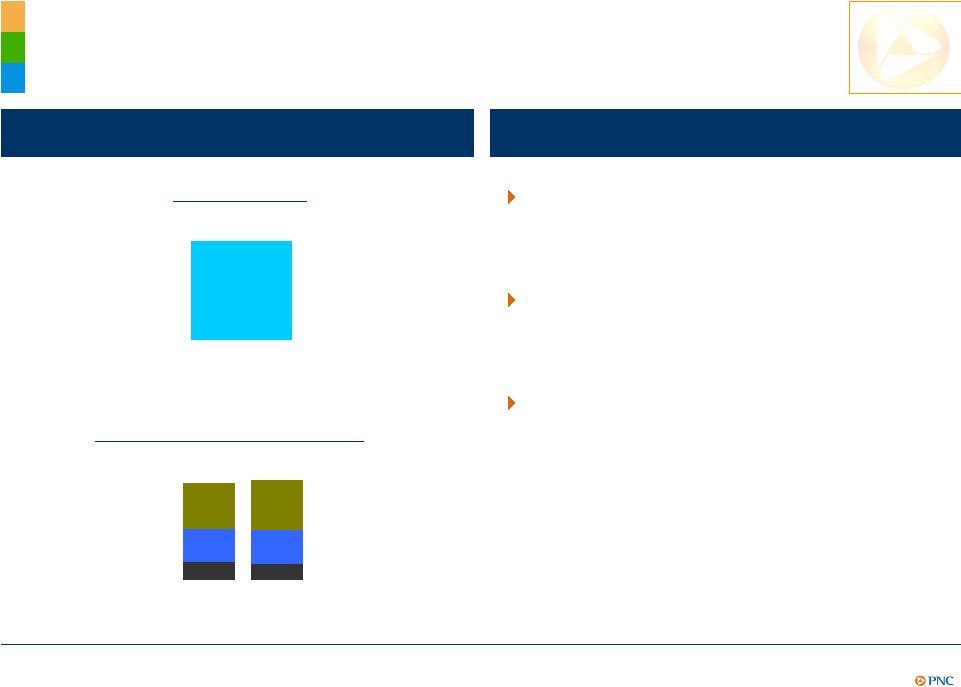
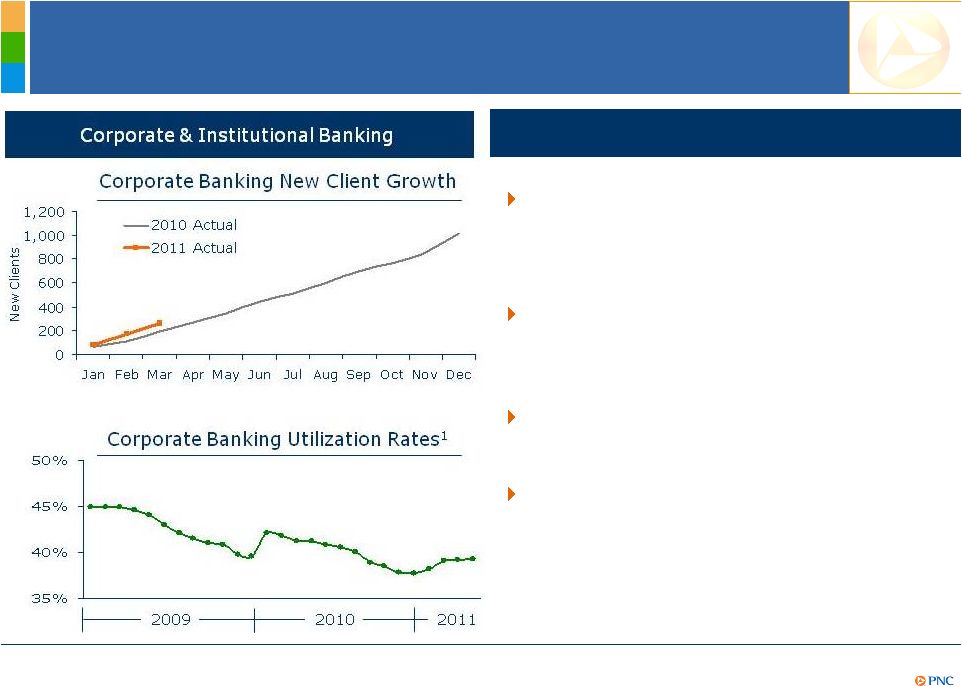 19 Strong Momentum – Corporate & Institutional Banking Growth strategies Continue to add new clients across the footprint - Goal of 1,000 for 2011 Leverage PNC’s loan syndication capabilities as a leader in the middle- market Deepening relationships by delivering all of PNC to our clients Focus on total relationship return 65% 59% 53% 54% Strong Momentum – Corporate & Institutional Banking Building Momentum (1) Corporate Banking Utilization rates reflect the consolidation of Market Street Funding Corporation beginning January 2010. |
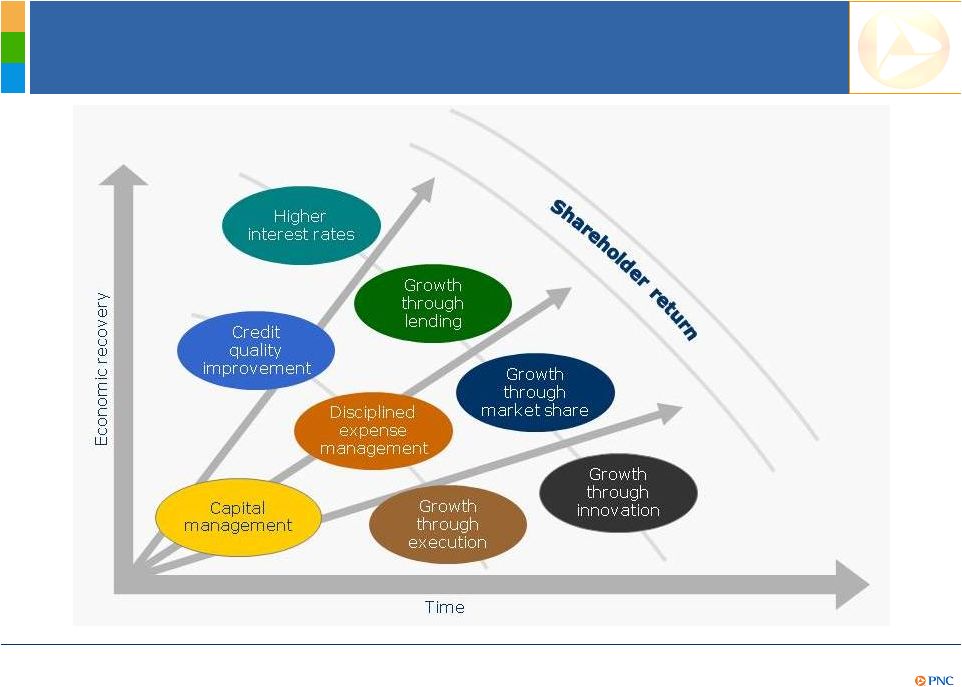 20 PNC’s Growth Opportunities Building Momentum |
 21 Summary PNC Continues to Build a Great Company. PNC Continues to Build a Great Company. PNC’s powerful franchise and proven business model are designed to deliver strong results Delivered strong financial performance and positioned for even greater shareholder value Client momentum is building across our businesses |
 22 Cautionary Statement Regarding Forward-Looking Information Appendix |
 23 Cautionary Statement Regarding Forward-Looking Information (continued) Appendix |
 24 Cautionary Statement Regarding Forward-Looking Information (continued) Appendix |
 25 Non-GAAP to GAAP Reconcilement Appendix |
 26 Non-GAAP to GAAP Reconcilement Appendix |
 27 Non-GAAP to GAAP Reconcilement Appendix |
 28 Non-GAAP to GAAP Reconcilement Appendix |
 29 Peer Group of Banks Appendix The PNC Financial Services Group, Inc. PNC BB&T Corporation BBT Bank of America Corporation BAC Capital One Financial, Inc. COF Comerica Inc. CMA Fifth Third Bancorp FITB JPMorgan Chase JPM KeyCorp KEY M&T Bank MTB Regions Financial Corporation RF SunTrust Banks, Inc. STI U.S. Bancorp USB Wells Fargo & Co. WFC Ticker |