 The PNC Financial Services Group, Inc. Second Quarter 2011 Earnings Conference Call July 20, 2011 Exhibit 99.2 |
 2 Cautionary Statement Regarding Forward-Looking Information and Adjusted Information This presentation includes “snapshot” information about PNC used by way of illustration. It is not intended as a full business or financial review and should be viewed in the context of all of the information made available by PNC in its SEC filings. The presentation also contains forward-looking statements regarding our outlook for earnings, revenues, expenses, capital levels, liquidity levels, asset quality and other matters regarding or affecting PNC and its future business and operations. Forward-looking statements are necessarily subject to numerous assumptions, risks and uncertainties, which change over time. The forward-looking statements in this presentation are qualified by the factors affecting forward-looking statements identified in the more detailed Cautionary Statement included in the Appendix, which is included in the version of the presentation materials posted on our corporate website at www.pnc.com/investorevents. We provide greater detail regarding some of these factors in our 2010 Form 10-K and first quarter 2011 Form 10-Q, including Risk Factors and Risk Management sections of those reports, and our subsequent SEC filings. Our forward-looking statements may also be subject to other risks and uncertainties, including those we may discuss in this presentation or in SEC filings, accessible on the SEC’s website at www.sec.gov and on PNC’s corporate website at www.pnc.com/secfilings. We have included web addresses in this presentation as inactive textual references only. Information on these websites is not part of this presentation. Future events or circumstances may change our outlook and may also affect the nature of the assumptions, risks and uncertainties to which our forward-looking statements are subject. Forward-looking statements in this presentation speak only as of the date of this presentation. We do not assume any duty and do not undertake to update forward-looking statements. Actual results or future events could differ, possibly materially, from those anticipated in forward-looking statements, as well as from historical performance. In this presentation, we sometimes refer to adjusted results to help illustrate the impact of certain types of items, such as our third quarter 2010 gain related to the sale of PNC Global Investment Servicing Inc. (“GIS”). This information supplements our results as reported in accordance with GAAP and should not be viewed in isolation from, or a substitute for, our GAAP results. We believe that this additional information and the reconciliations we provide may be useful to investors, analysts, regulators and others as they evaluate the impact of these respective items on our results for the periods presented due to the extent to which the items are not indicative of our ongoing operations. We may also provide information on pretax pre-provision earnings (total revenue less noninterest expense), as we believe that pretax pre-provision earnings, a non-GAAP measure, is useful as a tool to help evaluate the ability to provide for credit costs through operations. Where applicable, we provide GAAP reconciliations for such additional information. In certain discussions, we may also provide information on yields and margins for all interest-earning assets calculated using net interest income on a taxable-equivalent basis by increasing the interest income earned on tax-exempt assets to make it fully equivalent to interest income earned on taxable investments. We believe this adjustment may be useful when comparing yields and margins for all earning assets. We may also use annualized, proforma, estimated or third party numbers for illustrative or comparative purposes only. These may not reflect actual results. This presentation may also include discussion of other non-GAAP financial measures, which, to the extent not so qualified therein or in the Appendix, is qualified by GAAP reconciliation information available on our corporate website at www.pnc.com under “About PNC–Investor Relations.” |
 3 Today’s Discussion 2Q11 strategic achievements – strong financial results Exceptional client growth and strong new product penetration Key financial take-aways – high quality balance sheet, strong earnings and solid returns 2011 outlook remains positive PNC Continues to Build a Great Company. PNC Continues to Build a Great Company. |
 4 Significant 2Q11 Achievements PNC Is Positioned to Deliver Even Greater Shareholder Value. PNC Is Positioned to Deliver Even Greater Shareholder Value. 2Q11 financial summary Net income Diluted EPS from net income Return on average assets $912 million $1.67 1.40% Delivered strong financial results through improved credit quality and exceptional client growth Grew commercial loans Maintained a high quality balance sheet, poised to support client growth Continued to build capital to record levels Announced the pending acquisition of RBC Bank (USA) 2Q11 highlights |
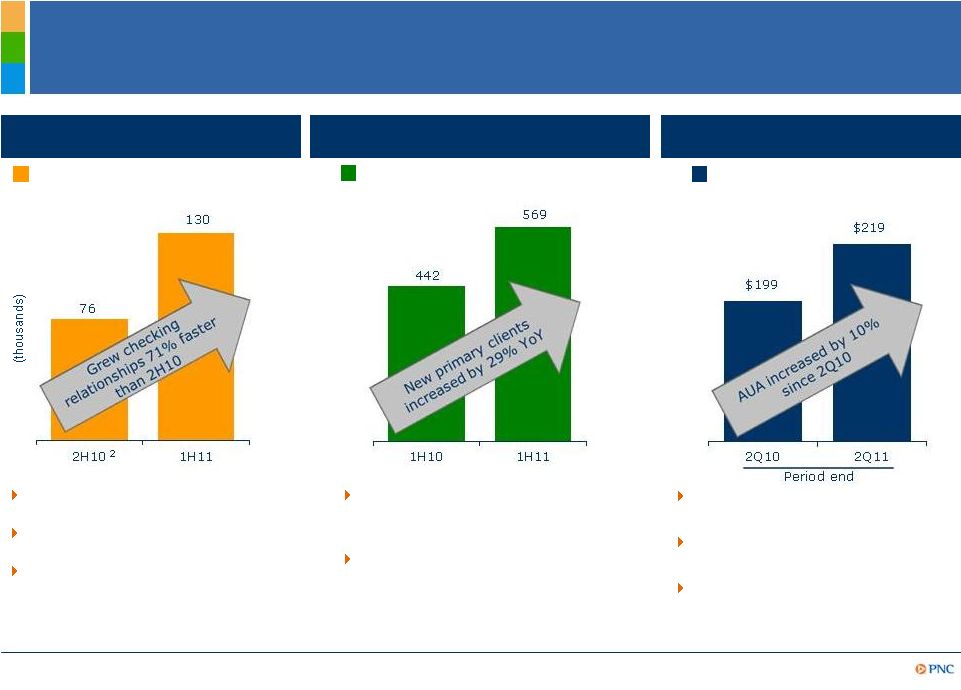 5 Focused on Growing Client Relationships Asset Management Group Retail Banking Corporate & Institutional Banking Organic checking relationship growth Assets under administration (billions) Corporate Banking new primary clients 2Q11 annualized growth of 5.4%, greater than 1.2% footprint population growth Successfully launched new checking, credit card products Active online bill payment customers showed organic growth of nearly 20% from 2Q10, 7% from 4Q10 Goal to exceed 1,000 new primary clients for 2011 represents 12% growth of total primary clients Spot loans up $2 billion over 1Q11 and $3.4 billion vs. 2Q10 YTD11 referral sales more than double YTD10 YTD11 new primary clients up 49% vs. YTD10 Total sales have increased by 57% for comparable year over year periods + + 1 3 5 (1) Organic growth refers to consumer and small business accounts excluding 32,000 relationships acquired by acquisition in 2Q11. (2) Reflects organic checking relationship growth since conversion of National City accounts to PNC's systems. (3) Organic growth excludes 3,000 customer accounts acquired by acquisition in 2Q11. (4) Corporate banking client relationships with annual revenue generation of $50,000 or more or, within corporate banking, commercial banking client relationships with annual revenue generation of $10,00 or more. (5) New client sales referred to AMG by Retail Banking or C&IB. 4 |
 6 1 Financial Performance Strong Earnings 2Q11 2Q10 YTD11 YTD10 Net income ($ millions) $912 $803 $1,744 $1,474 Earnings per diluted share $1.67 $1.47 $3.24 $2.15 Capital Adequacy 2Q11 2Q10 Tier 1 common capital ratio 10.5% 8.3% Performance Measures 2Q11 2Q10 YTD11 YTD10 Return on average assets 1.40% 1.22% 1.34% 1.12% Return on Tier 1 common capital 1,2 16.1% 17.7% 15.5% 15.9% (1) 2Q11 and YTD11 Tier 1 common capital ratio is period-end Tier 1 common capital divided by period-end risk weighted assets and is estimated. (2) Return on Tier 1 common capital calculated as annualized net income divided by period-end Tier 1 common capital. Further information is provided in the Appendix. |
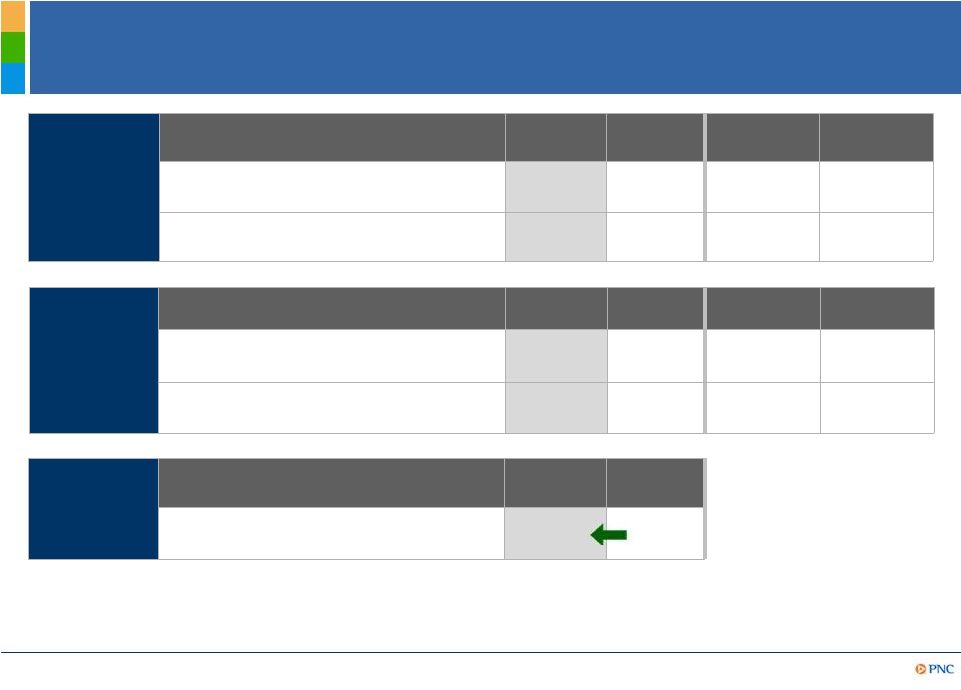
 7 A Higher Quality, Differentiated Balance Sheet Change from: Category (billions) Jun. 30, 2011 Mar. 31, 2011 Dec. 31, 2010 Total investment securities 59.4 (1.6) (4.8) Core commercial loans 64.0 2.0 3.3 Core commercial real estate 15.2 (0.6) (1.2) Core consumer loans 57.7 (0.0) (1.0) Distressed loans 13.4 (0.5) (1.4) Total loans 150.3 0.9 (0.3) Other assets 53.4 4.4 4.0 Total assets $263.1 $3.7 ($1.2) Transaction deposits $137.1 $2.6 $2.5 Retail CDs, time, savings 44.8 (2.7) (4.0) Total deposits 181.9 (0.1) (1.5) Borrowed funds, other 49.0 2.7 (1.7) Equity 32.2 1.1 2.0 Total liabilities and equity $263.1 $3.7 ($1.2) Core commercial loan growth partially offset by continued distressed loan run-off Transaction deposits grew $2.6 billion over 1Q11 Continued reduction in higher cost retail CDs Core funded – loans to deposits ratio of 83% Strengthened equity position Highlights 2 1 1 1 (1) Excludes loans assigned to the Distressed Assets Portfolio business segment. (2) Represents loans assigned to the Distressed Assets Portfolio business segment. |
 8 Nonperforming loans 1,3 Provision and net charge-offs Criticized commercial loans 30-89 Days 90 Days + Accruing loans past due 1,2 Criticized Commercial loans 4 Provision Net charge-offs Total nonperforming loans $5.1 $4.8 $4.5 $4.3 $3.9 $791 $533 $442 $421 $840 $614 $414 $486 $823 2Q10 3Q10 4Q10 1Q11 2Q11 $2.2 $1.8 $1.8 $1.9 2Q10 3Q10 4Q10 1Q11 2Q11 $15.0 $16.4 $13.7 $12.7 $11.7 2Q10 3Q10 4Q10 1Q11 2Q11 2Q10 3Q10 4Q10 1Q11 2Q11 $2.7 $2.6 $2.7 $2.6 $2.6 $1.5 $280 As of quarter end except net charge-offs, which are for the quarter. (1) Loans acquired from National City that were impaired are not included as they were recorded at estimated fair value when acquired and are currently considered performing loans due to the accretion of interest in purchase accounting. (2) Includes loans that are government guaranteed/insured, primarily residential mortgages. These loans totaled $2.7 billion in 2Q11. (3) Does not include loans held for sale or foreclosed and other assets. Effective in 2011, excludes residential real estate loans accounted for under the fair value option. (4) Criticized loans are ones that we consider “special mention,” “substandard’” or “doubtful”. Credit Trends Continue to Improve |
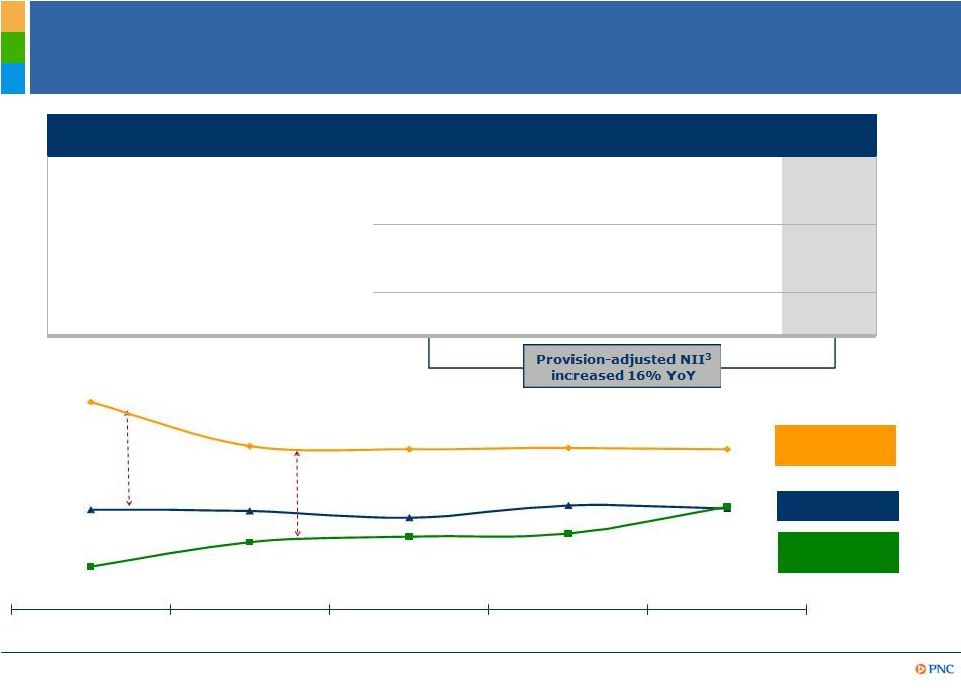 9 Net Interest Income and Provision Trends (millions) 2Q10 3Q10 4Q10 1Q11 2Q11 Core NII $1,895 $1,890 $1,857 $1,895 $1,860 Purchase accounting accretion 540 325 344 281 290 Total NII $2,435 $2,215 $2,201 $2,176 $2,150 Provision 823 486 442 421 280 Provision-adjusted NII $1,612 $1,729 $1,759 $1,755 $1,870 Net interest margin Provision- adjusted NIM 5 Core NIM 4 Purchase accounting accretion Provision 1 2 3 4.35% 3.93% 3.93% 3.96% 3.94% 3.40% 3.43% 3.32% 3.38% 3.39% 3.42% 3.10% 3.18% 3.15% 2.88% 2Q10 3Q10 4Q10 1Q11 2Q11 (1) Core net interest income is total net interest income, as reported, less related purchase accounting accretion (scheduled and cash recoveries). (2) Includes scheduled purchase accounting accretion and cash recoveries. Cash recoveries reflects cash received in excess of recorded investment from sales or payoffs of impaired commercial loans. (3) Provision-adjusted net interest income is total net interest income, as reported, less provision. (4) Net interest margin less (annualized purchase accounting accretion/average interest-earning assets). (5) Net interest margin less (annualized provision/average interest-earnings assets). Further information on (4) and (5) is provided in the Appendix. |
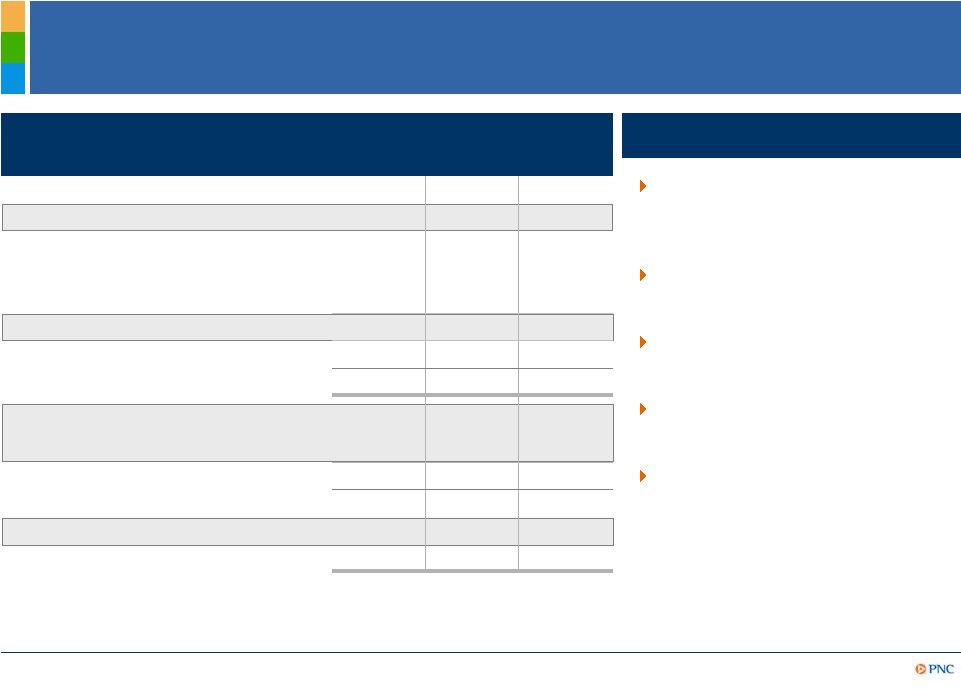
 10 Client Growth and Sales Momentum Provide Opportunities to Increase Noninterest Revenue 2Q11 vs. 1Q11 highlights (millions) 2Q10 3Q10 4Q10 1Q11 2Q11 Asset management 1 $243 $249 $303 $263 $288 Consumer services 315 328 322 311 333 Corporate services 261 183 370 217 228 Residential mortgage 179 216 157 195 163 Deposit service charges 209 164 132 123 131 Client fee income $1,207 $1,140 $1,284 $1,109 $1,143 Net gains on sales of securities 147 121 68 37 82 Net OTTI (94) (71) (44) (34) (39) BlackRock transaction gain - - 160 - - Other 217 193 234 343 266 Total noninterest income $1,477 $1,383 $1,702 $1,455 $1,452 Asset management fees rose due to higher earnings from BlackRock, higher asset values and new clients Consumer services increased due to higher volumes of customer-initiated transactions Corporate services reflected strong capital markets activity; 2Q11 impacted by higher CMSR amortization costs and impairment due to changes in interest rates and prepayments Residential mortgage impacted by lower loan sales revenue and lower net MSR hedging gains Deposit service charges reflected higher transaction volumes; comparison to prior year quarter impacted by regulatory changes Other decreased primarily due to lower equity management results and first quarter insurance recoveries (1) Asset management fees include the Asset Management Group and BlackRock. |
 11 Well–Controlled Expenses While Investing for Growth 2Q11 vs. 1Q11 highlights (millions) 2Q10 3Q10 4Q10 1Q11 2Q11 Personnel $959 $959 $1,032 $989 $976 Occupancy 172 177 194 193 176 Equipment 168 152 176 167 158 Marketing 65 81 70 40 63 Other 638 789 868 681 803 Total noninterest expense $2,002 $2,158 $2,340 $2,070 $2,176 Personnel, Occupancy and Equipment expenses declined Marketing expense increased due to elevated advertising costs associated with new products Other expense increased primarily due to 2Q11 accruals for legal contingencies and the impact of a first quarter reversal of an accrued liability for certain Visa litigation PNC is Committed to Disciplined Expense Management. PNC is Committed to Disciplined Expense Management. |
 12 Strong Capital Position and Improved Returns Book value per common share Tier 1 common ratio 8.3% 9.6% 9.8% 10.3% 10.5% 2Q10 3Q10 4Q10 1Q11 2Q11 Return on average assets 3 Return on Tier 1 common 2.3 $52.77 $55.91 $56.29 $58.01 $60.02 2Q10 3Q10 4Q10 1Q11 2Q11 17.7% 21.4% 15.4% 15.4% 16.1% 2Q10 3Q10 4Q10 1Q11 2Q11 1.22% 1.65% 1.23% 1.29% 1.40% 2Q10 3Q10 4Q10 1Q11 2Q11 1 1 Tier 1 common ratio and book value per share as of quarter end. (1) Estimated. (2) 2Q11 Tier 1 common capital is estimated. Return on Tier 1 common capital calculated as annualized net income divided by Tier 1 common capital. (3) See Appendix for 3Q10 returns as adjusted for the $328 million after-tax gain on the sale of GIS. Further information on (2) and (3) is provided in the Appendix. |
 13 Outlook 1 – Full Year 2011 vs. 2010 Balance Sheet Income Statement Commercial and consumer loan growth is expected Distressed asset portfolio will continue to run down by 25% per year Continue to shift deposit mix from high cost CD’s towards transaction accounts Core NII expected to be stable Purchase accounting accretion expected to decline by $700 million Provision expected to decline by at least $1 billion Provision-adjusted NII and margin expected to increase Noninterest income expected to increase in the low-to-mid single digits, excluding the impact of regulatory limits on overdraft and interchange fees Noninterest expenses expected to be flat 2 (1) Refer to assumptions in the Cautionary Statement in the Appendix. (2) Subject to litigation and regulatory contingencies. |
 14 Summary PNC Continues to Build a Great Company. PNC Continues to Build a Great Company. 2Q11 strategic achievements – strong financial results Exceptional client growth and strong new product penetration Key financial take-aways – high quality balance sheet, strong earnings and solid returns 2011 outlook remains positive |
 15 Cautionary Statement Regarding Forward-Looking Information Appendix This presentation includes “snapshot” information about PNC used by way of illustration and is not intended as a full business or financial review. It should not be viewed in isolation but rather in the context of all of the information made available by PNC in its SEC filings. We also make statements in this presentation, and we may from time to time make other statements, regarding our outlook for earnings, revenues, expenses, capital levels, liquidity levels, asset quality and other matters regarding or affecting PNC and its future business and operations that are forward-looking statements within the meaning of the Private Securities Litigation Reform Act. Forward-looking statements are typically identified by words such as “believe,” “plan,” “expect,” “anticipate,” “see,” “intend,” “outlook,” “project,” “forecast,” “estimate,” “goal,” “will,” “should” and other similar words and expressions. Forward-looking statements are subject to numerous assumptions, risks and uncertainties, which change over time. Forward-looking statements speak only as of the date made. We do not assume any duty and do not undertake to update forward-looking statements. Actual results or future events could differ, possibly materially, from those anticipated in forward-looking statements, as well as from historical performance. Our forward-looking statements are subject to the following principal risks and uncertainties. • Our businesses, financial results and balance sheet values are affected by business and economic conditions, including the following: o Changes in interest rates and valuations in debt, equity and other financial markets. o Disruptions in the liquidity and other functioning of U.S. and global financial markets. o Actions by Federal Reserve, U.S. Treasury and other government agencies, including those that impact money supply and market interest rates. o Changes in customers’, suppliers’ and other counterparties’ performance and creditworthiness. o Slowing or failure of the current moderate economic recovery. o Continued effects of aftermath of recessionary conditions and uneven spread of positive impacts of recovery on the economy and our counterparties, including adverse impacts on levels of unemployment, loan utilization rates, delinquencies, defaults and counterparty ability to meet credit obligations. o Changes in customer preferences and behavior, whether due to changing business and economic conditions, legislative and regulatory initiatives, or other factors. • Our forward-looking financial statements are subject to the risk that economic and financial market conditions will be substantially different than we are currently expecting. These statements are based on our current view that the moderate economic recovery is transitioning into a self-sustaining economic expansion in 2011, with faster economic growth in the second half pushing the unemployment rate lower amidst continued low interest rates. • Legal and regulatory developments could have an impact on ability to operate our businesses, financial condition, results of operations, competitive position, reputation, or pursuit of attractive acquisition opportunities. Reputational impacts could affect matters such as business generation and retention, liquidity, funding, and ability to attract and retain management. These developments could include: o Changes resulting from legislative and regulatory reforms, including broad-based restructuring of financial industry regulation and changes to laws and regulations involving tax, pension, bankruptcy, consumer protection, and other industry aspects, and changes in accounting policies and principles. We will be impacted by extensive reforms provided for in the Dodd-Frank Wall Street Reform and Consumer Protection Act (“Dodd- Frank”) and otherwise growing out of the recent financial crisis, the precise nature, extent and timing of which, and their impact on us, remains uncertain. |
 16 Cautionary Statement Regarding Forward-Looking Information (continued) Appendix o Changes to regulations governing bank capital, including due to Dodd-Frank and to Basel III initiatives. o Unfavorable resolution of legal proceedings or other claims and regulatory and other governmental investigations or other inquiries. In addition to matters relating to PNC’s business and activities, such matters may include proceedings, claims, investigations, or inquiries relating to pre acquisition business and activities of acquired companies, such as National City. These matters may result in monetary judgments or settlements or other remedies, including fines, penalties, restitution or alterations in our business practices and in additional expenses and collateral costs, and may cause reputational harm to PNC following the acquisition and integration of acquired businesses into ours. o Results of regulatory examination and supervision process, including our failure to satisfy requirements of agreements with governmental agencies. o Impact on business and operating results of any costs associated with obtaining rights in intellectual property claimed by others and of adequacy of our intellectual property protection in general. • Business and operating results are affected by our ability to identify and effectively manage risks inherent in our businesses, including, where appropriate, through effective use of third-party insurance, derivatives, and capital management techniques, and to meet evolving regulatory capital standards. In particular, our results currently depend on our ability to manage elevated levels of impaired assets. • Business and operating results also include impacts relating to our equity interest in BlackRock, Inc. and rely to a significant extent on information provided to us by BlackRock. Risks and uncertainties that could affect BlackRock are discussed in more detail by BlackRock in SEC filings. • Our planned acquisition of RBC Bank (USA) presents us with risks and uncertainties related both to the acquisition transaction itself and its integration into PNC after closing, including: o Closing is dependent on, among other things, receipt of regulatory and other applicable approvals, the timing of which cannot be predicted with precision at this point and which may not be received at all. The impact of closing on PNC’s financial statements will be affected by the timing of the transaction. o The transaction (including integration of RBC Bank (USA)’s businesses) may be substantially more expensive to complete than anticipated. Anticipated benefits, including cost savings and strategic gains, may be significantly harder or take longer to achieve than expected or may not be achieved in their entirety as a result of unexpected factors or events. o Our ability to achieve anticipated results from this transaction is dependent also on the following factors, in part related to the state of economic and financial markets: the extent of credit losses in the acquired loan portfolios and the extent of deposit attrition. Also, litigation and governmental investigations that may be filed or commenced, as a result of this transaction or otherwise, could impact the timing or realization of anticipated benefits to PNC. o Integration of RBC Bank (USA)’s business and operations into PNC, which will include conversion of RBC Bank (USA)’s different systems and procedures, may take longer than anticipated or be more costly than anticipated or have unanticipated adverse results relating to RBC Bank (USA)’s or PNC’s existing businesses. PNC’s ability to integrate RBC Bank (USA) successfully may be adversely affected by the fact that this transaction will result in PNC entering several markets where PNC does not currently have any meaningful retail presence. • In addition to the planned RBC Bank (USA) transaction, we grow our business in part by acquiring from time to time other financial services companies, financial services assets and related deposits. These other acquisitions often present risks and uncertainties analogous to those presented by the RBC Bank (USA) transaction as well, in some cases, with risks related to entering into new lines of business. |
 17 Cautionary Statement Regarding Forward-Looking Information (continued) Appendix • Competition can have an impact on customer acquisition, growth and retention and on credit spreads and product pricing, which can affect market share, deposits and revenues. Industry restructuring in the current environment could also impact our business and financial performance through changes in counterparty creditworthiness and performance and in competitive and regulatory landscape. Our ability to anticipate and respond to technological changes can also impact our ability to respond to customer needs and meet competitive demands. • Business and operating results can also be affected by widespread disasters, dislocations, terrorist activities or international hostilities through impacts on the economy and financial markets generally or on us or our counterparties specifically. We provide greater detail regarding some of these factors in our 2010 Form 10-K and first quarter 2011 Form 10-Q, including Risk Factors and Risk Management sections of those reports, and our subsequent SEC filings. Our forward-looking statements may also be subject to other risks and uncertainties, including those we may discuss elsewhere in this presentation or in SEC filings, accessible on the SEC’s website at www.sec.gov and on our corporate website at www.pnc.com/secfilings. We have included these web addresses as inactive textual references only. Information on these websites is not part of this document. Any annualized, proforma, estimated, third party or consensus numbers in this presentation are used for illustrative or comparative purposes only and may not reflect actual results. Any consensus earnings estimates are calculated based on the earnings projections made by analysts who cover that company. The analysts’ opinions, estimates or forecasts (and therefore the consensus earnings estimates) are theirs alone, are not those of PNC or its management, and may not reflect PNC’s or other company’s actual or anticipated results. |
 18 Non-GAAP to GAAP Reconcilement In millions Adjustments, pretax Income taxes (benefit) 1 Net income Average Assets Return on Avg. Assets Net income and return on avg. assets, as reported $912 Reported net income, if annualized $3,658 $261,106 1.40% In millions Adjustments, pretax Income taxes (benefit) 1 Net income Average Assets Return on Avg. Assets Net income and return on avg. assets, as reported $832 Reported net income, if annualized $3,374 $262,554 1.29% In millions Adjustments, pretax Income taxes (benefit) 1 Net income Average Assets Return on Avg. Assets Net income and return on avg. assets, as reported $820 Reported net income, if annualized $3,253 $263,558 1.23% In millions Adjustments, pretax Income taxes (benefit) 1 Net income Average Assets Return on Avg. Assets Net income and return on avg. assets, as reported $1,103 Reported net income, if annualized $4,376 $264,579 1.65% Adjustments: Gain on sale of GIS ($639) $311 (328) Adjusted net income $775 Adjusted net income, if annualized $3,075 $264,579 1.16% For the three months ended December 31, 2010 For the three months ended September 30, 2010 PNC believes that information adjusted for the impact of certain items may be useful due to the extent to which the items are not indicative of our ongoing operations. (1) Calculated using a marginal federal income tax rate of 35% and includes applicable income tax adjustments. The after- tax gain on the sale of GIS also reflects the impact of state income taxes. For the three months ended March 31, 2011 For the three months ended June 30, 2011 Appendix |
 19 Non-GAAP to GAAP Reconcilement In millions June 30, 2011 Mar. 31, 2011 Dec. 31, 2010 Sept. 30, 2010 June 30, 2010 Tier 1 common capital $22,731 $21,976 $21,188 $20,437 $18,173 Reported net income 912 832 820 1,103 803 Reported net income, if annualized 3,658 3,374 3,253 4,376 3,221 Adjustments: After-tax gain on sale of GIS (328) Adjusted net income 775 Adjusted net income, if annualized 3,075 Return on tier 1 common capital 16.1% 15.4% 15.4% 21.4% 17.7% Adjusted return on tier 1 common capital 15.0% In millions June 30, 2011 June 30, 2010 Tier 1 common capital $22,731 $18,173 Reported net income 1,744 1,429 Reported net income, if annualized 3,517 2,882 Return on tier 1 common capital 15.5% 15.9% As of or for the three months ended PNC believes that return on tier 1 common capital is useful as a tool to help measure and assess a company's use of common equity and that such information adjusted for the impact of the GIS gain may be useful due to the extent to which that item is not indicative of our ongoing operations. After-tax adjustments are calculated using a marginal federal income tax rate of 35% and include applicable income tax adjustments. The after-tax gain on the sale of GIS also reflects the impact of state income taxes. The pre-tax gain on the sale of GIS was $639 million. As of or for the six months ended In millions Adjustments, pretax Income taxes (benefit) 1 Net income Average Assets Return on Avg. Assets Net income and return on avg. assets, as reported $803 Reported net income, if annualized $3,221 $264,366 1.22% PNC believes that information adjusted for the impact of certain items may be useful due to the extent to which the items are not indicative of our ongoing operations. (1) Calculated using a marginal federal income tax rate of 35% and includes applicable income tax adjustments. For the three months ended June 30, 2010 Appendix |
 20 Non-GAAP to GAAP Reconcilement For the three months ended $ in millions June 30, 2011 Mar. 31, 2011 Dec. 31, 2010 Sept. 30, 2010 June 30, 2010 Net interest margin, as reported 3.93% 3.94% 3.93% 3.96% 4.35% Provision for credit losses $280 $421 $442 $486 $823 Provision for credit losses, if annualized $1,123 $1,707 $1,754 $1,928 $3,301 Avg. interest earning assets $220,742 $224,095 $223,795 $223,677 $224,580 Annualized provision/Avg. interest earning assets 0.51% 0.76% 0.78% 0.86% 1.47% Provision-adjusted net interest margin (1) 3.42% 3.18% 3.15% 3.10% 2.88% For the three months ended $ in millions June 30, 2011 Mar. 31, 2011 Dec. 31, 2010 Sept. 30, 2010 June 30, 2010 Net interest margin, as reported 3.93% 3.94% 3.93% 3.96% 4.35% Purchase accounting accretion (1) $290 $281 $344 $325 $540 Purchase accounting accretion, if annualized $1,163 $1,140 $1,365 $1,289 $2,166 Avg. interest earning assets $220,742 $224,095 $223,795 $223,677 $224,580 Annualized purchase accounting accretion/Avg. interest earning assets 0.53% 0.51% 0.61% 0.58% 0.96% Core net interest margin (2) 3.40% 3.43% 3.32% 3.38% 3.39% PNC believes that provision-adjusted net interest margin, a non-GAAP measure, is useful as a tool to help evaluate the amount of credit related risk associated with interest-earning assets. (1) The adjustment represents annualized provision for credit losses divided by average interest-earning assets. (1) Purchase accounting accretion is scheduled purchase accounting accretion plus cash recoveries. (2) PNC believes that core net interest margin, a non-GAAP measure, is useful as a tool to help evaluate the impact of purchase accounting accretion on net interest margin. The adjustment represents annualized purchase accounting accretion divided by average interest-earning assets. Appendix |
 21 Peer Group of Banks The PNC Financial Services Group, Inc. PNC BB&T Corporation BBT Bank of America Corporation BAC Capital One Financial, Inc. COF Comerica Inc. CMA Fifth Third Bancorp FITB JPMorgan Chase JPM KeyCorp KEY M&T Bank MTB Regions Financial Corporation RF SunTrust Banks, Inc. STI U.S. Bancorp USB Wells Fargo & Co. WFC Ticker Appendix |