 The PNC Financial Services Group, Inc. Barclays Capital Global Financial Services Conference September 12, 2011 Exhibit 99.1 |
 2 Cautionary Statement Regarding Forward-Looking Information and Adjusted Information This presentation includes “snapshot” information about PNC used by way of illustration. It is not intended as a full business or financial review and should be viewed in the context of all of the information made available by PNC in its SEC filings. The presentation also contains forward- looking statements regarding our outlook for earnings, revenues, expenses, capital levels, liquidity levels, asset quality and other matters regarding or affecting PNC and its future business and operations. Forward-looking statements are necessarily subject to numerous assumptions, risks and uncertainties, which change over time. The forward-looking statements in this presentation are qualified by the factors affecting forward-looking statements identified in the more detailed Cautionary Statement included in the Appendix, which is included in the version of the presentation materials posted on our corporate website at www.pnc.com/investorevents. We provide greater detail regarding some of these factors in our 2010 Form 10-K and 2011 Form 10-Qs, including Risk Factors and Risk Management sections of those reports, and our subsequent SEC filings. Our forward-looking statements may also be subject to other risks and uncertainties, including those we may discuss in this presentation or in SEC filings, accessible on the SEC’s website at www.sec.gov and on PNC’s corporate website at www.pnc.com/secfilings. We have included web addresses in this presentation as inactive textual references only. Information on these websites is not part of this presentation. Future events or circumstances may change our outlook and may also affect the nature of the assumptions, risks and uncertainties to which our forward-looking statements are subject. Forward-looking statements in this presentation speak only as of the date of this presentation. We do not assume any duty and do not undertake to update forward-looking statements. Actual results or future events could differ, possibly materially, from those anticipated in forward-looking statements, as well as from historical performance. In this presentation, we sometimes refer to adjusted results to help illustrate the impact of certain types of items, such as our third quarter 2010 gain related to the sale of PNC Global Investment Servicing Inc. (“GIS”). This information supplements our results as reported in accordance with GAAP and should not be viewed in isolation from, or a substitute for, our GAAP results. We believe that this additional information and the reconciliations we provide may be useful to investors, analysts, regulators and others as they evaluate the impact of these respective items on our results for the periods presented due to the extent to which the items are not indicative of our ongoing operations. We may also provide information on pretax pre-provision earnings (total revenue less noninterest expense), as we believe that pretax pre-provision earnings, a non- GAAP measure, is useful as a tool to help evaluate the ability to provide for credit costs through operations. Where applicable, we provide GAAP reconciliations for such additional information, including in the Appendix. In certain discussions, we may also provide information on yields and margins for all interest-earning assets calculated using net interest income on a taxable-equivalent basis by increasing the interest income earned on tax-exempt assets to make it fully equivalent to interest income earned on taxable investments. We believe this adjustment may be useful when comparing yields and margins for all earning assets. We may also use annualized, proforma, estimated or third party numbers for illustrative or comparative purposes only. These may not reflect actual results. This presentation may also include discussion of other non-GAAP financial measures, which, to the extent not so qualified therein or in the Appendix, is qualified by GAAP reconciliation information available on our corporate website at www.pnc.com under “About PNC–Investor Relations. |
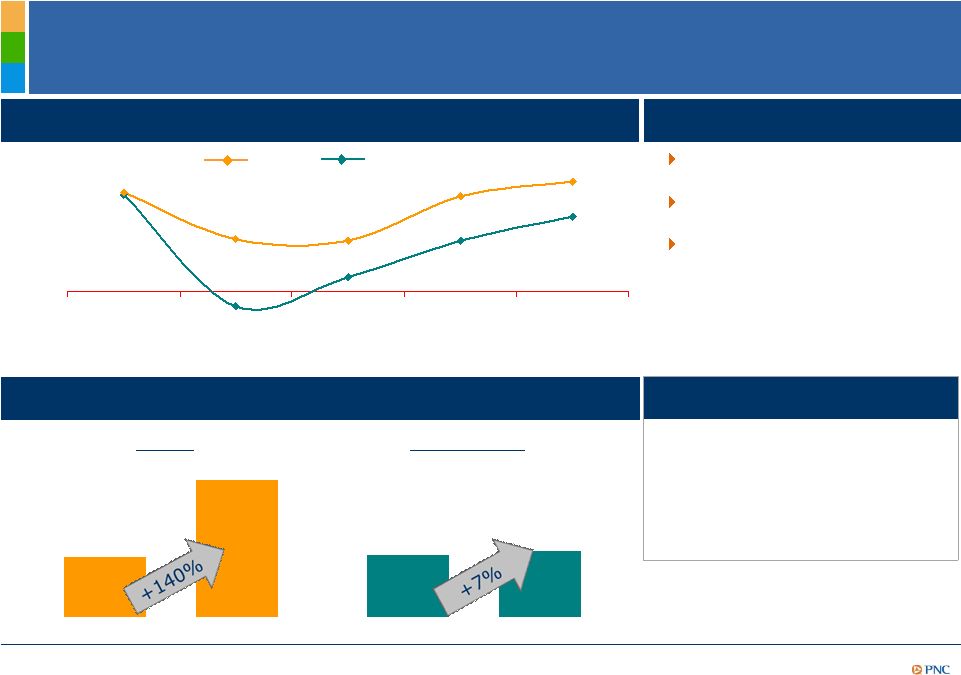 3 Industry Better Positioned in Current Environment Valuation metrics 5 PNC Peers Price to book 82% 81% Price to tangible book 115% 121% Dividend yield 2.8% 1.8% -0.5% 0.0% 0.5% 1.0% 1.5% 2007 2008 2009 2010 2011 Return on average assets 2 3 PNC Peer Average¹ Tangible book value per share 4 1.34% 0.91% $18.55 $19.78 12/31/07 6/30/11 12/31/07 6/30/11 Peer Average¹ PNC $17.91 $42.93 Stronger industry position Stronger balance sheet Improving profitability Diversifying business mix 1.21% 1.18% (1) Peer average represents average of banks identified in the Appendix. Source: SNL DataSource. (2) Excludes BLK/BGI gain. (3) Excludes GIS gain. (4) Tangible book value per share calculated as book value per share less total intangible assets per share. PNC believes that tangible book value, a non-GAAP measure, is useful as a tool to help evaluate the amount, on a per share basis, of intangible assets included in book value per common share. Further information is provided in the Appendix. (5) Based on closing prices as of August 30, 2011. |
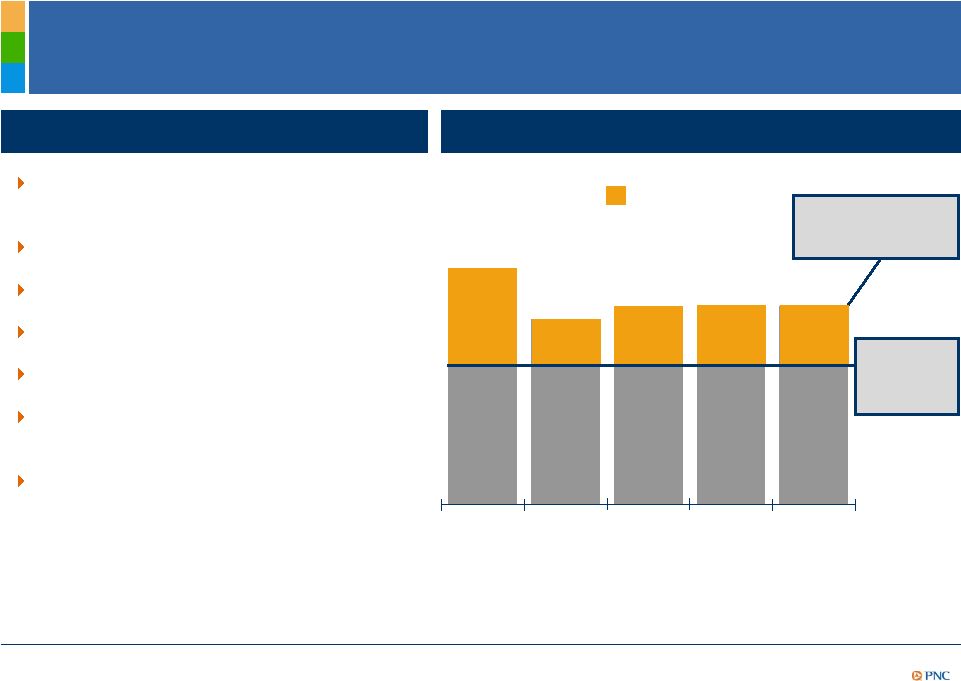 4 PNC’s Differentiated Results 1H11 highlights Net income of $1.7 billion increased by 18% YoY Accelerated customer growth Commercial loans grew Net charge-offs decreased by 51% YoY Tier 1 common increased to 10.5% Increased common stock dividend 250% Bank expansion through strategic capital deployment Return on tangible common equity¹ 19% 15% 16% 16% 16% 2Q10 3Q10 4Q10 1Q11 2Q11 12% Peer² five quarter average 3 PNC 33% above Peer² five quarter average PNC (1) Return on tangible common equity calculated as net income divided by (common equity less intangible assets), annualized. PNC believes that return on tangible common equity, a non-GAAP measure, is useful as a tool to help measure and assess a company’s use of equity. Further information is provided in the Appendix. (2) Peers represent banks identified in the Appendix, as available. Source: SNL DataSource. (3) Excludes the $328 million after-tax, $639 million pretax, GIS gain. |
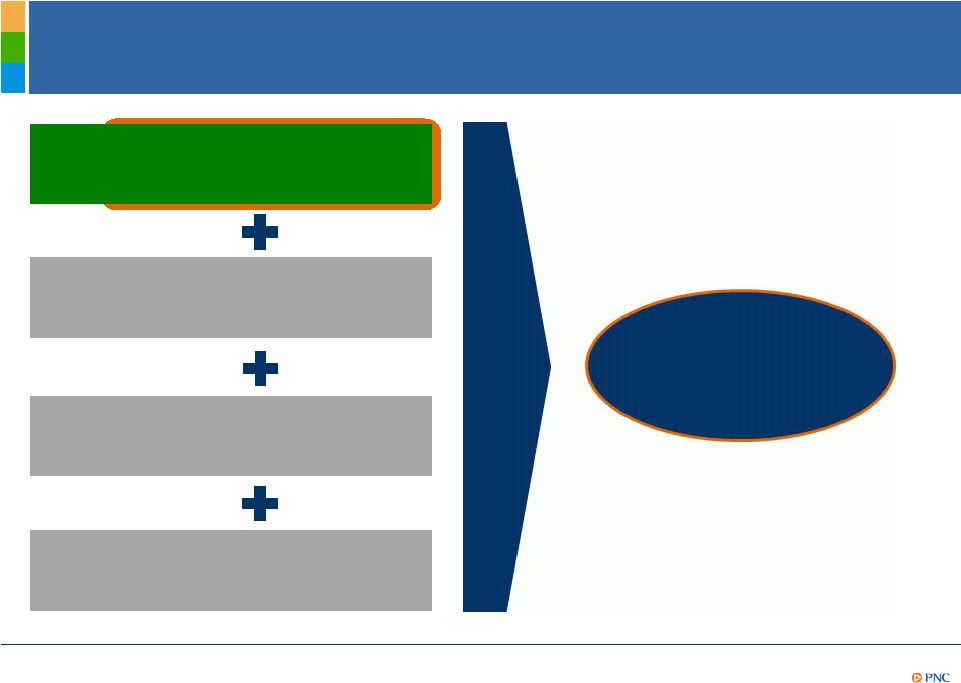 5 PNC’s Proven Business Model Provides Levers in the Current Environment Positioned for Quality Growth 1 Growing customers 2 Managing risk 3 Continuous improvement 4 Disciplined capital management |
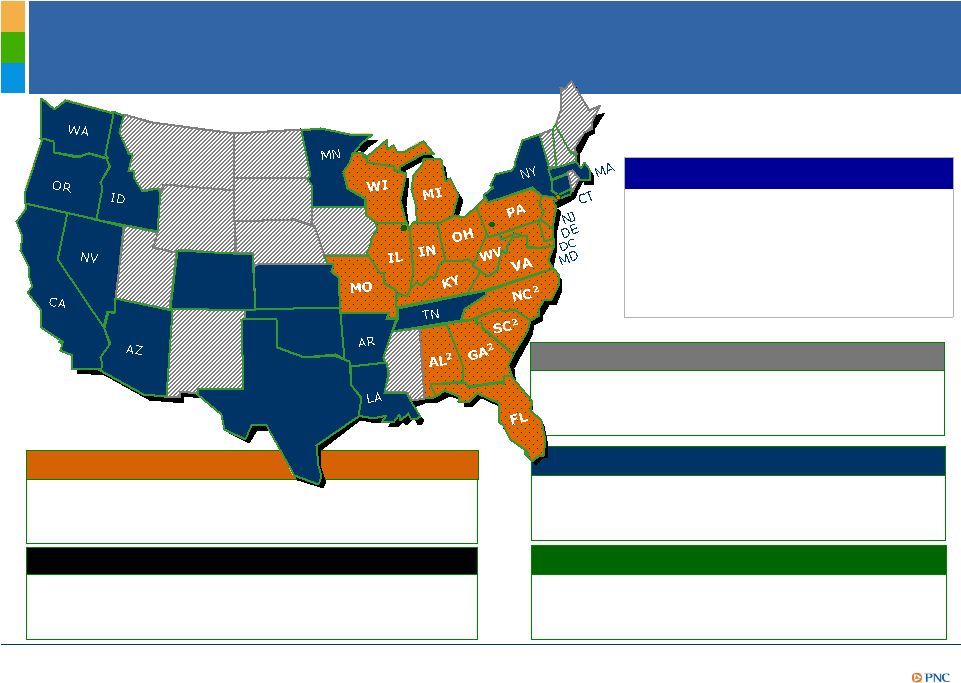 6 Proforma footprint covering approximately half of the U.S. population² Retail Corporate & Institutional A leader in serving middle-market customers and government entities One of the largest bank-held asset managers in the U.S. Asset Management Residential Mortgage National distribution capabilities PNC’s Powerful Franchise CO TX KS OK BlackRock A leader in investment management, risk management and advisory services worldwide June 30, 2011 U.S. Rank Deposits $182B 7 Assets $263B 7 Branches 2,459 5 ATMs 6,707 5 th th th th 1 (1) Rankings source: SNL DataSource; Banks headquartered in U.S. Assets rank excludes Morgan Stanley and Goldman Sachs. (2) Given effect to pending RBC Bank (USA) acquisition, which is subject to regulatory approvals and other customary closing conditions. |
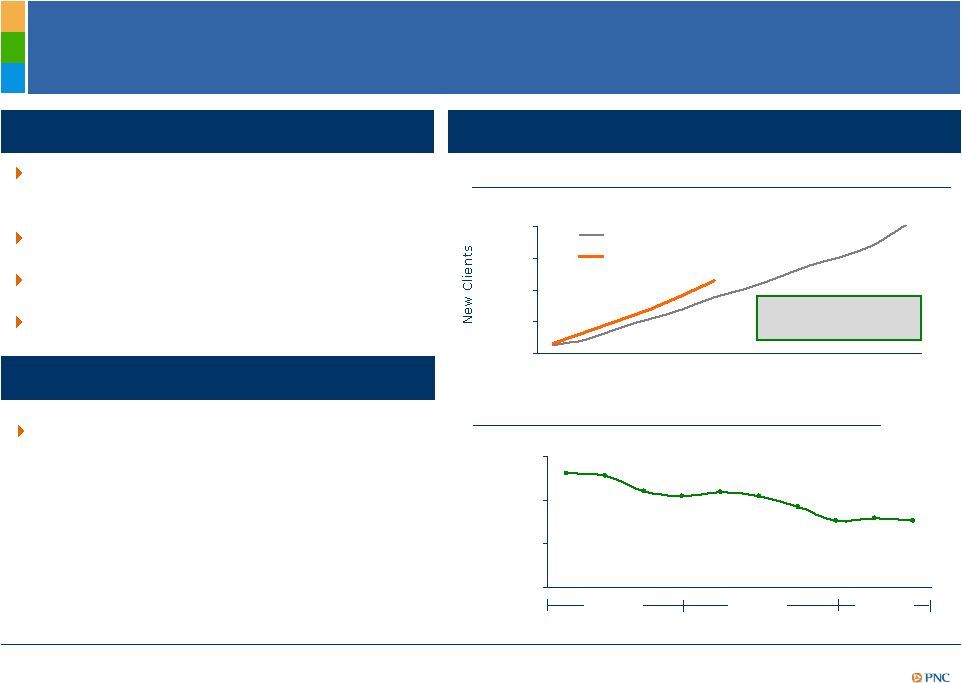
 7 0 25 50 75 100 2003 2004 2005 2006 2007 2008 2009 2010 2011 2012 2013 Growing Customers – Responding to Changing Customer Behaviors and Needs U.S. banking transactions by channel (billions) 1 Mobile Online ATM Call center Branch Forecast Actual Growth in electronic channels continues to reduce consumer check payments The percentage of customers transferring funds online nearly doubled from 34% in 2005 to 67% in 2010 By 2012, checks are expected to account for only 17% of non-cash transactions vs. 32% in 2006 Deposit transactions at PNC branches declined at an accelerated pace and a 5 year CAGR of (6.2%) Changing customer behaviors 2 3 (1) Source: Tower Group, McKinsey & Company. (2) Source: Novantas. “Annual Multichannel Preference Survey” as cited in Novarica, “Consumer Usage of the Mobile Banking Channel,” January 10, 2010. (3) Source: Forrester Research Mobile Banking Forecast, 2010-2015. |
 8 Growing Customers – Retail Banking Yielding results December 2010 Goal Free checking Relationship checking July 2011 30% 63% 70% Growth strategies Expand market share and share of wallet by providing customers with more choices and fair value Deepen share of wallet in the mass affluent segment Capitalize on the launch of integrated deposit products and enhanced credit card offerings Fully leverage new geographies and alternative distribution channels Organic checking relationship growth 1,2 Growth in online bill payment active customers 2H10 1H11 +130 +76 2Q10 2Q11 +1,045 +870 New originations Period end 3 (1) Organic growth refers to consumer and small business customers excluding 32,000 relationships acquired by acquisition in 2Q11. (2) Organic growth excludes 3,000 customers acquired by acquisition in 2Q11. (3) Relationship checking refers to accounts with a committed balance level or self-service accounts with lower cost of servicing. |
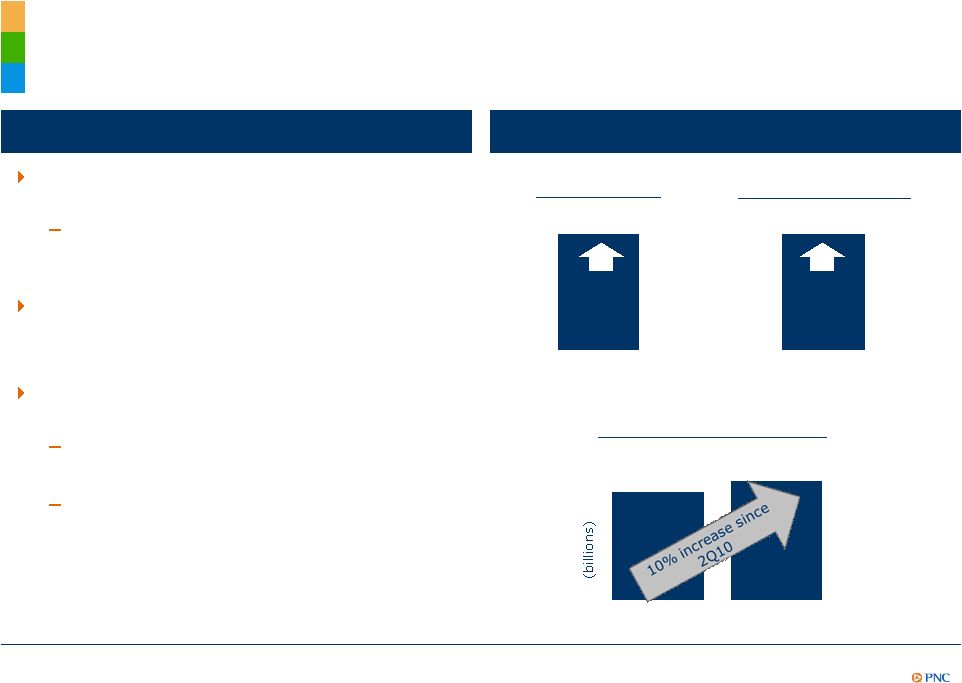
 9 40% 45% 50% 55% Yielding results Corporate Banking New Cumulative Primary Client 1 Growth Growing Customers – Corporate & Institutional Banking Growth strategies Focus on cross-sell of existing relationships Achieve high growth customer additions Invest in high potential markets Focus on total relationship return 1Q 2Q 3Q 4Q 0 250 500 750 1,000 2010 Actual 2011 Actual 2009 2010 2011 As of June 30, 2011, 94% of all PNC markets are ahead of first half sales plans ² Commercial loan growth increased 4% linked quarter and 9% first half 2011 ² New primary clients increased 29% year over year 1H11 highlights Loan commitments grew 10% YoY (1) Corporate banking primary client relationships are defined as corporate banking client relationships with annual revenue generation of $10,000 or more. (2) Corporate and Institutional Banking quarterly utilization rates reflect the consolidation of Market Street Funding Corporation beginning January 2010. 2011 represents year to date results through June quarter-end. Corporate and Institutional Banking Utilization Rates 2 |
  10 Growing Customers – Asset Management Group (1) Referral sales are new sales to clients referred to AMG by Retail Banking or Corporate and Institutional Banking. (2) New Primary clients are relationships with annual revenue of $10,000 or more. Growth strategies Expanding distribution in all markets with a particular focus on high growth markets Growing revenue through targeted market opportunities and increased channel penetration Investing in innovation and technology – piloting Wealth Insight tool Yielding results Referral sales 1H11 vs. 1H10 104% New primary clients 1H11 vs. 1H10 49% Assets under administration 2Q10 2Q11 $219 $199 150 external new hires in the first half of 2011 – primarily front line talent acquisition Pilot in progress with roll-out to over 10,000 clients Product launch in 3Q11 1 2 |
 11 RBC Bank (USA) – Strategic Growth Opportunity Priced Below Tangible Book Value Total market revenue growth for C&IB and AMG Projected 5-year population growth 4 of 6.5% more than 1.5 times the national average and 5 times PNC’s Retail Banking footprint Combined retail footprint covers 11 of the top 20 wealthiest states 5 Commercial market opportunity 6 : RBC’s market opportunities Fee NII $12 $21 $26 $18 $9 $7 2009 2010 2011 Florida $19 $30 $44 New primary clients up 17% over YTD10 3 $14 $20 $33 $48 $44 $50 2009 2010 2011 Chicago $64 $64 $82 New primary clients up 67% over YTD10 3 ² More than 500,000 small businesses ² Approximately 4,000 mid-market and 2,000 corporate companies 2 1 (1) Year over year market revenue growth. (2) Year over year total new primary client growth. (3) 2011 represents revenue growth for the six months ended June 30, 2011, annualized. (4) Source: SNL DataSource (5) Top 20 states based on wealth holders with >$1.5 million in net worth. Source: IRS Statistics of Income Division, August 2008. (6) Source: SNL Financial and OneSource. 2 |
 12 PNC’s Proven Business Model Provides Levers in the Current Environment Positioned for Quality Growth 1 Growing customers 2 Managing risk 3 Continuous improvement 4 Disciplined capital management |
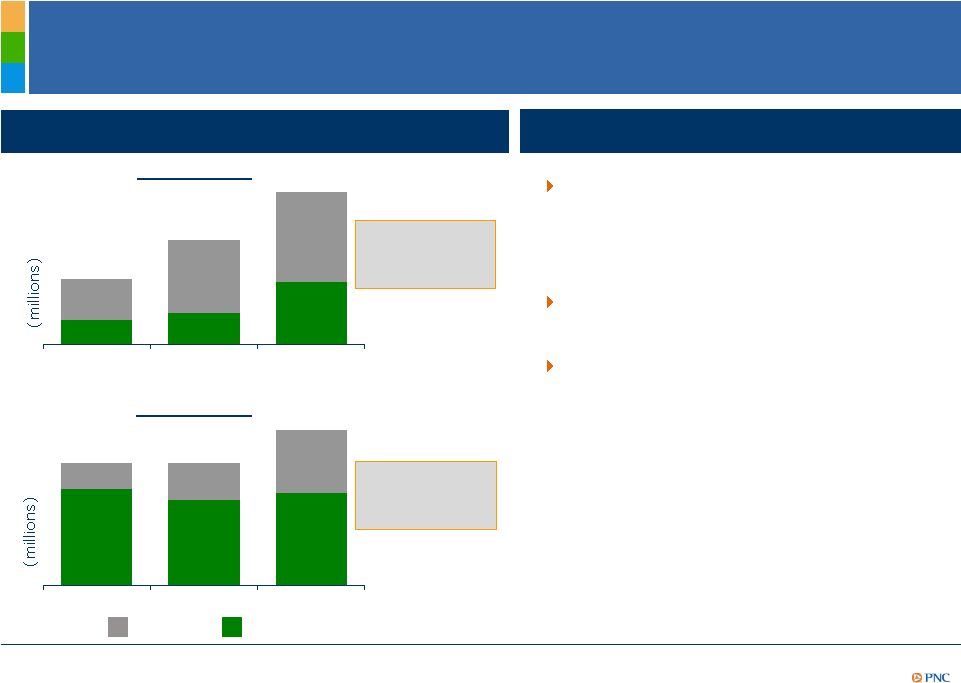
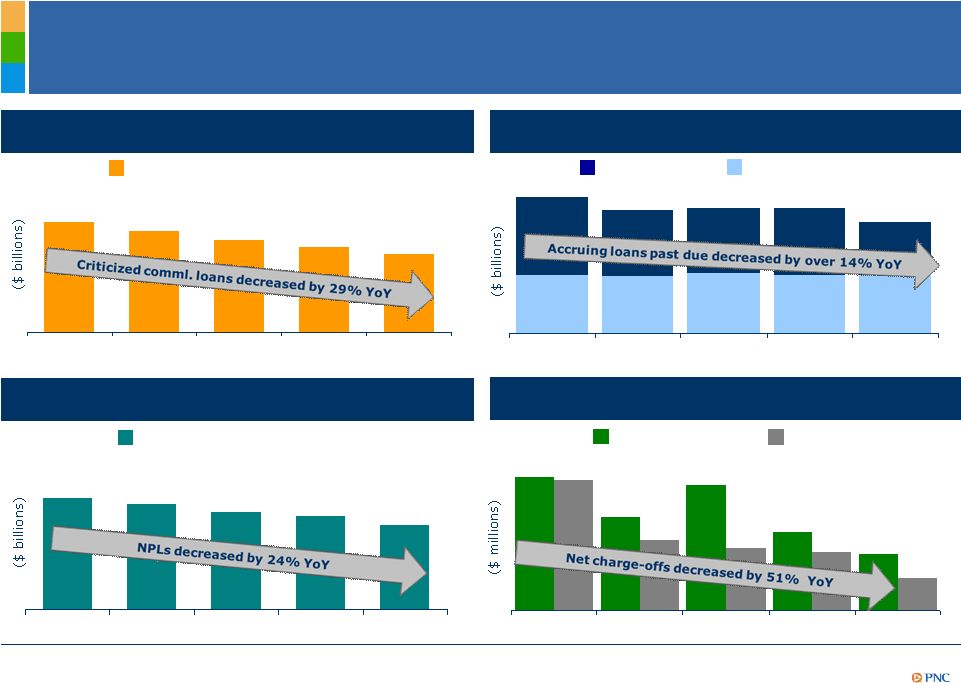 13 Managing Risk - Credit Trends Continue to Improve $791 $533 $442 $421 $840 $614 $414 $486 $280 $823 2Q10 3Q10 4Q10 1Q11 2Q11 Nonperforming loans 1,3 Provision and net charge-offs Criticized commercial loans 30-89 Days 90 Days + Accruing loans past due 1,2 $2.7 $2.6 $2.7 $2.6 $2.6 $2.2 $1.8 $1.8 $1.9 $1.5 2Q10 3Q10 4Q10 1Q11 2Q11 As of quarter end except net charge-offs, which are for the quarter. (1) Loans acquired from National City that were impaired are not included as they were recorded at estimated fair value when acquired and are currently considered performing loans due to the accretion of interest in purchase accounting. (2) Includes loans that are government guaranteed/insured, primarily residential mortgages. These loans totaled $2.7 billion in 2Q11. (3) Does not include loans held for sale or foreclosed and other assets. Effective in 2011, excludes residential real estate loans accounted for under the fair value option. (4) Criticized loans are ones that we consider “special mention,” “substandard’” or “doubtful”. $15.0 $16.4 $13.7 $12.7 $11.7 2Q10 3Q10 4Q10 1Q11 2Q11 Criticized Commercial loans 4 Provision Net charge-offs 2Q10 3Q10 4Q10 1Q11 2Q11 Total nonperforming loans $5.1 $4.8 $4.5 $4.3 $3.9 |
 14 Industry Leading Performance Nonperforming loans² to total loans Nonperforming assets² to total assets Net charge- offs to average loans Allowance for loan and lease losses³ to loans 2Q11 reserves/loans Key 2Q11 credit metrics 1.70% 2.37% 2.57% 3.53% 1.11% 1.69% 3.08% 2.93% (1) As of or for the quarter ended June, 2011. Net charge-offs to average loans percentages are annualized. Peers represents average of banks identified in the Appendix, as available. Sources: SNL DataSource, company reports. (2) Does not include purchased impaired loans or loans held for sale. (3) Includes impairment reserves attributable to purchased impaired loans. Loans PNC acquired from National City that were impaired are purchased impaired loans. (4) 2Q11 reserves/loans would be 3.87% if adjusted to include the remaining marks on purchased impaired loans. Further information is provided in the Appendix. Others have made acquisitions and have marks on purchased impaired loans. No adjustments have been made for those peers. 4.15% 3.96% 3.87% 3.84% 3.48% 3.35% 3.08% 2.78% 2.57% 2.57% 2.43% 2.39% 2.06% 1.56% JPM BAC PNC RF COF FITB PNC WFC KEY USB BBT STI CMA MTB Includes purchased impaired loan marks 4 1 |
 15 Balance Sheet Management Drivers Current environment Extended period of slow economic growth and low interest rates Increase responsible lending to partially offset lower asset yields Substantially reduce cost of funding to maintain net interest income Maintain liquidity and strong capital position Focus on risk-adjusted commercial loan growth to mitigate impact of securities repricing Lower funding cost Strategies Funding Cost Reduction Opportunities Expected 2012 Impact (in millions) Repricing CDs $450-$500 Trust preferreds Maturing debt Deposit funding |
 16 PNC’s Proven Business Model Provides Levers in the Current Environment Positioned for Quality Growth 1 Growing customers 2 Managing risk 3 Continuous improvement 4 Disciplined capital management |
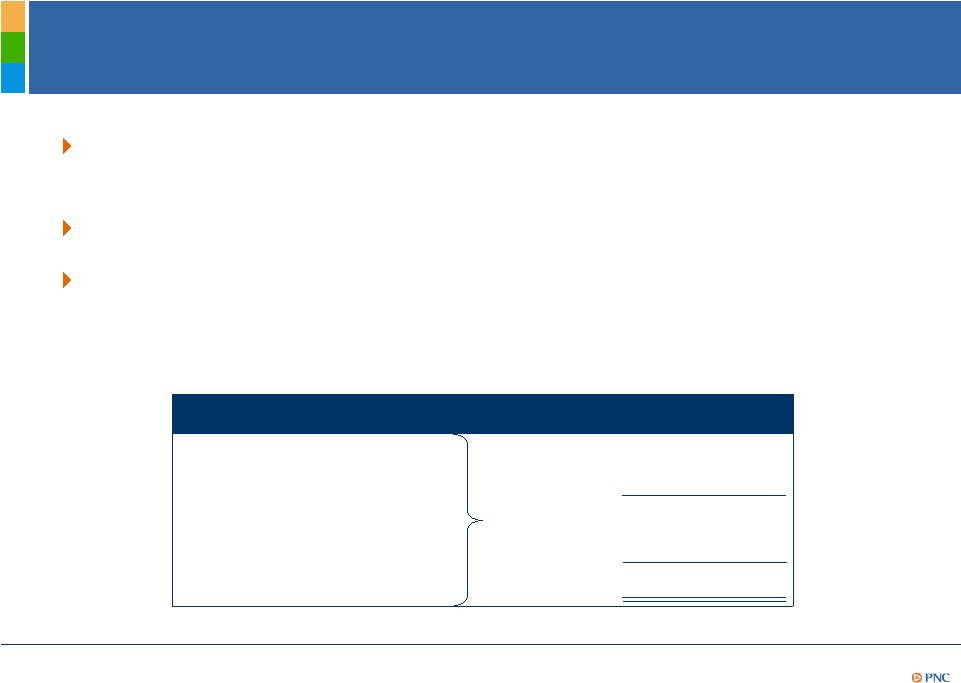 17 We are targeting expense reductions of $550 million or approximately 6% of PNC’s estimated 2012 expense base 2 These efficiencies provide the capacity to invest in future growth Expense efficiencies are designed not to have an impact on customers or revenue Continuous Improvement – Expenses to Remain Flat in 2012 1 Expense Reduction Goals 2012 Financial Impact (in millions) Business efficiency $125 Operational efficiency 275 Total PNC initiatives $400 RBC Bank (USA) integration 150 Total $550 (1) Does not include legal and regulatory related contingencies, and Flagstar and RBC Bank (USA) integration and operating costs, along with capital actions. (2) The 2012 expense base includes the impact of the Flagstar and RBC Bank (USA) operating costs. |
 18 PNC’s Proven Business Model Provides Levers in the Current Environment Positioned for Quality Growth 1 Growing customers 2 Managing risk 3 Continuous improvement 4 Disciplined capital management |
 19 3.5% 4.0% 4.5% 5.125% 5.75% 6.375% 7.0% 2013 2014 2015 2016 2017 2018 2019 Highlights The amount of cushion we choose to hold above and beyond Basel III limits will be a function of multiple inputs such as economic conditions, AOCI cushion and SIFI buffer, if required Assumes no common stock issuance to fund acquisition of RBC Bank (USA) BlackRock – Return on economic and regulatory capital is greater than 20% Sub-investment grade securities Significant upside potential assuming capital requirements reflect the inherent risk profile of the relevant investment Tier 1 common ratio (1) Proforma estimate is based on PNC’s Tier 1 common ratio of 10.5% as of 6/30/11, and includes the assumed benefit of 1.3%, which reflects First Call 2011 and 2012 estimates and current dividend payout, as well as the assumed decrease of 3.3%-3.8%, which reflects assumptions regarding credit, operating and market risk under Basel II, the treatment of BlackRock and sub-investment grade securities (assuming no AOCI double counting) under Basel II, and assumes no common share issuance for the RBC Bank (USA) acquisition. This estimate is subject to further regulatory guidance and clarity. (2) Regulatory requirements include capital conservation buffer. Basel III requirements 12/31/12 Proforma Basel III 8.0% - 8.5% 1 2 PNC’s Basel III Capital Ratio Estimate |
 20 Summary PNC Continues to Build a Great Company. PNC Continues to Build a Great Company. PNC’s proven business model and consistent execution have delivered strong results throughout the cycles Clear levers to drive quality growth in the future Relative valuation gap represents significant long- term value |
 21 Cautionary Statement Regarding Forward-Looking Information Appendix This presentation includes “snapshot” information about PNC used by way of illustration and is not intended as a full business or financial review It should not be viewed in isolation but rather in the context of all of the information made available by PNC in its SEC filings. We also make statements in this presentation, and we may from time to time make other statements, regarding our outlook for earnings, revenues, expenses, capital levels, liquidity levels, asset quality and other matters regarding or affecting PNC and its future business and operations that are forward-looking statements within the meaning of the Private Securities Litigation Reform Act. Forward-looking statements are typically identified by words such as “believe,” “plan,” “expect,” “anticipate,” “see,” “intend,” “outlook,” “project,” “forecast,” “estimate,” “goal,” “will,” “should” and other similar words and expressions. Forward-looking statements are subject to numerous assumptions, risks and uncertainties, which change over time. Forward-looking statements speak only as of the date made. We do not assume any duty and do not undertake to update forward-looking statements. Actual results or future events could differ, possibly materially, from those anticipated in forward-looking statements, as well as from historical performance. Our forward-looking statements are subject to the following principal risks and uncertainties. • Our businesses, financial results and balance sheet values are affected by business and economic conditions, including the following: o Changes in interest rates and valuations in debt, equity and other financial markets. o Disruptions in the liquidity and other functioning of U.S. and global financial markets. o The impact on financial markets and the economy of the downgrade by Standard & Poor’s of U.S. Treasury obligations and other U.S. government-backed debt, as well as issues surrounding the level of U.S. and European government debt. o Actions by Federal Reserve, U.S. Treasury and other government agencies, including those that impact money supply and market interest rates. o Changes in customers’, suppliers’ and other counterparties’ performance and creditworthiness. o Slowing or failure of the current moderate economic recovery. o Continued effects of aftermath of recessionary conditions and uneven spread of positive impacts of recovery on the economy and our counterparties, including adverse impacts on levels of unemployment, loan utilization rates, delinquencies, defaults and counterparty ability to meet credit and other obligations. o Changes in customer preferences and behavior, whether due to changing business and economic conditions, legislative and regulatory initiatives, or other factors. • Our forward-looking financial statements are subject to the risk that economic and financial market conditions will be substantially different than we are currently expecting. These statements are based on our current view that the moderate economic recovery is transitioning into a self-sustaining economic expansion in 2011, with faster economic growth in the second half pushing the unemployment rate lower amidst continued low interest rates. • Our forward-looking financial statements are subject to the risk that economic and financial market conditions will be substantially different than we are currently expecting. These statements are based on our current view that the modest economic expansion will persist in the year ahead and interest rates will remain very low. |
 22 Cautionary Statement Regarding Forward-Looking Information (continued) Appendix Legal and regulatory developments could have an impact on ability to operate our businesses, financial condition, results of operations, competitive position, reputation, or pursuit of attractive acquisition opportunities. Reputational impacts could affect matters such as business generation and retention, liquidity, funding, and ability to attract and retain management. These developments could include: o Changes resulting from legislative and regulatory reforms, including broad-based restructuring of financial industry regulation and changes to laws and regulations involving tax, pension, bankruptcy, consumer protection, and other industry aspects, and changes in accounting policies and principles. We will be impacted by extensive reforms provided for in the Dodd-Frank Wall Street Reform and Consumer Protection Act (the “Dodd-Frank Act”) and otherwise growing out of the recent financial crisis, the precise nature, extent and timing of which, and their impact on us, remains uncertain. o Changes to regulations governing bank capital, including due to the Dodd-Frank Act and to Basel III initiatives. o Unfavorable resolution of legal proceedings or other claims and regulatory and other governmental investigations or other inquiries. In addition to matters relating to PNC’s business and activities, such matters may include proceedings, claims, investigations, or inquiries relating to pre acquisition business and activities of acquired companies, such as National City. These matters may result in monetary judgments or settlements or other remedies, including fines, penalties, restitution or alterations in our business practices, and in additional expenses and collateral costs, and may cause reputational harm to PNC following the acquisition and integration of acquired businesses into ours. o Results of regulatory examination and supervision process, including our failure to satisfy requirements of agreements with governmental agencies. o Impact on business and operating results of any costs associated with obtaining rights in intellectual property claimed by others and of adequacy of our intellectual property protection in general. Business and operating results are affected by our ability to identify and effectively manage risks inherent in our businesses, including, where appropriate, through effective use of third-party insurance, derivatives, and capital management techniques, and to meet evolving regulatory capital standards. In particular, our results currently depend on our ability to manage elevated levels of impaired assets. Business and operating results also include impacts relating to our equity interest in BlackRock, Inc. and rely to a significant extent on information provided to us by BlackRock. Risks and uncertainties that could affect BlackRock are discussed in more detail by BlackRock in SEC filings. Our planned acquisition of RBC Bank (USA) presents us with risks and uncertainties related both to the acquisition transaction itself and its integration into PNC after closing, including: o Closing is dependent on, among other things, receipt of regulatory and other applicable approvals, the timing of which cannot be predicted with precision at this point and which may not be received at all. The impact of closing on PNC’s financial statements will be affected by the timing of the transaction. o The transaction (including integration of RBC Bank (USA)’s businesses) may be substantially more expensive to complete than anticipated. Anticipated benefits, including cost savings and strategic gains, may be significantly harder or take longer to achieve than expected or may not be achieved in their entirety as a result of unexpected factors or events. o Our ability to achieve anticipated results from this transaction is dependent also on the following factors, in part related to the state of economic and financial markets: the extent of credit losses in the acquired loan portfolios and the extent of deposit attrition. Also, litigation and governmental investigations that may be filed or commenced, as a result of this transaction or otherwise, could impact the timing or realization of anticipated benefits to PNC. • • • • |
 23 Cautionary Statement Regarding Forward-Looking Information (continued) Appendix o Integration of RBC Bank (USA)’s business and operations into PNC, which will include conversion of RBC Bank (USA)’s different systems and procedures, may take longer than anticipated or be more costly than anticipated or have unanticipated adverse results relating to RBC Bank (USA)’s or PNC’s existing businesses. PNC’s ability to integrate RBC Bank (USA) successfully may be adversely affected by the fact that this transaction will result in PNC entering several markets where PNC does not currently have any meaningful retail presence. •In addition to the planned RBC Bank (USA) transaction, we grow our business in part by acquiring from time to time other financial services companies, financial services assets and related deposits. These other acquisitions, including our planned acquisition of branches and related deposits in metropolitan Atlanta, Georgia from Flagstar Bank, FSB, often present risks and uncertainties analogous to those presented by the RBC Bank (USA) transaction, as well as, in some cases, with risks related to entering into new lines of business. •Competition can have an impact on customer acquisition, growth and retention and on credit spreads and product pricing, which can affect market share, deposits and revenues. Industry restructuring in the current environment could also impact our business and financial performance through changes in counterparty creditworthiness and performance and in competitive and regulatory landscape. Our ability to anticipate and respond to technological changes can also impact our ability to respond to customer needs and meet competitive demands. •Business and operating results can also be affected by widespread disasters, dislocations, terrorist activities or international hostilities through impacts on the economy and financial markets generally or on us or our counterparties specifically. We provide greater detail regarding some of these factors in our 2010 Form 10-K and first and second quarter 2011 Form 10-Qs, including Risk Factors and Risk Management sections of those reports, and our subsequent SEC filings. Our forward-looking statements may also be subject to other risks and uncertainties, including those we may discuss elsewhere in this presentation or in SEC filings, accessible on the SEC’s website at www.sec.gov and on our corporate website at www.pnc.com/secfilings. We have included these web addresses as inactive textual references only. Information on these websites is not part of this document. Any annualized, proforma, estimated, third party or consensus numbers in this presentation are used for illustrative or comparative purposes only and may not reflect actual results. Any consensus earnings estimates are calculated based on the earnings projections made by analysts who cover that company. The analysts’ opinions, estimates or forecasts (and therefore the consensus earnings estimates) are theirs alone, are not those of PNC or its management, and may not reflect PNC’s or other company’s actual or anticipated results. |
 24 Non-GAAP to GAAP Reconcilement Appendix Six months ended June 30 in millions 2011 2010 2009 2008 2007 Reported net income $1,744 $3,397 $2,403 $914 $1,491 Average assets $261,826 $264,902 $276,876 $142,020 $123,418 Return on average assets 1.34% 1.28% 0.87% 0.64% 1.21% Adjustments $0 $639 (1) $1,076 (2) $0 $0 Income taxes 0 311 389 0 0 After-tax adjustments $0 $328 $687 $0 $0 Net income excluding adjustments $1,744 $3,069 $1,716 $914 $1,491 Average assets $261,826 $264,902 $276,876 $142,020 $123,418 Return on average assets excluding adjustments 1.34% 1.16% 0.62% 0.64% 1.21% (1) Gain on sale of GIS (2) Gain on BlackRock/BGI transaction PNC believes that information adjusted for the impact of certain items may be useful due to the extent to which the items are not indicative of our ongoing operations. Year ended December 31 As of $ in millions June 30, 2011 Allowance for loan and lease losses $4,627 Remaining mark on purchased impaired loans $1,234 Allowance for loan and lease losses, adjusted to include remaining mark $5,861 Loans, as reported $150,319 Loans, adjusted to include remaining mark on purchased impaired loans $151,553 Allowance for loan and lease losses to loans 3.08% Allowance for loan and lease losses plus remaining mark to loans plus remaining mark 3.87% |
 25 Non-GAAP to GAAP Reconcilement Appendix In millions except per share data Dec. 31, 2007 June 30, 2011 Common shareholders' equity $14,854 $31,588 Common shares outstanding 335 526 Book value per common share $43.60 $60.02 Intangible assets $8,853 $9,005 Common shareholders' equity less intangible assets $6,001 $22,583 Common shares outstanding 335 526 Tangible book value per common share $17.91 $42.93 As of PNC believes that tangible book value per common share, a non-GAAP measure, is useful as a tool to help evaluate the amount, on a per share basis, of intangible assets included in book value per common share. In millions June 30, 2010 Sep. 30, 2010 Dec. 31, 2010 Mar. 31, 2011 June 30, 2011 Net income, as reported $803 $1,103 $820 $832 $912 Adjustment: After-tax gain on sale of GIS - 328 - - - Net income, as adjusted $803 $775 $820 $832 $912 Adjusted net income, annualized $3,221 $3,075 $3,253 $3,374 $3,658 Common shareholders' equity 27,731 29,396 29,595 30,485 31,588 Intangible and other assets 10,450 9,111 9,053 9,008 9,005 Tangible common shareholders' equity $17,281 $20,285 $20,542 $21,477 $22,583 Return on tangible common equity 19% 15% 16% 16% 16% As of |
 26 Peer Group of Banks Appendix The PNC Financial Services Group, Inc. PNC BB&T Corporation BBT Bank of America Corporation BAC Capital One Financial, Inc. COF Comerica Inc. CMA Fifth Third Bancorp FITB JPMorgan Chase JPM KeyCorp KEY M&T Bank MTB Regions Financial Corporation RF SunTrust Banks, Inc. STI U.S. Bancorp USB Wells Fargo & Co. WFC Ticker |