1Q 2018 Earnings Presentation Exhibit 99.2
2 Forward Looking Statements The foregoing contains forward-looking statements within the meaning of the Private Securities Litigation Reform Act of 1995. Such statements are not historical facts and include expressions about management’s confidence and strategies and management’s expectations about new and existing programs and products, acquisitions, relationships, opportunities, taxation, technology, market conditions and economic expectations. These statements may be identified by such forward-looking terminology as “should,” “expect,” “believe,” “view,” “opportunity,” “allow,” “continues,” “reflects,” “typically,” “usually,” “anticipate,” or similar statements or variations of such terms. Such forward-looking statements involve certain risks and uncertainties. Actual results may differ materially from such forward-looking statements. Factors that may cause actual results to differ materially from those contemplated by such forward-looking statements include, but are not limited to: weakness or a decline in the economy, mainly in New Jersey, New York, Florida and Alabama, as well as an unexpected decline in commercial real estate values within our market areas; the risk that the businesses of Valley and USAB may not be combined successfully, or such combination may take longer or be more difficult, time- consuming or costly to accomplish than expected; the diversion of management's time on issues relating to merger integration; the inability to realize expected cost savings and synergies from the merger of USAB with Valley in the amounts or in the timeframe anticipated; the inability to retain USAB’s customers and employees; less than expected cost reductions and revenue enhancement from Valley's cost reduction plans including its earnings enhancement program called "LIFT"; higher or lower than expected income tax expense or tax rates, including increases or decreases resulting from the impact of the Tax Act and other changes in tax laws, regulations and case law; damage verdicts or settlements or restrictions related to existing or potential litigations arising from claims of breach of fiduciary responsibility, negligence, fraud, contractual claims, environmental laws, patent or trade mark infringement, employment related claims, and other matters; the loss of or decrease in lower-cost funding sources within our deposit base may adversely impact our net interest income and net income; cyber attacks, computer viruses or other malware that may breach the security of our websites or other systems to obtain unauthorized access to confidential information, destroy data, disable or degrade service, or sabotage our systems; results of examinations by the OCC, the FRB, the CFPB and other regulatory authorities, including the possibility that any such regulatory authority may, among other things, require us to increase our allowance for credit losses, write-down assets, require us to reimburse customers, change the way we do business, or limit or eliminate certain other banking activities; changes in accounting policies or accounting standards, including the new authoritative accounting guidance (known as the current expected credit loss (CECL) model) which may increase the required level of our allowance for credit losses after adoption on January 1, 2020; our inability or determination not to pay dividends at current levels, or at all, because of inadequate future earnings, regulatory restrictions or limitations, changes in our capital requirements or a decision to increase capital by retaining more earnings; higher than expected loan losses within one or more segments of our loan portfolio; unanticipated loan delinquencies, loss of collateral, decreased service revenues, and other potential negative effects on our business caused by severe weather or other external events; unexpected significant declines in the loan portfolio due to the lack of economic expansion, increased competition, large prepayments, changes in regulatory lending guidance or other factors; and the failure of other financial institutions with whom we have trading, clearing, counterparty and other financial relationships. A detailed discussion of factors that could affect our results is included in our SEC filings, including the “Risk Factors” section of our Annual Report on Form 10-K for the year ended December 31, 2017. We undertake no duty to update any forward-looking statement to conform the statement to actual results or changes in our expectations. Although we believe that the expectations reflected in the forward-looking statements are reasonable, we cannot guarantee future results, levels of activity, performance or achievements.
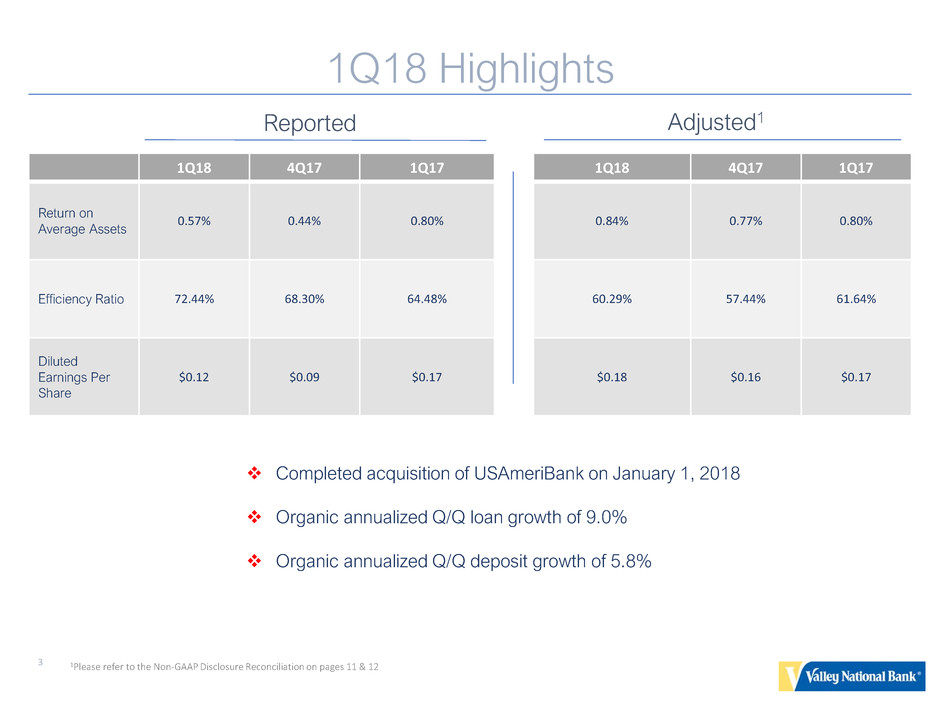
1Q18 Highlights 3 1Q18 4Q17 1Q17 1Q18 4Q17 1Q17 Return on Average Assets 0.57% 0.44% 0.80% 0.84% 0.77% 0.80% Efficiency Ratio 72.44% 68.30% 64.48% 60.29% 57.44% 61.64% Diluted Earnings Per Share $0.12 $0.09 $0.17 $0.18 $0.16 $0.17 Reported Adjusted1 Completed acquisition of USAmeriBank on January 1, 2018 Organic annualized Q/Q loan growth of 9.0% Organic annualized Q/Q deposit growth of 5.8% 1Please refer to the Non-GAAP Disclosure Reconciliation on pages 11 & 12
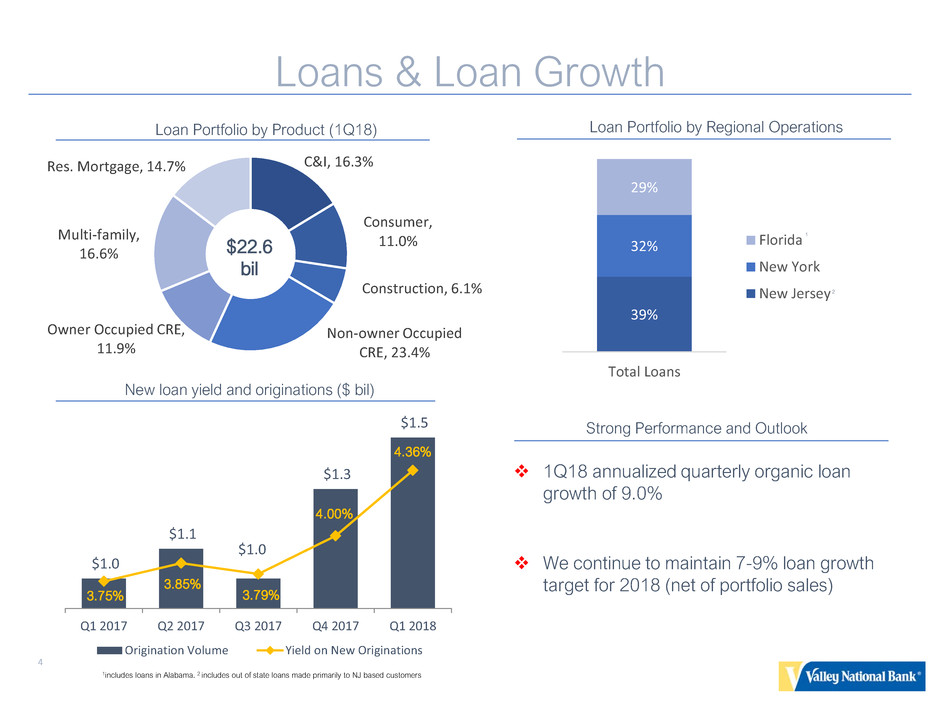
Loans & Loan Growth 4 $1.0 $1.1 $1.0 $1.3 $1.5 3.75% 3.85% 3.79% 4.00% 4.36% Q1 2017 Q2 2017 Q3 2017 Q4 2017 Q1 2018 Origination Volume Yield on New Originations Loan Portfolio by Product (1Q18) 39% 32% 29% Total Loans Florida New York New Jersey 1Q18 annualized quarterly organic loan growth of 9.0% We continue to maintain 7-9% loan growth target for 2018 (net of portfolio sales) Strong Performance and Outlook Loan Portfolio by Regional Operations New loan yield and originations ($ bil) C&I, 16.3% Consumer, 11.0% Construction, 6.1% Non-owner Occupied CRE, 23.4% Owner Occupied CRE, 11.9% Multi-family, 16.6% Res. Mortgage, 14.7% $22.6 bil 1 1includes loans in Alabama. 2 includes out of state loans made primarily to NJ based customers 2
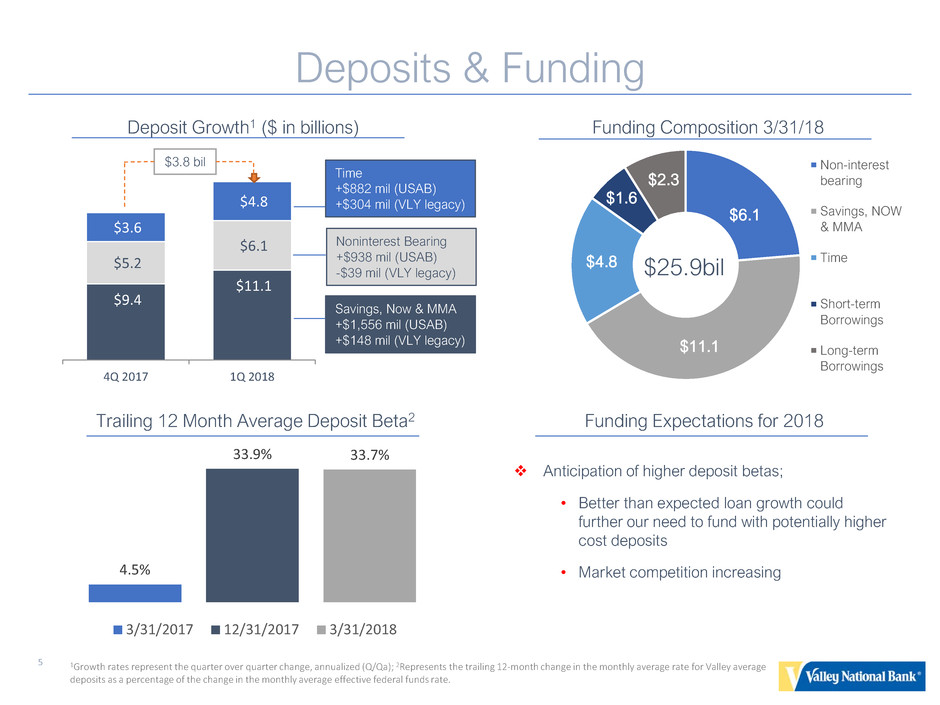
Deposits & Funding 5 Trailing 12 Month Average Deposit Beta2 Anticipation of higher deposit betas; • Better than expected loan growth could further our need to fund with potentially higher cost deposits • Market competition increasing $9.4 $11.1 $5.2 $6.1 $3.6 $4.8 4Q 2017 1Q 2018 Deposit Growth1 ($ in billions) 1Growth rates represent the quarter over quarter change, annualized (Q/Qa); 2Represents the trailing 12-month change in the monthly average rate for Valley average deposits as a percentage of the change in the monthly average effective federal funds rate. Funding Expectations for 2018 Time +$882 mil (USAB) +$304 mil (VLY legacy) Noninterest Bearing +$938 mil (USAB) -$39 mil (VLY legacy) Savings, Now & MMA +$1,556 mil (USAB) +$148 mil (VLY legacy) $6.1 $11.1 $4.8 $1.6 $2.3 Non-interest bearing Savings, NOW & MMA Time Short-term Borrowings Long-term Borrowings $25.9bil Funding Composition 3/31/18 $3.8 bil 4.5% 33.9% 33.7% 3/31/2017 12/31/2017 3/31/2018
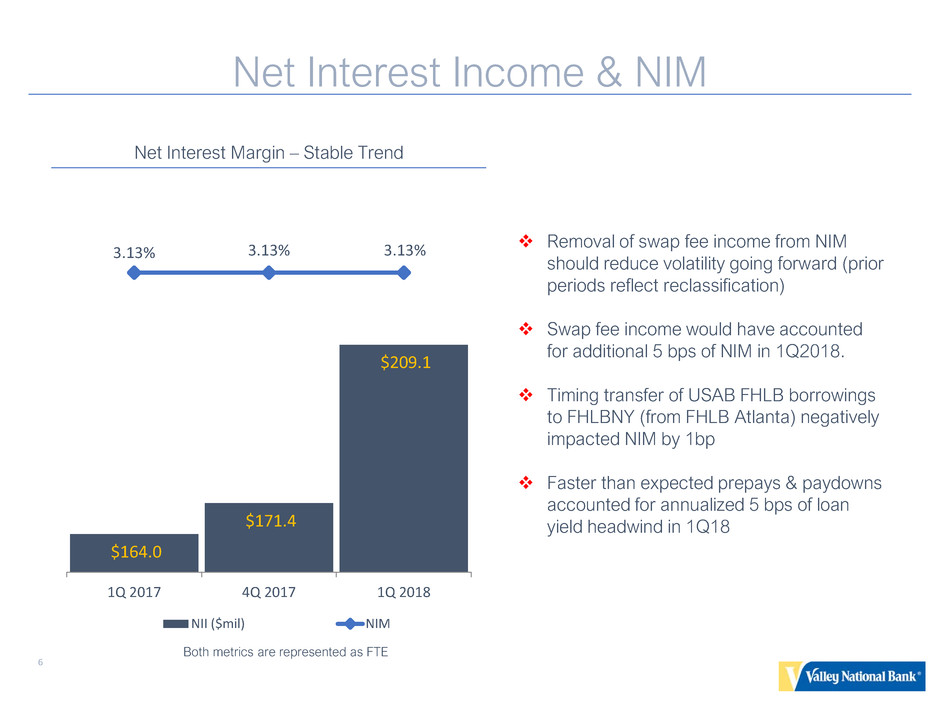
Net Interest Income & NIM 6 $164.0 $171.4 $209.1 3.13% 3.13% 3.13% 1Q 2017 4Q 2017 1Q 2018 NII ($mil) NIM Net Interest Margin – Stable Trend Removal of swap fee income from NIM should reduce volatility going forward (prior periods reflect reclassification) Swap fee income would have accounted for additional 5 bps of NIM in 1Q2018. Timing transfer of USAB FHLB borrowings to FHLBNY (from FHLB Atlanta) negatively impacted NIM by 1bp Faster than expected prepays & paydowns accounted for annualized 5 bps of loan yield headwind in 1Q18 Both metrics are represented as FTE

Non-Interest Income 4.3 7.8 7.1 2.5 1.6 1.8 7.8 7.2 7.1 1.8 1.8 2.2 5.2 5.4 7.3 4.1 6.4 6.8 1Q17 4Q17 1Q18 Other BOLI Trust, Investment & Insurance Loan Servicing Fees Service Charges Gain-on-Sale of Loans 7 Fee Income Trend ($mil) Delivering consistent growth and diversification of noninterest income, aided by USAB acquisition in 1Q18 The transfer of swap fee income added an additional $3.3 million to fees for the first quarter of 2018 (prior periods reflect swap income) We believe we are on target to originate > $1.5 billion in residential mortgage purchase loans in 2018 1Other Income includes income from swap fees, credit card fees, net gains/(losses) from sales of assets and securities, FDIC loss-share income/expense (change in FDIC receivable) and other additional sources. $25.7 $30.2 $32.3 1
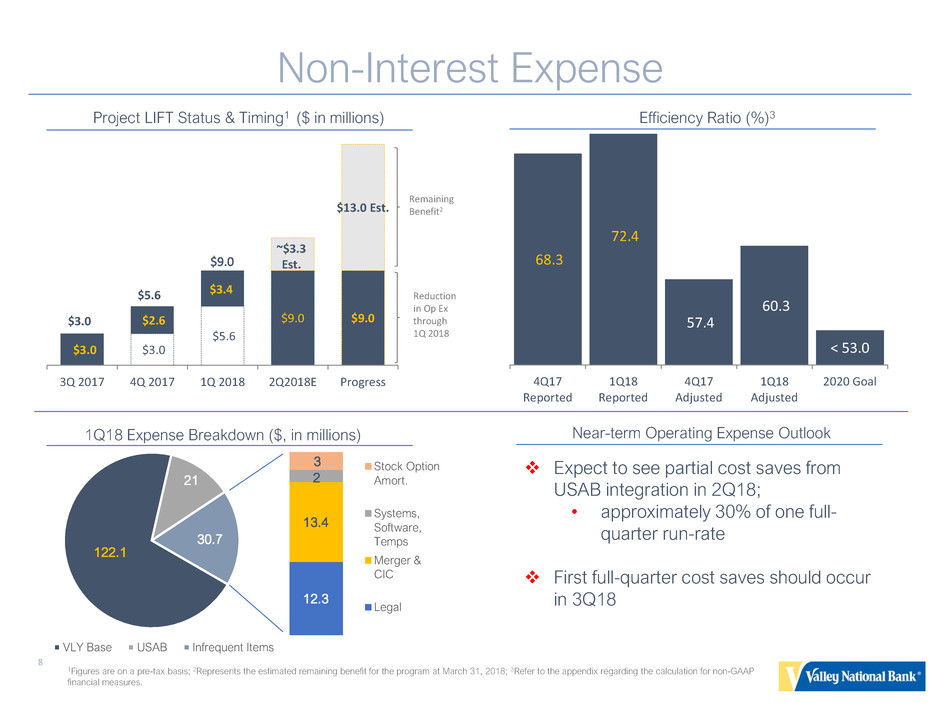
Non-Interest Expense 8 $3.0 $3.0 $2.6 $5.6 $9.0 $9.0 $9.0 $13.0 Est. 3Q 2017 4Q 2017 1Q 2018 2Q2018E Progress Remaining Benefit2 Reduction in Op Ex through 1Q 2018 $3.4 ~$3.3 Est. Project LIFT Status & Timing1 ($ in millions) $5.6 $3.0 68.3 72.4 57.4 60.3 < 53.0 4Q17 Reported 1Q18 Reported 4Q17 Adjusted 1Q18 Adjusted 2020 Goal Efficiency Ratio (%)3 Expect to see partial cost saves from USAB integration in 2Q18; • approximately 30% of one full- quarter run-rate First full-quarter cost saves should occur in 3Q18 1Figures are on a pre-tax basis; 2Represents the estimated remaining benefit for the program at March 31, 2018; 3Refer to the appendix regarding the calculation for non-GAAP financial measures. 1Q18 Expense Breakdown ($, in millions) Near-term Operating Expense Outlook 122.1 21 30.7 VLY Base USAB Infrequent Items 12.3 13.4 2 3 Stock Option Amort. Systems, Software, Temps Merger & CIC Legal

Asset Quality 9 -0.02% -0.02% 0.03% 1Q18 4Q17 1Q17 0.27% 0.26% 0.22% 1Q18 4Q17 1Q17 NCOs/Avg. Loans1 Nonaccruals/Loans 2 Taxi Medallion 3/31/18 12/31/17 Related Reserves as a % of Total Exposure 15.7% 7.7% Total Exposure $136 mil $137 mil Medallions as a % of Total Loans 0.60% 0.75% 1Represents annualized net charge-offs as a percentage of average loans for the period indicated; 2Represents nonaccrual loans as a percentage of total outstanding loans as the period indicated. Total Nonperforming Assets ($mil)Taxi Medallion Update $75.0 $57.5 $51.5 1Q18 4Q17 1Q17

Outlook (Estimates for 2018) • 7-9%, net of loan salesFull-year loan growth • 3.13% (+/- 2 bps) *no longer includes swap related income*2Q18 Net Interest Margin • $550 million (+/- 1%) - Inclusive of USAB operating expenses (excludes merger related charges and infrequent expenses) Full-year Adjusted Operating Expense • Provide phase 1 details during 2Q18 earnings releaseBranch Transformation Update 10
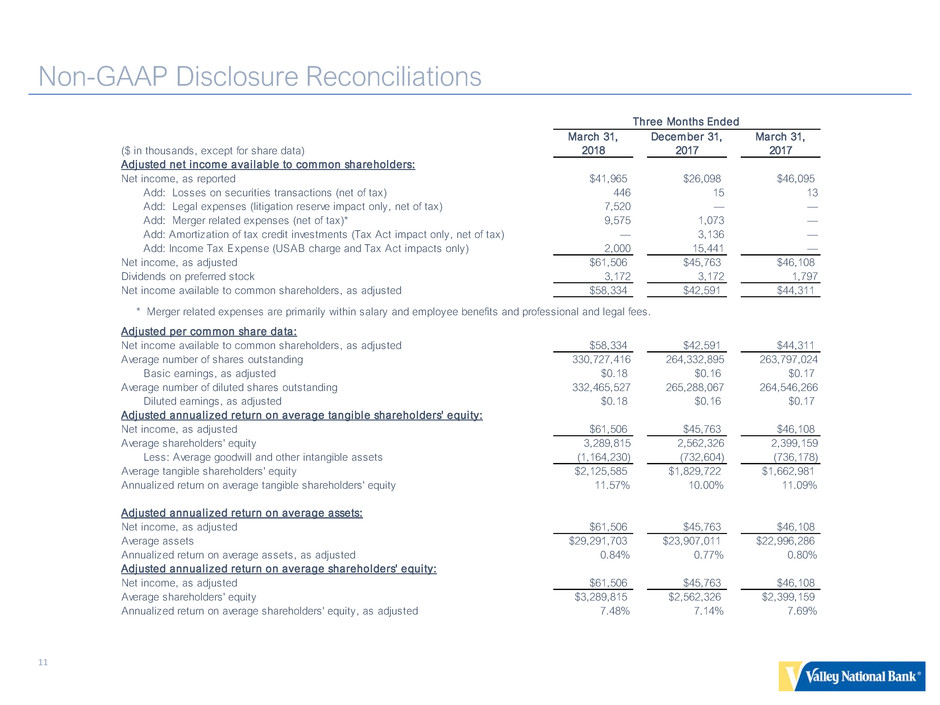
Non-GAAP Disclosure Reconciliations 11 March 31, December 31, March 31, ($ in thousands, except for share data) 2018 2017 2017 Adjusted net income avai lable to common shareholders: Net income, as reported $41,965 $26,098 $46,095 Add: Losses on securities transactions (net of tax) 446 15 13 Add: Legal expenses (litigation reserve impact only, net of tax) 7,520 — — Add: Merger related expenses (net of tax)* 9,575 1,073 — Add: Amortization of tax credit investments (Tax Act impact only, net of tax) — 3,136 — Add: Income Tax Expense (USAB charge and Tax Act impacts only) 2,000 15,441 — Net income, as adjusted $61,506 $45,763 $46,108 Dividends on preferred stock 3,172 3,172 1,797 Net income available to common shareholders, as adjusted $58,334 $42,591 $44,311 * Merger related expenses are primarily within salary and employee benefits and professional and legal fees. Adjusted per common share data: Net income available to common shareholders, as adjusted $58,334 $42,591 $44,311 Average number of shares outstanding 330,727,416 264,332,895 263,797,024 Basic earnings, as adjusted $0.18 $0.16 $0.17 Average number of diluted shares outstanding 332,465,527 265,288,067 264,546,266 Diluted earnings, as adjusted $0.18 $0.16 $0.17 Adjusted annual ized return on average tangible shareholders' equi ty: Net income, as adjusted $61,506 $45,763 $46,108 Average shareholders' equity 3,289,815 2,562,326 2,399,159 Less: Average goodwill and other intangible assets (1,164,230) (732,604) (736,178) Average tangible shareholders' equity $2,125,585 $1,829,722 $1,662,981 Annualized return on average tangible shareholders' equity 11.57% 10.00% 11.09% Adjusted annual ized return on average assets: Net income, as adjusted $61,506 $45,763 $46,108 Average assets $29,291,703 $23,907,011 $22,996,286 Annualized return on average assets, as adjusted 0.84% 0.77% 0.80% Adjusted annual ized return on average shareholders' equi ty: Net income, as adjusted $61,506 $45,763 $46,108 Average shareholders' equity $3,289,815 $2,562,326 $2,399,159 Annualized return on average shareholders' equity, as adjusted 7.48% 7.14% 7.69% Three Months Ended
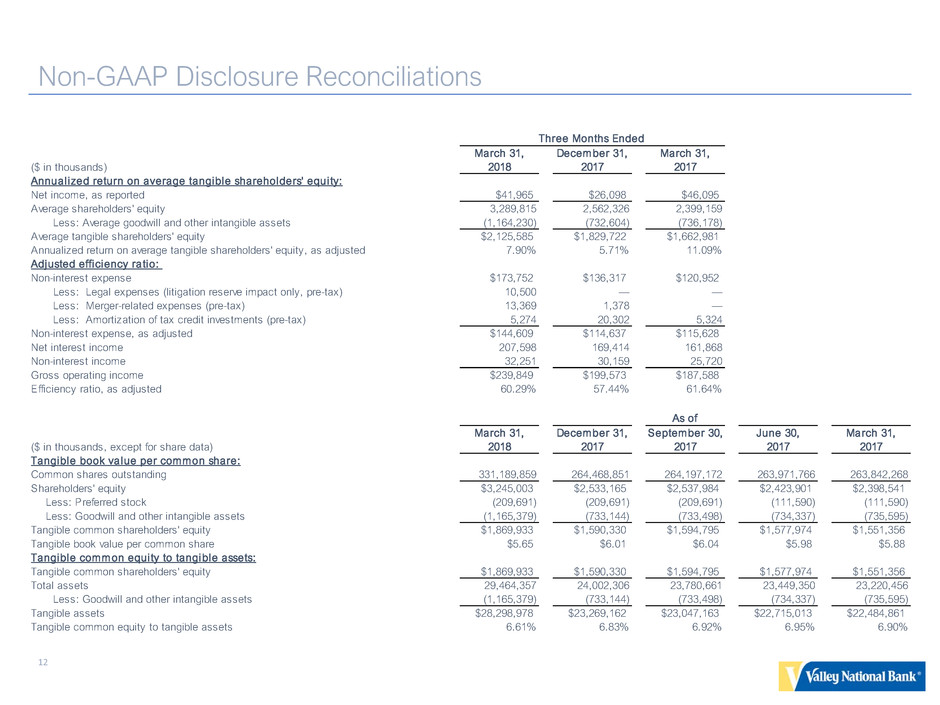
Non-GAAP Disclosure Reconciliations 12 March 31, December 31, March 31, ($ in thousands) 2018 2017 2017 Annual ized return on average tangible shareholders' equi ty: Net income, as reported $41,965 $26,098 $46,095 Average shareholders' equity 3,289,815 2,562,326 2,399,159 Less: Average goodwill and other intangible assets (1,164,230) (732,604) (736,178) Average tangible shareholders' equity $2,125,585 $1,829,722 $1,662,981 Annualized return on average tangible shareholders' equity, as adjusted 7.90% 5.71% 11.09% Adjusted efficiency ratio: Non-interest expense $173,752 $136,317 $120,952 Less: Legal expenses (litigation reserve impact only, pre-tax) 10,500 — — Less: Merger-related expenses (pre-tax) 13,369 1,378 — Less: Amortization of tax credit investments (pre-tax) 5,274 20,302 5,324 Non-interest expense, as adjusted $144,609 $114,637 $115,628 Net interest income 207,598 169,414 161,868 Non-interest income 32,251 30,159 25,720 Gross operating income $239,849 $199,573 $187,588 Efficiency ratio, as adjusted 60.29% 57.44% 61.64% March 31, December 31, September 30, June 30, March 31, ($ in thousands, except for share data) 2018 2017 2017 2017 2017 Tangible book value per common share: Common shares outstanding 331,189,859 264,468,851 264,197,172 263,971,766 263,842,268 Shareholders' equity $3,245,003 $2,533,165 $2,537,984 $2,423,901 $2,398,541 Less: Preferred stock (209,691) (209,691) (209,691) (111,590) (111,590) Less: Goodwill and other intangible assets (1,165,379) (733,144) (733,498) (734,337) (735,595) Tangible common shareholders' equity $1,869,933 $1,590,330 $1,594,795 $1,577,974 $1,551,356 Tangible book value per common share $5.65 $6.01 $6.04 $5.98 $5.88 Tangible common equi ty to tangible assets: Tangible common shareholders' equity $1,869,933 $1,590,330 $1,594,795 $1,577,974 $1,551,356 Total assets 29,464,357 24,002,306 23,780,661 23,449,350 23,220,456 Less: Goodwill and other intangible assets (1,165,379) (733,144) (733,498) (734,337) (735,595) Tangible assets $28,298,978 $23,269,162 $23,047,163 $22,715,013 $22,484,861 Tangible common equity to tangible assets 6.61% 6.83% 6.92% 6.95% 6.90% Three Months Ended As of
For More Information 13 Log onto our website: www.valleynationalbank.com Email requests to: rkraemer@valleynationalbank.com Call Rick Kraemer, Investor Relations Officer, at:(973) 686-4817 Write to: Valley National Bank 1455 Valley Road Wayne, New Jersey 07470 Attn: Rick Kraemer, Investor Relations Officer Log onto our website above or www.sec.gov to obtain free copies of documents filed by Valley with the SEC


