Exhibit 99.1
Lehman Brothers 2004 Financial Services Conference
September 15, 2004
Information For Investors And Shareholders
This presentation contains forward-looking statements concerning Valley’s future business outlook, financial condition and operating results. Generally, the words “will,” “may,” “should,” “continue,” “believes,” “expects,” “anticipates” or similar expressions identify forward-looking statements. Readers are advised not to place undue reliance on these forward-looking statements as they are influenced by certain risk factors and unpredictable events. Factors that could cause actual results to differ materially from those predicted by the forward-looking statements include among others:
1. Increased competitive pressure among banking and/or financial services companies
2. Adverse changes in the interest rate environment, causing reduced interest margins
3. Unexpected changes in the securities market
4. Decline in general economic conditions, whether nationally or in the market areas where Valley operates
5. New legislation or regulatory changes that may disrupt the course of business
6. Tax strategies and effective income tax rates
NOTE: Valley disclaims any obligation to update or revise forward-looking statements based on the occurrence of future events.
2
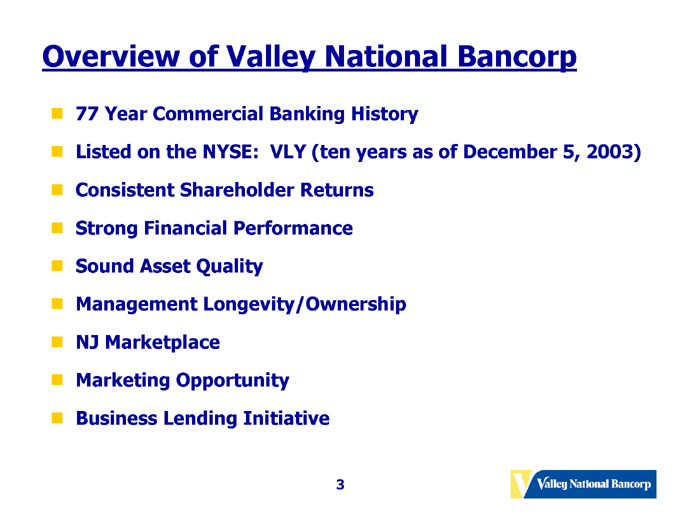
Overview of Valley National Bancorp
77 Year Commercial Banking History
Listed on the NYSE: VLY (ten years as of December 5, 2003)
Consistent Shareholder Returns
Strong Financial Performance
Sound Asset Quality
Management Longevity/Ownership
NJ Marketplace Marketing Opportunity
Business Lending Initiative
3
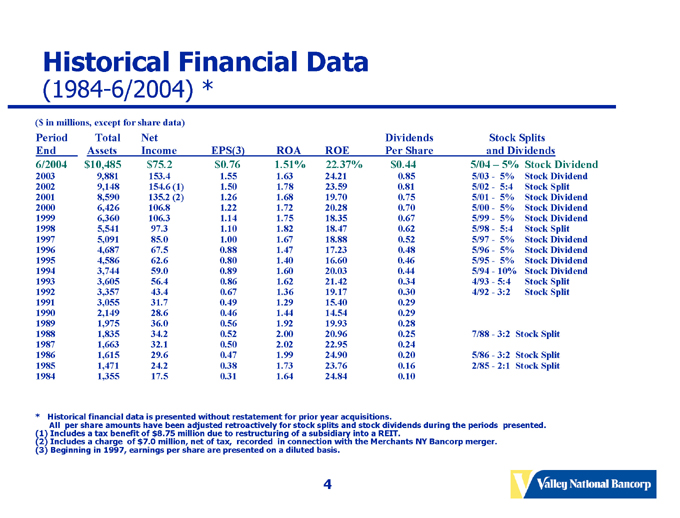
Historical Financial Data
(1984-6/2004) *
($ in millions, except for share data)
Period End Total Assets Net Income EPS(3) ROA ROE Dividends Per Share Stock Splits and Dividends
6/2004 $10,485 $75.2 $0.76 1.51% 22.37% $ 0.44 5/04 – 5% Stock Dividend
2003 9,881 153.4 1.55 1.63 24.21 0.85 5/03 - 5% Stock Dividend
2002 9,148 154.6 (1) 1.50 1.78 23.59 0.81 5/02 - 5:4 Stock Split
2001 8,590 135.2 (2) 1.26 1.68 19.70 0.75 5/01 - 5% Stock Dividend
2000 6,426 106.8 1.22 1.72 20.28 0.70 5/00 - 5% Stock Dividend
1999 6,360 106.3 1.14 1.75 18.35 0.67 5/99 - 5% Stock Dividend
1998 5,541 97.3 1.10 1.82 18.47 0.62 5/98 - 5:4 Stock Split
1997 5,091 85.0 1.00 1.67 18.88 0.52 5/97 - 5% Stock Dividend
1996 4,687 67.5 0.88 1.47 17.23 0.48 5/96 - 5% Stock Dividend
1995 4,586 62.6 0.80 1.40 16.60 0.46 5/95 - 5% Stock Dividend
1994 3,744 59.0 0.89 1.60 20.03 0.44 5/94 - 10% Stock Dividend
1993 3,605 56.4 0.86 1.62 21.42 0.34 4/93 - 5:4 Stock Split
1992 3,357 43.4 0.67 1.36 19.17 0.30 4/92 - 3:2 Stock Split
1991 3,055 31.7 0.49 1.29 15.40 0.29
1990 2,149 28.6 0.46 1.44 14.54 0.29
1989 1,975 36.0 0.56 1.92 19.93 0.28
1988 1,835 34.2 0.52 2.00 20.96 0.25 7/88 - 3:2 Stock Split
1987 1,663 32.1 0.50 2.02 22.95 0.24
1986 1,615 29.6 0.47 1.99 24.90 0.20 5/86 - 3:2 Stock Split
1985 1,471 24.2 0.38 1.73 23.76 0.16 2/85 - 2:1 Stock Split
1984 1,355 17.5 0.31 1.64 24.84 0.10
* Historical financial data is presented without restatement for prior year acquisitions.
All per share amounts have been adjusted retroactively for stock splits and stock dividends during the periods presented. (1) Includes a tax benefit of $8.75 million due to restructuring of a subsidiary into a REIT.
(2) Includes a charge of $7.0 million, net of tax, recorded in connection with the Merchants NY Bancorp merger.
(3) Beginning in 1997, earnings per share are presented on a diluted basis.
4
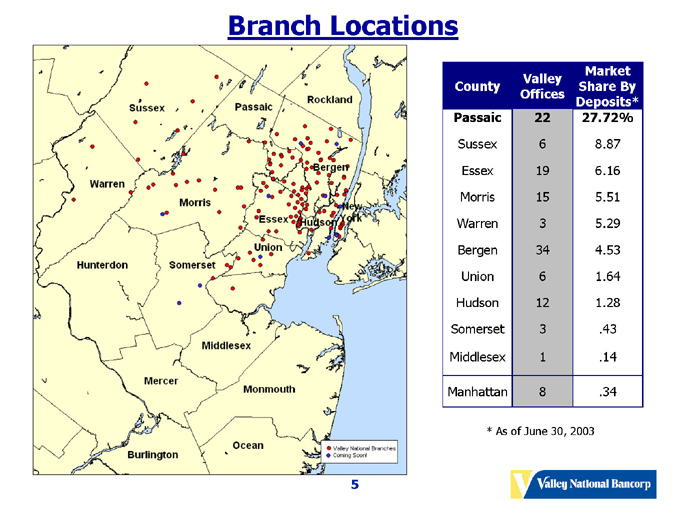
Branch Locations
Market Share By Deposits*
Valley Offices
County
Passaic 22 27.72%
Sussex 6 8.87
Essex 19 6.16
Morris 15 5.51
Warren 3 5.29
Bergen 34 4.53
Union 6 1.64
Hudson 12 1.28
Somerset 3 .43
Middlesex 1 .14
Manhattan 8 .34
* As of June 30, 2003
5
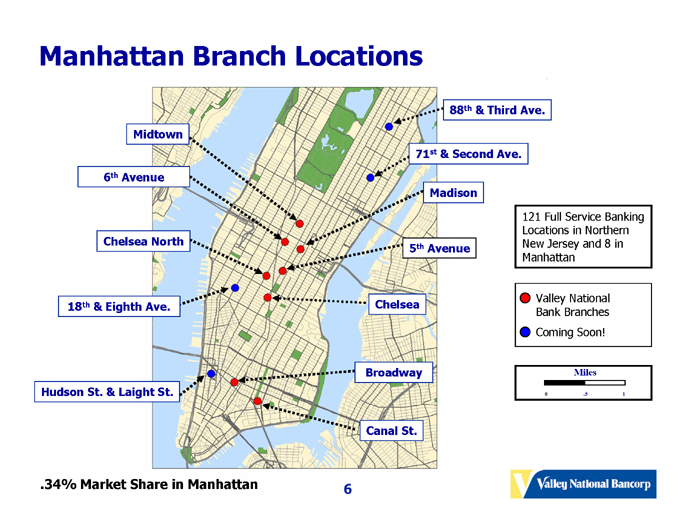
Manhattan Branch Locations
Midtown
6th Avenue
Chelsea North
18th & Eighth Ave.
Hudson St. & Laight St.
88th & Third Ave.
71st & Second Ave.
Madison
5th Avenue
Chelsea
Broadway
Canal St.
121 Full Service Banking Locations in Northern New Jersey and 8 in Manhattan
Valley National Bank Branches Coming Soon!
Miles
0 .5 1
.34% Market Share in Manhattan
6
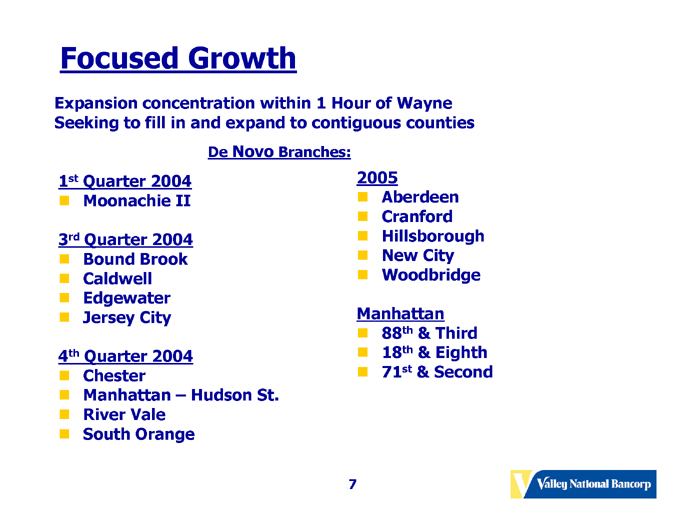
Focused Growth
Expansion concentration within 1 Hour of Wayne Seeking to fill in and expand to contiguous counties
De Novo Branches:
1st Quarter 2004
Moonachie II
3rd Quarter 2004
Bound Brook
Caldwell
Edgewater
Jersey City
4th Quarter 2004
Chester
Manhattan – Hudson St.
River Vale
South Orange
2005
Aberdeen
Cranford
Hillsborough
New City
Woodbridge
Manhattan
88th & Third
18th & Eighth
71st & Second
7
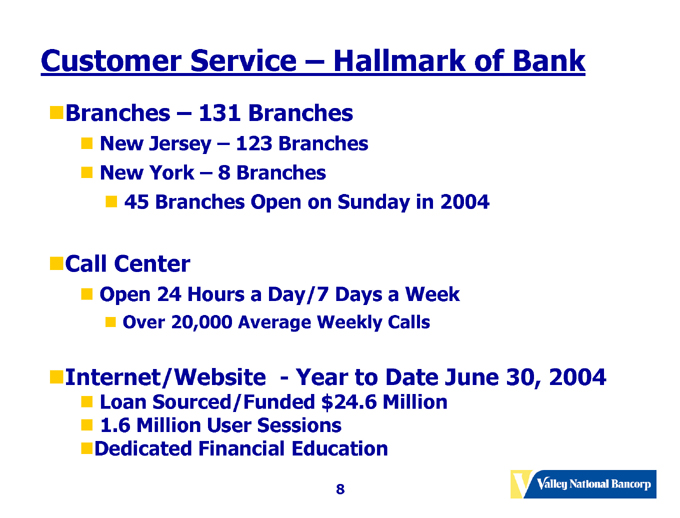
Customer Service – Hallmark of Bank
Branches – 131 Branches
New Jersey – 123 Branches
New York – 8 Branches
45 Branches Open on Sunday in 2004
Call Center
Open 24 Hours a Day/7 Days a Week
Over 20,000 Average Weekly Calls
Internet/Website—Year to Date June 30, 2004
Loan Sourced/Funded $24.6 Million
1.6 Million User Sessions
Dedicated Financial Education
8
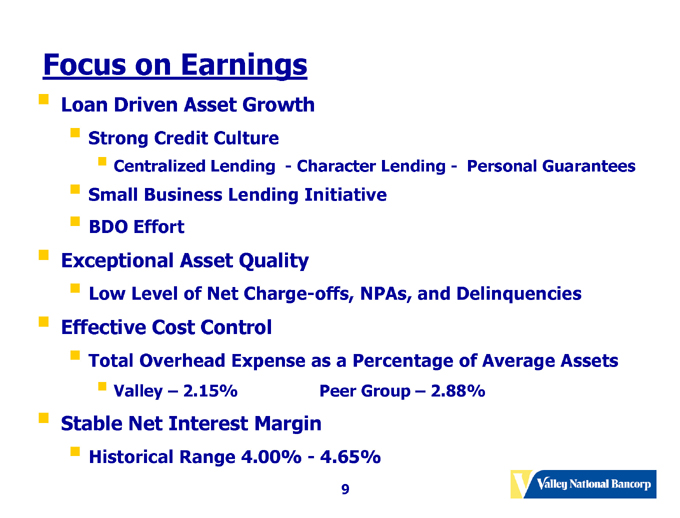
Focus on Earnings
Loan Driven Asset Growth
Strong Credit Culture
Centralized Lending - Character Lending - Personal Guarantees
Small Business Lending Initiative
BDO Effort
Exceptional Asset Quality
Low Level of Net Charge-offs, NPAs, and Delinquencies
Effective Cost Control
Total Overhead Expense as a Percentage of Average Assets
Valley – 2.15% Peer Group – 2.88%
Stable Net Interest Margin
Historical Range 4.00% - 4.65%
9
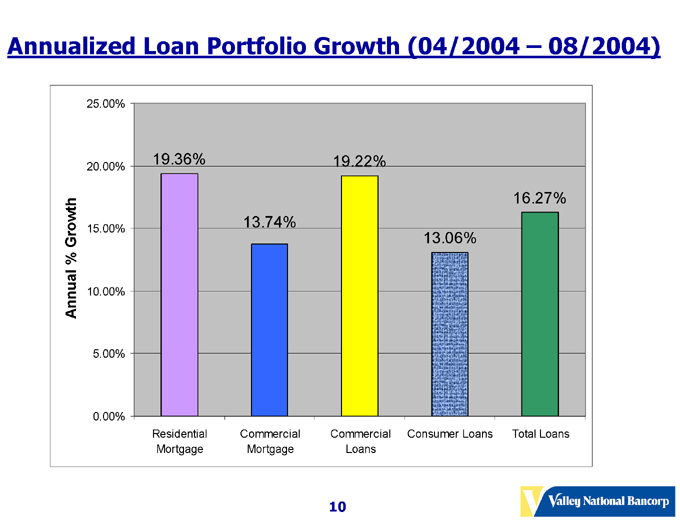
Annualized Loan Portfolio Growth (04/2004 – 08/2004)
Annual % Growth
25.00% 20.00% 15.00% 10.00% 5.00% 0.00%
Residential Mortgage Commercial Mortgage Commercial Loans Consumer Loans Total Loans
19.36% 13.74% 19.22% 13.06% 16.27%
10
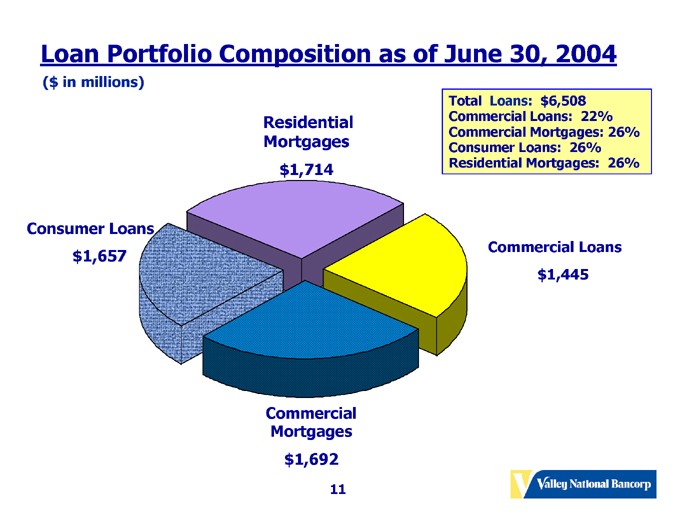
Loan Portfolio Composition as of June 30, 2004
($ in millions)
Total Loans: $6,508
Commercial Loans: 22%
Commercial Mortgages: 26%
Consumer Loans: 26%
Residential Mortgages: 26%
Residential Mortgages $1,714
Consumer Loans $1,657
Commercial Mortgages $1,692
Commercial Loans $1,445
11
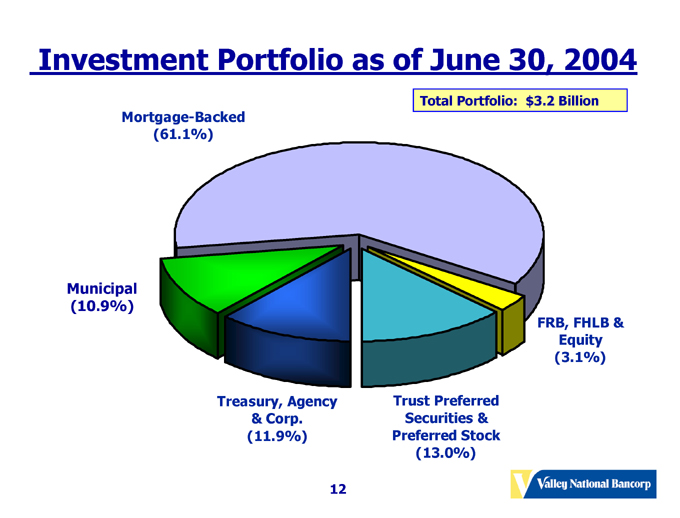
Investment Portfolio as of June 30, 2004
Mortgage-Backed (61.1%)
Total Portfolio: $3.2 Billion
Municipal (10.9%)
Treasury, Agency & Corp. (11.9%)
Trust Preferred Securities & Preferred Stock (13.0%)
FRB, FHLB & Equity (3.1%)
12
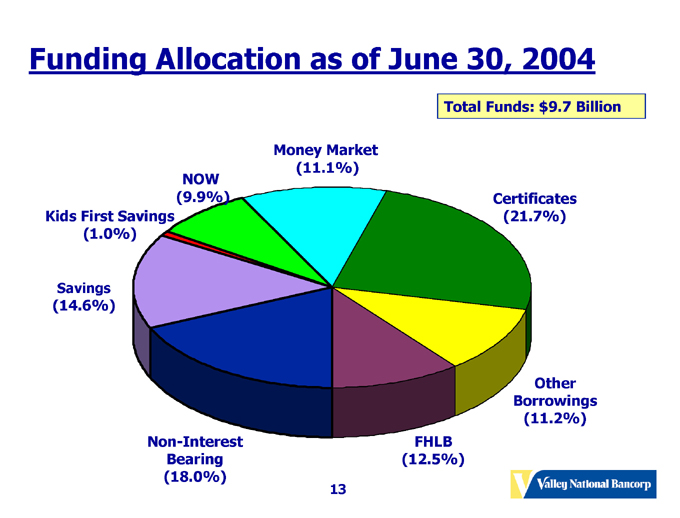
Funding Allocation as of June 30, 2004
Total Funds: $9.7 Billion
Money Market (11.1%)
NOW (9.9%)
Kids First Savings (1.0%)
Savings (14.6%)
Non-Interest Bearing (18.0%)
Certificates (21.7%)
Borrowings (11.2%)
FHLB (12.5%)
13
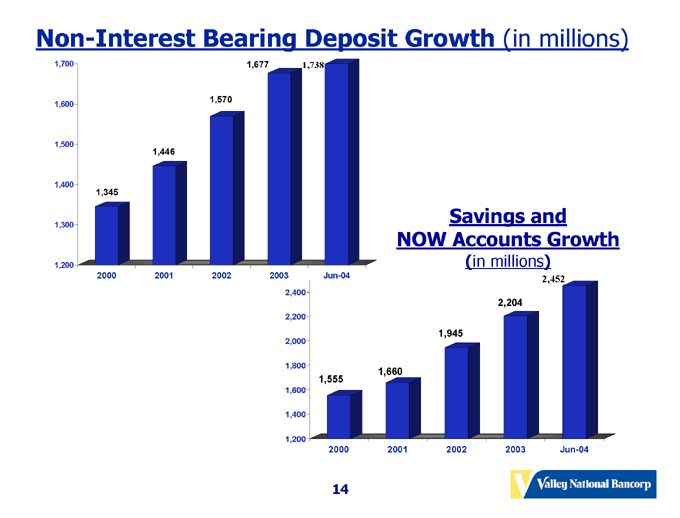
Non-Interest Bearing Deposit Growth (in millions)
1,700 1,600 1,500 1,400 1,300 1,200
1,345 1,446 1,570 1,677 1,738
Savings and NOW Accounts Growth
(in millions)
2000 2001 2002 2003 Jun-04
2,400 2,200 2,000 1,800 1,600 1,400 1,200
2000 2001 2002 2003 Jun-04
1,555 1,660 1,945 2,204 2,452
14
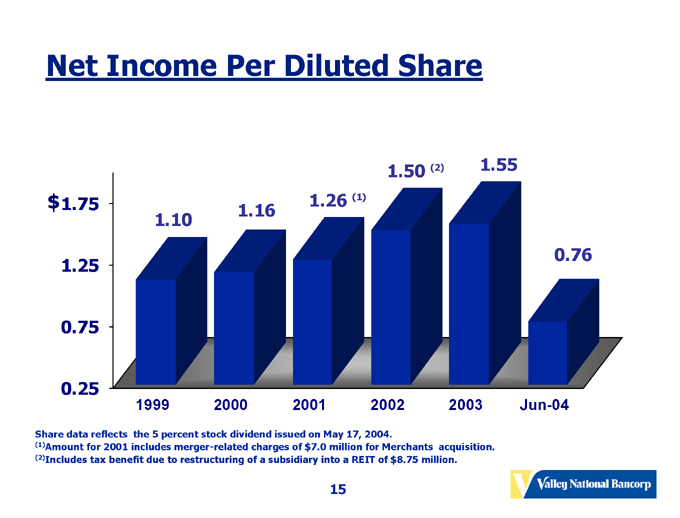
Net Income Per Diluted Share
$1.75 1.25 0.75 0.25
1.10 1.16 1.26 (1) 1.50 (2) 1.55 0.76
1999 2000 2001 2002 2003 Jun-04
Share data reflects the 5 percent stock dividend issued on May 17, 2004.
(1)Amount for 2001 includes merger-related charges of $7.0 million for Merchants acquisition.
(2)Includes tax benefit due to restructuring of a subsidiary into a REIT of $8.75 million.
15
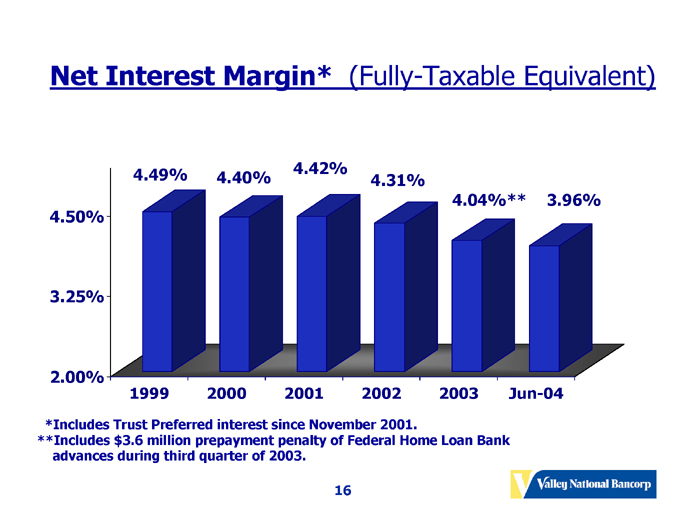
Net Interest Margin* (Fully-Taxable Equivalent)
4.50% 3.25% 2.00%
4.49% 4.40% 4.42% 4.31% 4.04%** 3.96%
1999 2000 2001 2002 2003 Jun-04
*Includes Trust Preferred interest since November 2001.
**Includes $3.6 million prepayment penalty of Federal Home Loan Bank advances during third quarter of 2003.
16
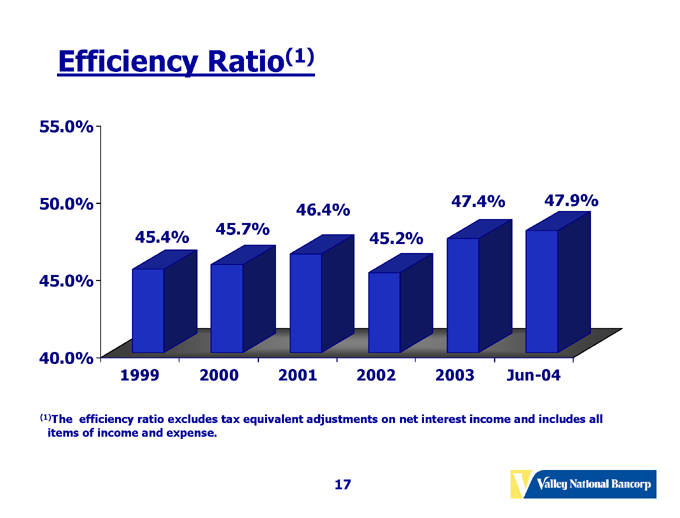
Efficiency Ratio(1)
55.0% 50.0% 45.0% 40.0%
45.4% 45.7% 46.4% 45.2% 47.4% 47.9%
1999 2000 2001 2002 2003 Jun-04
(1)The efficiency ratio excludes tax equivalent adjustments on net interest income and includes all items of income and expense.
17
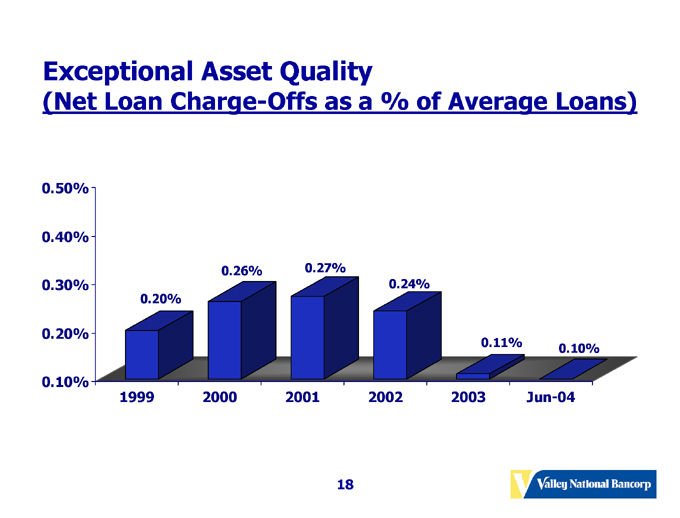
Exceptional Asset Quality
(Net Loan Charge-Offs as a % of Average Loans)
0.50% 0.40% 0.30% 0.20% 0.10%
1999 2000 2001 2002 2003 Jun-04
0.20% 0.26% 0.27% 0.24% 0.11% 0.10%
18
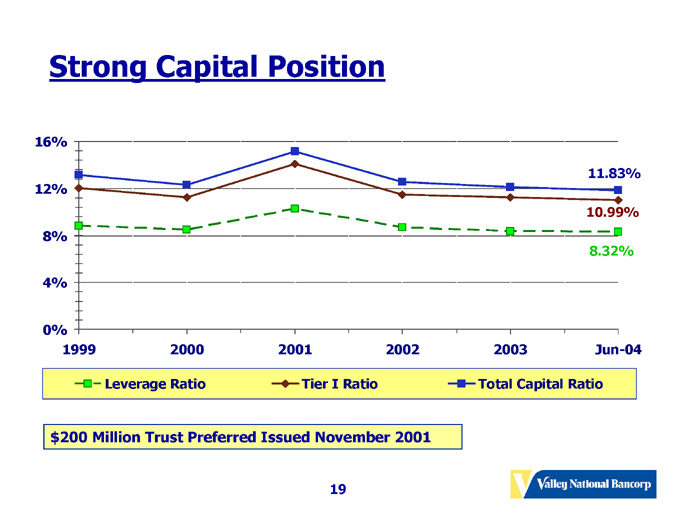
Strong Capital Position
16% 12% 8% 4% 0%
1999 2000 2001 2002 2003 Jun-04
11.83%
10.99%
8.32%
Leverage Ratio Tier I Ratio Total Capital Ratio
$200 Million Trust Preferred Issued November 2001
19
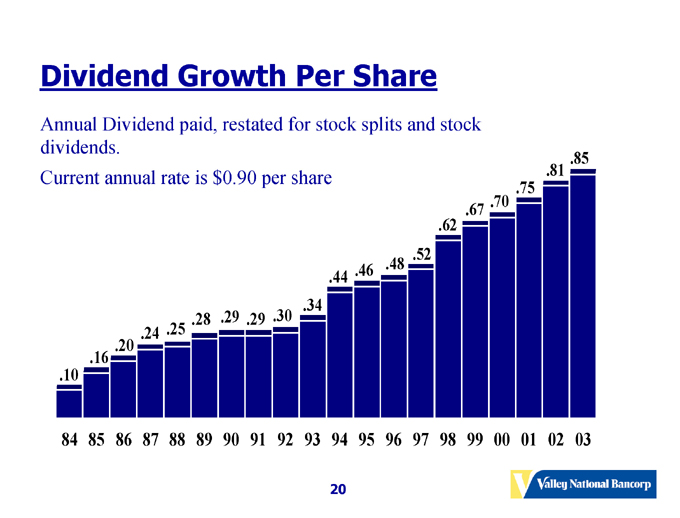
Dividend Growth Per Share
Annual Dividend paid, restated for stock splits and stock dividends.
Current annual rate is $0.90 per share
.10 .16 .20 .24 .25 .28 .29 .29 .30 .34 .44 .46 .48 .52 .62 .67 .70 .75 .81 .85
84 85 86 87 88 89 90 91 92 93 94 95 96 97 98 99 00 01 02 03
20
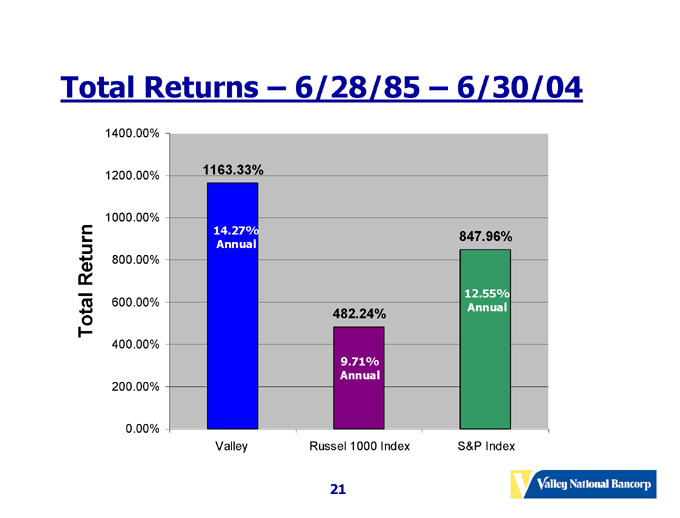
Total Returns – 6/28/85 – 6/30/04
Total Return
1400.00% 1200.00% 1000.00% 800.00% 600.00% 400.00% 200.00% 0.00%
1163.33%
14.27% Annual
847.96%
12.55% Annual
482.24%
9.71% Annual
Valley Russel 1000 Index S&P Index
21
Valley Goals
Maintain Exceptional Asset Quality
Plan to Open Approximately Ten New Branches Annually
Increase Market Share
Grow Core Deposits With Focus on Demand Deposits
Expand Non-Interest Income Sources
Seek to Maintain ROAA of at least 1.50% and keep ROAE over 20%
Emphasize Business Lending
Take Advantage of Changing Market in NJ
Objective Towards Independence
22
For More Information On Valley National Bank
Log onto our web site: www.valleynationalbank.com
Visit our kids site: www.vnbkids.com
E-mail requests to: dgrenz@valleynationalbank.com
Call Shareholder Relations at: (973) 305-3380
Write to: Valley National Bank
1455 Valley Road
Wayne, New Jersey 07470
Attn: Dianne M. Grenz, Senior Vice President Director of Shareholder & Public Relations
Log onto www.sec.gov to obtain free copies of documents filed by Valley with the SEC
23