EXHIBIT 99.1
Valley National Bancorp
Investor Presentation
September 14, 2005
Information For Investors And Shareholders
This presentation contains forward looking statements concerning Valley’s future business outlook, financial condition and operating results. Generally, the words “will,” “may,” “should,” “continue,” “believes,” “expects,” “anticipates” or similar expressions identify forward looking statements. Readers are advised not to place undue reliance on these forward looking statements as they are influenced by certain risk factors and unpredictable events. Factors that could cause actual results to differ materially from those predicted by the forward looking statements include among others:
Increased competitive pressure among banking and/or financial services companies
Adverse changes in the interest rate environment, causing reduced interest margins
Unexpected changes in the debt securities market
Decline in general economic conditions, whether nationally or in the market areas where Valley operates
New legislation or regulatory changes that may disrupt the course of business
The disallowance of prior tax strategies and increases in the effective income tax rate
NOTE: Valley disclaims any obligation to update or revise forward looking statements for any reason.
1
Overview of Valley National Bancorp
78 Year Commercial Banking History
Listed on the NYSE: VLY (eleven years as of December 5, 2004)
Consistent Shareholder Returns
Strong Financial Performance
Sound Asset Quality
Management Longevity/Ownership
Marketplace
Marketing Opportunity
Business Lending Initiative
2
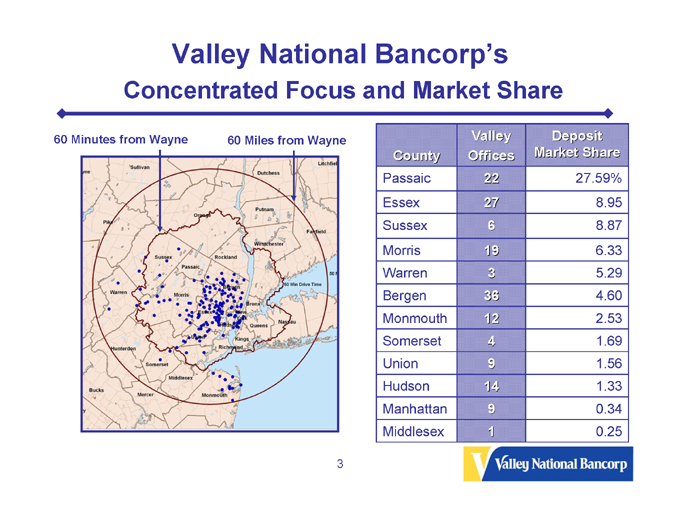
Valley National Bancorp’s
Concentrated Focus and Market Share
60 Minutes from Wayne
60 Miles from Wayne
County
Valley Offices
Deposit Market Share
Passaic
22
27.59%
Essex
27
8.95
Sussex
6
8.87
Morris
19
6.33
Warren
3
5.29
Bergen
36
4.60
Monmouth
12
2.53
Somerset
4
1.69
Union
9
1.56
Hudson
14
1.33
Manhattan
9
0.34
Middlesex
1
0.25
3
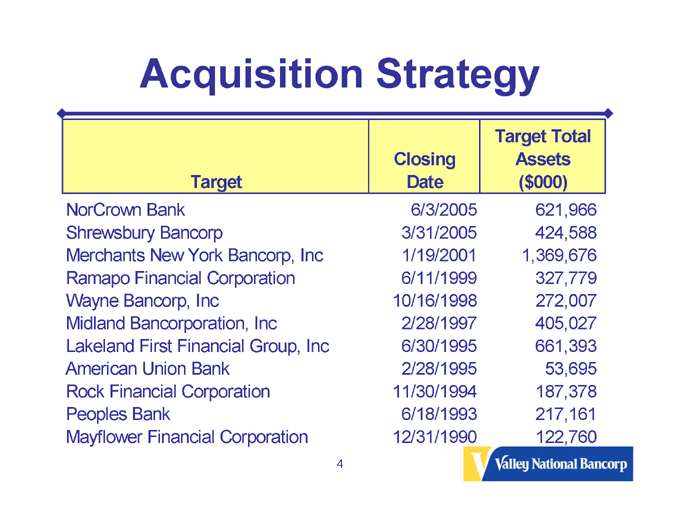
Acquisition Strategy
Target
Closing Date
Target Total Assets ($000)
NorCrown Bank
6/3/2005
621,966
Shrewsbury Bancorp
3/31/2005
424,588
Merchants New York Bancorp, Inc
1/19/2001
1,369,676
Ramapo Financial Corporation
6/11/1999
327,779
Wayne Bancorp, Inc
10/16/1998
272,007
Midland Bancorporation, Inc
2/28/1997
405,027
Lakeland First Financial Group, Inc
6/30/1995
661,393
American Union Bank
2/28/1995
53,695
Rock Financial Corporation
11/30/1994
187,378
Peoples Bank
6/18/1993
217,161
Mayflower Financial Corporation
12/31/1990
122,760
4
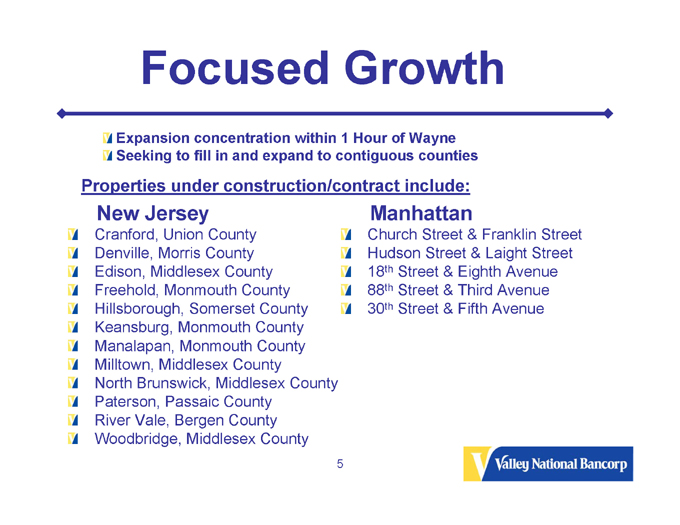
Focused Growth
Expansion concentration within 1 Hour of Wayne
Seeking to fill in and expand to contiguous counties
Properties under construction/contract include:
New Jersey
Cranford, Union County
Denville, Morris County
Edison, Middlesex County
Freehold, Monmouth County
Hillsborough, Somerset County
Keansburg, Monmouth County
Manalapan, Monmouth County
Milltown, Middlesex County
North Brunswick, Middlesex County
Paterson, Passaic County
River Vale, Bergen County
Woodbridge, Middlesex County
Manhattan
Church Street & Franklin Street
Hudson Street & Laight Street
18th Street & Eighth Avenue
88th Street & Third Avenue
30th Street & Fifth Avenue
5
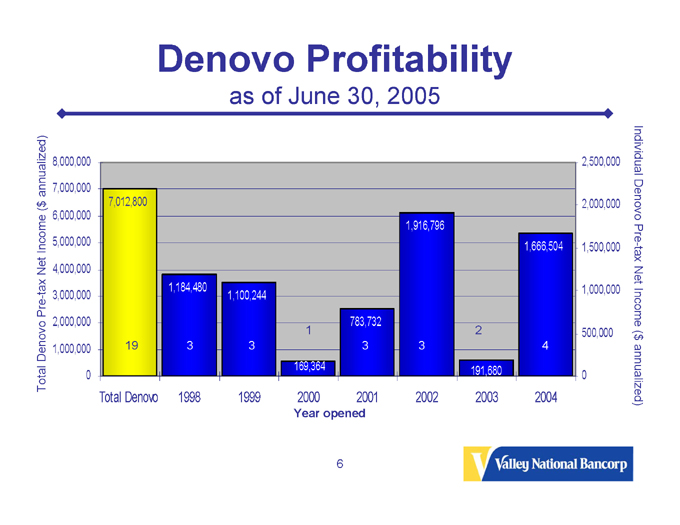
Denovo Profitability
as of June 30, 2005
Total Denovo Pre-tax Net Income ($ annualized)
8,000,000
7,000,000
6,000,000
5,000,000
4,000,000
3,000,000
2,000,000
1,000,000
0
7,012,800
19
Total Denovo
1,184,480
3
1998
1,100,244
3
1999
1
169,364
2000
783,732
3
2001
1,916,796
3
2002
2
191,680
2003
1,666,504
4
2004
2,500,000
2,000,000
1,500,000
1,000,000
500,000
0
Individual Denovo Pre-tax Net Income ($ annualized)
Year opened
6

Total Loan Portfolio Composition
as of June 30, 2005
Total Loans $ 6,934
Pre-merger
25%
26%
24%
25%
Commercial Loans
Residential Mortgages
Total Loans $ 7,845
Post-merger
28%
26%
23%
23%
Commercial Mortgages
Consumer Loans
($ in millions)
7
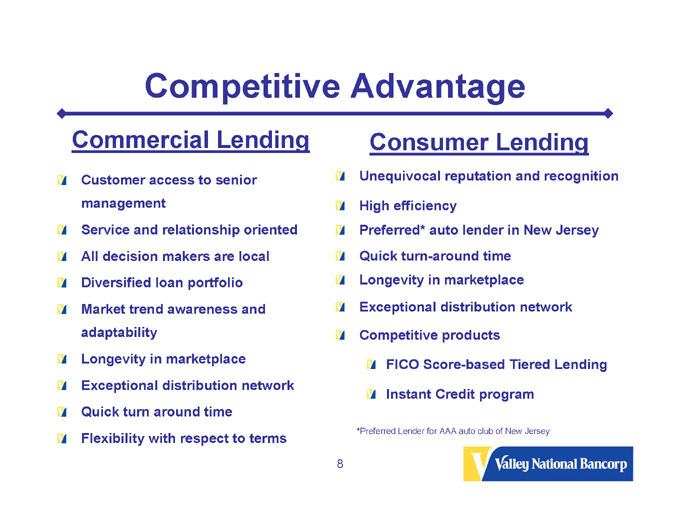
Competitive Advantage
Commercial Lending
Customer access to senior management
Service and relationship oriented
All decision makers are local
Diversified loan portfolio
Market trend awareness and adaptability
Longevity in marketplace
Exceptional distribution network
Quick turn around time
Flexibility with respect to terms
Consumer Lending
Unequivocal reputation and recognition
High efficiency
Preferred* auto lender in New Jersey
Quick turn-around time
Longevity in marketplace
Exceptional distribution network
Competitive products
FICO Score-based Tiered Lending
Instant Credit program
*Preferred Lender for AAA auto club of New Jersey
8
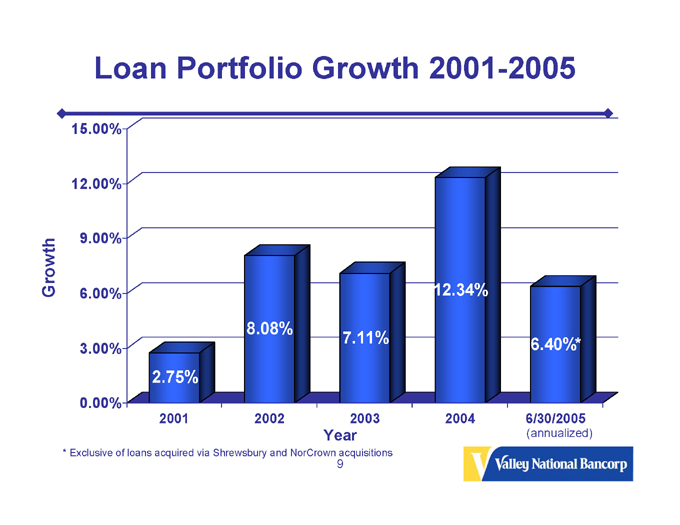
Loan Portfolio Growth 2001-2005
Growth
15.00%
12.00%
9.00%
6.00%
3.00%
0.00%
2.75%
2001
8.08%
2002
7.11%
2003
12.34%
2004
6.40%*
6/30/2005
Year
(annualized)
* Exclusive of loans acquired via Shrewsbury and NorCrown acquisitions
9
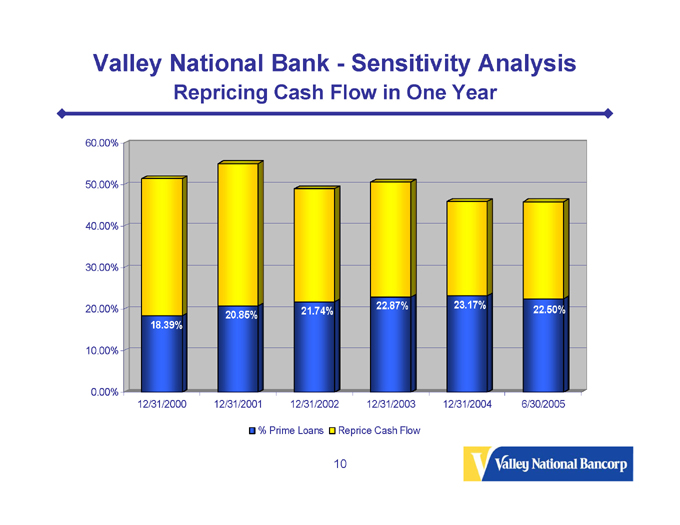
Valley National Bank - Sensitivity Analysis
Repricing Cash Flow in One Year
60.00%
50.00%
40.00%
30.00%
20.00%
10.00%
0.00%
18.39%
12/31/2000
20.85%
12/31/2001
21.74%
12/31/2002
22.87%
12/31/2003
23.17%
12/31/2004
22.50%
6/30/2005
% Prime Loans
Reprice Cash Flow
10
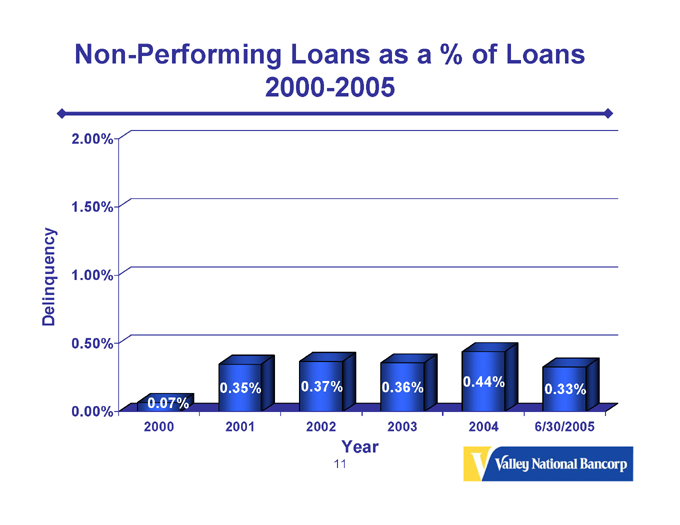
Non-Performing Loans as a % of Loans
2000-2005
Delinquency
2.00%
1.50%
1.00%
0.50%
0.00%
0.07%
2000
0.35%
2001
0.37%
2002
0.36%
2003
0.44%
2004
0.33%
6/30/2005
Year
11
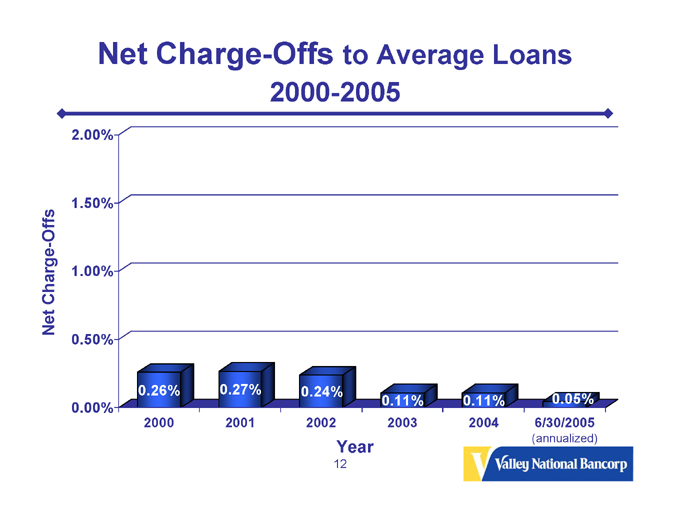
Net Charge-Offs to Average Loans
2000-2005
Net Charge-Offs
2.00%
1.50%
1.00%
0.50%
0.00%
0.26%
2000
0.27%
2001
0.24%
2002
0.11%
2003
0.11%
2004
0.05%
6/30/2005
(annualized)
Year
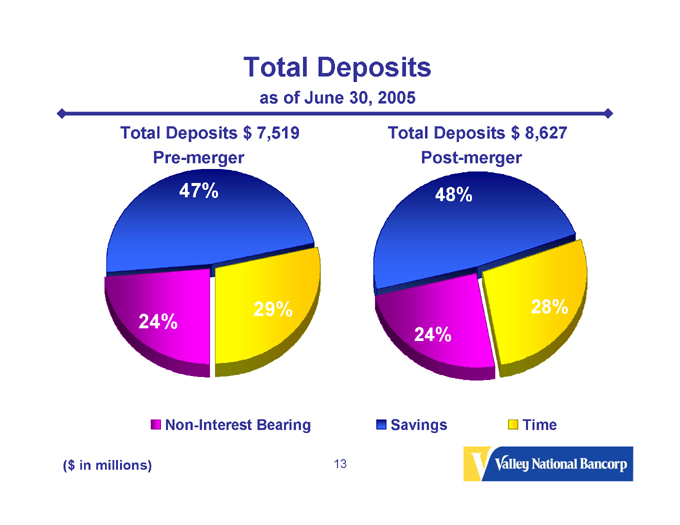
Total Deposits
as of June 30, 2005
Total Deposits $ 7,519
Pre-merger
47%
24%
29%
Non-Interest Bearing
Total Deposits $ 8,627
Post-merger
48%
24%
28%
Savings
Time
($ in millions)
13
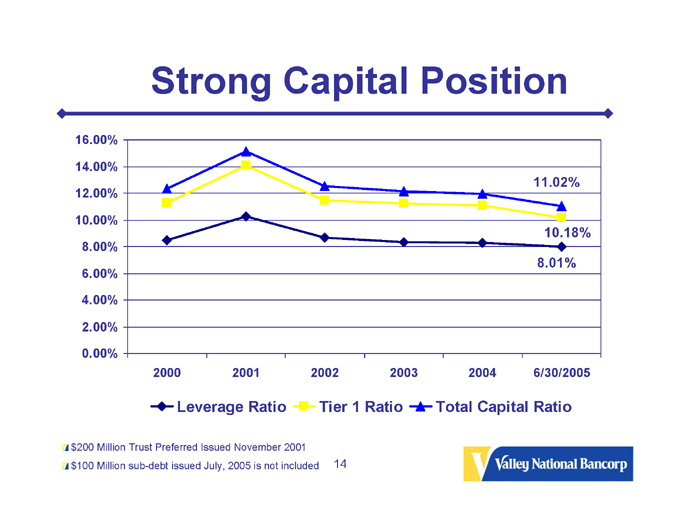
Strong Capital Position
16.00%
14.00%
12.00%
10.00%
8.00%
6.00%
4.00%
2.00%
0.00%
11.02%
10.18%
8.01%
2000
2001
2002
2003
2004
6/30/2005
Leverage Ratio
Tier 1 Ratio
Total Capital Ratio
$200 Million Trust Preferred Issued November 2001
$100 Million sub-debt issued July, 2005 is not included
14
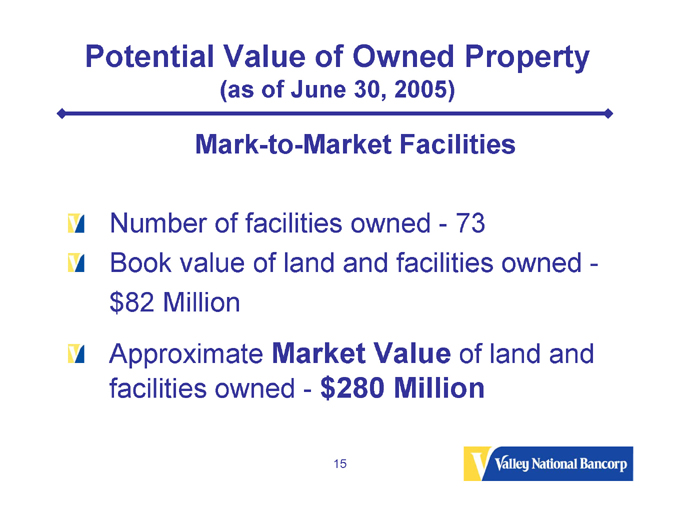
Potential Value of Owned Property
(as of June 30, 2005)
Mark-to-Market Facilities
Number of facilities owned - 73
Book value of land and facilities owned - $82 Million
Approximate Market Value of land and facilities owned - $280 Million
15
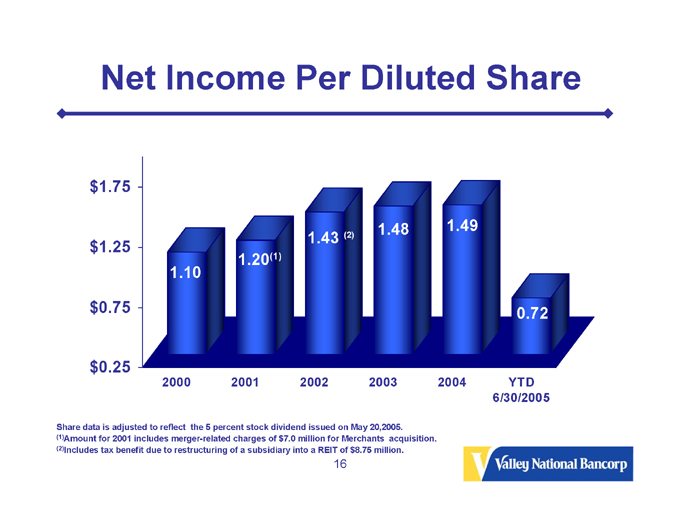
Net Income Per Diluted Share
$1.75
$1.25
$0.75
$0.25
1.10
2000
1.20(1)
2001
1.43(2)
2002
1.48
2003
1.49
2004
0.72
YTD
6/30/2005
Share data is adjusted to reflect the 5 percent stock dividend issued on May 20, 2005.
(1)Amount for 2001 includes merger-related charges of $7.0 million for Merchants acquisition.
(2)Includes tax benefit due to restructuring of a subsidiary into a REIT of $8.75 million.
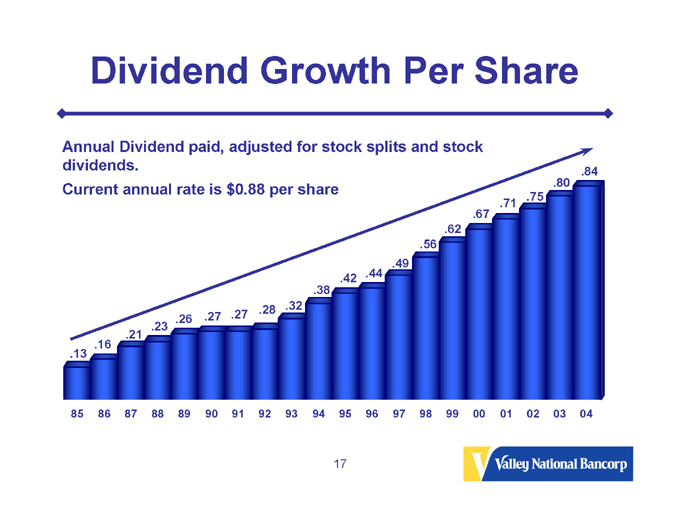
Dividend Growth Per Share
Annual Dividend paid, adjusted for stock splits and stock dividends.
Current annual rate is $0.88 per share
.13
85
.16
86
.21
87
.23
88
.26
89
.27
90
.27
91
.28
92
.32
93
.38
94
.42
95
.44
96
.49
97
.56
98
.62
99
.67
00
.71
01
.75
02
.80
03
.84
04
17
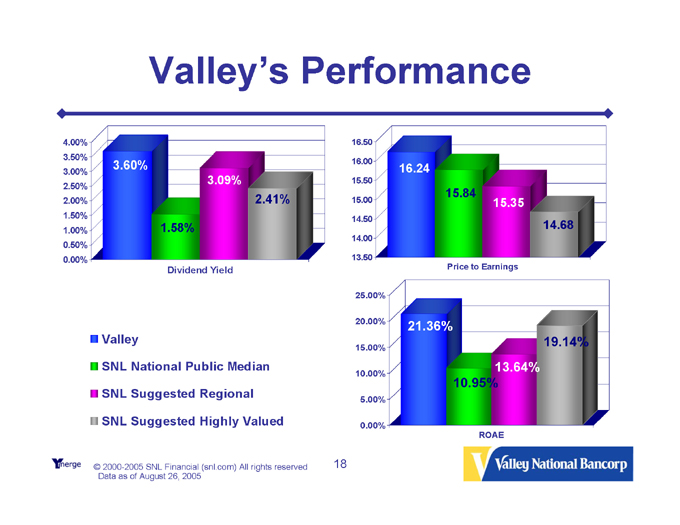
Valley’s Performance
4.00%
3.50%
3.00%
2.50%
2.00%
1.50%
1.00%
0.50%
0.00%
3.60%
1.58%
3.09%
2.41%
Dividend Yield
16.50
16.00
15.50
15.00
14.50
14.00
13.50
16.24
15.84
15.35
14.68
Price to Earnings
Valley
SNL National Public Median
SNL Suggested Regional
SNL Suggested Highly Valued
25.00%
20.00%
15.00%
10.00%
5.00%
0.00%
21.36%
10.95%
13.64%
19.14%
ROAE
© 2000-2005 SNL Financial (snl.com) All rights reserved Data as of August 26, 2005
18
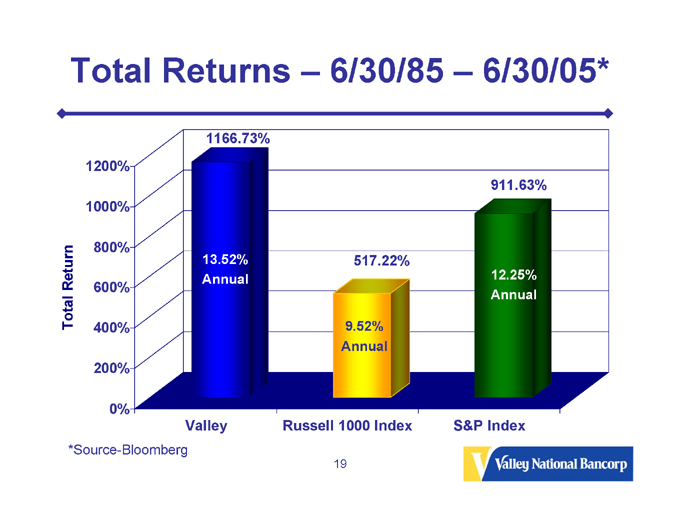
Total Returns – 6/30/85 – 6/30/05*
Total Return
1200%
1000%
800%
600%
400%
200%
0%
1166.73%
13.52%
Annual
Valley
517.22%
9.52%
Annual
Russell 1000 Index
911.63%
12.25%
Annual
S&P Index
*Source-Bloomberg
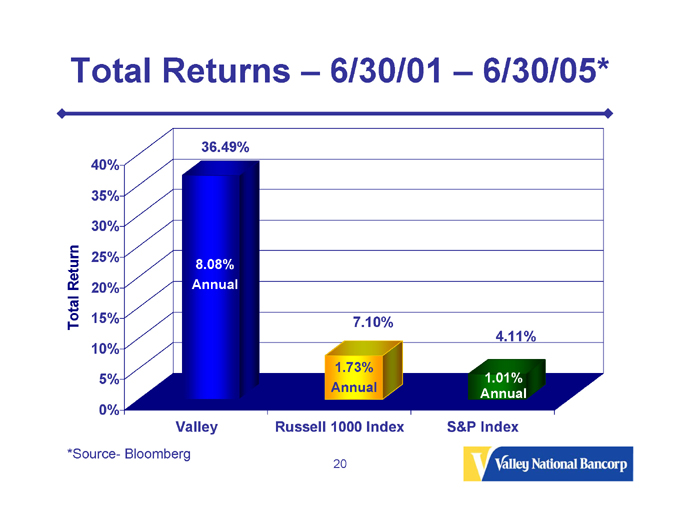
Total Returns – 6/30/01 – 6/30/05*
Total Return
40%
35%
30%
25%
20%
15%
10%
5%
0%
36.49%
8.08%
Annual
Valley
7.10%
1.73%
Annual
Russell 1000 Index
4.11%
1.01%
Annual
S&P Index
*Source- Bloomberg
20
Future Goals
Maintain exceptional asset quality
Remain aggressive and active in the lending community
Emphasize business lending
Take advantage of changing market in the Tri-State area
Focused growth within sixty miles of Valley’s headquarters through new branches and acquisitions of other financial institutions with a similar customer culture
21
For More Information
Log onto our web site: www.valleynationalbank.com
Visit our kids site: www.vnbkids.com
E-mail requests to: dgrenz@valleynationalbank.com
Call Shareholder Relations at: (973) 305-3380
Write to: Valley National Bank
1455 Valley Road
Wayne, New Jersey 07470
Attn: Dianne M. Grenz, Senior Vice President
Director of Shareholder & Public Relations
Log onto www.sec.gov to obtain free copies of documents filed by Valley with the SEC
22