 Merrill Lynch Investor Luncheon May 4, 2006 Exhibit 99.1 |
 2 This presentation contains forward looking statements concerning Valley’s future business outlook, financial condition and operating results. Generally, the words "will," "may," "should," "continue," "believes," "expects," "anticipates" or similar expressions identify forward looking statements. Readers are advised not to place undue reliance on these forward looking statements as they are influenced by certain risk factors and unpredictable events. Factors that could cause actual results to differ materially from those predicted by the forward looking statements include among others: unanticipated changes in the direction of interest rates; competition from banks and other financial institutions; changes in loan, investment and mortgage prepayment assumptions; insufficient allowance for loan losses; relationships with major customers; changes in effective income tax rates; higher or lower cash flow levels than anticipated; inability to hire and retain qualified employees; slowdown in levels of deposit growth; a decline in the economy in New Jersey and New York; a decrease in loan origination volume; a change in legal and regulatory barriers including issues related to AML/BSA compliance; the development of new tax strategies or the disallowance of prior tax strategies; unanticipated litigation pertaining to fiduciary responsibility; and retention of loans, deposits, customers and staff from Valley’s acquisition of Shrewsbury and NorCrown during 2005. NOTE: Valley disclaims any obligation to update or revise forward looking statements for any reason. Information For Investors And Shareholders |
 3 Overview of Valley National Bancorp 79 Year Commercial Banking History Listed on the NYSE: VLY (twelve years as of December 5, 2005) Consistent Shareholder Returns Strong Financial Performance Sound Asset Quality Management Longevity/Ownership Big Bank – Act Like Small Bank Marketplace |
     4 60 Miles from Wayne 60 Minutes from Wayne Valley National Bancorp’s Concentrated Focus and Market Share 1 As of March 31, 2006 2 June 2005 Total Deposits Merrill Lynch Bank and Trust, Metlife Inc. and TD Waterhouse bank were adjusted from county totals. 5.10 154 NJ Footprint 0.26 9 Manhattan 0.43 1 Middlesex 1.42 10 Union 6.45 19 Morris 9.11 27 Essex 2.74 12 Monmouth 2.08 13 Hudson 3.77 4 Somerset 4.68 37 Bergen 5.09 3 Warren 9.48 6 Sussex 25.73% 22 Passaic Market Share by Deposits² Valley Offices¹ County 5.10 154 NJ Footprint 0.26 9 Manhattan 0.43 1 Middlesex 1.42 10 Union 6.45 19 Morris 9.11 27 Essex 2.74 12 Monmouth 2.08 13 Hudson 3.77 4 Somerset 4.68 37 Bergen 5.09 3 Warren 9.48 6 Sussex 25.73% 22 Passaic Market Share by Deposits² Valley Offices¹ County |
 5 Focused Growth Branches under Development New Jersey Edison, Middlesex County Freehold, Monmouth County Hackensack, Bergen County Highlands, Monmouth County Hillsborough, Somerset County Keansburg, Monmouth County Manalapan, Monmouth County Milltown, Middlesex County North Brunswick, Middlesex County (2) Paterson, Passaic County Piscataway, Middlesex County Upper Montclair, Essex County Woodbridge, Middlesex County Expansion concentration within 1 Hour of Wayne Seeking to fill in and expand to contiguous counties, including Kings and Queens Counties, NY Properties under construction/contract include: Manhattan Church Street & Franklin Street Hudson Street & Laight Street 18 th Street & Eighth Avenue 88 th Street & Third Avenue Brooklyn 61 st Street & 18th Avenue |
 6 26% 23% 23% 28% Commercial & Construction Loans Commercial Mortgages Residential Mortgages Consumer Loans ($ in millions) Total Loans $8,161 Total Loan Portfolio Composition as of March 31, 2006 |
 7 Valley National Bank - Sensitivity Analysis Repricing Loan Cash Flow in One Year 20.92% 22.68% 22.33% 23.39% 22.08% 20.95% 0.00% 10.00% 20.00% 30.00% 40.00% 50.00% 60.00% 2001 2002 2003 2004 2005 3/31/2006 Prime-Based Loans Reprice Cash Flow |
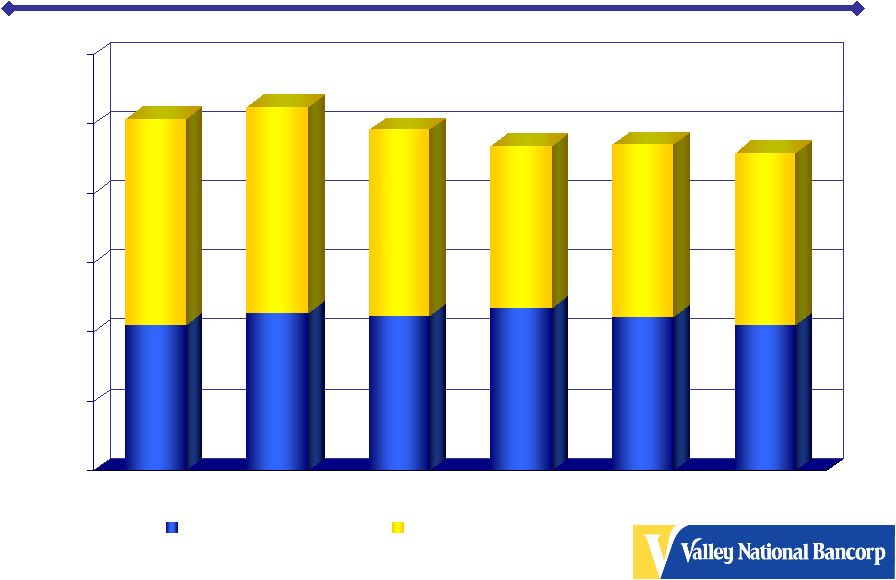
 8 Loan Portfolio Growth 2001- 2005 2.30% 8.13% 7.81% 12.41% 17.29% 0.00% 3.00% 6.00% 9.00% 12.00% 15.00% 18.00% 2001 2002 2003 2004 2005* * Includes loans acquired in connection with the Shrewsbury and NorCrown acquisitions totaling approximately $276 million and $413 million, respectively. |
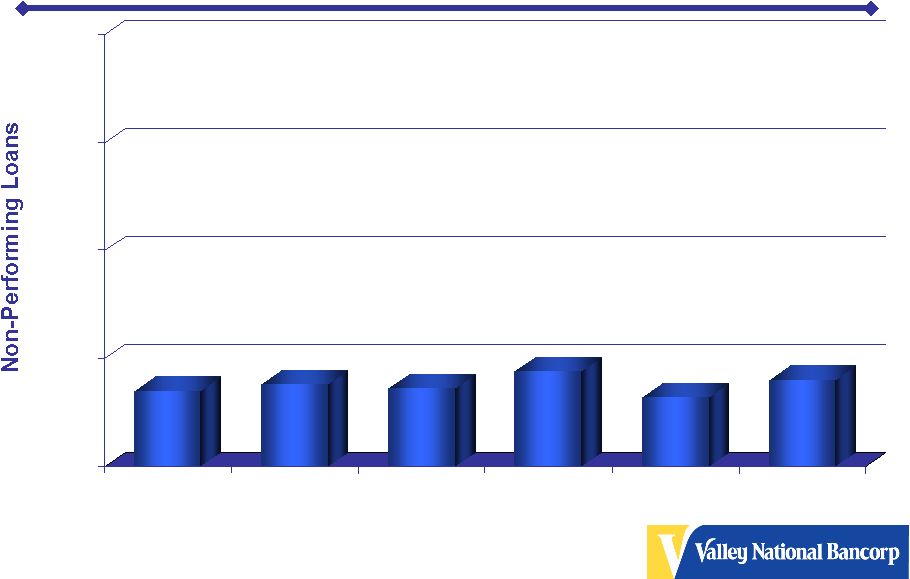 9 Non-Performing Loans as a % of Loans 2001- 3/31/2006 0.35% 0.38% 0.36% 0.44% 0.32% 0.40% 0.00% 0.50% 1.00% 1.50% 2.00% 2001 2002 2003 2004 2005 3/31/2006 (annualized) |
 10 Net Charge-Offs to Average Loans 2001- 3/31/2006 0.27% 0.24% 0.11% 0.11% 0.05% 0.03% 0.00% 0.50% 1.00% 1.50% 2.00% 2001 2002 2003 2004 2005 3/31/2006 (annualized) |
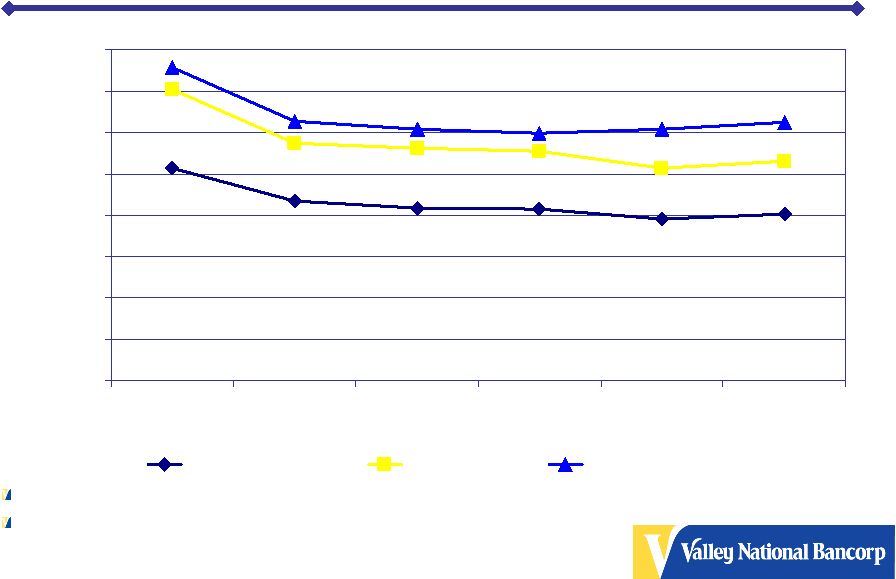
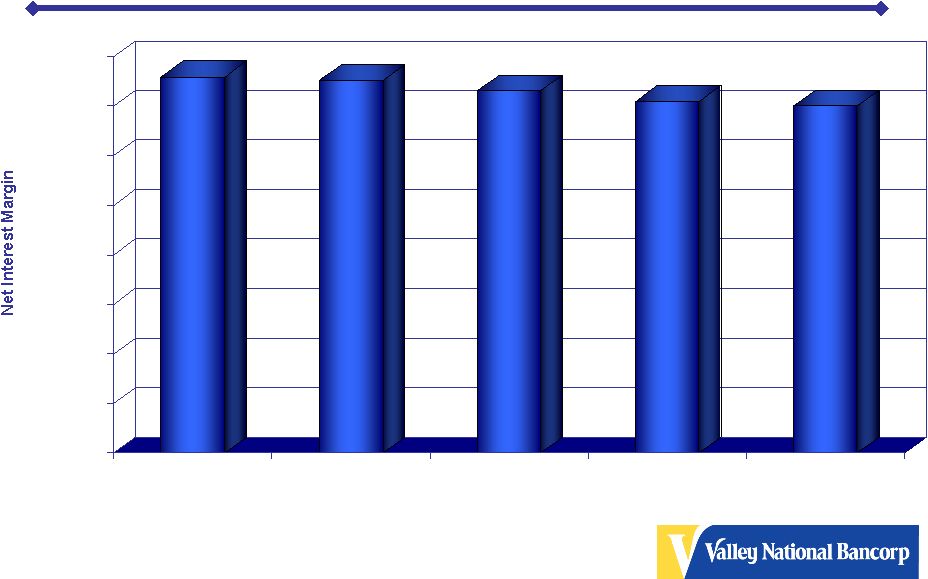 11 Net Interest Margin Trend Net Interest Margin is presented on a tax equivalent basis using a 35% tax rate 3.80% 3.76% 3.66% 3.55% 3.50% 0.00% 0.50% 1.00% 1.50% 2.00% 2.50% 3.00% 3.50% 4.00% 6/30/2005 9/30/2005 12/31/2005 3/31/2006 3/31/2005 |
 12 As the slope of the yield curve steepens, Valley’s Net Interest Margin will increase. With the expiration of a cash flow hedge on August 1, 2006, Net Interest Margin will increase 4bps annually. Yields on loans originated in the first quarter of 2006 were 33 bps higher than loans originated in the fourth quarter of 2005, while the rate paid on deposits was only 3 bps higher. Net Interest Margin Trend |
 13 Strong Capital Position Includes $200 Million Trust Preferred Issued November 2001. Total Capital Ratio Includes $100 Million Sub-debt Issued July 2005. 8.1% 10.6% 12.5% 0.00% 2.00% 4.00% 6.00% 8.00% 10.00% 12.00% 14.00% 16.00% 2001 2002 2003 2004 2005 3/31/2006 Leverage Ratio Tier 1 Ratio Total Capital Ratio |
 14 Unrealized Capital Position (as of March 31, 2006) Marked-to-Market Facilities Number of facilities owned - 74 Approximate book value of facilities owned * $82 Million Approximate Market Value of Facilities owned - $280 Million |
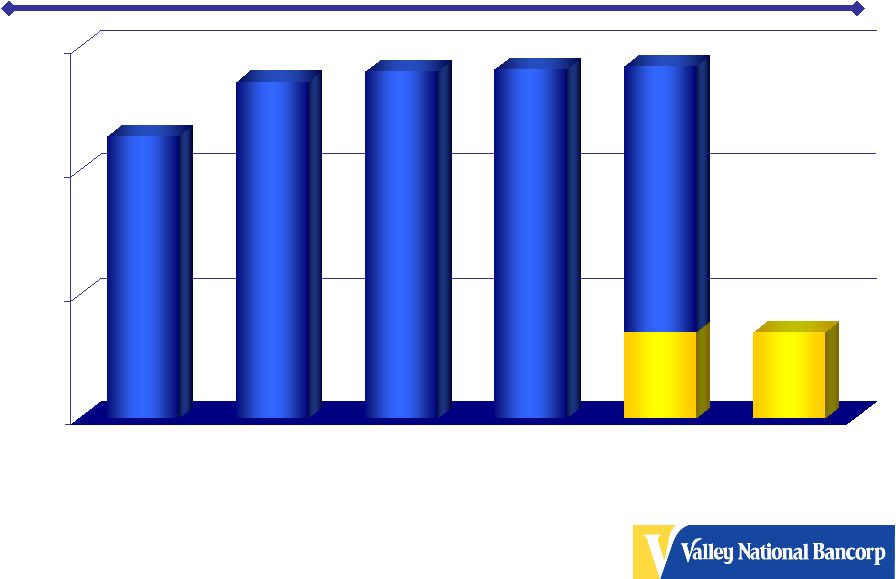 15 Net Income Per Diluted Share 1.14 (1) 1.36 (2) 1.40 1.41 0.35 1.42 0.35 $0.00 $0.50 $1.00 $1.50 2001 2002 2003 2004 2005 3/31/2006 All share data is adjusted to reflect a 5 percent stock dividend to be issued on May 22, 2006. (1) Amount for 2001 includes merger-related charges of $7.0 million for Merchants acquisition. (2) Includes tax benefit due to restructuring of a subsidiary into a REIT of $8.75 million. as of 3/31/05 |
 16 Peer Groups Institution Asset Size as of 12/31/05 Peer Group 1 ($5 billion - $15 billion) (in $000s) First Citizens BancShares, Inc. Raleigh NC 14,639,392 City National Corporation Beverly Hills CA 14,581,860 South Financial Group, Inc. Greenville SC 14,318,910 Commerce Bancshares, Inc. Kansas City MO 13,885,545 TCF Financial Corporation Wayzata MN 13,365,360 Fulton Financial Corporation Lancaster PA 12,403,681 Investors Financial Services Corp. Boston MA 12,096,393 BancorpSouth, Inc. Tupelo MS 11,769,164 Cullen/Frost Bankers, Inc. San Antonio TX 11,741,437 Wilmington Trust Corporation Wilmington DE 10,228,135 Bank of Hawaii Corporation Honolulu HI 10,187,038 FirstMerit Corporation Akron OH 10,161,317 Whitney Holding Corporation New Orleans LA 10,109,006 First Republic Bank San Francisco CA 9,319,910 Old National Bancorp Evansville IN 8,492,022 Corus Bankshares, Inc. Chicago IL 8,458,740 Trustmark Corporation Jackson MS 8,389,750 East West Bancorp, Inc. San Marino CA 8,278,256 UMB Financial Corporation Kansas City MO 8,247,789 Wintrust Financial Corporation Lake Forest IL 8,177,042 UCBH Holdings, Inc. San Francisco CA 7,962,583 Citizens Banking Corporation Flint MI 7,751,883 Sterling Financial Corporation Spokane WA 7,558,928 Susquehanna Bancshares, Inc. Lititz PA 7,466,007 First Midwest Bancorp, Inc. Itasca IL 7,210,151 Greater Bay Bancorp E. Palo Alto CA 7,116,325 Pacific Capital Bancorp Santa Barbara CA 6,876,159 United Bankshares, Inc. Charleston WV 6,728,492 Irwin Financial Corporation Columbus IN 6,646,524 Texas Regional Bancshares, Inc. McAllen TX 6,588,319 Chittenden Corporation Burlington VT 6,464,670 Headquarters Institution Asset Size as of 12/31/05 Peer Group 1 ($5 billion - $15 billion) (in $000s) Cathay General Bancorp, Inc. Los Angeles CA 6,373,313 Provident Bankshares Corporation Baltimore MD 6,354,952 Republic Bancorp Inc. Owosso MI 6,081,766 First Commonwealth Financial Corp. Indiana PA 6,026,320 Hancock Holding Company Gulfport MS 5,950,187 Alabama National BanCorporation Birmingham AL 5,931,673 United Community Banks, Inc. Blairsville GA 5,865,756 MB Financial, Inc. Chicago IL 5,714,131 F.N.B. Corporation Hermitage PA 5,590,326 SVB Financial Group Santa Clara CA 5,541,715 Park National Corporation Newark OH 5,436,048 CVB Financial Corp. Ontario CA 5,422,971 Umpqua Holdings Corporation Portland OR 5,360,639 AMCORE Financial, Inc. Rockford IL 5,344,902 Central Pacific Financial Corp. Honolulu HI 5,239,139 Westamerica Bancorporation San Rafael CA 5,149,209 Boston Private Financial Holdings, Inc. Boston MA 5,134,065 Peer Group 2 ($15 billion - $40 billion) (in $000s) Associated Banc-Corp Green Bay WI 22,100,082 BOK Financial Corporation Tulsa OK 16,252,907 Colonial BancGroup, Inc. Montgomery AL 21,426,197 Commerce Bancorp, Inc. Cherry Hill NJ 38,466,037 Compass Bancshares, Inc. Birmingham AL 30,798,232 First Horizon National Corporation Memphis TN 36,579,061 Huntington Bancshares Incorporated Columbus OH 32,764,805 Mellon Financial Corporation Pittsburgh PA 38,678,000 Mercantile Bankshares Corporation Baltimore MD 16,421,729 Sky Financial Group, Inc. Bowling Green OH 15,683,291 Synovus Financial Corp. Columbus GA 27,626,723 TD Banknorth Inc. Portland ME 32,095,353 Webster Financial Corporation Waterbury CT 17,824,391 Headquarters |
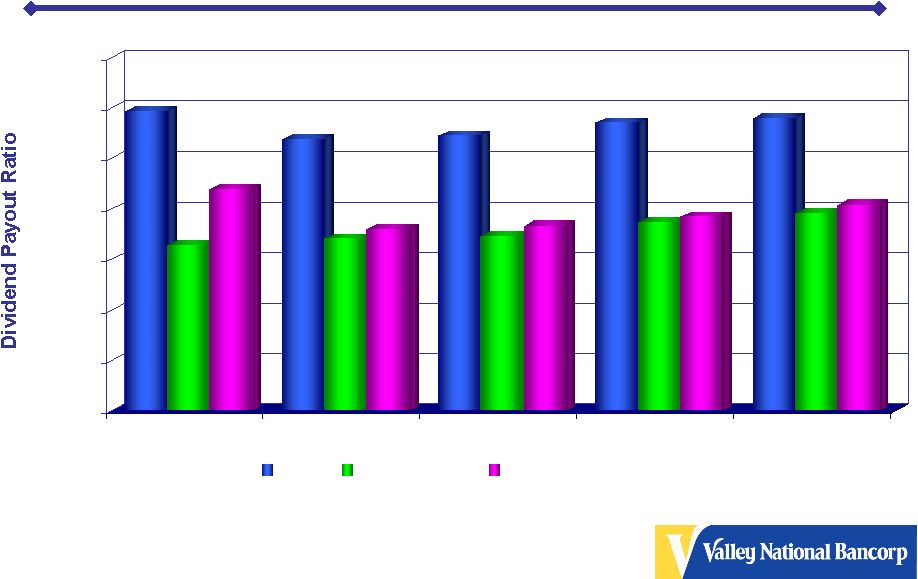 17 Dividend Payout Ratio Comparison 59.40% 32.81% 43.85% 53.80% 34.07% 36.00% 54.60% 34.52% 36.65% 57.05% 37.28% 38.40% 58.00% 39.10% 40.79% 0.00% 10.00% 20.00% 30.00% 40.00% 50.00% 60.00% 70.00% 2001 2002 2003 2004 2005 Valley Peer Group 1 Peer Group 2 |
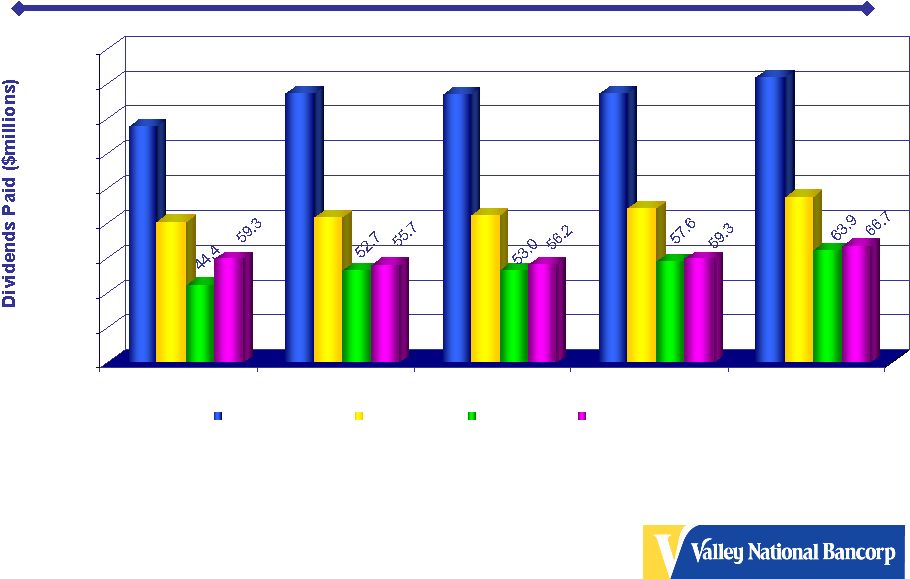 18 Actual Valley Dividends Paid vs. Peer Group Proforma 135.2 80.3 154.6 83.2 153.4 83.8 154.4 88.1 163.4 94.8 0.0 20.0 40.0 60.0 80.0 100.0 120.0 140.0 160.0 180.0 2001 2002 2003 2004 2005 Valley Net Income Valley Payout Peer Group 1 Peer Group 2 |
 19 .16 .21 .23 .25 .26 .26 .27 .30 .36 .40 .42 .47 .53 .59 .64 .67 .72 .76 .80 .83 86 87 88 89 90 91 92 93 94 95 96 97 98 99 00 01 02 03 04 05 Annual Dividend paid, adjusted for stock splits and stock dividends. Current annual rate is $0.86 per share Dividend Growth Per Share |
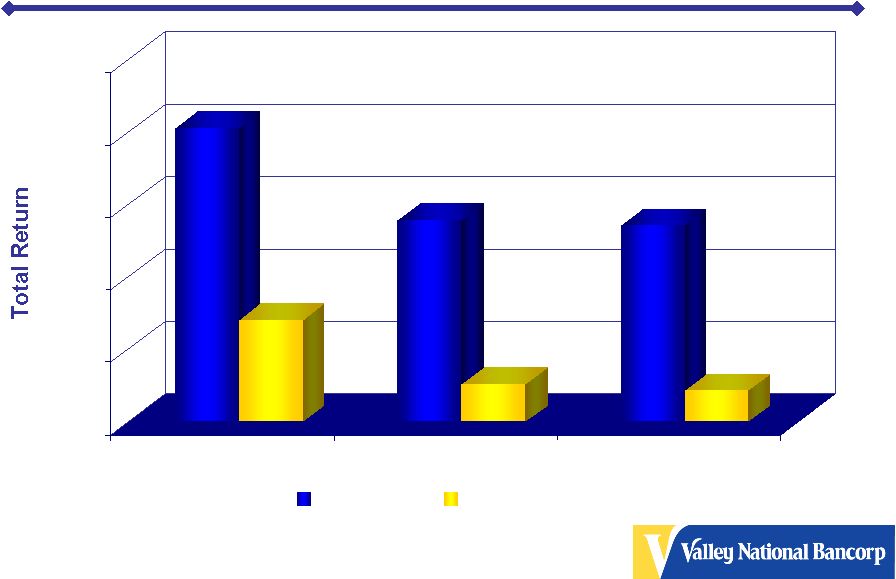 20 Total Returns – 3/31/96 – 3/31/06* 203.45% 70.38% 139.90% 26.37% 135.67% 21.46% 0% 50% 100% 150% 200% 250% Valley Russell 1000 Index S&P Index 10 Years 5 Years 11.73% Annual *Source- Bloomberg 11.23% Annual 9.13% Annual 4.79% Annual 8.94% Annual 3.96% Annual |
 21 For More Information Log onto our web site: www.valleynationalbank.com Visit our kids site: www.vnbkids.com E-mail requests to: dgrenz@valleynationalbank.com Call Shareholder Relations at: (973) 305-3380 Write to: Valley National Bank 1455 Valley Road Wayne, New Jersey 07470 Attn: Dianne M. Grenz, Senior Vice President Director of Shareholder & Public Relations Log onto our website above or www.sec.gov to obtain free copies of documents filed by Valley with the SEC |