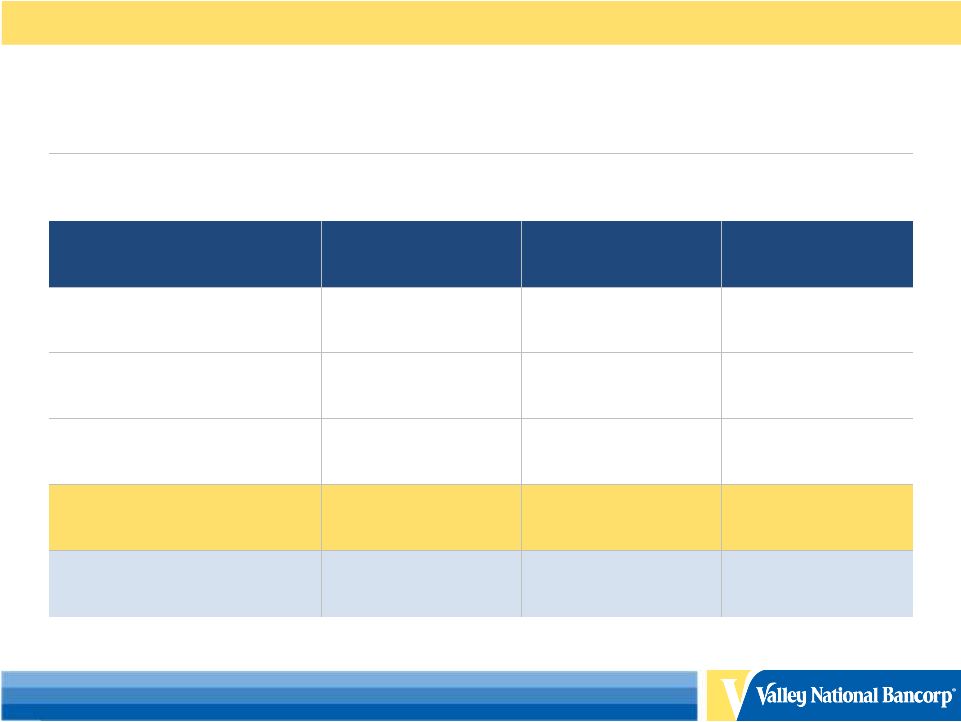
© 2013 Valley National Bank. Member FDIC. Equal Opportunity Lender. All Rights Reserved. Shareholder Returns 16 Historical Financial Data (1) (Dollars in millions, except for share data) 2013 16,157 $ 132.0 $ $0.66 0.83 % 8.69 % $0.60 N/A N/A 2012 16,013 143.6 0.73 0.91 9.57 0.65 5/12 - 5% Stock Dividend 2011 14,253 132.5 0.74 0.93 10.11 0.66 5/11 - 5% Stock Dividend 2010 14,151 130.0 0.73 0.92 10.23 0.65 5/10 - 5% Stock Dividend 2009 14,291 114.8 0.57 0.80 8.55 0.66 5/09 - 5% Stock Dividend 2008 14,724 92.3 0.57 0.68 8.61 0.66 5/08 - 5% Stock Dividend 2007 12,749 153.2 1.00 1.25 16.43 0.65 5/07 - 5% Stock Dividend 2006 12,395 163.7 1.04 1.33 17.24 0.64 5/06 - 5% Stock Dividend 2005 12,436 163.4 1.06 1.39 19.17 0.62 5/05 - 5% Stock Dividend 2004 10,763 154.4 1.05 1.51 22.77 0.60 5/04 - 5% Stock Dividend 2003 9,873 153.4 1.05 1.63 24.21 0.57 5/03 - 5% Stock Dividend 2002 9,148 154.6 1.01 1.78 23.59 0.54 5/02 - 5:4 Stock Split 2001 8,590 135.2 0.85 1.68 19.70 0.51 5/01 - 5% Stock Dividend 2000 6,426 106.8 0.82 1.72 20.28 0.48 5/00 - 5% Stock Dividend 1999 6,360 106.3 0.77 1.75 18.35 0.45 5/99 - 5% Stock Dividend 1998 5,541 97.3 0.74 1.82 18.47 0.41 5/98 - 5:4 Stock Split 1997 5,091 85.0 0.68 1.67 18.88 0.36 5/97 - 5% Stock Dividend Period Ended (2) Total Assets Net Income (3) Common Stock Splits and Dividends Diluted Earnings Per Common Share Return on Average Assets Return on Average Equity Cash Dividends Declared Per Common Share (1) All per share amounts have been adjusted retroactively for stock splits and stock dividends during the periods presented. Data for the years prior to 2001 in the table above exclude certain prior year results for merger transactions accounted for using the pooling-of-interests method. (2) Previously reported results for 2011, 2010, 2009 and 2008 have been revised to reflect an increase in non-interest expense, which after taxes, reduced net income by $1.1 million, $1.2 million, $1.2 million and $1.3 million, respectively, and reduced basic and diluted earnings per common share by $0.01 for each of these years. Total assets and the other statistical data presented in the table have been revised accordingly. (3) Net income includes other-than-temporary impairment charges on investment securities, net of tax benefit, totaling $3.0 million, $12.2 million, $2.9 million, $4.0 million, $49.9 million, $10.4 million, and $3.0 million for the years ended 2012, 2011, 2010, 2009, 2008, 2007, and 2006, respectively. |