
Issuer Free Writing Prospectus Filed pursuant to Rule 433 Dated May 25, 2021 Registration No. 333-254696 Subordinated Debt O ffe ri n g I nv est o r P r esent a t i o n May 2021Issuer Free Writing Prospectus Filed pursuant to Rule 433 Dated May 25, 2021 Registration No. 333-254696 Subordinated Debt O ffe ri n g I nv est o r P r esent a t i o n May 2021

Forward Looking Statements The presentation contains forward-looking statements within the meaning of the Private Securities Litigation Reform Act of 1995. Such statements are not historical facts and include expressions about management’s confidence and strategies and management’s expectations about new and existing programs and products, acquisitions, relationships, opportunities, taxation, technology, market conditions and economic expectations, including the potential effects of the COVID-19 pandemic on our businesses and financial results and conditions. These statements may be identified by such forward-looking terminology as “should,” “expect,” “believe,” “view,” “opportunity,” “allow,” “continues,” “reflects,” “typically,” “usually,” “anticipate,” or similar statements or variations of such terms. Such forward-looking statements involve certain risks and uncertainties. Actual results may differ materially from such forward-looking statements. Factors that may cause actual results to differ materially from those contemplated by such forward-looking statements include, but are not limited to: the continued impact of COVID-19 on the U.S. and global economies, including business disruptions, reductions in employment and an increase in business failures, specifically among our clients; the continued impact of COVID-19 on our employees and our ability to provide services to our customers and respond to their needs as more cases of COVID-19 may arise in our primary markets; potential judgments, claims, damages, penalties, fines and reputational damage resulting from pending or future litigation and regulatory and government actions, including as a result of our participation in and execution of government programs related to the COVID-19 pandemic or as a result of our actions in response to, or failure to implement or effectively implement, federal, state and local laws, rules or executive orders requiring that we grant forbearances or not act to collect our loans; the impact of forbearances or deferrals we are required or agree to as a result of customer requests and/or government actions, including, but not limited to our potential inability to recover fully deferred payments from the borrower or the collateral; the risks related to the discontinuation of the London Interbank Offered Rate and other reference rates, including increased expenses and litigation and the effectiveness of hedging strategies; damage verdicts or settlements or restrictions related to existing or potential class action litigation or individual litigation arising from claims of violations of laws or regulations, contractual claims, breach of fiduciary responsibility, negligence, fraud, environmental laws, patent or trademark infringement, employment related claims, and other matters; a prolonged downturn in the economy, mainly in New Jersey, New York, Florida and Alabama, as well as an unexpected decline in commercial real estate values within our market areas; higher or lower than expected income tax expense or tax rates, including increases or decreases resulting from changes in uncertain tax position liabilities, tax laws, regulations and case law; the inability to grow customer deposits to keep pace with loan growth; a material change in our allowance for credit losses under CECL due to forecasted economic conditions and/or unexpected credit deterioration in our loan and investment portfolios; the need to supplement debt or equity capital to maintain or exceed internal capital thresholds; greater than expected technology related costs due to, among other factors, prolonged or failed implementations, additional project staffing and obsolescence caused by continuous and rapid market innovations; the loss of or decrease in lower-cost funding sources within our deposit base, including our inability to achieve deposit retention targets under Valley's branch transformation strategy; cyber-attacks, computer viruses or other malware that may breach the security of our websites or other systems to obtain unauthorized access to confidential information, destroy data, disable or degrade service, or sabotage our systems; results of examinations by the Office of the Comptroller of the Currency, the Federal Reserve Bank, the Consumer Financial Protection Bureau and other regulatory authorities, including the possibility that any such regulatory authority may, among other things, require us to increase our allowance for credit losses, write-down assets, reimburse customers, change the way we do business, or limit or eliminate certain other banking activities; our inability or determination not to pay dividends at current levels, or at all, because of inadequate earnings, regulatory restrictions or limitations, changes in our capital requirements or a decision to increase capital by retaining more earnings; unanticipated loan delinquencies, loss of collateral, decreased service revenues, and other potential negative effects on our business caused by severe weather, the COVID-19 pandemic or other external events; unexpected significant declines in the loan portfolio due to the lack of economic expansion, increased competition, large prepayments, changes in regulatory lending guidance or other factors; and the failure of other financial institutions with whom we have trading, clearing, counterparty and other financial relationships. A detailed discussion of factors that could affect our results is included in our filings with the Securities and Exchange Commission (“SEC”), including the “Risk Factors” section of our Annual Report on Form 10-K for the year ended December 31, 2020. We undertake no duty to update any forward-looking statement to conform the statement to actual results or changes in our expectations. You should not place undue reliance on any forward-looking statement, which speaks only as of the date made. Although we believe that the expectations reflected in the forward-looking statements are reasonable, we cannot guarantee future results, levels of activity, performance or achievements. As used in this presentation, the terms “Valley”, “VLY”, “we”, “us”, and “our” mean Valley National Bancorp and its subsidiaries, on a consolidated basis, unless the context indicates otherwise. This presentation contains supplemental financial information determined by methods other than in accordance with U.S. generally accepted accounting principles (“U.S. GAAP”) that management uses in its analysis of Valley’s performance. Management believes these non-GAAP financial measures provide information useful to investors in understanding Valley’s underlying operational performance and business and performance trends and facilitate comparisons with the performance of others in the financial services industry. These non-GAAP financial measures should not be considered in isolation or as a substitute for or superior to financial measures calculated in accordance with U.S. GAAP. These non-GAAP financial measures may also be calculated differently from similar measures disclosed by other companies. A reconciliation of the non-GAAP measures used in this presentation to the most directly comparable GAAP measures is provided in the Appendix to this presentation.Forward Looking Statements The presentation contains forward-looking statements within the meaning of the Private Securities Litigation Reform Act of 1995. Such statements are not historical facts and include expressions about management’s confidence and strategies and management’s expectations about new and existing programs and products, acquisitions, relationships, opportunities, taxation, technology, market conditions and economic expectations, including the potential effects of the COVID-19 pandemic on our businesses and financial results and conditions. These statements may be identified by such forward-looking terminology as “should,” “expect,” “believe,” “view,” “opportunity,” “allow,” “continues,” “reflects,” “typically,” “usually,” “anticipate,” or similar statements or variations of such terms. Such forward-looking statements involve certain risks and uncertainties. Actual results may differ materially from such forward-looking statements. Factors that may cause actual results to differ materially from those contemplated by such forward-looking statements include, but are not limited to: the continued impact of COVID-19 on the U.S. and global economies, including business disruptions, reductions in employment and an increase in business failures, specifically among our clients; the continued impact of COVID-19 on our employees and our ability to provide services to our customers and respond to their needs as more cases of COVID-19 may arise in our primary markets; potential judgments, claims, damages, penalties, fines and reputational damage resulting from pending or future litigation and regulatory and government actions, including as a result of our participation in and execution of government programs related to the COVID-19 pandemic or as a result of our actions in response to, or failure to implement or effectively implement, federal, state and local laws, rules or executive orders requiring that we grant forbearances or not act to collect our loans; the impact of forbearances or deferrals we are required or agree to as a result of customer requests and/or government actions, including, but not limited to our potential inability to recover fully deferred payments from the borrower or the collateral; the risks related to the discontinuation of the London Interbank Offered Rate and other reference rates, including increased expenses and litigation and the effectiveness of hedging strategies; damage verdicts or settlements or restrictions related to existing or potential class action litigation or individual litigation arising from claims of violations of laws or regulations, contractual claims, breach of fiduciary responsibility, negligence, fraud, environmental laws, patent or trademark infringement, employment related claims, and other matters; a prolonged downturn in the economy, mainly in New Jersey, New York, Florida and Alabama, as well as an unexpected decline in commercial real estate values within our market areas; higher or lower than expected income tax expense or tax rates, including increases or decreases resulting from changes in uncertain tax position liabilities, tax laws, regulations and case law; the inability to grow customer deposits to keep pace with loan growth; a material change in our allowance for credit losses under CECL due to forecasted economic conditions and/or unexpected credit deterioration in our loan and investment portfolios; the need to supplement debt or equity capital to maintain or exceed internal capital thresholds; greater than expected technology related costs due to, among other factors, prolonged or failed implementations, additional project staffing and obsolescence caused by continuous and rapid market innovations; the loss of or decrease in lower-cost funding sources within our deposit base, including our inability to achieve deposit retention targets under Valley's branch transformation strategy; cyber-attacks, computer viruses or other malware that may breach the security of our websites or other systems to obtain unauthorized access to confidential information, destroy data, disable or degrade service, or sabotage our systems; results of examinations by the Office of the Comptroller of the Currency, the Federal Reserve Bank, the Consumer Financial Protection Bureau and other regulatory authorities, including the possibility that any such regulatory authority may, among other things, require us to increase our allowance for credit losses, write-down assets, reimburse customers, change the way we do business, or limit or eliminate certain other banking activities; our inability or determination not to pay dividends at current levels, or at all, because of inadequate earnings, regulatory restrictions or limitations, changes in our capital requirements or a decision to increase capital by retaining more earnings; unanticipated loan delinquencies, loss of collateral, decreased service revenues, and other potential negative effects on our business caused by severe weather, the COVID-19 pandemic or other external events; unexpected significant declines in the loan portfolio due to the lack of economic expansion, increased competition, large prepayments, changes in regulatory lending guidance or other factors; and the failure of other financial institutions with whom we have trading, clearing, counterparty and other financial relationships. A detailed discussion of factors that could affect our results is included in our filings with the Securities and Exchange Commission (“SEC”), including the “Risk Factors” section of our Annual Report on Form 10-K for the year ended December 31, 2020. We undertake no duty to update any forward-looking statement to conform the statement to actual results or changes in our expectations. You should not place undue reliance on any forward-looking statement, which speaks only as of the date made. Although we believe that the expectations reflected in the forward-looking statements are reasonable, we cannot guarantee future results, levels of activity, performance or achievements. As used in this presentation, the terms “Valley”, “VLY”, “we”, “us”, and “our” mean Valley National Bancorp and its subsidiaries, on a consolidated basis, unless the context indicates otherwise. This presentation contains supplemental financial information determined by methods other than in accordance with U.S. generally accepted accounting principles (“U.S. GAAP”) that management uses in its analysis of Valley’s performance. Management believes these non-GAAP financial measures provide information useful to investors in understanding Valley’s underlying operational performance and business and performance trends and facilitate comparisons with the performance of others in the financial services industry. These non-GAAP financial measures should not be considered in isolation or as a substitute for or superior to financial measures calculated in accordance with U.S. GAAP. These non-GAAP financial measures may also be calculated differently from similar measures disclosed by other companies. A reconciliation of the non-GAAP measures used in this presentation to the most directly comparable GAAP measures is provided in the Appendix to this presentation.
Disclaimer This presentation shall not constitute an offer to sell or the solicitation of an offer to buy, nor shall there be any sale of the subordinated notes in any state or jurisdiction in which such offer, solicitation or sale would be unlawful prior to registration or qualification under the securities laws of any such state or jurisdiction. The offering of the subordinated notes is being made pursuant to a shelf registration statement (File No. 333-254696) (including base prospectus), filed by Valley with the SEC on March 25, 2021. Valley has filed a preliminary prospectus supplement (which is subject to completion) with the SEC for the offering to which this presentation relates. Before you invest, you should read the base prospectus, the preliminary prospectus supplement, the final prospectus (when available) and any other documents that Valley has filed with the SEC for more information about Valley and this offering. You may get these documents for free by visiting EDGAR on the SEC website at www.sec.gov. Alternatively, you may request copies of the prospectus and the preliminary prospectus supplement by emailing Piper Sandler & Co. at fsg-dcm@psc.com or calling BofA Securities, Inc. toll free at (800) 294-1322. Neither the SEC nor any other regulatory body has approved or disapproved of the securities of the Company or passed upon the accuracy or adequacy of this presentation. Any representation to the contrary is a criminal offense.Disclaimer This presentation shall not constitute an offer to sell or the solicitation of an offer to buy, nor shall there be any sale of the subordinated notes in any state or jurisdiction in which such offer, solicitation or sale would be unlawful prior to registration or qualification under the securities laws of any such state or jurisdiction. The offering of the subordinated notes is being made pursuant to a shelf registration statement (File No. 333-254696) (including base prospectus), filed by Valley with the SEC on March 25, 2021. Valley has filed a preliminary prospectus supplement (which is subject to completion) with the SEC for the offering to which this presentation relates. Before you invest, you should read the base prospectus, the preliminary prospectus supplement, the final prospectus (when available) and any other documents that Valley has filed with the SEC for more information about Valley and this offering. You may get these documents for free by visiting EDGAR on the SEC website at www.sec.gov. Alternatively, you may request copies of the prospectus and the preliminary prospectus supplement by emailing Piper Sandler & Co. at fsg-dcm@psc.com or calling BofA Securities, Inc. toll free at (800) 294-1322. Neither the SEC nor any other regulatory body has approved or disapproved of the securities of the Company or passed upon the accuracy or adequacy of this presentation. Any representation to the contrary is a criminal offense.
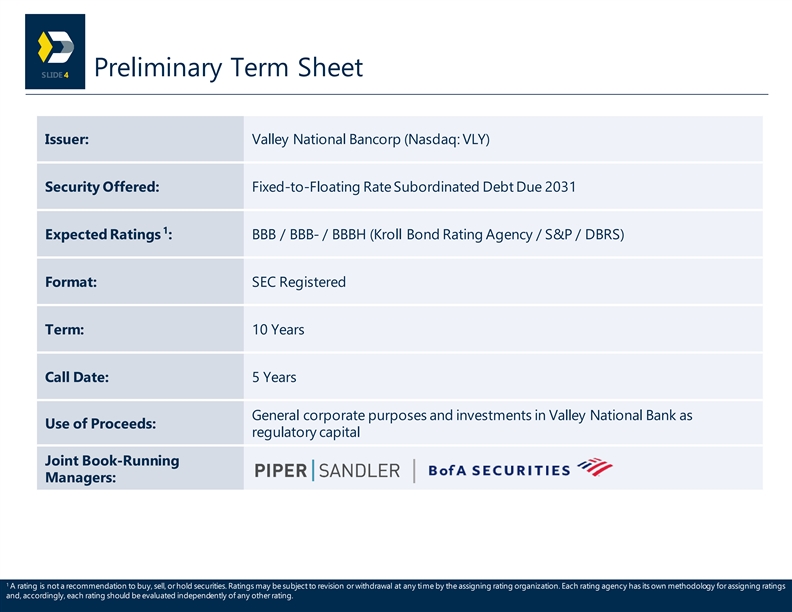
Preliminary Term Sheet 4 Issuer: Valley National Bancorp (Nasdaq: VLY) Security Offered: Fixed-to-Floating Rate Subordinated Debt Due 2031 1 Expected Ratings : BBB / BBB- / BBBH (Kroll Bond Rating Agency / S&P / DBRS) Format: SEC Registered Term: 10 Years Call Date: 5 Years General corporate purposes and investments in Valley National Bank as Use of Proceeds: regulatory capital Joint Book-Running | Managers: 1 A rating is not a recommendation to buy, sell, or hold securities. Ratings may be subject to revision or withdrawal at any time by the assigning rating organization. Each rating agency has its own methodology for assigning ratings and, accordingly, each rating should be evaluated independently of any other rating. Preliminary Term Sheet 4 Issuer: Valley National Bancorp (Nasdaq: VLY) Security Offered: Fixed-to-Floating Rate Subordinated Debt Due 2031 1 Expected Ratings : BBB / BBB- / BBBH (Kroll Bond Rating Agency / S&P / DBRS) Format: SEC Registered Term: 10 Years Call Date: 5 Years General corporate purposes and investments in Valley National Bank as Use of Proceeds: regulatory capital Joint Book-Running | Managers: 1 A rating is not a recommendation to buy, sell, or hold securities. Ratings may be subject to revision or withdrawal at any time by the assigning rating organization. Each rating agency has its own methodology for assigning ratings and, accordingly, each rating should be evaluated independently of any other rating.

Experienced Executive Leadership 5 Michael D. Hagedorn Ira Robbins Senior EVP & CFO President & CEO Years at Valley: 2 / Years in Banking: 34 Years at Valley: 25 / Years in Banking: 25 Mr. Hagedorn joined Valley in 2019. Previously he Mr. Robbins has been CEO of Valley since 2018 and served as President and CEO of UMB Bank, NA. Prior Chairman since 2019. He was named President in 2017. to that, Mr. Hagedorn spent 10 years as CFO and CAO Mr. Robbins joined Valley in 1996 as part of Valley’s for UMB Financial Corporation. Before joining UMB, Management Associate Program, and previously served as Mr. Hagedorn held various leadership positions at EVP and Treasurer. Norwest Bank and Wells Fargo. Robert J. Bardusch Tom Iadanza Senior EVP & Chief Banking Officer Senior EVP & COO Years at Valley: 9 / Years in Banking: 41 Years at Valley: 5 / Years in Banking: 24 Mr. Iadanza is responsible for commercial and consumer lending, Mr. Bardusch joined Valley in 2016 as EVP and Chief retail banking. Mr. Iadanza joined Valley through the State Bank Information Officer, and was promoted to COO in acquisition in 2012. Mr. Iadanza previously led metro New York 2018. Prior to joining Valley, Mr. Bardusch served as and New Jersey commercial lending for Santander Bank, N.A. and Chief Information Officer at MVB Financial Corp., and Independence Community Bank Corp. and held various Chief Information Officer of Enterprise Technology and leadership positions at Citibank. Risk Management Technology for PNC. Mark Saeger Melissa F. Scofield EVP & Chief Credit Officer EVP & Chief Risk Officer Years at Valley: 6 / Years in Banking: 34 Years at Valley: 6 / Years in Banking: 40 Mr. Saeger joined Valley in 2015 as Head of New York Ms. Scofield joined Valley in 2015. Previously, she served as Commercial Lending. Prior to joining Valley, Mr. Assistant Deputy Controller for the OCC in the New York Saeger spent 10 years at Sovereign Bank. field office. Ms. Scofield was commissioned as a National Bank Examiner in 1989 and spent 34 years in examining and supervisory roles at the OCC.Experienced Executive Leadership 5 Michael D. Hagedorn Ira Robbins Senior EVP & CFO President & CEO Years at Valley: 2 / Years in Banking: 34 Years at Valley: 25 / Years in Banking: 25 Mr. Hagedorn joined Valley in 2019. Previously he Mr. Robbins has been CEO of Valley since 2018 and served as President and CEO of UMB Bank, NA. Prior Chairman since 2019. He was named President in 2017. to that, Mr. Hagedorn spent 10 years as CFO and CAO Mr. Robbins joined Valley in 1996 as part of Valley’s for UMB Financial Corporation. Before joining UMB, Management Associate Program, and previously served as Mr. Hagedorn held various leadership positions at EVP and Treasurer. Norwest Bank and Wells Fargo. Robert J. Bardusch Tom Iadanza Senior EVP & Chief Banking Officer Senior EVP & COO Years at Valley: 9 / Years in Banking: 41 Years at Valley: 5 / Years in Banking: 24 Mr. Iadanza is responsible for commercial and consumer lending, Mr. Bardusch joined Valley in 2016 as EVP and Chief retail banking. Mr. Iadanza joined Valley through the State Bank Information Officer, and was promoted to COO in acquisition in 2012. Mr. Iadanza previously led metro New York 2018. Prior to joining Valley, Mr. Bardusch served as and New Jersey commercial lending for Santander Bank, N.A. and Chief Information Officer at MVB Financial Corp., and Independence Community Bank Corp. and held various Chief Information Officer of Enterprise Technology and leadership positions at Citibank. Risk Management Technology for PNC. Mark Saeger Melissa F. Scofield EVP & Chief Credit Officer EVP & Chief Risk Officer Years at Valley: 6 / Years in Banking: 34 Years at Valley: 6 / Years in Banking: 40 Mr. Saeger joined Valley in 2015 as Head of New York Ms. Scofield joined Valley in 2015. Previously, she served as Commercial Lending. Prior to joining Valley, Mr. Assistant Deputy Controller for the OCC in the New York Saeger spent 10 years at Sovereign Bank. field office. Ms. Scofield was commissioned as a National Bank Examiner in 1989 and spent 34 years in examining and supervisory roles at the OCC.
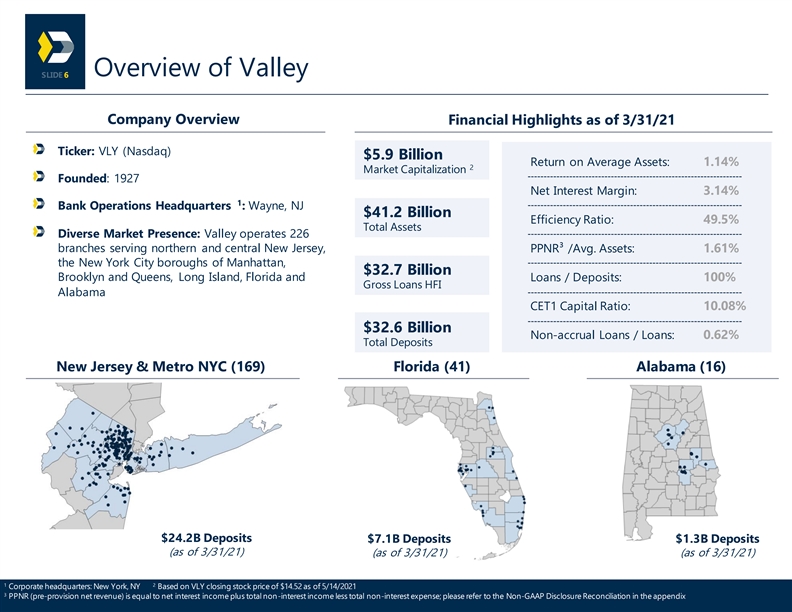
Overview of Valley 6 Company Overview Financial Highlights as of 3/31/21 Ticker: VLY (Nasdaq) $5.9 Billion Return on Average Assets: 1.14% 2 Market Capitalization Founded: 1927 Net Interest Margin: 3.14% 1 Bank Operations Headquarters : Wayne, NJ $41.2 Billion Efficiency Ratio: 49.5% Total Assets Diverse Market Presence: Valley operates 226 branches serving northern and central New Jersey, PPNR³ /Avg. Assets: 1.61% the New York City boroughs of Manhattan, $32.7 Billion Brooklyn and Queens, Long Island, Florida and Loans / Deposits: 100% Gross Loans HFI Alabama CET1 Capital Ratio: 10.08% $32.6 Billion Non-accrual Loans / Loans: 0.62% Total Deposits New Jersey & Metro NYC (169) Florida (41) Alabama (16) $24.2B Deposits $7.1B Deposits $1.3B Deposits (as of 3/31/21) (as of 3/31/21) (as of 3/31/21) 1 2 Corporate headquarters: New York, NY Based on VLY closing stock price of $14.52 as of 5/14/2021 3 PPNR (pre-provision net revenue) is equal to net interest income plus total non-interest income less total non-interest expense; please refer to the Non-GAAP Disclosure Reconciliation in the appendixOverview of Valley 6 Company Overview Financial Highlights as of 3/31/21 Ticker: VLY (Nasdaq) $5.9 Billion Return on Average Assets: 1.14% 2 Market Capitalization Founded: 1927 Net Interest Margin: 3.14% 1 Bank Operations Headquarters : Wayne, NJ $41.2 Billion Efficiency Ratio: 49.5% Total Assets Diverse Market Presence: Valley operates 226 branches serving northern and central New Jersey, PPNR³ /Avg. Assets: 1.61% the New York City boroughs of Manhattan, $32.7 Billion Brooklyn and Queens, Long Island, Florida and Loans / Deposits: 100% Gross Loans HFI Alabama CET1 Capital Ratio: 10.08% $32.6 Billion Non-accrual Loans / Loans: 0.62% Total Deposits New Jersey & Metro NYC (169) Florida (41) Alabama (16) $24.2B Deposits $7.1B Deposits $1.3B Deposits (as of 3/31/21) (as of 3/31/21) (as of 3/31/21) 1 2 Corporate headquarters: New York, NY Based on VLY closing stock price of $14.52 as of 5/14/2021 3 PPNR (pre-provision net revenue) is equal to net interest income plus total non-interest income less total non-interest expense; please refer to the Non-GAAP Disclosure Reconciliation in the appendix
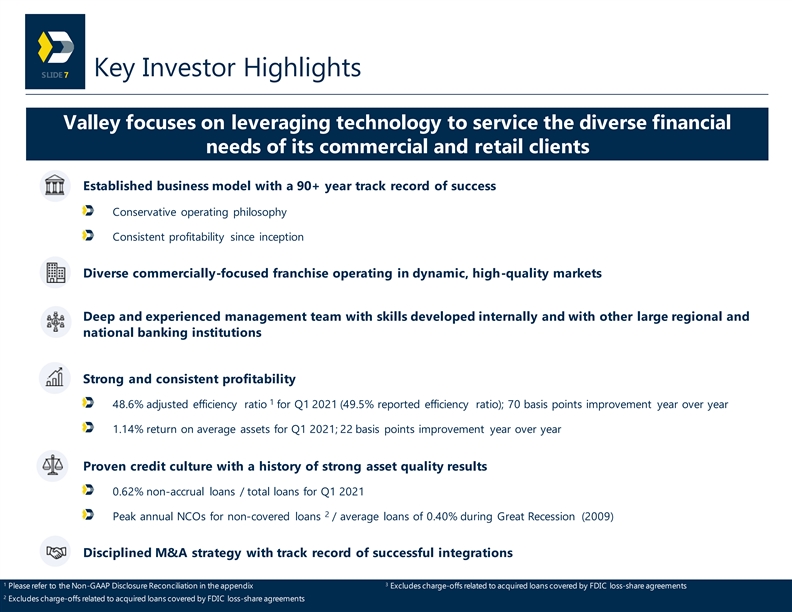
Key Investor Highlights 7 Valley focuses on leveraging technology to service the diverse financial needs of its commercial and retail clients Established business model with a 90+ year track record of success Conservative operating philosophy Consistent profitability since inception Diverse commercially-focused franchise operating in dynamic, high-quality markets Deep and experienced management team with skills developed internally and with other large regional and national banking institutions Strong and consistent profitability 1 48.6% adjusted efficiency ratio for Q1 2021 (49.5% reported efficiency ratio); 70 basis points improvement year over year 1.14% return on average assets for Q1 2021; 22 basis points improvement year over year Proven credit culture with a history of strong asset quality results 0.62% non-accrual loans / total loans for Q1 2021 2 Peak annual NCOs for non-covered loans / average loans of 0.40% during Great Recession (2009) Disciplined M&A strategy with track record of successful integrations 1 3 Please refer to the Non-GAAP Disclosure Reconciliation in the appendix Excludes charge-offs related to acquired loans covered by FDIC loss-share agreements 2 Excludes charge-offs related to acquired loans covered by FDIC loss-share agreementsKey Investor Highlights 7 Valley focuses on leveraging technology to service the diverse financial needs of its commercial and retail clients Established business model with a 90+ year track record of success Conservative operating philosophy Consistent profitability since inception Diverse commercially-focused franchise operating in dynamic, high-quality markets Deep and experienced management team with skills developed internally and with other large regional and national banking institutions Strong and consistent profitability 1 48.6% adjusted efficiency ratio for Q1 2021 (49.5% reported efficiency ratio); 70 basis points improvement year over year 1.14% return on average assets for Q1 2021; 22 basis points improvement year over year Proven credit culture with a history of strong asset quality results 0.62% non-accrual loans / total loans for Q1 2021 2 Peak annual NCOs for non-covered loans / average loans of 0.40% during Great Recession (2009) Disciplined M&A strategy with track record of successful integrations 1 3 Please refer to the Non-GAAP Disclosure Reconciliation in the appendix Excludes charge-offs related to acquired loans covered by FDIC loss-share agreements 2 Excludes charge-offs related to acquired loans covered by FDIC loss-share agreements
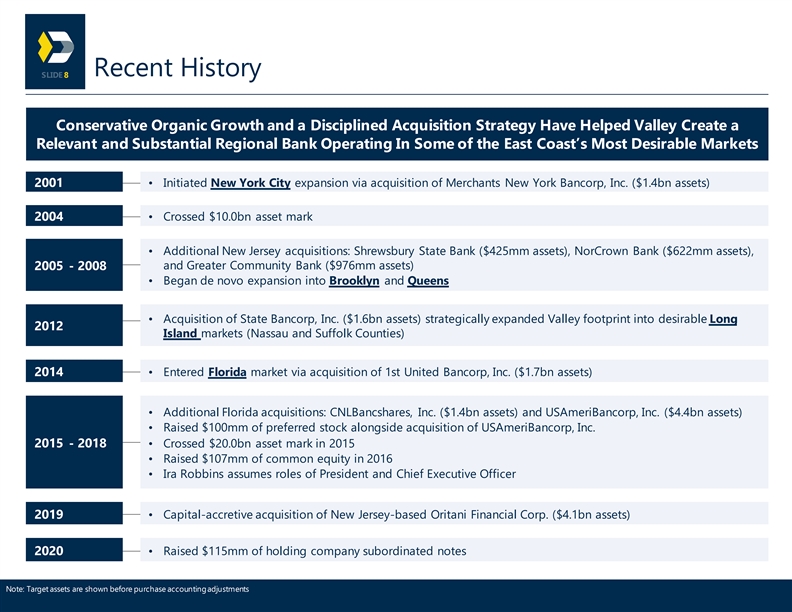
Recent History 8 Conservative Organic Growth and a Disciplined Acquisition Strategy Have Helped Valley Create a Relevant and Substantial Regional Bank Operating In Some of the East Coast’s Most Desirable Markets 2001 • Initiated New York City expansion via acquisition of Merchants New York Bancorp, Inc. ($1.4bn assets) 2004 • Crossed $10.0bn asset mark • Additional New Jersey acquisitions: Shrewsbury State Bank ($425mm assets), NorCrown Bank ($622mm assets), and Greater Community Bank ($976mm assets) 2005 - 2008 • Began de novo expansion into Brooklyn and Queens • Acquisition of State Bancorp, Inc. ($1.6bn assets) strategically expanded Valley footprint into desirable Long 2012 Island markets (Nassau and Suffolk Counties) 2014 • Entered Florida market via acquisition of 1st United Bancorp, Inc. ($1.7bn assets) • Additional Florida acquisitions: CNLBancshares, Inc. ($1.4bn assets) and USAmeriBancorp, Inc. ($4.4bn assets) • Raised $100mm of preferred stock alongside acquisition of USAmeriBancorp, Inc. 2015 - 2018 • Crossed $20.0bn asset mark in 2015 • Raised $107mm of common equity in 2016 • Ira Robbins assumes roles of President and Chief Executive Officer 2019 • Capital-accretive acquisition of New Jersey-based Oritani Financial Corp. ($4.1bn assets) 2020 • Raised $115mm of holding company subordinated notes Note: Target assets are shown before purchase accounting adjustmentsRecent History 8 Conservative Organic Growth and a Disciplined Acquisition Strategy Have Helped Valley Create a Relevant and Substantial Regional Bank Operating In Some of the East Coast’s Most Desirable Markets 2001 • Initiated New York City expansion via acquisition of Merchants New York Bancorp, Inc. ($1.4bn assets) 2004 • Crossed $10.0bn asset mark • Additional New Jersey acquisitions: Shrewsbury State Bank ($425mm assets), NorCrown Bank ($622mm assets), and Greater Community Bank ($976mm assets) 2005 - 2008 • Began de novo expansion into Brooklyn and Queens • Acquisition of State Bancorp, Inc. ($1.6bn assets) strategically expanded Valley footprint into desirable Long 2012 Island markets (Nassau and Suffolk Counties) 2014 • Entered Florida market via acquisition of 1st United Bancorp, Inc. ($1.7bn assets) • Additional Florida acquisitions: CNLBancshares, Inc. ($1.4bn assets) and USAmeriBancorp, Inc. ($4.4bn assets) • Raised $100mm of preferred stock alongside acquisition of USAmeriBancorp, Inc. 2015 - 2018 • Crossed $20.0bn asset mark in 2015 • Raised $107mm of common equity in 2016 • Ira Robbins assumes roles of President and Chief Executive Officer 2019 • Capital-accretive acquisition of New Jersey-based Oritani Financial Corp. ($4.1bn assets) 2020 • Raised $115mm of holding company subordinated notes Note: Target assets are shown before purchase accounting adjustments

Significant Scale in Attractive Markets 9 #1 Regional bank in 3 counties (Passaic, 1 Bergen and Morris) #1 $19.9B #2 New Jersey rank among New Jersey states by median HHI Deposit Market In-market deposits (~$90,000) ² Share for Regional as of 3/31/21 $635 Billion estimated GDP in 3 1 2019 Banks 131 branches #1 Largest US metropolitan market ² #3 $24.2B $2.0 Trillion in-market New York City deposits in MSA MSA (6/30/20) ² Deposit Market In-market deposits (New Jersey + Share for Regional as of 3/31/21 New York) $1.9 Trillion estimated GDP 1 Banks 169 branches 3 in 2019 #1 Regional bank in 1 Tampa MSA #9 $7.1B #6 Regional bank in 1 Orlando MSA Florida Top 15 National rank of Deposit Market In-market deposits Tampa, Miami & Share for Regional as of 3/31/21 Orlando for pop. 1 Banks 41 Branches growth since 2010 ⁴ 1 Deposit market share rank data per S&P Global Market Intelligence, data as of 6/30/20 as adjusted for acquisitions to the extent discernable. Rank includes banks with less than $100 billion in total assets and US subsidiaries of foreign banks. 2 3 4 Source: S&P Global Market Intelligence Includes MSAs with populations greater than 2 million Source: Federal Reserve Bank of St. Louis Significant Scale in Attractive Markets 9 #1 Regional bank in 3 counties (Passaic, 1 Bergen and Morris) #1 $19.9B #2 New Jersey rank among New Jersey states by median HHI Deposit Market In-market deposits (~$90,000) ² Share for Regional as of 3/31/21 $635 Billion estimated GDP in 3 1 2019 Banks 131 branches #1 Largest US metropolitan market ² #3 $24.2B $2.0 Trillion in-market New York City deposits in MSA MSA (6/30/20) ² Deposit Market In-market deposits (New Jersey + Share for Regional as of 3/31/21 New York) $1.9 Trillion estimated GDP 1 Banks 169 branches 3 in 2019 #1 Regional bank in 1 Tampa MSA #9 $7.1B #6 Regional bank in 1 Orlando MSA Florida Top 15 National rank of Deposit Market In-market deposits Tampa, Miami & Share for Regional as of 3/31/21 Orlando for pop. 1 Banks 41 Branches growth since 2010 ⁴ 1 Deposit market share rank data per S&P Global Market Intelligence, data as of 6/30/20 as adjusted for acquisitions to the extent discernable. Rank includes banks with less than $100 billion in total assets and US subsidiaries of foreign banks. 2 3 4 Source: S&P Global Market Intelligence Includes MSAs with populations greater than 2 million Source: Federal Reserve Bank of St. Louis
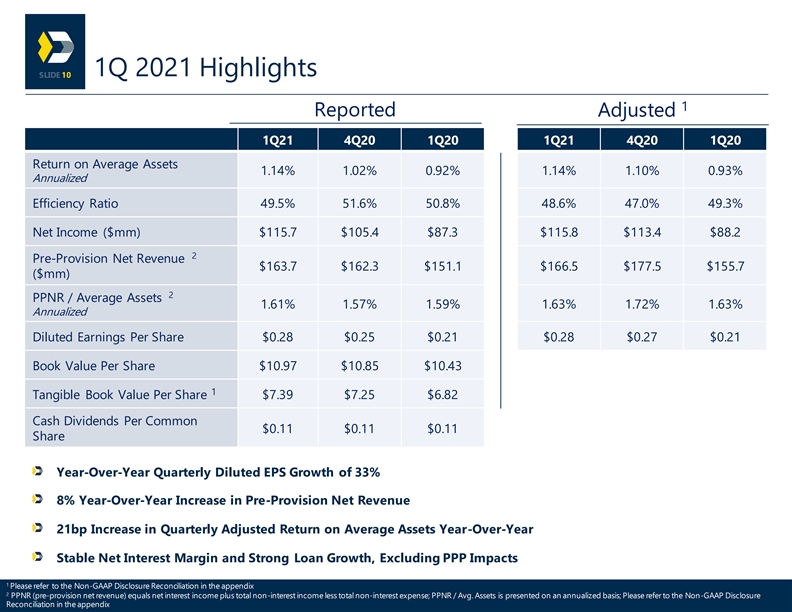
1Q 2021 Highlights 10 1 Reported Adjusted 1Q21 4Q20 1Q20 1Q21 4Q20 1Q20 Return on Average Assets 1.14% 1.02% 0.92% 1.14% 1.10% 0.93% Annualized Efficiency Ratio 49.5% 51.6% 50.8% 48.6% 47.0% 49.3% Net Income ($mm) $115.7 $105.4 $87.3 $115.8 $113.4 $88.2 2 Pre-Provision Net Revenue $163.7 $162.3 $151.1 $166.5 $177.5 $155.7 ($mm) 2 PPNR / Average Assets 1.61% 1.57% 1.59% 1.63% 1.72% 1.63% Annualized Diluted Earnings Per Share $0.28 $0.25 $0.21 $0.28 $0.27 $0.21 Book Value Per Share $10.97 $10.85 $10.43 1 Tangible Book Value Per Share $7.39 $7.25 $6.82 Cash Dividends Per Common $0.11 $0.11 $0.11 Share Year-Over-Year Quarterly Diluted EPS Growth of 33% 8% Year-Over-Year Increase in Pre-Provision Net Revenue 21bp Increase in Quarterly Adjusted Return on Average Assets Year-Over-Year Stable Net Interest Margin and Strong Loan Growth, Excluding PPP Impacts 1 Please refer to the Non-GAAP Disclosure Reconciliation in the appendix 2 PPNR (pre-provision net revenue) equals net interest income plus total non-interest income less total non-interest expense; PPNR / Avg. Assets is presented on an annualized basis; Please refer to the Non-GAAP Disclosure Reconciliation in the appendix1Q 2021 Highlights 10 1 Reported Adjusted 1Q21 4Q20 1Q20 1Q21 4Q20 1Q20 Return on Average Assets 1.14% 1.02% 0.92% 1.14% 1.10% 0.93% Annualized Efficiency Ratio 49.5% 51.6% 50.8% 48.6% 47.0% 49.3% Net Income ($mm) $115.7 $105.4 $87.3 $115.8 $113.4 $88.2 2 Pre-Provision Net Revenue $163.7 $162.3 $151.1 $166.5 $177.5 $155.7 ($mm) 2 PPNR / Average Assets 1.61% 1.57% 1.59% 1.63% 1.72% 1.63% Annualized Diluted Earnings Per Share $0.28 $0.25 $0.21 $0.28 $0.27 $0.21 Book Value Per Share $10.97 $10.85 $10.43 1 Tangible Book Value Per Share $7.39 $7.25 $6.82 Cash Dividends Per Common $0.11 $0.11 $0.11 Share Year-Over-Year Quarterly Diluted EPS Growth of 33% 8% Year-Over-Year Increase in Pre-Provision Net Revenue 21bp Increase in Quarterly Adjusted Return on Average Assets Year-Over-Year Stable Net Interest Margin and Strong Loan Growth, Excluding PPP Impacts 1 Please refer to the Non-GAAP Disclosure Reconciliation in the appendix 2 PPNR (pre-provision net revenue) equals net interest income plus total non-interest income less total non-interest expense; PPNR / Avg. Assets is presented on an annualized basis; Please refer to the Non-GAAP Disclosure Reconciliation in the appendix
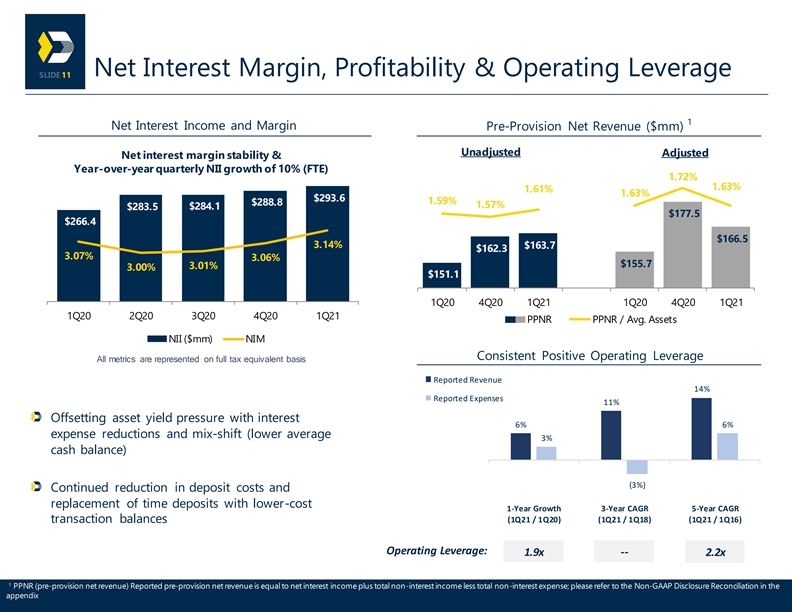
Net Interest Margin, Profitability & Operating Leverage 11 1 Net Interest Income and Margin Pre-Provision Net Revenue ($mm) Unadjusted Adjusted Net interest margin stability & Year-over-year quarterly NII growth of 10% (FTE) 1.72% 1.63% 1.61% 1.63% $293.6 1.59% $288.8 1.57% $283.5 $284.1 $177.5 $266.4 $166.5 3.14% $163.7 $162.3 3.07% 3.06% $155.7 3.01% 3.00% $151.1 1Q20 4Q20 1Q21 1Q20 4Q20 1Q21 1Q20 2Q20 3Q20 4Q20 1Q21 PPNR PPNR / Avg. Assets NII ($mm) NIM Consistent Positive Operating Leverage All metrics are represented on full tax equivalent basis Reported Revenue 14% Reported Expenses 11% Offsetting asset yield pressure with interest 6% 6% expense reductions and mix-shift (lower average 3% cash balance) (3%) Continued reduction in deposit costs and replacement of time deposits with lower-cost 1-Year Growth 3-Year CAGR 5-Year CAGR (1Q21 / 1Q20) (1Q21 / 1Q18) (1Q21 / 1Q16) transaction balances Operating Leverage: 1.9x -- 2.2x 1 PPNR (pre-provision net revenue) Reported pre-provision net revenue is equal to net interest income plus total non-interest income less total non-interest expense; please refer to the Non-GAAP Disclosure Reconciliation in the appendixNet Interest Margin, Profitability & Operating Leverage 11 1 Net Interest Income and Margin Pre-Provision Net Revenue ($mm) Unadjusted Adjusted Net interest margin stability & Year-over-year quarterly NII growth of 10% (FTE) 1.72% 1.63% 1.61% 1.63% $293.6 1.59% $288.8 1.57% $283.5 $284.1 $177.5 $266.4 $166.5 3.14% $163.7 $162.3 3.07% 3.06% $155.7 3.01% 3.00% $151.1 1Q20 4Q20 1Q21 1Q20 4Q20 1Q21 1Q20 2Q20 3Q20 4Q20 1Q21 PPNR PPNR / Avg. Assets NII ($mm) NIM Consistent Positive Operating Leverage All metrics are represented on full tax equivalent basis Reported Revenue 14% Reported Expenses 11% Offsetting asset yield pressure with interest 6% 6% expense reductions and mix-shift (lower average 3% cash balance) (3%) Continued reduction in deposit costs and replacement of time deposits with lower-cost 1-Year Growth 3-Year CAGR 5-Year CAGR (1Q21 / 1Q20) (1Q21 / 1Q18) (1Q21 / 1Q16) transaction balances Operating Leverage: 1.9x -- 2.2x 1 PPNR (pre-provision net revenue) Reported pre-provision net revenue is equal to net interest income plus total non-interest income less total non-interest expense; please refer to the Non-GAAP Disclosure Reconciliation in the appendix
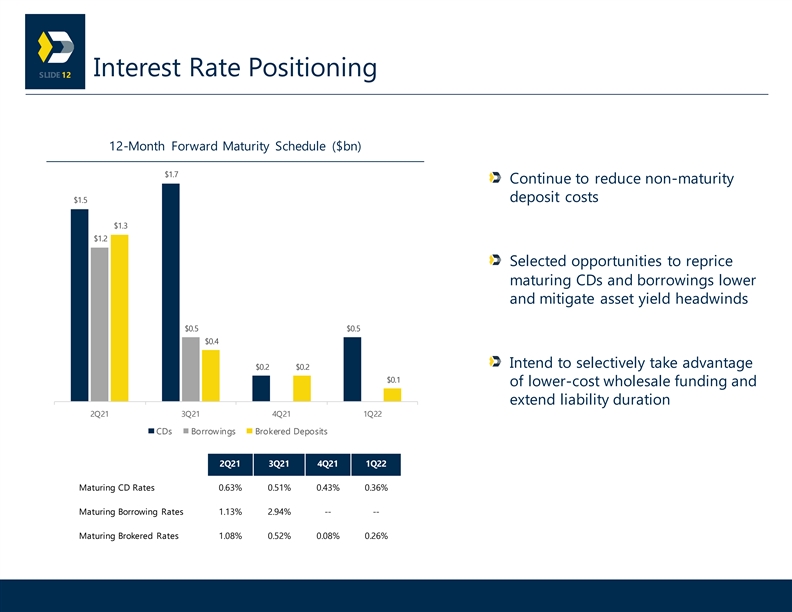
Interest Rate Positioning 12 12-Month Forward Maturity Schedule ($bn) $1.7 Continue to reduce non-maturity deposit costs $1.5 $1.3 $1.2 Selected opportunities to reprice maturing CDs and borrowings lower and mitigate asset yield headwinds $0.5 $0.5 $0.4 Intend to selectively take advantage $0.2 $0.2 $0.1 of lower-cost wholesale funding and extend liability duration 2Q21 3Q21 4Q21 1Q22 CDs Borrowings Brokered Deposits 2Q21 3Q21 4Q21 1Q22 Maturing CD Rates 0.63% 0.51% 0.43% 0.36% Maturing Borrowing Rates 1.13% 2.94% -- -- Maturing Brokered Rates 1.08% 0.52% 0.08% 0.26%Interest Rate Positioning 12 12-Month Forward Maturity Schedule ($bn) $1.7 Continue to reduce non-maturity deposit costs $1.5 $1.3 $1.2 Selected opportunities to reprice maturing CDs and borrowings lower and mitigate asset yield headwinds $0.5 $0.5 $0.4 Intend to selectively take advantage $0.2 $0.2 $0.1 of lower-cost wholesale funding and extend liability duration 2Q21 3Q21 4Q21 1Q22 CDs Borrowings Brokered Deposits 2Q21 3Q21 4Q21 1Q22 Maturing CD Rates 0.63% 0.51% 0.43% 0.36% Maturing Borrowing Rates 1.13% 2.94% -- -- Maturing Brokered Rates 1.08% 0.52% 0.08% 0.26%
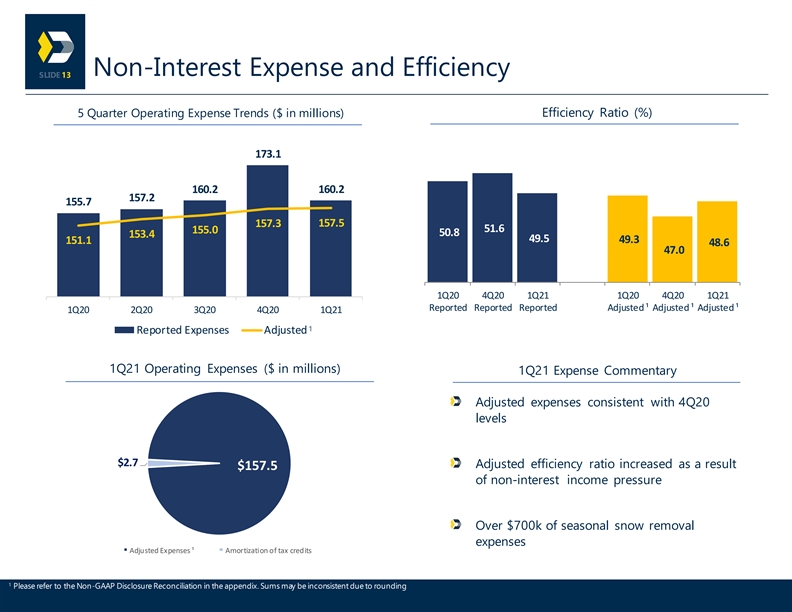
Non-Interest Expense and Efficiency 13 5 Quarter Operating Expense Trends ($ in millions) Efficiency Ratio (%) 173.1 160.2 160.2 157.2 155.7 157.3 157.5 51.6 155.0 50.8 153.4 49.5 49.3 151.1 2 48.6 47.0 1Q20 4Q20 1Q21 1Q20 4Q20 1Q21 Reported Reported Reported Adjusted ¹ Adjusted ¹ Adjusted ¹ 1Q20 2Q20 3Q20 4Q20 1Q21 1 Reported Expenses Adjusted 1Q21 Operating Expenses ($ in millions) 1Q21 Expense Commentary Adjusted expenses consistent with 4Q20 levels $2.7 Adjusted efficiency ratio increased as a result $157.5 of non-interest income pressure Over $700k of seasonal snow removal expenses Adjusted Expenses ¹ Amortization of tax credits 1 Please refer to the Non-GAAP Disclosure Reconciliation in the appendix. Sums may be inconsistent due to roundingNon-Interest Expense and Efficiency 13 5 Quarter Operating Expense Trends ($ in millions) Efficiency Ratio (%) 173.1 160.2 160.2 157.2 155.7 157.3 157.5 51.6 155.0 50.8 153.4 49.5 49.3 151.1 2 48.6 47.0 1Q20 4Q20 1Q21 1Q20 4Q20 1Q21 Reported Reported Reported Adjusted ¹ Adjusted ¹ Adjusted ¹ 1Q20 2Q20 3Q20 4Q20 1Q21 1 Reported Expenses Adjusted 1Q21 Operating Expenses ($ in millions) 1Q21 Expense Commentary Adjusted expenses consistent with 4Q20 levels $2.7 Adjusted efficiency ratio increased as a result $157.5 of non-interest income pressure Over $700k of seasonal snow removal expenses Adjusted Expenses ¹ Amortization of tax credits 1 Please refer to the Non-GAAP Disclosure Reconciliation in the appendix. Sums may be inconsistent due to rounding

Branch Network Evolution 14 We constantly analyze our branch network and individual branch performance to optimize our delivery channels from a productivity and efficiency perspective VLY Branch Count 26 29 56 227 226 12/31/15 USAB Acquisition ORIT Acquisition Branch Closures 12/31/20 3/31/21 Deposits / Branch $144MM $72MM 1 Reported Efficiency Ratio (%) 49.5% 78.7% 1 Efficiency ratio for the year ended December 31, 2015 and the quarter ended March 31, 2021Branch Network Evolution 14 We constantly analyze our branch network and individual branch performance to optimize our delivery channels from a productivity and efficiency perspective VLY Branch Count 26 29 56 227 226 12/31/15 USAB Acquisition ORIT Acquisition Branch Closures 12/31/20 3/31/21 Deposits / Branch $144MM $72MM 1 Reported Efficiency Ratio (%) 49.5% 78.7% 1 Efficiency ratio for the year ended December 31, 2015 and the quarter ended March 31, 2021
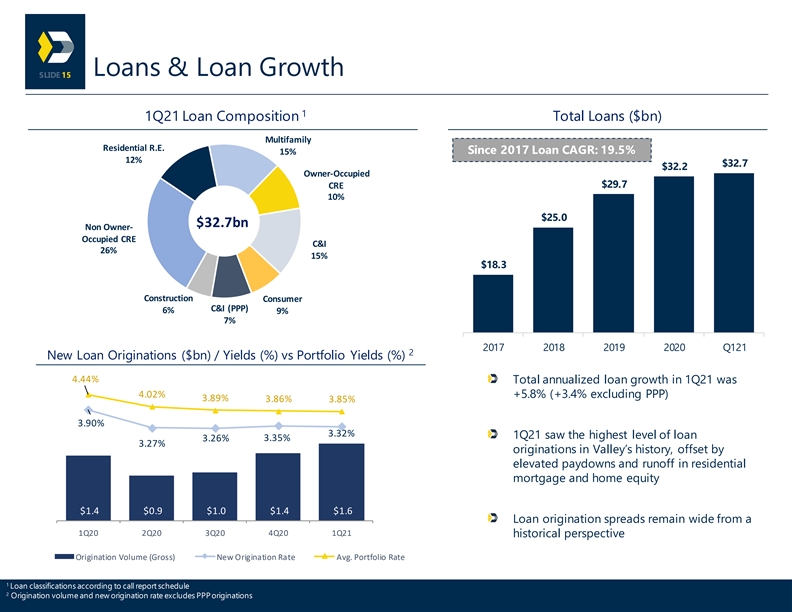
Loans & Loan Growth 15 1 1Q21 Loan Composition Total Loans ($bn) Multifamily Residential R.E. Since 2017 Loan CAGR: 19.5% 15% 12% $32.7 $32.2 Owner-Occupied $29.7 CRE 10% $25.0 $32.7bn Non Owner- Occupied CRE C&I 26% 15% $18.3 Construction Consumer C&I (PPP) 6% 9% 7% 2017 2018 2019 2020 Q121 2 New Loan Originations ($bn) / Yields (%) vs Portfolio Yields (%) 4.44% Total annualized loan growth in 1Q21 was 4.02% +5.8% (+3.4% excluding PPP) 3.89% 3.86% 3.85% 3.90% 3.32% 1Q21 saw the highest level of loan 3.26% 3.35% 3.27% originations in Valley’s history, offset by elevated paydowns and runoff in residential mortgage and home equity $1.4 $0.9 $1.0 $1.4 $1.6 Loan origination spreads remain wide from a 1Q20 2Q20 3Q20 4Q20 1Q21 historical perspective Origination Volume (Gross) New Origination Rate Avg. Portfolio Rate 1 Loan classifications according to call report schedule 2 Origination volume and new origination rate excludes PPP originations Loans & Loan Growth 15 1 1Q21 Loan Composition Total Loans ($bn) Multifamily Residential R.E. Since 2017 Loan CAGR: 19.5% 15% 12% $32.7 $32.2 Owner-Occupied $29.7 CRE 10% $25.0 $32.7bn Non Owner- Occupied CRE C&I 26% 15% $18.3 Construction Consumer C&I (PPP) 6% 9% 7% 2017 2018 2019 2020 Q121 2 New Loan Originations ($bn) / Yields (%) vs Portfolio Yields (%) 4.44% Total annualized loan growth in 1Q21 was 4.02% +5.8% (+3.4% excluding PPP) 3.89% 3.86% 3.85% 3.90% 3.32% 1Q21 saw the highest level of loan 3.26% 3.35% 3.27% originations in Valley’s history, offset by elevated paydowns and runoff in residential mortgage and home equity $1.4 $0.9 $1.0 $1.4 $1.6 Loan origination spreads remain wide from a 1Q20 2Q20 3Q20 4Q20 1Q21 historical perspective Origination Volume (Gross) New Origination Rate Avg. Portfolio Rate 1 Loan classifications according to call report schedule 2 Origination volume and new origination rate excludes PPP originations

Relationship-Based Commercial Lending 16 Commercial Real Estate Commercial Loan Balances ($bn) 78.6% 79.1% 80. 0% 75.7% Consistent and conservative underwriting across $30 .0 72.8% 71.4% markets $25.9 $25.3 70. 0% $25 .0 $1.8 $22.5 $1.7 Sophisticated high net worth borrowers supported by 60. 0% $1.6 $20 .0 $18.2 diverse collateral and cash flow sources $1.5 50. 0% $16.9 $15 .0 $13.1 $16.7 Focus on dense, highly-populated markets $0.9 $16.0 40. 0% $10 .0 $12.4 Granular portfolio with average loan balance of $2.7mm $9.5 30. 0% $5. 0 $7.1 $6.9 $4.8 Weighted average DSCR of 1.7x $4.3 $2.7 $0. 0 20. 0% 2017 2018 2019 2020 1Q21 Weighted average LTV of 56% C&I CRE Construction Commercial Loans / Total Loans C&I Commercial Loans by Geography C&I CRE Consistent and conservative underwriting across markets New York 24% New York Other Other Diverse industry focus 36% 14% 17% Nationwide Businesses: Equipment Financing (Highland Capital) and Premium Finance New Jersey Florida New Weighted average DSCR of 2.7x Florida 32% 26% Jersey 27% 24% Note: Underwriting metrics as of 3/31/2021Relationship-Based Commercial Lending 16 Commercial Real Estate Commercial Loan Balances ($bn) 78.6% 79.1% 80. 0% 75.7% Consistent and conservative underwriting across $30 .0 72.8% 71.4% markets $25.9 $25.3 70. 0% $25 .0 $1.8 $22.5 $1.7 Sophisticated high net worth borrowers supported by 60. 0% $1.6 $20 .0 $18.2 diverse collateral and cash flow sources $1.5 50. 0% $16.9 $15 .0 $13.1 $16.7 Focus on dense, highly-populated markets $0.9 $16.0 40. 0% $10 .0 $12.4 Granular portfolio with average loan balance of $2.7mm $9.5 30. 0% $5. 0 $7.1 $6.9 $4.8 Weighted average DSCR of 1.7x $4.3 $2.7 $0. 0 20. 0% 2017 2018 2019 2020 1Q21 Weighted average LTV of 56% C&I CRE Construction Commercial Loans / Total Loans C&I Commercial Loans by Geography C&I CRE Consistent and conservative underwriting across markets New York 24% New York Other Other Diverse industry focus 36% 14% 17% Nationwide Businesses: Equipment Financing (Highland Capital) and Premium Finance New Jersey Florida New Weighted average DSCR of 2.7x Florida 32% 26% Jersey 27% 24% Note: Underwriting metrics as of 3/31/2021
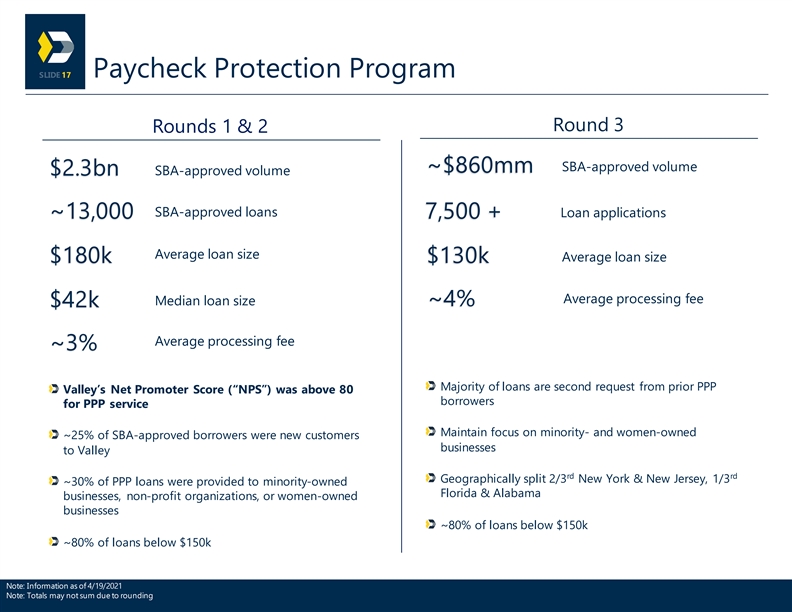
17 Paycheck Protection Program Round 3 Rounds 1 & 2 SBA-approved volume ~$860mm SBA-approved volume $2.3bn SBA-approved loans Loan applications ~13,000 7,500 + Average loan size Average loan size $180k $130k Average processing fee Median loan size ~4% $42k Average processing fee ~3% Majority of loans are second request from prior PPP Valley’s Net Promoter Score (“NPS”) was above 80 borrowers for PPP service Maintain focus on minority- and women-owned ~25% of SBA-approved borrowers were new customers businesses to Valley rd rd Geographically split 2/3 New York & New Jersey, 1/3 ~30% of PPP loans were provided to minority-owned Florida & Alabama businesses, non-profit organizations, or women-owned businesses ~80% of loans below $150k ~80% of loans below $150k Note: Information as of 4/19/2021 Note: Totals may not sum due to rounding17 Paycheck Protection Program Round 3 Rounds 1 & 2 SBA-approved volume ~$860mm SBA-approved volume $2.3bn SBA-approved loans Loan applications ~13,000 7,500 + Average loan size Average loan size $180k $130k Average processing fee Median loan size ~4% $42k Average processing fee ~3% Majority of loans are second request from prior PPP Valley’s Net Promoter Score (“NPS”) was above 80 borrowers for PPP service Maintain focus on minority- and women-owned ~25% of SBA-approved borrowers were new customers businesses to Valley rd rd Geographically split 2/3 New York & New Jersey, 1/3 ~30% of PPP loans were provided to minority-owned Florida & Alabama businesses, non-profit organizations, or women-owned businesses ~80% of loans below $150k ~80% of loans below $150k Note: Information as of 4/19/2021 Note: Totals may not sum due to rounding
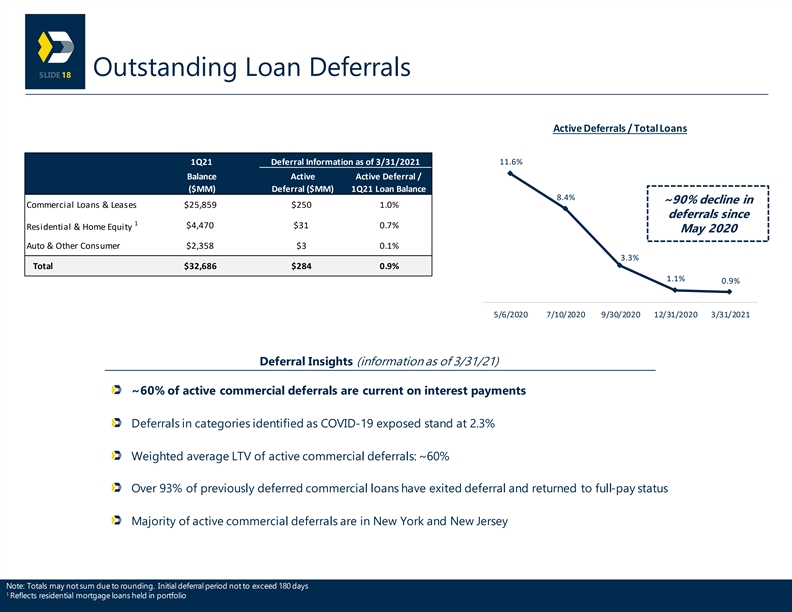
Outstanding Loan Deferrals 18 Active Deferrals / Total Loans 1Q21 Deferral Information as of 3/31/2021 11.6% Balance Active Active Deferral / ($MM) Deferral ($MM) 1Q21 Loan Balance 8.4% ~90% decline in Commercial Loans & Leases $25,859 $250 1.0% deferrals since 1 $4,470 $31 0.7% Residential & Home Equity May 2020 Auto & Other Consumer $2,358 $3 0.1% 3.3% Total $32,686 $284 0.9% 1.1% 0.9% 5/6/2020 7/10/2020 9/30/2020 12/31/2020 3/31/2021 Deferral Insights (information as of 3/31/21) ~60% of active commercial deferrals are current on interest payments Deferrals in categories identified as COVID-19 exposed stand at 2.3% Weighted average LTV of active commercial deferrals: ~60% Over 93% of previously deferred commercial loans have exited deferral and returned to full-pay status Majority of active commercial deferrals are in New York and New Jersey Note: Totals may not sum due to rounding. Initial deferral period not to exceed 180 days 1 Reflects residential mortgage loans held in portfolio Outstanding Loan Deferrals 18 Active Deferrals / Total Loans 1Q21 Deferral Information as of 3/31/2021 11.6% Balance Active Active Deferral / ($MM) Deferral ($MM) 1Q21 Loan Balance 8.4% ~90% decline in Commercial Loans & Leases $25,859 $250 1.0% deferrals since 1 $4,470 $31 0.7% Residential & Home Equity May 2020 Auto & Other Consumer $2,358 $3 0.1% 3.3% Total $32,686 $284 0.9% 1.1% 0.9% 5/6/2020 7/10/2020 9/30/2020 12/31/2020 3/31/2021 Deferral Insights (information as of 3/31/21) ~60% of active commercial deferrals are current on interest payments Deferrals in categories identified as COVID-19 exposed stand at 2.3% Weighted average LTV of active commercial deferrals: ~60% Over 93% of previously deferred commercial loans have exited deferral and returned to full-pay status Majority of active commercial deferrals are in New York and New Jersey Note: Totals may not sum due to rounding. Initial deferral period not to exceed 180 days 1 Reflects residential mortgage loans held in portfolio

COVID-19 Exposed Loan Segments 19 Non-PPP Loan Balance (3/31/21) Deferrals / Loans 1 Borrower Industry ($MM) % of non-PPP Loans 3/31/21 12/31/20 9/30/20 7/10/20 5/6/20 Primary Exposure Doctor & Surgery $494 1.6% 2.6% 0.9% 4.9% 16.5% 29.9% Retail Trade 585 1.9% 2.7% 2.7% 3.5% 21.2% 32.4% Hotels & Hospitality 505 1.7% -- -- 15.0% 12.3% 45.7% Restaurants & Foodservice 323 1.1% 5.9% 7.9% 8.7% 11.3% 25.2% Entertainment & Recreation 225 0.7% -- 1.7% 1.0% 7.7% 9.4% Primary Exposure Sub-Total $2,132 7.0% 2.3% 2.3% 7.1% 14.8% 31.3% Exposure to primary COVID-19 exposed loan segments has remained stable at roughly 7% of non-PPP loans Active loan deferrals in “Primary Exposure” categories were stable from December 31, 2020 at 2.3% 2 Active loan deferrals in previously disclosed “Secondary Exposure” categories are immaterial at 0.2% Note: Totals may not sum due to rounding 1 2 Borrower industry based on NAICS and SIC codes. Secondary categories: Nursing & Residential Care, Wholesale Trade, Manufacturing, Child Care & EducationCOVID-19 Exposed Loan Segments 19 Non-PPP Loan Balance (3/31/21) Deferrals / Loans 1 Borrower Industry ($MM) % of non-PPP Loans 3/31/21 12/31/20 9/30/20 7/10/20 5/6/20 Primary Exposure Doctor & Surgery $494 1.6% 2.6% 0.9% 4.9% 16.5% 29.9% Retail Trade 585 1.9% 2.7% 2.7% 3.5% 21.2% 32.4% Hotels & Hospitality 505 1.7% -- -- 15.0% 12.3% 45.7% Restaurants & Foodservice 323 1.1% 5.9% 7.9% 8.7% 11.3% 25.2% Entertainment & Recreation 225 0.7% -- 1.7% 1.0% 7.7% 9.4% Primary Exposure Sub-Total $2,132 7.0% 2.3% 2.3% 7.1% 14.8% 31.3% Exposure to primary COVID-19 exposed loan segments has remained stable at roughly 7% of non-PPP loans Active loan deferrals in “Primary Exposure” categories were stable from December 31, 2020 at 2.3% 2 Active loan deferrals in previously disclosed “Secondary Exposure” categories are immaterial at 0.2% Note: Totals may not sum due to rounding 1 2 Borrower industry based on NAICS and SIC codes. Secondary categories: Nursing & Residential Care, Wholesale Trade, Manufacturing, Child Care & Education
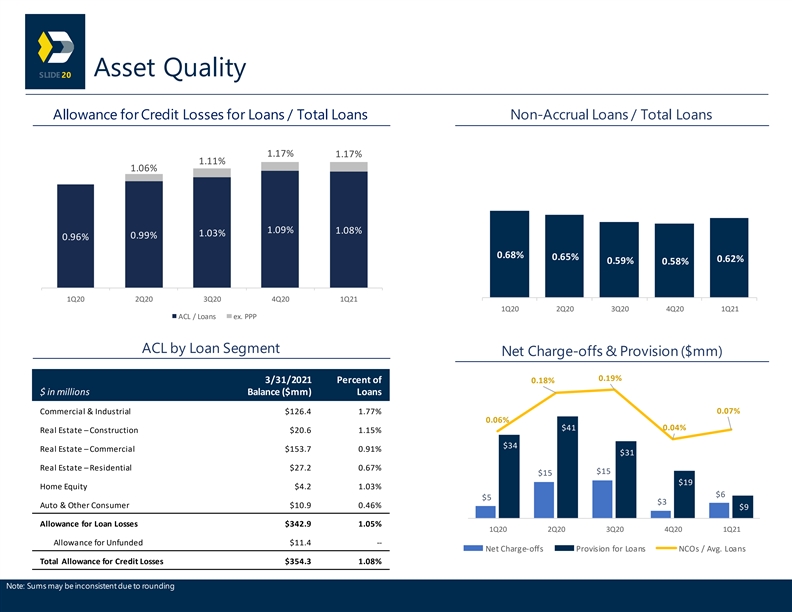
Asset Quality 20 Allowance for Credit Losses for Loans / Total Loans Non-Accrual Loans / Total Loans 1.17% 1.17% 1.11% 1.06% 1.09% 1.08% 1.03% 0.99% 0.96% 0.68% 0.65% 0.62% 0.59% 0.58% 1Q20 2Q20 3Q20 4Q20 1Q21 1Q20 2Q20 3Q20 4Q20 1Q21 ACL / Loans ex. PPP ACL by Loan Segment Net Charge-offs & Provision ($mm) 0.19% 3/31/2021 Percent of 0.18% $ in millions Balance ($mm) Loans Commercial & Industrial $126.4 1.77% 0.07% 0.06% 0.04% $41 Real Estate – Construction $20.6 1.15% $34 Real Estate – Commercial $153.7 0.91% $31 Real Estate – Residential $27.2 0.67% $15 1.03% $15 $19 Home Equity $4.2 1.03% $6 $5 $3 Auto & Other Consumer $10.9 0.46% $9 0.99% Allowance for Loan Losses $342.9 1.05% 1Q20 2Q20 3Q20 4Q20 1Q21 Allowance for Unfunded $11.4 -- Net Charge-offs Provision for Loans NCOs / Avg. Loans Total Allowance for Credit Losses $354.3 1.08% Note: Sums may be inconsistent due to roundingAsset Quality 20 Allowance for Credit Losses for Loans / Total Loans Non-Accrual Loans / Total Loans 1.17% 1.17% 1.11% 1.06% 1.09% 1.08% 1.03% 0.99% 0.96% 0.68% 0.65% 0.62% 0.59% 0.58% 1Q20 2Q20 3Q20 4Q20 1Q21 1Q20 2Q20 3Q20 4Q20 1Q21 ACL / Loans ex. PPP ACL by Loan Segment Net Charge-offs & Provision ($mm) 0.19% 3/31/2021 Percent of 0.18% $ in millions Balance ($mm) Loans Commercial & Industrial $126.4 1.77% 0.07% 0.06% 0.04% $41 Real Estate – Construction $20.6 1.15% $34 Real Estate – Commercial $153.7 0.91% $31 Real Estate – Residential $27.2 0.67% $15 1.03% $15 $19 Home Equity $4.2 1.03% $6 $5 $3 Auto & Other Consumer $10.9 0.46% $9 0.99% Allowance for Loan Losses $342.9 1.05% 1Q20 2Q20 3Q20 4Q20 1Q21 Allowance for Unfunded $11.4 -- Net Charge-offs Provision for Loans NCOs / Avg. Loans Total Allowance for Credit Losses $354.3 1.08% Note: Sums may be inconsistent due to rounding
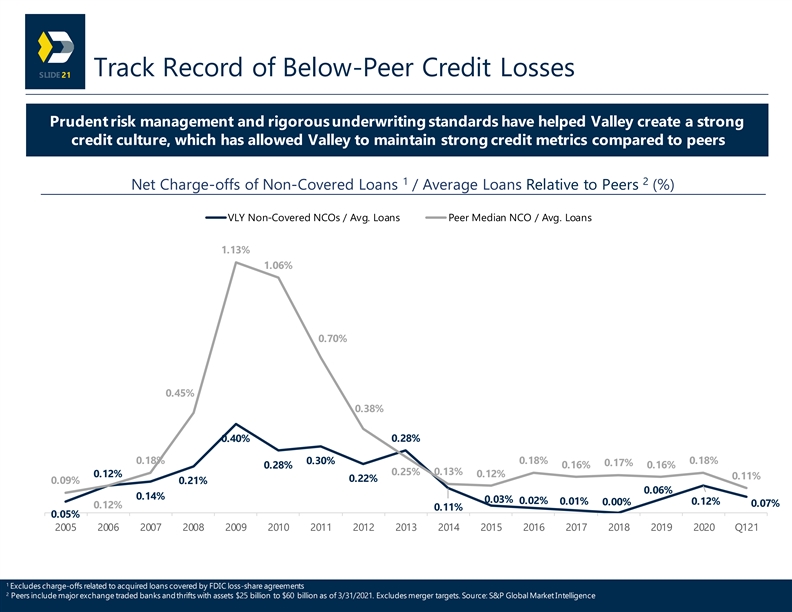
Track Record of Below-Peer Credit Losses 21 Prudent risk management and rigorous underwriting standards have helped Valley create a strong credit culture, which has allowed Valley to maintain strong credit metrics compared to peers 1 2 Net Charge-offs of Non-Covered Loans / Average Loans Relative to Peers (%) VLY Non-Covered NCOs / Avg. Loans Peer Median NCO / Avg. Loans 1.13% 1.06% 0.70% 0.45% 0.38% 0.40% 0.28% 0.18% 0.30% 0.18% 0.18% 0.17% 0.16% 0.16% 0.28% 0.25% 0.13% 0.12% 0.12% 0.11% 0.22% 0.09% 0.21% 0.06% 0.14% 0.03% 0.02% 0.01% 0.00% 0.12% 0.07% 0.12% 0.11% 0.05% 2005 2006 2007 2008 2009 2010 2011 2012 2013 2014 2015 2016 2017 2018 2019 2020 Q121 1 Excludes charge-offs related to acquired loans covered by FDIC loss-share agreements 2 Peers include major exchange traded banks and thrifts with assets $25 billion to $60 billion as of 3/31/2021. Excludes merger targets. Source: S&P Global Market IntelligenceTrack Record of Below-Peer Credit Losses 21 Prudent risk management and rigorous underwriting standards have helped Valley create a strong credit culture, which has allowed Valley to maintain strong credit metrics compared to peers 1 2 Net Charge-offs of Non-Covered Loans / Average Loans Relative to Peers (%) VLY Non-Covered NCOs / Avg. Loans Peer Median NCO / Avg. Loans 1.13% 1.06% 0.70% 0.45% 0.38% 0.40% 0.28% 0.18% 0.30% 0.18% 0.18% 0.17% 0.16% 0.16% 0.28% 0.25% 0.13% 0.12% 0.12% 0.11% 0.22% 0.09% 0.21% 0.06% 0.14% 0.03% 0.02% 0.01% 0.00% 0.12% 0.07% 0.12% 0.11% 0.05% 2005 2006 2007 2008 2009 2010 2011 2012 2013 2014 2015 2016 2017 2018 2019 2020 Q121 1 Excludes charge-offs related to acquired loans covered by FDIC loss-share agreements 2 Peers include major exchange traded banks and thrifts with assets $25 billion to $60 billion as of 3/31/2021. Excludes merger targets. Source: S&P Global Market Intelligence
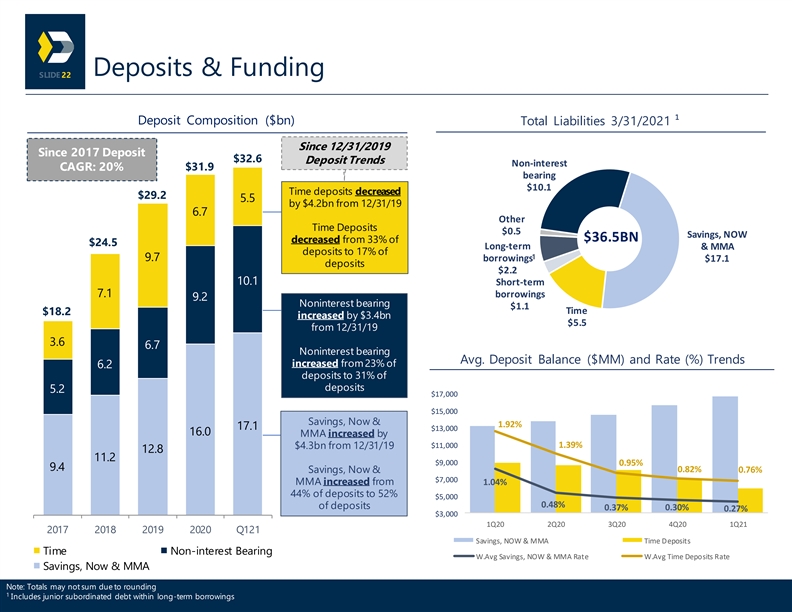
Deposits & Funding 22 Deposit Composition ($bn) Total Liabilities 3/31/2021 ¹ Since 12/31/2019 Since 2017 Deposit $32.6 Deposit Trends Non-interest CAGR: 20% $31.9 bearing $10.1 Time deposits decreased $29.2 5.5 by $4.2bn from 12/31/19 6.7 Other Time Deposits $0.5 Savings, NOW $36.5BN decreased from 33% of $24.5 Long-term & MMA deposits to 17% of 1 9.7 borrowings $17.1 deposits $2.2 10.1 Short-term 7.1 borrowings 9.2 Noninterest bearing $1.1 Time $18.2 increased by $3.4bn $5.5 from 12/31/19 3.6 6.7 Noninterest bearing Avg. Deposit Balance ($MM) and Rate (%) Trends increased from 23% of 6.2 deposits to 31% of deposits 5.2 $17,000 $15,000 Savings, Now & 1.92% 17.1 $13,000 16.0 MMA increased by $11,000 1.39% $4.3bn from 12/31/19 12.8 11.2 $9,000 0.95% 9.4 0.82% Savings, Now & 0.76% $7,000 MMA increased from 1.04% 44% of deposits to 52% $5,000 0.48% of deposits 0.30% 0.37% 0.27% $3,000 1Q20 2Q20 3Q20 4Q20 1Q21 2017 2018 2019 2020 Q121 Savings, NOW & MMA Time Deposits Time Non-interest Bearing W.Avg Savings, NOW & MMA Rate W.Avg Time Deposits Rate Savings, Now & MMA Note: Totals may not sum due to rounding 1 Includes junior subordinated debt within long-term borrowingsDeposits & Funding 22 Deposit Composition ($bn) Total Liabilities 3/31/2021 ¹ Since 12/31/2019 Since 2017 Deposit $32.6 Deposit Trends Non-interest CAGR: 20% $31.9 bearing $10.1 Time deposits decreased $29.2 5.5 by $4.2bn from 12/31/19 6.7 Other Time Deposits $0.5 Savings, NOW $36.5BN decreased from 33% of $24.5 Long-term & MMA deposits to 17% of 1 9.7 borrowings $17.1 deposits $2.2 10.1 Short-term 7.1 borrowings 9.2 Noninterest bearing $1.1 Time $18.2 increased by $3.4bn $5.5 from 12/31/19 3.6 6.7 Noninterest bearing Avg. Deposit Balance ($MM) and Rate (%) Trends increased from 23% of 6.2 deposits to 31% of deposits 5.2 $17,000 $15,000 Savings, Now & 1.92% 17.1 $13,000 16.0 MMA increased by $11,000 1.39% $4.3bn from 12/31/19 12.8 11.2 $9,000 0.95% 9.4 0.82% Savings, Now & 0.76% $7,000 MMA increased from 1.04% 44% of deposits to 52% $5,000 0.48% of deposits 0.30% 0.37% 0.27% $3,000 1Q20 2Q20 3Q20 4Q20 1Q21 2017 2018 2019 2020 Q121 Savings, NOW & MMA Time Deposits Time Non-interest Bearing W.Avg Savings, NOW & MMA Rate W.Avg Time Deposits Rate Savings, Now & MMA Note: Totals may not sum due to rounding 1 Includes junior subordinated debt within long-term borrowings
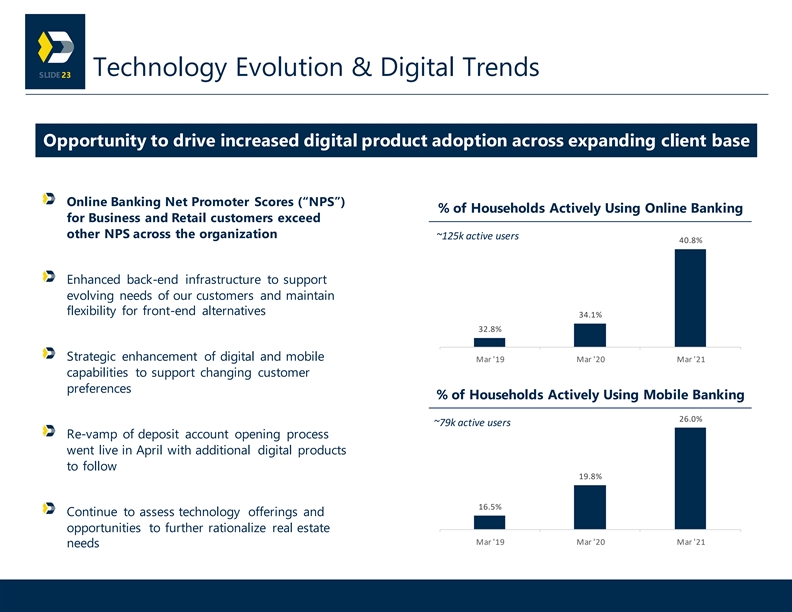
Technology Evolution & Digital Trends 23 Opportunity to drive increased digital product adoption across expanding client base Online Banking Net Promoter Scores (“NPS”) % of Households Actively Using Online Banking for Business and Retail customers exceed other NPS across the organization ~125k active users 40.8% Enhanced back-end infrastructure to support evolving needs of our customers and maintain flexibility for front-end alternatives 34.1% 32.8% Strategic enhancement of digital and mobile Mar '19 Mar '20 Mar '21 capabilities to support changing customer preferences % of Households Actively Using Mobile Banking 26.0% ~79k active users Re-vamp of deposit account opening process went live in April with additional digital products to follow 19.8% 16.5% Continue to assess technology offerings and opportunities to further rationalize real estate Mar '19 Mar '20 Mar '21 needsTechnology Evolution & Digital Trends 23 Opportunity to drive increased digital product adoption across expanding client base Online Banking Net Promoter Scores (“NPS”) % of Households Actively Using Online Banking for Business and Retail customers exceed other NPS across the organization ~125k active users 40.8% Enhanced back-end infrastructure to support evolving needs of our customers and maintain flexibility for front-end alternatives 34.1% 32.8% Strategic enhancement of digital and mobile Mar '19 Mar '20 Mar '21 capabilities to support changing customer preferences % of Households Actively Using Mobile Banking 26.0% ~79k active users Re-vamp of deposit account opening process went live in April with additional digital products to follow 19.8% 16.5% Continue to assess technology offerings and opportunities to further rationalize real estate Mar '19 Mar '20 Mar '21 needs
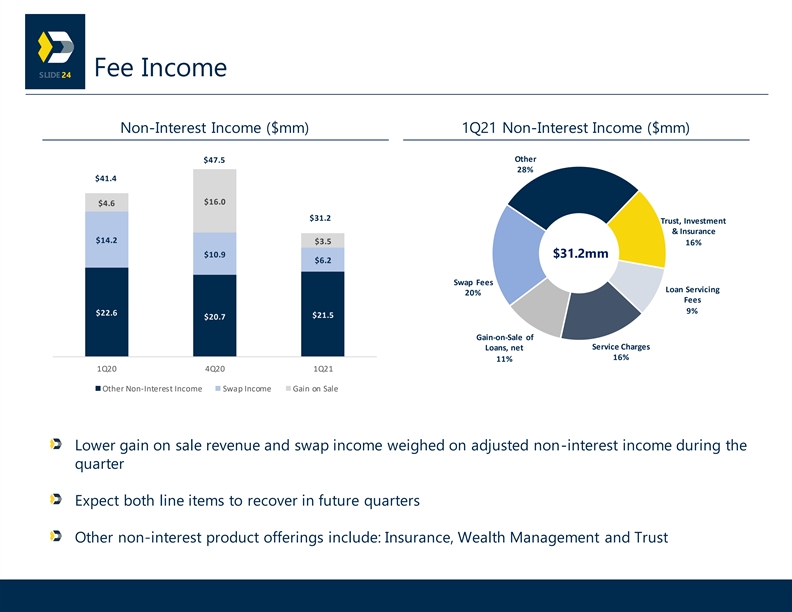
Fee Income 24 Non-Interest Income ($mm) 1Q21 Non-Interest Income ($mm) Other $47.5 28% $41.4 $16.0 $4.6 $31.2 Trust, Investment & Insurance $14.2 $3.5 16% $10.9 $31.2mm $6.2 Swap Fees Loan Servicing 20% Fees 9% $22.6 $21.5 $20.7 Gain-on-Sale of Service Charges Loans, net 16% 11% 1Q20 4Q20 1Q21 Other Non-Interest Income Swap Income Gain on Sale Lower gain on sale revenue and swap income weighed on adjusted non-interest income during the quarter Expect both line items to recover in future quarters Other non-interest product offerings include: Insurance, Wealth Management and TrustFee Income 24 Non-Interest Income ($mm) 1Q21 Non-Interest Income ($mm) Other $47.5 28% $41.4 $16.0 $4.6 $31.2 Trust, Investment & Insurance $14.2 $3.5 16% $10.9 $31.2mm $6.2 Swap Fees Loan Servicing 20% Fees 9% $22.6 $21.5 $20.7 Gain-on-Sale of Service Charges Loans, net 16% 11% 1Q20 4Q20 1Q21 Other Non-Interest Income Swap Income Gain on Sale Lower gain on sale revenue and swap income weighed on adjusted non-interest income during the quarter Expect both line items to recover in future quarters Other non-interest product offerings include: Insurance, Wealth Management and Trust
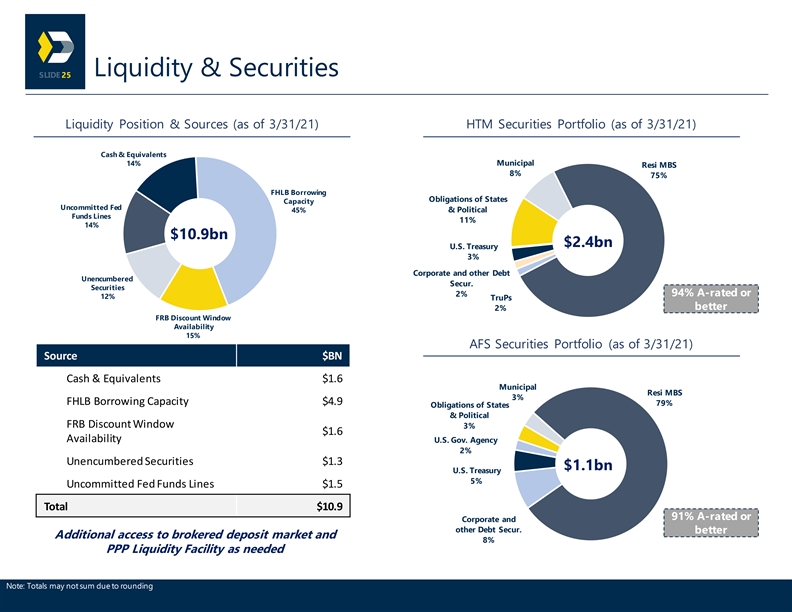
Liquidity & Securities 25 Liquidity Position & Sources (as of 3/31/21) HTM Securities Portfolio (as of 3/31/21) Cash & Equivalents 14% Municipal Resi MBS 8% 75% FHLB Borrowing Obligations of States Capacity Uncommitted Fed & Political 45% Funds Lines 11% 14% $10.9bn $2.4bn U.S. Treasury 3% Corporate and other Debt Unencumbered Secur. Securities 94% A-rated or 2% 12% TruPs better 2% FRB Discount Window Availability 15% AFS Securities Portfolio (as of 3/31/21) Source $BN Cash & Equivalents $1.6 Municipal Resi MBS 3% FHLB Borrowing Capacity $4.9 79% Obligations of States & Political FRB Discount Window 3% $1.6 Availability U.S. Gov. Agency 2% Unencumbered Securities $1.3 $1.1bn U.S. Treasury 5% Uncommitted Fed Funds Lines $1.5 Total $10.9 91% A-rated or Corporate and other Debt Secur. better Additional access to brokered deposit market and 8% PPP Liquidity Facility as needed Note: Totals may not sum due to roundingLiquidity & Securities 25 Liquidity Position & Sources (as of 3/31/21) HTM Securities Portfolio (as of 3/31/21) Cash & Equivalents 14% Municipal Resi MBS 8% 75% FHLB Borrowing Obligations of States Capacity Uncommitted Fed & Political 45% Funds Lines 11% 14% $10.9bn $2.4bn U.S. Treasury 3% Corporate and other Debt Unencumbered Secur. Securities 94% A-rated or 2% 12% TruPs better 2% FRB Discount Window Availability 15% AFS Securities Portfolio (as of 3/31/21) Source $BN Cash & Equivalents $1.6 Municipal Resi MBS 3% FHLB Borrowing Capacity $4.9 79% Obligations of States & Political FRB Discount Window 3% $1.6 Availability U.S. Gov. Agency 2% Unencumbered Securities $1.3 $1.1bn U.S. Treasury 5% Uncommitted Fed Funds Lines $1.5 Total $10.9 91% A-rated or Corporate and other Debt Secur. better Additional access to brokered deposit market and 8% PPP Liquidity Facility as needed Note: Totals may not sum due to rounding
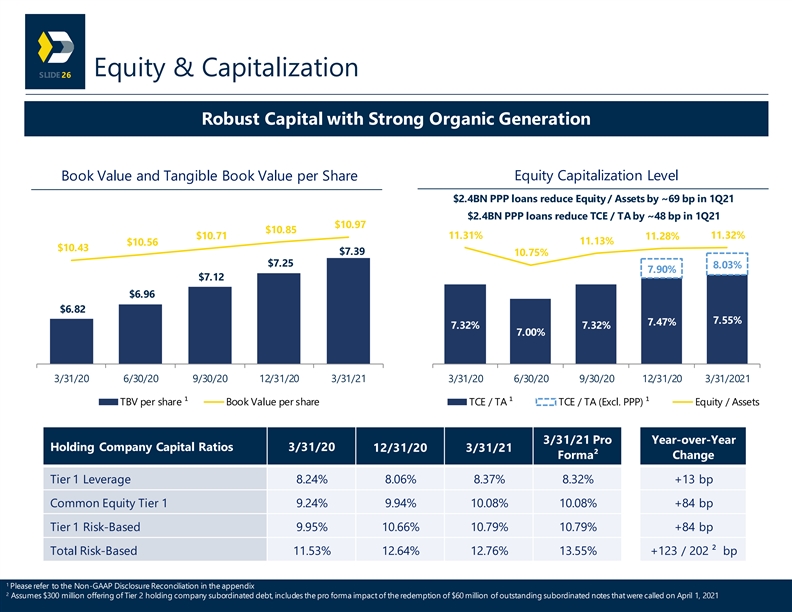
Equity & Capitalization 26 Robust Capital with Strong Organic Generation Equity Capitalization Level Book Value and Tangible Book Value per Share $2.4BN PPP loans reduce Equity / Assets by ~69 bp in 1Q21 $2.4BN PPP loans reduce TCE / TA by ~48 bp in 1Q21 $10.97 $10.85 $10.71 11.31% 11.32% 11.28% 11.13% $10.56 $10.43 $7.39 10.75% $7.25 8.03% 7.90% $7.12 $6.96 $6.82 7.55% 7.47% 7.32% 7.32% 7.00% 3/31/20 6/30/20 9/30/20 12/31/20 3/31/21 3/31/20 6/30/20 9/30/20 12/31/20 3/31/2021 TBV per share ¹ Book Value per share TCE / TA ¹ TCE / TA (Excl. PPP) ¹ Equity / Assets 3/31/21 Pro Year-over-Year Holding Company Capital Ratios 3/31/20 12/31/20 3/31/21 Forma² Change Tier 1 Leverage 8.24% 8.06% 8.37% 8.32% +13 bp Common Equity Tier 1 9.24% 9.94% 10.08% 10.08% +84 bp Tier 1 Risk-Based 9.95% 10.66% 10.79% 10.79% +84 bp Total Risk-Based 11.53% 12.64% 12.76% 13.55% +123 / 202 ² bp 1 Please refer to the Non-GAAP Disclosure Reconciliation in the appendix 2 Assumes $300 million offering of Tier 2 holding company subordinated debt, includes the pro forma impact of the redemption of $60 million of outstanding subordinated notes that were called on April 1, 2021Equity & Capitalization 26 Robust Capital with Strong Organic Generation Equity Capitalization Level Book Value and Tangible Book Value per Share $2.4BN PPP loans reduce Equity / Assets by ~69 bp in 1Q21 $2.4BN PPP loans reduce TCE / TA by ~48 bp in 1Q21 $10.97 $10.85 $10.71 11.31% 11.32% 11.28% 11.13% $10.56 $10.43 $7.39 10.75% $7.25 8.03% 7.90% $7.12 $6.96 $6.82 7.55% 7.47% 7.32% 7.32% 7.00% 3/31/20 6/30/20 9/30/20 12/31/20 3/31/21 3/31/20 6/30/20 9/30/20 12/31/20 3/31/2021 TBV per share ¹ Book Value per share TCE / TA ¹ TCE / TA (Excl. PPP) ¹ Equity / Assets 3/31/21 Pro Year-over-Year Holding Company Capital Ratios 3/31/20 12/31/20 3/31/21 Forma² Change Tier 1 Leverage 8.24% 8.06% 8.37% 8.32% +13 bp Common Equity Tier 1 9.24% 9.94% 10.08% 10.08% +84 bp Tier 1 Risk-Based 9.95% 10.66% 10.79% 10.79% +84 bp Total Risk-Based 11.53% 12.64% 12.76% 13.55% +123 / 202 ² bp 1 Please refer to the Non-GAAP Disclosure Reconciliation in the appendix 2 Assumes $300 million offering of Tier 2 holding company subordinated debt, includes the pro forma impact of the redemption of $60 million of outstanding subordinated notes that were called on April 1, 2021
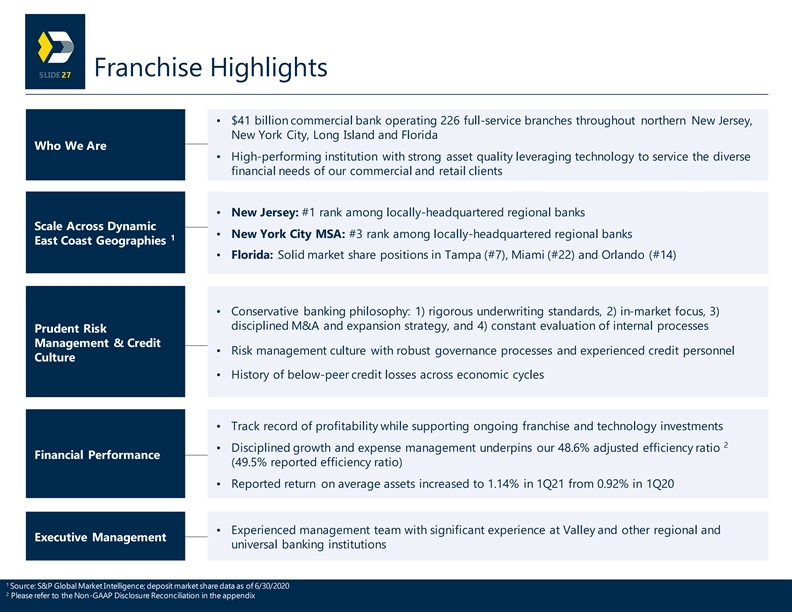
Franchise Highlights 27 • $41 billion commercial bank operating 226 full-service branches throughout northern New Jersey, New York City, Long Island and Florida Who We Are • High-performing institution with strong asset quality leveraging technology to service the diverse financial needs of our commercial and retail clients • New Jersey: #1 rank among locally-headquartered regional banks Scale Across Dynamic • New York City MSA: #3 rank among locally-headquartered regional banks 1 East Coast Geographies • Florida: Solid market share positions in Tampa (#7), Miami (#22) and Orlando (#14) • Conservative banking philosophy: 1) rigorous underwriting standards, 2) in-market focus, 3) disciplined M&A and expansion strategy, and 4) constant evaluation of internal processes Prudent Risk Management & Credit • Risk management culture with robust governance processes and experienced credit personnel Culture • History of below-peer credit losses across economic cycles • Track record of profitability while supporting ongoing franchise and technology investments 2 • Disciplined growth and expense management underpins our 48.6% adjusted efficiency ratio Financial Performance (49.5% reported efficiency ratio) • Reported return on average assets increased to 1.14% in 1Q21 from 0.92% in 1Q20 • Experienced management team with significant experience at Valley and other regional and Executive Management universal banking institutions 1 Source: S&P Global Market Intelligence; deposit market share data as of 6/30/2020 2 Please refer to the Non-GAAP Disclosure Reconciliation in the appendixFranchise Highlights 27 • $41 billion commercial bank operating 226 full-service branches throughout northern New Jersey, New York City, Long Island and Florida Who We Are • High-performing institution with strong asset quality leveraging technology to service the diverse financial needs of our commercial and retail clients • New Jersey: #1 rank among locally-headquartered regional banks Scale Across Dynamic • New York City MSA: #3 rank among locally-headquartered regional banks 1 East Coast Geographies • Florida: Solid market share positions in Tampa (#7), Miami (#22) and Orlando (#14) • Conservative banking philosophy: 1) rigorous underwriting standards, 2) in-market focus, 3) disciplined M&A and expansion strategy, and 4) constant evaluation of internal processes Prudent Risk Management & Credit • Risk management culture with robust governance processes and experienced credit personnel Culture • History of below-peer credit losses across economic cycles • Track record of profitability while supporting ongoing franchise and technology investments 2 • Disciplined growth and expense management underpins our 48.6% adjusted efficiency ratio Financial Performance (49.5% reported efficiency ratio) • Reported return on average assets increased to 1.14% in 1Q21 from 0.92% in 1Q20 • Experienced management team with significant experience at Valley and other regional and Executive Management universal banking institutions 1 Source: S&P Global Market Intelligence; deposit market share data as of 6/30/2020 2 Please refer to the Non-GAAP Disclosure Reconciliation in the appendix

A p p e n d i xA p p e n d i x
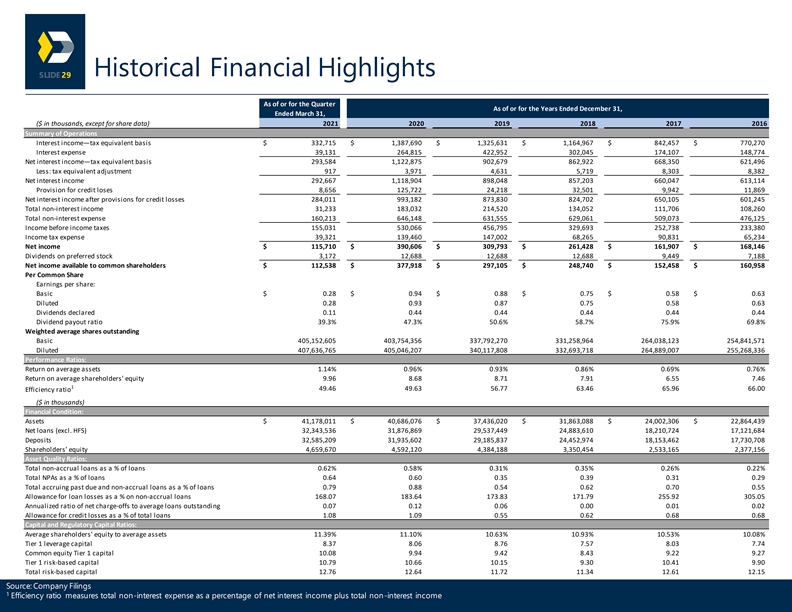
Historical Financial Highlights 29 As of or for the Quarter As of or for the Years Ended December 31, Ended March 31, ($ in thousands, except for share data) 2021 2020 2019 2018 2017 2016 Summary of Operations Interest income—tax equivalent basis $ 332,715 $ 1,387,690 $ 1,325,631 $ 1,164,967 $ 842,457 $ 770,270 Interest expense 39,131 264,815 422,952 302,045 174,107 148,774 Net interest income—tax equivalent basis 293,584 1,122,875 902,679 862,922 668,350 621,496 Less: tax equivalent adjustment 917 3,971 4,631 5,719 8,303 8,382 Net interest income 292,667 1,118,904 898,048 857,203 660,047 613,114 Provision for credit loses 8,656 125,722 24,218 32,501 9,942 11,869 Net interest income after provisions for credit losses 284,011 993,182 873,830 824,702 650,105 601,245 Total non-interest income 31,233 183,032 214,520 134,052 111,706 108,260 Total non-interest expense 160,213 646,148 631,555 629,061 509,073 476,125 Income before income taxes 155,031 530,066 456,795 329,693 252,738 233,380 Income tax expense 39,321 139,460 147,002 68,265 90,831 65,234 Net income $ 115,710 $ 390,606 $ 309,793 $ 261,428 $ 161,907 $ 168,146 Dividends on preferred stock 3,172 12,688 12,688 12,688 9,449 7,188 Net income available to common shareholders $ 112,538 $ 377,918 $ 297,105 $ 248,740 $ 152,458 $ 160,958 Per Common Share Earnings per share: Basic $ 0.28 $ 0.94 $ 0.88 $ 0.75 $ 0.58 $ 0.63 Diluted 0.28 0.93 0.87 0.75 0.58 0.63 Dividends declared 0.11 0.44 0.44 0.44 0.44 0.44 Dividend payout ratio 39.3% 47.3% 50.6% 58.7% 75.9% 69.8% Weighted average shares outstanding Basic 405,152,605 403,754,356 337,792,270 331,258,964 264,038,123 254,841,571 Diluted 407,636,765 405,046,207 340,117,808 332,693,718 264,889,007 255,268,336 Performance Ratios: Return on average assets 1.14% 0.96% 0.93% 0.86% 0.69% 0.76% Return on average shareholders' equity 9.96 8.68 8.71 7.91 6.55 7.46 1 49.46 49.63 56.77 63.46 65.96 66.00 Efficiency ratio ($ in thousands) Financial Condition: Assets $ 4 1,178,011 $ 40,686,076 $ 3 7,436,020 $ 31,863,088 $ 24,002,306 $ 22,864,439 Net loans (excl. HFS) 32,343,536 31,876,869 29,537,449 24,883,610 18,210,724 17,121,684 Deposits 32,585,209 31,935,602 29,185,837 24,452,974 18,153,462 17,730,708 Shareholders' equity 4,659,670 4,592,120 4,384,188 3,350,454 2,533,165 2,377,156 Asset Quality Ratios: Total non-accrual loans as a % of loans 0.62% 0.58% 0.31% 0.35% 0.26% 0.22% Total NPAs as a % of loans 0.64 0.60 0.35 0.39 0.31 0.29 Total accruing past due and non-accrual loans as a % of loans 0.79 0.88 0.54 0.62 0.70 0.55 Allowance for loan losses as a % on non-accrual loans 168.07 183.64 173.83 171.79 255.92 305.05 Annualized ratio of net charge-offs to average loans outstanding 0.07 0.12 0.06 0.00 0.01 0.02 Allowance for credit losses as a % of total loans 1.08 1.09 0.55 0.62 0.68 0.68 Capital and Regulatory Capital Ratios: Average shareholders' equity to average assets 11.39% 11.10% 10.63% 10.93% 10.53% 10.08% Tier 1 leverage capital 8.37 8.06 8.76 7.57 8.03 7.74 Common equity Tier 1 capital 10.08 9.94 9.42 8.43 9.22 9.27 Tier 1 risk-based capital 10.79 10.66 10.15 9.30 10.41 9.90 Total risk-based capital 12.76 12.64 11.72 11.34 12.61 12.15 Source: Company Filings 1 Efficiency ratio measures total non-interest expense as a percentage of net interest income plus total non-interest incomeHistorical Financial Highlights 29 As of or for the Quarter As of or for the Years Ended December 31, Ended March 31, ($ in thousands, except for share data) 2021 2020 2019 2018 2017 2016 Summary of Operations Interest income—tax equivalent basis $ 332,715 $ 1,387,690 $ 1,325,631 $ 1,164,967 $ 842,457 $ 770,270 Interest expense 39,131 264,815 422,952 302,045 174,107 148,774 Net interest income—tax equivalent basis 293,584 1,122,875 902,679 862,922 668,350 621,496 Less: tax equivalent adjustment 917 3,971 4,631 5,719 8,303 8,382 Net interest income 292,667 1,118,904 898,048 857,203 660,047 613,114 Provision for credit loses 8,656 125,722 24,218 32,501 9,942 11,869 Net interest income after provisions for credit losses 284,011 993,182 873,830 824,702 650,105 601,245 Total non-interest income 31,233 183,032 214,520 134,052 111,706 108,260 Total non-interest expense 160,213 646,148 631,555 629,061 509,073 476,125 Income before income taxes 155,031 530,066 456,795 329,693 252,738 233,380 Income tax expense 39,321 139,460 147,002 68,265 90,831 65,234 Net income $ 115,710 $ 390,606 $ 309,793 $ 261,428 $ 161,907 $ 168,146 Dividends on preferred stock 3,172 12,688 12,688 12,688 9,449 7,188 Net income available to common shareholders $ 112,538 $ 377,918 $ 297,105 $ 248,740 $ 152,458 $ 160,958 Per Common Share Earnings per share: Basic $ 0.28 $ 0.94 $ 0.88 $ 0.75 $ 0.58 $ 0.63 Diluted 0.28 0.93 0.87 0.75 0.58 0.63 Dividends declared 0.11 0.44 0.44 0.44 0.44 0.44 Dividend payout ratio 39.3% 47.3% 50.6% 58.7% 75.9% 69.8% Weighted average shares outstanding Basic 405,152,605 403,754,356 337,792,270 331,258,964 264,038,123 254,841,571 Diluted 407,636,765 405,046,207 340,117,808 332,693,718 264,889,007 255,268,336 Performance Ratios: Return on average assets 1.14% 0.96% 0.93% 0.86% 0.69% 0.76% Return on average shareholders' equity 9.96 8.68 8.71 7.91 6.55 7.46 1 49.46 49.63 56.77 63.46 65.96 66.00 Efficiency ratio ($ in thousands) Financial Condition: Assets $ 4 1,178,011 $ 40,686,076 $ 3 7,436,020 $ 31,863,088 $ 24,002,306 $ 22,864,439 Net loans (excl. HFS) 32,343,536 31,876,869 29,537,449 24,883,610 18,210,724 17,121,684 Deposits 32,585,209 31,935,602 29,185,837 24,452,974 18,153,462 17,730,708 Shareholders' equity 4,659,670 4,592,120 4,384,188 3,350,454 2,533,165 2,377,156 Asset Quality Ratios: Total non-accrual loans as a % of loans 0.62% 0.58% 0.31% 0.35% 0.26% 0.22% Total NPAs as a % of loans 0.64 0.60 0.35 0.39 0.31 0.29 Total accruing past due and non-accrual loans as a % of loans 0.79 0.88 0.54 0.62 0.70 0.55 Allowance for loan losses as a % on non-accrual loans 168.07 183.64 173.83 171.79 255.92 305.05 Annualized ratio of net charge-offs to average loans outstanding 0.07 0.12 0.06 0.00 0.01 0.02 Allowance for credit losses as a % of total loans 1.08 1.09 0.55 0.62 0.68 0.68 Capital and Regulatory Capital Ratios: Average shareholders' equity to average assets 11.39% 11.10% 10.63% 10.93% 10.53% 10.08% Tier 1 leverage capital 8.37 8.06 8.76 7.57 8.03 7.74 Common equity Tier 1 capital 10.08 9.94 9.42 8.43 9.22 9.27 Tier 1 risk-based capital 10.79 10.66 10.15 9.30 10.41 9.90 Total risk-based capital 12.76 12.64 11.72 11.34 12.61 12.15 Source: Company Filings 1 Efficiency ratio measures total non-interest expense as a percentage of net interest income plus total non-interest income
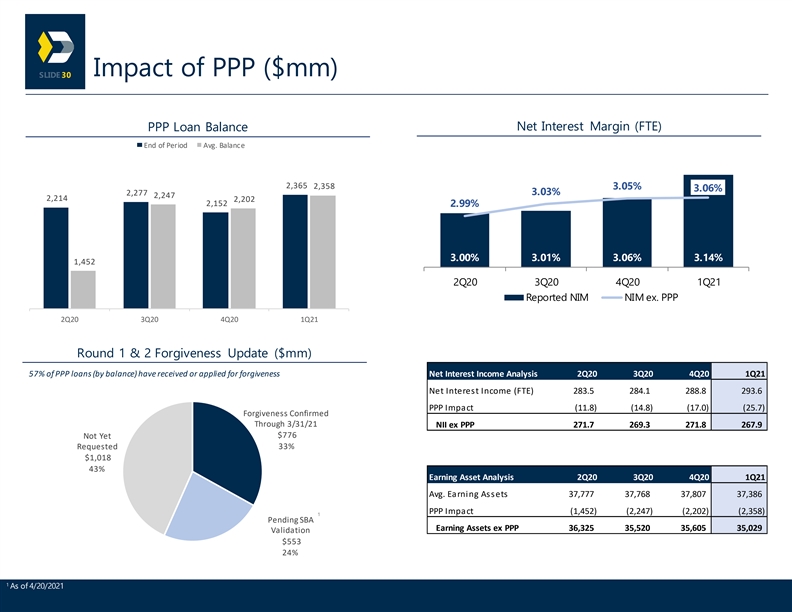
Impact of PPP ($mm) 30 PPP Loan Balance Net Interest Margin (FTE) End of Period Avg. Balance 2,365 2,358 3.05% 3.06% 3.03% 2,277 2,247 2,214 2,202 2,152 2.99% 3.00% 3.01% 3.06% 3.14% 1,452 2Q20 3Q20 4Q20 1Q21 Reported NIM NIM ex. PPP 2Q20 3Q20 4Q20 1Q21 Round 1 & 2 Forgiveness Update ($mm) 57% of PPP loans (by balance) have received or applied for forgiveness Net Interest Income Analysis 2Q20 3Q20 4Q20 1Q21 Net Interest Income (FTE) 2 83.5 2 84.1 288.8 2 93.6 PPP Impact (11.8) (14.8) (17.0) (25.7) Forgiveness Confirmed Through 3/31/21 NII ex PPP 271.7 269.3 2 71.8 2 67.9 $776 Not Yet Requested 33% $1,018 43% Earning Asset Analysis 2Q20 3Q20 4Q20 1Q21 Avg. Earning Assets 37,777 37,768 3 7,807 37,386 PPP Impact (1,452) (2,247) (2,202) (2,358) 1 Pending SBA Earning Assets ex PPP 36,325 35,520 35,605 35,029 Validation $553 24% 1 As of 4/20/2021Impact of PPP ($mm) 30 PPP Loan Balance Net Interest Margin (FTE) End of Period Avg. Balance 2,365 2,358 3.05% 3.06% 3.03% 2,277 2,247 2,214 2,202 2,152 2.99% 3.00% 3.01% 3.06% 3.14% 1,452 2Q20 3Q20 4Q20 1Q21 Reported NIM NIM ex. PPP 2Q20 3Q20 4Q20 1Q21 Round 1 & 2 Forgiveness Update ($mm) 57% of PPP loans (by balance) have received or applied for forgiveness Net Interest Income Analysis 2Q20 3Q20 4Q20 1Q21 Net Interest Income (FTE) 2 83.5 2 84.1 288.8 2 93.6 PPP Impact (11.8) (14.8) (17.0) (25.7) Forgiveness Confirmed Through 3/31/21 NII ex PPP 271.7 269.3 2 71.8 2 67.9 $776 Not Yet Requested 33% $1,018 43% Earning Asset Analysis 2Q20 3Q20 4Q20 1Q21 Avg. Earning Assets 37,777 37,768 3 7,807 37,386 PPP Impact (1,452) (2,247) (2,202) (2,358) 1 Pending SBA Earning Assets ex PPP 36,325 35,520 35,605 35,029 Validation $553 24% 1 As of 4/20/2021

Loan Segment Granularity 31 1, 2 CRE by Collateral Type (as of 3/31/2021) C&I by Borrower Industry (as of 3/31/2021) Apartment & Finance & Insurance Residential Real Estate 14% 27% 19% Retail Other 20% 10% Specialty & Healthcare Other 11% 11% Professional Services 3% Accommodation & Food Services Wholesale Trade Healthcare 4% 10% 9% Manufacturing Mixed Use 5% 11% Industrial Transport & Other Services 11% Office Construction Warehousing 9% 11% 6% 9% CRE is primarily comprised of loans on non owner- occupied investment properties made to sophisticated high net worth borrowers supported by diverse collateral and cash flow sources All medallion loans are now on non-accrual status Geography Outstanding ($BN) % of Total Wtd. Avg. LTV Wtd. Avg. DSCR Florida $4.3 25.7% 62% 1.86x Taxi Medallion 3/31/2020 3/31/2021 New Jersey $4.0 23.9% 60% 1.80x Relative Reserves as a % of Total 51.7% 67.2% Other $2.5 14.5% 63% 1.80x Exposure Other NYC Boroughs $2.3 13.7% 53% 1.44x Total Exposure $110 million $93.8 million Manhattan $1.9 11.4% 34% (49% ex 1.66x Co-Ops) Taxi medallions as a % of Total New York (ex. NYC) $1.8 10.8% 55% 1.56x 0.36% 0.29% Loans Total $16.9 100.0% 56% 1.72x 1 Borrower industry based on NAICS and SIC codes; excludes PPP balances; additional ~$650 million of equipment finance loans from Highland Capital subsidiary with primary borrower industries including Industrial, Medical & Dental, and Veterinary 2 Totals may not equal 100% due to roundingLoan Segment Granularity 31 1, 2 CRE by Collateral Type (as of 3/31/2021) C&I by Borrower Industry (as of 3/31/2021) Apartment & Finance & Insurance Residential Real Estate 14% 27% 19% Retail Other 20% 10% Specialty & Healthcare Other 11% 11% Professional Services 3% Accommodation & Food Services Wholesale Trade Healthcare 4% 10% 9% Manufacturing Mixed Use 5% 11% Industrial Transport & Other Services 11% Office Construction Warehousing 9% 11% 6% 9% CRE is primarily comprised of loans on non owner- occupied investment properties made to sophisticated high net worth borrowers supported by diverse collateral and cash flow sources All medallion loans are now on non-accrual status Geography Outstanding ($BN) % of Total Wtd. Avg. LTV Wtd. Avg. DSCR Florida $4.3 25.7% 62% 1.86x Taxi Medallion 3/31/2020 3/31/2021 New Jersey $4.0 23.9% 60% 1.80x Relative Reserves as a % of Total 51.7% 67.2% Other $2.5 14.5% 63% 1.80x Exposure Other NYC Boroughs $2.3 13.7% 53% 1.44x Total Exposure $110 million $93.8 million Manhattan $1.9 11.4% 34% (49% ex 1.66x Co-Ops) Taxi medallions as a % of Total New York (ex. NYC) $1.8 10.8% 55% 1.56x 0.36% 0.29% Loans Total $16.9 100.0% 56% 1.72x 1 Borrower industry based on NAICS and SIC codes; excludes PPP balances; additional ~$650 million of equipment finance loans from Highland Capital subsidiary with primary borrower industries including Industrial, Medical & Dental, and Veterinary 2 Totals may not equal 100% due to rounding
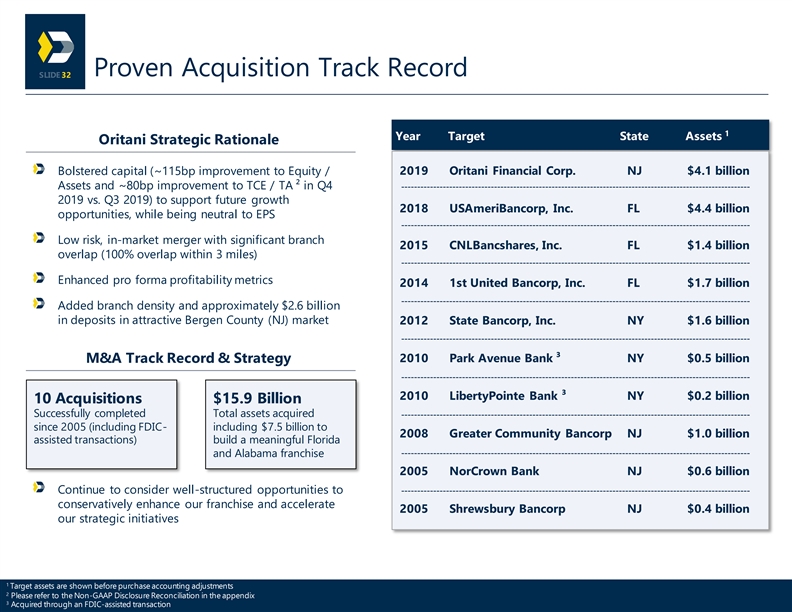
Proven Acquisition Track Record 32 1 Year Target State Assets Oritani Strategic Rationale Bolstered capital (~115bp improvement to Equity / 2019 Oritani Financial Corp. NJ $4.1 billion Assets and ~80bp improvement to TCE / TA ² in Q4 2019 vs. Q3 2019) to support future growth 2018 USAmeriBancorp, Inc. FL $4.4 billion opportunities, while being neutral to EPS Low risk, in-market merger with significant branch 2015 CNLBancshares, Inc. FL $1.4 billion overlap (100% overlap within 3 miles) Enhanced pro forma profitability metrics 2014 1st United Bancorp, Inc. FL $1.7 billion Added branch density and approximately $2.6 billion in deposits in attractive Bergen County (NJ) market 2012 State Bancorp, Inc. NY $1.6 billion 2010 Park Avenue Bank ³ NY $0.5 billion M&A Track Record & Strategy 2010 LibertyPointe Bank ³ NY $0.2 billion 10 Acquisitions $15.9 Billion Successfully completed Total assets acquired since 2005 (including FDIC- including $7.5 billion to 2008 Greater Community Bancorp NJ $1.0 billion assisted transactions) build a meaningful Florida and Alabama franchise 2005 NorCrown Bank NJ $0.6 billion Continue to consider well-structured opportunities to conservatively enhance our franchise and accelerate 2005 Shrewsbury Bancorp NJ $0.4 billion our strategic initiatives 1 Target assets are shown before purchase accounting adjustments 2 Please refer to the Non-GAAP Disclosure Reconciliation in the appendix 3 Acquired through an FDIC-assisted transactionProven Acquisition Track Record 32 1 Year Target State Assets Oritani Strategic Rationale Bolstered capital (~115bp improvement to Equity / 2019 Oritani Financial Corp. NJ $4.1 billion Assets and ~80bp improvement to TCE / TA ² in Q4 2019 vs. Q3 2019) to support future growth 2018 USAmeriBancorp, Inc. FL $4.4 billion opportunities, while being neutral to EPS Low risk, in-market merger with significant branch 2015 CNLBancshares, Inc. FL $1.4 billion overlap (100% overlap within 3 miles) Enhanced pro forma profitability metrics 2014 1st United Bancorp, Inc. FL $1.7 billion Added branch density and approximately $2.6 billion in deposits in attractive Bergen County (NJ) market 2012 State Bancorp, Inc. NY $1.6 billion 2010 Park Avenue Bank ³ NY $0.5 billion M&A Track Record & Strategy 2010 LibertyPointe Bank ³ NY $0.2 billion 10 Acquisitions $15.9 Billion Successfully completed Total assets acquired since 2005 (including FDIC- including $7.5 billion to 2008 Greater Community Bancorp NJ $1.0 billion assisted transactions) build a meaningful Florida and Alabama franchise 2005 NorCrown Bank NJ $0.6 billion Continue to consider well-structured opportunities to conservatively enhance our franchise and accelerate 2005 Shrewsbury Bancorp NJ $0.4 billion our strategic initiatives 1 Target assets are shown before purchase accounting adjustments 2 Please refer to the Non-GAAP Disclosure Reconciliation in the appendix 3 Acquired through an FDIC-assisted transaction
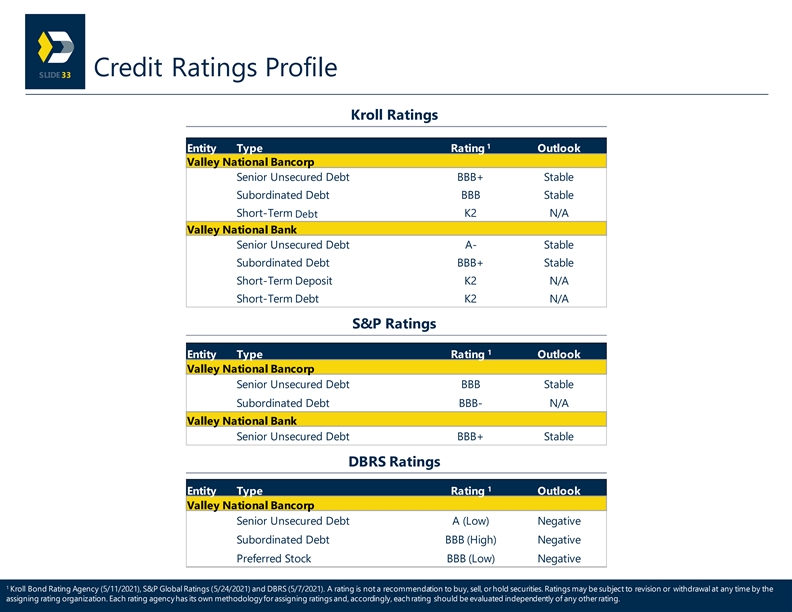
Credit Ratings Profile 33 Kroll Ratings 1 Entity Type Rating Outlook Valley National Bancorp Senior Unsecured Debt BBB+ Stable Subordinated Debt BBB Stable Short-Term K2 N/A Debt Valley National Bank Senior Unsecured Debt A- Stable Subordinated Debt BBB+ Stable Short-Term Deposit K2 N/A Short-Term Debt K2 N/A S&P Ratings 1 Entity Type Rating Outlook Valley National Bancorp Senior Unsecured Debt BBB Stable Subordinated Debt BBB- N/A Valley National Bank Senior Unsecured Debt BBB+ Stable DBRS Ratings 1 Entity Type Rating Outlook Valley National Bancorp Senior Unsecured Debt A (Low) Negative Subordinated Debt BBB (High) Negative Preferred Stock BBB (Low) Negative 1 Kroll Bond Rating Agency (5/11/2021), S&P Global Ratings (5/24/2021) and DBRS (5/7/2021). A rating is not a recommendation to buy, sell, or hold securities. Ratings may be subject to revision or withdrawal at any time by the assigning rating organization. Each rating agency has its own methodology for assigning ratings and, accordingly, each rating should be evaluated independently of any other rating.Credit Ratings Profile 33 Kroll Ratings 1 Entity Type Rating Outlook Valley National Bancorp Senior Unsecured Debt BBB+ Stable Subordinated Debt BBB Stable Short-Term K2 N/A Debt Valley National Bank Senior Unsecured Debt A- Stable Subordinated Debt BBB+ Stable Short-Term Deposit K2 N/A Short-Term Debt K2 N/A S&P Ratings 1 Entity Type Rating Outlook Valley National Bancorp Senior Unsecured Debt BBB Stable Subordinated Debt BBB- N/A Valley National Bank Senior Unsecured Debt BBB+ Stable DBRS Ratings 1 Entity Type Rating Outlook Valley National Bancorp Senior Unsecured Debt A (Low) Negative Subordinated Debt BBB (High) Negative Preferred Stock BBB (Low) Negative 1 Kroll Bond Rating Agency (5/11/2021), S&P Global Ratings (5/24/2021) and DBRS (5/7/2021). A rating is not a recommendation to buy, sell, or hold securities. Ratings may be subject to revision or withdrawal at any time by the assigning rating organization. Each rating agency has its own methodology for assigning ratings and, accordingly, each rating should be evaluated independently of any other rating.
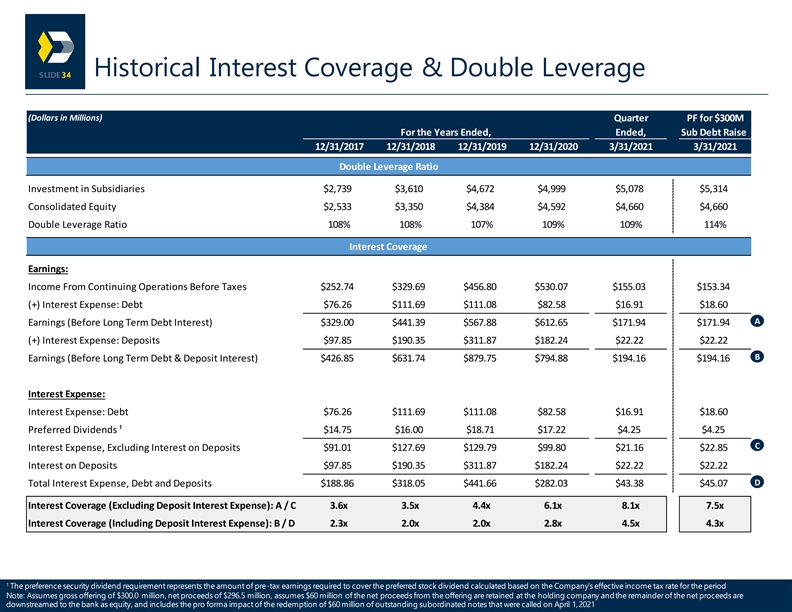
Historical Interest Coverage & Double Leverage 34 (Dollars in Millions) Quarter PF for $300M For the Years Ended, Ended, Sub Debt Raise 12/31/2017 12/31/2018 12/31/2019 12/31/2020 3/31/2021 3/31/2021 Double Leverage Ratio Investment in Subsidiaries $2,739 $3,610 $4,672 $4,999 $5,078 $5,314 Consolidated Equity $2,533 $3,350 $4,384 $4,592 $4,660 $4,660 Double Leverage Ratio 108% 108% 107% 109% 109% 114% Interest Coverage Earnings: Income From Continuing Operations Before Taxes $252.74 $329.69 $456.80 $530.07 $155.03 $153.34 (+) Interest Expense: Debt $76.26 $111.69 $111.08 $82.58 $16.91 $18.60 A Earnings (Before Long Term Debt Interest) $329.00 $441.39 $567.88 $612.65 $171.94 $171.94 (+) Interest Expense: Deposits $97.85 $190.35 $311.87 $182.24 $22.22 $22.22 B Earnings (Before Long Term Debt & Deposit Interest) $426.85 $631.74 $879.75 $794.88 $194.16 $194.16 Interest Expense: Interest Expense: Debt $76.26 $111.69 $111.08 $82.58 $16.91 $18.60 Preferred Dividends ¹ $14.75 $16.00 $18.71 $17.22 $4.25 $4.25 C Interest Expense, Excluding Interest on Deposits $91.01 $127.69 $129.79 $99.80 $21.16 $22.85 Interest on Deposits $97.85 $190.35 $311.87 $182.24 $22.22 $22.22 D Total Interest Expense, Debt and Deposits $188.86 $318.05 $441.66 $282.03 $43.38 $45.07 Interest Coverage (Excluding Deposit Interest Expense): A / C 3.6x 3.5x 4.4x 6.1x 8.1x 7.5x Interest Coverage (Including Deposit Interest Expense): B / D 2.3x 2.0x 2.0x 2.8x 4.5x 4.3x 1 The preference security dividend requirement represents the amount of pre-tax earnings required to cover the preferred stock dividend calculated based on the Company's effective income tax rate for the period Note: Assumes gross offering of $300.0 million, net proceeds of $296.5 million, assumes $60 million of the net proceeds from the offering are retained at the holding company and the remainder of the net proceeds are downstreamed to the bank as equity, and includes the pro forma impact of the redemption of $60 million of outstanding subordinated notes that were called on April 1,2021Historical Interest Coverage & Double Leverage 34 (Dollars in Millions) Quarter PF for $300M For the Years Ended, Ended, Sub Debt Raise 12/31/2017 12/31/2018 12/31/2019 12/31/2020 3/31/2021 3/31/2021 Double Leverage Ratio Investment in Subsidiaries $2,739 $3,610 $4,672 $4,999 $5,078 $5,314 Consolidated Equity $2,533 $3,350 $4,384 $4,592 $4,660 $4,660 Double Leverage Ratio 108% 108% 107% 109% 109% 114% Interest Coverage Earnings: Income From Continuing Operations Before Taxes $252.74 $329.69 $456.80 $530.07 $155.03 $153.34 (+) Interest Expense: Debt $76.26 $111.69 $111.08 $82.58 $16.91 $18.60 A Earnings (Before Long Term Debt Interest) $329.00 $441.39 $567.88 $612.65 $171.94 $171.94 (+) Interest Expense: Deposits $97.85 $190.35 $311.87 $182.24 $22.22 $22.22 B Earnings (Before Long Term Debt & Deposit Interest) $426.85 $631.74 $879.75 $794.88 $194.16 $194.16 Interest Expense: Interest Expense: Debt $76.26 $111.69 $111.08 $82.58 $16.91 $18.60 Preferred Dividends ¹ $14.75 $16.00 $18.71 $17.22 $4.25 $4.25 C Interest Expense, Excluding Interest on Deposits $91.01 $127.69 $129.79 $99.80 $21.16 $22.85 Interest on Deposits $97.85 $190.35 $311.87 $182.24 $22.22 $22.22 D Total Interest Expense, Debt and Deposits $188.86 $318.05 $441.66 $282.03 $43.38 $45.07 Interest Coverage (Excluding Deposit Interest Expense): A / C 3.6x 3.5x 4.4x 6.1x 8.1x 7.5x Interest Coverage (Including Deposit Interest Expense): B / D 2.3x 2.0x 2.0x 2.8x 4.5x 4.3x 1 The preference security dividend requirement represents the amount of pre-tax earnings required to cover the preferred stock dividend calculated based on the Company's effective income tax rate for the period Note: Assumes gross offering of $300.0 million, net proceeds of $296.5 million, assumes $60 million of the net proceeds from the offering are retained at the holding company and the remainder of the net proceeds are downstreamed to the bank as equity, and includes the pro forma impact of the redemption of $60 million of outstanding subordinated notes that were called on April 1,2021
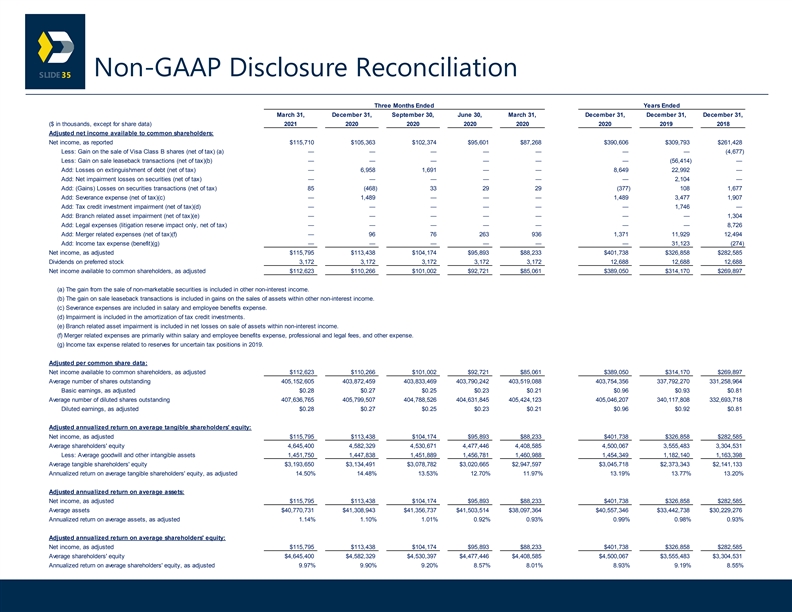
Non-GAAP Disclosure Reconciliation 35 Three Months Ended Years Ended March 31, December 31, September 30, June 30, March 31, December 31, December 31, December 31, ($ in thousands, except for share data) 2021 2020 2020 2020 2020 2020 2019 2018 Adjusted net income available to common shareholders: Net income, as reported $115,710 $105,363 $102,374 $95,601 $87,268 $390,606 $309,793 $261,428 Less: Gain on the sale of Visa Class B shares (net of tax) (a)——————— ( 4,677) Less: Gain on sale leaseback transactions (net of tax)(b)—————— (56,414)— Add: Losses on extinguishment of debt (net of tax)— 6 ,958 1,691—— 8 ,649 22,992— Add: Net impairment losses on securities (net of tax)—————— 2 ,104— Add: (Gains) Losses on securities transactions (net of tax) 85 ( 468) 33 29 29 (377) 108 1,677 Add: Severance expense (net of tax)(c)— 1,489——— 1 ,489 3,477 1 ,907 Add: Tax credit investment impairment (net of tax)(d)—————— 1,746— Add: Branch related asset impairment (net of tax)(e)——————— 1 ,304 Add: Legal expenses (litigation reserve impact only, net of tax)——————— 8,726 Add: Merger related expenses (net of tax)(f)— 96 76 263 936 1,371 1 1,929 12,494 Add: Income tax expense (benefit)(g)—————— 31,123 ( 274) Net income, as adjusted $115,795 $113,438 $104,174 $95,893 $88,233 $401,738 $326,858 $282,585 Dividends on preferred stock 3 ,172 3 ,172 3,172 3 ,172 3,172 1 2,688 1 2,688 1 2,688 Net income available to common shareholders, as adjusted $112,623 $110,266 $101,002 $92,721 $85,061 $389,050 $314,170 $269,897 (a) The gain from the sale of non-marketable securities is included in other non-interest income. (b) The gain on sale leaseback transactions is included in gains on the sales of assets within other non-interest income. (c) Severance expenses are included in salary and employee benefits expense. (d) Impairment is included in the amortization of tax credit investments. (e) Branch related asset impairment is included in net losses on sale of assets within non-interest income. (f) Merger related expenses are primarily within salary and employee benefits expense, professional and legal fees, and other expense. (g) Income tax expense related to reserves for uncertain tax positions in 2019. Adjusted per common share data: Net income available to common shareholders, as adjusted $112,623 $110,266 $101,002 $92,721 $85,061 $389,050 $314,170 $269,897 Average number of shares outstanding 405,152,605 403,872,459 403,833,469 403,790,242 403,519,088 4 03,754,356 337,792,270 331,258,964 Basic earnings, as adjusted $0.28 $0.27 $0.25 $0.23 $0.21 $0.96 $0.93 $0.81 Average number of diluted shares outstanding 4 07,636,765 4 05,799,507 4 04,788,526 4 04,631,845 405,424,123 4 05,046,207 340,117,808 3 32,693,718 Diluted earnings, as adjusted $0.28 $0.27 $0.25 $0.23 $0.21 $0.96 $0.92 $0.81 Adjusted annualized return on average tangible shareholders' equity: Net income, as adjusted $115,795 $113,438 $104,174 $95,893 $88,233 $401,738 $326,858 $282,585 Average shareholders' equity 4,645,400 4 ,582,329 4 ,530,671 4,477,446 4 ,408,585 4,500,067 3,555,483 3,304,531 Less: Average goodwill and other intangible assets 1 ,451,750 1 ,447,838 1,451,889 1,456,781 1 ,460,988 1,454,349 1 ,182,140 1,163,398 Average tangible shareholders' equity $3,193,650 $3,134,491 $3,078,782 $3,020,665 $2,947,597 $3,045,718 $2,373,343 $2,141,133 Annualized return on average tangible shareholders' equity, as adjusted 14.50% 14.48% 13.53% 12.70% 11.97% 13.19% 13.77% 13.20% Adjusted annualized return on average assets: Net income, as adjusted $115,795 $113,438 $104,174 $95,893 $88,233 $401,738 $326,858 $282,585 Average assets $40,770,731 $41,308,943 $41,356,737 $41,503,514 $38,097,364 $40,557,346 $33,442,738 $30,229,276 Annualized return on average assets, as adjusted 1.14% 1.10% 1.01% 0.92% 0.93% 0.99% 0.98% 0.93% Adjusted annualized return on average shareholders' equity: Net income, as adjusted $115,795 $113,438 $104,174 $95,893 $88,233 $401,738 $326,858 $282,585 Average shareholders' equity $4,645,400 $4,582,329 $4,530,397 $4,477,446 $4,408,585 $4,500,067 $3,555,483 $3,304,531 Annualized return on average shareholders' equity, as adjusted 9.97% 9.90% 9.20% 8.57% 8.01% 8.93% 9.19% 8.55%Non-GAAP Disclosure Reconciliation 35 Three Months Ended Years Ended March 31, December 31, September 30, June 30, March 31, December 31, December 31, December 31, ($ in thousands, except for share data) 2021 2020 2020 2020 2020 2020 2019 2018 Adjusted net income available to common shareholders: Net income, as reported $115,710 $105,363 $102,374 $95,601 $87,268 $390,606 $309,793 $261,428 Less: Gain on the sale of Visa Class B shares (net of tax) (a)——————— ( 4,677) Less: Gain on sale leaseback transactions (net of tax)(b)—————— (56,414)— Add: Losses on extinguishment of debt (net of tax)— 6 ,958 1,691—— 8 ,649 22,992— Add: Net impairment losses on securities (net of tax)—————— 2 ,104— Add: (Gains) Losses on securities transactions (net of tax) 85 ( 468) 33 29 29 (377) 108 1,677 Add: Severance expense (net of tax)(c)— 1,489——— 1 ,489 3,477 1 ,907 Add: Tax credit investment impairment (net of tax)(d)—————— 1,746— Add: Branch related asset impairment (net of tax)(e)——————— 1 ,304 Add: Legal expenses (litigation reserve impact only, net of tax)——————— 8,726 Add: Merger related expenses (net of tax)(f)— 96 76 263 936 1,371 1 1,929 12,494 Add: Income tax expense (benefit)(g)—————— 31,123 ( 274) Net income, as adjusted $115,795 $113,438 $104,174 $95,893 $88,233 $401,738 $326,858 $282,585 Dividends on preferred stock 3 ,172 3 ,172 3,172 3 ,172 3,172 1 2,688 1 2,688 1 2,688 Net income available to common shareholders, as adjusted $112,623 $110,266 $101,002 $92,721 $85,061 $389,050 $314,170 $269,897 (a) The gain from the sale of non-marketable securities is included in other non-interest income. (b) The gain on sale leaseback transactions is included in gains on the sales of assets within other non-interest income. (c) Severance expenses are included in salary and employee benefits expense. (d) Impairment is included in the amortization of tax credit investments. (e) Branch related asset impairment is included in net losses on sale of assets within non-interest income. (f) Merger related expenses are primarily within salary and employee benefits expense, professional and legal fees, and other expense. (g) Income tax expense related to reserves for uncertain tax positions in 2019. Adjusted per common share data: Net income available to common shareholders, as adjusted $112,623 $110,266 $101,002 $92,721 $85,061 $389,050 $314,170 $269,897 Average number of shares outstanding 405,152,605 403,872,459 403,833,469 403,790,242 403,519,088 4 03,754,356 337,792,270 331,258,964 Basic earnings, as adjusted $0.28 $0.27 $0.25 $0.23 $0.21 $0.96 $0.93 $0.81 Average number of diluted shares outstanding 4 07,636,765 4 05,799,507 4 04,788,526 4 04,631,845 405,424,123 4 05,046,207 340,117,808 3 32,693,718 Diluted earnings, as adjusted $0.28 $0.27 $0.25 $0.23 $0.21 $0.96 $0.92 $0.81 Adjusted annualized return on average tangible shareholders' equity: Net income, as adjusted $115,795 $113,438 $104,174 $95,893 $88,233 $401,738 $326,858 $282,585 Average shareholders' equity 4,645,400 4 ,582,329 4 ,530,671 4,477,446 4 ,408,585 4,500,067 3,555,483 3,304,531 Less: Average goodwill and other intangible assets 1 ,451,750 1 ,447,838 1,451,889 1,456,781 1 ,460,988 1,454,349 1 ,182,140 1,163,398 Average tangible shareholders' equity $3,193,650 $3,134,491 $3,078,782 $3,020,665 $2,947,597 $3,045,718 $2,373,343 $2,141,133 Annualized return on average tangible shareholders' equity, as adjusted 14.50% 14.48% 13.53% 12.70% 11.97% 13.19% 13.77% 13.20% Adjusted annualized return on average assets: Net income, as adjusted $115,795 $113,438 $104,174 $95,893 $88,233 $401,738 $326,858 $282,585 Average assets $40,770,731 $41,308,943 $41,356,737 $41,503,514 $38,097,364 $40,557,346 $33,442,738 $30,229,276 Annualized return on average assets, as adjusted 1.14% 1.10% 1.01% 0.92% 0.93% 0.99% 0.98% 0.93% Adjusted annualized return on average shareholders' equity: Net income, as adjusted $115,795 $113,438 $104,174 $95,893 $88,233 $401,738 $326,858 $282,585 Average shareholders' equity $4,645,400 $4,582,329 $4,530,397 $4,477,446 $4,408,585 $4,500,067 $3,555,483 $3,304,531 Annualized return on average shareholders' equity, as adjusted 9.97% 9.90% 9.20% 8.57% 8.01% 8.93% 9.19% 8.55%
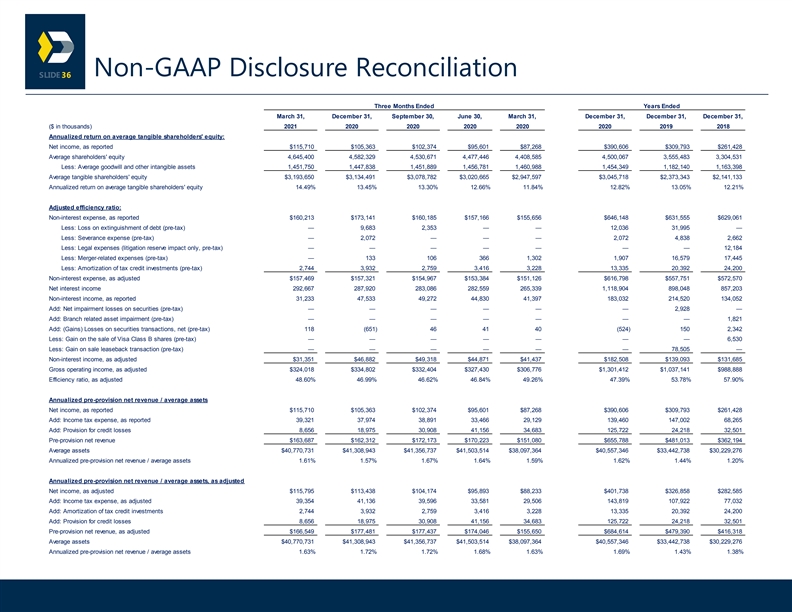
Non-GAAP Disclosure Reconciliation 36 Three Months Ended Years Ended March 31, December 31, September 30, June 30, March 31, December 31, December 31, December 31, ($ in thousands) 2021 2020 2020 2020 2020 2020 2019 2018 Annualized return on average tangible shareholders' equity: Net income, as reported $115,710 $105,363 $102,374 $95,601 $87,268 $390,606 $309,793 $261,428 Average shareholders' equity 4 ,645,400 4 ,582,329 4 ,530,671 4,477,446 4,408,585 4 ,500,067 3 ,555,483 3 ,304,531 Less: Average goodwill and other intangible assets 1,451,750 1 ,447,838 1 ,451,889 1 ,456,781 1 ,460,988 1 ,454,349 1 ,182,140 1,163,398 Average tangible shareholders' equity $3,193,650 $3,134,491 $3,078,782 $3,020,665 $2,947,597 $3,045,718 $2,373,343 $2,141,133 Annualized return on average tangible shareholders' equity 14.49% 13.45% 13.30% 12.66% 11.84% 12.82% 13.05% 12.21% Adjusted efficiency ratio: Non-interest expense, as reported $160,213 $173,141 $160,185 $157,166 $155,656 $646,148 $631,555 $629,061 Less: Loss on extinguishment of debt (pre-tax)— 9,683 2 ,353—— 1 2,036 31,995— Less: Severance expense (pre-tax)— 2 ,072——— 2,072 4 ,838 2 ,662 Less: Legal expenses (litigation reserve impact only, pre-tax)——————— 12,184 Less: Merger-related expenses (pre-tax)— 133 106 366 1 ,302 1,907 1 6,579 1 7,445 Less: Amortization of tax credit investments (pre-tax) 2,744 3 ,932 2,759 3 ,416 3 ,228 1 3,335 20,392 2 4,200 Non-interest expense, as adjusted $157,469 $157,321 $154,967 $153,384 $151,126 $616,798 $557,751 $572,570 Net interest income 2 92,667 287,920 2 83,086 282,559 2 65,339 1 ,118,904 898,048 8 57,203 Non-interest income, as reported 31,233 4 7,533 49,272 44,830 4 1,397 1 83,032 214,520 1 34,052 Add: Net impairment losses on securities (pre-tax)—————— 2,928— Add: Branch related asset impairment (pre-tax)——————— 1,821 Add: (Gains) Losses on securities transactions, net (pre-tax) 118 ( 651) 46 41 40 (524) 150 2 ,342 Less: Gain on the sale of Visa Class B shares (pre-tax)——————— 6,530 Less: Gain on sale leaseback transaction (pre-tax)—————— 7 8,505— Non-interest income, as adjusted $31,351 $46,882 $49,318 $44,871 $41,437 $182,508 $139,093 $131,685 Gross operating income, as adjusted $324,018 $334,802 $332,404 $327,430 $306,776 $1,301,412 $1,037,141 $988,888 Efficiency ratio, as adjusted 48.60% 46.99% 46.62% 46.84% 49.26% 47.39% 53.78% 57.90% Annualized pre-provision net revenue / average assets Net income, as reported $115,710 $105,363 $102,374 $95,601 $87,268 $390,606 $309,793 $261,428 Add: Income tax expense, as reported 39,321 37,974 38,891 33,466 2 9,129 139,460 1 47,002 6 8,265 Add: Provision for credit losses 8,656 1 8,975 30,908 41,156 3 4,683 125,722 2 4,218 3 2,501 Pre-provision net revenue $163,687 $162,312 $172,173 $170,223 $151,080 $655,788 $481,013 $362,194 Average assets $40,770,731 $41,308,943 $41,356,737 $41,503,514 $38,097,364 $40,557,346 $33,442,738 $30,229,276 Annualized pre-provision net revenue / average assets 1.61% 1.57% 1.67% 1.64% 1.59% 1.62% 1.44% 1.20% Annualized pre-provision net revenue / average assets, as adjusted Net income, as adjusted $115,795 $113,438 $104,174 $95,893 $88,233 $401,738 $326,858 $282,585 Add: Income tax expense, as adjusted 3 9,354 41,136 3 9,596 33,581 2 9,506 143,819 1 07,922 7 7,032 Add: Amortization of tax credit investments 2,744 3 ,932 2,759 3,416 3,228 13,335 20,392 24,200 Add: Provision for credit losses 8,656 1 8,975 3 0,908 41,156 34,683 1 25,722 2 4,218 3 2,501 Pre-provision net revenue, as adjusted $166,549 $177,481 $177,437 $174,046 $155,650 $684,614 $479,390 $416,318 Average assets $40,770,731 $41,308,943 $41,356,737 $41,503,514 $38,097,364 $40,557,346 $33,442,738 $30,229,276 Annualized pre-provision net revenue / average assets 1.63% 1.72% 1.72% 1.68% 1.63% 1.69% 1.43% 1.38%Non-GAAP Disclosure Reconciliation 36 Three Months Ended Years Ended March 31, December 31, September 30, June 30, March 31, December 31, December 31, December 31, ($ in thousands) 2021 2020 2020 2020 2020 2020 2019 2018 Annualized return on average tangible shareholders' equity: Net income, as reported $115,710 $105,363 $102,374 $95,601 $87,268 $390,606 $309,793 $261,428 Average shareholders' equity 4 ,645,400 4 ,582,329 4 ,530,671 4,477,446 4,408,585 4 ,500,067 3 ,555,483 3 ,304,531 Less: Average goodwill and other intangible assets 1,451,750 1 ,447,838 1 ,451,889 1 ,456,781 1 ,460,988 1 ,454,349 1 ,182,140 1,163,398 Average tangible shareholders' equity $3,193,650 $3,134,491 $3,078,782 $3,020,665 $2,947,597 $3,045,718 $2,373,343 $2,141,133 Annualized return on average tangible shareholders' equity 14.49% 13.45% 13.30% 12.66% 11.84% 12.82% 13.05% 12.21% Adjusted efficiency ratio: Non-interest expense, as reported $160,213 $173,141 $160,185 $157,166 $155,656 $646,148 $631,555 $629,061 Less: Loss on extinguishment of debt (pre-tax)— 9,683 2 ,353—— 1 2,036 31,995— Less: Severance expense (pre-tax)— 2 ,072——— 2,072 4 ,838 2 ,662 Less: Legal expenses (litigation reserve impact only, pre-tax)——————— 12,184 Less: Merger-related expenses (pre-tax)— 133 106 366 1 ,302 1,907 1 6,579 1 7,445 Less: Amortization of tax credit investments (pre-tax) 2,744 3 ,932 2,759 3 ,416 3 ,228 1 3,335 20,392 2 4,200 Non-interest expense, as adjusted $157,469 $157,321 $154,967 $153,384 $151,126 $616,798 $557,751 $572,570 Net interest income 2 92,667 287,920 2 83,086 282,559 2 65,339 1 ,118,904 898,048 8 57,203 Non-interest income, as reported 31,233 4 7,533 49,272 44,830 4 1,397 1 83,032 214,520 1 34,052 Add: Net impairment losses on securities (pre-tax)—————— 2,928— Add: Branch related asset impairment (pre-tax)——————— 1,821 Add: (Gains) Losses on securities transactions, net (pre-tax) 118 ( 651) 46 41 40 (524) 150 2 ,342 Less: Gain on the sale of Visa Class B shares (pre-tax)——————— 6,530 Less: Gain on sale leaseback transaction (pre-tax)—————— 7 8,505— Non-interest income, as adjusted $31,351 $46,882 $49,318 $44,871 $41,437 $182,508 $139,093 $131,685 Gross operating income, as adjusted $324,018 $334,802 $332,404 $327,430 $306,776 $1,301,412 $1,037,141 $988,888 Efficiency ratio, as adjusted 48.60% 46.99% 46.62% 46.84% 49.26% 47.39% 53.78% 57.90% Annualized pre-provision net revenue / average assets Net income, as reported $115,710 $105,363 $102,374 $95,601 $87,268 $390,606 $309,793 $261,428 Add: Income tax expense, as reported 39,321 37,974 38,891 33,466 2 9,129 139,460 1 47,002 6 8,265 Add: Provision for credit losses 8,656 1 8,975 30,908 41,156 3 4,683 125,722 2 4,218 3 2,501 Pre-provision net revenue $163,687 $162,312 $172,173 $170,223 $151,080 $655,788 $481,013 $362,194 Average assets $40,770,731 $41,308,943 $41,356,737 $41,503,514 $38,097,364 $40,557,346 $33,442,738 $30,229,276 Annualized pre-provision net revenue / average assets 1.61% 1.57% 1.67% 1.64% 1.59% 1.62% 1.44% 1.20% Annualized pre-provision net revenue / average assets, as adjusted Net income, as adjusted $115,795 $113,438 $104,174 $95,893 $88,233 $401,738 $326,858 $282,585 Add: Income tax expense, as adjusted 3 9,354 41,136 3 9,596 33,581 2 9,506 143,819 1 07,922 7 7,032 Add: Amortization of tax credit investments 2,744 3 ,932 2,759 3,416 3,228 13,335 20,392 24,200 Add: Provision for credit losses 8,656 1 8,975 3 0,908 41,156 34,683 1 25,722 2 4,218 3 2,501 Pre-provision net revenue, as adjusted $166,549 $177,481 $177,437 $174,046 $155,650 $684,614 $479,390 $416,318 Average assets $40,770,731 $41,308,943 $41,356,737 $41,503,514 $38,097,364 $40,557,346 $33,442,738 $30,229,276 Annualized pre-provision net revenue / average assets 1.63% 1.72% 1.72% 1.68% 1.63% 1.69% 1.43% 1.38%
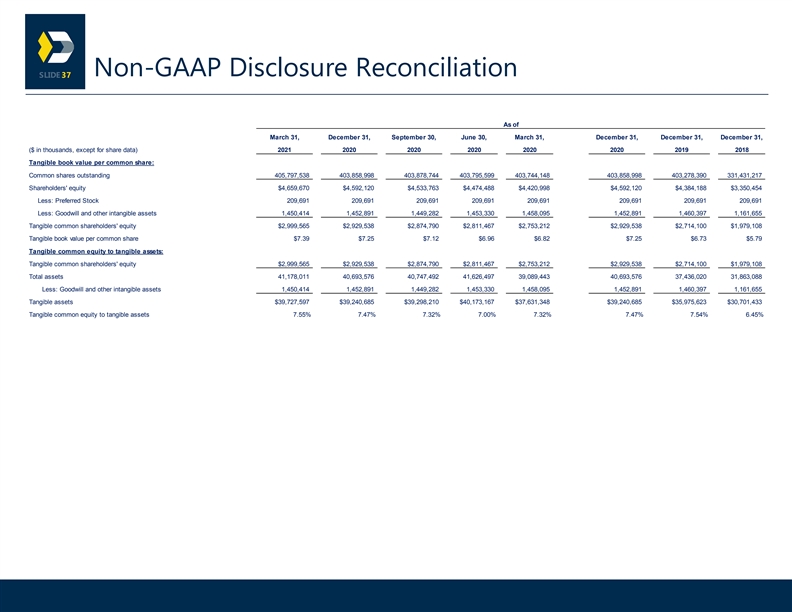
Non-GAAP Disclosure Reconciliation 37 As of March 31, December 31, September 30, June 30, March 31, December 31, December 31, December 31, ($ in thousands, except for share data) 2021 2020 2020 2020 2020 2020 2019 2018 Tangible book value per common share: Common shares outstanding 4 05,797,538 403,858,998 4 03,878,744 4 03,795,599 403,744,148 4 03,858,998 403,278,390 3 31,431,217 Shareholders' equity $4,659,670 $4,592,120 $4,533,763 $4,474,488 $4,420,998 $4,592,120 $4,384,188 $3,350,454 Less: Preferred Stock 2 09,691 2 09,691 209,691 209,691 209,691 2 09,691 209,691 2 09,691 Less: Goodwill and other intangible assets 1,450,414 1,452,891 1,449,282 1,453,330 1,458,095 1,452,891 1 ,460,397 1,161,655 Tangible common shareholders' equity $2,999,565 $2,929,538 $2,874,790 $2,811,467 $2,753,212 $2,929,538 $2,714,100 $1,979,108 Tangible book value per common share $7.39 $7.25 $7.12 $6.96 $6.82 $7.25 $6.73 $5.79 Tangible common equity to tangible assets: Tangible common shareholders' equity $2,999,565 $2,929,538 $2,874,790 $2,811,467 $2,753,212 $2,929,538 $2,714,100 $1,979,108 Total assets 41,178,011 40,693,576 4 0,747,492 41,626,497 39,089,443 40,693,576 37,436,020 3 1,863,088 Less: Goodwill and other intangible assets 1 ,450,414 1,452,891 1,449,282 1 ,453,330 1,458,095 1,452,891 1 ,460,397 1,161,655 Tangible assets $39,727,597 $39,240,685 $39,298,210 $40,173,167 $37,631,348 $39,240,685 $35,975,623 $30,701,433 Tangible common equity to tangible assets 7.55% 7.47% 7.32% 7.00% 7.32% 7.47% 7.54% 6.45%Non-GAAP Disclosure Reconciliation 37 As of March 31, December 31, September 30, June 30, March 31, December 31, December 31, December 31, ($ in thousands, except for share data) 2021 2020 2020 2020 2020 2020 2019 2018 Tangible book value per common share: Common shares outstanding 4 05,797,538 403,858,998 4 03,878,744 4 03,795,599 403,744,148 4 03,858,998 403,278,390 3 31,431,217 Shareholders' equity $4,659,670 $4,592,120 $4,533,763 $4,474,488 $4,420,998 $4,592,120 $4,384,188 $3,350,454 Less: Preferred Stock 2 09,691 2 09,691 209,691 209,691 209,691 2 09,691 209,691 2 09,691 Less: Goodwill and other intangible assets 1,450,414 1,452,891 1,449,282 1,453,330 1,458,095 1,452,891 1 ,460,397 1,161,655 Tangible common shareholders' equity $2,999,565 $2,929,538 $2,874,790 $2,811,467 $2,753,212 $2,929,538 $2,714,100 $1,979,108 Tangible book value per common share $7.39 $7.25 $7.12 $6.96 $6.82 $7.25 $6.73 $5.79 Tangible common equity to tangible assets: Tangible common shareholders' equity $2,999,565 $2,929,538 $2,874,790 $2,811,467 $2,753,212 $2,929,538 $2,714,100 $1,979,108 Total assets 41,178,011 40,693,576 4 0,747,492 41,626,497 39,089,443 40,693,576 37,436,020 3 1,863,088 Less: Goodwill and other intangible assets 1 ,450,414 1,452,891 1,449,282 1 ,453,330 1,458,095 1,452,891 1 ,460,397 1,161,655 Tangible assets $39,727,597 $39,240,685 $39,298,210 $40,173,167 $37,631,348 $39,240,685 $35,975,623 $30,701,433 Tangible common equity to tangible assets 7.55% 7.47% 7.32% 7.00% 7.32% 7.47% 7.54% 6.45%