
Exhibit 99.1 I n v e s t o r P r e s e n t a t i o n S e p t e m b e r 2 0 2 2

Forward Looking Statements This presentation contains forward-looking statements within the meaning of the Private Securities Litigation Reform Act of 1995. Such statements are not historical facts and include expressions about management’s confidence and strategies and management’s expectations about our business, new and existing programs and products, acquisitions, relationships, opportunities, taxation, technology, market conditions and economic expectations. These statements may be identified by such forward-looking terminology as “intend,” “should,” “expect,” “believe,” “view,” “opportunity,” “allow,” “continues,” “reflects,” “would,” “could,” “typically,” “usually,” “anticipate,” “may,” “estimate,” “outlook,” “project,” or similar statements or variations of such terms. Such forward-looking statements involve certain risks and uncertainties. Actual results may differ materially from such forward-looking statements. Factors that may cause actual results to differ materially from those contemplated by such forward-looking statements include, but are not limited to: the inability to realize expected cost savings and synergies from the Bank Leumi Le-Israel Corporation (“Bank Leumi USA”) acquisition in the amounts or timeframe anticipated; greater than expected costs or difficulties relating to Bank Leumi USA integration matters; the inability to retain customers and qualified employees of Bank Leumi USA; greater than expected non-recurring charges related to the Bank Leumi USA acquisition; the continued impact of COVID-19 on the U.S. and global economies, including business disruptions, reductions in employment, supply chain interruptions, inflation, Federal Reserve actions impacting the level of market interest rates and an increase in business failures, specifically among our clients; the continued impact of COVID-19 on our employees and our ability to provide services to our customers and respond to their needs as more cases and new variants of COVID-19 may arise in our primary markets; continued deterioration in general business and economic conditions or turbulence in domestic or global financial markets; the impact of forbearances or deferrals we are required or agree to as a result of customer requests and/or government actions, including, but not limited to our potential inability to recover fully deferred payments from the borrower or the collateral; the risks related to the discontinuation of the London Interbank Offered Rate and other reference rates, including increased expenses and litigation and the effectiveness of hedging strategies; damage verdicts or settlements or restrictions related to existing or potential class action litigation or individual litigation arising from claims of violations of laws or regulations, contractual claims, breach of fiduciary responsibility, negligence, fraud, environmental laws, patent or trademark infringement, employment related claims, and other matters; a prolonged downturn in the economy, mainly in New Jersey, New York, Florida, Alabama, California, and Illinois, as well as an unexpected decline in commercial real estate values within our market areas; higher or lower than expected income tax expense or tax rates, including increases or decreases resulting from changes in uncertain tax position liabilities, tax laws, regulations and case law; the inability to grow customer deposits to keep pace with loan growth; a material change in our allowance for credit losses under CECL due to forecasted economic conditions and/or unexpected credit deterioration in our loan and investment portfolios; the need to supplement debt or equity capital to maintain or exceed internal capital thresholds; greater than expected technology related costs due to, among other factors, prolonged or failed implementations, additional project staffing and obsolescence caused by continuous and rapid market innovations; the loss of or decrease in lower-cost funding sources within our deposit base, including our inability to achieve deposit retention targets under Valley's branch transformation strategy; cyber-attacks, ransomware attacks, computer viruses or other malware that may breach the security of our websites or other systems to obtain unauthorized access to confidential information, destroy data, disable or degrade service, or sabotage our systems; results of examinations by the Office of the Comptroller of the Currency (OCC), the Federal Reserve Bank (FRB), the Consumer Financial Protection Bureau (CFPB) and other regulatory authorities, including the possibility that any such regulatory authority may, among other things, require us to increase our allowance for credit losses, write-down assets, reimburse customers, change the way we do business, or limit or eliminate certain other banking activities; our inability or determination not to pay dividends at current levels, or at all, because of inadequate earnings, regulatory restrictions or limitations, changes in our capital requirements or a decision to increase capital by retaining more earnings; unanticipated loan delinquencies, loss of collateral, decreased service revenues, and other potential negative effects on our business caused by severe weather, the COVID-19 pandemic or other external events; and unexpected significant declines in the loan portfolio due to the lack of economic expansion, increased competition, large prepayments, changes in regulatory lending guidance or other factors. A detailed discussion of factors that could affect our results is included in our SEC filings, including the “Risk Factors” section of our Annual Report on Form 10-K for the year ended December 31, 2021. We undertake no duty to update any forward-looking statement to conform the statement to actual results or changes in our expectations. Although we believe that the expectations reflected in the forward-looking statements are reasonable, we cannot guarantee future results, levels of activity, performance or achievements. This presentation contains supplemental financial information determined by methods other than in accordance with U.S. generally accepted accounting principles (“GAAP”). Management believes that the non-GAAP financial measures provide useful supplemental information to both management and investors in understanding Valley’s underlying operational performance, business and performance trends, and may facilitate comparisons of our current and prior performance with the performance of others in the financial services industry. These non-GAAP financial measures should not be considered in isolation or as a substitute for or superior to financial measures calculated in accordance with GAAP. These non-GAAP financial measures may also be calculated differently from similar measures disclosed by other companies. A reconciliation of the non-GAAP measures used in this presentation to the most directly comparable GAAP measures is provided in the Appendix to this presentation.

Overview of Valley 3 Company Overview Strategic Pillars Ticker: VLY (Nasdaq) Relentless Strengthening Deepening Customer our Founded: 1927 Relationships Focus Communities 1 Bank Operations Headquarters : Wayne, NJ Diverse Market Presence: Valley operates over 240 retail branches and commercial banking offices serving northern and central New Jersey, the New York City boroughs of Be a TRUSTED Generate Cultivate a Advocate for our Manhattan, Brooklyn and Queens, Long Island, Florida, FINANCIAL PARTNER INNOVATIVE IDEAS COLLABORATIVE and LOCAL COMMUNITIES Alabama, California and Illinois and SOLUTIONS EMPOWERING CULTURE Financial Highlights as of 6/30/22 3 Return on Average Assets: 0.72% (1.25% Adj. ) 4 $54.4 Billion $6.0 Billion Net Interest Margin : 3.43% 2 Total Assets Mkt. Capitalization 3 Efficiency Ratio : 50.8% Loans / Deposits: 99.3% $43.6 Billion $43.9 Billion CET1 Capital Ratio: 9.06% Gross Loans HFI Total Deposits Non-accrual Loans / Loans: 0.72% 1 2 Corporate headquarters: New York, NY Based on VLY closing stock price of $11.88 as of 9/8/2022 3 4 Please refer to the Non-GAAP Disclosure Reconciliation in the appendix Net Interest Margin is presented on a fully tax equivalent basis using a 21 percent federal tax rate
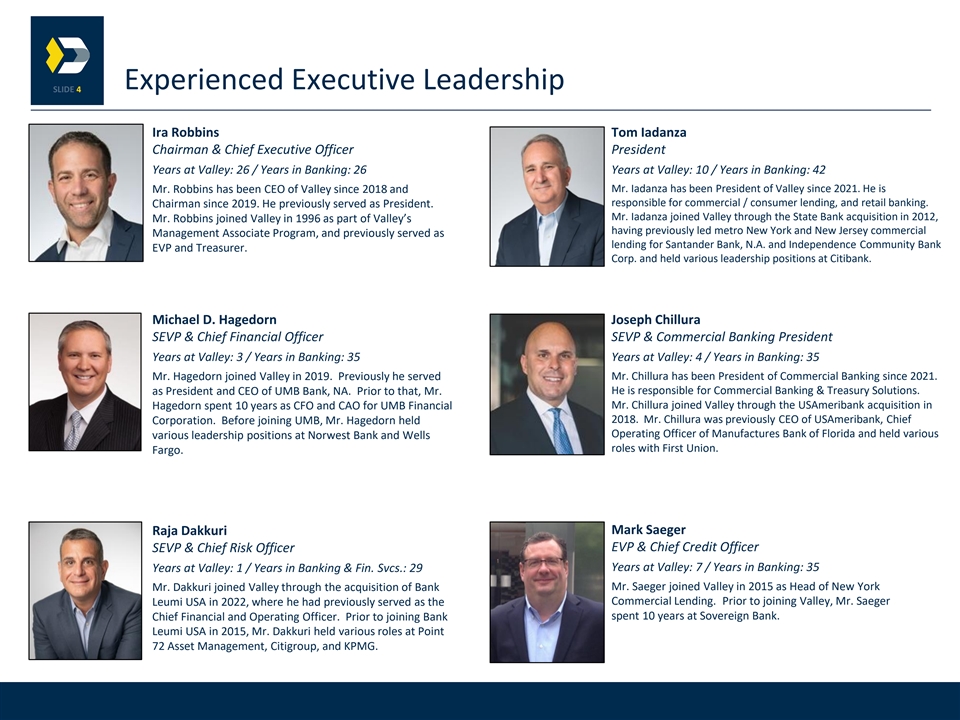
Experienced Executive Leadership 4 Ira Robbins Tom Iadanza Chairman & Chief Executive Officer President Years at Valley: 26 / Years in Banking: 26 Years at Valley: 10 / Years in Banking: 42 Mr. Iadanza has been President of Valley since 2021. He is Mr. Robbins has been CEO of Valley since 2018 and responsible for commercial / consumer lending, and retail banking. Chairman since 2019. He previously served as President. Mr. Iadanza joined Valley through the State Bank acquisition in 2012, Mr. Robbins joined Valley in 1996 as part of Valley’s having previously led metro New York and New Jersey commercial Management Associate Program, and previously served as lending for Santander Bank, N.A. and Independence Community Bank EVP and Treasurer. Corp. and held various leadership positions at Citibank. Michael D. Hagedorn Joseph Chillura SEVP & Chief Financial Officer SEVP & Commercial Banking President Years at Valley: 3 / Years in Banking: 35 Years at Valley: 4 / Years in Banking: 35 Mr. Hagedorn joined Valley in 2019. Previously he served Mr. Chillura has been President of Commercial Banking since 2021. as President and CEO of UMB Bank, NA. Prior to that, Mr. He is responsible for Commercial Banking & Treasury Solutions. Hagedorn spent 10 years as CFO and CAO for UMB Financial Mr. Chillura joined Valley through the USAmeribank acquisition in 2018. Mr. Chillura was previously CEO of USAmeribank, Chief Corporation. Before joining UMB, Mr. Hagedorn held Operating Officer of Manufactures Bank of Florida and held various various leadership positions at Norwest Bank and Wells roles with First Union. Fargo. Raja Dakkuri Mark Saeger SEVP & Chief Risk Officer EVP & Chief Credit Officer Years at Valley: 7 / Years in Banking: 35 Years at Valley: 1 / Years in Banking & Fin. Svcs.: 29 Mr. Dakkuri joined Valley through the acquisition of Bank Mr. Saeger joined Valley in 2015 as Head of New York Commercial Lending. Prior to joining Valley, Mr. Saeger Leumi USA in 2022, where he had previously served as the spent 10 years at Sovereign Bank. Chief Financial and Operating Officer. Prior to joining Bank Leumi USA in 2015, Mr. Dakkuri held various roles at Point 72 Asset Management, Citigroup, and KPMG.

Key Investor Highlights 5 Valley Focuses on Building Robust Relationships to Understand and Service the Diverse Financial Needs of its Commercial and Retail Clients Established business model with a 95-year track record of success Conservative operating philosophy Consistent profitability since inception, including through recessionary periods Diverse commercially-focused franchise operating in dynamic, high-quality markets supplemented by unique nationwide product offerings Deep and experienced management team with skills developed internally and with other large regional and national banking institutions Strong and consistent profitability 50.8% efficiency ratio ¹ for Q2 2022 3.43% net interest margin (FTE) for Q2 2022; 27 basis points improvement from Q1 2022 Proven credit culture with a history of strong asset quality results 0.72% non-accrual loans / total loans for Q2 2022 2 Peak annual net charge-offs for non-covered loans / average loans of 0.40% during 2009 (Great Recession) Disciplined M&A strategy with track record of successful bank and non-bank integrations 1 2 Please refer to the Non-GAAP Disclosure Reconciliation in appendix Excludes charge-offs related to acquired loans covered by FDIC loss-share agreements
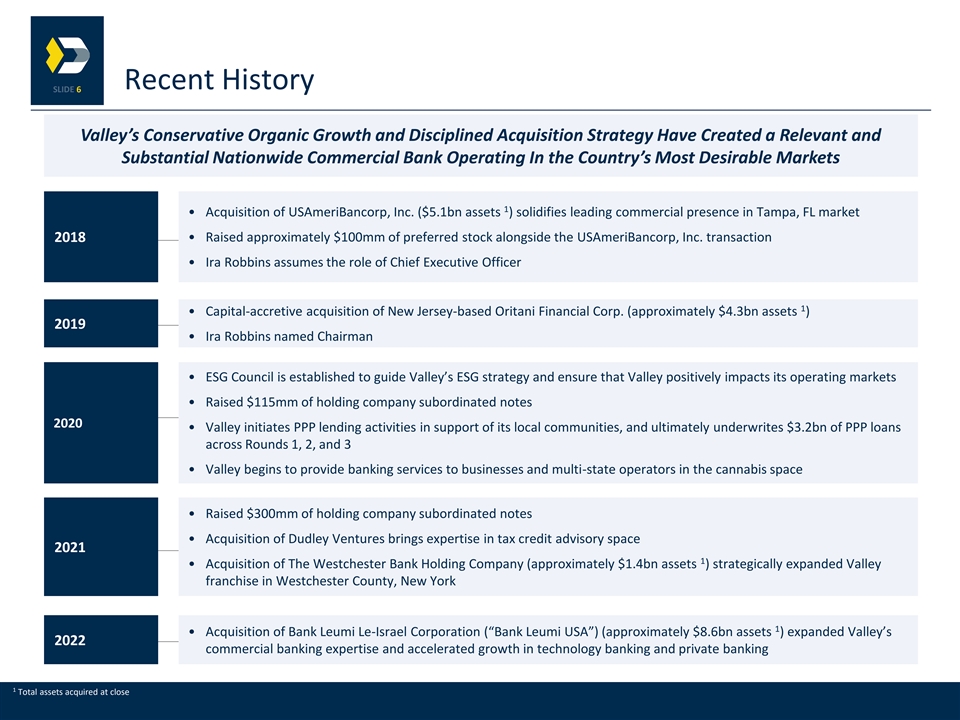
Recent History 6 Valley’s Conservative Organic Growth and Disciplined Acquisition Strategy Have Created a Relevant and Substantial Nationwide Commercial Bank Operating In the Country’s Most Desirable Markets 1 • Acquisition of USAmeriBancorp, Inc. ($5.1bn assets ) solidifies leading commercial presence in Tampa, FL market • Raised approximately $100mm of preferred stock alongside the USAmeriBancorp, Inc. transaction 2018 • Ira Robbins assumes the role of Chief Executive Officer 1 • Capital-accretive acquisition of New Jersey-based Oritani Financial Corp. (approximately $4.3bn assets ) 2019 • Ira Robbins named Chairman • ESG Council is established to guide Valley’s ESG strategy and ensure that Valley positively impacts its operating markets • Raised $115mm of holding company subordinated notes 2020 • Valley initiates PPP lending activities in support of its local communities, and ultimately underwrites $3.2bn of PPP loans across Rounds 1, 2, and 3 • Valley begins to provide banking services to businesses and multi-state operators in the cannabis space • Raised $300mm of holding company subordinated notes • Acquisition of Dudley Ventures brings expertise in tax credit advisory space 2021 1 • Acquisition of The Westchester Bank Holding Company (approximately $1.4bn assets ) strategically expanded Valley franchise in Westchester County, New York 1 • Acquisition of Bank Leumi Le-Israel Corporation (“Bank Leumi USA”) (approximately $8.6bn assets ) expanded Valley’s 2022 commercial banking expertise and accelerated growth in technology banking and private banking 1 Total assets acquired at close

Positioned for Sustained Growth in Dynamic Markets 7 1 Key Demographic Metrics 2010-2022 Median Proj. HHI Population Household Growth Number of Change Income (HHI) (2022-27) Businesses Market Key Business Lines (%) ($000) (%) (000) New Jersey & C&I, Technology Banking, Domestic Private Banking, CRE, 5.9% $92.6 12.2% 888 Construction, Healthcare Metro New York Florida & Alabama Int’l Private Banking, C&I, CRE, HOA 14.8% $66.4 12.8% 1,111 Palo Alto Technology Banking 9.5% $127.5 13.8% 272 Domestic Private Banking, C&I, CRE Los Angeles 3.0% $86.8 13.2% 558 Chicago CRE, C&I 0.8% $83.3 12.3% 418 National Total 8.3% $72.5 12.1% 17,566 VLY Aggregate ² 8.1% $86.8 12.4% 3,247 Other Nationwide Businesses Include: Equipment Financing, Cannabis-Related Business, Insurance Premium Financing, Tax Credit Advisory, and Cash Surrender Value of Life Insurance 1 2 Reflects MSA demographic statistics sourced from US Census data and accessed via S&P Capital IQ Pro; total businesses statistic reflects NAICS business counts by MSA The VLY Aggregate reflects weighted averages of total Valley franchise values across its MSAs using FDIC-reported deposit balances by MSA for population growth, median household income and projected household income growth. For the VLY Aggregate total businesses, the 3.2 million businesses reflect a summation of businesses located across the Valley franchise’s MSAs.

Strategic Execution Drives Sustainable Growth 8 Allowance for Credit Losses / Balanced Execution on Organic and Acquisitive Opportunities Total Assets ($bn) Loans (%) — 17% gross loan CAGR since 2018 $54 — 18% total deposit CAGR since 2018 1.13% $43 1.09% 1.10% $41 $37 — Recent acquisitions of The Westchester Bank and Bank Leumi USA $32 enhance funding based and future growth opportunities. 0.62% 0.55% Diverse Balance Sheet With Multiple Growth Engines — Strategically-positioned around the country’s most dynamic 2018 2019 2020 2021 6/30/22 2018 2019 2020 2021 6/30/22 commercial markets. — Granular commercial loan portfolio is well-diversified by geography Total Deposits ($bn) Gross Loans ($bn) and asset class. $44 $44 — Strategic funding initiatives have contributed to low-cost core $36 $34 $32 $32 account generation. $29 $30 $25 $24 Enhanced Reserve Coverage While Maintaining Stringent Underwriting Standards — Preserving historical underwriting standards that have led to 2018 2019 2020 2021 6/30/22 2018 2019 2020 2021 6/30/22 below-peer credit losses across economic cycles. — Significant lending activity with strong and sophisticated clients that Total Equity / Total Assets (%) TCE / TA¹ (%) are well-known to Valley. 11.7% 11.7% 11.4% 11.3% 8.0% 7.5% 7.5% 7.5% 6.5% Internal Capital Generation Poised to Accelerate Further 10.5% — Stable TCE / TA supporting $22bn asset growth and approximately $400mm annualized increase in earnings power. — TCE has increased nearly $2.0bn since 2018. 2018 2019 2020 2021 6/30/22 2018 2019 2020 2021 6/30/22 1 Please refer to the Non-GAAP Disclosure Reconciliation in appendix

Enhancing Profitability Through Execution 9 Net Income ($mm) Substantial Acceleration of Earnings Power Reported GAAP Adjusted ¹ $492.1 — 145%+ increase in adjusted earnings since 2018 (Q2 2022 $401.7 $326.9 $282.6 annualized adjusted net income) equating to approximately $473.8 $165.8 $390.6 $400mm on an annualized basis. $309.8 $261.4 $96.4 — Balance of organic and acquisitive efforts have contributed to the earnings increase. 2018 2019 2020 2021 2Q22 Return on Average Assets (%) Reported GAAP Adjusted ¹ Significant Profitability Improvement 1.25% 1.19% 0.99% 0.98% 0.93% — Adjusted annualized ROAA expansion of over 30 bps since 2018. — Driven by NIM enhancement and strong non-interest income 1.14% 0.93% 0.96% 0.86% 0.72% growth. 2018 2019 2020 2021 2Q22 Net Interest Margin Growth as Business Scales Net Interest Margin (FTE, %) — Net interest margin expansion of 32 bps since 2018. — Customer deposit costs have declined 66 bps since 2018. — Diversified approach to loan and deposit customers across. 3.43% 3.17% 3.11% geography and industry has enhanced margins. 3.03% 2.95% 2018 2019 2020 2021 2Q22 Revenue Growth Justifies Investment Efforts 1 Efficiency Ratio (%) — Efficiency ratio has improved over 7% since 2018. — Strong efficiency ratio with opportunities to improve further. 57.9% 53.8% 50.8% 48.5% 47.4% 2018 2019 2020 2021 2Q22 1 Please refer to the Non-GAAP Disclosure Reconciliation in appendix
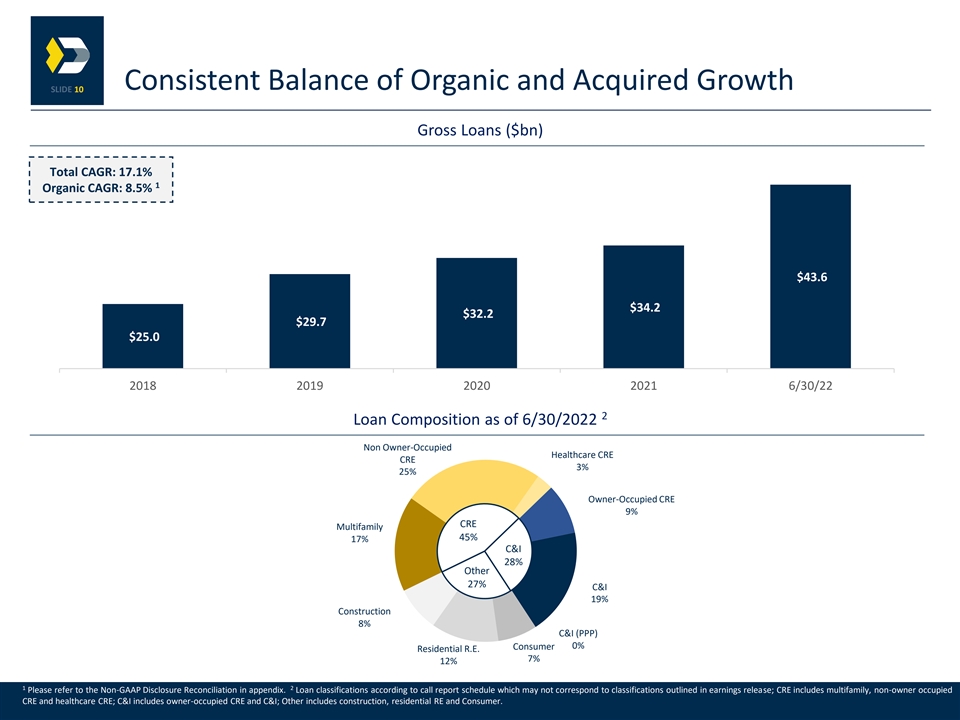
Consistent Balance of Organic and Acquired Growth 10 Gross Loans ($bn) Total CAGR: 17.1% 1 Organic CAGR: 8.5% $43.6 $34.2 $32.2 $29.7 $25.0 2018 2019 2020 2021 6/30/22 2 Loan Composition as of 6/30/2022 Non Owner-Occupied Healthcare CRE CRE 3% 25% Owner-Occupied CRE 9% CRE Multifamily 45% 17% C&I 28% Other 27% C&I 19% Construction 8% C&I (PPP) Consumer 0% Residential R.E. 7% 12% 1 2 Please refer to the Non-GAAP Disclosure Reconciliation in appendix. Loan classifications according to call report schedule which may not correspond to classifications outlined in earnings release; CRE includes multifamily, non-owner occupied CRE and healthcare CRE; C&I includes owner-occupied CRE and C&I; Other includes construction, residential RE and Consumer.

CRE Detail as of 6/30/2022 11 Portfolio by Collateral Type Portfolio by Geography Apartment & Florida Residential 25.1% 29% New York (ex. NYC) New Jersey 10.2% Retail 20.0% Specialty & 19% Other 10% $23.5bn $23.5bn Manhattan (Other) 4.7% Manhattan Healthcare (Multifamily) 11% 5.9% Mixed Use 10% Other NYC Other Industrial Boroughs 20.2% Office 11% 13.9% 10% Geography Outstanding ($BN) % of Total Wtd. Avg. LTV Wtd. Avg. DSCR Florida $5.9 25.1% 61% 1.79x New Jersey $4.7 20.0% 61% 1.87x Other NYC Boroughs $3.2 13.9% 53% 1.39x Manhattan $2.5 10.6% 34% (50% ex Co-Ops) 1.68x New York (ex. NYC) $2.4 10.2% 54% 1.82x Other $4.8 20.2% 66% 1.79x Total $23.5 100.0% 56% 1.74x Sums may be inconsistent due to rounding.

Asset Quality 12 Allowance for Credit Losses for Loans / Total Loans Non-Accrual Loans / Total Loans 0.72% 1.13% 1.09% 1.10% 0.70% 0.62% 0.55% 0.58% 0.56% 0.35% 0.31% 2018 2019 2020 2021 6/30/22 2018 2019 2020 2021 6/30/22 Legacy VLY Combined / Reported Loan Loss Provision ($mm) Net Charge-offs ($mm) $125.1 $45.0 $38.0 $15.9 $43.7 $15.1 $32.9 $32.5 1.03% $41.0 $24.2 $6.5 $2.3 0.12% 0.05% 0.02% 0.06% 0.00% 0.99% 1 $0.7 2018 2019 2020 2021 2Q22 2018 2019 2020 2021 2Q22 Net Charge-offs NCOs / Avg. Loans Non-PCD² 1 Excludes $62.4mm of charge-offs related to PCD loans acquired from Bank Leumi USA and recognized upon completion of the merger in accordance with GAAP. Sums may be inconsistent due to rounding. ² The provision required for non-PCD acquired loans under the Current Expected Credit Loss (CECL) accounting guidance in the period of acquisition.
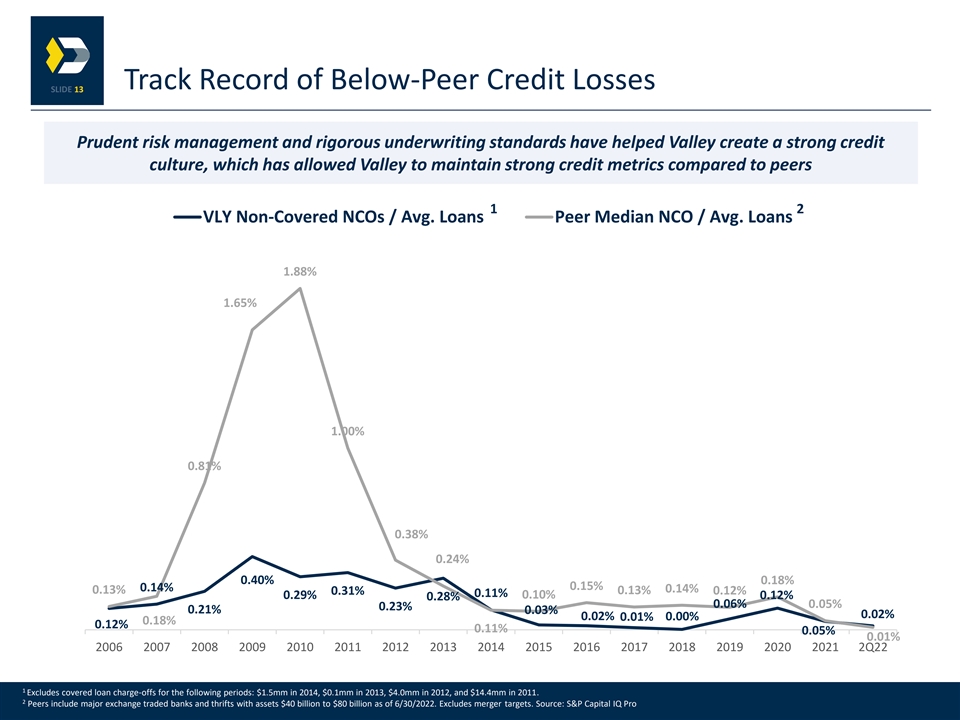
Track Record of Below-Peer Credit Losses 13 Prudent risk management and rigorous underwriting standards have helped Valley create a strong credit culture, which has allowed Valley to maintain strong credit metrics compared to peers 1 2 VLY Non-Covered NCOs / Avg. Loans Peer Median NCO / Avg. Loans 1.88% 1.65% 1.00% 0.81% 0.38% 0.24% 0.40% 0.18% 0.15% 0.14% 0.13% 0.14% 0.31% 0.13% 0.12% 0.11% 0.29% 0.10% 0.28% 0.12% 0.06% 0.05% 0.23% 0.21% 0.03% 0.02% 0.02% 0.00% 0.01% 0.18% 0.12% 0.11% 0.05% 0.01% 2006 2007 2008 2009 2010 2011 2012 2013 2014 2015 2016 2017 2018 2019 2020 2021 2Q22 1 Excludes covered loan charge-offs for the following periods: $1.5mm in 2014, $0.1mm in 2013, $4.0mm in 2012, and $14.4mm in 2011. 2 Peers include major exchange traded banks and thrifts with assets $40 billion to $80 billion as of 6/30/2022. Excludes merger targets. Source: S&P Capital IQ Pro

Enhanced Deposit Composition and Growth Profile 14 Deposit Balance Trends ($bn) Deposit Cost Trends (%) 43.9 Total CAGR: 18.2% ¹ 4.2 Organic CAGR: 8.7% 10% 35.6 31.9 3.7 16.1 37% 29.2 2.22% 6.7 24.5 11.7 1.60% 9.7 1.31% 1.27% 29% 7.1 9.2 54% 0.98% 6.7 1.23% 25% 0.53% 6.2 23.6 0.55% 20.3 0.85% 0.36% 16.0 0.24% 12.8 46% 0.59% 11.2 0.30% 0.20% 0.19% 2018 2019 2020 2021 6/30/22 2018 2019 2020 2021 2Q22 Savings, NOW, MMA Non-Interest Time Total Deposits Savings, NOW, MMA Time Total CAGR by Segment (‘18 – 2Q22, %) Savings, NOW, Non-Interest Time MMA +32% (14%) +24% 1 Please refer to the Non-GAAP Disclosure Reconciliation in appendix

Core Deposit Base Well-Diversified by Geography and Industry 15 Total Deposit Breakdown (as of 6/30/22) Valley has built a strong customer base on a national Specialized Deposits Traditional Deposits $11bn scale, through $33bn $44bn 24% 76% expansion into new business lines and geographic markets Traditional Deposits by Geography (as of 6/30/22) Specialized Deposits by Business Line (as of 6/30/22) Private Banking 12% Technology & Int'l 27% New York New Jersey Legacy Leumi 18% 52% Commercial 15% $33bn $11bn Nat'l Deposits, Cannabis, HOA Other Florida Alabama & Digital 24% 26% 4% 22% Traditional Deposits are Split Roughly 50% / 50% between Commercial (inc. Government) and Retail

Significant Available Liquidity & Low-Risk Securities 16 Liquidity Position & Sources (as of 6/30/22) HTM Securities Portfolio (as of 6/30/22) Liquid Cash Municipal 5% 11% FHLB Borrowing Resi MBS Capacity Obligations of 75% 28% States & Political 3% U.S. Gov. Agency FRB Discount Window 7% Availability $26.8bn $3.7bn Brokered Deposit U.S. Treasury 7% Availability 2% 40% Corporate and Unencumbered other Debt Secur. Securities 95% A-rated or 2% TruPs 13% 1% better Uncommitted Fed Funds Lines 7% AFS Securities Portfolio (as of 6/30/22) Source $BN Municipal Obligations of States 12% & Political Liquid Cash $1.4 1% Resi MBS 52% FHLB Borrowing Capacity $7.6 FRB Discount Window U.S. Treasury $2.0 20% Availability $1.5bn Unencumbered Securities $3.5 Uncommitted Fed Funds Lines $1.9 Corporate and other Debt 88% A-rated or Brokered Deposit Availability $10.9 Secur. better 13% Total $26.8 Note: Totals may not sum due to rounding
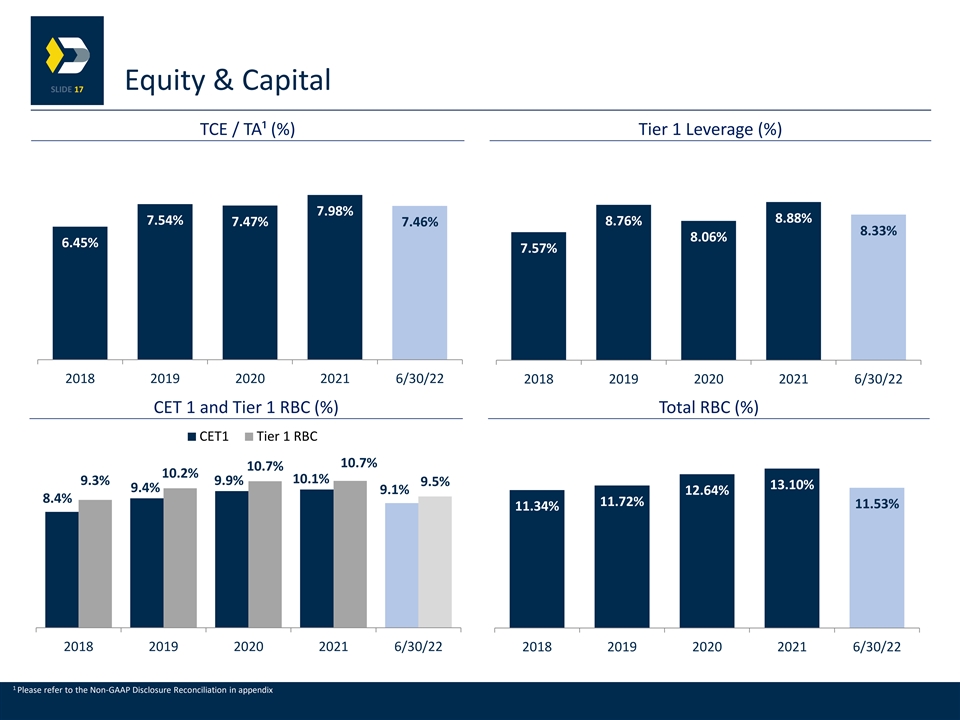
Equity & Capital 17 TCE / TA¹ (%) Tier 1 Leverage (%) 7.98% 8.88% 7.54% 8.76% 7.47% 7.46% 8.33% 8.06% 6.45% 7.57% 2018 2019 2020 2021 6/30/22 2018 2019 2020 2021 6/30/22 CET 1 and Tier 1 RBC (%) Total RBC (%) CET1 Tier 1 RBC 10.7% 10.7% 10.2% 10.1% 9.3% 9.9% 9.5% 13.10% 9.4% 9.1% 12.64% 8.4% 11.72% 11.53% 11.34% 2018 2019 2020 2021 6/30/22 2018 2019 2020 2021 6/30/22 1 Please refer to the Non-GAAP Disclosure Reconciliation in appendix
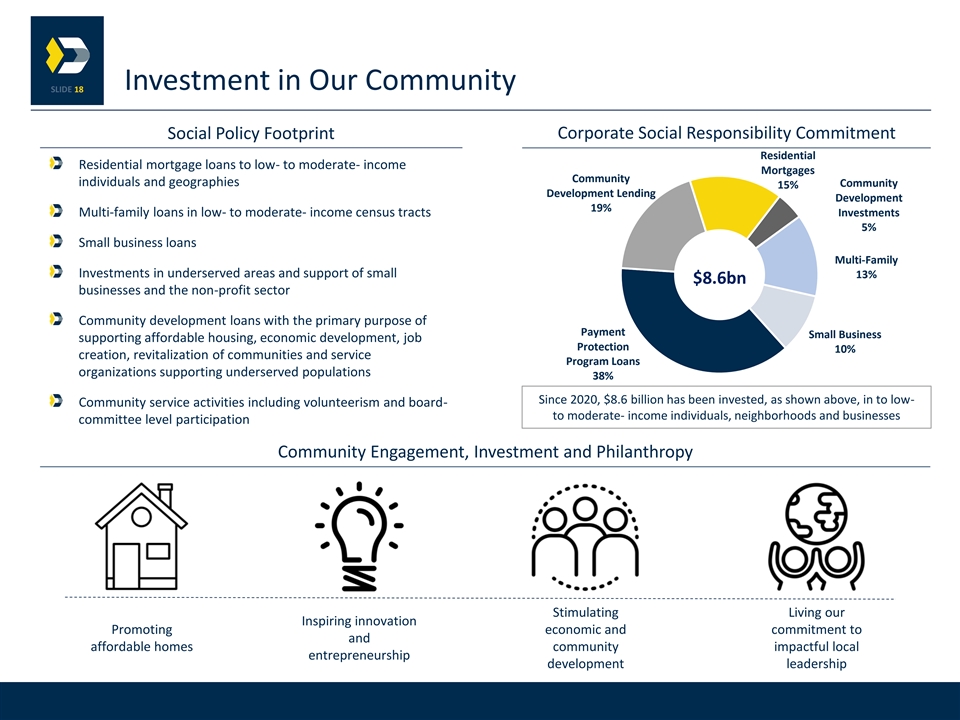
Investment in Our Community 18 Social Policy Footprint Corporate Social Responsibility Commitment Residential Residential mortgage loans to low- to moderate- income Mortgages Community individuals and geographies Community 15% Development Lending Development 19% Investments Multi-family loans in low- to moderate- income census tracts 5% Small business loans Multi-Family Investments in underserved areas and support of small 13% $8.6bn businesses and the non-profit sector Community development loans with the primary purpose of Payment Small Business supporting affordable housing, economic development, job Protection 10% creation, revitalization of communities and service Program Loans organizations supporting underserved populations 38% Since 2020, $8.6 billion has been invested, as shown above, in to low- Community service activities including volunteerism and board- to moderate- income individuals, neighborhoods and businesses committee level participation Community Engagement, Investment and Philanthropy Stimulating Living our Inspiring innovation Promoting economic and commitment to and affordable homes community impactful local entrepreneurship development leadership

Potential Environmental Lending Programs 19 Enhancing lending to environmentally sustainable companies in our operating markets Small Business Environmental Commercial Lending Officers Industry focus toward CRE and C&I lending Increasing focus on larger-scale renewable energy products through club deals and other participations Large Scale Project Finance Initiative Credit facilities could be agented by larger commercial banks already active in the renewable energy sector Enhancing new product platform providing incentives and capital for client utilizing loan proceeds for green initiatives in the residential and commercial mortgage sectors CRE and Consumer Lending Green Platform Focus on lending toward green standard construction and Leadership in Energy and Environmental Design (LEED) certified projects Indirect automotive and floor plan finance areas to provide discounted financing for hybrid and electric Program Supporting Hybrid and consumer vehicles Electric Vehicle Financing Product The program began in June 2021 and has attracted many borrowers in the hybrid and electric vehicle space In October 2021, began tracking lending portfolios involving renewable resources and energy efficient buildings within CRE, residential mortgage loans and automobile financing Tracking and Encouraging Climate Mitigation Lending Focus on providing financing to clients reducing the use of carbon emissions and encouraging the use of renewable energy resources Along with capital stress tests compliant to regulatory standards, management has begun to implement Stress Testing for Climate climate change stress tests to monitor the risk to capital levels Change Goal to develop scenarios that explore various climate related risks within our geographic footprint
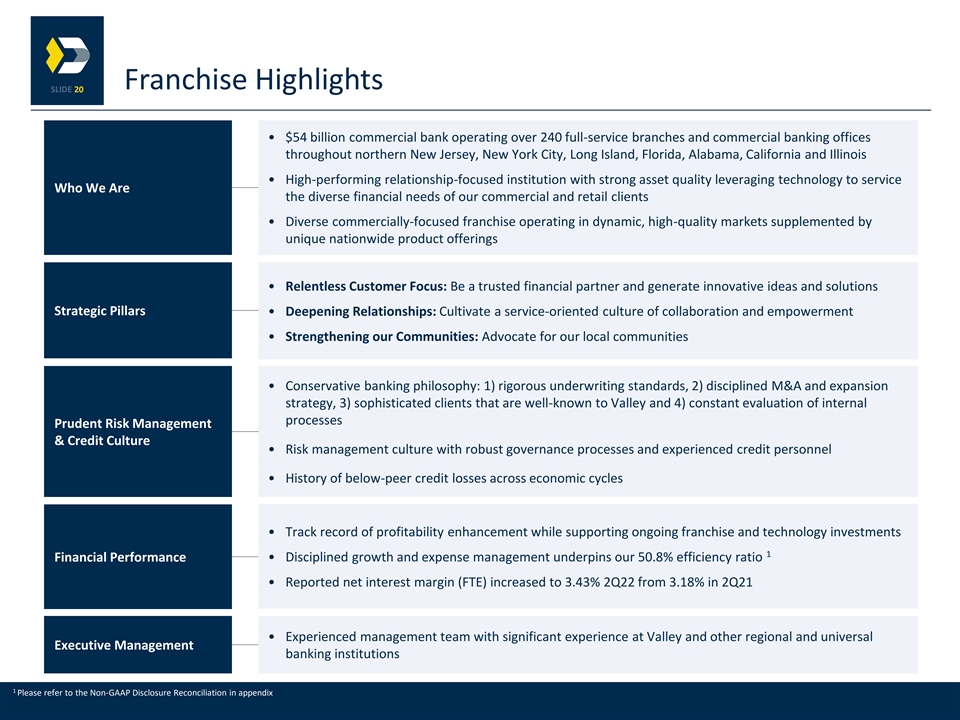
Franchise Highlights 20 • $54 billion commercial bank operating over 240 full-service branches and commercial banking offices throughout northern New Jersey, New York City, Long Island, Florida, Alabama, California and Illinois • High-performing relationship-focused institution with strong asset quality leveraging technology to service Who We Are the diverse financial needs of our commercial and retail clients • Diverse commercially-focused franchise operating in dynamic, high-quality markets supplemented by unique nationwide product offerings • Relentless Customer Focus: Be a trusted financial partner and generate innovative ideas and solutions Strategic Pillars • Deepening Relationships: Cultivate a service-oriented culture of collaboration and empowerment • Strengthening our Communities: Advocate for our local communities • Conservative banking philosophy: 1) rigorous underwriting standards, 2) disciplined M&A and expansion strategy, 3) sophisticated clients that are well-known to Valley and 4) constant evaluation of internal processes Prudent Risk Management & Credit Culture • Risk management culture with robust governance processes and experienced credit personnel • History of below-peer credit losses across economic cycles • Track record of profitability enhancement while supporting ongoing franchise and technology investments 1 Financial Performance • Disciplined growth and expense management underpins our 50.8% efficiency ratio • Reported net interest margin (FTE) increased to 3.43% 2Q22 from 3.18% in 2Q21 • Experienced management team with significant experience at Valley and other regional and universal Executive Management banking institutions 1 Please refer to the Non-GAAP Disclosure Reconciliation in appendix

A p p e n d i x

Historical Financial Highlights 22 As of or for the 6mo As of or for the Years Ended December 31, Period Ended June 30, ($ in thousands, except for share data) 2022 2021 2020 2019 2018 2017 Summary of Operations Interest income—tax equivalent basis $ 795,503 $ 1,337,440 $ 1,387,690 $ 1,325,631 $ 1,164,967 $ 842,457 Interest expense 57,576 124,325 264,815 422,952 302,045 174,107 Net interest income—tax equivalent basis 737,927 1,213,115 1,122,875 902,679 862,922 668,350 Less: tax equivalent adjustment 2,098 3,214 3,971 4,631 5,719 8,303 Net interest income 735,829 1,209,901 1,118,904 898,048 857,203 660,047 Provision for credit loses 47,555 32,633 125,722 24,218 32,501 9,942 Net interest income after provisions for credit losses 688,274 1,177,268 993,182 873,830 824,702 650,105 Total non-interest income 97,803 155,013 183,032 214,520 134,052 111,706 Total non-interest expense 497,070 691,542 646,148 631,555 629,061 509,073 Income before income taxes 289,007 640,739 530,066 456,795 329,693 252,738 Income tax expense 75,866 166,899 139,460 147,002 68,265 90,831 Net income $ 213,141 $ 473,840 $ 390,606 $ 309,793 $ 261,428 $ 161,907 Dividends on preferred stock 6,344 12,688 12,688 12,688 12,688 9,449 Net income available to common shareholders $ 206,797 $ 461,152 $ 377,918 $ 297,105 $ 248,740 $ 152,458 Per Common Share Earnings per share: Basic $ 0.45 $ 1.13 $ 0.94 $ 0.88 $ 0.75 $ 0.58 Diluted 0.44 1.12 0.93 0.87 0.75 0.58 Dividends declared 0.22 0.44 0.44 0.44 0.44 0.44 Dividend payout ratio 50.0% 39.3% 47.3% 50.6% 58.7% 75.9% Weighted average shares outstanding Basic 464,172,210 407,445,379 403,754,356 337,792,270 331,258,964 264,038,123 Diluted 466,320,683 410,018,328 405,046,207 340,117,808 332,693,718 264,889,007 Performance Ratios: Return on average assets 0.88% 1.14% 0.96% 0.93% 0.86% 0.69% Return on average shareholders' equity 7.51 9.98 8.68 8.71 7.91 6.55 ($ in thousands) Financial Condition: Assets $ 5 4,438,807 $ 43,446,443 $ 40,686,076 $ 3 7,436,020 $ 3 1,863,088 $ 2 4,002,306 Net loans (excl. HFS) 43,091,958 33,794,455 31,876,869 29,537,449 24,883,610 18,210,724 Deposits 43,881,051 35,632,412 31,935,602 29,185,837 24,452,974 18,153,462 Shareholders' equity 6,204,913 5,084,066 4,592,120 4,384,188 3,350,454 2,533,165 Asset Quality Ratios: Total non-accrual loans as a % of loans 0.72% 0.70% 0.58% 0.31% 0.35% 0.26% Total NPAs as a % of loans 0.72 0.71 0.60 0.35 0.39 0.31 Total accruing past due and non-accrual loans as a % of loans 0.89 0.87 0.88 0.54 0.62 0.70 Allowance for loan losses as a % on non-accrual loans 149.73 149.53 183.64 173.83 171.79 255.92 Annualized ratio of net charge-offs to average loans outstanding 0.01 0.05 0.12 0.06 0.00 0.01 Allowance for credit losses as a % of total loans 1.13 1.10 1.09 0.55 0.62 0.68 Capital and Regulatory Capital Ratios: Tier 1 leverage capital 8.33 8.88 8.06 8.76 7.57 8.03 Common equity Tier 1 capital 9.06 10.06 9.94 9.42 8.43 9.22 Tier 1 risk-based capital 9.54 10.69 10.66 10.15 9.30 10.41 Total risk-based capital 11.53 13.10 12.64 11.72 11.34 12.61

Acquisition Track Record Supplements Consistent Organic Growth 23 1 Year Target State Assets Bank Leumi USA Strategic Rationale Added new business lines, enhancing balance sheet and 2022 Bank Leumi Le-Israel Corp. NY $8.6 billion revenue diversity to position Valley for sustainable future growth 2021 The Westchester Bank Holding Co. NY $1.4 billion Differentiated technology / venture capital business supports low cost of funds Increased position in the Metro New York & Florida 2019 Oritani Financial Corp. NJ $4.3 billion footprints while adding market entry in the Palo Alto, Los Angeles, and Chicago markets Enhanced pro forma profitability metrics 2018 USAmeriBancorp, Inc. FL $5.1 billion Significantly additive to existing private bank with $4.1 billion of wealth assets 2015 CNLBancshares, Inc. FL $1.6 billion M&A Track Record & Strategy 7 Acquisitions $25.4 Billion 2014 1st United Bancorp, Inc. FL $1.7 billion Successfully completed since Total assets acquired 2012 including $7.5 billion to build a meaningful Florida and Alabama franchise 2012 State Bancorp, Inc. NY $1.7 billion Continue to consider well-structured opportunities to conservatively enhance our franchise and accelerate our strategic initiatives 1 Total assets acquired at close

Fee Income 24 Non-Interest Income ($mm) 2Q22 Non-Interest Income Composition ($mm) Adjusted ¹ Reported GAAP Other $214.5 $18.0 31% $183.0 Trust, Investment & $155.0 Swap Fees Insurance $11.1 $58.5mm $13.0 $134.1 19% 22% $182.5 Loan Servicing Gain-on-Sale of Fees $154.5 Loans, net $139.1 Service Charges $2.7 $58.5 $131.7 $3.6 $10.1 5% 6% 17% $58.5 2018 2019 2020 2021 2Q22 Adjusted Annualized Non-Interest Income CAGR Since 2018 +18% 1 Please refer to the Non-GAAP Disclosure Reconciliation in the appendix

Historical Interest Coverage & Double Leverage 25 (Dollars in Millions) Six Months As of or for the period ended, Ended, 12/31/2018 12/31/2019 12/31/2020 12/31/2021 6/30/2022 Double Leverage Ratio Investment in Subsidiaries $3,610 $4,672 $4,999 $5,765 $6,930 Consolidated Equity $3,350 $4,384 $4,592 $5,084 $6,205 Double Leverage Ratio 108% 107% 109% 113% 112% Interest Coverage Earnings: Income From Continuing Operations Before Taxes $329.69 $456.80 $529.97 $640.70 $288.99 (+) Interest Expense: Debt $111.69 $111.08 $82.58 $56.35 $24.73 A Earnings (Before Long Term Debt Interest) $441.39 $567.88 $612.55 $697.05 $313.72 (+) Interest Expense: Deposits $190.35 $311.87 $182.24 $67.97 $32.85 B Earnings (Before Long Term Debt & Deposit Interest) $631.74 $879.75 $794.79 $765.02 $346.57 Interest Expense: Interest Expense: Debt $111.69 $111.08 $82.58 $56.35 $24.73 Preferred Dividends ¹ $16.00 $18.71 $17.22 $17.16 $8.60 C Interest Expense, Excluding Interest on Deposits $127.69 $129.79 $99.80 $73.51 $33.33 Interest on Deposits $190.35 $311.87 $182.24 $67.97 $32.85 D Total Interest Expense, Debt and Deposits $318.05 $441.66 $282.03 $141.48 $66.18 Interest Coverage (Excluding Deposit Interest Expense): A / C 3.5x 4.4x 6.1x 9.5x 9.4x Interest Coverage (Including Deposit Interest Expense): B / D 2.0x 2.0x 2.8x 5.4x 5.2x 1 The preference security dividend requirement represents the amount of pre-tax earnings required to cover the preferred stock dividend calculated based on the Company's effective income tax rate for the period
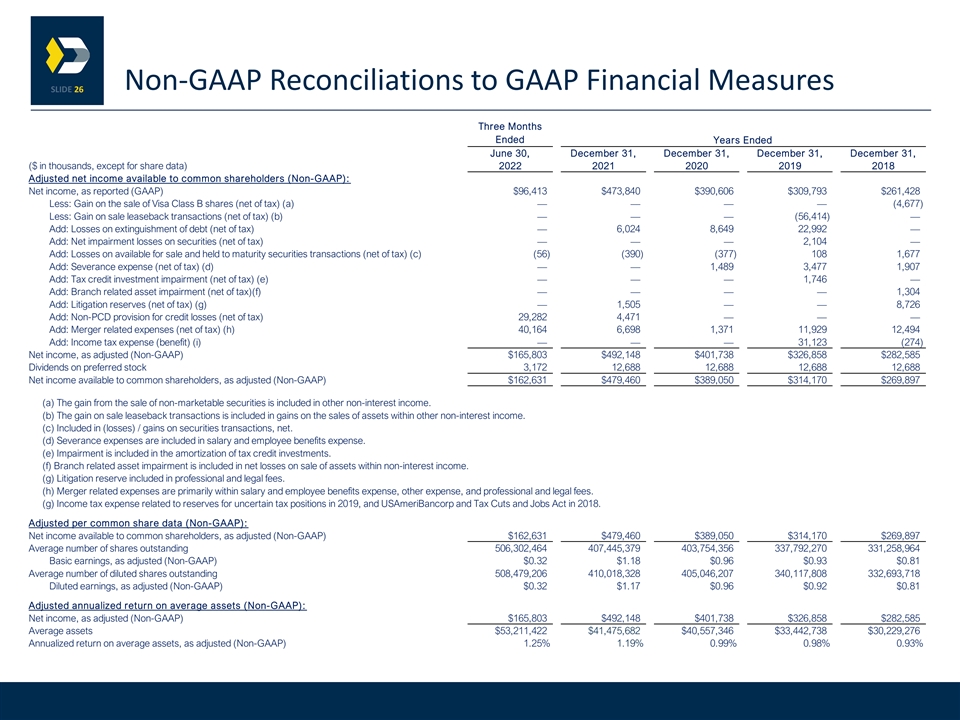
Non-GAAP Reconciliations to GAAP Financial Measures 26 Three Months Ended Years Ended June 30, December 31, December 31, December 31, December 31, ($ in thousands, except for share data) 2022 2021 2020 2019 2018 Adjusted net income available to common shareholders (Non-GAAP): Net income, as reported (GAAP) $96,413 $473,840 $390,606 $309,793 $261,428 Less: Gain on the sale of Visa Class B shares (net of tax) (a)———— (4,677) Less: Gain on sale leaseback transactions (net of tax) (b)——— (56,414)— Add: Losses on extinguishment of debt (net of tax)— 6,024 8,649 2 2,992— Add: Net impairment losses on securities (net of tax)——— 2 ,104— Add: Losses on available for sale and held to maturity securities transactions (net of tax) (c) ( 56) (390) (377) 108 1,677 Add: Severance expense (net of tax) (d)—— 1 ,489 3,477 1 ,907 Add: Tax credit investment impairment (net of tax) (e)——— 1 ,746— Add: Branch related asset impairment (net of tax)(f)———— 1 ,304 Add: Litigation reserves (net of tax) (g)— 1 ,505—— 8 ,726 Add: Non-PCD provision for credit losses (net of tax) 29,282 4 ,471——— Add: Merger related expenses (net of tax) (h) 4 0,164 6 ,698 1 ,371 11,929 12,494 Add: Income tax expense (benefit) (i)——— 3 1,123 (274) Net income, as adjusted (Non-GAAP) $165,803 $492,148 $401,738 $326,858 $282,585 Dividends on preferred stock 3 ,172 12,688 12,688 1 2,688 1 2,688 Net income available to common shareholders, as adjusted (Non-GAAP) $162,631 $479,460 $389,050 $314,170 $269,897 (a) The gain from the sale of non-marketable securities is included in other non-interest income. (b) The gain on sale leaseback transactions is included in gains on the sales of assets within other non-interest income. (c) Included in (losses) / gains on securities transactions, net. (d) Severance expenses are included in salary and employee benefits expense. (e) Impairment is included in the amortization of tax credit investments. (f) Branch related asset impairment is included in net losses on sale of assets within non-interest income. (g) Litigation reserve included in professional and legal fees. (h) Merger related expenses are primarily within salary and employee benefits expense, other expense, and professional and legal fees. (g) Income tax expense related to reserves for uncertain tax positions in 2019, and USAmeriBancorp and Tax Cuts and Jobs Act in 2018. Adjusted per common share data (Non-GAAP): Net income available to common shareholders, as adjusted (Non-GAAP) $162,631 $479,460 $389,050 $314,170 $269,897 Average number of shares outstanding 5 06,302,464 4 07,445,379 403,754,356 337,792,270 3 31,258,964 Basic earnings, as adjusted (Non-GAAP) $0.32 $1.18 $0.96 $0.93 $0.81 Average number of diluted shares outstanding 5 08,479,206 4 10,018,328 405,046,207 3 40,117,808 3 32,693,718 Diluted earnings, as adjusted (Non-GAAP) $0.32 $1.17 $0.96 $0.92 $0.81 Adjusted annualized return on average assets (Non-GAAP): Net income, as adjusted (Non-GAAP) $165,803 $492,148 $401,738 $326,858 $282,585 Average assets $53,211,422 $41,475,682 $40,557,346 $33,442,738 $30,229,276 Annualized return on average assets, as adjusted (Non-GAAP) 1.25% 1.19% 0.99% 0.98% 0.93%

Non-GAAP Reconciliations to GAAP Financial Measures 27 Three Months Ended Years Ended June 30, December 31, December 31, December 31, December 31, ($ in thousands) 2022 2021 2020 2019 2018 Efficiency ratio (Non-GAAP): Non-interest expense, as reported (GAAP) $299,730 $691,542 $646,148 $631,555 $629,061 Less: Loss on extinguishment of debt (pre-tax)— 8 ,406 1 2,036 31,995— Less: Severance expense (pre-tax)—— 2,072 4 ,838 2,662 Less: Litigation reserve (pre-tax)— 2,100—— 1 2,184 Less: Merger-related expenses (pre-tax) 54,496 8 ,900 1,907 1 6,579 17,445 Less: Amortization of tax credit investments (pre-tax) 3,193 1 0,910 13,335 2 0,392 24,200 Non-interest expense, as adjusted (Non-GAAP) $242,041 $661,226 $616,798 $557,751 $572,570 Net interest income, as reported (GAAP) 418,160 1 ,209,901 1 ,118,904 8 98,048 857,203 Non-interest income, as reported (GAAP) 58,533 1 55,013 183,032 2 14,520 1 34,052 Add: Net impairment losses on securities (pre-tax)——— 2 ,928— Add: Branch related asset impairment (pre-tax)———— 1,821 Add: Losses on available for sale and held to maturity securities transactions, net (pre-tax) (78) ( 545) (524) 150 2,342 Less: Gain on the sale of Visa Class B shares (pre-tax)———— 6,530 Less: Gain on sale leaseback transaction (pre-tax)——— 7 8,505— Non-interest income, as adjusted (Non-GAAP) $58,455 $154,468 $182,508 $139,093 $131,685 Gross operating income, as adjusted (Non-GAAP) 476,615 1 ,364,369 $1,301,412 $1,037,141 $988,888 Efficiency ratio (Non-GAAP) 50.78% 48.46% 47.39% 53.78% 57.90% As of June 30, December 31, December 31, December 31, December 31, ($ in thousands, except for share data) 2022 2021 2020 2019 2018 Tangible book value per common share (Non-GAAP): Common shares outstanding 506,328,526 4 21,437,068 403,858,998 4 03,278,390 3 31,431,217 Shareholders' equity $6,204,913 $5,084,106 $4,592,120 $4,384,188 $3,350,454 Less: Preferred Stock 209,691 209,691 2 09,691 209,691 2 09,691 Less: Goodwill and other intangible assets 2,090,147 1 ,529,394 1 ,452,891 1,460,397 1 ,161,655 Tangible common shareholders' equity (Non-GAAP) $3,905,075 $3,345,021 $2,929,538 $2,714,100 $1,979,108 Tangible book value per common share (Non-GAAP): $7.71 $7.94 $7.25 $6.73 $5.79 Tangible common equity to tangible assets (Non-GAAP): Tangible common shareholders' equity (Non-GAAP) $3,905,075 $3,345,021 $2,929,538 $2,714,100 $1,979,108 Total assets 5 4,438,807 43,421,849 4 0,693,576 3 7,436,020 3 1,863,088 Less: Goodwill and other intangible assets 2,090,147 1 ,529,394 1 ,452,891 1,460,397 1 ,161,655 Tangible assets (Non-GAAP) 5 2,348,660 41,892,455 $39,240,685 $35,975,623 $30,701,433 Tangible common equity to tangible assets (Non-GAAP) 7.46% 7.98% 7.47% 7.54% 6.45%

Non-GAAP Reconciliations to GAAP Financial Measures 28 As of, June 30, December 31, ($ in thousands, except for share data) 2022 2018 3.5 Year CAGR Organic Loans and Loan Growth (Non-GAAP) Total Loans, as reported (GAAP) $43,560,777 $25,035,469 17.1% Less: Fair Value of Total Loans Acquired from Bank Leumi USA as of April 1, 2022 5 ,914,389—— Less: Fair Value of Total Loans Acquired from The Westchester Bank Holding Corporation as of December 1, 2021 9 08,023—— Less: Fair Value of Total Loans Acquired from Oritani Financial Corp. as of December 1, 2019 3 ,380,841—— Total Organic Loans (Non-GAAP) 33,357,524 2 5,035,469 8.5% As of, June 30, December 31, ($ in thousands, except for share data) 2022 2018 3.5 Year CAGR Organic Deposits and Deposit Growth (Non-GAAP) Total Deposits, as reported (GAAP) $43,881,051 $24,452,974 18.2% Less: Fair Value of Total Deposits Acquired from Bank Leumi USA as of April 1, 2022 7 ,029,997—— Less: Fair Value of Total Deposits Acquired from The Westchester Bank Holding Corporation as of December 1, 2021 1 ,161,984—— Less: Fair Value of Total Deposits Acquired from Oritani Financial Corp. as of December 1, 2019 2 ,924,716—— Total Organic Deposits (Non-GAAP) 32,764,354 2 4,452,974 8.7%

For More Information 29 ▪ Log onto our website: www.valley.com ▪ Email requests to: tlan@valley.com ▪ Call Travis Lan in Investor Relations, at: (973) 686-5007 ▪ Write to: Valley National Bank 1455 Valley Road Wayne, New Jersey 07470 Attn: Travis Lan, FSVP – Director, Corporate Finance & Business Development ▪ Log onto our website above or www.sec.gov to obtain free copies of documents filed by Valley with the SEC