UNITED STATES
SECURITIES AND EXCHANGE COMMISSION
Washington, D.C. 20549
SCHEDULE 14A
Proxy Statement Pursuant to Section 14(a) of
the Securities Exchange Act of 1934
| Filed by the Registrant ¨ | Filed by a Party other than the Registrant ¨ |
| Check the appropriate box: |
| ¨ | Preliminary Proxy Statement |
| ¨ | Confidential, for Use of the Commission Only (as permitted by Rule 14a-6(e) (2)) |
| x | Definitive Proxy Statement |
| ¨ | Definitive Additional Materials |
| ¨ | Soliciting Material under §240.14a-12 |
| NEWBRIDGE BANCORP |
| (Name of Registrant as Specified In Its Charter) |
| (Name of Person(s) Filing Proxy Statement if other than the Registrant) |
Payment of Filing Fee (Check the appropriate box):
| x | No fee required |
| ¨ | Fee computed on table below per Exchange Act Rules 14a-6(i)(1) and 0-11 | |
| 1) | Title of each class of securities to which transaction applies: | |
| 2) | Aggregate number of securities to which transaction applies: | |
| 3) | Per unit price or other underlying value of transaction computed pursuant to Exchange Act Rule 0-11: | |
| 4) | Proposed maximum aggregate value of transaction: | |
| 5) | Total fee paid | |
| ¨ | Fee paid previously with preliminary materials | |
| ¨ | Check box if any part of the fee is offset as provided by Exchange Act Rule 0-11(a)(2) and identify the filing for which the offsetting fee was paid previously. Identify the previous filing by registration statement number, or the Form or Schedule and the date of its filing. | |
| 1) | Amount Previously Paid: | |
| 2) | Form, Schedule or Registration Statement No.: | |
| 3) | Filing Party: | |
| 4) | Date Filed: | |
1501 Highwoods Boulevard, Suite 400
Greensboro, North Carolina 27410
NOTICE OF SPECIAL MEETING OF SHAREHOLDERS
To be held on February 20, 2013
To the Shareholders of NewBridge Bancorp:
Notice is hereby given that the Special Meeting of Shareholders (the “Special Meeting”) of NewBridge Bancorp (the “Company”) will be held as follows:
| Place: | Community Room |
| NewBridge Bancorp Corporate Office | |
| 1501 Highwoods Boulevard, Suite 400 | |
| Greensboro, North Carolina 27410 | |
| Date: | February 20, 2013 |
| Time: | 1:00 p.m., Eastern Time |
The purpose of the Special Meeting is to consider and act upon the following proposals:
1. CREATE A NEW CLASS OF NON-VOTING COMMON STOCK. To approve an amendment to the Articles of Incorporation to create a class of non-voting common stock (Class B Common Stock), as described in the accompanying proxy statement;
2. INCREASE IN AUTHORIZED CAPITAL STOCK. To approve an amendment to the Articles of Incorporation to increase the number of shares of authorized common stock from 50,000,000 to 100,000,000, and the number of shares of authorized preferred stock from 10,000,000 to 30,000,000, as described in the accompanying proxy statement;
3. CONVERSION OF CONVERTIBLE PREFERRED STOCK.To approve for the purposes of NASDAQ Marketplace Rule 5635 (i) the issuance of up to 9,601,273 shares of Class A Common Stock upon the conversion of up to 422,456 shares of Series B Preferred Stock, and (ii) the issuance of up to 3,186,750 shares of Class B Common Stock upon the conversion of up to 140,217 shares of Series C Preferred Stock, as described in the accompanying proxy statement; and
4. OTHER BUSINESS. To consider such other business as may properly come before the Special Meeting or any adjournment(s) thereof. The Board is not aware of any other business to be conducted at the Special Meeting.
Shareholders of record at the close of business on January 11, 2013 are entitled to notice of and to vote at the Special Meeting and any adjournment(s) thereof. We urge you to attend the Special Meeting. It is extremely important that your shares be represented regardless of the number you own. Whether or not you expect to be present at the Special Meeting, please sign and return your proxy card to us in the enclosed envelope at your earliest convenience. You may also vote your shares over the Internet or by using a toll-free number. Unless you indicate to the contrary, your proxy will be castFOReach proposal, each as described in more detail in the accompanying proxy statement. If any other matters are properly presented for consideration at the Special Meeting, the persons named as proxies and acting thereunder will have discretion to vote on those matters according to their best judgment to the same extent as the person delivering the proxy would be entitled to vote. In the event that you attend the Special Meeting in person, you may revoke your proxy and vote your shares in person.
| This 18th day of January, 2013. | Yours very truly, |
| Michael S. Albert | |
| Chairman |
Important Notice Regarding the Availability of Proxy Materials for the Special Meeting to Be Held on February 20, 2013.
The Notice and Proxy Statement are also available athttp://www.snl.com/irweblinkx/GenPage.aspx?IID=100346&GKP=1073745413. You may also access the above off-site website by going towww.newbridgebank.com, under the headingInvestor Relations.
PROXY STATEMENT
Special Meeting of Shareholders
To be held on February 20, 2013
This Proxy Statement is being mailed to our shareholders on or about January 18, 2013 for solicitation of proxies by the Board of Directors (the “Board”) of your company, NewBridge Bancorp. Our principal executive offices are located at 1501 Highwoods Boulevard, Suite 400, Greensboro, North Carolina 27410.
In this Proxy Statement, terms such as “we,” “us,” “our” and the “Company” refer to NewBridge Bancorp. The term “Bank” means NewBridge Bank, our wholly-owned, North Carolina bank subsidiary. The terms “you” and “your” refer to the shareholders of the Company.
Important Notice Regarding the Availability of Proxy Materials for the Special Meeting to Be Held on February 20, 2013.
The Notice and Proxy Statement are also available athttp://www.snl.com/irweblinkx/GenPage.aspx?IID=100346&GKP=1073745413. You may also access the above off-site website by going towww.newbridgebank.com, under the headingInvestor Relations.
INFORMATION ABOUT THE SPECIAL MEETING
Your vote is very important. For this reason, our Board is requesting that you allow your shares of our common stock (“Common Stock”) to be represented at the Special Meeting of Shareholders (the “Special Meeting”) by the proxies named on the enclosed proxy card.
| When is the Special Meeting? | February 20, 2013 at 1:00 p.m., Eastern Time | |
| Where will the Special Meeting be held? | In the Community Room at our Corporate Office, located at 1501 Highwoods Boulevard, Suite 400, Greensboro, North Carolina 27410 | |
| What items will be voted on at the Special Meeting? | 1. CREATE A NEW CLASS OF NON-VOTING COMMON STOCK. To approve an amendment to the Articles of Incorporation to create a class of non-voting Common Stock (Class B Common Stock), as described herein;
2. INCREASE IN AUTHORIZED CAPITAL STOCK. To approve an amendment to the Articles of Incorporation to increase the number of shares of authorized Common Stock from 50,000,000 to 100,000,000, and the number of shares of authorized preferred stock from 10,000,000 to 30,000,000, as described herein;
3. CONVERSION OF CONVERTIBLE PREFERRED STOCK.To approve for the purposes of NASDAQ Marketplace Rule 5635 (“NASDAQ Rule 5635”) (i) the issuance of up to 9,601,273 shares of Class A Common Stock upon the conversion of up to 422,456 shares of Series B Preferred Stock, and (ii) the issuance of up to 3,186,750 shares of Class B Common Stock upon the conversion of up to 140,217 shares of Series C Preferred Stock, as described herein; and |
| 1 |
| 4. OTHER BUSINESS. To consider such other business as may properly come before the Special Meeting or any adjournment(s) thereof. The Board is not aware of any other business to be conducted at the Special Meeting. | ||
| Who can vote? | Only holders of record of our Common Stock at the close of business on January 11, 2013 (the “Record Date”) will be entitled to notice of and to vote at the Special Meeting or any adjournment(s) thereof. On the Record Date, there were 15,655,868 shares of our Common Stock outstanding and entitled to vote and approximately 2,831 shareholders of record. There is currently no other class of voting stock outstanding. | |
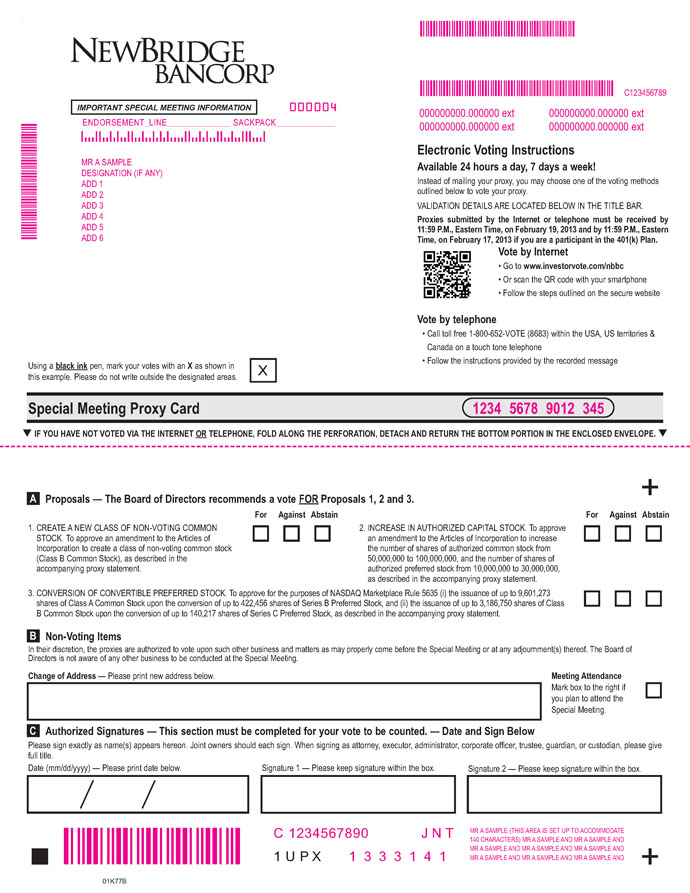
| How do I vote by proxy? | You may vote your shares by marking, signing and dating the enclosed proxy card and returning it in the enclosed postage-paid envelope. The shares represented by a proxy card will be voted at the Special Meeting if the proxy card is properly signed, dated and received by Computershare Trust Company, N.A. (“Computershare”), our transfer agent, prior to the time of the Special Meeting. You may also vote your shares over the Internet or by using a toll-free number. You should refer to the proxy card or the information forwarded by your bank, broker or other holder of record to see what voting options are available to you.
If you return your signed proxy card before the Special Meeting, the proxies will vote your shares as you direct. Michael S. Albert, Barry Z. Dodson, Robert F. Lowe and Pressley A. Ridgill, each a director of the Company and the Bank, have been appointed proxies by the Board.
The Internet and telephone voting facilities will close at 11:59 p.m., Eastern Time, on February 19, 2013. If you vote over the Internet you may incur costs, such as telephone, and Internet access charges for which you will be responsible. If you are interested in voting via the Internet or telephone, specific instructions are shown on the enclosed proxy card. The Internet and telephone voting procedures are designed to authenticate your identity and to allow you to vote your shares and confirm that your instructions have been properly recorded. In the event that the proxy card does not reference Internet or telephone voting information because you are not the registered owner of the shares, please complete and return the proxy card in the self-addressed, postage-paid envelope provided. |
| 2 |
If you are a shareholder of record and a participant in the Computershare Investment Plan or the NewBridge Bancorp Employees’ 401(k) Plan (the “401(k) Plan”), the proxy represents the number of shares of Common Stock in your Computershare Investment Plan account and/or 401(k) Plan account, as applicable, and the number of shares of Common Stock held of record directly by you. Shares allocated to participant accounts in the 401(k) Plan will be voted by the trustee of the 401(k) Plan in accordance with the instructions received from participants who timely return their proxy cards to Computershare or timely indicate their voting instructions pursuant to the Internet or telephone voting procedures. The Internet and telephone voting facilities for participants in the 401(k) Plan will close at 11:59 p.m. Eastern Time on February 17, 2013. Shares of Common Stock held under the 401(k) Plan for which no voting instructions are received will not be voted by the trustee. Shareholders’ voting instructions with respect to shares of Common Stock held under the 401(k) Plan will be held in strict confidence.
If you return your signed proxy card but do not specify how you want to vote your shares, the proxies will vote them “FOR” each proposal.If any other matters are properly presented for consideration at the Special Meeting, the persons named as proxies and acting thereunder will have discretion to vote on those matters according to their best judgment to the same extent as the person delivering the proxy would be entitled to vote.If your shares are held in the name of a broker or other nominee (i.e., held in “street name”), you will need to obtain a proxy instruction form from the broker or other nominee holding your shares and return the form as directed by your broker or other nominee.
We are not aware of any other matters to be brought before the Special Meeting. If matters other than those discussed above are properly brought before the Special Meeting, the proxies may vote your shares in accordance with their best judgment. | ||
| How do I change or revoke my proxy? | You may change or revoke your proxy at any time before it is voted at the Special Meeting in any of three ways: (i) by delivering a written notice of revocation to Computershare; (ii) by delivering another properly signed proxy card to Computershare with a more recent date than that of the proxy first given; or (iii) by attending the Special Meeting and voting in person. You should deliver your written notice or superseding proxy to Computershare at the address noted on the proxy card. If you vote by Internet or telephone, you may also revoke your proxy or change your vote with a timely and valid later Internet or telephone vote, as the case may be. | |
| How many votes may I cast? | You are entitled to one vote for each share of Common Stock held of record on January 11, 2013for each matter presented for a vote at the Special Meeting.
|
| 3 |
| How many votes are required to approve the proposals? | Each proposal will be approved if the votes cast in favor exceed the votes cast in opposition. Abstentions and broker non-votes will not be included in determining the number of votes cast on a proposal and, accordingly, will have no effect on the outcome of such vote. |
Any other matters properly coming before the Special Meeting will require the approval of the holders of Common Stock as required by applicable law or our governing documents.
If you hold your shares in “street name” through a broker or other nominee, your broker or nominee may not be permitted to exercise voting discretion with respect to some or all of the matters to be acted upon. Thus, if you do not give your broker or nominee specific instructions, your shares may not be voted on those matters. Shares represented by such “broker non-votes” will, however, be counted in determining whether there is a quorum at the Special Meeting or any adjournment(s) thereof.
A “broker non-vote” occurs when a broker or other nominee who holds shares for another does not vote on a particular matter because the broker or other nominee does not have discretionary authority on that matter and has not received instructions from the owner of the shares.
In the event there are insufficient votes present at the Special Meeting for a quorum or to approve or ratify any proposal, the Special Meeting may be adjourned in order to permit the further solicitation of proxies. | ||
| What constitutes a “quorum” for the Special Meeting? | A majority of the outstanding shares of our Common Stock entitled to vote at the Special Meeting, present in person or represented by proxy, constitutes a quorum (a quorum is necessary to conduct business at the Special Meeting). Your shares will be considered part of the quorum if you have voted by proxy. Once a share is represented for any purpose at the Special Meeting, it is deemed present for quorum purposes for the remainder of the Special Meeting and any adjournment(s) thereof. Abstentions and broker non-votes count as shares present at the Special Meeting for purposes of determining a quorum. | |
| How are the votes counted? | Computershare, our transfer agent, has been appointed by the Board as the Inspector of Elections for the Special Meeting. Computershare will tabulate the votes received for each proposal and all other items of business at the Special Meeting. Computershare will announce at the Special Meeting and will subsequently certify to the Board, the result of each vote. | |
| How do I obtain directions to the Special Meeting? | Directions to the Special Meeting are available on our website,www.newbridgebank.com, under the headingInvestorRelations. You may also obtain directions to the Special Meeting by contacting Rebecca Gibson, Assistant Vice President and Assistant Secretary at (336) 369-0960. |
| 4 |
| Who pays for the solicitation of proxies? | We will pay the cost of preparing, printing and mailing materials in connection with this solicitation of proxies. In addition to solicitation by mail, officers, directors (including those nominees for election as a director) and employees of the Company and the Bank, may make solicitations personally, by telephone or otherwise without additional compensation for doing so. We have also made arrangements with Georgeson Inc. to assist in soliciting proxies and have agreed to pay that firm a fee not expected to exceed $14,500 for these services. In addition, we will, upon request, reimburse brokerage firms, banks and others for their reasonable out-of-pocket expenses in forwarding proxy materials to beneficial owners of our Common Stock or otherwise in connection with this solicitation of proxies. |
| When are proposals for the 2013 Annual Meeting of Shareholders due? | It is presently anticipated that the 2013 Annual Meeting of Shareholders of the Company will be held in May of 2013. To be considered for inclusion in the proxy solicitation materials of the Board for the 2013 Annual Meeting, shareholder proposals must have been received by the Secretary of the Company at our principal executive offices at 1501 Highwoods Boulevard, Suite 400, Greensboro, North Carolina 27410 no later than December 10, 2012. To be eligible for inclusion, such proposals must have also complied with our Bylaws, Rule 14a-8 and all other applicable provisions of Regulation 14A under the Securities Exchange Act of 1934, as amended.
Any proposal not intended to be included in the proxy statement for the 2013 Annual Meeting of Shareholders, but intended to be presented from the floor at that Annual Meeting, must be received by us at our principal executive offices listed above no later than February 22, 2013. |
| 5 |
BACKGROUND TO THE PROPOSALS AND
THE PRIVATE PLACEMENT
On December 12, 2008, as part of the Troubled Asset Relief Program (“TARP”) Capital Purchase Program, the Company sold the United States Department of the Treasury (“Treasury”) 52,372 shares of Fixed Rate Cumulative Perpetual Preferred Stock, Series A (the “TARP Preferred Stock”) and a warrant (the “TARP Warrant”) to purchase 2,567,255 shares of Common Stock, for an aggregate purchase price of $52.3 million, which capital qualifies as tier 1 capital for regulatory purposes. The Company has been paying Treasury cumulative dividends on the TARP Preferred Stock at a rate of 5% per annum; however, this rate will increase to 9% per annum on and after February 15, 2014. In anticipation of this scheduled increase, our Board and management have been actively considering a number of alternative strategies to repurchase and redeem the TARP Preferred Stock, while continuing to maintain the Company and the Bank’s capital ratios at levels above those required to be considered well-capitalized for regulatory purposes.
In early 2012, FIG Partners, LLC (“FIG”) and Keefe, Bruyette & Woods, Inc. (“KBW”) were engaged by the Company to advise its Board and to ultimately contact potential investors to assess interest in a potential private placement of equity securities. Based on the advice of FIG and KBW, the Company engaged several firms to review and evaluate various portions of the Bank’s loan portfolio and its other real estate owned (real estate interests acquired by the Bank through foreclosure or otherwise acquired from borrowers). These reviews were completed in July of 2012. Although informal contacts with potential investors occurred during this review period, discussions of the specific terms of potential equity investments were deferred until completion of the reviews and the Company’s assessments of the evaluations received.
In August of 2012, FIG and KBW began discussions on the Company’s behalf with a number of potential “key” investors. At the outset, the Company, FIG and KBW understood that it would be necessary and desirable to identify one or more “key” investors to facilitate due diligence for all potential investors and the negotiation of investment terms and pricing acceptable to the Company and those investors selected to invest in the Company. During August and September, FIG and KBW spoke to a number of investment firms which expressed interest in being “key” investors. During this time several potential “key” investors conducted due diligence of the Company.
In the latter part of September, FIG, KBW and the Company conducted discussions with several “key” investors. Although the indications of interest of these investors included the same financial terms, the structures of their potential investments varied and presented differing regulatory considerations. In early October, management of the Company recommended to the Board those potential “key” investors whose indicators of interest were best structured in light of regulatory control requirements, NASDAQ listing standards and shareholder approvals. The Board authorized management to proceed with discussions with these investors with the assistance of FIG and KBW.
The Company and the investors agreed at the outset that the structure of the investment should emphasize common stock, reflecting the increased market and regulatory focus on tier 1 capital and the corresponding tier 1 capital ratio. Depending on the size of investment by each “key” investor, it was also anticipated that in order to satisfy regulatory restrictions on ownership of voting securities, a portion of the securities issued to “key” investors may have to be issued in the form of a new class of non-voting common stock. During October, discussions continued with a view to refining the terms of an investment and addressing structuring issues. The various investors, the Company, FIG and KBW understood that, as a result of the proposed size of the private placement and their mutual intent that the investment ultimately be in the form of tier 1 capital (voting and non-voting common stock), the approval of the Company’s shareholders would be required. In addition, the Company recognized that in order to provide an incentive to each of the investors to fully fund its investment prior to the receipt of such approval, it would be reasonable and necessary for the securities issued to include elements to compensate the investors in the event such approval was not received. Throughout this period, the Company’s senior management, the placement agents and the Company’s corporate counsel regularly updated the Board regarding the progress of discussions and the potential terms of the private placement. Discussions between the Company and the individual investors continued and terms for the private placement were finalized in late October.
| 6 |
On November 1, 2012, the Company entered into securities purchase agreements (the “Securities Purchase Agreements”) with approximately 22 investors, including certain directors and officers of the Company (the “Investors”), and on November 30, 2012, the Company completed the private placement (the “Private Placement”) in which it issued, in exchange for gross aggregate proceeds of approximately $56 million, a total of approximately 422,456 shares of its Series B Mandatorily Convertible Adjustable Rate Cumulative Perpetual Preferred Stock (“Series B Preferred Stock”) and approximately 140,217 shares of its Series C Mandatorily Convertible Adjustable Rate Cumulative Perpetual Preferred Stock (“Series C Preferred Stock,” and together with the Series B Preferred Stock, the “Series B and C Preferred Stock”). The Company intends to use these proceeds to (i) repurchase and redeem the TARP Preferred Stock and repurchase the TARP Warrant, (ii) support the Bank’s disposition of selected classified and non-performing assets in accordance with the Bank’s asset disposition plan and (iii) support the operations of the Company and the Bank, while maintaining the Company and the Bank’s capital ratios at levels above those required to be considered well-capitalized for regulatory purposes.
Following shareholder approval of the Proposals (the “Shareholder Approvals”) and the filing of articles of amendment in the form attached hereto asAppendix A (the “Common Stock Articles of Amendment”) with the North Carolina Secretary of State, the shares of Series B Preferred Stock will automatically convert into shares of voting Common Stock, and the shares of Series C Preferred Stock will automatically convert into shares of non-voting Common Stock (the “Conversion”). If we obtain the Shareholder Approvals and the Conversion occurs before May 30, 2013, no dividends will be owed on the Series B and C Preferred Stock. If we do not receive the Shareholder Approvals and the Conversion does not occur before May 30, 2013, cumulative dividends will be payable to the Investors at a rate of (i) 5% for the initial six month period following issuance, (ii) 6% for the next six months, (iii) 7% for the next six months and (iv) 8% thereafter.
Also on November 1, 2012, the Company and each of the Investors entered into Registration Rights Agreements, which provide the Investors with certain registration rights with respect to the Series B and C Preferred Stock and the shares of voting and non-voting Common Stock into which the Series B and C Preferred Stock convert. Among other things, the Registration Rights Agreements require the Company to file a resale registration statement, or statements if necessary, within 30 days following the Company’s receipt of the Shareholder Approvals.
The closing price of our Common Stock as reported by NASDAQ on October 31, 2012, the trading day immediately prior to the execution of the Securities Purchase Agreements, was $4.26. The Securities Purchase Agreements fix the conversion price at $4.40 per share.
In order for the Company to avoid paying dividends on the Series B and C Preferred Stock, and to assure favorable tier 1 capital treatment for the Company on the net proceeds received in the Private Placement, the Company's shareholders must approve Proposals 1, 2 and 3. Our Board unanimously recommends that our shareholders vote “FOR” each of the proposals at the Special Meeting.
| 7 |
PROPOSAL 1
CREATE A NEW CLASS OF NON-VOTING COMMON STOCK
AND
PROPOSAL 2
INCREASE IN AUTHORIZED CAPITAL STOCK
General
On November 14, 2012, our Board unanimously approved and adopted for submission to shareholders an amendment to our Articles of Incorporation, as amended (“Articles of Incorporation”), to (i) create a new class of non-voting Common Stock, no par value per share (the “Class B Common Stock”), with the existing class of voting Common Stock being re-designated “Class A Common Stock,” no par value per share, (ii) increase the number of shares of Common Stock available for issuance from 50,000,000 to 100,000,000, of which 90,000,000 shares shall be designated Class A Common Stock and 10,000,000 shares shall be designated Class B Common Stock, and (iii) increase the number of shares of preferred stock available for issuance from 10,000,000 to 30,000,000. The proposed Common Stock Articles of Amendment are set out inAppendix A to this Proxy Statement.
Purpose of Creating a New Class of Non-Voting Common Stock and Increasing Authorized Capital Stock
Tier 1 capital and the corresponding tier 1 capital ratio have become increasingly important in measuring and comparing the capital strength of financial institutions. The current stress in the banking industry and the large losses recorded by many financial institutions in recent periods have caused investors to focus on the ability of particular banks, on an absolute and comparative basis to peers, to absorb further losses and the resulting diminution in the institution’s capital. The tier 1 capital ratio gives investors a consistent barometer from one bank to the next to measure and compare the capital strength of financial institutions. Accordingly, in order to maximize the benefit to the Company, the Investors agreed at the outset that the structure of the Private Placement would emphasize the core component of tier 1 capital - common stock. However, in order to satisfy certain regulatory restrictions on ownership of voting securities by certain of our Investors, it was necessary to structure the Private Placement so as to limit the total voting securities that these Investors would own after the Conversion. The issuance of non-voting common stock (in the form of Class B Common Stock) satisfies both these criteria, however under our existing Articles of Incorporation, we are not authorized to issue non-voting common stock. Therefore, in order to maximize the effect that the Private Placement will have on the Company’s tier 1 capital and corresponding tier 1 capital ratio, and satisfy the regulatory restrictions on ownership of our voting securities by certain of our Investors, it is necessary to amend our Articles of Incorporation to create the Class B Common Stock.
Currently, our Articles of Incorporation authorize the issuance of only 50,000,000 shares of Common Stock, and do not permit us to issue shares of non-voting Common Stock. As of the Record Date, there were 15,655,868 shares of Common Stock outstanding. In addition, as of the Record Date, we have reserved for issuance an additional 4,296,605 shares of Common Stock pursuant to our stock compensation plans and the TARP Warrant. The proposed increase in our authorized capital stock is necessary to allow for the conversion of the Series B and C Preferred Stock, as described above, to provide greater flexibility for declaration of stock dividends and for other proper corporate purposes, and to provide maximum flexibility with respect to our ability to augment our capital in the future.
As is the case with the shares of Common Stock that currently are authorized but unissued, if the Common Stock Articles of Amendment are approved by our shareholders, our Board will have authority to issue additional shares of Class A Common Stock and Class B Common Stock from time to time without the expense and delay of a special meeting of shareholders or other shareholder action, except as may be required by applicable laws, regulatory authorities, or the rules of any stock exchange on which our securities are then listed.
If we receive the Shareholder Approvals, the Company will issue approximately 9,601,273 shares of Class A Common Stock upon the conversion of the Series B Preferred Stock, and approximately 3,186,750 shares of Class B Common Stock upon the conversion of the Series C Preferred Stock. Therefore, following the Conversion, there will be approximately 25,257,141 shares of Class A Common Stock issued and outstanding, and approximately 3,186,750 shares of Class B Common Stockissued and outstanding.
| 8 |
Description of the Class A Common Stock
The preferences, limitations and relative rights of the Class A Common Stock shall be identical to the preferences, limitations and relative rights of the existing Common Stock. See “Description of our Class A Common Stock and Class B Common Stock” on page 18, and the Common Stock Articles of Amendment attached hereto asAppendix A.
Description of the Class B Common Stock
Except as to voting rights, the shares of Class B Common Stock to be issued upon the Conversion shall have the same preferences, limitations and relative rights as, share ratably with and be identical in all respects to shares of Class A Common Stock as to all matters. See “Description of our Class A Common Stock and Class B Common Stock” on page 18, and the Common Stock Articles of Amendment attached hereto asAppendix A.
Effect of Proposal 1 and Proposal 2
If Proposal 1 and 2 are approved, there will be a sufficient number of authorized shares of Class A Common Stock to permit the full conversion of the Series B Preferred Stock and a sufficient number of authorized shares of Class B Common Stock to permit the full conversion of the Series C Preferred Stock, and leave additional shares of each class available for potential future issuances. Any future issuance of additional shares of Class A Common Stock or Class B Common Stock could have a dilutive effect on the book value and earnings per share of the outstanding shares and would decrease the relative voting power of current shareholders. The Company does not currently have any material commitments, arrangements, or understanding which would require the issuance of additional shares of Class A Common Stock or Class B Common Stock, other than as described in this Proxy Statement in connection with the Private Placement.
Our Board does not believe that an increase in the number of authorized shares of Common Stock or the creation of an additional class of common stock will have a significant impact on any future (and currently unknown) attempt to gain control of the Company. It is possible, however, that the availability of authorized but unissued shares of Class A Common Stock could discourage third parties from attempting to gain control since the Board could authorize the issuance of shares of Class A Common Stock in a manner that could dilute the voting power of a person attempting to acquire control of the Company, increase the cost of acquiring such control or otherwise hinder such efforts. The Board is not aware of any present threat or attempt to gain control of the Company and neither Proposal 1 nor Proposal 2 is in response to any such action nor is it being presented with the intent that it be utilized as a type of anti-takeover device.
Effectiveness of Change
If Proposals 1, 2 and 3 areall approved at the Special Meeting, we will deliver, as soon as reasonably practicable, to the North Carolina Secretary of State the Common Stock Articles of Amendment and the changes will be effective as of the date of such filing. Accordingly, if one or more of the Proposals is not approved, then the Common Stock Articles of Amendment willnot become effective.
Additional Important Information
See also “ADDITIONAL IMPORTANT INFORMATION” on page 12.
Vote Required
Proposal 1 and 2 will each be approved if the votes cast in favor of such Proposal exceed the votes cast in opposition. Abstentions and broker non-votes will not be included in determining the number of votes cast on the Proposals and, accordingly, will have no effect on the outcome of such vote.
Recommendation
The Board unanimously recommends a vote “FOR” Proposal 1 and “FOR” Proposal 2.
| 9 |
PROPOSAL 3
CONVERSION OF PREFERRED STOCK
General and Purpose of Approving the Proposal
As discussed above, on November 1, 2012, the Company entered into the Securities Purchase Agreements with the Investors, and on November 30, 2012, the Company completed the Private Placement in which it issued a total of approximately 422,456 shares of its Series B Preferred Stock and approximately 140,217 shares of its Series C Preferred Stock. The Company intends to use the net proceeds from the Private Placement to (i) repurchase and redeem the TARP Preferred Stock and repurchase the TARP Warrant, (ii) support the Bank’s disposition of selected classified and non-performing assets in accordance with the Bank’s asset disposition plan and (iii) support the operations of the Company and the Bank, while maintaining the Company and the Bank’s capital ratios at levels above those required to be considered well-capitalized for regulatory purposes.
Because our Common Stock is listed on the NASDAQ Global Select Market, we are subject to NASDAQ Rule 5635, which requires shareholder approval prior to the issuance of securities in connection with a transaction, other than a public offering, involving the sale, issuance or potential issuance by a company of common stock (or securities convertible into or exercisable for common stock) equal to 20% or more of the common stock or 20% or more of the voting power outstanding before the issuance for less than the greater of book or market value of the stock.
The approximately 9,601,273 shares of Class A Common Stock issuable upon conversion of the Series B Preferred Stock and the approximately 3,186,750 shares of Class B Common Stock issuable upon conversion of the Series C Preferred Stock, will exceed 20% of both the voting power and the number of shares of our Common Stock outstanding prior to the issuance.
Although the $4.40 per share conversion price is greater than $4.26, which was the closing price of our Common Stock as reported by NASDAQ on October 31, 2012, the trading day immediately prior to the execution of the Securities Purchase Agreements, it is less than $5.56, which was the book value of our Common Stock based on our common shareholders’ equity divided by the total number of shares of Common Stock outstanding as reported in our Quarterly Report on Form 10-Q for the quarter ended September 30, 2012, our most recent public filing with the Securities and Exchange Commission (the “SEC”). Accordingly, shareholder approval is required pursuant to NASDAQ Rule 5635 to permit us to complete the Conversion and issue the shares of Class A Common Stock and Class B Common Stock, as described above.
Effect of Proposal 3
If this Proposal, together with Proposal 1 and 2, is approved:
| • | Each share of Series B Preferred Stock will automatically convert into shares of Class A Common Stock on the business day after the date on which the Common Stock Articles of Amendment are accepted for filing by the North Carolina Secretary of State. Each outstanding share of Series B Preferred Stock will automatically convert into such number of shares of Class A Common Stock as determined by dividing (i) $100 (the purchase price per share of the Series B Preferred Stock) by (ii) $4.40 (the conversion price of the Series B Preferred Stock). Accordingly, the conversion of the Series B Preferred Stock would result in the issuance of approximately 9,601,273 shares of Class A Common Stock. |
| • | Each share of Series C Preferred Stock will automatically convert into shares of Class B Common Stock on the business day after the date on which the Common Stock Articles of Amendment are accepted for filing by the North Carolina Secretary of State. Each outstanding share of Series C Preferred Stock will automatically convert into such number of shares of Class B Common Stock as determined by dividing (i) $100 (the purchase price per share of the Series C Preferred Stock) by (ii) $4.40, the conversion price of the Series C Preferred Stock. Accordingly, the conversion of the Series C Preferred Stock would result in the issuance of approximately 3,186,750 shares of Class B Common Stock. |
| 10 |
| • | No fractional shares of either Class A Common Stock or Class B Common Stock will be issued as a result of the Conversion. In lieu of any fractional share otherwise issuable as a result of the Conversion, the Investors will receive a cash payment equal to the corresponding fraction of a share based on the closing price of the Common Stock on the NASDAQ Global Stock Market on the second trading day immediately preceding the date of the Conversion. |
| • | Upon the Conversion, all shares of Series B and C Preferred Stock will be cancelled. As a result, the dividend rights and liquidation preferences existing in favor of the Series B and C Preferred Stock will be eliminated. |
Effectiveness of Change
If Proposals 1, 2 and 3 are all approved at the Special Meeting, we will deliver, as soon as reasonably practicable, to the North Carolina Secretary of State the Common Stock Articles of Amendment and the changes will be effective as of the date of such filing. Accordingly, if one or more of the Proposals is not approved, then the Common Stock Articles of Amendment willnot become effective.
Additional Important Information
See also “ADDITIONAL IMPORTANT INFORMATION,” below.
Vote Required
Proposal 3 will be approved if the votes cast in favor of such Proposal exceed the votes cast in opposition. Abstentions and broker non-votes will not be included in determining the number of votes cast on the Proposal and, accordingly, will have no effect on the outcome of such vote.
Recommendation
The Board unanimously recommends a vote “FOR” Proposal 3.
| 11 |
ADDITIONAL IMPORTANT INFORMATION
Pro Forma Financial Information
To assist in your understanding of the impact of the Private Placement and the Proposals, we are providing pro forma financial information. The following pro forma table contains certain financial information as of September 30, 2012 and for the nine months ended September 30, 2012, and as of December 31, 2011 and for the year ended December 31, 2011.
This pro forma table should be read together with our consolidated historical financial statements and Management’s Discussion and Analysis of Financial Condition and Results of Operations (which appeared in our Annual Report on Form 10-K for the year ended December 31, 2011 filed with the SEC on March 22, 2012), and our Quarterly Report on Form 10-Q for the quarter ended September 30, 2012 filed with the SEC on November 14, 2012. SeeAppendix C, D, E and F, attached hereto.
| September 30, 2012 | December 31, 2011 | |||||||||||||||||||||||
| Actual | As Adjusted Assuming Proposals are not Approved(1) | As Adjusted Assuming Proposals are Approved(2) | Actual | As Adjusted Assuming Proposals are not Approved(1) | As Adjusted Assuming Proposals are Approved(2) | |||||||||||||||||||
| (Dollars in thousands, except per share data) | ||||||||||||||||||||||||
| Assets: | ||||||||||||||||||||||||
| Cash | $ | 42,741 | $ | 94,935 | $ | 94,935 | $ | 53,992 | $ | 106,186 | $ | 106,186 | ||||||||||||
| Securities | 387,376 | 387,376 | 387,376 | 337,811 | 337,811 | 337,811 | ||||||||||||||||||
| Net loans | 1,133,731 | 1,133,731 | 1,133,731 | 1,171,226 | 1,171,226 | 1,171,226 | ||||||||||||||||||
| Loans held for sale | 7,074 | 7,074 | 7,074 | 7,851 | 7,851 | 7,851 | ||||||||||||||||||
| Other assets | 142,987 | 142,987 | 142,987 | 163,684 | 163,684 | 163,684 | ||||||||||||||||||
| Total assets | $ | 1,713,909 | $ | 1,766,103 | $ | 1,766,103 | $ | 1,734,564 | $ | 1,786,758 | $ | 1,786,758 | ||||||||||||
| Liabilities: | ||||||||||||||||||||||||
| Deposits | $ | 1,389,736 | $ | 1,389,736 | $ | 1,389,736 | $ | 1,418,676 | $ | 1,418,676 | $ | 1,418,676 | ||||||||||||
| Borrowings | 163,974 | 163,974 | 163,974 | 133,474 | 133,474 | 133,474 | ||||||||||||||||||
| Other liabilities | 20,834 | 20,834 | 20,834 | 19,027 | 19,027 | 19,027 | ||||||||||||||||||
| Total liabilities | $ | 1,574,544 | $ | 1,574,544 | $ | 1,574,544 | $ | 1,571,177 | $ | 1,571,177 | $ | 1,571,177 | ||||||||||||
| Shareholders’ Equity: | ||||||||||||||||||||||||
| Series A Preferred Stock | $ | 52,014 | $ | 52,014 | $ | 52,014 | $ | 51,789 | $ | 51,789 | $ | 51,789 | ||||||||||||
| Series B Preferred Stock | 42,245 | 42,245 | ||||||||||||||||||||||
| Series C Preferred Stock | 14,022 | 14,022 | ||||||||||||||||||||||
| Class A Common Stock | 78,279 | 78,279 | 120,524 | 78,279 | 78,279 | 120,524 | ||||||||||||||||||
| Class B Common Stock | 14,022 | 14,022 | ||||||||||||||||||||||
| Additional paid in capital | 87,276 | 83,203 | 83,203 | 87,190 | 83,117 | 83,117 | ||||||||||||||||||
| Retained earnings | (79,731 | ) | (79,731 | ) | (79,731 | ) | (47,525 | ) | (47,525 | ) | (47,525 | ) | ||||||||||||
| Accumulated other comprehensive income | 1,995 | 1,995 | 1,995 | (5,771 | ) | (5,771 | ) | (5,771 | ) | |||||||||||||||
| Other equity | (468 | ) | (468 | ) | (468 | ) | (575 | ) | (575 | ) | (575 | ) | ||||||||||||
| Total equity | $ | 139,365 | $ | 191,559 | $ | 191,559 | $ | 163,387 | $ | 215,581 | $ | 215,581 | ||||||||||||
| Total liabilities and shareholders’ equity: | ||||||||||||||||||||||||
| Tangible common book value per share | $ | 5.35 | $ | 5.09 | $ | 4.78 | $ | 6.85 | $ | 6.59 | $ | 5.60 | ||||||||||||
| Common book value per share | $ | 5.56 | $ | 5.30 | $ | 4.89 | $ | 7.09 | $ | 6.83 | $ | 5.74 | ||||||||||||
| Capital Ratios: | ||||||||||||||||||||||||
| Tier 1 leverage ratio | 8.53 | % | 9.24 | % | 11.50 | % | 10.65 | % | 11.81 | % | 13.31 | % | ||||||||||||
| Tier 1 risk based capital ratio | 10.78 | % | 12.03 | % | 14.97 | % | 13.28 | % | 15.19 | % | 17.11 | % | ||||||||||||
| Total risk based capital ratio | 12.07 | % | 16.08 | % | 16.26 | % | 14.55 | % | 18.39 | % | 18.39 | % | ||||||||||||
| (1) | Reflects the net proceeds of the Private Placement of approximately $52.2 million after deducting commissions and our estimated expenses of approximately $4.1 million. Assumes that the Proposals are not approved and therefore the Series B and C Preferred Stock remain outstanding. If the Conversion does not occur before May 30, 2013, cumulative dividends will be payable to the Investors at a rate of (i) 5% for the initial six month period following issuance, (ii) 6% for the next six months, (iii) 7% for the next six months and (iv) 8% thereafter. |
| 12 |
| (2) | Reflects the net proceeds of the Private Placement of approximately $52.2 million after deducting commissions and our estimated expenses of approximately $4.1 million. Assumes the conversion of approximately 422,456 shares of Series B Preferred Stock into approximately 9,601,273 shares of Class A Common Stock and the conversion of approximately 140,217 shares of Series C Preferred Stock into approximately 3,186,750 shares of Class B Common Stock, based on the conversion price of $4.40 per share |
Financial Statements
Our Audited Consolidated Financial Statements (including notes thereto) at December 31, 2011 and 2010 and for the years in the three-year period ended December 31, 2011, as included in our Annual Report on Form 10-K for the fiscal year ended December 31, 2011, are attached to this Proxy Statement asAppendix C and incorporated by reference herein. Our Unaudited Consolidated Financial Statements (including notes thereto) at September 30, 2012 and December 31, 2011 and for the three-month and nine-month periods ended September 30, 2012 and September 30, 2011, as included in our Quarterly Report on Form 10-Q for the fiscal quarter ended September 30, 2012, are attached to this Proxy Statement asAppendix E and incorporated by reference herein.
Management’s Discussion and Analysis of Financial Condition and Results of Operations
Management’s Discussion and Analysis of Financial Condition at December 31, 2011 and December 31, 2010 and Results of Operations for the years in the three-year period ended December 31, 2011, as included in our Annual Report on Form 10-K for the fiscal year ended December 31, 2011, is attached to this Proxy Statement asAppendix D and incorporated by reference herein. Management’s Discussion and Analysis of Financial Condition at September 30, 2012 and December 31, 2011 and Results of Operations for the three-month and nine-month periods ended September 30, 2012 and September 30, 2011, as included in our Quarterly Report on Form 10-Q for the fiscal quarter ended September 30, 2012, is attached to this Proxy Statement asAppendix F and incorporated by reference herein.
Changes in and Disagreements with Accountants on Accounting and Financial Disclosure
There have been no changes in or disagreements with our accountants required to be disclosed pursuant to Item 304 of Regulation S-K.
Quantitative and Qualitative Disclosures about Market Risk
Information regarding our quantitative and qualitative disclosures about market risk is contained in Management’s Discussion and Analysis of Financial Condition and Results of Operations as reported in our Annual Report on Form 10-K and attached hereto asAppendix D in the section thereof entitled “QUANTITATIVE AND QUALITATIVE DISCLOSURES ABOUT MARKET RISK.” See also the section entitled “Interest Rate Risk Management” in Management’s Discussion and Analysis of Financial Condition and Results of Operations contained in our Quarterly Report on Form 10-Q for the fiscal quarter ended September 30, 2012, which is attached hereto asAppendix F.
Consequences if the Proposals are Approved
Conversion of the Series B Preferred Stock into Class A Common Stock. Each share of Series B Preferred Stock will automatically convert into shares of Class A Common Stock on the business day after the date on which the Common Stock Articles of Amendment are accepted for filing by the North Carolina Secretary of State. Each outstanding share of Series B Preferred Stock will automatically convert into such number of shares of Class A Common Stock as determined by dividing (i) $100 (the purchase price per share of the Series B Preferred Stock) by (ii) $4.40 (the conversion price of the Series B Preferred Stock). Accordingly, the conversion of the Series B Preferred Stock would result in the issuance of approximately 9,601,273 shares of Class A Common Stock.
Conversion of the Series C Preferred Stock into Class B Common Stock. Each share of Series C Preferred Stock will automatically convert into shares of Class B Common Stock on the business day after the date on which the Common Stock Articles of Amendment are accepted for filing by the North Carolina Secretary of State. Each outstanding share of Series C Preferred Stock will automatically convert into such number of shares of Class B Common Stock as determined by dividing (i) $100 (the purchase price per share
| 13 |
of the Series C Preferred Stock) by (ii) $4.40, the conversion price of the Series C Preferred Stock. Accordingly, the conversion of the Series C Preferred Stock would result in the issuance of approximately 3,186,750 shares of Class B Common Stock.
Cash Payments in Lieu of Fractional Shares. No fractional shares of either Class A Common Stock or Class B Common Stock will be issued as a result of the Conversion. In lieu of any fractional share otherwise issuable as a result of the Conversion, the Investors will receive a cash payment equal to the corresponding fraction of a share based on the closing price of the Common Stock on the NASDAQ Global Stock Market on the second trading day immediately preceding the date of the Conversion.
Rights of Investors.The preferences, limitations and relative rights of the shares of Class A Common Stock issued upon the Conversion will be identical to the preferences, limitations and relative rights of the shares of Common Stock held by our existing shareholders. Except as to voting rights, the shares of Class B Common Stock issued upon the Conversion shall have the same preferences, limitations and relative rights as, share ratably with and be identical in all respects to shares of Class A Common Stock as to all matters. Whereas shares of Class A Common Stock shall have unlimited voting rights, with each share being entitled to one vote, shares of Class B Common Stock shall have no voting rights except that the affirmative vote of the holders of a majority of the outstanding shares of Class B Common Stock, voting separately as a class, shall be required to amend (including by merger or otherwise) the Articles of Incorporation, to significantly and adversely affect the designation, preferences, limitations or relative rights of all or part of the shares of Class B Common Stock, and as otherwise required by law.
Dilution.Upon the Conversion,we will issue approximately 9,601,273 shares of Class A Common Stock and approximately 3,186,750 shares of Class B Common Stock. As a result, we expect there to be a dilutive effect on both the earnings per share of our Common Stock and the book value per share of our Common Stock. In addition, our existing common shareholders will own a smaller percentage of our outstanding Common Stock. See “CAPITALIZATION,” on page 20.
Effect on Earnings Per Share.The following table presents the Company’s unaudited pro forma earnings (loss) per share adjusted for the pro forma impacts of the Conversion for the periods shown. The pro forma consolidated earnings per share calculations assume no material pro forma impacts to net income (loss) for the periods shown. Pro forma earnings per share assumes the Company had completed the Private Placement and the Conversion on the first day of the period presented. Based on 15,655,868 shares of Common Stock outstanding as of the Record Date, following the Conversion, the Investors will own, in the aggregate, 45.0% of our total common stock (Class A Common Stock and Class B Common Stock) and existing common shareholders (excluding the Investors) will own approximately 55.0% of our total Common Stock.
| Actual Nine Months Ended September 30, 2012 | Conversion Adjustments | Pro Forma Nine Months Ended September 30, 2012 | ||||||||||
| (Dollars in thousands, except per share data) | ||||||||||||
| Net loss available to common shareholders | $ | (32,206 | ) | $ | 0.00 | $ | (32,206 | ) | ||||
| Basic earnings per share | $ | (2.06 | ) | $ | 0.93 | $ | (1.13 | ) | ||||
| Diluted earnings per share | $ | (2.06 | ) | $ | 0.93 | $ | (1.13 | ) | ||||
| Weighted average common shares | 15,655,868 | 12,788,023 | 28,443,891 | |||||||||
| Weighted average dilutive shares | 15,655,868 | 12,788,023 | 28,443,891 | |||||||||
| 14 |
| Actual Twelve Months Ended December 31, 2011 | Conversion Adjustments | Pro Forma Twelve Months Ended December 31, 2011 | ||||||||||
| (Dollars in thousands, except per share data) | ||||||||||||
| Net income available to common shareholders | $ | 1,761 | $ | 0.00 | $ | 1,761 | ||||||
| Basic earnings per share | $ | 0.11 | $ | (0.05 | ) | $ | 0.06 | |||||
| Diluted earnings per share | $ | 0.11 | $ | (0.05 | ) | $ | 0.06 | |||||
| Weighted average common shares | 15,655,868 | 12,788,023 | 28,443,891 | |||||||||
| Weighted average dilutive shares | 16,573,064 | 12,788,023 | 29,361,087 | |||||||||
Elimination of Dividend and Liquidation Rights of Holders of Series B and C Preferred Stock.Upon the Conversion, all shares of Series B and C Preferred Stock will be cancelled. As a result, the dividend rights and liquidation preferences existing in favor of the Series B and C Preferred Stock will be eliminated. See “Description of Series B and C Preferred Stock,” on page 17.
Improved Balance Sheet and Regulatory Capital.The net proceeds from the Private Placement have already strengthened our balance sheet and regulatory capital levels. The Conversion will further strengthen certain of our key capital ratios, including improved capital treatment of the net proceeds from the Private Placement, because of the more favorable treatment of common stock for regulatory capital purposes.
Market Effects.Despite the existence of certain restrictions on transfer, the issuance of shares of Class A Common Stock and Class B Common Stock upon the Conversion may impact trading patterns and adversely affect the market price of Class A Common Stock. If significant quantities of shares of Class A Common Stock or Class B Common Stock issued to Investors upon the Conversion are sold (or if it is perceived that they may be sold) into the public market, the trading price of Class A Common Stock could be adversely affected.
Consequences if the Proposals are Not Approved
The Series B and C Preferred Stock Will Remain Outstanding.Unless we receive the Shareholder Approvals or unless our shareholders approve similar proposals at a subsequent meeting, the Series B and C Preferred Stock will remain outstanding in accordance with their terms.
Continued Dividend Payment.For so long as the Series B and C Preferred Stock remains outstanding, we will be required to accrue and pay dividends as summarized below and as set forth in the articles of amendment attached hereto asAppendix B (the “Preferred Stock Articles of Amendment”.
Market Effects.As with any dividends, there is no assurance that we will be able to pay dividends on the Series B and C Preferred Stock and, if we are unable to pay such dividends as scheduled, the market perception could have a serious adverse impact on the price of our Common Stock.
Restriction on Payment of Dividends.For as long as the Series B and C Preferred Stock is outstanding, if full dividends payable on all outstanding shares of the Series B and C Preferred Stock have not been declared and paid, or declared and a sum sufficient for payment of those dividends been set aside, we will not be permitted to: (i) declare and pay or set aside for payment or declare and make or set aside for payment any distribution of assets, including dividends, on any of our junior securities (including our Common Stock) or parity securities, or (ii) repurchase, redeem, or acquire any of our junior securities, or (iii) repurchase, redeem, or acquire any junior security or parity security, subject to limited exceptions.
Additional Shareholder Meetings.We will be required to call additional shareholder meetings and recommend approval of proposals similar to these Proposals at each meeting every six months, if necessary, until such approvals are obtained pursuant to the provisions of the Securities Purchase Agreements. We will bear the costs of soliciting the approval of our shareholders in connection with these meetings.
Liquidation Preference.For as long as the Series B and C Preferred Stock remain outstanding, such shares will retain a senior liquidation preference over shares of our Common Stock in connection with any liquidation of us and, accordingly, no payments will be made to holders of our Common Stock upon any liquidation unless the full liquidation preference on the Series B and C Preferred Stock has first been paid in full.
| 15 |
Certain Interests of Certain Directors and Executive Officers in the Proposals
Upon the Conversion, we will issue approximately 304,750 shares of Class A Common Stock to those directors and executive officers who purchased shares of Series B Preferred Stock in the Private Placement. These directors and executive officers purchased their shares of Series B Preferred Stock at the same price and on the same terms and conditions as other independent unaffiliated third party Investors and did so to further align such directors’ and executive officers’ interests with generating long-term shareholder value. No director or officer purchased Series C Preferred Stock in the Private Placement. See “SECURITY OWNERSHIP OF CERTAIN BENEFICIAL OWNERS AND MANAGEMENT” on page 21.
Description of Series B and C Preferred Stock.
The following is a summary description of the preferences, limitations and relative rights of our Series B and C Preferred Stock. This summary does not purport to be complete in all respects. This description is subject to and qualified in its entirety by reference to the North Carolina Business Corporation Act (the “NCBCA”), our Articles of Incorporation, as amended by the Preferred Stock Articles of Amendment attached hereto asAppendix B, and our Bylaws.
General.Our Articles of Incorporation currently authorize the issuance of 10,000,000 shares of preferred stock, of which 52,372shares are designated as TARP Preferred Stock, 1,000,000 shares are designated as Series B Preferred Stock, and 500,000 shares are designated as Series C Preferred Stock. The Series B and C Preferred Stock have a par value of $0.01 per share, and a liquidation preference of $100 per share. As of the Record Date, the Company had issued and outstanding approximately 422,456 shares of Series B Preferred Stock and approximately 140,217 shares of Series C Preferred Stock. All of the outstanding shares of Series B and C Preferred Stock were issued to the Investors in the Private Placement.
Mandatory Conversion.Each share of Series B Preferred Stock will automatically convert into shares of Class A Common Stock on the business day after the date on which the Common Stock Articles of Amendment are accepted for filing by the North Carolina Secretary of State. Each outstanding share of Series B Preferred Stock will automatically convert into such number of shares of Class A Common Stock as determined by dividing (i)��$100 (the purchase price per share of the Series B Preferred Stock) by (ii) $4.40 (the conversion price of the Series B Preferred Stock). Each share of Series C Preferred Stock will automatically convert into shares of Class B Common Stock on the business day after the date on which the Common Stock Articles of Amendment are accepted for filing by the North Carolina Secretary of State. Each outstanding share of Series C Preferred Stock will automatically convert into such number of shares of Class B Common Stock as determined by dividing (i) $100 (the purchase price per share of the Series C Preferred Stock) by (ii) $4.40 (the conversion price of the Series C Preferred Stock). No fractional shares of either Class A Common Stock or Class B Common Stock will be issued as a result of the Conversion. In lieu of any fractional share otherwise issuable as a result of the Conversion, the Investors will receive a cash payment equal to the corresponding fraction of a share based on the closing price of the Common Stock on the NASDAQ Global Stock Market on the second trading day immediately preceding the date of the Conversion.
Anti-dilution Provisions.The conversion price of the Series B Preferred Stock and Series C Preferred Stock is subject to customary anti-dilution adjustments.
Dividends. Holders shall be entitled to receive, when, as and if authorized and declared by the Board, out of legally available funds, on a cumulative basis, cash dividends payable in semi-annual installments commencing on May 30, 2013 at the rate of (i) 5% per annum for the initial six month period ending May 30, 2013, (ii) 6% per annum for the next six month period, (iii) 7% per annum for the next six month period, and (iv) 8% per annum thereafter. If the Conversion occurs prior to May 30, 2013, no dividends will be paid on the Series B and C Preferred Stock.
Ranking.Shares of Series B and C Preferred Stock rank, with respect to the payment of dividends and distributions and upon liquidation, dissolution or winding-up, on parity with our TARP Preferred Stock and senior to our Common Stock, and each other class or series of our capital stock, the terms of which do not expressly provide that it ranks on parity with or senior to the Series B or C Preferred Stock, that the Company may issue in the future.
| 16 |
Voting Rights.Shares of the Series B Preferred Stock generally have no voting rights other than as required by law except that (i) the approval of at least a two-thirds majority of the holders of the Series B Preferred Stock, voting as a single class, will be required for the creation of any series of senior equity securities, and (ii) the approval of all of the holders of the Series B Preferred Stock will be required for amendments to our Articles of Incorporation (including by means of a merger or otherwise) significantly and adversely affecting the special rights, preferences, privileges or voting powers of the Series B Preferred Stock. Shares of the Series C Preferred Stock generally have no voting rights other than as required by law except that (i) the approval of at least a two-thirds majority of the holders of the Series C Preferred Stock, voting as a single class, will be required for the creation of any series of senior equity securities, and (ii) the approval of all of the holders of the Series C Preferred Stock will be required for amendments to our Articles of Incorporation (including by means of a merger or otherwise) significantly and adversely affecting the special rights, preferences, privileges or voting powers of the Series C Preferred Stock.
Liquidation.In the event of any liquidation, dissolution or winding-up, the holders of the Series B and C Preferred Stock will be entitled to receive liquidating distributions in an amount equal to the greater of (i) $100 per share, plus an amount equal to any accrued but unpaid dividends and any authorized and declared but unpaid dividends, and (ii) the payment or distribution to which such holders would be entitled if the Series B and C Preferred Stock were converted into Class A Common Stock and Class B Common Stock, respectively, immediately before such liquidation, dissolution or winding-up, in each case out of assets legally available for distribution to our shareholders, before any distribution of assets is made to the holders of our Common Stock or any other junior securities.
Reorganization Event.In the event of a merger of the Company or the sale, transfer, lease or conveyance of all or substantially all of our property and assets (in each case pursuant to which our Common Stock will be converted into cash, securities or other property) or for certain reclassifications or exchanges of our Common Stock, then in such event (each a “Reorganization Event”) each share of Series B and C Preferred Stock outstanding immediately prior to such event will, at the option of the holder, either (i) convert into the securities, cash and other property receivable in the transaction by the holder of the number of shares of Common Stock determined by assuming each of the outstanding shares of Series B and C Preferred Stock were converted immediately prior to the transaction at the conversion rate, plus any accrued and unpaid dividends on each share of Series B and C Preferred Stock, or (ii) liquidating distributions as if the transaction were a liquidation of the Company.
Perpetual; No Maturity. Except in the case of a Reorganization Event, the Series B and C Preferred Stock are perpetual and without maturity subject only to mandatory conversion to Class A Common Stock or Class B Common Stock, as applicable.
Limitations on Beneficial Ownership and Dividends.In the event that the Conversion would result in a holder and its affiliates owning or controlling in the aggregate more than a 9.9% voting ownership interest in the Company, then, in lieu of issuing the holder shares of Class A Common Stock in excess of such limit, the holder shall receive an equal number of shares of Class B Common Stock. In the event that the Conversion would result in the holder and its affiliates owning or controlling in the aggregate more than 33.3% of the Company’s total equity, then, in lieu of issuing the holder shares of Class A Common Stock and/or Class B Common Stock in excess of such limit, the holder shall continue to hold shares of Series B and C Preferred Stock equal to such excess. Each share of Series B or C Preferred Stock that is not converted due to such limitation shall remain outstanding and shall be automatically converted into Class A Common Stock upon a subsequent permitted transfer of such Series B Preferred Stock or Series C Preferred.
No Preemptive Rights; Redemption Rights; Sinking Fund and Redemption Provisions.Our Series B and C Preferred Stock have no preemptive rights, redemption rights, sinking fund or redemption provisions.
Transfer Agent and Registrar.Computershare is the transfer agent and registrar for our Series B and C Preferred Stock.
| 17 |
Description of our Class A Common Stock and Class B Common Stock
The following is a summary description of the preferences, limitations and relative rights of our Class A Common Stock and Class B Common Stock. This summary does not purport to be complete in all respects. This description is subject to and qualified in its entirety by reference to the NCBCA, our Articles of Incorporation, as amended by the Common Stock Articles of Amendment attached hereto asAppendix A, and our Bylaws.
General.Our Articles of Incorporation currently authorize the issuance of 50,000,000 shares of Common Stock. Upon shareholder approval of the Proposals at the Special Meeting and the filing of the Common Stock Articles of Amendment with the North Carolina Secretary of State, our Articles of Incorporation, as amended by the Common Stock Articles of Amendment, will authorize the issuance of 100,000,000 shares of common stock, of which 90,000,000 shares will be designated Class A Common Stock and 10,000,000 shares will be designated Class B Common Stock. Neither the Class A Common Stock nor the Class B Common Stock will have a par value. As of the Record Date, the Company had issued and outstanding 15,655,868 shares of Common Stock, which were held of record by approximately 2,938 persons. In addition, as of the Record Date, 4,296,605 shares of our Common Stock are reserved for issuance pursuant to our stock compensation plans and the TARP Warrant.
Our Common Stock is listed and traded on the NASDAQ Global Select Market under the symbol “NBBC.” Upon the Conversion, all outstanding shares of our Common Stock shall be re-designated Class A Common Stock, no par value, and shall be listed and traded on the NASDAQ Global Select Market under the symbol “NBBC.” We have no plans to list our Class B Common Stock on any national stock exchange. Outstanding shares of our Common Stock are validly issued, fully paid and non-assessable.
Identical Rights. Except as to voting rights, the Class B Common Stock shall have the same preferences, limitations and relative rights as, share ratably with and be identical in all respects to the Class A Common Stock as to all matters. Each share of Class A Common Stock shall have the same preferences, limitations and relative rights as, and shall be identical in all respects with, all the other shares of Class A Common Stock. Similarly, each share of Class B Common Stock shall have the same preferences, limitations and relative rights as, and shall be identical in all respects with, all the other shares of Class B Common Stock.
Voting Rights. Whereas shares of Class A Common Stock shall have unlimited voting rights, with each share being entitled to one vote, shares of Class B Common Stock shall have no voting rights except that the affirmative vote of the holders of a majority of the outstanding shares of Class B Common Stock, voting separately as a class, shall be required to amend (including by merger or otherwise) the Articles of Incorporation, to significantly and adversely affect the designation, preferences, limitations or relative rights of all or part of the shares of Class B Common Stock, and as otherwise required by law. Shareholders are not entitled to cumulate their votes for the election of directors. Directors are elected by a plurality of the votes cast.
Distributions.Subject to the preferential distribution rights, if any, of any preferred stock of the Company, the holders of Class B Common Stock will be entitled to receive, to the extent permitted by law, such distributions as may be declared from time to time by the Board on the Class A Common Stock. If a distribution is declared and paid with respect to the Class A Common Stock, then the Board will declare and pay an equivalent distribution, on a per share basis, on the Class B Common Stock. Likewise, if the Board declares and pays a distribution on the Class B Common Stock, it will declare and pay an equivalent distribution, on a per share basis, on the Class A Common Stock. Notwithstanding the foregoing, no distribution payable in Class A Common Stock or rights or warrants to subscribe for Class A Common Stock shall be declared on the Class B Common Stock and no dividend payable in Class B Common Stock or rights or warrants to subscribe for Class B Common Stock shall be declared on the Class A Common Stock, but instead, in the case of such a dividend, each class shall receive such dividend in like stock or rights or warrants to subscribe for like stock.
| 18 |
Dissolution. In the event of a dissolution of the Company, after distribution in full of the preferential amounts, if any, to be distributed to the holders of shares of preferred stock of the Company, holders of the Class A Common Stock and the Class B Common Stock shall be entitled to receive all the net assets of the Company of whatever kind available for distribution to shareholders ratably in proportion to the number of shares of Class A Common Stock and Class B Common Stock held by them.
Adjustments.In the event of any stock split, combination or other reclassification of shares of either the Class A Common Stock or the Class B Common Stock, the outstanding shares of the other class shall be proportionately split, combined or reclassified in a similar manner; provided, however, that in any such transaction, holders of Class A Common Stock shall receive only shares of Class A Common Stock and holders of Class B Common Stock shall receive only shares of Class B Common Stock.
Conversion.Any holder of shares of Class B Common Stock may convert any number of shares of Class B Common Stock into an equal number of shares of Class A Common Stock at the option of the holder; provided, however, that each share of Class B Common Stock will not be convertible in the hands of or at the election of the initial holder or any affiliate of such initial holder and will only be convertible by a transferee and in connection with or after a transfer to a third party unaffiliated with such initial holder and that complies with the transfer restrictions described in this paragraph. Shares of Class B Common Stock may only be transferred through one or more of the following alternatives: (i) to an affiliate of the initial holder, (ii) in a widespread public distribution, (iii) in a transfer to a person that would control more than 50% of any class of the company’s outstanding voting securities without any transfer from the transferor, or (iv) in a transfer in which no one transferee (or group of associated transferees) would receive 2% or more of the voting securities of the Company then outstanding. In connection with a transfer pursuant to clauses (ii), (iii) or (iv) above, the transferor of the Class B Common Stock is entitled to surrender to the Company the shares of the Class B Common Stock to be so transferred, and, upon such surrender, the Company will issue to the transferee, in lieu of the shares of Class B Common Stock, an equal number of shares of Class A Common Stock.
Mergers, Etc. In the event of any merger, reclassification or other transaction in which shares of Class A Common Stock are exchanged for or changed into other stock or securities, cash and/or any other property, each share of Class B Common Stock will at the same time be similarly exchanged or changed in an amount per whole share equal to the aggregate amount of stock, securities, cash and/or any other property (payable in kind), as the case may be, that each share of Class A Common Stock would be entitled to receive as a result of such transaction, provided that at the election of such holder, any securities issued with respect to the Class B Common Stock shall be non-voting securities under the resulting corporation’s organizational documents and the Company shall make appropriate provisions (in form and substance reasonably satisfactory to the holders of a majority of the Class B Common Stock then outstanding) and take such actions necessary to ensure that holders of the Class B Common Stock shall retain securities with substantially the same privileges, limitations and relative rights as the Class B Common Stock. Subject to the foregoing, in the event the holders of Class A Common Stock are provided the right to convert or exchange Class A Common Stock for stock or securities, cash and/or any other property, then the holders of the Class B Common Stock shall be provided the same right based upon the number of shares of Class A Common Stock such holders would be entitled to receive if such shares of Class B Common Stock were converted into shares of Class A Common Stock immediately prior to such offering. In the event that the Company offers to repurchase shares of Class A Common Stock from its shareholders generally, the Company shall offer to repurchase Class B Common Stock pro rata based upon the number of shares of Class A Common Stock such holders would be entitled to receive if such shares were converted into shares of Class A Common Stock immediately prior to such repurchase. In the event of any pro rata subscription offer, rights offer or similar offer to holders of Class A Common Stock, the Company shall provide the holders of the Class B Common Stock the right to participate based upon the number of shares of Class A Common Stock such holders would be entitled to receive if such shares were converted into shares of Class A Common Stock immediately prior to such offering; provided that at the election of such holder, any shares issued with respect to the Class B Common Stock shall be issued in the form of Class B Common Stock rather than Class A Common Stock.
No Preemptive Rights; Redemption Rights; Sinking Fund and Redemption Provision.Our Class A Common Stock and Class B Common Stock will have no preemptive rights, redemption rights, sinking fund or redemption provisions.
Transfer Agent and Registrar.Computershare will be the transfer agent and registrar for our Class A Common Stock and Class B Common Stock.
| 19 |
CAPITALIZATION
The following table sets forth our consolidated capitalization as of September 30, 2012, and as adjusted (i) to give effect to the issuance of the Series B and C Preferred Stock but assuming that the proposals are not approved by the shareholders and (ii) to give effect to (a) the issuance of approximately 9,601,273 shares of Class A Common Stock issuable upon the conversion of the Series B Preferred Stock based on a conversion price of $4.40 per share, and (b) the issuance of approximately 3,186,750 shares of Class B Common Stock issuable upon the conversion of the Series C Preferred Stock based on a conversion price of $4.40 per share.
| As of September 30, 2012 | ||||||||||||
| Shareholders’ Equity | Actual | As Adjusted Assuming Proposals are not Approved | As Adjusted Assuming Proposals are Approved | |||||||||
| (Dollars in thousands, except per share data) | ||||||||||||
| Series A Preferred Stock | $ | 52,014 | $ | 52,014 | $ | 52,014 | ||||||
| Series B Preferred Stock | 42,245 | |||||||||||
| Series C Preferred Stock | 14,022 | |||||||||||
| Class A Common Stock | 78,279 | 78,279 | 120,524 | |||||||||
| Class B Common Stock | 14,022 | |||||||||||
| Additional paid in capital | 87,276 | 83,203 | 83,203 | |||||||||
| Retained earnings | (79,731 | ) | (79,731 | ) | (79,731 | ) | ||||||
| Accumulated other comprehensive income | 1,995 | 1,995 | 1,995 | |||||||||
| Other equity | (468 | ) | (468 | ) | (468 | ) | ||||||
| Total shareholders’ equity | $ | 139,365 | $ | 191,559 | $ | 191,559 | ||||||
| 20 |
SECURITY OWNERSHIP OF CERTAIN
BENEFICIAL OWNERS AND MANAGEMENT
The following table shows (i) how much of the Company’s securities are owned by the directors, executive officers, all directors and executive officers as a group, and owners of more than 5% of the outstanding Common Stock, as of the Record Date, and (ii) how much of the Company’s securities will be owned by the directors, executive officers, all directors and executive officers as a group, and owners of more than 5% of the outstanding Class A Common Stock assuming conversion of the Series B Preferred Stock into shares of Class A Common Stock. Unless otherwise stated in the footnotes below, each of the named individuals and each member of the group has sole voting and investment power for all the securities shown in the table.
| Name | Shares Beneficially Owned | Percent (1) | Shares Beneficially Owned After Conversion | Percent After Conversion(2) | ||||||||||||
| Michael S. Albert | 40,306 | (3) | * | 50,306 | (3) | * | ||||||||||
| David P. Barksdale | 11,748 | (4) | * | 11,748 | (4) | * | ||||||||||
| J. David Branch | 23,883 | * | 33,883 | * | ||||||||||||
| C. Arnold Britt | 130,619 | (5) | * | 130,619 | (5) | * | ||||||||||
| William W. Budd, Jr. | 12,400 | (6) | * | 17,400 | (6) | * | ||||||||||
| Robert C. Clark | 12,304 | (7) | * | 15,053 | (7) | * | ||||||||||
| Alex A. Diffey, Jr. | 20,577 | * | 26,076 | * | ||||||||||||
| Barry Z. Dodson | 101,207 | (8) | * | 111,207 | (8) | * | ||||||||||
| Robin S. Hager | 10,669 | (9) | * | 11,669 | (9) | * | ||||||||||
| Ramsey K. Hamadi | 86,811 | * | 91,811 | * | ||||||||||||
| Donald P. Johnson(10) | - | - | - | - | ||||||||||||
| Joseph H. Kinnarney | 111,682 | (11) | * | 114,682 | (11) | * | ||||||||||
| Robert F. Lowe | 94,785 | (12) | * | 94,785 | (12) | * | ||||||||||
| Robert V. Perkins | 25,049 | (13) | * | 25,049 | (13) | * | ||||||||||
| Pressley A. Ridgill | 137,115 | (14) | * | 187,115 | (14) | * | ||||||||||
| Mary E. Rittling | 6,340 | (15) | * | 7,340 | (15) | * | ||||||||||
| E. Reid Teague | 70,634 | (16) | * | 70,634 | (16) | * | ||||||||||
| John F. Watts | 54,101 | (17) | * | 77,851 | (17) | * | ||||||||||
| G. Alfred Webster | 6,341 | * | 21,341 | * | ||||||||||||
| Kenan C. Wright | 85,448 | (18) | * | 245,448 | (18) | * | ||||||||||
| Julius S. Young, Jr. | 93,699 | (19) | * | 96,449 | (19) | * | ||||||||||
| All directors & executive officers as a group | 1,135,718 | (20) | 7.1 | % | 1,440,466 | (20) | 5.6 | % | ||||||||
| Endicott Opportunity Partners III, L.P.(21) | - | - | 2,504,500 | 9.9 | % | |||||||||||
| U.S. Department of the Treasury | 2,567,255 | (22) | 14.1 | % | 2,567,255 | 9.2 | % | |||||||||
| Wellington Management Company, LLP(23) | 1,059,147 | 6.8 | % | 2,504,647 | 9.9 | % | ||||||||||
| * | Represents less than 1% of the issued and outstanding Common Stock or Class A Common Stock, as applicable. |
| (1) | Based upon 15,655,868 shares outstanding as of the Record Date plus, in the case of each named individual and the group, the number of additional shares that could be purchased by that individual or by persons included in the group pursuant to stock options or warrants exercisable within 60 days of the Record Date (“Option Shares”). |
| (2) | Based upon 25,257,141 shares of Class A Common Stock outstanding following the issuance of 9,601,273 shares of Class A Common Stock upon the conversion of the Series B Preferred Stock plus, in the case of each named individual and the group, the number of Option Shares owned by such individual or by persons included in the group. |
| (3) | Includes (a) 1,250 Option Shares; and (b) 799 shares held by Mr. Albert’s son. |
| (4) | Includes 8,500 Option Shares. |
| 21 |
| (5) | Includes (a) 43,468 Option Shares; and (b) 554 shares held by Mr. Britt’s wife. |
| (6) | Includes 5,350 Option Shares. |
| (7) | Includes 375 shares held by Mr. Clark as custodian for his daughter. |
| (8) | Includes (a) 43,468 Option Shares; (b) 394 shares held jointly with Mr. Dodson’s wife; (c) 2,650 shares held by Mr. Dodson’s wife; (d) 7,077 shares held by a trust for the benefit of Mr. Dodson’s daughter, and for which Mr. Dodson and his daughter serve as joint trustees; (e) 2,011 shares held by Mr. Dodson’s daughter; and (f) 3,362 shares held by Mr. Dodson as custodian for his daughter. |
| (9) | Includes 5,535 Option Shares. |
| (10) | Mr. Johnson was elected as a director of the Company on December 19, 2012. |
| (11) | Includes 43,468 Option Shares. |
| (12) | Includes10,353 shares held by Mr. Lowe’s wife. |
| (13) | Mr. Perkins resigned as a director of the Company effective October 16, 2012. He is included in the above table because he served as a director for part of 2012. Includes 18,725 Option Shares. |
| (14) | Includes 84,426 Option Shares. |
| (15) | Includes 2,900 shares held by Dr. Rittling’s husband. |
| (16) | Includes (a) 35,110 Option Shares; (b) 835 shares held by Mr. Teague’s wife; and (c) 333 shares held by Mr. Teague’s daughter. |
| (17) | Includes (a) 639 shares held by Mr. Watts as custodian for his daughter; and (b) 68 shares held by Mr. Watts as custodian for his son. |
| (18) | Includes 43,468 Option Shares. |
| (19) | Includes 1,250 Option Shares. |
| (20) | Includes 334,018 Option Shares. | |
| (21) | Also owns 75,812 shares of Series C Preferred Stock as of the Record Date, which will convert to 1,723,000 shares of Class B Common Stock following the Conversion. |
| (22) | Represents 2,567,255 shares which may be purchased pursuant to the warrant issued to the U.S. Department of the Treasury on December 12, 2008 (the “Warrant”). | |
| (23) | Also owns 64,405 shares of Series C Preferred Stock as of the Record Date, which will convert to 1,463,750 shares of Class B Common Stock following the Conversion. |
SHAREHOLDER PROPOSALS FOR 2013 ANNUAL MEETING
It is presently anticipated that the 2013 Annual Meeting of Shareholders will be held in May of 2013. If a shareholder desires to submit a proposal for possible inclusion in the proxy statement and form of proxy for our 2013 Annual Meeting of Shareholders, including a shareholder nominee for director, the proposal must have been received by the Secretary of the Company at 1501 Highwoods Boulevard, Suite 400, Greensboro, North Carolina 27410, by December 10, 2012 and have met all other applicable requirements for inclusion in the 2012 Proxy Statement.
In the alternative, a shareholder may commence his or her own proxy solicitation subject to the SEC’s rules on proxy solicitation and may present a proposal from the floor at the 2013 Annual Meeting of Shareholders. In order to do so, the shareholder must notify the Secretary of the Company, in writing, of his or her proposal at the Company’s main office no later than February 22, 2013.If the Secretary of the Company is not notified of the shareholder’s proposal by February 22, 2013, the Board may vote on the proposal pursuant to the discretionary authority granted by the proxies solicited by the Board for the 2013 Annual Meeting of Shareholders.
| 22 |
OTHER MATTERS
The Board knows of no other matters intended to be presented for consideration at the Special Meeting. If, however, any other matters properly come before the Special Meeting, it is the intention of the persons named in the accompanying proxy to vote on such matters in accordance with their best judgment.
FORWARD LOOKING STATEMENTS
Statements contained in this Proxy Statement that are not purely historical are forward-looking statements, including, but not limited to, statements regarding our expectations, hopes, beliefs, intentions or strategies regarding the future. Actual results could differ materially from those projected in any forward-looking statements as a result of a number of factors, including, without limitation, those described in this Proxy Statement. The forward-looking statements are made as of the date of this Proxy Statement and we undertake no obligation to update or revise the forward-looking statements, or to update the reasons why actual results could differ materially from those projected in the forward-looking statements.
We caution you not to place undue reliance on any forward-looking statements made by, or on behalf us in this Proxy Statement or in any of our filings with the SEC or otherwise. Additional information with respect to factors that may cause the results to differ materially from those contemplated by forward-looking statements is included in our Annual Report on Form 10-K for the fiscal year ended December 31, 2011 and in our other current and subsequent filings with the SEC.
WHERE YOU CAN FIND MORE INFORMATION
We file annual, quarterly and current reports, proxy statements and other information with the SEC. Our filings with the SEC are available to the public on the Internet at the SEC’s website atwww.sec.gov . You may also read and copy any document that we file with the SEC at its public reference room at 100 F Street, NE, Washington D.C. 20549. Please call the SEC at (800) SEC-0330 for further information on the public reference room and their copy charges.
| 23 |
[This page intentionally left blank.]
APPENDIX A
Common Stock
Articles of Amendment
| A-1 |
State of North Carolina
Department of the Secretary of State
ARTICLES OF AMENDMENT
TO
ARTICLES OF INCORPORATION
OF
NEWBRIDGE BANCORP
Pursuant to §55-10-06 of the General Statutes of North Carolina, the undersigned corporation hereby submits the following Articles of Amendment for the purpose of amending its Articles of Incorporation.
1. The name of the corporation is: NEWBRIDGE BANCORP.
2. The text of each amendment adopted is as follows:
Article IV of the corporation’s Articles of Incorporation is hereby amended by deleting such Article IV in its entirety and by substituting in lieu thereof the following:
ARTICLE IV
The corporation shall have authority to issue one hundred million (100,000,000) shares of common stock, with no par value per share, of which number ninety million (90,000,000) shares shall be designated Class A Common Stock and ten million (10,000,000) shares shall be designated Class B Common Stock. Class A Common Stock shall have unlimited voting rights, with each share being entitled to one vote.
The corporation shall also have authority to issue thirty million (30,000,000) shares of preferred stock, no par value per share (the “Preferred Stock”).
The Preferred Stock may be issued from time to time in one or more classes or series pursuant to a resolution or resolutions adopted by the Board of Directors of the corporation. The Board of Directors shall have full and complete authority by resolution, from time to time, to establish one or more series and to fix, determine and vary the voting rights, designations, preferences, qualifications, privileges, limitations, options, conversion rights and other special rights of each series, including, but not limited to, dividend rates and manner of payment, preferential amounts payable upon voluntary or involuntary liquidation, voting rights, conversion rights, redemption prices, sinking fund and stock purchase prices, terms and conditions.
In addition, the attached Certificate of Designation of the preferences, limitations and relative rights of the Class B Common Stock is deemed to constitute an amendment to the Corporation’s Articles of Incorporation and is incorporated herein.
3. If an amendment provides for an exchange, reclassification, or cancellation of issued shares, provisions for implementing the amendment, if not contained in the amendment itself, are as follows:
Not applicable.
4. The date of adoption of the foregoing amendments was as follows: __________ ___, 2012.
5. The foregoing amendments were approved by shareholder action, and such shareholder approval was obtained as required by Chapter 55 of the North Carolina General Statutes.
6. These Articles of Amendment will be effective upon filing.
This the ___ day of _______________, 2012.
| NEWBRIDGE BANCORP | |
| Pressley A. Ridgill | |
| President and Chief Executive Officer |
| A-2 |
Exhibit A
CERTIFICATE OF DESIGNATION
OF
CLASS B COMMON STOCK
OF
NEWBRIDGE BANCORP
Section 1. Designation. The class of non-voting common stock, no par value, of the Corporation hereby created shall be designated as the “Class B Common Stock” (referred to herein as the “Class B Common Stock”).
Section 2. Rights. Except as set forth in Section 3 below, the Class B Common Stock shall have the same preferences, limitations and relative rights as, share ratably with and be identical in all respects to the Class A Common Stock as to all matters. Each share of Class B Common Stock shall have the same relative preferences, limitations and relative rights as, and shall be identical in all respects with, all the other shares of Class B Common Stock.
Section 3. Voting Rights. The holders of Class B Common Stock shall have no voting rights except as provided herein or required by law. Notwithstanding the foregoing, and in addition to any other vote required by law, the affirmative vote of the holders of a majority of the outstanding shares of Class B Common Stock, voting separately as a class, shall be required to amend (including by merger or otherwise) the Corporation’s Articles of Incorporation, as amended, to significantly and adversely affect the designation, preferences, limitations or relative rights of all or part of the shares of Class B Common Stock.
Section 4. Distributions. Subject to preferential distribution rights, if any, applicable to any shares of the Preferred Stock, the holders of Class B Common Stock shall be entitled to receive, to the extent permitted by law, such distributions as may be declared from time to time by the Board of Directors on the Class A Common Stock. The holders of the Class B Common Stock shall share ratably in any distributions made on the Class B Common Stock in proportion to the number of shares of Class B Common Stock held by each such holder. Notwithstanding the foregoing, no distribution payable in Class A Common Stock or rights or warrants to subscribe for Class A Common Stock shall be declared on the Class B Common Stock and no dividend payable in Class B Common Stock or rights or warrants to subscribe for Class B Common Stock shall be declared on the Class A Common Stock, but instead, in the case of such a dividend, each class shall receive such dividend in like stock or rights or warrants to subscribe for like stock.
Section 5. Distributions. In the event of a dissolution of the Corporation, after distribution in full of the preferential amounts, if any, to be distributed to the holders of shares of Preferred Stock, holders of the Class A Common Stock and the Class B Common Stock shall be entitled to receive all the net assets of the Corporation of whatever kind available for distribution to shareholders ratably in proportion to the number of shares of Class A Common Stock and Class B Common Stock held by them.
Section 6. Adjustment. In the event of any stock split, combination or other reclassification of shares of either the Class A Common Stock or the Class B Common Stock, the outstanding shares of the other class shall be proportionately split, combined or reclassified in a similar manner; provided, however, that in any such transaction, holders of Class A Common Stock shall receive only shares of Class A Common Stock and holders of Class B Common Stock shall receive only shares of Class B Common Stock.
Section 7. Conversion.
a. The Class B Common Stock may be converted into Class A Common Stock in accordance with the provisions of this Section 7 by any Convertible Holder following an Approved Transfer (as defined herein). The term “Approved Transfer” means a sale or other transfer (i) to an Affiliate of the Initial Holder of the Class B Common Stock to be transferred under common control with such Initial Holder’s ultimate parent, general partner, managing member or investment adviser but only if the transferee agrees in writing for the benefit of the Corporation to be bound by the terms of that certain Securities Purchase Agreement by and between the Corporation and the purchaser named therein pursuant to which the securities convertible into such shares of Class B Common Stock were sold to such Initial Holder (the “Purchase Agreement”); (ii) in a widespread public distribution; (iii) to a person that would control more than 50% of any class of the
| A-3 |
Corporation’s outstanding “voting securities” (as defined in the Bank Holding Company Act of 1956, as amended, and any rules or regulations promulgated thereunder) without any transfer from the transferor; or (iv) in which no transferee (or group of associated transferees) would receive 2% or more of any class of voting securities of the Corporation outstanding at such time. The term “Initial Holder” means the purchaser of such Class B Common Stock pursuant to the Purchase Agreement. The term “Affiliate” means, with respect to any person, any person directly or indirectly, controlling, controlled by or under common control with, such other person. “Convertible Holder” means a holder of Class B Common Stock, other than the Initial Holder of such Class B Common Stock or an Affiliate thereof, who acquires one or more shares of Class B Common Stock in an Approved Transfer.
b. Conditions of Conversion. Following an Approved Transfer, a Convertible Holder may surrender to the Corporation (at the principal office of the Corporation) a certificate or certificates representing all or part of the Convertible Holder’s shares of Class B Common Stock and in such event each share of Class B Common Stock represented by such certificate or certificates will convert into one share of Class A Common Stock; provided that, in connection with any transfer of shares of Class B Common Stock pursuant to a transfer described in clause (ii), clause (iii) or clause (iv) of the definition of “Approved Transfer” above, upon the request of the transferor, the transferor shall be entitled to surrender to the Corporation shares of Class B Common Stock to be so transferred, and, upon such surrender, the Corporation shall issue to the transferee, in lieu of shares of Class B Common Stock surrendered, an equal number of shares of Class A Common Stock. Except as otherwise provided herein, each conversion of Class B Common Stock shall be deemed to have been effected as of the close of business on the date on which the certificate or certificates representing such shares of Class B Common Stock to be converted have been surrendered for conversion at the principal office of the Corporation. Notwithstanding any other provision hereof, if a conversion of Class B Common Stock is to be made in connection with a merger, reclassification or other transaction in which the shares of Class A Common Stock are exchanged for or changed into other stock or securities, cash and/or any other property or in any dissolution or liquidation, the conversion of any shares of Class B Common Stock may, at the election of the holder thereof, be conditioned upon the consummation of such event or transaction, in which case such conversion shall not be deemed to be effective until such event or transaction has been consummated.
c. Reservation of Stock Issuable Upon Conversion. The Corporation shall at all times reserve and keep available out of its authorized but unissued shares of Class A Common Stock, solely for the purpose of effecting the conversion of the Class B Common Stock, such number of shares of Class A Common Stock as shall from time to time be sufficient to effect the conversion of all outstanding shares of Class B Common Stock. The Corporation shall take all action necessary so that all shares of Class A Common Stock issuable upon conversion of Class B Common Stock will, upon issue, be duly and validly issued, fully paid, and non-assessable, and free from all taxes, liens, charges and encumbrances in respect of the issuance or delivery thereof. The Corporation shall take all such actions as may be necessary to assure that all such shares of Class A Common Stock issuable upon conversion of the Class B Common Stock may be so issued without violation of any applicable law or governmental regulation or any requirements of any domestic securities exchange upon which shares may be listed (except for official notice of issuance which shall be immediately delivered by the Corporation upon each such issuance). The Corporation shall not take any action which would cause the number of authorized but unissued shares of Class A Common Stock to be less than the number of such shares required to be reserved hereunder for issuance upon conversion of the Class B Common Stock.
Section 8. Mergers, Etc. In the event of any merger, reclassification or other transaction in which the shares of Class A Common Stock are exchanged for or changed into other stock or securities, cash and/or any other property, each share of Class B Common Stock will at the same time be similarly exchanged or changed in an amount per whole share equal to the aggregate amount of stock, securities, cash and/or any other property (payable in kind), as the case may be, that each share of Class A Common Stock would be entitled to receive as a result of such transaction, provided that at the election of such holder, any securities issued with respect to the Class B Common Stock shall be non-voting securities under the resulting corporation’s organizational documents and the Corporation shall make appropriate provisions (in form and substance reasonably satisfactory to the holders of a majority of the Class B Common Stock then outstanding) and take such actions necessary to ensure that holders of the Class B Common Stock shall retain securities with substantially the same privileges, limitations and relative rights as the Class B Common Stock. Subject to the foregoing, in the
| A-4 |
event the holders of Class A Common Stock are provided the right to convert or exchange Class A Common Stock for stock or securities, cash and/or any other property, then the holders of the Class B Common Stock shall be provided the same right based upon the number of shares of Class A Common Stock such holders would be entitled to receive if such shares of Class B Common Stock were converted into shares of Class A Common Stock immediately prior to such offering. In the event that the Corporation offers to repurchase shares of Class A Common Stock from its shareholders generally, the Corporation shall offer to repurchase Class B Common Stock pro rata based upon the number of shares of Class A Common Stock such holders would be entitled to receive if such shares were converted into shares of Class A Common Stock immediately prior to such repurchase. In the event of any pro rata subscription offer, rights offer or similar offer to holders of Class A Common Stock, the Corporation shall provide the holders of the Class B Common Stock the right to participate based upon the number of shares of Class A Common Stock such holders would be entitled to receive if such shares were converted into shares of Class A Common Stock immediately prior to such offering; provided that at the election of such holder, any shares issued with respect to the Class B Common Stock shall be issued in the form of Class B Common Stock rather than Class A Common Stock.
| A-5 |
[This page intentionally left blank.]
APPENDIX B
Preferred Stock
Articles of Amendment
| B-1 |
State of North Carolina
Secretary of State
ARTICLES OF AMENDMENT
OF
NEWBRIDGE BANCORP
Pursuant to §55-10-06 of the General Statutes of North Carolina, the undersigned corporation hereby submits the following Articles of Amendment for the purpose of amending its Articles of Incorporation.
| 1. | The name of the corporation is:NEWBRIDGE BANCORP. |
| 2. | The text of each amendment adopted is as follows (State below or attach): |
The attached certificate of designation of the preferences, limitations, and relative rights of the Company’s Series B Mandatorily Convertible Adjustable Rate Cumulative Perpetual Preferred Stock and Series C Mandatorily Convertible Adjustable Rate Cumulative Perpetual Preferred Stock was approved by the Corporation’s Board of Directors as provided in N.C. Gen. Stat. Section 55-6-02(b). Shareholder approval is not required under Section 55-6-02(b).
| 3. | If an amendment provides for an exchange, reclassification, or cancellation of issued shares, provisions for implementing the amendment, if not contained in the amendment itself, are as follows: |
Not applicable.
| 4. | The date of adoption of each amendment was as follows: November 14, 2012. |
| 5. | The amendment was approved by the Board of Directors of the Corporation, as provided for pursuant to §55-10-02 of the General Statutes of North Carolina. |
| 6. | These articles will be effective upon filing, unless a delayed time and date is specified. |
This the 29th day of November, 2012.
| NEWBRIDGE BANCORP | ||
| Pressley A. Ridgill | ||
| President and Chief Executive Officer | ||
| B-2 |
CERTIFICATE OF DESIGNATION
Section 1. Designation of Series and Number of Shares.
(a) Two additional series of preferred stock are hereby created out of the authorized and unissued shares of preferred stock.
(b) One such series of preferred stock shall be designated “Series B Mandatorily Convertible Adjustable Rate Cumulative Perpetual Preferred Stock” (the “Series B Preferred Stock”), and the authorized number of shares that shall constitute such series shall be 1,000,000 shares, which may be decreased (but not below the number of shares of Series B Preferred Stock then issued and outstanding) from time to time by the Board of Directors in compliance with the NCBA. Shares of outstanding Series B Preferred Stock that are converted, purchased or otherwise acquired by the Corporation shall revert to authorized but unissued shares of Preferred Stock of the Corporation, undesignated as to series.
(c) The other additional series of preferred stock shall be designated “Series C Mandatorily Convertible Adjustable Rate Cumulative Perpetual Preferred Stock” (the “Series C Preferred Stock”), and the authorized number of shares that shall constitute such series shall be 500,000 shares, which may be decreased (but not below the number of shares of Series C Preferred Stock then issued and outstanding) from time to time by the Board of Directors in compliance with the NCBA. Shares of outstanding Series C Preferred Stock that are converted, purchased or otherwise acquired by the Corporation shall revert to authorized but unissued shares of Preferred Stock of the Corporation, undesignated as to series.
Section 2. Ranking. The Series B Preferred Stock and Series C Preferred Stock will each rank, with respect to the payment of dividends and distributions and upon liquidation, dissolution or winding-up, (1) on a parity with the Corporation’s Fixed Rate Cumulative Perpetual Preferred Stock, Series A, issued on December 12, 2008 (“TARP Preferred Stock”), and each class or series of capital stock the Corporation may issue in the future the terms of which expressly provide that such class or series will rank on a parity with the Series B Preferred Stock and the Series C Preferred Stock as to the payment of dividends and distributions upon liquidation, dissolution or winding up of the Corporation (collectively, and inclusive of the TARP Preferred Stock, the Series B Preferred Stock and the Series C Preferred Stock when the context in which such term is used requires, the “Parity Securities”), and (2) senior to Common Stock, each class of Common Stock and each other class or series of capital stock, not referred to in clause (1) above, that the Corporation may issue in the future the terms of which do not expressly provide that it ranks on a parity with or senior to the Series B Preferred Stock and the Series C Preferred Stock as to the payment of dividends and distributions upon liquidation, dissolution or winding-up of the Corporation (the “Junior Securities”).
Section 3. Definitions. As used herein with respect to the Series B Preferred Stock and the Series C Preferred Stock:
(a) “Additional Stock” has the meaning set forth in Section 10(a)(viii)(F).
(b) “Articles of Incorporation” shall mean the articles of incorporation of the Corporation, as they may be amended from time to time.
(c) “BHC Act” means the federal Bank Holding Company Act of 1956, as amended, and the Federal Reserve regulations thereunder.
(d) “BHC Affiliates” means, with respect to an Person, its Affiliates and all of its “affiliates” as defined in the BHC Act or Regulation Y of the Federal Reserve.
(e) “Board of Directors” means the board of directors of the Corporation or any committee thereof duly authorized to act on behalf of such board of directors.
(f) “Business Day” means any day that is not Saturday or Sunday and that, in North Carolina, is not a day on which banking institutions generally are authorized or obligated by law or executive order to be closed.
(g) “Bylaws” mean the Bylaws of the Corporation, as they may be amended from time to time.
(h) “Certificate of Designation” means this Certificate of Designation relating to the Series B Preferred Stock and the Series C Preferred Stock, as it may be amended from time to time.
| B-3 |
(i) “Class A Common Stock” means that class of Common Stock of the Corporation to be authorized, if at all, pursuant to the Shareholder Approvals.
(j) “Class B Common Stock” means that class of Common Stock of the Corporation to be authorized, if at all, pursuant to the Shareholder Approvals.
(k) “Closing Price” of the Common Stock on any determination date means the closing sale price on such date or, if no closing sale price is reported, the last reported sale price of the shares of the Common Stock on the NASDAQ Stock Market. If the Common Stock is not traded on the NASDAQ Stock Market on any determination date, the Closing Price of the Common Stock on such determination date means the closing sale price as reported in the composite transactions for the principal U.S. national or regional securities exchange on which the Common Stock is so listed or quoted, or, if no closing sale price is reported, the last reported sale price on such exchange, or if the Common Stock is not so listed or quoted on a U.S. national or regional securities exchange, the last quoted bid price for the Common Stock in the over-the-counter market as reported by the OTC Bulletin Board, the OTC Markets Group, Inc. or a similar organization, or, if that bid price is not available, the market price of the Common Stock on that date as determined by an independent investment banking firm retained by the Corporation for this purpose, subject to ultimate joint approval by the Board of Directors and the Holders. For the purposes of this Certificate of Designation, all references herein to the closing sale price and the last reported sale price of the Common Stock (or other property) on the NASDAQ Stock Market shall be the closing sale price and last reported sale price as reflected on the website of the NASDAQ Stock Market (www.nasdaq.com) and as reported by Bloomberg Professional Service; provided that, in the event that there is a discrepancy between the closing price and the last reported sale price as reflected on the website of the NASDAQ Stock Market and as reported by Bloomberg Professional Service, the closing sale price and the last reported sale price on the website of the NASDAQ Stock Market shall govern.
(l) “Common Stock” means the common stock of the Corporation.
(m) “Common Stock Articles of Amendment” means Articles of Amendment to the Articles of Incorporation to be approved and filed with the North Carolina Secretary of State, if at all, pursuant to, and to effect the matters approved by, the Shareholder Approvals.
(n) “Common Stock Equivalents” means securities representing rights convertible into or exchangeable for, or entitling the holder thereof to purchase or receive directly or indirectly, shares of Common Stock.
(o) “Conversion Agent” shall mean the Transfer Agent (which may be the Corporation) acting in its capacity as conversion agent for the Series B Preferred Stock and the Series C Preferred Stock, and its successors and assigns.
(p) “Conversion Price” means $4.40 (subject to adjustment from time to time in a manner consistent with the provisions of Section 10).
(q) “Conversion Rate” means that number of shares of Class A Common Stock (and cash in lieu of fractional shares of Class A Common Stock) into which each share of Series B Preferred Stock and that number of shares of Class B Common Stock (and cash in lieu of fractional shares of Class B Common Stock) into which each share of Series C Preferred Stock shall be convertible following the filing of the Common Stock Articles of Amendment that is determined by dividing the Liquidation Preference by the Conversion Price, subject to adjustment as set forth herein.
(r) “Corporation” means NewBridge Bancorp, a North Carolina corporation.
(s) “Current Market Price” means, on any date, the average of the daily Closing Prices per share of the Common Stock or other securities on each of the five (5) consecutive Trading Days preceding the earlier of the day before the date in question and the day before the Ex-Date with respect to the issuance or distribution requiring such computation.
(t) “Depositary” means DTC and its successors and assigns, including any successor depositary appointed by the Corporation.
(u) “Distributed Property” has the meaning set forth in Section 10(a)(iv).
| B-4 |
(v) “Dividend Payment Date” has the meaning set forth in Section 4(b).
(w) “Dividend Period” has the meaning set forth in Section 4(b).
(x) “DTC” means The Depository Trust Company.
(y) “Excess Voting Shares” has the meaning set forth in Section 15(a).
(z) “Exchange Act” means the Securities Exchange Act of 1934, as amended.
(aa) “Exchange Property” shall have the meaning set forth in Section 12.
(bb) “Ex-Date,” when used with respect to any issuance or distribution, means the first date on which the Common Stock or other securities trade without the right to receive an issuance or distribution.
(cc) “Federal Reserve” means the Board of Governors of the Federal Reserve System.
(dd) “Filing Date” has the meaning set forth in Section 10(a)(viii).
(ee) “First Dilutive Issuance” has the meaning set forth in Section 10(a)(viii).
(ff) “Holder” means the Person in whose name the shares of the Series B Preferred Stock or Series C Preferred Stock are registered and who therefore may be treated by the Corporation, Transfer Agent, Registrar, paying agent and Conversion Agent as the absolute owner of such shares of Series B Preferred Stock or Series C Preferred Stock for the purpose of making payment and settling the related conversions and for all other purposes.
(gg) “Issue Date” means the date on which shares of the Series B Preferred Stock and the Series C Preferred Stock are first issued.
(hh) “Junior Securities” has the meaning set forth in Section 2.
(ii) “Liquidation Preference” means, as to the Series B Preferred Stock, $100.00 per share, and as to the Series C Preferred Stock, $100.00 per share, in each case, as adjusted for any split, subdivision, combination, consolidation, recapitalization or similar event with respect to the Series B Preferred Stock or Series C Preferred Stock, as applicable.
(jj) “Mandatory Conversion Date” means, with respect to the shares of Series B Preferred Stock or Series C Preferred Stock of any Holder, the Business Day after the date on which the Common Stock Articles of Amendment are accepted for filing by the North Carolina Secretary of State (or if a Reorganization Event has theretofore been consummated, the date of consummation of such Reorganization Event); provided, however, that if a Mandatory Conversion Date would otherwise occur on or after an Ex-Date for an issuance or distribution that results in an adjustment of the Conversion Rate pursuant to Section 10 and on or before the Record Date for such issuance or distribution, such Mandatory Conversion Date shall instead occur on the first calendar day after the Record Date for such issuance or distribution.
(kk) “NASDAQ Stock Market” means the NASDAQ Global Select Market, the NASDAQ Global Market, the NASDAQ Select Market, or any successor thereto.
(ll) “NCBA” means the North Carolina Business Corporation Act, as amended from time to time, and any successor statutes thereto.
(mm) “Parity Securities” has the meaning set forth in Section 2.
(nn) “Permitted Transfer” means a transfer by any Holder: (i) in a widespread public distribution; (ii) in which no transferee (or group of associated transferees) would receive 2% or more of any class of Voting Securities of the Corporation; or (iii) to a transferee that would control more than 50% of the Voting Securities of the Corporation without any transfer from the Holder.
(oo) “Person” means any legal person, including an individual, corporation, estate, partnership, joint venture, association, joint-stock company, limited liability company or trust.
(pp) “Record Date” has the meaning set forth in Section 4(b).
| B-5 |
(qq) “Registrar” shall mean the Transfer Agent acting in its capacity as registrar for the Series B Preferred Stock and the Series C Preferred Stock, and its successors and assigns or any other registrar duly appointed by the Corporation.
(rr) “Reorganization Event” has the meaning set forth in Section 12.
(ss) “Series A Certificate” means the Certificate of Designations of Preferences, Limitations and Relative Rights of Fixed Rate Cumulative Perpetual Preferred Stock, Series A, filed by the Corporation with the North Carolina Secretary of State to establish the TARP Preferred Stock.
(tt) “Share Dilution Amount” has the meaning set forth in Section 4(h).
(uu) “Shareholder Approvals” means receipt of the shareholder votes necessary to approve (i) the conversion of the Series B Preferred Stock into Class A Common Stock, and the Series C Preferred Stock into Class B Common Stock, each for purposes of Rule 5635 of the NASDAQ Stock Market Rules and (ii) amendments to the Articles of Incorporation to (x) authorize the Board of Directors to divide the Corporation’s Common Stock into two classes, Class A Common Stock (voting) and Class B Common Stock (non-voting), (y) cause the conversion of outstanding shares of Common Stock into Class A Common Stock and (z) increase the number of authorized shares of the Corporation’s Common Stock and preferred stock.
(vv) “Subsequent Dilutive Issuance” has the meaning set forth in Section 10(a)(viii).
(ww) “TARP Dividend Payment Date” has the meaning set forth in Section 4(h).
(xx) “TARP Dividend Period” means the “Dividend Period” established in the Series A Certificate.
(yy) “TARP Preferred Stock” has the meaning set forth in Section 2.
(zz) “Total Conversion Limit” has the meaning set forth in Section 15(b).
(aaa) “Trading Day” means a day on which the shares of Common Stock:
(i) are not suspended at the close of business from trading on any national or regional securities exchange or association or over-the-counter market that is the primary market for the trading of the Common Stock; and
(ii) have traded at least once on such exchange, association or over-the-counter market.
(bbb) “Transfer Agent” means Computershare Trust Company, N.A., acting as transfer agent, registrar, paying agent and Conversion Agent for the Series B Preferred Stock and the Series C Preferred Stock, and its successors and assigns, including any successor transfer agent appointed by the Corporation.
(ccc) “Voting Conversion Limit” has the meaning set forth in Section 15(a).
(ddd) “Voting Ownership Interest” means, with respect to any particular date and with respect to any Holder, the percentage of any class of Voting Securities of the Corporation deemed to be owned or controlled by the Holder (when aggregated with its BHC Affiliates) for purposes of, and in accordance with, the BHC Act and its implementing regulations and guidance.
(eee) “Voting Securities” has the meaning set forth in the BHC Act and any rules and regulations promulgated thereunder.
Section 4. Dividends.
(a) Subject to Section 15, from and after the Issue Date, Holders shall be entitled to receive, when, as and if authorized and declared by the Board of Directors, out of legally available funds, on a cumulative basis, cash dividends on the outstanding shares of the Series B Preferred Stock and the Series C Preferred Stock in the amount determined as set forth in Section 4(c), and no more; provided, however, if the Mandatory Conversion Date occurs before the six (6) month anniversary of the Issue Date, then no dividends shall accrue or be payable.
(b) Subject to Sections 4(a) and 15, dividends shall be payable in semi-annual installments commencing on the six (6) month anniversary of the Issue Date and continuing on each six (6) month anniversary thereafter (each,
| B-6 |
a “Dividend Payment Date”). Each dividend will be payable to Holders as they appear in the stock register of the Corporation at the close of business on the first day of the month, whether or not a Business Day, in which the relevant Dividend Payment Date occurs (each, a “Record Date”). Each period from and including a Dividend Payment Date (or the Issue Date) to but excluding the following Dividend Payment Date is herein referred to as a “Dividend Period.”
(c) Subject to Section 4(a) and Section 15, dividends, if, when and as authorized and declared by the Board of Directors, will be payable, for each outstanding share of each of the Series B Preferred Stock and the Series C Preferred Stock, at the following respective rates during each of the following respective periods (each rate expressed as an annual rate on the applicable per share Liquidation Preference):
(i) 5.0% per annum for the Dividend Period beginning on the Issue Date;
(ii) 6.0% per annum for the Dividend Period beginning on the first Dividend Payment Date;
(iii) 7.0% per annum for the Dividend Period beginning on the second Dividend Payment Date; and
(iv) 8.0% per annum for the dividends accruing during all Dividend Periods beginning on or after the third Dividend Payment Date.
Dividends payable for a Dividend Period will be computed on the basis of a 360-day year consisting of twelve (12) 30-day months. If a scheduled Dividend Payment Date falls on a day that is not a Business Day, the dividend will be paid on the next Business Day as if it were paid on the scheduled Dividend Payment Date, and no additional interest or other amount will accrue on the dividend so payable for such Dividend Period from and after that Dividend Payment Date to the date the dividend is paid. Except as provided in Section 4(d), no interest or sum of money in lieu of interest will be paid on any dividend payment on shares of Series B Preferred Stock and Series C Preferred Stock paid later than the scheduled Dividend Payment Date.
(d) Dividends on the Series B Preferred Stock and the Series C Preferred Stock are cumulative and shall begin to accrue on the Issue Date except as otherwise provided in Section 4(a). With respect to each such Series, if the Board of Directors does not authorize and declare a dividend on such Series for a Dividend Period or if the Board of Directors authorizes and declares less than a full dividend in respect of any Dividend Period, such dividends will continue to accrue and cumulate from such scheduled Dividend Payment Date, shall compound on each subsequent Dividend Payment Date and shall be payable semi-annually in arrears on each subsequent Dividend Payment Date.
(e) So long as any share of Series B Preferred Stock or Series C Preferred Stock remains outstanding, (1) no dividend shall be declared and paid or set aside for payment and no distribution shall be declared and made or set aside for payment on any Junior Securities (other than a dividend payable solely in shares of Junior Securities) and (2) no shares of Junior Securities shall be purchased, redeemed or otherwise acquired for consideration by the Corporation, directly or indirectly (other than (x) as a result of a reclassification of Junior Securities for or into other Junior Securities or the exchange or conversion of one share of Junior Securities for or into another share of Junior Securities, (y) repurchases in support of the Corporation’s employee benefit and compensation programs and (z) through the use of the proceeds of a substantially contemporaneous sale of other shares of Junior Securities), unless, in each case, the full dividends for the most recent Dividend Payment Date (including any prior missed dividends) on all outstanding shares of Series B Preferred Stock, Series C Preferred Stock and Parity Securities have been paid or declared and a sum sufficient for the payment thereof has been set aside.
Subject to Section 15, the succeeding sentence and, with respect to the TARP Preferred Stock, subject to Section 4(h), for so long as any share of Series B Preferred Stock or Series C Preferred Stock remains outstanding, (1) no dividends shall be declared or paid or set aside for payment and no distribution shall be declared or made and set aside for distribution on any Parity Securities for any period and (2) no shares of Parity Securities shall be purchased, redeemed or otherwise acquired for consideration by the Corporation, directly or indirectly, unless, in each case, full dividends on all outstanding shares of Series B Preferred Stock and Series C Preferred Stock for the then-current Dividend Period (including any prior missed dividends) have been paid in full or declared and a sum sufficient for the payment thereof set aside for all outstanding shares of Series B Preferred Stock and Series C Preferred Stock. To the extent the Corporation declares dividends on the
| B-7 |
Series B Preferred Stock, Series C Preferred Stock and on any Parity Securities but does not make full payment of such declared dividends, and except as otherwise provided in Sections 4(h) and 15, the Corporation shall allocate the dividend payments on a pro rata basis among the Holders of the shares of Series B Preferred Stock, Series C Preferred Stock and the holders of any Parity Securities then outstanding. For purposes of calculating the pro rata allocation of partial dividend payments, the Corporation shall allocate those payments so that the respective amounts of those payments bear the same ratio to each other as all accrued and unpaid dividends per share on the Series B Preferred Stock or Series C Preferred Stock, as applicable, and all Parity Securities bear to each other.
The Corporation is not obligated to pay Holders of shares of the Series B Preferred Stock or the Series C Preferred Stock any dividend in excess of the dividends on the Series B Preferred Stock or the Series C Preferred Stock, as applicable, that are payable as described herein. Subject to the foregoing, and not otherwise, such dividends (payable in cash, stock or otherwise) as may be determined by the Board of Directors may be declared and paid on any Junior Securities from time to time out of any assets legally available therefor, and the shares of Series B Preferred Stock and Series C Preferred Stock shall not be entitled to participate in any such dividend, other than as expressly set forth in Section 15.
(f) Payments of cash for dividends will be delivered to the Holder by check or, at any time that shares of Series B Preferred Stock or Series C Preferred Stock are held in book-entry form with DTC or any successor Depositary, through a book-entry transfer through the Depositary.
(g) If the Mandatory Conversion Date occurs on or prior to the Record Date for any Dividend Period, the Holder will not have the right to receive any dividends for that Dividend Period. If the Mandatory Conversion Date is after the Record Date and prior to the Dividend Payment Date for any Dividend Period, such Holder on such Record Date shall receive that dividend on the Dividend Payment Date.
(h) Notwithstanding any other provision of this Section 4, so long as any share of TARP Preferred Stock remains outstanding, no dividend or distribution shall be declared or paid on the Common Stock or any other shares of Junior Securities (other than dividends payable solely in shares of Common Stock) or Parity Securities, subject to the immediately following paragraph in the case of Parity Securities, and no Common Stock, Junior Securities or Parity Securities shall be, directly or indirectly, purchased, redeemed or otherwise acquired for consideration by the Corporation or any of its subsidiaries unless all accrued and unpaid dividends for all past TARP Dividend Periods, including the latest completed TARP Dividend Period (including, if applicable, dividends on such amount) on all outstanding shares of TARP Preferred Stock have been or are contemporaneously declared and paid in full (or have been declared and a sum sufficient for the payment thereof has been set aside for the benefit of the holders of shares of TARP Preferred Stock on the applicable record date). The foregoing limitation shall not apply to (i) redemptions, purchases or other acquisitions of shares of Common Stock or other Junior Securities in connection with the administration of any employee benefit plan in the ordinary course of business (including purchases to offset the “Share Dilution Amount” (as defined below) pursuant to a publicly announced repurchase plan) and consistent with past practice,provided that any purchases to offset the Share Dilution Amount shall in no event exceed the Share Dilution Amount; (ii) purchases or other acquisitions by a broker-dealer subsidiary of the Corporation solely for the purpose of market-making, stabilization or customer facilitation transactions in Junior Securities or Parity Securities in the ordinary course of its business; (iii) purchases by a broker-dealer subsidiary of the Corporation of capital stock of the Corporation for resale pursuant to an offering by the Corporation of such capital stock underwritten by such broker-dealer subsidiary; (iv) any dividends or distributions of rights of Junior Securities in connection with a shareholders’ rights plan or any redemption or repurchase of rights pursuant to any shareholders’ rights plan; (v) the acquisition by the Corporation or any of its subsidiaries of record ownership in Junior Securities or Parity Securities for the beneficial ownership of any other Persons (other than the Corporation or any of its subsidiaries), including as trustees or custodians; and (vi) the exchange or conversion of Junior Securities for or into other Junior Securities or of Parity Securities for or into other Parity Securities (with the same or lesser aggregate liquidation amount) or Junior Securities, in each case, solely to the extent required pursuant to binding contractual agreements entered into by the Corporation or one of its subsidiaries prior to December 12, 2008 or any subsequent agreement for the accelerated exercise, settlement or exchange thereof for Common Stock. “Share Dilution Amount” means the increase in the number of diluted shares outstanding (determined in accordance with generally accepted accounting principles in the United States, and as measured from the
| B-8 |
date of the Corporation’s consolidated financial statements most recently filed with the Securities and Exchange Commission prior to December 12, 2008) resulting from the grant, vesting or exercise of equity-based compensation to employees and equitably adjusted for any stock split, stock dividend, reverse stock split, reclassification or similar transaction.
When dividends are not paid (or declared and a sum sufficient for payment thereof set aside for the benefit of the holders of the TARP Preferred Stock on the applicable record date) on any dividend payment date established in the Series A Certificate (each, a “TARP Dividend Payment Date”) (or, in the case of Parity Securities having dividend payment dates different from the TARP Dividend Payment Dates, on a dividend payment date falling within a TARP Dividend Period related to such TARP Dividend Payment Date) in full upon TARP Preferred Stock and any shares of Parity Securities, all dividends declared on TARP Preferred Stock and all such Parity Securities and payable on such TARP Dividend Payment Date (or, in the case of Parity Securities having dividend payment dates different from the TARP Dividend Payment Dates, on a dividend payment date falling within the TARP Dividend Period related to such TARP Dividend Payment Date) shall be declaredpro rata so that the respective amounts of such dividends declared shall bear the same ratio to each other as all accrued and unpaid dividends per share on the shares of TARP Preferred Stock (including, if applicable, dividends on such amount) and all Parity Securities payable on such TARP Dividend Payment Date (or, in the case of Parity Securities having dividend payment dates different from the TARP Dividend Payment Dates, on a dividend payment date falling within the TARP Dividend Period related to such TARP Dividend Payment Date) (subject to such dividends having been declared by the Board of Directors or a duly authorized committee of the Board of Directors out of legally available funds and including, in the case of Parity Securities that bear cumulative dividends, all accrued but unpaid dividends) bear to each other.
This Section 4(h) shall cease to have any effect in the event that all of the shares of TARP Preferred Stock are redeemed, repurchased or otherwise acquired by the Corporation.
Section 5. Liquidation.
(a) In the event the Corporation voluntarily or involuntarily liquidates, dissolves or winds up, the Holders at the time shall be entitled to receive liquidating distributions in an amount equal to the greater of (i) the Liquidation Preference per share of each of Series B Preferred Stock and Series C Preferred Stock, plus with respect each share of each such Series held by such Holders, an amount equal to (A) any accrued and unpaid dividends (regardless of whether any dividends are actually declared) and (B) any authorized and declared but unpaid dividends thereon, to and including the date of such liquidation, dissolution, or winding up and (ii) the distribution to which such Holders would be entitled if the Series B Preferred Stock and Series C Preferred Stock were converted into Class A Common Stock and Class B Common Stock, respectively, immediately prior to such liquidation, dissolution or winding up, in each case out of assets legally available for distribution to the Corporation’s shareholders, before any distribution of assets is made to the holders of the Common Stock or any other Junior Securities. After payment of the full amount of such liquidating distributions, the Holders will not be entitled to any further participation in any distribution of assets by, and shall have no right or claim to any remaining assets of, the Corporation.
(b) In the event the assets of the Corporation available for distribution to shareholders upon any liquidation, dissolution or winding-up of the affairs of the Corporation, whether voluntary or involuntary, shall be insufficient to pay in full the amounts payable with respect to all outstanding shares of the Series B Preferred Stock and the Series C Preferred Stock, and the corresponding amounts payable on any Parity Securities, Holders and the holders of such Parity Securities shall share ratably in any distribution of assets of the Corporation in proportion to the full respective liquidating distributions to which they would otherwise be respectively entitled.
(c) The Corporation’s merger with or into any other entity, the merger of any other entity with or into the Corporation, or the sale of all or substantially all of the Corporation’s property or business will not constitute its liquidation, dissolution or winding up.
| B-9 |
Section 6. Perpetual; No Maturity. Except as otherwise specifically permitted in Section 12, the Series B Preferred Stock and the Series C Preferred Stock each shall be perpetual and shall be without maturity subject only to mandatory conversion to Class A Common Stock or Class B Common Stock, as applicable, in accordance with this Certificate of Designation.
Section 7. Non-Redeemable; No Sinking Fund. Neither the Series B Preferred Stock nor the Series C Preferred Stock shall be redeemable either at the Corporation’s option or at the option of Holders at any time. Neither the Series B Preferred Stock nor the Series C Preferred Stock shall be subject to any sinking fund or other obligation to redeem, repurchase or retire the Series B Preferred Stock or the Series C Preferred Stock, as applicable.
Section 8. Mandatory Conversion.
(a) Effective as of the close of business on the Mandatory Conversion Date, all shares of Series B Preferred Stock shall, subject to the provisions of Section 15, automatically convert into shares of Class A Common Stock at the Conversion Rate.
(b) Effective as of the close of business of the Mandatory Conversion Date, all shares of Series C Preferred Stock shall, subject to the provisions of Section 15, automatically convert into shares of Class B Common Stock at the Conversion Rate.
(c) If the Mandatory Conversion Date is more than six (6) months after the Issue Date, on the Mandatory Conversion Date, the Corporation shall pay in cash to the Holders, any accrued and unpaid dividends on its shares of Series B Preferred Stock or Series C Preferred Stock, in each case regardless of whether any dividends are actually declared. To the extent that the Corporation is unable to pay such dividends in cash on the Mandatory Conversion Date as a result of any regulatory restriction or otherwise, the payment of such amount shall remain an obligation of the Corporation and payable to the Holders when permitted, in accordance with and subject to Section 4(g).
Section 9. Conversion Procedures.
(a) Effective immediately prior to the close of business on the Mandatory Conversion Date, dividends shall no longer be authorized and declared on any shares of Series B Preferred Stock or Series C Preferred Stock, other than as expressly set forth in Section 15, and, subject to Section 15, such shares of Series B Preferred Stock and Series C Preferred Stock shall automatically cease to be outstanding, subject to the right of Holders to receive any then authorized, declared and unpaid dividends on such shares and any other payments to which they are otherwise entitled pursuant to applicable provisions of this Certificate of Designation; provided, however, if the Mandatory Conversion Date occurs on or before the six (6) month anniversary of the Issue Date, then no dividends shall accrue or be payable.
(b) No allowance or adjustment, except pursuant to Section 10, shall be made with respect to Holders of Series B Preferred Stock or the Class A Common Stock into which the shares of Series B Preferred Stock are converted, relating to dividends payable to holders of the Class A Common Stock of record as of any date or time prior to the close of business on the Mandatory Conversion Date. Prior to the close of business on the Mandatory Conversion Date, shares of Class A Common Stock issuable upon conversion of, or other securities issuable upon conversion of, any shares of Series B Preferred Stock shall not be deemed outstanding for any purpose, and Holders shall have no rights with respect to the Class A Common Stock or other securities issuable upon conversion (including voting rights, rights to respond to tender offers for the Class A Common Stock or other securities issuable upon conversion and rights to receive any dividends or other distributions on the Common Stock or other securities issuable upon conversion) by virtue of holding shares of Series B Preferred Stock.
(c) No allowance or adjustment, except pursuant to Section 10, shall be made with respect to Holders of Series C Preferred Stock or the Class B Common Stock into which the shares of Series C Preferred Stock are converted, relating to dividends payable to holders of the Class B Common Stock of record as of any date or time prior to the close of business on the Mandatory Conversion Date. Prior to the close of business on the Mandatory Conversion Date, shares of Class B Common Stock issuable upon conversion of, or other securities issuable upon conversion of, any shares of Series C Preferred Stock shall not be deemed outstanding for any
| B-10 |
purpose, and Holders shall have no rights with respect to the Class B Common Stock or other securities issuable upon conversion (including voting rights, rights to respond to tender offers for the Class B Common Stock or other securities issuable upon conversion and rights to receive any dividends or other distributions on the Common Stock or other securities issuable upon conversion) by virtue of holding shares of Series C Preferred Stock.
(d) The Person or Persons entitled to receive shares of the Class A Common Stock and/or cash, securities or other property issuable upon conversion of outstanding Series B Preferred Stock shall be treated for all purposes as the record holder(s) of such shares of Class A Common Stock and/or securities as of the close of business on the Mandatory Conversion Date. A Holder may by written notice designate the name in which shares of Class A Common Stock and/or cash, securities or other property (including payments of cash in lieu of fractional shares) to be issued or paid upon conversion of shares of Series B Preferred Stock should be registered or paid or the manner in which such shares should be delivered. In the absence of such written notice, the Corporation shall be entitled to register and deliver such shares, and make such payment, in the name of the Holder and in the manner shown on the records of the Corporation or, if the shares of Series B Preferred Stock are then held by book-entry with DTC or any successor Depositary, through book-entry transfer through the Depositary.
(e) The Person or Persons entitled to receive shares of the Class B Common Stock and/or cash, securities or other property issuable upon conversion of outstanding Series C Preferred Stock shall be treated for all purposes as the record holder(s) of such shares of Class B Common Stock and/or securities as of the close of business on the Mandatory Conversion Date. A Holder may by written notice designate the name in which shares of Class B Common Stock and/or cash, securities or other property (including payments of cash in lieu of fractional shares) to be issued or paid upon conversion of shares of Series C Preferred Stock should be registered or paid or the manner in which such shares should be delivered. In the absence of such written notice, the Corporation shall be entitled to register and deliver such shares, and make such payment, in the name of the Holder and in the manner shown on the records of the Corporation or, if the shares of Series C Preferred Stock are then held by book-entry with DTC or any successor Depositary, through book-entry transfer through the Depositary.
(f) Although conversions of shares of Series B Preferred Stock and Series C Preferred Stock into Class A Common Stock and Class B Common Stock, respectively, are automatic as provided in Section 8(a) and (b), the mechanical issuance of shares of Class A Common Stock and Class B Common Stock will occur on the Mandatory Conversion Date as follows:
(i) On the Mandatory Conversion Date, shares of Class A Common Stock and/or cash, securities or other property issuable upon conversion of outstanding Series B Preferred Stock shall be issued to Holders of Series B Preferred Stock or their designee upon presentation and surrender of the certificate evidencing the Series B Preferred Stock to the Conversion Agent, if shares of the Series B Preferred Stock are held in certificated form, and, if required, the furnishing of appropriate endorsements and transfer documents and the payment of all transfer and similar taxes. If a Holder’s interest is a beneficial interest in shares of Series B Preferred Stock held by book-entry with the Depositary, a book-entry transfer through the Depositary will be made by the Conversion Agent upon compliance with the Depositary’s procedures.
(ii) On the Mandatory Conversion Date, shares of Class B Common Stock and/or cash, securities or other property issuable upon conversion of outstanding Series C Preferred Stock shall be issued to Holders of Series C Preferred Stock or their designee upon presentation and surrender of the certificate evidencing the Series C Preferred Stock to the Conversion Agent, if shares of the Series C Preferred Stock are held in certificated form, and, if required, the furnishing of appropriate endorsements and transfer documents and the payment of all transfer and similar taxes. If a Holder’s interest is a beneficial interest in shares of Series C Preferred Stock held by book-entry with the Depositary, a book-entry transfer through the Depositary will be made by the Conversion Agent upon compliance with the Depositary’s procedures.
| B-11 |
Section 10. Anti-Dilution Adjustments.
(a) The Conversion Rate shall be subject to the following adjustments:
(i) Stock Dividends and Distributions. If the Corporation pays dividends or other distributions on its Common Stock in shares of Common Stock, then the Conversion Rate in effect immediately prior to the Ex-Date for such dividend or distribution will be multiplied by the following fraction:
OS1 / OS2
Where:
| • | OS1 means the sum of the number of shares of Common Stock outstanding immediately prior to the Ex-Date for such dividend or distribution plus the total number of shares of Common Stock constituting such dividend or distribution; and |
| • | OS2 means the number of shares of Common Stock outstanding immediately prior to the Ex-Date for such dividend or distribution. |
(ii) Subdivisions, Splits and Combination of the Common Stock. If the Corporation subdivides, splits or combines the shares of Common Stock, then the Conversion Rate in effect immediately prior to the effective date of such share subdivision, split or combination will be multiplied by the following fraction: OS1/OS2. Where:
| • | OS1 means the number of shares of Common Stock outstanding immediately after the effective time of such share subdivision, split or combination; and |
| • | OS2 means the number of shares of Common Stock outstanding immediately prior to the effective time of such share subdivision, split or combination. |
(iii) Issuance of Stock Purchase Rights. If the Corporation issues to all or substantially all holders of the shares of Common Stock rights or warrants (other than rights or warrants issued pursuant to a dividend reinvestment plan or share purchase plan or other similar plans) entitling them to subscribe for or purchase the shares of Common Stock at less than the Current Market Price on the date fixed for the determination of shareholders entitled to receive such rights or warrants, then the Conversion Rate in effect immediately prior to the Ex-Date for such distribution will be multiplied by the following fraction:
(OS0 + X) / (OX0 +Y)
Where:
| • | OS0 means the number of shares of Common Stock outstanding immediately prior to the Ex-Date for such distribution; |
| • | X means the total number of shares of Common Stock issuable pursuant to such rights or warrants; and |
| • | Y means the number of shares of Common Stock equal to the aggregate price payable to exercise such rights or warrants divided by the Current Market Price. |
To the extent that such rights or warrants described in this clause (iii) are not exercised prior to their expiration or shares of Common Stock are otherwise not delivered pursuant to such rights or warrants upon the exercise of such rights or warrants, the Conversion Rate shall be readjusted to such Conversion Rate that would then be in effect had the adjustment made upon the issuance of such rights or warrants been made on the basis of the delivery of only the number of shares of Common Stock actually delivered (but giving effect to any intervening adjustments that may have been made with respect to the Conversion Rate). In determining the aggregate price payable for such shares of Common Stock, there shall be taken into account any consideration received for such rights or warrants and the value of such consideration (if other than cash, to be determined in good faith and in a reasonable manner by the Board of Directors). If an adjustment to the Conversion Rate is required under this clause (iii), delivery of any additional shares of Common Stock that may be deliverable upon conversion as a result of an adjustment required under this clause (iii) shall be delayed to the extent necessary in order to complete the calculations provided in this clause (iii).
| B-12 |
(iv) Debt or Asset Distributions. If the Corporation distributes to all or substantially all holders of shares of Common Stock evidences of indebtedness, shares of capital stock, securities, cash or other assets (excluding any dividend or distribution referred to in clause (i) of this Section 10(a), any rights or warrants referred to in clause (iii) of this Section 10(a), any dividend or distribution paid exclusively in cash, any consideration payable in connection with a tender or exchange offer made by the Corporation or any of its subsidiaries, and any dividend of shares of capital stock of any class or series, or similar equity interests, of or relating to a subsidiary or other business unit in the case of certain spin-off transactions as described below) (such evidences of indebtedness, shares of capital stock, securities, cash or other assets, the “Distributed Property”), then the Conversion Rate in effect immediately prior to the Ex-Date for such distribution will be multiplied by the following fraction:
SPO / (SPO-FMV)
Where:
| • | SPO means the Current Market Price per share of Common Stock on such date; and |
| • | FMV means the fair market value of the portion of the distribution applicable to one share of Common Stock on such date as determined in good faith and in a reasonable manner by the Board of Directors; |
provided that, if “FMV” as set forth above is equal to or greater than “SPO” as set forth above, in lieu of the foregoing adjustment, adequate provision shall be made so that each Holder shall receive on the date on which the Distributed Property is distributed to holders of Common Stock, for each share of Series B Preferred Stock and Series C Preferred Stock, the amount of Distributed Property such Holder would have received had such Holder owned a number of shares of Common Stock equal to the Conversion Rate on the Ex-Date for such distribution, subject to the rights of the holders of the TARP Preferred Stock.
In a “spin-off,” where the Corporation makes a distribution to all or substantially all holders of shares of Common Stock consisting of capital stock of any class or series, or similar equity interests of, or relating to, a subsidiary or other business unit, the Conversion Rate will not be adjusted, but in lieu of such adjustment each Holder shall receive the same distribution as a holder of Common Stock would as though such Holder’s shares of Series B Preferred Stock or Series C Preferred Stock had been converted into such number of shares of Class A Common Stock or Class B Common Stock that such Holder’s shares would then be convertible assuming the Shareholder Approvals had been previously received, subject to the rights of the holders of the TARP Preferred Stock.
If an adjustment to the Conversion Rate is required under this clause (iv), delivery of any additional shares of Common Stock that may be deliverable upon conversion as a result of an adjustment required under this clause (iv) shall be delayed to the extent necessary in order to complete the calculations provided for in this clause (iv).
(v) Cash Distributions. If the Corporation makes a distribution consisting exclusively of cash to all or substantially all holders of the Common Stock (excluding any cash that is distributed in a Reorganization Event or as part of a “spin-off” referred to in clause (iv) of this Section 10(a), any dividend or distribution in connection with the Corporation’s liquidation, dissolution or winding up, and any consideration payable in connection with a tender or exchange offer made by the Corporation or any of its subsidiaries), then in each event, the Conversion Rate in effect immediately prior to the Ex-Date for such distribution will be multiplied by the following fraction:
SPO / (SPO-DIV)
Where:
| • | SPO means the Closing Price per share of Common Stock on the Ex-Date; and |
| • | DIV means the amount per share of Common Stock of the dividend or distribution, as determined pursuant to the following paragraph. |
| B-13 |
Notwithstanding the foregoing, if “DIV” as set forth above is equal to or greater than “SP0” as set forth above, in lieu of the foregoing adjustment, adequate provision shall be made so that each Holder shall have the right to receive on the date on which the relevant cash dividend or distribution is distributed to holders of Common Stock, for each share of Series B Preferred Stock or Series C Preferred Stock held, the amount of cash such Holder would have received had such Holder owned a number of shares of Common Stock equal to the Conversion Rate on the Ex-Date for such distribution, subject to the rights of the holder(s) of the TARP Preferred Stock.
(vi) Self Tender Offers and Exchange Offers. If the Corporation or any of its subsidiaries successfully completes a tender or exchange offer for the Common Stock where the cash and the value of any other consideration included in the payment per share of the Common Stock exceeds the Closing Price per share of the Common Stock on the Trading Day immediately succeeding the expiration of the tender or exchange offer, then the Conversion Rate in effect at the close of business on such immediately succeeding Trading Day will be multiplied by the following fraction:
[AC + (SPO X OS1)] / (OS2 x SPO)
Where:
| • | AC means the aggregate cash and fair market value of the other consideration payable in the tender or exchange offer, as determined in good faith and in a reasonable manner by the Board of Directors; |
| • | SPO means the Closing Price per share of Common Stock on the Trading Day immediately succeeding the expiration of the tender or exchange offer; |
| • | OS1 means the number of shares of Common Stock outstanding immediately after the expiration of the tender or exchange offer, giving effect to consummation of the acquisition of all shares validly tendered or exchanged (and not withdrawn) in connection with such tender or exchange; and |
| • | OS2 means the number of shares of Common Stock outstanding immediately prior to the expiration of the tender or exchange offer, including any shares validly tendered and not withdrawn. |
In the event that the Corporation, or one of its subsidiaries, is obligated to purchase shares of Common Stock pursuant to any such tender offer or exchange offer, but the Corporation, or such subsidiary, is permanently prevented by applicable law from effecting any such purchases, or all such purchases are rescinded, then the Conversion Rate shall be readjusted to be such Conversion Rate that would then be in effect if such tender offer or exchange offer had not been made (but giving effect to any intervening adjustments that may have been made with respect to the Conversion Rate). Except as set forth in the preceding sentence, if the application of this clause (vi) to any tender offer or exchange offer would result in a decrease in the Conversion Rate, no adjustment shall be made for such tender offer or exchange offer under this clause (vi). If an adjustment to the Conversion Rate is required under this clause (vi), delivery of any additional shares of Common Stock that may be deliverable upon conversion as a result of an adjustment required under this clause (vi) shall be delayed to the extent necessary in order to complete the calculations provided for in this clause (vi).
(vii) Rights Plans. To the extent that the Corporation has a rights plan in effect with respect to the Common Stock on the Mandatory Conversion Date (a “Rights Plan”), Holders will receive, in addition to the shares of Class A Common Stock and Class B Common Stock, respectively, the rights under the Rights Plan, unless, prior to such Mandatory Conversion Date, the rights have separated from the shares of Common Stock, in which case the Conversion Rate will be adjusted at the time of separation as if the Corporation had made a distribution to all holders of the Common Stock as described in clause (iv) of this Section 10(a), subject to readjustment in the event of the expiration, termination or redemption of such rights.
(viii) Other Issuances of Additional Stock.
(A) For so long as any share of Series B Preferred Stock or Series C Preferred Stock remains outstanding, if the Corporation shall issue (or be deemed to have issued), after the date of filing of this Certificate of Designation (the “Filing Date”), any Additional Stock without consideration or for
| B-14 |
a consideration per share less than the Conversion Price in effect immediately prior to the issuance of such Additional Stock, the Conversion Price in effect immediately prior to each such issuance of Additional Stock shall forthwith (except as otherwise provided in this subsection (viii)) be adjusted to a price equal to (calculated to the nearest cent) the product obtained by multiplying the Conversion Price in effect immediately prior to such issuance of Additional Stock by a fraction, the numerator of which is equal to the sum of (x) the total number of shares of Common Stock outstanding (including any shares of Common Stock previously deemed to have been issued pursuant to subsection (viii)(E)(1) or (2) of this Section 10 (to the extent not actually issued)) immediately prior to such issuance of Additional Stock plus (y) the number of shares of Common Stock that the aggregate consideration received by the Corporation for such issuance of Additional Stock would purchase at the Conversion Price in effect immediately prior to such issuance of Additional Stock, and the denominator of which is equal to the sum of (x) the total number of shares of Common Stock outstanding (including any shares of Common Stock previously deemed to have been issued pursuant to subsection (viii)(E)(1) or (2) of this Section 10 (to the extent not actually issued)) immediately prior to such issuance of Additional Stock plus (y) the number of shares of Additional Stock issued. In the event that the Corporation issues or sells, or is deemed to have issued or sold, Additional Stock (the “First Dilutive Issuance”), then in the event that the Corporation issues or sells, or is deemed to have issued or sold, Additional Stock other than the First Dilutive Issuance as a part of the same transaction or series of related transactions as the First Dilutive Issuance (a “Subsequent Dilutive Issuance”), then and in each such case upon a Subsequent Dilutive Issuance, the Conversion Price shall be reduced to the Conversion Price that would have been in effect had the First Dilutive Issuance and each Subsequent Dilutive Issuance all occurred on the closing date of the First Dilutive Issuance.
(B) Except to the limited extent provided for in subsections (viii)(E)(3) or (4), no adjustment of the Conversion Price pursuant to this subsection (viii) shall have the effect of increasing any such Conversion Price above the Conversion Price in effect immediately prior to such adjustment.
(C) In the case of the issuance of Additional Stock for cash, the consideration shall be deemed to be the amount of cash paid therefor before deducting any discounts, commissions or other expenses allowed, paid or incurred by the Corporation for any underwriting or otherwise in connection with the issuance and sale thereof.
(D) In the case of the issuance of Additional Stock for a consideration in whole or in part other than cash, the consideration other than cash shall be deemed to be the fair value thereof as determined in good faith and in a reasonable manner by the Board of Directors irrespective of any accounting treatment.
(E) In the case of the issuance (whether before, on or after the Filing Date) of (i) options to purchase or rights to subscribe for Common Stock, (ii) securities by their terms convertible into or exchangeable for Common Stock or (iii) options to purchase or rights to subscribe for securities by their terms convertible into or exchangeable for Common Stock, the following provisions shall apply for all purposes of this subsection (viii):
(1) The aggregate maximum number of shares of Common Stock deliverable upon exercise (assuming the satisfaction of any conditions to exercisability, including without limitation, the passage of time, but without taking into account potential anti-dilution adjustments) of such options to purchase or rights to subscribe for Common Stock shall be deemed to have been issued at the time such options or rights were issued and for a consideration equal to the consideration (determined in the manner provided in subsections (viii)(C) and (D)) if any, received by the Corporation upon the issuance of such options or rights plus the minimum exercise price provided in such options or rights (without taking into account potential anti-dilution adjustments) for the Common Stock covered thereby.
(2) The aggregate maximum number of shares of Common Stock deliverable upon conversion of or in exchange (assuming the satisfaction of any conditions to convertibility or exchangeability, including without limitation, the passage of time, but without taking into account potential
| B-15 |
anti-dilution adjustments) for any such convertible or exchangeable securities or upon the exercise of options to purchase or rights to subscribe for such convertible or exchangeable securities and subsequent conversion or exchange thereof shall be deemed to have been issued at the time such securities were issued or such options or rights were issued and for a consideration equal to the consideration, if any, received by the Corporation for any such securities and related options or rights (excluding any cash received on account of accrued interest or accrued dividends), plus the minimum additional consideration, if any, to be received by the Corporation (without taking into account potential anti-dilution adjustments) upon the conversion or exchange of such securities or the exercise of any related options or rights (the consideration in each case to be determined in the manner provided in subsections (viii)(C) and (D)).
(3) In the event of any change in the number of shares of Common Stock deliverable or in the consideration payable to the Corporation upon exercise of such options or rights or upon conversion of or exchange for such convertible or exchangeable securities, including, but not limited to, a change resulting from the anti-dilution provisions thereof, the Conversion Price, to the extent in any way affected by or computed using such options, rights or securities, shall be recomputed to reflect such change, but no further adjustment shall be made for the actual issuance of Common Stock or any payment of such consideration upon the exercise of any such options or rights or the conversion or exchange of such securities.
(4) Upon the expiration of any such options or rights, the termination of any such rights to convert or exchange or the expiration of any options or rights related to such convertible or exchangeable securities, the Conversion Price, to the extent in any way affected by or computed using such options, rights or securities or options or rights related to such securities, shall be recomputed to reflect the issuance of only the number of shares of Common Stock (and convertible or exchangeable securities that remain in effect) actually issued upon the exercise of such options or rights, upon the conversion or exchange of such securities or upon the exercise of the options or rights related to such securities.
(5) The number of shares of Common Stock deemed issued and the consideration deemed paid therefor pursuant to subsections (viii)(E)(1) and (2) shall be appropriately adjusted to reflect any change, termination or expiration of the type described in either subsection (viii)(E)(3) and (4).
(F) “Additional Stock” shall mean any shares of Common Stock issued (or deemed to have been issued pursuant to subsection (viii)(E) of this Section 10) by the Corporation after the Filing Date for so long as any shares of Series B Preferred Stock or Series C Preferred Stock remain outstanding, other than:
(1) shares of Common Stock or Common Stock Equivalents issued pursuant to an event or transaction described in Sections 10(a)(i) to (vii);
(2) shares of Common Stock issued pursuant to an event or transaction described in Section 10(e) (exceptions to adjustment of Conversion Price);
(3) shares of Class A Common Stock issued or issuable upon conversion of shares of Series B Preferred Stock and shares of Class B Common Stock issued or issuable upon conversion of shares of Series C Preferred Stock;
(4) shares of Common Stock issued (or deemed to have been issued pursuant to subsection (viii)(E) of this Section 10(a)) in connection with a Reorganization Event.
(b) With the approval of the Holders of at least two-thirds (2/3) of the shares of Series B Preferred Stock and Series C Preferred Stock (determined on an as-converted into Common Stock basis) at the time outstanding, the Corporation may make such increases in the Conversion Rate, in addition to any other increases required by this Section 10, if the Board of Directors deems it to be in the best interests of the Corporation or otherwise
| B-16 |
advisable to avoid or diminish any income tax to holders of the Common Stock resulting from any dividend or distribution of shares of Common Stock (or issuance of rights or warrants to acquire shares of Common Stock) or from any event treated as such for income tax purposes or for any other reason.
(c) All adjustments to the Conversion Rate shall be calculated to the nearest 1/10,000th of a share of Common Stock. No adjustment in the Conversion Rate shall be required unless such adjustment would require an increase or decrease of at least one percent thereof; provided, however, that any adjustments which by reason of this subparagraph are not required to be made shall be carried forward and taken into account in any subsequent adjustment; provided further that on the Mandatory Conversion Date or any other conversion date, adjustments to the Conversion Rate will be made with respect to any such adjustment carried forward and which has not been taken into account before such date.
(d) No adjustment to the Conversion Rate shall be made if Holders may participate in the transaction that would otherwise give rise to an adjustment, as a result of holding the Series B Preferred Stock or Series C Preferred Stock, without having to convert the Series B Preferred Stock or Series C Preferred Stock, as if they held the full number of shares of Class A Common Stock or Class B Common Stock into which a share of the Series B Preferred Stock or Series C Preferred Stock may then be converted.
(e) The Conversion Rate shall not be adjusted:
(i) upon the issuance of any shares of the Common Stock pursuant to any present or future plan providing for the reinvestment of dividends or interest payable on the Corporation’s securities and the investment of additional optional amounts in shares of Common Stock under any plan;
(ii) upon the issuance of any shares of the Common Stock or rights, options or warrants to purchase those shares pursuant to any employment benefit, incentive or compensation plans of the Corporation or any of its subsidiaries;
(iii) upon the issuance of any shares of the Common Stock pursuant to any option, warrant, right or exercisable, exchangeable or convertible security outstanding as of the date shares of the Series B Preferred Stock and Series C Preferred Stock were first issued;
(iv) for a change in the par value or no par value of the Common Stock;
(v) for accrued and unpaid dividends on the Series B Preferred Stock; or
(vi) for accrued and unpaid dividends on the Series C Preferred Stock.
(f) Whenever the Conversion Rate is to be adjusted in accordance with Section 10(a) or Section 10(b), the Corporation shall: (i) as soon as practicable following the occurrence of an event that requires an adjustment to the Conversion Rate pursuant to Section 10(a) or Section 10(b), taking into account the one percent threshold set forth in Section 10(c) (or if the Corporation is not aware of such occurrence, as soon as practicable after becoming so aware), provide, or cause to be provided, a written notice to the Holders of the occurrence of such event; and (ii) as soon as practicable following the determination of the revised Conversion Rate in accordance with Section 10(a) or Section 10(b), provide, or cause to be provided, a written notice to the Holders setting forth in reasonable detail the method by which the adjustment to the Conversion Rate was determined and setting forth the revised Conversion Rate. Failure to deliver such notice shall not affect the legality or validity of any such adjustment.
Section 11. Voting Rights. Neither the Holders of Series B Preferred Stock nor the Holders of Series C Preferred Stock shall have any voting rights except as set forth in this Section 11 or as otherwise from time to time required by the NCBA.
(a) Series B Voting Rights.
(i) Subject to Section 11(c) and (e) so long as any shares of Series B Preferred Stock are outstanding, in addition to any other vote or consent of shareholders required by the NCBA, the vote or consent of the Holders of at least two-thirds (2/3) of the outstanding shares of Series B Preferred Stock at the time
| B-17 |
outstanding and entitled to vote thereon, voting together as a single class, given in person or by proxy, either in writing without a meeting or by vote at any meeting called for the purpose, shall be necessary for effecting or validating:
(A) Authorization of Senior Stock. Any amendment or alteration of the Articles of Incorporation (including by means of a merger or otherwise) to authorize or create, or increase the authorized amount of, any shares of any specific class or series of capital stock of the Corporation ranking senior to the Series B Preferred Stock with respect to either or both the payment of dividends or the distribution of assets on any liquidation, dissolution or winding up of the Corporation.
(ii) Subject to Section 11(c) and (e) so long as any shares of Series B Preferred Stock are outstanding, in addition to any other vote or consent of shareholders required by the NCBA, the vote or consent of all of the Holders of the outstanding shares of Series B Preferred Stock at the time outstanding and entitled to vote thereon, voting together as a single class, given in person or by proxy, either in writing without a meeting or by vote at any meeting called for the purpose, shall be necessary for effecting or validating:
(A) Amendment of Articles of Incorporation. Any amendment, alteration or repeal of any provision of the Articles of Incorporation (including by means of a merger or otherwise) that significantly and adversely affects the special rights, preferences, privileges or voting powers of the Series B Preferred Stock; provided, however, that for all purposes of this Section 11(a), (1) any increase in the amount of the Corporation’s authorized but unissued shares of Series B Preferred Stock, (2) any increase in the amount of the Corporation’s authorized or issued Series C Preferred Stock, and (3) to the extent allowed by the NCBA, the creation and issuance, or an increase in the authorized or issued amount, of other series of preferred stock of the Corporation ranking equally with or junior to the Series B Preferred Stock either or both with respect to the payment of dividends (whether such dividends are cumulative or non-cumulative) and/or the distribution of assets upon the liquidation, dissolution or winding up of the Corporation, will not be deemed to significantly and adversely affect the special rights, preferences, privileges or voting powers of the Series B Preferred Stock.
(b) Series C Voting Rights.
(i) Subject to Section 11(d) and (e) so long as any shares of Series C Preferred Stock are outstanding, in addition to any other vote or consent of shareholders required by the NCBA, the vote or consent of the Holders of at least two-thirds (2/3) of the outstanding shares of Series C Preferred Stock at the time outstanding and entitled to vote thereon, voting together as a single class, given in person or by proxy, either in writing without a meeting or by vote at any meeting called for the purpose, shall be necessary for effecting or validating:
(A) Authorization of Senior Stock. Any amendment or alteration of the Articles of Incorporation (including by means of a merger or otherwise) to authorize or create, or increase the authorized amount of, any shares of any specific class or series of capital stock of the Corporation ranking senior to the Series C Preferred Stock with respect to either or both the payment of dividends or the distribution of assets on any liquidation, dissolution or winding up of the Corporation.
(ii) Subject to Section 11(d) and (e) so long as any shares of Series C Preferred Stock are outstanding, in addition to any other vote or consent of shareholders required by the NCBA, the vote or consent of all of the Holders of the outstanding shares of Series C Preferred Stock at the time outstanding and entitled to vote thereon, voting together as a single class, given in person or by proxy, either in writing without a meeting or by vote at any meeting called for the purpose, shall be necessary for effecting or validating:
(A) Amendment of Articles of Incorporation. Any amendment, alteration or repeal of any provision of the Articles of Incorporation (including by means of a merger or otherwise) that significantly and adversely affects the special rights, preferences, privileges or voting powers of the Series C Preferred Stock; provided, however, that for all purposes of this Section 11(b), (1) any increase in the amount of the Corporation’s authorized but unissued shares of Series C Preferred Stock, (2) any increase in the amount of the Corporation’s authorized or issued Series B Preferred Stock, and (3) to the extent allowed by the NCBA, the creation and issuance, or an increase in the authorized or issued amount, of other series of preferred stock of the Corporation ranking equally with or junior to the Series C
| B-18 |
Preferred Stock either or both with respect to the payment of dividends (whether such dividends are cumulative or non-cumulative) and/or the distribution of assets upon the liquidation, dissolution or winding up of the Corporation, will not be deemed to significantly and adversely affect the special rights, preferences, privileges or voting powers of the Series C Preferred Stock.
(c) Series B Change for Clarification. Without the consent or vote of the Holders of the Series B Preferred Stock, so long as such action does not adversely affect the special rights, preferences, privileges or voting powers, of the Series B Preferred Stock, the Corporation may amend, alter, supplement or repeal any terms of the Articles of Incorporation:
(i) to cure any ambiguity, or to cure, correct or supplement any provision contained in this Certificate of Designation that may be ambiguous, defective or inconsistent; or
(ii) to make any provision with respect to matters or questions relating to the Series B Preferred Stock or Series C Preferred Stock that is not inconsistent with the provisions of this Certificate of Designation.
(d) Series C Change for Clarification. Without the consent or vote of the Holders of the Series C Preferred Stock, so long as such action does not adversely affect the rights, preferences, privileges or voting powers of the Series C Preferred Stock, the Corporation may amend, alter, supplement or repeal any terms of the Articles of Incorporation:
(i) to cure any ambiguity, or to cure, correct or supplement any provision contained in this Certificate of Designation that may be ambiguous, defective or inconsistent; or
(ii) to make any provision with respect to matters or questions relating to the Series B Preferred Stock or Series C Preferred Stock that is not inconsistent with the provisions of this Certificate of Designation.
(e) Common Stock Articles of Amendment. Without the consent or vote of the Holders of the Series B Preferred Stock and Series C Preferred Stock, the Corporation may amend, alter, supplement or repeal the Articles of Incorporation as anticipated pursuant to the Common Stock Articles of Amendment.
(f) Procedures for Voting and Consents. The rules and procedures for calling and conducting any meeting of the Holders of Series B Preferred Stock or any meeting of Holders of Series C Preferred Stock (including, without limitation, the fixing of a record date in connection therewith), the solicitation and use of proxies at any such meeting, the obtaining of written consents and any other aspect or matter with regard to any such meeting or such consents shall be governed by any rules the Board of Directors, in its discretion, may adopt from time to time, which rules and procedures shall conform to the requirements of the Articles of Incorporation, the Bylaws, the NCBA and any national securities exchange or other trading facility, if any, on which the Common Stock is listed or traded at the time.
Section 12. Reorganization Events.
(a) In the event of:
(i) any merger of the Corporation with or into another Person, in each case pursuant to which the Common Stock will be converted into cash, securities or other property of the Corporation or another Person,
(ii) any sale, transfer, lease or conveyance to another Person of all or substantially all of the property and assets of the Corporation, in each case pursuant to which the Common Stock will be converted into cash, securities or other property of the Corporation or another Person,
(iii) any reclassification of the Common Stock into securities including securities other than the Common Stock (other than pursuant to the Common Stock Articles of Amendment),
(iv) any statutory exchange of the outstanding shares of Common Stock for securities of another Person (other than in connection with a merger or acquisition) (any such event specified in clauses (i) through (iv), a “Reorganization Event”), each share of Series B Preferred Stock and each share of Series C Preferred Stock outstanding immediately prior to such Reorganization Event shall, at the option of the Holder, either convert into the securities, cash and other property receivable in such Reorganization Event by the Holder (excluding the counterparty to the Reorganization Event or an affiliate of such counterparty)
| B-19 |
of that number of shares of Common Stock determined by assuming each of the outstanding shares of Series B Preferred Stock and Series C Preferred Stock were converted immediately prior to the Reorganization Event at the Conversion Rate (such securities, cash and other property, the “Exchange Property”) plus an amount in cash equal to any accrued and unpaid dividends on each such share of Series B Preferred Stock or share of Series C Preferred Stock as applicable, or be entitled to receive liquidating distributions in accordance with Section 5 as if such Reorganization Event were a liquidation of the Corporation.
(b) In the event that holders of the shares of Common Stock have the opportunity to elect the form of consideration to be received in such transaction, the Holders shall likewise be allowed to make such an election.
(c) The above provisions of this Section 12 shall similarly apply to successive Reorganization Events and the provisions of Section 10 shall apply to any shares of capital stock of the Corporation (or any successor) received by the holders of the Common Stock in any such Reorganization Event.
(d) The Corporation (or any successor) shall, within seven (7) days of the occurrence of any Reorganization Event, provide written notice to the Holders of such occurrence of such event and of the kind and amount of the cash, securities or other property that constitutes the Exchange Property. Failure to deliver such notice shall not affect the operation of this Section 12.
(e) The Corporation shall not enter into any agreement for a transaction constituting a Reorganization Event unless such agreement provides for or does not interfere with or prevent (as applicable) conversion of the Series B Preferred Stock and Series C Preferred Stock into the Exchange Property in a manner that is consistent with and gives effect to this Section 12.
Section 13. Fractional Shares.
(a) No fractional shares of Class A Common Stock or Class B Common Stock will be issued as a result of any conversion of shares of Series B Preferred Stock or Series C Preferred Stock, respectively.
(b) In lieu of any fractional share of Class A Common Stock or Class B Common Stock otherwise issuable in respect of any mandatory conversion pursuant to Section 8, the Holder shall be entitled to receive an amount in cash (computed to the nearest cent) equal to the same fraction of the Closing Price of the Common Stock determined as of the second Trading Day immediately preceding the Mandatory Conversion Date.
(c) If more than one share of the Series B Preferred Stock or Series C Preferred Stock is surrendered for conversion at one time by or for the same Holder, the number of full shares of or Class A Common Stock or Class B Common Stock issuable upon conversion thereof shall be computed on the basis of the aggregate number of shares of the Series B Preferred Stock or Series C Preferred Stock, as applicable, so surrendered.
Section 14. Reservation of Common Stock.
(a) The Corporation shall at all times reserve and keep available out of its authorized and unissued Class A Common Stock and Class B Common Stock, solely for issuance upon the conversion of shares of Series B Preferred Stock and Series C Preferred Stock as provided in this Certificate of Designation (assuming the receipt of Shareholder Approvals), free from any preemptive or other similar rights, such numbers of shares of Class A Common Stock and Class B Common Stock as shall from time to time be issuable upon the conversion of all the shares of Series B Preferred Stock and Series C Preferred Stock then outstanding. For purposes of this Section 14(a), the number of shares of Class A Common Stock that shall be deliverable upon the conversion of all outstanding shares of Series B Preferred Stock and the number of shares of Class B Common Stock that shall be deliverable upon the conversion of all outstanding shares of Series C Preferred Stock shall be computed, in each such case, as if at the time of computation all such outstanding shares were held by a single Holder and there was no regulatory impediment to such conversion.
(b) All shares of Class A Common Stock and Class B Common Stock delivered upon conversion of the Series B Preferred Stock and the Series C Preferred Stock shall be duly authorized, validly issued, fully paid and non-assessable and free and clear of all liens, claims, security interests and encumbrances.
| B-20 |
(c) Prior to the delivery of any securities that the Corporation shall be obligated to deliver upon conversion of the Series B Preferred Stock and Series C Preferred Stock, the Corporation shall use its reasonable best efforts to comply with all federal and state laws and regulations thereunder requiring the registration of such securities with, or any approval of or consent to the delivery thereof by, any governmental authority or seek an exemption therefrom.
Section 15. Limitations on Beneficial Ownership and Dividends.
(a) Notwithstanding anything to the contrary contained herein, if, as of the Mandatory Conversion Date, the conversion of the Series B Preferred Stock would result in the Holder thereof (together with its BHC Affiliates) owning or controlling in the aggregate more than a 9.9% Voting Ownership Interest, excluding for the purpose of this calculation any reduction in ownership resulting from transfers by such Holder and its BHC Affiliates of Voting Securities of the Corporation (the “Voting Conversion Limit”), then in lieu of issuing shares of Class A Common Stock in excess of the Voting Conversion Limit (the “Excess Voting Shares”) upon conversion to such Holder, the Corporation shall issue to such Holder a number of shares of Class B Common Stock equal to the number of Excess Voting Shares (in addition to the shares of Class A Common Stock that can be issued to such Holder without violating the Voting Conversion Limit).
(b) Notwithstanding anything to the contrary contained herein, if, as of the Mandatory Conversion Date, the conversion of the Series B Preferred Stock and the Series C Preferred Stock would result in the Holder thereof (together with its BHC Affiliates) owning or controlling in the aggregate more than 33.3% of the Corporation’s total equity, excluding for the purpose of this calculation any reduction in ownership resulting from transfers by such Holder and its BHC Affiliates of equity securities of the Corporation (the “Total Conversion Limit”), then such shares of Series B Preferred Stock and/or Series C Preferred Stock owned by such Holder shall not be converted on such the Mandatory Conversion Date to the extent such conversion would result in such Holder and its BHC Affiliates owning or controlling in the aggregate equity securities in excess of the Total Conversion Limit (for the avoidance of doubt, thereby permitting conversion of shares up to but not exceeding the Total Conversion Limit); provided that shares of Series B Preferred Stock shall be converted first to the maximum extent permissible hereunder. Each share of Series B Preferred Stock or Series C Preferred Stock that is not converted on the Mandatory Conversion Date due to the Total Conversion Limit shall remain outstanding and shall be automatically converted into Class A Common Stock at the Conversion Rate, immediately upon a transfer of such Series B Preferred Stock or Series C Preferred Stock to a transferee pursuant to a Permitted Transfer.
(c) Notwithstanding any other provision of this Certificate of Designation, following the Mandatory Conversion Date, no dividends shall accrue on outstanding shares of Series B Preferred Stock or Series C Preferred Stock; provided, however, in the event that dividends or distributions are declared and paid by the Board of Directors on outstanding shares of Common Stock, each outstanding share of Series B Preferred Stock or Series C Preferred Stock shall be entitled to the same aggregate dividends or distributions as equals the dividend or distribution per share of Common Stock times the number of whole shares of Common Stock into which a share of Series B Preferred Stock or Series C Preferred Stock is convertible as of the record date for the dividend or distribution on the shares of Common Stock.
Section 16. Transfer Agent, Registrar, Paying Agent and Conversion Agent. The duly appointed Transfer Agent, Registrar, paying agent and Conversion Agent for the Series B Preferred Stock and the Series C Preferred Stock shall initially be Computershare Trust Company, N.A. The Corporation may, in its sole discretion, remove the Transfer Agent, Registrar, paying agent and Conversion Agent; provided that the Corporation shall appoint a successor who shall accept such appointments prior to the effectiveness of such removal.
| B-21 |
Section 17. Miscellaneous. All notices referred to herein shall be in writing, and, unless otherwise specified herein, all notices hereunder shall be deemed to have been given upon the earlier of receipt thereof or three (3) Business Days after the mailing thereof if sent by registered or certified mail (unless first-class mail shall be specifically permitted for such notice under the terms of this Certificate of Designation) with postage prepaid, addressed: (i) if to the Corporation, to the principal executive office of the Corporation or to the Transfer Agent at its principal office in the United States of America, or other agent of the Corporation designated as permitted by this Certificate of Designation, or (ii) if to any Holder or holder of shares of Series B Preferred Stock, Series C Preferred Stock, Common Stock, Class A Common Stock or Class B Common Stock, as the case may be, to such Holder at the address of such Holder as listed in the stock record books of the Corporation (which may include the records of any transfer agent for the Series B Preferred Stock, Series C Preferred Stock, Common Stock, Class A Common Stock or Class B Common Stock, as the case may be), or (iii) to such other address as the Corporation or any such Holder, as the case may be, shall have designated by notice similarly given.
| B-22 |
APPENDIX C
Audited Consolidated Financial Statements (including Notes thereto) at December 31, 2011 and 2010, and for the years in the three-year period ended December 31, 2011, as included in our Annual Report on Form 10-K for the fiscal year ended December 31, 2011
| C-1 |
REPORT OF INDEPENDENT REGISTERED PUBLIC ACCOUNTING FIRM
Board of Directors and Shareholders
NewBridge Bancorp
We have audited the accompanying consolidated balance sheets of NewBridge Bancorp (a North Carolina corporation) and Subsidiary (the “Company”) as of December 31, 2011 and 2010, and the related consolidated statements of income, changes in shareholders’ equity and comprehensive income, and cash flows for each of the three years in the period ended December 31, 2011. These financial statements are the responsibility of the Company’s management. Our responsibility is to express an opinion on these financial statements based on our audits.
We conducted our audits in accordance with the standards of the Public Company Accounting Oversight Board (United States).Those standards require that we plan and perform the audit to obtain reasonable assurance about whether the financial statements are free of material misstatement.An audit includes examining, on a test basis, evidence supporting the amounts and disclosures in the financial statements.An audit also includes assessing the accounting principles used and significant estimates made by management, as well as evaluating the overall financial statement presentation.We believe that our audits provide a reasonable basis for our opinion.
In our opinion, the consolidated financial statements referred to above present fairly, in all material respects, the financial position of NewBridge Bancorp and Subsidiary as of December 31, 2011 and 2010, and the results of their operations and their cash flows for each of the three years in the period ended December 31, 2011 in conformity with accounting principles generally accepted in the United States of America.
We also have audited, in accordance with the standards of the Public Company Accounting Oversight Board (United States), NewBridge Bancorp and Subsidiary’s internal control over financial reporting as of December 31, 2011, based on criteria established inInternal Control—Integrated Framework issued by the Committee of Sponsoring Organizations of the Treadway Commission (COSO)and our report dated March 22, 2012, expressed an unqualified opinion.
/s/ GRANT THORNTON LLP
Raleigh, North Carolina
March 22, 2012
| C-2 |
NewBridge Bancorp and Subsidiary
December 31, 2011 and 2010
(Dollars in thousands, except per share data)
| 2011 | 2010 | |||||||
ASSETS | ||||||||
Cash and due from banks | $ | 27,629 | $ | 23,479 | ||||
Interest-bearing bank balances | 26,363 | 5,596 | ||||||
Loans held for sale | 7,851 | 76,994 | ||||||
Investment securities | 337,811 | 325,129 | ||||||
Loans | 1,200,070 | 1,260,585 | ||||||
Less allowance for credit losses | (28,844 | ) | (28,752 | ) | ||||
|
|
|
| |||||
Net Loans | 1,171,226 | 1,231,833 | ||||||
Premises and equipment, net | 36,225 | 38,442 | ||||||
Real estate acquired in settlement of loans | 30,587 | 26,718 | ||||||
Bank-owned life insurance | 43,727 | 30,317 | ||||||
Deferred tax assets | 32,263 | 29,819 | ||||||
Accrued income and other assets | 20,882 | 21,564 | ||||||
|
|
|
| |||||
Total assets | $ | 1,734,564 | $ | 1,809,891 | ||||
|
|
|
| |||||
LIABILITIES AND SHAREHOLDERS’ EQUITY | ||||||||
Deposits: | ||||||||
Noninterest-bearing | $ | 172,351 | $ | 161,734 | ||||
Savings, NOW and money market accounts Time deposits |
| 852,941 393,384 |
|
| 795,696 495,565 |
| ||
|
|
|
| |||||
Total deposits | 1,418,676 | 1,452,995 | ||||||
Borrowings from the Federal Home Loan Bank | 86,700 | 112,700 | ||||||
Other borrowings | 46,774 | 61,774 | ||||||
Accrued expenses and other liabilities | 19,027 | 16,504 | ||||||
|
|
|
| |||||
Total liabilities | 1,571,177 | 1,643,973 | ||||||
|
|
|
| |||||
Commitments and contingent liabilities Shareholders’ equity: | ||||||||
Preferred stock, par value $.01 per share; | ||||||||
Authorized – 10,000,000 shares; issued and outstanding (liquidation preference $1,000 per share) – 52,372 | 51,789 | 51,490 | ||||||
Common stock, par value $5.00 per share; | ||||||||
Authorized – 50,000,000 shares; issued and outstanding—15,655,868 | 78,279 | 78,279 | ||||||
Paid-in capital | 87,190 | 87,048 | ||||||
Directors’ deferred compensation plan Retained deficit |
| (575 (47,525 | ) ) |
| (618 (49,286 | ) ) | ||
Accumulated other comprehensive income (loss) | (5,771 | ) | (995 | ) | ||||
|
|
|
| |||||
Total shareholders’ equity | 163,387 | 165,918 | ||||||
|
|
|
| |||||
Total liabilities and shareholders’ equity | $ | 1,734,564 | $ | 1,809,891 | ||||
|
|
|
| |||||
See notes to consolidated financial statements
| C-3 |
NewBridge Bancorp and Subsidiary
Consolidated Statements of Income
Years ended December 31, 2011, 2010 and 2009
(Dollars in thousands, except per share data)
| 2011 | 2010 | 2009 | ||||||||||
Interest Income | ||||||||||||
Interest and fees on loans | $ | 65,871 | $ | 74,795 | $ | 84,089 | ||||||
Interest on taxable investment securities | 12,750 | 11,698 | 9,416 | |||||||||
Interest on tax exempt investment securities | 764 | 3,324 | 4,759 | |||||||||
Interest-bearing bank balances and federal funds sold | 60 | 96 | 236 | |||||||||
|
|
|
|
|
| |||||||
Total interest income | 79,445 | 89,913 | 98,500 | |||||||||
|
|
|
|
|
| |||||||
Interest Expense | ||||||||||||
Deposits | 9,493 | 14,960 | 31,891 | |||||||||
Borrowings from the Federal Home Loan Bank | 1,178 | 3,087 | 4,706 | |||||||||
Other borrowings | 1,648 | 2,407 | 2,559 | |||||||||
|
|
|
|
|
| |||||||
Total Interest Expense | 12,319 | 20,454 | 39,156 | |||||||||
|
|
|
|
|
| |||||||
Net Interest Income | 67,126 | 69,459 | 59,344 | |||||||||
Provision for credit losses | 16,785 | 21,252 | 35,749 | |||||||||
|
|
|
|
|
| |||||||
Net interest income after provision for credit losses | 50,341 | 48,207 | 23,595 | |||||||||
|
|
|
|
|
| |||||||
Noninterest Income | ||||||||||||
Retail banking | 9,925 | 11,592 | 14,159 | |||||||||
Wealth management services | 2,499 | 2,133 | 1,750 | |||||||||
Mortgage banking services | 1,728 | 2,438 | 674 | |||||||||
Gain on sales of investment securities | 2,026 | 3,637 | 389 | |||||||||
Writedowns and loss on sale of real estate acquired in settlement of loans | (5,238 | ) | (5,508 | ) | (1,294 | ) | ||||||
Bank-owned life insurance | 1,385 | 865 | 587 | |||||||||
Other | 830 | 658 | 2,209 | |||||||||
|
|
|
|
|
| |||||||
Total Noninterest Income | 13,155 | 15,815 | 18,474 | |||||||||
|
|
|
|
|
| |||||||
Noninterest Expense | ||||||||||||
Personnel | 28,806 | 29,897 | 30,901 | |||||||||
Occupancy | 3,987 | 4,189 | 5,436 | |||||||||
Furniture and equipment | 3,644 | 4,644 | 6,012 | |||||||||
Technology and data processing | 3,942 | 4,501 | 5,729 | |||||||||
Legal and professional | 2,892 | 3,028 | 3,463 | |||||||||
FDIC insurance | 2,399 | 3,491 | 4,528 | |||||||||
Real estate acquired in settlement of loans expense | 1,830 | 1,426 | 919 | |||||||||
Other operating | 9,869 | 9,713 | 11,855 | |||||||||
|
|
|
|
|
| |||||||
Total Noninterest Expense | 57,369 | 60,889 | 68,843 | |||||||||
|
|
|
|
|
| |||||||
Income (Loss) Before Income Taxes | 6,127 | 3,133 | (26,774 | ) | ||||||||
Income Tax Expense (Benefit) | 1,449 | (247 | ) | (11,641 | ) | |||||||
|
|
|
|
|
| |||||||
Net Income (Loss) | 4,678 | 3,380 | (15,133 | ) | ||||||||
Dividends and accretion on preferred stock | (2,917 | ) | (2,919 | ) | (2,917 | ) | ||||||
|
|
|
|
|
| |||||||
Net Income (Loss) available to common shareholders | $ | 1,761 | $ | 461 | $ | (18,050 | ) | |||||
|
|
|
|
|
| |||||||
Income (Loss) Per Share – Basic and Diluted | $ | 0.11 | $ | 0.03 | $ | (1.15 | ) | |||||
Weighted Average Shares Outstanding | ||||||||||||
Basic | 15,655,868 | 15,655,868 | 15,655,868 | |||||||||
Diluted | 16,573,064 | 16,097,680 | �� | 15,655,868 | ||||||||
See notes to consolidated financial statements
| C-4 |
NewBridge Bancorp and Subsidiary
Consolidated Statements of Changes in Shareholders’ Equity and Comprehensive Income
Years ended December 31, 2011, 2010 and 2009
(Dollars in thousands, except share data)
| Common Stock | ||||||||||||||||||||||||||||||||
| Preferred Stock | Shares | Amount | Paid-In Capital | Directors’ Deferred Comp Plan | Retained Earnings | Accumulated Other Comprehensive Income (Loss) | Total Shareholders’ Equity | |||||||||||||||||||||||||
Balances at December 31, 2008 | $ | 50,891 | 15,655,868 | $ | 78,279 | $ | 86,852 | $ | (650 | ) | $ | (31,697 | ) | $ | (1,709 | ) | $ | 181,966 | ||||||||||||||
Net Loss | (15,133 | ) | (15,133 | ) | ||||||||||||||||||||||||||||
Change in unrealized gain on securities available for sale (net of tax of $1,029) | 1,577 | 1,577 | ||||||||||||||||||||||||||||||
Change in funded status of pension plans (Net of tax of $919) | 1,409 | 1,409 | ||||||||||||||||||||||||||||||
Comprehensive loss | (12,147 | ) | ||||||||||||||||||||||||||||||
|
| |||||||||||||||||||||||||||||||
Dividends and accretion on preferred stock | 299 | (2,917 | ) | (2,618 | ) | |||||||||||||||||||||||||||
Stock-based compensation | 117 | 117 | ||||||||||||||||||||||||||||||
Common stock distributed | 16 | 16 | ||||||||||||||||||||||||||||||
|
|
|
|
|
|
|
|
|
|
|
|
|
|
|
| |||||||||||||||||
Balances at December 31, 2009 | $ | 51,190 | 15,655,868 | $ | 78,279 | $ | 86,969 | $ | (634 | ) | $ | (49,747 | ) | $ | 1,277 | $ | 167,334 | |||||||||||||||
Net Income | 3,380 | 3,380 | ||||||||||||||||||||||||||||||
Change in unrealized gain on securities available for sale (net of tax of $1,432) | (2,195 | ) | (2,195 | ) | ||||||||||||||||||||||||||||
Change in funded status of pension plans (Net of tax of $(50)) | (77 | ) | (77 | ) | ||||||||||||||||||||||||||||
|
| |||||||||||||||||||||||||||||||
Comprehensive income | 1,108 | |||||||||||||||||||||||||||||||
Dividends and accretion on preferred stock | 300 | (2,919 | ) | (2,619 | ) | |||||||||||||||||||||||||||
Stock-based compensation | 79 | 79 | ||||||||||||||||||||||||||||||
Common stock distributed | 16 | 16 | ||||||||||||||||||||||||||||||
|
|
|
|
|
|
|
|
|
|
|
|
|
|
|
| |||||||||||||||||
Balances at December 31, 2010 | $ | 51,490 | 15,655,868 | $ | 78,279 | $ | 87,048 | $ | (618 | ) | $ | (49,286 | ) | $ | (995 | ) | $ | 165,918 | ||||||||||||||
Net Income | 4,678 | 4,678 | ||||||||||||||||||||||||||||||
Change in unrealized gain on securities available for sale (net of tax of ($1,189)) | (1,821 | ) | (1,821 | ) | ||||||||||||||||||||||||||||
Change in funded status of pension plans (Net of tax of $(1,928)) | (2,955 | ) | (2,955 | ) | ||||||||||||||||||||||||||||
|
| |||||||||||||||||||||||||||||||
Comprehensive income | (98 | ) | ||||||||||||||||||||||||||||||
Dividends and accretion on preferred stock | 299 | (2,917 | ) | (2,618 | ) | |||||||||||||||||||||||||||
Stock-based compensation | 142 | 142 | ||||||||||||||||||||||||||||||
Common stock distributed | 43 | 43 | ||||||||||||||||||||||||||||||
|
|
|
|
|
|
|
|
|
|
|
|
|
|
|
| |||||||||||||||||
Balances at December 31, 2011 | $ | 51,789 | 15,655,868 | $ | 78,279 | $ | 87,190 | $ | (575 | ) | $ | (47,525 | ) | $ | (5,771 | ) | $ | 163,387 | ||||||||||||||
|
|
|
|
|
|
|
|
|
|
|
|
|
|
|
| |||||||||||||||||
See notes to consolidated financial statements
| C-5 |
NewBridge Bancorp and Subsidiary
Consolidated Statements of Cash Flows
Years ended December 31, 2011, 2010 and 2009
(Dollars in thousands)
| 2011 | 2010 | 2009 | ||||||||||
| CASH FLOW FROM OPERATING ACTIVITIES | ||||||||||||
Net Income (Loss) | $ | 4,678 | $ | 3,380 | $ | (15,133 | ) | |||||
Adjustments to reconcile net income (loss) to net cash provided by operating activities: | ||||||||||||
Depreciation and amortization | 3,769 | 5,500 | 6,669 | |||||||||
Securities premium amortization and discount accretion, net | 334 | 697 | 591 | |||||||||
(Gain) loss on sale of securities | (2,026 | ) | (3,637 | ) | (389 | ) | ||||||
Mortgage Banking Services | (1,728 | ) | (2,438 | ) | (674 | ) | ||||||
Originations of loans held for sale | (119,914 | ) | (195,602 | ) | (97,360 | ) | ||||||
Proceeds from sales of loans held for sale | 190,715 | 199,957 | 92,403 | |||||||||
(Increase) decrease in deferred tax assets | (2,444 | ) | (1,067 | ) | (4,158 | ) | ||||||
(Increase) decrease in income taxes receivable | 1,160 | 3,632 | (2,560 | ) | ||||||||
(Increase) decrease in interest earned but not received | 605 | 1,179 | 700 | |||||||||
Increase (decrease) in interest accrued but not paid | (328 | ) | (623 | ) | (1,470 | ) | ||||||
Write downs of real estate acquired in settlement of loans | 5,116 | 3,691 | 703 | |||||||||
Net (increase) decrease in other assets | 729 | 1,754 | (818 | ) | ||||||||
Net increase (decrease) in other liabilities | 2,852 | (687 | ) | (589 | ) | |||||||
Provision for credit losses | 16,785 | 21,252 | 35,749 | |||||||||
Stock-based compensation | 142 | 79 | 117 | |||||||||
Loss on sales of premises and equipment and real estate acquired in settlement of loans | 133 | 2,236 | 572 | |||||||||
|
|
|
|
|
| |||||||
Net cash provided by operating activities | 100,578 | 39,303 | 14,353 | |||||||||
|
|
|
|
|
| |||||||
| CASH FLOW FROM INVESTING ACTIVITIES | ||||||||||||
Purchases of securities available for sale | (164,292 | ) | (226,705 | ) | (108,828 | ) | ||||||
Proceeds from sales, maturities and calls of securities available for sale | 147,078 | 223,741 | 78,714 | |||||||||
Net (increase) decrease in loans | 20,737 | 73,606 | 83,853 | |||||||||
Purchase of bank-owned life insurance | (12,000 | ) | — | — | ||||||||
Purchases of premises and equipment and expenditures for improvements to real estate acquired in settlement of loans | (2,247 | ) | (2,296 | ) | (3,074 | ) | ||||||
Proceeds from sales of premises and equipment and real estate | ||||||||||||
Acquired in settlement of loans | 12,958 | 15,827 | 9,974 | |||||||||
Net (increase) decrease in federal funds sold | — | — | 42,043 | |||||||||
Net cash provided by (used in) investing activities | 2,234 | 84,173 | 102,682 | |||||||||
|
|
|
|
|
| |||||||
| CASH FLOW FROM FINANCING ACTIVITIES | ||||||||||||
Net increase in demand deposits, NOW, money market and savings accounts | 67,862 | 132,515 | 61,600 | |||||||||
Net (decrease) in time deposits | (102,182 | ) | (178,830 | ) | (225,753 | ) | ||||||
Net increase (decrease) in other borrowings | (15,000 | ) | (37,823 | ) | 22,543 | |||||||
Net increase (decrease) in borrowings from FHLB | (26,000 | ) | (52,500 | ) | 26,200 | |||||||
Dividends paid | (2,618 | ) | (2,619 | ) | (2,618 | ) | ||||||
Common stock distributed | 43 | 16 | 16 | |||||||||
Net cash provided by (used in) financing activities | (77,895 | ) | (139,241 | ) | (118,012 | ) | ||||||
|
|
|
|
|
| |||||||
Increase (decrease) in cash and cash equivalents | 24,917 | (15,765 | ) | (977 | ) | |||||||
Cash and cash equivalents at the beginning of the years | 29,075 | 44,840 | 45,817 | |||||||||
Cash and cash equivalents at the end of the years | $ | 53,992 | $ | 29,075 | $ | 44,840 | ||||||
| C-6 |
| 2011 | 2010 | 2009 | ||||||||||
| SUPPLEMENTAL DISCLOSURE OF CASH FLOW INFORMATION | ||||||||||||
Cash paid during the years for: | ||||||||||||
Interest | $ | 12,647 | $ | 21,077 | $ | 40,626 | ||||||
Income taxes | — | — | — | |||||||||
| SUPPLEMENTAL DISCLOSURE OF NONCASH TRANSACTIONS | ||||||||||||
Transfer of loans to real estate acquired in settlement of loans | $ | 20,656 | $ | 20,667 | $ | 26,216 | ||||||
Transfer of loans to loans held for sale | — | 72,343 | — | |||||||||
Reclassification of investment securities from held to maturity to available for sale | — | 43,679 | — | |||||||||
Unrealized gain on securities available for sale: | ||||||||||||
Change in securities available for sale | 3,010 | 5,099 | (5,308 | ) | ||||||||
Change in deferred income taxes | (1,189 | ) | (2,904 | ) | 3,731 | |||||||
Change in shareholders’ equity | (1,821 | ) | (2,195 | ) | 1,577 | |||||||
See notes to consolidated financial statements
| C-7 |
NewBridge Bancorp and Subsidiary
Notes to Consolidated Financial Statements
December 31, 2011, 2010, and 2009
Note 1 – Summary of significant accounting policies
Principles of consolidation
NewBridge Bancorp was formed in 2007 following the merger of FNB Southeast into LSB Bancshares. The accompanying consolidated financial statements include the accounts of NewBridge Bancorp (“Bancorp” or the “Company”) and its wholly owned subsidiary NewBridge Bank (the “Bank”). All significant intercompany balances and transactions have been eliminated in consolidation.
Nature of operations
The Bank provides a variety of financial services to individual and corporate clients in North Carolina (“NC”). As of December 31, 2011, the Bank operated 30 branches in the Piedmont Triad Region and Coastal Region of NC. The majority of the Bank’s clients are located in Davidson, Rockingham, Guilford, Forsyth and New Hanover Counties. The Bank’s primary deposit products are noninterest-bearing checking accounts, interest-bearing checking accounts, money market accounts, certificates of deposit and individual retirement accounts. Its primary lending products are commercial, real estate and consumer loans.
Use of estimates
The preparation of financial statements in conformity with accounting principles generally accepted in the United States (“GAAP”) requires management to make estimates and assumptions that affect the reported amounts of assets and liabilities and disclosure of contingent assets and liabilities at the date of the financial statements and the reported amounts of revenues and expenses during the reporting period. Actual results could differ from those estimates.
Material estimates that are particularly susceptible to significant change relate to the determination of the allowance for credit losses. A majority of the Bank’s loan portfolio consists of loans in the geographic areas cited above. The local economies of these areas depend heavily on the industrial, agricultural and service sectors. Accordingly, the ultimate collectibility of a large portion of the Bank’s loan portfolio would be affected by changes in local economic conditions.
Cash and cash equivalents
Cash and cash equivalents include cash and due from banks and interest-bearing bank deposits. Cash and cash equivalents are defined as cash and short-term investments with maturities of three months or less at the time of acquisition.
Investment securities
The Bank classifies its investment securities at the time of purchase into three categories as follows:
| • | Held to Maturity – reported at amortized cost, |
| • | Trading – reported at fair value with unrealized gains and losses included in earnings, or |
| • | Available for Sale – reported at fair value with unrealized gains and losses reported in other comprehensive income. |
The Bank is required to maintain certain levels of Federal Home Loan Bank (“FHLB”) of Atlanta stock based on various criteria established by the issuer. Gains and losses on sales of securities are recognized when realized on a specific identification basis. Premiums and discounts are amortized into interest income using methods that approximate the level yield method.
Other Than Temporary Impairment of Investment Securities
The Company’s policy regarding other than temporary impairment of investment securities requires continuous monitoring. Individual investment securities with a fair market value that is less than 80% of original cost over a continuous period of two quarters are evaluated for impairment during the subsequent quarter. The evaluation
| C-8 |
NewBridge Bancorp and Subsidiary
Notes to Consolidated Financial Statements
December 31, 2011, 2010, and 2009
Note 1 – Summary of significant accounting policies - (continued)
includes an assessment of both qualitative and quantitative measures to determine whether, in management’s judgment, the investment is likely to recover its original value. If the evaluation concludes that the investment is not likely to recover its original value, the unrealized loss is reported as an “other than temporary impairment”, and the loss is recorded as a securities transaction on the Consolidated Statement of Income.
Loans
Interest on loans is accrued and credited to income based on the principal amount outstanding. The accrual of interest on a loan is discontinued when, in management’s opinion, the borrower may be unable to meet payments as they become due. When interest accrual is discontinued, all unpaid accrued interest is reversed. Loans are placed on nonaccrual status when: (i) management has concerns relating to the ability to collect the loan principal and interest and (ii) generally when such loans are 90 days or more past due. Interest income is subsequently recognized only to the extent payments are received and the loan is well secured. Loans may be returned to accrual status when all principal and interest amounts contractually due are reasonably assured of repayment within an acceptable period of time, and there is a sustained period of repayment performance (generally a minimum of six months) of interest and principal by the borrower in accordance with the contractual terms. Loans held for sale are valued at the lower of cost or market as determined by outstanding commitments from investors or current investor yield requirements, calculated on the aggregate loan basis.
Loan origination fees and costs
Loan origination fees and certain direct origination costs are capitalized and recognized as an adjustment of the yield on the related loan.
Impaired loans
A loan is considered impaired, based on current information and events, if it is probable that the Bank will be unable to collect the scheduled payments of principal or interest when due according to the contractual terms of the loan agreement. Generally, a loan will be considered impaired if it exhibits the same level of underlying weakness and probability of loss as loans classified doubtful or loss.
The impairment evaluation compares the recorded book value of the loan, or loan relationship, to the present value of the expected future principal, interest and collateral value (if applicable) cash flows. The expected cash flows are discounted at the contractual interest rate for the individual note. A specific reserve is established if the present value of expected future cash flows, or fair value of collateral, is less than the recorded book value of the loan.
Allowance for credit losses
The Bank’s allowance for credit losses is based on management’s best estimate of probable loan losses incurred as of the balance sheet date. Factors impacting estimated probable loan losses include credit quality trends, past loan loss experience, current economic conditions, and loan volume among loan categories.
While management uses the best available information to establish the allowance for credit losses, future additions to the allowance may be necessary based on the factors cited above. In addition, the allowance is reviewed by regulatory agencies as an integral part of their examination processes. Such agencies may require the Company to recognize changes to the allowance based on their judgments about information available to them at the time of their examination.
| C-9 |
NewBridge Bancorp and Subsidiary
Notes to Consolidated Financial Statements
December 31, 2011, 2010, and 2009
Note 1 – Summary of significant accounting policies - (continued)
Real estate acquired in settlement of loans
Real estate acquired in settlement of loans, through partial or total satisfaction of loans, is initially recorded at fair market value, less estimated costs to sell, which becomes the property’s new basis. At the date of acquisition, losses are charged to the allowance for credit losses. Expenses to maintain the property are charged to expense in the period they are incurred. Subsequent writedowns and gains or losses on sales of foreclosed properties are offset to noninterest income in the period they are incurred.
Premises and equipment
Premises and equipment are stated at cost (or at fair value for premises and equipment acquired in business combinations) less accumulated depreciation and amortization. The provision for depreciation and amortization is computed principally by the straight-line method over the estimated useful lives of the assets. Useful lives are estimated at 20 to 40 years for buildings and three to ten years for equipment. Leasehold improvements are amortized over the expected terms of the respective leases or the estimated useful lives of the improvements, whichever is shorter. Expenditures for maintenance and repairs are charged to operations, and expenditures for major replacements and betterments are added to the premises and equipment accounts. The cost and accumulated depreciation of premises and equipment retired or sold are eliminated from the appropriate asset accounts at the time of retirement or sale and the resulting gain or loss is reflected in current operations.
Income taxes
Provisions for income taxes are based on taxes payable or refundable, for the current year (after exclusion of non-taxable income such as interest on state and municipal securities and bank owned life insurance and non-deductible expenses) and deferred taxes on temporary differences between the tax basis of assets and liabilities and their reported amounts in the financial statements at currently enacted income tax rates applicable to the period in which the deferred tax assets and liabilities are expected to be realized or settled. As changes in tax laws or rates are enacted, deferred tax assets and liabilities are adjusted through the provision for income taxes.
Per share data
Basic net income per share of common stock is computed by dividing net income available to common shareholders by the weighted average number of shares of common stock outstanding during each year. Diluted net income per share of common stock is computed by dividing net income available to common shareholders plus any adjustments to net income related to the issuance of dilutive potential common shares, comprised of outstanding options and/or warrants to purchase shares of common stock and restricted stock grants, by the weighted average number of shares of common stock outstanding during each year plus the number of dilutive potential common shares.
Sales of loans
Gains and losses on the sales of loans are accounted for by imputing gain or loss on those sales where a yield rate guaranteed to the buyer is more or less than the contract interest rate being collected. Such gains or losses are recognized in the financial statements at the time of the sale. Loans held for sale are recorded at the lower of cost or fair value, on an aggregate basis.
Off-balance sheet arrangements
In the ordinary course of business, the Bank enters into off-balance sheet financial instruments consisting of commitments to extend credit, commitments under credit card arrangements, commercial letters of credit and standby letters of credit. Such financial instruments are recorded in the financial statements when they are funded or related fees are incurred or received.
| C-10 |
NewBridge Bancorp and Subsidiary
Notes to Consolidated Financial Statements
December 31, 2011, 2010, and 2009
Note 1 – Summary of significant accounting policies - (continued)
Accumulated Other Comprehensive Income (Loss)
The balances of accumulated other comprehensive income, net of tax, at December 31, 2011 are $488,000 of unrealized gains on available for sale securities and $(6,259,000) for funded status of pension plans.
Segment information
Operating segments are components of an enterprise with separate financial information available for use by the chief operating decision maker to allocate resources and to assess performance. The Company has determined that it has one significant operating segment, providing financial services through the Bank, including banking, mortgage, and investment services, to customers located principally in Davidson, Rockingham, Guilford, Forsyth and New Hanover Counties in NC, and in the surrounding communities. The various products are those generally offered by community banks, and the allocation of resources is based on the overall performance of the Bank, rather than the individual branches or products.
There are no differences between the measurements used in reporting segment information and those used in the Company’s general-purpose financial statements.
Recent accounting pronouncements
In July 2010, the Financial Accounting Standards Board (“FASB”) issued Accounting Standards Update (“ASU”) No. 2010-20, Receivables (ASC 310) – “Disclosure about the Credit Quality of Financing Receivables and the Allowance for Credit Losses.” This ASU requires new disclosures and clarifies existing disclosure requirements about the nature of credit risk inherent in an entity’s loan portfolio; how that risk is analyzed and assessed in arriving at the allowance for loan losses; and the changes and reasons for those changes in the allowance for loan losses. The FASB’s objective is to improve these disclosures and, thus, increase the transparency in financial reporting, as well as clarify the requirements for existing disclosures. ASU 2010-20 is effective for interim and annual reporting periods ending on or after December 15, 2010. The disclosures about activity during a reporting period became effective for interim and annual reporting periods beginning on or after December 15, 2010. In January 2011, the FASB delayed the effective date of the portion of ASU 2010-20 related to troubled debt restructurings to June 2011. The Company adopted the required portions of ASU-2010-20 as of December 31, 2010, which only impacted disclosures. The Company adopted the remainder of ASU 2010-20 in 2011, and the adoption did not have a material impact on its financial condition or results of operations.
In April 2011, the FASB issued ASU 2011-02, Receivables (Topic 310) – A Creditor’s Determination of Whether a Restructuring Is a Troubled Debt Restructuring. This Update outlines the parameters of what constitutes a troubled debt restructuring, as well as clarifies the guidance on those parameters. The clarifying guidance is meant to eliminate current diversity in practice of identifying restructurings of receivables. This guidance becomes effective for the Company in the first interim period beginning after June 15, 2011. The Company applied the provisions retrospectively in its 2011 third quarter results back to activity beginning January 1, 2011. For those receivables that are newly considered impaired based on the newly adopted guidance, the amendments were applied prospectively. In addition, the Company disclosed those items deferred by ASU 2011-01, discussed above, in Note 4 in the Notes to Consolidated Financial Statements of this Annual Report on Form 10-K. The Company did not experience a material effect on its consolidated financial position or consolidated results of operations based on the new measurement parameters.
In May 2011, the FASB issued ASU 2011-04, Fair Value Measurement (Topic 820) – Amendments to Achieve Common Fair Value Measurement and Disclosure Requirements in U.S. GAAP and IFRSs. This Update will result in common fair value measurement and disclosure requirements in accounting principles generally accepted in the United States and international financial reporting standards through changes to wording used to describe and disclose information about fair value measurements, clarification about the application of existing requirements, and changes to particular principles for measuring fair value or for disclosing
| C-11 |
NewBridge Bancorp and Subsidiary
Notes to Consolidated Financial Statements
December 31, 2011, 2010, and 2009
Note 1 – Summary of significant accounting policies - (continued)
information about those measurements. This guidance becomes effective during the first interim period beginning after December 15, 2011. We do not expect a material effect on our consolidated financial position or consolidated results of operations based on the clarification about application or changes to principles from the new standard.
In June 2011, the FASB issued ASU 2011-05, Comprehensive Income (Topic 220) – Presentation of Comprehensive Income. This Update requires companies to present the total of comprehensive income, the components of net income, and the components of other comprehensive income either in a single continuous statement of comprehensive income or in two separate but consecutive statements. Presentation of comprehensive income in the statement of changes in stockholders’ equity will no longer be acceptable. The Update does not change the items that must be reported in other comprehensive income, when an item of other comprehensive income must be reclassified to net income, the option for an entity to present components of other comprehensive income net or before related tax effects, or how earnings per share is calculated or presented. This guidance becomes effective for fiscal years, and interim periods within those years, beginning after December 15, 2011. Early adoption is permitted. The Company currently presents other comprehensive income in its Consolidated Statements of Changes in Shareholders’ Equity and Comprehensive Income and plans to adopt the new disclosure requirements in its Quarterly Report on Form 10-Q for the first quarter 2012.
Reclassification
Certain items for 2010 and 2009 have been reclassified to conform to the 2011 presentation. Such reclassifications had no effect on net income, total assets or shareholders’ equity as previously reported.
Prior Period Adjustment
During the fourth quarter of 2011, the Company changed its methodology for calculating deferred income taxes related to premises and equipment. In doing so, management identified an error in the prior methodology used to calculate and record these deferred tax assets, and the related calculation of goodwill, dating back to the merger of its predecessor companies in 2007. Due to consistent application of this prior methodology, the error was carried forward in subsequent years. Following the writeoff of the Company's goodwill in 2008, subsequent financial reporting under-reported stockholders' equity by $2,730,000, or approximately 2%. Consistent with SEC Staff Accounting Bulletin ("SAB") No. 99,Materiality, and SAB No. 108,Considering the Effects of Prior Year Misstatements When Quantifying Misstatements in Current Year Financial Statements, management determined that the error did not result in a misstatement of material fact in any period, and has adjusted the Company's deferred tax assets and retained earnings for prior years in the accompanying consolidated financial statements.
Note 2 – Restriction on cash and due from banks
The Bank maintains required reserve balances with the Federal Reserve Bank of Richmond. The amounts of these reserve balances were $25,000 at both December 31, 2011 and 2010.
| C-12 |
NewBridge Bancorp and Subsidiary
Notes to Consolidated Financial Statements
December 31, 2011, 2010, and 2009
Note 3 – Investment securities
Investment securities at December 31 consist of the following (in thousands):
| Amortized Cost | Gross Unrealized Gains | Gross Unrealized Losses | Estimated Fair Value | |||||||||||||
2011: | ||||||||||||||||
U.S. government agency securities | $ | 39,000 | $ | 147 | $ | — | $ | 39,147 | ||||||||
Mortgage backed securities | 31,917 | 2,926 | — | 34,843 | ||||||||||||
Collateralized mortgage obligations | 23,599 | 168 | (332 | ) | 23,435 | |||||||||||
Commercial mortgage backed securities | 30,169 | 153 | (33 | ) | 30,289 | |||||||||||
Corporate bonds | 118,573 | 385 | (4,282 | ) | 114,676 | |||||||||||
Covered bonds | 61,414 | 1,243 | (131 | ) | 62,526 | |||||||||||
State and municipal obligations | 19,371 | 425 | (288 | ) | 19,508 | |||||||||||
|
|
|
|
|
|
|
| |||||||||
Total debt securities | 324,043 | 5,447 | (5,066 | ) | 324,424 | |||||||||||
Federal Home Loan Bank stock | 7,185 | — | — | 7,185 | ||||||||||||
Other equity securities | 5,775 | 427 | — | 6,202 | ||||||||||||
|
|
|
|
|
|
|
| |||||||||
Total investment securities | $ | 337,003 | $ | 5,874 | $ | (5,066 | ) | $ | 337,811 | |||||||
|
|
|
|
|
|
|
| |||||||||
2010: | ||||||||||||||||
U.S. government agency securities | $ | 109,274 | $ | 267 | $ | (2,017 | ) | $ | 107,524 | |||||||
Mortgage backed securities | 55,989 | 4,320 | — | 60,309 | ||||||||||||
Collateralized mortgage obligations | 39,679 | 823 | (90 | ) | 40,412 | |||||||||||
Corporate bonds | 38,560 | 507 | (612 | ) | 38,455 | |||||||||||
Covered bonds | 44,256 | 1,802 | — | 46,058 | ||||||||||||
State and municipal obligations | 17,380 | 13 | (1,982 | ) | 15,411 | |||||||||||
|
|
|
|
|
|
|
| |||||||||
Total debt securities | 305,138 | 7,732 | (4,701 | ) | 308,169 | |||||||||||
Federal Home Loan Bank stock | 10,399 | — | — | 10,399 | ||||||||||||
Other equity securities | 5,775 | 786 | — | 6,561 | ||||||||||||
|
|
|
|
|
|
|
| |||||||||
Total investment securities | $ | 321,312 | $ | 8,518 | $ | (4,701 | ) | $ | 325,129 | |||||||
|
|
|
|
|
|
|
| |||||||||
The aggregate cost of the Company’s investment in Federal Home Loan Bank stock totaled $7,185,000 at December 31, 2011. Because of the redemption provisions of this stock, the Company estimates that the fair value equals the cost of this investment and that it is not impaired.
The following table shows the Company’s investments’ gross unrealized losses and fair value, aggregated by investment category and length of time that the individual securities have been in a continuous unrealized loss position, at December 31, 2011 and 2010. The unrealized losses relate to debt securities that have incurred fair value reductions due to higher market interest rates since the securities were purchased. The unrealized losses are not likely to reverse unless and until market interest rates decline to the levels that existed when the securities were purchased. Since none of the unrealized losses are greater than 20% of the original cost of any individual investment and do not relate to the marketability of the securities or the issuer’s ability to honor redemption obligations, and the Company has the intent and ability to hold until recovery, none of the securities are deemed to be other than temporarily impaired.
| C-13 |
NewBridge Bancorp and Subsidiary
Notes to Consolidated Financial Statements
December 31, 2011, 2010, and 2009
Note 3 – Investment securities - (continued)
2011 | Less than 12 months | 12 months or more | Total | |||||||||||||||||||||
| Fair value | Unrealized losses | Fair value | Unrealized losses | Fair value | Unrealized losses | |||||||||||||||||||
| (In thousands) | ||||||||||||||||||||||||
Investment securities: | ||||||||||||||||||||||||
Collateralized mortgage obligations | $ | 8,520 | $ | (270 | ) | $ | 1,845 | $ | (62 | ) | $ | 10,365 | $ | (332 | ) | |||||||||
Commercial mortgage backed securities | 2,055 | (33 | ) | — | — | 2,055 | (33 | ) | ||||||||||||||||
Corporate bonds | 71,787 | (3,640 | ) | 4,342 | (642 | ) | 76,129 | (4,282 | ) | |||||||||||||||
Covered bonds | $ | 14,760 | (131 | ) | — | — | 14,760 | (131 | ) | |||||||||||||||
State and municipal obligations | — | — | 4,421 | (288 | ) | 4,421 | (288 | ) | ||||||||||||||||
|
|
|
|
|
|
|
|
|
|
|
| |||||||||||||
Total temporarily impaired securities | $ | 97,122 | $ | (4,074 | ) | $ | 10,608 | $ | (992 | ) | $ | 107,730 | $ | (5,066 | ) | |||||||||
|
|
|
|
|
|
|
|
|
|
|
| |||||||||||||
2010 | Less than 12 months | 12 months or more | Total | |||||||||||||||||||||
| Fair value | Unrealized losses | Fair value | Unrealized losses | Fair value | Unrealized losses | |||||||||||||||||||
| (In thousands) | ||||||||||||||||||||||||
Investment securities: | ||||||||||||||||||||||||
U.S. government agency securities | $ | 58,273 | $ | (2,017 | ) | $ | — | $ | — | $ | 58,273 | $ | (2,017 | ) | ||||||||||
Collateralized mortgage obligations | 3,706 | (90 | ) | — | — | 3,706 | (90 | ) | ||||||||||||||||
Corporate bonds | 28,023 | (612 | ) | — | — | 28,023 | (612 | ) | ||||||||||||||||
State and municipal obligations | 8,514 | (924 | ) | 5,059 | (1,058 | ) | 13,573 | (1,982 | ) | |||||||||||||||
|
|
|
|
|
|
|
|
|
|
|
| |||||||||||||
Total temporarily impaired securities | $ | 98,516 | $ | (3,643 | ) | $ | 5,059 | $ | (1,058 | ) | $ | 103,575 | $ | (4,701 | ) | |||||||||
|
|
|
|
|
|
|
|
|
|
|
| |||||||||||||
The amortized cost and estimated market value of debt securities at December 31, 2011, by contractual maturities, are shown in the accompanying schedule. Expected maturities may differ from contractual maturities because borrowers may have the right to call or prepay obligations with or without call or prepayment penalties (in thousands).
| Amortized Cost | Estimated Fair Value | |||||||
Due in one year or less | $ | 21,408 | $ | 21,834 | ||||
Due after one through five years | 116,238 | 113,719 | ||||||
Due after five through ten years | 84,030 | 84,047 | ||||||
Due after ten years | 102,367 | 104,824 | ||||||
|
|
|
| |||||
Total debt securities | $ | 324,043 | $ | 324,424 | ||||
|
|
|
| |||||
| C-14 |
NewBridge Bancorp and Subsidiary
Notes to Consolidated Financial Statements
December 31, 2011, 2010, and 2009
Note 3 – Investment securities - (continued)
A recap of the maturities of held to maturity securities follows (in thousands):
| Years Ended December 31 | ||||||||||||
| 2011 | 2010 | 2009 | ||||||||||
Proceeds from maturities | $ | — | $ | 1,480 | $ | — | ||||||
A recap of the maturities and sales of available for sale securities follows (in thousands):
| Years Ended December 31 | ||||||||||||
| 2011 | 2010 | 2009 | ||||||||||
Proceeds from sales and maturities | $ | 41,235 | $ | 85,785 | $ | 10,977 | ||||||
Gross realized gains | 2,026 | 3,637 | 389 | |||||||||
Gross realized losses | — | — | — | |||||||||
During 2011, the Company sold $39,209,000 of investments for a gain of $2,026,000. The investments sold by the Company consisted of shorter-duration, odd-lot mortgage backed securities and certain corporate bonds. Investment securities with a book value of $82,148,000 were sold during 2010, for a gain of $3,637,000, to reposition the investment portfolio and reduce the Company’s exposure to municipalities.
Investment securities with amortized costs of approximately $79,211,000 and $98,111,000 and market values of approximately $82,048,000 and $99,223,000 as of December 31, 2011 and 2010, respectively, were pledged to secure public deposits and for other purposes. The Bank has obtained $50,000,000 in letters of credit, which are used in lieu of securities to pledge against public deposits.
Note 4 – Loans
Loans are summarized as follows (in thousands):
| December 31 | ||||||||
| 2011 | 2010 | |||||||
Secured by owner-occupied nonfarm nonresidential properties | $ | 269,972 | $ | 222,889 | ||||
Secured by other nonfarm nonresidential properties | 157,594 | 159,086 | ||||||
Other commercial and industrial | 119,877 | 134,011 | ||||||
|
|
|
| |||||
Total Commercial | 547,443 | 515,986 | ||||||
Construction loans - 1 to 4 family residential | 7,781 | 16,736 | ||||||
Other construction and land development | 81,630 | 122,382 | ||||||
|
|
|
| |||||
Total Real estate - construction | 89,411 | 139,118 | ||||||
Closed-end loans secured by 1 to 4 family residential properties | 287,268 | 304,640 | ||||||
Lines of credit secured by 1 to 4 family residential properties | 209,634 | 219,557 | ||||||
Loans secured by 5 or more family residential | 25,883 | 20,207 | ||||||
|
|
|
| |||||
Total Real estate - mortgage | 522,785 | 544,404 | ||||||
Credit cards | 7,649 | 7,749 | ||||||
Other revolving credit plans | 9,444 | 9,042 | ||||||
Other consumer loans | 17,648 | 36,224 | ||||||
|
|
|
| |||||
Total Consumer | 34,741 | 53,015 | ||||||
Loans to other depository institutions | — | 3,800 | ||||||
All other loans | 5,690 | 4,262 | ||||||
|
|
|
| |||||
Total Other | 5,690 | 8,062 | ||||||
|
|
|
| |||||
Total loans | $ | 1,200,070 | $ | 1,260,585 | ||||
|
|
|
| |||||
| C-15 |
NewBridge Bancorp and Subsidiary
Notes to Consolidated Financial Statements
December 31, 2011, 2010, and 2009
Note 4 – Loans - (continued)
As of December 31, 2011 and December 31, 2010, loans totaling approximately $506,449,000 and $569,896,000, respectively, were pledged to secure the lines of credit with the FHLB and Federal Reserve Bank.
Nonperforming assets are summarized as follows (in thousands):
| December 31 | ||||||||
| 2011 | 2010 | |||||||
Commercial nonaccrual loans, not restructured | $ | 15,773 | $ | 23,453 | ||||
Commercial nonaccrual loans, restructured | 7,489 | 11,190 | ||||||
Non-commercial nonaccrual loans | 9,852 | 8,537 | ||||||
|
|
|
| |||||
Total nonaccrual loans | 33,114 | 43,180 | ||||||
Troubled debt restructured, accruing | 7,406 | 7,378 | ||||||
Accruing loans which are contractually past due 90 days or more | 14 | 27 | ||||||
|
|
|
| |||||
Total nonperforming loans | 40,534 | 50,585 | ||||||
Real estate acquired in settlement of loans | 30,587 | 26,718 | ||||||
|
|
|
| |||||
Total nonperforming assets | $ | 71,121 | $ | 77,303 | ||||
|
|
|
| |||||
Restructured loans, performing(1) | $ | 4,888 | $ | — | ||||
|
|
|
| |||||
| (1) | Loans restructured in a previous year without an interest rate concession or forgiveness of debt that are performing in accordance with their modified terms. |
Nonperforming assets include nonaccrual loans, accruing loans contractually past due 90 days or more, restructured loans, and real estate acquired in settlement of loans. Loans are placed on nonaccrual status when: (i) management has concerns relating to the ability to collect the loan principal and interest and (ii) generally when such loans are 90 days or more past due. No assurance can be given, however, that economic conditions will not adversely affect borrowers and result in increased credit losses.
Commitments to lend additional funds to borrowers whose loans have been restructured are not material at December 31, 2011 or 2010.
| C-16 |
NewBridge Bancorp and Subsidiary
Notes to Consolidated Financial Statements
December 31, 2011, 2010, and 2009
Note 4 – Loans - (continued)
The aging of loans is summarized in the following table (in thousands):
December 31, 2011 | 30-89 days | 90+ days | Nonaccrual | Total past due | Total loans | |||||||||||||||||||
| past due | past due | Loans | + nonaccrual | Current | receivable | |||||||||||||||||||
Secured by owner-occupied nonfarm nonresidential property | $ | 4,514 | $ | — | $ | 7,718 | $ | 12,232 | $ | 257,740 | $ | 269,972 | ||||||||||||
Secured by other nonfarm nonresidential property | 2,134 | — | 1,310 | 3,444 | 154,150 | 157,594 | ||||||||||||||||||
Other commercial and industrial | 1,199 | — | 437 | 1,636 | 118,241 | 119,877 | ||||||||||||||||||
|
|
|
|
|
|
|
|
|
|
|
| |||||||||||||
Total Commercial | 7,847 | — | 9,465 | 17,312 | 530,131 | 547,443 | ||||||||||||||||||
Construction loans – 1 to 4 family residential | 650 | — | 447 | 1,097 | 6,684 | 7,781 | ||||||||||||||||||
Other construction and land development | 2,776 | — | 9,016 | 11,792 | 69,838 | 81,630 | ||||||||||||||||||
|
|
|
|
|
|
|
|
|
|
|
| |||||||||||||
Total Real estate – construction | 3,426 | — | 9,463 | 12,889 | 76,522 | 89,411 | ||||||||||||||||||
Closed-end loans secured by 1 to 4 family residential property | 7,483 | — | 12,744 | 20,227 | 267,041 | 287,268 | ||||||||||||||||||
Lines of credit secured by 1 to 4 family residential property | 5,489 | — | 975 | 6,464 | 203,170 | 209,634 | ||||||||||||||||||
Loans secured by 5 or more family residential property | 3,852 | — | 302 | 4,154 | 21,729 | 25,883 | ||||||||||||||||||
|
|
|
|
|
|
|
|
|
|
|
| |||||||||||||
Total Real estate - mortgage | 16,824 | — | 14,021 | 30,845 | 491,940 | 522,785 | ||||||||||||||||||
Credit cards | 146 | 14 | — | 160 | 7,489 | 7,649 | ||||||||||||||||||
Other revolving credit plans | 339 | — | 125 | 464 | 8,980 | 9,444 | ||||||||||||||||||
Other consumer loans | 372 | — | 40 | 412 | 17,236 | 17,648 | ||||||||||||||||||
|
|
|
|
|
|
|
|
|
|
|
| |||||||||||||
Total Consumer | 857 | 14 | 165 | 1,036 | 33,705 | 34,741 | ||||||||||||||||||
Loans to other depository institutions | — | — | — | — | — | — | ||||||||||||||||||
All other loans | — | — | — | — | 5,690 | 5,690 | ||||||||||||||||||
|
|
|
|
|
|
|
|
|
|
|
| |||||||||||||
Total Other | — | — | — | — | 5,690 | 5,690 | ||||||||||||||||||
Total loans | $ | 28,954 | $ | 14 | $ | 33,114 | $ | 62,082 | $ | 1,137,988 | $ | 1,200,070 | ||||||||||||
|
|
|
|
|
|
|
|
|
|
|
| |||||||||||||
| C-17 |
NewBridge Bancorp and Subsidiary
Notes to Consolidated Financial Statements
December 31, 2011, 2010, and 2009
Note 4 – Loans - (continued)
December 31, 2010 | 30-89 days | 90+ days | Nonaccrual | Total past due | Total loans | |||||||||||||||||||
| Past due | Past due | Loans | + nonaccrual | Current | Receivable | |||||||||||||||||||
Secured by owner-occupied nonfarm nonresidential property | $ | 2,619 | $ | — | $ | 5,953 | $ | 8,572 | $ | 214,317 | $ | 222,889 | ||||||||||||
Secured by other nonfarm nonresidential property | 1,767 | — | 1,076 | 2,843 | 156,243 | 159,086 | ||||||||||||||||||
Other commercial and industrial | 2,641 | — | 1,875 | 4,516 | 129,495 | 134,011 | ||||||||||||||||||
|
|
|
|
|
|
|
|
|
|
|
| |||||||||||||
Total Commercial | 7,027 | — | 8,904 | 15,931 | 500,055 | 515,986 | ||||||||||||||||||
Construction loans – 1 to 4 family residential | 1,166 | — | 2,666 | 3,832 | 12,904 | 16,736 | ||||||||||||||||||
Other construction and land development | 3,354 | — | 13,925 | 17,279 | 105,103 | 122,382 | ||||||||||||||||||
|
|
|
|
|
|
|
|
|
|
|
| |||||||||||||
Total Real estate – construction | 4,520 | — | 16,591 | 21,111 | 118,007 | 139,118 | ||||||||||||||||||
Closed-end loans secured by 1 to 4 family residential property | 10,444 | — | 10,830 | 21,274 | 283,366 | 304,640 | ||||||||||||||||||
Lines of credit secured by 1 to 4 family residential property | 4,549 | — | 1,611 | 6,160 | 213,397 | 219,557 | ||||||||||||||||||
Loans secured by 5 or more family residential property | 147 | — | 1,004 | 1,151 | 19,056 | 20,207 | ||||||||||||||||||
|
|
|
|
|
|
|
|
|
|
|
| |||||||||||||
Total Real estate - mortgage | 15,140 | — | 13,445 | 28,585 | 515,189 | 544,404 | ||||||||||||||||||
Credit cards | 122 | 27 | — | 149 | 7,600 | 7,749 | ||||||||||||||||||
Other revolving credit plans | 226 | — | 11 | 237 | 8,805 | 9,042 | ||||||||||||||||||
Other consumer loans | 847 | — | 429 | 1,276 | 34,948 | 36,224 | ||||||||||||||||||
|
|
|
|
|
|
|
|
|
|
|
| |||||||||||||
Total Consumer | 1,195 | 27 | 440 | 1,662 | 51,353 | 53,015 | ||||||||||||||||||
Loans to other depository institutions | — | — | 3,800 | 3,800 | — | 3,800 | ||||||||||||||||||
All other loans | — | — | — | — | 4,262 | 4,262 | ||||||||||||||||||
|
|
|
|
|
|
|
|
|
|
|
| |||||||||||||
Total Other | — | — | 3,800 | 3,800 | 4,262 | 8,062 | ||||||||||||||||||
Total loans | $ | 27,882 | $ | 27 | $ | 43,180 | $ | 71,089 | $ | 1,189,496 | $ | 1,260,585 | ||||||||||||
|
|
|
|
|
|
|
|
|
|
|
| |||||||||||||
Loans specifically identified and evaluated for impairment totaled $32.6 million and $38.3 million at December 31, 2011 and December 31, 2010, respectively. Included in these balances were $14.9 million and $18.6 million, respectively, of loans classified as troubled debt restructurings (“TDRs”). A modification of a loan’s terms constitutes a TDR if the creditor grants a concession to the borrower for economic or legal reasons related to the borrower’s financial difficulties that it would not otherwise consider. For loans classified as TDRs, the Company further evaluates the loans as performing or nonperforming. Nonperforming TDRs originally classified as non-accrual are able to be reclassified as accruing if, subsequent to restructure, they experience six consecutive months of payment performance according to the restructured terms. Further, a TDR may be considered performing and subsequently removed from impaired status in years subsequent to the restructuring if it meets the following criteria:
| • | At the time of restructure, the loan was made at a market rate of interest; and |
| • | The loan has shown at least 6 consecutive months of payment performance in accordance with the restructured terms; and |
| • | The loan has been included in the TDR disclosures for at least one Annual Report on Form 10-K |
Modifications of terms for loans and their inclusion as TDRs are based on individual facts and circumstances. Loan modifications that are included as TDRs may involve either an increase or reduction of the interest rate,
| C-18 |
NewBridge Bancorp and Subsidiary
Notes to Consolidated Financial Statements
December 31, 2011, 2010, and 2009
Note 4 – Loans - (continued)
extension of the term of the loan, or deferral or forgiveness of principal payments, regardless of the period of the modification. The loans included in all loan classes as TDRs at December 31, 2011 had either an interest rate modification or a deferral of principal payments, which the Company considers are concessions. All loans designated as TDRs were modified due to financial difficulties experienced by the borrower. The Company has removed $4,888,000 of performing TDRs from impaired status in 2011 that were restructured in a prior year.
The Company monitors the performance of modified loans on an ongoing basis. Loans retain their accrual status at the time of their modification. As a result, if a loan is on non-accrual at the time it is modified, it stays as non-accrual, and if a loan is on accrual at the time of the modification, it generally stays on accrual. A modified loan will be reclassified to non-accrual if the loan becomes 90 days delinquent or other weaknesses are observed which make collection of principal and interest unlikely. A loan on non-accrual will be individually evaluated based on sustained adherence to the terms of the modification agreement for a minimum of six months prior to being reclassified to accrual status. TDRs are considered impaired.
The total number of loans that are TDRs and the total outstanding recorded investment in TDRs as of December 31 for the three years 2011, 2010, and 2009 are reflected in the table below (dollars in thousands):
2011 | 2010 | 2009 | ||||||||
Number | Outstanding | Number | Outstanding | Number | Outstanding | |||||
of | Recorded | of | Recorded | of | Recorded | |||||
Loans | Investment | Loans | Investment | Loans | Investment | |||||
|
|
|
|
| ||||||
59 | $19,783 | 46 | $18,568 | 7 | $3,218 | |||||
The Bank’s policy for impaired loan accounting subjects all loans to impairment recognition except for large groups of smaller balance homogeneous loans such as credit card, residential mortgage and consumer loans. The Bank generally considers loans 90 days or more past due and all nonaccrual loans to be impaired.
Impaired loans specifically evaluated for impairment and related information are summarized in the following tables (in thousands):
| Impaired Loans | Average | |||||||||||||||
| Recorded | Unpaid principal | Specific | Recorded | |||||||||||||
| Balance | Balance | Allowance | Investment | |||||||||||||
| December 31, 2011 | ||||||||||||||||
| Loans without a specific valuation allowance | ||||||||||||||||
| Commercial | $ | 2,722 | $ | 2,856 | $ | — | $ | 3,497 | ||||||||
| Real estate- construction | 6,874 | 8,571 | — | 8,655 | ||||||||||||
| Real estate – mortgage | 6,429 | 6,536 | — | 8,128 | ||||||||||||
| Consumer | — | — | — | 57 | ||||||||||||
| Total | 16,025 | 17,963 | — | 20,337 | ||||||||||||
| Loans with a specific valuation allowance | ||||||||||||||||
| Commercial | 8,014 | 8,329 | 1,972 | 4,251 | ||||||||||||
| Real estate- construction | 1,495 | 1,515 | 203 | 2,954 | ||||||||||||
| Real estate – mortgage | 6,940 | 7,240 | 1,874 | 7,472 | ||||||||||||
| Consumer | 117 | 117 | 117 | 86 | ||||||||||||
| Total | 16,566 | 17,201 | 4,166 | 14,763 | ||||||||||||
| Total impaired loans | ||||||||||||||||
| Commercial | 10,736 | 11,185 | 1,972 | 7,749 | ||||||||||||
| Real estate- construction | 8,369 | 10,086 | 203 | 11,608 | ||||||||||||
| Real estate – mortgage | 13,369 | 13,776 | 1,874 | 15,600 | ||||||||||||
| Consumer | 117 | 117 | 117 | 143 | ||||||||||||
| Total | $ | 32,591 | $ | 35,164 | $ | 4,166 | $ | 35,100 | ||||||||
| C-19 |
NewBridge Bancorp and Subsidiary
Notes to Consolidated Financial Statements
December 31, 2011, 2010, and 2009
Note 4 – Loans - (continued)
| Impaired Loans | ||||||||||||
| Recorded | Unpaid principal | Specific | ||||||||||
| Balance | Balance | Allowance | ||||||||||
| December 31, 2010(1) | ||||||||||||
| Loans without a specific valuation allowance | ||||||||||||
| Commercial | $ | 4,651 | $ | 5,437 | $ | — | ||||||
| Real estate- construction | 12,489 | 17,165 | — | |||||||||
| Real estate – mortgage | 6,633 | 7,676 | — | |||||||||
| Consumer | 112 | 112 | — | |||||||||
| Other | 3,800 | 10,000 | — | |||||||||
| Total | 27,685 | 40,390 | — | |||||||||
| Loans with a specific valuation allowance | ||||||||||||
| Commercial | 1,375 | 1,482 | 578 | |||||||||
| Real estate- construction | 1,606 | 2,577 | 251 | |||||||||
| Real estate – mortgage | 7,290 | 7,290 | 976 | |||||||||
| Consumer | 347 | 347 | 122 | |||||||||
| Other | — | — | — | |||||||||
| Total | 10,618 | 11,696 | 1,927 | |||||||||
| Total impaired loans | ||||||||||||
| Commercial | 6,026 | 6,919 | 578 | |||||||||
| Real estate- construction | 14,095 | 19,742 | 251 | |||||||||
| Real estate – mortgage | 13,923 | 14,966 | 976 | |||||||||
| Consumer | 459 | 459 | 122 | |||||||||
| Other | 3,800 | 10,000 | — | |||||||||
| Total | $ | 38,303 | $ | 52,086 | $ | 1,927 | ||||||
| (1) | Data for Average Recorded Investment for 2010 is not available. |
Impaired, nonperforming and other potential problem loans are summarized in the following table (in thousands):
| December 31 | ||||||||||||
| 2011 | 2010 | 2009 | ||||||||||
Loans identified as impaired | $ | 32,591 | $ | 38,303 | $ | 46,122 | ||||||
Other nonperforming loans | 7,943 | 12,282 | 12,107 | |||||||||
|
|
|
|
|
| |||||||
Total nonperforming loans | 40,534 | 50,585 | 58,229 | |||||||||
Other potential problem loans | 87,959 | 110,924 | 66,725 | |||||||||
|
|
|
|
|
| |||||||
Total nonperforming and other potential problem loans | $ | 128,493 | $ | 161,509 | $ | 124,954 | ||||||
|
|
|
|
|
| |||||||
Interest is not typically accrued on impaired loans, as they are normally in nonaccrual status. However, interest is accrued on performing TDRs, and interest may be accrued on nonperforming TDRs. Interest income on performing or nonperforming accruing TDRs is recognized consistent with any other accruing loan. When a loan goes into nonaccrual status, any accrued interest is reversed out of interest income. When a loan comes out of nonaccrual status, interest income is increased by the interest payments made during the period while in nonaccrual status based on the term/amortization o the underlying contract.
| C-20 |
NewBridge Bancorp and Subsidiary
Notes to Consolidated Financial Statements
December 31, 2011, 2010, and 2009
Note 4 – Loans - (continued)
The following table summarizes, by internally assigned risk grade, the risk grade for loans for which the Bank has assigned a risk grade (in thousands).
| December 31 | ||||||||||||||||||||||||||||||||||||||||
| 2011 | 2010 | |||||||||||||||||||||||||||||||||||||||
| Special | Sub- | Special | Sub- | |||||||||||||||||||||||||||||||||||||
| Pass | Mention | standard | Doubtful | Total | Pass | Mention | standard | Doubtful | Total | |||||||||||||||||||||||||||||||
Commercial | $ | 437,475 | $ | 56,172 | $ | 79,229 | $ | 301 | $ | 573,177 | $ | 423,474 | $ | 48,651 | $ | 75,682 | $ | 1,121 | $ | 548,928 | ||||||||||||||||||||
Real estate –construction | 35,622 | 14,304 | 23,667 | 757 | 74,350 | 66,766 | 13,673 | 47,319 | 630 | 128,388 | ||||||||||||||||||||||||||||||
Real estate – mortgage | 57,089 | 7,363 | 14,517 | 171 | 79,140 | 92,610 | 7,898 | 20,288 | 798 | 121,594 | ||||||||||||||||||||||||||||||
Consumer | — | — | — | — | — | 2 | — | — | — | 2 | ||||||||||||||||||||||||||||||
Other | 4,954 | — | — | — | 4,954 | 3,448 | — | 3,903 | — | 7,351 | ||||||||||||||||||||||||||||||
|
|
|
|
|
|
|
|
|
|
|
|
|
|
|
|
|
|
|
| |||||||||||||||||||||
Total | $ | 535,140 | $ | 77,839 | $ | 117,413 | $ | 1,229 | $ | 731,621 | $ | 586,300 | $ | 70,222 | $ | 147,192 | $ | 2,549 | $ | 806,263 | ||||||||||||||||||||
|
|
|
|
|
|
|
|
|
|
|
|
|
|
|
|
|
|
|
| |||||||||||||||||||||
The balance in the allowance for loan losses and the recorded investment in loans by portfolio segment and based on the impairment method for the years ended December 31, 2011 and 2010 were as follows:
| Real Estate - | Real Estate - | Total | ||||||||||||||||||||||
| Commercial | Construction | Mortgage | Consumer | Other | Loans | |||||||||||||||||||
2011 | ||||||||||||||||||||||||
Allowance for loan losses: | ||||||||||||||||||||||||
Specific reserves on impaired loans | $ | 1,972 | $ | 203 | $ | 1,874 | $ | 117 | $ | — | $ | 4,166 | ||||||||||||
General reserves | 6,554 | 6,264 | 10,079 | 1,749 | 32 | 24,678 | ||||||||||||||||||
|
|
|
|
|
|
|
|
|
|
|
| |||||||||||||
Total ending allowance | $ | 8,526 | $ | 6,467 | $ | 11,953 | $ | 1,866 | $ | 32 | $ | 28,844 | ||||||||||||
|
|
|
|
|
|
|
|
|
|
|
| |||||||||||||
| Real Estate - | Real Estate - | Total | ||||||||||||||||||||||
| Commercial | Construction | Mortgage | Consumer | Other | Loans | |||||||||||||||||||
2010 | ||||||||||||||||||||||||
Allowance for loan losses: | ||||||||||||||||||||||||
Specific reserves on impaired loans | $ | 578 | $ | 251 | $ | 976 | $ | 122 | $ | — | $ | 1,927 | ||||||||||||
General reserves | 9,374 | 6,614 | 8,080 | 2,705 | 52 | 26,825 | ||||||||||||||||||
|
|
|
|
|
|
|
|
|
|
|
| |||||||||||||
Total ending allowance | $ | 9,952 | $ | 6,865 | $ | 9,056 | $ | 2,827 | $ | 52 | $ | 28,752 | ||||||||||||
|
|
|
|
|
|
|
|
|
|
|
| |||||||||||||
Management follows a loan review program designed to evaluate the credit risk in its loan portfolio. Through this loan review process, the Bank maintains an internally classified watch list that helps management assess the overall quality of the loan portfolio and the adequacy of the allowance for credit losses. In establishing the appropriate classification for specific assets, management considers, among other factors, the estimated value of the underlying collateral, the borrower’s ability to repay, the borrower’s payment history and the current delinquent status. As a result of this process, certain loans are categorized as special mention, substandard, doubtful or loss as described below, and reserves are allocated based on management’s judgment and historical experience.
Special Mention - These loans have potential weaknesses, which may, if not corrected or reversed, weaken the bank's credit position at some future date. The loans may not show problems as yet due to the borrower(s)’ apparent ability to service the debt, but special circumstances surround the loans of which the bank and management should be aware. This category may also include loans where repayment has not been satisfactory, where constant attention is required to maintain a set repayment schedule, or where terms of a loan agreement have been violated but the borrower still appears to have sufficient financial strength to avoid a lower rating. It also includes new loans that significantly depart from established loan policy and loans to weak borrowers with a strong guarantor.
| C-21 |
NewBridge Bancorp and Subsidiary
Notes to Consolidated Financial Statements
December 31, 2011, 2010, and 2009
Note 4 – Loans - (continued)
Substandard - These are loans whose full final collectability may not appear to be a matter for serious doubt, but which nevertheless have a well-defined weakness or weaknesses that jeopardize the liquidation of the debt and require close supervision by management, such as unprofitable and/or undercapitalized businesses, inability to generate sufficient cash flow for debt reduction, deterioration of collateral and special problems arising from the particular condition of an industry. It also includes workout loans on a liquidation basis when a loss is not expected. Some of these loans are considered impaired.
Doubtful – These are loans that have all the weakness inherent in one graded Substandard with the added provision that the weaknesses make collection or liquidation in full, on the basis of currently existing facts, conditions, and value, highly questionable. In addition, the extent of the potential loss may not be currently determinable. Most of these loans are considered impaired.
The function of determining the allowance for credit losses is driven by the risk grade system and the loss experience on non risk graded homogeneous types of loans. The allowance for credit losses represents management’s estimate of the appropriate level of reserve to provide for probable losses inherent in the loan portfolio. In determining the allowance for credit losses and any resulting provision to be charged against earnings, particular emphasis is placed on the results of the loan review process. Consideration is also given to a review of individual loans, historical loan loss experience, the value and adequacy of collateral and economic conditions in the Bank’s market areas. For loans determined to be impaired, the impairment is based on discounted cash flows using the loan’s initial effective interest rate or the fair value of the collateral for certain collateral dependent loans. This evaluation is inherently subjective as it requires material estimates, including the amounts and timing of future cash flows expected to be received on impaired loans that may be susceptible to significant change. In addition, various regulatory agencies, as an integral part of their examination process, periodically review the Bank’s allowance for credit losses. Such agencies may require the Bank to recognize changes to the allowance based on their judgments about information available to them at the time of their examinations. Loans are charged off when in the opinion of management, they are deemed to be uncollectible. Recognized losses are charged against the allowance, and subsequent recoveries are added to the allowance.
Management believes the allowance for credit losses of $28.8 million at December 31, 2011 is adequate to cover probable losses in the loan portfolio; however, assessing the adequacy of the allowance is a process that requires continuous evaluation and considerable judgment. Management’s judgments are based on numerous assumptions about current events which it believes to be reasonable, but which may or may not be valid. Thus, there can be no assurance that credit losses in future periods will not exceed the current allowance or that future increases in the allowance will not be required. No assurance can be given that management’s ongoing evaluation of the loan portfolio in light of changing economic conditions and other relevant circumstances will not require significant future additions to the allowance, thus adversely affecting future operating results of the Bank.
Other potential problem loans. These are loans graded substandard, doubtful and loss which do not fit the criteria to be considered significant (total credit exposure of less than $500,000 and not evaluated on an individual basis for impairment). However, the Bank closely monitors such loans as a result of their elevated risk profile. The balance of these other potential problem loans decreased to $88.0 million at December 31, 2011 from $110.9 million at December 31, 2010. These loans, while exhibiting signs of weakness, continue to perform pursuant to stated terms and conditions and therefore do not have identified expected losses. Approximately 75% of the loans in this category are identified as commercial and industrial or income producing commercial real estate, which management assigns a lower probability of default and/or loss given default. The allowance for credit losses associated with such loans was $3.9 million at December 31, 2011, which was based on a model that uses probability of default, and expected loss in the event of default, to determine expected losses within a given group of loans.
| C-22 |
NewBridge Bancorp and Subsidiary
Notes to Consolidated Financial Statements
December 31, 2011, 2010, and 2009
Note 4 – Loans - (continued)
An analysis of the changes in the allowance for credit losses follows (in thousands):
| Years Ended December 31 | ||||||||||||
| 2011 | 2010 | 2009 | ||||||||||
Balance, beginning of year | $ | 28,752 | $ | 35,843 | $ | 35,805 | ||||||
Loans charged off: | ||||||||||||
Secured by owner-occupied nonfarm nonresidential properties | 1,131 | 1,433 | 3,108 | |||||||||
Secured by other nonfarm nonresidential properties | 956 | 1,767 | 4,425 | |||||||||
Other commercial and industrial | 2,958 | 5,852 | 3,699 | |||||||||
|
|
|
|
|
| |||||||
Total Commercial | 5,045 | 9,052 | 11,232 | |||||||||
Construction loans – 1 to 4 family residential | 209 | 526 | 2,055 | |||||||||
Other construction and land development | 3,776 | 4,853 | 10,172 | |||||||||
|
|
|
|
|
| |||||||
Total Real estate – construction | 3,985 | 5,379 | 12,227 | |||||||||
Closed-end loans secured by 1 to 4 family residential properties | 3,603 | 4,262 | 4,877 | |||||||||
Lines of credit secured by 1 to 4 family residential properties | 2,443 | 2,998 | 5,233 | |||||||||
Loans secured by 5 or more family residential properties | 776 | — | — | |||||||||
|
|
|
|
|
| |||||||
Total Real estate – mortgage | 6,822 | 7,260 | 10,110 | |||||||||
Credit cards | 101 | 291 | 276 | |||||||||
Other consumer loans | 1,257 | 2,538 | 4,649 | |||||||||
|
|
|
|
|
| |||||||
Total Consumer | 1,358 | 2,829 | 4,925 | |||||||||
Total Other | 1,387 | 6,200 | — | |||||||||
|
|
|
|
|
| |||||||
Total chargeoffs | 18,597 | 30,720 | 38,494 | |||||||||
Recoveries of loans previously charged off: | ||||||||||||
Total Commercial | 495 | 1,370 | 605 | |||||||||
Total Real estate – construction | 534 | 80 | 588 | |||||||||
Total Real estate – mortgage | 443 | 270 | 514 | |||||||||
Total Consumer | 362 | 647 | 1,076 | |||||||||
Total Other | 70 | 10 | — | |||||||||
|
|
|
|
|
| |||||||
Total Recoveries | 1,904 | 2,377 | 2,783 | |||||||||
|
|
|
|
|
| |||||||
Net loans charged off | 16,693 | 28,343 | 35,711 | |||||||||
Provision for credit losses | 16,785 | 21,252 | 35,749 | |||||||||
|
|
|
|
|
| |||||||
Balance, end of year | $ | 28,844 | $ | 28,752 | $ | 35,843 | ||||||
|
|
|
|
|
| |||||||
| C-23 |
NewBridge Bancorp and Subsidiary
Notes to Consolidated Financial Statements
December 31, 2011, 2010, and 2009
Note 4 – Loans - (continued)
| Quarters Ended December 31 | ||||||||||||
| 2011 | 2010 | 2009 | ||||||||||
Balance, beginning of year | $ | 27,750 | $ | 35,554 | $ | 38,902 | ||||||
Loans charged off: | ||||||||||||
Secured by owner-occupied nonfarm nonresidential properties | 615 | 295 | 306 | |||||||||
Secured by other nonfarm nonresidential properties | 190 | 79 | 108 | |||||||||
Other commercial and industrial | 779 | 1,451 | 732 | |||||||||
|
|
|
|
|
| |||||||
Total Commercial | 1,584 | 1,825 | 1,146 | |||||||||
Construction loans – 1 to 4 family residential | — | 22 | 810 | |||||||||
Other construction and land development | 559 | 2,182 | 4,769 | |||||||||
|
|
|
|
|
| |||||||
Total Real estate – construction | 559 | 2,204 | 5,579 | |||||||||
Closed-end loans secured by 1 to 4 family residential properties | 398 | 1,324 | 1,608 | |||||||||
Lines of credit secured by 1 to 4 family residential properties | 623 | 575 | 500 | |||||||||
Loans secured by 5 or more family residential properties | 200 | — | — | |||||||||
|
|
|
|
|
| |||||||
Total Real estate – mortgage | 1,221 | 1,899 | 2,108 | |||||||||
Credit cards | 49 | 60 | 9 | |||||||||
Other consumer loans | 201 | 475 | 864 | |||||||||
|
|
|
|
|
| |||||||
Total Consumer | 250 | 535 | 873 | |||||||||
Total Other | 87 | 6,200 | — | |||||||||
|
|
|
|
|
| |||||||
Total chargeoffs | 3,701 | 12,663 | 9,706 | |||||||||
Recoveries of loans previously charged off: | ||||||||||||
Total Commercial | 283 | 1,066 | 332 | |||||||||
Total Real estate – construction | 193 | 31 | 168 | |||||||||
Total Real estate – mortgage | — | 46 | 230 | |||||||||
Total Consumer | 34 | 71 | 347 | |||||||||
Total Other | 39 | 11 | — | |||||||||
|
|
|
|
|
| |||||||
Total Recoveries | 549 | 1,225 | 1,077 | |||||||||
|
|
|
|
|
| |||||||
Net loans charged off | 3,152 | 11,438 | 8,629 | |||||||||
Provision for credit losses | 4,246 | 4,636 | 5,570 | |||||||||
|
|
|
|
|
| |||||||
Balance, end of year | $ | 28,844 | $ | 28,752 | $ | 35,843 | ||||||
|
|
|
|
|
| |||||||
| C-24 |
NewBridge Bancorp and Subsidiary
Notes to Consolidated Financial Statements
December 31, 2011, 2010, and 2009
Note 5 – Premises and equipment
The following is a summary of premises and equipment (in thousands):
| December 31 | ||||||||
| 2011 | 2010 | |||||||
Land | $ | 13,684 | $ | 15,312 | ||||
Buildings | 21,990 | 21,721 | ||||||
Equipment | 25,374 | 27,866 | ||||||
Leasehold improvements | 1,830 | 1,831 | ||||||
|
|
|
| |||||
Premises and equipment, total cost | 62,878 | 66,730 | ||||||
Less, accumulated depreciation | 26,653 | 28,288 | ||||||
|
|
|
| |||||
Premises and equipment, net | $ | 36,225 | $ | 38,442 | ||||
|
|
|
| |||||
Depreciation and amortization expense amounting to $3,044,000, $3,792,000 and $4,630,000, for the years ended December 31, 2011, 2010, and 2009, respectively, is included in occupancy expense and furniture and equipment expense in the consolidated statements of income.
Note 6 – Deposits
The aggregate amount of certificates of deposit of $100,000 or more was approximately $169,768,000 and $247,154,000 at December 31, 2011 and 2010, respectively. The accompanying table presents the scheduled maturities of total time deposits at December 31, 2011 (in thousands).
Years ending December 31, | ||||
2012 | $ | 342,005 | ||
2013 | 20,095 | |||
2014 | 23,702 | |||
2015 | 7,140 | |||
2016 | 340 | |||
Thereafter | 102 | |||
|
| |||
Total time deposits | $ | 393,384 | ||
|
| |||
| C-25 |
NewBridge Bancorp and Subsidiary
Notes to Consolidated Financial Statements
December 31, 2011, 2010, and 2009
Note 7 – Short-term borrowings and long-term debt
The following is a schedule of short-term borrowings and long-term debt (in thousands, except percentages):
| Balance as of December 31 | Interest Rate as of December 31 | Average Balance | Average Interest Rate | Maximum Outstanding at Any Month End | ||||||||||||||||
2011 | ||||||||||||||||||||
Federal funds purchased and repurchase agreements | $ | 21,000 | 4.03 | % | $ | 28,414 | 4.19 | % | $ | 36,000 | ||||||||||
Federal Reserve Bank borrowings | — | N/A | 27 | 0.75 | % | — | ||||||||||||||
Trust preferred securities | 25,774 | 1.79 | % | 25,774 | 1.79 | % | 25,774 | |||||||||||||
FHLB borrowings | 86,700 | 1.26 | % | 87,720 | 1.34 | % | 137,500 | |||||||||||||
|
|
|
|
|
| |||||||||||||||
Total | $ | 133,474 | $ | 141,935 | $ | 199,274 | ||||||||||||||
|
|
|
|
|
| |||||||||||||||
2010 | ||||||||||||||||||||
Federal funds purchased and repurchase agreements | $ | 36,000 | 4.19 | % | $ | 45,933 | 4.16 | % | $ | 46,000 | ||||||||||
Federal Reserve Bank borrowings | — | N/A | 4,708 | 0.56 | % | 26,500 | ||||||||||||||
Trust preferred securities | 25,774 | 1.77 | % | 25,774 | 1.83 | % | 25,774 | |||||||||||||
FHLB borrowings | 112,700 | 1.53 | % | 123,015 | 2.51 | % | 162,700 | |||||||||||||
|
|
|
|
|
| |||||||||||||||
Total | $ | 174,474 | $ | 199,430 | $ | 260,974 | ||||||||||||||
|
|
|
|
|
| |||||||||||||||
At December 31, 2011, the Bank had a $346,128,000 line of credit with the FHLB under which $136,700,000 was used. The amounts used consist of $86,700,000 in regular FHLB advances and a $50,000,000 letter of credit which the Bank uses as collateral securing deposits from municipalities. This line of credit is secured with FHLB stock, certain pledged securities and a blanket floating lien on qualifying 1 to 4 family residential mortgage loans, home equity loans and commercial real estate loans. Based upon collateral pledged, as of December 31, 2011, the borrowing capacity under this line was $254,391,000, with $117,691,000 available to be borrowed. In addition to the credit line at the FHLB, the Bank has borrowing capacity at the Federal Reserve Bank totaling $20,427,000, and has federal funds lines of $15.0 million, of which there were no borrowings outstanding at December 31, 2011.
Federal funds purchased represent unsecured overnight borrowings from other financial institutions by the Bank. Retail repurchase agreements represent short-term borrowings by the Bank, with overnight maturities collateralized by securities issued by the United States Government or its agencies.
The Bank sold securities under an agreement to repurchase (a “wholesale repurchase agreement”) in 2006. This $21,000,000 transaction has a maturity date in 2016, became callable after one year, and has quarterly calls thereafter at a fixed rate of 4.03%. The investment securities serving as collateral for this borrowing had a market value of approximately $23,772,000 at December 31, 2011. In 2007, the Bank entered into a $15,000,000 wholesale repurchase agreement, which was repaid in June, 2011.
FNB Financial Services Capital Trust I, a Delaware statutory trust (the “Trust,” wholly owned by the Company), issued and sold in a private placement, on August 26, 2005, $25,000,000 of the Trust’s floating rate preferred securities, with a liquidation amount of $1,000 per preferred security, bearing a variable rate of interest per annum, reset quarterly, equal to 3 month LIBOR plus 1.46% (the “Preferred Securities”) and a maturity date of September 30, 2035. The Preferred Securities became callable after five years. Interest payment dates are March 30, June 30, September 30 and December 31 of each year. The Preferred Securities are fully and unconditionally guaranteed on a subordinated basis by the Company with respect to distributions and amounts payable upon liquidation, redemption or repayment. The entire proceeds from the sale by the Trust to the holders of the Preferred Securities was combined with the entire proceeds from the sale by the Trust to the Company of its common securities (the “Common Securities”), and was used by the Trust to
| C-26 |
NewBridge Bancorp and Subsidiary
Notes to Consolidated Financial Statements
December 31, 2011, 2010, and 2009
Note 7 – Short-term borrowings and long-term debt - (continued)
purchase $25,774,000 in principal amount of the Floating Rate Junior Subordinated Notes (the “Junior Subordinated Notes”) of the Company. The Company has not included the Trust in the consolidated financial statements. Currently, regulatory capital rules allow trust preferred securities to be included as a component of regulatory capital for the Company.
The following is a schedule of the components of other borrowings (in thousands):
| 2011 | 2010 | |||||||
Wholesale repurchase agreements | $ | 21,000 | $ | 36,000 | ||||
Junior subordinated notes | 25,774 | 25,774 | ||||||
|
|
|
| |||||
Total | $ | 46,774 | $ | 61,774 | ||||
|
|
|
| |||||
The maturities of short-term borrowings and long-term debt at December 31, 2011, is as follows (in thousands):
Years Ending December 31 | ||||
2012 | $ | 51,700 | ||
2013 | 15,000 | |||
2014 | 20,000 | |||
2015 | — | |||
2016 | 21,000 | |||
Thereafter | 25,774 | |||
|
| |||
Total maturities of short-term borrowings and long-term debt | $ | 133,474 | ||
|
| |||
Note 8 – Other assets and other liabilities
The components of other assets and liabilities for the years ended December 31 are as follows (in thousands):
| 2011 | 2010 | |||||||
Other assets: | ||||||||
Core deposit intangible | �� | $ | 3,800 | $ | 4,526 | |||
Accrued interest receivable | 6,530 | 7,134 | ||||||
Assets held in trusts for deferred compensation | 4,051 | 4,080 | ||||||
Other | 6,501 | 5,824 | ||||||
|
|
|
| |||||
Total | $ | 20,882 | $ | 21,564 | ||||
|
|
|
| |||||
Other liabilities: | ||||||||
Accrued interest payable | 583 | 911 | ||||||
Accrued compensation | 793 | 1,009 | ||||||
Dividends payable | 335 | 405 | ||||||
Retirement plans and deferred compensation | 14,677 | 11,055 | ||||||
Other | 2,639 | 3,124 | ||||||
|
|
|
| |||||
Total | $ | 19,027 | $ | 16,504 | ||||
|
|
|
| |||||
| C-27 |
NewBridge Bancorp and Subsidiary
Notes to Consolidated Financial Statements
December 31, 2011, 2010, and 2009
Note 9 – Income taxes
The components of income tax expense (benefit) for the years ended December 31 are as follows (in thousands):
| 2011 | 2010 | 2009 | ||||||||||
Current tax (benefit) expense | ||||||||||||
Federal | $ | 135 | $ | 78 | $ | (4,808) | ||||||
State | (132) | (50) | (613) | |||||||||
|
|
|
|
|
| |||||||
Total current | 3 | 28 | (5,421) | |||||||||
|
|
|
|
|
| |||||||
Deferred tax (benefit) expense | ||||||||||||
Federal | 1,168 | (359) | (5,133) | |||||||||
State | 278 | 84 | (1,087) | |||||||||
|
|
|
|
|
| |||||||
Total deferred | 1,446 | (275) | (6,220) | |||||||||
|
|
|
|
|
| |||||||
Total income tax (benefit) expense | $ | 1,449 | $ | (247) | $ | (11,641) | ||||||
|
|
|
|
|
| |||||||
The significant components of deferred tax assets at December 31 are as follows (in thousands):
| 2011 | 2010 | |||||||
Deferred tax assets: | ||||||||
Allowance for credit losses | $ | 11,411 | $ | 11,371 | ||||
Non-qualified deferred compensation plans | 2,175 | 2,020 | ||||||
Accrued compensation | 316 | 286 | ||||||
Writedowns on real estate acquired in settlement of loans | 1,992 | 2,121 | ||||||
| Interest on nonaccrual loans | 1,551 | 1,278 | ||||||
| Net operating losses | 16,753 | 17,608 | ||||||
Pension plans – Other comprehensive income | 4,084 | 2,156 | ||||||
Contribution carryforward | 1,019 | 966 | ||||||
Other | 1,043 | 2,554 | ||||||
Valuation allowance | (1,037 | ) | (809 | ) | ||||
Total | 39,307 | 39,551 | ||||||
|
|
|
| |||||
Deferred tax liabilities: | ||||||||
Depreciable basis of property and equipment | 2,431 | 2,868 | ||||||
Deferred loan fees | 414 | 395 | ||||||
Net unrealized gain on available for sale securities | 319 | 2,284 | ||||||
Other | 3,880 | 4,185 | ||||||
Total | 7,044 | 9,732 | ||||||
|
|
|
| |||||
Net deferred tax assets | $ | 32,263 | $ | 29,819 | ||||
Management has evaluated the realizability of the recorded deferred tax assets at December 31, 2011. This evaluation included a review of recent improving trends and expected near term levels in the net interest margin, nonperforming assets, operating expenses and other factors. It also included a current forecast of performance for 2012 as well as projections for several years based on management’s expectations of performance, adjusted to assume a continuation of credit quality issues and future net interest margin erosion. It further included the consideration of the items that have given rise to the deferred tax assets, as well as tax planning strategies. Management has concluded that, with the exception of a portion of contribution carryforwards which begin expiring in 2013, and a portion of state economic loss carryforwards, it is more likely than not that the deferred taxes will be realized and therefore, no valuation allowance is necessary, except for those contribution and loss carryforwards.
| C-28 |
NewBridge Bancorp and Subsidiary
Notes to Consolidated Financial Statements
December 31, 2011, 2010, and 2009
Note 9 – Income taxes-(continued)
Federal net operating loss carryforwards of $4,535,000, $27,601,000 and $10,278,000 expire in 2028, 2029, and 2030 respectively. State net economic loss carryforwards of $1,282,000, $10,081,000, $21,420,000. $7,134,000 and $2,626,000 expire in 2022 through 2026, respectively.
The provision for income taxes differs from that computed by applying the federal statutory rate of 35% as indicated in the following analysis (in thousands, except percentages):
| 2011 | 2010 | 2009 | ||||||||||
Tax based on statutory rates | $ | 2,144 | $ | 1,097 | $ | (9,371) | ||||||
Increase (decrease) resulting from: | ||||||||||||
Effect of tax-exempt income | (306) | (1,155) | (1,570) | |||||||||
State income taxes, net of federal benefit | 80 | 22 | (1,105) | |||||||||
Income on bank-owned life insurance | (484) | (303) | (205) | |||||||||
Other, net | 15 | 92 | 610 | |||||||||
|
|
|
|
|
| |||||||
Total provision (benefit) for income taxes | $ | 1,449 | $ | (247) | $ | (11,641) | ||||||
|
|
|
|
|
| |||||||
Effective tax rate | 23.6% | (7.9%) | (43.5%) | |||||||||
|
|
|
|
|
| |||||||
The Company’s federal income tax returns through 2009 have been examined and settled. The state income tax returns through 2009 are currently under examination, and the Company does not expect any significant adjustments. The Company does not have any material uncertain tax positions.
Note 10 – Lease commitments
The minimum annual lease commitments under noncancelable operating leases in effect at December 31, 2011, are as follows (in thousands):
Years Ending December 31 | ||||
2012 | $ | 1,643 | ||
2013 | 1,380 | |||
2014 | 1,028 | |||
2015 | 768 | |||
2016 | 490 | |||
Thereafter | 143 | |||
|
| |||
Total lease commitments | $ | 5,452 | ||
|
| |||
Payments under these leases amounted to approximately $1,676,000, $1,863,000 and $2,671,000 for the years ended December 31, 2011, 2010, and 2009, respectively.
| C-29 |
NewBridge Bancorp and Subsidiary
Notes to Consolidated Financial Statements
December 31, 2011, 2010, and 2009
Note 11 – Related party transactions
The Bank had loans outstanding to officers and directors and their affiliated entities during each of the past two years. Such loans were made substantially on the same terms, including interest rates and collateral, as those prevailing at the time for comparable transactions with other borrowers, and, at the time that they were made, did not involve more than the normal risks of collectibility. The following table summarizes the transactions for the past two years (in thousands):
| 2011 | 2010 | |||||||
Balance, beginning of year | $ | 8,751 | $ | 10,229 | ||||
Amounts removed as a result of director resignations | (142 | ) | — | |||||
Advances (repayments), net, during year | 800 | (1,478 | ) | |||||
|
|
|
| |||||
Balance, end of year | $ | 9,409 | $ | 8,751 | ||||
|
|
|
| |||||
Note 12 – Other operating expenses
The components of other operating expense for the years ended December 31, 2011, 2010 and 2009 are as follows (in thousands):
| Years Ended December 31 | ||||||||||||
| 2011 | 2010 | 2009 | ||||||||||
Other operating expenses: | ||||||||||||
Advertising | $ | 1,526 | $ | 1,594 | $ | 1,428 | ||||||
Bankcard expense | 621 | 567 | 2,293 | |||||||||
Postage | 750 | 964 | 873 | |||||||||
Stationery, printing and supplies | 492 | 675 | 590 | |||||||||
Telephone | 669 | 723 | 681 | |||||||||
Travel, dues and subscriptions | 725 | 834 | 784 | |||||||||
Directors’ fees | 599 | 507 | 593 | |||||||||
Franchise and privilege taxes | 530 | 509 | 496 | |||||||||
Deposit premium amortization | 726 | 726 | 726 | |||||||||
Other expense | 3,231 | 2,614 | 3,391 | |||||||||
|
|
|
|
|
| |||||||
Total | $ | 9,869 | $ | 9,713 | $ | 11,855 | ||||||
|
|
|
|
|
| |||||||
Note 13 – Stock based compensation
The Company recorded $142,000 of total stock-based compensation expense during 2011, compared to $79,000 in 2010 and $117,000 in 2009, or less than $0.01 per diluted share in each year. The stock-based compensation expense is calculated on a ratable basis over the vesting periods of the related stock options or restricted stock units. This expense had no impact on the Company’s reported cash flows. The stock-based compensation expense is reported under personnel expense in the consolidated statements of income.
To determine the amounts recorded in the financial statements, the fair value of each stock option is estimated on the date of the grant using the Black-Scholes option-pricing model. For restricted stock units, the fair value is considered to be the market price on the date the restricted stock unit is granted.
As of December 31, 2011, there was $378,000 of total unrecognized compensation expense related to stock options and restricted stock units. This expense will be fully amortized by January 31, 2015.
As of December 31, 2011, 98,094 restricted stock units granted to certain senior officers were outstanding. For 88,094 of these restricted stock units, the fair value of each of the restricted stock units is $5.15, and for 10,000 of these restricted stock units, the fair value of each of the restricted stock units is $2.18, which was the closing price of the Company’s common stock on the dates they were granted. The stock-based compensation expense for these awards was immaterial for the period ended December 31, 2011, 2010 and 2009.
| C-30 |
NewBridge Bancorp and Subsidiary
Notes to Consolidated Financial Statements
December 31, 2011, 2010, and 2009
Note 13 – Stock based compensation - (continued)
As of December 31, 2011, the Company’s Compensation Committee administered the Company’s five stock-based compensation plans, each of which was approved by the shareholders.
Three of these plans have expired, and while there are options outstanding that have not yet expired, no new awards may be granted thereunder. One of the active plans, which will expire in 2014, has 750,000 shares of common stock authorized for issuance to plan participants in the form of stock options, restricted stock, restricted stock units, performance units and other stock-based awards. The other active plan, which will expire in 2016, has 535,000 shares of common stock authorized for issuance to plan participants in the form of stock options, rights to receive restricted shares of common stock and/or performance units. At December 31, 2011, a total of 998,806 shares were available for future grants under these two plans.
The following is a summary of stock option activity and related information for the years ended December 31:
| 2011 | 2010 | 2009 | ||||||||||||||||||||||
| Options | Weighted Average Exercise Price | Options | Weighted Average Exercise Price | Options | Weighted Average Exercise Price | |||||||||||||||||||
Outstanding - | ||||||||||||||||||||||||
Beginning of year | 821,767 | $ | 14.23 | 896,991 | $ | 14.45 | 1,052,517 | $ | 14.32 | |||||||||||||||
Granted | — | — | — | — | — | — | ||||||||||||||||||
Exercised | — | — | — | — | — | — | ||||||||||||||||||
Forfeited | (163,302 | ) | 12.14 | (75,224 | ) | 16.33 | (155,526 | ) | 13.55 | |||||||||||||||
|
|
|
|
|
| |||||||||||||||||||
Outstanding – | ||||||||||||||||||||||||
End of year | 658,465 | $ | 14.82 | 821,767 | $ | 14.23 | 896,991 | $ | 14.45 | |||||||||||||||
|
|
|
|
|
| |||||||||||||||||||
Exercisable – | ||||||||||||||||||||||||
End of year | 654,465 | $ | 14.86 | 742,067 | $ | 14.13 | 811,041 | $ | 14.41 | |||||||||||||||
|
|
|
|
|
| |||||||||||||||||||
The following is a summary of restricted stock unit activity and related information for the years ended December 31:
| 2011 | 2010 | 2009 | ||||||||||||||||||||||
| Units | Weighted Average Intrinsic Value | Units | Weighted Average Intrinsic Value | Units | Weighted Average Intrinsic Value | |||||||||||||||||||
Outstanding - | ||||||||||||||||||||||||
Beginning of year | 10,000 | $ | 2.18 | 44,000 | $ | 5.77 | 34,000 | $ | 6.82 | |||||||||||||||
Granted | 88,094 | 5.15 | — | — | 10,000 | 2.18 | ||||||||||||||||||
Stock Issued | — | — | — | — | — | — | ||||||||||||||||||
Forfeited | — | 4.85 | 34,000 | 6.82 | — | — | ||||||||||||||||||
|
|
|
|
|
| |||||||||||||||||||
Outstanding – | ||||||||||||||||||||||||
End of year | 98,094 | $ | 4.85 | 10,000 | $ | 2.18 | 44,000 | $ | 5.77 | |||||||||||||||
|
|
|
|
|
| |||||||||||||||||||
| C-31 |
NewBridge Bancorp and Subsidiary
Notes to Consolidated Financial Statements
December 31, 2011, 2010, and 2009
Note 13 – Stock based compensation - (continued)
The following is a summary of information on outstanding and exercisable stock options at December 31, 2011:
Options Outstanding | Options Exercisable | |||||||||||||||||||
Range of Exercise Prices | Number | Weighted Average | Weighted | Number | Weighted | |||||||||||||||
$ 5.81 – 10.05 | 144,349 | 1.48 | $ | 9.77 | 140,349 | $ | 9.79 | |||||||||||||
$11.06 – 14.93 | 100,307 | 2.00 | 14.82 | 100,307 | 14.82 | |||||||||||||||
$15.42 – 16.93 | 243,684 | 3.27 | 16.00 | 243,684 | 16.00 | |||||||||||||||
$17.10 – 18.00 | 170,125 | 2.74 | 17.41 | 170,125 | 17.41 | |||||||||||||||
|
|
|
| |||||||||||||||||
| 658,465 | 2.53 | $ | 14.82 | 654,465 | $ | 14.86 | ||||||||||||||
|
|
|
| |||||||||||||||||
In addition, restricted stock units totaling 98,094 shares with a weighted average intrinsic value of $4.85 were outstanding at December 31, 2011.
Note 14 – Net income (loss) per share
The following is a reconciliation of the numerator and denominator of basic and diluted net income (loss) per share of common stock (in thousands, except share data):
| �� | For the years ended December 31, | |||||||||||
| 2011 | 2010 | 2009 | ||||||||||
Basic: | ||||||||||||
Net income (loss) available to common shareholders | $ | 1,761 | $ | 461 | $ | (18,050) | ||||||
|
|
|
|
|
| |||||||
Weighted average shares outstanding | 15,655,868 | 15,655,868 | 15,655,868 | |||||||||
|
|
|
|
|
| |||||||
Net income (loss) per share, basic | $ | 0.11 | $ | 0.03 | $ | (1.15) | ||||||
|
|
|
|
|
| |||||||
Diluted: | ||||||||||||
Net income (loss) available to common shareholders | $ | 1,761 | $ | 461 | $ | (18,050) | ||||||
|
|
|
|
|
| |||||||
Weighted average shares outstanding | 15,655,868 | 15,655,868 | 15,655,868 | |||||||||
Effect of dilutive securities: | ||||||||||||
Restricted stock units | 98,094 | 10,000 | — | |||||||||
Warrant | 819,102 | 431,812 | — | |||||||||
|
|
|
|
|
| |||||||
Weighted average shares outstanding and dilutive potential shares outstanding | 16,573,064 | 16,097,680 | 15,655,868 | |||||||||
|
|
|
|
|
| |||||||
Net income (loss) per share, diluted | $ | 0.11 | $ | 0.03 | $ | (1.15) | ||||||
|
|
|
|
|
| |||||||
On December 31, 2011, there were 658,465 options that were antidilutive since the exercise price exceeded the average market price for the year, and there were 98,094 restricted stock units and a warrant to purchase 2,567,255 shares that were dilutive. On December 31, 2010, there were 821,767 options that were antidilutive since the exercise price exceeded the average market price for the year, and there were 10,000 restricted stock units and a warrant to purchase 2,567,255 shares that were dilutive. For both 2011 and 2010, the effect of the dilutive restricted stock units and warrant are reflected in the table above.
| C-32 |
NewBridge Bancorp and Subsidiary
Notes to Consolidated Financial Statements
December 31, 2011, 2010, and 2009
Note 14 – Net income (loss) per share - (continued)
On December 31, 2009, there were 896,991 options, 10,000 restricted stock units and a warrant to purchase 2,567,255 shares outstanding. The options, the restricted stock units and the warrant were antidilutive as a result of the Company’s net loss for 2009.
See Note 20 in the Notes to Consolidated Financial Statements of this Annual Report on Form 10-K for a description of the warrant.
Note 15 – Parent company only
The Company’s principal asset is its investment in its subsidiary, the Bank. The Company’s principal source of income is dividends and management fees received from the Bank. The following presents condensed financial information of the Company:
| 2011 | 2010 | |||||||
Condensed balance sheets (in thousands) | ||||||||
Assets | ||||||||
Cash and due from banks | $ | 5,037 | $ | 6,282 | ||||
Investment in wholly-owned subsidiary | 184,953 | 185,561 | ||||||
Other assets | 359 | 1,006 | ||||||
|
|
|
| |||||
Total assets | $ | 190,349 | $ | 192,849 | ||||
Liabilities | ||||||||
Trust preferred securities | $ | 25,774 | $ | 25,774 | ||||
Other liabilities | 1,188 | 1,157 | ||||||
Shareholders’ equity | 163,387 | 165,918 | ||||||
|
|
|
| |||||
Total liabilities and shareholders’ equity | $ | 190,349 | $ | 192,849 | ||||
|
|
|
| |||||
| 2011 | 2010 | 2009 | ||||||||||
Condensed statements of income | ||||||||||||
Management and service fees from subsidiary | $ | 1,762 | $ | — | $ | — | ||||||
Other operating expense | 1,110 | 733 | 824 | |||||||||
|
|
|
|
|
| |||||||
Income before equity in undistributed net income of subsidiary | 652 | (733 | ) | (824 | ) | |||||||
Equity in undistributed net income (loss) of subsidiary | 4,026 | 4,113 | (14,309 | ) | ||||||||
|
|
|
|
|
| |||||||
Net income (loss) | $ | 4,678 | $ | 3,380 | $ | (15,133 | ) | |||||
|
|
|
|
|
| |||||||
| C-33 |
NewBridge Bancorp and Subsidiary
Notes to Consolidated Financial Statements
December 31, 2011, 2010, and 2009
Note 15 – Parent company only - (continued)
| 2011 | 2010 | 2009 | ||||||||||
Condensed statements of cash flows | ||||||||||||
Cash flows from operating activities | ||||||||||||
Net income( loss) | $ | 4,678 | $ | 3,380 | $ | (15,133 | ) | |||||
Adjustments to reconcile net income (loss) to net cash provided by operating activities: | ||||||||||||
Other changes, net | 722 | (299 | ) | 3,243 | ||||||||
Change in investment in wholly-owned subsidiary | (4,026 | ) | (4,113 | ) | 14,309 | |||||||
|
|
|
|
|
| |||||||
Net cash (used in) provided by operating activities | 1,374 | (1,032 | ) | 2,419 | ||||||||
Cash flows from investing activities | ||||||||||||
Investments in wholly-owned subsidiary | — | — | (16,372 | ) | ||||||||
|
|
|
|
|
| |||||||
Net cash provided by (used in) investing activities | — | — | (16,372 | ) | ||||||||
Cash flows from financing activities | ||||||||||||
Proceeds from issuance of preferred stock and warrants | — | — | — | |||||||||
Dividends paid | (2,619 | ) | (2,619 | ) | (2,422 | ) | ||||||
Common stock acquired | — | — | — | |||||||||
Increase in other liabilities | — | — | — | |||||||||
|
|
|
|
|
| |||||||
Net cash provided by (used in) financing activities | (2,619 | ) | (2,619 | ) | (2,422 | ) | ||||||
|
|
|
|
|
| |||||||
Increase (decrease) in cash | (1,245 | ) | (3,651 | ) | (16,375 | ) | ||||||
Cash at beginning of year | 6,282 | 9,933 | 26,308 | |||||||||
|
|
|
|
|
| |||||||
Cash at end of year | $ | 5,037 | $ | 6,282 | $ | 9,933 | ||||||
|
|
|
|
|
| |||||||
Income derived from management and service fees from subsidiary reported in 2011 includes $1,154,000 for prior years.
Note 16 – Off-balance sheet arrangements
The Company’s consolidated financial statements do not reflect various commitments and contingent liabilities which arise in the normal course of business and which involve elements of credit risk, interest rate risk and liquidity risk. These commitments and contingent liabilities are commitments to extend credit and standby letters of credit. A summary of the contractual amounts of the Bank’s exposure to off-balance sheet risk at December 31 is as follows (in thousands):
| Contractual Amount | ||||||||
| 2011 | 2010 | |||||||
Loan commitments | $ | 253,998 | $ | 273,536 | ||||
Credit card lines | 22,687 | 22,457 | ||||||
Standby letters of credit | 3,735 | 3,830 | ||||||
|
|
|
| |||||
Total commitments and contingent liabilities | $ | 280,420 | $ | 299,823 | ||||
|
|
|
| |||||
The Bank’s exposure to credit loss in the event of nonperformance by the counter party is equal to the contractual amount of those instruments. The Bank uses the same credit policies in making commitments and conditional obligations as it does for on-balance sheet instruments.
| C-34 |
NewBridge Bancorp and Subsidiary
Notes to Consolidated Financial Statements
December 31, 2011, 2010, and 2009
Note 17 – Employee benefit plans
The Company has three curtailed defined benefit retirement plans:
| • | A pension plan, which is the result of the merger of two legacy pension plans. |
| • | A supplemental executive retirement plan (“SERP”) covering certain executive and former executive officers; and |
| • | A retiree health benefit plan, which provides partial health insurance benefits for certain early retired former employees. |
The disclosures presented represent combined information for all of the employee benefit plans. The retiree health benefit plan is not a material part of the aggregate information.
The pension plan, the retiree health benefit plan and the SERP provide for benefits to be paid to eligible employees at retirement based primarily upon years of service with the Company and a percentage of qualifying compensation during the employee’s final years of employment. Contributions to the pension plan were based upon the projected unit credited actuarial funding method and comply with the funding requirements of the Employee Retirement Income Security Act. Contributions prior to the curtailments were intended to provide not only for benefits attributed to service to date but also for those expected to be earned in the future. Plan assets consist primarily of cash and cash equivalents, U.S. government securities, and other securities. The following tables outline the changes in these pension obligations, assets and funded status for the years ended December 31, 2011 and 2010, and the assumptions and components of net periodic pension cost for the two and three years in the period ended December 31, 2011 (dollars in thousands):
| 2011 | 2010 | |||||||
Change in benefit obligation | ||||||||
Projected benefit obligation at beginning of year | $ | 27,103 | $ | 25,716 | ||||
Service cost | 35 | 42 | ||||||
Interest cost | 1,495 | 1,523 | ||||||
Actuarial (gain) loss | 2,678 | 1,231 | ||||||
Benefits paid | (1,454) | (1,409) | ||||||
|
|
|
| |||||
Projected benefit obligation at end of year | 29,857 | 27,103 | ||||||
|
|
|
| |||||
Change in plan assets | ||||||||
Fair value of plan assets at beginning of year | 20,682 | 18,688 | ||||||
Actual return on plan assets | (745) | 2,252 | ||||||
Employer contributions | 1,242 | 1,151 | ||||||
Benefits paid | (1,454) | (1,409) | ||||||
|
|
|
| |||||
Fair value of plan assets at end of year | 19,725 | 20,682 | ||||||
|
|
|
| |||||
Funded status at end of year | ||||||||
Plan assets less projected benefit obligation – pension liability | $ | (10,132) | $ | (6,421) | ||||
| C-35 |
NewBridge Bancorp and Subsidiary
Notes to Consolidated Financial Statements
December 31, 2011, 2010, and 2009
Note 17 – Employee benefit plans - (continued)
| 2011 | 2010 | |||||||
Amounts recognized in the consolidated balance sheets consist of: | ||||||||
Pension liability | $ | (10,132) | $ | (6,421) | ||||
Deferred tax asset | 4,001 | 2,535 | ||||||
Accumulated comprehensive income, net | 6,259 | 3,304 | ||||||
|
|
|
| |||||
Net amount recognized | $ | 128 | $ | (582) | ||||
| 2011 | 2010 | 2009 | ||||||||||
Components of net periodic pension cost | ||||||||||||
Service | $ | 35 | $ | 42 | $ | 43 | ||||||
Interest | 1,495 | 1,523 | 1,494 | |||||||||
Expected return on plan assets | (1,662) | (1,524) | (1,197) | |||||||||
Amortization of prior service cost | 1 | 1 | 1 | |||||||||
Amortization of net (gain) loss | 135 | 241 | 416 | |||||||||
|
|
|
|
|
| |||||||
Net periodic pension cost costcost | $ | 4 | $ | 283 | $ | 757 | ||||||
|
|
|
|
|
| |||||||
Weighted-average assumptions | ||||||||||||
Discount rate | 4.90% | 5.65% | 6.00% | |||||||||
Expected return on plan assets | 8.25% | 8.25% | 8.25% | |||||||||
Rate of compensation increases | 4.00% | 4.50% | 4.50% | |||||||||
Target asset allocations are established based on periodic evaluations of risk/reward under various economic scenarios and with varying asset class allocations. The near-term and long-term impact on obligations and asset values are projected and evaluated for funding and financial accounting implications. Actual allocation and investment performance is reviewed quarterly. The current target allocation ranges, along with the actual allocation as of December 31, 2011, are included in the accompanying table.
| Plan Assets | Market Value as of December 31, 2011 (in thousands) | Actual Allocation as of December 31, 2011 | Long-Term Allocation Target | |||||||||
Equity securities | $ | 11,061 | 56.1% | 40% -75% | ||||||||
Debt securities | 8,664 | 43.9% | 25% -60% | |||||||||
|
|
|
|
|
| |||||||
Total | $ | 19,725 | 100% | 100% | ||||||||
|
|
|
|
|
| |||||||
The fair value of the Company’s pension plan assets at December 31, 2011 and 2010 by asset category are reflected in the following table. The fair value hierarchy descriptions used to measure these plan assets are identified in Note 19 in the Notes to Consolidated Financial Statements of this Annual Report on Form 10-K.
| C-36 |
NewBridge Bancorp and Subsidiary
Notes to Consolidated Financial Statements
December 31, 2011, 2010, and 2009
Note 17 – Employee benefit plans - (continued)
| Quoted prices in active markets for identical assets (Level 1) | Significant other observable inputs (Level 2) | Significant unobservable inputs (Level 3) | ||||||||||
Plan Assets at December 31, 2011 | ||||||||||||
US equity securities | $ | 4,427 | $ | — | $ | — | ||||||
Equity mutual funds | 6,634 | — | — | |||||||||
Fixed income securities | — | 3,319 | — | |||||||||
Fixed income mutual funds | — | 4,018 | — | |||||||||
Cash and money market funds | 1,327 | — | — | |||||||||
|
|
|
|
|
| |||||||
Total plan assets | $ | 12,388 | $ | 7,337 | — | |||||||
|
|
|
|
|
| |||||||
| Quoted prices in active markets for identical assets (Level 1) | Significant other observable inputs (Level 2) | Significant unobservable inputs (Level 3) | ||||||||||
Plan Assets at December 31, 2010 | ||||||||||||
US equity securities | $ | 7,694 | $ | — | $ | — | ||||||
Equity mutual funds | 3,776 | — | — | |||||||||
Fixed income securities | — | 4,387 | — | |||||||||
Fixed income mutual funds | — | 3,835 | — | |||||||||
Cash and money market funds | 990 | — | — | |||||||||
|
|
|
|
|
| |||||||
Total plan assets | $ | 12,460 | $ | 8,222 | $ | — | ||||||
|
|
|
|
|
| |||||||
The assumed expected return on assets considers the current level of expected returns on risk-free investments (primarily government bonds), the historical level of risk premium associated with the other asset classes in the portfolio and the expectation for future returns of each asset class. The expected return of each asset class is weighted based on the target allocation to develop the expected long-term rate of return on assets. This resulted in the selection of the 8.25% rate used in 2009, 2010, 2011 and to be used for 2012. The required contributions for 2011 were approximately $1,242,000, and the required contributions for 2012 are expected to be approximately $1,041,000. The expected benefit payments for the next ten years are as follows: (1) 2012 - $1,461,000, (2) 2013 - $1,531,000, (3) 2014 - $1,552,000, (4) 2015 - $1,560,000, (5) 2016 - $1,609,000, and (6) 2017 through 2021 - $9,275,000.
The Company also has a separate contributory 401(k) savings plan covering substantially all employees. The 401(k) savings plan allows eligible employees to contribute up to a fixed percentage of their compensation, with the Bank matching a portion of each employee’s contribution. The Bank’s contributions were $756,000 for 2011, $792,000 for 2010 and $748,000 for 2009. The 401(k) savings plan contribution expense is reported under personnel expense in the consolidated statements of income.
A deferred compensation plan allows the directors of the Company to defer compensation. Each plan participant makes an annual election to either receive that year’s compensation or to defer receipt until his or her death, disability or retirement. The deferred compensation balances of this plan are maintained in a rabbi trust. The balances in the trust at December 31, 2011 and 2010 were $4,051,000 and $4,080,000, respectively. In addition, the Company has an inactive Director Deferred Compensation Plan that acquired shares of the Company’s common stock in the open market. These shares are held in a trust at cost, as a component of shareholders’ equity, until distributed.
| C-37 |
NewBridge Bancorp and Subsidiary
Notes to Consolidated Financial Statements
December 31, 2011, 2010, and 2009
Note 18 – Regulatory matters
The primary source of funds for dividends that may be paid by the Company to its shareholders is dividends received from the Bank plus cash on hand of $5.0 million as of December 31, 2011. The Bank is restricted as to dividend payments by state laws applicable to banks and may pay dividends only out of undivided profits. At December 31, 2011, the Bank had undivided profits of approximately $58.8 million. Additionally, dividends paid by the Company and the Bank may be limited by minimum capital requirements imposed by banking regulators. The Bank is currently restricted from paying dividends to the Company unless it receives advance approval from the FDIC and the North Carolina Commissioner of Banks (the “Commissioner”). During 2008, the Company first reduced its quarterly cash dividend, and later suspended the payment of cash dividends, based on the uncertain economic conditions and in the interest of preserving capital.
The Company and the Bank are subject to various regulatory capital requirements administered by federal banking agencies. Failure to meet minimum capital requirements can initiate certain mandatory – and possible additional discretionary – actions by regulators that, if undertaken, could have a direct material effect on the Company’s financial statements. Under capital adequacy guidelines and the regulatory framework for prompt corrective action, the Company and the Bank must meet specific capital guidelines that involve quantitative measures of assets, liabilities and certain off-balance-sheet items as calculated under regulatory accounting practices. The capital amounts and classification are also subject to qualitative judgments by the regulators about components, risk weighting, and other factors.
Quantitative measures established by regulation to ensure capital adequacy require the Company and the Bank to maintain minimum amounts and ratios (set forth in the table below) of total and Tier 1 capital (as defined in the regulations) to risk-weighted assets (as defined), and of Tier 1 capital to average assets (as defined). Management believes that as of December 31, 2011, both the Company and the Bank met all capital adequacy requirements to which they are subject.
The most recent notification from the FDIC categorized the Bank as “well capitalized” under the Regulatory Framework for Prompt Corrective Action. There are no conditions or events since that notification that management believes have changed the Bank’s category. To be categorized as well capitalized the Bank must maintain minimum total risk-based, Tier 1 risk-based and Tier 1 leverage ratios as set forth in the accompanying table (dollars in thousands).
| Actual | For Capital Adequacy Purposes | To Be Well Capitalized Under Prompt Corrective Action Provisions | ||||||||||||||||||||||
| Amount | Percentages | Amount | Percentages | Amount | Percentages | |||||||||||||||||||
December 31, 2011 | ||||||||||||||||||||||||
Total Capital (To Risk Weighted Assets) | ||||||||||||||||||||||||
Consolidated | $ | 198,089 | 14.55 | % | $ | 108,881 | ³ | 8.0% | N/A | |||||||||||||||
Bank | 193,685 | 14.24 | 108,837 | ³ | 8.0 | $ | 136,046 | ³ | 10.0% | |||||||||||||||
Tier 1 Capital (To Risk Weighted Assets) | ||||||||||||||||||||||||
Consolidated | 180,738 | 13.28 | 54,441 | ³ | 4.0 | N/A | ||||||||||||||||||
Bank | 176,341 | 12.96 | 54,418 | ³ | 4.0 | 81,628 | ³ | 6.0% | ||||||||||||||||
Tier 1 Capital (To Average Assets) | ||||||||||||||||||||||||
Consolidated | 180,738 | 10.65 | 67,907 | ³ | 4.0 | N/A | ||||||||||||||||||
Bank | 176,341 | 10.40 | 67,832 | ³ | 4.0 | 84,790 | ³ | 5.0% | ||||||||||||||||
| C-38 |
NewBridge Bancorp and Subsidiary
Notes to Consolidated Financial Statements
December 31, 2011, 2010, and 2009
Note 18 – Regulatory matters - (continued)
| Actual | For Capital Adequacy Purposes | To Be Well Capitalized Under Prompt Corrective Action Provisions | ||||||||||||||||||||||
| Amount | Percentages | Amount | Percentages | Amount | Percentages | |||||||||||||||||||
December 31, 2010 | ||||||||||||||||||||||||
Total Capital (To Risk Weighted Assets) | ||||||||||||||||||||||||
Consolidated | $ | 194,931 | 13.15 | % | $ | 118,781 | ³ | 8.0 | % | N/A | ||||||||||||||
Bank | 188,261 | 12.71 | 118,657 | ³ | 8.0 | $ | 148,321 | ³ | 10.0 | % | ||||||||||||||
Tier 1 Capital (To Risk Weighted Assets) | ||||||||||||||||||||||||
Consolidated | 175,893 | 11.86 | 59,390 | ³ | 4.0 | N/A | ||||||||||||||||||
Bank | 169,242 | 11.43 | 59,328 | ³ | 4.0 | 88,992 | ³ | 6.0 | % | |||||||||||||||
Tier 1 Capital (To Average Assets) | ||||||||||||||||||||||||
Consolidated | 175,893 | 9.70 | 72,644 | ³ | 4.0 | N/A | ||||||||||||||||||
Bank | 169,242 | 9.34 | 72,551 | ³ | 4.0 | 90,689 | ³ | 5.0 | % | |||||||||||||||
Banking regulations restrict the amount of deferred income tax assets that may be recognized for purposes of calculating regulatory capital ratios. At December 31, 2011, $9.6 million of the Company’s deferred income tax assets were deducted from regulatory capital. This amount, which is principally comprised of the future tax benefit associated with net operating loss carry-forwards, is the equivalent of 0.61% of total and Tier I risk based capital for the Company.
Note 19 – Fair value of financial instruments
The following methods and assumptions were used to estimate the fair value for each class of the Company’s financial instruments.
Cash and cash equivalents.The carrying amounts for cash and due from banks approximate fair value because of the short maturities of those instruments.
Investment securities. The fair value of investment securities is based on quoted prices in active markets for identical assets, if available. If a quoted market price is not available, fair value is estimated using quoted market prices for similar securities, corresponding to the “significant other observable inputs” definition of GAAP. The fair value of equity investments in the restricted stock of the FHLB equals the carrying value as the fair value is not readily determinable.
Loans.The fair value of fixed rate loans is estimated by discounting the future cash flows using the current rates at which similar loans would be made to borrowers with similar credit ratings and for the same remaining maturities. Substantially all residential mortgage loans held for sale are pre-sold and their carrying value approximates fair value. The fair value of variable rate loans with frequent repricing and negligible credit risk approximates book value.
Investment in bank-owned life insurance.The carrying value of bank-owned life insurance approximates fair value because this investment is carried at cash surrender value, as determined by the insurer.
Deposits. The fair value of noninterest-bearing demand deposits and NOW, savings, and money market deposits are the amounts payable on demand at the reporting date. The fair value of time deposits is estimated using the rates currently offered for deposits of similar remaining maturities.
Federal funds purchased and retail repurchase agreements.The carrying value of federal funds purchased and retail repurchase agreements are considered to be a reasonable estimate of fair value.
| C-39 |
NewBridge Bancorp and Subsidiary
Notes to Consolidated Financial Statements
December 31, 2011, 2010, and 2009
Note 19 – Fair value of financial instruments - (continued)
Wholesale repurchase agreements and other borrowings.The fair values of these liabilities are estimated using the discounted values of the contractual cash flows. The discount rate is estimated using the rates currently in effect for similar borrowings.
Accrued interest. The carrying amounts of accrued interest approximate fair value.
Financial instruments with off-balance sheet risk. The carrying value of financial instruments with off-balance sheet risk is considered to approximate fair value, since a large majority of these future financing commitments would result in loans that have variable rates and/or relatively short terms to maturity. For other commitments, generally of a short-term nature, the carrying value is considered to be a reasonable estimate of fair value. The various financial instruments are disclosed in Note 16 in the Notes to Consolidated Financial Statements of this Annual Report on Form 10-K.
The estimated fair values of financial instruments for the years ending December 31 (in thousands):
| 2011 | 2010 | |||||||||||||||
| Carrying Value | Estimated Fair Value | Carrying Value | Estimated Fair Value | |||||||||||||
Financial assets: | ||||||||||||||||
Cash and short term investments | $ | 53,992 | $ | 53,992 | $ | 29,075 | $ | 29,075 | ||||||||
Investment securities | 337,811 | 337,811 | 325,129 | 325,129 | ||||||||||||
Loans (excluding held for sale) | 1,200,070 | 1,197,885 | 1,337,579 | 1,343,235 | ||||||||||||
Financial liabilities: | ||||||||||||||||
Deposits | 1,418,676 | 1,248,353 | 1,452,995 | 1,455,838 | ||||||||||||
Wholesale repurchase agreements | 21,000 | 23,772 | 36,000 | 37,231 | ||||||||||||
Junior subordinated notes | 25,774 | 10,857 | 25,774 | 8,310 | ||||||||||||
FHLB borrowings | 86,700 | 87,911 | 112,700 | 113,580 | ||||||||||||
The fair value estimates are made at a specific point in time based on relevant market and other information about the financial instruments. Because no market exists for a significant portion of the Company’s financial instruments, fair value estimates are based on current economic conditions, risk characteristics of various financial instruments, and such other factors. These estimates are subjective in nature and involve uncertainties and matters of significant judgment and therefore cannot be determined with precision. Changes in assumptions could significantly affect the estimates. In addition, the tax ramifications related to the realization of the unrealized gains and losses can have a significant effect on fair value estimates and have not been considered in the estimates.
| C-40 |
NewBridge Bancorp and Subsidiary
Notes to Consolidated Financial Statements
December 31, 2011, 2010, and 2009
Note 19 – Fair value of financial instruments - (continued)
The table below presents the assets measured at fair value on a recurring basis categorized by the level of inputs used in the valuation of each asset (in thousands):
| Quoted prices in active markets for identical assets (Level 1) | Significant other observable inputs (Level 2) | Significant unobservable inputs (Level 3) | ||||||||||
Available for sale securities at December 31, 2011 | $ | — | $ | 330,626 | $ | — | ||||||
Available for sale securities at December 31, 2010 | — | 314,730 | — | |||||||||
The table below presents the assets measured at fair value on a non-recurring basis categorized by the level of inputs used in the valuation of each asset (in thousands):
| Quoted prices in active markets for identical assets (Level 1) | Significant other observable inputs (Level 2) | Significant inputs (Level 3) | ||||||||||
Loans held for sale at December 31, 2011 | $ | — | $ | 7,851 | $ | — | ||||||
Loans held for sale at December 31, 2010 | — | 76,994 | — | |||||||||
Real estate acquired in settlement of loans at December 31, 2011 | — | — | 30,587 | |||||||||
Real estate acquired in settlement of loans at December 31, 2010 | — | — | 26,718 | |||||||||
Impaired loans net of allowance at December 31, 2011 | — | — | 40,534 | |||||||||
Impaired loans net of allowance at December 31, 2010 | — | — | 50,585 | |||||||||
Note 20 – U.S. Treasury Capital Purchase Program
Pursuant to the Capital Purchase Program (the “CPP”), on December 12, 2008, the Company issued and sold to the U.S. Department of the Treasury (the “U.S. Treasury”) (i) 52,372 shares of Bancorp’s Fixed Rate Cumulative Perpetual Preferred Stock, Series A (the “Series A Preferred Stock”) and (ii) a warrant (the “Warrant”) to purchase 2,567,255 shares of Bancorp’s common stock at an exercise price of $3.06 per share, representing a price of approximately $7.9 million, for an aggregate purchase price of $52,372,000 in cash. The Warrant may be exercised by the U.S. Treasury at any time before it expires on December 12, 2018. Subject to the approval of the federal banking regulators, the Series A Preferred Stock may be redeemed in whole or in part, at any time and from time to time. Once an institution notifies the U.S. Treasury that it would like to repay its investment, the U.S. Treasury must permit repayment subject to consultation with the federal banking regulators. All such redemptions will be at 100% of the issue price, plus any accrued and unpaid dividends. The fair value of the Warrant of $1,497,000 was estimated on the date of the grant using the Black-Scholes option-pricing model. The holders of the Series A Preferred Stock are entitled to receive cumulative dividends of 5 percent for the first five years and 9 percent thereafter.
Note 21 – Sale of Virginia operations
On May 20, 2011, the Bank sold its Harrisonburg, Virginia operations, which included deposits of approximately $48.8 million and loans of approximately $73.0 million at book value. The Bank also sold its branch in Harrisonburg, as well as a parcel of land located in Waynesboro, Virginia. An impairment charge of $339,000 was recorded during the fourth quarter of 2010 for the expected loss on the sale of the real property. A gain of $90,000 was recorded on the sale of the real property when the sale closed in the second quarter of 2011.
| C-41 |
[This page intentionally left blank.]
APPENDIX D
Management’s Discussion and Analysis of Financial Condition at December 31, 2011 and 2010 and Results of Operations for the years in the three-year period ended December 31, 2011, as included in our Annual Report on Form 10-K for the fiscal year ended December 31, 2011
| D-1 |
| Item 7. | MANAGEMENT’S DISCUSSIONAND ANALYSISOF FINANCIAL CONDITIONAND RESULTSOF OPERATIONS |
The following presents management’s discussion and analysis of the Company’s financial condition and results of operations and should be read in conjunction with the consolidated financial statements and related notes included elsewhere in this Annual Report on Form 10-K. This discussion may contain forward-looking statements that involve risks and uncertainties. Our actual results could differ significantly from those anticipated in forward-looking statements as a result of various factors. The following discussion is intended to assist in understanding the financial condition and results of operations of the Company.
Executive Overview
In 2011, net income climbed 38% to $4.7 million, compared to $3.4 million in 2010. Despite the lingering effects of the deep economic recession that began in 2008, the Company has been profitable for nine consecutive quarters. Consistent with the Company’s strategic and operating plans, asset quality improved, net interest margin increased, core deposits increased, operating expense declined and other sources of non-interest income improved and became more diversified.
Under the leadership of Pressley A. Ridgill, the Company’s Chief Executive Officer (“CEO”) and President, the Company did not defer credit costs when it began to experience the effects of the recession in 2008, but instead aggressively charged off and wrote down credits. As a result of such early recognition, credit costs have now fallen for two consecutive years and are expected to continue to fall if levels of problem and potential problem assets continue to decline, as anticipated. The net interest margin improved to 4.22% in 2011, an improvement of more than 122 basis points from the low point in the credit cycle, and annual operating expense has declined by more than $16.5 million since the Company was formed in the July 2008 merger of LSB and FNB.
While a number of challenges emerged during the recession, the then newly appointed CEO brought together a management team focused on a North Carolina community bank strategy. The management team members were selected for their talents, experience and commitment to the Company’s Guiding Principles, which are founded on the concept that “Financial Success Begins with Integrity”. By early 2009, the management team was in place, and the credit deterioration in the loan portfolio had peaked. Having implemented a re-defined community bank strategy, the Company focused on returning to profitability. Under Mr. Ridgill’s guidance, management’s implementation of the redefined community bank strategy has yielded dramatically improved operating results and positive trends, including:
| • | Nine consecutive quarters of profit, including $4.7 million of full-year profit in 2011 |
| • | Pre-tax income increased $3.0 million from 2010 to 2011 and $32.9 million from 2009 to 2011 |
| • | Net interest margin increased 22 basis points from 4.00% in 2010 to 4.22% in 2011, or 104 basis points from 3.18% in 2009 |
| • | Core deposits grew 7% in 2011, 16% in 2010 and 8% in 2009 |
| • | Core deposits represented 72% of total deposits at year end 2011 |
| • | Provision for credit losses declined $4.5 million in 2011, and $14.5 million in 2010 |
| • | Non-performing loans declined 20% in 2011, and 37% from the peak level in June 2009 |
| • | Total noninterest expense declined $3.5 million in 2011 and $8.0 million in 2010 |
| • | Since merger, annual operating expense has declined by $16.5 million |
| • | Total and tier one leverage capital improved to 14.55% and 10.65%, respectively, at December 31, 2011 from lows of 10.18% and 7.78%, respectively, at September 30, 2008 |
As we evaluate our 2011 results, we are pleased with the robust improvements to date in lowering operating and credit-related costs, increasing net interest income and building a stable capital position well above the regulatory levels required to be “well capitalized”. Between 2007 and 2011, the Company charged off more than $139 million of loans and real estate acquired in settlement of loans, or 8.6% of the highest/peak level of loan balances in June 2008. As we have previously discussed, our desire was to put this adverse credit cycle
| D-2 |
behind us as quickly as possible, through early recognition of credit losses. We believe we have been largely successful in doing so. Looking forward, we believe credit costs will remain high through 2013, but core earnings should continue to build as problem and potential problem loans decline. In the recovery period of this recession, we believe the Company has emerged more disciplined and efficient with a greater opportunity for long-term success than what would have otherwise been realized. In the coming year, we will look at ways to further reduce problem assets, improve operating efficiencies and reverse the trend of negative loan growth. The Company will also continue to consider opportunities to repay TARP funds and exit the TARP program, although the Company is under no compulsion to do so, and will not do so if the terms are not considered favorable to shareholders.
Our Community Bank Strategy and Operating Plan
As a community bank, we believe our opportunity to achieve exceptional returns for our shareholders is through consistent delivery of superior customer service to small and medium sized business and retail clients in a manner that the large national and super regional banks are unable or unwilling to emulate. The Piedmont Triad has approximately $33 billion of deposits and just 4% of those balances are held at our Bank. The market is dominated by large national and regional banks, with 76% of the market’s deposits residing in banks with more than $10 billion of assets. Consequently, even relatively small growth in our market share could potentially result in extraordinary gains for the Company. While deposit balances have been plentiful in the Piedmont Triad, quality loan opportunities have been insufficient in recent quarters to offset loan portfolio pay downs. Consequently, in 2011, the Company opened three loan production offices including one in Raleigh, NC. In the coming year, the Company intends to have a lending presence in each of the four largest metropolitan statistical areas (MSAs) in NC, including Charlotte, Raleigh, the Piedmont Triad and Wilmington.
To ensure the long-term achievement of our strategic plan, the Company’s operating plan focuses on basic, measurable operating items that communicate throughout the organization the steps needed to improve the Company’s financial results. The operating plan objectives include:
| • | Manage the net interest margin (NIM) and grow net interest income |
| • | Improve asset quality |
| • | Increase non-interest income |
| • | Implement a disciplined cost management culture |
| • | Position the Company to fulfill its Vision and Mission. |
Manage Net Interest Margin
Net interest income is the difference between interest income and interest expense and is the Bank’s primary source of revenue.
In its strategic and operating plans, management identified several steps to increase net interest income and control the net interest margin, including:
| • | Redefining the Bank’s target market to include the entire State of North Carolina. Corresponding with its North Carolina focus, during 2011, the Company sold its Harrisonburg, Virginia operations and opened three loan production offices in Raleigh, Morganton and Asheboro, NC. |
| • | In 2012, the Company intends to open a loan production office in Charlotte, NC– so establishing a lending presence in each of the four largest financial districts and MSAs in NC. |
| • | Reducing the Company’s dependence on high cost time deposits in favor of lower cost core accounts, including DDA, NOW checking, money market and savings accounts. |
| • | Establishing a loan pricing committee to better evaluate risk based and relationship pricing to include deposit and other relationships. Management is also seeking to develop more consistency on loan pricing relative to credit characteristics of loans. |
| D-3 |
| • | Redirecting portfolio investments to corporate debt and commercial mortgage backed securities. |
| • | Maintaining a disciplined and accountable budget process to include monitoring loan, investment and deposit yields, rates and balances so that variances are questioned, and controllable items are examined monthly. |
Management implemented many of these operating changes over the last three years, which had a pronounced impact on the Company’s operating results in 2010 and 2011.
Net interest income declined $2.4 million in 2011 to $67.1 million from $69.5 million in 2010, following an increase of $10.1 million from $59.3 million in 2009. Net interest margin increased 22 basis points in 2011, rising from 4.00% in 2010 to 4.22% in 2011, following an 82 basis point increase in 2010 from 3.18% in 2009. While the Company benefitted from the rise in the net interest margin, loan runoff caused a $171 million decline in the average balance of earning assets. The decline in earning assets resulted in a $6.5 million reduction to net interest income, partially offset by the improvement in the net interest margin. The margin improved due to a continued decline in the cost of funds, attributable to the Company’s success in attracting additional low cost core deposits. The weighted average deposit cost fell 35 basis points to 0.75% for the year ending December 31, 2011 compared to 1.10% for the year ending December 31, 2010 and 2.16% for the year ending December 31, 2009. In 2008, the Company faced irrational time deposit pricing pressure from financial institutions in-market. The impact caused intense margin compression during late 2008 and the first two quarters of 2009. As management shifted liability strategies, high cost time deposits left the Bank for higher rates elsewhere and were replaced with lower cost core deposit accounts. NOW checking accounts became the featured product in marketing ads and internal sales incentives, which resulted in a sizable shift in the deposit mix. At December 31, 2011, DDA, money market, NOW and savings accounts totaled 72%, or $1.03 billion of the Company’s $1.42 billion of deposits. The percentage of core deposits has increased significantly, from 66% at December 31, 2010, 55% at December 31, 2009 and 45.9% at December 31, 2008.
Improve Asset Quality
Our primary objective is to put the adverse effects of the recession behind us as quickly as possible through early recognition of credit losses. We believe we have been largely successful in identifying and taking appropriate aggressive action with our problem credits. Since 2007, the Company has charged off more than $139 million of problem loans and real estate acquired in settlement of loans and every meaningful credit metric appears to have peaked and subsequently steadily improved. Nonperforming loans declined 19.9%, or $10.1 million, for the year to $40.5 million at December 31, 2011. Since the peak level in June of 2009, nonperforming loans are down 37% or $23.5 million. Likewise, total classified loans declined 20%, or $33.0 million, for the year to $128.5 million and are down 24%, or $41.6 million, from the peak level at September 30, 2010. At December 31, 2011, real estate acquired in settlement of loans totaled $30.6 million, up from $26.7 million at December 31, 2010. During 2011, $20.7 million of loans were transferred into real estate acquired in settlement of loans, $5.1 million of write downs were taken, and $11.6 million was sold.
At December 31, 2011, the allowance for credit losses totaled $28.8 million, or 2.40% of loans held for investment and 71.16% of nonperforming loans. Provision for credit losses declined $4.5 million for the year to $16.8 million compared to $21.3 million for the year ending December 31, 2010. The Company’s coverage percentage may not be comparable with other banking institutions due to its practice of charging off specific estimated losses on loans at the time they become measurable. Consequently, the Company’s allowance for credit losses consists primarily of general reserves, with 86% being general and 14% specific. Management believes that substantially all losses in the Company’s impaired and non-performing loans have been recognized and charged off through the allowance for loan losses.
Increase Non-interest Income
Excluding gains and losses from sales of investments and real estate acquired in settlement of loans, non-interest income declined $1.3 million, from $17.7 million in 2010 to $16.4 million in 2011. The decline in fee income was due primarily to lower retail banking fee income, which declined $1.7 million, from 11.6 million in 2010 to $9.9 million in 2011. Increasing sources of noninterest income was a focal point in the 2011 and 2012 operating plans, in large part due to the regulatory changes that have targeted the reduction of retail banking fees and income. Wealth management revenue increased $366,000 to $2.5 million for the year
| D-4 |
ended December 31, 2011, due primarily to growth in trust income, which rose $360,000 for the year on higher assets under management. Other noninterest income, including bank-owned life insurance (BOLI), increased $692,000 over the prior year. Mortgage revenue declined $710,000 to $1.7 million for the year on lower volume in 2011; however, expense cuts in the mortgage division largely offset the lower revenues in 2011.
Implement a Disciplined Cost Management Culture
Core to the execution of management’s operating plan is the implementation of a disciplined cost management culture where “that which is within our control is controlled.” While certain items such as real estate acquired in settlement of loans and other credit related expenses such as legal, have proven to be outside our control, the vast majority of non-interest related expenses are controllable.
A key element to creating this culture was the implementation of a line-item accountable budget process. The budget was built around a philosophy we termed as the “CAST” philosophy, which is an acronym for:
| • | Conservative in forecasts and expectations |
| • | Accountable on an account by account basis |
| • | Specific to each individual in the organization so goals and budgets are understood |
| • | Timely so that continued monitoring and adjustments can be made |
Since the Merger, the Bank has implemented several major cost reduction initiatives focused on eliminating excess costs and non-core or unprofitable activities. These initiatives include an ongoing franchise validation plan, which carefully reviews each of our branch locations and targets the elimination of waste, inefficiency and duplication throughout our franchise. Management developed a methodology that evaluates each location’s pre-tax contribution, age and state of the facility, ease of closure, market demographics and overall fit within our strategic vision. Execution of the franchise validation plan and other expense reduction initiatives have resulted in a net reduction of 12 bank locations and 254 full time equivalent employees since merger in 2007. In 2011, the validation planning led to the sale of the last remaining Virginia location. At December 31, 2011, the Company had 30 full service bank locations and 426 full time equivalent employees. The reduction in the number of branch locations and other expense reductions resulted in an improvement in our core efficiency from a high of 90% to 65% in 2011. Since the Merger, the Company has eliminated $16.5 million of annual operating expense.
Noninterest expense declined $3.5 million in 2011, from $60.9 million to $57.4 million. Personnel expense, furniture and equipment and FDIC assessment expense each fell by approximately $1.0 million in 2011. In addition, technology and data processing fell by $559,000. Real estate acquired in settlement of loans expense increased by $404,000, partially offsetting other expense reductions. As we look into 2012, we anticipate that the established cost management culture will continue to improve the organization’s financial performance. While noninterest expense has declined significantly in recent years, the goal remains to continue to improve efficiencies to a level that surpasses our peers. That objective has not yet been achieved, but remains a focus through continued discipline.
Position the Company to fulfill its Vision and Mission
The Company is well positioned to serve North Carolina, having its headquarters located in the Piedmont Triad, the state’s third largest MSA, while also being in close proximity to the largest two MSAs in North Carolina–Charlotte and Raleigh/Durham, both of which are within a 90 minute drive. In addition, the Company has three branches in the Coastal Region, which is within the state’s fourth largest MSA–Wilmington. Together, the four largest MSAs represent the focus of future lending opportunities; whereas near term growth in deposits is likely be drawn from the Piedmont Triad. In 2011, the Company opened loan production offices in Raleigh, Morganton and Asheboro, NC. An additional loan production office is planned to open in Charlotte, NC in 2012.
Capital planning remains paramount in this economic environment. Despite several challenging years following the merger, the Company’s capital levels have grown and remain well above “well capitalized” levels, as defined by regulatory guidelines. At December 31, 2011 the Company’s total risk based capital was 14.55%
| D-5 |
compared to the minimum “well capitalized” level of 10.00% and Tier I risk based capital was 13.28%. Banking regulations restrict the amount of deferred income tax assets that may be recognized for purposes of calculating regulatory capital ratios. At December 31, 2011, $9.6 million of the Company’s deferred income tax assets were deducted from regulatory capital. This amount, which is principally comprised of the future tax benefit associated with net operating loss carry-forwards, is the equivalent of 0.61% of total and Tier I risk based capital for the Company. In the event that the Company is able to utilize the net operating losses in future periods, some or all of excluded deferred tax assets will qualify to be included in determining regulatory capital ratios, thereby increasing the Company’s regulatory capital ratios.
The Company continues to consider opportunities to repay TARP funds and exit the TARP program, although the Company is under no compulsion to do so, and will not do so if the terms are not considered favorable to shareholders. Management has also considered the merits of wholesale disposal of distressed assets.
Financial Condition at December 31, 2011 and 2010
The Company’s consolidated assets of $1.73 billion at year end 2011 reflect a decrease of 4.2% from year end 2010, following a decrease of 7.2% during the previous year. The decreases in both years were primarily a result of a decline in the Company’s loan portfolio. Total average assets decreased 8.4% from $1.91 billion in 2010, to $1.75 billion in 2011, while average earning assets decreased 9.6%, from $1.77 billion in 2010, to $1.60 billion in 2011. The decreases in total average assets and average earning assets were also primarily the result of a decrease in loans outstanding.
Gross loans (including loans held for sale) decreased $129.7 million during 2011, or 9.7%, compared to a decrease of 8.6% in 2010. The decrease in loans is due primarily to the sale of $72.5 million of loans in connection with the sale of the Bank’s Virginia operation in May 2011, as well as principal repayment on existing loans and loan chargeoffs and foreclosures, coupled with soft loan demand from qualified borrowers. Loans secured by real estate totaled $1.04 billion in 2011 and represented 86.4% of total loans (excluding loans held for sale), compared with 84.8% at year end 2010. Within this category, residential real estate loans decreased 4.0% to $522.8 million and construction loans decreased 35.7% to $89.4 million. Commercial loans totaled $547.4 million at year end 2011, an increase of 6.1% from the end of 2010. Consumer loans decreased 34.5% during 2011, ending the year at $34.7 million. Management believes the Bank is not dependent on any single customer or group of customers concentrated in a particular industry, the loss of whose deposits or whose insolvency would have a material adverse effect on operations.
Investment securities (at amortized cost) totaled $337.0 million at year end 2011, a 4.9% increase from $321.3 million at year end 2010. U.S. Government agency securities totaled $39.0 million, or 11.6% of the portfolio, at year end 2011, compared to $109.3 million, or 34.0% of the portfolio one year earlier. Mortgage backed securities totaled $62.1 million, or 18.4% of the portfolio, at December 31, 2011, compared to $56.0 million, or 17.4% of the portfolio, at the previous year end. State and municipal obligations amounted to $19.4 million at year end 2011, and comprised 5.7% of the portfolio, compared to $17.4 million, or 5.4% of the portfolio, a year earlier. Corporate bonds totaled $180.0 million, or 53.4% of the portfolio at December 31, 2011, of which $61.4 million were covered bonds, compared to total corporate bonds of $82.8 million, or 25.8% of the portfolio at December 31, 2010, of which $46.1 million were covered bonds. Collateralized mortgage obligations (“CMOs”) totaled $23.6 million, or 7.0% of the portfolio at year end 2011, compared to $39.7 million, or 12.3% of the portfolio, at the end of the previous year. The Company’s investment strategy is to achieve acceptable total returns through investments in securities with varying maturity dates, cash flows and yield characteristics. U.S. Government agency securities are generally purchased for liquidity and collateral purposes, mortgage backed securities are purchased for yield and cash flow purposes, corporate bonds are purchased for yield, and longer maturity municipal bonds are purchased for yield and income tax advantage. The table, “Investment Securities,” on page 53, presents the composition of the securities portfolio for the last three years, as well as information about cost and fair value, and the table“Investment Securities Portfolio Maturity Schedule” presents the maturities, fair values and weighted average yield.
The competition for deposits within the Bank’s market areas increased significantly during the liquidity crisis of 2008 as larger national and regional banks increased their rates in an effort to attract deposits and maintain adequate liquidity. The Bank, which historically has relied on appropriate pricing and high quality customer service to retain and increase its retail deposit base, was forced to compete with higher rates offered by the
| D-6 |
larger national and regional banks in order to satisfy its deposit requirements. Beginning in 2009, the Bank shifted its liability strategy, reducing its dependence on high cost time deposits in favor of lower cost core accounts, including DDA, NOW checking, money market and savings accounts.
Total deposits decreased $34.3 million to $1.42 billion at December 31, 2011, a 2.4% decrease from a total of $1.45 billion one year earlier. This change was primarily the result of a $102.2 million reduction in time deposits, as the interest rates offered by the Bank were reduced substantially during the year. This decrease was partially offset by a $54.2 million increase in money market account deposits. In May 2011, $54.1 million of total deposits, which included $24.9 million of core deposits, were sold as part of the sale of the Bank’s Virginia operations. The Bank’s “FastForward Checking” product, introduced in the third quarter of 2009, totaled $184.8 million at December 31, 2011.
In order to attract additional deposits, when necessary the Bank uses several different sources such as membership in an electronic deposit gathering network that allows it to post interest rates and attract deposits from across the U.S. (bulletin board deposits), brokered certificates of deposit secured through broker/dealer partnerships and deposits obtained through the Promontory InterFinancial Network, also known as CDARS. The Bank’s reliance on these out-of-market deposits continued to decrease during 2011. CDARS decreased $11.9 million, from $27.1 million at year end 2010 to $15.2 million at year end 2011, while brokered deposits decreased $1.7 million, from $30.1 million at year end 2010 to $28.4 million at year end 2011.
The Bank also has a credit facility available with the FHLB of Atlanta. The Bank utilized a portion of the approximately $346.1 million credit line with the FHLB of Atlanta to fund earning assets. FHLB borrowings totaled $86.7 million at year end 2011. In addition to the credit line at the FHLB, the Bank has borrowing capacity at the Federal Reserve Bank totaling $20.4 million, and has federal funds lines of $15.0 million, of which there were no borrowings outstanding at December 31, 2011. Management believes these credit lines are a cost effective and prudent alternative to deposit balances, since particular amounts, terms and structures may be selected to meet changing needs.
During the fourth quarter of 2011, the Company enhanced its methodology for calculating deferred income taxes related to premises and equipment. In doing so, management identified an error in the prior methodology used to calculate and record these deferred tax assets, and the related calculation of goodwill, dating back to the merger of its predecessor companies in 2007. Due to consistent application of this prior methodology, the error was carried forward in subsequent years. Following the writeoff of the Company's goodwill in 2008, subsequent financial reporting under-reported shareholders' equity by $2,730,000, or approximately 2%. Consistent with SEC Staff Accounting Bulletin (“SAB”) No. 99,Materiality, and SAB No. 108,Considering the Effects of Prior Year Misstatements When Quantifying Misstatements in Current Year Financial Statements, management determined that the error did not result in a misstatement of material fact in any period, and has adjusted the Company's deferred tax assets and retained earnings for prior years in the accompanying consolidated financial statements. See also Note 1 in the Notes to Consolidated Financial Statements of this Annual Report on Form 10-K.
Financial Condition at December 31, 2010 and 2009
The Company’s consolidated assets of $1.81 billion at year end 2010 reflect a decrease of 7.2% from year end 2009, following a decrease of 6.4% during the previous year. The decreases in both years were primarily a result of a decline in the Company’s loan portfolio. Total average assets decreased 7.1% from $2.05 billion in 2009, to $1.91 billion in 2010, while average earning assets decreased 8.2%, from $1.93 billion in 2009, to $1.77 billion in 2010. The decreases in total average assets and average earning assets were also primarily the result of a decrease in loans outstanding.
Gross loans (including loans held for sale) decreased $125.5 million during 2010, or 8.6%, compared to a decrease of 8.8% in 2009. The decrease in loans was due primarily to principal repayment on existing loans and loan chargeoffs and foreclosures, coupled with soft loan demand from qualified borrowers. Loans secured by real estate totaled $1.07 billion in 2010 and represented 84.8% of total loans (excluding loans held for sale), compared with 83.4% at year end 2009. Within this category, residential real estate loans decreased 9.0% to
| D-7 |
$544.4 million and construction loans decreased 21.5% to $139.1 million. Commercial loans totaled $516.0 million at year end 2010, a decrease of 13.0% from the end of 2009. Consumer loans decreased 30.0% during 2010, ending the year at $53.0 million.
Investment securities (at amortized cost) totaled $321.3 million at year end 2010, a 1.1% increase from $317.9 million at year end 2009. U.S. Government agency securities totaled $109.3 million, or 34.0% of the portfolio at year end 2010, compared to $49.0 million, or 15.4% of the portfolio one year earlier. Mortgage backed securities totaled $56.0 million, or 17.4% of the portfolio, at December 31, 2010, compared to $77.4 million, or 24.4% of the portfolio, at the previous year end. State and municipal obligations amounted to $17.4 million at year end 2010, and comprised 5.4% of the portfolio, compared to $105.2 million, or 33.1% of the portfolio, a year earlier. Investment securities with a book value of $82.1 million were sold during 2010 to reposition the investment portfolio and reduce the Company’s exposure to municipalities. A portion of the securities that were identified for sale had been classified as held to maturity and, accordingly, all held to maturity securities were designated as available for sale. Corporate bonds totaled $82.8 million, or 25.8% of the portfolio, at December 31, 2010, of which $46.1 million were covered bonds, compared to total corporate bonds of $34.0 million, or 10.7% of the portfolio, at December 31, 2009, of which $29.1 million were covered bonds. CMOs totaled $39.7 million, or 12.3% of the portfolio, at year end 2010, compared to $35.1 million, or 11.0% of the portfolio, at the end of the previous year.
Total deposits decreased $46.3 million to $1.45 billion at December 31, 2010, a 3.1% decrease from a total of $1.50 billion one year earlier. This change was primarily the result of a $178.8 million reduction in time deposits, as the interest rates offered by the Bank were reduced substantially during the year. This decrease was partially offset by a $169.0 million increase in NOW account deposits, as the Bank’s new “FastForward Checking” product, introduced in the third quarter of 2009, grew to $212.0 million at December 31, 2010.
Net Interest Income
Like most financial institutions, the primary component of the Company’s earnings is net interest income. Net interest income is the difference between interest income, principally from loans and investments, and interest expense, principally on customer deposits and borrowings. Changes in net interest income result from changes in volume and changes in interest rates earned and paid. Volume refers to the average dollar level of interest-earning assets and interest-bearing liabilities. Spread refers to the difference between the average yield on interest-earning assets and the average cost of interest-bearing liabilities, and margin refers to net interest income divided by average interest-earning assets. Spread and margin are influenced by the levels and relative mix of interest-earning assets and interest-bearing liabilities, as well as by levels of noninterest-bearing liabilities.
Average Balances and Net Interest Income Analysis.The accompanying table sets forth, for the years 2009 through 2011, information with regard to average balances of assets and liabilities, as well as the total dollar amounts of interest income from interest-earning assets and interest expense on interest-bearing liabilities, resultant yields or rates, net interest income, net interest spread, net interest margin and ratio of average interest-earning assets to average interest-bearing liabilities. Average loans include nonaccruing loans, the effect of which is to lower the average yield.
| D-8 |
Average Balances and Net Interest Income Analysis
Fully taxable equivalent basis(1) (Dollars in thousands)
| 2011 | 2010 | 2009 | ||||||||||||||||||||||||||||||||||
| Average Balance | Interest Income/ Expense | Average Yield/ Rate | Average Balance | Interest Income/ Expense | Average Yield/ Rate | Average Balance | Interest Income/ Expense | Average Yield/ Rate | ||||||||||||||||||||||||||||
Earning assets: | ||||||||||||||||||||||||||||||||||||
Loans receivable(1) | $ | 1,271,790 | $ | 65,871 | 5.18 | % | $ | 1,406,624 | $ | 74,795 | 5.32 | % | $ | 1,538,777 | $ | 84,089 | 5.46 | % | ||||||||||||||||||
Taxable securities(2) | 279,417 | 12,672 | 4.54 | 253,585 | 11,659 | 4.60 | 197,132 | 9,425 | 4.78 | |||||||||||||||||||||||||||
Tax exempt securities | 16,494 | 1,132 | 6.86 | 65,807 | 4,821 | 7.33 | 109,622 | 6,754 | 6.16 | |||||||||||||||||||||||||||
FHLB stock | 9,150 | 78 | 0.85 | 11,241 | 39 | 0.35 | 11,177 | 4 | 0.04 | |||||||||||||||||||||||||||
Interest-bearing bank balances | 24,270 | 60 | 0.25 | 34,496 | 96 | 0.28 | 54,667 | 186 | 0.34 | |||||||||||||||||||||||||||
Federal funds sold | — | — | — | — | — | — | 18,751 | 46 | 0.25 | |||||||||||||||||||||||||||
|
|
|
|
|
|
|
|
|
|
|
| |||||||||||||||||||||||||
Total earning assets | 1,601,121 | 79,813 | 4.99 | 1,771,753 | 91,410 | 5.16 | 1,930,126 | 100,504 | 5.21 | |||||||||||||||||||||||||||
Non-earning assets: | ||||||||||||||||||||||||||||||||||||
Cash and due from banks | 28,684 | 27,525 | 24,120 | |||||||||||||||||||||||||||||||||
Premises and equipment | 37,248 | 39,815 | 42,889 | |||||||||||||||||||||||||||||||||
Other assets | 111,985 | 107,890 | 100,666 | |||||||||||||||||||||||||||||||||
Allowance for credit losses | (29,230 | ) | (35,630 | ) | (40,584 | ) | ||||||||||||||||||||||||||||||
|
|
|
|
|
| |||||||||||||||||||||||||||||||
Total assets | $ | 1,749,809 | $ | 1,911,353 | $ | 2,057,217 | ||||||||||||||||||||||||||||||
|
|
|
|
|
| |||||||||||||||||||||||||||||||
Interest-bearing liabilities: | ||||||||||||||||||||||||||||||||||||
Savings deposits | $ | 40,766 | $ | 41 | 0.10 | % | $ | 40,222 | $ | 40 | 0.10 | % | $ | 40,703 | $ | 41 | 0.10 | % | ||||||||||||||||||
NOW deposits | 430,695 | 2,504 | 0.58 | 368,702 | 3,201 | 0.87 | 195,626 | 778 | 0.40 | |||||||||||||||||||||||||||
Money market deposits | 353,567 | 2,447 | 0.69 | 344,033 | 2,838 | 0.82 | 390,042 | 4,326 | 1.11 | |||||||||||||||||||||||||||
Time deposits | 433,523 | 4,501 | 1.04 | 606,636 | 8,881 | 1.46 | 853,100 | 26,746 | 3.14 | |||||||||||||||||||||||||||
Other Borrowings | 54,215 | 1,648 | 3.04 | 76,415 | 2,407 | 3.15 | 75,462 | 2,559 | 3.39 | |||||||||||||||||||||||||||
Borrowings from Federal Home Loan Bank | 87,720 | 1,178 | 1.34 | 123,015 | 3,087 | 2.51 | 149,559 | 4,706 | 3.15 | |||||||||||||||||||||||||||
|
|
|
|
|
|
|
|
|
|
|
| |||||||||||||||||||||||||
Total interest-bearing liabilities | 1,400,486 | 12,319 | 0.88 | 1,559,023 | 20,454 | 1.31 | 1,704,492 | 39,156 | 2.30 | |||||||||||||||||||||||||||
Other liabilities and shareholders’ equity: | ||||||||||||||||||||||||||||||||||||
Demand deposits | 166,077 | 164,958 | 158,436 | |||||||||||||||||||||||||||||||||
Other liabilities | 16,909 | 18,921 | 20,988 | |||||||||||||||||||||||||||||||||
Shareholders’ equity | 166,337 | 168,451 | 173,301 | |||||||||||||||||||||||||||||||||
|
|
|
|
|
| |||||||||||||||||||||||||||||||
Total liabilities and shareholders’ equity | $ | 1,749,809 | $ | 1,911,353 | $ | 2,057,217 | ||||||||||||||||||||||||||||||
|
|
|
|
|
|
|
|
|
|
|
| |||||||||||||||||||||||||
Net interest income and net interest margin(3) | $ | 67,494 | 4.22 | % | $ | 70,956 | 4.00 | % | $ | 61,348 | 3.18 | % | ||||||||||||||||||||||||
|
|
|
|
|
|
|
|
|
|
|
| |||||||||||||||||||||||||
Interest rate spread(4) | 4.11 | % | 3.85 | % | 2.91 | % | ||||||||||||||||||||||||||||||
|
|
|
|
|
| |||||||||||||||||||||||||||||||
| D-9 |
| (1) | Average loans receivable include non-accruing loans. Amortization of loan fees, net of deferred costs, of $741, $935 and $1,449, for 2011, 2010 and 2009, respectively, are included in interest income. |
| (2) | Income related to securities exempt from federal income taxes is stated on a fully taxable-equivalent basis, assuming a federal income tax rate of 35%, and is then reduced by the non-deductible portion of interest expense. The adjustments made to convert to a fully taxable-equivalent basis were $358 for 2011, $1,497 for 2010 and $2,004 for 2009. |
| (3) | Net interest margin is computed by dividing taxable-equivalent net interest income by average earning assets. |
| (4) | Interest rate spread is computed by subtracting interest-bearing liability rate from earning asset yield. |
Volume and Rate Variance Analysis
The following table analyzes the dollar amount of changes in interest income and interest expense for major components of interest-earning assets and interest-bearing liabilities. The table identifies (i) changes attributable to volume (changes in volume multiplied by the prior period’s rate), (ii) changes attributable to rate (changes in rate multiplied by the prior period’s volume), and (iii) net change (the sum of the previous columns). The change attributable to both rate and volume (changes in rate multiplied by changes in volume) have been allocated, based on the absolute value, between changes attributable to volume and changes attributable to rate.
Volume and Rate Variance Analysis
Fully taxable-equivalent basis(1) (in thousands)
| 2011 | 2010 | |||||||||||||||||||||||
| Volume Variance(2) | Rate Variance(2) | Total Variance | Volume Variance(2) | Rate Variance(2) | Total Variance | |||||||||||||||||||
Interest income: | ||||||||||||||||||||||||
Loans receivable | $ | (7,023 | ) | $ | (1,901 | ) | $ | (8,924 | ) | $ | (7,157 | ) | $ | (2,137 | ) | $ | (9,294 | ) | ||||||
Taxable investment securities(1) | 1,169 | (156 | ) | 1,013 | 2,602 | (368 | ) | 2,234 | ||||||||||||||||
Tax exempt investment securities | (3,402 | ) | (287 | ) | (3,689 | ) | (3,049 | ) | 1,116 | (1,933 | ) | |||||||||||||
FHLB stock | (6 | ) | 45 | 39 | 0 | 36 | 36 | |||||||||||||||||
Interest-bearing bank balances | (26 | ) | (10 | ) | (36 | ) | (62 | ) | (29 | ) | (91 | ) | ||||||||||||
Federal funds sold | 0 | 0 | 0 | (46 | ) | 0 | (46 | ) | ||||||||||||||||
|
|
|
|
|
|
|
|
|
|
|
| |||||||||||||
Total interest income | (9,288 | ) | (2,309 | ) | (11,597 | ) | (7,712 | ) | (1,382 | ) | (9,094 | ) | ||||||||||||
|
|
|
|
|
|
|
|
|
|
|
| |||||||||||||
Interest expense: | ||||||||||||||||||||||||
Savings deposits | 1 | 0 | 1 | (1 | ) | 0 | (1 | ) | ||||||||||||||||
NOW deposits | 722 | (1,419 | ) | (697 | ) | 1,041 | 1,382 | 2,423 | ||||||||||||||||
Money market deposits | 81 | (472 | ) | (391 | ) | (463 | ) | (1,026 | ) | (1,489 | ) | |||||||||||||
Time deposits | (2,169 | ) | (2,210 | ) | (4,379 | ) | (6,264 | ) | (11,601 | ) | (17,865 | ) | ||||||||||||
Other borrowings | (678 | ) | (81 | ) | (759 | ) | 31 | (183 | ) | (152 | ) | |||||||||||||
Borrowings from FHLB | (729 | ) | (1,180 | ) | (1,909 | ) | (755 | ) | (864 | ) | (1,619 | ) | ||||||||||||
|
|
|
|
|
|
|
|
|
|
|
| |||||||||||||
Total interest expense | (2,772 | ) | (5,362 | ) | (8,134 | ) | (6,411 | ) | (12,292 | ) | (18,703 | ) | ||||||||||||
|
|
|
|
|
|
|
|
|
|
|
| |||||||||||||
Increase (decrease) in net interest income | $ | (6,516 | ) | $ | 3,053 | $ | (3,463 | ) | $ | (1,301 | ) | $ | 10,910 | $ | 9,609 | |||||||||
|
|
|
|
|
|
|
|
|
|
|
| |||||||||||||
| (1) | Income related to securities exempt from federal income taxes is stated on a fully taxable-equivalent basis, assuming a federal income tax rate of 35% and is then reduced by the non-deductible portion of interest expense. |
| (2) | The volume/rate variance for each category has been allocated on a consistent basis between rate and volume variances, based on the percentage of rate, or volume, variance to the sum of the two absolute variances. |
| D-10 |
Results of Operations –Years Ended December 31, 2011 and 2010
Net Income.Net income available to common shareholders for 2011 was $1.8 million, representing net income per diluted share of $0.11, compared to net income to common shareholders of $461,000, or $0.03 per diluted share the prior year. The improvement to net income in 2011 was mostly attributed to a reduction in the provision for credit losses and continued reductions in noninterest expense. Net interest income for 2011 after provision for credit losses increased by $2.1 million, or 4.4%, as compared to 2010. The taxable equivalent net interest margin increased 22 basis points for 2011 to 4.22%, from 4.00% for 2010. Noninterest income decreased $2.7 million, or 16.8%, in 2011, while noninterest expense for 2011 decreased $3.5 million, or 5.8%. The provision for loan losses in 2011 was $16.8 million, down $4.5 million, or 21.0% from $21.3 million in 2010. Return on average assets for 2011 was 0.27% compared to 0.18% for 2010. Return on average shareholders' equity for 2011 was 2.81% compared to 2.00% in 2010.
Net Interest Income. Net interest income represents the gross profit from the lending and investing activities of a banking organization and is the most significant factor affecting the earnings of the Company. Net interest income is influenced by changes in interest rates and the volume and mix of the various interest earning asset and interest bearing liability components. Net interest income for 2011, on a taxable-equivalent basis, decreased $3.5 million, or 4.9%, compared to 2010. This was primarily due to a decrease in average earning assets, which declined $170.6 million, or 9.6%, to $1.60 billion from $1.77 billion for the prior year. The decline was partially offset by an increase in taxable-equivalent net interest margin, which rose to 4.22% for 2011 compared to 4.00% for 2010. Average interest-bearing liabilities for 2011 decreased $158.5 million, or 10.2%, to $1.40 billion, compared to $1.56 billion for 2010.
During 2011, the Bank continued to reduce its dependence on high cost time deposits, and, as a result, the net interest margin improved from 2010 levels. In 2011, the average yield on earning assets decreased by 17 basis points while the average rate on interest-bearing liabilities decreased by 43 basis points, which resulted in an increase in the interest rate spread in 2011 of 26 basis points compared to the prior year.
The table,“Average Balances and Net Interest Income Analysis,” above summarizes net interest income and average yields earned, and rates paid for the years indicated, on a taxable-equivalent basis. The table, “Volume and Rate Variance Analysis” above presents the changes in interest income and interest expense attributable to volume and rate changes between the years indicated.
Provision for Credit Losses and Allowance for Credit Losses.The Company recorded a $16.8 million provision for credit losses during the year ended December 31, 2011, compared to a $21.3 million provision during the previous year. The decrease in 2011 was primarily a result of a lower level of chargeoffs in 2011 than in 2010. During the fourth quarter of 2010, the Company charged off $6.2 million, and during the first quarter of 2011 charged off an additional $1.3 million, of a $10.0 million subordinated debt loan to a financial institution. The remaining $2.5 million was exchanged for preferred stock in the institution and is carried in other assets on the Company’s balance sheet as of December 31, 2011. The Company does not have any other loans to financial institutions. The Company’s allowance for credit losses was $28.8 million at December 31, 2011, essentially unchanged from the end of 2010. The allowance for credit losses expressed as a percentage of total loans (including loans held for sale) increased to 2.39% at December 31, 2011 to 2.15% at December 31, 2010.
Noninterest Income. In 2011, noninterest income decreased $2.7 million to $13.2 million. Pre-tax gains on sale of investment securities totaled $2.0 million in 2011 compared to $3.6 million in 2010. Retail banking revenue declined 14.4% for the year, or $1.7 million, due primarily to ongoing regulatory changes in the industry and changes in consumer behavior. These declines were partially offset by an increase of $366,000, or 17.2%, in wealth management service income, due primarily to a 94% increase in assets under management, which totaled $146.4 million at December 31, 2011. Mortgage revenue decreased $710,000, or 29%, for the year due to the volatility of interest rates. Income on bank-owned life insurance rose $520,000, or $60%, as the Company purchased additional insurance policies. For the detailed change in other operating income please see the table “Other Operating Income and Expenses” in Note 12 of the Notes to Consolidated Financial Statements of this Annual Report on Form 10-K.
Noninterest Expense.In 2011, noninterest expense declined $3.5 million, or 5.8%, compared to 2010. The Company has continued to focus on improving efficiencies and controlling costs, and has reduced its expenses
| D-11 |
in nearly all categories, including personnel, occupancy, furniture and equipment, technology and data processing, legal and professional, and FDIC assessments. For the detailed change in other operating expense please see the table “Other Operating Income and Expenses” in Note 12 of the Notes to Consolidated Financial Statements of this Annual Report on Form 10-K.
Provision for Income Taxes. The Company recorded an income tax expense of $1.4 million in 2011, compared to a tax benefit of $0.2 million in 2010. This change was primarily attributable to the increase in pre-tax income in 2011, combined with a reduction in tax exempt income in 2011. The Company’s effective tax rate was 23.6% in 2011 and (7.9)% in 2010. In 2011, the difference between the effective tax rate and the statutory rate was primarily due to tax-preferenced items such as income on bank-owned life insurance, while in 2010, the difference between the effective tax rate and the statutory rate was principally due to tax exempt interest income.
Results of Operations –Years Ended December 31, 2010 and 2009
Net Income.Net income available to common shareholders for 2010 was $461,000, representing net income per diluted share of $0.03, compared to net loss to common shareholders of ($18.1) million, or ($1.15) per diluted share the prior year. The improvement to net income in 2010 from net loss for 2009 was mostly attributed to a reduction in the provision for credit losses, improved net interest income and continued reductions in noninterest expense. Net interest income for 2010 after provision for credit losses increased by $24.6 million, or 104.3%, as compared to 2009. The taxable equivalent net interest margin increased 82 basis points for 2010, to 4.00%, from 3.18% for 2009. Noninterest income increased $0.3 million, or 1.7%, in 2010, while noninterest expense for 2010 decreased $5.0 million, or 7.1%. The provision for credit losses in 2010 was $21.3 million, down $14.4 million, or 40.6% from $35.7 million in 2009. Return on average assets for 2010 was 0.18% compared to (0.74)% for 2009. Return on average shareholders' equity for 2010 was 2.00% compared to (8.73)% in 2009.
Net Interest Income. Net interest income for 2010, on a taxable-equivalent basis, increased $9.6 million, or 15.7%, compared to 2009. This was primarily due to an increase in net interest margin, which increased 82 basis points over the same period. Average earning assets in 2010 decreased $158.4 million, or 8.2%, to $1.77 billion, compared to $1.93 billion in 2009. Average interest-bearing liabilities for 2010 decreased $145.5 million, or 8.5%, to $1.56 billion, compared to $1.70 billion for 2009.
The taxable-equivalent net interest margin for 2010 increased to 4.00%, compared to 3.18% for 2009, an improvement of 82 basis points. During 2010, the Bank substantially reduced its dependence on high cost time deposits, and, as a result, net interest income and the net interest margin improved steadily throughout 2010. In 2010, the average yield on earning assets decreased by five basis points while the average rate on interest-bearing liabilities decreased by 99 basis points, which resulted in an increase in the interest rate spread in 2010 of 94 basis points compared to the prior year.
The table,“Average Balances and Net Interest Income Analysis,” on page 37 summarizes net interest income and average yields earned, and rates paid for the years indicated, on a taxable-equivalent basis. The table, “Volume and Rate Variance Analysis” on page 38 presents the changes in interest income and interest expense attributable to volume and rate changes between the years indicated.
Provision for Credit Losses and Allowance for Credit Losses.The Company recorded a $21.3 million provision for credit losses during the year ended December 31, 2010, compared to a $35.7 million provision during the previous year. The decrease in 2010 was primarily a result of a lower level of chargeoffs in 2010 than in 2009, following the Company’s decision in 2009 to more quickly take appropriate aggressive action with its problem credits. During the fourth quarter of 2010, the Company charged off $6.2 million of a $10.0 million loan composed of subordinated debt to a financial institution. The Company’s allowance for credit losses decreased 19.8% from the prior year end and was $28.8 million at December 31, 2010. The allowance for credit losses expressed as a percentage of total loans (including loans held for sale) decreased from 2.45% at December 31, 2009 to 2.15% at December 31, 2010.
| D-12 |
Noninterest Income. In 2010, noninterest income declined $2.7 million to $15.8 million. Pre-tax gains on sale of investment securities totaled $3.6 million in 2010 compared to $389,000 in 2009. The Company sold substantially all of its municipal securities to reduce exposure to municipalities, many of which have been experiencing challenging budgetary issues. These gains were partially offset by losses on sale of real estate acquired in settlement of loans of $1.8 million in 2010 and $591,000 in 2009 and other writedowns on land and fixed assets of $418,000 in 2010. For 2010, growth in mortgage revenue and investment services income exceeded declines in deposit service income. Mortgage revenue increased $1.8 million, or 262%, for the year due primarily to the Company’s acquisition of the operations of Bradford Mortgage Company in 2009. Investment services revenue increased $403,000 for the year to $1.6 million from $1.2 million in 2009. Deposit service charge revenue declined 13% for the year, or $1.1 million, due primarily to ongoing regulatory changes in the industry and changes in consumer behavior. Merchant processing income decreased by $1.6 million as a result of the Company’s sale of its merchant card servicing operation in 2009. For the detailed change in other operating income please see the table “Other Operating Income and Expenses” in Note 12 of the Notes to Consolidated Financial Statements of this Annual Report on Form 10-K.
Noninterest Expense.In 2010, noninterest expense declined $8.0 million, or 12%, compared to 2009. The Company recorded a $3.5 million increase in real estate acquired in settlement of loans-related costs in 2010 compared to 2009. The results in 2009 were affected by $3.8 million of one time expenses related to restructuring branch operations, terminating certain retired data processing systems and termination of non-executive employment agreements totaling $2.9 million pre-tax, as well as a special industry-wide FDIC assessment expense of $970,000. Excluding the one-time items and the increased costs on real estate acquired in settlement of loans, operating costs have declined $4.6 million for the year on lower data processing costs, legal and professional expenses, merchant processing costs and various other operating expense reductions. For the detailed change in other operating income please see the table “Other Operating Income and Expenses” in Note 12 of the Notes to Consolidated Financial Statements of this Annual Report on Form 10-K.
Provision for Income Taxes. The Company recorded a tax benefit of $0.2 million in 2010, compared to a tax benefit totaling $11.6 million in 2009. The tax benefits in both years were primarily attributable to the provisions for credit losses and asset writedowns recorded during those years. The Company’s effective tax rate was (7.9)% in 2010 and (43.5)% in 2009. In both 2010 and 2009, the difference between the effective tax rate and the statutory rate was principally due to tax exempt interest income.
Liquidity and Cash Flow
Market and public confidence in our financial strength and in the strength of financial institutions in general will largely determine our access to appropriate levels of liquidity. This confidence is significantly dependent on our ability to maintain sound asset quality and appropriate levels of capital resources. Liquidity management refers to the policies and practices that ensure the Bank has the ability to meet day-to-day cash flow requirements based primarily on activity in loan and deposit accounts of the Bank’s customers. Management measures our liquidity position by giving consideration to both on- and off-balance sheet sources of, and demands for, funds on a daily and other periodic bases. Deposit withdrawals, loan funding and general corporate activity create the primary needs for liquidity for the Bank. Sources of liquidity include cash and cash equivalents, net of federal requirements to maintain reserves against deposit liabilities, investments available for sale, loan repayments, loan sales, increases in deposits, and increases in borrowings from the FHLB secured with pledged loans and securities, and from correspondent banks under overnight federal funds credit lines and securities sold under repurchase agreements.
Bancorp had sufficient cash and cash equivalents on hand at December 31, 2011 to provide for Bancorp’s obligations and service its debt for approximately one and a half years.
The investment portfolio at December 31, 2011 included securities with a par value of approximately $71.5 million with call features, whereby the issuers of such securities have the option to repay the security before the contractual maturity date. The Company anticipates that a number of these debt instruments may be called by their issuers during 2012, due to the current low interest rate environment.
| D-13 |
The Bank has the ability to manage, within competitive and cost of funds constraints, increases in deposits within its market areas. The Bank is a member of an electronic network that allows it to post interest rates and attract certificates of deposit nationally. It also utilizes CDARS and brokered deposits to supplement in-market deposit growth.
The Bank has established wholesale repurchase agreements with regional brokerage firms. The Bank can access this additional source of liquidity by pledging investment securities with the brokerage firms.
Liquidity is further enhanced by a line of credit with the FHLB, amounting to approximately $346.1 million, collateralized by FHLB stock, investment securities, qualifying 1 to 4 family residential mortgage loans, and qualifying commercial real estate loans. Based upon collateral pledged, as of December 31, 2011, the borrowing capacity under this line was $254.4 million, with $117.7 million available to be borrowed. The Bank provides various reports to the FHLB on a regular basis to maintain the availability of the credit line. Each borrowing request to the FHLB is initiated through an advance application that is subject to approval by the FHLB before funds are advanced under the line of credit. In addition to the credit line at the FHLB, the Bank has borrowing capacity at the Federal Reserve Bank totaling $20.4 million, and has federal funds lines of $15.0 million, of which there were no borrowings outstanding at December 31, 2011.
As presented in the Consolidated Statement of Cash Flows, the Company generated $102.7 million in operating cash flow during 2011, compared to $39.3 million in 2010 and $14.4 million in 2009. The increase from 2010 to 2011 was primarily the result of the sale of $73.0 million in loans held for sale in connection with sale of the Bank’s Virginia operations. The increase from 2009 to 2010 was primarily the result of the Company’s net income in 2010, compared to a net loss in 2009.
Cash used by investing activities in 2011 was $.1 million, compared to cash provided by investing activities of $84.2 million in 2010, and cash provided by investing activities of $102.7 million in 2009. Cash flows for 2011, 2010 and 2009 included inflows of $20.4 million, $73.6 million and $83.9 million, respectively, related to a decrease in the loan portfolio. The Company also invested $12.0 million in bank-owned life insurance during 2011.
Cash used by financing activities was $77.9 million in 2011, compared to $139.2 million in 2010 and $118.0 million in 2009. Cash flows for 2011, 2010 and 2009 included outflows of $102.2 million, $178.8 million and $225.8 million, respectively related to decreases in time deposits. During 2011, the Company had a cash inflow of $67.9 million related to increase in core deposits, partially offset by cash outflows of $41.0 million used to reduce outstanding borrowings. During 2010, the Company had a cash inflow of $132.5 million related to increase in core deposits, partially offset by cash outflows of $90.3 million used to reduce outstanding borrowings. In 2009, the Company had cash inflows of $61.6 million as a result of increased core deposits and an inflow of $48.7 million as a result of increased borrowings.
Contractual Obligations and Commitments
In the normal course of business there are various outstanding contractual obligations of the Company that will require future cash outflows. In addition, there are commitments and contingent liabilities, such as commitments to extend credit, which may or may not require future cash outflows. Payments for borrowings do not include interest. Payments related to leases and service contracts are based on actual payments specified in the underlying contracts. The following table reflects the material contractual obligations of the Company outstanding as of December 31, 2011.
| D-14 |
Contractual Obligations
(in thousands)
| Payments Due by Period | ||||||||||||||||||||
| Within One Year | One Year to Three Years | Three Years to Five Years | After Five Years | Total | ||||||||||||||||
Junior subordinated notes and wholesale repurchase agreements | $ | — | $ | — | $ | 21,000 | $ | 25,774 | $ | 46,774 | ||||||||||
Federal Home Loan Bank borrowings | 51,700 | 35,000 | — | — | 86,700 | |||||||||||||||
Operating lease obligations | 1,602 | 2,408 | 1,258 | 143 | 5,411 | |||||||||||||||
Service contracts and purchase obligations | 6,598 | 8,469 | 6,107 | 266 | 21,440 | |||||||||||||||
Other long-term liabilities | 396 | 2,160 | 1,329 | 1,275 | 5,160 | |||||||||||||||
|
|
|
|
|
|
|
|
|
| |||||||||||
Total contractual cash obligations excluding deposits | 60,296 | 48,037 | 29,694 | 27,458 | 165,485 | |||||||||||||||
Deposits | 1,367,297 | 43,797 | 7,480 | 102 | 1,418,676 | |||||||||||||||
|
|
|
|
|
|
|
|
|
| |||||||||||
Total contractual cash obligations | $ | 1,427,593 | $ | 91,834 | $ | 37,174 | $ | 27,560 | $ | 1,584,161 | ||||||||||
|
|
|
|
|
|
|
|
|
| |||||||||||
Capital Resources
Banks, bank holding companies, and financial holding companies, as regulated institutions, must meet required levels of capital. The Federal Reserve and the FDIC have minimum capital regulations or guidelines that categorize components and the level of risk associated with various types of assets. Financial institutions are required to maintain a level of capital commensurate with the risk profile assigned to their assets in accordance with the guidelines. On August 26, 2005, the Company completed a private placement of trust preferred securities in the amount of $25.0 million. See Note 7 of the Notes to the Consolidated Financial Statements of this Annual Report on Form 10-K for a discussion of the issuance of the trust preferred securities. On December 12, 2008, the Company sold Series A Preferred Stock and a Warrant to the U.S. Treasury for $52.4 million as part of the CPP. As shown in Note 18 of the Notes to the Consolidated Financial Statements of this Annual Report on Form 10-K the Company and the Bank both maintained capital levels exceeding the minimum levels required to be categorized as “well capitalized” for each of the three years presented.
Lending Activities
General. The Bank offers a broad array of lending services, including construction, real estate, commercial and consumer loans, to individuals and small to medium-sized businesses and retail clients that are located in or conduct a substantial portion of their business in the Bank’s market areas. The Bank’s total loans (excluding loans held for sale) at December 31, 2011 were $1.20 billion, or 69.2% of total assets. At December 31, 2011, the Bank had no large loan concentrations (exceeding 10% of its portfolio) in any particular industry, other than real estate. The Bank’s legal lending limit at December 31, 2011 was $31.9 million (absent fully marketable collateral) and the largest credit relationship was approximately $13.7 million.
Loan Composition. The following table summarizes, at the dates indicated, the composition of the Bank’s loan portfolio and the related percentage composition (excluding loans held for sale).
| D-15 |
Summary of Loan Portfolio
(in thousands; excluding loans held for sale)
| December 31 | ||||||||||||||||||||||||||||||||||||||||
| 2011 | 2010 | 2009 | 2008 | 2007 | ||||||||||||||||||||||||||||||||||||
| Amount | % Of Total Loans | Amount | % Of Total Loans | Amount | % Of Total Loans | Amount | % Of Total Loans | Amount | % Of Total Loans | |||||||||||||||||||||||||||||||
Secured by owner-occupied nonfarm non-residential properties | $ | 269,972 | $ | 222,889 | $ | 232,769 | $ | 242,379 | $ | - | (1) | |||||||||||||||||||||||||||||
Secured by other nonfarm nonresidential properties | 157,594 | 159,086 | 202,030 | 202,069 | 407,015 | |||||||||||||||||||||||||||||||||||
Other commercial and industrial | 119,877 | 134,011 | 158,624 | 173,197 | 164,559 | |||||||||||||||||||||||||||||||||||
|
|
|
|
|
|
|
|
|
| |||||||||||||||||||||||||||||||
Total Commercial | 547,443 | 45.6 | % | 515,986 | 40.9 | % | 593,423 | 40.7 | % | 617,645 | 38.5 | % | 571,574 | 38.4 | % | |||||||||||||||||||||||||
Construction loans – 1 to 4 family residential | 7,781 | 16,736 | 28,929 | 27,131 | - | (1) | ||||||||||||||||||||||||||||||||||
Other construction and land development | 81,630 | 122,382 | 148,356 | 212,622 | 248,222 | |||||||||||||||||||||||||||||||||||
|
|
|
|
|
|
|
|
|
| |||||||||||||||||||||||||||||||
Total Real estate – construction | 89,411 | 7.4 | 139,118 | 11.0 | 177,285 | 12.2 | 239,753 | 13.7 | 248,222 | 16.6 | ||||||||||||||||||||||||||||||
Closed-end loans secured by 1 to 4 family residential properties | 287,268 | 304,640 | 339,485 | 371,592 | 353,814 | |||||||||||||||||||||||||||||||||||
Lines of credit secured by 1 to 4 family residential properties | 209,634 | 219,557 | 234,674 | 231,314 | 203,779 | |||||||||||||||||||||||||||||||||||
Loans secured by 5 or more family residential properties | 25,883 | 20,207 | 24,333 | 28,888 | 17,546 | |||||||||||||||||||||||||||||||||||
|
|
|
|
|
|
|
|
|
| |||||||||||||||||||||||||||||||
Total Real estate – mortgage | 522,785 | 43.6 | 544,404 | 43.2 | 598,492 | 41.1 | 631,794 | 39.4 | 575,139 | 38.6 | ||||||||||||||||||||||||||||||
Credit cards | 7,649 | 7,749 | 7,416 | 6,703 | 6,555 | |||||||||||||||||||||||||||||||||||
Other revolving credit plans | 9,444 | 9,042 | 10,974 | 14,354 | 17,781 | |||||||||||||||||||||||||||||||||||
Other consumer loans | 17,648 | 36,224 | 57,079 | 80,342 | 67,490 | |||||||||||||||||||||||||||||||||||
|
|
|
|
|
|
|
|
|
| |||||||||||||||||||||||||||||||
Total Consumer | 34,741 | 2.9 | 53,015 | 4.2 | 75,469 | 5.2 | 101,399 | 7.6 | 91,826 | 6.2 | ||||||||||||||||||||||||||||||
Loans to other depository institutions | — | 3,800 | 10,000 | 10,000 | — | |||||||||||||||||||||||||||||||||||
All other loans | 5,690 | 4,262 | 1,857 | 2,997 | 3,323 | |||||||||||||||||||||||||||||||||||
|
|
|
|
|
|
|
|
|
| |||||||||||||||||||||||||||||||
Total Other | 5,690 | 0.5 | 8,062 | 0.7 | 11,857 | 0.8 | 12,997 | 0.8 | 3,323 | 0.2 | ||||||||||||||||||||||||||||||
|
|
|
|
|
|
|
|
|
|
|
|
|
|
|
|
|
|
|
| |||||||||||||||||||||
Total | $ | 1,200,070 | 100.0 | % | $ | 1,260,585 | 100.0 | % | $ | 1,456,526 | 100.0 | % | $ | 1,603,588 | 100.0 | % | $ | 1,490,084 | 100.0 | % | ||||||||||||||||||||
|
|
|
|
|
|
|
|
|
|
|
|
|
|
|
|
|
|
|
| |||||||||||||||||||||
| (1) | Data is not available for these line items prior to 2008 |
The Company has no foreign loan activity.
Real Estate Loans. Loans secured by real estate totaled $1.04 billion, or 86.6% of total loans (excluding loans held for sale), at December 31, 2011. At year end 2011, the Bank had real estate loan relationships of various sizes ranging up to $13.2 million and commitments up to $13.7 million, secured by office buildings, retail establishments, residential development and construction, warehouses, motels, restaurants and other types of property. Loan terms are typically limited to five years, with payments through the date of maturity generally based on a 15-20 year (15-30 year for owner-occupied single and multi-family properties) amortization schedule. Interest rates may be fixed or adjustable, based on market conditions, and the Bank generally charges an origination fee. Management has attempted to reduce credit risk in the real estate portfolio by emphasizing loans on owner-occupied office, multi-family and retail buildings where the loan to value ratio, established by independent appraisals, does not exceed 70% to 80%, and net projected cash flow available for debt service amounts to at least 120% to 135% of the debt service requirement. The Bank also generally requires personal guarantees and personal financial statements from the principal owners in such cases.
Real Estate – Mortgage.The Bank originates fixed and adjustable rate mortgages as well as FHA, VA and USDA Government supported loans for resale into the secondary market. The Bank provides bank-held mortgage products to accommodate qualified borrowers who do not meet all the standards for a conventional secondary market mortgage. During 2011, the Bank originated $153.2 million of loans in these various
| D-16 |
categories. Also included in real estate mortgage loans are home equity revolving lines of credit, with $209.6 million outstanding as of December 31, 2011. The Bank recorded net chargeoffs from mortgage loans of $6.4 million during 2011, compared to $7.0 million in 2010.
Real Estate – Construction Loans. The Bank’s current lending strategy is to reduce exposure in this portfolio segment. The Bank expects that the majority of its new construction and development loans on commercial and residential projects will be in the range of $300,000 to $5.0 million. At December 31, 2011 and 2010, the Bank held $89.4 million and $139.1 million, respectively, of such loans. To reduce credit risk associated with such loans, the Bank emphasizes small commercial centers that are substantially pre-leased, or residential projects that are substantially presold and built in strong, proven markets. The leases on commercial projects must generally result in a loan to appraised value of 75% to 80% or less and a net cash flow to debt service of no less than 120% to 135%. The Bank typically requires a personal guarantee from the developer or builder. Loan terms are generally 12-15 months, although the Bank will make a “mini-permanent” loan for purposes of construction and development of up to a five year term. Rates can be either fixed or variable, and the Bank usually charges an origination fee. The Bank experienced net chargeoffs from real estate – construction loans of $3.5 million in 2011, $5.3 million in 2010 and $11.6 million in 2009.
Commercial Loans. The Bank makes loans for commercial purposes to various types of businesses. At December 31, 2011, the Bank held $547.4 million of commercial loans, or 45.6% of its total loan portfolio. Equipment loans are typically made on terms up to five years at fixed or variable rates, with the financed equipment pledged as collateral to the Bank. The Bank attempts to reduce its credit risk on these loans by limiting the loan to value percentage to 80%. Working capital loans are made on terms typically not exceeding one year. These loans may be secured or unsecured, but the Bank attempts to limit its credit risk by requiring the borrower to demonstrate its capacity to produce net cash flow available for debt service equal to 120% to 150% of its debt service requirements. The Bank experienced net chargeoffs from commercial loans of $4.6 million in 2011, $7.7 million in 2010, and $10.6 million in 2009.
Consumer Loans.Using a centralized underwriting process, the Bank makes a variety of loans to individuals for personal and household purposes, including (i) secured and unsecured installment and term loans originated directly by the Bank; (ii) unsecured revolving lines of credit, and (iii) amortizing secured lot loans. Certain of the direct loans are secured by the borrowers’ residences. At December 31, 2011, the Bank held $34.7 million of consumer loans. During 2011, 2010, and 2009, the Bank experienced net consumer loan chargeoffs of $1.0 million, $2.2 million, and $3.9 million, respectively.
Loan Approval and Review. When the aggregate outstanding loans to a single borrower or related entities exceed an individual officer’s lending authority, the loan request must be considered and approved by an officer with a higher lending limit. All consumer purpose loan decisions are made by the Bank’s Central Underwriting Support Group. Commercial banking managers (“CBM”) can generally approve commercial relationships up to $750,000. If the lending request exceeds the CBM’s lending limit, the loan must be submitted to and approved by a senior credit officer. A senior credit officer has authority to approve commercial relationships up to $2,500,000 on a secured basis. All loan relationships between $2,500,000 and $4,000,000 must be approved by the Chief Commercial Credit Officer (“CCCO”). All loans between $4,000,000 and $7,500,000 must be approved by the Chief Credit Officer (“CCO”). Loan relationships exceeding $7,500,000 up to $10,000,000 must be unanimously approved by a committee of the CCCO, the CCO, and the Bank’s CEO. Loan relationships over $10,000,000 must be approved by the Credit Management Committee of the Bank’s Board of Directors.
The Bank’s Loan Review Program is headed by the Loan Review Manager, who reports directly to the Credit Management Committee of the Bank’s Board of Directors. The Program includes the Annual Loan Review Coverage Plan which is approved by the Credit Management Committee and which stipulates a certain number of loan reviews to be completed by the Loan Review Manager and employees under his or her guidance, and an additional number of loan reviews to be completed by independent loan review consulting firms. In addition, all loan officers are charged with the responsibility of reviewing their portfolios and making adjustments to the risk ratings as needed. The “Watch Loan Committee”, which includes the CCO, the CCCO, the Special Assets Manager and the Special Assets Officers, reviews all commercial loans graded special mention, substandard, doubtful and loss on a monthly basis, and provides a summary to the Credit
| D-17 |
Management Committee, also on a monthly basis. In addition, a committee made up of the Special Assets Manager, Special Assets Officers, senior credit officers and senior lenders reviews all past due loans on a monthly basis and provides a summary to management.
The Bank’s credit review system supplements its loan rating system, pursuant to which the Bank may place a loan on its criticized asset list or may classify a loan in one of various other classification categories. A specified minimum percentage of loans in each adverse asset classification category, based on the probability of default and on the historical loss experience of the Bank in each such category, as well as other environmental factors
such as the unemployment level or other economic conditions affecting that type of loan, are used to determine the adequacy of the Bank’s allowance for credit losses monthly. These loans are also individually reviewed by the Watch Loan Committee of the Bank to determine whether a greater allowance allocation is justified due to the facts and circumstances of a particular adversely classified loan.
The Bank’s loan portfolio is analyzed on an ongoing basis to evaluate current risk levels, and risk grades are adjusted accordingly. The Bank’s allowance for credit losses is also analyzed monthly by management. This analysis includes a methodology that separates the total loan portfolio into homogeneous loan classifications for purposes of evaluating risk. The required allowance is calculated by applying a risk adjusted reserve requirement to the dollar volume of loans within a homogenous group. Major loan portfolio subgroups include: risk graded commercial loans, mortgage loans, home equity loans, retail loans and retail credit lines. The provisions of ASC 310-10-35 “Loans that Are Identified for Evaluation or that Are Individually Considered Impaired” are applied to individually significant loans. Finally, individual reserves may be recorded based on a review of loans on the watch list. See Note 4 in the Notes to Consolidated Financial Statements of this Annual Report on Form 10-K.
| D-18 |
Loan Portfolio – Maturities and Interest Rate Sensitivities
(in thousands, excluding loans held for sale)
| Maturity | Maturity Greater Than One Year | |||||||||||||||||||||||
| One Year or Less | Over One Year to Five Years | Over Five Years | Total | Fixed Interest Rate | Floating or Adjustable Rate | |||||||||||||||||||
Secured by owner-occupied nonfarm non-residential properties | $ | 62,864 | $ | 159,898 | $ | 47,210 | $ | 269,972 | $ | 182,539 | $ | 24,569 | ||||||||||||
Secured by other nonfarm non-residential properties | 21,738 | 96,148 | 39,708 | 157,594 | 92,828 | 43,028 | ||||||||||||||||||
Other commercial and industrial | 53,936 | 53,492 | 12,449 | 119,877 | 55,964 | 9,977 | ||||||||||||||||||
|
|
|
|
|
|
|
|
|
|
|
| |||||||||||||
Total Commercial | $ | 138,538 | $ | 309,538 | $ | 99,367 | $ | 547,443 | $ | 331,331 | $ | 77,574 | ||||||||||||
Construction loans – 1 to 4 family residential | 7,123 | 283 | 375 | 7,781 | 200 | 458 | ||||||||||||||||||
Other construction and land development | 32,582 | 45,017 | 4,031 | 81,630 | 32,666 | 16,382 | ||||||||||||||||||
|
|
|
|
|
|
|
|
|
|
|
| |||||||||||||
Total Real estate – construction | 39,705 | 45,300 | 4,406 | 89,411 | 32,866 | 16,840 | ||||||||||||||||||
Closed-end loans secured by 1 to 4 family residential properties | 47,614 | 74,404 | 165,250 | 287,268 | 101,453 | 138,201 | ||||||||||||||||||
Lines of credit secured by 1 to 4 family residential properties | 1,959 | 13,071 | 194,604 | 209,634 | 53 | 207,622 | ||||||||||||||||||
Loans secured by 5 or more family residential properties | 9,697 | 15,498 | 688 | 25,883 | 9,961 | 6,225 | ||||||||||||||||||
|
|
|
|
|
|
|
|
|
|
|
| |||||||||||||
Total Real estate – mortgage | 59,270 | 102,973 | 360,542 | 522,785 | 111,467 | 352,048 | ||||||||||||||||||
Credit cards | 7,649 | — | — | 7,649 | — | — | ||||||||||||||||||
Other revolving credit plans | 1,824 | 234 | 7,386 | 9,444 | 2,889 | 4,731 | ||||||||||||||||||
Other consumer loans | 2,443 | 14,481 | 724 | 17,648 | 15,170 | 35 | ||||||||||||||||||
|
|
|
|
|
|
|
|
|
|
|
| |||||||||||||
Total Consumer | 11,916 | 14,715 | 8,110 | 34,741 | 18,059 | 4,766 | ||||||||||||||||||
Loans to other depository institutions | — | — | — | — | — | — | ||||||||||||||||||
All other loans | 836 | 2,127 | 2,727 | 5,690 | 4,850 | 4 | ||||||||||||||||||
|
|
|
|
|
|
|
|
|
|
|
| |||||||||||||
Total Other | 836 | 2,127 | 2,727 | 5,690 | 4,850 | 4 | ||||||||||||||||||
|
|
|
|
|
|
|
|
|
|
|
| |||||||||||||
Total | $ | 250,265 | $ | 474,653 | $ | 475,152 | $ | 1,200,070 | $ | 498,573 | $ | 451,232 | ||||||||||||
|
|
|
|
|
|
|
|
|
|
|
| |||||||||||||
Asset Quality
The Bank considers asset quality to be of primary importance, and employs a formal internal loan review process to ensure adherence to its lending policy as approved by the Bank’s Board of Directors. See “Lending Activities – Loan Approval and Review”. It is the responsibility of each commercial lending officer to assign an appropriate risk grade to every loan they originate. Credit Administration, through the loan review process, validates the accuracy of the initial risk grade assessment. In addition, as a given loan’s credit quality improves or deteriorates, it is the lending officer’s responsibility to recommend appropriate changes in the borrower’s risk grade.
Currently, the grading process utilized by the Bank is segmented by product type. This methodology does not provide a direct correlation with groupings utilized in the other tables presenting loan information.
| D-19 |
The following table summarizes, by internally assigned risk grade, the risk grade for loans for which the bank has assigned a risk grade.
Risk Profile by Internally Assigned Risk Grade
(in thousands)
| December 31 | ||||||||||||||||||||||||||||||||||||||||
| 2011 | 2010 | |||||||||||||||||||||||||||||||||||||||
| Pass | Special Mention | Sub- standard | Doubtful | Total | Pass | Special Mention | Sub- standard | Doubtful | Total | |||||||||||||||||||||||||||||||
Commercial | $ | 437,475 | $ | 56,172 | $ | 79,229 | $ | 301 | $ | 573,177 | $ | 423,474 | $ | 48,651 | $ | 75,682 | $ | 1,121 | $ | 548,928 | ||||||||||||||||||||
Real estate – construction | 35,622 | 14,304 | 23,667 | 757 | 74,350 | 66,766 | 13,673 | 47,319 | 630 | 128,388 | ||||||||||||||||||||||||||||||
Real estate – mortgage | 57,089 | 7,363 | 14,517 | 171 | 79,140 | 92,610 | 7,898 | 20,288 | 798 | 121,594 | ||||||||||||||||||||||||||||||
Consumer | — | — | — | — | — | 2 | — | — | — | 2 | ||||||||||||||||||||||||||||||
Other | 4,954 | — | — | — | 4,954 | 3,448 | — | 3,903 | — | 7,351 | ||||||||||||||||||||||||||||||
|
|
|
|
|
|
|
|
|
|
|
|
|
|
|
|
|
|
|
| |||||||||||||||||||||
Total | $ | 535,140 | $ | 77,839 | $ | 117,413 | $ | 1,229 | $ | 731,621 | $ | 586,300 | $ | 70,222 | $ | 147,192 | $ | 2,549 | $ | 806,263 | ||||||||||||||||||||
|
|
|
|
|
|
|
|
|
|
|
|
|
|
|
|
|
|
|
| |||||||||||||||||||||
The Bank’s loan portfolio consists of loans made for a variety of commercial and consumer purposes. Because commercial loans are made based to a great extent on the Bank’s assessment of a borrower’s income, cash flow, character and ability to repay, such loans are generally viewed as involving a higher degree of credit risk than is the case with residential mortgage loans or consumer loans. To manage this risk, the Bank’s commercial loan portfolio is managed under a defined process which includes underwriting standards and risk assessment, procedures for loan approvals, loan grading, ongoing identification and management of credit deterioration and portfolio reviews to assess loss exposure and to ascertain compliance with the Bank’s credit policies and procedures.
Allocation of Allowance for Credit Losses(1)
(dollars in thousands)
| December 31 | ||||||||||||||||||||||||||||||||||||||||
| 2011 | 2010 | 2009 | 2008 | 2007 | ||||||||||||||||||||||||||||||||||||
| Amount | % Of Total Loans | Amount | % Of Total Loans | Amount | % Of Total Loans | Amount | % Of Total Loans | Amount | % Of Total Loans | |||||||||||||||||||||||||||||||
Commercial | $ | 8,526 | 45.6 | % | $ | 9,952 | 40.9 | % | $ | 10,648 | 40.7 | % | $ | 7,351 | 38.5 | % | $ | 11,185 | 38.4 | % | ||||||||||||||||||||
Real estate – construction | 6,467 | 7.4 | 6,865 | 11.0 | 11,662 | 12.2 | 13,039 | 13.6 | 6,945 | 16.6 | ||||||||||||||||||||||||||||||
Real estate – mortgage | 11,953 | 43.6 | 9,056 | 43.2 | 9,615 | 41.1 | 8,555 | 39.5 | 7,928 | 38.6 | ||||||||||||||||||||||||||||||
Consumer | 1,866 | 2.9 | 2,827 | 4.2 | 3,858 | 5.2 | 6,742 | 7.6 | 4,295 | 6.2 | ||||||||||||||||||||||||||||||
Other | 32 | 0.5 | 52 | 0.7 | 60 | 0.8 | 118 | 0.8 | 17 | 0.2 | ||||||||||||||||||||||||||||||
|
|
|
|
|
|
|
|
|
|
|
|
|
|
|
|
|
|
|
| |||||||||||||||||||||
Total | $ | 28,844 | 100.0 | % | $ | 28,752 | 100.0 | % | $ | 35,843 | 100.0 | % | $ | 35,805 | 100.0 | % | $ | 30,370 | 100.0 | % | ||||||||||||||||||||
|
|
|
|
|
|
|
|
|
|
|
|
|
|
|
|
|
|
|
| |||||||||||||||||||||
| (1) | The allowance for credit losses has been allocated on an approximate basis. The allocation is not necessarily indicative of future losses. |
In general, consumer loans (including mortgage and home equity) have a lower risk profile than commercial loans. Commercial loans (including commercial real estate, commercial non real estate and construction loans) are generally larger in size and more complex than consumer loans. Commercial real estate loans are deemed less risky than commercial non real estate and construction loans, because the collateral value of real estate generally maintains its value better than non real estate or construction collateral. The Bank has little or no exposure to subprime lending. Consumer loans, which are smaller in size and more geographically diverse across the Bank’s entire primary market areas, provide risk diversity across the portfolio. Because mortgage loans are secured by first liens on the consumer’s residential real estate, they are the Bank’s lowest risk profile loan type. Home equity loans are deemed less risky than unsecured consumer loans because home equity loans are secured by first or second deeds of trust on the borrower’s residential real estate. A centralized decision-making process is in place to control the risk of the consumer, home equity and mortgage loan portfolio. The consumer real estate appraisal process is also centralized relative to appraisal engagement,
| D-20 |
appraisal review, and appraiser quality assessment. These processes are detailed in the underwriting guidelines, which cover each retail loan product type from underwriting, servicing, compliance issues and closing procedures.
Management follows a loan review program designed to evaluate the credit risk in its loan portfolio. Through this loan review process, the Bank maintains an internally classified watch list that helps management assess the overall quality of the loan portfolio and the adequacy of the allowance for credit losses. In establishing the appropriate classification for specific assets, management considers, among other factors, the estimated value of the underlying collateral, the borrower’s ability to repay, the borrower’s payment history and the current delinquent status. As a result of this process, certain loans are categorized as special mention, substandard, doubtful or loss as described below, and reserves are allocated based on management’s judgment and historical experience.
Special Mention - These loans have potential weaknesses, which may, if not corrected or reversed, weaken the bank's credit position at some future date. The loans may not currently show problems due to the borrower(s)’ apparent ability to service the debt, but special circumstances surround the loans of which the bank and management should be aware. This category may also include loans where repayment has not been satisfactory, where constant attention is required to maintain a set repayment schedule, or where terms of a loan agreement have been violated but the borrower still appears to have sufficient financial strength to avoid a lower rating. It also includes new loans that significantly depart from established loan policy and loans to weak borrowers with a strong guarantor.
Substandard - These are loans whose full final collectability may not appear to be a matter for serious doubt, but which nevertheless have a well-defined weakness or weaknesses that jeopardize the liquidation of the debt and require close supervision by management, such as unprofitable and/or undercapitalized businesses, inability to generate sufficient cash flow for debt reduction, deterioration of collateral and special problems arising from the particular condition of an industry. It also includes workout loans on a liquidation basis when a loss is not expected. Some of these loans are considered impaired.
Doubtful – These loans have all the weakness inherent in loans graded Substandard with the added provision that the weaknesses make collection or liquidation in full, on the basis of currently existing facts, conditions, and value, highly questionable. In some instances, the extent of the potential loss is not currently determinable. Most of these loans are considered impaired.
The function of determining the allowance for credit losses is driven by the risk grade system and the loss experience on non risk graded homogeneous types of loans. The allowance for credit losses represents management’s estimate of the appropriate level of reserve to provide for probable losses inherent in the loan portfolio. In determining the allowance for credit losses and any resulting provision to be charged against earnings, particular emphasis is placed on the results of the loan review process. Consideration is also given to a review of individual loans, historical loan loss experience, the value and adequacy of collateral and economic conditions in the Bank’s market areas. For loans determined to be impaired, the impairment is based on discounted cash flows using the loan’s initial effective interest rate or the fair value of the collateral, less selling and other handling costs, for certain collateral dependent loans. This evaluation is inherently subjective as it requires material estimates, including the amounts and timing of future cash flows expected to be received on impaired loans that may be susceptible to significant change. In addition, various regulatory agencies, as an integral part of their examination process, periodically review the Bank’s allowance for credit losses. Such agencies may require the Bank to recognize changes to the allowance based on their judgments about information available to them at the time of their examinations. Loans are charged off when in the opinion of management, they are deemed to be uncollectible. Recognized losses are charged against the allowance, and subsequent recoveries are added to the allowance.
Management believes the allowance for credit losses of $28.8 million at December 31, 2011 is adequate to cover inherent losses in the loan portfolio; however, assessing the adequacy of the allowance is a process that requires continuous evaluation and considerable judgment. Management’s judgments are based on numerous assumptions about current events which it believes to be reasonable, but which may or may not be valid. Thus, there can be no assurance that credit losses in future periods will not exceed the current allowance or that future increases in the allowance will not be required. No assurance can be given that management’s ongoing
| D-21 |
evaluation of the loan portfolio in light of changing economic conditions and other relevant circumstances will not require significant future additions to the allowance, thus adversely affecting future operating results of the Bank.
The following table presents an analysis of the changes in the allowance for credit losses.
Analysis of Allowance for Credit Losses
(dollars in thousands)
As of or for the Years Ended December 31 | ||||||||||||||||||||
| 2011 | 2010 | 2009 | 2008 | 2007 | ||||||||||||||||
Average amount of loans outstanding | $ | 1,267,601 | $ | 1,398,474 | $ | 1,534,478 | $ | 1,574,809 | $ | 1,049,810 | ||||||||||
Amount of loans outstanding at December 31 | 1,200,070 | 1,332,928 | 1,460,766 | 1,603,588 | 1,477,733 | |||||||||||||||
Allowance for credit losses: | ||||||||||||||||||||
Balance on January 1 | $ | 28,752 | $ | 35,843 | $ | 35,805 | $ | 30,370 | $ | 9,564 | ||||||||||
Loans charged off: | ||||||||||||||||||||
Secured by owner-occupied nonfarm nonresidential properties | 1,131 | 1,433 | 3,108 | 2,745 | — | (1) | ||||||||||||||
Secured by other nonfarm nonresidential properties | 956 | 1,767 | 4,425 | 707 | 1,668 | |||||||||||||||
Other commercial and industrial | 2,958 | 5,852 | 3,699 | 1,594 | 3,384 | |||||||||||||||
|
|
|
|
|
|
|
|
|
| |||||||||||
Total Commercial | 5,045 | 9,052 | 11,232 | 5,046 | 5,052 | |||||||||||||||
Construction loans – 1 to 4 family residential | 209 | 526 | 2,055 | — | — | (1) | ||||||||||||||
Other construction and land development | 3,776 | 4,853 | 10,172 | 7,339 | 825 | |||||||||||||||
|
|
|
|
|
|
|
|
|
| |||||||||||
Total Real estate – construction | 3,985 | 5,379 | 12,227 | 7,339 | 825 | |||||||||||||||
Closed end loans secured by 1 to 4 family residential properties | 3,603 | 4,262 | 4,877 | 3,740 | 437 | |||||||||||||||
Lines of credit secured by 1 to 4 family residential properties | 2,443 | 2,998 | 5,233 | 1,272 | 863 | |||||||||||||||
Loans secured by 5 or more family residential properties | 776 | — | — | — | — | |||||||||||||||
|
|
|
|
|
|
|
|
|
| |||||||||||
Total Real estate – mortgage | 6,822 | 7,260 | 10,110 | 5,012 | 1,300 | |||||||||||||||
Credit Cards | 101 | 291 | 276 | 300 | 221 | |||||||||||||||
Other consumer loans | 1,257 | 2,538 | 4,649 | 4,771 | 2,014 | |||||||||||||||
|
|
|
|
|
|
|
|
|
| |||||||||||
Total Consumer | 1,358 | 2,829 | 4,925 | 5,071 | 2,235 | |||||||||||||||
All Other | 1,387 | 6,200 | — | — | — | |||||||||||||||
|
|
|
|
|
|
|
|
|
| |||||||||||
Total chargeoffs | 18,597 | 30,720 | 38,494 | 22,468 | 9,412 | |||||||||||||||
|
|
|
|
|
|
|
|
|
| |||||||||||
Recoveries of loans previously charged off: | ||||||||||||||||||||
Total Commercial | 495 | 1,370 | 605 | 978 | 210 | |||||||||||||||
Total Real estate – construction | 534 | 80 | 588 | 95 | 8 | |||||||||||||||
Total Real estate – mortgage | 443 | 270 | 514 | 243 | 34 | |||||||||||||||
Total Consumer | 362 | 647 | 1,076 | 1,296 | 702 | |||||||||||||||
Total Other | 70 | 10 | — | 29 | 2 | |||||||||||||||
|
|
|
|
|
|
|
|
|
| |||||||||||
Total recoveries | 1,904 | 2,377 | 2,783 | 2,641 | 956 | |||||||||||||||
|
|
|
|
|
|
|
|
|
| |||||||||||
Net loans charged off | 16,693 | 28,343 | 35,711 | 19,827 | 8,456 | |||||||||||||||
|
|
|
|
|
|
|
|
|
| |||||||||||
Provision for loan losses | 16,785 | 21,252 | 35,749 | 25,262 | 18,952 | |||||||||||||||
|
|
|
|
|
|
|
|
|
| |||||||||||
Allowance acquired via merger | — | — | — | — | 10,310 | |||||||||||||||
|
|
|
|
|
|
|
|
|
| |||||||||||
Balance on December 31 | $ | 28,844 | $ | 28,752 | $ | 35,843 | $ | 35,805 | $ | 30,370 | ||||||||||
|
|
|
|
|
|
|
|
|
| |||||||||||
Net chargeoffs of loans to average loans outstanding during the year | 1.32 | % | 2.03 | % | 2.33 | % | 1.26 | % | 0.81 | % | ||||||||||
|
|
|
|
|
|
|
|
|
| |||||||||||
Allowance to loans outstanding | 2.40 | % | 2.16 | % | 2.45 | % | 2.23 | % | 2.06 | % | ||||||||||
|
|
|
|
|
|
|
|
|
| |||||||||||
Allowance to non-performing loans | 71.16 | % | 56.84 | % | 61.56 | % | 90.52 | % | 234.35 | % | ||||||||||
|
|
|
|
|
|
|
|
|
| |||||||||||
| (1) | Data is not available for these line items prior to 2008 |
| D-22 |
Commercial loans. All commercial loans within the portfolio are risk graded among nine risk grades based on management’s evaluation of the overall credit quality of the loan, including the payment history, the financial position of the borrower, the underlying collateral value, an internal credit risk assessment and examination results. As a result, the allowance is adjusted upon any migration of a loan to a higher or lower risk grade within the commercial loan portfolio. The reserve percentages utilized have been determined by management to be appropriate based on historical loan loss levels and the risk for each corresponding risk grade.
Mortgage, home equity, and credit lines. Reserves are calculated on mortgage, home equity, and credit lines based on historical loss experience. The average rolling eight quarter net loss percentage is calculated for each of these loan categories, and is multiplied by the dollar balance of loans in each of these categories to determine the required reserve.
Consumer loans. The consumer loans are pooled together to determine the reserve requirement. The average rolling eight quarter net loss percentage is calculated for this loan category, and is multiplied by the dollar balance of retail loans to determine a required reserve. An additional reserve, equal to 25.0% of all retail loans past due 90 days or more, is added to the above.
Specific impairment.Management evaluates significant loans graded substandard, doubtful and loss on an individual basis for impairment. The specific allowance is calculated based upon a review of these loans and the estimated losses at the balance sheet date. At December 31, 2011 and 2010, the recorded investment in loans specifically identified and evaluated for impairment was approximately $32.6 million and $38.3 million, respectively and the specific allowance for credit losses associated with those loans was approximately $4.2 million and $1.9 million, respectively. The decrease in the amount of specifically impaired loans held by the Bank and the associated allowance for credit losses resulted primarily from the Bank’s decision to take appropriate aggressive action with our problem credits through chargeoffs and foreclosure.
Other potential problem loans. Loans graded substandard, doubtful and loss which do not fit the criteria to be considered significant are not evaluated on an individual basis for impairment. However, the Bank closely monitors such loans as a result of their elevated risk profile. As a result of the Bank’s discipline, the balance of these other potential problem loans decreased to $88.0 million at December 31, 2011 from $110.9 million at December 31, 2010. The loans that make up this category trended as management had projected and reached a peak level in the third quarter of 2010. These loans, while exhibiting signs of weakness, continue to perform pursuant to stated terms and conditions and therefore do not have specifically identified expected losses. Approximately 75% of the loans in this category are identified as commercial and industrial or income producing commercial real estate, which management assigns a lower probability of default and/or loss given default. The allowance for credit losses associated with such loans was $3.9 million at December 31, 2011, which was based on a model that uses probability of default, and expected loss in the event of default, to determine inherent losses within a given group of loans.
Provision for credit losses. The 2011 provision for credit losses totaled $16.8 million, compared to $21.3 million in 2010. As of December 31, 2011, nonperforming assets totaled $71.1 million, comprised of $40.5 million in nonperforming loans and $30.6 million in real estate acquired in settlement of loans. Those figures compare to $50.6 million in nonperforming loans and $26.7 million in real estate acquired in settlement of loans at the end of 2010, totaling $77.3 million in nonperforming assets. Net chargeoffs decreased in 2011 to $16.7 million, or 1.31% of average loans outstanding, compared with $28.3 million, or 2.01% of average loans outstanding, in the prior year. During the fourth quarter of 2010, the Company charged off $6.2 million of a $10.0 million loan composed of subordinated debt to a financial institution. In the first quarter of 2011, an additional writedown of $1.3 million was recorded on this loan. The Bank forgave $5.0 million of the loan and all unpaid interest and the remaining $5.0 million was exchanged for preferred stock with a liquidation preference value of $5.0 million in the institution. The Bank’s recorded investment of $2.5 million is carried in other assets on the Company’s balance sheet as of December 31, 2011. Periodic impairment evaluations are performed and management believes this asset is currently not impaired. The Company does not have any other loans to financial institutions. At December 31, 2011 and 2010 the allowance for credit losses as a percentage of year end loans (excluding loans held for sale) was 2.39% and 2.15%, respectively. The 2011 and 2010 results have been impacted by the continued weakness in the regional and national economies.
| D-23 |
Nonperforming Assets
(dollars in thousands)
| December 31 | ||||||||||||||||||||
| 2011 | 2010 | 2009 | 2008 | 2007 | ||||||||||||||||
Commercial nonaccrual loans, not restructured | $ | 15,773 | $ | 23,453 | $ | 46,788 | $ | 32,428 | $ | 8,688 | ||||||||||
Commercial nonaccrual loans, restructured | 7,489 | 11,190 | 1,777 | 160 | — | |||||||||||||||
Non-commercial nonaccrual loans | 9,852 | 8,537 | 4,772 | 5,601 | 3,548 | |||||||||||||||
|
|
|
|
|
|
|
|
|
| |||||||||||
Total nonaccrual loans | 33,114 | 43,180 | 53,337 | 38,189 | 12,236 | |||||||||||||||
Loans past due 90 days or more and still accruing | 14 | 27 | 3,450 | 1,277 | 72 | |||||||||||||||
Accruing restructured loans | 7,406 | 7,378 | 1,442 | 90 | 651 | |||||||||||||||
|
|
|
|
|
|
|
|
|
| |||||||||||
Total nonperforming loans | 40,534 | 50,585 | 58,229 | 39,556 | 12,959 | |||||||||||||||
Real estate acquired in settlement of loans | 30,587 | 26,718 | 27,337 | 9,080 | 4,280 | |||||||||||||||
|
|
|
|
|
|
|
|
|
| |||||||||||
Total nonperforming assets | $ | 71,121 | $ | 77,303 | $ | 85,566 | $ | 48,636 | $ | 17,239 | ||||||||||
|
|
|
|
|
|
|
|
|
| |||||||||||
Restructured loans, performing(1) | $ | 4,888 | $ | — | $ | — | $ | — | $ | — | ||||||||||
|
|
|
|
|
|
|
|
|
| |||||||||||
Nonperforming loans to loans outstanding at end of year | 3.36 | % | 4.01 | % | 3.98 | % | 2.47 | % | 0.87 | % | ||||||||||
Nonperforming assets to total assets at end of year | 4.10 | % | 4.28 | % | 4.40 | % | 2.34 | % | 0.84 | % | ||||||||||
| (1) | Loans restructured in a previous year without an interest rate concession or forgiveness of debt that are performing in accordance with their modified terms. |
Nonperforming assets include nonaccrual loans, accruing loans contractually past due 90 days or more, restructured loans, and real estate acquired in settlement of loans. Loans are placed on nonaccrual status when: (i) management has concerns relating to the ability to collect the loan principal and interest and (ii) generally when such loans are 90 days or more past due. No assurance can be given, however, that economic conditions will not adversely affect borrowers and result in increased credit losses.
The Bank’s policy for impaired loan accounting subjects all loans to impairment recognition except for large groups of smaller balance homogeneous loans such as credit card, residential mortgage and consumer loans. The Bank generally considers loans 90 days or more past due, all nonaccrual loans, and all TDRs to be impaired. Loans specifically indentified and evaluated for impairment totaled $32.6 million and $38.3 million at December 31, 2011 and December 31, 2010, respectively, as summarized in the following tables (in thousands):
| Impaired Loans | Average | |||||||||||||||
| Recorded Balance | Unpaid principal Balance | Specific Allowance | Recorded Investment | |||||||||||||
December 31, 2011 | ||||||||||||||||
Loans without a specific valuation allowance | ||||||||||||||||
Commercial | $ | 2,722 | $ | 2,856 | $ | — | $ | 3,497 | ||||||||
Real estate- construction | 6,874 | 8,571 | — | 8,655 | ||||||||||||
Real estate – mortgage | 6,429 | 6,536 | — | 8,128 | ||||||||||||
Consumer | — | — | — | 57 | ||||||||||||
|
|
|
|
|
|
|
| |||||||||
Total | 16,025 | 17,963 | — | 20,337 | ||||||||||||
Loans with a specific valuation allowance | ||||||||||||||||
Commercial | 8,014 | 8,329 | 1,972 | 4,251 | ||||||||||||
Real estate- construction | 1,495 | 1,515 | 203 | 2,954 | ||||||||||||
Real estate – mortgage | 6,940 | 7,240 | 1,874 | 7,472 | ||||||||||||
| D-24 |
| Impaired Loans | ||||||||||||||||
| Recorded Balance | Unpaid principal Balance | Specific Allowance | Average Recorded Investment | |||||||||||||
Consumer | 117 | 117 | 117 | 86 | ||||||||||||
|
|
|
|
|
|
|
| |||||||||
Total | 16,566 | 17,201 | 4,166 | 14,763 | ||||||||||||
Total impaired loans | ||||||||||||||||
Commercial | 10,736 | 11,185 | 1,972 | 7,749 | ||||||||||||
Real estate- construction | 8,369 | 10,086 | 203 | 11,608 | ||||||||||||
Real estate – mortgage | 13,369 | 13,776 | 1,874 | 15,600 | ||||||||||||
Consumer | 117 | 117 | 117 | 143 | ||||||||||||
|
|
|
|
|
|
|
| |||||||||
Total | $ | 32,591 | $ | 35,164 | $ | 4,166 | $ | 35,100 | ||||||||
|
|
|
|
|
|
|
| |||||||||
| Impaired Loans | ||||||||||||
| Recorded Balance | Unpaid principal Balance | Specific Allowance | ||||||||||
December 31, 2010(1) | ||||||||||||
Loans without a specific valuation allowance | ||||||||||||
Commercial | $ | 4,651 | $ | 5,437 | $ | — | ||||||
Real estate- construction | 12,489 | 17,165 | — | |||||||||
Real estate – mortgage | 6,633 | 7,676 | — | |||||||||
Consumer | 112 | 112 | — | |||||||||
Other | 3,800 | 10,000 | — | |||||||||
|
|
|
|
|
| |||||||
Total | 27,685 | 40,390 | — | |||||||||
Loans with a specific valuation allowance | ||||||||||||
Commercial | 1,375 | 1,482 | 578 | |||||||||
Real estate- construction | 1,606 | 2,577 | 251 | |||||||||
Real estate – mortgage | 7,290 | 7,290 | 976 | |||||||||
Consumer | 347 | 347 | 122 | |||||||||
Other | — | — | — | |||||||||
|
|
|
|
|
| |||||||
Total | 10,618 | 11,696 | 1,927 | |||||||||
Total impaired loans | ||||||||||||
Commercial | 6,026 | 6,919 | 578 | |||||||||
Real estate- construction | 14,095 | 19,742 | 251 | |||||||||
Real estate – mortgage | 13,923 | 14,966 | 976 | |||||||||
Consumer | 459 | 459 | 122 | |||||||||
Other | 3,800 | 10,000 | — | |||||||||
|
|
|
|
|
| |||||||
Total | $ | 38,303 | $ | 52,086 | $ | 1,927 | ||||||
| (1) | Data for Average Recorded Investment for 2010 is not available. |
Impaired, nonperforming and other potential problem loans and related information are summarized in the following table (in thousands):
| December 31 | ||||||||||||
| 2011 | 2010 | 2009 | ||||||||||
Loans identified as impaired | $ | 32,591 | $ | 38,303 | $ | 46,122 | ||||||
Other nonperforming loans | 7,943 | 12,282 | 12,107 | |||||||||
|
|
|
|
|
| |||||||
Total nonperforming loans | 40,534 | 50,585 | 58,229 | |||||||||
Other potential problem loans | 87,959 | 110,924 | 66,725 | |||||||||
|
|
|
|
|
| |||||||
Total impaired and potential problem loans | $ | 128,493 | $ | 161,509 | $ | 124,954 | ||||||
|
|
|
|
|
| |||||||
| D-25 |
Investment Activities
Our investment portfolio plays a primary role in the management of liquidity and interest rate sensitivity and, therefore, is managed in the context of the overall balance sheet. In 2011, the securities portfolio generated approximately 17% of our interest income and served as a necessary source of liquidity.
Management attempts to deploy investable funds into instruments that are expected to increase the overall return of the portfolio given the current assessment of economic and financial conditions, while maintaining acceptable levels of credit, interest rate and liquidity risk, as well as capital usage and risk.
The following tables present the carrying values, fair values, unrealized gains and losses, and weighted average yields and durations of our investment portfolio at December 31, 2011, 2010 and 2009, as well as the interval of maturities or repricings at December 31, 2011.
Investment Securities
(in thousands)
| December 31, 2011 | December 31, 2010 | December 31, 2009 | ||||||||||||||||||||||
| Amortized Cost | Market Value | Amortized Cost | Market Value | Amortized Cost | Market Value | |||||||||||||||||||
U.S. government agencies obligations | $ | 39,000 | $ | 39,147 | $ | 109,274 | $ | 107,524 | $ | 49,005 | $ | 49,519 | ||||||||||||
Mortgage backed securities | 31,917 | 34,843 | 55,989 | 60,309 | 77,430 | 81,690 | ||||||||||||||||||
Collateralized mortgage obligations | 23,599 | 23,435 | 39,679 | 40,412 | 35,124 | 35,368 | ||||||||||||||||||
Commercial mortgage backed securities | 30,169 | 30,289 | — | — | — | — | ||||||||||||||||||
Corporate bonds | 118,573 | 114,676 | 38,560 | 38,455 | 33,978 | 35,604 | ||||||||||||||||||
Covered bonds | 61,414 | 62,526 | 44,256 | 46,058 | — | — | ||||||||||||||||||
State and municipal obligations | 19,371 | 19,508 | 17,380 | 15,411 | 105,169 | 105,994 | ||||||||||||||||||
|
|
|
|
|
|
|
|
|
|
|
| |||||||||||||
Total debt securities | 324,043 | 324,424 | 305,138 | 308,169 | 300,706 | 308,175 | ||||||||||||||||||
Other equity | 12,960 | 13,387 | 16,174 | 16,960 | 17,189 | 17,694 | ||||||||||||||||||
|
|
|
|
|
|
|
|
|
|
|
| |||||||||||||
Total securities | $ | 337,003 | $ | 337,811 | $ | 321,312 | $ | 325,129 | $ | 317,895 | $ | 325,869 | ||||||||||||
|
|
|
|
|
|
|
|
|
|
|
| |||||||||||||
Investment securities at December 31 consist of the following (dollars in thousands):
| Amortized Cost | Gross Unrealized Gains | Gross Unrealized Losses | Estimated Fair Value | Average Yield | Average Duration(1) | |||||||||||||||||||
| 2011: | ||||||||||||||||||||||||
| U.S. government agency securities | $ | 39,000 | $ | 147 | $ | — | $ | 39,147 | 2.79 | % | 1.06 | |||||||||||||
| Mortgage backed securities | 31,917 | 2,926 | — | 34,843 | 5.21 | 3.55 | ||||||||||||||||||
| Collateralized mortgage obligations | 23,599 | 168 | (332 | ) | 23,435 | 4.69 | 2.03 | |||||||||||||||||
| Commercial mortgage backed securities | 30,169 | 153 | (33 | ) | 30,289 | 3.47 | 4.43 | |||||||||||||||||
| Corporate bonds | 118,573 | 385 | (4,282 | ) | 114,676 | 3.77 | 3.98 | |||||||||||||||||
| Covered bonds | 61,414 | 1,243 | (131 | ) | 62,526 | 5.25 | 2.12 | |||||||||||||||||
| State and municipal obligations | 19,371 | 425 | (288 | ) | 19,508 | 6.01 | (2) | 5.64 | ||||||||||||||||
| Total debt securities | 324,043 | 5,447 | (5,066 | ) | 324,424 | 4.13 | (2) | 3.37 | ||||||||||||||||
| Federal Home Loan Bank stock | 7,185 | — | — | 7,185 | ||||||||||||||||||||
| Other equity securities | 5,775 | 427 | — | 6,202 | ||||||||||||||||||||
| Total investment securities | $ | 337,003 | $ | 5,874 | $ | (5,066 | ) | $ | 337,811 | |||||||||||||||
| D-26 |
| Amortized Cost | Gross Unrealized Gains | Gross Unrealized Losses | Estimated Fair Value | Average Yield | Average Duration(1) | |||||||||||||||||||
| 2010: | ||||||||||||||||||||||||
| U.S. government agency securities | $ | 109,274 | $ | 267 | $ | (2,017 | ) | $ | 107,524 | 3.88 | % | 6.10 | ||||||||||||
| Mortgage backed securities | 55,989 | 4,320 | — | 60,309 | 5.65 | 2.14 | ||||||||||||||||||
| Collateralized mortgage obligations | 39,679 | 823 | (90 | ) | 40,412 | 5.52 | 2.10 | |||||||||||||||||
| Corporate bonds | 38,560 | 507 | (612 | ) | 38,455 | 5.50 | 6.42 | |||||||||||||||||
| Covered bonds | 44,256 | 1,802 | — | 46,058 | 5.30 | 2.62 | ||||||||||||||||||
| State and municipal obligations | 17,380 | 13 | (1,982 | ) | 15,411 | 6.71 | (2) | 11.46 | ||||||||||||||||
| Total debt securities | 305,138 | 7,732 | (4,701 | ) | 308,169 | 4.96 | (2) | 4.69 | ||||||||||||||||
| Federal Home Loan Bank stock | 10,399 | — | — | 10,399 | ||||||||||||||||||||
| Other equity securities | 5,775 | 786 | — | 6,561 | ||||||||||||||||||||
| Total investment securities | $ | 321,312 | $ | 8,518 | $ | (4,701 | ) | $ | 325,129 | |||||||||||||||
| (1) | Average remaining duration to maturity, in years |
| (2) | Fully taxable equivalent basis |
Investment Securities Portfolio Maturity Schedule
(dollars in thousands)
| December 31, 2011 | ||||||||
| Market Value | Weighted Average Yield(1) | |||||||
U. S. government agencies and mortgage backed obligations: | ||||||||
Within one year | $ | — | — | % | ||||
One to five years | 4,006 | 1.70 | ||||||
Five to ten years | 35,498 | 3.30 | ||||||
After ten years | 88,210 | 4.33 | ||||||
|
| |||||||
Total | 127,714 | 3.93 | ||||||
|
| |||||||
Obligations of states and political subdivisions: | ||||||||
Within one year | — | — | ||||||
One to five years | 466 | 7.89 | ||||||
Five to ten years | 2,428 | 6.31 | ||||||
After ten years | 16,614 | 6.39 | ||||||
|
| |||||||
Total | 19,508 | 6.41 | ||||||
|
| |||||||
Corporate bonds and covered bonds: | ||||||||
Within one year | 21,834 | 5.40 | ||||||
One to five years | 109,246 | 3.28 | ||||||
Five to ten years | 46,122 | 5.31 | ||||||
After ten years | — | — | ||||||
|
| |||||||
Total | 177,202 | 4.07 | ||||||
|
| |||||||
Total debt securities | $ | 324,424 | 4.17 | % | ||||
|
| |||||||
| (1) | The yield related to securities exempt from federal income taxes is stated on a fully taxable-equivalent basis, assuming a federal income tax rate of 35%. |
See also Note 3 in the Notes to Consolidated Financial Statements of this Annual Report on Form 10-K.
| D-27 |
Off-Balance Sheet Arrangements
Information about the Company’s off-balance sheet risk exposure is presented in Note 16 in the Notes to the Consolidated Financial Statements of this Annual Report on Form 10-K.
Market Risk
Market risk is the risk of loss arising from adverse changes in the fair values of financial instruments or other assets caused by changes in interest rates, currency exchange rates, or equity prices. Interest rate risk is the Company’s primary market risk and results from timing differences in the repricing of assets and liabilities, changes in relationships between rate indices, and the potential exercise of explicit or embedded options.
For a complete discussion on market risk and how the Company addresses this risk, see Item 7A of this Annual Report on Form 10-K.
Effects of Inflation
As discussed in Item 7A of this Annual Report on Form 10-K, the effect of interest rate movements in response to changes in the actual and perceived rates of inflation can materially impact bank operations, which rely on net interest margins as a major source of earnings. Noninterest expense, such as salaries and wages, occupancy and equipment are also negatively affected by inflation.
Application of Critical Accounting Policies
The Company's accounting policies are in accordance with accounting principles generally accepted in the United States and with general practice within the banking industry, and are fundamental to understanding management's discussion and analysis of results of operations and financial condition. The Company's significant accounting policies are discussed in detail in Note 1 in the Notes to the Consolidated Financial Statements of this Annual Report on Form 10-K. The following is a summary of the Bank’s allowance for credit losses, one of the most complex and judgmental accounting policies of the Company.
The allowance for credit losses, which is utilized to absorb actual losses in the loan portfolio, is maintained at a level consistent with management’s best estimate of probable credit losses incurred as of the balance sheet date. The Bank’s allowance for credit losses is also analyzed monthly by management. This analysis includes a methodology based on a risk grading system that separates non risk grade loans into homogeneous loan classifications for purposes of evaluating risk. The required allowance is calculated by applying a risk adjusted reserve requirement to the dollar volume of loans within a homogenous group. Major loan portfolio subgroups include: risk graded commercial loans, mortgage loans, home equity loans, retail loans and retail credit lines. Management also analyzes the loan portfolio on an ongoing basis to evaluate current risk levels, and risk grades are adjusted accordingly. While management uses the best information available to make evaluations, future adjustments may be necessary, if economic or other conditions differ substantially from the assumptions used. See additional discussion under “Asset Quality” above.
| Item 7A. | QUANTITATIVEAND QUALITATIVE DISCLOSURES ABOUT MARKET RISK |
The Company’s primary market risk is considered to be the Bank’s interest rate risk which could potentially have the greatest impact on operating earnings. The Bank is not subject to other types of market risk, such as foreign currency exchange rate risk, commodity or equity price risk. Interest rate risk on our balance sheet arises from the maturity mismatch of interest-earning assets versus interest-bearing liabilities, as well as the potential for maturities to shorten or lengthen our interest-earning assets and interest-bearing liabilities. In addition, market risk is the possible chance of loss from unfavorable changes in market prices and rates. These changes may result in a reduction of current and future period net interest income, which is the favorable spread earned from the excess of interest income on interest-earning assets, over interest expense on interest-bearing liabilities.
The Company uses several interest rate risk measurement tools provided by a national asset liability management consultant to help manage this risk. The Bank’s Asset/Liability policy provides guidance for acceptable levels of interest rate risk and potential remediations. Management provides the consultant with key assumptions, which are used as inputs into the measurement tools. Following is a summary of two different tools management uses on a quarterly basis to monitor and manage interest rate risk.
| D-28 |
Earnings Simulation Modeling.Net income is affected by changes in the level of interest rates, the shape of the yield curve and the general market pressures affecting current market interest rates at the time of simulation. Many interest rate indices do not move uniformly, creating certain disunities between them. For example, the spread between a 30 day, prime-based asset and a 30 day, FHLB advance may not be uniform over time. The earnings simulation model projects changes in net interest income caused by the effect of changes in interest rates on interest-earning assets and interest-bearing liabilities. Simulation results are measured as a percentage change in net interest income compared to the static-rate or “base case” scenario. The model uses the Company’s current balance sheet, but considers decreases in asset and liability volumes based on prepayment assumptions as well as rate changes. Rate changes are modeled gradually over a 12 month period, referred to as a “rate ramp.” The model projects only changes in interest income and expense and does not project changes in non-interest income, non-interest expense, provision for loan losses or the impact of changing tax rates. At December 31, 2011, net interest income simulation showed a positive .64% change from the base case in a 200 basis point ramped rising rate environment and a positive 0.22% change from the base case in a 100 basis point ramped declining rate environment. The projected changes in net interest income are within the Asset/Liability Committee’s guidelines in a 200 basis point increasing or 100 basis point decreasing interest rate environment. However, management continually monitors signs of elevated risks and takes certain actions to limit these risks.
The following table summarizes the results of the Company’s income simulation model as of December 31, 2010.
| Change in Net Interest Income | ||||||||
| Year 1 | Year 2 | |||||||
Change in Market Interest Rates: | ||||||||
200 basis point ramped increase | 0.64 | % | (5.32 | )% | ||||
Base case – no change | — | (3.46 | )% | |||||
100 basis point ramped decrease | 0.22 | % | (1.73 | )% | ||||
Net Portfolio Value Analysis.Net portfolio value (“NPV”) represents the market value of portfolio equity and is equal to the market value of assets minus the market value of liabilities, with adjustments made for off-balance sheet items. This analysis assesses the risk of loss in market risk sensitive instruments in the event of a sudden and sustained 100 to 200 basis point increase or decrease in market interest rates with no effect given to any actions management might take to counter the effect of that interest rate movement. The following is a summary of the results of the report compiled by the Company’s outside consultant using data and assumptions management provided as of December 31, 2011.
| Estimated Change in Net Portfolio Value | ||||||||
| Amount in 000s | Percent | |||||||
Change in Market Interest Rates: | ||||||||
200 basis point increase | $ | 1,671 | .92 | % | ||||
Base case – no change | — | — | ||||||
100 basis point decrease | $ | (16,763 | ) | 9.22 | % | |||
The preceding table indicates that, at December 31, 2011, in the event of a 200 basis point increase in prevailing market interest rates, NPV would be expected to decrease by $1.7 million, or .9% of the base case scenario value of $181.8 million. In the event of a decrease in prevailing market rates of 100 basis points, NPV would be expected to decline by $16.8 million, or 9.2% of the base case scenario value. The projected changes in NPV are within the Asset/Liability Committee’s guidelines in a 200 basis point increasing or 100 basis point decreasing interest rate environment. However, management continually monitors signs of elevated risks and takes certain actions to limit these risks.
Interest rate risk management is a part of the Bank’s overall asset/liability management process. The primary oversight of asset/liability management rests with the Bank’s Asset and Liability Committee, which is comprised of the Bank’s CEO, Chief Financial Officer (“CFO”) and other senior executives. The Committee
| D-29 |
meets approximately twice per quarter to review the asset/liability management activities of the Bank and monitor compliance with established policies. Activities of the Asset and Liability Committee are reported to the Audit and Risk Management Committee of the Company’s Board of Directors.
A primary objective of interest rate sensitivity management is to ensure the stability and quality of the Bank’s primary earnings component, net interest income. This process involves monitoring the Bank’s balance sheet in order to determine the potential impact that changes in the interest rate environment may have on net interest income. Rate sensitive assets and liabilities have interest rates that are subject to change within a specific time period, due to either maturity or to contractual agreements which allow the instruments to reprice prior to maturity. Interest rate sensitivity management seeks to ensure that both assets and liabilities react to changes in interest rates within a similar time period, thereby minimizing the risk to net interest income.
Interest Sensitivity Analysis
At December 31, 2011
(in thousands, except ratios)
| 1 – 90 Day Sensitive | 91 – 365 Day Sensitive | Total Sensitive Within One Year | Total Sensitive Over One Year | Total | ||||||||||||||||
Interest earning assets: | ||||||||||||||||||||
Loans (excluding held for sale), net of unearned income | $ | 382,370 | $ | 178,680 | $ | 561,050 | $ | 639,020 | $ | 1,200,070 | ||||||||||
U. S. government agencies and mortgage backed obligations | — | — | — | 124,685 | 124,685 | |||||||||||||||
State and municipal obligations | — | — | — | 19,371 | 19,371 | |||||||||||||||
Corporate and covered bonds | — | 21,409 | 21,409 | 158,578 | 179,987 | |||||||||||||||
Other investment securities | 7,185 | — | 7,185 | 5,775 | 12,960 | |||||||||||||||
Overnight funds | 26,363 | — | 26,363 | — | 26,363 | |||||||||||||||
|
|
|
|
|
|
|
|
|
| |||||||||||
Total interest earning assets | 415,918 | 200,089 | 616,007 | 947,429 | 1,563,436 | |||||||||||||||
|
|
|
|
|
|
|
|
|
| |||||||||||
Interest bearing liabilities: | ||||||||||||||||||||
NOW | 441,292 | — | 441,292 | — | 441,292 | |||||||||||||||
MMI | 370,773 | — | 370,773 | — | 370,773 | |||||||||||||||
Savings | 40,876 | — | 40,876 | — | 40,876 | |||||||||||||||
Time deposits | 137,565 | 204,440 | 342,005 | 51,379 | 393,384 | |||||||||||||||
Junior subordinated notes | 25,774 | — | 25,774 | — | 25,774 | |||||||||||||||
FHLB borrowings | 36,700 | 15,000 | 51,700 | 35,000 | 86,700 | |||||||||||||||
Wholesale repurchase agreements | 21,000 | — | 21,000 | — | 21,000 | |||||||||||||||
|
|
|
|
|
|
|
|
|
| |||||||||||
Total interest bearing liabilities | 1,073,980 | 219,440 | 1,293,420 | 86,379 | 1,379,799 | |||||||||||||||
|
|
|
|
|
|
|
|
|
| |||||||||||
Interest sensitivity gap | $ | (658,062 | ) | $ | (19,351 | ) | $ | (677,413 | ) | $ | 861,050 | $ | 183,637 | |||||||
|
|
|
|
|
|
|
|
|
| |||||||||||
Ratio of interest sensitive assets to liabilities | 0.39 | 0.91 | 0.48 | 10.97 | 1.13 | |||||||||||||||
The measurement of the Bank’s interest rate sensitivity, or “gap”, is a technique traditionally used in asset/liability management. The interest sensitivity gap is the difference between repricing assets and repricing liabilities for a particular time period. The table, “Interest Sensitivity Analysis,” indicates a ratio of rate sensitive assets to rate sensitive liabilities within one year at December 31, 2011, to be 0.48X. This ratio indicates that a larger balance of liabilities, compared to assets, could potentially reprice during the upcoming 12 month period. Included in rate sensitive liabilities are certain deposit accounts (NOW, MMI, and savings) that are subject to immediate withdrawal and repricing. These balances are presented in the category that management believes best identifies their actual repricing patterns. The overall risk to net interest income is also influenced by the Bank’s level of variable rate loans. These are loans with a contractual interest rate tied to an interest rate index, such as the prime rate. A portion of these loans may reprice on multiple occasions
| D-30 |
during a one-year period due to changes in the underlying interest rate index. Approximately 45.7% of the total loan portfolio at December 31, 2011 had a variable interest rate and reprices in accordance with the underlying rate index subject to terms of individual note agreements.
The table, “Market Sensitive Financial Instruments Maturities,” presents the Company’s financial instruments that are considered to be sensitive to changes in interest rates, categorized by contractual maturities, average interest rates and estimated fair values as of December 31, 2011.
Market Sensitive Financial Instruments Maturities
(Dollars in thousands)
| Contractual Maturities as of December 31, 2011 | ||||||||||||||||||||||||||||
| 2012 | 2013 | 2014 | 2015 | 2016 | After Five Years | Total | ||||||||||||||||||||||
Financial assets: | ||||||||||||||||||||||||||||
Investment securities | $ | 21,409 | $ | 20,459 | $ | 17,000 | $ | 22,381 | $ | 56,398 | $ | 186,396 | $ | 324,043 | ||||||||||||||
Loans: | ||||||||||||||||||||||||||||
Fixed rate | 153,008 | 113,250 | 89,555 | 86,288 | 74,871 | 134,603 | 651,580 | |||||||||||||||||||||
Variable rate | 97,257 | 37,378 | 35,578 | 18,532 | 19,200 | 340,545 | 548,490 | |||||||||||||||||||||
|
|
|
|
|
|
|
|
|
|
|
|
|
| |||||||||||||||
Total | $ | 271,674 | $ | 171,087 | $ | 142,133 | $ | 127,201 | $ | 150,469 | $ | 661,549 | $ | 1,524,113 | ||||||||||||||
|
|
|
|
|
|
|
|
|
|
|
|
|
| |||||||||||||||
Financial liabilities: | ||||||||||||||||||||||||||||
NOW | $ | 441,292 | $ | — | $ | — | $ | — | $ | — | $ | — | $ | 441,292 | ||||||||||||||
MMI | 370,773 | — | — | — | — | — | 370,773 | |||||||||||||||||||||
Savings | 40,876 | — | — | — | — | — | 40,876 | |||||||||||||||||||||
Time deposits | 342,005 | 20,095 | 23,702 | 7,140 | 340 | 102 | 393,384 | |||||||||||||||||||||
Wholesale repurchase agreements | — | — | — | — | 21,000 | — | 21,000 | |||||||||||||||||||||
FHLB borrowing | 51,700 | 15,000 | 20,000 | — | — | — | 86,700 | |||||||||||||||||||||
Junior subordinated notes | — | — | — | — | — | 25,774 | 25,774 | |||||||||||||||||||||
|
|
|
|
|
|
|
|
|
|
|
|
|
| |||||||||||||||
Total | $ | 1,246,646 | $ | 35,095 | $ | 43,702 | $ | 7,140 | $ | 21,340 | $ | 25,876 | $ | 1,379,799 | ||||||||||||||
|
|
|
|
|
|
|
|
|
|
|
|
|
| |||||||||||||||
Market Sensitive Financial Instruments Maturities (continued)
(Dollars in thousands)
| Average Interest Rate | Estimated Fair Value | |||||||
Financial assets: | ||||||||
Investment securities | 4.03 | % | $ | 337,811 | ||||
Loans: | ||||||||
Fixed rate | 5.65 | 649,395 | ||||||
Variable rate | 4.25 | 548,490 | ||||||
|
| |||||||
Total | $ | 1,535,696 | ||||||
|
| |||||||
Financial liabilities: | ||||||||
NOW | 0.45 | $ | 441,292 | |||||
MMI | 0.57 | 370,773 | ||||||
Savings | 0.10 | 40,876 | ||||||
Time deposits | 0.93 | 395,412 | ||||||
Wholesale repurchase agreements | 4.03 | 23,772 | ||||||
FHLB borrowing | 1.26 | 87,911 | ||||||
Junior subordinated notes | 1.79 | 10,857 | ||||||
|
| |||||||
Total | $ | 1,370,893 | ||||||
|
| |||||||
| D-31 |
[This page intentionally left blank.]
APPENDIX E
Unaudited Consolidated Financial Statements (including Notes thereto) at September 30, 2012 and December 31, 2011, and for the three-month and nine-month periods ended September 30, 2012 and September 30, 2011, as included in our Quarterly Report on Form 10-Q for the fiscal quarter ended September 30, 2012
| E-1 |
PART I
FINANCIAL INFORMATION
Item 1. Financial Statements.
NewBridge Bancorp and Subsidiary
Consolidated Balance Sheets
(Dollars in thousands, except per share data)
| September 30 | December 31 | |||||||
| 2012 | 2011 | |||||||
| (Unaudited) | ||||||||
| Assets | ||||||||
| Cash and due from banks | $ | 32,095 | $ | 27,629 | ||||
| Interest-bearing bank balances | 10,646 | 26,363 | ||||||
| Loans held for sale | 7,074 | 7,851 | ||||||
| Investment securities | 387,376 | 337,811 | ||||||
| Loans | 1,168,747 | 1,200,070 | ||||||
| Less allowance for credit losses | (35,016 | ) | (28,844 | ) | ||||
| Net loans | 1,133,731 | 1,171,226 | ||||||
| Premises and equipment | 36,637 | 36,225 | ||||||
| Real estate acquired in settlement of loans | 10,465 | 30,587 | ||||||
| Bank-owned life insurance | 44,940 | 43,727 | ||||||
| Deferred tax assets | 29,966 | 32,263 | ||||||
| Other assets | 20,979 | 20,882 | ||||||
| Total assets | $ | 1,713,909 | $ | 1,734,564 | ||||
| Liabilities | ||||||||
| Noninterest-bearing deposits | $ | 184,942 | $ | 172,351 | ||||
| NOW deposits | 429,792 | 441,292 | ||||||
| Savings and money market deposits | 395,179 | 411,649 | ||||||
| Time deposits | 379,823 | 393,384 | ||||||
| Total deposits | 1,389,736 | 1,418,676 | ||||||
| Borrowings from the Federal Home Loan Bank | 117,200 | 86,700 | ||||||
| Other borrowings | 46,774 | 46,774 | ||||||
| Accrued expenses and other liabilities | 20,834 | 19,027 | ||||||
| Total liabilities | 1,574,544 | 1,571,177 | ||||||
| Shareholders’ Equity | ||||||||
| Preferred stock, par value $.01 per share: | ||||||||
| Authorized 10,000,000 shares; issued and outstanding (liquidation preference $1,000 per share) – 52,372 | 52,014 | 51,789 | ||||||
| Common stock, par value $5 per share: | ||||||||
| Authorized 50,000,000 shares; issued and outstanding – 15,655,868 | 78,279 | 78,279 | ||||||
| Paid-in capital | 87,276 | 87,190 | ||||||
| Directors’ deferred compensation plan | (468 | ) | (575 | ) | ||||
| Retained deficit | (79,731 | ) | (47,525 | ) | ||||
| Accumulated other comprehensive income (loss) | 1,995 | (5,771 | ) | |||||
| Total shareholders’ equity | 139,365 | 163,387 | ||||||
| Total liabilities and shareholders’ equity | $ | 1,713,909 | $ | 1,734,564 | ||||
See notes to consolidated financial statements
| E-2 |
NewBridge Bancorp and Subsidiary
Consolidated Statements of Income
(Unaudited; dollars in thousands, except per share data)
| Three Months Ended | Nine Months Ended | |||||||||||||||
| September 30 | September 30 | |||||||||||||||
| 2012 | 2011 | 2012 | 2011 | |||||||||||||
| Interest Income | ||||||||||||||||
| Interest and fees on loans | $ | 14,084 | $ | 16,121 | $ | 43,587 | $ | 50,052 | ||||||||
| Interest on investment securities | ||||||||||||||||
| Taxable | 3,061 | 3,147 | 9,994 | 9,595 | ||||||||||||
| Tax exempt | 186 | 190 | 571 | 572 | ||||||||||||
| Interest-bearing bank balances and federal funds sold | 10 | 20 | 30 | 44 | ||||||||||||
| Total interest income | 17,341 | 19,478 | 54,182 | 60,263 | ||||||||||||
| Interest Expense | ||||||||||||||||
| Deposits | 1,088 | 2,252 | 4,217 | 7,513 | ||||||||||||
| Borrowings from the Federal Home Loan Bank | 232 | 275 | 760 | 907 | ||||||||||||
| Other borrowings | 343 | 329 | 1,032 | 1,313 | ||||||||||||
| Total interest expense | 1,663 | 2,856 | 6,009 | 9,733 | ||||||||||||
| Net interest income | 15,678 | 16,622 | 48,173 | 50,530 | ||||||||||||
| Provision for credit losses | 28,881 | 3,445 | 34,684 | 12,539 | ||||||||||||
| Net interest income after provision for credit losses | (13,203 | ) | 13,177 | 13,489 | 37,991 | |||||||||||
| Noninterest Income | ||||||||||||||||
| Retail banking | 2,308 | 2,457 | 6,888 | 7,511 | ||||||||||||
| Mortgage banking services | 732 | 395 | 1,848 | 1,088 | ||||||||||||
| Wealth management services | 645 | 702 | 1,800 | 1,873 | ||||||||||||
| Gain on sale of investment securities | 3 | 65 | 3 | 2,026 | ||||||||||||
| Writedowns and losses on sales of real estate acquired in settlement of loans | (10,587 | ) | (799 | ) | (14,571 | ) | (3,871 | ) | ||||||||
| Bank-owned life insurance | 326 | 303 | 1,171 | 1,015 | ||||||||||||
| Other | 171 | 177 | 468 | 592 | ||||||||||||
| Total noninterest income | (6,402 | ) | 3,300 | (2,393 | ) | 10,234 | ||||||||||
| Noninterest Expense | ||||||||||||||||
| Personnel | 7,513 | 7,857 | 21,800 | 22,498 | ||||||||||||
| Occupancy | 2,155 | 983 | 4,183 | 3,043 | ||||||||||||
| Furniture and equipment | 832 | 896 | 2,495 | 2,784 | ||||||||||||
| Technology and data processing | 1,039 | 960 | 3,074 | 2,970 | ||||||||||||
| Legal and professional | 858 | 664 | 2,219 | 2,032 | ||||||||||||
| FDIC insurance | 444 | 600 | 1,326 | 2,027 | ||||||||||||
| Real estate acquired in settlement of loans | 479 | 451 | 1,002 | 1,233 | ||||||||||||
| Other | 3,225 | 2,482 | 7,786 | 7,278 | ||||||||||||
| Total noninterest expense | 16,545 | 14,893 | 43,885 | 43,865 | ||||||||||||
| Income (loss) before income taxes | (36,150 | ) | 1,584 | (32,789 | ) | 4,360 | ||||||||||
| Income tax expense (benefit) | (3,700 | ) | 501 | (2,771 | ) | 1,125 | ||||||||||
| Net Income (Loss) | (32,450 | ) | 1,083 | (30,018 | ) | 3,235 | ||||||||||
See notes to consolidated financial statements
| E-3 |
NewBridge Bancorp and Subsidiary
Consolidated Statements of Income (continued)
(Unaudited; dollars in thousands, except per share data)
| Three Months Ended | Nine Months Ended | |||||||||||||||
| September 30 | September 30 | |||||||||||||||
| 2012 | 2011 | 2012 | 2012 | |||||||||||||
| Dividends and accretion on preferred stock | (729 | ) | (730 | ) | (2,188 | ) | (2,188 | ) | ||||||||
| Net Income (Loss) available to common shareholders | $ | (33,179 | ) | $ | 353 | $ | (32,206 | ) | $ | 1,047 | ||||||
| Earnings (loss) per share | ||||||||||||||||
| Basic | $ | (2.12 | ) | $ | 0.02 | $ | (2.06 | ) | $ | 0.07 | ||||||
| Diluted | $ | (2.12 | ) | $ | 0.02 | $ | (2.06 | ) | $ | 0.06 | ||||||
| Weighted average shares outstanding | ||||||||||||||||
| Basic | 15,655,868 | 15,655,868 | 15,655,868 | 15,655,868 | ||||||||||||
| Diluted | 15,655,868 | 16,467,550 | 15,655,868 | 16,558,862 | ||||||||||||
See notes to consolidated financial statements
| E-4 |
NewBridge Bancorp and Subsidiary
Consolidated Statements of Comprehensive Income
(Unaudited; dollars in thousands)
| Three Months Ended | Nine Months Ended | |||||||||||||||
| September 30 | September 30 | |||||||||||||||
| 2012 | 2011 | 2012 | 2011 | |||||||||||||
| Net Income (Loss) | $ | (32,450 | ) | $ | 1,083 | $ | (30,018 | ) | $ | 3,235 | ||||||
| Other Comprehensive Income (Loss), Net of Tax: | ||||||||||||||||
| Unrealized gains on securities: | ||||||||||||||||
| Unrealized holding gains (losses) arising during period | 2,863 | 160 | 7,797 | 1,197 | ||||||||||||
| Reclassification adjustment for (gains) losses included in net income | (2 | ) | (39 | ) | (2 | ) | (1,226 | ) | ||||||||
| Defined benefit pension plans: | ||||||||||||||||
| Amortization of post retirement benefit | (9 | ) | (10 | ) | (29 | ) | (29 | ) | ||||||||
| Total other comprehensive income (loss) | 2,852 | 111 | 7,766 | (58 | ) | |||||||||||
| Comprehensive Income (Loss) | $ | (29,598 | ) | $ | 1,194 | $ | (22,252 | ) | $ | 3,177 | ||||||
See notes to consolidated financial statements
| E-5 |
NewBridge Bancorp and Subsidiary
Consolidated Statements of Changes in Shareholders’ Equity
Nine months ended September 30, 2012 and 2011
(Unaudited; dollars in thousands)
| Directors’ | Accumulated | |||||||||||||||||||||||||||||||
| Deferred | Retained | Other | Total | |||||||||||||||||||||||||||||
| Preferred | Common Stock | Paid-in | Compensation | Earnings | Comprehensive | Shareholders’ | ||||||||||||||||||||||||||
| Stock | Shares | Amount | Capital | Plan | (Deficit) | Income (Loss) | Equity | |||||||||||||||||||||||||
| Balances at December 31, 2010 | $ | 51,490 | 15,655,868 | $ | 78,279 | $ | 87,048 | $ | (618 | ) | $ | (49,286 | ) | $ | (995 | ) | $ | 165,918 | ||||||||||||||
| Net Income | 3,235 | 3,235 | ||||||||||||||||||||||||||||||
| Change in accumulated other comprehensive income (loss) net of deferred income taxes | (58 | ) | (58 | ) | ||||||||||||||||||||||||||||
| Dividends and accretion on preferred stock | 224 | (2,188 | ) | (1,964 | ) | |||||||||||||||||||||||||||
| Stock-based compensation expense | 104 | 104 | ||||||||||||||||||||||||||||||
| Common stock distributed | 43 | 43 | ||||||||||||||||||||||||||||||
| Balances at September 30, 2011 | $ | 51,714 | 15,655,868 | $ | 78,279 | $ | 87,152 | $ | (575 | ) | $ | (48,239 | ) | $ | (1,053 | ) | $ | 167,278 | ||||||||||||||
| Balances at December 31, 2011 | $ | 51,789 | 15,655,868 | $ | 78,279 | $ | 87,190 | $ | (575 | ) | $ | (47,525 | ) | $ | (5,771 | ) | $ | 163,387 | ||||||||||||||
| Net (Loss) | (30,018 | ) | (30,018 | ) | ||||||||||||||||||||||||||||
| Change in accumulated other comprehensive income (loss) net of deferred income taxes | 7,766 | 7,766 | ||||||||||||||||||||||||||||||
| Dividends and accretion on preferred stock | 225 | (2,188 | ) | (1,963 | ) | |||||||||||||||||||||||||||
| Stock-based compensation expense | 86 | 86 | ||||||||||||||||||||||||||||||
| Common stock distributed | 107 | 107 | ||||||||||||||||||||||||||||||
| Balances at September 30, 2012 | $ | 52,014 | �� | 15,655,868 | $ | 78,279 | $ | 87,276 | $ | (468 | ) | $ | (79,731 | ) | $ | 1,995 | $ | 139,365 | ||||||||||||||
See notes to consolidated financial statements
| E-6 |
NewBridge Bancorp and Subsidiary
Consolidated Statements of Cash Flows
(Unaudited; dollars in thousands)
| Nine Months Ended | ||||||||
| September 30 | ||||||||
| 2012 | 2011 | |||||||
| Cash Flow from operating activities | ||||||||
| Net Income (Loss) | $ | (30,018 | ) | $ | 3,235 | |||
| Adjustments to reconcile net income (loss) to net cash provided by operating activities: | ||||||||
| Depreciation and amortization | 2,585 | 4,346 | ||||||
| Securities premium amortization and discount accretion, net | 165 | 280 | ||||||
| (Gain) loss on sale of securities | (3 | ) | (2,026 | ) | ||||
| Mortgage banking services | (1,848 | ) | (1,088 | ) | ||||
| Originations of loans held for sale | (114,385 | ) | (72,928 | ) | ||||
| Proceeds from sales of loans held for sale | 117,081 | 144,117 | ||||||
| (Increase) decrease in deferred tax assets | (2,789 | ) | 309 | |||||
| (Increase) in income taxes receivable | (153 | ) | - | |||||
| Decrease in interest earned but not received | 190 | 311 | ||||||
| (Decrease) in interest accrued but not paid | (195 | ) | (327 | ) | ||||
| Writedowns and losses on sales of real estate acquired in settlement of loans | 14,571 | 3,871 | ||||||
| Net (increase) decrease in other assets | (2.603 | ) | 2,251 | |||||
| Net increase in other liabilities | 2,002 | 3,759 | ||||||
| Provision for credit losses | 34,684 | 12,539 | ||||||
| Stock-based compensation | 86 | 104 | ||||||
| Net cash provided by operating activities | 19,370 | 98,753 | ||||||
| Cash Flow from investing activities | ||||||||
| Purchases of securities available for sale | (170,690 | ) | (86,418 | ) | ||||
| Proceeds from sales of securities available for sale | 6,721 | 39,209 | ||||||
| Proceeds from maturities, prepayments and calls of securities available for sale | 127,812 | 75,063 | ||||||
| Net (increase) decrease in loans | (4,618 | ) | 15,086 | |||||
| Purchases of premises and equipment | (2,686 | ) | (3,076 | ) | ||||
| Proceeds from sales of premises and equipment | 160 | 2,902 | ||||||
| Proceeds from sales of real estate acquired in settlement of loans | 12,977 | 7,358 | ||||||
| Net cash provided by (used in) investing activities | (30,324 | ) | 50,124 | |||||
| Cash Flow from financing activities | ||||||||
| Net increase (decrease) in demand deposits and NOW accounts | 1,090 | (10,978 | ) | |||||
| Net increase (decrease) in savings and money market accounts | (16,470 | ) | 47,932 | |||||
| Net (decrease) in time deposits | (13,561 | ) | (94,278 | ) | ||||
| Net (decrease) in other borrowings | - | (15,000 | ) | |||||
| Net increase (decrease) in borrowings from FHLB | 30,500 | (39,700 | ) | |||||
| Dividends paid | (1,963 | ) | (1,964 | ) | ||||
| Common stock distributed | 107 | 43 | ||||||
| Net cash (used in) financing activities | (297 | ) | (113,945 | ) | ||||
| Increase (decrease) in cash and cash equivalents | (11,251 | ) | 34,932 | |||||
| Cash and cash equivalents at the beginning of the period | 53,992 | 29,075 | ||||||
| Cash and cash equivalents at the end of the period | $ | 42,741 | $ | 64,007 | ||||
See notes to consolidated financial statements
| E-7 |
NewBridge Bancorp and Subsidiary
Consolidated Statements of Cash Flows (continued)
(Unaudited; dollars in thousands)
| Nine Months Ended | ||||||||
| September 30 | ||||||||
| 2012 | 2011 | |||||||
| Supplemental disclosures of cash flow information | ||||||||
| Cash paid during the periods for: | ||||||||
| Interest | $ | 6,204 | $ | 10,060 | ||||
| Income taxes | 250 | - | ||||||
| Supplemental disclosures of noncash transactions | ||||||||
| Transfer of loans to real estate acquired in settlement of loans | $ | 7,426 | $ | 10,980 | ||||
| Unrealized gains/(losses) on securities available for sale: | ||||||||
| Change in securities available for sale | 12,881 | (48 | ) | |||||
| Change in deferred income taxes | (5,086 | ) | 19 | |||||
| Change in shareholders’ equity | 7,795 | (29 | ) | |||||
See notes to consolidated financial statements
| E-8 |
NewBridge Bancorp and Subsidiary
Notes to Consolidated Financial Statements
(Unaudited)
Note 1—Basis of Presentation
The accompanying interim unaudited consolidated financial statements have been prepared in accordance with generally accepted accounting principles in the United States (“GAAP”) for interim financial information and in accordance with the instructions to Form 10-Q and Rule 10-01 of Regulation S-X. They do not include all of the information and footnotes required by GAAP for complete financial statements. In the opinion of management, all adjustments (consisting of normal recurring accruals) and provisions for credit losses considered necessary for a fair presentation have been included. Operating results for the three-month and nine-month periods ended September 30, 2012 are not necessarily indicative of the results that may be expected for the year ending December 31, 2012.
NewBridge Bancorp (“Bancorp” or the “Company”) is a bank holding company incorporated under the laws of North Carolina (“NC”) and registered under the Bank Holding Company Act of 1956, as amended (the “BHCA”). Bancorp’s principal asset is the stock of its banking subsidiary, NewBridge Bank (the “Bank”). Accordingly, throughout this Quarterly Report on Form 10-Q, there are frequent references to the Bank.
Through its branch network, the Bank provides a wide range of banking products to individuals, small to medium-sized businesses and other organizations in its market areas, including interest-bearing and noninterest-bearing checking accounts, certificates of deposit, individual retirement accounts, overdraft protection, personal and corporate trust services, safe deposit boxes, online banking, corporate cash management, brokerage, financial planning and asset management, mortgage loans and secured and unsecured loans.
The organization and business of the Company, accounting policies followed by the Company and other relevant information are contained in the notes to the consolidated financial statements in Bancorp’s Annual Report on Form 10-K for the fiscal year ended December 31, 2011, filed with the Securities and Exchange Commission (the “SEC”) on March 22, 2012 (SEC File No. 000-11448) (the “Annual Report”). This Quarterly Report should be read in conjunction with the Annual Report.
Recent accounting pronouncements
In May 2011, the Financial Accounting Standards Board (“FASB”) issued Accounting Standards Update (“ASU”) 2011-04, Fair Value Measurement (Topic 820) – Amendments to Achieve Common Fair Value Measurement and Disclosure Requirements in U.S. GAAP and International Financial Reporting Standards (“IFRS”). This Update establishes common fair value measurement and disclosure requirements in GAAP and IFRS through changes in the description and disclosure of fair value measurements, clarification about the application of existing requirements, and changes to particular principles for measuring fair value or for disclosing information about those measurements. This guidance became effective during the first interim period beginning after December 15, 2011. The application of this Update did not have a material effect on our consolidated financial position or consolidated results of operations.
In June 2011, the FASB issued ASU 2011-05, Comprehensive Income (Topic 220) – Presentation of Comprehensive Income. This Update requires companies to present the total comprehensive income, the components of net income, and the components of other comprehensive income either in a single continuous statement of comprehensive income or in two separate but consecutive statements. Presentation of comprehensive income in the statement of changes in shareholders’ equity is no longer acceptable. This Update does not change the items that must be reported in other comprehensive income, when an item of other comprehensive income must be reclassified to net income, the option for an entity to present components of other comprehensive income net or before related tax effects, or how earnings per share is calculated or presented. This Update became effective for fiscal years, and interim periods within those years, beginning after December 15, 2011. The Company adopted the new disclosure requirements in its Quarterly Report on Form 10-Q for the period ended March 31, 2012.
| E-9 |
NewBridge Bancorp and Subsidiary
Notes to Consolidated Financial Statements
(Unaudited)
Note 1—Basis of Presentation - (continued)
Reclassification
Certain items for 2011 have been reclassified to conform to the 2012 presentation. Such reclassifications had no effect on net income, total assets or shareholders’ equity as previously reported.
Note 2—Nonrecurring Adjustments
Occupancy expense for the three months and nine months ended September 30, 2012 includes $1.0 million in adjustments for impairments on facilities. Other expense for the three months and nine months ended September 30, 2012 includes $0.9 million in adjustments for various nonrecurring accruals.
Note 3 — Net Income Per Share
Basic and diluted net income per share is computed based on the weighted average number of shares outstanding during each period. Diluted net income per share reflects the potential dilution that could occur if stock options or warrants were exercised, or restricted stock vested, resulting in the issuance of common stock sharing in the net income of the Company. A summary of basic and diluted net income per share follows (in thousands, except per share data):
| For the three months ended September 30 | For the nine months ended September 30 | |||||||||||||||
| 2012 | 2011 | 2012 | 2011 | |||||||||||||
| Basic: | ||||||||||||||||
| Net income (loss) available to common shareholders | $ | (33,179 | ) | $ | 353 | $ | (32,206 | ) | $ | 1,047 | ||||||
| Weighted average shares outstanding | 15,655,868 | 15,655,868 | 15,655,868 | 15,655,868 | ||||||||||||
| Net income (loss) per share, basic | $ | (2.12 | ) | $ | 0.02 | $ | (2.06 | ) | 0.07 | |||||||
| Diluted: | ||||||||||||||||
| Net income (loss) available to common shareholders | $ | (33,179 | ) | $ | 353 | $ | (32,206 | ) | $ | 1,047 | ||||||
| Weighted average shares outstanding | 15,655,868 | 15,655,868 | 15,655,868 | 15,655,868 | ||||||||||||
| Effect of dilutive securities: | ||||||||||||||||
| Stock options | - | - | - | - | ||||||||||||
| Restricted stock units | - | 10,218 | - | 9,484 | ||||||||||||
| Warrant | - | 801,464 | - | 893,510 | ||||||||||||
| Weighted average shares outstanding and dilutive potential shares outstanding | 15,655,868 | 16,467,550 | 15,655,868 | 16,558,862 | ||||||||||||
| Net income (loss) per share, diluted | $ | (2.12 | ) | $ | 0.02 | $ | (2.06 | ) | $ | 0.06 | ||||||
The calculation of diluted net income (loss) per share for the 2012 periods excludes the effect of normally dilutive restricted stock units of 50,472 and warrant of 791,539 for the three months and 33,054 and 732,867, respectively, for the nine months as these are antidilutive due to the net loss reported in these periods.
| E-10 |
NewBridge Bancorp and Subsidiary
Notes to Consolidated Financial Statements
(Unaudited)
Note 4 — Investment Securities
Investment securities consist of the following (in thousands):
| September 30, 2012 | ||||||||||||||||||||||||
| Amortized Cost | Unrealized Gains | Unrealized Losses | Market Value | Average Yield | Average Duration(1) | |||||||||||||||||||
| U.S. Treasury securities | $ | 19,999 | $ | - | $ | - | $ | 19,999 | 0.05 | % | 0.06 | |||||||||||||
| U.S. government agency securities | 36,996 | 135 | - | 37,131 | 1.74 | 0.41 | ||||||||||||||||||
| Agency mortgage backed securities | 23,963 | 2,569 | - | 26,532 | 5.28 | 2.40 | ||||||||||||||||||
| Collateralized mortgage obligations | 11,579 | 252 | (1 | ) | 11,830 | 5.66 | 1.70 | |||||||||||||||||
| Commercial mortgage backed securities | 53,960 | 2,196 | (126 | ) | 56,030 | 3.34 | 3.54 | |||||||||||||||||
| Corporate bonds | 150,578 | 4,978 | (1,807 | ) | 153,749 | 3.26 | 3.51 | |||||||||||||||||
| Covered bonds | 44,915 | 3,853 | - | 48,768 | 3.68 | 3.71 | ||||||||||||||||||
| State and municipal obligations | 18,048 | 779 | - | 18,827 | 6.21 | (2) | 4.27 | |||||||||||||||||
| Total debt securities | 360,038 | 14,762 | (1,934 | ) | 372,866 | 3.35 | (2) | 2.93 | ||||||||||||||||
| Federal Home Loan Bank stock | 7,874 | - | - | 7,874 | ||||||||||||||||||||
| Other equity securities | 5,775 | 861 | - | 6,636 | ||||||||||||||||||||
| Total investment securities | $ | 373,687 | $ | 15,623 | $ | (1,934 | ) | $ | 387,376 | |||||||||||||||
| December 31, 2011 | ||||||||||||||||||||||||
| Amortized Cost | Unrealized Gains | Unrealized Losses | Market Value | Average Yield | Average Duration(1) | |||||||||||||||||||
| U.S. government agency securities | $ | 39,000 | $ | 147 | $ | - | $ | 39,147 | 2.79 | % | 1.06 | |||||||||||||
| Agency mortgage backed securities | 31,917 | 2,926 | - | 34,843 | 5.21 | 3.55 | ||||||||||||||||||
| Collateralized mortgage obligations | 23,599 | 168 | (332 | ) | 23,435 | 4.69 | 2.03 | |||||||||||||||||
| Commercial mortgage backed securities | 30,169 | 153 | (33 | ) | 30,289 | 3.47 | 4.43 | |||||||||||||||||
| Corporate bonds | 118,573 | 385 | (4,282 | ) | 114,676 | 3.77 | 3.98 | |||||||||||||||||
| Covered bonds | 61,414 | 1,243 | (131 | ) | 62,526 | 5.25 | 2.12 | |||||||||||||||||
| State and municipal obligations | 19,371 | 425 | (288 | ) | 19,508 | 6.47 | (2) | 5.64 | ||||||||||||||||
| Total debt securities | 324,043 | 5,447 | (5,066 | ) | 324,424 | 4.13 | (2) | 3.37 | ||||||||||||||||
| Federal Home Loan Bank stock | 7,185 | - | - | 7,185 | ||||||||||||||||||||
| Other equity securities | 5,775 | 427 | - | 6,202 | ||||||||||||||||||||
| Total investment securities | $ | 337,003 | $ | 5,874 | $ | (5,066 | ) | $ | 337,811 | |||||||||||||||
(1) Average remaining duration to maturity, in years
(2) Fully taxable equivalent basis
All securities were classified as available for sale as of each date presented.
During 2012, the Company’s investment strategy has focused on corporate bonds in order to take advantage of higher yield potential compared to other available investment alternatives and to supplement earning asset growth. Accordingly, the balance of corporate bond investments has increased notably during the period. All corporate bond investments are investment grade, as determined by S&P and Moody’s credit ratings.
| E-11 |
NewBridge Bancorp and Subsidiary
Notes to Consolidated Financial Statements
(Unaudited)
Note 4 — Investment Securities - (continued)
The following is a schedule of investment securities in a loss position as of September 30, 2012 (in thousands):
| Less than 1 year | 1 Year or More | Total | ||||||||||||||||||||||
| Market | Unrealized | Market | Unrealized | Market | Unrealized | |||||||||||||||||||
| Value | Loss | Value | Loss | Value | Loss | |||||||||||||||||||
| U.S. Treasury securities | $ | 9,999 | $ | - | $ | - | $ | - | $ | 9,999 | $ | - | ||||||||||||
| Collateralized mortgage obligations | 367 | (1 | ) | - | - | 367 | (1 | ) | ||||||||||||||||
| Commercial mortgage backed securities | 13,442 | (126 | ) | - | - | 13,442 | (126 | ) | ||||||||||||||||
| Corporate bonds | 2,484 | (15 | ) | 23,183 | (1,792 | ) | 25,667 | (1,807 | ) | |||||||||||||||
| State and municipal obligations | - | - | 467 | - | 467 | - | ||||||||||||||||||
| Total investment securities in a loss position | $ | 26,292 | $ | (142 | ) | $ | 23,650 | $ | (1,792 | ) | $ | 49,942 | $ | (1,934 | ) | |||||||||
Declines in the fair value of available for sale securities below their cost that are deemed to be other than temporary are reflected in earnings as realized losses to the extent the impairment is related to credit losses. The amount of the impairment related to other factors is recognized in other comprehensive income. In estimating other-than-temporary impairment losses, management considers, among other things, (i) the length of time and the extent to which the fair value has been less than cost, (ii) the financial condition and near-term prospects of the issuer, and (iii) our intent and ability to retain our investment in the issuer for a period of time sufficient to allow for any anticipated recovery in cost.
As of September 30, 2012, management does not intend to sell any of the securities classified as available for sale in the table above which have unrealized losses and believes that it is not likely that we will have to sell any such securities before a recovery of cost given the current liquidity position. The unrealized losses are largely due to increases in market interest rates over the yields available at the time the underlying securities were purchased. The fair value is expected to recover as the bonds approach their maturity date or repricing date or if market yields for such investments decline. Management does not believe such securities are other-than-temporarily impaired due to reasons of credit quality.
Investment securities with an amortized cost of $94,642,000 and $79,211,000, as of September 30, 2012, and December 31, 2011, respectively, were pledged to secure public deposits and for other purposes. The Bank has obtained $50,000,000 in letters of credit, which are used in lieu of securities to pledge against public deposits.
During the first nine months of 2012, the Company sold $6,721,000 of investments for a gain of $3,000. During the first nine months of 2011, the Company sold $39,209,000 of investments for a gain of $2,026,000. The investments sold by the Company in 2011 consisted of shorter-duration, odd-lot mortgage backed securities and certain corporate bonds.
| E-12 |
NewBridge Bancorp and Subsidiary
Notes to Consolidated Financial Statements
(Unaudited)
Note 5 — Loans and Allowance for Credit Losses
Loans are summarized as follows (in thousands):
| September 30 | December 31 | |||||||
| 2012 | 2011 | |||||||
| Secured by owner-occupied nonfarm nonresidential properties | $ | 257,230 | $ | 269,972 | ||||
| Secured by other nonfarm nonresidential properties | 200,848 | 157,594 | ||||||
| Other commercial and industrial | 94,536 | 119,877 | ||||||
| Total Commercial | 552,614 | 547,443 | ||||||
| Construction loans – 1 to 4 family residential | 9,850 | 7,781 | ||||||
| Other construction and land development | 66,276 | 81,630 | ||||||
| Total Real estate – construction | 76,126 | 89,411 | ||||||
| Closed-end loans secured by 1 to 4 family residential properties | 283,409 | 287,268 | ||||||
| Lines of credit secured by 1 to 4 family residential properties | 201,731 | 209,634 | ||||||
| Loans secured by 5 or more family residential properties | 20,698 | 25,883 | ||||||
| Total Real estate – mortgage | 505,838 | 522,785 | ||||||
| Credit cards | 7,408 | 7,649 | ||||||
| Other revolving credit plans | 9,139 | 9,444 | ||||||
| Other consumer loans | 11,441 | 17,648 | ||||||
| Total Consumer | 27,988 | 34,741 | ||||||
| All other loans | 6,181 | 5,690 | ||||||
| Total Other | 6,181 | 5,690 | ||||||
| Total loans | $ | 1,168,747 | $ | 1,200,070 | ||||
Nonperforming assets are summarized as follows (in thousands):
| September 30 | December 31 | |||||||
| 2012 | 2011 | |||||||
| Commercial nonaccrual loans, not restructured | $ | 12,411 | $ | 15,773 | ||||
| Commercial nonaccrual loans, restructured | 5,092 | 7,489 | ||||||
| Non-commercial nonaccrual loans, not restructured | 4,418 | 9,569 | ||||||
| Non-commercial nonaccrual loans, restructured | 1,007 | 283 | ||||||
| Total nonaccrual loans | 22,928 | 33,114 | ||||||
| Troubled debt restructured loans, accruing | 4,760 | 7,406 | ||||||
| Accruing loans which are contractually past due 90 days or more | 6 | 14 | ||||||
| Total nonperforming loans | 27,694 | 40,534 | ||||||
| Real estate acquired in settlement of loans | 10,465 | 30,587 | ||||||
| Total nonperforming assets | $ | 38,159 | $ | 71,121 | ||||
| Nonperforming loans to loans outstanding at end of period | 2.37 | % | 3.38 | % | ||||
| Nonperforming assets to total assets at end of period | 2.23 | % | 4.10 | % | ||||
| Allowance for credit losses to nonperforming loans | 126.44 | % | 71.16 | % | ||||
| Restructured loans, performing(1) | $ | 1,296 | $ | 4,888 | ||||
| (1) | Loans restructured in a prior calendar year at a market rate of interest and which have experienced at least six consecutive months of payment performance in accordance with the restructured terms. |
| E-13 |
NewBridge Bancorp and Subsidiary
Notes to Consolidated Financial Statements
(Unaudited)
Note 5 — Loans and Allowance for Credit Losses - (continued)
Nonperforming assets include nonaccrual loans, accruing loans contractually past due 90 days or more, certain restructured loans, and real estate acquired in settlement of loans. Loans are placed on nonaccrual status when: (i) management has concerns relating to the ability to collect the loan principal and interest and (ii) generally when such loans are 90 days or more past due. No assurance can be given, however, that economic conditions will not adversely affect borrowers and result in increased credit losses.
Commitments to lend additional funds to borrowers whose loans have been restructured are not material at September 30, 2012.
The aging of loans is summarized in the following table (in thousands):
| 30-89 days | 90+ days | Nonaccrual | Total past due | Total loans | ||||||||||||||||||||
| September 30, 2012 | past due | past due | Loans | + nonaccrual | Current | receivable | ||||||||||||||||||
| Secured by owner-occupied nonfarm nonresidential properties | $ | 4,206 | $ | - | $ | 5,844 | $ | 10,050 | $ | 247,180 | $ | 257,230 | ||||||||||||
| Secured by other nonfarm nonresidential properties | 1,088 | - | 4,934 | 6,022 | 194,826 | 200,848 | ||||||||||||||||||
| Other commercial and industrial | 1,211 | - | 657 | 1,868 | 92,668 | 94,536 | ||||||||||||||||||
| Total Commercial | 6,505 | - | 11,435 | 17,940 | 534,674 | 552,614 | ||||||||||||||||||
| Construction loans – 1 to 4 family residential | 101 | - | 470 | 571 | 9,279 | 9,850 | ||||||||||||||||||
| Other construction and land development | 1,843 | - | 3,298 | 5,141 | 61,135 | 66,276 | ||||||||||||||||||
| Total Real estate – construction | 1,944 | - | 3,768 | 5,712 | 70,414 | 76,126 | ||||||||||||||||||
| Closed-end loans secured by 1 to 4 family residential properties | 6,165 | - | 6,149 | 12,314 | 271,095 | 283,409 | ||||||||||||||||||
| Lines of credit secured by 1 to 4 family residentialproperties | 2,473 | - | 1,325 | 3,798 | 197,933 | 201,731 | ||||||||||||||||||
| Loans secured by 5 or more family residential properties | 437 | - | - | 437 | 20,261 | 20,698 | ||||||||||||||||||
| Total Real estate – mortgage | 9,075 | - | 7,474 | 16,549 | 489,289 | 505,838 | ||||||||||||||||||
| Credit cards | 73 | 6 | - | 79 | 7,329 | 7,408 | ||||||||||||||||||
| Other revolving credit plans | 42 | - | 111 | 153 | 8,986 | 9,139 | ||||||||||||||||||
| Other consumer loans | 550 | - | 140 | 690 | 10,751 | 11,441 | ||||||||||||||||||
| Total Consumer | 665 | 6 | 251 | 922 | 27,066 | 27,988 | ||||||||||||||||||
| All other loans | - | - | - | - | 6,181 | 6,181 | ||||||||||||||||||
| Total Other | - | - | - | - | 6,181 | 6,181 | ||||||||||||||||||
| Total loans | $ | 18,189 | $ | 6 | $ | 22,928 | $ | 41,123 | $ | 1,127,624 | $ | 1,168,747 | ||||||||||||
| E-14 |
NewBridge Bancorp and Subsidiary
Notes to Consolidated Financial Statements
(Unaudited)
Note 5 — Loans and Allowance for Credit Losses - (continued)
| 30-89 days | 90+ days | Nonaccrual | Total past due | Total loans | ||||||||||||||||||||
| December 31, 2011 | past due | past due | Loans | + nonaccrual | Current | receivable | ||||||||||||||||||
| Secured by owner-occupied nonfarm nonresidential properties | $ | 4,514 | $ | - | $ | 7,718 | $ | 12,232 | $ | 257,740 | $ | 269,972 | ||||||||||||
| Secured by other nonfarm nonresidential properties | 2,134 | - | 1,310 | 3,444 | 154,150 | 157,594 | ||||||||||||||||||
| Other commercial and industrial | 1,199 | - | 437 | 1,636 | 118,241 | 119,877 | ||||||||||||||||||
| Total Commercial | 7,847 | - | 9,465 | 17,312 | 530,131 | 547,443 | ||||||||||||||||||
| Construction loans – 1 to 4 family residential | 650 | - | 447 | 1,097 | 6,684 | 7,781 | ||||||||||||||||||
| Other construction and land development | 2,776 | - | 9,016 | 11,792 | 69,838 | 81,630 | ||||||||||||||||||
| Total Real estate – construction | 3,426 | - | 9,463 | 12,889 | 76,522 | 89,411 | ||||||||||||||||||
| Closed-end loans secured by 1 to 4 family residential properties | 7,483 | - | 12,744 | 20,227 | 267,041 | 287,268 | ||||||||||||||||||
| Lines of credit secured by 1 to 4 family residentialproperties | 5,489 | - | 975 | 6,464 | 203,170 | 209,634 | ||||||||||||||||||
| Loans secured by 5 or more family residential properties | 3,852 | - | 302 | 4,154 | 21,729 | 25,883 | ||||||||||||||||||
| Total Real estate – mortgage | 16,824 | - | 14,021 | 30,845 | 491,940 | 522,785 | ||||||||||||||||||
| Credit cards | 146 | 14 | - | 160 | 7,489 | 7,649 | ||||||||||||||||||
| Other revolving credit plans | 339 | - | 125 | 464 | 8,980 | 9,444 | ||||||||||||||||||
| Other consumer loans | 372 | - | 40 | 412 | 17,236 | 17,648 | ||||||||||||||||||
| Total Consumer | 857 | 14 | 165 | 1,036 | 33,705 | 34,741 | ||||||||||||||||||
| All other loans | - | - | - | - | 5,690 | 5,690 | ||||||||||||||||||
| Total Other | - | - | - | - | 5,690 | 5,690 | ||||||||||||||||||
| Total loans | $ | 28,954 | $ | 14 | $ | 33,114 | $ | 62,082 | $ | 1,137,988 | $ | 1,200,070 | ||||||||||||
At September 30, 2012 and December 31, 2011, there were $10.9 million and $15.2 million, respectively, of loans classified as nonperforming troubled debt restructurings (“TDRs”). A modification of a loan’s terms constitutes a TDR if the creditor grants a concession to the borrower for reasons related to the borrower’s financial difficulties that it would not otherwise consider. For loans classified as TDRs, the Company further evaluates the loans as performing or nonperforming. Nonperforming TDRs originally classified as nonaccrual may be reclassified as accruing if, subsequent to restructure, they experience six consecutive months of payment performance in accordance with the restructured terms. Further, a TDR may be considered performing and subsequently removed from impaired status in years subsequent to the restructuring if it meets the following criteria:
| · | At the time of restructure, the loan was made at a market rate of interest; and |
| · | The loan has experienced at least six consecutive months of payment performance in accordance with the restructured terms; and |
| · | The loan has been included in the TDR disclosures for at least one Annual Report on Form 10-K |
Modifications of terms for loans and their inclusion as TDRs are based on individual facts and circumstances. Loan modifications that are included as TDRs may involve either an increase or reduction of the interest rate, extension of the term of the loan, or deferral or forgiveness of principal payments. The loans included as TDRs at September 30, 2012 had either an interest rate modification or a deferral of one or more principal payments.
| E-15 |
NewBridge Bancorp and Subsidiary
Notes to Consolidated Financial Statements
(Unaudited)
Note 5 — Loans and Allowance for Credit Losses - (continued)
All loans designated as TDRs were modified due to financial difficulties experienced by the borrower. The Company has $1,296,000 of performing TDRs at September 30, 2012 which meet the above criteria and therefore are excluded from nonperforming status.
The Company monitors the performance of modified loans on an ongoing basis. Loans retain their accrual status at the time of their modification. As a result, if a loan is on nonaccrual at the time it is modified, it stays as nonaccrual, and if a loan is on accrual at the time of the modification, it generally stays on accrual. A modified loan will be reclassified to nonaccrual if the loan becomes 90 days delinquent or other weaknesses are observed which make collection of principal and interest unlikely. A loan on nonaccrual may be reclassified to accrual status following an evaluation and having experienced at least six consecutive months of payment performance in accordance with the restructured terms. Nonperforming TDRs are considered impaired.
The following table provides information about TDRs identified during the current period (in thousands, except number of contracts):
| Modifications for the three months ended September 30, 2012 | Modifications for the nine months ended September 30, 2012 | |||||||||||||||||||||||
| Number of Contracts | Pre-Modification Outstanding Recorded Investment | Post- Modification Outstanding Recorded Investment | Number of Contracts | Pre-Modification Outstanding Recorded Investment | Post- Modification Outstanding Recorded Investment | |||||||||||||||||||
| Troubled Debt Restructurings: | ||||||||||||||||||||||||
| Commercial | 2 | $ | 1,242 | $ | 651 | 9 | $ | 7,851 | $ | 6,204 | ||||||||||||||
| Real estate – construction | 1 | 135 | 124 | 3 | 321 | 309 | ||||||||||||||||||
| Real estate – mortgage | 1 | 100 | 117 | 4 | 669 | 685 | ||||||||||||||||||
| Total | 4 | $ | 1,477 | $ | 892 | 16 | $ | 8,841 | $ | 7,198 | ||||||||||||||
A TDR is considered to be in default if it is 90 days or more past due at the end of any month during the reporting period.
The following table provides information about TDRs restructured in the previous 12 months that subsequently defaulted during the stated periods (in thousands, except number of contracts):
| Defaults for the three months ended September 30, 2012 | Defaults for the nine months ended September 30, 2012 | |||||||||||||||
| Number of Contracts | Recorded Investment | Number of Contracts | Recorded Investment | |||||||||||||
| TDR Defaults: | ||||||||||||||||
| Commercial | 1 | $ | 425 | 3 | $ | 914 | ||||||||||
| Total | 1 | $ | 425 | 3 | $ | 914 | ||||||||||
| E-16 |
NewBridge Bancorp and Subsidiary
Notes to Consolidated Financial Statements
(Unaudited)
Note 5 — Loans and Allowance for Credit Losses - (continued)
Interest income is not typically accrued on impaired loans, but there are $4.8 million in TDRs at September 30, 2012 that are considered impaired and are accruing. The following table shows interest income recognized on these TDRs for the three and nine months ended September 30, 2012 (in thousands):
| Three Months Ended September 30, 2012 | Nine Months Ended September 30, 2012 | |||||||
| Interest Income Recognized: | ||||||||
| Commercial | $ | 29 | $ | 90 | ||||
| Real estate – construction | 4 | 13 | ||||||
| Real estate – mortgage | 22 | 90 | ||||||
| Consumer | - | 2 | ||||||
| Total | $ | 55 | $ | 195 | ||||
Classified loans are summarized in the following table (in thousands):
| September 30 | December 31 | |||||||
| 2012 | 2011 | |||||||
| Loans identified as impaired | $ | 22,644 | $ | 32,591 | ||||
| Other nonperforming loans | 5,050 | 7,943 | ||||||
| Total nonperforming loans | 27,694 | 40,534 | ||||||
| Performing classified loans | 46,842 | 87,959 | ||||||
| Total classified loans | $ | 74,536 | $ | 128,493 | ||||
Loans specifically identified and evaluated for impairment totaled $22,644,000 and $32,591,000 at September 30, 2012 and December 31, 2011, respectively, as summarized in the following tables (in thousands).
| Impaired Loans | ||||||||||||||||
| Recorded | Unpaid Principal | Specific | Average | |||||||||||||
| Balance | Balance | Allowance | Recorded Investment | |||||||||||||
| September 30, 2012 | ||||||||||||||||
| Loans without a specific valuation allowance: | ||||||||||||||||
| Commercial | $ | 8,183 | $ | 10,761 | $ | - | $ | 10,944 | ||||||||
| Real estate – construction | 1,853 | 4,071 | - | 4,102 | ||||||||||||
| Real estate – mortgage | 4,224 | 5,372 | - | 5,764 | ||||||||||||
| Consumer | - | - | - | - | ||||||||||||
| Total | 14,260 | 20,204 | - | 20,810 | ||||||||||||
| E-17 |
NewBridge Bancorp and Subsidiary
Notes to Consolidated Financial Statements
(Unaudited)
Note 5 — Loans and Allowance for Credit Losses - (continued)
| Impaired Loans | ||||||||||||||||
| Recorded | Unpaid Principal | Specific | Average | |||||||||||||
| Balance | Balance | Allowance | Recorded Investment | |||||||||||||
| Loans with a specific valuation allowance: | ||||||||||||||||
| Commercial | 4,570 | 4,595 | 876 | 6,112 | ||||||||||||
| Real estate – construction | 913 | 1,116 | 253 | 1,167 | ||||||||||||
| Real estate – mortgage | 2,882 | 2,882 | 1,155 | 2,900 | ||||||||||||
| Consumer | 19 | 19 | 19 | 11 | ||||||||||||
| Total | 8,384 | 8,612 | 2,303 | 10,190 | ||||||||||||
| Total impaired loans: | ||||||||||||||||
| Commercial | 12,753 | 15,356 | 876 | 17,056 | ||||||||||||
| Real estate – construction | 2,766 | 5,187 | 253 | 5,269 | ||||||||||||
| Real estate – mortgage | 7,106 | 8,254 | 1,155 | 8,664 | ||||||||||||
| Consumer | 19 | 19 | 19 | 11 | ||||||||||||
| Total | $ | 22,644 | $ | 28,816 | $ | 2,303 | $ | 31,000 | ||||||||
| Impaired Loans | ||||||||||||||||
| Recorded | Unpaid Principal | Specific | Average | |||||||||||||
| Balance | Balance | Allowance | Recorded Investment | |||||||||||||
| December 31, 2011 | ||||||||||||||||
| Loans without a specific valuation allowance: | ||||||||||||||||
| Commercial | $ | 2,722 | $ | 2,856 | $ | - | $ | 3,497 | ||||||||
| Real estate – construction | 6,874 | 8,571 | - | 8,655 | ||||||||||||
| Real estate – mortgage | 6,429 | 6,536 | - | 8,128 | ||||||||||||
| Consumer | - | - | - | 57 | ||||||||||||
| Total | 16,025 | 17,963 | - | 20,337 | ||||||||||||
| Loans with a specific valuation allowance: | ||||||||||||||||
| Commercial | 8,014 | 8,329 | 1,972 | 4,251 | ||||||||||||
| Real estate – construction | 1,495 | 1,515 | 203 | 2,954 | ||||||||||||
| Real estate – mortgage | 6,940 | 7,240 | 1,874 | 7,472 | ||||||||||||
| Consumer | 117 | 117 | 117 | 86 | ||||||||||||
| Total | 16,566 | 17,201 | 4,166 | 14,763 | ||||||||||||
| Total impaired loans: | ||||||||||||||||
| Commercial | 10,736 | 11,185 | 1,972 | 7,748 | ||||||||||||
| Real estate – construction | 8,369 | 10,086 | 203 | 11,609 | ||||||||||||
| Real estate – mortgage | 13,369 | 13,776 | 1,874 | 15,600 | ||||||||||||
| Consumer | 117 | 117 | 117 | 143 | ||||||||||||
| Total | $ | 32,591 | $ | 35,164 | $ | 4,166 | $ | 35,100 | ||||||||
| E-18 |
NewBridge Bancorp and Subsidiary
Notes to Consolidated Financial Statements
(Unaudited)
Note 5 — Loans and Allowance for Credit Losses - (continued)
The balance in the allowance for credit losses and the recorded investment in loans by portfolio segment and based on the reserving method as of September 30, 2012, December 31, 2011 and September 30, 2011 were as follows:
| Real Estate - | Real Estate - | Total | ||||||||||||||||||||||
| Commercial | Construction | Mortgage | Consumer | Other | Loans | |||||||||||||||||||
| September 30, 2012 | ||||||||||||||||||||||||
| Allowance for credit losses: | ||||||||||||||||||||||||
| Individually evaluated for impairment | $ | 876 | $ | 253 | $ | 1,155 | $ | 19 | $ | - | $ | 2,303 | ||||||||||||
| Collectively evaluated for impairment | 12,790 | 7,941 | 11,007 | 972 | 3 | 32,713 | ||||||||||||||||||
| Total ending allowance | $ | 13,666 | $ | 8,194 | $ | 12,162 | $ | 991 | $ | 3 | $ | 35,016 | ||||||||||||
| Real Estate - | Real Estate - | Total | ||||||||||||||||||||||
| Commercial | Construction | Mortgage | Consumer | Other | Loans | |||||||||||||||||||
| December 31, 2011 | ||||||||||||||||||||||||
| Allowance for credit losses: | ||||||||||||||||||||||||
| Individually evaluated for impairment | $ | 1,972 | $ | 203 | $ | 1,874 | $ | 117 | $ | - | $ | 4,166 | ||||||||||||
| Collectively evaluated for impairment | 6,554 | 6,264 | 10,079 | 1,749 | 32 | 24,678 | ||||||||||||||||||
| Total ending allowance | $ | 8,526 | $ | 6,467 | $ | 11,953 | $ | 1,866 | $ | 32 | $ | 28,844 | ||||||||||||
| Real Estate - | Real Estate - | Total | ||||||||||||||||||||||
| Commercial | Construction | Mortgage | Consumer | Other | Loans | |||||||||||||||||||
| September 30, 2011 | ||||||||||||||||||||||||
| Allowance for credit losses: | ||||||||||||||||||||||||
| Individually evaluated for impairment | $ | 368 | $ | 281 | $ | 1,073 | $ | 119 | $ | - | $ | 1,841 | ||||||||||||
| Collectively evaluated for impairment | 7,868 | 6,709 | 9,189 | 2,143 | - | 25,909 | ||||||||||||||||||
| Total ending allowance | $ | 8,236 | $ | 6,990 | $ | 10,262 | $ | 2,262 | $ | - | $ | 27,750 | ||||||||||||
| Real Estate - | Real Estate - | Total | ||||||||||||||||||||||
| Commercial | Construction | Mortgage | Consumer | Other | Loans | |||||||||||||||||||
| September 30, 2012 | ||||||||||||||||||||||||
| Recorded investment in loans: | ||||||||||||||||||||||||
| Individually evaluated for impairment | $ | 12,753 | $ | 2,766 | $ | 7,106 | $ | 19 | $ | - | $ | 22,644 | ||||||||||||
| Collectively evaluated for impairment | 539,861 | 73,360 | 498,732 | 27,969 | 6,181 | 1,146,103 | ||||||||||||||||||
| Total recorded investment in loans | $ | 552,614 | $ | 76,126 | $ | 505,838 | $ | 27,988 | $ | 6,181 | $ | 1,168,747 | ||||||||||||
| E-19 |
NewBridge Bancorp and Subsidiary
Notes to Consolidated Financial Statements
(Unaudited)
Note 5 — Loans and Allowance for Credit Losses - (continued)
| Real Estate - | Real Estate - | Total | ||||||||||||||||||||||
| Commercial | Construction | Mortgage | Consumer | Other | Loans | |||||||||||||||||||
| December 31, 2011 | ||||||||||||||||||||||||
| Recorded investment in loans: | ||||||||||||||||||||||||
| Individually evaluated for impairment | $ | 10,736 | $ | 8,369 | $ | 13,369 | $ | 117 | $ | - | $ | 32,591 | ||||||||||||
| Collectively evaluated for impairment | 536,707 | 81,042 | 509,416 | 34,624 | 5,690 | 1,167,479 | ||||||||||||||||||
| Total recorded investment in loans | $ | 547,443 | $ | 89,411 | $ | 522,785 | $ | 34,741 | $ | 5,690 | $ | 1,200,070 | ||||||||||||
| Real Estate - | Real Estate - | Total | ||||||||||||||||||||||
| Commercial | Construction | Mortgage | Consumer | Other | Loans | |||||||||||||||||||
| September 30, 2011 | ||||||||||||||||||||||||
| Recorded investment in loans: | ||||||||||||||||||||||||
| Individually evaluated for impairment | $ | 5,547 | $ | 10,557 | $ | 17,604 | $ | 119 | $ | - | $ | 33,827 | ||||||||||||
| Collectively evaluated for impairment | 536,750 | 95,822 | 508,751 | 36,167 | 5,741 | 1,183,231 | ||||||||||||||||||
| Total recorded investment in loans | $ | 542,297 | $ | 106,379 | $ | 526,355 | $ | 36,286 | $ | 5,741 | $ | 1,217,058 | ||||||||||||
The Bank’s policy for calculating and assigning specific reserves is applicable to all loans except for large groups of smaller balance homogeneous loans such as credit card, residential mortgage and consumer loans in which impairment is collectively evaluated. The Bank generally considers loans 90 days or more past due and all nonaccrual loans to be impaired.
The allowance for credit losses increased $9.8 million in the third quarter of 2012 to $35.0 million. A portion of the increase in reserves was attributed to higher general reserve levels principally for homogenous residential and home equity loans resulting from management’s review of these portfolios and the subsequent identification of pools of high risk performing loans.
The following table summarizes, by internally assigned risk grade, the risk grade for loans for which the Bank has assigned a risk grade (in thousands).
| September 30 | December 31 | |||||||||||||||||||||||||||||||||||||||
| 2012_ | 2011 | |||||||||||||||||||||||||||||||||||||||
| Special | Sub- | Special | Sub- | |||||||||||||||||||||||||||||||||||||
| Pass | Mention | Standard | Doubtful | Total | Pass | Mention | standard | Doubtful | Total | |||||||||||||||||||||||||||||||
| Commercial | $ | 491,203 | $ | 35,356 | $ | 49,068 | $ | 693 | $ | 576,320 | $ | 437,475 | $ | 56,172 | $ | 79,229 | $ | 301 | $ | 573,177 | ||||||||||||||||||||
| Real estate – construction | 42,491 | 10,068 | 10,205 | 213 | 62,977 | 35,622 | 14,304 | 23,667 | 757 | 74,350 | ||||||||||||||||||||||||||||||
| Real estate – mortgage | 58,167 | 7,485 | 8,901 | 32 | 74,585 | 57,089 | 7,363 | 14,517 | 171 | 79,140 | ||||||||||||||||||||||||||||||
| Other | 5,598 | - | - | - | 5,598 | 4,954 | - | - | - | 4,954 | ||||||||||||||||||||||||||||||
| Total | $ | 597,459 | $ | 52,909 | $ | 68,174 | $ | 938 | $ | 719,480 | $ | 535,140 | $ | 77,839 | $ | 117,413 | $ | 1,229 | $ | 731,621 | ||||||||||||||||||||
Loans with a risk grade of sub-standard or doubtful are components of classified loans. Additionally, non-risk graded residential, home equity, and consumer loans in nonaccrual status of $5,424,000 and $9,851,000 as of September 30, 2012 and December 31, 2011, respectively, are components of classified loans.
An analysis of the changes in the allowance for credit losses follows (in thousands):
| E-20 |
NewBridge Bancorp and Subsidiary
Notes to Consolidated Financial Statements
(Unaudited)
Note 5 — Loans and Allowance for Credit Losses - (continued)
| Three Months Ended September 30 2012 | Three Months Ended September 30 2011 | Nine Months Ended September 30 2012 | Nine Months Ended September 30 2011 | |||||||||||||
| Balance, beginning of period | $ | 25,231 | $ | 28,040 | $ | 28,844 | $ | 28,752 | ||||||||
| Loans charged off: | ||||||||||||||||
| Secured by owner-occupied nonfarm nonresidential properties | 4,609 | 62 | 5,755 | 516 | ||||||||||||
| Secured by other nonfarm nonresidential properties | 1,491 | 398 | 2,101 | 766 | ||||||||||||
| Other commercial and industrial | 3,257 | 542 | 3,842 | 2,179 | ||||||||||||
| Total Commercial | 9,357 | 1,002 | 11,698 | 3,461 | ||||||||||||
| Construction loans – 1-4 family residential | 193 | 108 | 403 | 209 | ||||||||||||
| Other construction and land development | 4,079 | 1,070 | 6,611 | 3,217 | ||||||||||||
| Total Real estate – construction | 4,272 | 1,178 | 7,014 | 3,426 | ||||||||||||
| Closed-end loans secured by 1 to 4 family residential properties | 4,034 | 592 | 6,560 | 3,204 | ||||||||||||
| Lines of credit secured by 1 to 4 family residential properties | 1,409 | 433 | 3,578 | 1,826 | ||||||||||||
| Loans secured by 5 or more family residential properties | 273 | 576 | 273 | 576 | ||||||||||||
| Total Real estate – mortgage | 5,716 | 1,601 | 10,411 | 5,606 | ||||||||||||
| Credit cards | 54 | 117 | 265 | 296 | ||||||||||||
| Other consumer loans | 263 | 282 | 583 | 813 | ||||||||||||
| Total Consumer | 317 | 399 | 848 | 1,109 | ||||||||||||
| Total Other | 1 | - | 3 | 1,300 | ||||||||||||
| Total chargeoffs | 19,663 | 4,180 | 29,974 | 14,902 | ||||||||||||
| Recoveries of loans previously charged off: | ||||||||||||||||
| Total Commercial | 118 | 14 | 294 | 212 | ||||||||||||
| Total Real estate – construction | 107 | 158 | 292 | 341 | ||||||||||||
| Total Real estate – mortgage | 176 | 156 | 576 | 450 | ||||||||||||
| Total Consumer | 157 | 106 | 278 | 328 | ||||||||||||
| Total Other | 9 | 11 | 22 | 30 | ||||||||||||
| Total recoveries | 567 | 445 | 1,462 | 1,361 | ||||||||||||
| Net loans charged off | 19,096 | 3,735 | 28,512 | 13,541 | ||||||||||||
| Provision for credit losses | 28,881 | 3,445 | 34,684 | 12,539 | ||||||||||||
| Balance, end of period | $ | 35,016 | $ | 27,750 | $ | 35,016 | $ | 27,750 | ||||||||
Loans totaling $7,074,000 and $7,851,000, as of September 30, 2012 and December 31, 2011, respectively, were held for sale, and stated at the lower of cost or market on an individual basis.
Loans totaling $466,700,000 and $506,449,000, as of September 30, 2012 and December 31, 2011, respectively, were pledged to secure lines of the credit with the Federal Home Loan Bank (“FHLB”) and Federal Reserve Bank of Richmond.
| E-21 |
NewBridge Bancorp and Subsidiary
Notes to Consolidated Financial Statements
(Unaudited)
Note 6 — Deferred Tax Assets
During the third quarter 2012, the Company recorded material writedowns and losses on the disposition or resolution of problem assets, which resulted in a material pretax net loss for the quarter. The Company is now in a cumulative pretax loss position for the three year period ended September 30, 2012, which constitutes significant negative evidence in the context of evaluating deferred tax assets for realizability as prescribed by ASC Topic 740.
ASC Topic 740 requires that the realizability of the deferred tax asset and evaluation of the need for a valuation allowance consider all positive and negative evidence to form a conclusion as to whether the realization of the deferred tax asset is more likely than not. The Company must also assign weight to the various forms of evidence, based upon the ability to verify the evidence.
Management has evaluated the realizability of the recorded deferred tax assets at September 30, 2012. This evaluation included a review of all available evidence, including recent historical financial performance and expected near term levels in net interest margin, nonperforming assets, operating expenses, earnings and other factors. It further included the consideration of the items that have given rise to the deferred tax assets, as well as tax planning strategies. Management has concluded that, in addition to a portion of contribution carryforwards which begin expiring in 2013, and a portion of state economic loss carryforwards, an additional $11.0 million valuation allowance is necessary. Management also concluded that the utilization of the remaining deferred tax asset was more likely than not.
The significant components of deferred tax assets at September 30, 2012 and December 31, 2011 are as follows (in thousands):
| 2012 | 2011 | |||||||
| Deferred tax assets: | ||||||||
| Allowance for credit losses | $ | 13,826 | $ | 11,411 | ||||
| Writedowns on real estate acquired in settlement of loans | 5,571 | 1,992 | ||||||
| Interest on nonaccrual loans | 1,145 | 1,551 | ||||||
| Net operating losses | 24,954 | 16,753 | ||||||
| Other | 8,637 | 8,637 | ||||||
| Valuation allowance | (12,037 | ) | (1,037 | ) | ||||
| Total | 42,096 | 39,307 | ||||||
| Deferred tax liabilities: | ||||||||
| Net unrealized gain on available for sale securities | 5,405 | 319 | ||||||
| Other | 6,725 | 6,725 | ||||||
| Total | 12,130 | 7,044 | ||||||
| Net deferred tax assets | $ | 29,966 | $ | 32,263 | ||||
Note 7 — Stock Compensation Plans
The Company recorded $86,000 and $104,000 of total stock-based compensation expense for the nine-month periods ended September 30, 2012 and September 30, 2011, respectively. The reduced expense during the current period is primarily due to revised expectations as to the achievement of certain conditions affecting the vesting of outstanding performance-based awards. The stock-based compensation expense is calculated on a ratable basis over the vesting periods of the related stock options, restricted stock grants or restricted stock units and is reported under personnel expense. This expense had no impact on the Company’s reported cash flows.As of September 30, 2012, there was $661,000 of total unrecognized stock-based compensation expense. This expense will be fully recognized by December of 2015.
| E-22 |
NewBridge Bancorp and Subsidiary
Notes to Consolidated Financial Statements
(Unaudited)
Note 7 — Stock Compensation Planss - (continued)
For purposes of determining estimated fair value of stock options, restricted stock grants and restricted stock units, the Company has computed the estimated fair values of all stock-based compensation using the Black-Scholes option pricing model and, for stock options and restricted stock grants granted prior to December 31, 2011, has applied the assumptions set forth in the Annual Report.
On January 11, 2012, the Company’s Board of Directors awarded a total of 121,616 restricted stock units to certain executive officers. The fair value of these restricted stock units is $3.89 per unit, which was the closing price of the Company’s common stock on that date. On July 25, 2012, the Company’s Board of Directors awarded an additional 9,710 restricted stock units to certain executive officers. The fair value of these restricted stock units is $4.10 per unit, which was the closing price of the Company’s common stock on that date. Half of the restricted stock units vest over a period of four years and half vest, subject to meeting certain performance criteria, over a period of three years. Vesting is also subject to the Company repurchasing, or the U.S. Department of the Treasury (the “U.S. Treasury”) selling, some or all of the Fixed Rate Cumulative Perpetual Preferred Stock, Series A (the “Series A Preferred Stock”) issued by the U.S. Treasury under theCapital Purchase Program (the “CPP). The stock-based compensation expense for these awards was immaterial for the first nine months of 2012.
Note 8—Fair Value of Financial Instruments
The following methods and assumptions were used to estimate the fair value for each class of the Company’s financial instruments.
Cash and cash equivalents.The carrying amounts for cash and due from banks approximate fair value because of the short maturities of those instruments.
Investment securities. The fair value of investment securities is based on quoted prices in active markets for identical assets, if available. If a quoted market price is not available, fair value is estimated using quoted market prices for similar securities, corresponding to the “significant other observable inputs” definition of GAAP. If a quoted market price for a similar security is not available, fair value is estimated using “significant unobservable inputs” as defined by GAAP. The fair value of equity investments in the restricted stock of the FHLB equals the carrying value as there is no market for FHLB stock which is redeemable only by the FHLB.
Loans. The fair value of fixed rate loans is estimated by discounting the future cash flows using the current rates at which similar loans would be made to borrowers with similar credit ratings and for the same remaining maturities. Substantially all residential mortgage loans held for sale are pre-sold and their carrying value approximates fair value. The fair value of variable rate loans with frequent repricing and negligible credit risk approximates book value.
Deposits. The fair value of noninterest-bearing demand deposits and NOW, savings, and money market deposits are the amounts payable on demand at the reporting date. The fair value of time deposits is estimated using the rates currently offered for deposits of similar remaining maturities.
Federal funds purchased and retail repurchase agreements. The carrying value of federal funds purchased and retail repurchase agreements are considered to be a reasonable estimate of fair value.
Wholesale repurchase agreements and other borrowings.The fair values of these liabilities are estimated using the discounted values of the contractual cash flows. The discount rate is estimated using the rates currently in effect for similar borrowings.
Financial instruments with off-balance sheet risk. The carrying value of financial instruments with off-balance sheet risk is considered to approximate fair value, since a large majority of these future financing commitments would result in loans that have variable rates and/or relatively short terms to maturity. For other commitments,
| E-23 |
NewBridge Bancorp and Subsidiary
Notes to Consolidated Financial Statements
(Unaudited)
Note 8 — Fair Value of Financial Instruments - (continued)
generally of a short-term nature, the carrying value is considered to be a reasonable estimate of fair value. The various financial instruments are disclosed in Note 16in the Notes to Consolidated Financial Statements of the Annual Report.
The table below presents the estimated fair values of financial instruments as of September 30, 2012 and December 31, 2011 (in thousands):
| Estimated Fair Value | ||||||||||||||||||||
| September 30, 2012 | Carrying Value | Quoted prices in active markets for identical assets (Level 1) | Significant other observable inputs (Level 2) | Significant unobservable inputs (Level 3) | Total | |||||||||||||||
| Financial assets: | ||||||||||||||||||||
| Cash and short term investments | $ | 42,741 | $ | 42,741 | $ | - | $ | - | $ | 42,741 | ||||||||||
| Investment securities | 387,376 | 379,502 | 7,874 | 387,376 | ||||||||||||||||
| Loans | 1,168,747 | - | - | 1,156,043 | 1,156,043 | |||||||||||||||
| Financial liabilities: | ||||||||||||||||||||
| Deposits | 1,389,736 | - | 1,391,240 | - | 1,391,240 | |||||||||||||||
| Wholesale repurchase agreements | 21,000 | - | 23,896 | - | 23,896 | |||||||||||||||
| Junior subordinated notes | 25,774 | - | - | 11,225 | 11,225 | |||||||||||||||
| FHLB borrowings | 117,200 | - | 118,214 | - | 118,214 | |||||||||||||||
| Estimated Fair Value | ||||||||||||||||||||
| December 31, 2011 | Carrying Value | Quoted prices in active markets for identical assets (Level 1) | Significant other observable inputs (Level 2) | Significant unobservable inputs (Level 3) | Total | |||||||||||||||
| Financial assets: | ||||||||||||||||||||
| Cash and short term investments | $ | 53,992 | $ | 53,992 | $ | - | $ | - | $ | 53,992 | ||||||||||
| Investment securities | 337,811 | 330,626 | 7,185 | 337,811 | ||||||||||||||||
| Loans | 1,200,070 | - | - | 1,197,885 | 1,197,885 | |||||||||||||||
| Financial liabilities: | ||||||||||||||||||||
| Deposits | 1,418,676 | - | 1,420,704 | - | 1,420,704 | |||||||||||||||
| Wholesale repurchase agreements | 21,000 | - | 23,772 | - | 23,772 | |||||||||||||||
| Junior subordinated notes | 25,774 | - | - | 10,857 | 10,857 | |||||||||||||||
| FHLB borrowings | 86,700 | - | 87,911 | - | 87,911 | |||||||||||||||
The fair value estimates are made at a specific point in time based on relevant market and other information about the financial instruments. Because no market exists for a significant portion of the Company’s financial instruments, fair value estimates are based on current economic conditions, risk characteristics of various financial instruments, and such other factors. These estimates are subjective in nature and involve uncertainties and matters of significant judgment and therefore cannot be determined with precision. Changes in assumptions could significantly affect the estimates. In addition, the tax ramifications related to the realization of the unrealized gains and losses can have a significant effect on fair value estimates and have not been considered in the estimates.
| E-24 |
NewBridge Bancorp and Subsidiary
Notes to Consolidated Financial Statements
(Unaudited)
Note 8 — Fair Value of Financial Instruments - (continued)
The table below presents the assets measured at fair value on a recurring basis categorized by the level of inputs used in the valuation of each asset (in thousands):
| Quoted prices in active markets for identical assets (Level 1) | | Significant other observable inputs (Level 2) | Significant unobservable inputs (Level 3) | |||||||||
| Available for sale securities at September 30, 2012 | $ | - | $ | 379,502 | $ | 7,874 | ||||||
| Available for sale securities at December 31, 2011 | - | 330,626 | 7,185 | |||||||||
The table below presents the reconciliation for all assets and liabilities measured at fair value on a recurring basis using significant unobservable inputs (level 3) during 2012 and 2011 (in thousands):
| Nine Months | Twelve Months | |||||||
| Ended | Ended | |||||||
| September 30 | December 31 | |||||||
| 2012 | 2011 | |||||||
| Available for sale securities | ||||||||
| Federal Home Loan Bank stock: | ||||||||
| Beginning balance | $ | 7,185 | $ | 10,399 | ||||
| Purchases | 4,894 | - | ||||||
| Redemptions | (4,205 | ) | (3,214 | ) | ||||
| Ending balance | $ | 7,874 | $ | 7,185 | ||||
The table below presents the assets measured at fair value on a nonrecurring basis categorized by the level of inputs used in the valuation of each asset (in thousands):
| Quoted prices in active markets for identical assets (Level 1) | Significant other observable inputs (Level 2) | Significant unobservable inputs (Level 3) | ||||||||||
| Loans held for sale at September 30, 2012 | $ | - | $ | 7,074 | $ | - | ||||||
| Loans held for sale at December 31, 2011 | - | 7,851 | - | |||||||||
| Real estate acquired in settlement of loans at September 30, 2012 | - | - | 10,465 | |||||||||
| Real estate acquired in settlement of loans at December 31, 2011 | - | - | 30,587 | |||||||||
| Impaired loans, net of allowance at September 30, 2012 | - | - | 20,341 | |||||||||
| Impaired loans, net of allowance at December 31, 2011 | - | - | 28,425 | |||||||||
The fair value of loans secured by real estate is determined by appraisals or by alternative evaluations, such as tax evaluations. The fair value of loans not secured by real estate is based on present value of future cash flows. The fair value of loans may also be determined by sales contract in hand or settlement agreement.
| E-25 |
NewBridge Bancorp and Subsidiary
Notes to Consolidated Financial Statements
(Unaudited)
Note 9 —U.S. Treasury Capital Purchase Program (CPP)
On December 12, 2008, the Company issued and sold to the U.S. Treasury (i) 52,372 shares of Series A Preferred Stock and (ii) a warrant (the “Warrant”) to purchase 2,567,255 shares of the Company’s common stock at an exercise price of $3.06 per share, for an aggregate purchase price of $52,372,000 in cash. The Warrant may be exercised by the U.S. Treasury at any time before it expires on December 12, 2018. The fair value of the Warrant of $1,497,000 was estimated on the date of the grant using the Black-Scholes option-pricing model. The Series A Preferred Stock pays cumulative dividends of five percent for the first five years and nine percent thereafter, unless the Company redeems the shares.
Note 10—Subsequent Events
On November 1, 2012, the Company entered into securities purchase agreements with select investors and insiders pursuant to which it expects to raise $56 million of equity, subject to receipt of customary regulatory approvals and determinations. The capital raise will be executed through a private placement of two series of mandatorily convertible preferred stock. The two series of preferred stock will automatically convert into shares of the Company’s voting and nonvoting common stock at a price of $4.40 per share after the Company has received shareholder approval at a Special Meeting of Shareholders expected to be held in the first quarter of 2013.
| E-26 |
APPENDIX F
Management’s Discussion and Analysis of Financial Condition at September 30, 2012, and Results of Operations for the three-month and nine-month periods ended September 30, 2012 and September 30, 2011, as included in our Quarterly Report on Form 10-Q for the fiscal quarter ended September 30, 2012
| F-1 |
Item 2. Management’s Discussion and Analysis of Financial Condition and Results of Operations.
The discussion presented herein is intended to provide an overview of the changes in financial condition and results of operations during the time periods required by Item 303 of Regulation S-K for NewBridge Bancorp (“Bancorp” or the “Company”) and its wholly-owned subsidiary NewBridge Bank (the “Bank”).
The consolidated financial statements also include the accounts and results of operations of the Bank’s wholly-owned subsidiaries. This discussion and analysis is intended to complement the unaudited financial statements, notes and supplemental financial data in this Quarterly Report on Form 10-Q and should be read in conjunction therewith.
This Quarterly Report on Form 10-Q contains forward-looking statements within the meaning of the Private Securities Litigation Reform Act of 1995. These statements represent expectations and beliefs of Bancorp including but not limited to Bancorp’s operations, performance, financial condition, growth or strategies. These forward-looking statements are identified by words such as “expects,” “anticipates,” “should,” “estimates,” “believes” and variations of these words and other similar statements. For this purpose, any statements contained in this Quarterly Report on Form 10-Q that are not statements of historical fact may be deemed to be forward-looking statements. Readers should not place undue reliance on forward-looking statements as a number of important factors could cause actual results to differ materially from those in the forward-looking statements. These forward-looking statements involve estimates, assumptions, risks and uncertainties that could cause actual results to differ materially from current projections depending on a variety of important factors, including without limitation: (1) the successful completion of the recently announced capital raise; (2) the receipt of customary regulatory approvals and determinations related to the recently announced capital raise; (3) receipt of the shareholder approvals related to the recently announced capital raise; (4) recently enacted legislation, or legislation enacted in the future, or any proposed federal programs may subject Bancorp to increased regulation and may adversely affect Bancorp; (5) the strength of the United States economy generally, and the strength of the local economies in which Bancorp conducts operations, may be different than expected, resulting in, among other things, a continued deterioration in credit quality, including the resultant effect on Bancorp’s loan portfolio and allowance for credit losses; (6) the effects of, and changes in, trade, monetary and fiscal policies and laws, including interest rate policies of the Board of Governors of the Federal Reserve System (the “Federal Reserve”); (7) inflation, deflation, interest rate, market and monetary fluctuations; (8) adverse conditions in the stock market, the public debt market and other capital markets (including changes in interest rate and market liquidity conditions) and the impact of such conditions on Bancorp’s capital markets and capital management activities; (9) the timely development of competitive new products and services by Bancorp and the acceptance of these products and services by new and existing customers; (10) the willingness of customers to accept third party products marketed by Bancorp; (11) the willingness of customers to substitute competitors’ products and services for Bancorp’s products and services and vice versa; (12) the impact of changes in financial services’ laws and regulations (including laws concerning taxes, banking and securities); (13) technological changes; (14) changes in consumer spending and saving habits; (15) the effect of corporate restructurings, acquisitions and/or dispositions, and the failure to achieve the expected revenue growth and/or expense savings from such corporate restructurings, acquisitions and/or dispositions; (16) the current stresses in the financial and real estate markets, including possible continued deterioration in property values; (17) unanticipated regulatory or judicial proceedings; (18) the impact of changes in accounting policies by the Securities and Exchange Commission (the “SEC”); (19) adverse changes in financial performance and/or condition of Bancorp’s borrowers which could impact repayment of such borrowers’ outstanding loans; and (20) Bancorp’s success at managing the risks involved in the foregoing. Bancorp cautions that the foregoing list of important factors is not exhaustive. See also those risk factors identified in the section headed “Risk Factors” beginning on page 13 of Bancorp’s Annual Report on Form 10-K for the fiscal year ended December 31, 2011, filed with the SEC on March 22, 2012 (the “Annual Report”). Bancorp undertakes no obligation to update any forward-looking statement, whether written or oral, which may be made from time to time by or on behalf of Bancorp.
Introduction
Bancorp is a bank holding company incorporated under the laws of North Carolina (“NC”) and registered under the Bank Holding Company Act of 1956, as amended (the “BHCA”). Bancorp’s principal asset is the stock of its banking subsidiary, the Bank.
| F-2 |
The Company’s results of operations are dependent primarily on the results of operations of the Bank and thus are dependent to a significant extent on net interest income, which is the difference between the income earned on the Bank’s loan and investment portfolios and cost of funds, consisting of interest paid on deposits and borrowings. Results of operations are also affected by the Company’s provision for credit losses, mortgage loan sales activities, service charges and other fee income, and noninterest expense. The Company’s noninterest expense principally consists of compensation and employee benefits, office occupancy and equipment expense, data processing, professional fees, and advertising and business promotion expenses. The Company’s results of operations are also significantly affected by general economic and competitive conditions, particularly changes in interest rates, government policies and actions of regulatory authorities.
Commercial banking in North Carolina is extremely competitive, due in large part to intrastate and interstate branching laws. Many of the Company’s competitors are significantly larger and have greater resources. The Company continues to encounter significant competition from a number of sources, including bank holding companies, financial holding companies, commercial banks, thrift institutions, credit unions and other financial institutions and financial intermediaries. The Company competes in its market areas with some of the largest banking organizations in the Southeast and nationally, almost all of which have numerous branches in NC. The Company’s competition is not limited to financial institutions based in NC. The enactment of federal legislation authorizing nationwide interstate banking has greatly increased the size and financial resources of some of the Company’s competitors. Many of its competitors have substantially higher lending limits due to their greater total capitalization, and many perform functions for their customers that the Company generally does not offer. The Company primarily relies on providing quality products and services at a competitive price within its market areas. As a result of interstate banking legislation, the Company’s market is open to future penetration by banks located in other states.
The following discussion and analysis is presented on a consolidated basis and focuses on the major components of the Company’s operations and significant changes in its results of operations for the periods presented. For further information, refer to the Consolidated Financial Statements and notes thereto included in the Annual Report.
Application of Critical Accounting Policies
The accounting and reporting policies of the Company and its subsidiary comply with accounting principles generally accepted in the United States and conform to standards within the banking industry.The preparation of the financial information contained in this Quarterly Report on Form 10-Q requires the Company’s management to make estimates and judgments that affect the reported amounts of assets, liabilities, revenues and expenses, and related disclosure of contingent assets and liabilities. The Company’s management evaluates these estimates on an ongoing basis.A summary of the allowance for credit losses, the most complex and subjective accounting policy of the Company, is discussed under the heading “Asset Quality and Allowance for Credit Losses” as well as in Note 4 of the Notes to Consolidated Financial Statements. Income taxes and the valuation allowance against deferred tax assets are discussed in Note 5 of the Notes to Consolidated Financial Statements.
Three Months Ended September 30, 2012 Compared to Three Months Ended September 30, 2011
Net Interest Income
Net interest income for the third quarter of 2012, on a taxable equivalent basis, was $15.8 million, a decrease of $0.9 million, or 5.6%, from $16.7 million for the third quarter of 2011. Average earning assets in the third quarter of 2012 decreased $18.7 million, or 1.2%, to $1.56 billion, compared to $1.58 billion in the third quarter of 2011. Average interest-bearing liabilities in the third quarter of 2012 decreased $36.4 million, or 2.6%, to $1.34 billion, compared to $1.37 billion in the third quarter of 2011. Taxable equivalent net interest margin decreased to 4.02% for the third quarter of 2012, compared to 4.20% for the third quarter of 2011. The interest rate spread decreased in the third quarter of 2012 by 14 basis points compared to the third quarter of 2011.
The decrease in net interest margin and interest rate spread was driven primarily by an overall lower yield on the investment portfolio and a lower yield on the loan portfolio, partially offset by a lower cost of funds rate. The par value of the Company’s investment in U.S. government agency securities decreased to $37.0 million at
| F-3 |
September 30, 2012 from $48.0 million at September, 30, 2011 due to calls on higher yielding securities. At September 30, 2012, the par value of the Company’s investment in corporate bonds was $150.8 million compared to $110.8 million at September 30, 2011. The weighted average duration of the Company’s investment securities was 2.9 years at September 30, 2012, compared to 3.4 years at September 30, 2011. The sustained low interest rate environment continues to impact loan yields. The annualized average yield on loans decreased to 4.81% for the three months ended September 30, 2012 compared to 5.18% for the three months ended September 30, 2011. The average yield on earning assets during the third quarter of 2012 was 47 basis points lower than the average yield on earning assets during the comparable period in 2011, while the average rate on interest-bearing liabilities decreased by 33 basis points during the same time period. The highest cost category of deposits remains retail time deposits, which had a weighted average interest rate of 0.64% at September 30 2012. Approximately $94.9 million of retail time deposits with a weighted average rate of 0.46% will mature in the fourth quarter of 2012. The following table provides an analysis of average volumes, yields and rates and net interest income on a taxable equivalent basis for the three months ended September 30, 2012 and 2011.
(Fully taxable equivalent basis1, dollars in thousands)
| Three Months Ended | Three Months Ended | |||||||||||||||||||||||
| September 30, 2012 | September 30, 2011 | |||||||||||||||||||||||
| Interest | Annualized | Interest | Annualized | |||||||||||||||||||||
| Average | Income/ | Average | Average | Income/ | Average | |||||||||||||||||||
| Balance | Expense | Yield/Rate | Balance | Expense | Yield/Rate | |||||||||||||||||||
| Earning assets: | ||||||||||||||||||||||||
| Loans receivable2 | $ | 1,165,080 | $ | 14,084 | 4.81 | % | $ | 1,234,861 | $ | 16,121 | 5.18 | % | ||||||||||||
| Taxable securities | 361,123 | 3,033 | 3.34 | 286,736 | 3,129 | 4.33 | ||||||||||||||||||
| Tax exempt securities | 17,464 | 279 | 6.36 | 16,790 | 283 | 6.69 | ||||||||||||||||||
| FHLB stock | 7,163 | 28 | 1.56 | 8,830 | 18 | 0.83 | ||||||||||||||||||
| Interest-bearing bank balances | 10,430 | 10 | 0.38 | 32,709 | 20 | 0.24 | ||||||||||||||||||
| Federal funds sold | - | - | - | - | - | - | ||||||||||||||||||
| Total earning assets | 1,561,260 | 17,434 | 4.44 | 1,579,926 | 19,571 | 4.91 | ||||||||||||||||||
| Nonearning assets: | ||||||||||||||||||||||||
| Cash and due from banks | 25,439 | 25,623 | ||||||||||||||||||||||
| Premises and equipment | 36,544 | 36,387 | ||||||||||||||||||||||
| Other assets | 120,127 | 104,938 | ||||||||||||||||||||||
| Allowance for credit losses | (28,757 | ) | (28,456 | ) | ||||||||||||||||||||
| Total assets | $ | 1,714,613 | $ | 17,434 | $ | 1,718,418 | $ | 19,571 | ||||||||||||||||
| Interest-bearing liabilities: | ||||||||||||||||||||||||
| Savings deposits | $ | 45,298 | $ | 6 | 0.05 | % | $ | 40,675 | $ | 10 | 0.10 | % | ||||||||||||
| NOW deposits | 425,361 | 259 | 0.24 | 420,734 | 557 | 0.53 | ||||||||||||||||||
| Money market deposits | 366,213 | 224 | 0.24 | 364,813 | 657 | 0.71 | ||||||||||||||||||
| Time deposits | 389,638 | 599 | 0.61 | 428,291 | 1,028 | 0.95 | ||||||||||||||||||
| Other borrowings | 46,926 | 343 | 2.91 | 46,774 | 328 | 2.78 | ||||||||||||||||||
| Borrowings from FHLB | 62,259 | 232 | 1.48 | 70,761 | 276 | 1.55 | ||||||||||||||||||
| Total interest-bearing liabilities | 1,335,695 | 1,663 | 0.50 | 1,372,048 | 2,856 | 0.83 | ||||||||||||||||||
| Other liabilities and shareholders’ equity: | ||||||||||||||||||||||||
| Demand deposits | 189,979 | 163,440 | ||||||||||||||||||||||
| Other liabilities | 18,442 | 17,849 | ||||||||||||||||||||||
| Shareholders’ equity | 170,497 | 165,081 | ||||||||||||||||||||||
| Total liabilities and shareholders’ equity | $ | 1,714,613 | 1,663 | $ | 1,718,418 | 2,856 | ||||||||||||||||||
| Net interest income and net interest margin3 | $ | 15,771 | 4.02 | % | $ | 16,715 | 4.20 | % | ||||||||||||||||
| Interest rate spread4 | 3.94 | % | 4.08 | % | ||||||||||||||||||||
| F-4 |
| 1 | Income related to securities exempt from federal income taxes is stated on a fully taxable equivalent basis, assuming a federal income tax rate of 35%, and is then reduced by the nondeductible portion of interest expense. The adjustments made to convert to a fully taxable equivalent basis were $92 for 2012 and $92 for 2011. |
��
| 2 | The average loans receivable balances include nonaccruing loans. Amortization of loan fees, net of deferred costs, and other loan-related fees of $84 and $139 for the three months ended September 30, 2012 and 2011, respectively, are included in interest income. |
| 3 | Net interest margin is computed by dividing net interest income by average earning assets. |
| 4 | Earning assets yield minus interest-bearing liability rate. |
Noninterest Income and Expense
In the third quarter of 2012, noninterest income decreased to $(6.4) million, from $3.3 million during the same period in 2011. Writedowns and losses on sales of real estate acquired in settlement of loans increased to $10.6 million, from $0.8 million during the same period last year as the Company made significant progress with the asset disposition plan. See “Asset Quality and Allowance for Credit Losses” for further discussion of this plan.The Company recognized gains on the sale of investment securities of $3,000 during the third quarter of 2012, compared to $65,000 during the third quarter of 2011. Retail Banking income decreased 6.1% to $2.3 million in the third quarter of 2012 from $2.5 million in the third quarter of 2011 due primarily to ongoing regulatory changes in the industry and changes in consumer behavior.Mortgage Banking revenue increased to $0.7 million in the third quarter of 2012, compared to $0.4 million in the third quarter of 2011, due to higher volume of mortgage originations.
In the third quarter of 2012, noninterest expense increased to $16.5 million from $14.9 million in the third quarter of 2011. In the third quarter of 2012, the Company expensed $1.9 million in adjustments for impairments on facilities and for other nonrecurring accruals. Federal Deposit Insurance Corporation (“FDIC”) insurance expense decreased to $0.4 million in the third quarter of 2012 from $0.6 million in the third quarter of 2011. In the third quarter of 2011, the Bank received a new risk rating which reduced the Bank’s assessments. Compared to the third quarter of 2011, the Company recorded decreases in personnel expense and furniture and equipment expense during the third quarter of 2012 as a result of the Company’s continued focus on efficiency and a disciplined cost management culture.
The following table presents the details of Other Noninterest Expense (dollars in thousands):
| Three Months Ended | ||||||||||||
| September 30 | Percentage | |||||||||||
| 2012 | 2011 | Variance | ||||||||||
| Other noninterest expense: | ||||||||||||
| Advertising | $ | 367 | $ | 346 | 6.1 | % | ||||||
| Bankcard expense | 117 | 166 | (29.5 | ) | ||||||||
| Postage | 186 | 225 | (17.3 | ) | ||||||||
| Telephone | 182 | 164 | 11.0 | |||||||||
| Amortization of core deposit intangible | 182 | 182 | 0.0 | |||||||||
| Stationery, printing and supplies | 97 | 125 | (22.4 | ) | ||||||||
| Other expense | 2,094 | 1,274 | 64.4 | |||||||||
| Total other noninterest expense | $ | 3,225 | $ | 2,482 | 29.9 | |||||||
Income Taxes
The Company recorded income tax benefit of $3.7 million for the third quarter of 2012, compared to income tax expense of $501,000 for the third quarter of 2011. The Company’s effective tax rate was 10.2% for the three-month period ended September 30, 2012, compared to 31.6% for the third quarter of 2011. The change in the effective tax rate is primarily a result of an increase of $11.0 million in the valuation allowance against deferred tax assets in 2012.
| F-5 |
Nine Months Ended September 30, 2012 Compared to Nine Months Ended September 30, 2011
Net Interest Income
Net interest income for the first nine months of 2012, on a taxable equivalent basis, was $48.5 million, a decrease of $2.4 million, or 4.6%, from $50.8 million for the first nine months of 2011. Average earning assets in the first nine months of 2012 decreased $39.9 million, or 2.5%, to $1.58 billion, compared to $1.62 billion in the first nine months of 2011. Average interest-bearing liabilities in the first nine months of 2012 decreased $63.5 million, or 4.5%, to $1.35 billion, compared to $1.41 billion in the first nine months of 2011. Taxable equivalent net interest margin decreased to 4.11% for the nine months of 2012, compared to 4.21% for the first nine months of 2011, a decrease of 10 basis points. The interest rate spread decreased in the first nine months of 2012 by six basis points compared to the first nine months of 2011.
The decrease in net interest margin and interest rate spread was driven primarily by an overall lower yield on the investment portfolio and a lower yield on the loan portfolio, partially offset by a lower cost of funds rate. The par value of the Company’s investment in U.S. government agency securities decreased to $37.0 million at September 30, 2012 from $48.0 million at September 30, 2011 due to calls on higher yielding securities. At September 30, 2012, the par value of the Company’s investment in corporate bonds was $150.8 million compared to $110.8 million at September 30, 2011. The weighted average duration of the Company’s investment securities was 2.9 years at September 30, 2012, compared to 3.4 years at September 30, 2011. For the nine months ended September 30, 2012, the annualized average yield on loans decreased to 4.95% from 5.19% for the nine months ended September 30, 2011. The net interest margin is also impacted by changes in interest income from nonaccrual loans. For the nine months ended September 30, 2012, nonaccrual interest decreased the net interest margin by nine basis points compared to 11 basis points for the nine months ended September 30, 2011. The average yield on earning assets during the first nine months of 2012 was 39 basis points lower than the average yield on earning assets during the comparable period in 2011, while the average rate on interest-bearing liabilities decreased by 33 basis points during the same time period. The following table provides an analysis of average volumes, yields and rates and net interest income on a taxable equivalent basis for the nine months ended September 30, 2012 and 2011.
| F-6 |
(Fully taxable equivalent basis1, dollars in thousands)
| Nine Months Ended | Nine Months Ended | |||||||||||||||||||||||
| September 30, 2012 | September 30, 2011 | |||||||||||||||||||||||
| Interest | Annualized | Interest | Annualized | |||||||||||||||||||||
| Average | Income/ | Average | Average | Income/ | Average | |||||||||||||||||||
| Balance | Expense | Yield/Rate | Balance | Expense | Yield/Rate | |||||||||||||||||||
| Earning assets: | ||||||||||||||||||||||||
| Loans receivable2 | $ | 1,177,334 | $ | 43,587 | 4.95 | % | $ | 1,289,198 | $ | 50,052 | 5.19 | % | ||||||||||||
| Taxable securities | 357,371 | 9,915 | 3.71 | 275,665 | 9,535 | 4.62 | ||||||||||||||||||
| Tax exempt securities | 17,692 | 852 | 6.43 | 16,247 | 848 | 6.98 | ||||||||||||||||||
| FHLB stock | 7,302 | 79 | 1.45 | 9,625 | 60 | 0.83 | ||||||||||||||||||
| Interest-bearing bank balances | 15,462 | 30 | 0.26 | 24,359 | 44 | 0.24 | ||||||||||||||||||
| Federal funds sold | - | - | - | - | - | - | ||||||||||||||||||
| Total earning assets | 1,575,161 | 54,463 | 4.62 | 1,615,094 | 60,539 | 5.01 | ||||||||||||||||||
| Nonearning assets: | ||||||||||||||||||||||||
| Cash and due from banks | 26,132 | 29,815 | ||||||||||||||||||||||
| Premises and equipment | 36,522 | 37,579 | ||||||||||||||||||||||
| Other assets | 122,271 | 106,483 | ||||||||||||||||||||||
| Allowance for credit losses | (28,635 | ) | (29,446 | ) | ||||||||||||||||||||
| Total assets | $ | 1,731,451 | $ | 54,463 | $ | 1,759,525 | $ | 60,539 | ||||||||||||||||
| Interest-bearing liabilities: | ||||||||||||||||||||||||
| Savings deposits | $ | 44,155 | $ | 20 | 0.06 | % | $ | 40,823 | $ | 30 | 0.10 | % | ||||||||||||
| NOW deposits | 433,546 | 1,015 | 0.31 | 433,346 | 2,018 | 0.62 | ||||||||||||||||||
| Money market deposits | 373,158 | 1,024 | 0.37 | 347,244 | 1,912 | 0.74 | ||||||||||||||||||
| Time deposits | 379,106 | 2,158 | 0.76 | 443,166 | 3,553 | 1.07 | ||||||||||||||||||
| Other borrowings | 47,016 | 1,032 | 2.93 | 56,712 | 1,313 | 3.10 | ||||||||||||||||||
| Borrowings from FHLB | 74,532 | 760 | 1.36 | 93,701 | 907 | 1.29 | ||||||||||||||||||
| Total interest-bearing liabilities | 1,351,513 | 6,009 | 0.59 | 1,414,992 | 9,733 | 0.92 | ||||||||||||||||||
| Other liabilities and shareholders’ equity: | ||||||||||||||||||||||||
| Demand deposits | 192,100 | 164,047 | ||||||||||||||||||||||
| Other liabilities | 19,372 | 16,657 | ||||||||||||||||||||||
| Shareholders’ equity | 168,466 | 163,829 | ||||||||||||||||||||||
| Total liabilities and shareholders’ equity | $ | 1,731,451 | 6,009 | $ | 1,759,525 | 9,733 | ||||||||||||||||||
| Net interest income and net interest margin3 | $ | 48,454 | 4.11 | % | $ | 50,806 | 4.21 | % | ||||||||||||||||
| Interest rate spread4 | 4.03 | % | 4.09 | % | ||||||||||||||||||||
| 1 | Income related to securities exempt from federal income taxes is stated on a fully taxable equivalent basis, assuming a federal income tax rate of 35%, and is then reduced by the nondeductible portion of interest expense. The adjustments made to convert to a fully taxable equivalent basis were $281 for 2012 and $276 for 2011. |
| 2 | The average loans receivable balances include nonaccruing loans. Amortization of loan fees, net of deferred costs, and other loan-related feesof $373 and $422 for the nine months ended September 30, 2012 and 2011, respectively, are included in interest income. |
| 3 | Net interest margin is computed by dividing net interest income by average earning assets. |
| 4 | Earning assets yield minus interest-bearing liability rate. |
| F-7 |
Noninterest Income and Expense
In the first nine months of 2012, noninterest income decreased to $(2.4) million, from $10.2 million during the same period in 2011. Writedowns and losses on sales of real estate acquired in settlement of loans increased to $14.6 million, from $3.9 million during the same period last year as the Company made significant progress with the asset disposition plan. See “Asset Quality and Allowance for Credit Losses” for further discussion of this plan.The Company recognized gains on the sale of investment securities of $3,000 during the first nine months of 2012, compared to $2.0 million during the first nine months of 2011. Retail Banking income decreased 8.3% to $6.9 million in the first nine months of 2012 from $7.5 million in the first nine months of 2011 due primarily to ongoing regulatory changes in the industry and changes in consumer behavior.Mortgage Banking revenue increased to $1.8 million in the first nine months of 2012, compared to $1.1 million in the first nine months of 2011, due to higher volume of mortgage originations.
In the first nine months of 2012, noninterest expense was $43.9 million, the same as for the first nine months of 2011. In the third quarter of 2012, the Company expensed $1.9 million in adjustments for impairments on facilities and for other nonrecurring accruals. FDIC insurance expense decreased to $1.3 million in the first nine months of 2012 from $2.0 million in the first nine months of 2011. On February 7, 2011, the FDIC adopted a new assessment formula, which became effective in the second quarter of 2011. The application of the new assessment formula had the effect of reducing the Bank’s assessments. In the third quarter of 2011, the Bank received a new risk rating which further reduced the Bank’s assessments. Compared to the first nine months of 2011, the Company recorded decreases in personnel expense and furniture and equipment expense during the first nine months of 2012 as a result of the Company’s continued focus on efficiency and a disciplined cost management culture.
The following table presents the details of Other Noninterest Expense (dollars in thousands):
| Nine Months Ended | ||||||||||||
| September 30 | Percentage | |||||||||||
| 2012 | 2011 | Variance | ||||||||||
| Other noninterest expense: | ||||||||||||
| Advertising | $ | 1,150 | $ | 1,160 | (0.9 | )% | ||||||
| Bankcard expense | 329 | 459 | (28.3 | ) | ||||||||
| Postage | 572 | 585 | (2.2 | ) | ||||||||
| Telephone | 525 | 489 | 7.4 | |||||||||
| Amortization of core deposit intangible | 545 | 545 | 0.0 | |||||||||
| Stationery, printing and supplies | 312 | 375 | (16.8 | ) | ||||||||
| Other expense | 4,353 | 3,665 | 18.8 | |||||||||
| Total noninterest expense | $ | 7,786 | $ | 7,278 | 7.0 | |||||||
Income Taxes
The Company recorded income tax benefit of $2.8 million for the first nine months of 2012, compared to income tax expense of $1.1 million for the first nine months of 2011. The Company’s effective tax rate was 8.5% for the nine-month period ended September 30, 2012, compared to 25.8% for the first nine months of 2011. The change in the effective tax rate is primarily a result of an increase of $11.0 million in the valuation allowance against deferred tax assets in 2012.
Asset Quality and Allowance for Credit Losses
The Company’s allowance for credit losses, which is utilized to absorb actual losses in the loan portfolio, is analyzed monthly by management. This analysis includes a methodology that segments the loan portfolio into risk graded loans and homogeneous loan classifications and considers the current status of the portfolio, historical chargeoff experience, current levels of delinquent, impaired and nonperforming loans and their underlying collateral values, as well as economic and other risk factors. It is also subject to regulatory examinations and determinations as to adequacy, which may take into account such factors as the methodology employed and other analytical measures in comparison to a group of peer banks. The Bank, like many financial institutions, has recently faced a challenging credit environment and could continue to face similar challenges
| F-8 |
in the coming months unless there is a significant improvement in regional and national economic conditions. The majority of the Bank’s loan portfolio is comprised of loans secured by real estate and is therefore subject to risk as a result of the weak real estate market. No assurances can be given that future economic conditions will not adversely affect borrowers and result in increases in credit losses and nonperforming asset levels.
The allowance for credit losses is maintained at a level consistent with management’s best estimate of probable credit losses incurred as of the balance sheet date. Major loan portfolio subgroups include: risk graded commercial loans, mortgage loans, home equity loans, retail loans and retail credit lines. Management analyzes loans in the portfolio on an ongoing basis to evaluate current risk levels, and risk grades are adjusted accordingly. While management uses the best information available to make evaluations, future adjustments may be needed if economic or other conditions differ substantially from the assumptions used. The allowance for credit losses increased $9.8 million in the third quarter of 2012 to $35.0 million. A portion of the increase in reserves was attributed to higher general reserve levels principally for homogenous residential and home equity loans resulting from management’s review of these portfolios and the subsequent identification of pools of high risk performing loans.
In its Quarterly Report on Form 10-Q for the second quarter of 2012, the Company disclosed that a Plan was being developed to accelerate the work-out and disposition of a substantial portion of remaining problem assets. During the third quarter, the Plan was developed with management committing to the execution of an internally managed asset disposition plan, rather than a bulk sale.
Using March 31, 2012 problem asset levels, management established the following goals:
| · | Nonperforming Loans – Reduce by $20.0 million to $23.7 million |
| · | Performing Classified Loans – Reduce by $26.0 million to $49.3 million |
| · | Real Estate Acquired in Settlement of Loans (“OREO”) – Reduce by $25.0 million to $5.0 million |
| · | Total Classified Assets – Reduce by $71.0 million to $78.0 million |
| · | Classified Assets – Reduce to 45.00% of Tier 1 capital plus reserves |
| · | Nonperforming Assets – Reduce to 2.00% or less of total assets |
As of September 30, 2012, by various methods, including loan sale, asset sale, short refinancing, foreclosure, and chargeoff, the Bank has executed the plan to substantial completion. As of September 30, total problem assets have been reduced by approximately $64.0 million from the March 31, 2012 levels as follows:
| · | Nonperforming Loans – Reduced by $16.0 million to $27.7 million |
| · | Performing Classified Loans – Reduced by $28.5 million to $46.8 million |
| · | OREO – Reduced by $19.5 million to $10.5 million |
| · | Total Classified Assets – Reduced by $64.0 million to $85.0 million |
| · | Classified Assets – Reduced to 48.10% of Tier 1 capital plus reserves |
| · | Nonperforming Assets – Reduced to 2.23% of total assets |
At September 30, 2012, loans with a carrying value of $9.1 million, after writedowns, are under contract to sell, or the Bank has received a letter of intent or similar non-binding agreement to sell the loans. These loans have not been classified as held for sale in the balance sheet as their future sale is not in the normal course of business and the sales are not imminent.
The results achieved through this asset disposition plan are reflected in the amounts reported for September 30, 2012 and for the periods then ended and are the principal reasons for changes from prior period amounts.
At September 30, 2012, the allowance for credit losses was $35.0 million, or 3.00% of total loans outstanding, compared to $28.8 million, or 2.40% of loans outstanding at December 31, 2011, and $27.8 million, or 2.28% of loans outstanding, at September 30, 2011. At September 30, 2012, the allowance for credit losses was 126.44% of nonperforming loans compared to 71.16% at December 31, 2011, and 63.85% at September 30,
| F-9 |
2011. Based on its analysis of the current loan portfolio and levels of current problem assets and potential problem loans, management believes the allowance for credit losses to be adequate. Additional information regarding the allowance for credit losses is presented in the table headed “Asset Quality Analysis” on the following page.
Nonperforming loans totaled $27.7 million at September 30, 2012 compared to $40.5 million at December 31, 2011 and $43.5 million at September 30, 2011. OREO was $10.5 million at September 30, 2012, $30.6 million at December 31, 2011, and $26.5 million at September 30, 2011. Approximately $7.4 million was transferred from loans into OREO, and approximately $16.6 million of OREO was disposed of during the first nine months of 2012. A net loss of $14.6 million has been recorded on the disposition and writedown of OREO in the current year through September 30, 2012, compared to a net loss of $3.9 million in the first nine months of 2011. At September 30, 2012 the OREO balance of $10.5 million is net of accumulated writedowns of $12.8 million. The Company recorded $1.0 million of additional expenses on OREO during the first nine months of 2012, compared to $1.2 million in the first nine months of 2011. Nonperforming assets (comprised of nonaccrual loans, loans 90 days past due and still accruing, certain restructured loans and OREO) totaled $38.2 million, or 2.23% of total assets, at September 30, 2012, compared to $71.1 million, or 4.10% of total assets, at December 31, 2011 and $69.9 million, or 4.11% of total assets, a year ago.
Classified assets are summarized in the following table (in thousands):
| September 30 | December 31 | |||||||
| 2012 | 2011 | |||||||
| Loans identified as impaired | $ | 22,644 | $ | 32,591 | ||||
| Other nonperforming loans | 5,050 | 7,943 | ||||||
| Total nonperforming loans | 27,694 | 40,534 | ||||||
| Performing classified loans | 46,842 | 87,959 | ||||||
| Total classified loans | 74,536 | 128,493 | ||||||
| Real estate acquired in settlement of loans | 10,465 | 30,587 | ||||||
| Total classified assets | $ | 85,001 | $ | 159,080 | ||||
| Classified ratio | 48.10 | % | 77.59 | % | ||||
The Bank is well within the regulatory commercial real estate high concentration guidelines in land acquisition, development and construction (the “AD&C portfolio”) loans, as well as total commercial real estate loans. At September 30, 2012, the Bank’s concentration levels were 39.61% and 178.96%, respectively, of total regulatory capital, which compares favorably to the interagency regulatory guidance maximum concentrations of 100% and 300%, respectively. The AD&C portfolio totaled $63 million at September 30, 2012, including $23 million of speculative residential construction and residential acquisition and development. This portfolio is largely graded as classified loans.
The provision for credit losses charged to operations for the three months ended September 30, 2012 totaled $28.9 million, compared to $3.4 million for the three months ended September 30, 2011. Net chargeoffs for the three months ended September 30, 2012 were $19.1 million, or 6.52% of average loans held for investment on an annualized basis, compared to net chargeoffs of $3.7 million, or 1.20% of average loans held for investment on an annualized basis, for the three months ended September 30, 2011.
The provision for credit losses charged to operations for the nine months ended September 30, 2012 totaled $34.7 million, compared to $12.5 million for the nine months ended September 30, 2011. Net chargeoffs for the nine months ended September 30, 2012 were $28.5 million, or 3.23% of average loans held for investment on an annualized basis, compared to net chargeoffs of $13.5 million, or 1.40% of average loans held for investment on an annualized basis, for the nine months ended September 30, 2011.
| F-10 |
Asset Quality Analysis
(dollars in thousands)
| Allowance for credit losses: | Three Months Ended September 30, 2012 | Year Ended December 31, 2011 | Three Months Ended September 30, 2011 | |||||||||
| Balance, beginning of period | $ | 25,231 | $ | 28,752 | $ | 28,040 | ||||||
| Loans charged off: | ||||||||||||
| Secured by owner-occupied nonfarm nonresidential properties | 4,609 | 1,131 | 62 | |||||||||
| Secured by other nonfarm nonresidential properties | 1,491 | 956 | 398 | |||||||||
| Other commercial and industrial | 3,257 | 2,958 | 542 | |||||||||
| Total Commercial | 9,357 | 5,045 | 1,002 | |||||||||
| Construction loans – 1-4 family residential | 193 | 209 | 108 | |||||||||
| Other construction and land development | 4,079 | 3,776 | 1,070 | |||||||||
| Total Real estate – construction | 4,272 | 3,985 | 1,178 | |||||||||
| Closed-end loans secured by 1 to 4 family residential properties | 4,034 | 3,603 | 592 | |||||||||
| Lines of credit secured by 1 to 4 family residential properties | 1,409 | 2,443 | 433 | |||||||||
| Loans secured by 5 or more family residential properties | 273 | 776 | 576 | |||||||||
| Total Real estate – mortgage | 5,716 | 6,822 | 1,601 | |||||||||
| Credit cards | 54 | 398 | 117 | |||||||||
| Other consumer loans | 263 | 1,047 | 282 | |||||||||
| Total Consumer | 317 | 1,445 | 399 | |||||||||
| Total Other | 1 | 1,300 | - | |||||||||
| Total chargeoffs | 19,663 | 18,597 | 4,180 | |||||||||
| Recoveries of loans previously charged off: | ||||||||||||
| Total Commercial | 118 | 495 | 14 | |||||||||
| Total Real estate – construction | 107 | 534 | 158 | |||||||||
| Total Real estate – mortgage | 176 | 443 | 156 | |||||||||
| Total Consumer | 157 | 401 | 106 | |||||||||
| Total Other | 9 | 31 | 11 | |||||||||
| Total recoveries | 567 | 1,904 | 445 | |||||||||
| Net loans charged off | 19,096 | 16,693 | 3,735 | |||||||||
| Provision for credit losses | 28,881 | 16,785 | 3,445 | |||||||||
| Balance, end of period | $ | 35,016 | $ | 28,844 | $ | 27,750 | ||||||
| Nonperforming Assets: | ||||||||||||
| Commercial nonaccrual loans, not restructured | $ | 12,411 | $ | 15,773 | $ | 17,477 | ||||||
| Commercial nonaccrual loans, restructured | 5,092 | 7,489 | 9,870 | |||||||||
| Non-commercial nonaccrual loans, not restructured | 4,418 | 9,569 | 8,789 | |||||||||
| Non-commercial nonaccrual loans, restructured | 1,007 | 283 | 133 | |||||||||
| Total nonaccrual loans | 22,928 | 33,114 | 36,269 | |||||||||
| Troubled debt restructured loans, accruing | 4,760 | 7,406 | 7,167 | |||||||||
| Loans 90 days or more past due and still accruing | 6 | 14 | 26 | |||||||||
| Total nonperforming loans | 27,694 | 40,534 | 43,462 | |||||||||
| Real estate acquired in settlement of loans | 10,465 | 30,587 | 26,469 | |||||||||
| Total nonperforming assets | $ | 38,159 | $ | 71,121 | $ | 69,931 | ||||||
| F-11 |
| Allowance for credit losses: | Three Months Ended September 30, 2012 | Year Ended December 31, 2011 | Three Months Ended September 30, 2011 | |||||||||
| Asset Quality Percentages: | ||||||||||||
| Nonperforming loans to total loans outstanding at end of period | 2.37 | % | 3.38 | % | 3.57 | % | ||||||
| Nonperforming assets to total assets at end of period | 2.23 | % | 4.10 | % | 4.11 | % | ||||||
| Allowance for credit losses as a percentage of total loans outstanding at end of period | 3.00 | % | 2.40 | % | 2.28 | % | ||||||
| Allowance for credit losses to nonperforming loans | 126.44 | % | 71.16 | % | 63.85 | % | ||||||
| Net chargeoffs as a percentage of average loans outstanding during the period (annualized for interim periods) | 6.52 | % | 1.32 | % | 1.20 | % | ||||||
| Allowance for credit losses: | Nine Months Ended September 30, 2012 | Year Ended December 31, 2011 | Nine Months Ended September 30, 2011 | |||||||||
| Balance, beginning of period | $ | 28,844 | $ | 28,752 | $ | 28,752 | ||||||
| Loans charged off: | ||||||||||||
| Secured by owner-occupied nonfarm nonresidential properties | 5,755 | 1,131 | 516 | |||||||||
| Secured by other nonfarm nonresidential properties | 2,101 | 956 | 766 | |||||||||
| Other commercial and industrial | 3,842 | 2,958 | 2,179 | |||||||||
| Total Commercial | 11,698 | 5,045 | 3,461 | |||||||||
| Construction loans – 1-4 family residential | 403 | 209 | 209 | |||||||||
| Other construction and land development | 6,611 | 3,776 | 3,217 | |||||||||
| Total Real estate – construction | 7,014 | 3,985 | 3,426 | |||||||||
| Closed-end loans secured by 1 to 4 family residential properties | 6,560 | 3,603 | 3,204 | |||||||||
| Lines of credit secured by 1 to 4 family residential properties | 3,578 | 2,443 | 1,826 | |||||||||
| Loans secured by 5 or more family residential properties | 273 | 776 | 576 | |||||||||
| Total Real estate – mortgage | 10,411 | 6,822 | 5,606 | |||||||||
| Credit cards | 265 | 398 | 296 | |||||||||
| Other consumer loans | 583 | 1,047 | 813 | |||||||||
| Total Consumer | 848 | 1,445 | 1,109 | |||||||||
| Total Other | 3 | 1,300 | 1,300 | |||||||||
| Total chargeoffs | 29,974 | 18,597 | 14,902 | |||||||||
| Recoveries of loans previously charged off: | ||||||||||||
| Total Commercial | 294 | 495 | 212 | |||||||||
| Total Real estate – construction | 292 | 534 | 341 | |||||||||
| Total Real estate – mortgage | 576 | 443 | 450 | |||||||||
| Total Consumer | 278 | 401 | 328 | |||||||||
| Total Other | 22 | 31 | 30 | |||||||||
| Total recoveries | 1,462 | 1,904 | 1,361 | |||||||||
| Net loans charged off | 28,512 | 16,693 | 13,541 | |||||||||
| Provision for credit losses | 34,684 | 16,785 | 12,539 | |||||||||
| Balance, end of period | $ | 35,016 | $ | 28,844 | $ | 27,750 | ||||||
| F-12 |
| Allowance for credit losses: | Nine Months Ended September 30, 2012 | Year Ended December 31, 2011 | Nine Months Ended September 30, 2011 | |||||||||
| Nonperforming Assets: | ||||||||||||
| Commercial nonaccrual loans, not restructured | $ | 12,411 | $ | 15,773 | $ | 17,477 | ||||||
| Commercial nonaccrual loans, restructured | 5,092 | 7,489 | 9,870 | |||||||||
| Non-commercial nonaccrual loans, not restructured | 4,418 | 9,569 | 8,789 | |||||||||
| Non-commercial nonaccrual loans, restructured | 1,007 | 283 | 133 | |||||||||
| Total nonaccrual loans | 22,928 | 33,114 | 36,269 | |||||||||
| Troubled debt restructured loans, accruing | 4,760 | 7,406 | 7,167 | |||||||||
| Loans 90 days or more past due and still accruing | 6 | 14 | 26 | |||||||||
| Total nonperforming loans | 27,694 | 40,534 | 43,462 | |||||||||
| Real estate acquired in settlement of loans | 10,465 | 30,587 | 26,469 | |||||||||
| Total nonperforming assets | $ | 38,159 | $ | 71,121 | $ | 69,931 | ||||||
| Asset Quality Percentages: | ||||||||||||
| Nonperforming loans to total loans outstanding at end of period | 2.37 | % | 3.38 | % | 3.57 | % | ||||||
| Nonperforming assets to total assets at end of period | 2.23 | % | 4.10 | % | 4.11 | % | ||||||
| Allowance for credit losses as a percentage of total loans outstanding at end of period | 3.00 | % | 2.40 | % | 2.28 | % | ||||||
| Allowance for credit losses to nonperforming loans | 126.44 | % | 71.16 | % | 63.85 | % | ||||||
| Net chargeoffs as a percentage of average loans outstanding during the period (annualized for interim periods) | 3.23 | % | 1.32 | % | 1.40 | % | ||||||
Liquidity Management
Liquidity management refers to the policies and practices that ensure the Company has the ability to meet day-to-day cash flow requirements based primarily on activity in loan and deposit accounts of the Bank’s customers. Deposit withdrawals, loan funding and general corporate activity create the primary needs for liquidity for the Bank. Liquidity is derived from sources such as deposit growth; maturity, calls or sales of investment securities; principal and interest payments on loans; access to borrowed funds or lines of credit; and profits.
During the first nine months of 2012, the Company had net cash provided by operating activities of $19.4 million, compared to $98.8 million of net cash provided by operating activities in the first nine months of 2011. The decrease was primarily the result of the Company’s sale of $73.0 million of loans in connection with the sale of its Harrisonburg, Virginia operations in May 2011. In addition, there was a gain on the sale of securities of $2.0 million during the first nine months of 2011.
Net cash used in investing activities for the first nine months of 2012 was $30.3 million, compared to net cash provided by investing activities in the first nine months of 2011 of $50.1 million. This change is primarily attributable to purchases of securities available for sale of $170.7 million during the first nine months of 2012, compared to $86.4 million in purchases during the same period last year. Proceeds from securities sales, maturities and calls were $134.5 million during the first nine months of 2012, compared to $114.3 million during the first nine months of 2011. During the first nine months of 2012, there was an increase in loans of $4.6 million compared to a decrease in loans of $15.1 million during the same period last year.
During the nine months ended September 30, 2012, financing activities used $300,000, compared to net cash used by financing activities of $113.9 million during the same period of 2011. The change was primarily the result of a decrease in time deposits of $13.6 million during the first nine months of 2012, compared to a decrease of $94.3 million in time deposits during the first nine months of 2011.
Cash and cash equivalents totaled $42.7 million at September 30, 2012, compared to $54.0 million at December 31, 2011 and $64.0 million at September 30, 2011.
| F-13 |
The Bank has borrowing capacity of approximately $255.6 million with the FHLB, of which approximately $88.4 million was available at September 30, 2012. These borrowings are collateralized by FHLB stock, investment securities, qualifying residential 1 to 4 family first mortgage loans, qualifying multifamily first mortgage loans, qualifying commercial real estate loans, and qualifying home equity lines of credit and second mortgage loans. The Bank provides various reports to the FHLB on a regular basis to maintain the availability of the credit line. Each borrowing request to the FHLB is initiated through an advance application that is subject to approval by the FHLB before funds are advanced under the line of credit. The Bank also has $8 million of borrowing capacity through the Federal Reserve Bank System, of which none was used as of September 30, 2012. The line with the Federal Reserve Bank of Richmond (“Federal Reserve Bank”) is collateralized using investment securities and qualified loans. In addition, the Bank has $25.0 million in unsecured, overnight Federal Funds lines with correspondent banks.
Interest Rate Risk Management
Interest rate risk management is a part of the Company’s overall asset/liability management process. The primary oversight of asset/liability management rests with the Bank’s Asset and Liability Committee, which is comprised of the Bank’s Chief Executive Officer (“CEO”), Chief Financial Officer (“CFO”), and other senior executives. The Committee meets on a monthly basis to review the asset/liability management activities of the Bank and monitor compliance with established policies. Activities of the Asset and Liability Committee are reported to the Audit and Risk Management Committee of the Company and the Bank.
A primary objective of interest rate risk management is to ensure the stability and quality of the Company’s primary earnings component, net interest income. This process involves monitoring the Company’s balance sheet in order to determine the potential impact that changes in the interest rate environment may have on net interest income. Rate sensitive assets and liabilities have interest rates that are subject to change within a specific time period, due to either maturity or to contractual agreements which allow the instruments to reprice prior to maturity. Interest rate sensitivity management seeks to ensure that both assets and liabilities react to changes in interest rates within a similar time period, thereby minimizing the risk to net interest income.
The Company uses several interest rate risk measurement tools provided by a national asset liability management consultant to help manage this risk. The Company’s Asset/Liability policy provides guidance for acceptable levels of interest rate risk and potential remediations. Management provides the consultant with key assumptions, which are used as inputs into the measurement tools. The Company has not experienced any material changes in interest rate risk since the end of the fiscal year ended December 31, 2011.
The following table summarizes the results of the Company’s income simulation model as of June 30, 2012, the most currently available review date.
| Change in Net Interest Income | ||||||||
| Year 1 | Year 2 | |||||||
| Change in Market Interest Rates: | ||||||||
| 200 basis point ramped increase | .33 | % | (2.41 | )% | ||||
| Base case – no change | - | (2.55 | )% | |||||
| 100 basis point ramped decrease | .30 | % | (3.90 | )% | ||||
Capital Resources and Shareholders’ Equity
Pursuant to the U.S. Department of the Treasury (the “U.S. Treasury”) Capital Purchase Program (the “CPP”), on December 12, 2008, the Company issued and sold to the U.S. Treasury (i) 52,372 shares of Company’s Fixed Rate Cumulative Perpetual Preferred Stock, Series A (the “Series A Preferred Stock”) and (ii) a warrant (the “Warrant”) to purchase 2,567,255 shares of the Company’s common stock, par value $5.00 per share, for an aggregate purchase price of $52,372,000 in cash. The Securities Purchase Agreement grants the holders of the Series A Preferred Stock, the Warrant and the common stock of the Company to be issued under the Warrant, certain registration rights, and subjects the Company to certain of the executive compensation limitations included in the Emergency Economic Stabilization Act of 2008, the American
| F-14 |
Recovery and Reinvestment Act of 2009 and related regulations. The Bank is currently restricted from paying dividends to the Company unless it receives advance approval from the FDIC and the N. C. Commissioner of Banks (“Commissioner”).
The Company did not repurchase any of its equity securities during 2011 or the first three quarters of 2012.
Banks and bank holding companies, as regulated institutions, must meet required levels of capital. The Commissioner, the Federal Reserve and the FDIC, which are the primary banking regulatory agencies for the Bank and the Company, have adopted minimum capital regulations or guidelines that categorize components and the level of risk associated with various types of assets. Financial institutions are required to maintain a level of capital commensurate with the risk profile assigned to their assets in accordance with the regulatory guidelines.
As shown in the accompanying table, the Company and the Bank have capital levels exceeding the minimum levels for “well capitalized” banks and bank holding companies as of September 30, 2012.
| Regulatory Capital | ||||||||||||||||
| Well Capitalized | Adequately Capitalized | Company | Bank | |||||||||||||
| Total Capital | 10.0 | % | 8.0 | % | 12.07 | % | 11.93 | % | ||||||||
| Tier 1 Capital | 6.0 | 4.0 | 10.78 | 10.63 | ||||||||||||
| Leverage Capital | 5.0 | 4.0 | 8.53 | 8.43 | ||||||||||||
The Company holds $2.5 million of the $52.4 million received from the U.S. Treasury under the CPP, which may be invested in the Bank to increase the Bank’s total risk based capital percentage from the present level of 11.93%.
| F-15 |
[This page intentionally left blank.]