FILED BY YADKIN FINANCIAL CORPORATION
PURSUANT TO RULE 425 UNDER THE SECURITIES ACT OF 1933
AND DEEMED FILED PURSUANT TO RULE 14a-12
UNDER THE SECURITIES EXCHANGE ACT OF 1934
SUBJECT COMPANY: NEWBRIDGE BANCORP
(Commission File No. 000-11448)
Yadkin Financial Corporation Achieves Record Operating EPS of $0.40 in the Third Quarter of 2015
RALEIGH, N.C., October 22, 2015 – Yadkin Financial Corporation (NYSE: YDKN) ("Yadkin" or the "Company"), the parent company of Yadkin Bank, today announced financial results for the third quarter ended September 30, 2015.
"We are very pleased to report strong operating EPS for the third quarter of 2015, driven by record loan production, robust core deposit growth and cost reductions," commented Scott Custer, Yadkin's CEO. "Our continued focus on superior customer service and operating efficiency has enabled us to achieve record operating results for the second consecutive quarter."
"We also recently announced an agreement to acquire NewBridge Bancorp, a $2.8 billion bank holding company headquartered in Greensboro, North Carolina," Mr. Custer continued. "We are obviously excited about the combination of these two high quality organizations. With this proposed merger, Yadkin will become the largest community bank in North Carolina with over $7 billion in assets and a strong statewide presence in every major market. NewBridge also has an attractive customer base, top-notch associates, and a healthy balance sheet. In every way, this acquisition will enhance our ability to be the bank of choice for businesses and consumers throughout our markets."
"Yadkin has positive operating momentum and enjoys a healthy balance sheet with strong capital, asset quality, and liquidity," said Mr. Custer. "We look forward to continued growth in our businesses."
Third Quarter 2015 Performance Highlights
| • | The Company recently announced an agreement to acquire NewBridge Bancorp and its wholly-owned bank subsidiary, NewBridge Bank. The NewBridge acquisition is expected to close in the second quarter of 2016, subject to regulatory approval and customary closing conditions. | |
| • | Net operating earnings available to common shareholders, which excludes certain non-operating items, improved to $12.5 million, or 0.40 per diluted share, in Q3 2015 from $0.38 per diluted share in Q2 2015 and $0.36 per diluted share in Q3 2014. | |
| • | Net income available to common shareholders totaled $11.8 million, or $0.37 per diluted share, in Q3 2015 compared to $0.33 per diluted share in Q2 2015 and $0.01 per diluted share in Q3 2014. | |
| • | Annualized operating return on average tangible common equity, which excludes preferred stock, goodwill, and other intangible assets, improved to 13.85 percent in Q3 2015 from 13.35 percent in Q2 2015. | |
| • | Annualized operating return on average assets improved to 1.15 percent in Q3 2015 from 1.14 percent in Q2 2015. | |
| • | Operating efficiency, the ratio of operating expenses, excluding certain non-operating items, to total operating revenues, improved to 57.3 percent in Q3 2015 compared to 60.0 percent in Q2 2015. | |
| • | Low cost deposit growth was 9.5 percent annualized in Q3 2015 while non-interest demand deposits increased to 22.5 percent of total deposits at September 30, 2015 from 21.5 percent at June 30, 2015 and 20.6 percent at September 30, 2014. | |
| • | Annualized net loan growth was 3.2 percent in Q3 2015 as a result of new loan originations and commitments of $396 million. | |
| • | Tangible book value per share increased to $12.31 at September 30, 2015 from $12.01 at June 30, 2015 and $10.89 at September 30, 2014. |
Results of Operations and Asset Quality
3Q 2015 vs. 2Q 2015
Net operating earnings available to common shareholders, which is a non-GAAP metric that excludes securities gains, merger and conversion costs, restructuring charges, and the income tax effect of adjustments, improved to $12.5 million in the third quarter of 2015 from $11.9 million in the second quarter of 2015. Pre-tax, pre-provision operating earnings, which also excludes securities gains, merger and conversion costs, and restructuring charges, also improved to $21.4 million in the third quarter of 2015 from $20.0 million in the second quarter of 2015.
Net income available to common shareholders improved to $11.8 million in the third quarter of 2015, or $0.37 per diluted share, compared to $10.6 million, or $0.33 per diluted share, in the second quarter of 2015.
Net interest income was largely flat at $39.3 million in the second and third quarters of 2015. Net interest margin decreased from 4.29 percent in the second quarter of 2015 to 4.19 percent in the third quarter of 2015. Loan growth mostly offset the impact of a declining net interest margin as average loan balances increased by $18.1 million. The Company also increased the average balance of its investment portfolio in the quarter by $24.1 million. Core net interest margin, which excludes the impact of accretion income on net interest income, was 3.77 percent in the third quarter of 2015, unchanged from the second quarter. Similar to its peers, the Company continues to face pricing pressure on loan originations and elevated levels of prepayments on existing loans, both of which weighed on core loan yields.
Net accretion income on acquired loans totaled $3.4 million in the third quarter of 2015, which consisted of $895 thousand of net accretion on purchased credit-impaired ("PCI") loans and $2.5 million of accretion income on purchased non-impaired loans. Net accretion income on acquired loans in the second quarter of 2015 totaled $4.1 million, which included $812 thousand of net accretion on PCI loans and $3.3 million of net accretion income on purchased non-impaired loans. Net accretion income on purchased non-impaired loans included $978 thousand of accelerated accretion due to principal prepayments in the third quarter of 2015 compared to $1.5 million in the second quarter of 2015.
Provision for loan losses was $1.6 million in the third quarter of 2015, which was an increase from $1.0 million in the second quarter of 2015.The table below summarizes changes in the allowance for loan losses ("ALLL") for the quarters presented.
| (Dollars in thousands) | Non-PCI Loans | PCI Loans | Total | |||||||||||
| Q3 2015 | ||||||||||||||
| Balance at July 1, 2015 | $ | 7,000 | $ | 1,358 | $ | 8,358 | ||||||||
| Net charge-offs | (934 | ) | — | (934 | ) | |||||||||
| Provision for loan losses | 1,536 | 40 | 1,576 | |||||||||||
| Balance at September 30, 2015 | $ | 7,602 | $ | 1,398 | $ | 9,000 | ||||||||
| Q2 2015 | ||||||||||||||
| Balance at April 1, 2015 | $ | 6,907 | $ | 1,377 | $ | 8,284 | ||||||||
| Net charge-offs | (920 | ) | — | (920 | ) | |||||||||
| Provision for loan losses | 1,013 | (19 | ) | 994 | ||||||||||
| Balance at June 30, 2015 | $ | 7,000 | $ | 1,358 | $ | 8,358 | ||||||||
The ALLL was $9.0 million, or 0.30 percent of total loans as of September 30, 2015 compared to $8.4 million, or 0.28 percent of total loans, as of June 30, 2015. Adjusted ALLL, which is a non-GAAP metric that includes the ALLL, as well as net acquisition accounting fair value adjustments for acquired loans, declined from 1.88 percent of total loans as of June 30, 2015 to 1.75 percent as of September 30, 2015 due to accretion of fair value discounts.
The provision for loan losses on non-PCI loans increased by $523 thousand in the third quarter of 2015 as the Company increased its reserves on originated loans. Net charge-offs totaled $934 thousand in the third quarter of 2015 compared to $920 thousand in the second quarter of 2015. The annualized net charge-off rate was unchanged at 0.12 percent of average loans in both the second and third quarters of 2015. Provision expense on PCI loans increased by $59 thousand in the third quarter of 2015.
Nonperforming loans, which include nonaccrual loans, loans past due 90 days or more and still accruing, as a percentage of total loans was 1.25 percent as of September 30, 2015 compared to 1.10 percent as of June 30, 2015. Total nonperforming assets (which include nonperforming loans and foreclosed assets) as a percentage of total assets was 1.12 percent as of September 30, 2015 compared to 1.06 percent as of June 30, 2015.
Non-interest income totaled $10.8 million in both the second and third quarters of 2015. Government-guaranteed, small business lending income, which includes gains on sales of the guaranteed portion of certain U.S. Small Business Administration "SBA" loans as well as servicing fees on previously sold SBA loans, contributed $3.0 million to non-interest income during the third quarter of 2015. Although the Company had the highest level of SBA loan originations in its history, third quarter income represented a $668 thousand decrease on a linked-quarter basis due to the originated product mix (i.e., larger proportion of loans originated under the SBA's 504 program vs. the 7(a) program), lower loan sale premiums, and a larger proportion of multi-funding loans which take longer to sell. Other non-interest income increased from $1.4 million in the second quarter of 2015 to $2.0 million in the third quarter of 2015 primarily due to a gain on a real estate sale.
Non-interest expense totaled $28.8 million in the third quarter of 2015, which was a decrease from $32.3 million in the second quarter of 2015. The $3.5 million expense decline included a $2.2 million reduction in restructuring charges. Additionally, salaries and employee benefits decreased by $863 thousand in the third quarter of 2015 from the Company's recent restructuring initiatives and a decline in employee incentive accruals. The Company's operating efficiency ratio, which is a non-GAAP metric that excludes securities gains, merger and conversion costs, and restructuring charges, improved from 60.0 percent in the second quarter of 2015 to 57.3 percent in the third quarter of 2015.
Income tax expense totaled $7.9 million in the third quarter of 2015, which was an increase from $6.1 million in the second quarter of 2015. The Company's effective tax rate increased to 40.1 percent in the third quarter of 2015 from 36.1 percent in the second quarter of 2015. The higher effective tax rate reflected a $651 thousand one-time charge to income tax expense in the third quarter of 2015 to account for the revaluation of the Company's state deferred tax assets as the North Carolina state corporate income tax rate will be reduced from 5 percent to 4 percent effective January 1, 2016.
3Q 2015 vs. 3Q 2014
Net operating earnings available to common shareholders, which excludes nonrecurring income and expenses, improved to $12.5 million in the third quarter of 2015 from $11.4 million in the third quarter of 2014. Pre-tax, pre-provision operating earnings, which also excludes nonrecurring income and expenses, also improved to $21.4 million in the third quarter of 2015 from $19.5 million in the third quarter of 2014. Net operating earnings benefited from higher operating non-interest income and lower operating non-interest expense in the quarter.
Net income available to common shareholders improved to $11.8 million in the third quarter of 2015, or $0.37 per diluted share, compared to $319 thousand, or $0.01 per diluted share, in the third quarter of 2014.
Dividend Information
On October 21, 2015, Yadkin's Board of Directors declared a regular quarterly cash dividend of $0.10 per share on its outstanding shares of unrestricted common stock, payable on November 19, 2015 to shareholders of record on November 5, 2015.
****
Yadkin Financial Corporation is the bank holding company for Yadkin Bank, a full-service state-chartered community bank providing services in 70 branches across North Carolina and upstate South Carolina. Serving over 80,000 customers, the Company has assets of $4.4 billion. The Bank’s primary business is providing banking, mortgage, investment and insurance services to consumers and businesses across the Carolinas. The Bank provides SBA lending services through its Government Guaranteed Lending division, headquartered in Charlotte, NC, and mortgage lending services through Yadkin Mortgage, headquartered in Greensboro, NC. Yadkin Financial Corporation’s website is www.yadkinbank.com.Yadkin Financial Corporation's common stock is traded on the NYSE under the symbol YDKN.
Conference Call
Yadkin Financial Corporation will host a conference call at 10:00 a.m. Eastern Time on October 22, 2015, to discuss the Company's financial results. The call may be accessed by dialing (877) 256-8284 and requesting the Yadkin Financial Corporation Third Quarter 2015 Conference Call. Listeners should dial in 10-15 minutes prior to the start of the call.
A webcast of the conference call will be available online at www.yadkinbank.com and following the links to About Us, Investor Relations. A replay of the call will be available through November 23, 2015, by dialing (800) 633-8284 or (402) 977-9140 and entering reservation number 21779820.
Non-GAAP Financial Measures
Statements included in this press release include non-GAAP financial measures and should be read along with the accompanying tables, which provide a reconciliation of non-GAAP financial measures to GAAP financial measures. Yadkin management uses non-GAAP financial measures, including: (i) net operating earnings available to common shareholders; (ii) pre-tax, pre-provision operating earnings; (iii) operating non-interest expense, (iv) operating efficiency ratio, (v) adjusted allowance for loan losses to loans; and (vi) tangible common equity, in its analysis of the Company's performance. Net operating earnings available to common shareholders excludes the following from net income available to common shareholders: securities gains and losses, a one-time branch sale gain, merger and conversion costs, restructuring charges, income tax expense from the change in future state tax rates, and the income tax effect of adjustments. Pre-tax, pre-provision operating earnings excludes the following from net income: provision for loan losses, income tax expense, securities gains and losses, a one-time branch sale gain, merger and conversion costs, and restructuring charges. Operating non-interest expense excludes merger and conversion costs and restructuring charges from non-interest expense. The operating efficiency ratio excludes a one-time branch sale gain, securities gains and losses, merger and conversion costs, and restructuring charges from the efficiency ratio. Adjusted allowance for loan losses adds net acquisition accounting fair value discounts to the allowance for loan losses. Tangible common equity excludes preferred stock as well as goodwill and other intangible assets, net, from shareholders' equity.
Management believes that non-GAAP financial measures provide additional useful information that allows readers to evaluate the ongoing performance of the Company and provide meaningful comparisons to its peers. Non-GAAP financial measures should not be considered as an alternative to any measure of performance or financial condition as promulgated under GAAP, and investors should consider Yadkin performance and financial condition as reported under GAAP and all other relevant information when assessing the performance or financial condition of the
Company. Non-GAAP financial measures have limitations as analytical tools, and investors should not consider them in isolation or as a substitute for analysis of the results or financial condition as reported under GAAP.
Forward-Looking Statements
Information in this press release contains forward-looking statements within the meaning of the Private Securities Litigation Reform Act of 1995. These statements involve risks and uncertainties that could cause actual results to differ materially, including without limitation, reduced earnings due to larger than expected credit losses in the sectors of our loan portfolio secured by real estate due to economic factors, including declining real estate values, increasing interest rates, increasing unemployment, or changes in payment behavior or other factors; reduced earnings due to larger credit losses because our loans are concentrated by loan type, industry segment, borrower type, or location of the borrower or collateral; the rate of delinquencies and amount of loans charged-off; the adequacy of the level of our allowance for loan losses and the amount of loan loss provisions required in future periods; costs or difficulties related to the integration of the banks we acquired or may acquire may be greater than expected; factors relating to our proposed acquisition of NewBridge Bancorp (“NewBridge”), including our ability to consummate the transaction on a timely basis, if at all, our ability to effectively and timely integrate the operations of Yadkin and NewBridge, our ability to achieve the estimated synergies from this proposed transaction and once integrated, the effects of such business combination on our future financial condition, operating results, strategy and plans; results of examinations by our regulatory authorities, including the possibility that the regulatory authorities may, among other things, require us to increase our allowance for loan losses or write down assets; the amount of our loan portfolio collateralized by real estate; our ability to maintain appropriate levels of capital; adverse changes in asset quality and resulting credit risk-related losses and expenses; increased funding costs due to market illiquidity, competition for funding, and increased regulatory requirements with regard to funding; significant increases in competitive pressure in the banking and financial services industries; changes in political conditions or the legislative or regulatory environment, including the effect of future financial reform legislation on the banking industry; general economic conditions, either nationally or regionally and especially in our primary service area, becoming less favorable than expected resulting in, among other things, a deterioration in credit quality; our ability to retain our existing customers, including our deposit relationships; changes occurring in business conditions and inflation; changes in monetary and tax policies; ability of borrowers to repay loans; risks associated with a failure in or breach of our operational or security systems or infrastructure, or those of our third party vendors and other service providers or other third parties, including cyber attacks, which could disrupt our businesses, result in the disclosure or misuse of confidential or proprietary information, damage our reputation, increase our costs and cause losses; changes in accounting principles, policies or guidelines; changes in the assessment of whether a deferred tax valuation allowance is necessary; our reliance on secondary liquidity sources such as Federal Home Loan Bank advances, sales of securities and loans, federal funds lines of credit from correspondent banks and out-of-market time deposits; loss of consumer confidence and economic disruptions resulting from terrorist activities or military actions; and changes in the securities markets. Additional factors that could cause actual results to differ materially are discussed in the Company’s filings with the Securities and Exchange Commission, including without limitation its Annual Report on Form 10-K, its Quarterly Reports on Form 10-Q, and its Current Reports on Form 8-K. The forward-looking statements in this press release speak only as of the date of the press release, and the Company does not assume any obligation to update such forward-looking statements.
Additional Information About the Proposed Transaction and Where to Find It
This communication is being made in respect of the proposed transaction involving Yadkin and NewBridge. This material is not a solicitation of any vote or approval of Yadkin’s or NewBridge’s shareholders and is not a
substitute for the joint proxy statement/prospectus or any other documents which Yadkin and NewBridge may send to their respective shareholders in connection with the proposed merger. This communication does not constitute an offer to sell or the solicitation of an offer to buy any securities.
In connection with the proposed transaction, Yadkin intends to file with the Securities and Exchange Commission (“SEC”) a Registration Statement on Form S-4 that will include a joint proxy statement of Yadkin and NewBridge and a prospectus of Yadkin, as well as other relevant documents concerning the proposed transaction. Investors and security holders are also urged to carefully review and consider each of Yadkin’s and NewBridge’s public filings with the SEC, including but not limited to their Annual Reports on Form 10-K, their proxy statements, their Current Reports on Form 8-K and their Quarterly Reports on Form 10-Q. Both NewBridge and Yadkin will mail the joint proxy statement/prospectus to their respective shareholders. BEFORE MAKING ANY VOTING OR INVESTMENT DECISIONS, INVESTORS AND SHAREHOLDERS OF YADKIN AND NEWBRIDGE ARE URGED TO CAREFULLY READ THE ENTIRE REGISTRATION STATEMENT AND JOINT PROXY STATEMENT/PROSPECTUS REGARDING THE PROPOSED MERGER WHEN IT BECOMES AVAILABLE AND ANY OTHER RELEVANT DOCUMENTS FILED WITH THE SEC, AS WELL AS ANY AMENDMENTS OR SUPPLEMENTS TO THOSE DOCUMENTS, BECAUSE THEY WILL CONTAIN IMPORTANT INFORMATION ABOUT THE PROPOSED TRANSACTION. Investors and security holders may obtain a free copy of the proxy statement/prospectus (when available) and other filings containing information about Yadkin and NewBridge at the SEC’s website at www.sec.gov. The joint proxy statement/prospectus (when available) and the other filings may also be obtained free of charge at Yadkin’s website at www.yadkinbank.com, or at NewBridge’s website at www.newbridgebank.com.
Yadkin, NewBridge and certain of their respective directors and executive officers, under the SEC’s rules, may be deemed to be participants in the solicitation of proxies of Yadkin’s and NewBridge’s shareholders in connection with the proposed transaction. Information about the directors and executive officers of Yadkin and their ownership of Yadkin common stock is set forth in the proxy statement for Yadkin’s 2015 Annual Meeting of Shareholders, as filed with the SEC on Schedule 14A on April 10, 2015. Information about the directors and executive officers of NewBridge and their ownership of NewBridge’s common stock is set forth in the proxy statement for NewBridge’s 2015 Annual Meeting of Shareholders, as filed with the SEC on a Schedule 14A on April 2, 2015. Additional information regarding the interests of those participants and other persons who may be deemed participants in the transaction may be obtained by reading the joint proxy statement/prospectus regarding the proposed transaction when it becomes available. Free copies of this document may be obtained as described in the preceding paragraph.
CONTACT:
Terry Earley, CFO
Yadkin Financial Corporation
Phone: (919) 659-9015
Email: Terry.Earley@yadkinbank.com
QUARTERLY RESULTS OF OPERATIONS (UNAUDITED)
| Three months ended | ||||||||||||||||||||
| (Dollars in thousands, except per share data) | September 30, 2015 | June 30, 2015 | March 31, 2015 | December 31, 2014 | September 30, 2014 | |||||||||||||||
| Interest income | ||||||||||||||||||||
| Loans | $ | 40,300 | $ | 40,404 | $ | 39,796 | $ | 41,160 | $ | 41,667 | ||||||||||
| Investment securities | 3,957 | 3,786 | 3,996 | 4,058 | 3,756 | |||||||||||||||
| Federal funds sold and interest-earning deposits | 47 | 45 | 50 | 54 | 38 | |||||||||||||||
| Total interest income | 44,304 | 44,235 | 43,842 | 45,272 | 45,461 | |||||||||||||||
| Interest expense | ||||||||||||||||||||
| Deposits | 3,097 | 3,073 | 2,889 | 2,714 | 2,374 | |||||||||||||||
| Short-term borrowings | 437 | 331 | 289 | 168 | 65 | |||||||||||||||
| Long-term debt | 1,465 | 1,504 | 1,488 | 1,599 | 1,510 | |||||||||||||||
| Total interest expense | 4,999 | 4,908 | 4,666 | 4,481 | 3,949 | |||||||||||||||
| Net interest income | 39,305 | 39,327 | 39,176 | 40,791 | 41,512 | |||||||||||||||
| Provision for loan losses | 1,576 | 994 | 961 | 843 | 816 | |||||||||||||||
| Net interest income after provision for loan losses | 37,729 | 38,333 | 38,215 | 39,948 | 40,696 | |||||||||||||||
| Non-interest income | ||||||||||||||||||||
| Service charges and fees | 3,566 | 3,495 | 3,253 | 3,506 | 3,265 | |||||||||||||||
| Government-guaranteed lending | 3,009 | 3,677 | 2,873 | 2,917 | 2,072 | |||||||||||||||
| Mortgage banking | 1,731 | 1,633 | 1,322 | 1,002 | 1,520 | |||||||||||||||
| Bank-owned life insurance | 470 | 465 | 472 | 517 | 572 | |||||||||||||||
| Gain (loss) on sales of available for sale securities | — | 84 | 1 | 4 | (96 | ) | ||||||||||||||
| Gain on sale of branch | — | — | — | — | 415 | |||||||||||||||
| Other | 2,022 | 1,446 | 918 | 1,616 | 1,313 | |||||||||||||||
| Total non-interest income | 10,798 | 10,800 | 8,839 | 9,562 | 9,061 | |||||||||||||||
| Non-interest expense | ||||||||||||||||||||
| Salaries and employee benefits | 14,528 | 15,391 | 15,202 | 16,787 | 16,800 | |||||||||||||||
| Occupancy and equipment | 4,641 | 4,637 | 4,799 | 5,009 | 4,856 | |||||||||||||||
| Data processing | 1,851 | 1,929 | 1,888 | 1,959 | 1,255 | |||||||||||||||
| Professional services | 1,196 | 1,407 | 1,092 | 1,431 | 1,153 | |||||||||||||||
| FDIC insurance premiums | 732 | 772 | 714 | 636 | 700 | |||||||||||||||
| Foreclosed asset expenses | 277 | 445 | 188 | 129 | 129 | |||||||||||||||
| Loan, collection, and repossession expense | 931 | 850 | 936 | 849 | 1,192 | |||||||||||||||
| Merger and conversion costs | 104 | (25 | ) | 220 | 1,589 | 17,270 | ||||||||||||||
| Restructuring charges | 50 | 2,294 | 907 | 33 | 180 | |||||||||||||||
| Amortization of other intangible assets | 761 | 777 | 815 | 861 | 845 | |||||||||||||||
| Other | 3,777 | 3,839 | 4,197 | 4,309 | 3,807 | |||||||||||||||
| Total non-interest expense | 28,848 | 32,316 | 30,958 | 33,592 | 48,187 | |||||||||||||||
| Income before income taxes | 19,679 | 16,817 | 16,096 | 15,918 | 1,570 | |||||||||||||||
| Income tax expense | 7,891 | 6,076 | 5,846 | 607 | 621 | |||||||||||||||
| Net income | 11,788 | 10,741 | 10,250 | 15,311 | 949 | |||||||||||||||
| Dividends on preferred stock | — | 183 | 639 | 639 | 630 | |||||||||||||||
| Net income available to common shareholders | $ | 11,788 | $ | 10,558 | $ | 9,611 | $ | 14,672 | $ | 319 | ||||||||||
| NET INCOME PER COMMON SHARE | ||||||||||||||||||||
| Basic | $ | 0.37 | $ | 0.33 | $ | 0.30 | $ | 0.46 | $ | 0.01 | ||||||||||
| Diluted | 0.37 | 0.33 | 0.30 | 0.46 | 0.01 | |||||||||||||||
| WEIGHTED AVERAGE COMMON SHARES OUTSTANDING | ||||||||||||||||||||
| Basic | 31,608,909 | 31,609,021 | 31,606,909 | 31,597,798 | 31,597,659 | |||||||||||||||
| Diluted | 31,686,150 | 31,610,620 | 31,608,928 | 31,602,497 | 31,602,192 | |||||||||||||||
SELECTED PERFORMANCE RATIOS AND FINANCIAL DATA
| As of and for the three months ended | ||||||||||||||||||||
| (Dollars in thousands, except per share data) | September 30, 2015 | June 30, 2015 | March 31, 2015 | December 31, 2014 | September 30, 2014 | |||||||||||||||
| Selected Performance Ratios (Annualized) | ||||||||||||||||||||
| Return on average assets | 1.08 | % | 1.01 | % | 0.98 | % | 1.44 | % | 0.09 | % | ||||||||||
| Net operating return on average assets (Non-GAAP) | 1.15 | 1.14 | 1.04 | 1.09 | 1.17 | |||||||||||||||
| Return on average shareholders' equity | 8.45 | 7.71 | 7.37 | 11.07 | 0.69 | |||||||||||||||
| Net operating return on average shareholders' equity (Non-GAAP) | 8.98 | 8.68 | 7.87 | 8.40 | 8.76 | |||||||||||||||
| Return on average tangible common equity | 12.55 | 11.38 | 10.61 | 16.52 | 0.37 | |||||||||||||||
| Net operating return on average tangible common equity (Non-GAAP) | 13.85 | 13.35 | 11.94 | 12.97 | 13.62 | |||||||||||||||
| Yield on earning assets, tax equivalent | 4.72 | 4.83 | 4.84 | 4.92 | 5.12 | |||||||||||||||
| Cost of interest-bearing liabilities | 0.66 | 0.65 | 0.63 | 0.60 | 0.54 | |||||||||||||||
| Net interest margin, tax equivalent | 4.19 | 4.29 | 4.33 | 4.43 | 4.68 | |||||||||||||||
| Efficiency ratio | 57.58 | 64.47 | 64.48 | 66.71 | 95.28 | |||||||||||||||
| Operating efficiency ratio (Non-GAAP) | 57.27 | 60.04 | 62.13 | 63.50 | 61.16 | |||||||||||||||
| Per Common Share | ||||||||||||||||||||
| Net income, basic | $ | 0.37 | $ | 0.33 | $ | 0.30 | $ | 0.46 | $ | 0.01 | ||||||||||
| Net income, diluted | 0.37 | 0.33 | 0.30 | 0.46 | 0.01 | |||||||||||||||
| Net operating earnings, basic (Non-GAAP) | 0.40 | 0.38 | 0.33 | 0.35 | 0.36 | |||||||||||||||
| Net operating earnings, diluted (Non-GAAP) | 0.40 | 0.38 | 0.33 | 0.35 | 0.36 | |||||||||||||||
| Book value | 17.56 | 17.28 | 17.07 | 16.75 | 16.26 | |||||||||||||||
| Tangible book value (Non-GAAP) | 12.31 | 12.01 | 11.75 | 11.41 | 10.89 | |||||||||||||||
| Common shares outstanding | 31,711,901 | 31,712,021 | 31,609,021 | 31,599,150 | 31,598,907 | |||||||||||||||
| Asset Quality Data and Ratios | ||||||||||||||||||||
| Nonperforming loans | $ | 37,133 | $ | 32,492 | $ | 37,630 | $ | 26,759 | $ | 25,533 | ||||||||||
| Foreclosed assets | 11,793 | 13,547 | 12,427 | 12,891 | 11,078 | |||||||||||||||
| Total nonperforming assets | $ | 48,926 | $ | 46,039 | $ | 50,057 | $ | 39,650 | $ | 36,611 | ||||||||||
| Restructured loans not included in nonperforming assets | $ | 2,564 | $ | 2,333 | $ | 2,043 | $ | 3,948 | $ | 4,424 | ||||||||||
| Net charge-offs to average loans (annualized) | 0.12 | % | 0.12 | % | 0.07 | % | 0.09 | % | 0.09 | % | ||||||||||
| Allowance for loan losses to loans | 0.30 | 0.28 | 0.28 | 0.27 | 0.27 | |||||||||||||||
| Adjusted allowance for loan losses to loans (Non-GAAP) | 1.75 | % | 1.88 | % | 2.04 | % | 2.17 | % | 2.50 | % | ||||||||||
| Nonperforming loans to loans | 1.25 | 1.10 | 1.29 | 0.92 | 0.90 | |||||||||||||||
| Nonperforming assets to total assets | 1.12 | 1.06 | 1.17 | 0.93 | 0.88 | |||||||||||||||
| Capital Ratios | ||||||||||||||||||||
| Tangible equity to tangible assets | 9.30 | % | 9.16 | % | 9.75 | % | 9.49 | % | 9.29 | % | ||||||||||
| Tangible common equity to tangible assets | 9.30 | 9.16 | 9.06 | 8.80 | 8.58 | |||||||||||||||
Yadkin Financial Corporation1: | ||||||||||||||||||||
| Tier 1 leverage | 9.33 | % | 9.22 | % | 9.60 | % | 9.33 | % | 9.40 | % | ||||||||||
| Common equity Tier 12 | 10.55 | 10.43 | 10.14 | NR | NR | |||||||||||||||
| Tier 1 risk-based capital | 10.55 | 10.43 | 10.82 | 10.87 | 10.81 | |||||||||||||||
| Total risk-based capital | 12.00 | 11.88 | 12.25 | 12.34 | 12.36 | |||||||||||||||
Yadkin Bank1: | ||||||||||||||||||||
| Tier 1 leverage | 10.27 | % | 10.17 | % | 10.59 | % | 10.13 | % | 10.32 | % | ||||||||||
| Common equity Tier 12 | 11.62 | 11.53 | 11.97 | NR | NR | |||||||||||||||
| Tier 1 risk-based capital | 11.62 | 11.53 | 11.97 | 11.82 | 11.85 | |||||||||||||||
| Total risk-based capital | 12.02 | 11.93 | 12.34 | 12.18 | 12.27 | |||||||||||||||
1 Regulatory capital ratios for Q3 2015 are estimates.
2 Yadkin became subject to new Basel III regulatory capital rules in Q1 2015. The common equity Tier 1 ratio was not reported in prior periods.
QUARTERLY BALANCE SHEETS (UNAUDITED)
| Ending balances | ||||||||||||||||||||
| (Dollars in thousands, except per share data) | September 30, 2015 | June 30, 2015 | March 31, 2015 | December 31, 2014 | September 30, 2014 | |||||||||||||||
| Assets | ||||||||||||||||||||
| Cash and due from banks | $ | 54,667 | $ | 65,620 | $ | 55,426 | $ | 65,312 | $ | 59,837 | ||||||||||
| Interest-earning deposits with banks | 23,088 | 57,141 | 52,826 | 66,548 | 31,223 | |||||||||||||||
| Federal funds sold | — | 200 | 250 | 505 | 15 | |||||||||||||||
| Investment securities available for sale | 713,492 | 649,015 | 658,323 | 672,421 | 694,993 | |||||||||||||||
| Investment securities held to maturity | 39,292 | 39,402 | 39,511 | 39,620 | 39,728 | |||||||||||||||
| Loans held for sale | 37,962 | 38,622 | 32,322 | 20,205 | 26,853 | |||||||||||||||
| Loans | 2,979,779 | 2,955,771 | 2,913,859 | 2,898,266 | 2,827,426 | |||||||||||||||
| Allowance for loan losses | (9,000 | ) | (8,358 | ) | (8,284 | ) | (7,817 | ) | (7,641 | ) | ||||||||||
| Net loans | 2,970,779 | 2,947,413 | 2,905,575 | 2,890,449 | 2,819,785 | |||||||||||||||
| Purchased accounts receivable | 69,383 | 69,933 | 62,129 | 44,821 | 43,187 | |||||||||||||||
| Federal Home Loan Bank stock | 22,932 | 21,976 | 20,277 | 19,499 | 19,320 | |||||||||||||||
| Premises and equipment, net | 75,530 | 77,513 | 78,683 | 80,379 | 81,554 | |||||||||||||||
| Bank-owned life insurance | 78,397 | 77,927 | 77,462 | 76,990 | 76,500 | |||||||||||||||
| Foreclosed assets | 11,793 | 13,547 | 12,427 | 12,891 | 11,078 | |||||||||||||||
| Deferred tax asset, net | 54,402 | 62,179 | 67,071 | 73,059 | 73,575 | |||||||||||||||
| Goodwill | 152,152 | 152,152 | 152,152 | 152,152 | 152,152 | |||||||||||||||
| Other intangible assets, net | 14,324 | 15,085 | 15,862 | 16,677 | 17,538 | |||||||||||||||
| Accrued interest receivable and other assets | 44,033 | 39,327 | 38,782 | 36,506 | 34,502 | |||||||||||||||
| Total assets | $ | 4,362,226 | $ | 4,327,052 | $ | 4,269,078 | $ | 4,268,034 | $ | 4,181,840 | ||||||||||
| Liabilities | ||||||||||||||||||||
| Deposits: | ||||||||||||||||||||
| Non-interest demand | $ | 730,928 | $ | 697,653 | $ | 655,333 | $ | 680,387 | $ | 657,554 | ||||||||||
| Interest-bearing demand | 484,187 | 475,597 | 472,524 | 469,898 | 439,117 | |||||||||||||||
| Money market and savings | 1,001,739 | 991,982 | 1,010,348 | 1,004,796 | 970,571 | |||||||||||||||
| Time | 1,030,915 | 1,077,862 | 1,070,970 | 1,092,283 | 1,117,697 | |||||||||||||||
| Total deposits | 3,247,769 | 3,243,094 | 3,209,175 | 3,247,364 | 3,184,939 | |||||||||||||||
| Short-term borrowings | 395,500 | 355,500 | 325,500 | 250,500 | 216,500 | |||||||||||||||
| Long-term debt | 129,859 | 147,265 | 137,199 | 180,164 | 210,154 | |||||||||||||||
| Accrued interest payable and other liabilities | 32,301 | 33,077 | 29,385 | 32,204 | 27,917 | |||||||||||||||
| Total liabilities | 3,805,429 | 3,778,936 | 3,701,259 | 3,710,232 | 3,639,510 | |||||||||||||||
| Shareholders' equity | ||||||||||||||||||||
| Preferred stock | — | — | 28,405 | 28,405 | 28,405 | |||||||||||||||
| Common stock | 31,712 | 31,712 | 31,609 | 31,599 | 31,599 | |||||||||||||||
| Common stock warrant | 717 | 717 | 717 | 717 | 717 | |||||||||||||||
| Additional paid-in capital | 492,387 | 492,151 | 492,194 | 492,014 | 491,864 | |||||||||||||||
| Retained earnings (accumulated deficit) | 36,109 | 27,481 | 16,922 | 7,311 | (7,361 | ) | ||||||||||||||
| Accumulated other comprehensive loss | (4,128 | ) | (3,945 | ) | (2,028 | ) | (2,244 | ) | (2,894 | ) | ||||||||||
| Total shareholders' equity | 556,797 | 548,116 | 567,819 | 557,802 | 542,330 | |||||||||||||||
| Total liabilities and shareholders' equity | $ | 4,362,226 | $ | 4,327,052 | $ | 4,269,078 | $ | 4,268,034 | $ | 4,181,840 |
QUARTERLY NET INTEREST MARGIN ANALYSIS
| Three months ended September 30, 2015 | Three months ended June 30, 2015 | Three months ended September 30, 2014 | ||||||||||||||||||||||||||||||||||
| (Dollars in thousands) | Average Balance | Interest* | Yield/Cost* | Average Balance | Interest* | Yield/Cost* | Average Balance | Interest* | Yield/Cost* | |||||||||||||||||||||||||||
| Assets | ||||||||||||||||||||||||||||||||||||
| Loans | $ | 2,985,063 | $ | 40,362 | 5.36 | % | $ | 2,966,953 | $ | 40,468 | 5.47 | % | $ | 2,794,765 | $ | 41,667 | 5.91 | % | ||||||||||||||||||
| Investment securities | 709,914 | 4,209 | 2.35 | 685,796 | 4,024 | 2.35 | 694,239 | 3,907 | 2.23 | |||||||||||||||||||||||||||
| Federal funds and other | 55,246 | 47 | 0.34 | 49,407 | 45 | 0.37 | 44,165 | 38 | 0.34 | |||||||||||||||||||||||||||
| Total interest-earning assets | 3,750,223 | 44,618 | 4.72 | % | 3,702,156 | 44,537 | 4.83 | % | 3,533,169 | 45,612 | 5.12 | % | ||||||||||||||||||||||||
| Goodwill | 152,152 | 152,152 | 152,152 | |||||||||||||||||||||||||||||||||
| Other intangibles, net | 14,763 | 15,570 | 17,758 | |||||||||||||||||||||||||||||||||
| Other non-interest-earning assets | 400,811 | 401,690 | 377,754 | |||||||||||||||||||||||||||||||||
| Total assets | $ | 4,317,949 | $ | 4,271,568 | $ | 4,080,833 | ||||||||||||||||||||||||||||||
| Liabilities and Equity | ||||||||||||||||||||||||||||||||||||
| Interest-bearing demand | $ | 487,173 | $ | 130 | 0.11 | % | $ | 475,546 | $ | 158 | 0.13 | % | $ | 481,460 | $ | 156 | 0.13 | % | ||||||||||||||||||
| Money market and savings | 996,357 | 713 | 0.28 | 997,732 | 718 | 0.29 | 956,128 | 567 | 0.24 | |||||||||||||||||||||||||||
| Time | 1,056,806 | 2,254 | 0.85 | 1,078,460 | 2,197 | 0.82 | 1,123,293 | 1,651 | 0.58 | |||||||||||||||||||||||||||
| Total interest-bearing deposits | 2,540,336 | 3,097 | 0.48 | 2,551,738 | 3,073 | 0.48 | 2,560,881 | 2,374 | 0.37 | |||||||||||||||||||||||||||
| Short-term borrowings | 349,900 | 437 | 0.50 | 320,694 | 331 | 0.41 | 203,193 | 65 | 0.13 | |||||||||||||||||||||||||||
| Long-term debt | 125,846 | 1,465 | 4.62 | 136,377 | 1,504 | 4.42 | 148,650 | 1,510 | 4.03 | |||||||||||||||||||||||||||
| Total interest-bearing liabilities | 3,016,082 | 4,999 | 0.66 | % | 3,008,809 | 4,908 | 0.65 | % | 2,912,724 | 3,949 | 0.54 | % | ||||||||||||||||||||||||
| Non-interest-bearing deposits | 718,989 | 676,858 | 602,888 | |||||||||||||||||||||||||||||||||
| Other liabilities | 29,196 | 27,090 | 19,613 | |||||||||||||||||||||||||||||||||
| Total liabilities | 3,764,267 | 3,712,757 | 3,535,225 | |||||||||||||||||||||||||||||||||
| Shareholders’ equity | 553,682 | 558,811 | 545,608 | |||||||||||||||||||||||||||||||||
| Total liabilities and shareholders’ equity | $ | 4,317,949 | $ | 4,271,568 | $ | 4,080,833 | ||||||||||||||||||||||||||||||
| Net interest income, taxable equivalent | $ | 39,619 | $ | 39,629 | $ | 41,663 | ||||||||||||||||||||||||||||||
| Interest rate spread | 4.06 | % | 4.18 | % | 4.58 | % | ||||||||||||||||||||||||||||||
| Tax equivalent net interest margin | 4.19 | % | 4.29 | % | 4.68 | % | ||||||||||||||||||||||||||||||
| Percentage of average interest-earning assets to average interest-bearing liabilities | 124.34 | % | 123.04 | % | 121.30 | % | ||||||||||||||||||||||||||||||
| * Taxable equivalent basis | ||||||||||||||||||||||||||||||||||||
APPENDIX - RECONCILIATION OF NON-GAAP MEASURES
| As of and for the three months ended | ||||||||||||||||||||
| (Dollars in thousands, except per share data) | September 30, 2015 | June 30, 2015 | March 31, 2015 | December 31, 2014 | September 30, 2014 | |||||||||||||||
| Operating Earnings | ||||||||||||||||||||
| Net income (GAAP) | $ | 11,788 | $ | 10,741 | $ | 10,250 | $ | 15,311 | $ | 949 | ||||||||||
| Securities (gains) losses | — | (84 | ) | (1 | ) | (4 | ) | 96 | ||||||||||||
| Gain on sale of branch | — | — | — | — | (415 | ) | ||||||||||||||
| Merger and conversion costs | 104 | (25 | ) | 220 | 1,589 | 17,270 | ||||||||||||||
| Restructuring charges | 50 | 2,294 | 907 | 33 | 180 | |||||||||||||||
| Income tax effect of adjustments | (59 | ) | (836 | ) | (431 | ) | (601 | ) | (6,075 | ) | ||||||||||
| DTA revaluation from reduction in state income tax rates, net of federal benefit | 651 | — | — | — | — | |||||||||||||||
| DTA valuation allowance reversal | — | — | — | (4,706 | ) | — | ||||||||||||||
| Net operating earnings (Non-GAAP) | 12,534 | 12,090 | 10,945 | 11,622 | 12,005 | |||||||||||||||
| Dividends on preferred stock | — | 183 | 639 | 639 | 630 | |||||||||||||||
| Net operating earnings available to common shareholders (Non-GAAP) | $ | 12,534 | $ | 11,907 | $ | 10,306 | $ | 10,983 | $ | 11,375 | ||||||||||
| Net operating earnings per common share: | ||||||||||||||||||||
| Basic (Non-GAAP) | $ | 0.40 | $ | 0.38 | $ | 0.33 | $ | 0.35 | $ | 0.36 | ||||||||||
| Diluted (Non-GAAP) | 0.40 | 0.38 | 0.33 | 0.35 | 0.36 | |||||||||||||||
| Pre-Tax, Pre-Provision Operating Earnings | ||||||||||||||||||||
| Net income (GAAP) | $ | 11,788 | $ | 10,741 | $ | 10,250 | $ | 15,311 | $ | 949 | ||||||||||
| Provision for loan losses | 1,576 | 994 | 961 | 843 | 816 | |||||||||||||||
| Income tax expense | 7,891 | 6,076 | 5,846 | 607 | 621 | |||||||||||||||
| Pre-tax, pre-provision income | 21,255 | 17,811 | 17,057 | 16,761 | 2,386 | |||||||||||||||
| Securities (gains) losses | — | (84 | ) | (1 | ) | (4 | ) | 96 | ||||||||||||
| Gain on sale of branch | — | — | — | — | (415 | ) | ||||||||||||||
| Merger and conversion costs | 104 | (25 | ) | 220 | 1,589 | 17,270 | ||||||||||||||
| Restructuring charges | 50 | 2,294 | 907 | 33 | 180 | |||||||||||||||
| Pre-tax, pre-provision operating earnings (Non-GAAP) | $ | 21,409 | $ | 19,996 | $ | 18,183 | $ | 18,379 | $ | 19,517 | ||||||||||
| Operating Non-Interest Income | ||||||||||||||||||||
| Non-interest income (GAAP) | $ | 10,798 | $ | 10,800 | $ | 8,839 | $ | 9,562 | $ | 9,061 | ||||||||||
| Gain on sale of branch | — | — | — | — | (415 | ) | ||||||||||||||
| Securities (gains) losses | — | (84 | ) | (1 | ) | (4 | ) | 96 | ||||||||||||
| Operating non-interest income (Non-GAAP) | $ | 10,798 | $ | 10,716 | $ | 8,838 | $ | 9,558 | $ | 8,742 | ||||||||||
| Operating Non-Interest Expense | ||||||||||||||||||||
| Non-interest expense (GAAP) | $ | 28,848 | $ | 32,316 | $ | 30,958 | $ | 33,592 | $ | 48,187 | ||||||||||
| Merger and conversion costs | (104 | ) | 25 | (220 | ) | (1,589 | ) | (17,270 | ) | |||||||||||
| Restructuring charges | (50 | ) | (2,294 | ) | (907 | ) | (33 | ) | (180 | ) | ||||||||||
| Operating non-interest expense (Non-GAAP) | $ | 28,694 | $ | 30,047 | $ | 29,831 | $ | 31,970 | $ | 30,737 | ||||||||||
| Operating Efficiency Ratio | ||||||||||||||||||||
| Efficiency ratio (GAAP) | 57.58 | % | 64.47 | % | 64.48 | % | 66.71 | % | 95.28 | % | ||||||||||
| Effect to adjust for securities gains (losses) | — | 0.11 | — | 0.01 | (0.18 | ) | ||||||||||||||
| Effect to adjust for gain on sale of branch | — | — | — | — | 0.79 | |||||||||||||||
| Effect to adjust for merger and conversion costs | (0.21 | ) | 0.04 | (0.46 | ) | (3.15 | ) | (34.37 | ) | |||||||||||
| Effect to adjust for restructuring costs | (0.10 | ) | (4.58 | ) | (1.89 | ) | (0.07 | ) | (0.36 | ) | ||||||||||
| Operating efficiency ratio (Non-GAAP) | 57.27 | % | 60.04 | % | 62.13 | % | 63.50 | % | 61.16 | % | ||||||||||
| As of and for the three months ended | ||||||||||||||||||||
| (Dollars in thousands, except per share data) | September 30, 2015 | June 30, 2015 | March 31, 2015 | December 31, 2014 | September 30, 2014 | |||||||||||||||
| Adjusted Allowance for Loan Losses | ||||||||||||||||||||
| Allowance for loan losses (GAAP) | $ | 9,000 | $ | 8,358 | $ | 8,284 | $ | 7,817 | $ | 7,641 | ||||||||||
| Net acquisition accounting fair value discounts to loans | 43,095 | 47,160 | 51,125 | 55,166 | 62,969 | |||||||||||||||
| Adjusted allowance for loan losses (Non-GAAP) | 52,095 | 55,518 | 59,409 | 62,983 | 70,610 | |||||||||||||||
| Loans | 2,979,779 | 2,955,771 | 2,913,859 | 2,898,266 | 2,827,426 | |||||||||||||||
| Adjusted allowance for loan losses to loans (Non-GAAP) | 1.75 | % | 1.88 | % | 2.04 | % | 2.17 | % | 2.50 | % | ||||||||||
| Tangible Common Equity | ||||||||||||||||||||
| Shareholders' equity (GAAP) | $ | 556,797 | $ | 548,116 | $ | 567,819 | $ | 557,802 | $ | 542,330 | ||||||||||
| Less preferred stock | — | — | 28,405 | 28,405 | 28,405 | |||||||||||||||
| Less goodwill and other intangible assets | 166,476 | 167,237 | 168,014 | 168,829 | 169,690 | |||||||||||||||
| Tangible common equity (Non-GAAP) | $ | 390,321 | $ | 380,879 | $ | 371,400 | $ | 360,568 | $ | 344,235 | ||||||||||

2015 Q3 Earnings Call
October 22, 2015

Forward Looking Statements
Information in this presentation contains forward-looking statements within the meaning of the Private Securities Litigation Reform Act of 1995. These statements involve risks and
uncertainties that could cause actual results to differ materially, including without limitation, reduced earnings due to larger than expected credit losses in the sectors of our loan portfolio
secured by real estate due to economic factors, including declining real estate values, increasing interest rates, increasing unemployment, or changes in payment behavior or other factors;
reduced earnings due to larger credit losses because our loans are concentrated by loan type, industry segment, borrower type, or location of the borrower or collateral; the rate of
delinquencies and amount of loans charged-off; the adequacy of the level of our allowance for loan losses and the amount of loan loss provisions required in future periods; costs or difficulties
related to the integration of the banks we acquired or may acquire may be greater than expected; factors relating to our proposed acquisition of NewBridge Bancorp (“NewBridge”), including
our ability to consummate the transaction on a timely basis, if at all, our ability to effectively and timely integrate the operations of Yadkin and NewBridge, our ability to achieve the estimated
synergies from this proposed transaction and once integrated, the effects of such business combination on our future financial condition, operating results, strategy and plans; results of
examinations by our regulatory authorities, including the possibility that the regulatory authorities may, among other things, require us to increase our allowance for loan losses or writedown
assets; the amount of our loan portfolio collateralized by real estate, and the weakness in the commercial real estate market; our ability to maintain appropriate levels of capital; adverse
changes in asset quality and resulting credit risk-related losses and expenses; increased funding costs due to market illiquidity, increased competition for funding, and increased regulatory
requirements with regard to funding; significant increases in competitive pressure in the banking and financial services industries; changes in political conditions or the legislative or regulatory
environment, including the effect of recent financial reform legislation on the banking industry; general economic conditions, either nationally or regionally and especially in our primary service
area, becoming less favorable than expected resulting in, among other things, a deterioration in credit quality; our ability to retain our existing customers, including our deposit relationships;
changes occurring in business conditions and inflation; changes in monetary and tax policies; ability of borrowers to repay loans; risks associated with a failure in or breach of our operational
or security systems or infrastructure, or those of our third party vendors and other service providers or other third parties, including as a result of cyber attacks, which could disrupt our
businesses, result in the disclosure or misuse of confidential or proprietary information, damage our reputation, increase our costs and cause losses; changes in accounting principles, policies
or guidelines; changes in the assessment of whether a deferred tax valuation allowance is necessary; our reliance on secondary sources such as Federal Home Loan Bank advances, sales of
securities and loans, federal funds lines of credit from correspondent banks and out-of-market time deposits, to meet our liquidity needs; loss of consumer confidence and economic
disruptions resulting from terrorist activities or other military actions; and changes in the securities markets. Additional factors that could cause actual results to differ materially are discussed in
the Company’s filings with the Securities and Exchange Commission ("SEC"), including without limitation its Annual Report on Form 10-K, its Quarterly Reports on Form 10-Q, and its Current
Reports on Form 8-K. The forward-looking statements in this presentation speak only as of the date of the presentation, and the Company does not assume any obligation to update such
forward-looking statements.
Pro forma combined information which combines Yadkin and VantageSouth Banchares, Inc. contained in this presentation are used for illustrative purposes only. The pro forma information
does nor purport to project our results of operations or financial condition for any future period or for any future date.
does nor purport to project our results of operations or financial condition for any future period or for any future date.
Non‐GAAP Measures
Statements included in this presentation include non‐GAAP measures and should be read along with the accompanying tables to the October 22, 2015 presentation and earnings release
which provide a reconciliation of non‐GAAP measures to GAAP measures. Management believes that these non‐GAAP measures provide additional useful information that allows readers to
evaluate the ongoing performance of the Company. Non‐GAAP measures should not be considered as an alternative to any measure of performance or financial condition as promulgated
under GAAP, and investors should consider the Company's performance and financial condition as reported under GAAP and all other relevant information when assessing the performance or
financial condition of the Company. Non‐GAAP measures have limitations as analytical tools, and investors should not consider them in isolation or as a substitute for analysis of the
Company's results or financial condition as reported under GAAP.
Important Information
2

Q3 2015 Highlights
3
§ Record net operating EPS to common shareholders of $0.40, or $12.5 million, a 20.9% annualized
growth over Q2 2015
growth over Q2 2015
§ Annualized net operating ROATCE of 13.85% and net operating ROAA of 1.15% in Q3 2015,
compared to 13.35% and 1.14% in Q2 2015
compared to 13.35% and 1.14% in Q2 2015
§ Operating efficiency ratio declined to 57.3% in Q3 2015 from 60.0% in Q2 2015
§ Record loan originations and commitments of $396mm drove originated loan growth of 9.9% from
Q2 to Q3
Q2 to Q3
§ Non-interest demand deposits increased at an annualized rate of 18.9% from Q2 to Q3
§ Tangible book value per share increased from $12.01 in Q2 to $12.31 in Q3
§ Announced quarterly cash dividend of $0.10 per share payable on November 19 to shareholders of
record as of November 5
record as of November 5
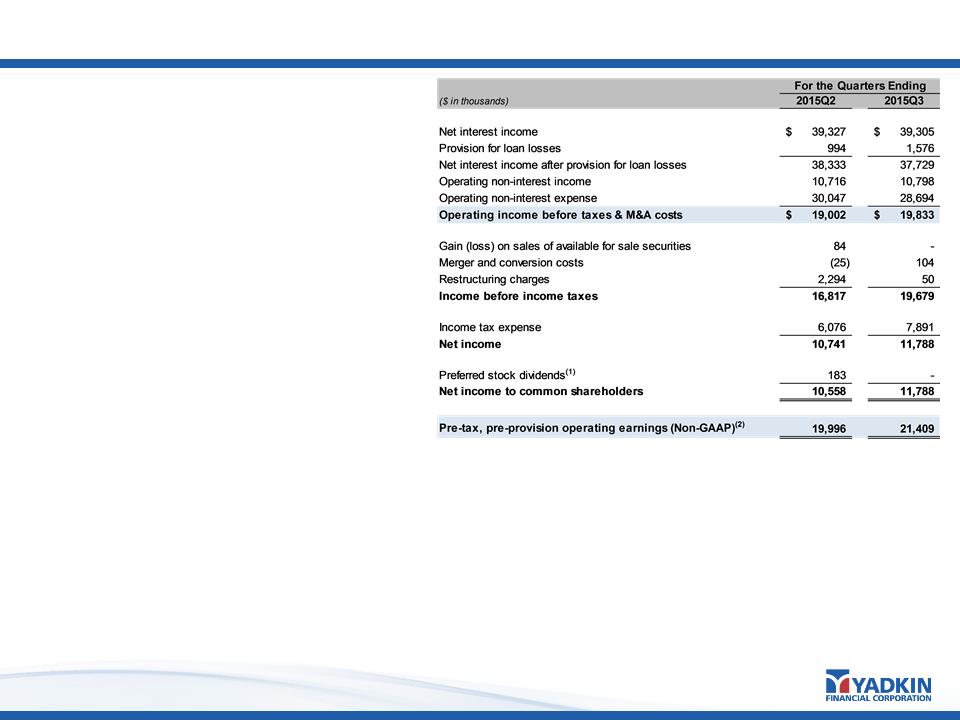
§ Net income available to common shareholders
totaled $11.8mm or $0.37 per share during Q3
2015, compared to $10.6mm or $0.33 per share
during Q2 2015
totaled $11.8mm or $0.37 per share during Q3
2015, compared to $10.6mm or $0.33 per share
during Q2 2015
§ Net operating earnings available to common
shareholders totaled $12.5mm, or $0.40 per
share, in Q3 2015, compared to $11.9mm or
$0.38 per share in Q2 2015
shareholders totaled $12.5mm, or $0.40 per
share, in Q3 2015, compared to $11.9mm or
$0.38 per share in Q2 2015
§ Annualized net operating ROAA of 1.15% in Q3
2015, compared to 1.14% in Q2 2015
2015, compared to 1.14% in Q2 2015
§ Annualized net operating ROATCE 13.85% in Q3
2015, compared to 13.35% in Q2 2015
2015, compared to 13.35% in Q2 2015
§ Provision increased to $1.6mm in Q3 due to an
increase in reserve build on originated loans
increase in reserve build on originated loans
§ Income tax expense increased to $7.9mm,
including a $0.65mm one-time charge to revalue
DTA as the 2016 NC income tax rate will decline
from 5% to 4%
including a $0.65mm one-time charge to revalue
DTA as the 2016 NC income tax rate will decline
from 5% to 4%
§ Operating efficiency ratio improved to 57.3% in
Q3 2015, compared to 60.0% in Q2 2015
Q3 2015, compared to 60.0% in Q2 2015
(1) Prefered stock was initially issued in connection with the TARP Capital Purchase Program.
(2) Excludes securities gains and losses, branch sale gain, merger and conversion costs, and restructuring charges.
Earnings Profile
4
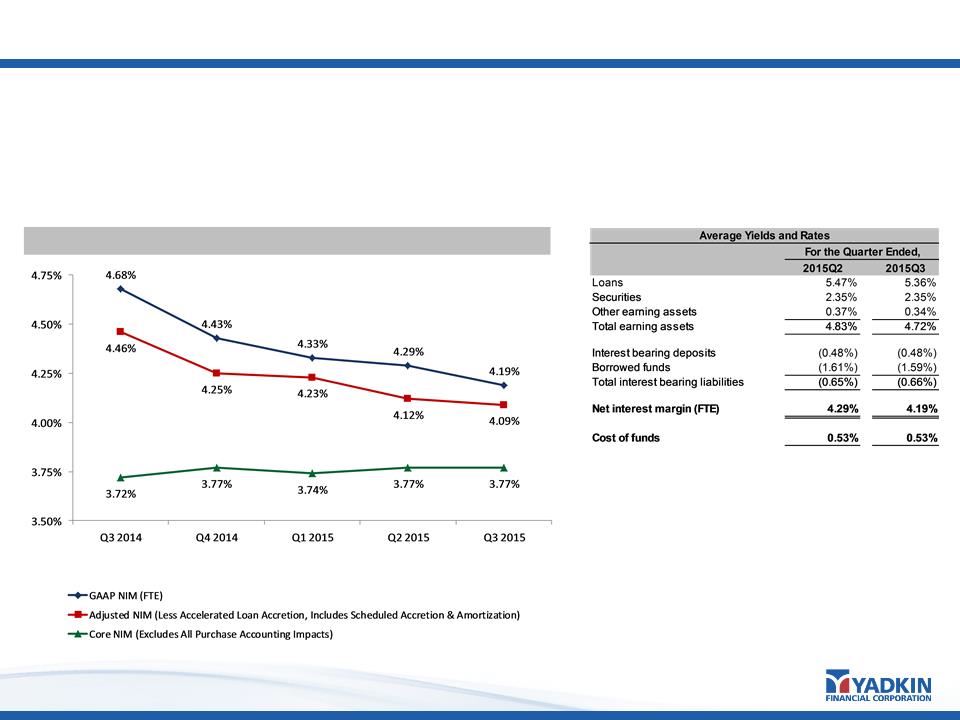
Net Interest Income
5
Combined Net Interest Margin (%)
§ Continued loan pricing pressure weighed on earning asset yields and NIM and core NIM (non-GAAP)
§ Impact of acquisition accounting on net interest margin is declining
§ Focus remains on disciplined loan pricing and low-cost, core deposits
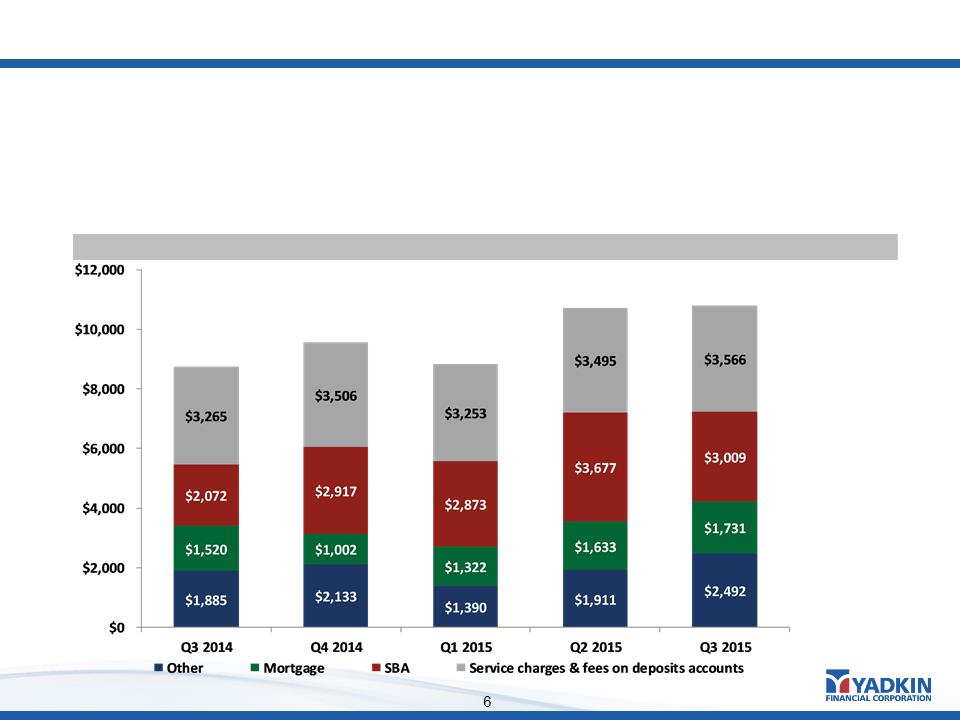
Diverse Drivers of Non-Interest Income Growth
Combined Operating Non-Interest Income Composition1 ($000)
$8,742
$9,558
§ Operating non-interest income totaled $10.8mm in the Q3 2015, a 23.5% increase from Q3 2014
§ Record SBA production of $43.5mm in Q3 as pipeline strengthened but gain on sale declined, product mix included more
504 loans, and the proportion of multi-funding loans increased
504 loans, and the proportion of multi-funding loans increased
§ Mortgage revenue increased to $1.7mm, benefiting from a 5% annualized production increase over Q2 2015 and despite a
$0.1mm MSR impairment compared to a $0.2mm MSR recovery in Q2
$0.1mm MSR impairment compared to a $0.2mm MSR recovery in Q2
(1) Excludes securities gains and losses and branch sale gain.
$8,838
$10,716
$10,798
Change from Q3
2014 to Q3 2015
2014 to Q3 2015
9.2%
45.2%
13.9%
32.2%
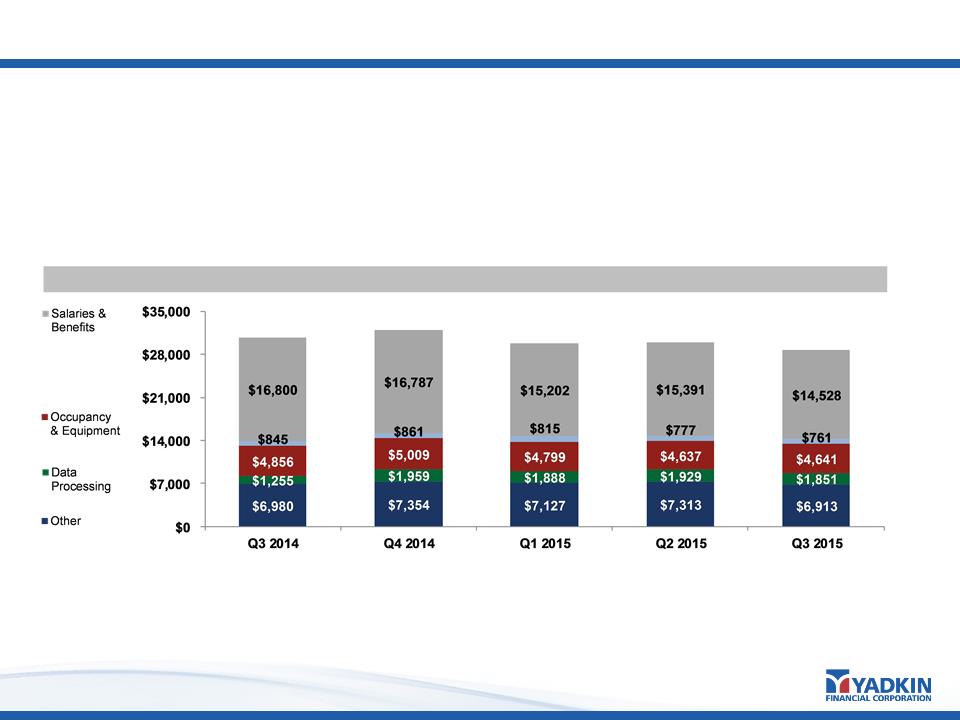
Non-Interest Expense
7
Combined Non-Interest Expense Composition1 ($000)
§ Operating efficiency ratio declined to 57.3% for the second quarter
• Reduced operating non-interest expenses 10.2% since Q4 2014 peak
• Comfortably reached the previously announced operating efficiency goal of sub 60% before the end of
2015
2015
Total Non-Interest Expense | $48,187 | $33,592 | $30,958 | $32,316 | $28,848 |
One-time charges | ($17,450) | ($1,622) | ($1,127) | ($2,485) | ($154) |
Operating Non-Interest Expense | $30,737 | $31,970 | $29,831 | $30,047 | $28,694 |
$30,737
$31,970
$29,831
(1) Excludes merger and conversion costs and restructuring charges.
n Core Deposit
Intangible
Amortization
Intangible
Amortization
$30,047
$28,694
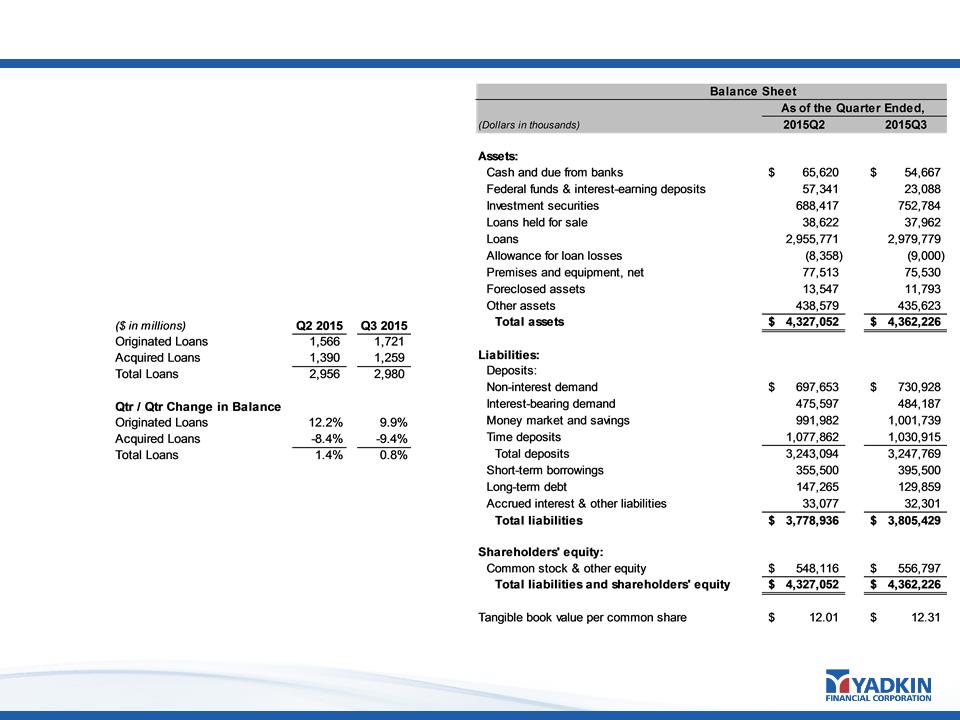
Balance Sheet
8
§ Annualized net loan growth was approximately
3.2% in Q3 2015
3.2% in Q3 2015
• Record loan originations and commitments of
$396mm
$396mm
• Loan growth is net of $30.6 mm in SBA loan
sales
sales
• $155mm (9.9%) originated loan growth from Q2 to
Q3
Q3
• Non-interest demand deposits increased by 18.9%
annualized
annualized
• Non-interest demand deposits are 22.5% of
total deposits
total deposits
§ TCE / TA increased to 9.30% at September 30,
2015, compared to 9.16% at June 30, 2015
2015, compared to 9.16% at June 30, 2015
§ TBV per share up 9.9% annualized to $12.31
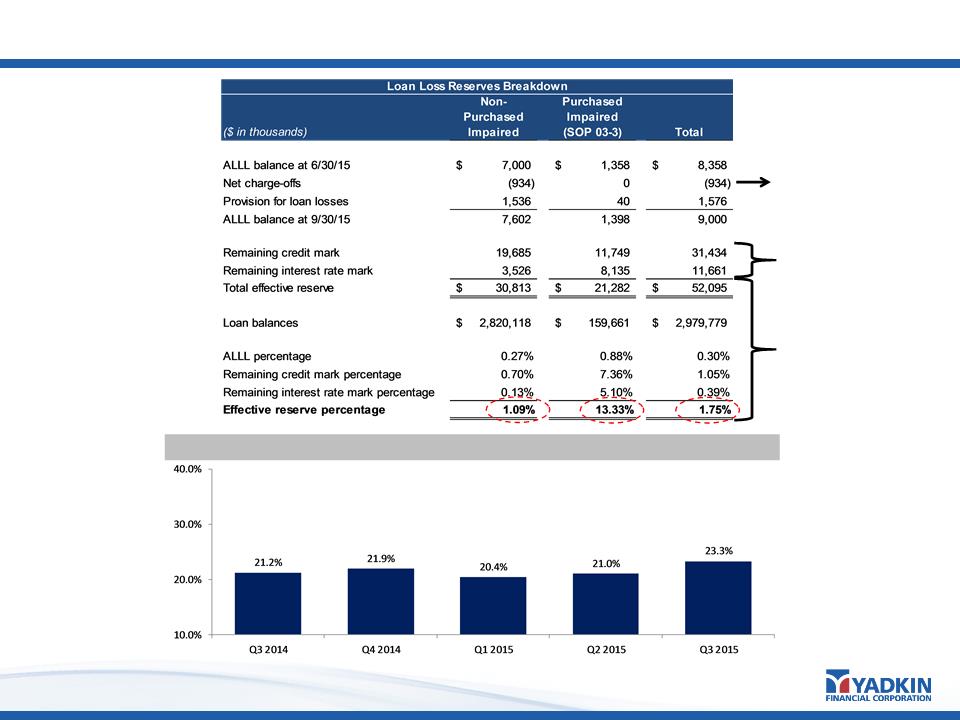
Strong Asset Quality
9
Effective Reserve of
1.75% or $52.1mm
1.75% or $52.1mm
Classified Asset Ratio (1) - Bank Level
(1) Classified Asset Ratio = Classified Assets / (Tier 1 Capital + Loan Loss Reserves)
Net charge-offs - 12bps
Remaining mark
declined by $4.1mm in
Q3 2015
declined by $4.1mm in
Q3 2015
Q3 increase driven by
one credit; not systemic
as 30-89 days past due
loans are at lowest point
since merger completion
one credit; not systemic
as 30-89 days past due
loans are at lowest point
since merger completion
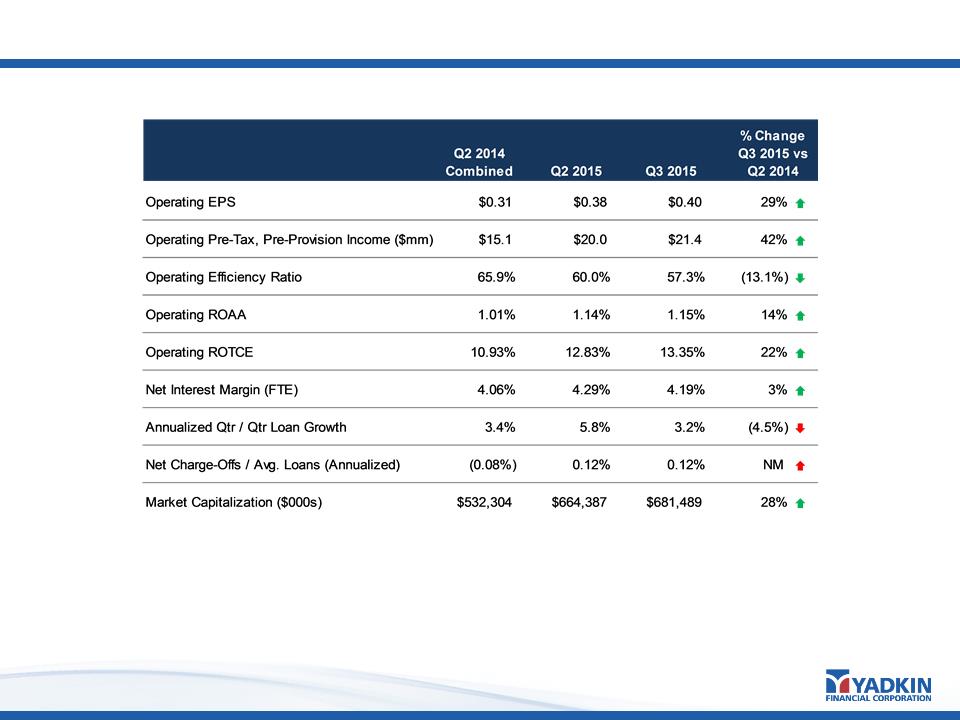
Delivering on Yadkin-VantageSouth MOE Potential
10
Notes:
- Market capitalizations are calculated using the final closing stock price of the quarter. Q2 2014 combined market capitalization is as of Jan 24, 2014, the final trading day prior to the Yadkin-VSB merger announcement. This
market capitalization is also adjusted to include the VantageSouth common equity raised at the same time.
market capitalization is also adjusted to include the VantageSouth common equity raised at the same time.
- Q2 2014 represents pro forma combination of Yadkin Financial Corporation and VantageSouth Bancshares, Inc. results. Q2 and Q3 2015 represent actual results. All periods exclude securities gains and losses, merger and
conversion costs, and restructuring charges.
conversion costs, and restructuring charges.
- Results from Q2 2014 do not include any acquisition accounting impact from the Yadkin-VantageSouth merger.

NewBridge Transaction Rationale
11
Low Risk
Profile
Profile
Ø Experienced management team with a proven track record of integrating
acquisitions
acquisitions
Ø Comprehensive due diligence process and thorough review of loan portfolio
Ø Supplemented with experienced 3rd party vendors
Ø Compatible cultures with familiar customer base
Financially
Attractive
Attractive
Ø Positions franchise for top tier financial performance
Ø Enhances business model economies of scale
Ø EPS accretion of approximately 10%
Ø After full realization of expense savings
Ø Minimal dilution to tangible book value
Ø TBV accretive in approximately 2.5 years
Ø IRR in excess of 20%
Ø Strong pro forma capital position
Strategically
Compelling
Compelling
Ø Strengthens YDKN’s leading position as the largest community bank in North
Carolina
Carolina
Ø Over $7 billion in assets with #1 market share among community banks
Ø Statewide presence serving North Carolina’s premier markets
Ø Adds significant scale in the Piedmont Triad
Ø Complements existing footprint in Raleigh, Charlotte and Wilmington
Ø Bolsters long-term growth potential
Ø Broadens and deepens competitive strengths
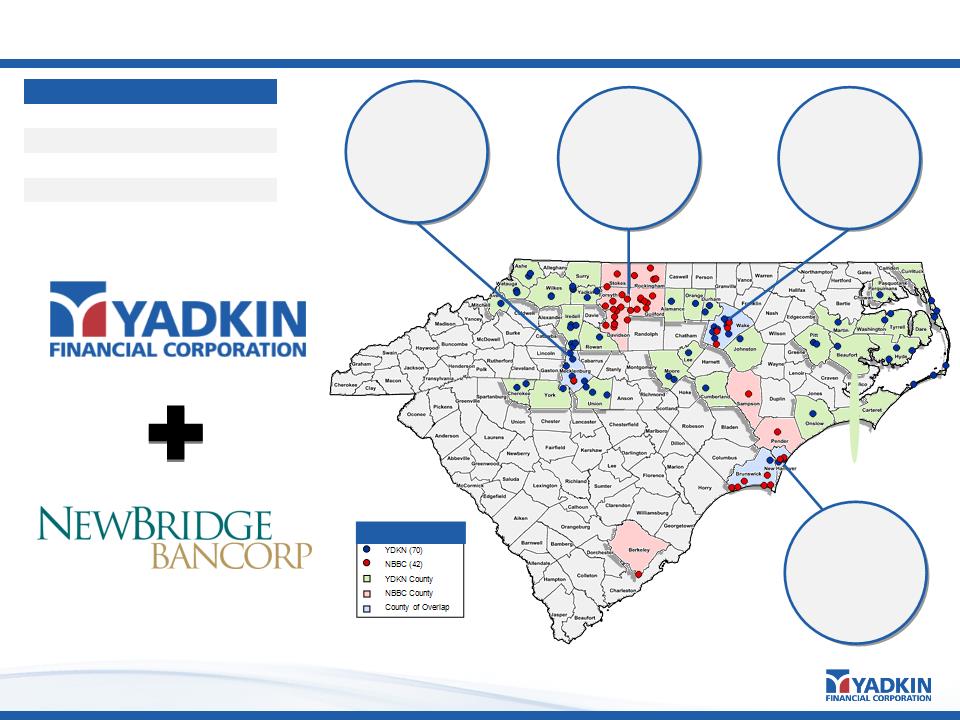
Overview of Pro Forma Franchise
12
Source: SNL Financial and MapInfo Professional
Note: Projected population growth from 2016 to 2021
Note: Projected population growth from 2016 to 2021
Note: Community Bank defined as an institution with less than or equal to $25 billion in total assets
(1) Figures reflect balance sheet data as of 6/30/2015; Market capitalization based on YDKN stock price of $22.79 as of 10/12/15
Legend
Charlotte
Comm. Bank Rank:
#2
Deposits: $784mm
Market Tot: $216.2bn
Pop. Growth: 7.0%
#2
Deposits: $784mm
Market Tot: $216.2bn
Pop. Growth: 7.0%
Piedmont Triad
Comm. Bank Rank:
#2
Deposits: $1.6bn
Market Tot: $46.3bn
Pop. Growth: 3.7%
#2
Deposits: $1.6bn
Market Tot: $46.3bn
Pop. Growth: 3.7%
Raleigh / Durham-
Chapel Hill
Chapel Hill
Comm. Bank Rank:
#1
Deposits: $1.2bn
Market Tot: $32.2bn
Pop. Growth: 7.8%
#1
Deposits: $1.2bn
Market Tot: $32.2bn
Pop. Growth: 7.8%
Wilmington
Comm. Bank Rank:
#2
Deposits: $366mm
Market Tot: $5.1bn
Pop. Growth: 6.9%
#2
Deposits: $366mm
Market Tot: $5.1bn
Pop. Growth: 6.9%
Pro Forma Financial Highlights (1) | |
Branches: | 112 |
Assets: | $7.1 billion |
Loans: | $5.0 billion |
Deposits: | $5.2 billion |
Market Cap: | $1.2 billion |

Transaction Assumptions
13
Ø Earnings estimates based on First Call consensus
Ø Gross credit mark of 1.3%, $25.7 million
Ø Reversal of existing credit mark of $11.7 million
Ø Net transaction-related credit mark of $14.0 million
Ø Reversal of existing ALLL
Ø Mark up of pension liability of $5 million
Ø One-time merger related expenses of $29 million (pre-tax)
Ø Approximately 30% realized at close
Ø Cost savings expected to be 33.5% of estimated NBBC expense base
Ø 37.5% realized in 2016, 100% realized by year-end 2017
Ø Branch consolidations of approximately 10% of the combined company
Ø No revenue synergies included in modeling
Ø Core deposit intangible of 1.0% of non-time deposits, amortized sum-of-years digits over 8 years
Ø TRUPS mark of $11.4 million
Ø Anticipate special dividend of $0.50 per share to YDKN shareholders prior to close
Ø Both YDKN and NBBC to continue paying current quarterly dividends
Ø Estimated close in early Q2 2016
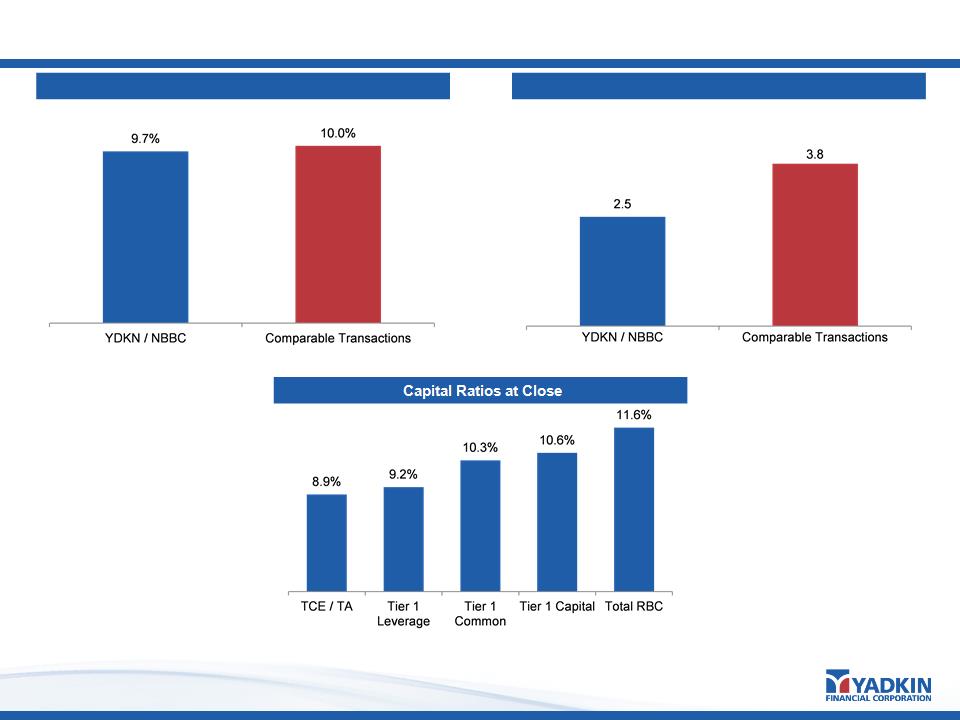
Pro Forma Analysis
14
Sources: SNL Financial
Note: Comparable Transactions include nationwide transactions announced since 12/31/2013 with deal values greater than $250 million
(1) Based on YDKN First Call consensus estimates of $1.85 for 2017 and NBBC First Call consensus estimates of $0.78 for 2017; reflects fully phased-in cost savings
Earnback Period (Years)
EPS Accretion (%) (1)

Contact: Terry Earley
(919) 659-9015
terry.earley@yadkinbank.com

Additional Information About the Proposed Transaction and Where to Find It
This communication is being made in respect of the proposed transaction involving Yadkin and NewBridge. This material is not a solicitation of any vote or approval of Yadkin’s or
NewBridge’s shareholders and is not a substitute for the joint proxy statement/prospectus or any other documents which Yadkin and NewBridge may send to their respective shareholders in
connection with the proposed merger. This communication does not constitute an offer to sell or the solicitation of an offer to buy any securities.
In connection with the proposed transaction, Yadkin intends to file with the Securities and Exchange Commission (“SEC”) a Registration Statement on Form S-4 that will include a joint proxy
statement of Yadkin and NewBridge and a prospectus of Yadkin, as well as other relevant documents concerning the proposed transaction. Investors and security holders are also urged to
carefully review and consider each of Yadkin’s and NewBridge’s public filings with the SEC, including but not limited to their Annual Reports on Form 10-K, their proxy statements, their Current
Reports on Form 8-K and their Quarterly Reports on Form 10-Q. Both NewBridge and Yadkin will mail the joint proxy statement/prospectus to their respective shareholders. BEFORE MAKING
ANY VOTING OR INVESTMENT DECISIONS, INVESTORS AND SHAREHOLDERS OF YADKIN AND NEWBRIDGE ARE URGED TO CAREFULLY READ THE ENTIRE REGISTRATION
STATEMENT AND JOINT PROXY STATEMENT/PROSPECTUS REGARDING THE PROPOSED MERGER WHEN IT BECOMES AVAILABLE AND ANY OTHER RELEVANT DOCUMENTS
FILED WITH THE SEC, AS WELL AS ANY AMENDMENTS OR SUPPLEMENTS TO THOSE DOCUMENTS, BECAUSE THEY WILL CONTAIN IMPORTANT INFORMATION ABOUT THE
PROPOSED TRANSACTION. Investors and security holders may obtain a free copy of the proxy statement/prospectus (when available) and other filings containing information about Yadkin
and NewBridge at the SEC’s website at www.sec.gov. The joint proxy statement/prospectus (when available) and the other filings may also be obtained free of charge at Yadkin’s website at
www.yadkinbank.com, or at NewBridge’s website at www.newbridgebank.com.
Yadkin, NewBridge and certain of their respective directors and executive officers, under the SEC’s rules, may be deemed to be participants in the solicitation of proxies of Yadkin’s and
NewBridge’s shareholders in connection with the proposed transaction. Information about the directors and executive officers of Yadkin and their ownership of Yadkin common stock is set
forth in the proxy statement for Yadkin’s 2015 Annual Meeting of Shareholders, as filed with the SEC on Schedule 14A on April 10, 2015. Information about the directors and executive officers
of NewBridge and their ownership of NewBridge’s common stock is set forth in the proxy statement for NewBridge’s 2015 Annual Meeting of Shareholders, as filed with the SEC on a Schedule
14A on April 2, 2015. Additional information regarding the interests of those participants and other persons who may be deemed participants in the transaction may be obtained by reading the
joint proxy statement/prospectus regarding the proposed transaction when it becomes available. Free copies of this document may be obtained as described in the preceding paragraph.
Important Information
16