Annual
Meeting
May 19,
2009

President and CEO – Francis J. Evanitsky
Juniata Valley Financial Corp.
Stability and Strength
Through Superior Performance

Our Message is Simple and Clear
No neon lights.
No loss-leader promotions.
Competent and caring professionals.
Broad array of products and services suited to the
needs of our customers.
Carefully designed to be offered with pride.
We listen, then act.
This has been our way for 141 years.

Results
Strong, stable financial condition.
Performance consistently exceeding peers.
Capital Strength - Risk-based capital more
than twice regulatory requirements for
“well-capitalized” category.
Liquidity more than double policy minimums.
No need for “help” from our government.
Profitability among highest in industry.

2008 Improvements over 2007
Increase in net income: 5.3%
Increase in fully diluted earnings per share: 7.4%
Increase in return on average equity: 3.1%
Increase in return on average assets: 4.7%
Increase in fully tax-equivalent net interest
margin: 4.1%
Reduction in noninterest expense: 1.6%

Strong Capacity to Pay Dividends
While many financial services companies have
decreased or eliminated dividends to shareholders
because of capital and liquidity concerns, we
increased our regular dividend again in 2008.
On April 21, our Board of Directors has declared a
regular quarterly dividend in the amount of $0.19
per share.
Year to date in 2009, the dividend is 5.5%
higher than in 2008.
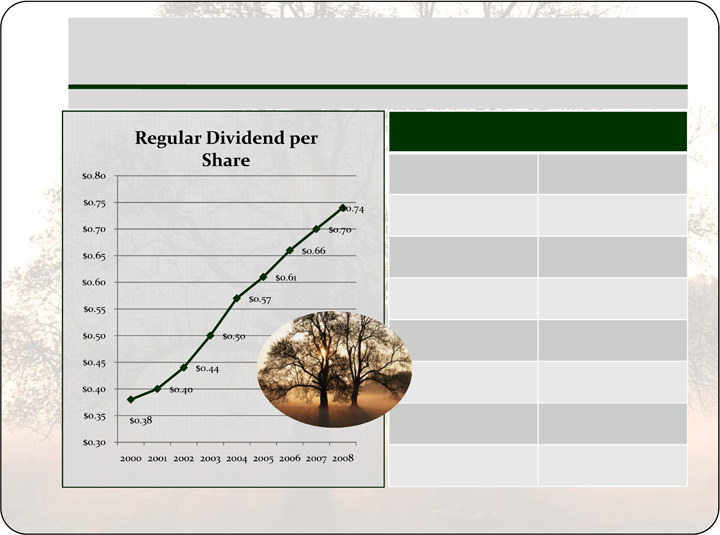
Historical Regular Dividend Activity
Annual Percentage Increase
2001
5.3%
2002
10.0%
2003
13.6%
2004
14.0%
2005
7.0%
2006
8.2%
2007
6.1%
2008
5.7%

Juniata Valley Stock Trades
In spite of performance, stock has been trading at lower
levels than in the past.
General disfavor of financial institutions has affected the
perceived value of our stock, but not to the same degree
as our peers.
Have withstood negative industry trends better than
many others in our sector.
Current market values do not reflect our strong financial
accomplishments.

Comparison to Local Peers
Stock Value
Shareholder Return

Stockholder Total Return – 5 Year
Assumptions
Investment made on 12/31/2003
Selected Local Peers
FMFP – First Community
Financial Corp.
KISB – Kish Bancorp
MPB – Mid Penn Bancorp
MIFF – Mifflinburg B&T
NUBC – Northumberland
Bancorp
ORRF – Orrstown Financial
Services
FNB – FNB of Pennsylvania
Definition
Total return of a security
over a period, including
price appreciation and
the reinvestment of
dividends. Dividends are
assumed to be
reinvested at the closing
price of the security on
the ex-date of the
dividend.
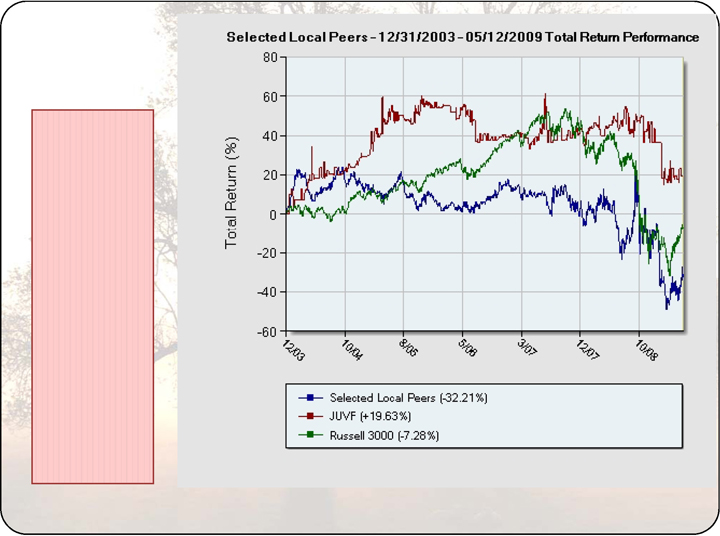
Juniata
Valley
Vs.
Composite of
Selected
Peers
and
National
Index
Total Return Performance – 5 Year
Initial Investment 12/31/03 to 12/31/08
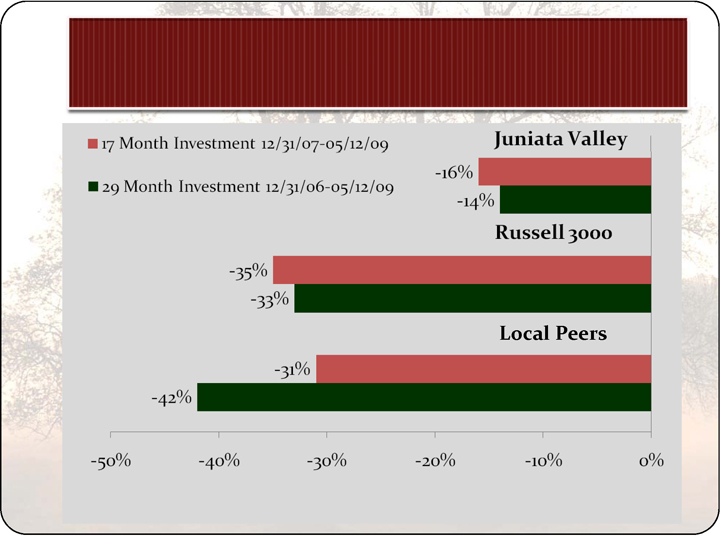
Total Return
in Shortened Investment Period

Independent Performance Analysis
Pennsylvania Bank Performance Report 2008
Analysis by FMC (Financial Management Consulting
Group) from Kentucky.
Ranks 143 banks in Pennsylvania on all major
performance components.
Juniata Valley Bank ranks 6th in the state for
overall performance in 2008.

Our Record
Speaks for itself.
Our People
Dedicated to our success.
Team of experienced senior officers.
Backed up by devoted middle managers.
Supported by competent staff.
Oversight by seasoned board of directors.

Assuring our
Customers

Firmly planted in Central Pennsylvania

Rural Central Pennsylvania
Serving the Juniata Valley

Financial Performance
Presented by JoAnn McMinn, Chief Financial Officer

Juniata Valley Financial Corp.
2008
2007
2006
Net interest
income
$16,173,000
$15,663,000
$14,552,000
Loan loss
provision
(421,000)
(120,000)
(54,000)
Non-interest
income
4,558,000
4,218,000
3,649,000
Security
transactions
(521,000)
(19,000)
181,000
Non-interest
expense
(12,008,000)
(12,209,000)
(11,245,000)
Income tax
expense
(2,057,000)
(2,099,000)
(2,081,000)
Net income
$5,724,000
$5,434,000
$5,002,000

Juniata Valley Financial Corp.
2008
2007
Change
ROAA
1.34%
1.28%
4.7%
ROAE
11.76%
11.41%
3.1%
Yield on Earning Assets
6.48%
6.88%
(5.8)%
Cost of Funding
2.33%
2.85%
(18.2)%
Net Interest Margin (tax equivalent)
4.34%
4.17%
4.1%
Non-interest income /AA
1.06%
0.99%
7.1%
Non-interest expense/AA
2.80%
2.87%
(2.4)%
Net non-interest expense/AA
1.74%
1.88%
(7.4)%
Earnings per share (FD)
$1.31
$1.22
7.4%

Key Factors Affecting 2008 Results
Interest rate environment – an increase in the net interest margin during
swiftly changing rate environment
Loan growth
- Increased $17 million, or 5.7% from year-end 2007 at year-end 2008
Allowance for Loan Loss adequacy
Changes in depositor preferences
- Shift from interest-bearing transaction accounts to term Certificates of Deposit
Other-than-temporary impairment charges on equities portfolio
Staffing turnover
Non-interest income improvement
Non-interest expense reduction

Comparison to Local Peers
Financial Performance

Local Peer Group
Corporation
Assets at
12/31/08
(in millions)
Principal Bank
Mid Penn Bancorp
$572
Mid Penn Bank
Kish Bancorp
$473
Kish Bank
First Community Financial
Corporation
$326
FNB Mifflintown
Mifflinburg Bancorp, Inc
$275
Mifflinburg Bank & Trust
Orrstown Financial Services
$1,052
Orrstown Bank
Northumberland Bancorp
$369
Northumberland National Bank
F.N.B. Corporation
$8,365
First National Bank of PA
Juniata Valley Financial
Corp
$428
Juniata Valley Bank
Sources for all Peer Data: SNL Financial and Company Annual Reports

For the Year 2008
Corporation
ROA
ROE
Net
Interest
Margin
Non-
Interest
Income to
Average
Assets
Non-
Interest
Expense to
Average
Assets
Mid Penn
0.67%
8.83%
3.50%
0.68%
2.74%
Kish
0.84%
12.75%
3.37%
0.81%
2.73%
First Community
0.73%
10.52%
3.20%
0.72%
2.50%
Mifflinburg
1.15 %
10.84%
3.62%
0.60%
2.35%
Orrstown
1.38%
13.20%
3.93%
1.63%
2.98%
F.N.B. Corp
0.46%
4.20%
3.88%
1.33%
2.89%
Northumberland
0.71%
9.32%
2.46%
0.46%
1.79%
Juniata Valley
1.34%
11.76%
4.34%
1.06%
2.80%
Peer Average
0.85%
9.95%
3.42%
0.89%
2.57%
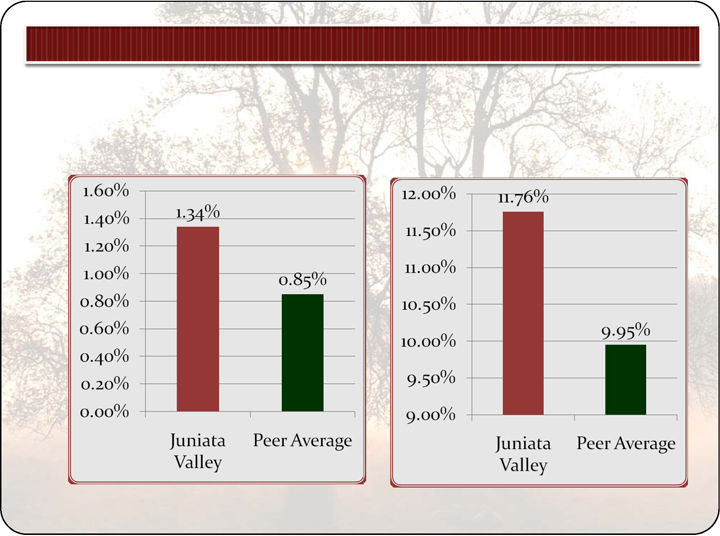
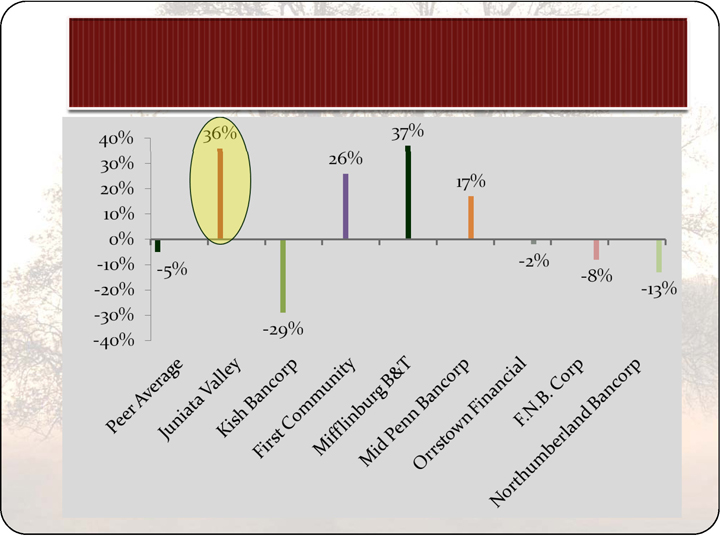
Return on Average
Assets
Return on Average
Equity
2008 Key Performance Ratio Comparisons to Local Peer Group
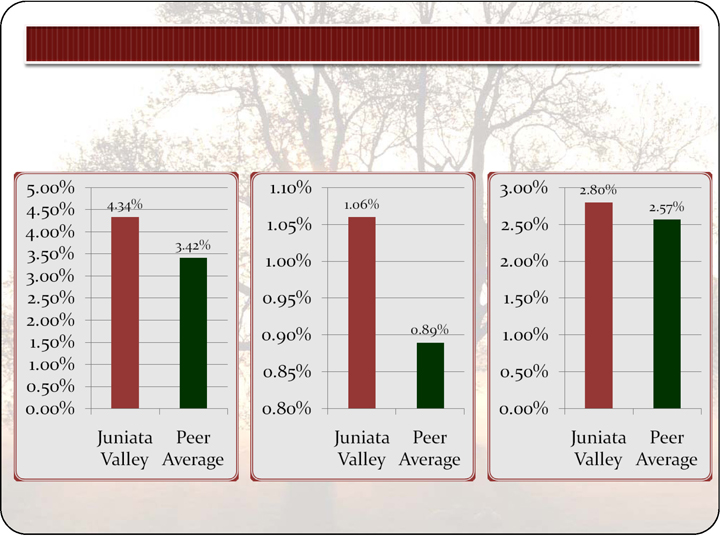
Net Interest Margin
Non-Interest Income /
Average Assets
2008 Key Performance Ratio Comparisons to Local Peer Group
Non-Interest Expense/
Average Assets
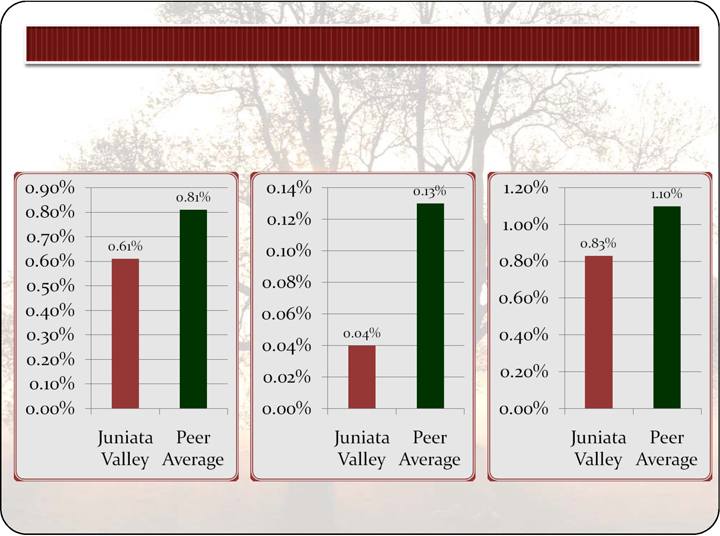
Non-Performing Loans
/ Total Loans
Net Charge-Offs to
Average Loans
2008 Key Performance Ratio Comparisons to Local Peer Group
Loan Loss Reserve /
Total Loans

Risk-Based Capital
Ratio (8% Minimum)
Tier 1 Risk Based
Capital Ratio (4% Minimum)
2008 Capital Ratio Comparisons to Local Peer Group
Leverage Ratio
(4% Minimum)

2009– Moving Ahead
Facing challenges

Q1 2009 vs. Q1 2008 Results
Q1 2009
Change from Q1 2008
Net Income
$1,410,000
0.6% Increase
Earnings per Share
$0.32
0.00% Increase
Total Assets (since year end)
$429,542,000
0.3% Increase
Net Interest Income
$4,017,000
3.5% Increase
Net Interest Margin
4.35%
2.4% Increase – 10 bp
Non-Interest Income/AA
1.16%
8.4% Increase – 9 bp
Non-Interest Expense/AA
3.00%
3.4% Increase – 10 bp
Return on Assets
1.32%
1.5% Decrease – 2 bp
Return on Equity
11.59%
0.0% Decrease – 1 bp

Juniata Valley Financial Corp.
Strategic Plan
Presented by Marcie Barber, Chief Operating Officer
Juniata Valley Bank
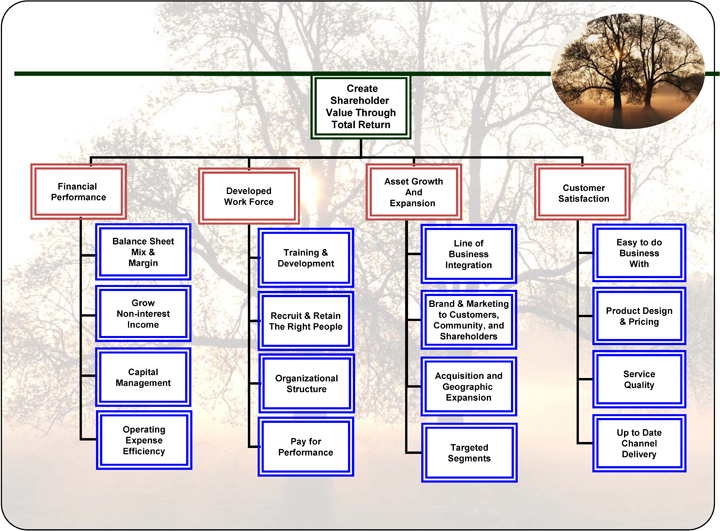
Strategy Map – Prioritized

Create Shareholder
Value Through
Total Return
Dividends
Financial Performance
Appreciation
Market Dynamics
Industry Perception
Image and Reputation

Financial Performance
Manage the Margin – Buy Low – Sell High
Trust - Deposit fee income – Alternative Investments
Protect and Share Responsibly
Controllable - And not…..
Financial
Performance
Balance Sheet
Mix &
Margin
Grow
Non-interest
Income
Capital
Management
Operating
Expense
Efficiency

Developed Workforce
Developed
Workforce
Training &
Development
Recruit & Retain
The Right People
Organizational
Structure
Pay for
Performance
Loan Training
Compliance Training
Changing Roles
Community Office
Incentive program

Credit – Compliance - Security

Asset Growth and Expansion
Asset Growth
and
Expansion
Line of
Business
Integration
Brand & Marketing
to Customers,
Community, and
Shareholders
Acquisition and
Geographic
Expansion
Targeted
Segments
.
Build the Team – Integrate Lines of Business
Stable and strong
Compatible markets and culture
Bloom where you’re planted

Integration of Business
Lines

Customer Satisfaction
Customer
Satisfaction
Easy to Do
Business
With
Product Design
& Pricing
Service
Quality
Up to Date
Channel
Delivery
Convenience
Progressive Internet and
Bill pay services
Remote Capture
One size does not fit all

An Enduring Strategy
3 Year Plan
Grow the Earnings
Grow the People
Grow the Bank – Profitably through new markets
and business integration
Grow the Base – Serve customers –Enhance Image
Maximize Shareholder Value

Presented by Fran Evanitsky, CEO
Juniata Valley Financial Corp.
In Summary

Outlook for 2009
Out of our control.
FDIC deposit insurance assessments.
Potential for further declines in fair values of
equities investments leading to other-than-
temporary impairment charges.
Development of financial problems among
borrowers that may lead to loan defaults.
Juniata Valley Financial Corp.

Outlook for 2009
In our control.
Maintaining traditional sound business practices.
Supplying the members of our community with the
financial services they need.
Adhering to our basic philosophies.
Juniata Valley Financial Corp.

Our long-standing philosophies have the greatest
impact during economic conditions like those we now
face:
Juniata Valley Financial Corp.
Higher value in strong net interest margin than
in high growth rates.
Solid, repeatable non-interest revenues result
from service-focused strategies.
Continued cost controls are imperative.

An inheritance of 5 shares of Lewistown Trust Co. stock
in 1922, with a basis of $500, has grown to 5,148 shares,
valued at $85,000 today.
Another inheritance of 6,388 shares of Juniata Valley
stock was valued at $243,000 in 1993. 1,500 of those
shares were sold in 1994 for $58,500. Through stock
dividends and splits, the remaining shares have grown to
21,000 and are valued today at $346,500.
Juniata Valley Financial Corp.
Long-Term Returns on Capital and Shareholder Value

We’re
Strong,
We’re
Healthy,
We’re Here
for You
Firmly planted in Central Pennsylvania – 141 Years