Exhibit 99.1

Annual Shareholders Meeting May 16, 2017 Juniata Valley Financial Corp.

The presentation may contain “forward looking” information as defined by the Private Securities Litigation Reform Act of 1995 . When words such as “believes”, “expects”, “anticipates” or similar expressions are used in this release, Juniata Valley is making forward - looking statements . Such information is based on Juniata Valley’s current expectations, estimates and projections about future events and financial trends affecting the financial condition of its business . These statements are not historical facts or guarantees of future performance, events or results . Such statements involve potential risks and uncertainties and, accordingly, actual results may differ materially from this “forward looking” information . Many factors could affect future financial results . Juniata Valley undertakes no obligation to publicly update or revise forward looking information, whether as a result of new or updated information, future events, or otherwise . For a more complete discussion of certain risks and uncertainties affecting Juniata Valley, please see the sections entitled “Risk Factors” and “Management’s Discussion and Analysis of Financial Condition and Results of Operations – Forward - Looking Statements” set forth in the Juniata Valley’s filings with the Securities and Exchange Commission .

“ ” Shareholders’ Business Meeting Timothy I. Havice Chairman of the Board of Directors
Marcie A. Barber President and Chief Executive Officer The New Shape of Banking


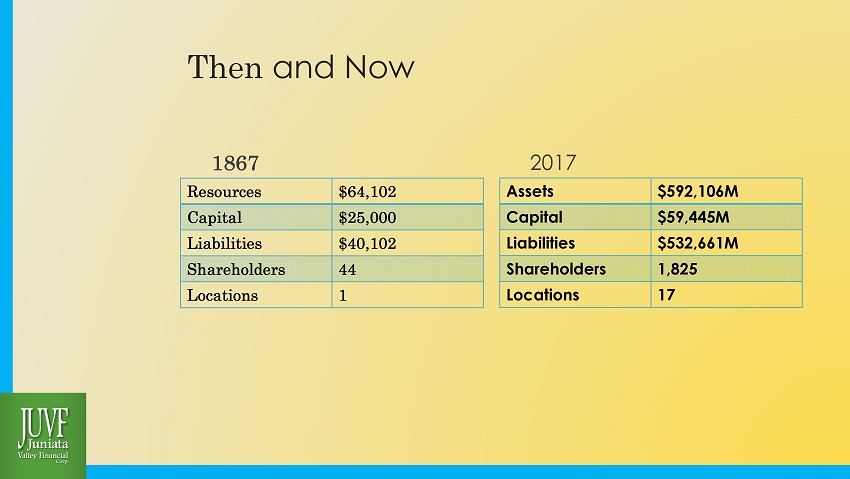
Then and Now 1867 Resources $64,102 Capital $25,000 Liabilities $40,102 Shareholders 44 Locations 1 2017 Assets $592,106M Capital $59,445M Liabilities $532,661M Shareholders 1,825 Locations 17
“ ” With hard work and determination, this 150 year - old community bank has grown, adapted and evolved into something new… JUVF is embracing the New Shape of Banking
JoAnn N. McMinn Executive Vice President and Chief Financial Officer Financial Performance

The presentation that follows contains some supplemental financial information determined by methods other than in accordance with U . S . generally accepted accounting principles (GAAP) . Some tables that follow present reconciliations of certain non - GAAP measures to the most directly comparable GAAP measures . These reconciliations exclude certain charges incurred during the years ended December 31 , 2015 and 2016 , which the Company believes do not reflect the operating performance of the Company during that period . These charges include costs associated with the acquisition of FNBPA Bancorp, Inc . There have not been similar charges prior to 2015 and, based on current information, the Company believes these charges are not reasonably likely to recur within two years . The Company’s management uses these non - GAAP measures to evaluate the performance of the Company and believes this presentation also increases the comparability of period - to - period results . The Company believes these non - GAAP measures, in addition to GAAP measures, provide useful information for investors to evaluate the Company’s results . These non - GAAP measures should not be considered a substitute for GAAP measures, nor are they necessarily comparable to non - GAAP measures that may be presented by other companies .
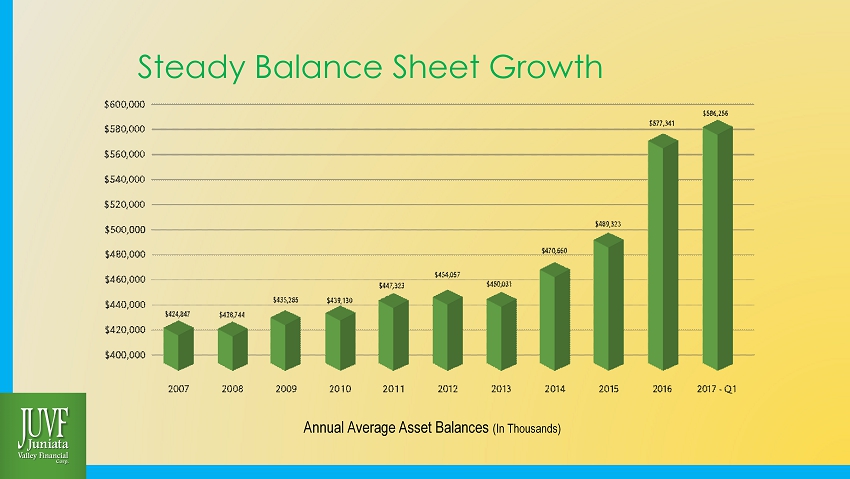
Steady Balance Sheet Growth Annual Average Asset Balances (In Thousands)

2016 – A Year of Re - Shaping Following Juniata Valley Financial Corp’s Acquisition of FNBPA Bancorp, Inc. in November 2015 Established JVB’s presence in Pennsylvania’s Northern Tier Through personal community involvement – meeting local residents and entrepreneurs Maintaining local personnel while providing centralized support Converted all operating systems to common providers Juniata Valley Financial Corp. Prepares for the new Shape of Banking Established business development boards in all market regions Senior and middle management transition and expansion Created and Re - Aligned delivery methods Customer Care Center – Social Media – Centralized Consumer Lending and Applications Introduction of JVB products to new region IDLock Accounts – Trust and Wealth Management Services – Mobile App – Business and Personal Remote Deposit On - Line Loan Applications
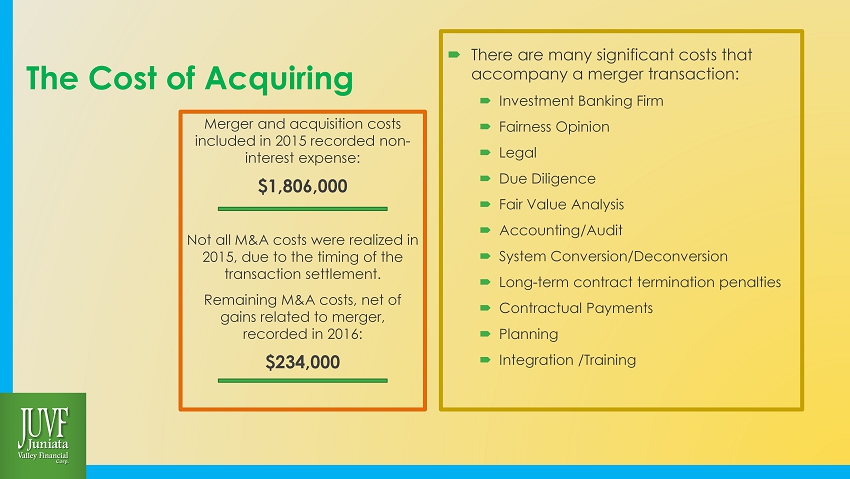
The Cost of Acquiring There are many significant costs that accompany a merger transaction: Investment Banking Firm Fairness Opinion Legal Due Diligence Fair Value Analysis Accounting/Audit System Conversion/Deconversion Long - term contract termination penalties Contractual Payments Planning Integration /Training Merger and acquisition costs included in 2015 recorded non - interest expense: $1,806,000 Not all M&A costs were realized in 2015, due to the timing of the transaction settlement. Remaining M&A costs, net of gains related to merger, recorded in 2016: $234,000

Note concerning performance comparisons * In order to provide meaningful comparisons to prior years and to peer performance, in this presentation, earnings and non - interest income and expense ratios for 2015 and 2016 will reflect the adjusted results indicated above. Non-GAAP presentation of net income and performance ratios 2015 2016 Net income, as reported 3,058,000$ 5,156,000$ Merger and acquisition costs, one-time non-recurring 1,806,000 347,000 Merger-related gain on the sale of loans - (113,000) Tax impact of merger-related items listed above (495,000) (80,000) Net income, exclusive of merger-related costs and gains, net of corresponding tax impact 4,369,000$ 5,310,000$ Return on Average Assets, as reported 0.62% 0.89% Impact of merger-related items, net of corresponding tax impact, as % of average assets 0.27% 0.03% Return on Average Assets, as adjusted for effect of merger-related items 0.89% 0.92% Return on Average Equity, as reported 5.98% 8.42% Impact of merger-related items, net of corresponding tax impact, as % of average equity 2.56% 0.26% Return on Average Equity, as adjusted for effect of merger-related items 8.54% 8.68%
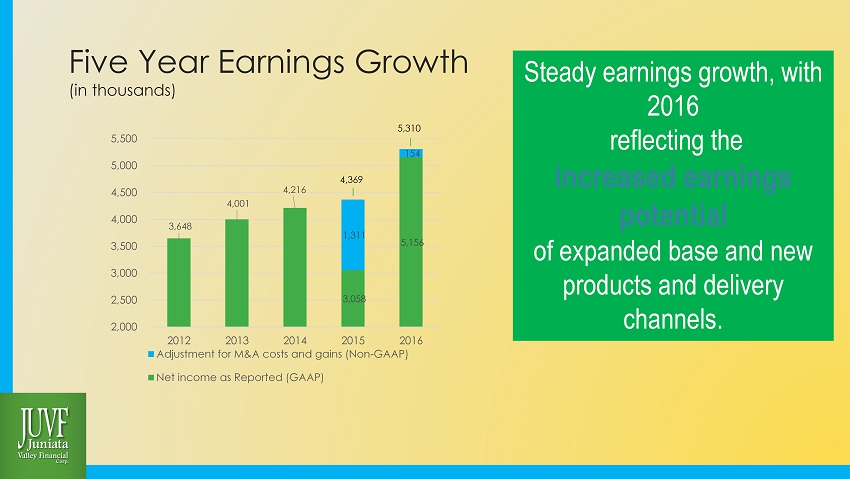
Five Year Earnings Growth (in thousands) 3,648 4,001 4,216 3,058 5,156 1,311 154 2,000 2,500 3,000 3,500 4,000 4,500 5,000 5,500 2012 2013 2014 2015 2016 Adjustment for M&A costs and gains (Non-GAAP) Net income as Reported (GAAP) Steady earnings growth, with 2016 reflecting the increased earnings potential of expanded base and new products and delivery channels. 4,369 5,310
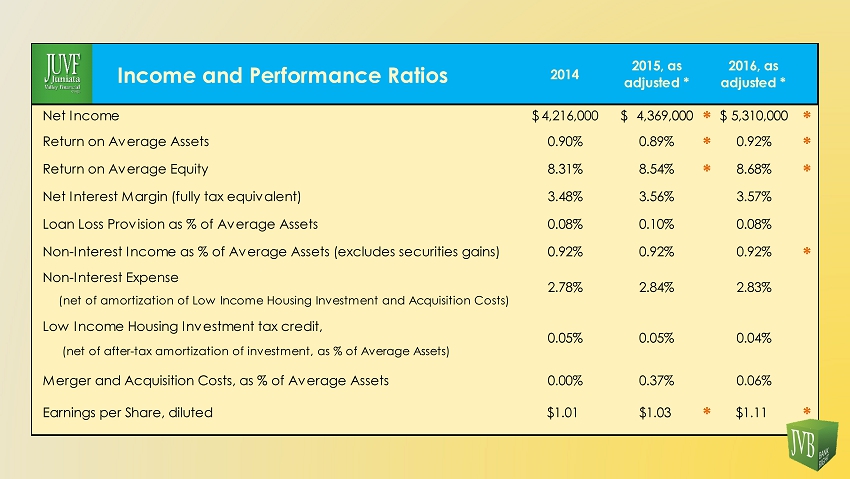
Income and Performance Ratios 2014 2015, as adjusted * 2016, as adjusted * Net Income 4,216,000$ 4,369,000$ * 5,310,000$ * Return on Average Assets 0.90% 0.89% * 0.92% * Return on Average Equity 8.31% 8.54% * 8.68% * Net Interest Margin (fully tax equivalent) 3.48% 3.56% 3.57% Loan Loss Provision as % of Average Assets 0.08% 0.10% 0.08% Non-Interest Income as % of Average Assets (excludes securities gains) 0.92% 0.92% 0.92% * Non-Interest Expense (net of amortization of Low Income Housing Investment and Acquisition Costs) Low Income Housing Investment tax credit, (net of after-tax amortization of investment, as % of Average Assets) Merger and Acquisition Costs, as % of Average Assets 0.00% 0.37% 0.06% Earnings per Share, diluted $1.01 $1.03 * $1.11 * 2.78% 2.84% 2.83% 0.05% 0.05% 0.04%
Peer Group Comparisons Important to assess our performance against other financial institutions of our relative size who are experiencing similar regulatory and compliance governance .
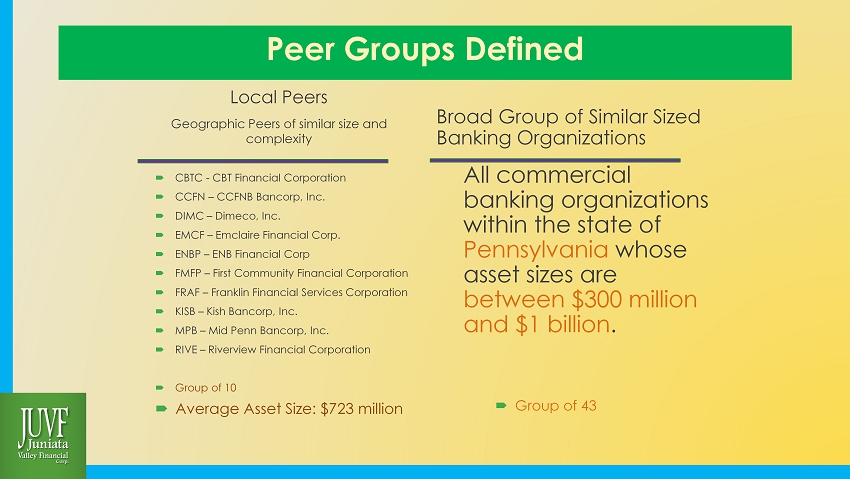
Local Peers Geographic Peers of similar size and complexity CBTC - CBT Financial Corporation CCFN – CCFNB Bancorp, Inc. DIMC – Dimeco, Inc. EMCF – Emclaire Financial Corp. ENBP – ENB Financial Corp FMFP – First Community Financial Corporation FRAF – Franklin Financial Services Corporation KISB – Kish Bancorp, Inc. MPB – Mid Penn Bancorp, Inc. RIVE – Riverview Financial Corporation Group of 10 Average Asset Size: $723 million Broad Group of Similar Sized Banking Organizations All commercial banking organizations within the state of Pennsylvania whose asset sizes are between $300 million and $1 billion . Group of 43 Peer Groups Defined
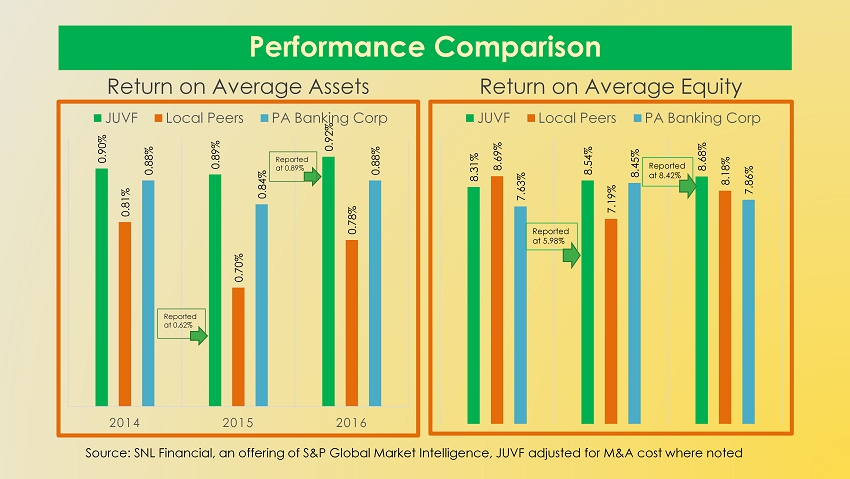
Performance Comparison Return on Average Assets 0.90% 0.89% 0.92% 0.81% 0.70% 0.78% 0.88% 0.84% 0.88% 2014 2015 2016 JUVF Local Peers PA Banking Corp Reported at 0.89% Reported at 0.62% Return on Average Equity 8.31% 8.54% 8.68% 8.69% 7.19% 8.18% 7.63% 8.45% 7.86% JUVF Local Peers PA Banking Corp Reported at 8.42% Reported at 5.98% Source: SNL Financial, an offering of S&P Global Market Intelligence, JUVF adjusted for M&A cost where noted
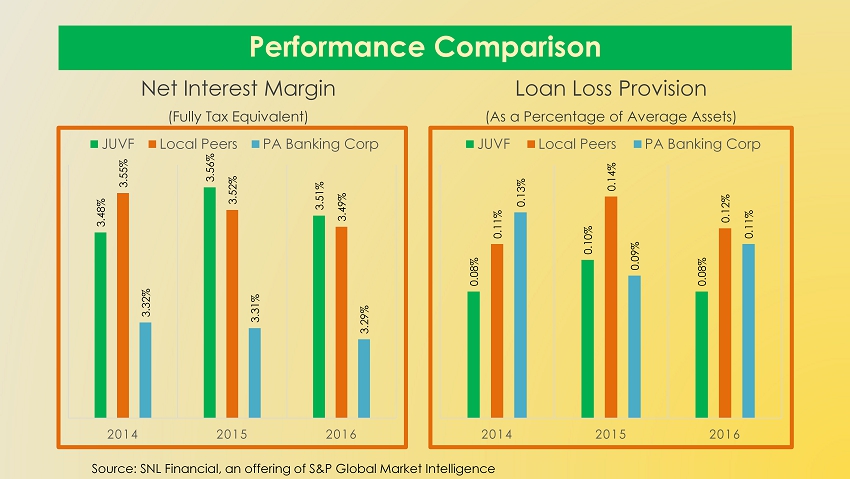
Performance Comparison Net Interest Margin (Fully Tax Equivalent) 3.48% 3.56% 3.51% 3.55% 3.52% 3.49% 3.32% 3.31% 3.29% 2014 2015 2016 JUVF Local Peers PA Banking Corp Loan Loss Provision (As a Percentage of Average Assets) 0.08% 0.10% 0.08% 0.11% 0.14% 0.12% 0.13% 0.09% 0.11% 2014 2015 2016 JUVF Local Peers PA Banking Corp Source: SNL Financial, an offering of S&P Global Market Intelligence

Performance Comparison Non - Interest Income (As a Percentage of Average Assets) 0.92% 0.92% 0.92% 0.77% 0.78% 0.76% 0.59% 0.55% 0.57% 2014 2015 2016 JUVF Local Peers PA Banking Corp Non - Interest Expense (As a Percentage of Average Assets) 2.88% 2.94% 2.92% 2.88% 2.93% 2.85% 2.54% 2.50% 2.54% 2014 2015 2016 JUVF Local Peers PA Banking Corp Source: SNL Financial, an offering of S&P Global Market Intelligence, JUVF adjusted for M&A cost where noted
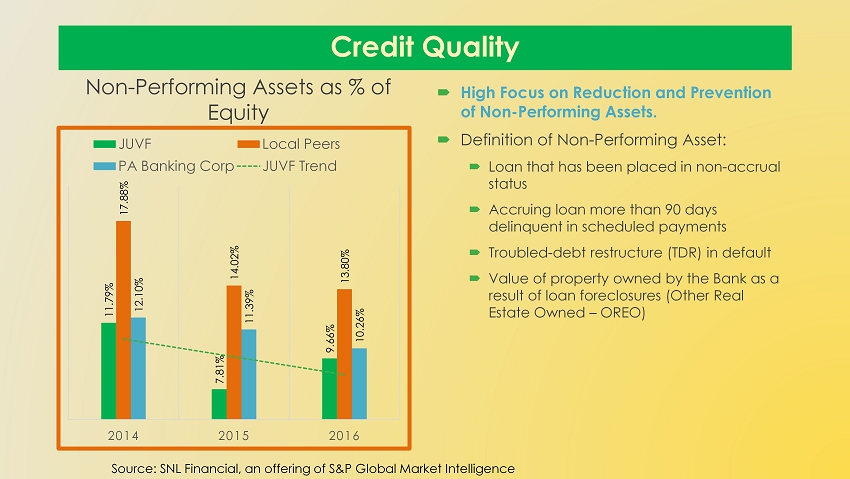
Credit Quality Non - Performing Assets as % of Equity 11.79% 7.81% 9.66% 17.88% 14.02% 13.80% 12.10% 11.39% 10.26% 2014 2015 2016 JUVF Local Peers PA Banking Corp JUVF Trend High Focus on Reduction and Prevention of Non - Performing Assets. Definition of Non - Performing Asset: Loan that has been placed in non - accrual status Accruing loan more than 90 days delinquent in scheduled payments Troubled - debt restructure (TDR) in default Value of property owned by the Bank as a result of loan foreclosures (Other Real Estate Owned – OREO) Source: SNL Financial, an offering of S&P Global Market Intelligence
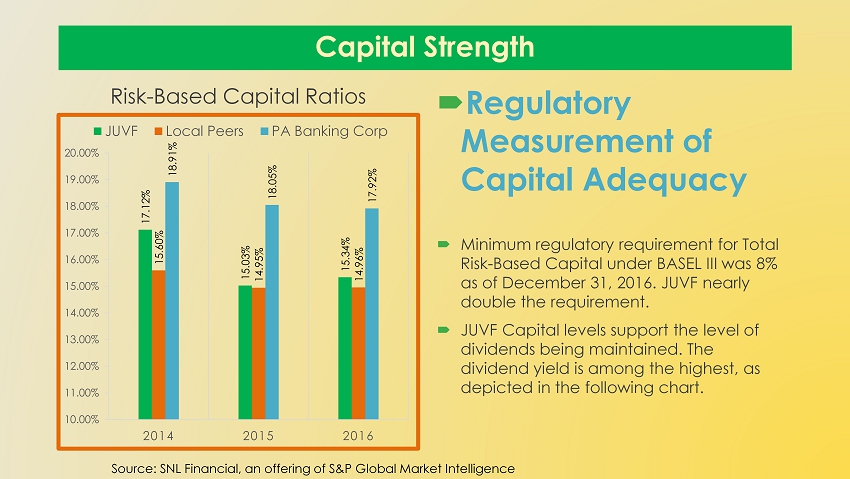
Capital Strength Risk - Based Capital Ratios 17.12% 15.03% 15.34% 15.60% 14.95% 14.96% 18.91% 18.05% 17.92% 10.00% 11.00% 12.00% 13.00% 14.00% 15.00% 16.00% 17.00% 18.00% 19.00% 20.00% 2014 2015 2016 JUVF Local Peers PA Banking Corp Regulatory Measurement of Capital Adequacy Minimum regulatory requirement for Total Risk - Based Capital under BASEL III was 8% as of December 31, 2016. JUVF nearly double the requirement. JUVF Capital levels support the level of dividends being maintained. The dividend yield is among the highest, as depicted in the following chart. Source: SNL Financial, an offering of S&P Global Market Intelligence
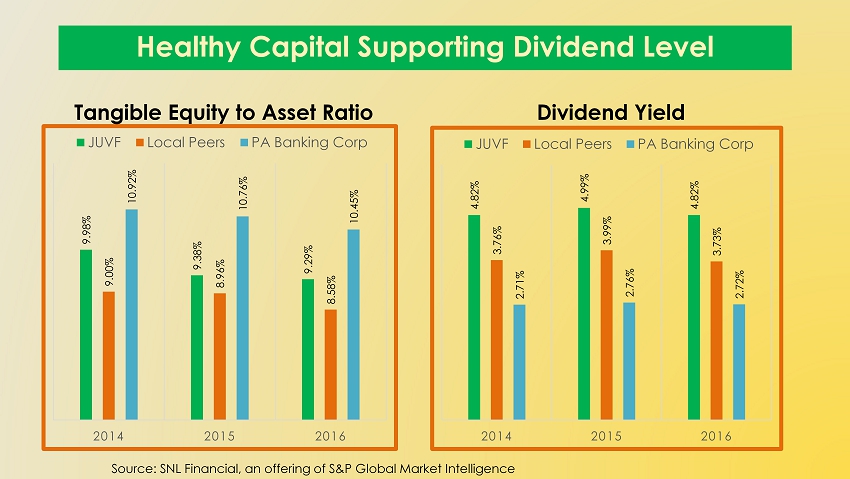
Healthy Capital Supporting Dividend Level 9.98% 9.38% 9.29% 9.00% 8.96% 8.58% 10.92% 10.76% 10.45% 2014 2015 2016 JUVF Local Peers PA Banking Corp Tangible Equity to Asset Ratio 4.82% 4.99% 4.82% 3.76% 3.99% 3.73% 2.71% 2.76% 2.72% 2014 2015 2016 JUVF Local Peers PA Banking Corp Dividend Yield Source: SNL Financial, an offering of S&P Global Market Intelligence
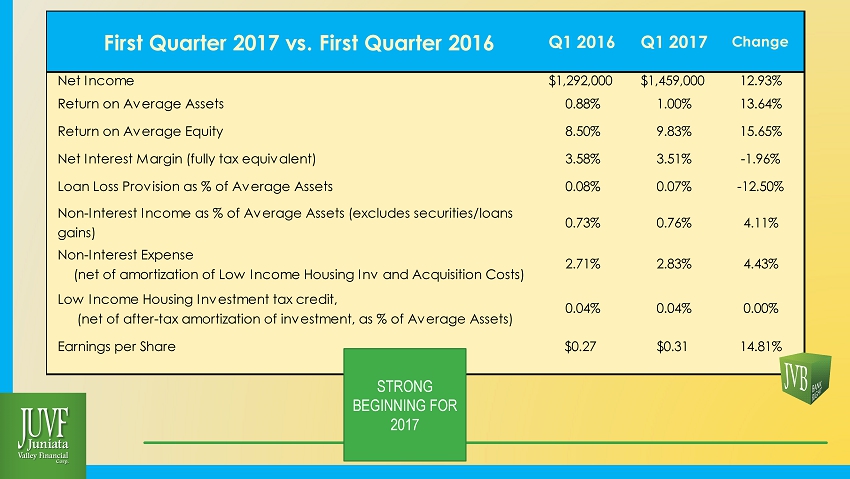
First Quarter 2017 vs. First Quarter 2016 Q1 2016 Q1 2017 Change Net Income $1,292,000 $1,459,000 12.93% Return on Average Assets 0.88% 1.00% 13.64% Return on Average Equity 8.50% 9.83% 15.65% Net Interest Margin (fully tax equivalent) 3.58% 3.51% -1.96% Loan Loss Provision as % of Average Assets 0.08% 0.07% -12.50% Non-Interest Income as % of Average Assets (excludes securities/loans gains) 0.73% 0.76% 4.11% Non-Interest Expense (net of amortization of Low Income Housing Inv and Acquisition Costs) Low Income Housing Investment tax credit, (net of after-tax amortization of investment, as % of Average Assets) Earnings per Share $0.27 $0.31 14.81% 2.71% 2.83% 4.43% 0.04% 0.04% 0.00% STRONG BEGINNING FOR 2017

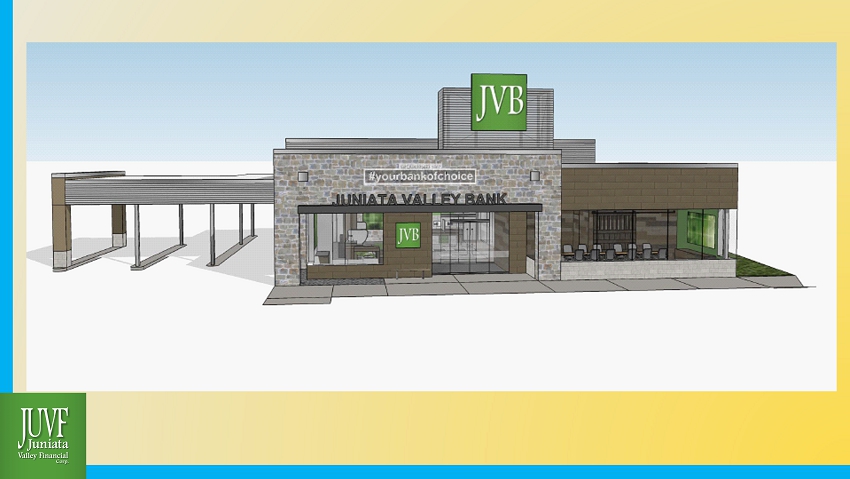
A New Shape For Customers

Customer Center Customer Centric On Boarding Problem Solving Cross - Sell On - Line Chat Remote Service


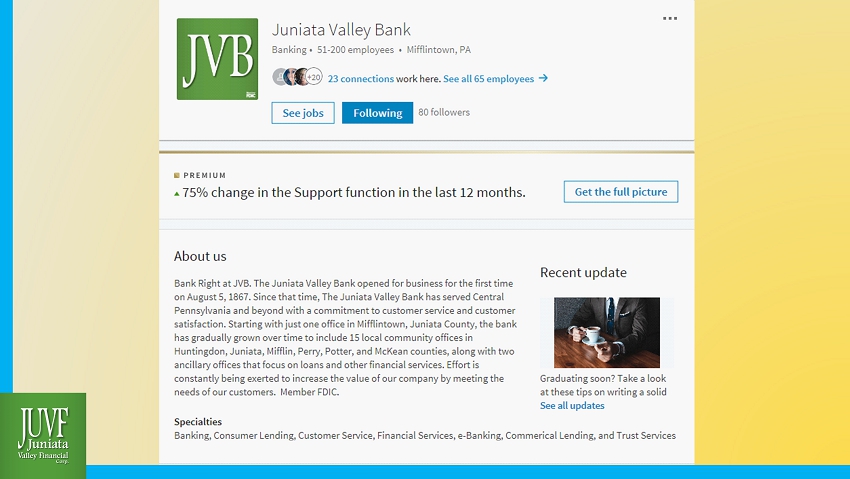
New Customer FACEBOOK Facebook Page Live - October Followers - 760 Likes – 763 Community Involvement Charity Fun Connect with Heart LinkedIn Site Live – September 81 Followers Research Decision Makers Promote Professionalism Educate Prospect Connect with Head


A New Shape for Our Team

People Find the best ones Place in the right job Train them Keep them

A New Shape For Shareholders
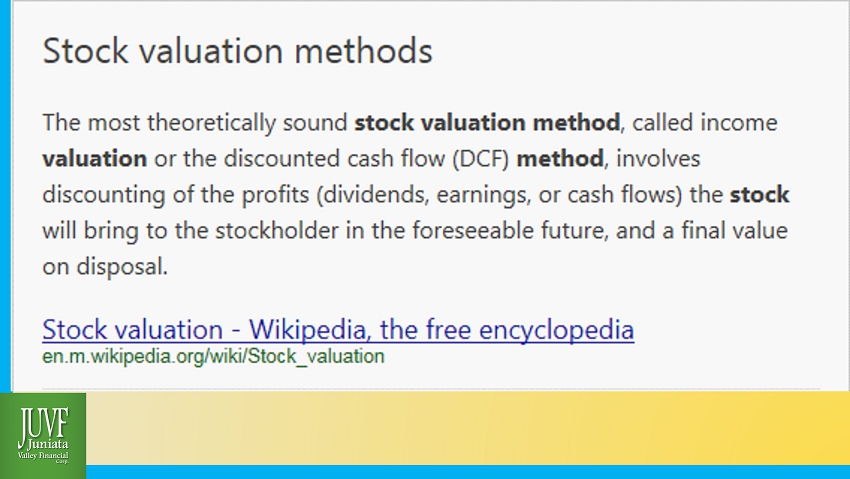

Stock Valuation Method Discounted Cash Flow Sum of Perpetuities Method

Five Year Earnings Growth (in thousands) 3,648 4,001 4,216 3,058 5,156 1,311 154 2,000 2,500 3,000 3,500 4,000 4,500 5,000 5,500 2012 2013 2014 2015 2016 Adjustment for M&A costs and gains (Non-GAAP) Net income as Reported (GAAP) Steady earnings growth, with 2016 reflecting the increased earnings potential of expanded base and new products and delivery channels. 4,369 5,310

That reminds me of…..
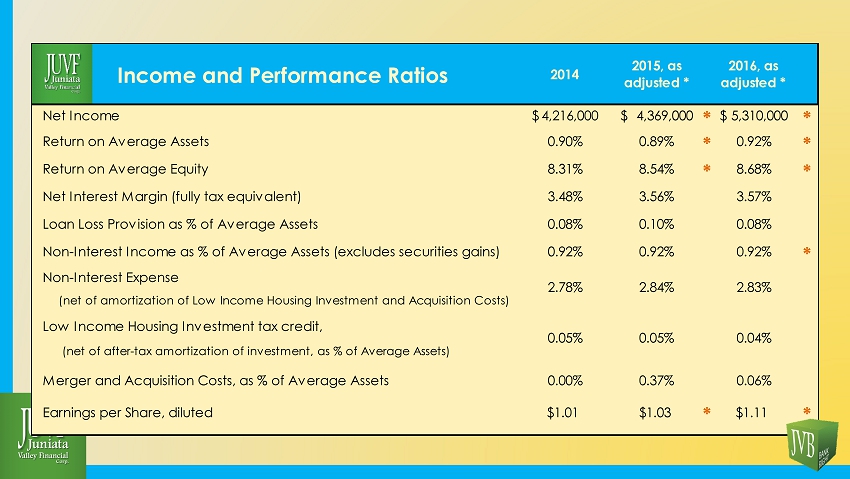
Income and Performance Ratios 2014 2015, as adjusted * 2016, as adjusted * Net Income 4,216,000$ 4,369,000$ * 5,310,000$ * Return on Average Assets 0.90% 0.89% * 0.92% * Return on Average Equity 8.31% 8.54% * 8.68% * Net Interest Margin (fully tax equivalent) 3.48% 3.56% 3.57% Loan Loss Provision as % of Average Assets 0.08% 0.10% 0.08% Non-Interest Income as % of Average Assets (excludes securities gains) 0.92% 0.92% 0.92% * Non-Interest Expense (net of amortization of Low Income Housing Investment and Acquisition Costs) Low Income Housing Investment tax credit, (net of after-tax amortization of investment, as % of Average Assets) Merger and Acquisition Costs, as % of Average Assets 0.00% 0.37% 0.06% Earnings per Share, diluted $1.01 $1.03 * $1.11 * 2.78% 2.84% 2.83% 0.05% 0.05% 0.04%