Filed by National Mercantile Bancorp and First California Financial Group, Inc.
Pursuant to Rule 425 under the Securities Act of 1933
and deemed filed pursuant to Rule 14a-12
under the Securities and Exchange Act of 1934, as amended
Commission File No.: 0-15982
Subject Companies: National Mercantile Bancorp and First California Financial Group, Inc.
The following is a copy of a slide presentation presented in connection with a June 21, 2006 conference call hosted by National Mercantile Bancorp and FCB Bancorp.
National Mercantile Bancorp and FCB Bancorp Merger of Equals Into First California Financial Group June 2006 |
Safe Harbor Statement This presentation contains forward-looking statements that are: subject to contingencies & uncertainties, not a guarantee of future performance, based on assumptions that may change, not to be relied on unduly. These include statements relating to EPS and other growth rates Accretion Costs savings Increased liquidity and visibility Many factors are beyond our ability to control or predict, including: Shareholder and regulatory approvals Interest rate volatility Impact of national/regional economy on small business loan demand Loan delinquency rates Ability of companies to retain employees and customers Acquisition synergies and cost saving Please see risk factors in MBLA’s and FCBA’s 10-K and other SEC filings. |
Additional Information The proposed merger will be submitted to the shareholders of each of National Mercantile Bancorp and FCB Bancorp for their consideration. First California Financial Group, Inc. will file a registration statement, which will include a joint proxy statement/prospectus to be sent to the shareholders of each of National Mercantile Bancorp and FCB Bancorp, and each of First California Financial Group, National Mercantile Bancorp and FCB Bancorp may file other relevant documents concerning the proposed merger with the SEC. Shareholders are urged to read the registration statement and the joint proxy statement/prospectus regarding the proposed merger when they become available and any other relevant documents filed with the SEC, as well as any amendments or supplements to those documents, because they will contain important information. You will be able to obtain a free copy of the joint proxy statement/prospectus, as well as other filings containing information about First California Financial Group, National Mercantile Bancorp and FCB Bancorp, at the SEC’s website (http://www.sec.gov). You will also be able to obtain these documents, free of charge, by accessing National Mercantile Bancorp’s website (http://www.nmbla.com) under the tab “Investor Relations”, or by accessing FCB Bancorp’s website (http://www.fcbank.com) under the tab “About Us”. National Mercantile Bancorp and FCB Bancorp and their respective directors and executive officers may be deemed to be participants in the solicitation of proxies from the shareholders of National Mercantile Bancorp and FCB Bancorp in connection with the proposed merger. Information about the directors and executive officers of National Mercantile Bancorp is set forth in the proxy statement for its 2006 annual meeting of shareholders, as filed with the SEC on April 20, 2006. Information about the directors and executive officers of FCB Bancorp is set forth in its Annual Report on Form 10-K, as filed with the SEC on March 31, 2006. Additional information regarding the interests of those participants and other persons who may be deemed participants in the transaction may be obtained by reading the joint proxy statement/prospectus regarding the proposed merger when it becomes available. You may obtain free copies of these documents as described above. |
Partnership of 2 Fast Growing Banks MBLA 11 quarters of EPS growth 1Q06 EPS increased 40% NIM 5.49% in 1Q06 NPA/Assets 0.06% Serving affluent communities LA and Orange Counties Expertise in business niche markets FCBA 25% + CAGR in loans and deposits since 2000 1Q06 EPS increased 75% NIM 5.05% in 1Q06 Total NCOs since 2000 <$500,000 Focus on small businesses LA, Ventura & Orange Counties As of March 31, 2006, compared to prior year |
Expected Transaction Benefits Enhances both banking franchises Expanded reach in fast-growing markets $1 billion in assets Appealing demographics Complementary branch locations Enhanced lending capabilities Larger legal lending limit Accretive to GAAP EPS in 2007 |
Expected Transaction Benefits Low risk transaction Modest cost savings Expanded platform for growth Strong management team Enhanced opportunities for staff Increase market cap Improve liquidity and visibility |
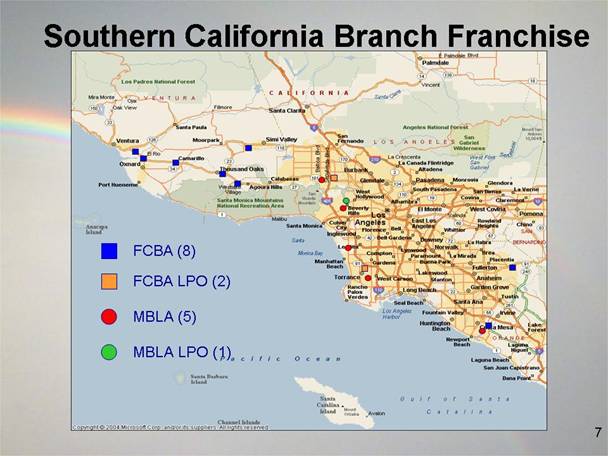
Southern California Branch Franchise FCBA (8) MBLA (5) MBLA LPO (1) FCBA LPO (2) |
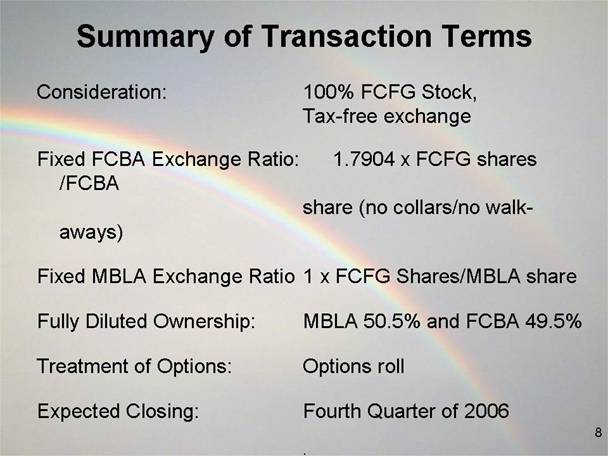
Summary of Transaction Terms Consideration: 100% FCFG Stock, Tax-free exchange Fixed FCBA Exchange Ratio: 1.7904 x FCFG shares /FCBA share (no collars/no walk-aways) Fixed MBLA Exchange Ratio 1 x FCFG Shares/MBLA share Fully Diluted Ownership: MBLA 50.5% and FCBA 49.5% Treatment of Options: Options roll Expected Closing: Fourth Quarter of 2006 . |
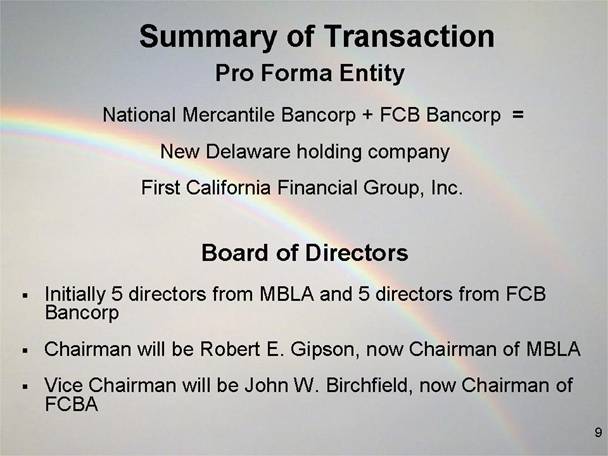
Summary of Transaction Pro Forma Entity National Mercantile Bancorp + FCB Bancorp = New Delaware holding company First California Financial Group, Inc. Board of Directors Initially 5 directors from MBLA and 5 directors from FCB Bancorp Chairman will be Robert E. Gipson, now Chairman of MBLA Vice Chairman will be John W. Birchfield, now Chairman of FCBA |
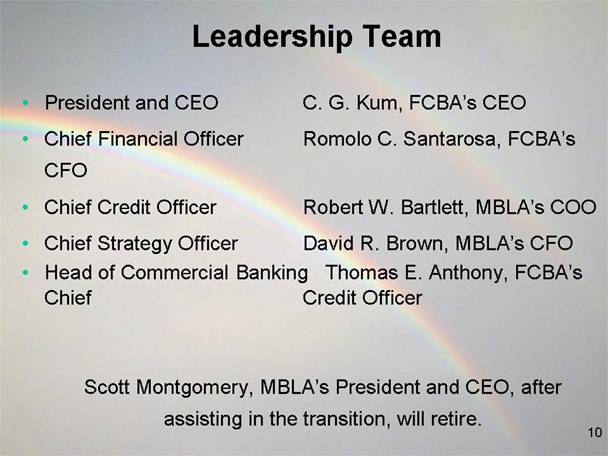
Leadership Team President and CEO C. G. Kum, FCBA’s CEO Chief Financial Officer Romolo C. Santarosa, FCBA’s CFO Chief Credit Officer Robert W. Bartlett, MBLA’s COO Chief Strategy Officer David R. Brown, MBLA’s CFO Head of Commercial Banking Thomas E. Anthony, FCBA’s Chief Credit Officer Scott Montgomery, MBLA’s President and CEO, after assisting in the transition, will retire. |
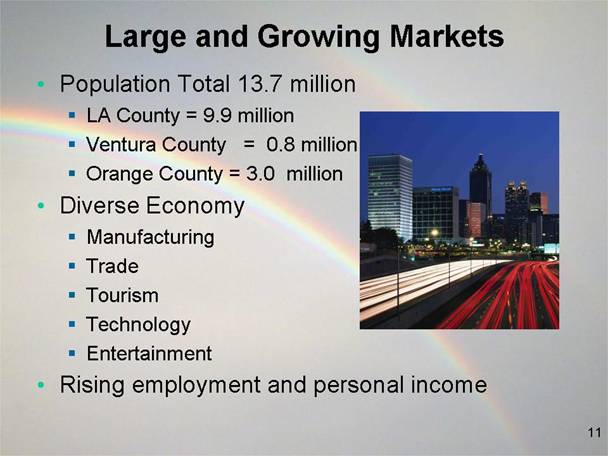
Large and Growing Markets Population Total 13.7 million LA County = 9.9 million Ventura County = 0.8 million Orange County = 3.0 million Diverse Economy Manufacturing Trade Tourism Technology Entertainment Rising employment and personal income |
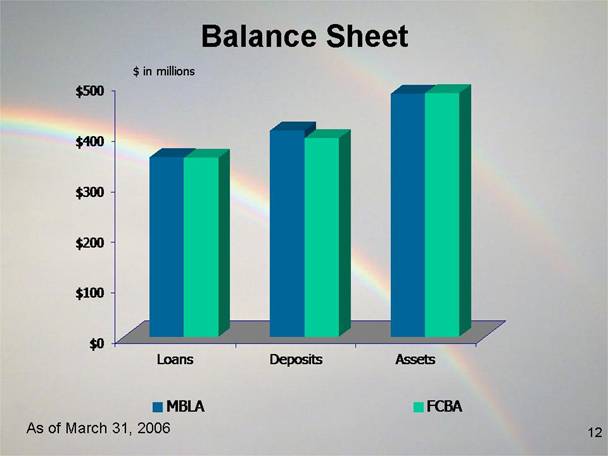
Balance Sheet $ in millions As of March 31, 2006 $0 $100 $200 $300 $4 00 $500 Loans Deposits Assets MBLA FCBA |
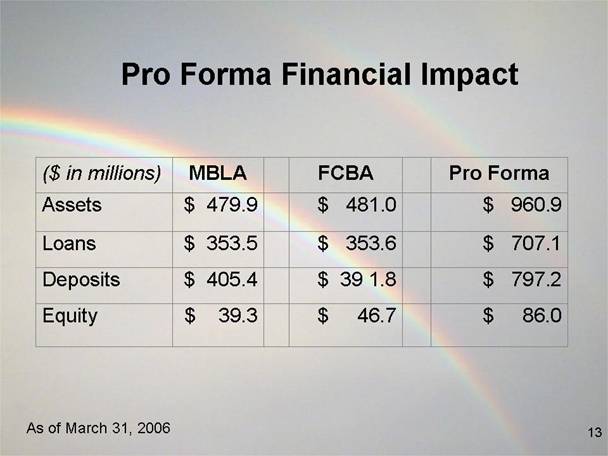
Pro Forma Financial Impact $ 46.7 $ 39 1.8 $ 353.6 $ 481.0 FCBA $ 39.3 $ 405.4 $ 353.5 $ 479.9 MBLA $ 86.0 Equity $ 797.2 Deposits $ 707.1 Loans $ 960.9 Assets Pro Forma ($ in millions) As of March 31, 2006 |
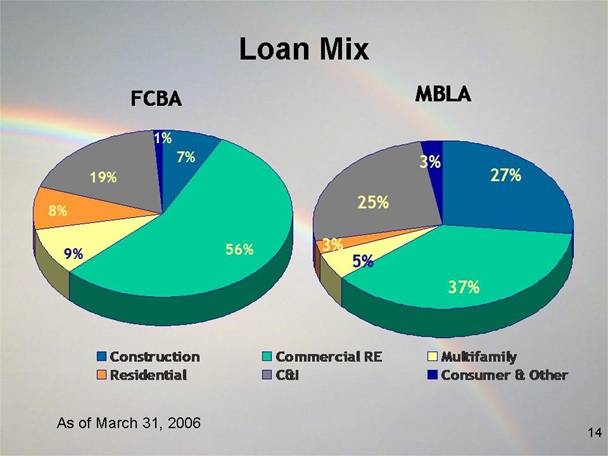
Loan Mix As of March 31, 2006 MBLA 3% 3% 25% 5% 27% 37% Construction Commercial RE Multifamily Residential C&IConsumer & Other FCBA 1% 19% 7% 56% 9% 8% |
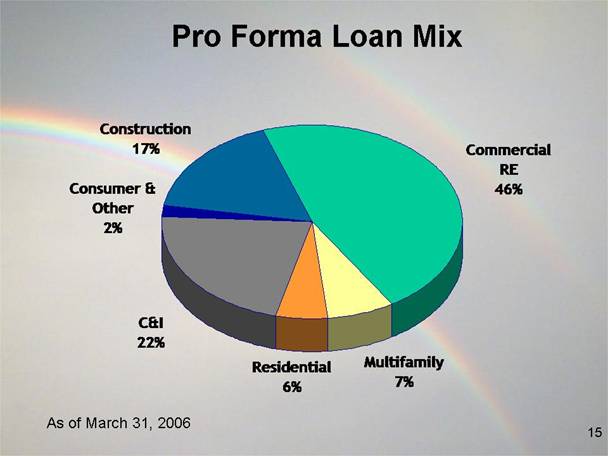
Pro Forma Loan Mix As of March 31, 2006 Construction 17% Multifamily 7% Residential 6% Consumer & Other2% Commercial RE 46%C&I 22% |
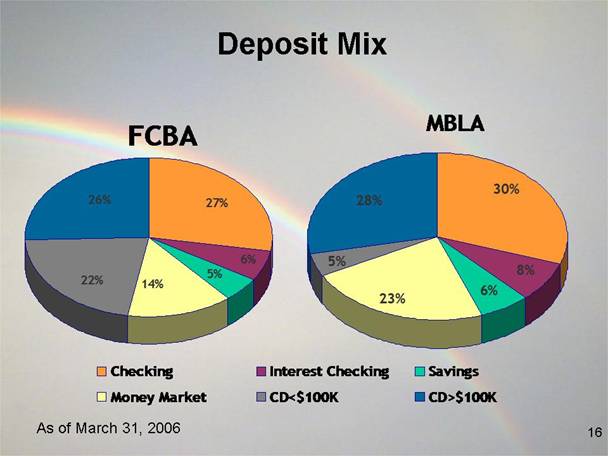
Deposit Mix As of March 31, 2006 MBLA 28% 5% 23% 8% 30% 6% Checking Interest Checking Savings Money Market CD<$100K CD>$100K FCBA 26% 14% 22% 27% 6% 5% |
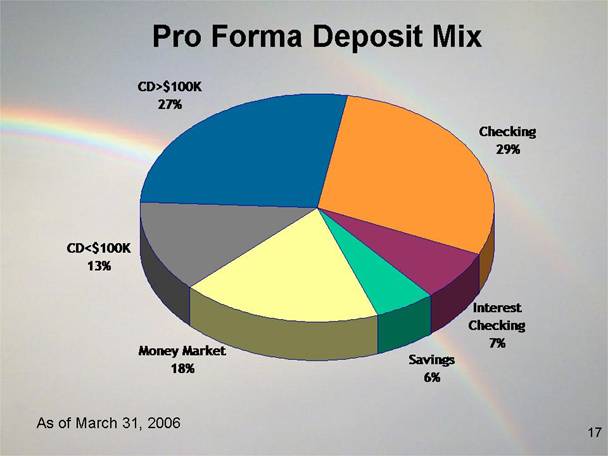
Pro Forma Deposit Mix As of March 31, 2006 Checking 29% Savings 6% CD>$100K 27% Interest Checking 7% Money Market 18% CD<$100K 13% |
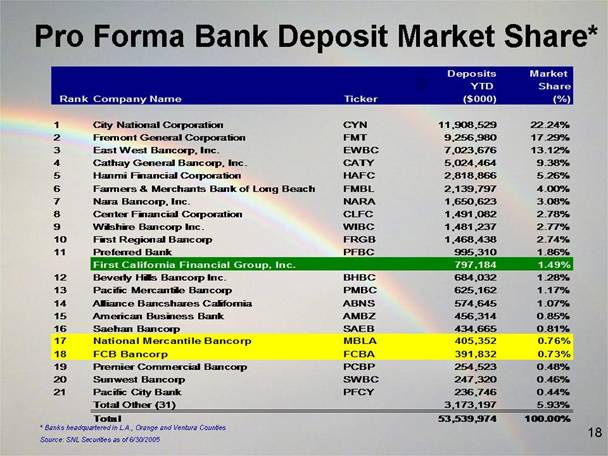
Pro Forma Bank Deposit Market Share* * Banks headquartered in L.A., Orange and Ventura Counties Source: SNL Securities as of 6/30/2005 Deposits Market Industry Branches YTD Share Rank Company Name Ticker Type Count ($000) (%) 1 City National Corporation CYN Bank 58 11,908,529 22.24% 2 Fremont General Corporation FMT Bank 21 9,256,980 17.29% 3 East West Bancorp, Inc. EWBC Bank 63 7,023,676 13.12% 4 Cathay General Bancorp, Inc. CATY Bank 43 5,024,464 9.38% 5 Hanmi Financial Corporation HAFC Bank 22 2,818,866 5.26% 6 Farmers & Merchants Bank of Long Beach FMBL Bank 20 2,139,797 4.00% 7& nbsp;Nara Bancorp, Inc. NARA Bank 20 1,650,623 3.08% 8 Center Financial Corporation CLFC Bank 18 1,491,082 2.78% 9 Wilshire Bancorp Inc. WIBC Bank 18 1,481,237 2.77% 10 First Regional Bancorp FRGB Bank 8 1,468,438 2.74% 11 Preferred Bank PFBC Bank 11 995,310 1.86% First California Financial Group, Inc. Bank 15 797,184 1.49% 12 Beverly Hills Bancorp Inc. BHBC Bank 2 684,032 1.28% 13 Pacific Mercantile Bancorp PMBC Bank 10 625,162 1.17% 14 Alliance Bancshares California ABNS Bank 4 574,645 1.07% 15 American Business Bank AMBZ Bank 1 456,314 0.85% 16 Saehan Bancorp SAEB Bank 8 434,665 0.81% 17 National Mercantile Bancorp MBLA Bank 4 405,352 0.76% 18 FCB Bancorp FCBA Bank 11 391,832 0.73% 19 ;Premier Commercial Bancorp PCBP Bank 1 254,523 0.48% 20 Sunwest Bancorp SWBC Bank 4 247,320 0.46% 21 Pacific City Bank PFCY Bank 1 236,746 0.44% Total Other (31) 65 3,173,197 5.93% Total 428 53,539,974 100.00% Deposits Market Industry Branches YTD Share Rank Company Name Ticker Type Count ($000) (%) 1 City National Corporation CYN Bank 58 11,908,529 22.24% 2 Fremont General Corporation FMT Bank 21 9,256,980 17.29% 3 East West Bancorp, Inc. EWBC Bank 63 7,023,676 13.12% 4 Cathay General Bancorp, Inc. CATY Bank 43 5,024,464 9.38% 5 Hanmi Financial Corporation HAFC Bank 22 2,818,866 5.26% 6 Farmers & Merchants Bank of Long Beach FMBL Bank 20 2,139,797 4.00% 7& nbsp;Nara Bancorp, Inc. NARA Bank 20 1,650,623 3.08% 8 Center Financial Corporation CLFC Bank 18 1,491,082 2.78% 9 Wilshire Bancorp Inc. WIBC Bank 18 1,481,237 2.77% 10 First Regional Bancorp FRGB Bank 8 1,468,438 2.74% 11 Preferred Bank PFBC Bank 11 995,310 1.86% First California Financial Group, Inc. Bank 15 797,184 1.49% 12 Beverly Hills Bancorp Inc. BHBC Bank 2 684,032 1.28% 13 Pacific Mercantile Bancorp PMBC Bank 10 625,162 1.17% 14 Alliance Bancshares California ABNS Bank 4 574,645 1.07% 15 American Business Bank AMBZ Bank 1 456,314 0.85% 16 Saehan Bancorp SAEB Bank 8 434,665 0.81% 17 National Mercantile Bancorp MBLA Bank 4 405,352 0.76% 18 FCB Bancorp FCBA Bank 11 391,832 0.73% 19 ;Premier Commercial Bancorp PCBP Bank 1 254,523 0.48% 20 Sunwest Bancorp SWBC Bank 4 247,320 0.46% 21 Pacific City Bank PFCY Bank 1 236,746 0.44% Total Other (31) 65 3,173,197 5.93% Total 428 53,539,974 100.00% |
Enhances banking franchise Low risk transaction Expected to be accretive to EPS Diversifies and expands lending capacity Increases presence in fast-growing So. Cal. market Transaction Summary |
Thank You |