
Keefe Bruyette & Woods Boston Bank Conference February 26, 2014

This presentation contains forward-looking statements within the meaning of the Private Securities Litigation Reform Act of 1995. Congress passed the Private Securities Litigation Act of 1995 in an effort to encourage corporations to provide information about companies’ anticipated future financial performance. This act provides a safe harbor for such disclosure, which protects the companies from unwarranted litigation if actual results are different from management expectations. This release contains forward looking statements within the meaning of the Private Securities Litigation Reform Act, and reflects management’s current views and estimates of future economic circumstances, industry conditions, company performance, and financial results. These forward looking statements are subject to a number of factors and uncertainties which could cause Renasant’s, M&F’s or the combined company’s actual results and experience to differ from the anticipated results and expectations expressed in such forward looking statements. Forward looking statements speak only as of the date they are made and neither Renasant nor M&F assumes any duty to update forward looking statements. In addition to factors previously disclosed in Renasant’s and M&F’s reports filed with the SEC and those identified elsewhere in presentation, these forward- looking statements include, but are not limited to, statements about (i) the expected benefits of the transaction between Renasant and M&F and between Renasant Bank and Merchants and Farmers Bank, including future financial and operating results, cost savings, enhanced revenues and the expected market position of the combined company that may be realized from the transaction, and (ii) Renasant and M&F’s plans, objectives, expectations and intentions and other statements contained in this presentation that are not historical facts. Other statements identified by words such as “expects,” “anticipates,” “intends,” “plans,” “believes,” “seeks,” “estimates,” “targets,” “projects” or words of similar meaning generally are intended to identify forward-looking statements. These statements are based upon the current beliefs and expectations of Renasant’s and M&F’s management and are inherently subject to significant business, economic and competitive risks and uncertainties, many of which are beyond their respective control. In addition, these forward-looking statements are subject to assumptions with respect to future business strategies and decisions that are subject to change. Actual results may differ materially from those indicated or implied in the forward-looking statements. 2
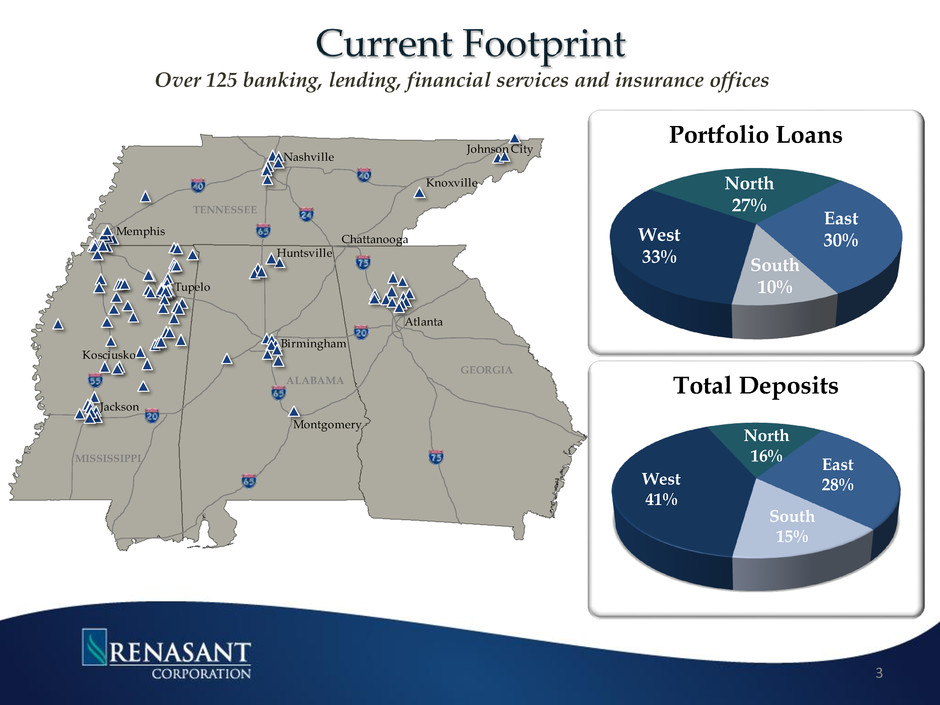
Over 125 banking, lending, financial services and insurance offices 3 West 33% North 27% East 30% South 10% Portfolio Loans West 41% North 16% East 28% South 15% Total Deposits Tupelo Nashville Atlanta Birmingham Huntsville Montgomery Jackson Memphis Kosciusko Chattanooga Johnson City Knoxville GEORGIA ALABAMA MISSISSIPPI TENNESSEE
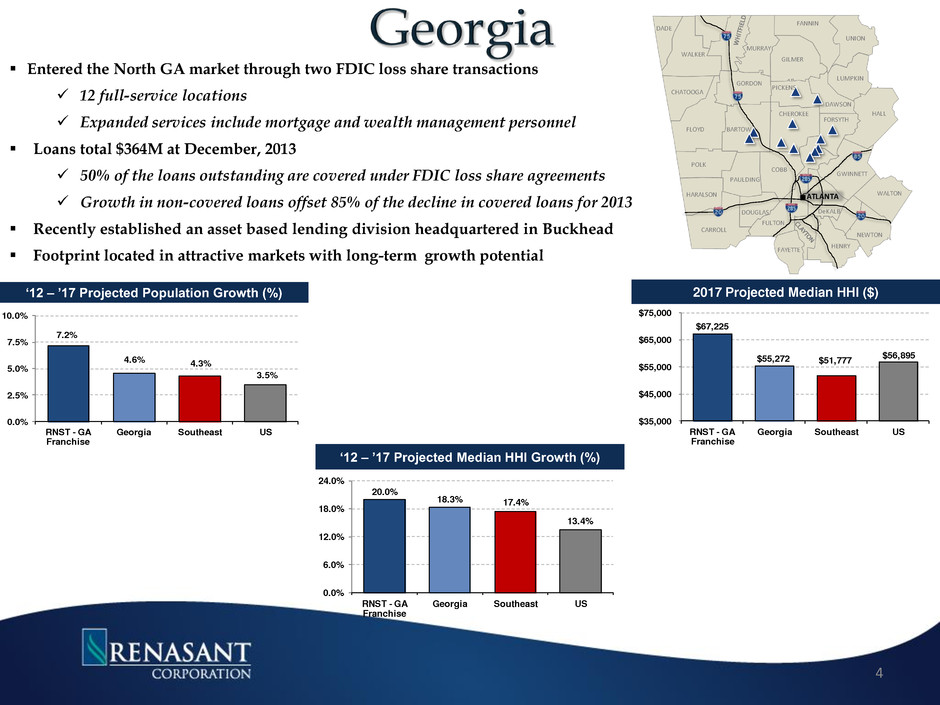
DADE WALKER CHATOOGA FLOYD POLK HARALSON CARROLL DOUGLAS FULTON FAYETTE HENRY NEWTON WALTON GWINNETT HALL LUMPKIN UNION FANNIN GILMER MURRAY GORDON BARTOW PICKENS CHEROKEE PAULDING COBB DeKALB FORSYTH DAWSON ATLANTA Entered the North GA market through two FDIC loss share transactions 12 full-service locations Expanded services include mortgage and wealth management personnel Loans total $364M at December, 2013 50% of the loans outstanding are covered under FDIC loss share agreements Growth in non-covered loans offset 85% of the decline in covered loans for 2013 Recently established an asset based lending division headquartered in Buckhead Footprint located in attractive markets with long-term growth potential 4 ‘12 – ’17 Projected Population Growth (%) 7.2% 4.6% 4.3% 3.5% 0.0% 2.5% 5.0% 7.5% 10.0% RNST - GA Franchise Georgia Southeast US ‘12 – ’17 Projected Median HHI Growth (%) 20.0% 18.3% 17.4% 13.4% 0.0% 6.0% 12.0% 18.0% 24.0% RNST - GA Franchise Georgia Southeast US 2017 Projected Median HHI ($) $67,225 $55,272 $51,777 $56,895 $35,000 $45,000 $55,000 $65,000 $75,000 RNST - GA Franchise Georgia Southeast US

• Entered the Montgomery and Tuscaloosa markets during late 3Q11 with the hiring of an experienced management team well entrenched in the respective markets • Acquired RBC Bank USA’s Birmingham, AL Trust unit on Sept 1, 2011 with assets under management of $680M Account retention exceeded 95% • Birmingham leads the state in the health care industry with an annual payroll of approximately $2.9B, followed by Huntsville with $998M • With an unemployment rate of 5.8% Metro Birmingham is ranked number 8 out of top 50 MSA’s • All three auto makers (Honda, Hyundai, Mercedes-Benz) are adding employees to keep pace with demand • Y-O-Y net loan growth was 6.1% at 4Q13, with loan growth occurring in 14 out of the last 15 quarters • Merger with First M&F provided approximately $122M in loans, $160M in deposits and 4 branch locations 5 Montgomery Huntsville Birmingham
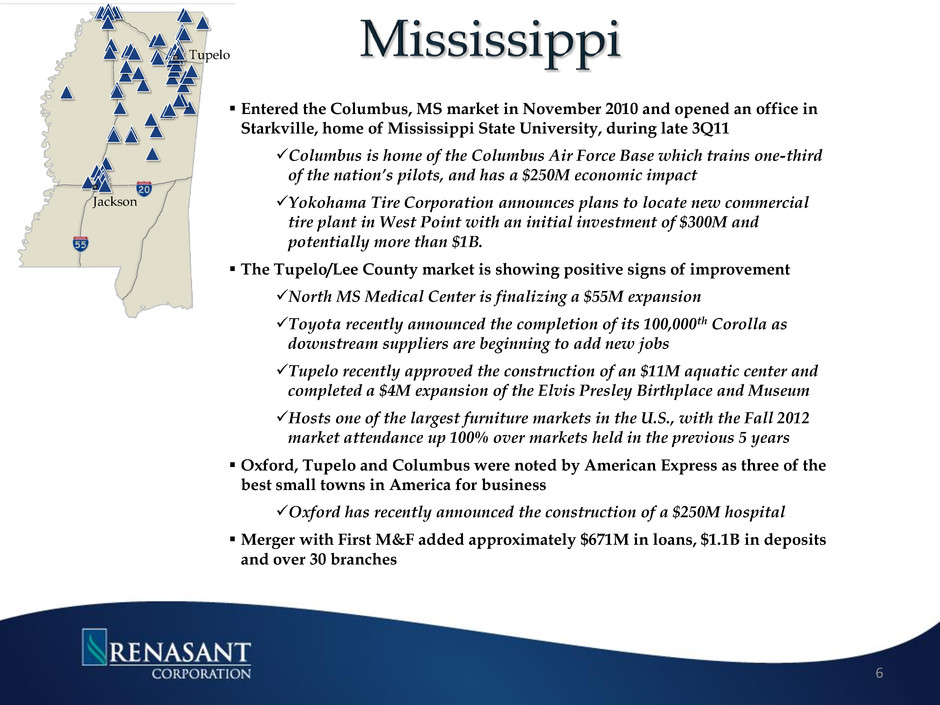
Entered the Columbus, MS market in November 2010 and opened an office in Starkville, home of Mississippi State University, during late 3Q11 Columbus is home of the Columbus Air Force Base which trains one-third of the nation’s pilots, and has a $250M economic impact Yokohama Tire Corporation announces plans to locate new commercial tire plant in West Point with an initial investment of $300M and potentially more than $1B. The Tupelo/Lee County market is showing positive signs of improvement North MS Medical Center is finalizing a $55M expansion Toyota recently announced the completion of its 100,000th Corolla as downstream suppliers are beginning to add new jobs Tupelo recently approved the construction of an $11M aquatic center and completed a $4M expansion of the Elvis Presley Birthplace and Museum Hosts one of the largest furniture markets in the U.S., with the Fall 2012 market attendance up 100% over markets held in the previous 5 years Oxford, Tupelo and Columbus were noted by American Express as three of the best small towns in America for business Oxford has recently announced the construction of a $250M hospital Merger with First M&F added approximately $671M in loans, $1.1B in deposits and over 30 branches 6 Jackson Tupelo
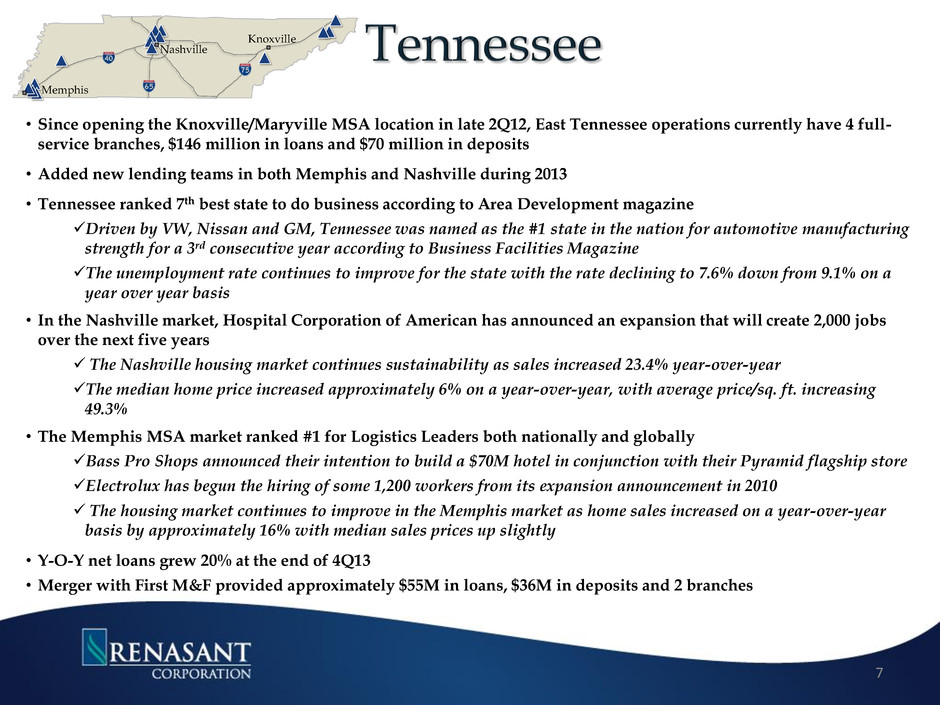
• Since opening the Knoxville/Maryville MSA location in late 2Q12, East Tennessee operations currently have 4 full- service branches, $146 million in loans and $70 million in deposits • Added new lending teams in both Memphis and Nashville during 2013 • Tennessee ranked 7th best state to do business according to Area Development magazine Driven by VW, Nissan and GM, Tennessee was named as the #1 state in the nation for automotive manufacturing strength for a 3rd consecutive year according to Business Facilities Magazine The unemployment rate continues to improve for the state with the rate declining to 7.6% down from 9.1% on a year over year basis • In the Nashville market, Hospital Corporation of American has announced an expansion that will create 2,000 jobs over the next five years The Nashville housing market continues sustainability as sales increased 23.4% year-over-year The median home price increased approximately 6% on a year-over-year, with average price/sq. ft. increasing 49.3% • The Memphis MSA market ranked #1 for Logistics Leaders both nationally and globally Bass Pro Shops announced their intention to build a $70M hotel in conjunction with their Pyramid flagship store Electrolux has begun the hiring of some 1,200 workers from its expansion announcement in 2010 The housing market continues to improve in the Memphis market as home sales increased on a year-over-year basis by approximately 16% with median sales prices up slightly • Y-O-Y net loans grew 20% at the end of 4Q13 • Merger with First M&F provided approximately $55M in loans, $36M in deposits and 2 branches 7 Nashville Memphis Knoxville
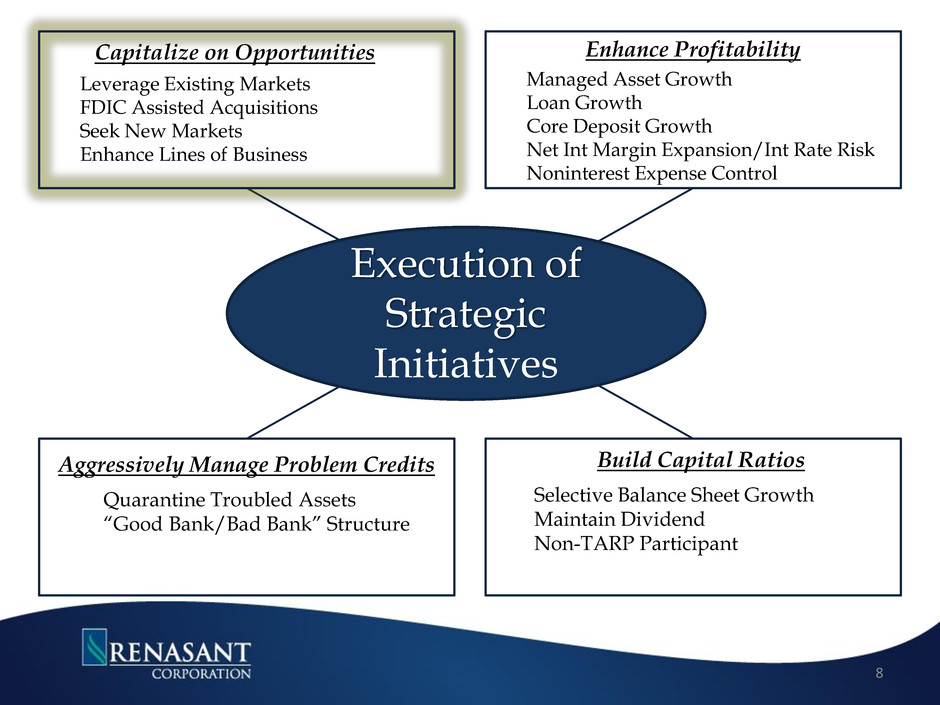
Capitalize on Opportunities Leverage Existing Markets FDIC Assisted Acquisitions Seek New Markets Enhance Lines of Business Build Capital Ratios Selective Balance Sheet Growth Maintain Dividend Non-TARP Participant Enhance Profitability Managed Asset Growth Loan Growth Core Deposit Growth Net Int Margin Expansion/Int Rate Risk Noninterest Expense Control Execution of Strategic Initiatives Aggressively Manage Problem Credits Quarantine Troubled Assets “Good Bank/Bad Bank” Structure 8
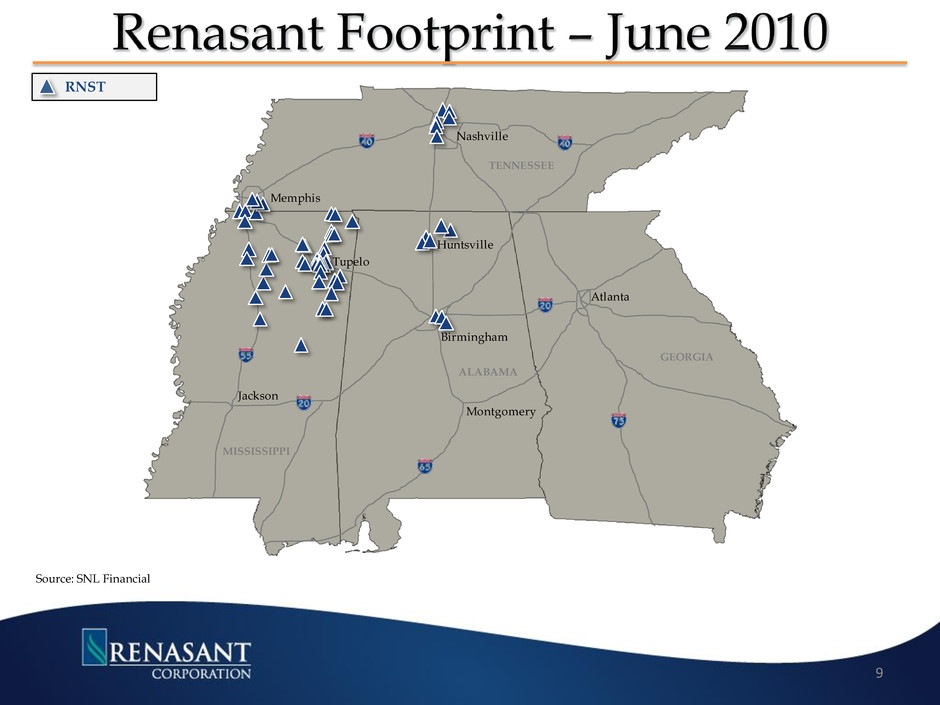
RNST Nashville Memphis TENNESSEE Tupelo Jackson MISSISSIPPI Birmingham Huntsville Montgomery Atlanta GEORGIA ALABAMA Source: SNL Financial 9
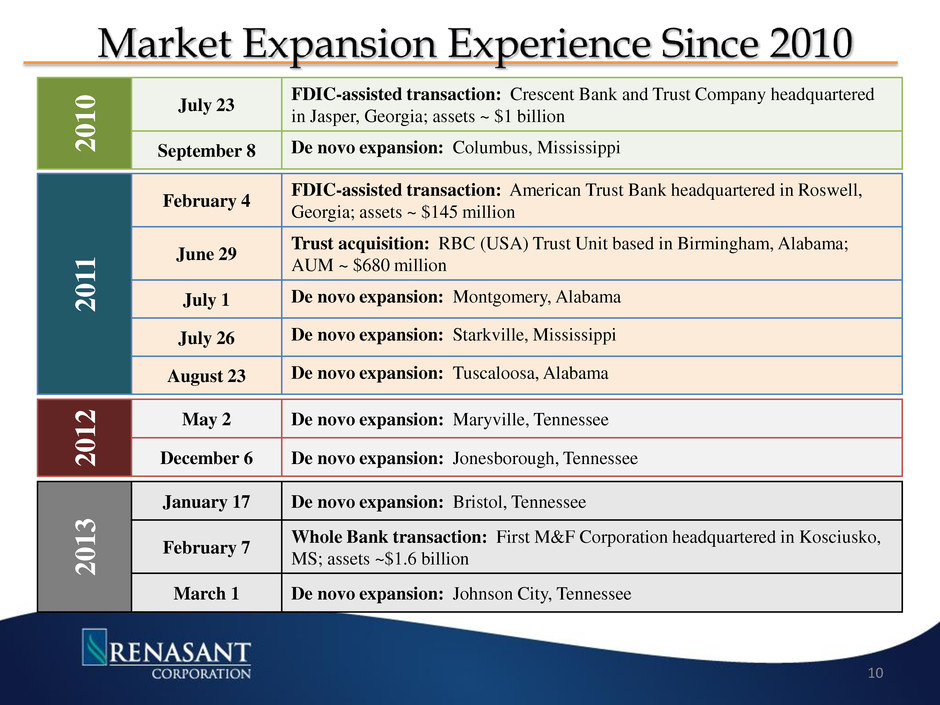
2 0 1 0 July 23 FDIC-assisted transaction: Crescent Bank and Trust Company headquartered in Jasper, Georgia; assets ~ $1 billion September 8 De novo expansion: Columbus, Mississippi 2 0 11 February 4 FDIC-assisted transaction: American Trust Bank headquartered in Roswell, Georgia; assets ~ $145 million June 29 Trust acquisition: RBC (USA) Trust Unit based in Birmingham, Alabama; AUM ~ $680 million July 1 De novo expansion: Montgomery, Alabama July 26 De novo expansion: Starkville, Mississippi August 23 De novo expansion: Tuscaloosa, Alabama 2 0 1 2 May 2 De novo expansion: Maryville, Tennessee December 6 De novo expansion: Jonesborough, Tennessee 2 0 1 3 January 17 De novo expansion: Bristol, Tennessee February 7 Whole Bank transaction: First M&F Corporation headquartered in Kosciusko, MS; assets ~$1.6 billion March 1 De novo expansion: Johnson City, Tennessee 10

Tupelo Nashville Atlanta Birmingham Huntsville Montgomery Jackson Memphis Kosciusko Chattanooga Johnson City Knoxville GEORGIA ALABAMA MISSISSIPPI TENNESSEE Source: SNL Financial, Company documents Expansions in 2010 – 2013 RNST De Novo FMFC Acquisition 11
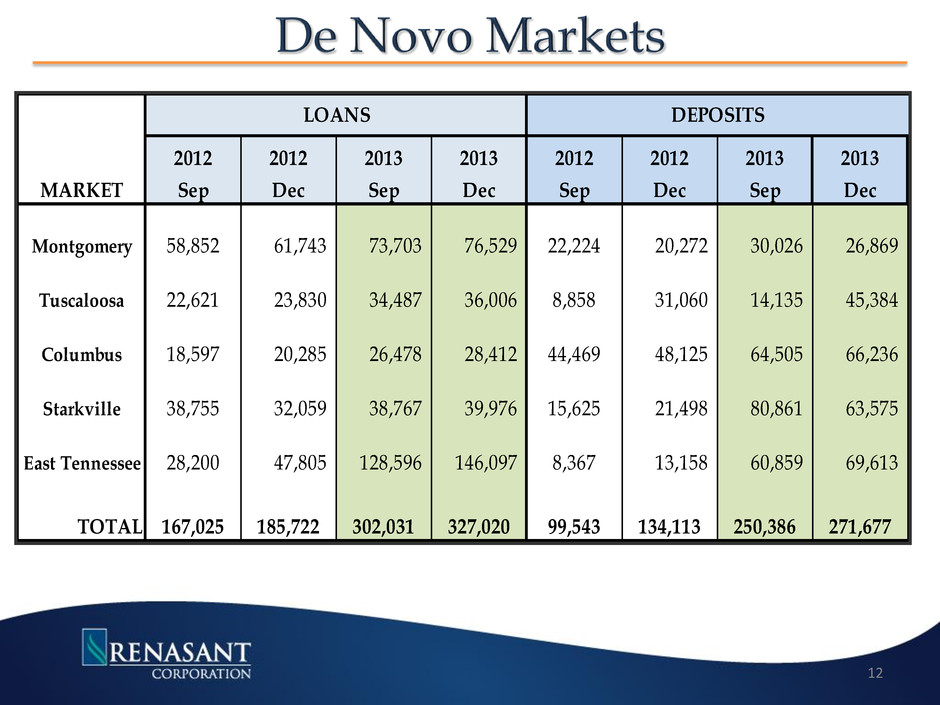
12 2012 2012 2013 2013 2012 2012 2013 2013 Sep Dec Sep Dec Sep Dec Sep Dec Montgomery 58,852 61,743 73,703 76,529 22,224 20,272 30,026 26,869 Tuscaloosa 22,621 23,830 34,487 36,006 8,858 31,060 14,135 45,384 Columbus 18,597 20,285 26,478 28,412 44,469 48,125 64,505 66,236 Starkville 38,755 32,059 38,767 39,976 15,625 21,498 80,861 63,575 East Tennessee 28,200 47,805 128,596 146,097 8,367 13,158 60,859 69,613 TOTAL 167,025 185,722 302,031 327,020 99,543 134,113 250,386 271,677 MARKET LOANS DEPOSITS

Enhance Profitability Managed Asset Growth Loan Growth Core Deposit Growth Net Int Margin Expansion/Int Rate Risk Noninterest Expense Control Execution of Strategic Initiatives Capitalize on Opportunities Leverage Existing Markets FDIC Assisted Acquisitions Seek New Markets Enhance Lines of Business Build Capital Ratios Selective Balance Sheet Growth Maintain Dividend Non-TARP Participant Aggressively Manage Problem Credits Quarantine Troubled Assets “Good Bank/Bad Bank” Structure 13
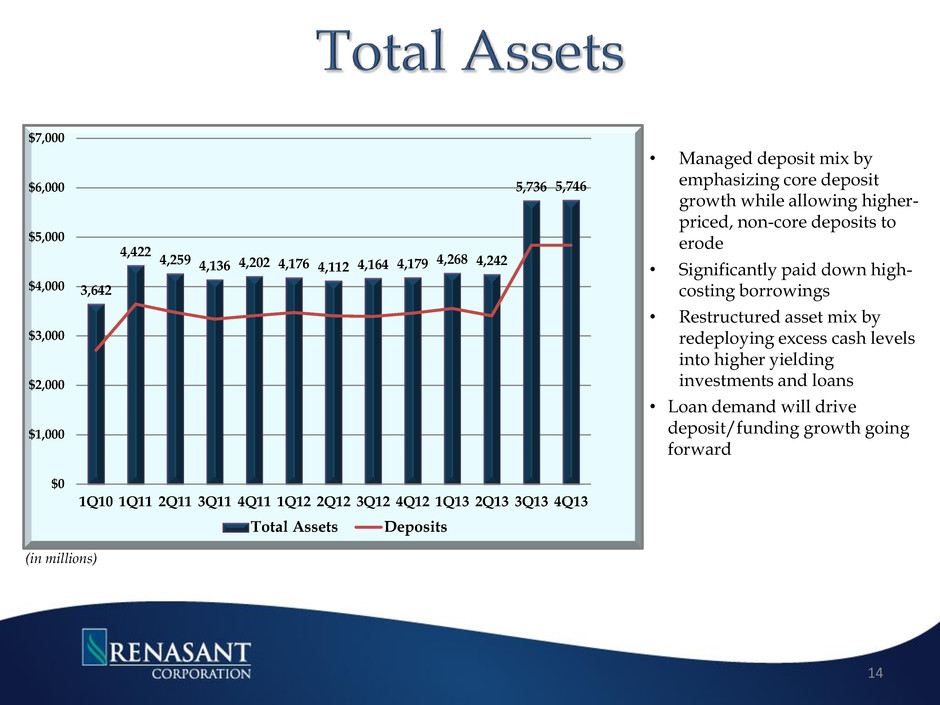
• Managed deposit mix by emphasizing core deposit growth while allowing higher- priced, non-core deposits to erode • Significantly paid down high- costing borrowings • Restructured asset mix by redeploying excess cash levels into higher yielding investments and loans • Loan demand will drive deposit/funding growth going forward 3,642 4,422 4,259 4,136 4,202 4,176 4,112 4,164 4,179 4,268 4,242 5,736 5,746 $0 $1,000 $2,000 $3,000 $4,000 $5,000 $6,000 $7,000 1Q10 1Q11 2Q11 3Q11 4Q11 1Q12 2Q12 3Q12 4Q12 1Q13 2Q13 3Q13 4Q13 Total Assets Deposits (in millions) 14

4Q10 1Q11 2Q11 3Q11 4Q11 1Q12 2Q12 3Q12 4Q12 1Q13 2Q13 3Q13 4Q13 Non- Aquired $2,191 $2,190 $2,186 $2,205 $2,242 $2,282 $2,392 $2,540 $2,573 $2,594 $2,683 $2,794 $2,886 Acquired Covered* $334 $387 $377 $360 $339 $318 $290 $260 $237 $214 $201 $196 $182 Acquired M&F - - - - - - - - - - - $891 $813 Total Loans $2,525 $2,577 $2,563 $2,565 $2,581 $2,600 $2,682 $2,800 $2,810 $2,808 $2,884 $3,881 $3,881 • Non-acquired loans increased $313M or 12% on a Y-O-Y basis • Covered loans declined $55M or 23% on a Y-O-Y basis • Company maintained strong pipelines throughout all markets which will continue to driver further loan growth $0 $500,000 $1,000,000 $1,500,000 $2,000,000 $2,500,000 $3,000,000 $3,500,000 $4,000,000 4Q10 1Q11 2Q11 3Q11 4Q11 1Q12 2Q12 3Q12 4Q12 1Q13 2Q13 3Q13 4Q13 Non-Acquired Acquired Covered Acquired M&F 15 *Covered loans are subject to loss-share agreements with FDIC
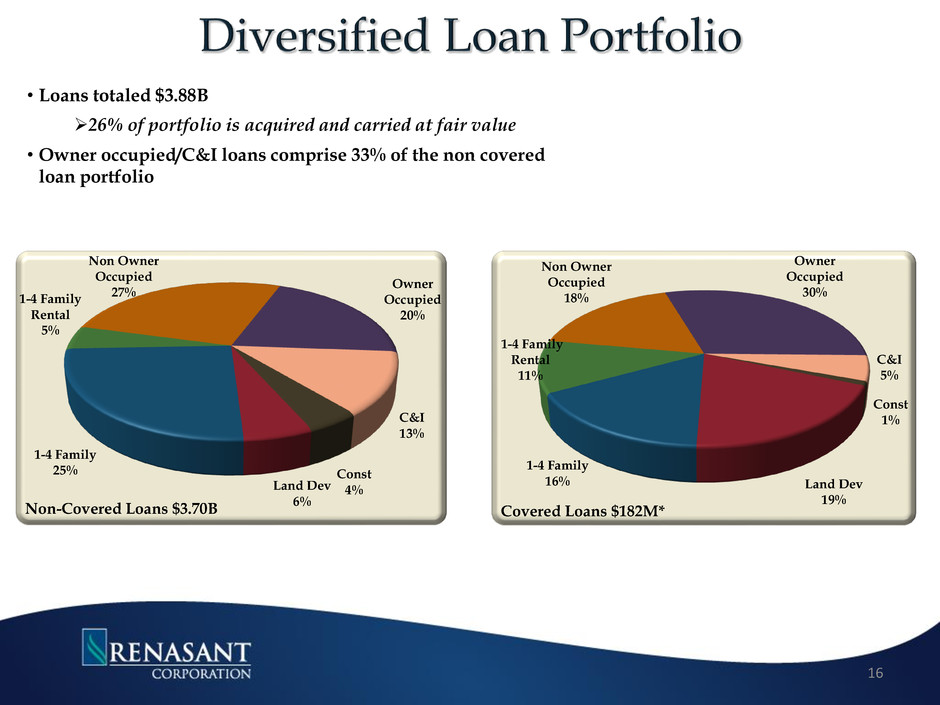
• Loans totaled $3.88B 26% of portfolio is acquired and carried at fair value • Owner occupied/C&I loans comprise 33% of the non covered loan portfolio Const 4% Land Dev 6% 1-4 Family 25% 1-4 Family Rental 5% Non Owner Occupied 27% Owner Occupied 20% C&I 13% Non-Covered Loans $3.70B Const 1% Land Dev 19% 1-4 Family 16% 1-4 Family Rental 11% Non Owner Occupied 18% Owner Occupied 30% C&I 5% Covered Loans $182M* 16

DDA 10% Other Int Bearing Accts 36% Time Deposits 39% Borrowed Funds 15% 2008 Cost of Funds 2.81% $3.28B DDA 18% Other Int Bearing Accts 48% Time Deposits 31% Borrowed Funds 3% 2013 $5.01B Cost of Funds .51% - 100,000 200,000 300,000 400,000 500,000 600,000 700,000 800,000 900,000 1,000,000 2008 2009 2010 2011 1Q12 2Q12 3Q12 4Q12 1Q13 2Q13 3Q13 4Q13 Non Interest Bearing Demand Deposits • Non-interest bearing deposits represent 18% of deposits, up from 12% at year end 2008 • Time deposits totaling $239M at WAR of 65 bps will be maturing during 1Q14 with the current repricing rate between 35-40 bps • Less reliance on borrowed funds Borrowed funds as a percentage of funding sources declined from 15% at year end 2008 to 3% at the end of 3Q13 17
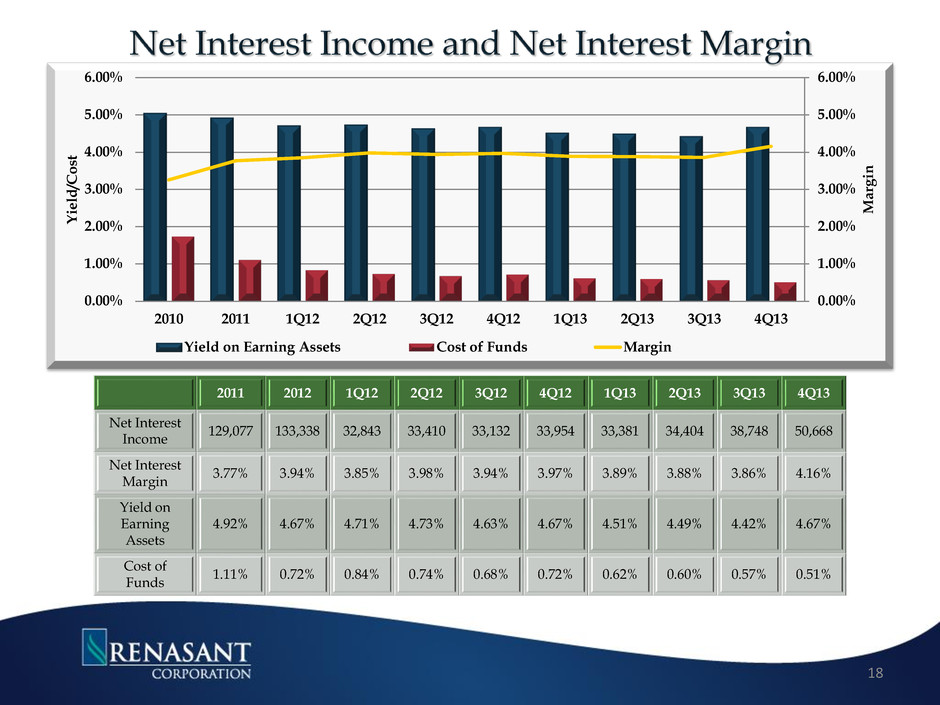
0.00% 1.00% 2.00% 3.00% 4.00% 5.00% 6.00% 0.00% 1.00% 2.00% 3.00% 4.00% 5.00% 6.00% 2010 2011 1Q12 2Q12 3Q12 4Q12 1Q13 2Q13 3Q13 4Q13 Marg in Y ie ld /C os t Yield on Earning Assets Cost of Funds Margin 2011 2012 1Q12 2Q12 3Q12 4Q12 1Q13 2Q13 3Q13 4Q13 Net Interest Income 129,077 133,338 32,843 33,410 33,132 33,954 33,381 34,404 38,748 50,668 Net Interest Margin 3.77% 3.94% 3.85% 3.98% 3.94% 3.97% 3.89% 3.88% 3.86% 4.16% Yield on Earning Assets 4.92% 4.67% 4.71% 4.73% 4.63% 4.67% 4.51% 4.49% 4.42% 4.67% Cost of Funds 1.11% 0.72% 0.84% 0.74% 0.68% 0.72% 0.62% 0.60% 0.57% 0.51% 18

34% 10% 7% 12% 29% 8% 4Q13 $18.3M Svc Chgs Insurance Mtg Gains Wealth Mgmt Fees & Comm Other • Diversified sources of noninterest income Less reliant on NSF • Opportunities for growing Non Interest Income Expansion of Trust Division Wealth Management Services into larger, metropolitan markets Expansions within our de novo operations Expansion of the Mortgage Division within new markets Fees derived from higher penetration and usage of debit cards and deposit charges *Non interest income excludes gains from securities transactions and gains from acquisitions 39% 6% 11% 5% 27% 12% 1Q08 $13.9M Svc Chgs Insurance Mtg Gains Wealth Mgmt Fees & Comm Other - 5,000 10,000 15,000 20,000 Non Interest Income* 19
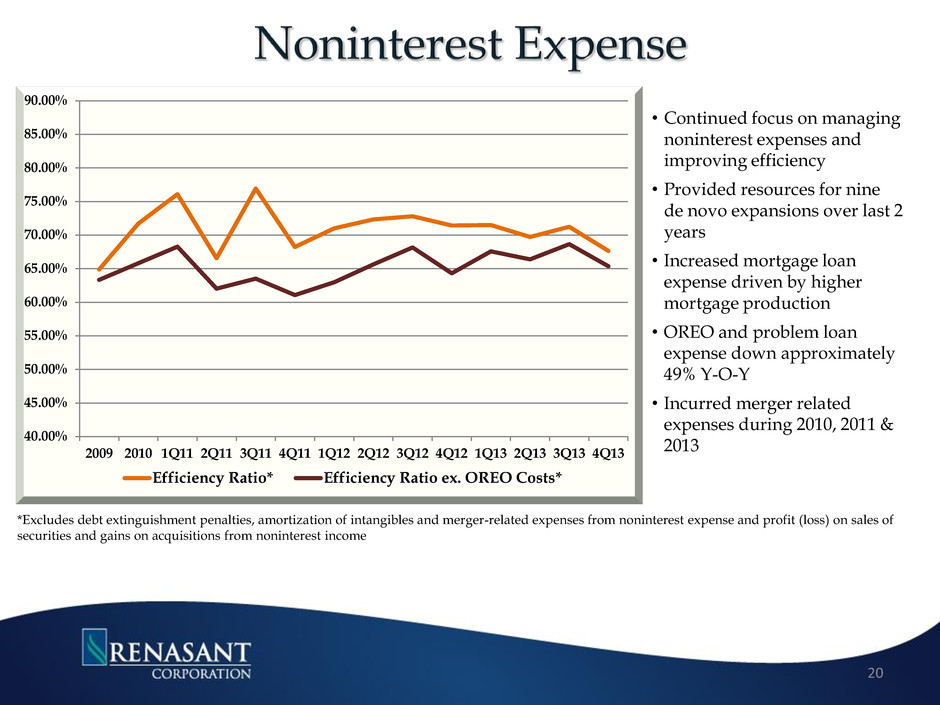
• Continued focus on managing noninterest expenses and improving efficiency • Provided resources for nine de novo expansions over last 2 years • Increased mortgage loan expense driven by higher mortgage production • OREO and problem loan expense down approximately 49% Y-O-Y • Incurred merger related expenses during 2010, 2011 & 2013 20 40.00% 45.00% 50.00% 55.00% 60.00% 65.00% 70.00% 75.00% 80.00% 85.00% 90.00% 2009 2010 1Q11 2Q11 3Q11 4Q11 1Q12 2Q12 3Q12 4Q12 1Q13 2Q13 3Q13 4Q13 Efficiency Ratio* Efficiency Ratio ex. OREO Costs* *Excludes debt extinguishment penalties, amortization of intangibles and merger-related expenses from noninterest expense and profit (loss) on sales of securities and gains on acquisitions from noninterest income

Capitalize on Opportunities Leverage Existing Markets FDIC Assisted Acquisitions Seek New Markets Enhance Lines of Business Build Capital Ratios Selective Balance Sheet Growth Maintain Dividend Non-TARP Participant Enhance Profitability Managed Asset Growth Loan Growth Core Deposit Growth Net Int Margin Expansion/Int Rate Risk Noninterest Expense Control Execution of Strategic Initiatives Aggressively Manage Problem Credits Quarantine Troubled Assets “Good Bank/Bad Bank” Structure 21
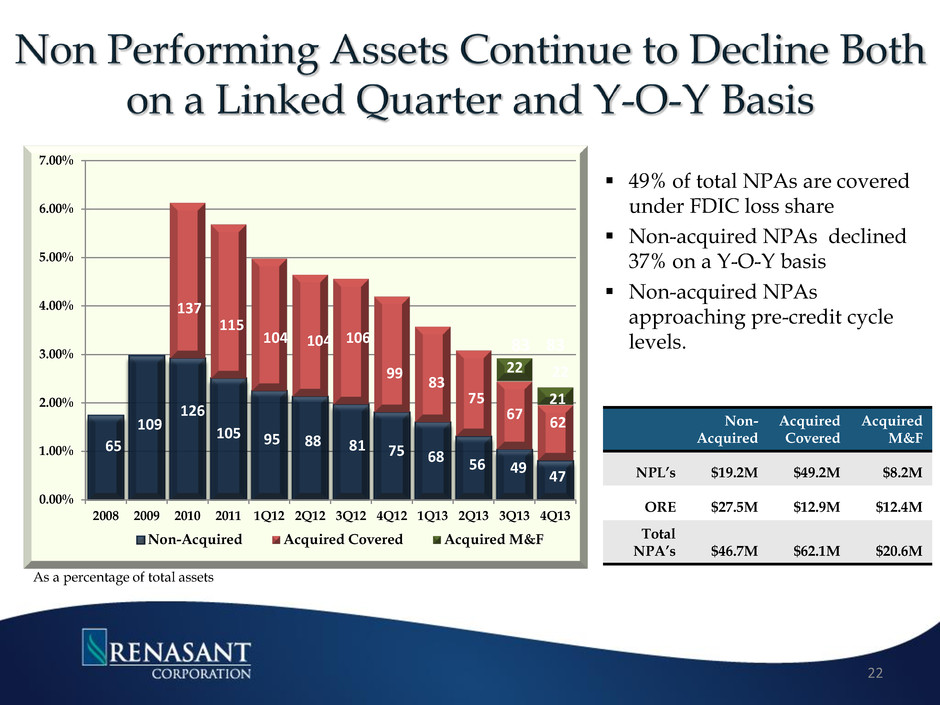
49% of total NPAs are covered under FDIC loss share Non-acquired NPAs declined 37% on a Y-O-Y basis Non-acquired NPAs approaching pre-credit cycle levels. 0.00% 1.00% 2.00% 3.00% 4.00% 5.00% 6.00% 7.00% 2008 2009 2010 2011 1Q12 2Q12 3Q12 4Q12 1Q13 2Q13 3Q13 4Q13 Non-Acquired Acquired Covered Acquired M&F 109 99 81 106 115 83 75 22 As a percentage of total assets 65 126 105 95 88 104 137 75 68 83 22 Non- Acquired Acquired Covered Acquired M&F NPL’s $19.2M $49.2M $8.2M ORE $27.5M $12.9M $12.4M Total NPA’s $46.7M $62.1M $20.6M 83 56 49 67 104 47 62 22 21

*Ratios excludes loans and assets acquired in connection with the M&F acquisition or loss share transactions 0.00% 50.00% 100.00% 150.00% 200.00% 250.00% 300.00% $- $2,000 $4,000 $6,000 $8,000 $10,000 $12,000 4Q10 1Q11 2Q11 3Q11 4Q11 1Q12 2Q12 3Q12 4Q12 1Q13 2Q13 3Q13 4Q13 ($)Provision for Loan Losses ($)Net Charge Offs Coverage Ratio* • Net charge-offs down 61.2% on a Y-O-Y basis • Provision for loan losses totaled $10.4M for 2013 down 43% from $18.1M for 2012 • The allowance for loan losses to non-covered loans was 1.64% excluding • Coverage ratio approximately 250% Allowance for Loan Losses as % of Non-Acquired Loans* 2010 2011 2012 2013 Q1 Q2 Q3 Q4 Q1 Q2 Q3 Q4 Q1 Q2 Q3 Q4 Q1 Q2 Q3 Q4 1.78% 1.82% 2.02% 2.07% 2.17% 2.18% 2.20% 1.98% 1.94% 1.87% 1.74% 1.72% 1.79% 1.75% 1.66% 1.64% 23

$0 $10,000 $20,000 $30,000 $40,000 $50,000 $60,000 2008 2009 2010 1Q11 2Q11 3Q11 4Q11 1Q12 2Q12 3Q12 4Q12 1Q13 2Q13 3Q13 4Q13 39.9 50.0 53.8 57.2 51.9 49.0 34.9 30.4 30.0 32.0 30.2 28.0 22.5 22.1 19.1 48.5 24.1 21.5 18.9 17.5 16.4 15.8 13.4 14.5 14.1 8.0 8.3 7.2 8.0 8.9 NPLs 30-89 Days Continued Improvement NPLs and Early Stage Delinquencies (30-89 Days Past Due Loans)* • NPL’s declined 37% Y-O-Y • Loans 30-89 days past due have remained at the lowest level since 2006 • NPL’s to total loans were .66%, lowest level since 1Q08 24 *Ratios excludes loans and assets acquired in connection with the M&F acquisition or loss share transactions
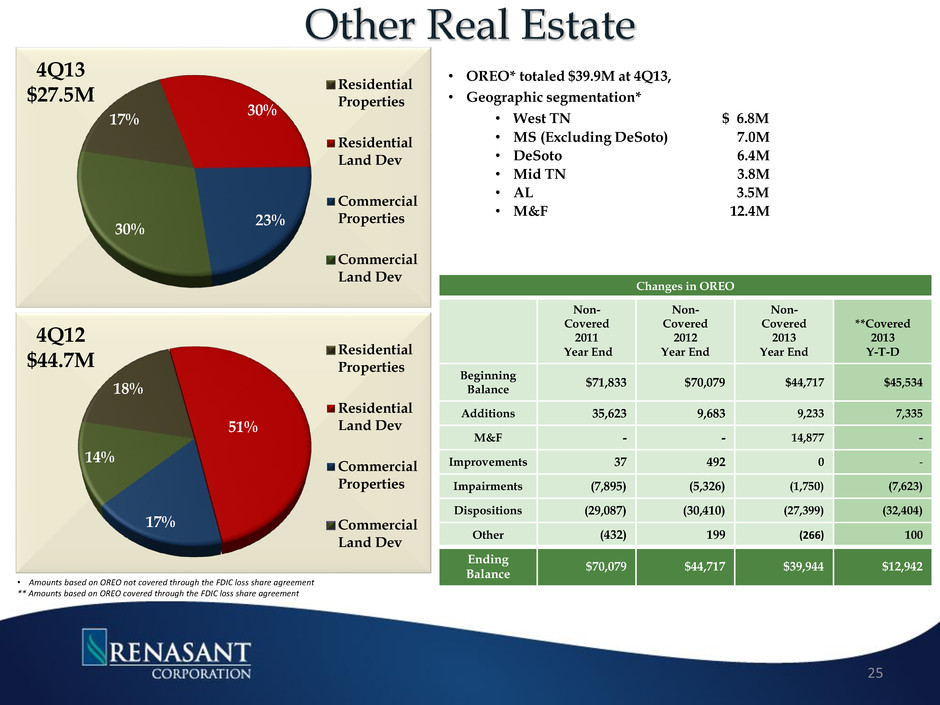
17% 30% 23% 30% 4Q13 $27.5M Residential Properties Residential Land Dev Commercial Properties Commercial Land Dev • OREO* totaled $39.9M at 4Q13, • Geographic segmentation* • West TN $ 6.8M • MS (Excluding DeSoto) 7.0M • DeSoto 6.4M • Mid TN 3.8M • AL 3.5M • M&F 12.4M Changes in OREO Non- Covered 2011 Year End Non- Covered 2012 Year End Non- Covered 2013 Year End **Covered 2013 Y-T-D Beginning Balance $71,833 $70,079 $44,717 $45,534 Additions 35,623 9,683 9,233 7,335 M&F - - 14,877 - Improvements 37 492 0 - Impairments (7,895) (5,326) (1,750) (7,623) Dispositions (29,087) (30,410) (27,399) (32,404) Other (432) 199 (266) 100 Ending Balance $70,079 $44,717 $39,944 $12,942 • Amounts based on OREO not covered through the FDIC loss share agreement ** Amounts based on OREO covered through the FDIC loss share agreement 25 18% 51% 17% 14% 4Q12 $44.7M Residential Properties Residential Land Dev Commercial Properties Commercial Land Dev

Capitalize on Opportunities Leverage Existing Markets FDIC Assisted Acquisitions Seek New Markets Enhance Lines of Business Build Capital Ratios Selective Balance Sheet Growth Maintain Dividend Non-TARP Participant Enhance Profitability Loan Growth Core Deposit Growth Net Int Margin Expansion/Int Rate Risk Noninterest Expense Control Aggressively Manage Problem Credits Quarantine Troubled Assets “Good Bank/Bad Bank” Structure Execution of Strategic Initiatives 26
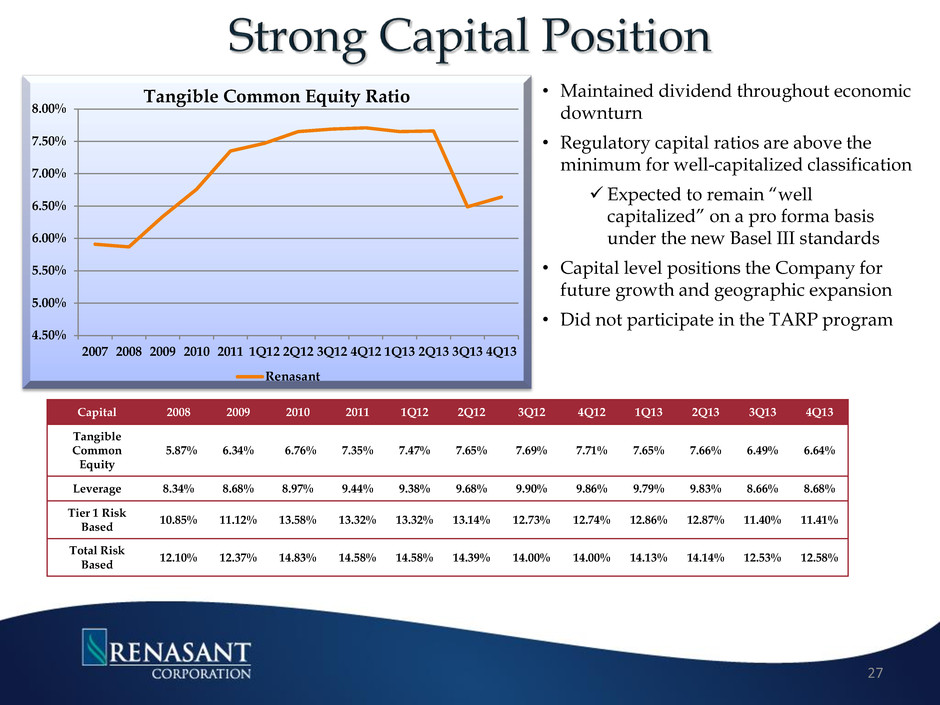
4.50% 5.00% 5.50% 6.00% 6.50% 7.00% 7.50% 8.00% 2007 2008 2009 2010 2011 1Q12 2Q12 3Q12 4Q12 1Q13 2Q13 3Q13 4Q13 Tangible Common Equity Ratio Renasant Capital 2008 2009 2010 2011 1Q12 2Q12 3Q12 4Q12 1Q13 2Q13 3Q13 4Q13 Tangible Common Equity 5.87% 6.34% 6.76% 7.35% 7.47% 7.65% 7.69% 7.71% 7.65% 7.66% 6.49% 6.64% Leverage 8.34% 8.68% 8.97% 9.44% 9.38% 9.68% 9.90% 9.86% 9.79% 9.83% 8.66% 8.68% Tier 1 Risk Based 10.85% 11.12% 13.58% 13.32% 13.32% 13.14% 12.73% 12.74% 12.86% 12.87% 11.40% 11.41% Total Risk Based 12.10% 12.37% 14.83% 14.58% 14.58% 14.39% 14.00% 14.00% 14.13% 14.14% 12.53% 12.58% • Maintained dividend throughout economic downturn • Regulatory capital ratios are above the minimum for well-capitalized classification Expected to remain “well capitalized” on a pro forma basis under the new Basel III standards • Capital level positions the Company for future growth and geographic expansion • Did not participate in the TARP program 27
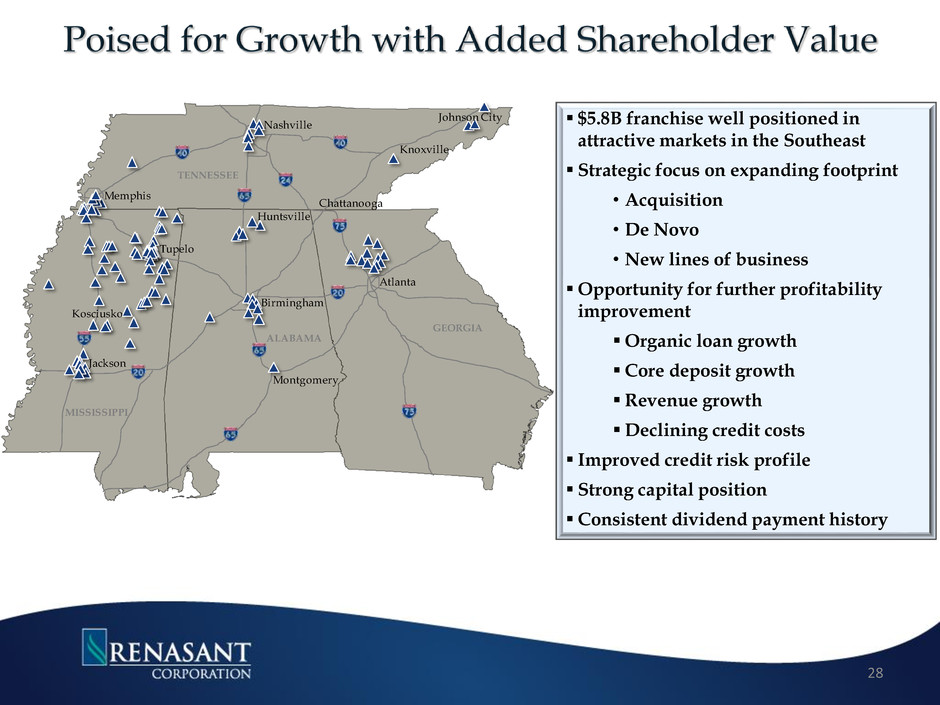
$5.8B franchise well positioned in attractive markets in the Southeast Strategic focus on expanding footprint • Acquisition • De Novo • New lines of business Opportunity for further profitability improvement Organic loan growth Core deposit growth Revenue growth Declining credit costs Improved credit risk profile Strong capital position Consistent dividend payment history 28 Tupelo Nashville Atlanta Birmingham Huntsville Montgomery Jackson Memphis Kosciusko Chattanooga Johnson City Knoxville GEORGIA ALABAMA MISSISSIPPI TENNESSEE
E. Robinson McGraw Chairman, President and Chief Executive Officer Kevin D. Chapman Executive Vice President and Chief Financial Officer 209 TROY STREET TUPELO, MS 38804-4827 PHONE: 1-800-680-1601 FACSIMILE: 1-662-680-1234 WWW.RENASANT.COM WWW.RENASANTBANK.COM 29


