Q1 2019 Investor Presentation Financial Information – 12-31-18
Forward-Looking Statements This presentation contains various “forward-looking statements” within the meaning of the Private Securities Litigation Reform Act of 1995 about Renasant Corporation (“Renasant,” “we,” “our,” or “us”) that are subject to risks and uncertainties. Congress passed the Private Securities Litigation Reform Act of 1995 in an effort to encourage companies to provide information about their anticipated future financial performance. This act provides a safe harbor for such disclosure, which protects a company from unwarranted litigation if actual results are different from management expectations. Forward-looking statements include information concerning our future financial performance, business strategy, projected plans and objectives. These statements are based upon the current beliefs and expectations of our management and are inherently subject to significant business, economic and competitive risks and uncertainties, many of which are beyond our control. In addition, these forward-looking statements are subject to assumptions with respect to future business strategies and decisions that are subject to change. Actual results may differ from those indicated or implied in the forward-looking statements, and such differences may be material. Statements preceded by, followed by or that otherwise include the words “believes,” “expects,” “anticipates,” “intends,” “estimates,” “plans,” “may increase,” “may fluctuate,” “will likely result,” and similar expressions, or future or conditional verbs such as “will,” “should,” “would,” and “could,” are generally forward-looking in nature and not historical facts. Investors should understand that the following important factors, in addition to those discussed elsewhere in this presentation as well as in reports we file with the Securities and Exchange Commission, could cause actual results to differ materially from those expressed in such forward-looking statements: (i) our ability to efficiently integrate acquisitions into our operations, retain the customers of these businesses and grow the acquired operations, including with respect to our recently completed acquisition of Brand Group Holdings, Inc.; (ii) the timing of the implementation of changes in operations to achieve enhanced earnings or effect cost savings; (iii) competitive pressures in the consumer finance, commercial finance, insurance, financial services, asset management, retail banking, mortgage lending and auto lending industries; (iv) the financial resources of, and products available to, competitors; (v) changes in laws and regulations as well as changes in accounting standards; (vi) changes in regulatory policy; (vii) changes in the securities and foreign exchange markets; (viii) our potential growth, including our entrance or expansion into new markets, and the need for sufficient capital to support that growth; (ix) changes in the quality or composition of our loan or investment portfolios, including adverse developments in borrower industries or in the repayment ability of individual borrowers; (x) an insufficient allowance for loan losses as a result of inaccurate assumptions; (xi) general market or business conditions; (xii) changes in demand for loan products and financial services; (xiii) concentration of credit exposure; (xiv) changes or the lack of changes in interest rates, yield curves and interest rate spread relationships; and (xv) other circumstances, many of which are beyond management’s control. Our management believes the forward-looking statements about us are reasonable. However, investors should not place undue reliance on them. Any forward-looking statements in this presentation are not guarantees of future performance. They involve risks, uncertainties and assumptions, and actual results, developments and business decisions may differ from those contemplated by those forward-looking statements. Many of the factors that will determine these results are beyond our ability to control or predict. We expressly disclaim any duty to update or revise any forward-looking statements, all of which are expressly qualified by the statements above. 2

Current Footprint More than 190 banking, lending, wealth management and insurance offices Portfolio Loans* Northern Eastern 21% 36% Western 24% Central 19% Total Deposits* Northern 15% Eastern Western 33% 38% Central 14% * As of December 31, 2018. Portfolio Loans excludes loans held for sale. 3
Four Key Strategic Initiatives • Focus on highly-accretive acquisition opportunities Capitalize on • Leverage existing markets Opportunities • Seek new markets • New lines of business • Superior returns • Revenue growth / Expense control Enhance Profitability • Net interest margin expansion / mitigate interest rate risk • Loan growth • Core deposit growth • Enhance credit process, policies and personnel Focus on Risk • Aggressively identify and manage problem credits Management • Board focus on Enterprise Risk Management • Selective balance sheet growth Build Capital Ratios • Maintain dividend • Prudently manage capital 4
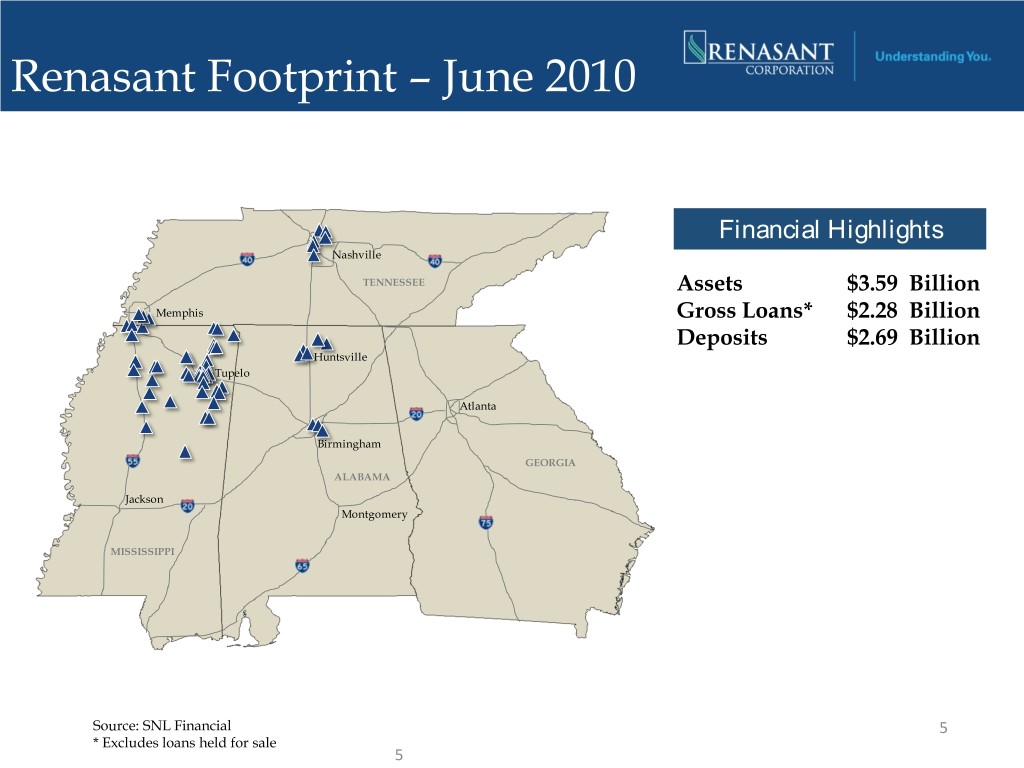
Renasant Footprint – June 2010 Financial Highlights Nashville TENNESSEE Assets $3.59 Billion Memphis Gross Loans* $2.28 Billion Deposits $2.69 Billion Huntsville Tupelo Atlanta Birmingham GEORGIA ALABAMA Jackson Montgomery MISSISSIPPI Source: SNL Financial 5 * Excludes loans held for sale 5
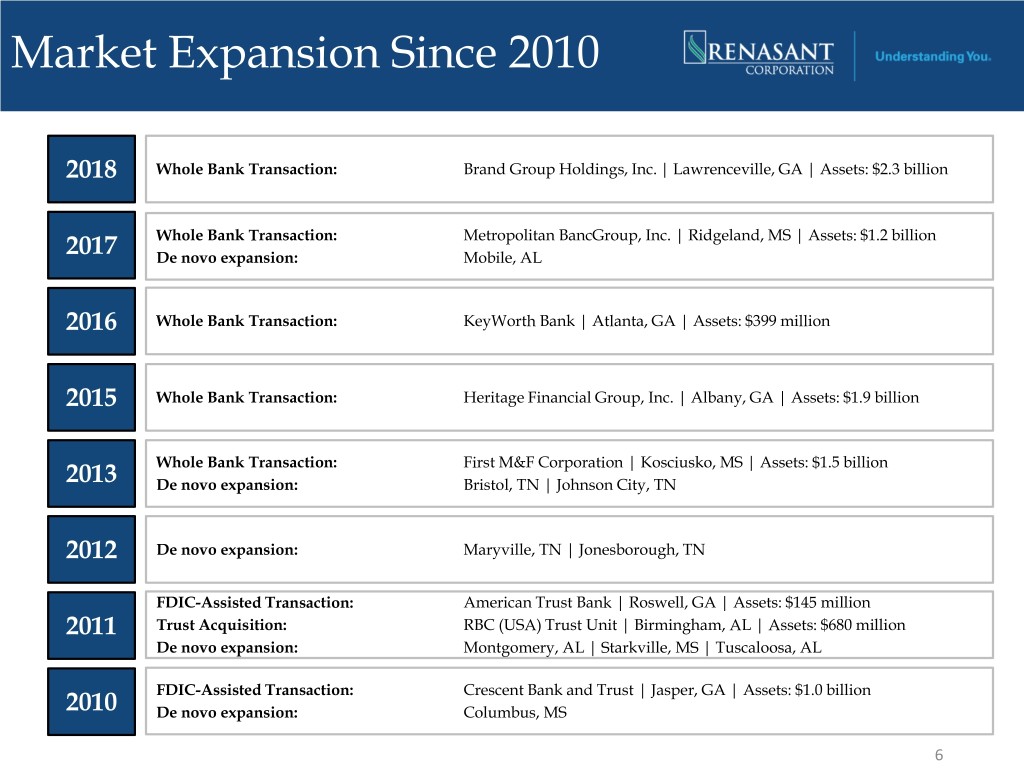
Market Expansion Since 2010 2018 Whole Bank Transaction: Brand Group Holdings, Inc. | Lawrenceville, GA | Assets: $2.3 billion Whole Bank Transaction: Metropolitan BancGroup, Inc. | Ridgeland, MS | Assets: $1.2 billion 2017 De novo expansion: Mobile, AL 2016 Whole Bank Transaction: KeyWorth Bank | Atlanta, GA | Assets: $399 million 2015 Whole Bank Transaction: Heritage Financial Group, Inc. | Albany, GA | Assets: $1.9 billion Whole Bank Transaction: First M&F Corporation | Kosciusko, MS | Assets: $1.5 billion 2013 De novo expansion: Bristol, TN | Johnson City, TN 2012 De novo expansion: Maryville, TN | Jonesborough, TN FDIC-Assisted Transaction: American Trust Bank | Roswell, GA | Assets: $145 million 2011 Trust Acquisition: RBC (USA) Trust Unit | Birmingham, AL | Assets: $680 million De novo expansion: Montgomery, AL | Starkville, MS | Tuscaloosa, AL FDIC-Assisted Transaction: Crescent Bank and Trust | Jasper, GA | Assets: $1.0 billion 2010 De novo expansion: Columbus, MS 6
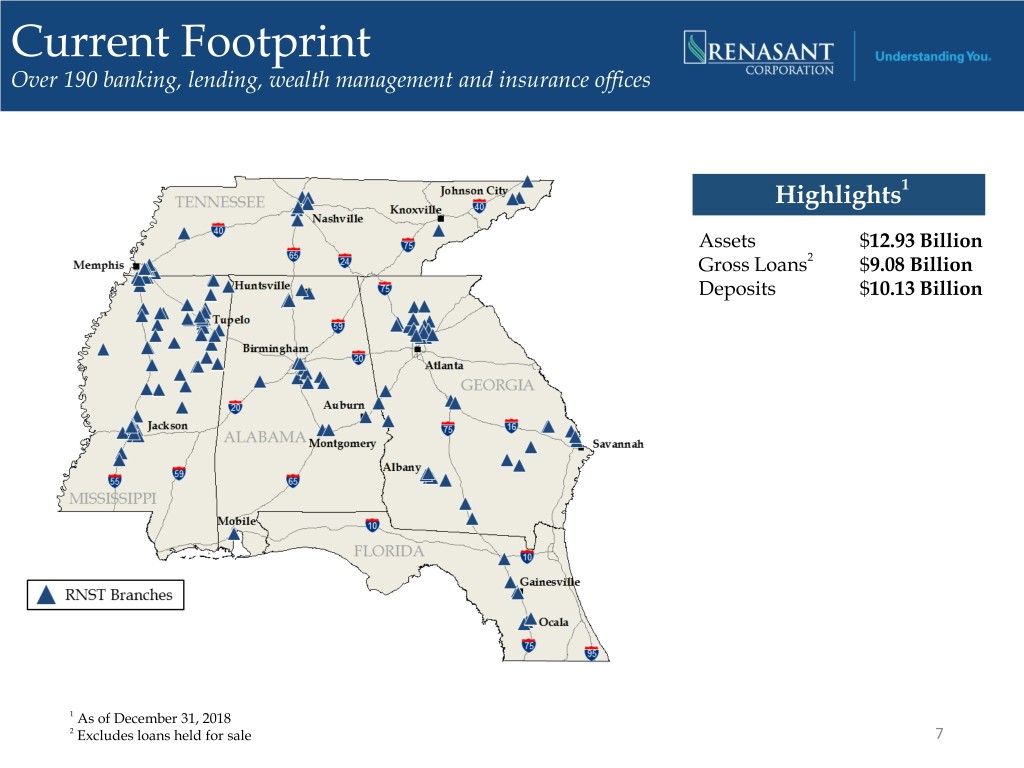
Current Footprint Over 190 banking, lending, wealth management and insurance offices Highlights1 Assets $12.93 Billion Gross Loans2 $9.08 Billion Deposits $10.13 Billion 1 As of December 31, 2018 2 Excludes loans held for sale 7
Merger of Renasant Corporation and Brand Group Holdings, Inc. Completed September 1, 2018 8
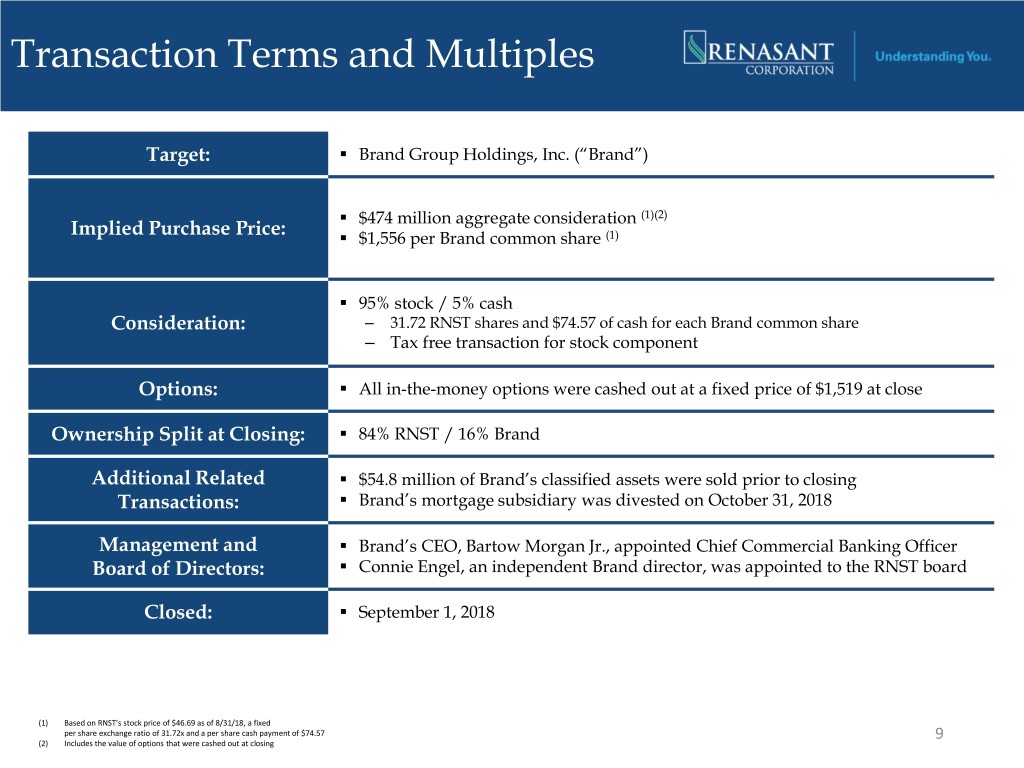
Transaction Terms and Multiples Target: . Brand Group Holdings, Inc. (“Brand”) . $474 million aggregate consideration (1)(2) Implied Purchase Price: . $1,556 per Brand common share (1) . 95% stock / 5% cash Consideration: ‒ 31.72 RNST shares and $74.57 of cash for each Brand common share ‒ Tax free transaction for stock component Options: . All in-the-money options were cashed out at a fixed price of $1,519 at close Ownership Split at Closing: . 84% RNST / 16% Brand Additional Related . $54.8 million of Brand’s classified assets were sold prior to closing . Transactions: Brand’s mortgage subsidiary was divested on October 31, 2018 Management and . Brand’s CEO, Bartow Morgan Jr., appointed Chief Commercial Banking Officer . Board of Directors: Connie Engel, an independent Brand director, was appointed to the RNST board Closed: . September 1, 2018 (1) Based on RNST’s stock price of $46.69 as of 8/31/18, a fixed per share exchange ratio of 31.72x and a per share cash payment of $74.57 9 (2) Includes the value of options that were cashed out at closing
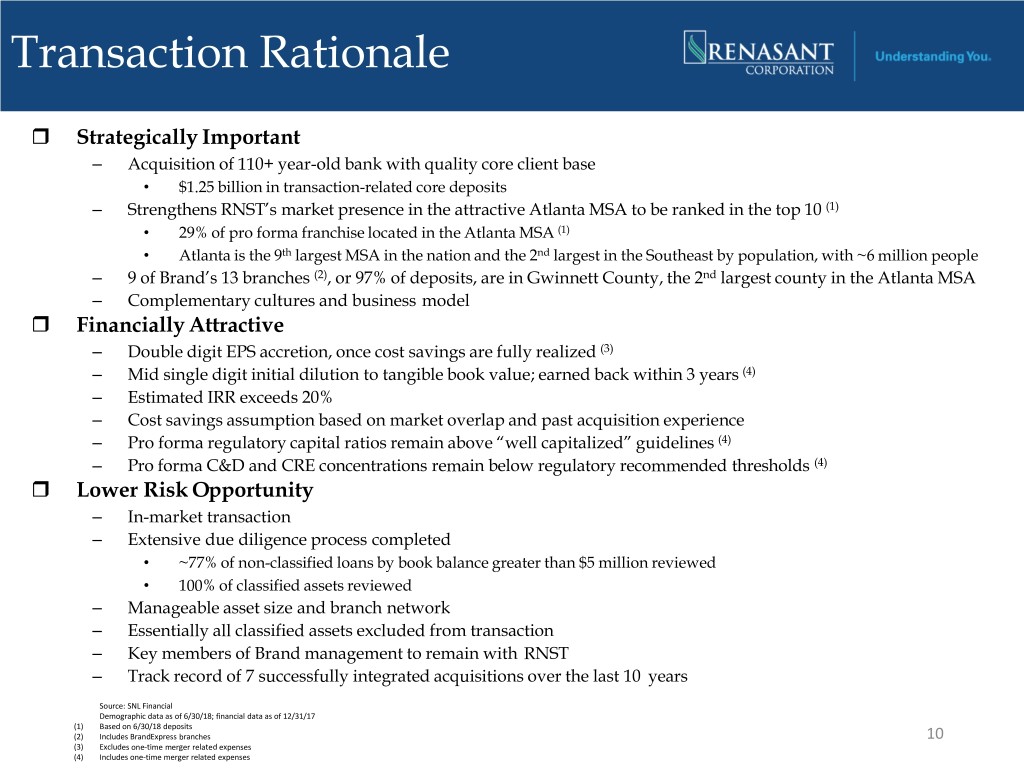
Transaction Rationale Strategically Important ‒ Acquisition of 110+ year-old bank with quality core client base • $1.25 billion in transaction-related core deposits ‒ Strengthens RNST’s market presence in the attractive Atlanta MSA to be ranked in the top 10 (1) • 29% of pro forma franchise located in the Atlanta MSA (1) • Atlanta is the 9th largest MSA in the nation and the 2nd largest in the Southeast by population, with ~6 million people ‒ 9 of Brand’s 13 branches (2), or 97% of deposits, are in Gwinnett County, the 2nd largest county in the Atlanta MSA ‒ Complementary cultures and business model Financially Attractive ‒ Double digit EPS accretion, once cost savings are fully realized (3) ‒ Mid single digit initial dilution to tangible book value; earned back within 3 years (4) ‒ Estimated IRR exceeds 20% ‒ Cost savings assumption based on market overlap and past acquisition experience ‒ Pro forma regulatory capital ratios remain above “well capitalized” guidelines (4) ‒ Pro forma C&D and CRE concentrations remain below regulatory recommended thresholds (4) Lower Risk Opportunity ‒ In-market transaction ‒ Extensive due diligence process completed • ~77% of non-classified loans by book balance greater than $5 million reviewed • 100% of classified assets reviewed ‒ Manageable asset size and branch network ‒ Essentially all classified assets excluded from transaction ‒ Key members of Brand management to remain with RNST ‒ Track record of 7 successfully integrated acquisitions over the last 10 years Source: SNL Financial Demographic data as of 6/30/18; financial data as of 12/31/17 (1) Based on 6/30/18 deposits (2) Includes BrandExpress branches 10 (3) Excludes one-time merger related expenses (4) Includes one-time merger related expenses
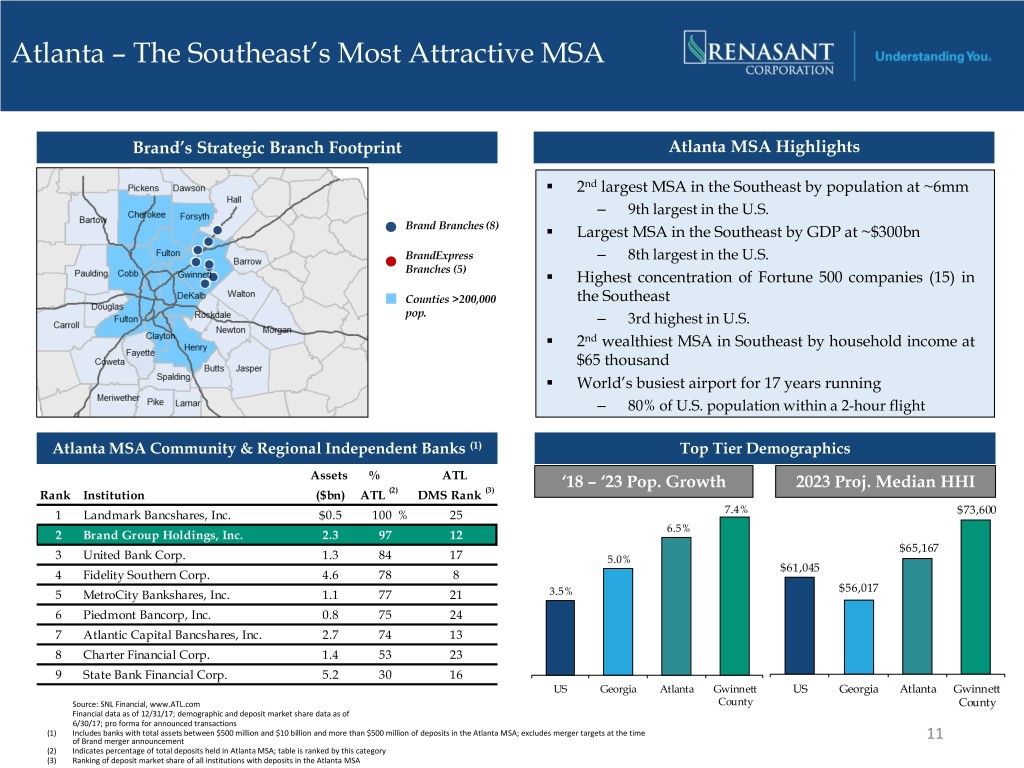
Atlanta – The Southeast’s Most Attractive MSA Brand’s Strategic Branch Footprint Atlanta MSA Highlights . 2nd largest MSA in the Southeast by population at ~6mm ‒ 9th largest in the U.S. Brand Branches (8) . Largest MSA in the Southeast by GDP at ~$300bn BrandExpress ‒ 8th largest in the U.S. Branches (5) . Highest concentration of Fortune 500 companies (15) in Counties >200,000 the Southeast pop. ‒ 3rd highest in U.S. . 2nd wealthiest MSA in Southeast by household income at $65 thousand . World’s busiest airport for 17 years running ‒ 80% of U.S. population within a 2-hour flight Atlanta MSA Community & Regional Independent Banks (1) Top Tier Demographics Assets % ATL ‘18 – ‘23 Pop. Growth 2023 Proj. Median HHI Rank Institution ($bn) ATL (2) DMS Rank (3) 1 Landmark Bancshares, Inc. $0.5 100 % 25 7.4% $73,600 6.5% 2 Brand Group Holdings, Inc. 2.3 97 12 $65,167 3 United Bank Corp. 1.3 84 17 5.0% $61,045 4 Fidelity Southern Corp. 4.6 78 8 $56,017 5 MetroCity Bankshares, Inc. 1.1 77 21 3.5% 6 Piedmont Bancorp, Inc. 0.8 75 24 7 Atlantic Capital Bancshares, Inc. 2.7 74 13 8 Charter Financial Corp. 1.4 53 23 9 State Bank Financial Corp. 5.2 30 16 US Georgia Atlanta Gwinnett US Georgia Atlanta Gwinnett Source: SNL Financial, www.ATL.com County County Financial data as of 12/31/17; demographic and deposit market share data as of 6/30/17; pro forma for announced transactions (1) Includes banks with total assets between $500 million and $10 billion and more than $500 million of deposits in the Atlanta MSA; excludes merger targets at the time of Brand merger announcement 11 (2) Indicates percentage of total deposits held in Atlanta MSA; table is ranked by this category (3) Ranking of deposit market share of all institutions with deposits in the Atlanta MSA
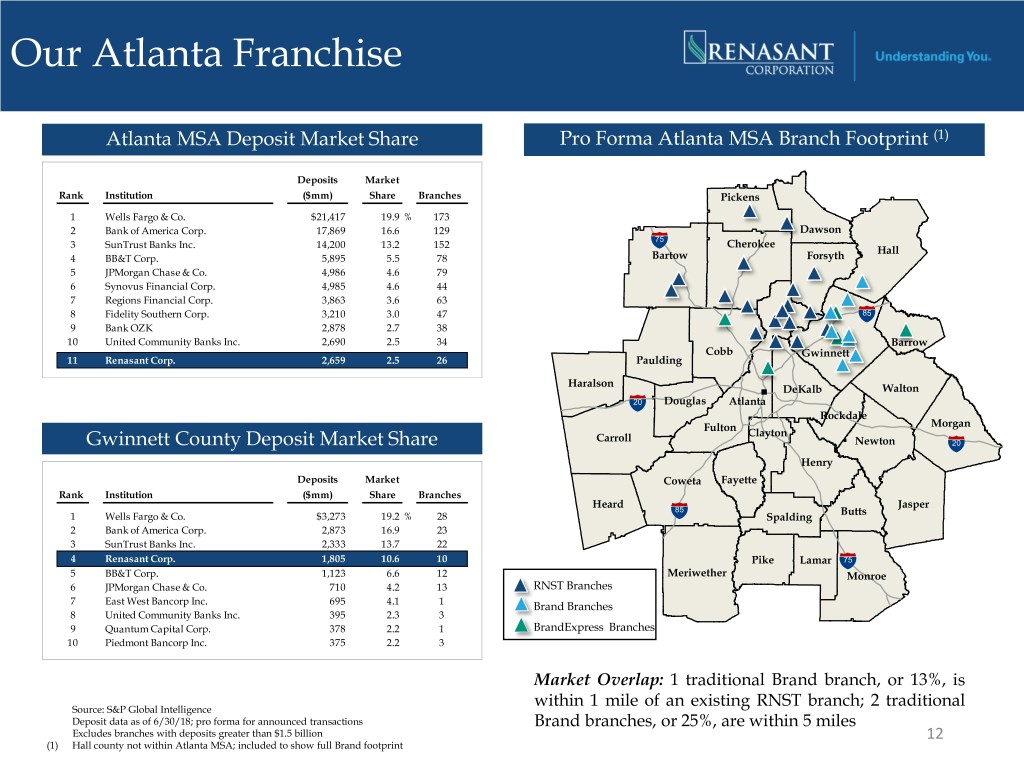
Our Atlanta Franchise Atlanta MSA Deposit Market Share Pro Forma Atlanta MSA Branch Footprint (1) Deposits Market Rank Institution ($mm) Share Branches Pickens 1 Wells Fargo & Co. $21,417 19.9 % 173 2 Bank of America Corp. 17,869 16.6 129 Dawson 75 Cherokee 3 SunTrust Banks Inc. 14,200 13.2 152 Hall 4 BB&T Corp. 5,895 5.5 78 Bartow Forsyth 5 JPMorgan Chase & Co. 4,986 4.6 79 6 Synovus Financial Corp. 4,985 4.6 44 7 Regions Financial Corp. 3,863 3.6 63 8 Fidelity Southern Corp. 3,210 3.0 47 85 9 Bank OZK 2,878 2.7 38 10 United Community Banks Inc. 2,690 2.5 34 Barrow Cobb Gwinnett 11 Renasant Corp. 2,659 2.5 26 Paulding Haralson DeKalb Walton 20 Douglas Atlanta Rockdale Fulton Morgan Carroll Clayton Gwinnett County Deposit Market Share Newton 20 Henry Deposits Market Coweta Fayette Rank Institution ($mm) Share Branches Heard Jasper 85 Butts 1 Wells Fargo & Co. $3,273 19.2 % 28 Spalding 2 Bank of America Corp. 2,873 16.9 23 3 SunTrust Banks Inc. 2,333 13.7 22 4 Renasant Corp. 1,805 10.6 10 Pike Lamar 75 5 BB&T Corp. 1,123 6.6 12 Meriwether Monroe 6 JPMorgan Chase & Co. 710 4.2 13 RNST Branches 7 East West Bancorp Inc. 695 4.1 1 Brand Branches 8 United Community Banks Inc. 395 2.3 3 9 Quantum Capital Corp. 378 2.2 1 BrandExpress Branches 10 Piedmont Bancorp Inc. 375 2.2 3 Market Overlap: 1 traditional Brand branch, or 13%, is within 1 mile of an existing RNST branch; 2 traditional Source: S&P Global Intelligence Deposit data as of 6/30/18; pro forma for announced transactions Brand branches, or 25%, are within 5 miles Excludes branches with deposits greater than $1.5 billion 12 (1) Hall county not within Atlanta MSA; included to show full Brand footprint
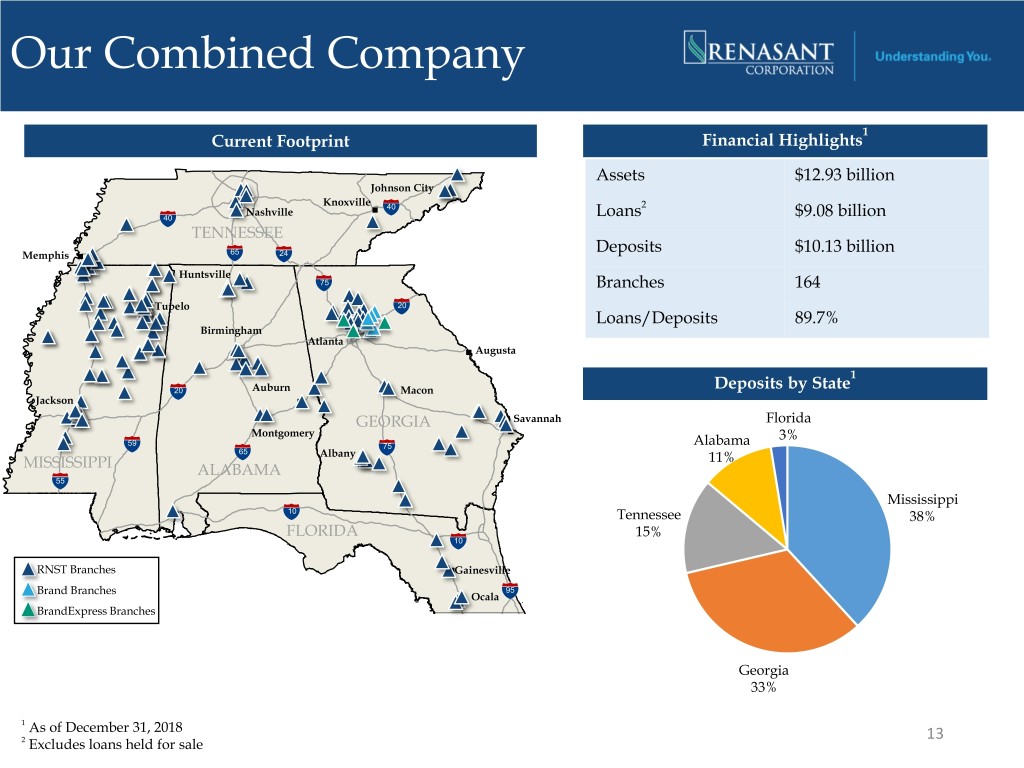
Our Combined Company 1 Current Footprint Financial Highlights Assets $12.93 billion Johnson City Knoxville 40 2 40 Nashville Loans $9.08 billion TENNESSEE Memphis 65 24 Deposits $10.13 billion Huntsville 75 Branches 164 Tupelo 20 Loans/Deposits 89.7% Birmingham Atlanta Augusta 1 20 Auburn Macon Deposits by State Jackson GEORGIA Savannah Florida Montgomery 3% 59 75 Alabama 65 Albany 11% MISSISSIPPI ALABAMA 55 Mississippi 10 Tennessee 38% FLORIDA 15% 10 RNST Branches Gainesville Brand Branches 95 Ocala BrandExpress Branches Georgia 33% 1 As of December 31, 2018 13 2 Excludes loans held for sale
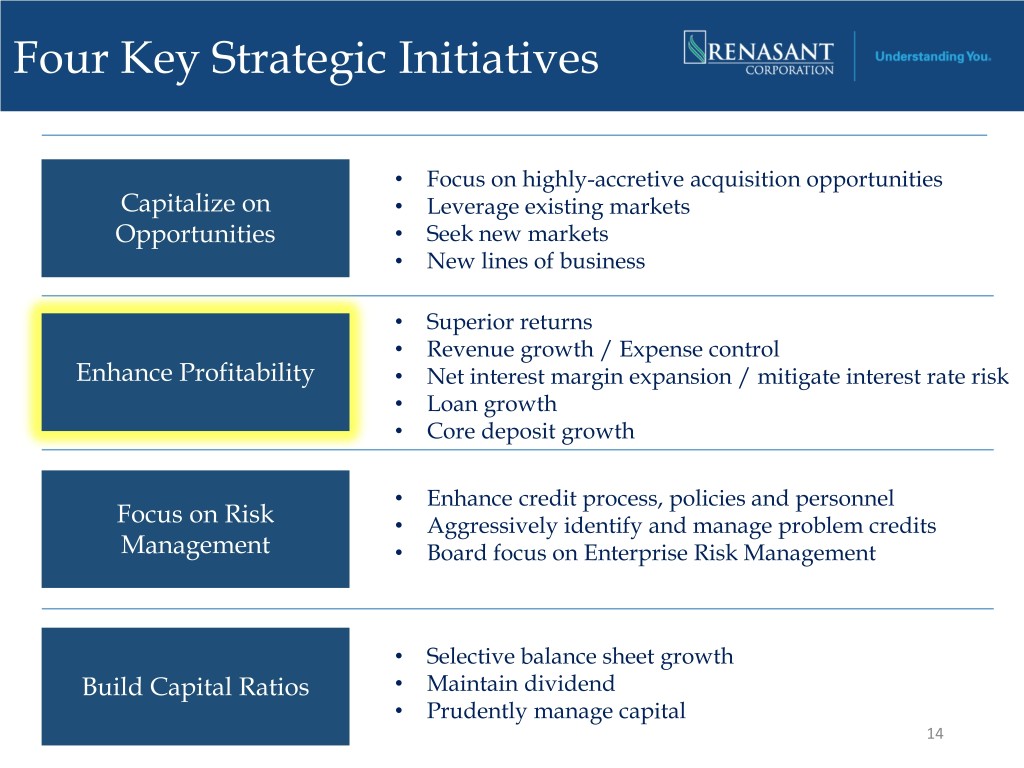
Four Key Strategic Initiatives • Focus on highly-accretive acquisition opportunities Capitalize on • Leverage existing markets Opportunities • Seek new markets • New lines of business • Superior returns • Revenue growth / Expense control Enhance Profitability • Net interest margin expansion / mitigate interest rate risk • Loan growth • Core deposit growth • Enhance credit process, policies and personnel Focus on Risk • Aggressively identify and manage problem credits Management • Board focus on Enterprise Risk Management • Selective balance sheet growth Build Capital Ratios • Maintain dividend • Prudently manage capital 14

Total Assets • Reduced balance sheet to $12,000 manage assets below $10 billion at December 31, 2017 $10,000 • Deleverage strategy included: • Reduction of $479 million in investment securities $8,000 • Reduction of $99 million in mortgage loans held for sale $6,000 • Purchased investment securities of $318 million in 1Q18, $180 million in 2Q18, $79 $4,000 million in 3Q18, and $110 million in 4Q18 to relever the balance sheet $2,000 $0 (In thousands) Total Assets Deposits 15
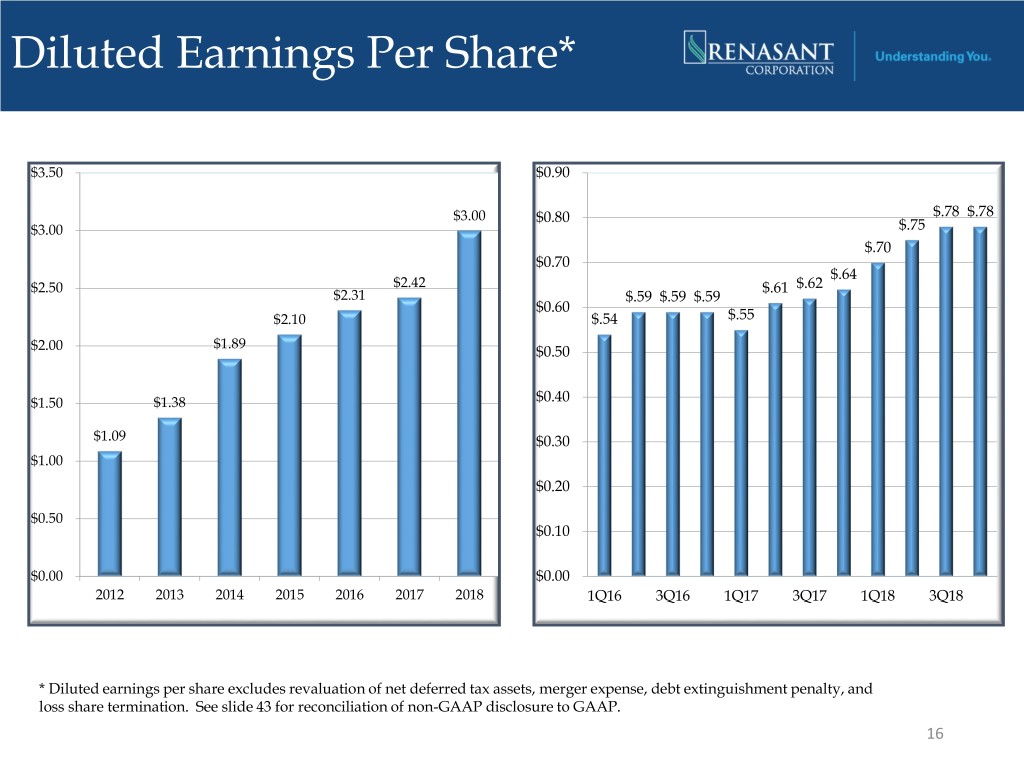
Diluted Earnings Per Share* $3.50 $0.90 $3.00 $0.80 $.78 $.78 $3.00 $.75 $.70 $0.70 $.64 $2.50 $2.42 $.61 $.62 $2.31 $.59 $.59 $.59 $0.60 $2.10 $.54 $.55 $1.89 $2.00 $0.50 $1.50 $1.38 $0.40 $1.09 $0.30 $1.00 $0.20 $0.50 $0.10 $0.00 $0.00 2012 2013 2014 2015 2016 2017 2018 1Q16 3Q16 1Q17 3Q17 1Q18 3Q18 * Diluted earnings per share excludes revaluation of net deferred tax assets, merger expense, debt extinguishment penalty, and loss share termination. See slide 43 for reconciliation of non-GAAP disclosure to GAAP. 16

Enhanced Profitability Return on Assets* Return on Tangible Equity* 1.60% 20.00% 1.45% 1.47% 1.46% 18.32% 1.39% 17.66% 1.40% 18.00% 17.11% 16.37% 16.23% 16.34% 16.10% 1.20% 16.00% 1.20% 1.15% 14.48% 1.10% 1.03% 14.00% 1.00% 12.17% 12.00% 0.80% 0.80% 10.00% 9.40% 0.66% 0.60% 8.00% 6.00% 0.40% 4.00% 0.20% 2.00% 0.00% 0.00% 2012 2013 2014 2015 2016 2017 1Q18 2Q18 3Q18 4Q18 2012 2013 2014 2015 2016 2017 1Q18 2Q18 3Q18 4Q18 * Return on assets and return on tangible equity each excludes revaluation of net deferred tax assets, merger expense, debt extinguishment penalty, and loss share termination. See slides 44 and 45 for reconciliations of these non-GAAP disclosures 17 to GAAP.
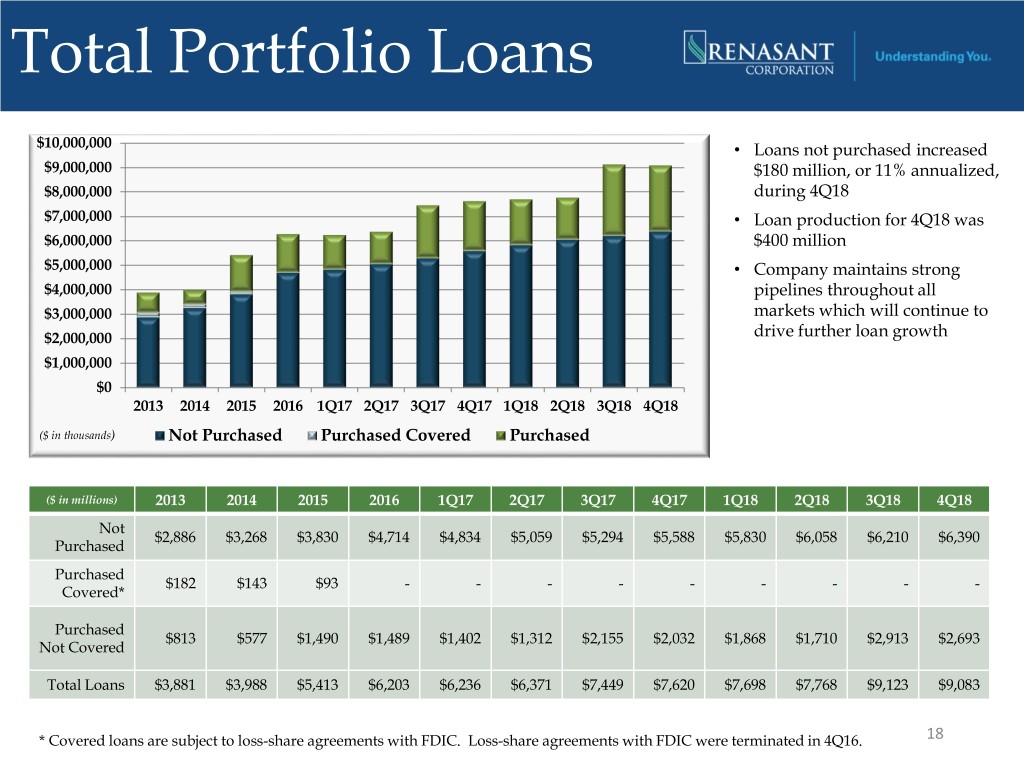
Total Portfolio Loans $10,000,000 • Loans not purchased increased $9,000,000 $180 million, or 11% annualized, $8,000,000 during 4Q18 $7,000,000 • Loan production for 4Q18 was $6,000,000 $400 million $5,000,000 • Company maintains strong $4,000,000 pipelines throughout all $3,000,000 markets which will continue to $2,000,000 drive further loan growth $1,000,000 $0 2013 2014 2015 2016 1Q17 2Q17 3Q17 4Q17 1Q18 2Q18 3Q18 4Q18 ($ in thousands) Not Purchased Purchased Covered Purchased ($ in millions) 2013 2014 2015 2016 1Q17 2Q17 3Q17 4Q17 1Q18 2Q18 3Q18 4Q18 Not $2,886 $3,268 $3,830 $4,714 $4,834 $5,059 $5,294 $5,588 $5,830 $6,058 $6,210 $6,390 Purchased Purchased $182 $143 $93 - - - - - - - - - Covered* Purchased $813 $577 $1,490 $1,489 $1,402 $1,312 $2,155 $2,032 $1,868 $1,710 $2,913 $2,693 Not Covered Total Loans $3,881 $3,988 $5,413 $6,203 $6,236 $6,371 $7,449 $7,620 $7,698 $7,768 $9,123 $9,083 * Covered loans are subject to loss-share agreements with FDIC. Loss-share agreements with FDIC were terminated in 4Q16. 18

Diversified Loan Portfolio . At December 31, 2018, loans totaled $9.08 billion* 70% Not Purchased 30% Purchased Non Owner Occupied 25% Owner Occupied 18% C&I 14% Consumer 1-4 Family 2% 31% Const Land Dev 8% 2% * Excludes Loans held for sale 19
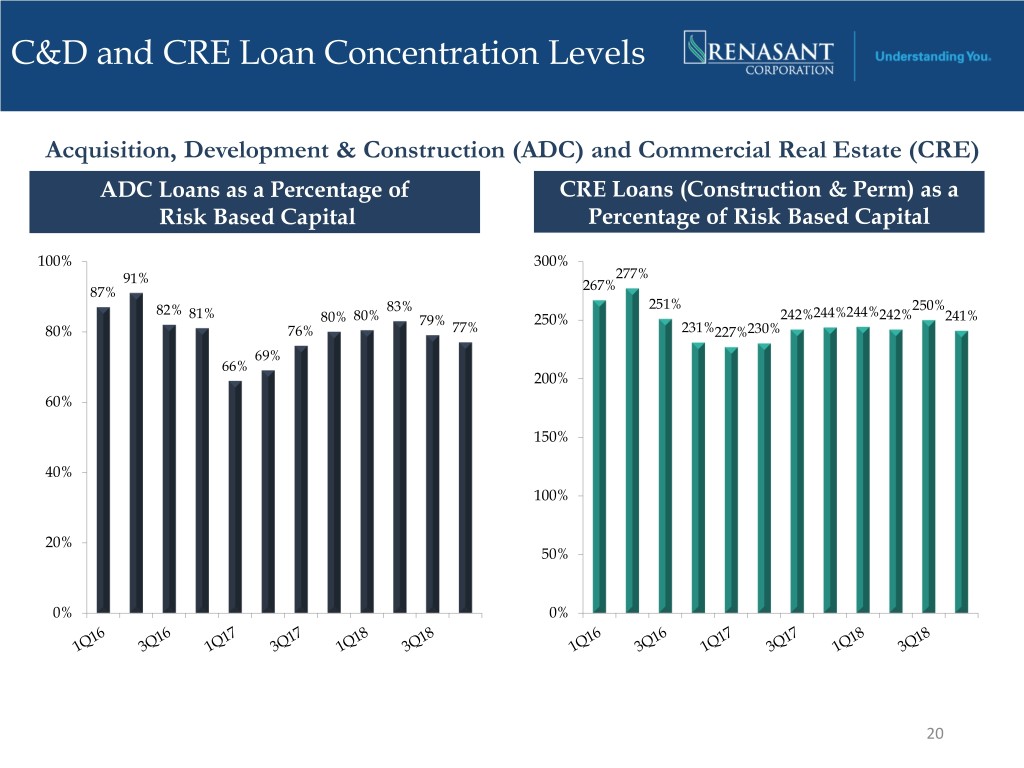
C&D and CRE Loan Concentration Levels Acquisition, Development & Construction (ADC) and Commercial Real Estate (CRE) ADC Loans as a Percentage of CRE Loans (Construction & Perm) as a Risk Based Capital Percentage of Risk Based Capital 100% 300% 91% 277% 87% 267% 251% 250% 82% 83% 244%244% 81% 80% 80% 79% 250% 242% 242% 241% 80% 76% 77% 231%227%230% 69% 66% 200% 60% 150% 40% 100% 20% 50% 0% 0% 20
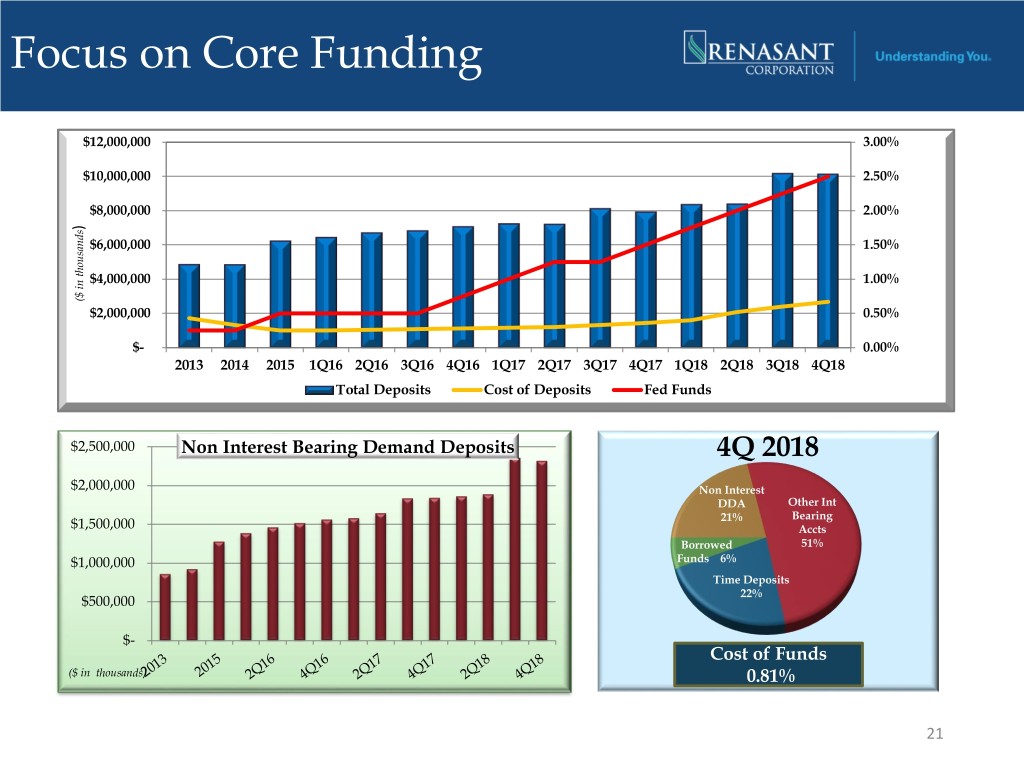
Focus on Core Funding $12,000,000 3.00% $10,000,000 2.50% $8,000,000 2.00% ) $6,000,000 1.50% $4,000,000 1.00% ($ in thousands ($ $2,000,000 0.50% $- 0.00% 2013 2014 2015 1Q16 2Q16 3Q16 4Q16 1Q17 2Q17 3Q17 4Q17 1Q18 2Q18 3Q18 4Q18 Total Deposits Cost of Deposits Fed Funds $2,500,000 Non Interest Bearing Demand Deposits 4Q 2018 $2,000,000 Non Interest DDA Other Int 21% Bearing $1,500,000 Accts Borrowed 51% $1,000,000 Funds 6% Time Deposits 22% $500,000 $- Cost of Funds ($ in thousands) 0.81% 21
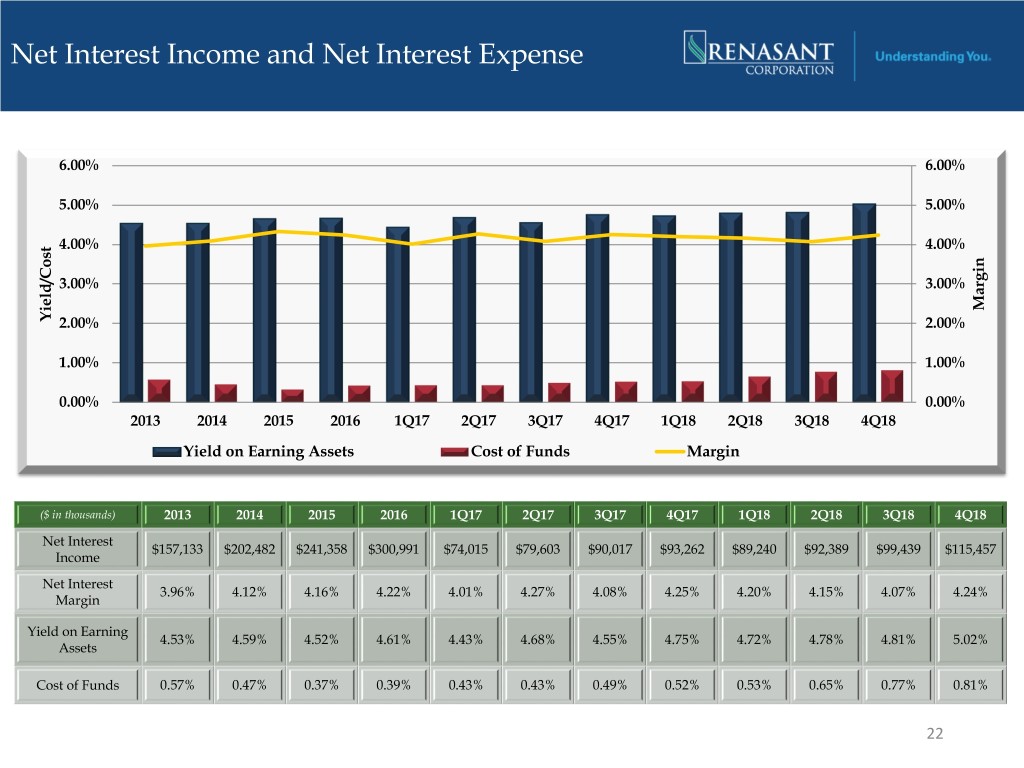
Net Interest Income and Net Interest Expense 6.00% 6.00% 5.00% 5.00% 4.00% 4.00% 3.00% 3.00% Margin Yield/Cost 2.00% 2.00% 1.00% 1.00% 0.00% 0.00% 2013 2014 2015 2016 1Q17 2Q17 3Q17 4Q17 1Q18 2Q18 3Q18 4Q18 Yield on Earning Assets Cost of Funds Margin ($ in thousands) 2013 2014 2015 2016 1Q17 2Q17 3Q17 4Q17 1Q18 2Q18 3Q18 4Q18 Net Interest $157,133 $202,482 $241,358 $300,991 $74,015 $79,603 $90,017 $93,262 $89,240 $92,389 $99,439 $115,457 Income Net Interest 3.96% 4.12% 4.16% 4.22% 4.01% 4.27% 4.08% 4.25% 4.20% 4.15% 4.07% 4.24% Margin Yield on Earning 4.53% 4.59% 4.52% 4.61% 4.43% 4.68% 4.55% 4.75% 4.72% 4.78% 4.81% 5.02% Assets Cost of Funds 0.57% 0.47% 0.37% 0.39% 0.43% 0.43% 0.49% 0.52% 0.53% 0.65% 0.77% 0.81% 22

Sources of Non Interest Income* ($ in thousands) • Diversified sources of noninterest income Non Interest Income* $45,000 • Opportunities for growing Non Interest Income $40,000 $35,000 Expansion of Trust Division Wealth Management $30,000 services into larger, metropolitan markets $25,000 Expansions within our de novo operations $20,000 $15,000 Expansion of the Mortgage Division within new $10,000 markets $5,000 Preserved debit card revenue in 2018 by $- deleveraging the balance sheet below $10B in assets in 4Q17 1Q08 Svc Chgs 4Q18 Svc Chgs $14M* 39% $36M* 6% Insurance 25% Insurance 6% Mtg Inc Mtg Inc 33% 12% 11% Wealth Mgmt 10% Wealth Mgmt 5% Fees & Comm Fees & Comm 17% 9% 27% Other Other 23 *Non interest income excludes gains and losses from securities transactions. See slide 42 for reconciliation of non-GAAP disclosure to GAAP.
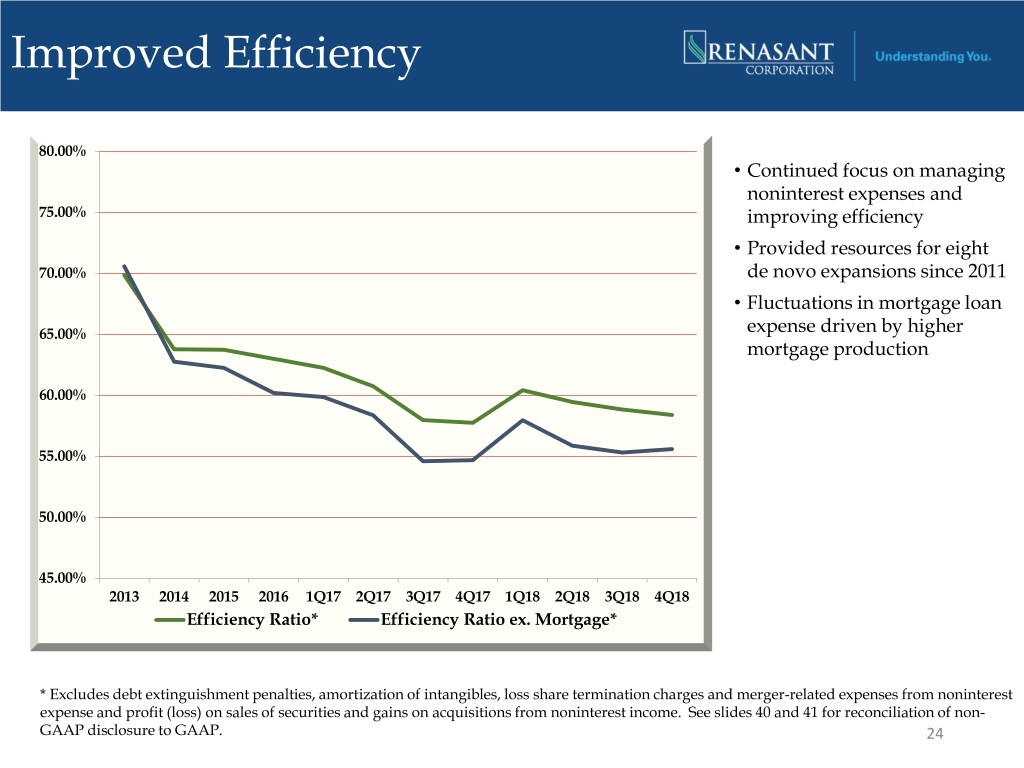
Improved Efficiency 80.00% • Continued focus on managing noninterest expenses and 75.00% improving efficiency • Provided resources for eight 70.00% de novo expansions since 2011 • Fluctuations in mortgage loan 65.00% expense driven by higher mortgage production 60.00% 55.00% 50.00% 45.00% 2013 2014 2015 2016 1Q17 2Q17 3Q17 4Q17 1Q18 2Q18 3Q18 4Q18 Efficiency Ratio* Efficiency Ratio ex. Mortgage* * Excludes debt extinguishment penalties, amortization of intangibles, loss share termination charges and merger-related expenses from noninterest expense and profit (loss) on sales of securities and gains on acquisitions from noninterest income. See slides 40 and 41 for reconciliation of non- GAAP disclosure to GAAP. 24
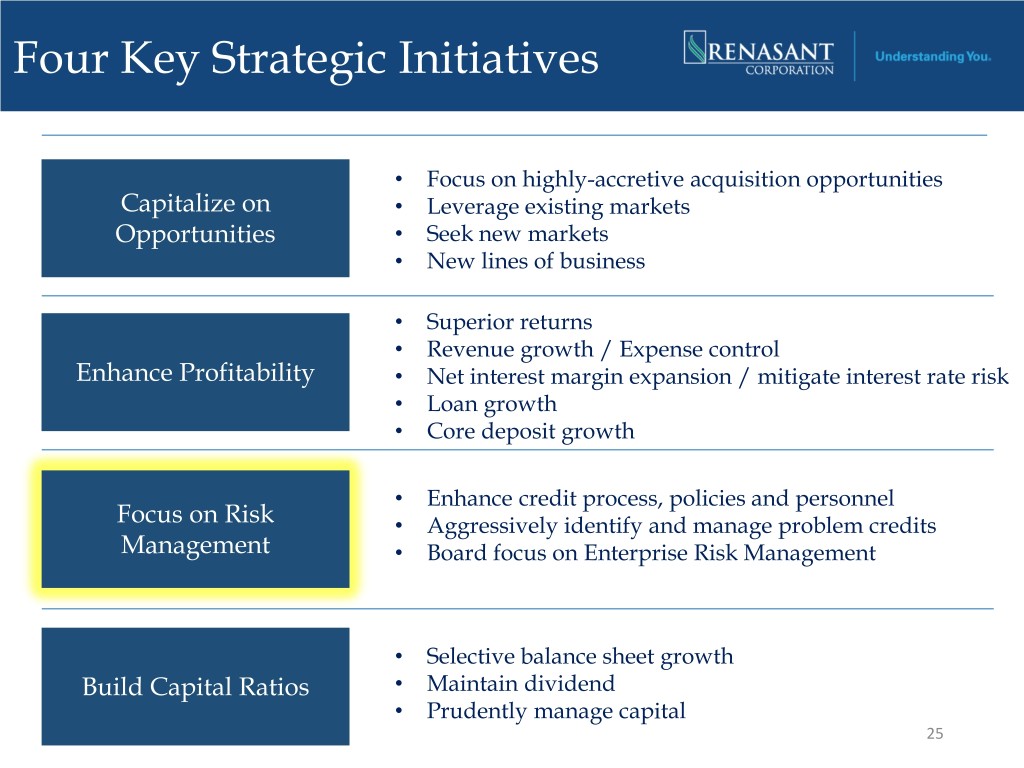
Four Key Strategic Initiatives • Focus on highly-accretive acquisition opportunities Capitalize on • Leverage existing markets Opportunities • Seek new markets • New lines of business • Superior returns • Revenue growth / Expense control Enhance Profitability • Net interest margin expansion / mitigate interest rate risk • Loan growth • Core deposit growth • Enhance credit process, policies and personnel Focus on Risk • Aggressively identify and manage problem credits Management • Board focus on Enterprise Risk Management • Selective balance sheet growth Build Capital Ratios • Maintain dividend • Prudently manage capital 25
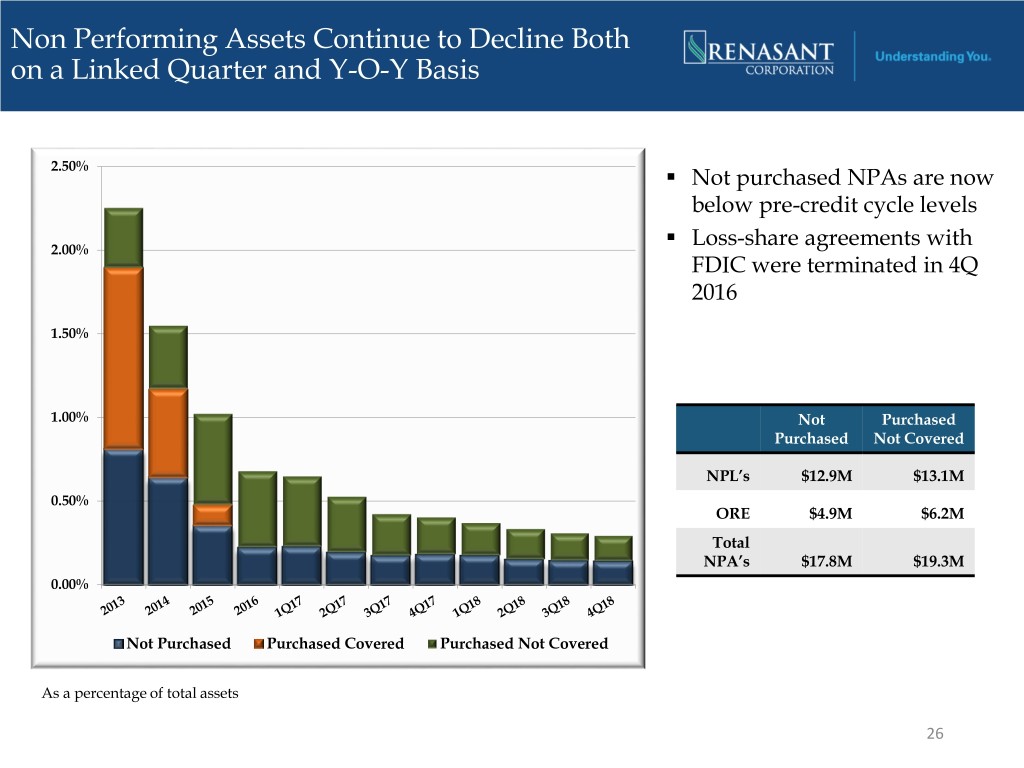
Non Performing Assets Continue to Decline Both on a Linked Quarter and Y-O-Y Basis 2.50% . Not purchased NPAs are now below pre-credit cycle levels . 2.00% Loss-share agreements with FDIC were terminated in 4Q 2016 1.50% 1.00% Not Purchased Purchased Not Covered NPL’s $12.9M $13.1M 0.50% ORE $4.9M $6.2M Total NPA’s $17.8M $19.3M 0.00% Not Purchased Purchased Covered Purchased Not Covered As a percentage of total assets 26
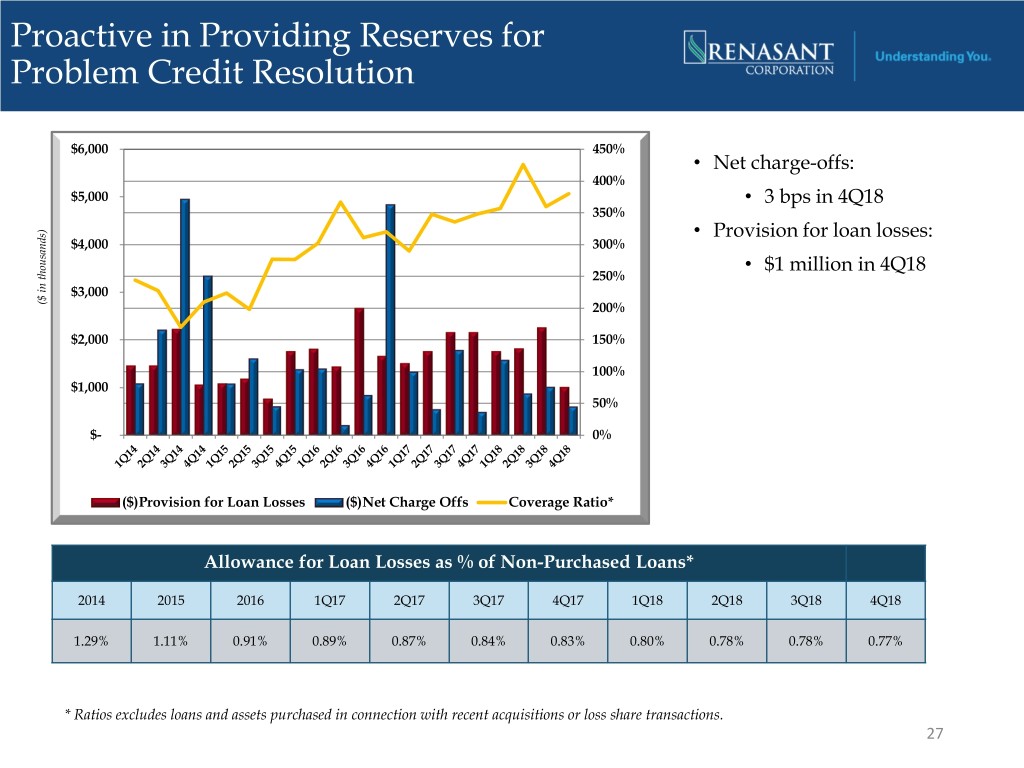
Proactive in Providing Reserves for Problem Credit Resolution $6,000 450% • Net charge-offs: 400% $5,000 • 3 bps in 4Q18 350% • Provision for loan losses: $4,000 300% • $1 million in 4Q18 250% $3,000 ($ in thousands) ($ 200% $2,000 150% 100% $1,000 50% $- 0% ($)Provision for Loan Losses ($)Net Charge Offs Coverage Ratio* Allowance for Loan Losses as % of Non-Purchased Loans* 2014 2015 2016 1Q17 2Q17 3Q17 4Q17 1Q18 2Q18 3Q18 4Q18 1.29% 1.11% 0.91% 0.89% 0.87% 0.84% 0.83% 0.80% 0.78% 0.78% 0.77% * Ratios excludes loans and assets purchased in connection with recent acquisitions or loss share transactions. 27

Strong Credit Quality Metrics NPLs and Early Stage Delinquencies (30-89 Days Past Due Loans)* $25,000 $20,000 NPLs 30-89 $15,000 Days $10,000 $5,000 $0 2013 2014 2015 2016 1Q17 2Q17 3Q17 4Q17 1Q18 2Q18 3Q18 4Q18 ($ in thousands) *Amounts exclude loans and assets purchased in connection with recent acquisitions or loss-share transactions. • NPLs to total loans were 0.20% as of December 31, 2018 28

Four Key Strategic Initiatives • Focus on highly-accretive acquisition opportunities Capitalize on • Leverage existing markets Opportunities • Seek new markets • New lines of business • Superior returns • Revenue growth / Expense control Enhance Profitability • Net interest margin expansion / mitigate interest rate risk • Loan growth • Core deposit growth • Enhance credit process, policies and personnel Focus on Risk • Aggressively identify and manage problem credits Management • Board focus on Enterprise Risk Management • Selective balance sheet growth Build Capital Ratios • Maintain dividend • Prudently manage capital 29
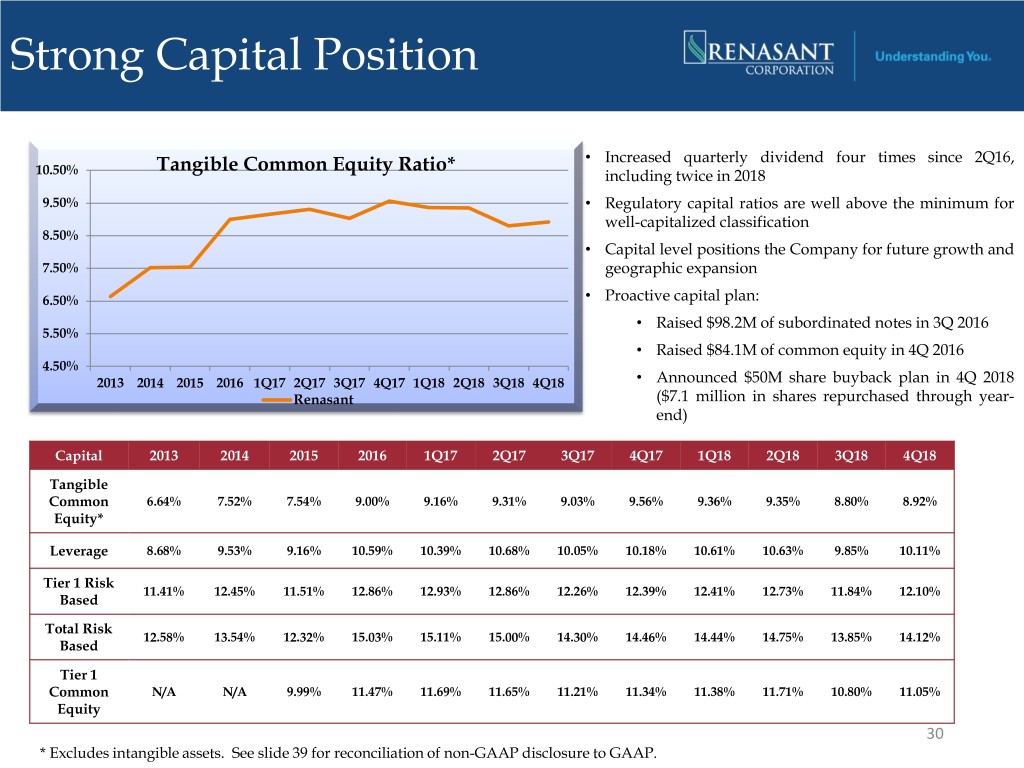
Strong Capital Position Tangible Common Equity Ratio* • Increased quarterly dividend four times since 2Q16, 10.50% including twice in 2018 9.50% • Regulatory capital ratios are well above the minimum for well-capitalized classification 8.50% • Capital level positions the Company for future growth and 7.50% geographic expansion 6.50% • Proactive capital plan: • Raised $98.2M of subordinated notes in 3Q 2016 5.50% • Raised $84.1M of common equity in 4Q 2016 4.50% 2013 2014 2015 2016 1Q17 2Q17 3Q17 4Q17 1Q18 2Q18 3Q18 4Q18 • Announced $50M share buyback plan in 4Q 2018 Renasant ($7.1 million in shares repurchased through year- end) Capital 2013 2014 2015 2016 1Q17 2Q17 3Q17 4Q17 1Q18 2Q18 3Q18 4Q18 Tangible Common 6.64% 7.52% 7.54% 9.00% 9.16% 9.31% 9.03% 9.56% 9.36% 9.35% 8.80% 8.92% Equity* Leverage 8.68% 9.53% 9.16% 10.59% 10.39% 10.68% 10.05% 10.18% 10.61% 10.63% 9.85% 10.11% Tier 1 Risk 11.41% 12.45% 11.51% 12.86% 12.93% 12.86% 12.26% 12.39% 12.41% 12.73% 11.84% 12.10% Based Total Risk 12.58% 13.54% 12.32% 15.03% 15.11% 15.00% 14.30% 14.46% 14.44% 14.75% 13.85% 14.12% Based Tier 1 Common N/A N/A 9.99% 11.47% 11.69% 11.65% 11.21% 11.34% 11.38% 11.71% 10.80% 11.05% Equity 30 * Excludes intangible assets. See slide 39 for reconciliation of non-GAAP disclosure to GAAP.

Consistent and Strong Dividend Dividends Per Share – Annually Dividends Per Share – Quarterly $0.90 $0.25 $0.80 $0.70 $0.20 $0.60 $0.15 $0.50 $0.40 $0.10 $0.30 $0.20 $0.05 $0.10 $0.00 $0.00 31
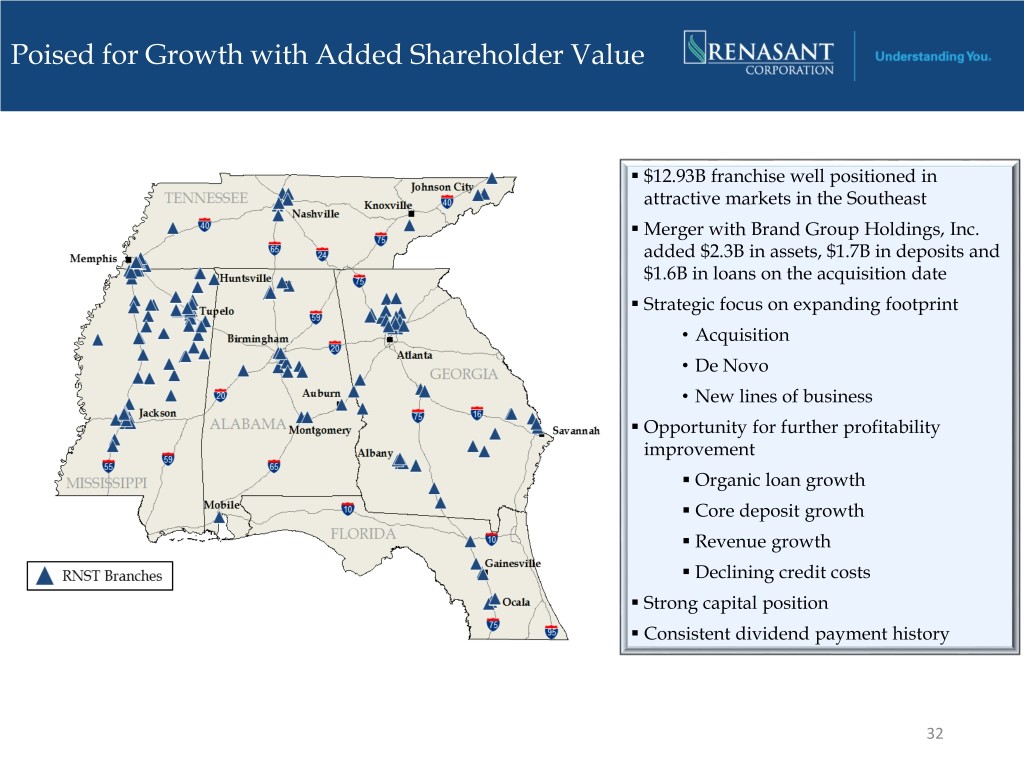
Poised for Growth with Added Shareholder Value . $12.93B franchise well positioned in attractive markets in the Southeast . Merger with Brand Group Holdings, Inc. added $2.3B in assets, $1.7B in deposits and $1.6B in loans on the acquisition date . Strategic focus on expanding footprint • Acquisition • De Novo • New lines of business . Opportunity for further profitability improvement . Organic loan growth . Core deposit growth . Revenue growth . Declining credit costs . Strong capital position . Consistent dividend payment history 32
Appendix 33
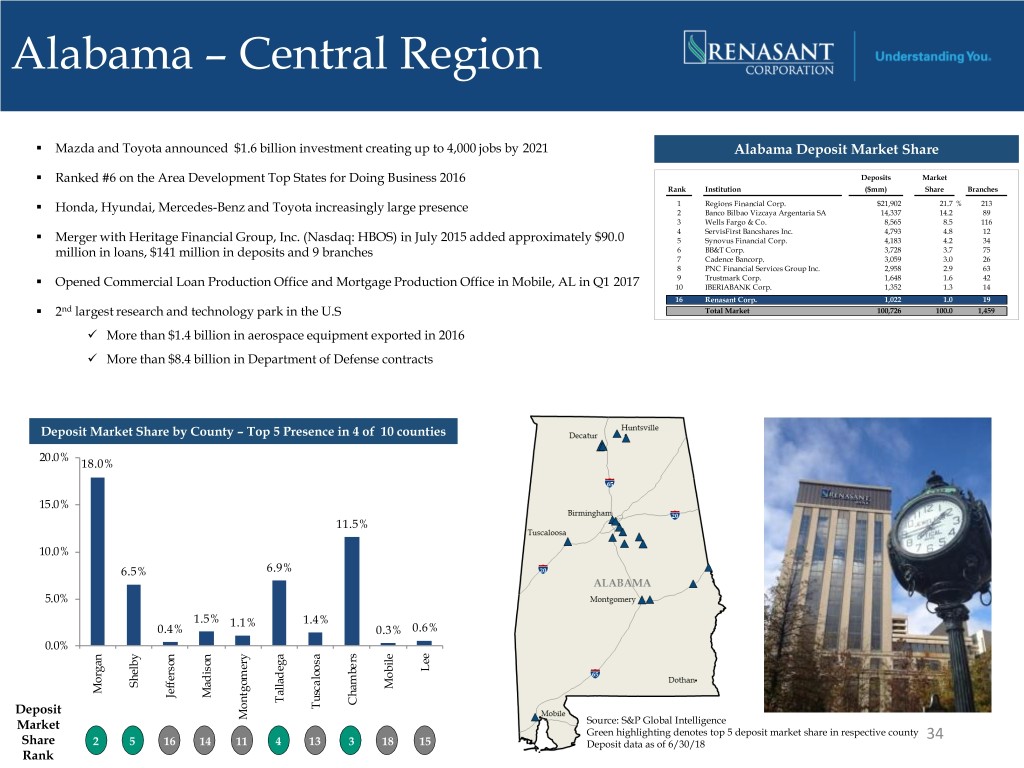
Alabama – Central Region . Mazda and Toyota announced $1.6 billion investment creating up to 4,000 jobs by 2021 Alabama Deposit Market Share . Ranked #6 on the Area Development Top States for Doing Business 2016 Deposits Market Rank Institution ($mm) Share Branches . 1 Regions Financial Corp. $21,902 21.7 % 213 Honda, Hyundai, Mercedes-Benz and Toyota increasingly large presence 2 Banco Bilbao Vizcaya Argentaria SA 14,337 14.2 89 3 Wells Fargo & Co. 8,565 8.5 116 . 4 ServisFirst Bancshares Inc. 4,793 4.8 12 Merger with Heritage Financial Group, Inc. (Nasdaq: HBOS) in July 2015 added approximately $90.0 5 Synovus Financial Corp. 4,183 4.2 34 million in loans, $141 million in deposits and 9 branches 6 BB&T Corp. 3,728 3.7 75 7 Cadence Bancorp. 3,059 3.0 26 8 PNC Financial Services Group Inc. 2,958 2.9 63 . 9 Trustmark Corp. 1,648 1.6 42 Opened Commercial Loan Production Office and Mortgage Production Office in Mobile, AL in Q1 2017 10 IBERIABANK Corp. 1,352 1.3 14 . 16 Renasant Corp. 1,022 1.0 19 2nd largest research and technology park in the U.S Total Market 100,726 100.0 1,459 More than $1.4 billion in aerospace equipment exported in 2016 More than $8.4 billion in Department of Defense contracts Deposit Market Share by County – Top 5 Presence in 4 of 10 counties 20.0% 18.0% 15.0% 11.5% 10.0% 6.5% 6.9% 5.0% 1.5% 1.1% 1.4% 0.4% 0.3% 0.6% 0.0% Lee Shelby Mobile Morgan Madison Jefferson Talladega Chambers Deposit Tuscaloosa Market Montgomery Source: S&P Global Intelligence Green highlighting denotes top 5 deposit market share in respective county 34 Share 2 5 16 14 11 4 13 3 18 15 Deposit data as of 6/30/18 Rank
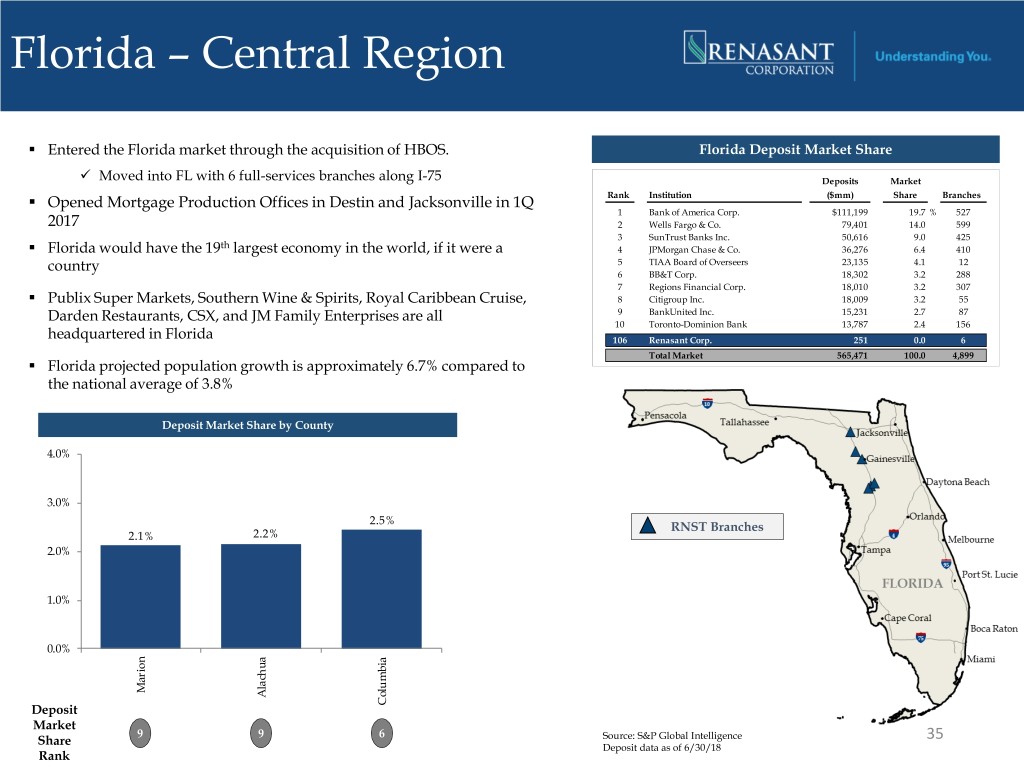
Florida – Central Region . Entered the Florida market through the acquisition of HBOS. Florida Deposit Market Share Moved into FL with 6 full-services branches along I-75 Deposits Market Rank Institution ($mm) Share Branches . Opened Mortgage Production Offices in Destin and Jacksonville in 1Q 1 Bank of America Corp. $111,199 19.7 % 527 2017 2 Wells Fargo & Co. 79,401 14.0 599 3 SunTrust Banks Inc. 50,616 9.0 425 . th Florida would have the 19 largest economy in the world, if it were a 4 JPMorgan Chase & Co. 36,276 6.4 410 country 5 TIAA Board of Overseers 23,135 4.1 12 6 BB&T Corp. 18,302 3.2 288 . 7 Regions Financial Corp. 18,010 3.2 307 Publix Super Markets, Southern Wine & Spirits, Royal Caribbean Cruise, 8 Citigroup Inc. 18,009 3.2 55 Darden Restaurants, CSX, and JM Family Enterprises are all 9 BankUnited Inc. 15,231 2.7 87 10 Toronto-Dominion Bank 13,787 2.4 156 headquartered in Florida 106 Renasant Corp. 251 0.0 6 Total Market 565,471 100.0 4,899 . Florida projected population growth is approximately 6.7% compared to the national average of 3.8% Deposit Market Share by County 4.0% 3.0% 2.5% RNST Branches 2.1% 2.2% 2.0% 1.0% 0.0% Marion Alachua Deposit Columbia Market 9 9 6 Share Source: S&P Global Intelligence 35 Deposit data as of 6/30/18 Rank
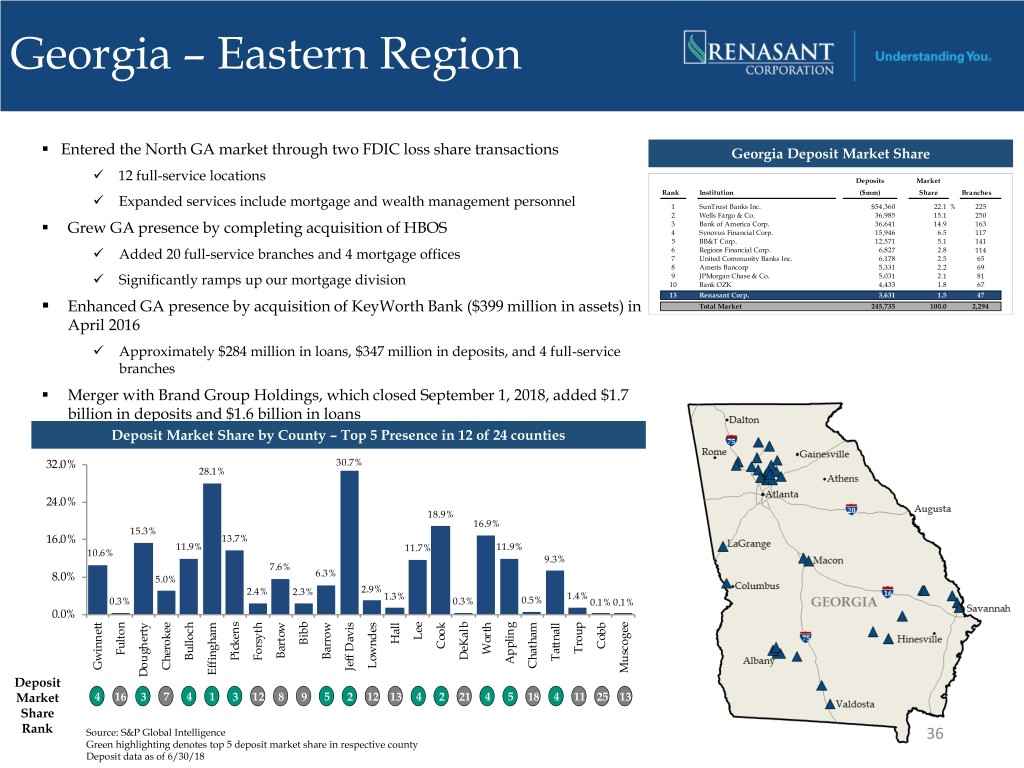
Georgia – Eastern Region . Entered the North GA market through two FDIC loss share transactions Georgia Deposit Market Share 12 full-service locations Deposits Market Rank Institution ($mm) Share Branches Expanded services include mortgage and wealth management personnel 1 SunTrust Banks Inc. $54,360 22.1 % 225 2 Wells Fargo & Co. 36,985 15.1 250 . 3 Bank of America Corp. 36,641 14.9 163 Grew GA presence by completing acquisition of HBOS 4 Synovus Financial Corp. 15,946 6.5 117 5 BB&T Corp. 12,571 5.1 141 6 Regions Financial Corp. 6,827 2.8 114 Added 20 full-service branches and 4 mortgage offices 7 United Community Banks Inc. 6,178 2.5 65 8 Ameris Bancorp 5,331 2.2 69 9 JPMorgan Chase & Co. 5,031 2.1 81 Significantly ramps up our mortgage division 10 Bank OZK 4,433 1.8 67 . 13 Renasant Corp. 3,631 1.5 47 Enhanced GA presence by acquisition of KeyWorth Bank ($399 million in assets) in Total Market 245,735 100.0 2,294 April 2016 Approximately $284 million in loans, $347 million in deposits, and 4 full-service branches . Merger with Brand Group Holdings, which closed September 1, 2018, added $1.7 billion in deposits and $1.6 billion in loans Deposit Market Share by County – Top 5 Presence in 12 of 24 counties 32.0% 30.7% 28.1% 24.0% 18.9% 16.9% 15.3% 16.0% 13.7% 11.9% 11.7% 11.9% 10.6% 9.3% 7.6% 6.3% 8.0% 5.0% 2.4% 2.9% 2.3% 1.3% 1.4% 0.3% 0.3% 0.5% 0.1% 0.1% 0.0% Lee Hall Bibb Cook Cobb Troup Worth Fulton Bartow Barrow DeKalb Bulloch Pickens Forsyth Tattnall Appling Chatham Lowndes Gwinnett Cherokee Jeff Davis Jeff Muscogee Effingham Dougherty Deposit Market 4 16 3 7 4 1 3 12 8 9 5 2 12 13 4 2 21 4 5 18 4 11 25 13 Share Rank Source: S&P Global Intelligence 36 Green highlighting denotes top 5 deposit market share in respective county Deposit data as of 6/30/18
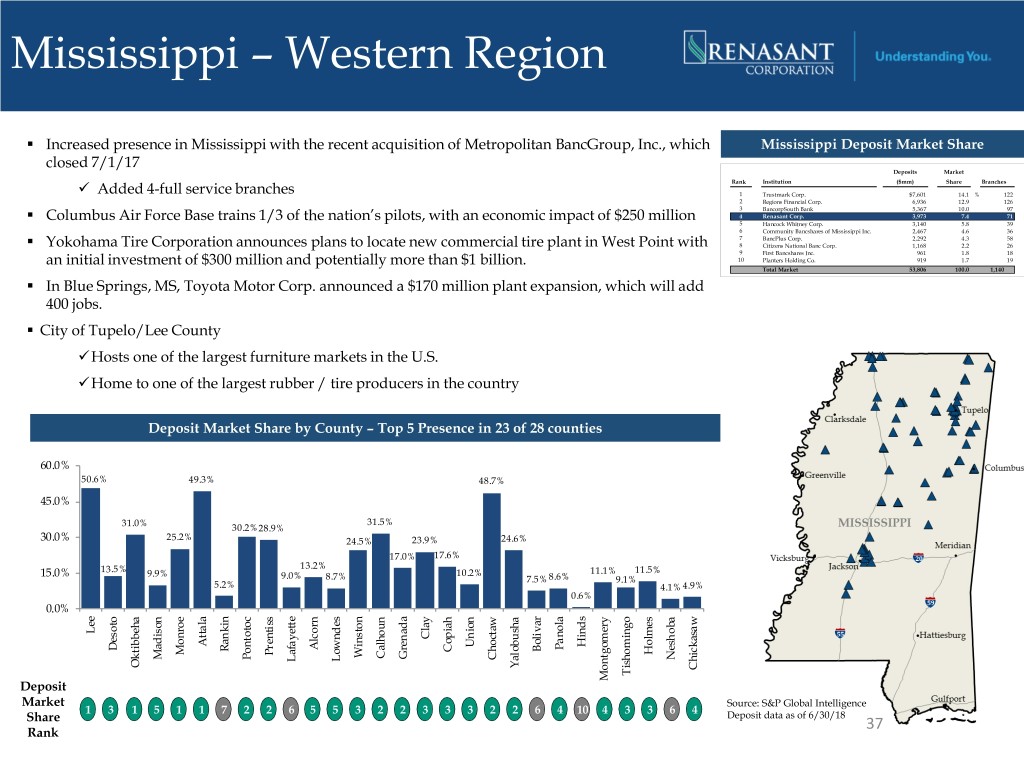
Mississippi – Western Region . Increased presence in Mississippi with the recent acquisition of Metropolitan BancGroup, Inc., which Mississippi Deposit Market Share closed 7/1/17 Deposits Market Rank Institution ($mm) Share Branches Added 4-full service branches 1 Trustmark Corp. $7,601 14.1 % 122 2 Regions Financial Corp. 6,936 12.9 126 . 3 BancorpSouth Bank 5,367 10.0 97 Columbus Air Force Base trains 1/3 of the nation’s pilots, with an economic impact of $250 million 4 Renasant Corp. 3,973 7.4 71 5 Hancock Whitney Corp. 3,140 5.8 39 6 Community Bancshares of Mississippi Inc. 2,467 4.6 36 . 7 BancPlus Corp. 2,292 4.3 58 Yokohama Tire Corporation announces plans to locate new commercial tire plant in West Point with 8 Citizens National Banc Corp. 1,168 2.2 26 9 First Bancshares Inc. 961 1.8 18 an initial investment of $300 million and potentially more than $1 billion. 10 Planters Holding Co. 919 1.7 19 Total Market 53,806 100.0 1,140 . In Blue Springs, MS, Toyota Motor Corp. announced a $170 million plant expansion, which will add 400 jobs. . City of Tupelo/Lee County Hosts one of the largest furniture markets in the U.S. Home to one of the largest rubber / tire producers in the country Deposit Market Share by County – Top 5 Presence in 23 of 28 counties 60.0% 50.6% 49.3% 48.7% 45.0% 31.0% 31.5% 30.2%28.9% 30.0% 25.2% 24.5% 23.9% 24.6% 17.0% 17.6% 13.2% 15.0% 13.5% 9.9% 10.2% 11.1% 11.5% 9.0% 8.7% 7.5% 8.6% 9.1% 5.2% 4.1% 4.9% 0.6% 0.0% Lee Clay Attala Hinds Union Panola Alcorn Desoto Rankin Bolivar Copiah Holmes Monroe Prentiss Winston Calhoun Grenada Madison Neshoba Pontotoc Choctaw Lowndes Lafayette Oktibbeha Yalobusha Chickasaw Tishomingo Montgomery Deposit Market Source: S&P Global Intelligence 1 3 1 5 1 1 7 2 2 6 5 5 3 2 2 3 3 3 2 2 6 4 10 4 3 3 6 4 Share Deposit data as of 6/30/18 37 Rank

Tennessee – Northern Region . Our Tennessee Operations Tennessee Deposit Market Share The Knoxville/Maryville MSA location opened in late Q2 ‘12 Deposits Market East Tennessee operations currently have 4 full-service branches, $304 million in Rank Institution ($mm) Share Branches loans and $133 million in deposits 1 First Horizon National Corp. $24,023 15.5 % 164 2 Regions Financial Corp. 18,727 12.1 220 3 SunTrust Banks Inc. 13,918 9.0 117 Metropolitan acquisition added two branches in each of Memphis and Nashville 4 Pinnacle Financial Partners Inc. 12,264 7.9 47 5 Bank of America Corp. 11,288 7.3 59 New Healthcare Lending Group added in Nashville during 2015 6 FB Financial Corp. 3,702 2.4 60 7 Franklin Financial Network Inc. 3,401 2.2 14 . th 8 U.S. Bancorp 3,166 2.0 102 Tennessee ranked 4 best state to do business, per Area Development magazine 9 BB&T Corp. 2,973 1.9 42 10 Wells Fargo & Co. 2,234 1.4 19 Driven by VW, Nissan and GM, Tennessee named the #1 state in the nation for 16 Renasant Corp. 1,388 0.9 19 automotive manufacturing strength Total Market 154,893 100.0 2,055 Unemployment rate continues to improve declining to 3.4% from 10.4% in January 2010, down 1.6% since last November . In the Nashville market, Hospital Corporation of American announced an Deposit Market Share by County – Top 5 Presence in 1 of 8 counties expansion that will create 2,000 jobs . #1 single-family housing market in the country 12.0% 10.9% Housing prices appreciated 8% in the last year, and 23.3% in the last 3 years . 9.0% The Memphis MSA market ranked #1 for Logistics Leaders both nationally and globally Bass Pro Shops, $70 million hotel in conjunction with their Pyramid 6.0% flagship store . 2.8% Fortune 500 company, Royal Phillips to expand in Tennessee, creating nearly 3.0% 2.4% 2.4% 1,000 jobs in Nashville and Franklin 1.4% 1.2% 0.7% 0.9% 0.0% Blount Shelby Sumner Sullivan Crockett Davidson Williamson Washington Deposit Market 8 12 18 8 11 16 3 9 Share 38 Source: S&P Global Intelligence - Green highlighting denotes top 5 deposit market share in respective county Rank Deposit data as of 6/30/18
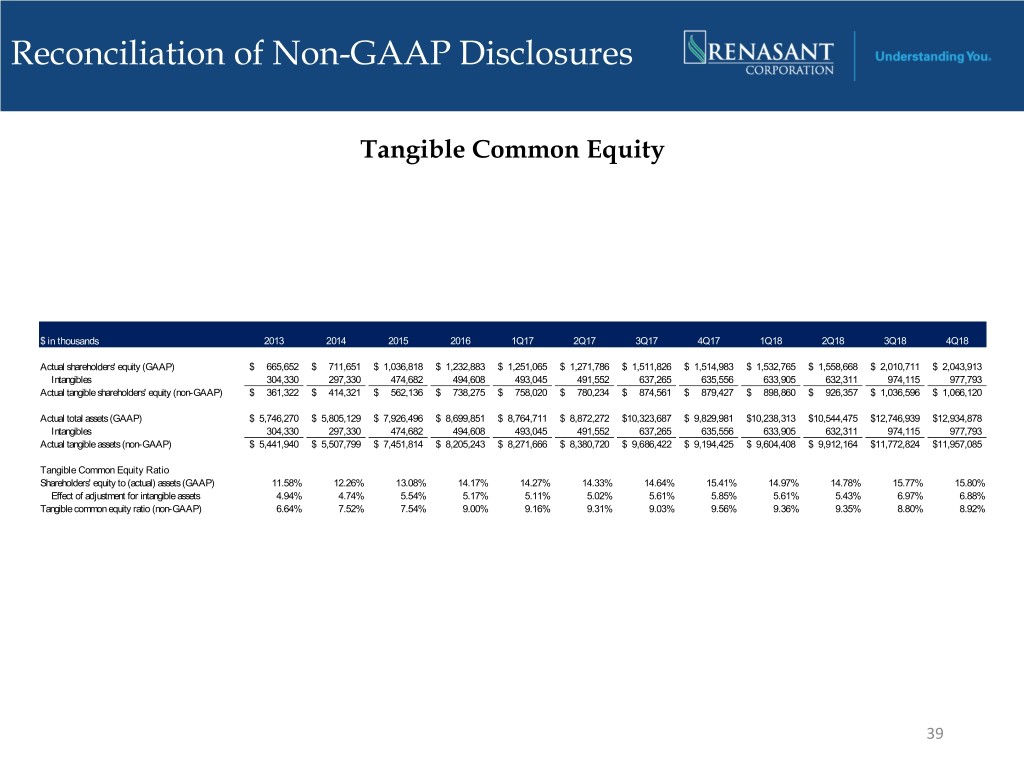
Reconciliation of Non-GAAP Disclosures Tangible Common Equity $ in thousands 2013 2014 2015 2016 1Q17 2Q17 3Q17 4Q17 1Q18 2Q18 3Q18 4Q18 Actual shareholders' equity (GAAP) $ 665,652 $ 711,651 $ 1,036,818 $ 1,232,883 $ 1,251,065 $ 1,271,786 $ 1,511,826 $ 1,514,983 $ 1,532,765 $ 1,558,668 $ 2,010,711 $ 2,043,913 Intangibles 304,330 297,330 474,682 494,608 493,045 491,552 637,265 635,556 633,905 632,311 974,115 977,793 Actual tangible shareholders' equity (non-GAAP) $ 361,322 $ 414,321 $ 562,136 $ 738,275 $ 758,020 $ 780,234 $ 874,561 $ 879,427 $ 898,860 $ 926,357 $ 1,036,596 $ 1,066,120 Actual total assets (GAAP) $ 5,746,270 $ 5,805,129 $ 7,926,496 $ 8,699,851 $ 8,764,711 $ 8,872,272 $10,323,687 $ 9,829,981 $10,238,313 $10,544,475 $12,746,939 $12,934,878 Intangibles 304,330 297,330 474,682 494,608 493,045 491,552 637,265 635,556 633,905 632,311 974,115 977,793 Actual tangible assets (non-GAAP) $ 5,441,940 $ 5,507,799 $ 7,451,814 $ 8,205,243 $ 8,271,666 $ 8,380,720 $ 9,686,422 $ 9,194,425 $ 9,604,408 $ 9,912,164 $11,772,824 $11,957,085 Tangible Common Equity Ratio Shareholders' equity to (actual) assets (GAAP) 11.58% 12.26% 13.08% 14.17% 14.27% 14.33% 14.64% 15.41% 14.97% 14.78% 15.77% 15.80% Effect of adjustment for intangible assets 4.94% 4.74% 5.54% 5.17% 5.11% 5.02% 5.61% 5.85% 5.61% 5.43% 6.97% 6.88% Tangible common equity ratio (non-GAAP) 6.64% 7.52% 7.54% 9.00% 9.16% 9.31% 9.03% 9.56% 9.36% 9.35% 8.80% 8.92% 39
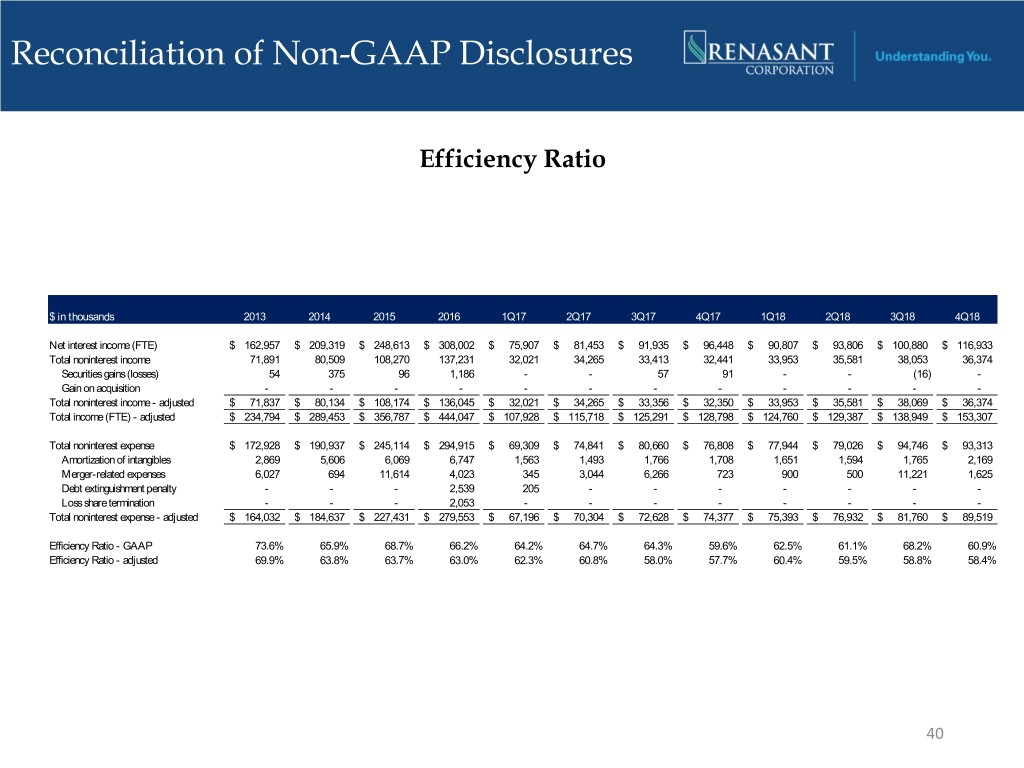
Reconciliation of Non-GAAP Disclosures Efficiency Ratio $ in thousands 2013 2014 2015 2016 1Q17 2Q17 3Q17 4Q17 1Q18 2Q18 3Q18 4Q18 Net interest income (FTE) $ 162,957 $ 209,319 $ 248,613 $ 308,002 $ 75,907 $ 81,453 $ 91,935 $ 96,448 $ 90,807 $ 93,806 $ 100,880 $ 116,933 Total noninterest income 71,891 80,509 108,270 137,231 32,021 34,265 33,413 32,441 33,953 35,581 38,053 36,374 Securities gains (losses) 54 375 96 1,186 - - 57 91 - - (16) - Gain on acquisition - - - - - - - - - - - - Total noninterest income - adjusted $ 71,837 $ 80,134 $ 108,174 $ 136,045 $ 32,021 $ 34,265 $ 33,356 $ 32,350 $ 33,953 $ 35,581 $ 38,069 $ 36,374 Total income (FTE) - adjusted $ 234,794 $ 289,453 $ 356,787 $ 444,047 $ 107,928 $ 115,718 $ 125,291 $ 128,798 $ 124,760 $ 129,387 $ 138,949 $ 153,307 Total noninterest expense $ 172,928 $ 190,937 $ 245,114 $ 294,915 $ 69,309 $ 74,841 $ 80,660 $ 76,808 $ 77,944 $ 79,026 $ 94,746 $ 93,313 Amortization of intangibles 2,869 5,606 6,069 6,747 1,563 1,493 1,766 1,708 1,651 1,594 1,765 2,169 Merger-related expenses 6,027 694 11,614 4,023 345 3,044 6,266 723 900 500 11,221 1,625 Debt extinguishment penalty - - - 2,539 205 - - - - - - - Loss share termination - - - 2,053 - - - - - - - - Total noninterest expense - adjusted $ 164,032 $ 184,637 $ 227,431 $ 279,553 $ 67,196 $ 70,304 $ 72,628 $ 74,377 $ 75,393 $ 76,932 $ 81,760 $ 89,519 Efficiency Ratio - GAAP 73.6% 65.9% 68.7% 66.2% 64.2% 64.7% 64.3% 59.6% 62.5% 61.1% 68.2% 60.9% Efficiency Ratio - adjusted 69.9% 63.8% 63.7% 63.0% 62.3% 60.8% 58.0% 57.7% 60.4% 59.5% 58.8% 58.4% 40
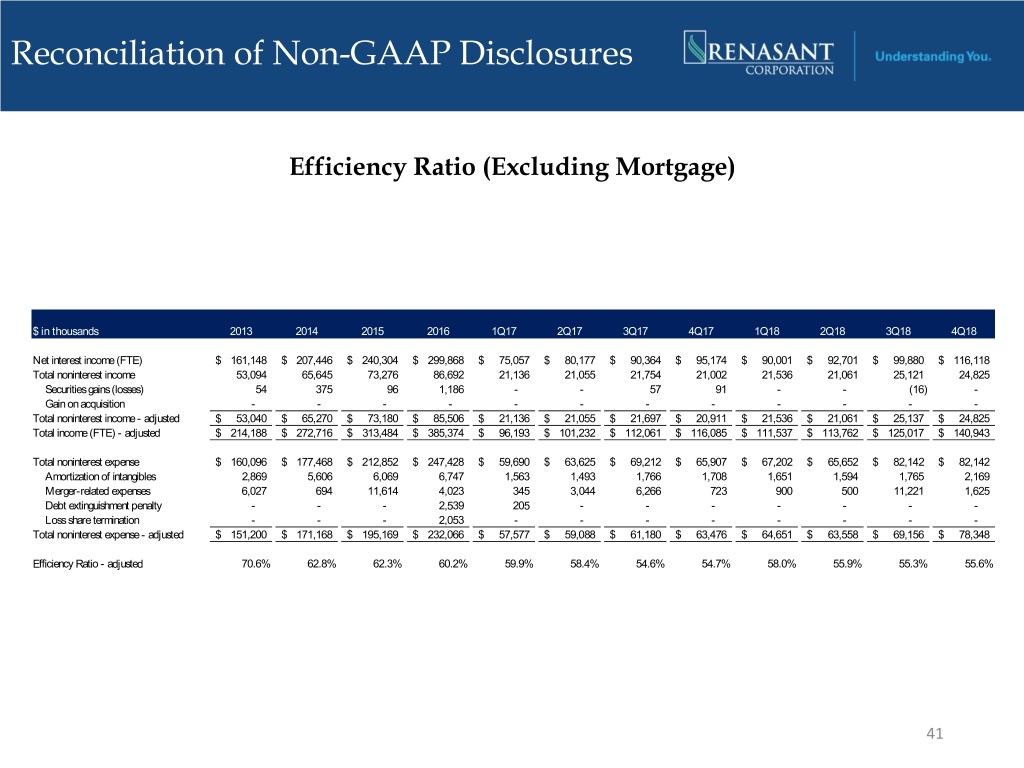
Reconciliation of Non-GAAP Disclosures Efficiency Ratio (Excluding Mortgage) $ in thousands 2013 2014 2015 2016 1Q17 2Q17 3Q17 4Q17 1Q18 2Q18 3Q18 4Q18 Net interest income (FTE) $ 161,148 $ 207,446 $ 240,304 $ 299,868 $ 75,057 $ 80,177 $ 90,364 $ 95,174 $ 90,001 $ 92,701 $ 99,880 $ 116,118 Total noninterest income 53,094 65,645 73,276 86,692 21,136 21,055 21,754 21,002 21,536 21,061 25,121 24,825 Securities gains (losses) 54 375 96 1,186 - - 57 91 - - (16) - Gain on acquisition - - - - - - - - - - - - Total noninterest income - adjusted $ 53,040 $ 65,270 $ 73,180 $ 85,506 $ 21,136 $ 21,055 $ 21,697 $ 20,911 $ 21,536 $ 21,061 $ 25,137 $ 24,825 Total income (FTE) - adjusted $ 214,188 $ 272,716 $ 313,484 $ 385,374 $ 96,193 $ 101,232 $ 112,061 $ 116,085 $ 111,537 $ 113,762 $ 125,017 $ 140,943 Total noninterest expense $ 160,096 $ 177,468 $ 212,852 $ 247,428 $ 59,690 $ 63,625 $ 69,212 $ 65,907 $ 67,202 $ 65,652 $ 82,142 $ 82,142 Amortization of intangibles 2,869 5,606 6,069 6,747 1,563 1,493 1,766 1,708 1,651 1,594 1,765 2,169 Merger-related expenses 6,027 694 11,614 4,023 345 3,044 6,266 723 900 500 11,221 1,625 Debt extinguishment penalty - - - 2,539 205 - - - - - - - Loss share termination - - - 2,053 - - - - - - - - Total noninterest expense - adjusted $ 151,200 $ 171,168 $ 195,169 $ 232,066 $ 57,577 $ 59,088 $ 61,180 $ 63,476 $ 64,651 $ 63,558 $ 69,156 $ 78,348 Efficiency Ratio - adjusted 70.6% 62.8% 62.3% 60.2% 59.9% 58.4% 54.6% 54.7% 58.0% 55.9% 55.3% 55.6% 41
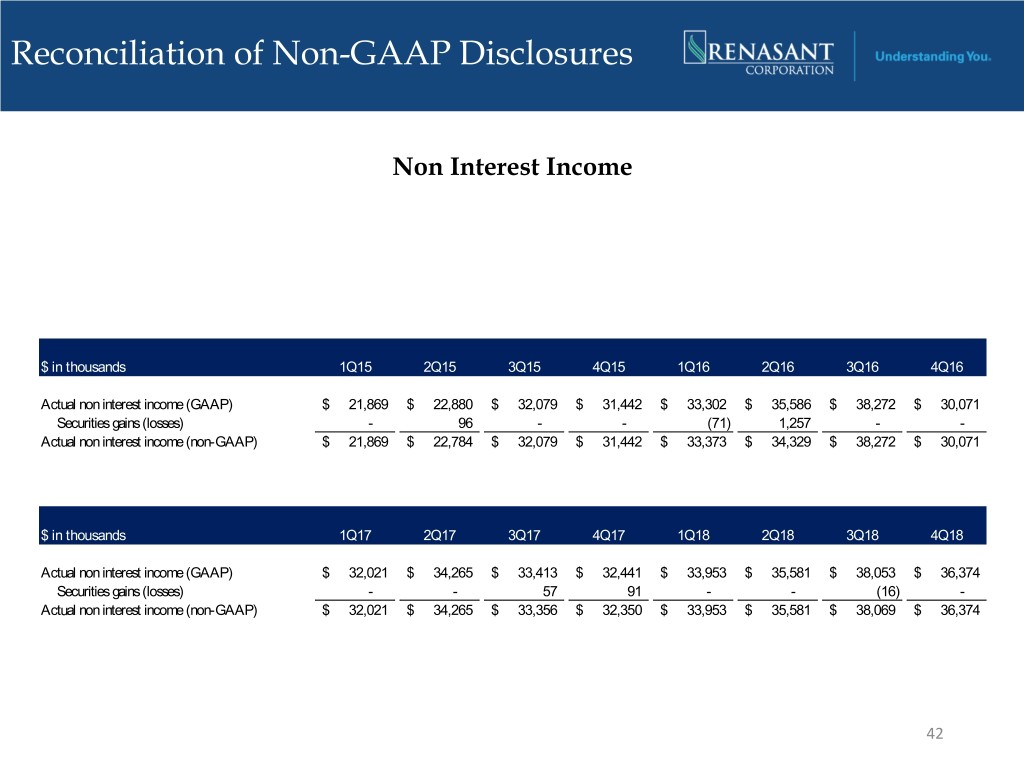
Reconciliation of Non-GAAP Disclosures Non Interest Income $ in thousands 1Q15 2Q15 3Q15 4Q15 1Q16 2Q16 3Q16 4Q16 Actual non interest income (GAAP) $ 21,869 $ 22,880 $ 32,079 $ 31,442 $ 33,302 $ 35,586 $ 38,272 $ 30,071 Securities gains (losses) - 96 - - (71) 1,257 - - Actual non interest income (non-GAAP) $ 21,869 $ 22,784 $ 32,079 $ 31,442 $ 33,373 $ 34,329 $ 38,272 $ 30,071 $ in thousands 1Q17 2Q17 3Q17 4Q17 1Q18 2Q18 3Q18 4Q18 Actual non interest income (GAAP) $ 32,021 $ 34,265 $ 33,413 $ 32,441 $ 33,953 $ 35,581 $ 38,053 $ 36,374 Securities gains (losses) - - 57 91 - - (16) - Actual non interest income (non-GAAP) $ 32,021 $ 34,265 $ 33,356 $ 32,350 $ 33,953 $ 35,581 $ 38,069 $ 36,374 42
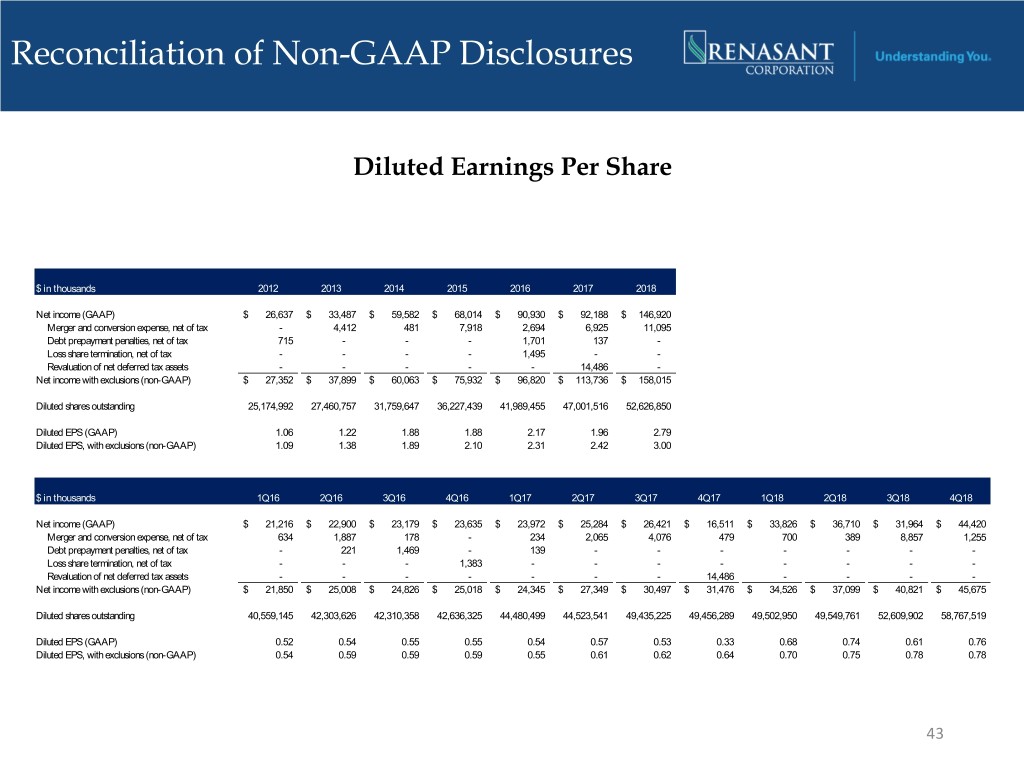
Reconciliation of Non-GAAP Disclosures Diluted Earnings Per Share $ in thousands 2012 2013 2014 2015 2016 2017 2018 Net income (GAAP) $ 26,637 $ 33,487 $ 59,582 $ 68,014 $ 90,930 $ 92,188 $ 146,920 Merger and conversion expense, net of tax - 4,412 481 7,918 2,694 6,925 11,095 Debt prepayment penalties, net of tax 715 - - - 1,701 137 - Loss share termination, net of tax - - - - 1,495 - - Revaluation of net deferred tax assets - - - - - 14,486 - Net income with exclusions (non-GAAP) $ 27,352 $ 37,899 $ 60,063 $ 75,932 $ 96,820 $ 113,736 $ 158,015 Diluted shares outstanding 25,174,992 27,460,757 31,759,647 36,227,439 41,989,455 47,001,516 52,626,850 Diluted EPS (GAAP) 1.06 1.22 1.88 1.88 2.17 1.96 2.79 Diluted EPS, with exclusions (non-GAAP) 1.09 1.38 1.89 2.10 2.31 2.42 3.00 $ in thousands 1Q16 2Q16 3Q16 4Q16 1Q17 2Q17 3Q17 4Q17 1Q18 2Q18 3Q18 4Q18 Net income (GAAP) $ 21,216 $ 22,900 $ 23,179 $ 23,635 $ 23,972 $ 25,284 $ 26,421 $ 16,511 $ 33,826 $ 36,710 $ 31,964 $ 44,420 Merger and conversion expense, net of tax 634 1,887 178 - 234 2,065 4,076 479 700 389 8,857 1,255 Debt prepayment penalties, net of tax - 221 1,469 - 139 - - - - - - - Loss share termination, net of tax - - - 1,383 - - - - - - - - Revaluation of net deferred tax assets - - - - - - - 14,486 - - - - Net income with exclusions (non-GAAP) $ 21,850 $ 25,008 $ 24,826 $ 25,018 $ 24,345 $ 27,349 $ 30,497 $ 31,476 $ 34,526 $ 37,099 $ 40,821 $ 45,675 Diluted shares outstanding 40,559,145 42,303,626 42,310,358 42,636,325 44,480,499 44,523,541 49,435,225 49,456,289 49,502,950 49,549,761 52,609,902 58,767,519 Diluted EPS (GAAP) 0.52 0.54 0.55 0.55 0.54 0.57 0.53 0.33 0.68 0.74 0.61 0.76 Diluted EPS, with exclusions (non-GAAP) 0.54 0.59 0.59 0.59 0.55 0.61 0.62 0.64 0.70 0.75 0.78 0.78 43
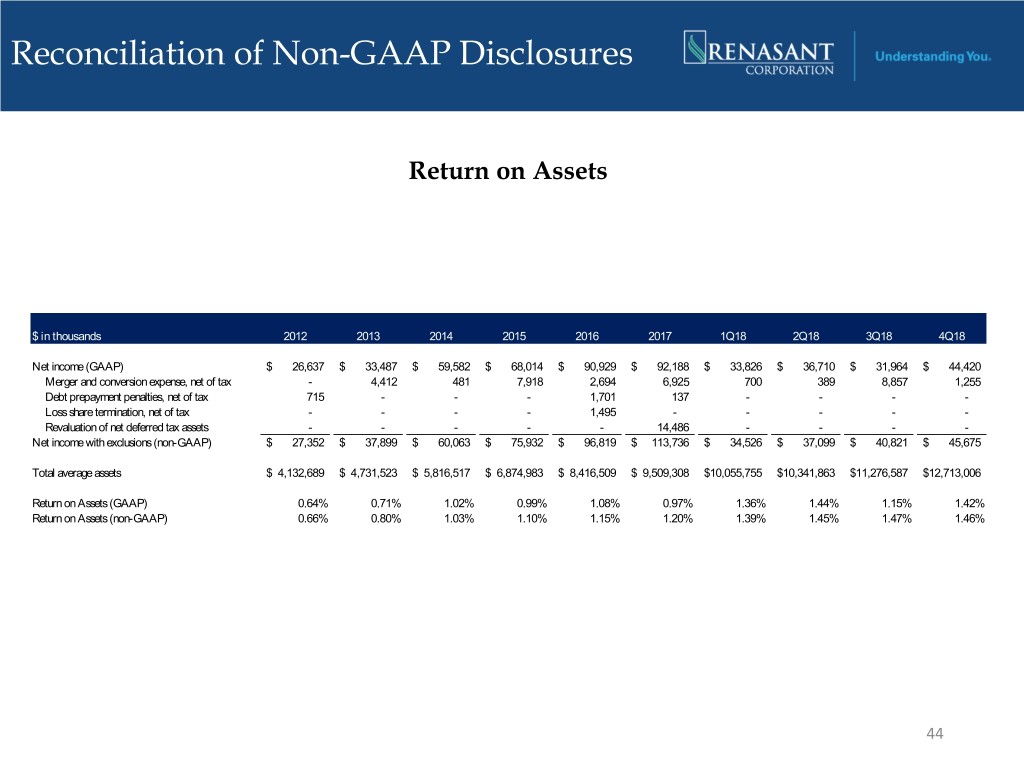
Reconciliation of Non-GAAP Disclosures Return on Assets $ in thousands 2012 2013 2014 2015 2016 2017 1Q18 2Q18 3Q18 4Q18 Net income (GAAP) $ 26,637 $ 33,487 $ 59,582 $ 68,014 $ 90,929 $ 92,188 $ 33,826 $ 36,710 $ 31,964 $ 44,420 Merger and conversion expense, net of tax - 4,412 481 7,918 2,694 6,925 700 389 8,857 1,255 Debt prepayment penalties, net of tax 715 - - - 1,701 137 - - - - Loss share termination, net of tax - - - - 1,495 - - - - - Revaluation of net deferred tax assets - - - - - 14,486 - - - - Net income with exclusions (non-GAAP) $ 27,352 $ 37,899 $ 60,063 $ 75,932 $ 96,819 $ 113,736 $ 34,526 $ 37,099 $ 40,821 $ 45,675 Total average assets $ 4,132,689 $ 4,731,523 $ 5,816,517 $ 6,874,983 $ 8,416,509 $ 9,509,308 $10,055,755 $10,341,863 $11,276,587 $12,713,006 Return on Assets (GAAP) 0.64% 0.71% 1.02% 0.99% 1.08% 0.97% 1.36% 1.44% 1.15% 1.42% Return on Assets (non-GAAP) 0.66% 0.80% 1.03% 1.10% 1.15% 1.20% 1.39% 1.45% 1.47% 1.46% 44
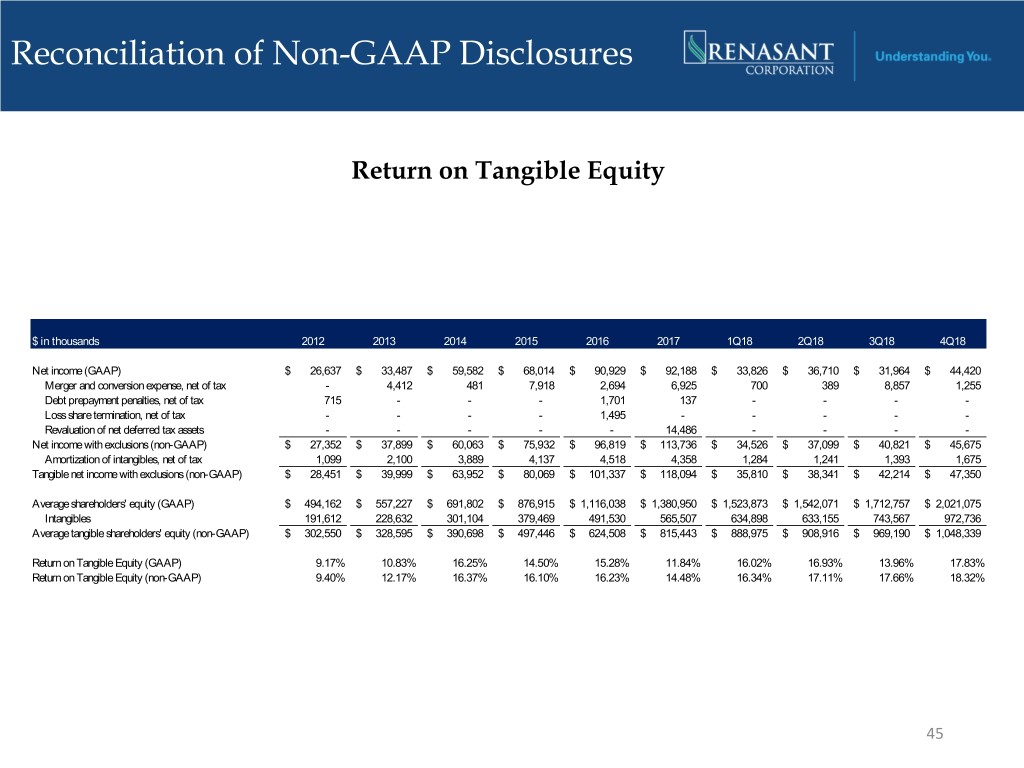
Reconciliation of Non-GAAP Disclosures Return on Tangible Equity $ in thousands 2012 2013 2014 2015 2016 2017 1Q18 2Q18 3Q18 4Q18 Net income (GAAP) $ 26,637 $ 33,487 $ 59,582 $ 68,014 $ 90,929 $ 92,188 $ 33,826 $ 36,710 $ 31,964 $ 44,420 Merger and conversion expense, net of tax - 4,412 481 7,918 2,694 6,925 700 389 8,857 1,255 Debt prepayment penalties, net of tax 715 - - - 1,701 137 - - - - Loss share termination, net of tax - - - - 1,495 - - - - - Revaluation of net deferred tax assets - - - - - 14,486 - - - - Net income with exclusions (non-GAAP) $ 27,352 $ 37,899 $ 60,063 $ 75,932 $ 96,819 $ 113,736 $ 34,526 $ 37,099 $ 40,821 $ 45,675 Amortization of intangibles, net of tax 1,099 2,100 3,889 4,137 4,518 4,358 1,284 1,241 1,393 1,675 Tangible net income with exclusions (non-GAAP) $ 28,451 $ 39,999 $ 63,952 $ 80,069 $ 101,337 $ 118,094 $ 35,810 $ 38,341 $ 42,214 $ 47,350 Average shareholders' equity (GAAP) $ 494,162 $ 557,227 $ 691,802 $ 876,915 $ 1,116,038 $ 1,380,950 $ 1,523,873 $ 1,542,071 $ 1,712,757 $ 2,021,075 Intangibles 191,612 228,632 301,104 379,469 491,530 565,507 634,898 633,155 743,567 972,736 Average tangible shareholders' equity (non-GAAP) $ 302,550 $ 328,595 $ 390,698 $ 497,446 $ 624,508 $ 815,443 $ 888,975 $ 908,916 $ 969,190 $ 1,048,339 Return on Tangible Equity (GAAP) 9.17% 10.83% 16.25% 14.50% 15.28% 11.84% 16.02% 16.93% 13.96% 17.83% Return on Tangible Equity (non-GAAP) 9.40% 12.17% 16.37% 16.10% 16.23% 14.48% 16.34% 17.11% 17.66% 18.32% 45
Investor Inquiries E. Robinson McGraw Chairman of the Board and Executive Chairman 209 TROY STREET TUPELO, MS 38804-4827 C. Mitchell Waycaster President and Chief Executive Officer PHONE: 1-800-680-1601 FACSIMILE: 1-662-680-1234 Kevin D. Chapman WWW.RENASANT.COM Senior Executive Vice President, WWW.RENASANTBANK.COM Chief Financial Officer and Chief Operating Officer 46


