Q1 2020 Investor Presentation Financial Information – December 31, 2019
Forward-Looking Statements This presentation may contain or incorporate by reference various statements about Renasant Corporation (“Renasant,” “we,” “our,” or “us”) that constitute “forward-looking statements” within the meaning of Section 27A of the Securities Act of 1933, as amended, and Section 21E of the Securities Exchange Act of 1934, as amended. Statements preceded by, followed by or that otherwise include the words “believes,” “expects,” “projects,” “anticipates,” “intends,” “estimates,” “plans,” “potential,” “possible,” “may increase,” “may fluctuate,” “will likely result,” and similar expressions, or future or conditional verbs such as “will,” “should,” “would” and “could,” are generally forward-looking in nature and not historical facts. Forward-looking statements include information about our future financial performance, business strategy, projected plans and objectivesand are based on the current beliefs and expectations of our management. Our management believes these forward-looking statements are reasonable, but they are inherently subject to significant business, economic and competitive risks and uncertainties, many of which are beyond our control. In addition, these forward-looking statements are subject to assumptions with respect to future business strategies and decisions that are subject to change. Actual results may differ from those indicated or implied in the forward-looking statements, and such differences may be material. Investors should understand that the following important factors, in addition to those discussed elsewhere in this presentation, could cause actual results to differ materially from those expressed in such forward-looking statements: (i) our ability to efficiently integrate acquisitions into our operations, retain the customers of these businesses and grow the acquired operations; (ii) the timing of the implementation of changes in operations to achieve enhanced earnings or effect cost savings; (iii) competitive pressures in the consumer finance, commercial finance, insurance, financial services, asset management, retail banking, mortgage lending and auto lending industries; (iv) the financial resources of, and products available to, competitors; (v) changes in laws and regulations as well as changes in accounting standards; (vi) changes in regulatory policy; (vii) changes in the securities and foreign exchange markets; (viii) our potential growth, including our entrance or expansion into new markets, and the need for sufficient capital to support that growth; (ix) changes in the quality or composition of our loan or investment portfolios, including adverse developments in borrower industries or in the repayment ability of individual borrowers; (x) an insufficient allowance for loan losses as a result of inaccurate assumptions; (xi) general market or business conditions; (xii) changes in demand for loan products and financial services; (xiii) concentration of credit exposure; (xiv) changes or the lack of changes in interest rates, yield curves and interest rate spread relationships; and (xv) other circumstances, many of which are beyond management’s control. We refer you to the additional risk factors that could cause results to differ materially from those described in this presentation contained in our Annual Report on Form 10-K for the year ended December 31, 2018 and any updates to those risk factors set forth in our Quarterly Reports on Form 10-Q, Current Reports on Form 8-K and other filings, all of which we have filed with the SEC and are available on the SEC’s website at www.sec.gov. All forward-looking statements, expressed or implied, included herein are expressly qualified in their entirety by the cautionary statements contained or referred to herein. We caution readers not to place undue reliance on any such forward-looking statements, which speak only as of the date on which they are made and are not guarantees of future performance. Renasant undertakes no obligation, and specifically declines any obligation, to revise or update any forward-looking statements, whether as a result of new information, future developments or otherwise, except as required by federal securities laws. 2

Current Footprint More than 190 banking, lending, wealth management and insurance offices Portfolio Loans* Northern 20% Eastern 36% Western 29% Central 15% Total Deposits* Northern 14% Eastern Western 36% 38% Central 12% * As of December 31, 2019. Portfolio Loans excludes loans held for sale. 3
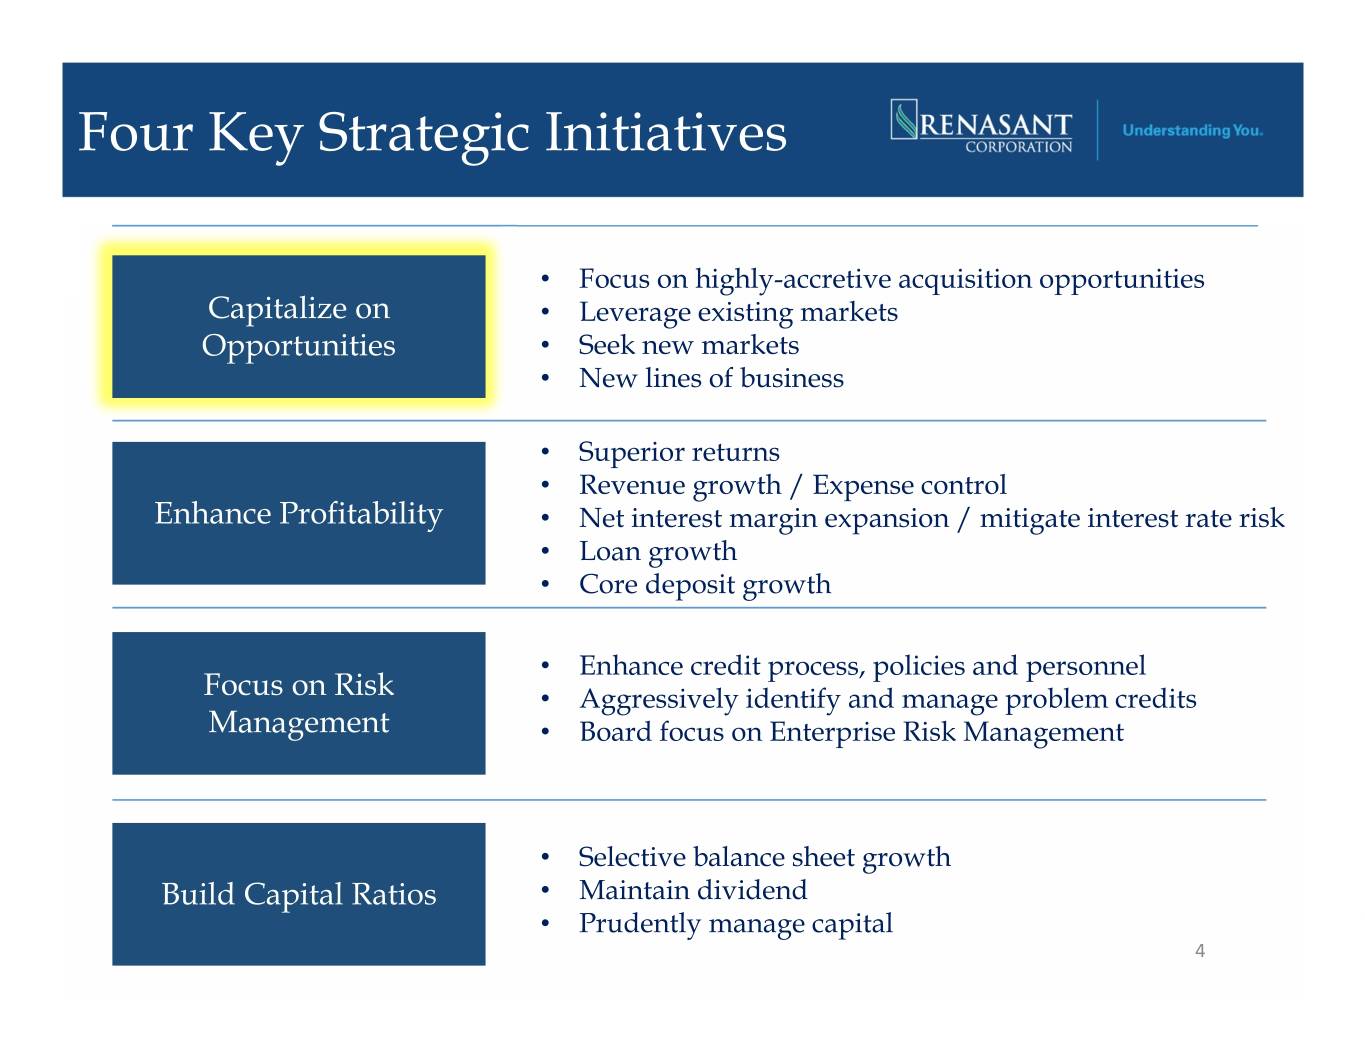
Four Key Strategic Initiatives • Focus on highly-accretive acquisition opportunities Capitalize on • Leverage existing markets Opportunities • Seek new markets • New lines of business • Superior returns • Revenue growth / Expense control Enhance Profitability • Net interest margin expansion / mitigate interest rate risk • Loan growth • Core deposit growth • Enhance credit process, policies and personnel Focus on Risk • Aggressively identify and manage problem credits Management • Board focus on Enterprise Risk Management • Selective balance sheet growth Build Capital Ratios • Maintain dividend • Prudently manage capital 4
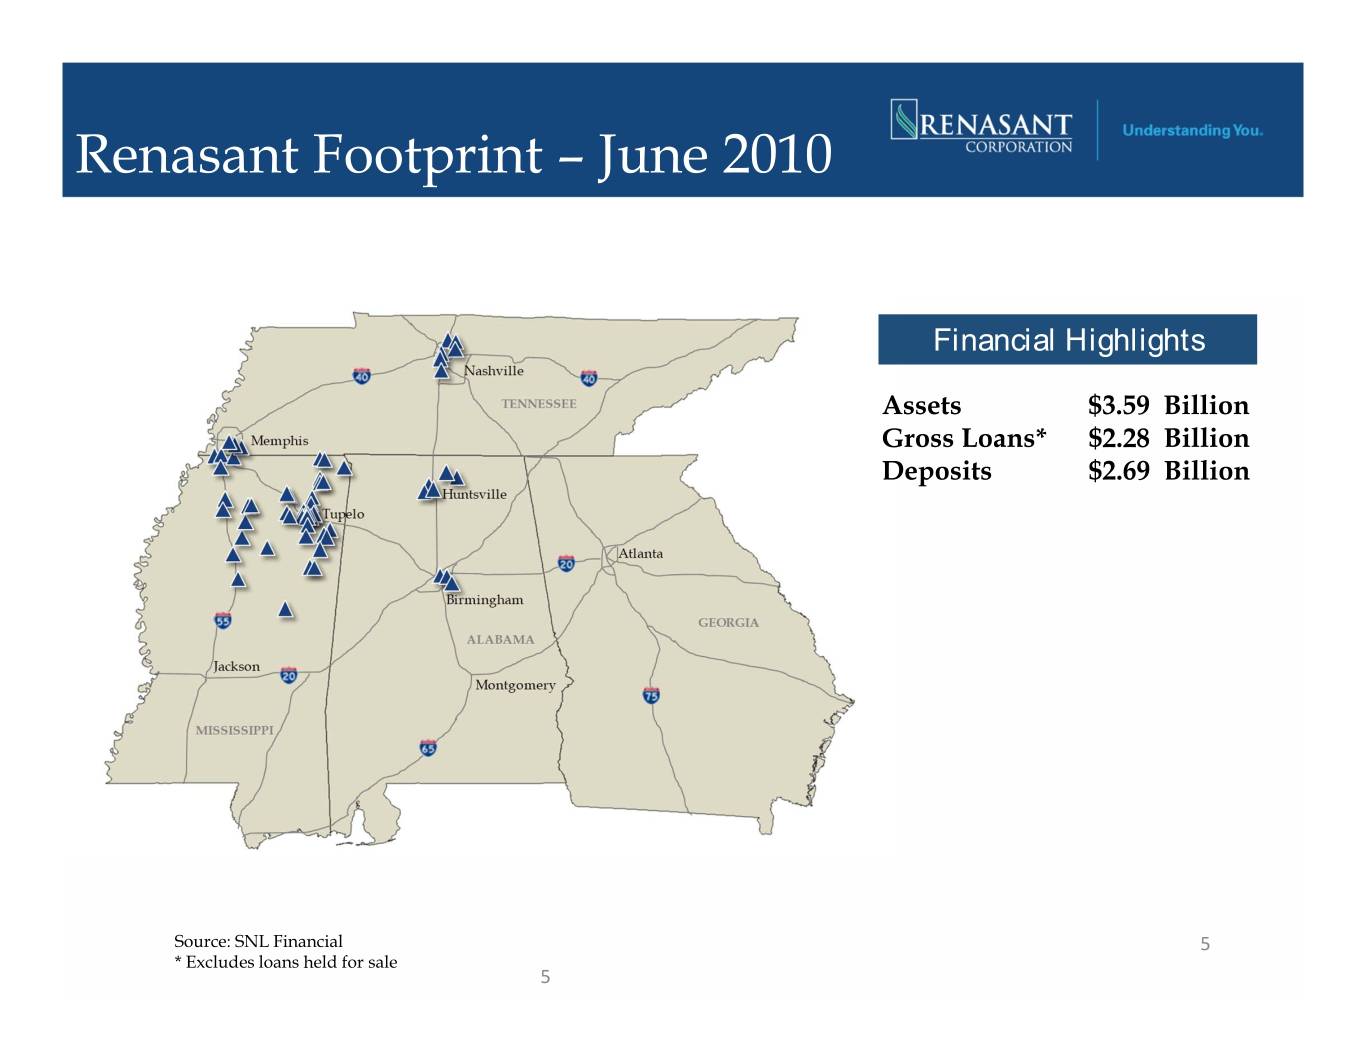
Renasant Footprint – June 2010 Financial Highlights Assets $3.59 Billion Gross Loans* $2.28 Billion Deposits $2.69 Billion Source: SNL Financial 5 * Excludes loans held for sale 5
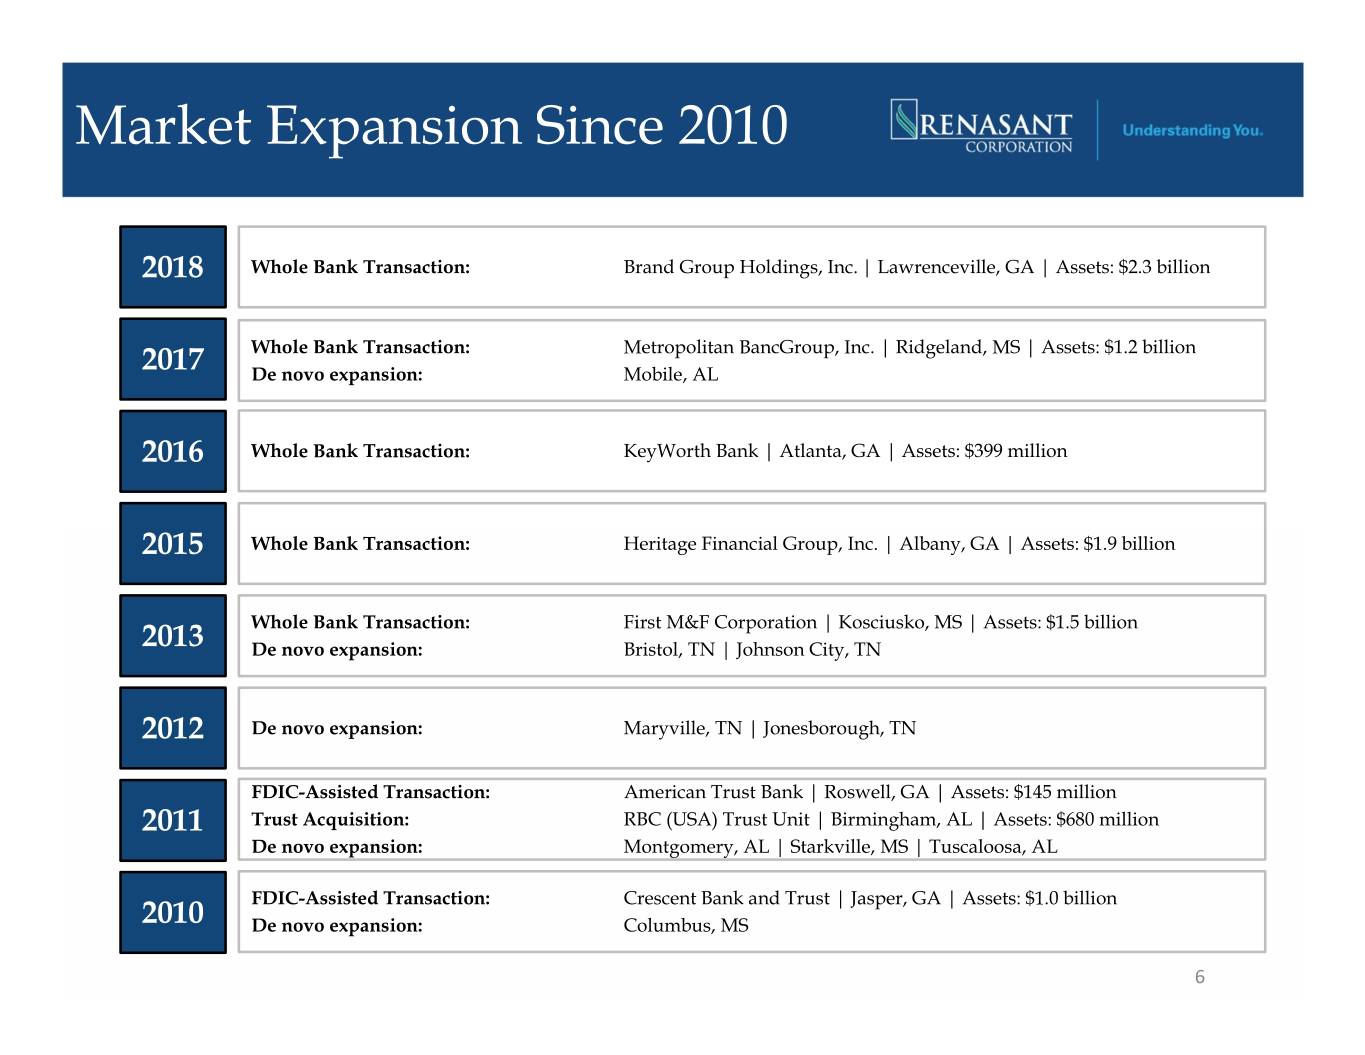
Market Expansion Since 2010 2018 Whole Bank Transaction: Brand Group Holdings, Inc. | Lawrenceville, GA | Assets: $2.3 billion Whole Bank Transaction: Metropolitan BancGroup, Inc. | Ridgeland, MS | Assets: $1.2 billion 2017 De novo expansion: Mobile, AL 2016 Whole Bank Transaction: KeyWorth Bank | Atlanta, GA | Assets: $399 million 2015 Whole Bank Transaction: Heritage Financial Group, Inc. | Albany, GA | Assets: $1.9 billion Whole Bank Transaction: First M&F Corporation | Kosciusko, MS | Assets: $1.5 billion 2013 De novo expansion: Bristol, TN | Johnson City, TN 2012 De novo expansion: Maryville, TN | Jonesborough, TN FDIC-Assisted Transaction: American Trust Bank | Roswell, GA | Assets: $145 million 2011 Trust Acquisition: RBC (USA) Trust Unit | Birmingham, AL | Assets: $680 million De novo expansion: Montgomery, AL | Starkville, MS | Tuscaloosa, AL FDIC-Assisted Transaction: Crescent Bank and Trust | Jasper, GA | Assets: $1.0 billion 2010 De novo expansion: Columbus, MS 6
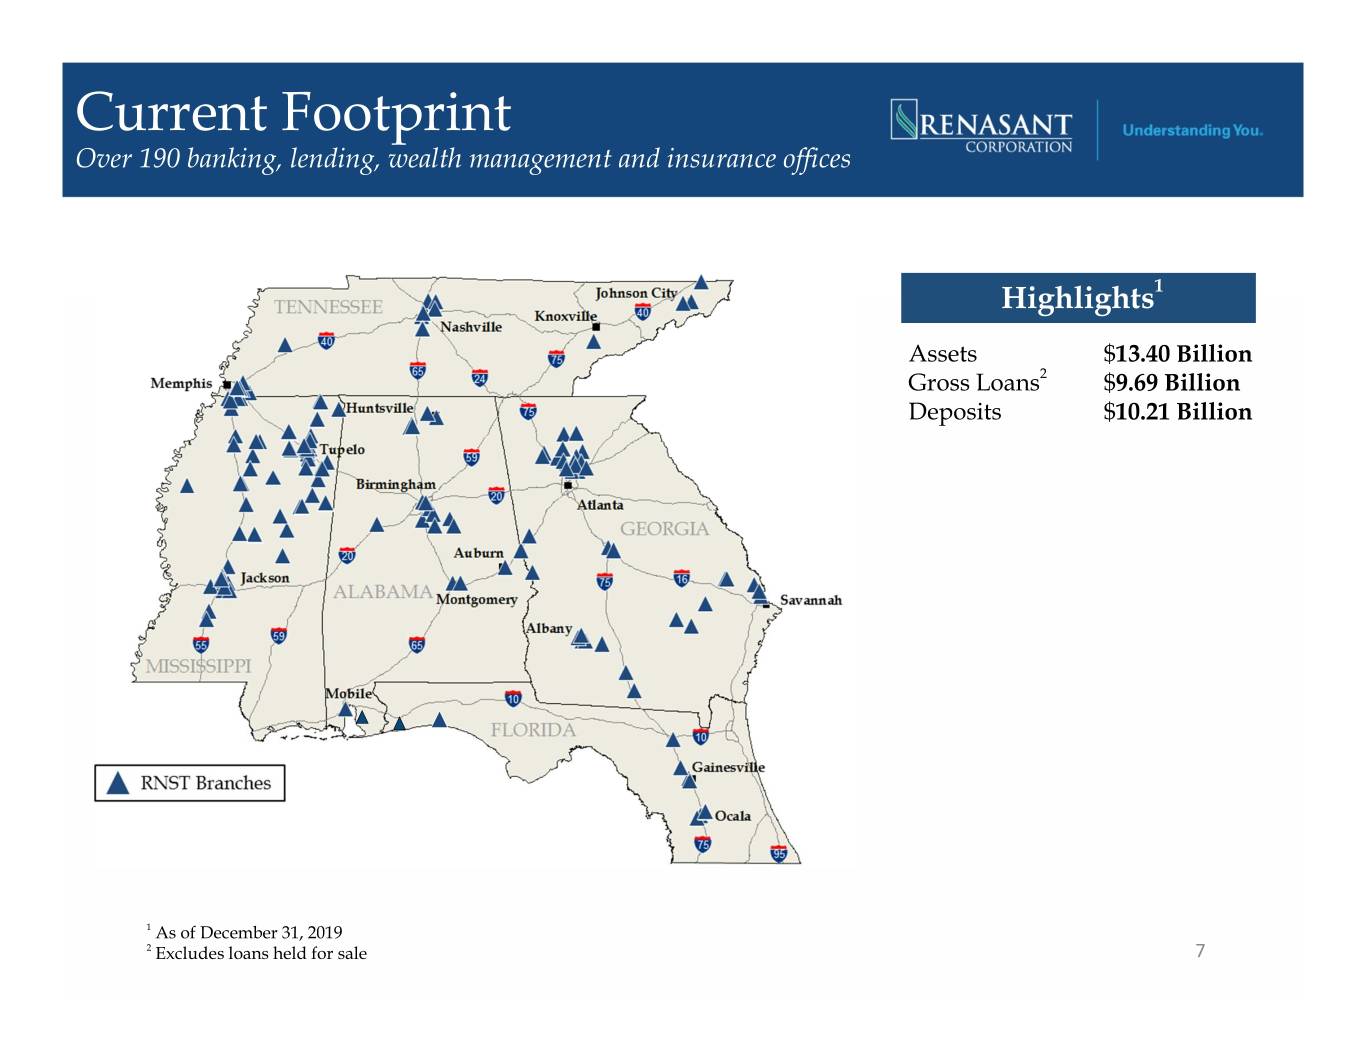
Current Footprint Over 190 banking, lending, wealth management and insurance offices Highlights1 Assets $13.40 Billion Gross Loans2 $9.69 Billion Deposits $10.21 Billion 1 As of December 31, 2019 2 Excludes loans held for sale 7
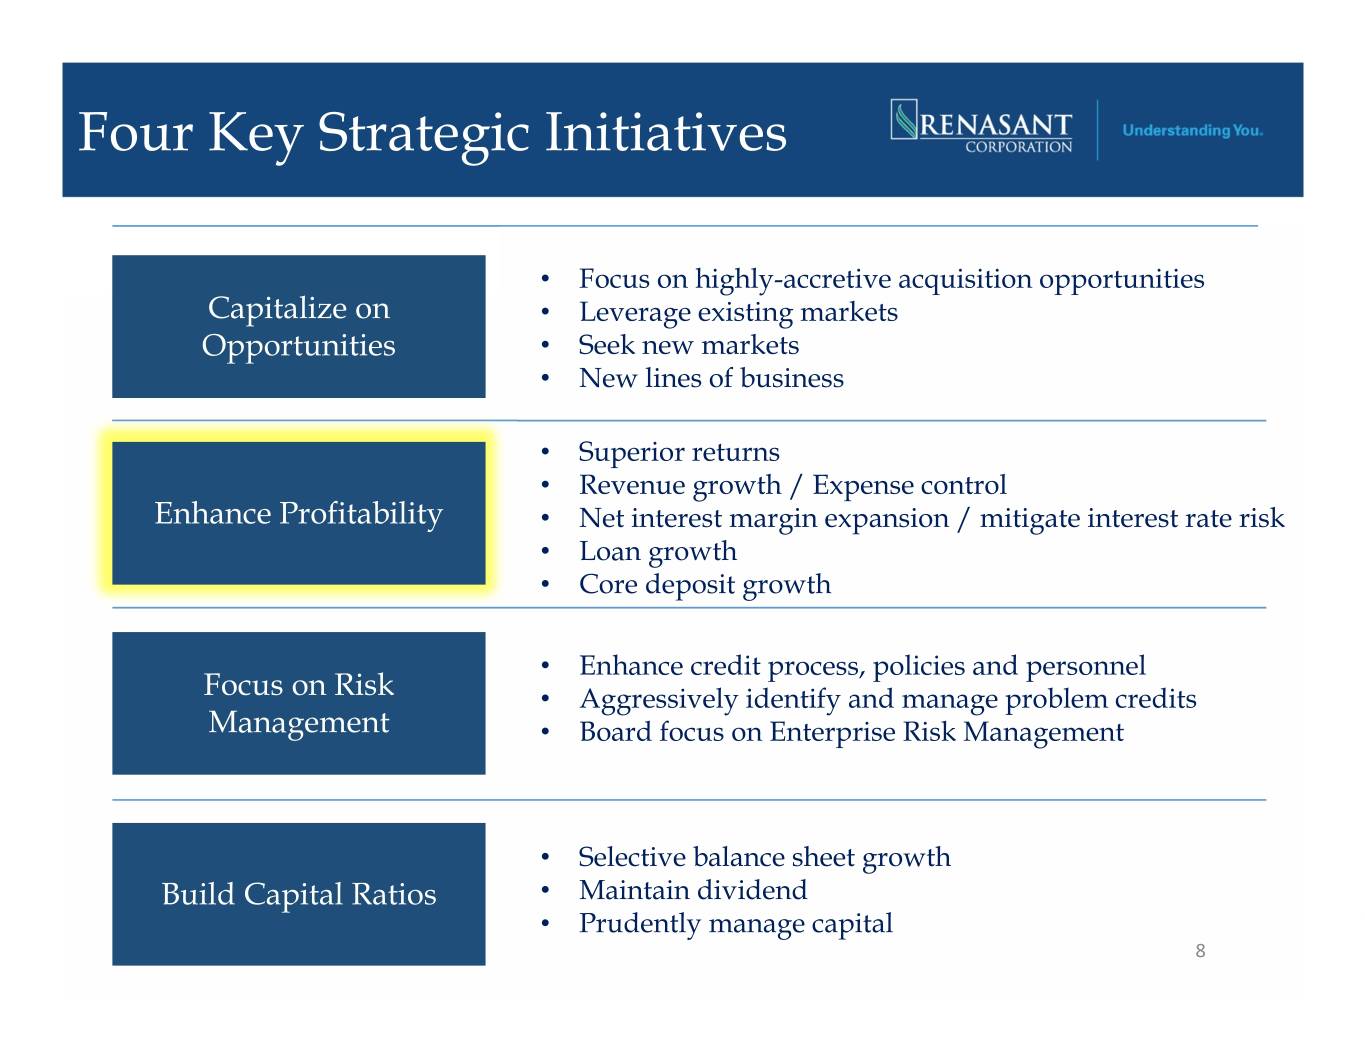
Four Key Strategic Initiatives • Focus on highly-accretive acquisition opportunities Capitalize on • Leverage existing markets Opportunities • Seek new markets • New lines of business • Superior returns • Revenue growth / Expense control Enhance Profitability • Net interest margin expansion / mitigate interest rate risk • Loan growth • Core deposit growth • Enhance credit process, policies and personnel Focus on Risk • Aggressively identify and manage problem credits Management • Board focus on Enterprise Risk Management • Selective balance sheet growth Build Capital Ratios • Maintain dividend • Prudently manage capital 8
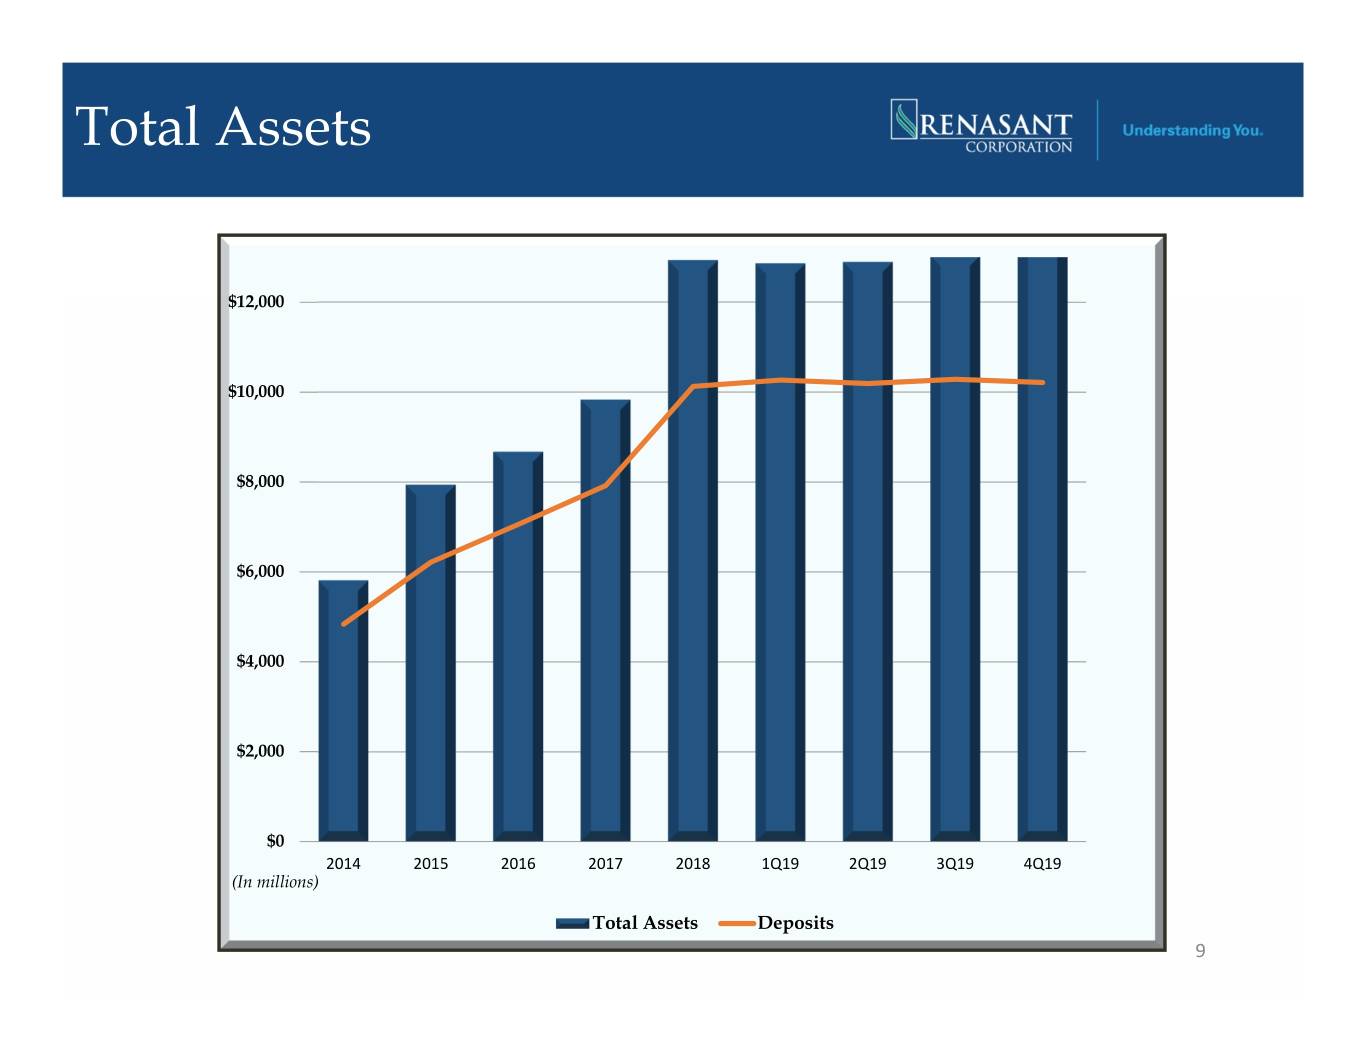
Total Assets $12,000 $10,000 $8,000 $6,000 $4,000 $2,000 $0 2014 2015 2016 2017 2018 1Q19 2Q19 3Q19 4Q19 (In millions) Total Assets Deposits 9
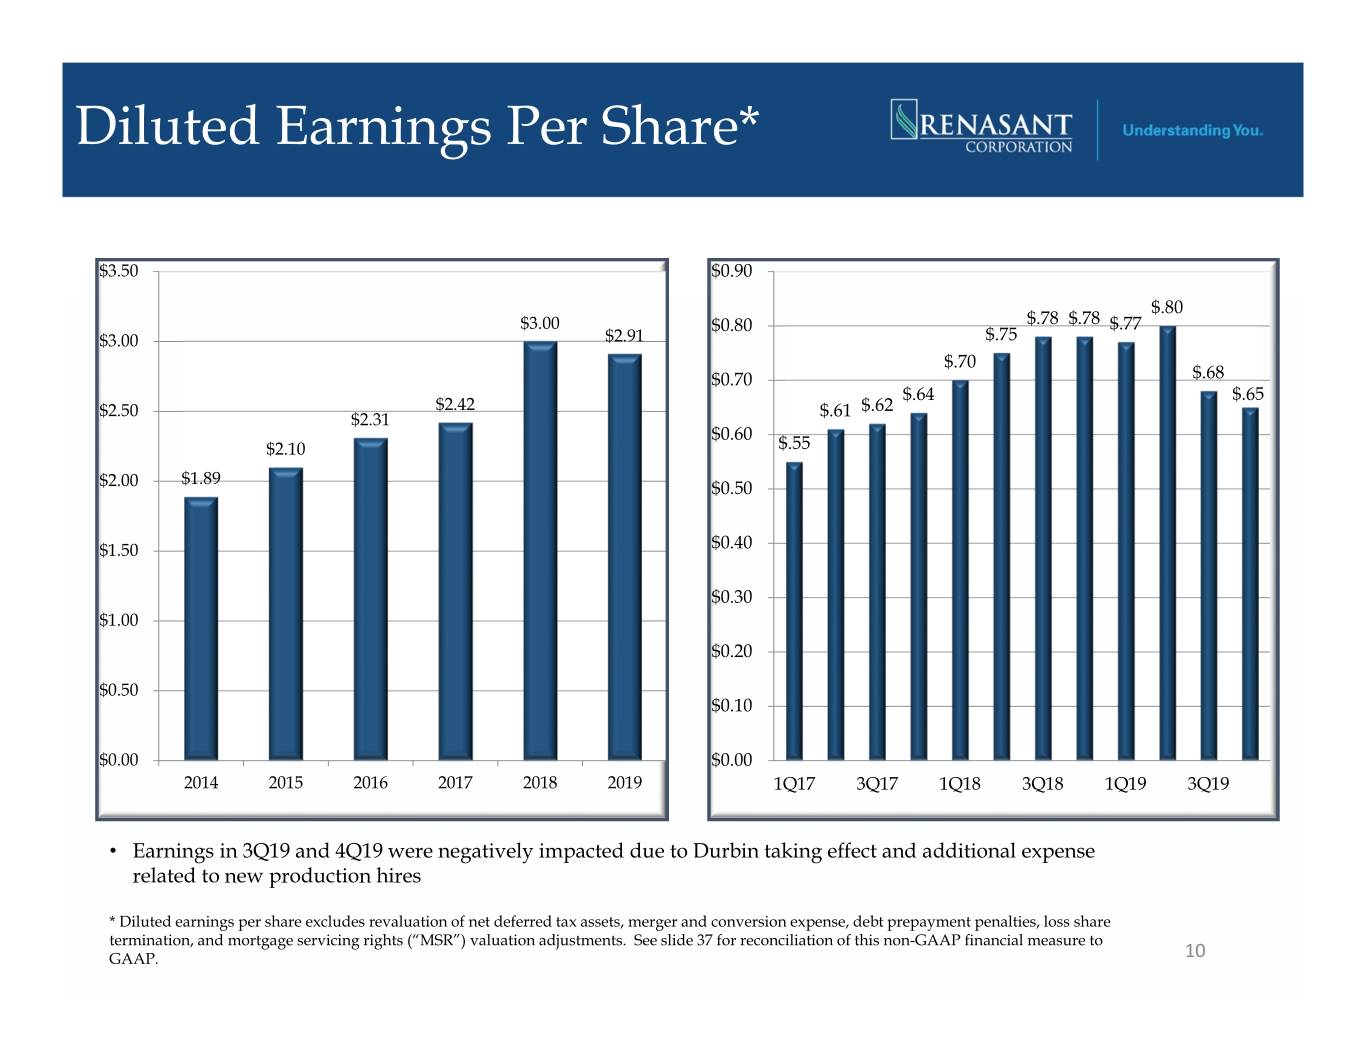
Diluted Earnings Per Share* $3.50 $0.90 $.80 $3.00 $0.80 $.78 $.78 $.77 $3.00 $2.91 $.75 $.70 $0.70 $.68 $.64 $.65 $2.50 $2.42 $.61 $.62 $2.31 $0.60 $2.10 $.55 $1.89 $2.00 $0.50 $1.50 $0.40 $0.30 $1.00 $0.20 $0.50 $0.10 $0.00 $0.00 2014 2015 2016 2017 2018 2019 1Q17 3Q17 1Q18 3Q18 1Q19 3Q19 • Earnings in 3Q19 and 4Q19 were negatively impacted due to Durbin taking effect and additional expense related to new production hires * Diluted earnings per share excludes revaluation of net deferred tax assets, merger and conversion expense, debt prepayment penalties, loss share termination, and mortgage servicing rights (“MSR”) valuation adjustments. See slide 37 for reconciliation of this non-GAAP financial measure to GAAP. 10
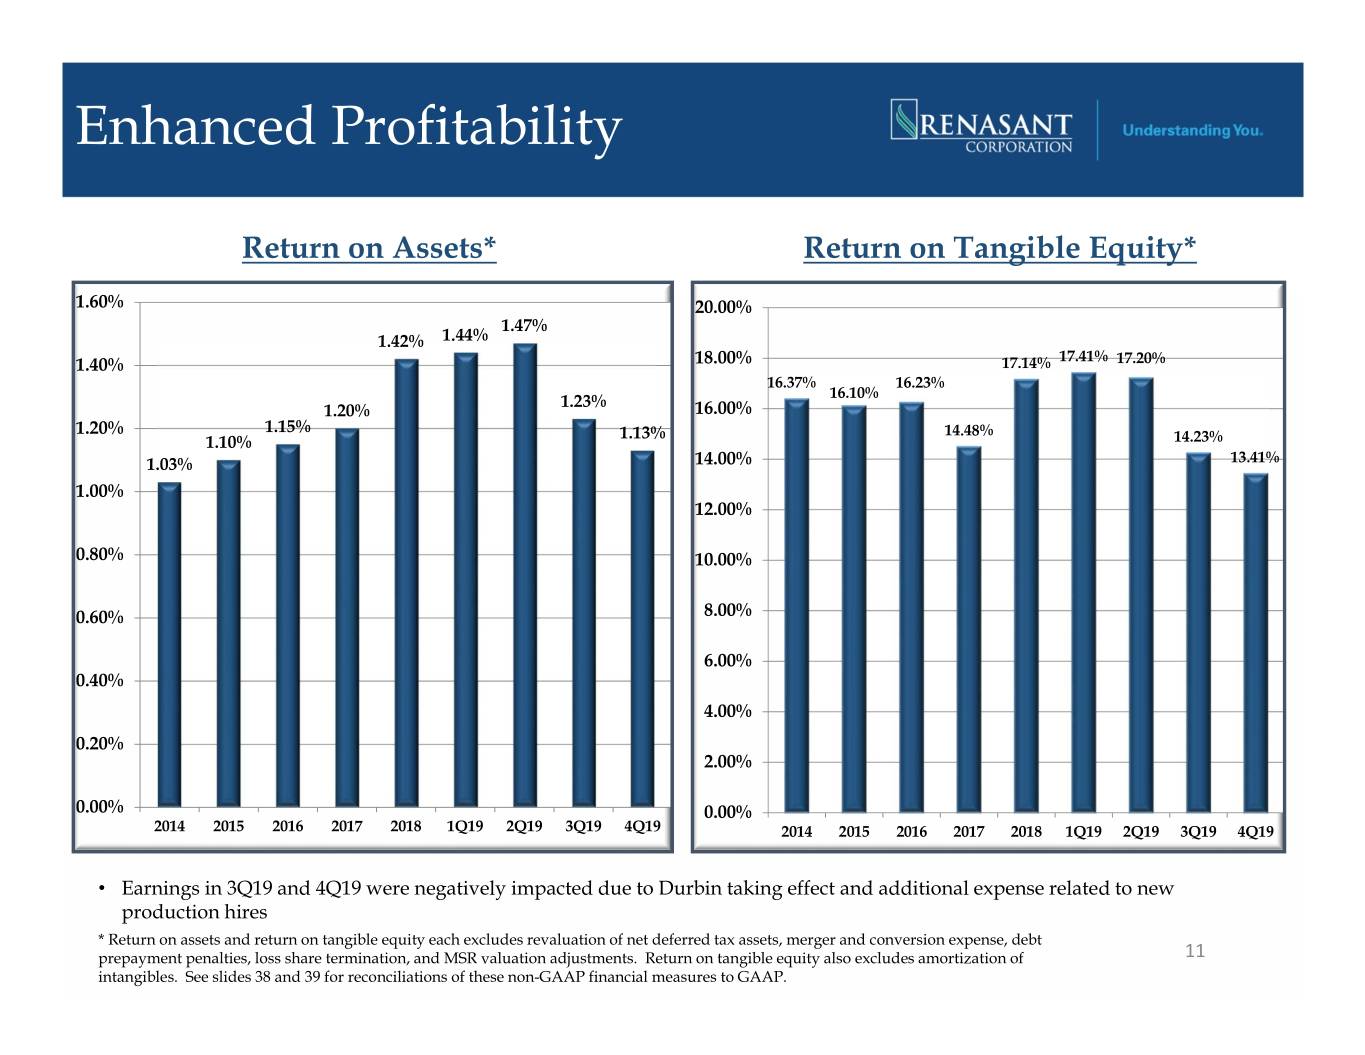
Enhanced Profitability Return on Assets* Return on Tangible Equity* 1.60% 20.00% 1.47% 1.42% 1.44% 1.40% 18.00% 17.14% 17.41% 17.20% 16.37% 16.23% 1.23% 16.10% 1.20% 16.00% 1.20% 1.15% 1.13% 14.48% 1.10% 14.23% 1.03% 14.00% 13.41% 1.00% 12.00% 0.80% 10.00% 0.60% 8.00% 6.00% 0.40% 4.00% 0.20% 2.00% 0.00% 0.00% 2014 2015 2016 2017 2018 1Q19 2Q19 3Q19 4Q19 2014 2015 2016 2017 2018 1Q19 2Q19 3Q19 4Q19 • Earnings in 3Q19 and 4Q19 were negatively impacted due to Durbin taking effect and additional expense related to new production hires * Return on assets and return on tangible equity each excludes revaluation of net deferred tax assets, merger and conversion expense, debt prepayment penalties, loss share termination, and MSR valuation adjustments. Return on tangible equity also excludes amortization of 11 intangibles. See slides 38 and 39 for reconciliations of these non-GAAP financial measures to GAAP.

Total Portfolio Loans $10,000,000 • Loans not purchased increased $9,000,000 $556 million, or 31% annualized, $8,000,000 during 4Q19 $7,000,000 • Loan production for 4Q19 was $6,000,000 $837 million $5,000,000 • Company maintains strong $4,000,000 pipelines throughout all $3,000,000 markets and lines of business, $2,000,000 which will continue to drive further loan growth $1,000,000 $0 2014 2015 2016 2017 2018 1Q19 2Q19 3Q19 4Q19 ($ in thousands) Not Purchased Purchased Covered Purchased ($ in millions) 2014 2015 2016 2017 2018 1Q19 2Q19 3Q19 4Q19 Not $3,268 $3,830 $4,714 $5,588 $6,390 $6,565 $6,704 $7,032 $7,588 Purchased Purchased 1 $143 $93 - - - - - - - Covered Purchased $577 $1,490 $1,489 $2,032 $2,693 $2,523 $2,350 $2,282 $2,102 Not Covered Total Loans 2 $3,988 $5,413 $6,203 $7,620 $9,083 $9,088 $9,055 $9,314 $9,690 1 Covered loans are subject to loss-share agreements with FDIC. Loss-share agreements with FDIC were terminated in 4Q16. 2 Total Loans excludes loans held for sale. 12
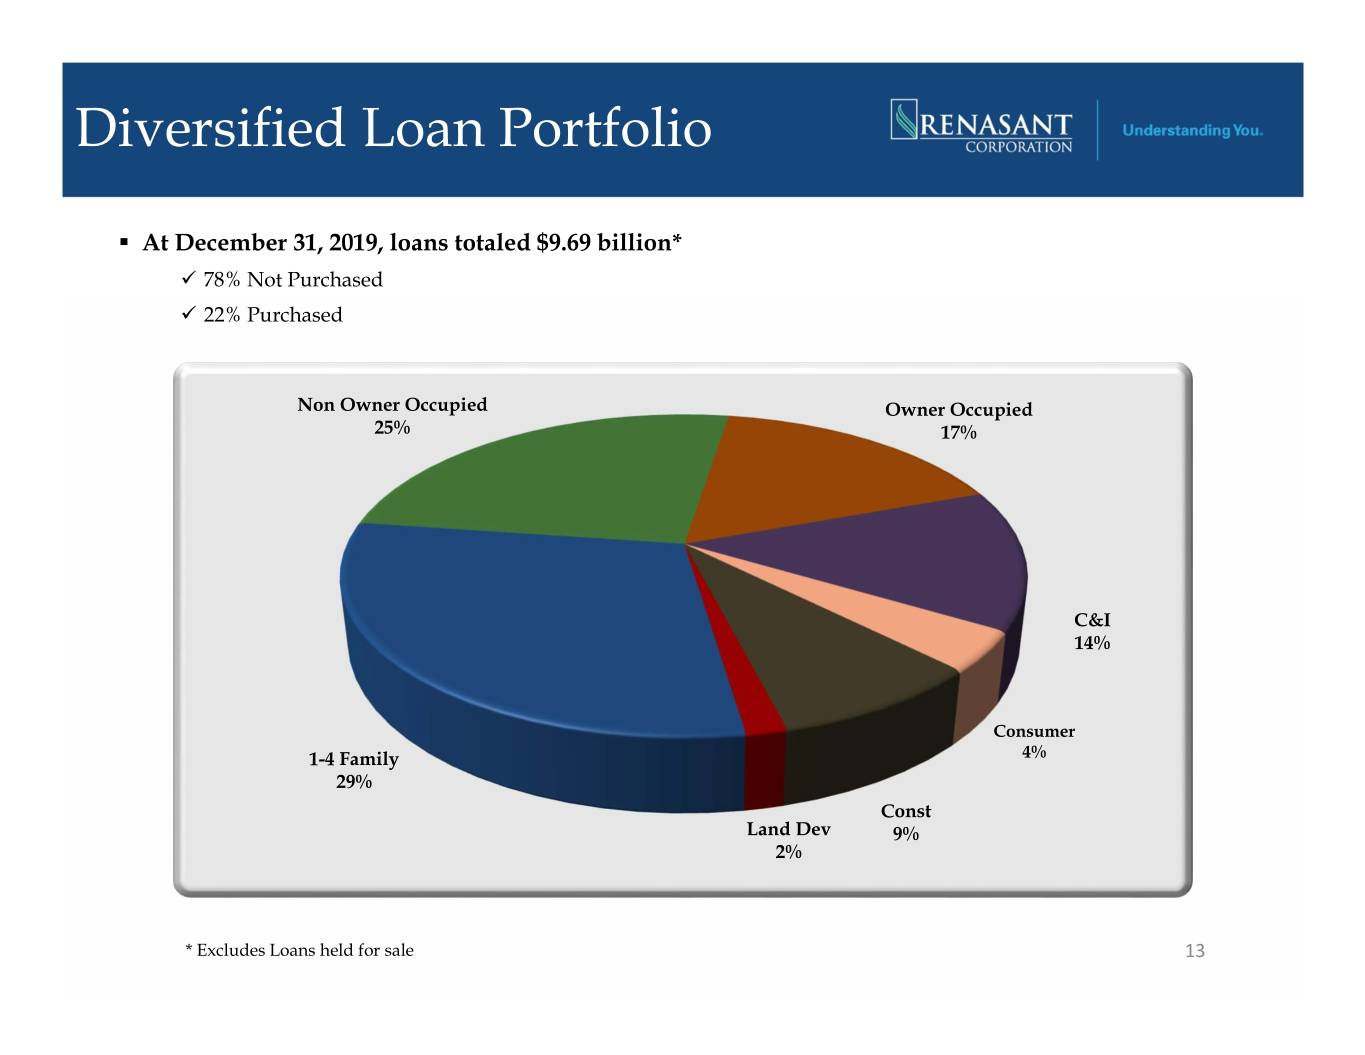
Diversified Loan Portfolio . At December 31, 2019, loans totaled $9.69 billion* 78% Not Purchased 22% Purchased Non Owner Occupied Owner Occupied 25% 17% C&I 14% Consumer 1-4 Family 4% 29% Const Land Dev 9% 2% * Excludes Loans held for sale 13

C&D and CRE Loan Concentration Levels Acquisition, Development & Construction (ADC) and Commercial Real Estate (CRE) ADC Loans as a Percentage of CRE Loans (Construction & Perm) as a Risk Based Capital Percentage of Risk Based Capital 100% 300% 83% 80% 80% 79% 80% 81% 250% 80% 76% 77% 75% 77% 69% 66% 200% 60% 150% 40% 100% 20% 50% 0% 0% 14

Focus on Core Funding $12,000,000 3.00% $10,000,000 2.50% $8,000,000 2.00% ) $6,000,000 1.50% $4,000,000 1.00% ($ in thousands $2,000,000 0.50% $- 0.00% 2014 2015 2016 2017 2018 1Q19 2Q19 3Q19 4Q19 Total Deposits Cost of Deposits Fed Funds $3,000,000 Non Interest Bearing Demand Deposits 4Q 2019 $2,500,000 Non Interest DDA $2,000,000 23% Other Int Bearing Borrowed Accts $1,500,000 Funds 8% 50% $1,000,000 Time Deposits 19% $500,000 $- Cost of Funds ($ in thousands) 0.89% 15
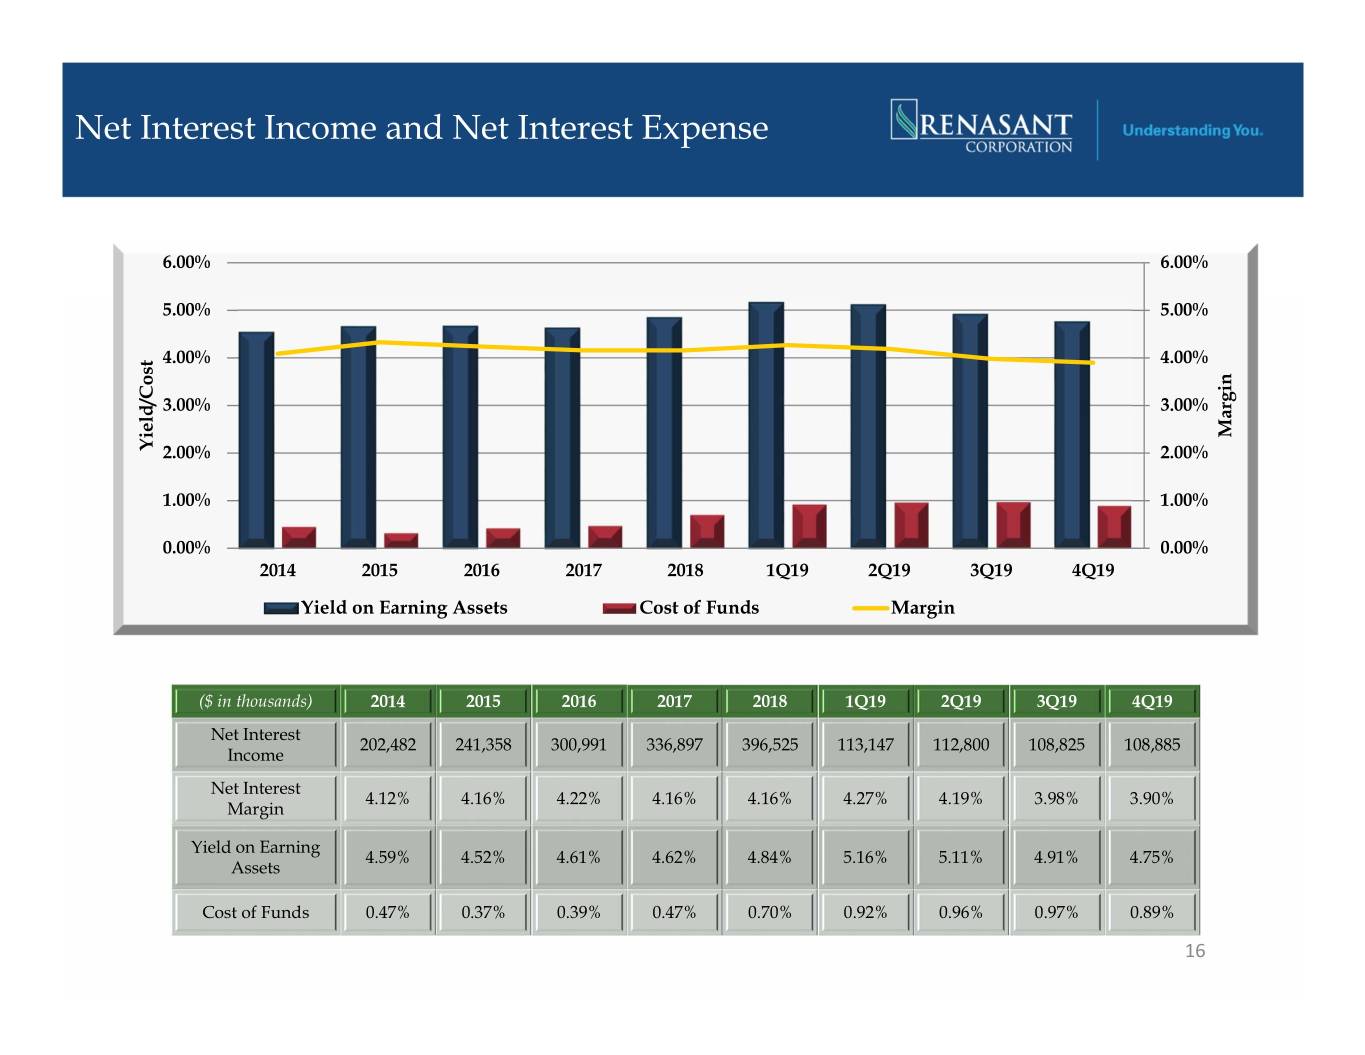
Net Interest Income and Net Interest Expense 6.00% 6.00% 5.00% 5.00% 4.00% 4.00% 3.00% 3.00% Margin Yield/Cost 2.00% 2.00% 1.00% 1.00% 0.00% 0.00% 2014 2015 2016 2017 2018 1Q19 2Q19 3Q19 4Q19 Yield on Earning Assets Cost of Funds Margin ($ in thousands) 2014 2015 2016 2017 2018 1Q19 2Q19 3Q19 4Q19 Net Interest 202,482 241,358 300,991 336,897 396,525 113,147 112,800 108,825 108,885 Income Net Interest 4.12% 4.16% 4.22% 4.16% 4.16% 4.27% 4.19% 3.98% 3.90% Margin Yield on Earning 4.59% 4.52% 4.61% 4.62% 4.84% 5.16% 5.11% 4.91% 4.75% Assets Cost of Funds 0.47% 0.37% 0.39% 0.47% 0.70% 0.92% 0.96% 0.97% 0.89% 16

Sources of Non Interest Income* ($ in thousands) • Diversified sources of noninterest income Non Interest Income* $45,000 • Opportunities for growing Non Interest Income $40,000 Expansion of Trust Division Wealth Management $35,000 services into larger, metropolitan markets $30,000 $25,000 Expansions within our de novo operations $20,000 Expansion of the Mortgage Division within new $15,000 markets; acquisition of wholesale mortgage operations $10,000 of FirstBank in South Carolina $5,000 $- Durbin amendment reduced non interest income by $3 million in 3Q19 and 4Q19 and is expected to impact noninterest income by $10-11 million annually 1Q08 Svc Chgs 4Q19 Svc Chgs $14M* 39% $36M* 6% Insurance 26% Insurance 6% Mtg Inc Mtg Inc 12% 11% Wealth Mgmt 11% 38% Wealth Mgmt 5% Fees & Comm 8% Fees & Comm 27% Other 11% Other * Non interest income excludes gains and losses from securities transactions and MSR valuation adjustments. See slide 36 for reconciliation of 17 this non-GAAP financial measure to GAAP.
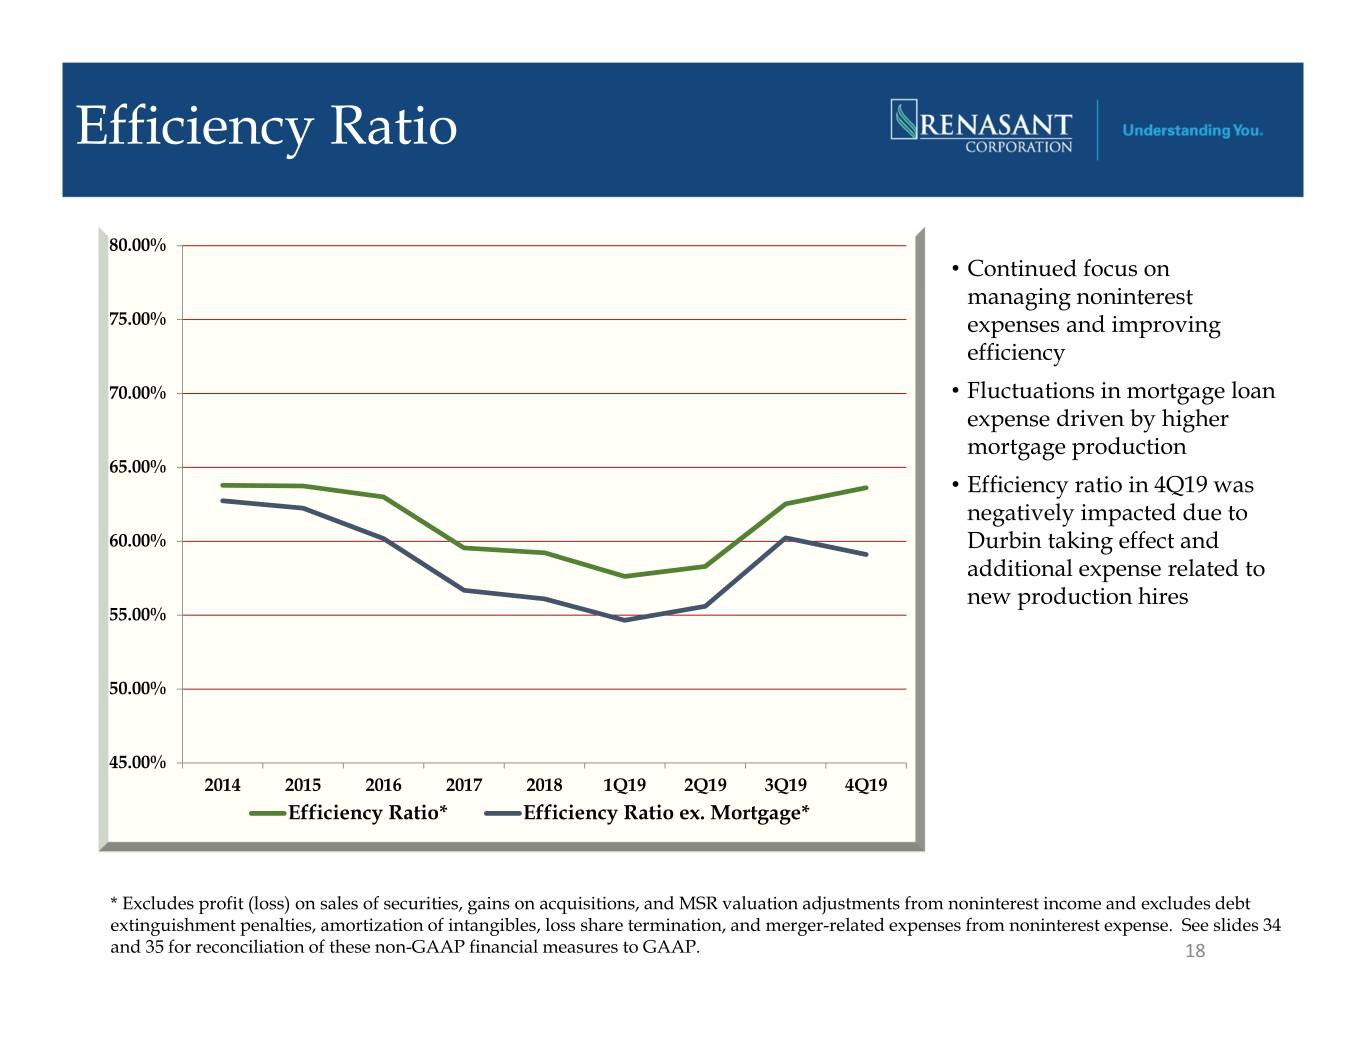
Efficiency Ratio 80.00% • Continued focus on managing noninterest 75.00% expenses and improving efficiency 70.00% • Fluctuations in mortgage loan expense driven by higher mortgage production 65.00% • Efficiency ratio in 4Q19 was negatively impacted due to 60.00% Durbin taking effect and additional expense related to new production hires 55.00% 50.00% 45.00% 2014 2015 2016 2017 2018 1Q19 2Q19 3Q19 4Q19 Efficiency Ratio* Efficiency Ratio ex. Mortgage* * Excludes profit (loss) on sales of securities, gains on acquisitions, and MSR valuation adjustments from noninterest income and excludes debt extinguishment penalties, amortization of intangibles, loss share termination, and merger-related expenses from noninterest expense. See slides 34 and 35 for reconciliation of these non-GAAP financial measures to GAAP. 18
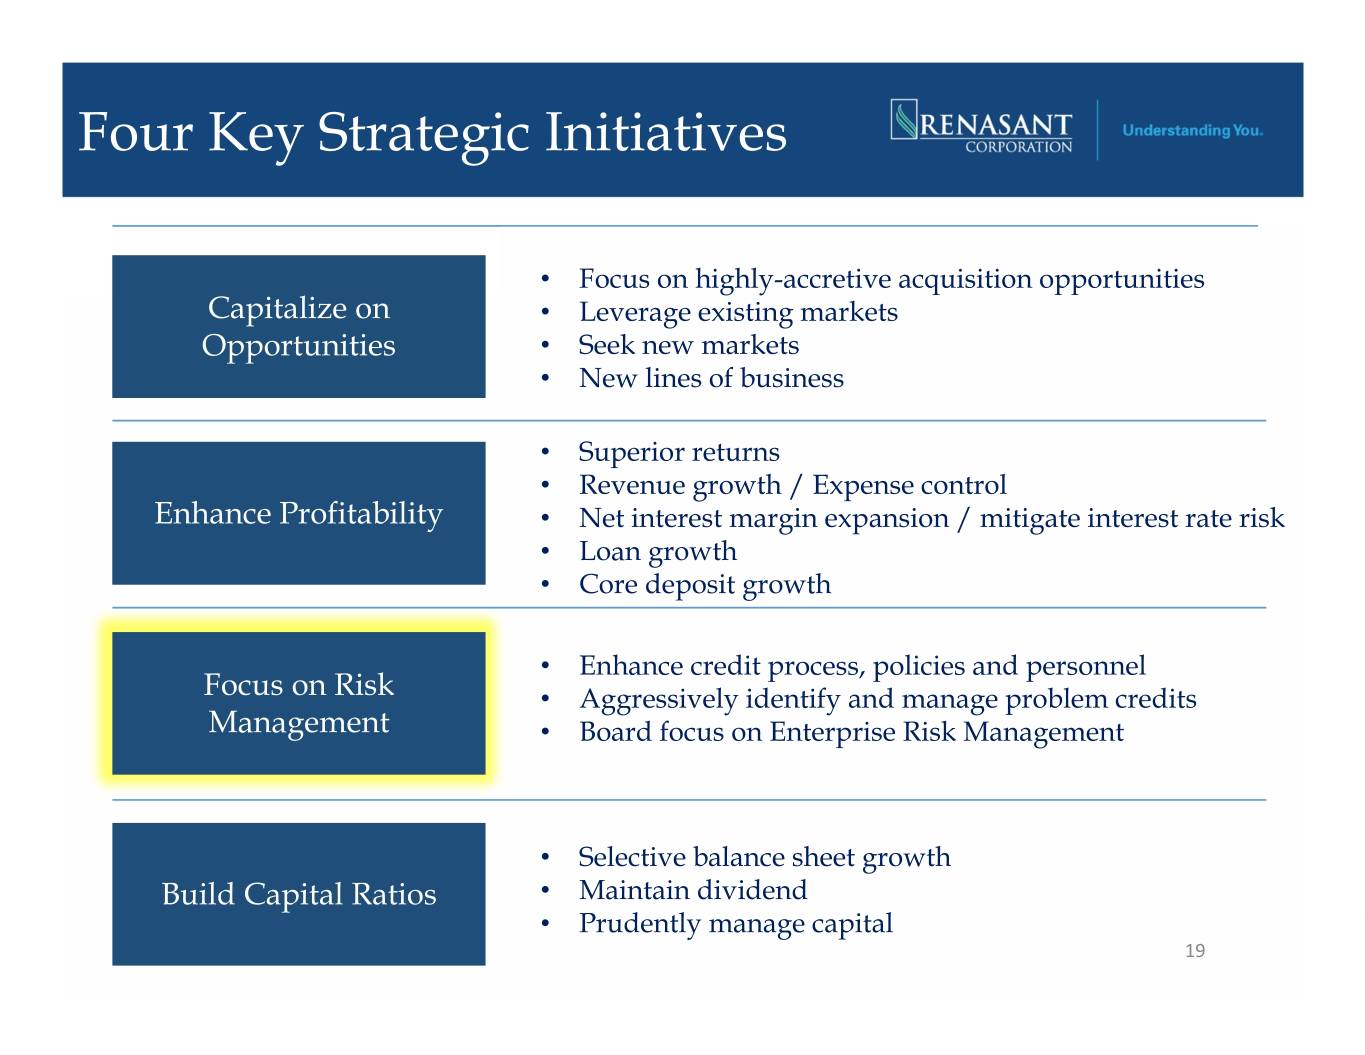
Four Key Strategic Initiatives • Focus on highly-accretive acquisition opportunities Capitalize on • Leverage existing markets Opportunities • Seek new markets • New lines of business • Superior returns • Revenue growth / Expense control Enhance Profitability • Net interest margin expansion / mitigate interest rate risk • Loan growth • Core deposit growth • Enhance credit process, policies and personnel Focus on Risk • Aggressively identify and manage problem credits Management • Board focus on Enterprise Risk Management • Selective balance sheet growth Build Capital Ratios • Maintain dividend • Prudently manage capital 19
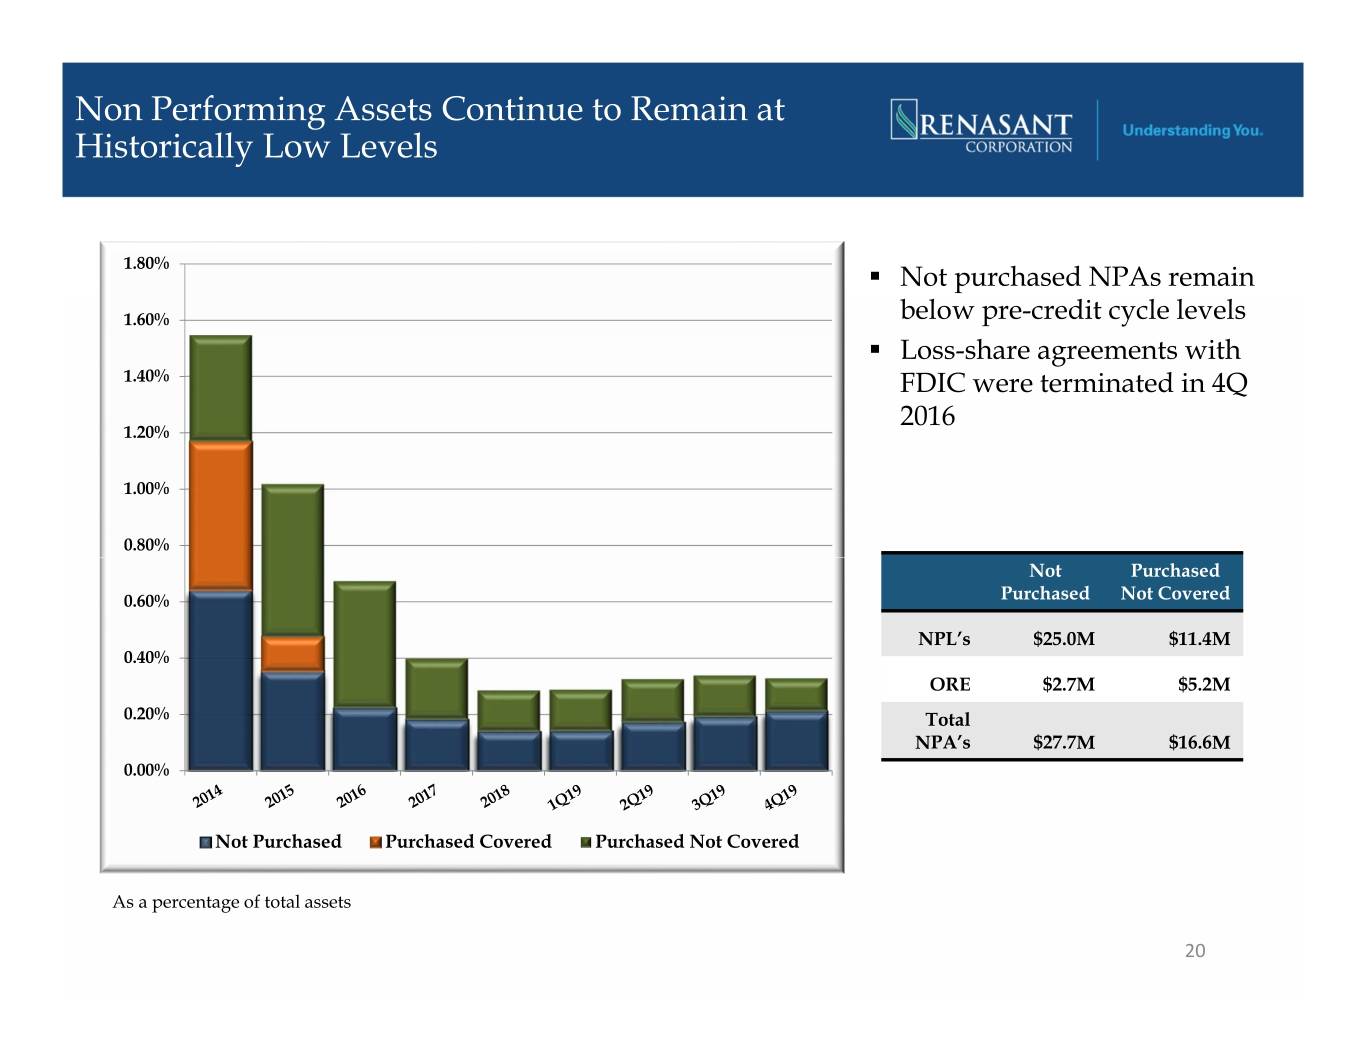
Non Performing Assets Continue to Remain at Historically Low Levels 1.80% . Not purchased NPAs remain 1.60% below pre-credit cycle levels . Loss-share agreements with 1.40% FDIC were terminated in 4Q 2016 1.20% 1.00% 0.80% Not Purchased 0.60% Purchased Not Covered NPL’s $25.0M $11.4M 0.40% ORE $2.7M $5.2M 0.20% Total NPA’s $27.7M $16.6M 0.00% Not Purchased Purchased Covered Purchased Not Covered As a percentage of total assets 20

Proactive in Providing Reserves for Problem Credit Resolution $6,000 450% • Net charge-offs: 400% $5,000 • 7 bps in 4Q19** 350% • 4bps YTD $4,000 300% • Provision for loan losses: 250% $3,000 ($ in thousands) • 200% $3.0 million in 4Q19 $2,000 150% • $7.1 million YTD 100% $1,000 50% $- 0% 1Q16 2Q16 3Q16 4Q16 1Q17 2Q17 3Q17 4Q17 1Q18 2Q18 3Q18 4Q18 1Q19 2Q19 3Q19 4Q19 ($)Provision for Loan Losses ($)Net Charge Offs Coverage Ratio* Allowance for Loan Losses as % of Non-Purchased Loans 2014 2015 2016 2017 2018 1Q19 2Q19 3Q19 4Q19 1.29% 1.11% 0.91% 0.83% 0.77% 0.76% 0.75% 0.72% 0.69% * Represents the percentage of the allowance for loan losses to total non purchased nonperforming loans. ** Annualized 21
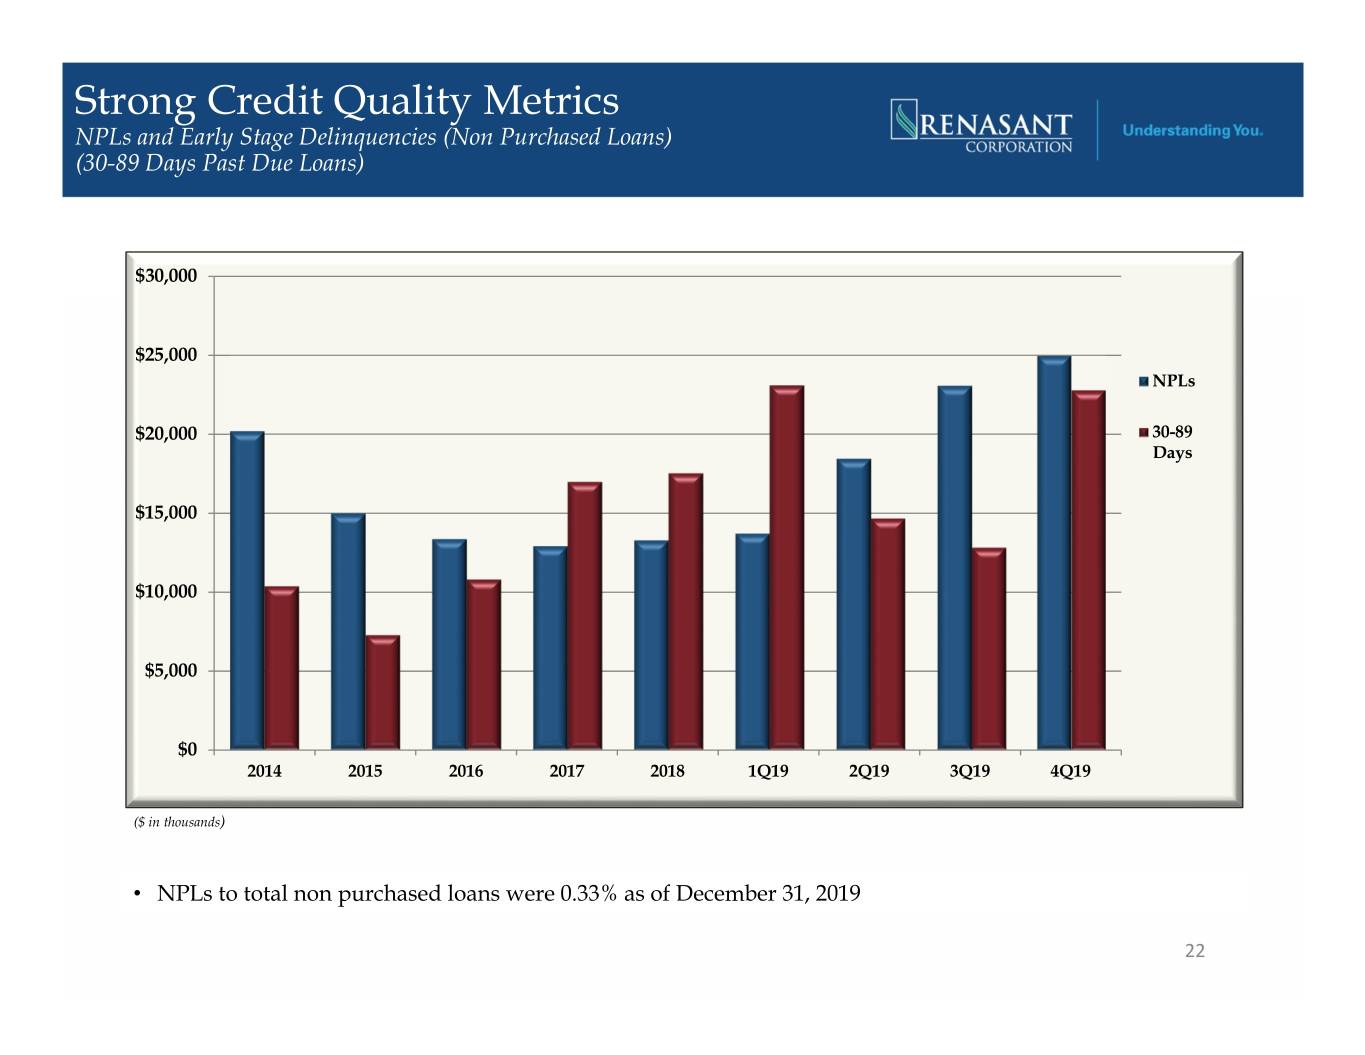
Strong Credit Quality Metrics NPLs and Early Stage Delinquencies (Non Purchased Loans) (30-89 Days Past Due Loans) $30,000 $25,000 NPLs $20,000 30-89 Days $15,000 $10,000 $5,000 $0 2014 2015 2016 2017 2018 1Q19 2Q19 3Q19 4Q19 ($ in thousands) • NPLs to total non purchased loans were 0.33% as of December 31, 2019 22

Four Key Strategic Initiatives • Focus on highly-accretive acquisition opportunities Capitalize on • Leverage existing markets Opportunities • Seek new markets • New lines of business • Superior returns • Revenue growth / Expense control Enhance Profitability • Net interest margin expansion / mitigate interest rate risk • Loan growth • Core deposit growth • Enhance credit process, policies and personnel Focus on Risk • Aggressively identify and manage problem credits Management • Board focus on Enterprise Risk Management • Selective balance sheet growth Build Capital Ratios • Maintain dividend • Prudently manage capital 23
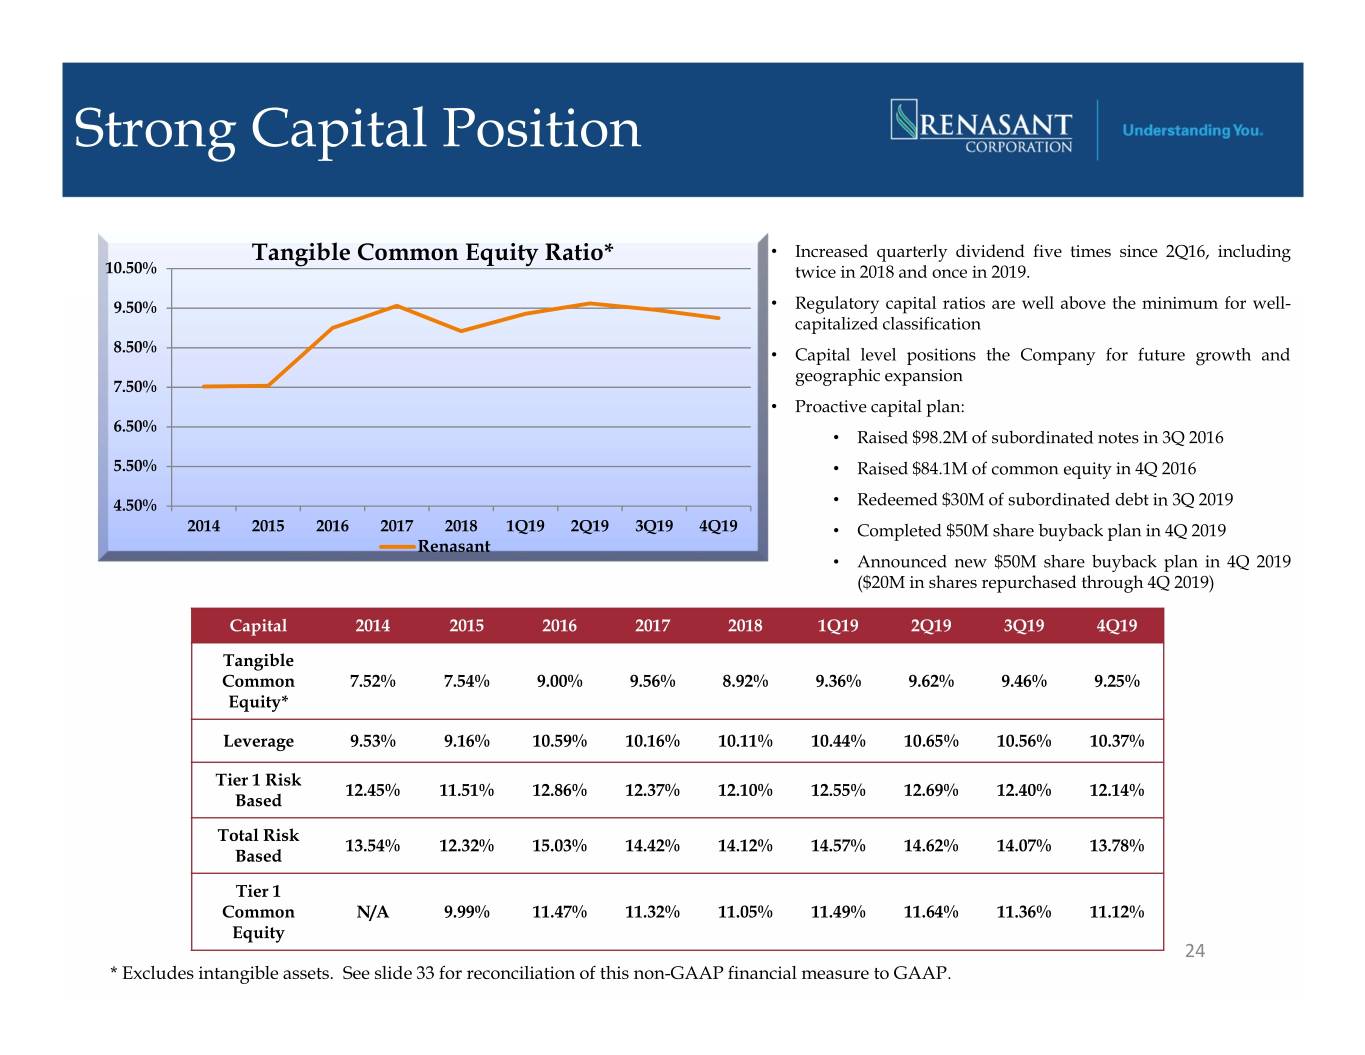
Strong Capital Position Tangible Common Equity Ratio* • Increased quarterly dividend five times since 2Q16, including 10.50% twice in 2018 and once in 2019. 9.50% • Regulatory capital ratios are well above the minimum for well- capitalized classification 8.50% • Capital level positions the Company for future growth and geographic expansion 7.50% • Proactive capital plan: 6.50% • Raised $98.2M of subordinated notes in 3Q 2016 5.50% • Raised $84.1M of common equity in 4Q 2016 4.50% • Redeemed $30M of subordinated debt in 3Q 2019 2014 2015 2016 2017 2018 1Q19 2Q19 3Q19 4Q19 • Completed $50M share buyback plan in 4Q 2019 Renasant • Announced new $50M share buyback plan in 4Q 2019 ($20M in shares repurchased through 4Q 2019) Capital 2014 2015 2016 2017 2018 1Q19 2Q19 3Q19 4Q19 Tangible Common 7.52% 7.54% 9.00% 9.56% 8.92% 9.36% 9.62% 9.46% 9.25% Equity* Leverage 9.53% 9.16% 10.59% 10.16% 10.11% 10.44% 10.65% 10.56% 10.37% Tier 1 Risk 12.45% 11.51% 12.86% 12.37% 12.10% 12.55% 12.69% 12.40% 12.14% Based Total Risk 13.54% 12.32% 15.03% 14.42% 14.12% 14.57% 14.62% 14.07% 13.78% Based Tier 1 Common N/A 9.99% 11.47% 11.32% 11.05% 11.49% 11.64% 11.36% 11.12% Equity 24 * Excludes intangible assets. See slide 33 for reconciliation of this non-GAAP financial measure to GAAP.
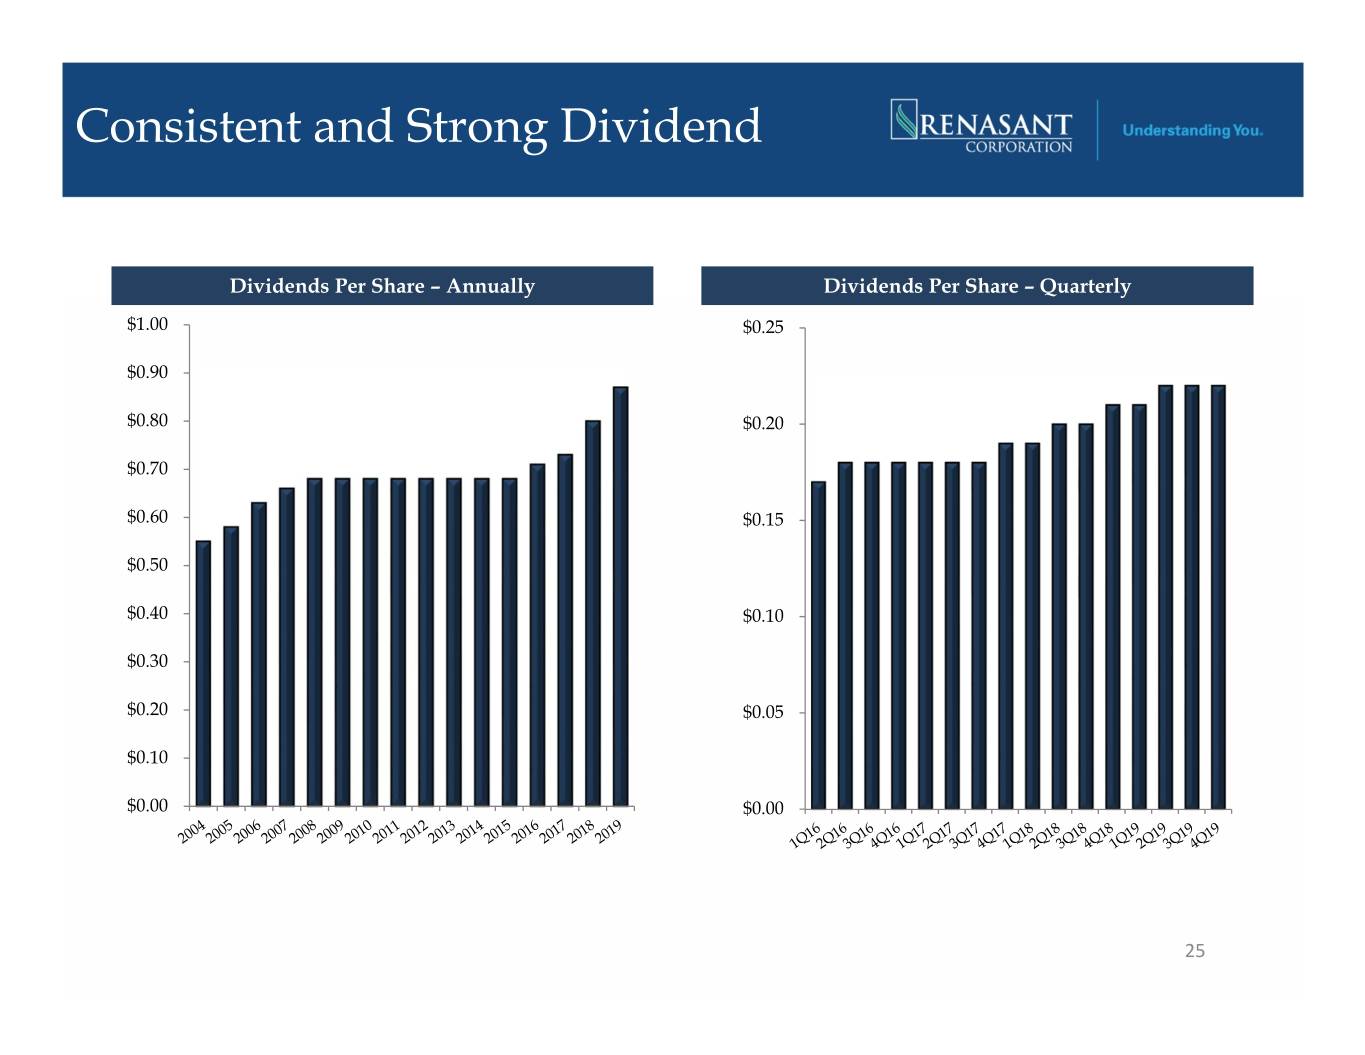
Consistent and Strong Dividend Dividends Per Share – Annually Dividends Per Share – Quarterly $1.00 $0.25 $0.90 $0.80 $0.20 $0.70 $0.60 $0.15 $0.50 $0.40 $0.10 $0.30 $0.20 $0.05 $0.10 $0.00 $0.00 25
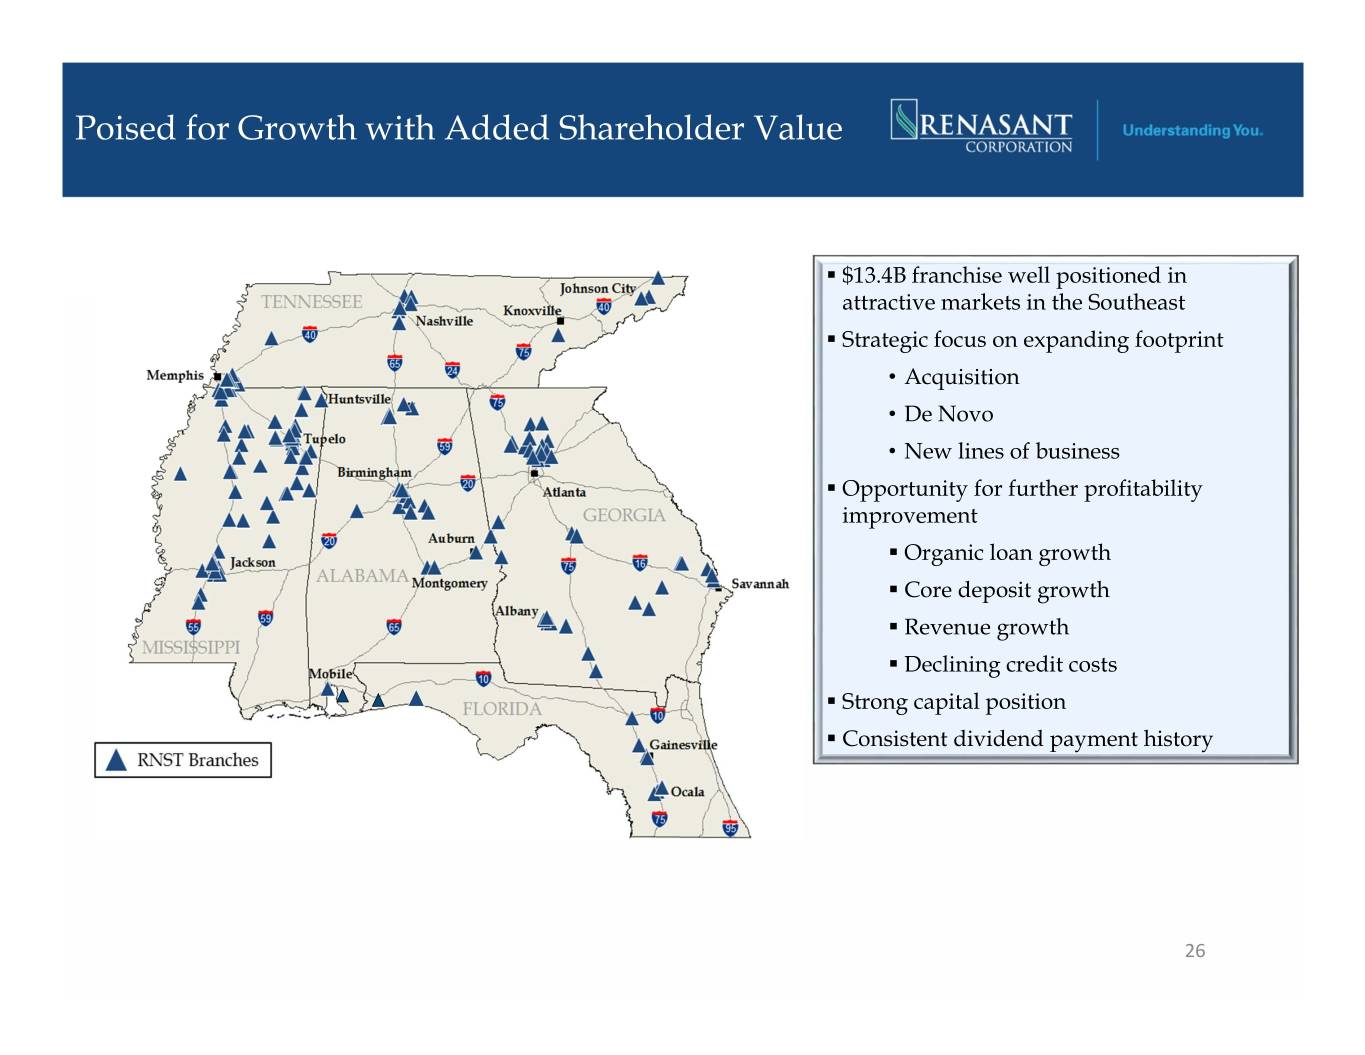
Poised for Growth with Added Shareholder Value . $13.4B franchise well positioned in attractive markets in the Southeast . Strategic focus on expanding footprint • Acquisition • De Novo • New lines of business . Opportunity for further profitability improvement . Organic loan growth . Core deposit growth . Revenue growth . Declining credit costs . Strong capital position . Consistent dividend payment history 26
Appendix 27

Alabama – Central Region . Mazda and Toyota announced $1.6 billion investment creating up to 4,000 jobs by 2021 Alabama Deposit Market Share . Ranked #3 on the Area Development Top States for Doing Business 2018 Deposits Market Rank Institution ($mm) Share Branches 1Regions Financial Corp. $24,882 23.2 % 207 . Honda, Hyundai, Mercedes-Benz and Toyota increasingly large presence 2 Banco Bilbao Vizcaya Argentaria SA16,177 15.1 89 3 Wells Fargo & Co. 8,644 8.1 108 4 ServisFirst Bancshares Inc. 5,5875.2 12 . Merger with Heritage Financial Group, Inc. (Nasdaq: HBOS) in July 2015 added approximately $90.0 5Synovus Financial Corp. 4,312 4.0 34 6 Truist Financial Corp. 3,740 3.5 70 million in loans, $141 million in deposits and 9 branches 7PNC Financial Services Group Inc. 2,909 2.7 61 8 Cadence Bancorp. 2,585 2.4 27 9Trustmark Corp. 1,791 1.7 43 . Opened Commercial Loan Production Office and Mortgage Production Office in Mobile in 1Q 2017 and 10 IBERIABANK Corp. 1,436 1.3 14 full-service branch in Fairhope in 4Q 2019 18 Renasant Corp. 1,071 1.0 20 Total Market 107,424 100.0 1,453 . 2nd largest research and technology park in the U.S More than $1.4 billion in aerospace equipment exported in 2016 More than $8.4 billion in Department of Defense contracts Deposit Market Share by County – Top 5 Presence in 4 of 10 counties 20.0% 17.0% 15.0% 12.1% 10.0% 6.9% 6.8% 5.0% 1.5% 1.1% 1.4% 0.4% 0.6% 0.3% 0.0% Lee, AL Lee, Shelby, AL Shelby, Mobile, AL Morgan, AL Jefferson, AL Jefferson, Madison, AL Talladega, AL Talladega, Chambers, AL Chambers, Deposit AL Tuscaloosa, Market Montgomery, AL Source: S&P Global Intelligence Green highlighting denotes top 5 deposit market share in respective county 28 Share 4 16 14 14 18 11 2 5 4 14 Deposit data as of 6/30/19 Rank

Florida – Central Region . Entered the Florida market through the acquisition of HBOS. Florida Deposit Market Share Moved into FL with 6 full-services branches along I-75 Deposits Market Rank Institution ($mm) Share Branches . Opened full-service branch in Destin in 1Q 2019 and full-service 1 Bank of America Corp. $115,813 20.0 % 517 branch in Pensacola in 4Q 2019 2 Wells Fargo & Co. 79,048 13.7 580 3 Truist Financial Corp. 66,486 11.5 666 th . Florida would have the 19 largest economy in the world, if it were a 4 JPMorgan Chase & Co. 38,443 6.6 415 country 5 TIAA Board of Overseers 25,425 4.4 12 6 Citigroup Inc. 17,969 3.1 54 7 Regions Financial Corp. 17,800 3.1 306 . Publix Super Markets, Southern Wine & Spirits, Royal Caribbean Cruise, 8 BankUnited Inc. 15,190 2.6 77 Darden Restaurants, CSX, and JM Family Enterprises are all 9 Toronto-Dominion Bank 14,334 2.5 162 10 Synovus Financial Corp. 13,207 2.3 97 headquartered in Florida 99 Renasant Corp. 281 0.1 7 Total Market 4,769 100.0 4,769 . Florida projected population growth is approximately 6.7% compared to the national average of 3.8% Deposit Market Share by County 4.0% 3.0% 2.5% 2.5% 2.3% RNST Branches 2.0% 1.0% 0.1% 0.0% Marion, FL Alachua, FL Okaloosa, FL Deposit FL Columbia, Market 10 6 7 21 Share Source: S&P Global Intelligence 29 Deposit data as of 6/30/19 Rank

Georgia – Eastern Region . Entered the North GA market through two FDIC loss share transactions Georgia Deposit Market Share 12 full-service locations Deposits Market Rank Institution ($mm) Share Branches Expanded services include mortgage and wealth management personnel 1 Truist Financial Corp. $67,048 26.6 % 341 2 Bank of America Corp. 37,738 15.0 160 3 Wells Fargo & Co. 37,475 14.9 238 . Grew GA presence by completing acquisition of HBOS 4 Synovus Financial Corp. 17,327 6.9 114 5 Ameris Bancorp 8,778 3.5 109 6 United Community Banks Inc. 6,695 2.7 67 Added 20 full-service branches and 4 mortgage offices 7 Regions Financial Corp. 6,437 2.6 113 8 JPMorgan Chase & Co. 5,736 2.3 84 9 Cadence Bancorp. 4,947 2.0 35 Significantly ramps up our mortgage division 10 Bank OZK 3,580 1.4 68 11 Renasant Corp. 3,393 1.4 49 . Enhanced GA presence by acquisition of KeyWorth Bank ($399 million in assets) in Total Market 251,866 100.0 2,246 April 2016 Approximately $284 million in loans, $347 million in deposits, and 4 full-service branches . Merger with Brand Group Holdings, which closed September 1, 2018, added $1.7 billion in deposits and $1.6 billion in loans Deposit Market Share by County – Top 5 Presence in 11 of 24 counties 39.0% 40.0% 32.6% 30.0% 26.6% 20.0% 16.8% 15.9% 14.3% 12.0% 11.0% 11.1% 10.2% 7.5% 7.3% 8.2% 10.0% 4.9% 3.1% 3.1% 2.3% 1.6% 0.5% 0.1% 0.3% 0.3% 1.2% 0.1% 0.0% Lee, GA Lee, Hall, GA Bibb, GA Bibb, Cook, GA Cook, Cobb, GA Cobb, Troup, GA Troup, Worth, GA Worth, Fulton, GA Bartow, GA Bartow, Barrow, GA DeKalb, GA Bulloch, GA Bulloch, Pi ckens, GA Forsyth, GA Forsyth, Tattnall, GA Tattnall, Appling, GA Chatham, GA Chatham, Lowndes, GA Lowndes, Gwinnett, GA Cherokee, GA Cherokee, Jeff Davis, GA Davis, Jeff Muscogee, GA Effingham, GA Deposit Dougherty, GA Market 56 8 6 416 8 22 1 19 2143311 15 13 2 12 9 4 9 4 Share Rank Source: S&P Global Intelligence 30 Green highlighting denotes top 5 deposit market share in respective county Deposit data as of 6/30/19
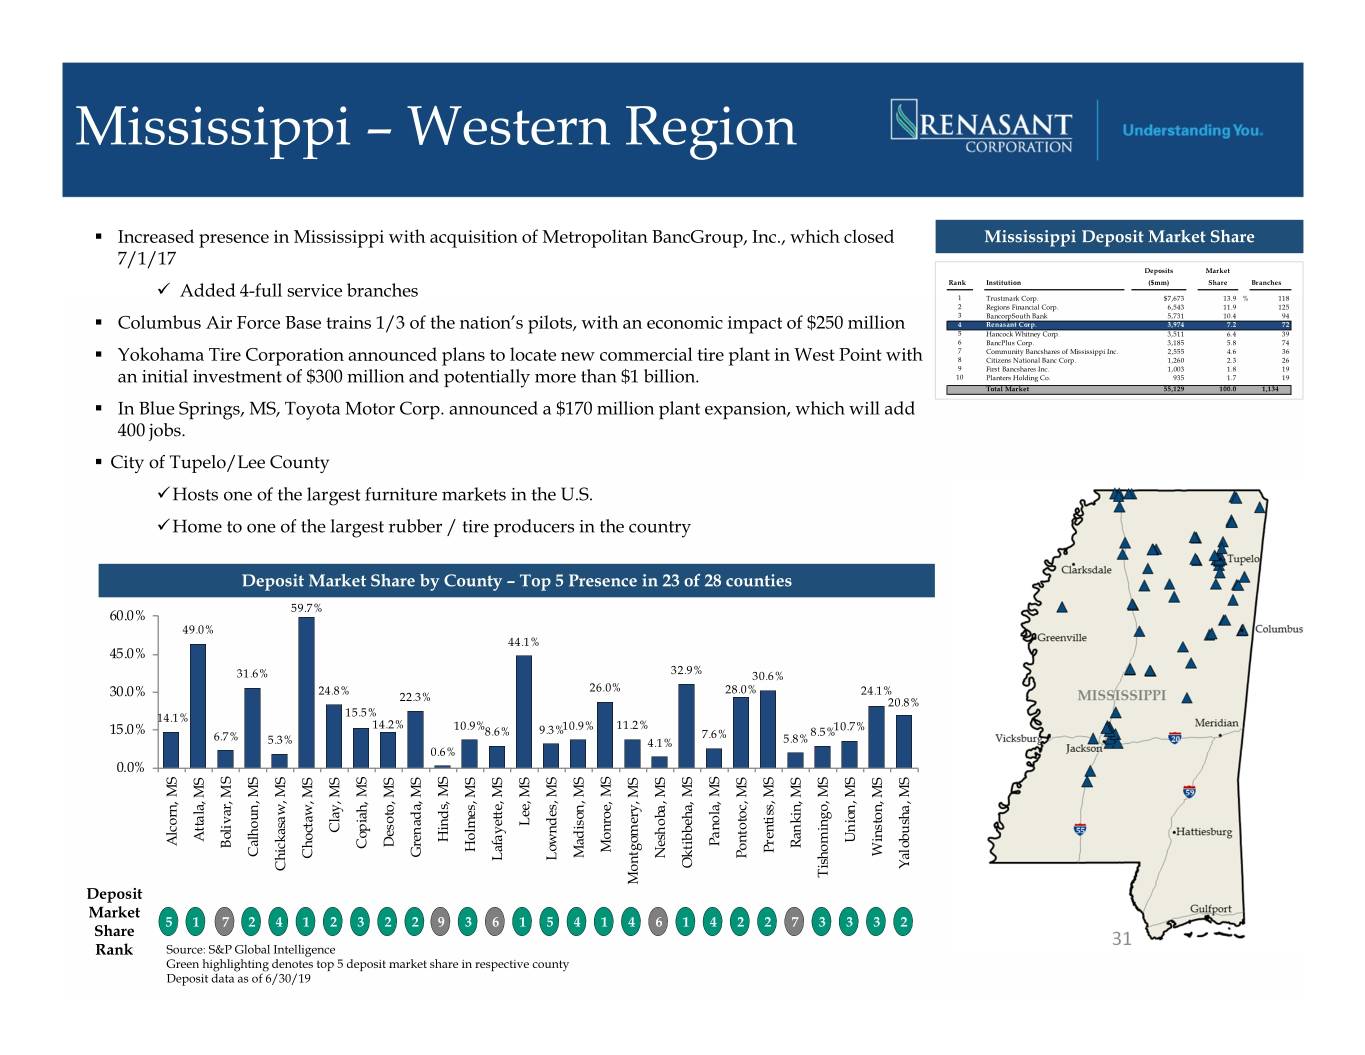
Mississippi – Western Region . Increased presence in Mississippi with acquisition of Metropolitan BancGroup, Inc., which closed Mississippi Deposit Market Share 7/1/17 Deposits Market Rank Institution ($mm) Share Branches Added 4-full service branches 1 Trustmark Corp. $7,673 13.9 % 118 2 Regions Financial Corp. 6,543 11.9 125 3 BancorpSouth Bank 5,731 10.4 94 . Columbus Air Force Base trains 1/3 of the nation’s pilots, with an economic impact of $250 million 4 Renasant Corp. 3,974 7.2 72 5 Hancock Whitney Corp. 3,511 6.4 39 6 BancPlus Corp. 3,185 5.8 74 7 Community Bancshares of Mississippi Inc. 2,555 4.6 36 . Yokohama Tire Corporation announced plans to locate new commercial tire plant in West Point with 8 Citizens National Banc Corp. 1,260 2.3 26 9 First Bancshares Inc. 1,003 1.8 19 an initial investment of $300 million and potentially more than $1 billion. 10 Planters Holding Co. 935 1.7 19 Total Market 55,129 100.0 1,134 . In Blue Springs, MS, Toyota Motor Corp. announced a $170 million plant expansion, which will add 400 jobs. . City of Tupelo/Lee County Hosts one of the largest furniture markets in the U.S. Home to one of the largest rubber / tire producers in the country Deposit Market Share by County – Top 5 Presence in 23 of 28 counties 59.7% 60.0% 49.0% 44.1% 45.0% 32.9% 31.6% 30.6% 30.0% 24.8% 26.0% 28.0% 24.1% 22.3% 20.8% 14.1% 15.5% 14.2% 10.9% 9.3%10.9% 11.2% 10.7% 15.0% 6.7% 8.6% 7.6% 8.5% 5.3% 4.1% 5.8% 0.6% 0.0% Lee, MS Lee, Clay, MS Clay, Attala, MS Hinds, MS Hinds, Union, MS Panola, MS Alcorn, MS Desoto, MS Rankin, MS Bolivar, MS Bolivar, Copiah, MS Copiah, Holmes, MS Monroe, MS Prenti ss, MS Winston, MS Calhoun, MS Calhoun, Grenada, MS Madison, MS Neshoba, MS Neshoba, Pontotoc, MS Pontotoc, Choctaw, MS Choctaw, Lowndes, MS Lowndes, Lafayette, MS Lafayette, Oktibbeha, MS Yalobusha, MS Chickasaw, MS Chickasaw, Tishomingo, MS Tishomingo, Montgomery, MS Deposit Market 5 1 7 2412 322 9 36 154146 14 22 7 333 2 Share 31 Rank Source: S&P Global Intelligence Green highlighting denotes top 5 deposit market share in respective county Deposit data as of 6/30/19

Tennessee – Northern Region . Our Tennessee Operations Tennessee Deposit Market Share The Knoxville/Maryville MSA location opened in late Q2 ‘12 Deposits Market East Tennessee operations currently have 4 full-service branches, $304 million in Rank Institution ($mm) Share Branches loans and $133 million in deposits 1 First Horizon National Corp. $24,671 15.4 % 157 2Regions Financial Corp. 18,351 11.5 217 3 Truist Financial Corp. 15,472 9.7 147 Metropolitan acquisition added two branches in each of Memphis and Nashville 4 Pinnacle Financial Partners Inc. 13,549 8.5 48 5 Bank of America Corp. 12,608 7.9 58 New Healthcare Lending Group added in Nashville during 2015 6 FB Financial Corp. 4,382 2.7 67 7 U.S. Bancorp 3,471 2.2 91 th 8 Franklin Financial Network Inc. 3,148 2.0 15 . Tennessee ranked 4 best state to do business, per Area Development magazine 9 Wilson Bank Holding Co. 2,332 1.5 28 10 Reliant Bancorp Inc. 2,329 1.5 31 Driven by VW, Nissan and GM, Tennessee named the #1 state in the nation for 17 Renasant Corp. 1,502 0.9 20 automotive manufacturing strength Total Market 160,289 100.0 2,025 Unemployment rate continues to improve declining to 3.4% from 10.4% in January 2010, down 1.6% since last November . In the Nashville market, Hospital Corporation of American announced an Deposit Market Share by County – Top 5 Presence in 1 of 8 counties expansion that will create 2,000 jobs 12.0% . #1 single-family housing market in the country 10.5% Housing prices appreciated 8% in the last year, and 23.3% in the last 3 years 9.0% . The Memphis MSA market ranked #1 for Logistics Leaders both nationally and globally 6.0% Bass Pro Shops, $70 million hotel in conjunction with their Pyramid flagship store 3.4% 3.2% 3.0% 2.4% . Fortune 500 company, Royal Phillips to expand in Tennessee, creating nearly 1.1% 1.2% 0.8% 0.7% 1,000 jobs in Nashville and Franklin 0.0% Blount, TN Blount, Shelby, TN Shelby, Sumner, TN Sumner, Sullivan, TN Crockett, TN Crockett, Davidson, TN Williamson, TN Williamson, Washington, TN Washington, Deposit Market 7 3 15 7 8 18 10 16 Share 32 Source: S&P Global Intelligence - Green highlighting denotes top 5 deposit market share in respective county Rank Deposit data as of 6/30/19
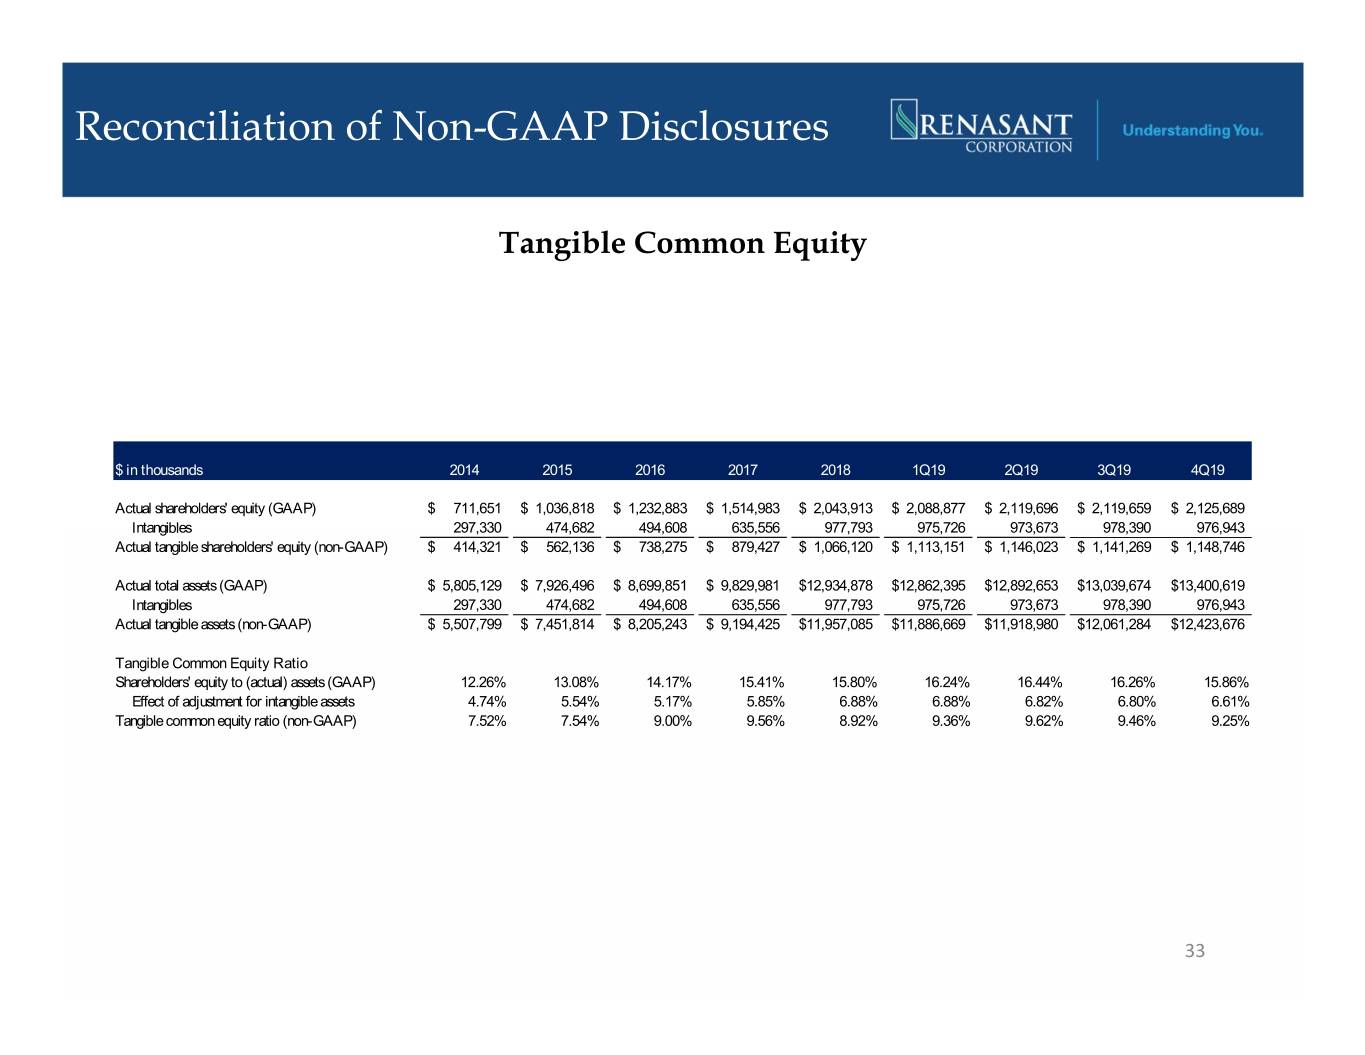
Reconciliation of Non-GAAP Disclosures Tangible Common Equity $ in thousands 2014 2015 2016 2017 2018 1Q19 2Q19 3Q19 4Q19 Actual shareholders' equity (GAAP)$ 711,651 $ 1,036,818 $ 1,232,883 $ 1,514,983 $ 2,043,913 $ 2,088,877 $ 2,119,696 $ 2,119,659 $ 2,125,689 Intangibles 297,330 474,682 494,608 635,556 977,793 975,726 973,673 978,390 976,943 Actual tangible shareholders' equity (non-GAAP)$ 414,321 $ 562,136 $ 738,275 $ 879,427 $ 1,066,120 $ 1,113,151 $ 1,146,023 $ 1,141,269 $ 1,148,746 Actual total assets (GAAP)$ 5,805,129 $ 7,926,496 $ 8,699,851 $ 9,829,981 $ 12,934,878 $ 12,862,395 $12,892,653 $ 13,039,674 $ 13,400,619 Intangibles 297,330 474,682 494,608 635,556 977,793 975,726 973,673 978,390 976,943 Actual tangible assets (non-GAAP)$ 5,507,799 $ 7,451,814 $ 8,205,243 $ 9,194,425 $ 11,957,085 $ 11,886,669 $11,918,980 $ 12,061,284 $ 12,423,676 Tangible Common Equity Ratio Shareholders' equity to (actual) assets (GAAP) 12.26% 13.08% 14.17% 15.41% 15.80% 16.24% 16.44% 16.26% 15.86% Effect of adjustment for intangible assets 4.74% 5.54% 5.17% 5.85% 6.88% 6.88% 6.82% 6.80% 6.61% Tangible common equity ratio (non-GAAP) 7.52% 7.54% 9.00% 9.56% 8.92% 9.36% 9.62% 9.46% 9.25% 33
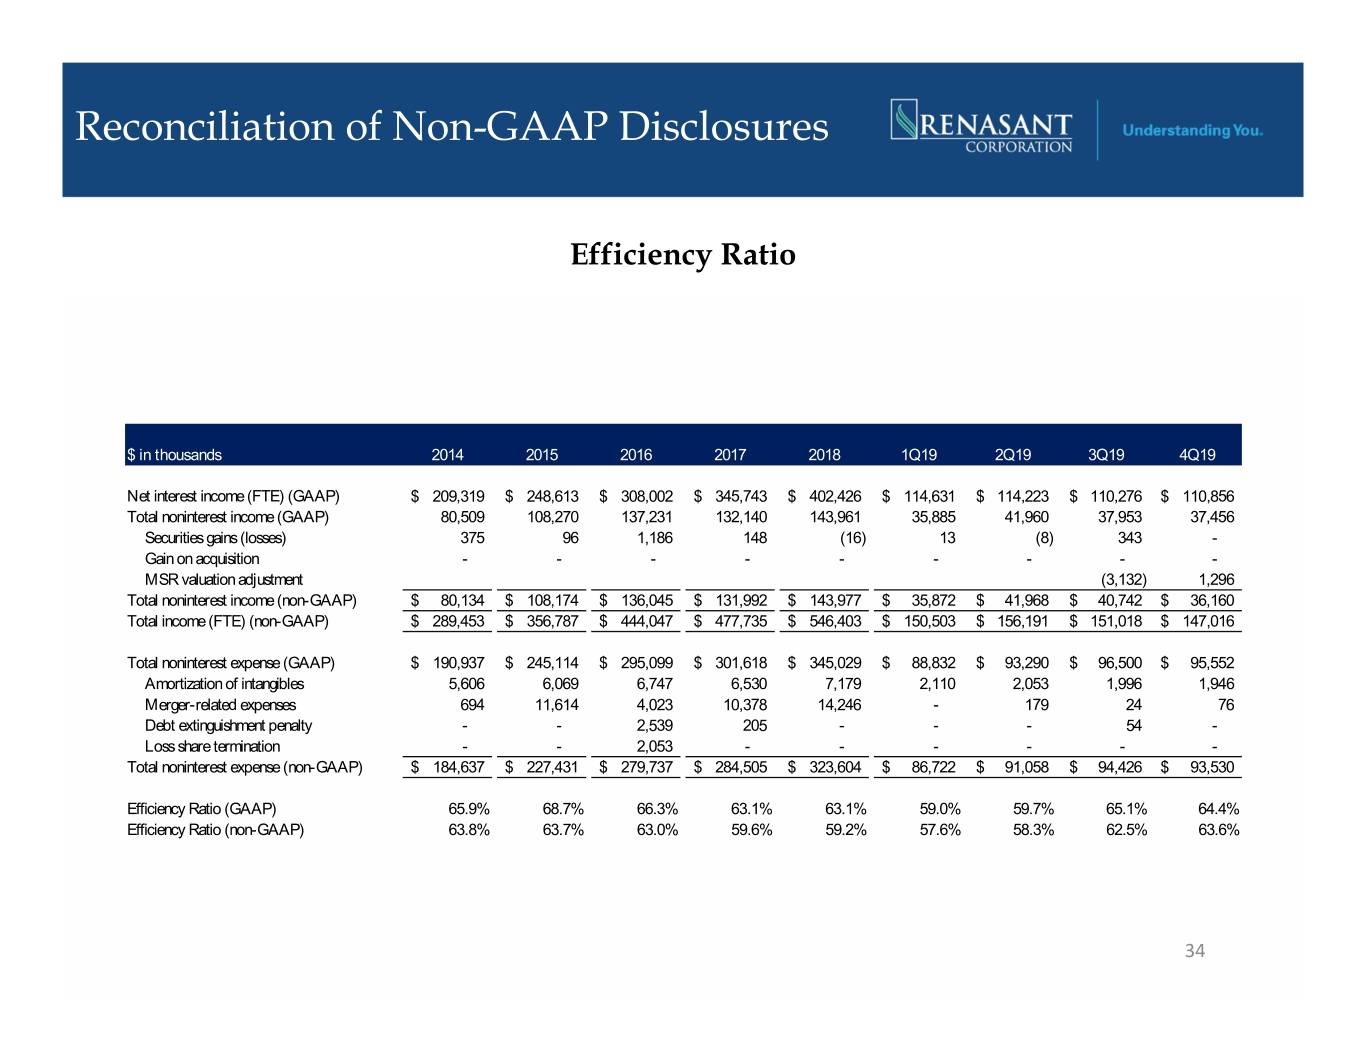
Reconciliation of Non-GAAP Disclosures Efficiency Ratio $ in thousands 2014 2015 2016 2017 2018 1Q19 2Q19 3Q19 4Q19 Net interest income (FTE) (GAAP)$ 209,319 $ 248,613 $ 308,002 $ 345,743 $ 402,426 $ 114,631 $ 114,223 $ 110,276 $ 110,856 Total noninterest income (GAAP) 80,509 108,270 137,231 132,140 143,961 35,885 41,960 37,953 37,456 Securities gains (losses) 375 96 1,186 148 (16) 13 (8) 343 - Gain on acquisition - - - - - - - - - MSR valuation adjustment (3,132) 1,296 Total noninterest income (non-GAAP)$ 80,134 $ 108,174 $ 136,045 $ 131,992 $ 143,977 $ 35,872 $ 41,968 $ 40,742 $ 36,160 Total income (FTE) (non-GAAP)$ 289,453 $ 356,787 $ 444,047 $ 477,735 $ 546,403 $ 150,503 $ 156,191 $ 151,018 $ 147,016 Total noninterest expense (GAAP)$ 190,937 $ 245,114 $ 295,099 $ 301,618 $ 345,029 $ 88,832 $ 93,290 $ 96,500 $ 95,552 Amortization of intangibles 5,606 6,069 6,747 6,530 7,179 2,110 2,053 1,996 1,946 Merger-related expenses 694 11,614 4,023 10,378 14,246 - 179 24 76 Debt extinguishment penalty - - 2,539 205 - - - 54 - Loss share termination - - 2,053 - - - - - - Total noninterest expense (non-GAAP)$ 184,637 $ 227,431 $ 279,737 $ 284,505 $ 323,604 $ 86,722 $ 91,058 $ 94,426 $ 93,530 Efficiency Ratio (GAAP) 65.9% 68.7% 66.3% 63.1% 63.1% 59.0% 59.7% 65.1% 64.4% Efficiency Ratio (non-GAAP) 63.8% 63.7% 63.0% 59.6% 59.2% 57.6% 58.3% 62.5% 63.6% 34
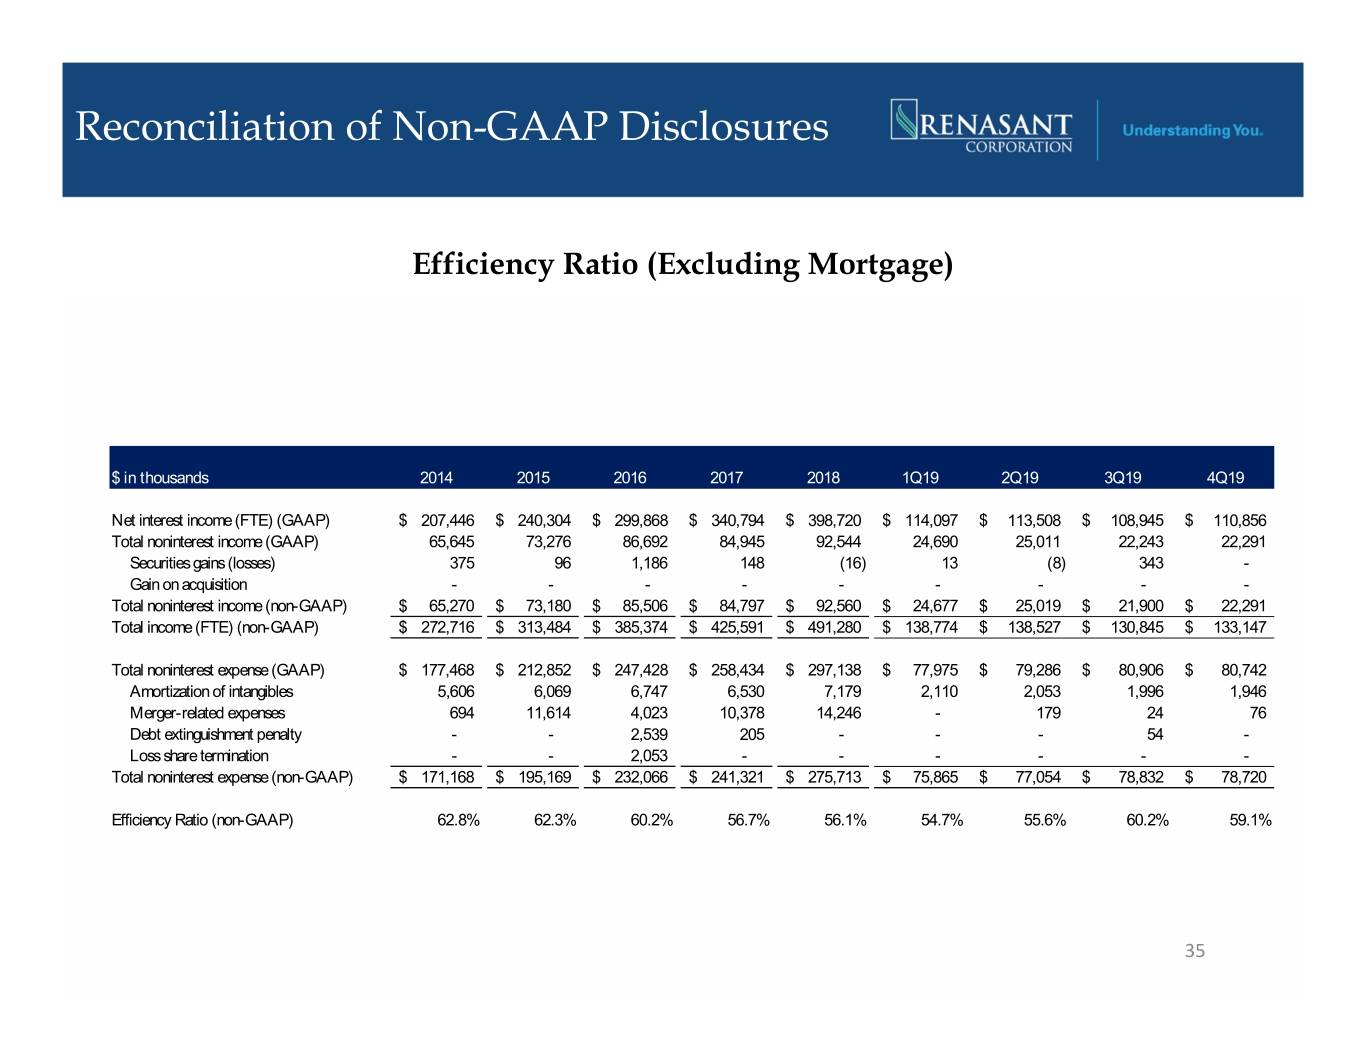
Reconciliation of Non-GAAP Disclosures Efficiency Ratio (Excluding Mortgage) $ in thousands 2014 2015 2016 2017 2018 1Q19 2Q19 3Q19 4Q19 Net interest income (FTE) (GAAP)$ 207,446 $ 240,304 $ 299,868 $ 340,794 $ 398,720 $ 114,097 $ 113,508 $ 108,945 $ 110,856 Total noninterest income (GAAP) 65,645 73,276 86,692 84,945 92,544 24,690 25,011 22,243 22,291 Securities gains (losses) 375 96 1,186 148 (16) 13 (8) 343 - Gain on acquisition - - - - - - - - - Total noninterest income (non-GAAP)$ 65,270 $ 73,180 $ 85,506 $ 84,797 $ 92,560 $ 24,677 $ 25,019 $ 21,900 $ 22,291 Total income (FTE) (non-GAAP)$ 272,716 $ 313,484 $ 385,374 $ 425,591 $ 491,280 $ 138,774 $ 138,527 $ 130,845 $ 133,147 Total noninterest expense (GAAP)$ 177,468 $ 212,852 $ 247,428 $ 258,434 $ 297,138 $ 77,975 $ 79,286 $ 80,906 $ 80,742 Amortization of intangibles 5,606 6,069 6,747 6,530 7,179 2,110 2,053 1,996 1,946 Merger-related expenses 694 11,614 4,023 10,378 14,246 - 179 24 76 Debt extinguishment penalty - - 2,539 205 - - - 54 - Loss share termination - - 2,053 - - - - - - Total noninterest expense (non-GAAP)$ 171,168 $ 195,169 $ 232,066 $ 241,321 $ 275,713 $ 75,865 $ 77,054 $ 78,832 $ 78,720 Efficiency Ratio (non-GAAP) 62.8% 62.3% 60.2% 56.7% 56.1% 54.7% 55.6% 60.2% 59.1% 35

Reconciliation of Non-GAAP Disclosures Non Interest Income $ in thousands 1Q16 2Q16 3Q16 4Q16 Actual non interest income (GAAP)$ 33,302 $ 35,586 $ 38,272 $ 30,071 Securities gains (losses) (71) 1,257 - - Actual non interest income (non-GAAP)$ 33,373 $ 34,329 $ 38,272 $ 30,071 $ in thousands 1Q17 2Q17 3Q17 4Q17 1Q18 2Q18 3Q18 4Q18 1Q19 2Q19 3Q19 4Q19 Actual non interest income (GAAP)$ 32,021 $ 34,265 $ 33,413 $ 32,441 $ 33,953 $ 35,581 $ 38,053 $ 36,374 $ 35,885 $ 41,960 $ 37,953 $ 37,456 Securities gains (losses) - - 57 91 - - (16) - 13 (8) 343 - MSR valuation adjustment - - - - - - - - - - (3,132) 1,296 Actual non interest income (non-GAAP)$ 32,021 $ 34,265 $ 33,356 $ 32,350 $ 33,953 $ 35,581 $ 38,069 $ 36,374 $ 35,872 $ 41,968 $ 40,742 $ 36,160 36
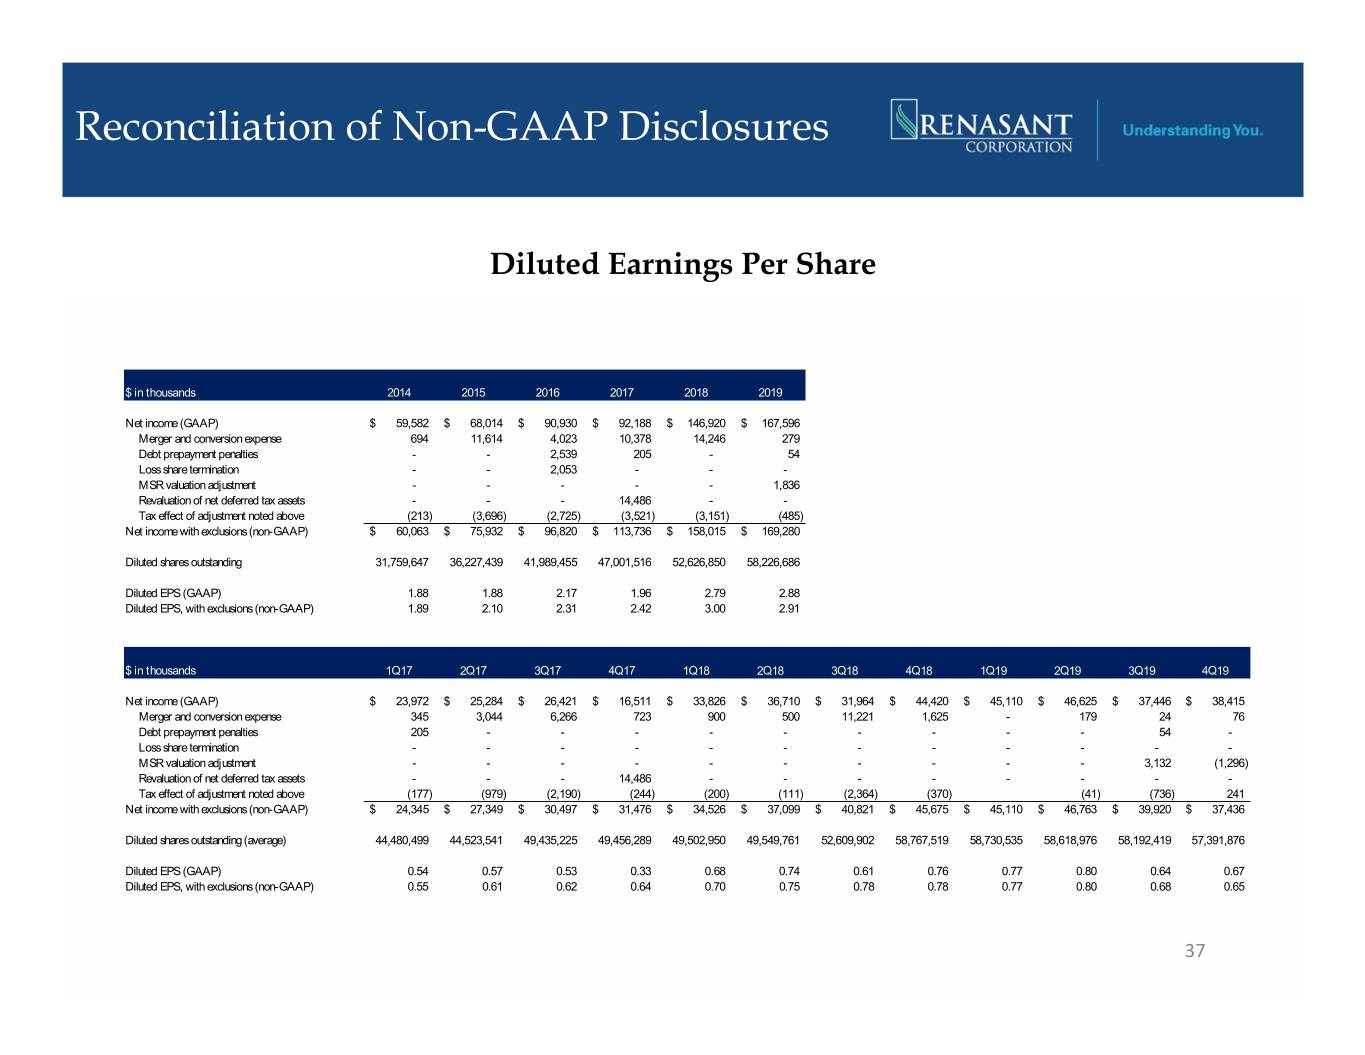
Reconciliation of Non-GAAP Disclosures Diluted Earnings Per Share $ in thousands 2014 2015 2016 2017 2018 2019 Net income (GAAP)$ 59,582 $ 68,014 $ 90,930 $ 92,188 $ 146,920 $ 167,596 Merger and conversion expense 694 11,614 4,023 10,378 14,246 279 Debt prepayment penalties - - 2,539 205 - 54 Loss share termination - - 2,053 - - - MSR valuation adjustment - - - - - 1,836 Revaluation of net deferred tax assets - - - 14,486 - - Tax effect of adjustment noted above (213) (3,696) (2,725) (3,521) (3,151) (485) Net income with exclusions (non-GAAP)$ 60,063 $ 75,932 $ 96,820 $ 113,736 $ 158,015 $ 169,280 Diluted shares outstanding 31,759,647 36,227,439 41,989,455 47,001,516 52,626,850 58,226,686 Diluted EPS (GAAP) 1.88 1.88 2.17 1.96 2.79 2.88 Diluted EPS, with exclusions (non-GAAP) 1.89 2.10 2.31 2.42 3.00 2.91 $ in thousands 1Q17 2Q17 3Q17 4Q17 1Q18 2Q18 3Q18 4Q18 1Q19 2Q19 3Q19 4Q19 Net income (GAAP)$ 23,972 $ 25,284 $ 26,421 $ 16,511 $ 33,826 $ 36,710 $ 31,964 $ 44,420 $ 45,110 $ 46,625 $ 37,446 $ 38,415 Merger and conversion expense 345 3,044 6,266 723 900 500 11,221 1,625 - 179 24 76 Debt prepayment penalties 205 - - - - - - - - - 54 - Loss share termination - - - - - - - - - - - - MSR valuation adjustment - - - - - - - - - - 3,132 (1,296) Revaluation of net deferred tax assets - - - 14,486 - - - - - - - - Tax effect of adjustment noted above (177) (979) (2,190) (244) (200) (111) (2,364) (370) (41) (736) 241 Net income with exclusions (non-GAAP)$ 24,345 $ 27,349 $ 30,497 $ 31,476 $ 34,526 $ 37,099 $ 40,821 $ 45,675 $ 45,110 $ 46,763 $ 39,920 $ 37,436 Diluted shares outstanding (average) 44,480,499 44,523,541 49,435,225 49,456,289 49,502,950 49,549,761 52,609,902 58,767,519 58,730,535 58,618,976 58,192,419 57,391,876 Diluted EPS (GAAP) 0.54 0.57 0.53 0.33 0.68 0.74 0.61 0.76 0.77 0.80 0.64 0.67 Diluted EPS, with exclusions (non-GAAP) 0.55 0.61 0.62 0.64 0.70 0.75 0.78 0.78 0.77 0.80 0.68 0.65 37
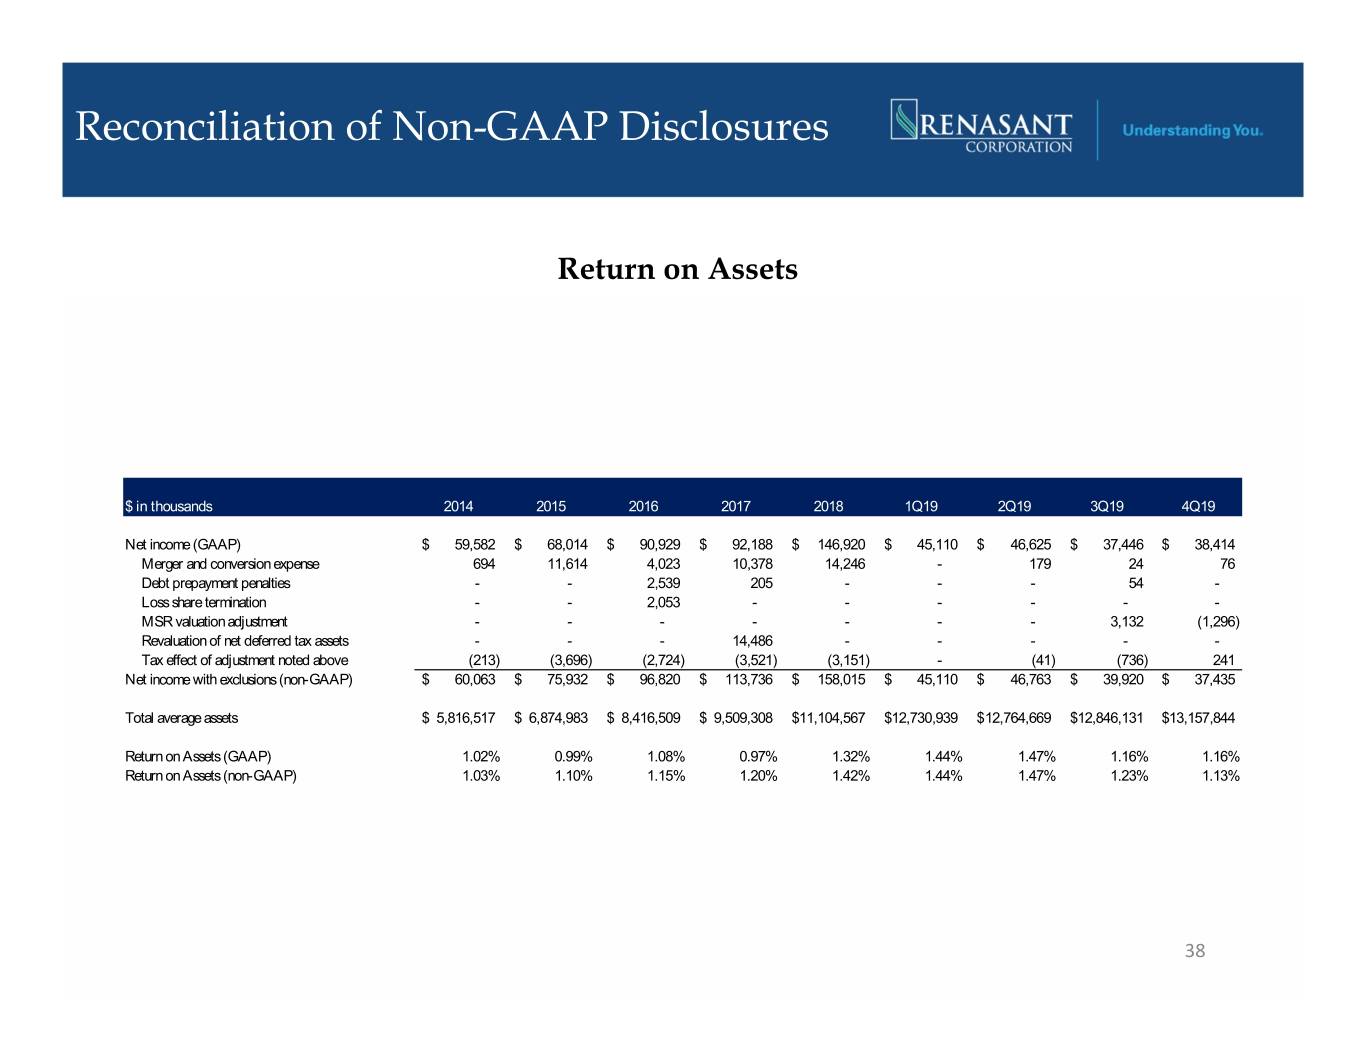
Reconciliation of Non-GAAP Disclosures Return on Assets $ in thousands 2014 2015 2016 2017 2018 1Q19 2Q19 3Q19 4Q19 Net income (GAAP)$ 59,582 $ 68,014 $ 90,929 $ 92,188 $ 146,920 $ 45,110 $ 46,625 $ 37,446 $ 38,414 Merger and conversion expense 694 11,614 4,023 10,378 14,246 - 179 24 76 Debt prepayment penalties - - 2,539 205 - - - 54 - Loss share termination - - 2,053 - - - - - - MSR valuation adjustment - - - - - - - 3,132 (1,296) Revaluation of net deferred tax assets - - - 14,486 - - - - - Tax effect of adjustment noted above (213) (3,696) (2,724) (3,521) (3,151) - (41) (736) 241 Net income with exclusions (non-GAAP)$ 60,063 $ 75,932 $ 96,820 $ 113,736 $ 158,015 $ 45,110 $ 46,763 $ 39,920 $ 37,435 Total average assets$ 5,816,517 $ 6,874,983 $ 8,416,509 $ 9,509,308 $ 11,104,567 $12,730,939 $ 12,764,669 $12,846,131 $ 13,157,844 Return on Assets (GAAP) 1.02% 0.99% 1.08% 0.97% 1.32% 1.44% 1.47% 1.16% 1.16% Return on Assets (non-GAAP) 1.03% 1.10% 1.15% 1.20% 1.42% 1.44% 1.47% 1.23% 1.13% 38
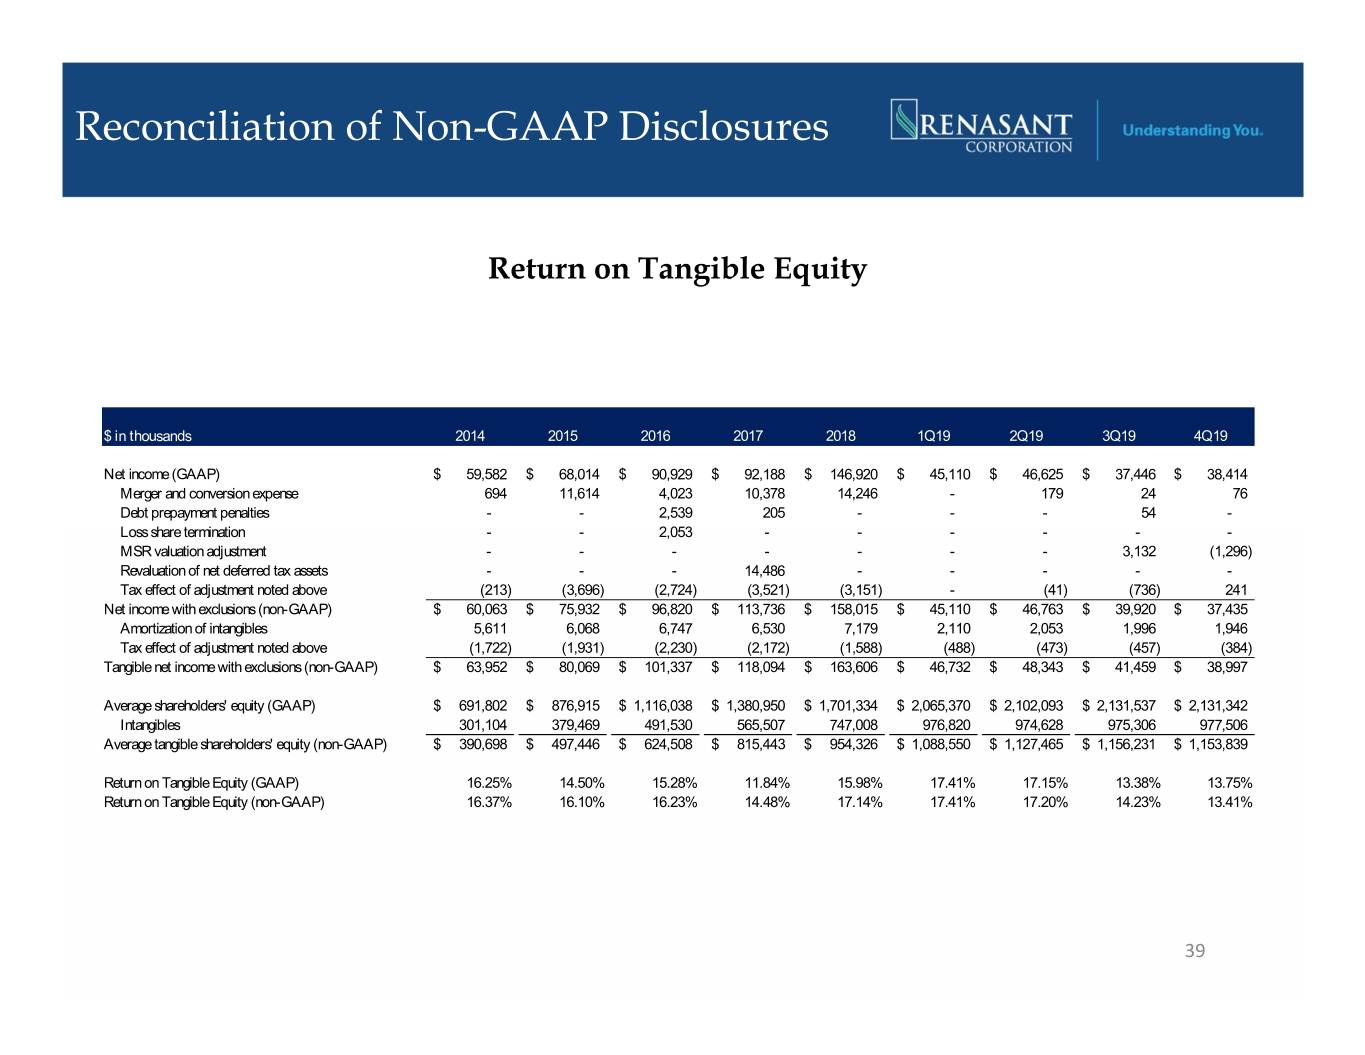
Reconciliation of Non-GAAP Disclosures Return on Tangible Equity $ in thousands 2014 2015 2016 2017 2018 1Q19 2Q19 3Q19 4Q19 Net income (GAAP)$ 59,582 $ 68,014 $ 90,929 $ 92,188 $ 146,920 $ 45,110 $ 46,625 $ 37,446 $ 38,414 Merger and conversion expense 694 11,614 4,023 10,378 14,246 - 179 24 76 Debt prepayment penalties - - 2,539 205 - - - 54 - Loss share termination - - 2,053 - - - - - - MSR valuation adjustment - - - - - - - 3,132 (1,296) Revaluation of net deferred tax assets - - - 14,486 - - - - - Tax effect of adjustment noted above (213) (3,696) (2,724) (3,521) (3,151) - (41) (736) 241 Net income with exclusions (non-GAAP)$ 60,063 $ 75,932 $ 96,820 $ 113,736 $ 158,015 $ 45,110 $ 46,763 $ 39,920 $ 37,435 Amortization of intangibles 5,611 6,068 6,747 6,530 7,179 2,110 2,053 1,996 1,946 Tax effect of adjustment noted above (1,722) (1,931) (2,230) (2,172) (1,588) (488) (473) (457) (384) Tangible net income with exclusions (non-GAAP)$ 63,952 $ 80,069 $ 101,337 $ 118,094 $ 163,606 $ 46,732 $ 48,343 $ 41,459 $ 38,997 Average shareholders' equity (GAAP)$ 691,802 $ 876,915 $ 1,116,038 $ 1,380,950 $ 1,701,334 $ 2,065,370 $ 2,102,093 $ 2,131,537 $ 2,131,342 Intangibles 301,104 379,469 491,530 565,507 747,008 976,820 974,628 975,306 977,506 Average tangible shareholders' equity (non-GAAP)$ 390,698 $ 497,446 $ 624,508 $ 815,443 $ 954,326 $ 1,088,550 $ 1,127,465 $ 1,156,231 $ 1,153,839 Return on Tangible Equity (GAAP) 16.25% 14.50% 15.28% 11.84% 15.98% 17.41% 17.15% 13.38% 13.75% Return on Tangible Equity (non-GAAP) 16.37% 16.10% 16.23% 14.48% 17.14% 17.41% 17.20% 14.23% 13.41% 39

Investor Inquiries E. Robinson McGraw Chairman of the Board and Executive Chairman 209 TROY STREET TUPELO, MS 38804-4827 C. Mitchell Waycaster President and Chief Executive Officer PHONE: 1-800-680-1601 FACSIMILE: 1-662-680-1234 Kevin D. Chapman WWW.RENASANT.COM Senior Executive Vice President, WWW.RENASANTBANK.COM Chief Financial Officer and Chief Operating Officer 40


