COVID-19 Credit Update Q2 2020
Forward-Looking Statements This presentation may contain various statements about Renasant Corporation (“Renasant,” “we,” “our,” or “us”) that constitute “forward-looking statements” within the meaning of Section 27A of the Securities Act of 1933, as amended, and Section 21E of the Securities Exchange Act of 1934, as amended. Statements preceded by, followed by or that otherwise include the words “believes,” “expects,” “projects,” “anticipates,” “intends,” “estimates,” “plans,” “potential,” “possible,” “may increase,” “may fluctuate,” “will likely result,” and similar expressions, or future or conditional verbs such as “will,” “should,” “would” and “could,” are generally forward-looking in nature and not historical facts. Forward-looking statements include information about our future financial performance, business strategy, projected plans and objectives and are based on the current beliefs and expectations of management. We believe these forward-looking statements are reasonable, but they are all inherently subject to significant business, economic and competitive risks and uncertainties, many of which are beyond our control. In addition, these forward-looking statements are subject to assumptions about future business strategies and decisions that are subject to change. Actual results may differ from those indicated or implied in the forward-looking statements; such differences may be material. Prospective investors are cautioned that any forward-looking statements are not guarantees of future performance and involve risks and uncertainties. Investors should not place undue reliance on these forward-looking statements, which speak only as of the date they are made. Currently, the most important factor that could cause Renasant’s actual results to differ materially from those in forward-looking statements is the continued impact of the COVID-19 pandemic and related governmental measures to respond to the pandemic on the U.S. economy and the economies of the markets in which we operate. In this presentation, we have addressed the historical impact of the pandemic on our operations and set forth certain expectations regarding the COVID-19 pandemic’s future impact on our business, financial condition, results of operations, liquidity, asset quality, cash flows and prospects. We believe these statements about future events and conditions in light of the COVID-19 pandemic are reasonable, but these statements are based on assumptions regarding, among other things, how long the pandemic will continue, the duration and extent of the governmental measures implemented to contain the pandemic and ameliorate its impact on businesses and individuals throughout the United States, and the impact of the pandemic and the government’s virus containment measures on national and local economies, all of which are out of our control. If the assumptions underlying these statements about future events prove to be incorrect, Renasant’s business, financial condition, results of operations, liquidity, asset quality, cash flows and prospects may be materially different from what is presented in our forward-looking statements. Important factors other than the COVID-19 pandemic currently known to us that could cause actual results to differ materially from those in forward-looking statements include the following: (i) our ability to efficiently integrate acquisitions into operations, retain the customers of these businesses, grow the acquired operations and realize the cost savings expected from an acquisition to the extent and in the timeframe management anticipated; (ii) the effect of economic conditions and interest rates on a national, regional or international basis; (iii) timing and success of the implementation of changes in operations to achieve enhanced earnings or effect cost savings; (iv) competitive pressures in the consumer finance, commercial finance, insurance, financial services, asset management, retail banking, mortgage lending and auto lending industries; (v) the financial resources of, and products available from, competitors; (vi) changes in laws and regulations as well as changes in accounting standards, such as the adoption of the CECL model on January 1, 2020; (vii) changes in policy by regulatory agencies; (viii) changes in the securities and foreign exchange markets; (ix) our potential growth, including our entrance or expansion into new markets, and the need for sufficient capital to support that growth; (x) changes in the quality or composition of our loan or investment portfolios, including adverse developments in borrower industries or in the repayment ability of individual borrowers; (xi) an insufficient allowance for credit losses as a result of inaccurate assumptions; (xii) general economic, market or business conditions, including the impact of inflation; (xiii) changes in demand for loan products and financial services; (xiv) concentration of credit exposure; (xv) changes or the lack of changes in interest rates, yield curves and interest rate spread relationships; (xvi) increased cybersecurity risk, including potential network breaches, business disruptions or financial losses; (xvii) natural disasters, epidemics and other catastrophic events in our geographic area; (xviii) the impact, extent and timing of technological changes; and (xix) other circumstances, many of which are beyond our control. The COVID-19 pandemic has exacerbated, and is likely to continue to exacerbate the impact of any of these factors on us. Management believes that the assumptions underlying our forward-looking statements are reasonable, but any of the assumptions could prove to be inaccurate. Investors are urged to carefully consider the risks described in Renasant’s filings with the Securities and Exchange Commission from time to time, which are available at www.renasant.com and the SEC’s website at www.sec.gov. We undertake no obligation, and specifically disclaim any obligation, to update or our revise forward-looking statements, whether as a result of new information or to reflect changed assumptions, the occurrence of unanticipated events or changes to future operating results over time, except as required by federal securities laws. 2

Loan Portfolio* As of June 30, 2020 • Legacy of proactive portfolio management and Consumer Const 4% 8% Land Dev prudent credit underwriting C&I 2% 14% • Granular loan portfolio: 1-4 Family o Average loan size is approximately 29% $110,000 o No single commercial collateral type exceeds 7% of total portfolio Owner Remain below 100/300 CRE Occupied o 17% concentration limitations Multi-Family • Line utilization percentage remained flat at 4% Non Owner 6/30/20 as compared to 3/31/20 Occupied 22% • Minimal exposure to Energy sector Total Loan Portfolio1 • Approximately 94% of loans are in footprint * All references to loans in pages in the reminder of this section exclude loans held for sale and Paycheck Protection Program loans 3
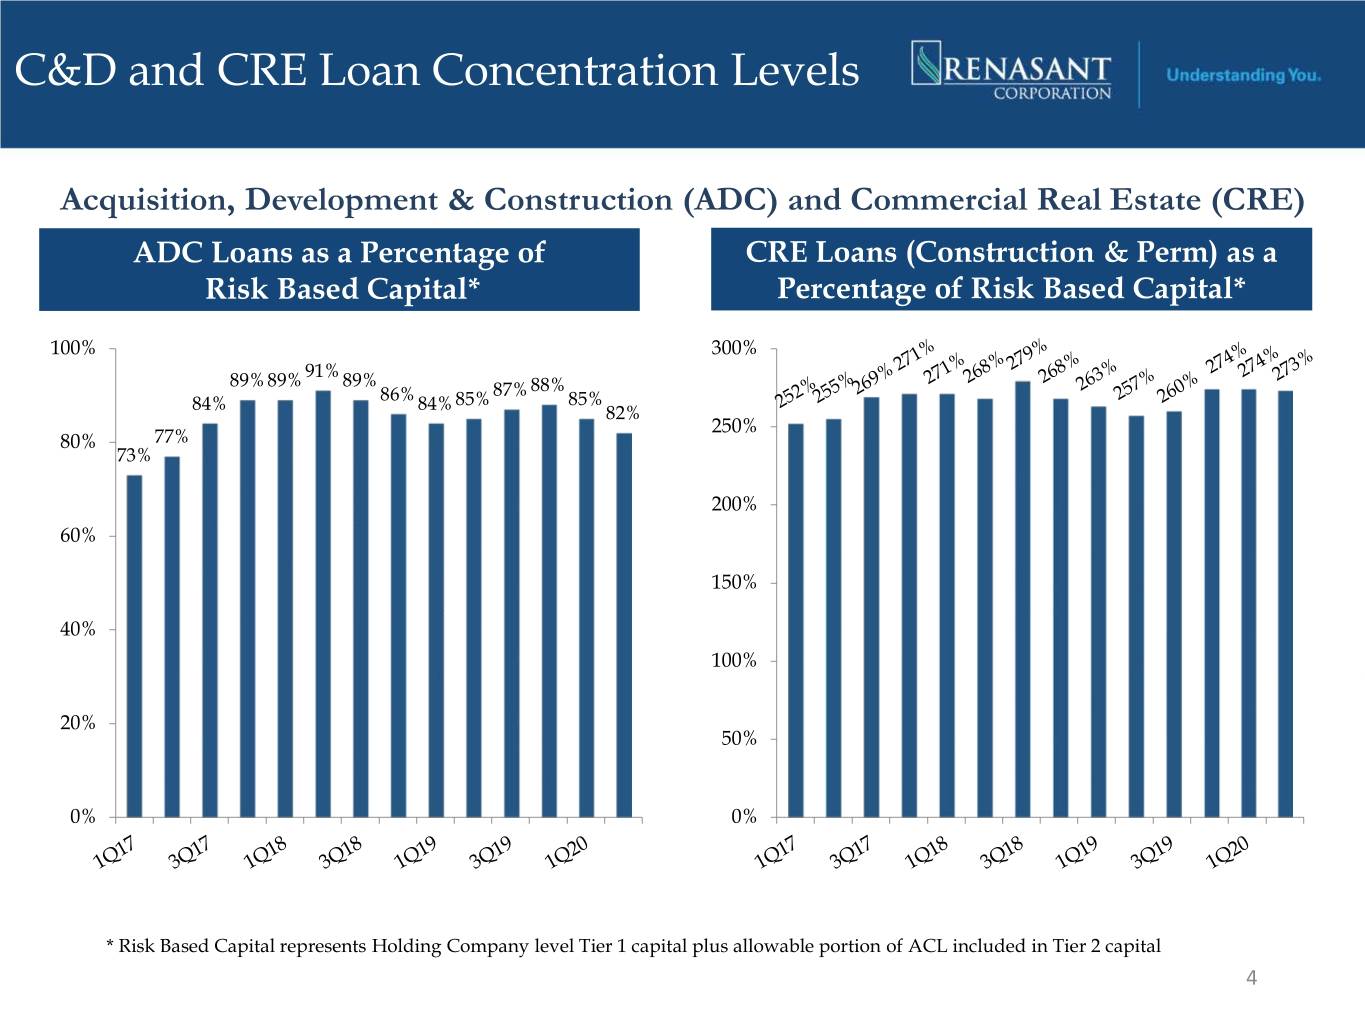
C&D and CRE Loan Concentration Levels Acquisition, Development & Construction (ADC) and Commercial Real Estate (CRE) ADC Loans as a Percentage of CRE Loans (Construction & Perm) as a Risk Based Capital* Percentage of Risk Based Capital* 100% 300% 91% 89% 89% 89% 88% 86% 85% 87% 85% 84% 84% 82% 250% 80% 77% 73% 200% 60% 150% 40% 100% 20% 50% 0% 0% * Risk Based Capital represents Holding Company level Tier 1 capital plus allowable portion of ACL included in Tier 2 capital 4
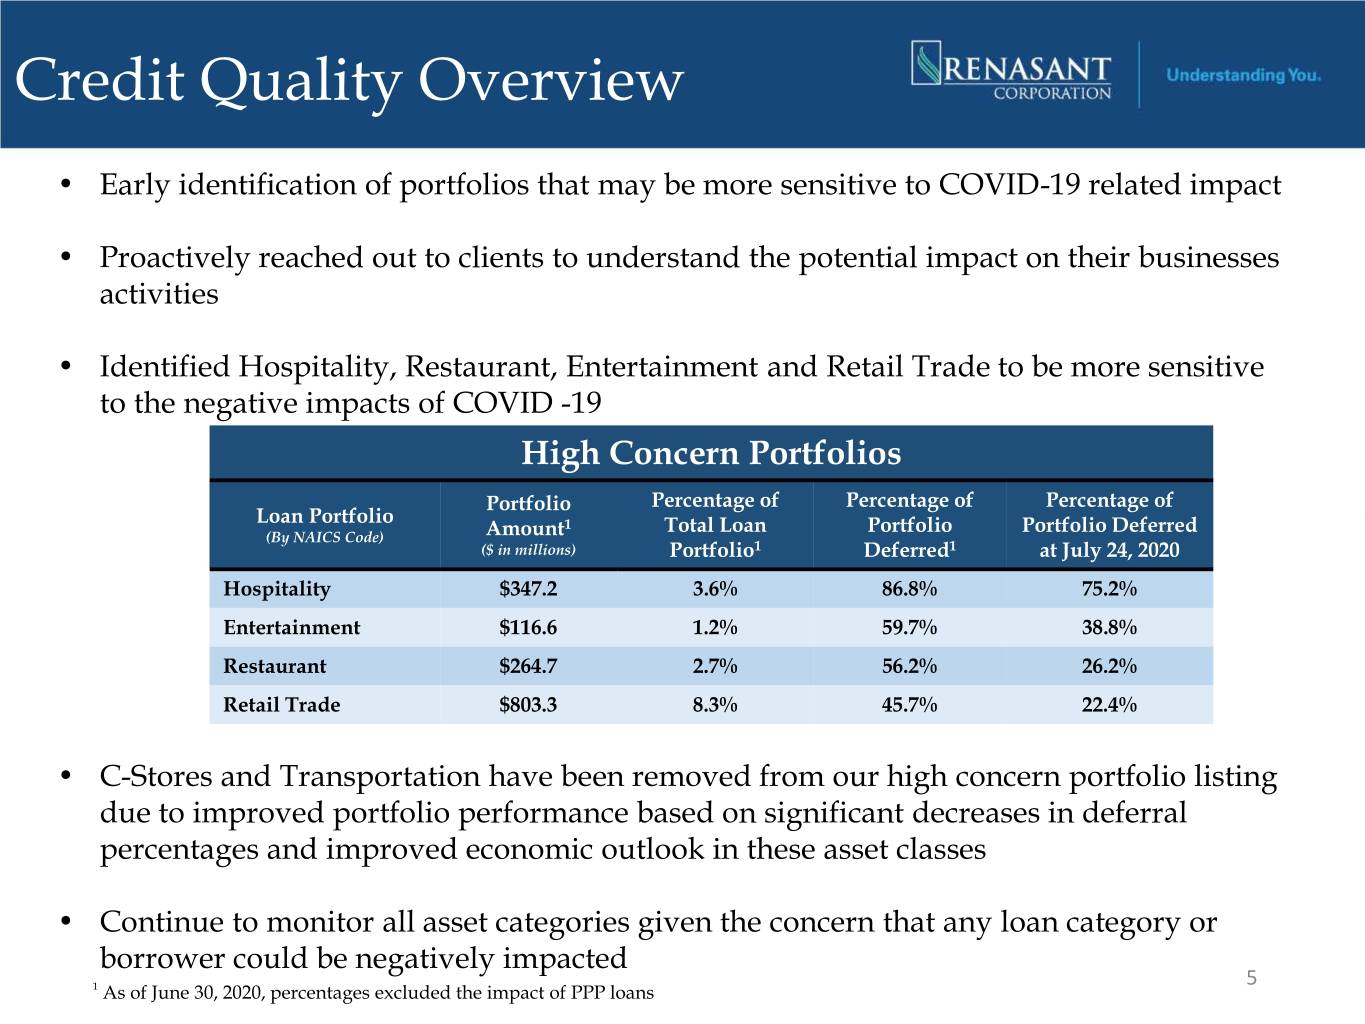
Credit Quality Overview • Early identification of portfolios that may be more sensitive to COVID-19 related impact • Proactively reached out to clients to understand the potential impact on their businesses activities • Identified Hospitality, Restaurant, Entertainment and Retail Trade to be more sensitive to the negative impacts of COVID -19 High Concern Portfolios Portfolio Percentage of Percentage of Percentage of Loan Portfolio 1 Total Loan Portfolio Portfolio Deferred (By NAICS Code) Amount ($ in millions) Portfolio1 Deferred1 at July 24, 2020 Hospitality $347.2 3.6% 86.8% 75.2% Entertainment $116.6 1.2% 59.7% 38.8% Restaurant $264.7 2.7% 56.2% 26.2% Retail Trade $803.3 8.3% 45.7% 22.4% • C-Stores and Transportation have been removed from our high concern portfolio listing due to improved portfolio performance based on significant decreases in deferral percentages and improved economic outlook in these asset classes • Continue to monitor all asset categories given the concern that any loan category or borrower could be negatively impacted 5 1 As of June 30, 2020, percentages excluded the impact of PPP loans
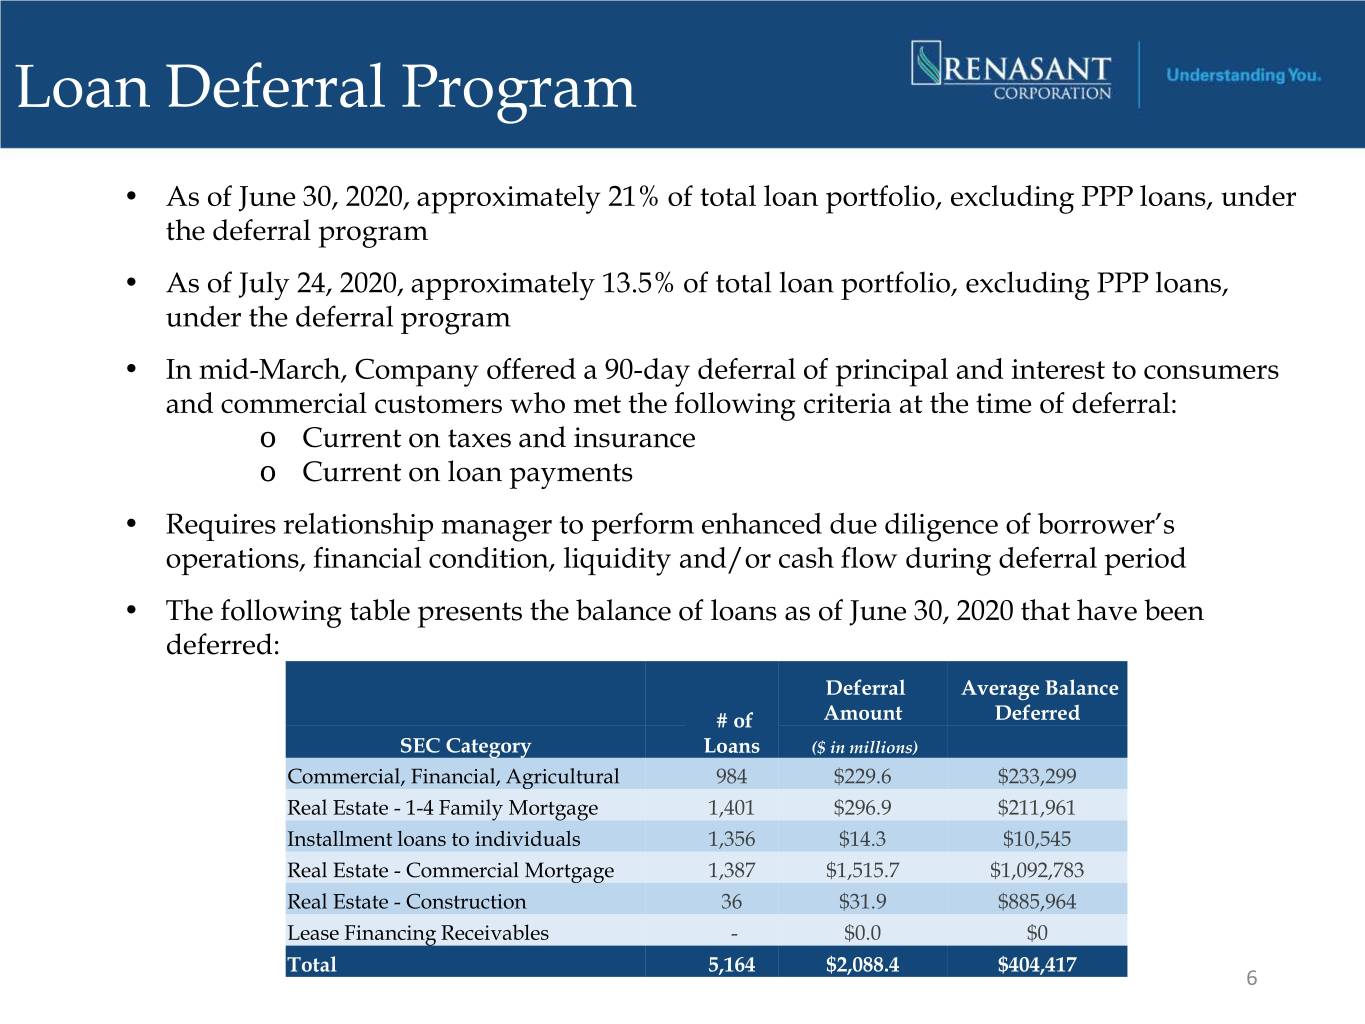
Loan Deferral Program • As of June 30, 2020, approximately 21% of total loan portfolio, excluding PPP loans, under the deferral program • As of July 24, 2020, approximately 13.5% of total loan portfolio, excluding PPP loans, under the deferral program • In mid-March, Company offered a 90-day deferral of principal and interest to consumers and commercial customers who met the following criteria at the time of deferral: o Current on taxes and insurance o Current on loan payments • Requires relationship manager to perform enhanced due diligence of borrower’s operations, financial condition, liquidity and/or cash flow during deferral period • The following table presents the balance of loans as of June 30, 2020 that have been deferred: Deferral Average Balance # of Amount Deferred SEC Category Loans ($ in millions) Commercial, Financial, Agricultural 984 $229.6 $233,299 Real Estate - 1-4 Family Mortgage 1,401 $296.9 $211,961 Installment loans to individuals 1,356 $14.3 $10,545 Real Estate - Commercial Mortgage 1,387 $1,515.7 $1,092,783 Real Estate - Construction 36 $31.9 $885,964 Lease Financing Receivables - $0.0 $0 Total 5,164 $2,088.4 $404,417 6

Continuing Credit Enhancement • Rolled out a phase 2 commercial loan deferral program with requirement to underwrite the customer’s deferral needs and creditworthiness • Instituted a monthly loan risk rating upgrade/downgrade committee to manage consistency of risk rating migration and portfolio stress • Added a monthly market based problem loan committee to early identify and manage problem assets • Establishing a problem loan workout team • Increased expectations for credit quality, yield and returns on new production • Updated CRE and C&I lending guidance • Implemented new C&I underwriting stress scenarios • Added COVID-19 questionnaire for all new and renewed customers to gauge its impact on their business model • Staying disciplined on past dues and staying connected with customers 7

Higher Risk Industries Hospitality Portfolio by Flag1 Entertainment Portfolio by Type1 Independent Other 9% Golf National Other Flags Courses Marriott 23% 8% 24% Wyndham 32% 3% Holiday Inn (IHG) 14% Fitness Theaters Centers 12% 17% Sports Facilities/Instruction Marinas 5% Hilton 19% 34% • Entertainment represents 1.2% of total loans • Hospitality represents 3.6% of total loans • Average loans size approximates $574,000 • Average loans size approximates $2.5 million • Approximately 88% of the entertainment • Weighted average LTV approximates 59% portfolio is secured by real estate 1 As of June 30, 2020 8
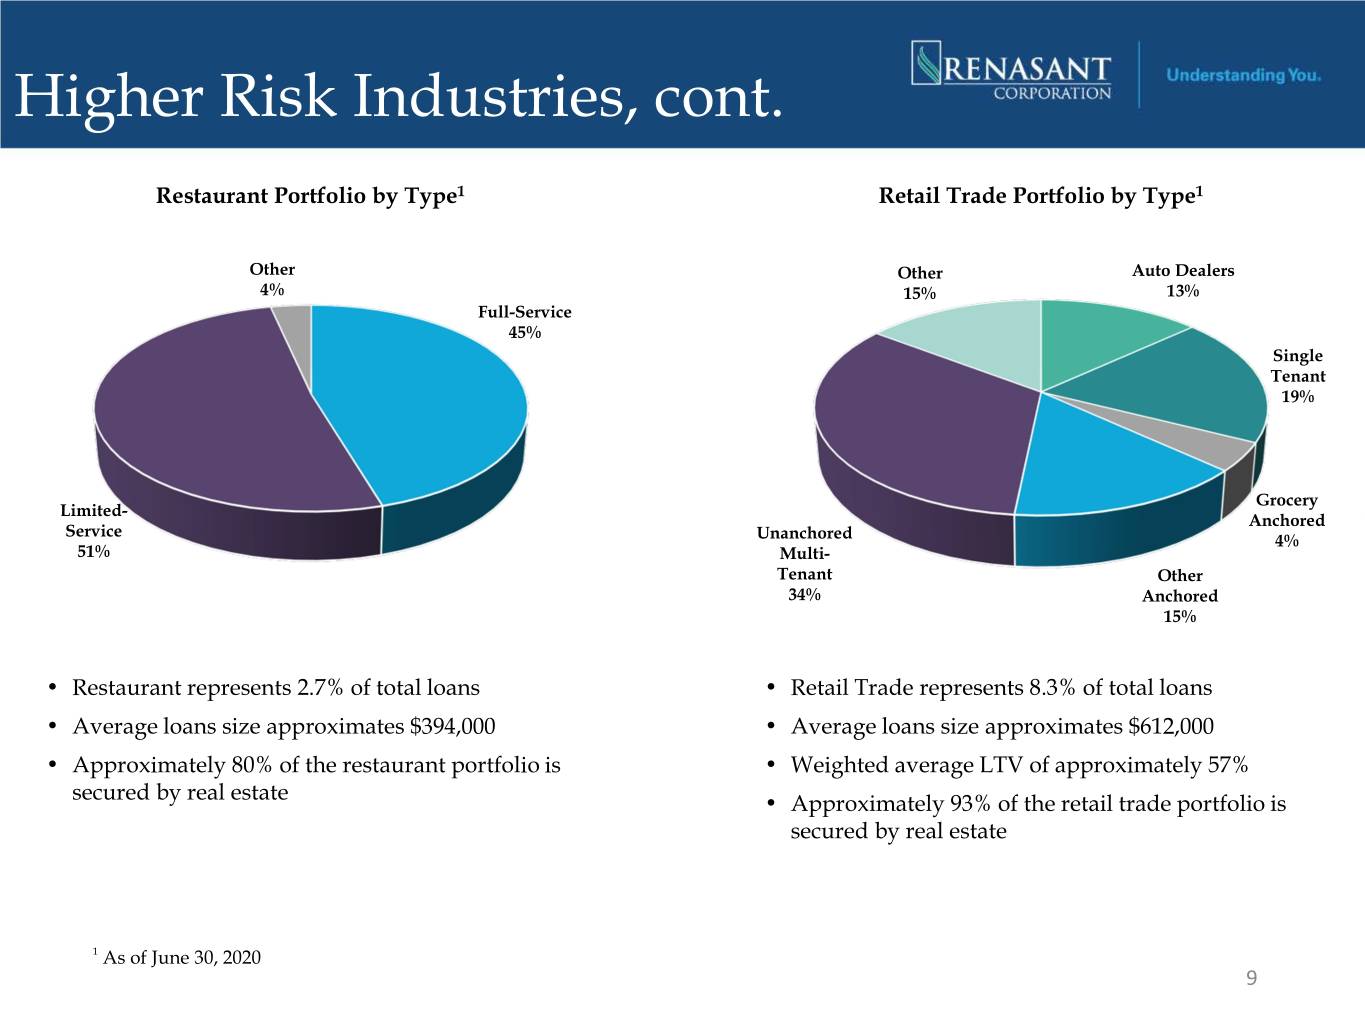
Higher Risk Industries, cont. Restaurant Portfolio by Type1 Retail Trade Portfolio by Type1 Other Other Auto Dealers 4% 15% 13% Full-Service 45% Single Tenant 19% Grocery Limited- Anchored Service Unanchored 4% 51% Multi- Tenant Other 34% Anchored 15% • Restaurant represents 2.7% of total loans • Retail Trade represents 8.3% of total loans • Average loans size approximates $394,000 • Average loans size approximates $612,000 • Approximately 80% of the restaurant portfolio is • Weighted average LTV of approximately 57% secured by real estate • Approximately 93% of the retail trade portfolio is secured by real estate 1 As of June 30, 2020 9

CARES Act and Paycheck Protection Program (PPP) • Our approach • Lenders were hands on with the customers – not an online application portal • Credit was included in approval process • Utilized technology to improve efficiency • Offered to clients and non-clients, gained media recognition and loyal new clients • 30% of PPP loans were to new customers • 70% of PPP loans were to existing customers • Closed over 10,500 loans, funded $1.3 billion through June 30, 2020 and generated over $44.7 million in gross fees • Utilizing on-balance sheet liquidity for current funding needs. • Prepared to participate in the Paycheck Protection Program Liquidity Facility (PPPLF) but currently using excess balance sheet liquidity to fund PPP loans 10


