
Fourth Quarter 2020 Earnings Call

2 Forward-Looking Statements This presentation may contain various statements about Renasant Corporation (“Renasant,” “we,” “our,” or “us”) that constitute “forward-looking statements” within the meaning of Section 27A of the Securities Act of 1933, as amended, and Section 21E of the Securities Exchange Act of 1934, as amended. Statements preceded by, followed by or that otherwise include the words “believes,” “expects,” “projects,” “anticipates,” “intends,” “estimates,” “plans,” “potential,” “possible,” “may increase,” “may fluctuate,” “will likely result,” and similar expressions, or future or conditional verbs such as “will,” “should,” “would” and “could,” are generally forward-looking in nature and not historical facts. Forward-looking statements include information about our future financial performance, business strategy, projected plans and objectives and are based on the current beliefs and expectations of management. We believe these forward-looking statements are reasonable, but they are all inherently subject to significant business, economic and competitive risks and uncertainties, many of which are beyond our control. In addition, these forward-looking statements are subject to assumptions about future business strategies and decisions that are subject to change. Actual results may differ from those indicated or implied in the forward-looking statements; such differences may be material. Prospective investors are cautioned that any forward-looking statements are not guarantees of future performance and involve risks and uncertainties. Investors should not place undue reliance on these forward-looking statements, which speak only as of the date they are made. Currently, the most important factor that could cause Renasant’s actual results to differ materially from those in forward-looking statements is the continued impact of the COVID-19 pandemic and related governmental measures to respond to the pandemic on the U.S. economy and the economies of the markets in which we operate and our participation in government programs related to the pandemic. In this presentation, we have addressed the historical impact of the pandemic on our operations and set forth certain expectations regarding the COVID-19 pandemic’s future impact on our business, financial condition, results of operations, liquidity, asset quality, capital, cash flows and prospects. We believe these statements about future events and conditions in light of the COVID-19 pandemic are reasonable, but these statements are based on assumptions regarding, among other things, how long the pandemic will continue, the pace at which the COVID-19 vaccine can be distributed and administered to residents of the markets we serve and the United States generally, the duration, extent and effectiveness of the governmental measures implemented to contain the pandemic and ameliorate its impact on businesses and individuals throughout the United States, and the impact of the pandemic and the government’s virus containment measures on national and local economies, all of which are out of our control. If the assumptions underlying these statements about future events prove to be incorrect, Renasant’s business, financial condition, results of operations, liquidity, asset quality, capital, cash flows and prospects may be materially different from what is presented in our forward-looking statements. Important factors other than the COVID-19 pandemic currently known to us that could cause actual results to differ materially from those in forward-looking statements include the following: (i) our ability to efficiently integrate acquisitions into operations, retain the customers of these businesses, grow the acquired operations and realize the cost savings expected from an acquisition to the extent and in the timeframe management anticipated; (ii) the effect of economic conditions and interest rates on a national, regional or international basis; (iii) timing and success of the implementation of changes in operations to achieve enhanced earnings or effect cost savings; (iv) competitive pressures in the consumer finance, commercial finance, insurance, financial services, asset management, retail banking, mortgage lending and auto lending industries; (v) the financial resources of, and products available from, competitors; (vi) changes in laws and regulations as well as changes in accounting standards, such as the adoption of the CECL model on January 1, 2020; (vii) changes in policy by regulatory agencies; (viii) changes in the securities and foreign exchange markets; (ix) our potential growth, including our entrance or expansion into new markets, and the need for sufficient capital to support that growth; (x) changes in the quality or composition of our loan or investment portfolios, including adverse developments in borrower industries or in the repayment ability of individual borrowers; (xi) an insufficient allowance for credit losses as a result of inaccurate assumptions; (xii) general economic, market or business conditions, including the impact of inflation; (xiii) changes in demand for loan products and financial services; (xiv) concentration of credit exposure; (xv) changes or the lack of changes in interest rates, yield curves and interest rate spread relationships; (xvi) increased cybersecurity risk, including potential network breaches, business disruptions or financial losses; (xvii) civil unrest, natural disasters, epidemics and other catastrophic events in our geographic area; (xviii) the impact, extent and timing of technological changes; and (xix) other circumstances, many of which are beyond our control. The COVID-19 pandemic has exacerbated, and is likely to continue to exacerbate, the impact of any of these factors on us. Management believes that the assumptions underlying our forward-looking statements are reasonable, but any of the assumptions could prove to be inaccurate. Investors are urged to carefully consider the risks described in Renasant’s filings with the Securities and Exchange Commission (“SEC”) from time to time, which are available at investors.renasant.com and the SEC’s website at www.sec.gov. We undertake no obligation, and specifically disclaim any obligation, to update or revise our forward-looking statements, whether as a result of new information or to reflect changed assumptions, the occurrence of unanticipated events or changes to future operating results over time, except as required by federal securities laws.
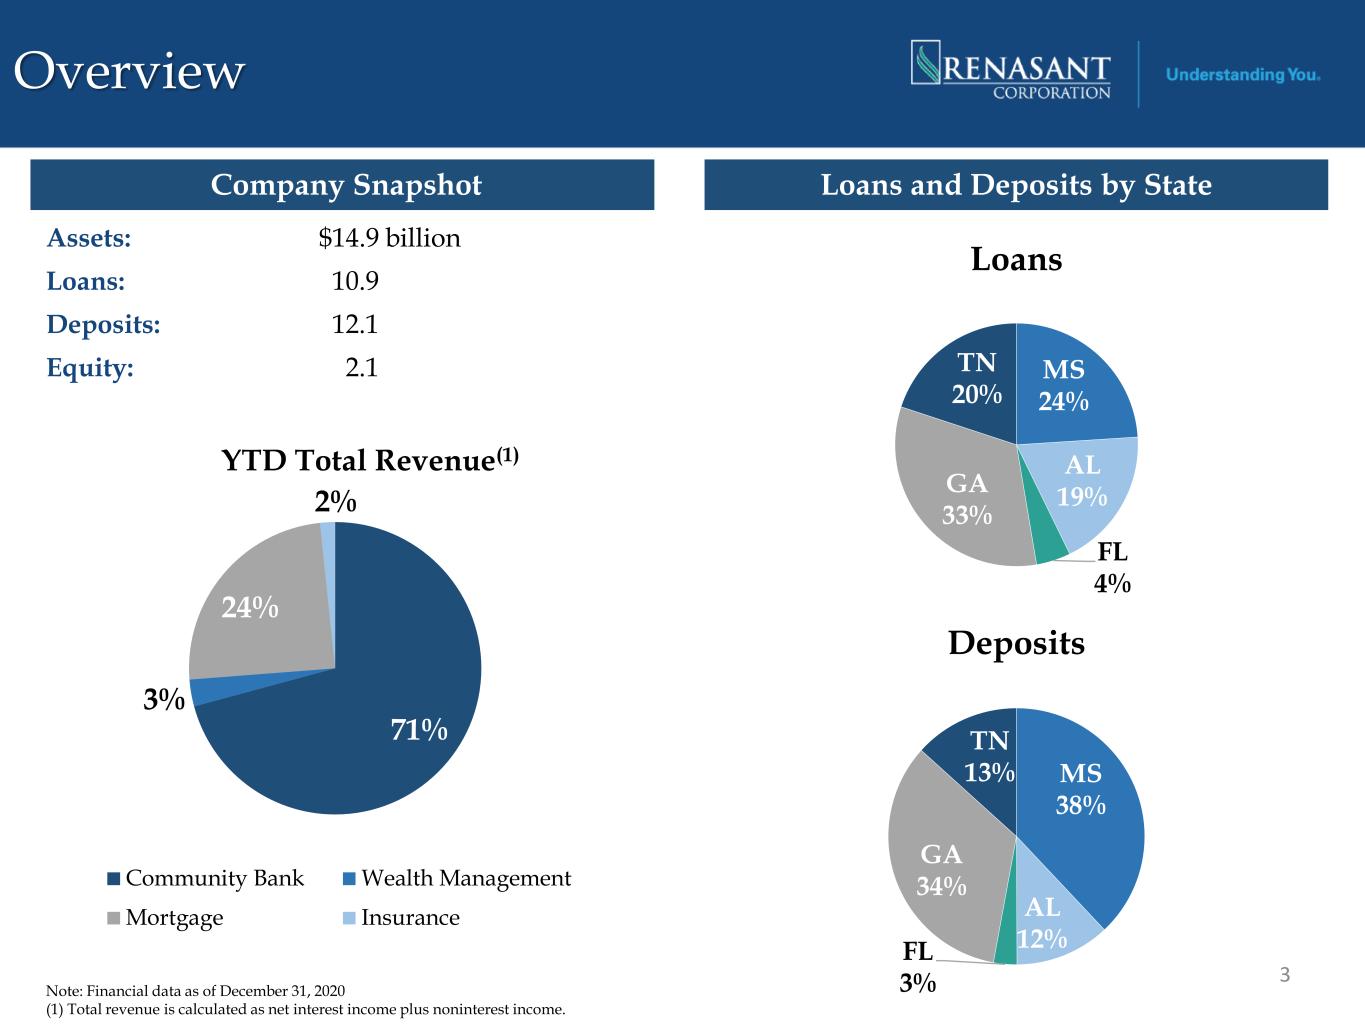
Overview Note: Financial data as of December 31, 2020 (1) Total revenue is calculated as net interest income plus noninterest income. Company Snapshot Loans and Deposits by State Assets: $14.9 billion Loans: 10.9 Deposits: 12.1 Equity: 2.1 3 MS 24% AL 19% FL 4% GA 33% TN 20% Loans MS 38% AL 12% FL 3% GA 34% TN 13% Deposits 71% 3% 24% 2% YTD Total Revenue(1) Community Bank Wealth Management Mortgage Insurance
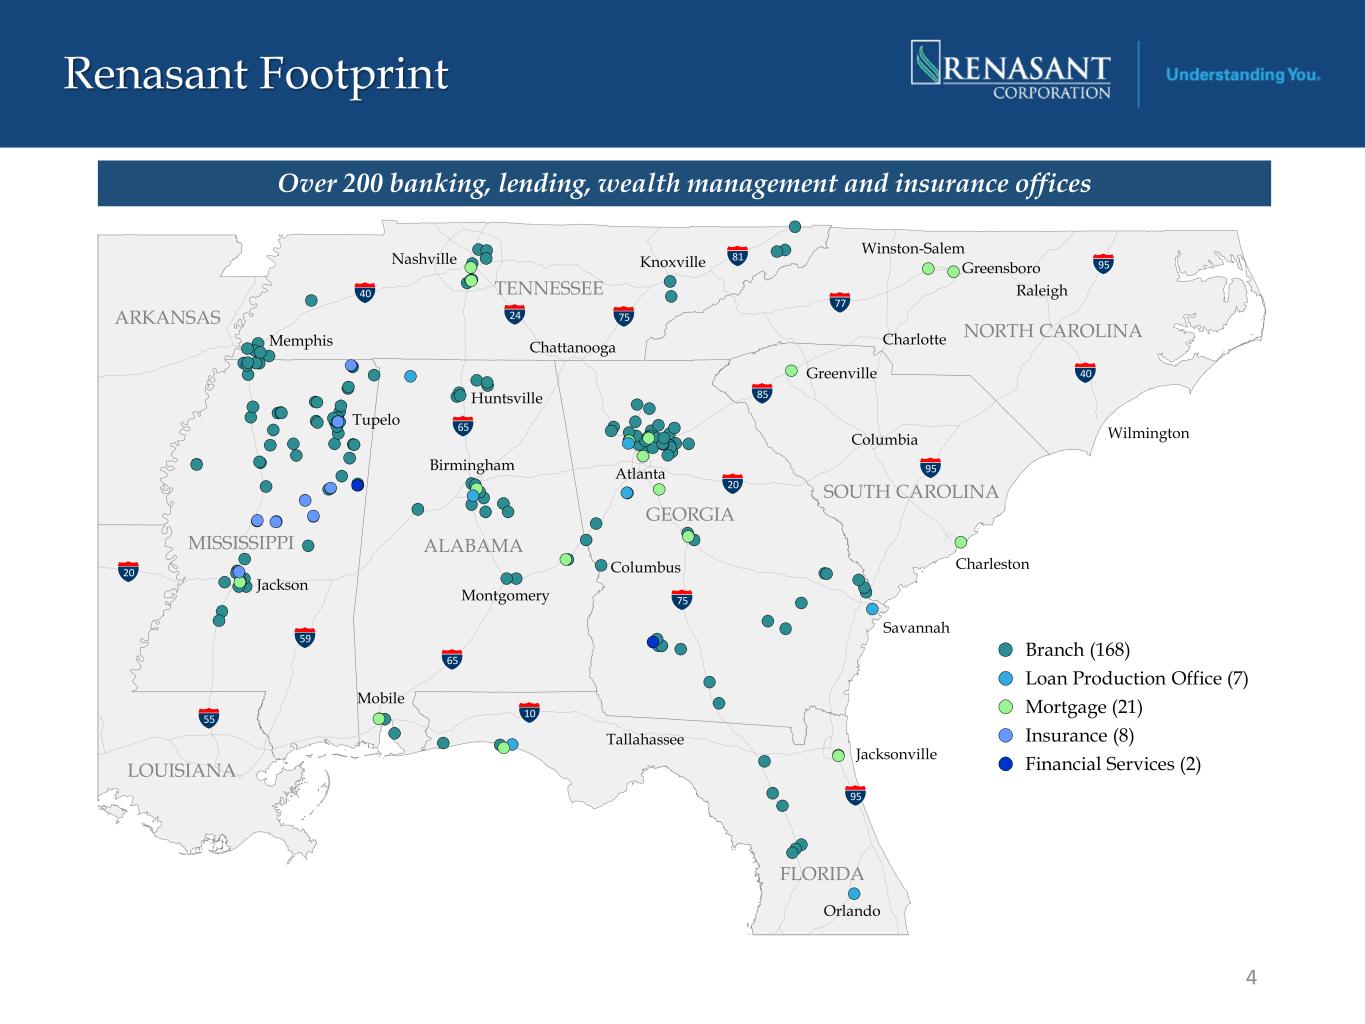
4 Renasant Footprint Branch (168) Loan Production Office (7) Mortgage (21) Insurance (8) Financial Services (2) Jackson Mobile Knoxville Chattanooga Greensboro Raleigh Columbia Nashville Winston-Salem Montgomery Birmingham Columbus Charlotte Jacksonville Memphis Orlando Huntsville Tallahassee Atlanta Wilmington Charleston Savannah Tupelo MISSISSIPPI ALABAMA TENNESSEE GEORGIA FLORIDA SOUTH CAROLINA NORTH CAROLINA ARKANSAS LOUISIANA 55 20 65 10 65 75 20 95 95 85 77 95 81 7524 40 59 40Greenville Over 200 banking, lending, wealth management and insurance offices
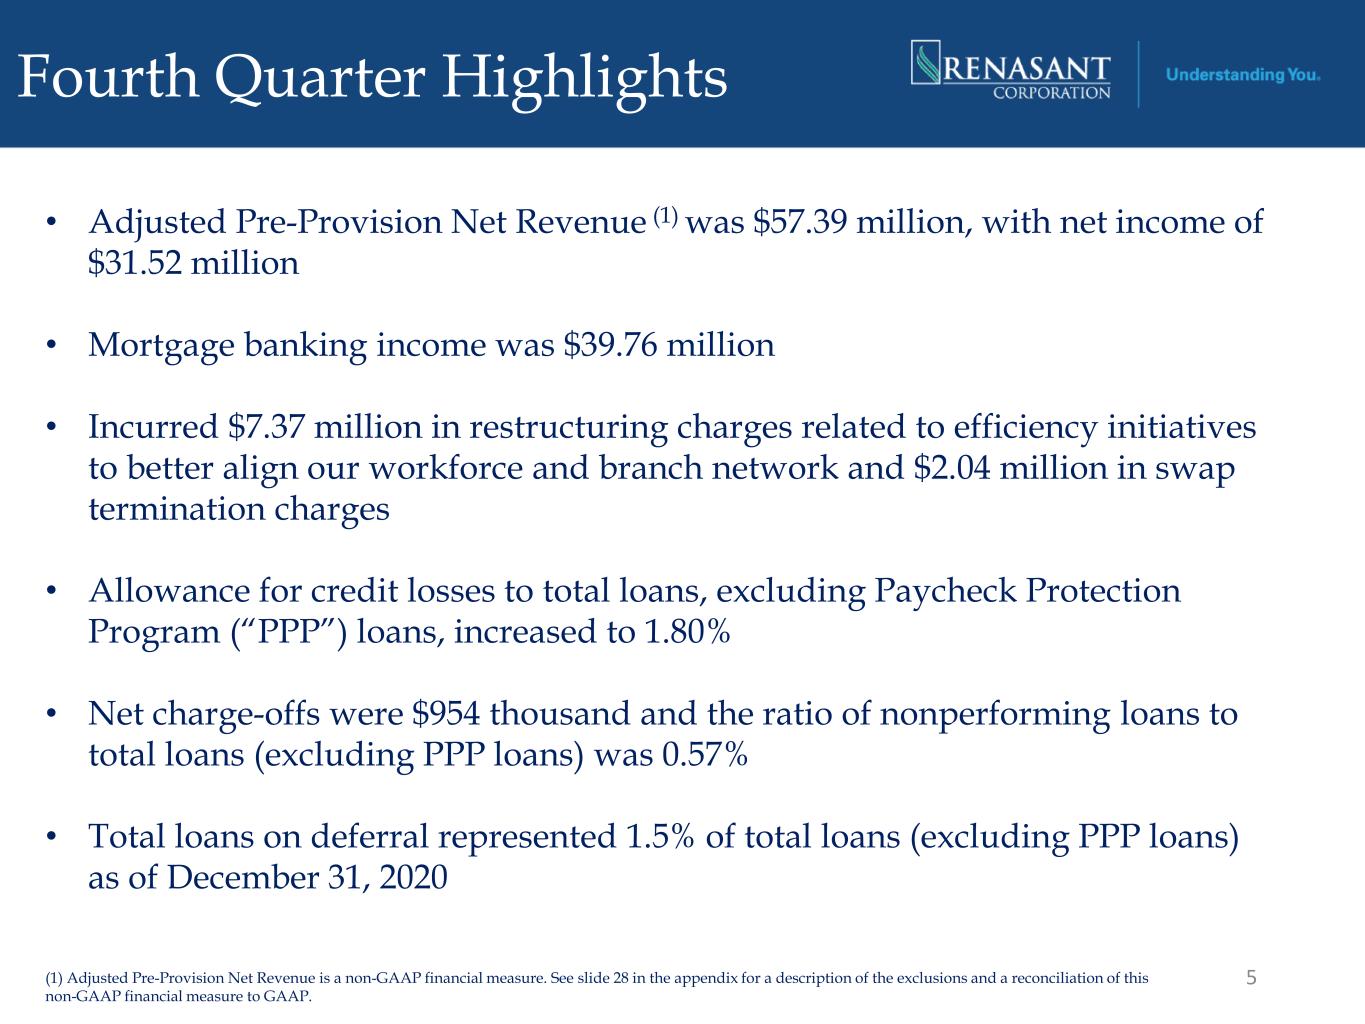
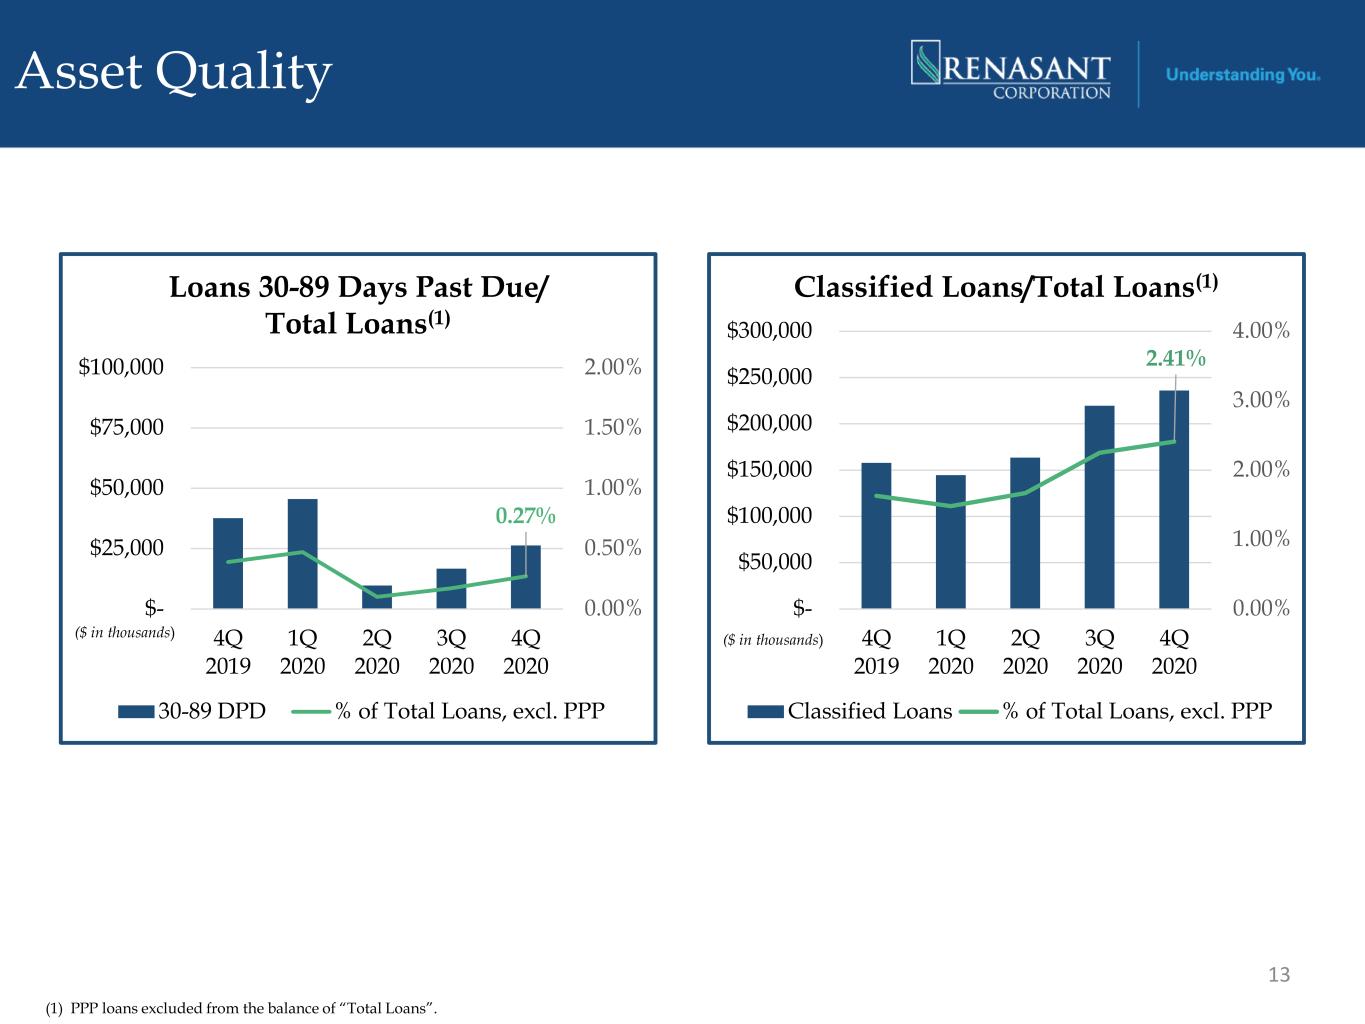
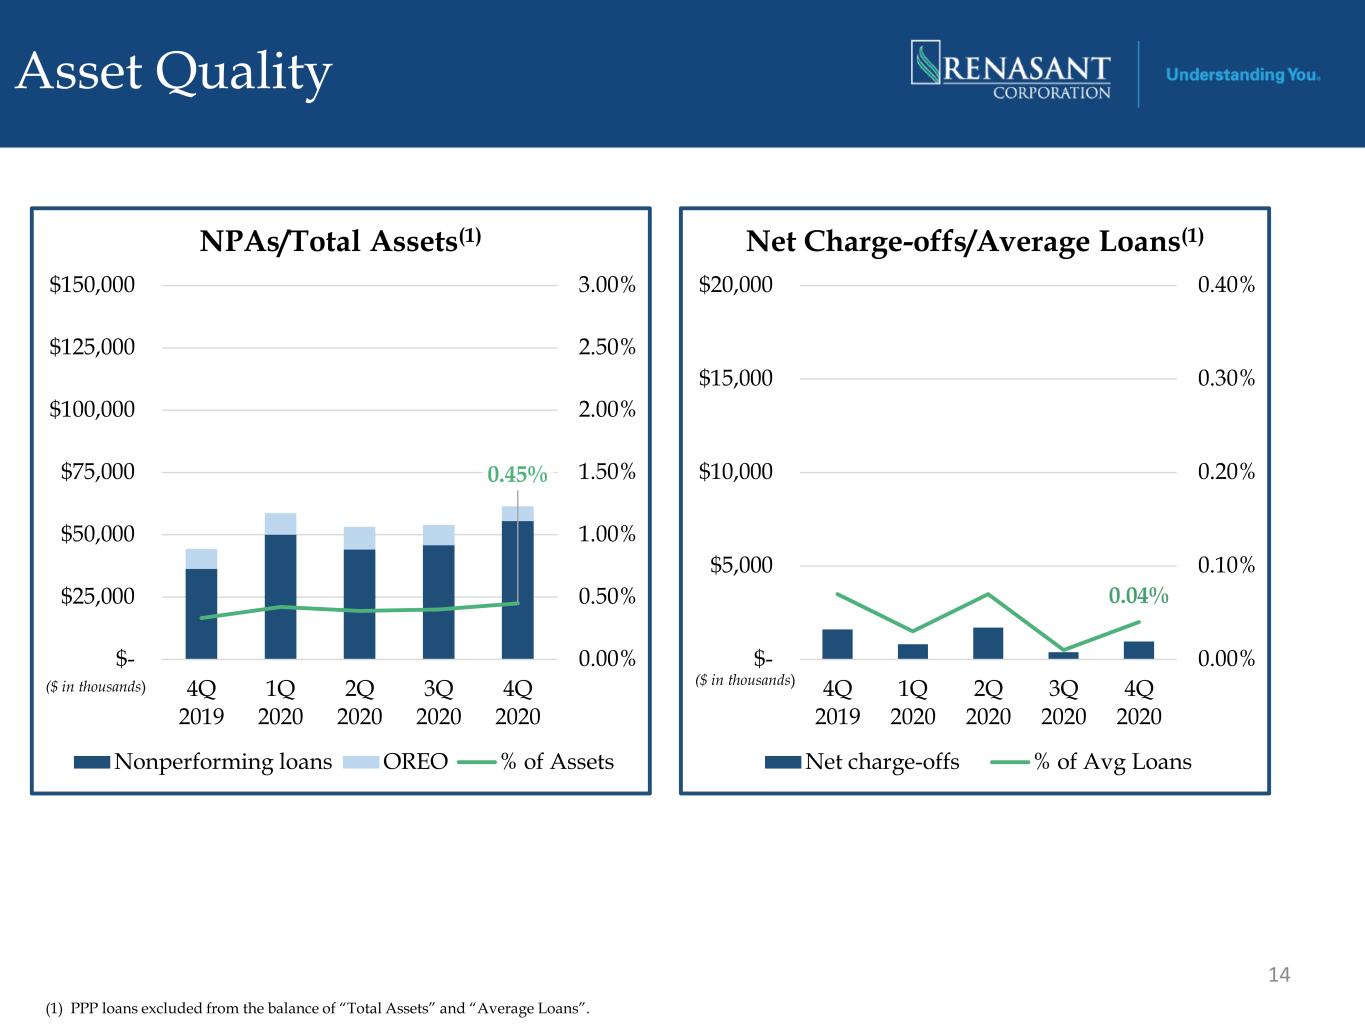
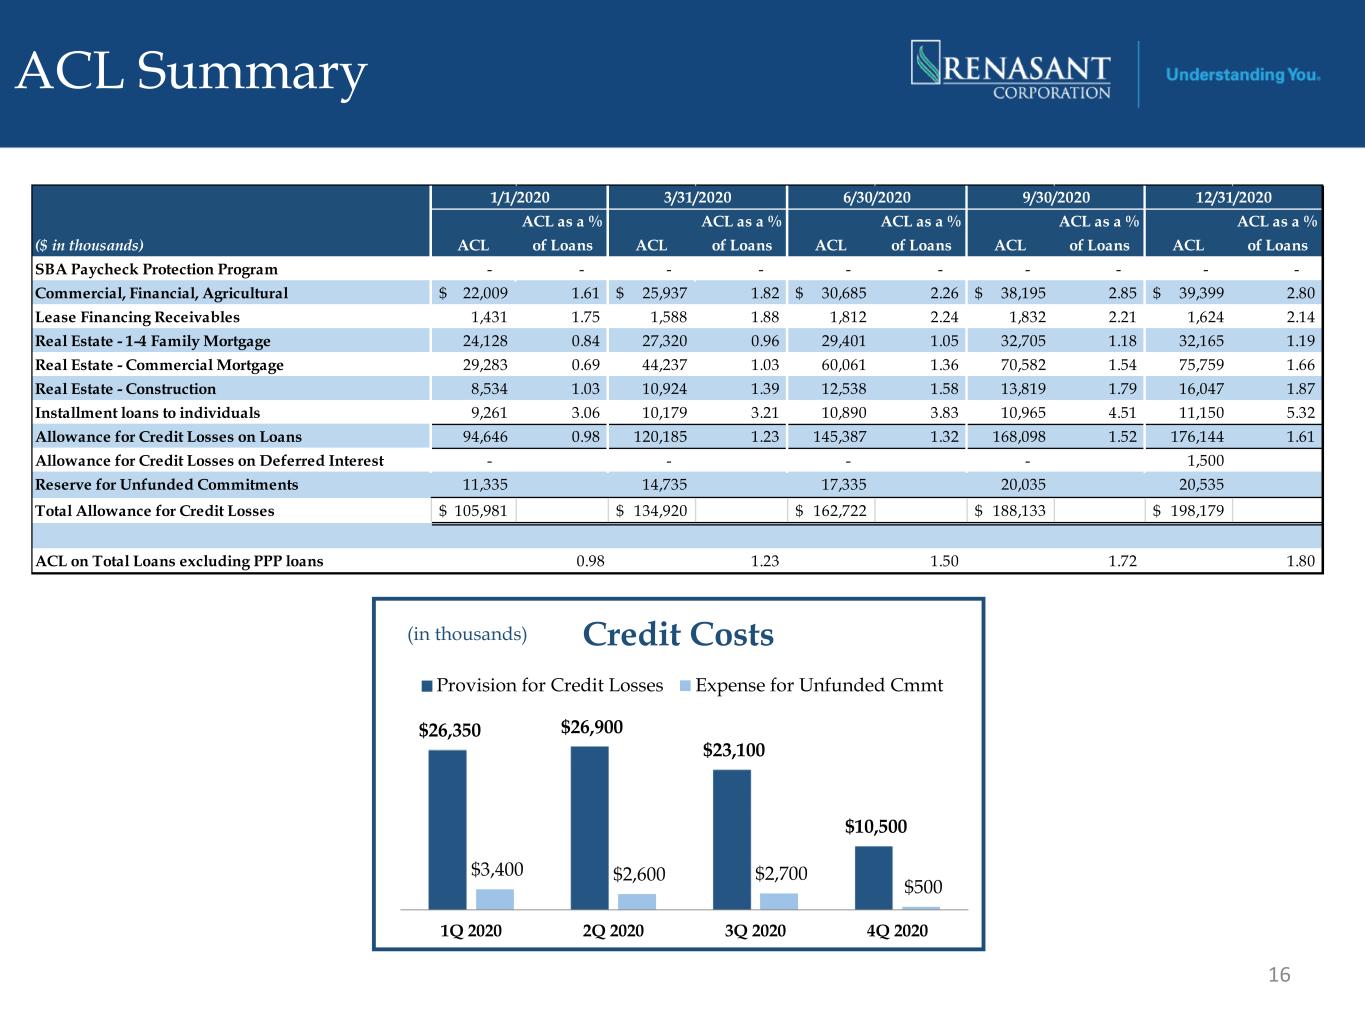
Fourth Quarter Highlights 5 • Adjusted Pre-Provision Net Revenue (1) was $57.39 million, with net income of $31.52 million • Mortgage banking income was $39.76 million • Incurred $7.37 million in restructuring charges related to efficiency initiatives to better align our workforce and branch network and $2.04 million in swap termination charges • Allowance for credit losses to total loans, excluding Paycheck Protection Program (“PPP”) loans, increased to 1.80% • Net charge-offs were $954 thousand and the ratio of nonperforming loans to total loans (excluding PPP loans) was 0.57% • Total loans on deferral represented 1.5% of total loans (excluding PPP loans) as of December 31, 2020 (1) Adjusted Pre-Provision Net Revenue is a non-GAAP financial measure. See slide 28 in the appendix for a description of the exclusions and a reconciliation of this non-GAAP financial measure to GAAP.
Financial Condition
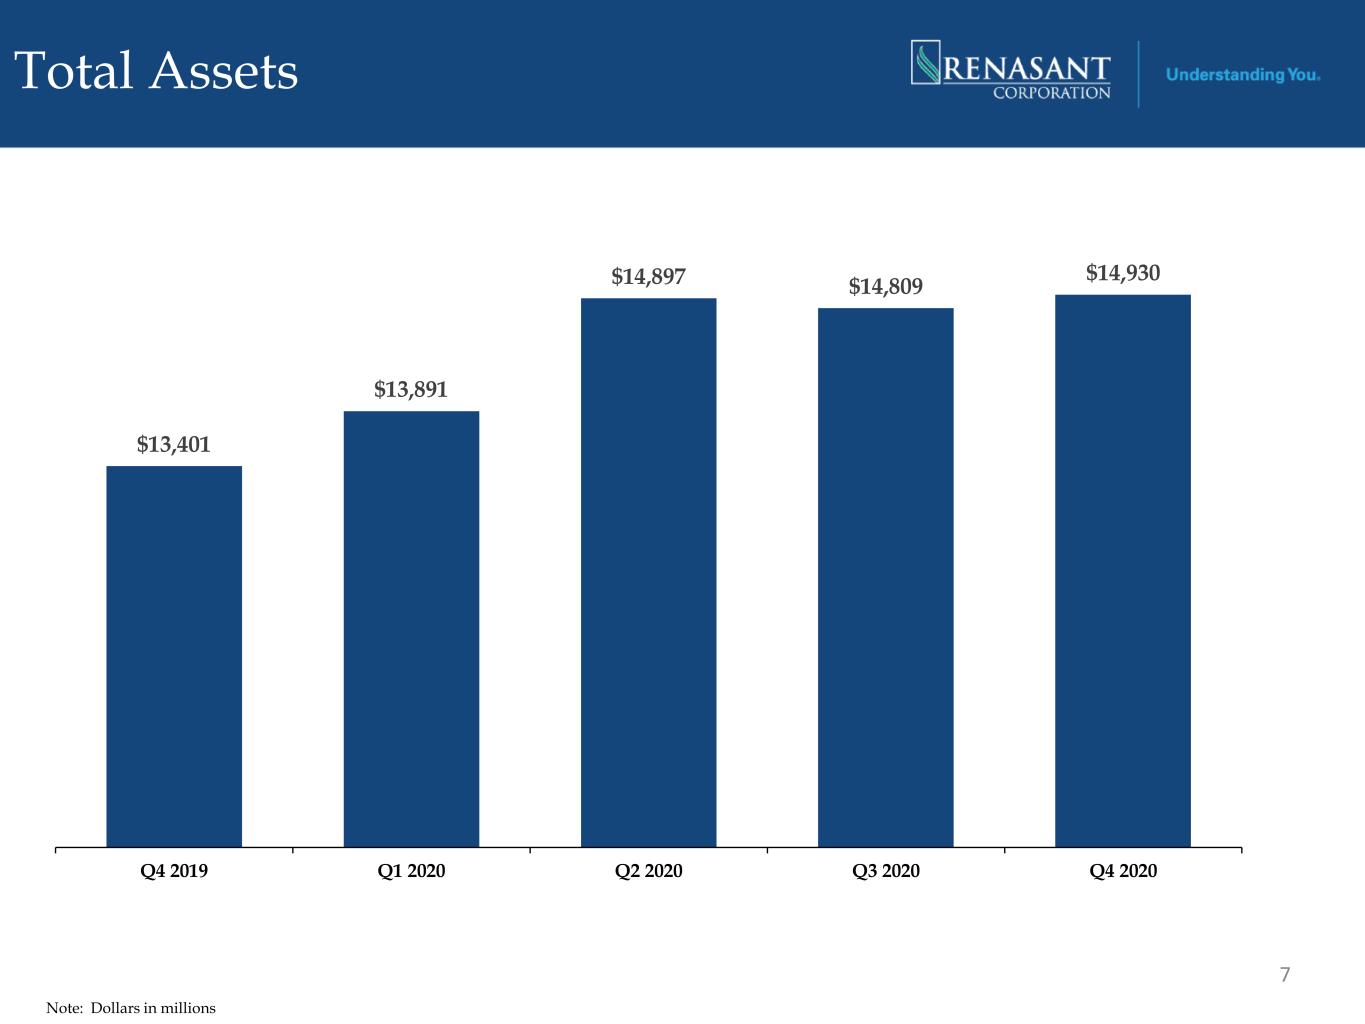
Total Assets 7 Note: Dollars in millions $13,401 $13,891 $14,897 $14,809 $14,930 $10 ,000 $11 ,000 $12 ,000 $13 ,000 $14 ,000 $15 ,000 Q4 2019 Q1 2020 Q2 2020 Q3 2020 Q4 2020
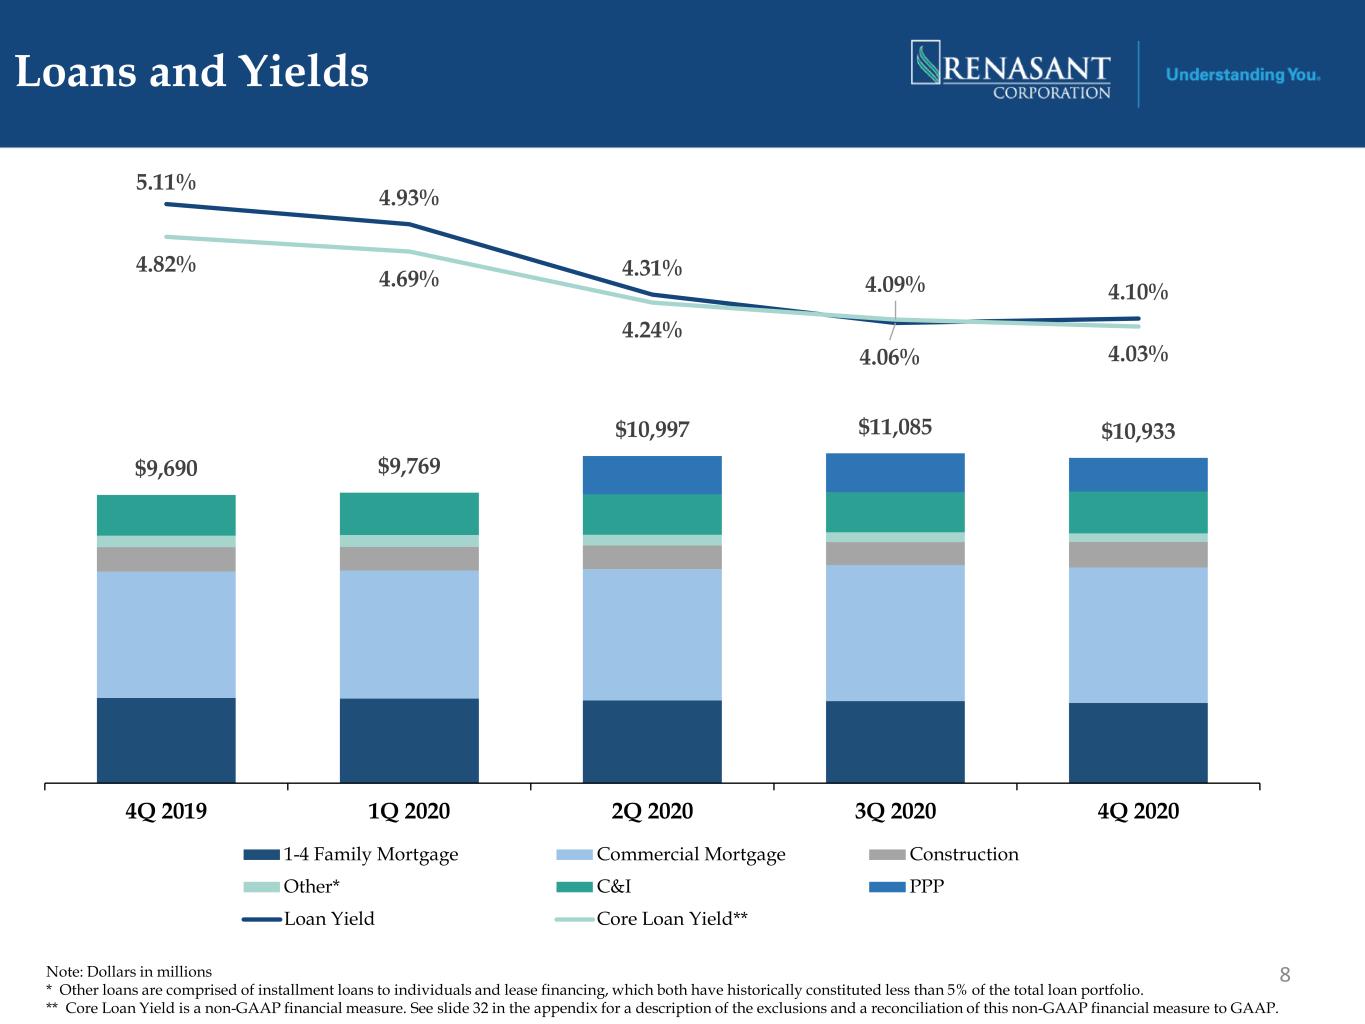
Loans and Yields 8Note: Dollars in millions * Other loans are comprised of installment loans to individuals and lease financing, which both have historically constituted less than 5% of the total loan portfolio. ** Core Loan Yield is a non-GAAP financial measure. See slide 32 in the appendix for a description of the exclusions and a reconciliation of this non-GAAP financial measure to GAAP. $9,690 $9,769 $10,997 $11,085 $10,933 5.11% 4.93% 4.31% 4.06% 4.10% 4.82% 4.69% 4.24% 4.09% 4.03% 4Q 2019 1Q 2020 2Q 2020 3Q 2020 4Q 2020 1-4 Family Mortgage Commercial Mortgage Construction Other* C&I PPP Loan Yield Core Loan Yield**
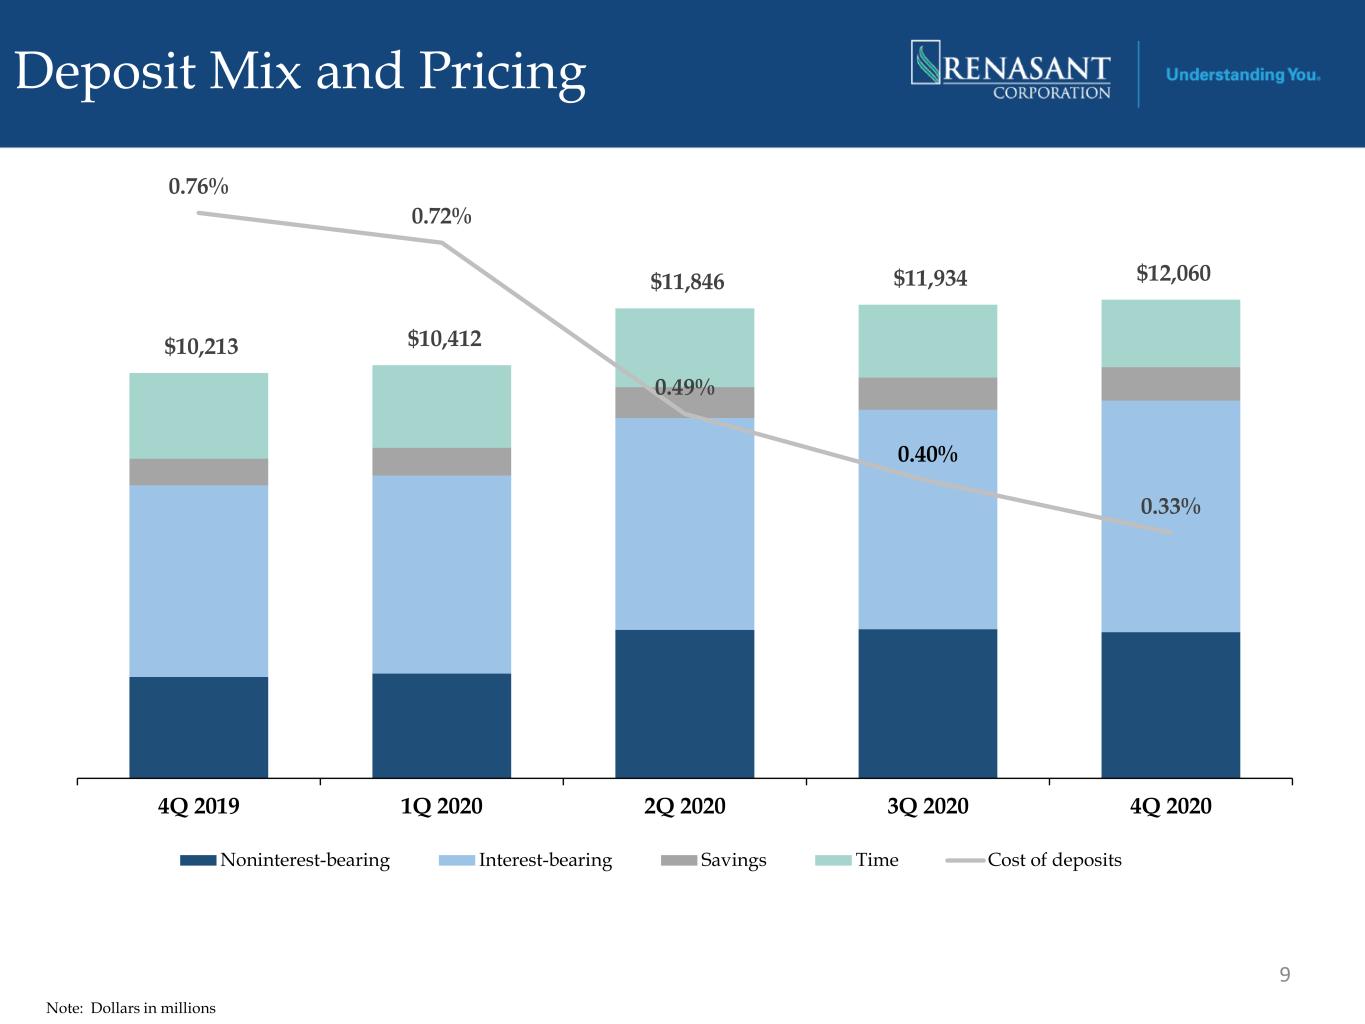
Deposit Mix and Pricing 9 Note: Dollars in millions $10,213 $10,412 $11,846 $11,934 $12,060 0.76% 0.72% 0.49% 0.40% 0.33% 4Q 2019 1Q 2020 2Q 2020 3Q 2020 4Q 2020 Noninterest-bearing Interest-bearing Savings Time Cost of deposits
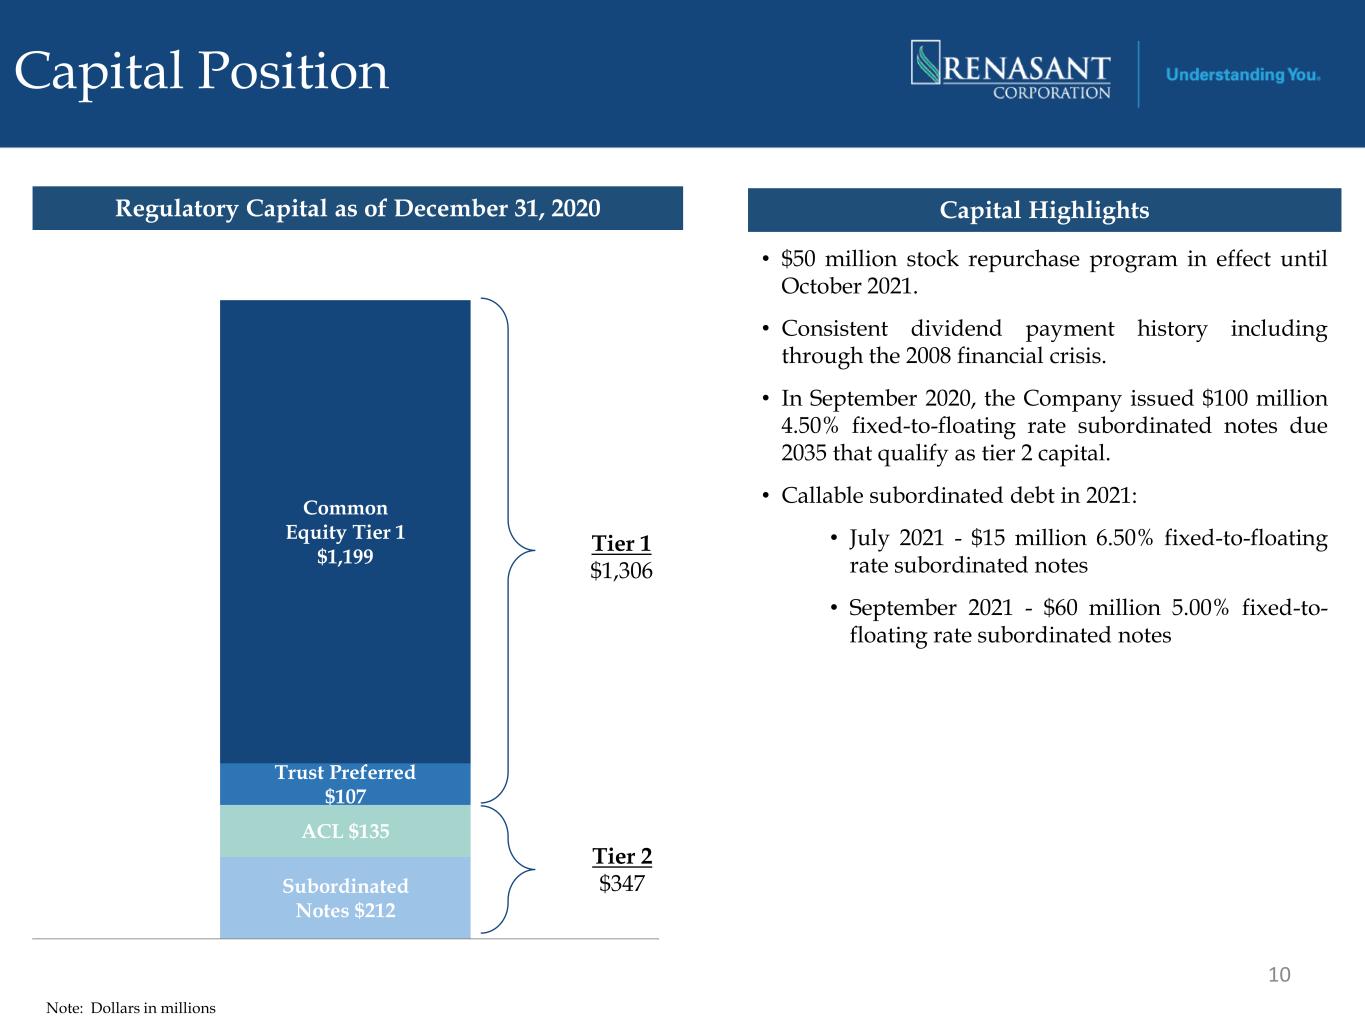
Capital Position 10 Tier 1 $1,306 Tier 2 $347 Regulatory Capital as of December 31, 2020 • $50 million stock repurchase program in effect until October 2021. • Consistent dividend payment history including through the 2008 financial crisis. • In September 2020, the Company issued $100 million 4.50% fixed-to-floating rate subordinated notes due 2035 that qualify as tier 2 capital. • Callable subordinated debt in 2021: • July 2021 - $15 million 6.50% fixed-to-floating rate subordinated notes • September 2021 - $60 million 5.00% fixed-to- floating rate subordinated notes Capital Highlights Subordinated Notes $212 ACL $135 Trust Preferred $107 Common Equity Tier 1 $1,199 1 Note: Dollars in millions

Strong Capital Position 11 * Tangible Common Equity is a non-GAAP financial measure. See slide 34 in the appendix for a description of the exclusions and a reconciliation of this non-GAAP financial measure to GAAP. Ratio 4Q 2019 1Q 2020 2Q 2020 3Q 2020 4Q 2020 Minimum to be Well Capitalized Tangible Common Equity* 9.25% 8.48% 7.97% 8.19% 8.33% N/A Leverage 10.37 9.90 9.12 9.17 9.37 5.00% Tier 1 Risk Based 12.14 11.63 11.69 11.79 11.91 8.00 Total Risk Based 13.78 13.44 13.72 14.89 15.07 10.00 Tier 1 Common Equity 11.12 10.63 10.69 10.80 10.93 6.50 PPP impact as of December 31, 2020: Tangible common equity* 73 bps Leverage ratio 92 bps Capital Ratios

Asset Quality
2.41% 0.00% 1.00% 2.00% 3.00% 4.00% $- $50,000 $100,000 $150,000 $200,000 $250,000 $300,000 4Q 2019 1Q 2020 2Q 2020 3Q 2020 4Q 2020 Classified Loans/Total Loans(1) Classified Loans % of Total Loans, excl. PPP ($ in thousands) 0.27% 0.00% 0.50% 1.00% 1.50% 2.00% $- $25,000 $50,000 $75,000 $100,000 4Q 2019 1Q 2020 2Q 2020 3Q 2020 4Q 2020 Loans 30-89 Days Past Due/ Total Loans(1) 30-89 DPD % of Total Loans, excl. PPP ($ in thousands) Asset Quality (1) PPP loans excluded from the balance of “Total Loans”. 13
0.45% 0.00% 0.50% 1.00% 1.50% 2.00% 2.50% 3.00% $- $25,000 $50,000 $75,000 $100,000 $125,000 $150,000 4Q 2019 1Q 2020 2Q 2020 3Q 2020 4Q 2020 NPAs/Total Assets(1) Nonperforming loans OREO % of Assets ($ in thousands) 0.04% 0.00% 0.10% 0.20% 0.30% 0.40% $- $5,000 $10,000 $15,000 $20,000 4Q 2019 1Q 2020 2Q 2020 3Q 2020 4Q 2020 Net Charge-offs/Average Loans(1) Net charge-offs % of Avg Loans ($ in thousands) Asset Quality (1) PPP loans excluded from the balance of “Total Assets” and “Average Loans”. 14
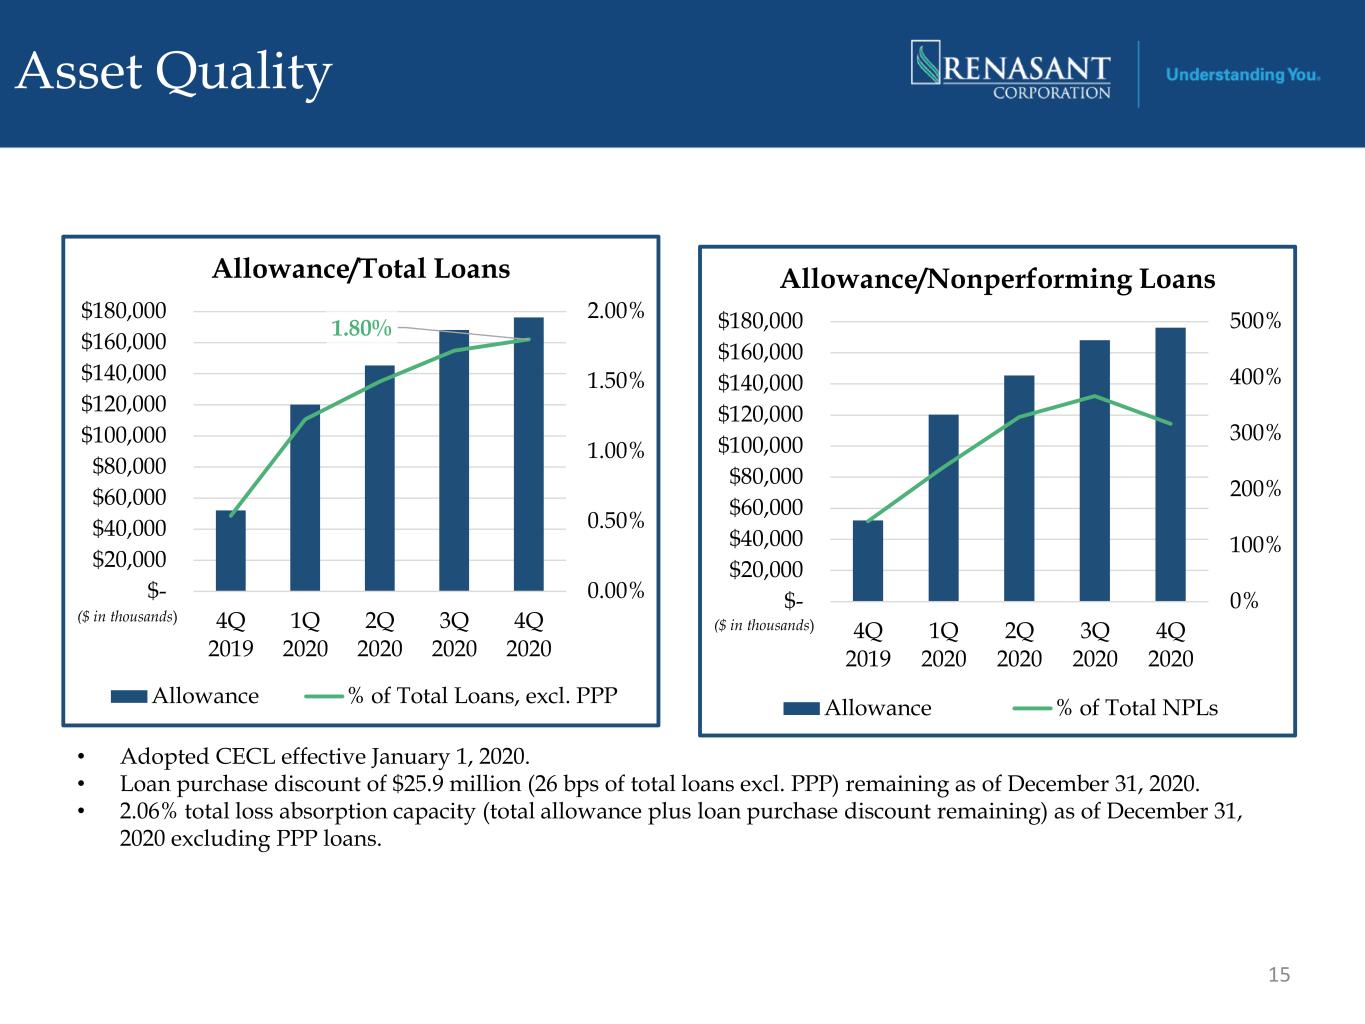
1.80% 0.00% 0.50% 1.00% 1.50% 2.00% $- $20,000 $40,000 $60,000 $80,000 $100,000 $120,000 $140,000 $160,000 $180,000 4Q 2019 1Q 2020 2Q 2020 3Q 2020 4Q 2020 Allowance/Total Loans Allowance % of Total Loans, excl. PPP ($ in thousands) 0% 100% 200% 300% 400% 500% $- $20,000 $40,000 $60,000 $80,000 $100,000 $120,000 $140,000 $160,000 $180,000 4Q 2019 1Q 2020 2Q 2020 3Q 2020 4Q 2020 Allowance/Nonperforming Loans Allowance % of Total NPLs ($ in thousands) • Adopted CECL effective January 1, 2020. • Loan purchase discount of $25.9 million (26 bps of total loans excl. PPP) remaining as of December 31, 2020. • 2.06% total loss absorption capacity (total allowance plus loan purchase discount remaining) as of December 31, 2020 excluding PPP loans. Asset Quality 15
ACL Summary ($ in thousands) ACL ACL as a % of Loans ACL ACL as a % of Loans ACL ACL as a % of Loans ACL ACL as a % of Loans ACL ACL as a % of Loans SBA Paycheck Protection Program - - - - - - - - - - Commercial, Financial, Agricultural 22,009$ 1.61 25,937$ 1.82 30,685$ 2.26 38,195$ 2.85 39,399$ 2.80 Lease Financing Receivables 1,431 1.75 1,588 1.88 1,812 2.24 1,832 2.21 1,624 2.14 Real Estate - 1-4 Family Mortgage 24,128 0.84 27,320 0.96 29,401 1.05 32,705 1.18 32,165 1.19 Real Estate - Commercial Mortgage 29,283 0.69 44,237 1.03 60,061 1.36 70,582 1.54 75,759 1.66 Real Estate - Construction 8,534 1.03 10,924 1.39 12,538 1.58 13,819 1.79 16,047 1.87 Installment loans to individuals 9,261 3.06 10,179 3.21 10,890 3.83 10,965 4.51 11,150 5.32 Allowance for Credit Losses on Loans 94,646 0.98 120,185 1.23 145,387 1.32 168,098 1.52 176,144 1.61 Allowance for Credit Losses on Deferred Interest - - - - 1,500 Reserve for Unfunded Commitments 11,335 14,735 17,335 20,035 20,535 Total Allowance for Credit Losses 105,981$ 134,920$ 162,722$ 188,133$ 198,179$ ACL on Total Loans excluding PPP loans 0.98 1.23 1.50 1.72 1.80 12/31/20201/1/2020 3/31/2020 9/30/20206/30/2020 $26,350 $26,900 $23,100 $10,500 $3,400 $2,600 $2,700 $500 1Q 2020 2Q 2020 3Q 2020 4Q 2020 Credit Costs Provision for Credit Losses Expense for Unfunded Cmmt (in thousands) 16
Profitability

Net Income & Adjusted Pre-Provision Net Revenue* 18 $38.4 $2.0 $20.1 $30.0 $31.5 $49.6 $45.0 $65.6 $63.2 $57.4 1.49% 1.34% 1.79% 1.68% 1.53% 4Q 2019 1Q 2020 2Q 2020 3Q 2020 4Q 2020 $90.9 $92.2 $146.9 $167.6 $22.1 $151.9 $192.5 $209.7 $224.9 $110.6 1.81% 2.02% 1.89% 1.75% 1.58% 2016 2017 2018 2019 YTD 2020 PPNR (Non-GAAP) Net Income PPNR/Avg Assets (Non-GAAP) $90.9 $92.2 $146.9 $167.6 $22.1 $151.9 $192.5 $209.7 $224.9 $110.6 1.81% 2.02% 1.89% 1.75% 1.58% 2016 2017 2018 2019 YTD 2020 PPNR (Non-GAAP) Net Income PPNR/Avg Assets (Non-GAAP) $90.9 $92.2 $146.9 $167.6 $22.1 $151.9 $192.5 $209.7 $224.9 $110.6 1.81% 2.02% 1.89% 1.75% 1.58% 2016 2017 2018 2019 YTD 2020 PPNR (Non-GAAP) Net Income PPNR/Avg Assets (Non-GAAP)Adj. PPNR (non-GAAP) Adj. PPNR /Avg. Assets (non-GAAP) Note: Dollars in millions *Adjusted Pre-Provision Net Revenue and Adjusted PPNR/Average Assets are non GAAP financial measures. See slides 27 and 28 in the appendix for a description of the exclusions and a reconciliation of these non-GAAP financial measures to GAAP.
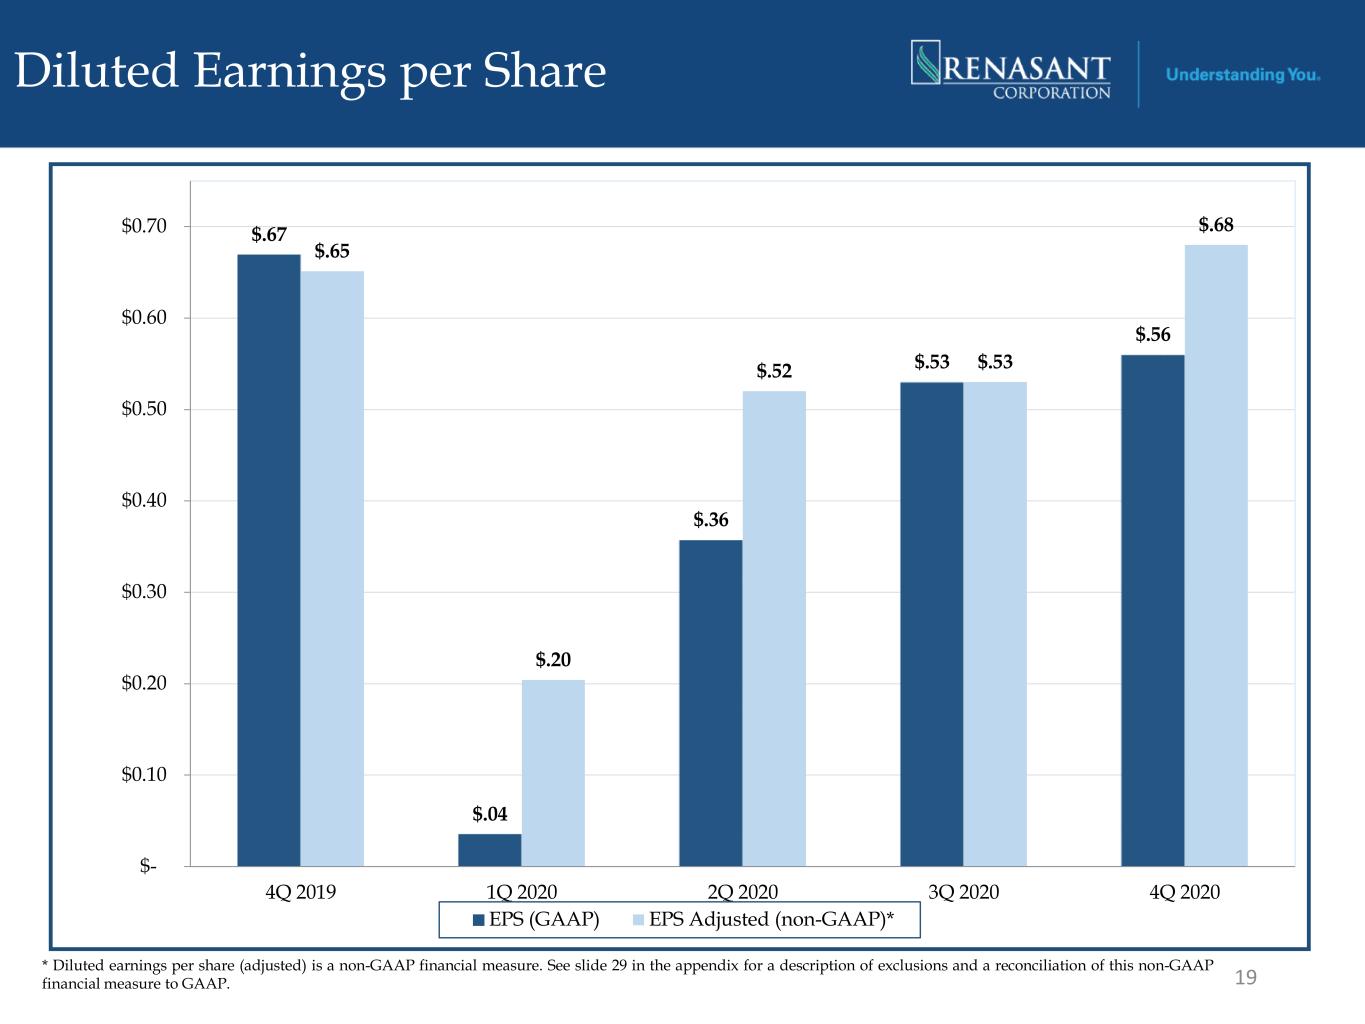
Diluted Earnings per Share 19 $.67 $.04 $.36 $.53 $.56 $.65 $.20 $.52 $.53 $.68 $- $0.10 $0.20 $0.30 $0.40 $0.50 $0.60 $0.70 4Q 2019 1Q 2020 2Q 2020 3Q 2020 4Q 2020 EPS (GAAP) EPS Adjusted (non-GAAP)* * Diluted earnings per share (adjusted) is a non-GAAP financial measure. See slide 29 in the appendix for a description of exclusions and a reconciliation of this non-GAAP financial measure to GAAP.
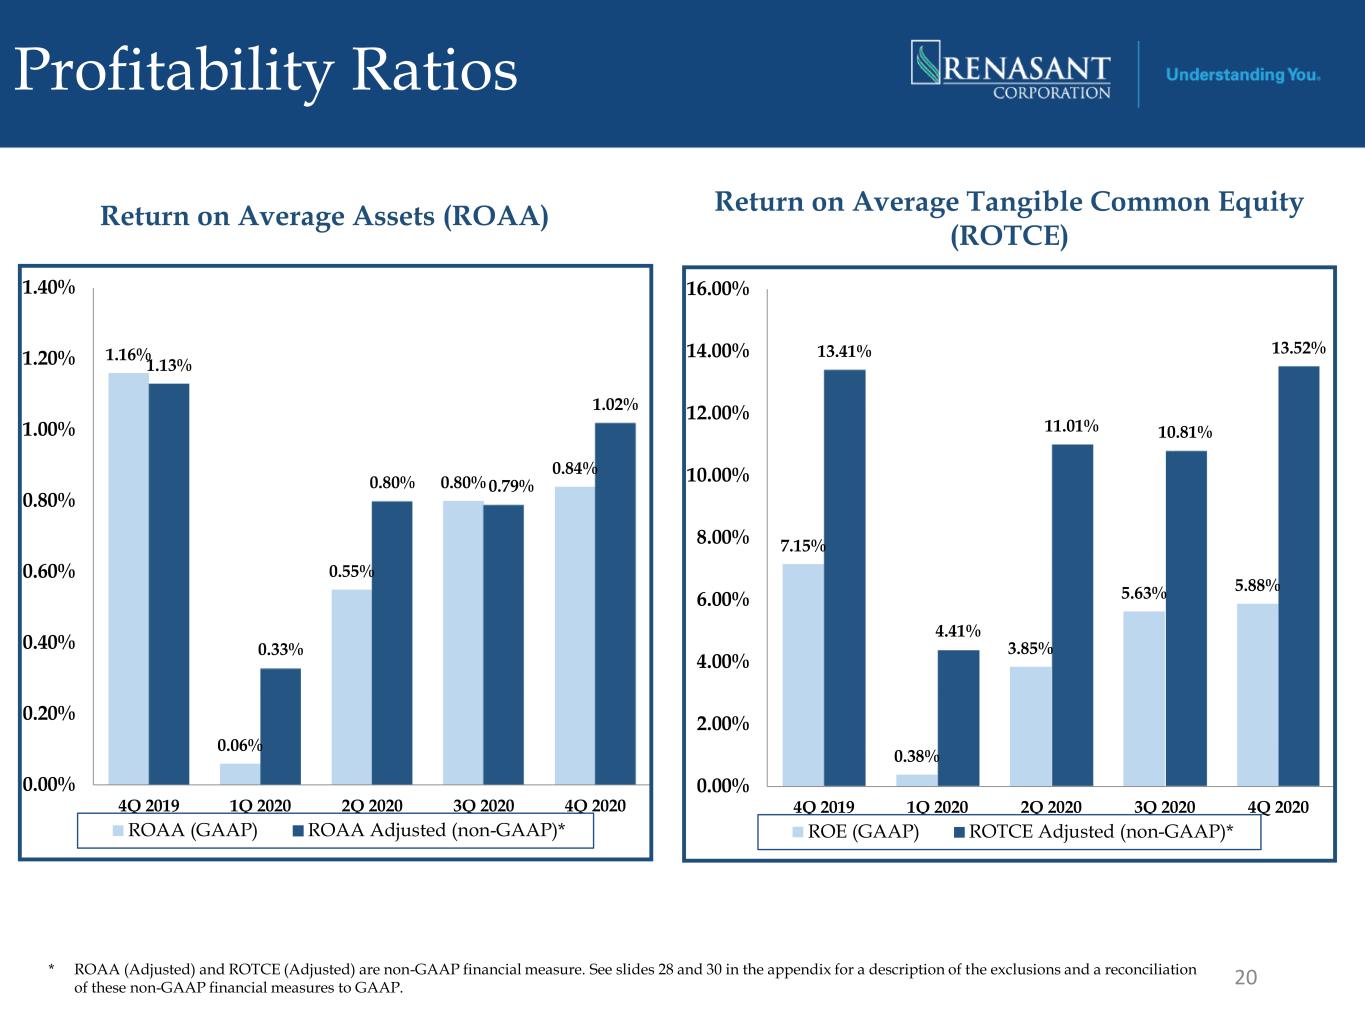
Profitability Ratios 20 7.15% 0.38% 3.85% 5.63% 5.88% 13.41% 4.41% 11.01% 10.81% 13.52% 0.00% 2.00% 4.00% 6.00% 8.00% 10.00% 12.00% 14.00% 16.00% 4Q 2019 1Q 2020 2Q 2020 3Q 2020 4Q 2020 ROE (GAAP) ROTCE Adjusted (non-GAAP)* * ROAA (Adjusted) and ROTCE (Adjusted) are non-GAAP financial measure. See slides 28 and 30 in the appendix for a description of the exclusions and a reconciliation of these non-GAAP financial measures to GAAP. 1.16% 0.06% 0.55% 0.80% 0.84% 1.13% 0.33% 0.80% 0.79% 1.02% 0.00% 0.20% 0.40% 0.60% 0.80% 1.00% 1.20% 1.40% 4Q 2019 1Q 2020 2Q 2020 3Q 2020 4Q 2020 ROAA (GAAP) ROAA Adjusted (non-GAAP)* Return on Average Tangible Common Equity (ROTCE) Return on Average Assets (ROAA)
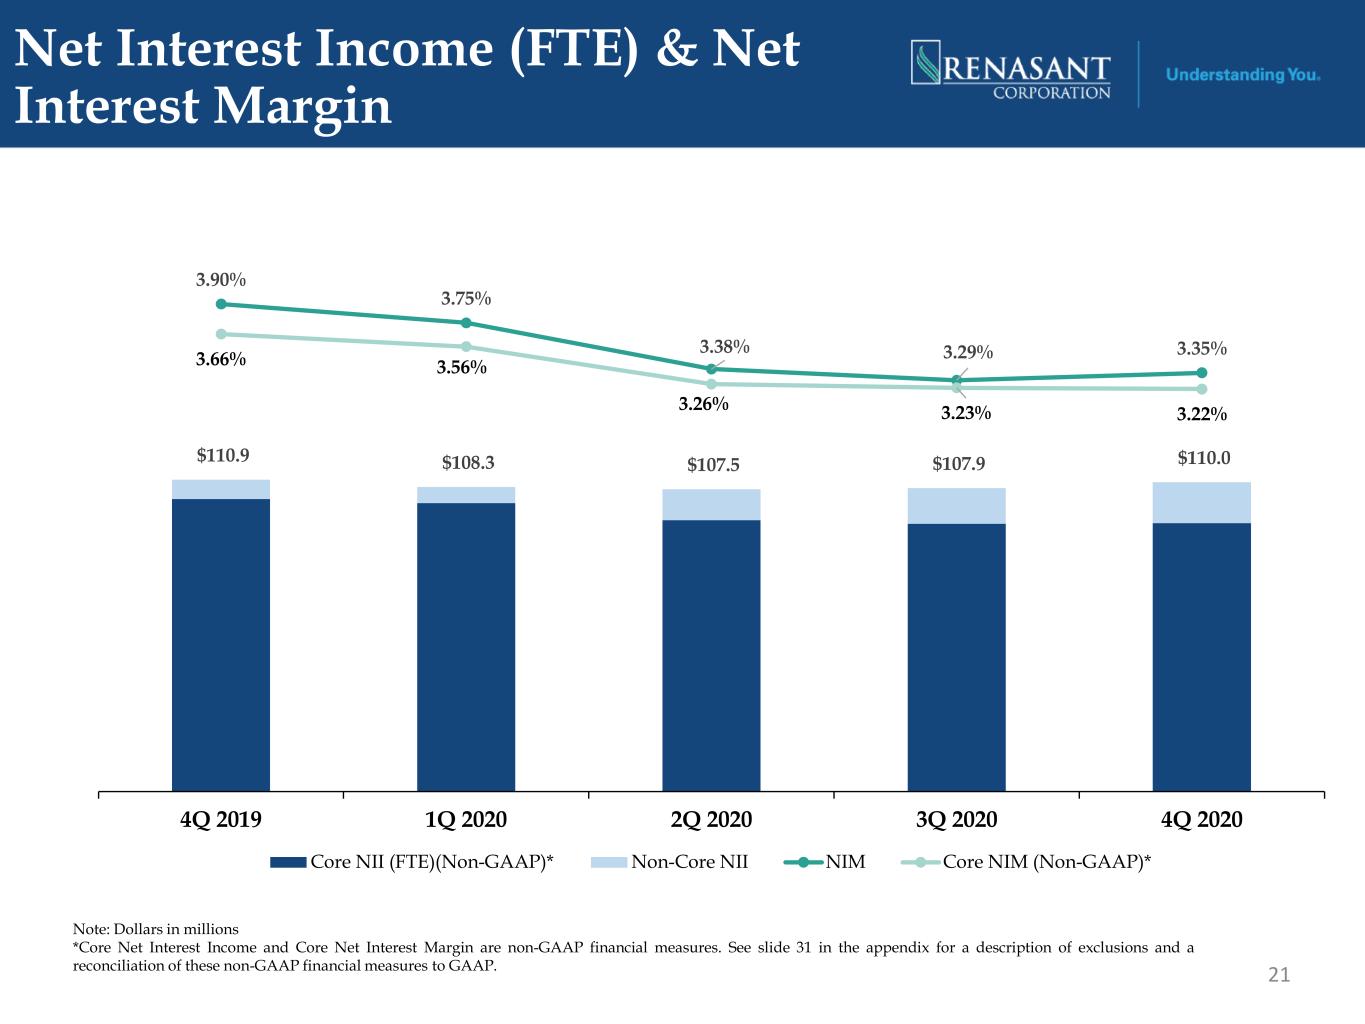
Net Interest Income (FTE) & Net Interest Margin 21 $110.9 $108.3 $107.5 $107.9 $110.0 3.90% 3.75% 3.38% 3.29% 3.35%3.66% 3.56% 3.26% 3.23% 3.22% 4Q 2019 1Q 2020 2Q 2020 3Q 2020 4Q 2020 Core NII (FTE)(Non-GAAP)* Non-Core NII NIM Core NIM (Non-GAAP)* Note: Dollars in millions *Core Net Interest Income and Core Net Interest Margin are non-GAAP financial measures. See slide 31 in the appendix for a description of exclusions and a reconciliation of these non-GAAP financial measures to GAAP.

Note: Dollars in thousands $37,456 $37,570 $64,170 $70,928 $62,864 4Q 2019 1Q 2020 2Q 2020 3Q 2020 4Q 2020 Service Charges Fees and Commissions Insurance Wealth Management Mortgage Banking Securities Gains Other Noninterest Income 22 MORTGAGE HIGHLIGHTS 4Q19 3Q20 4Q20 Locked Volume $0.9 bill $1.7 bill $1.4 bill Wholesale % 43 41 41 Retail % 57 59 59 Purchase % 59 55 50 Refinance % 41 45 50 ($ in thousands) 4Q19 3Q20 4Q20 Gain on sales of loans, net 10,438$ 45,985$ 36,080$ Fees, net 3,023 5,367 5,318 Mortgage servicing income, net 408 (2,466) (3,606) MSR valuation adjustment 1,296 828 1,968 Mortgage banking income, net 15,165$ 49,714$ 39,760$
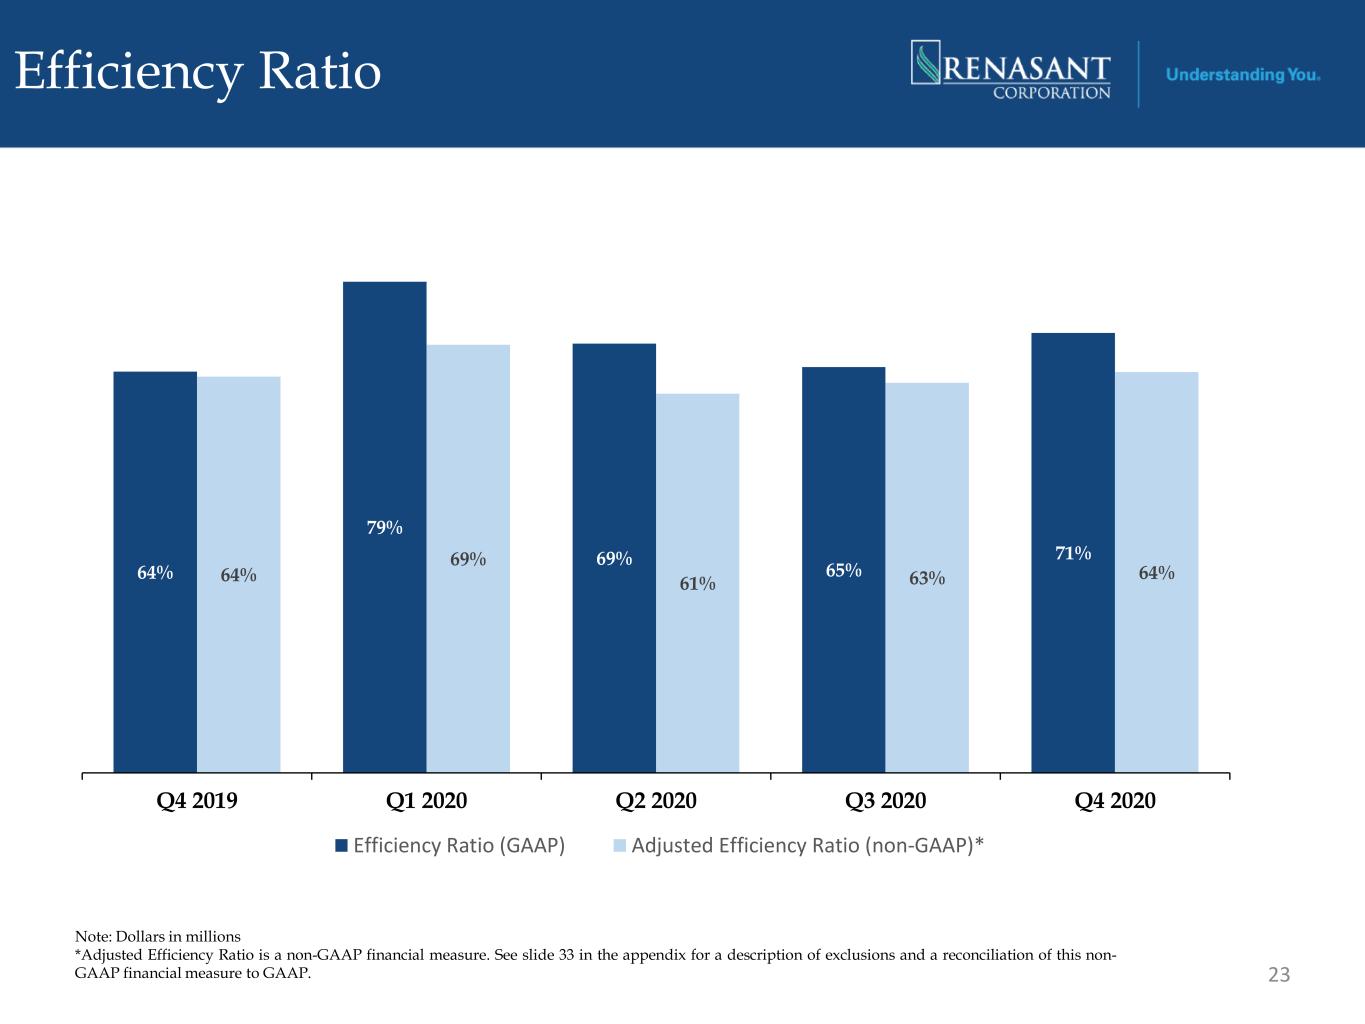
64% 79% 69% 65% 71% 64% 69% 61% 63% 64% Q4 2019 Q1 2020 Q2 2020 Q3 2020 Q4 2020 Efficiency Ratio (GAAP) Adjusted Efficiency Ratio (non-GAAP)* Efficiency Ratio 23 Note: Dollars in millions *Adjusted Efficiency Ratio is a non-GAAP financial measure. See slide 33 in the appendix for a description of exclusions and a reconciliation of this non- GAAP financial measure to GAAP.
Appendix
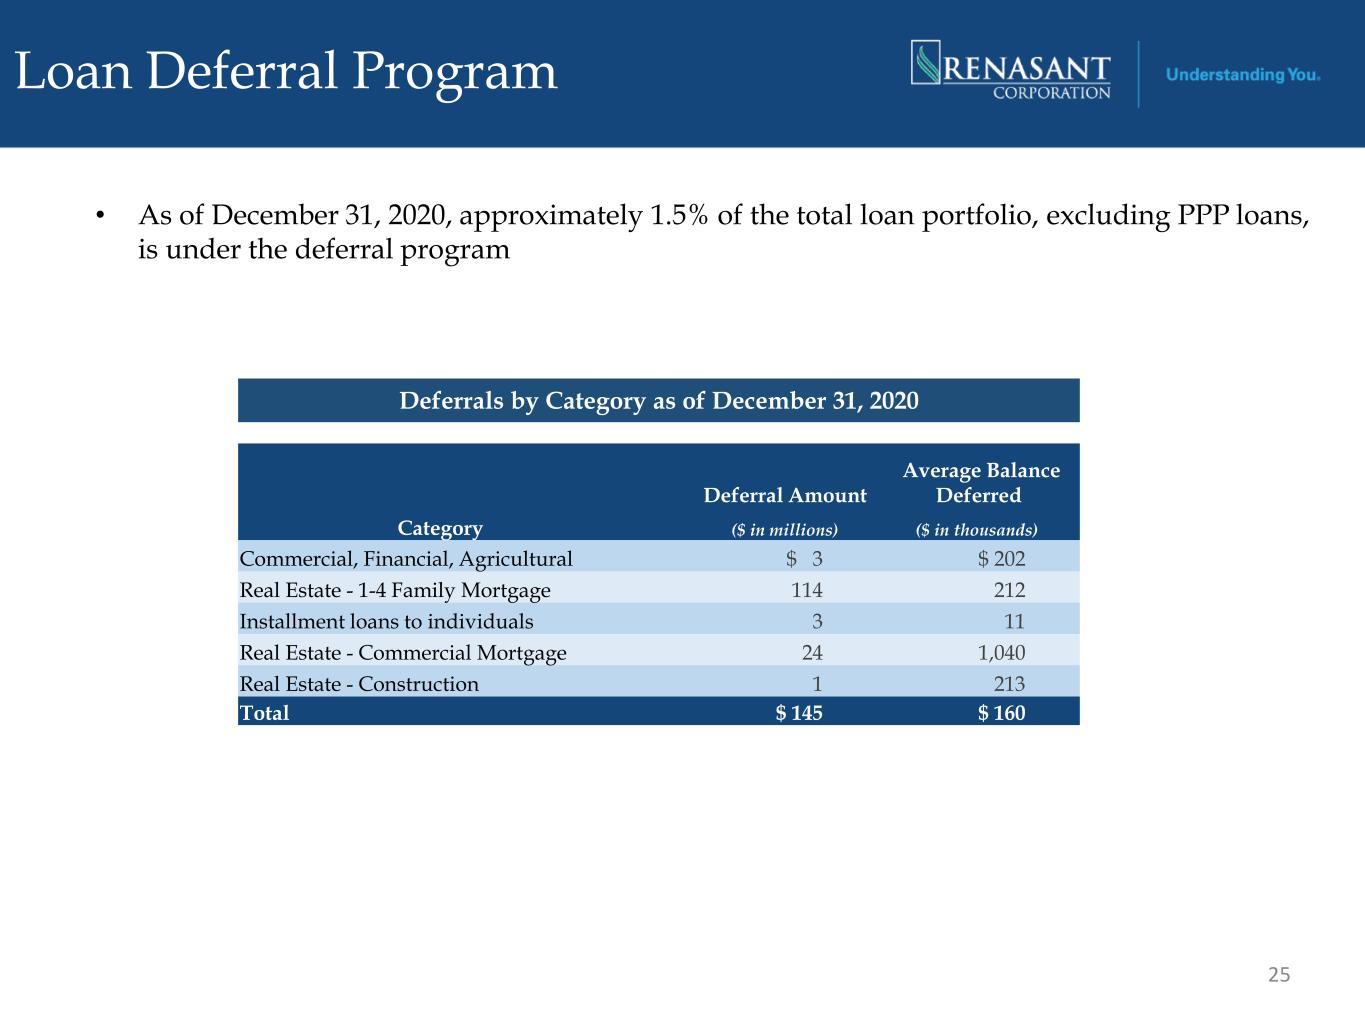
Loan Deferral Program • As of December 31, 2020, approximately 1.5% of the total loan portfolio, excluding PPP loans, is under the deferral program Deferral Amount Average Balance Deferred Category ($ in millions) ($ in thousands) Commercial, Financial, Agricultural $ 3 $ 202 Real Estate - 1-4 Family Mortgage 114 212 Installment loans to individuals 3 11 Real Estate - Commercial Mortgage 24 1,040 Real Estate - Construction 1 213 Total $ 145 $ 160 25 Deferrals by Category as of December 31, 2020
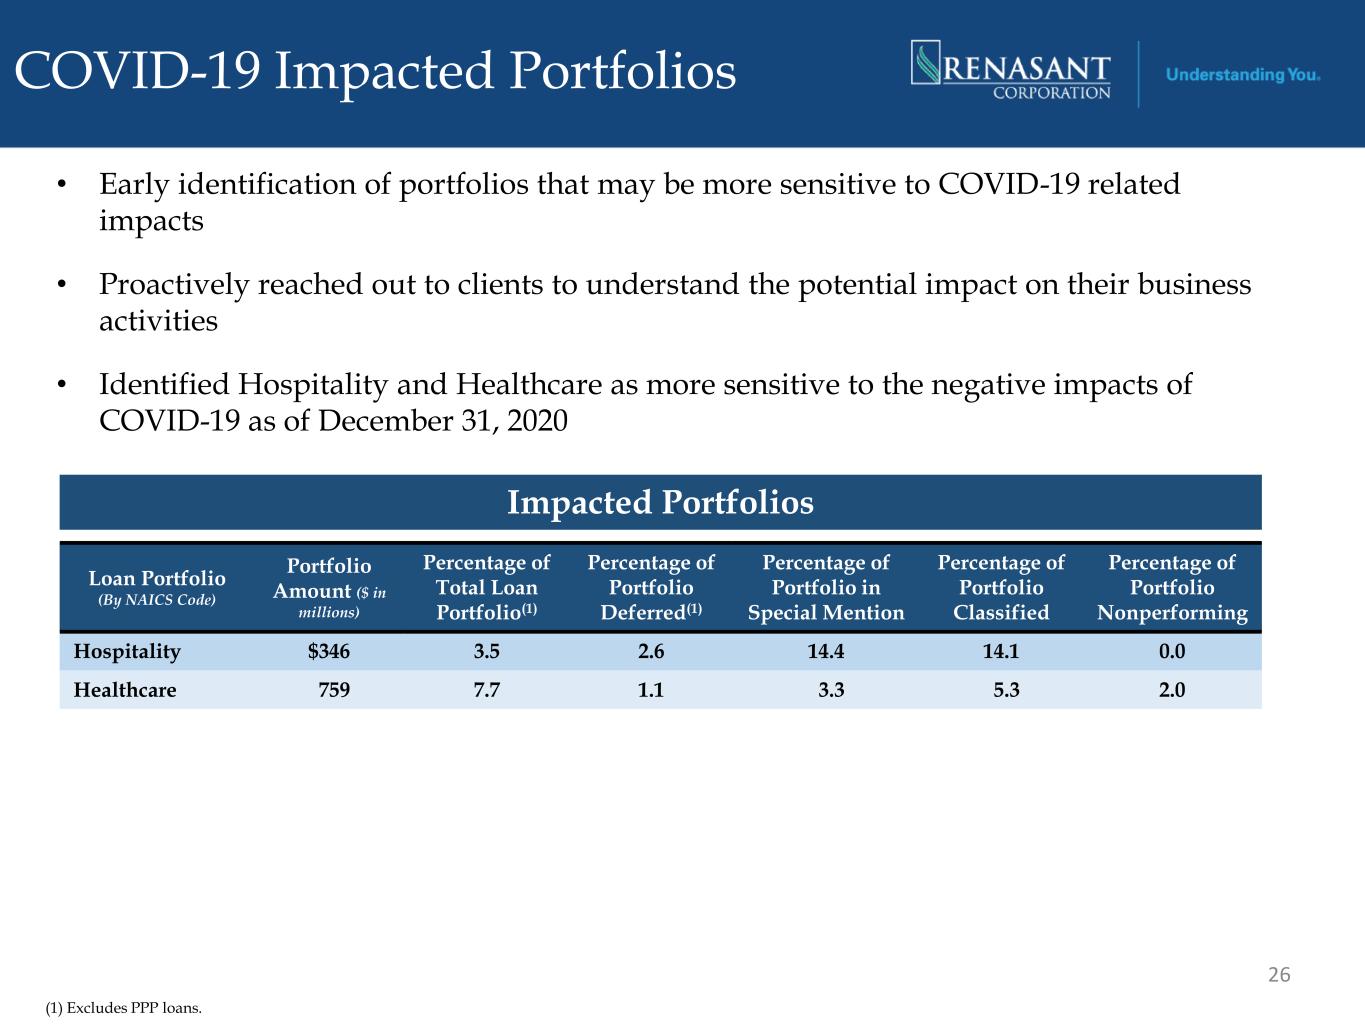
COVID-19 Impacted Portfolios • Early identification of portfolios that may be more sensitive to COVID-19 related impacts • Proactively reached out to clients to understand the potential impact on their business activities • Identified Hospitality and Healthcare as more sensitive to the negative impacts of COVID-19 as of December 31, 2020 Impacted Portfolios Loan Portfolio (By NAICS Code) Portfolio Amount ($ in millions) Percentage of Total Loan Portfolio(1) Percentage of Portfolio Deferred(1) Percentage of Portfolio in Special Mention Percentage of Portfolio Classified Percentage of Portfolio Nonperforming Hospitality $346 3.5 2.6 14.4 14.1 0.0 Healthcare 759 7.7 1.1 3.3 5.3 2.0 26 (1) Excludes PPP loans.
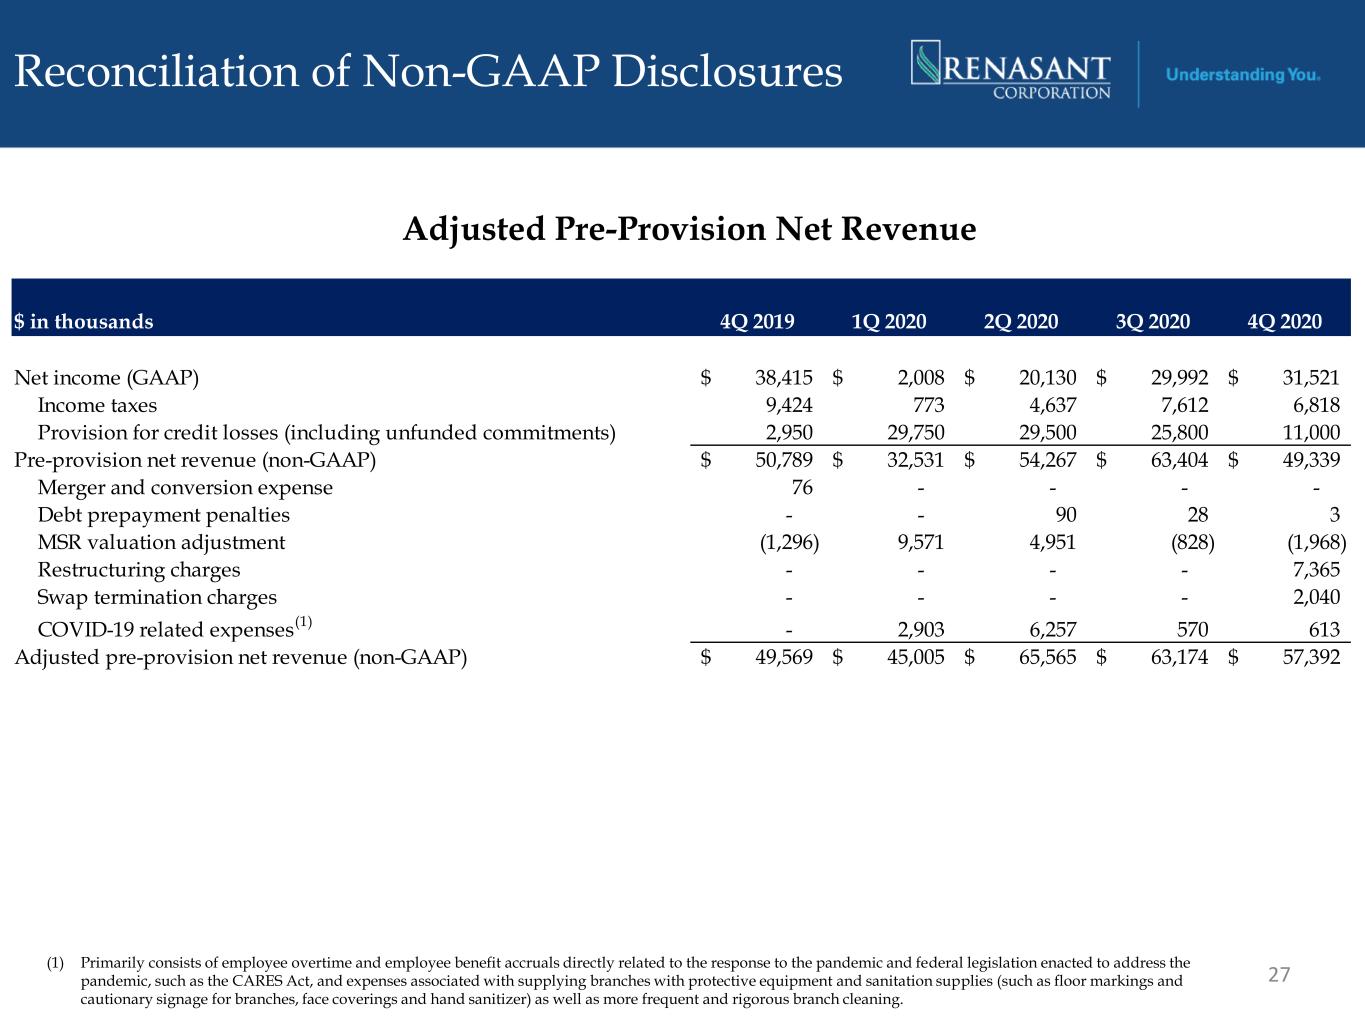
Reconciliation of Non-GAAP Disclosures Adjusted Pre-Provision Net Revenue 27 $ in thousands 4Q 2019 1Q 2020 2Q 2020 3Q 2020 4Q 2020 Net income (GAAP) 38,415$ 2,008$ 20,130$ 29,992$ 31,521$ Income taxes 9,424 773 4,637 7,612 6,818 Provision for credit losses (including unfunded commitments) 2,950 29,750 29,500 25,800 11,000 Pre-provision net revenue (non-GAAP) 50,789$ 32,531$ 54,267$ 63,404$ 49,339$ Merger and conversion expense 76 - - - - Debt prepayment penalties - - 90 28 3 MSR valuation adjustment (1,296) 9,571 4,951 (828) (1,968) Restructuring charges - - - - 7,365 Swap termination charges - - - - 2,040 COVID-19 related expenses (1) - 2,903 6,257 570 613 Adjusted pre-provision net revenue (non-GAAP) 49,569$ 45,005$ 65,565$ 63,174$ 57,392$ (1) Primarily consists of employee overtime and employee benefit accruals directly related to the response to the pandemic and federal legislation enacted to address the pandemic, such as the CARES Act, and expenses associated with supplying branches with protective equipment and sanitation supplies (such as floor markings and cautionary signage for branches, face coverings and hand sanitizer) as well as more frequent and rigorous branch cleaning.
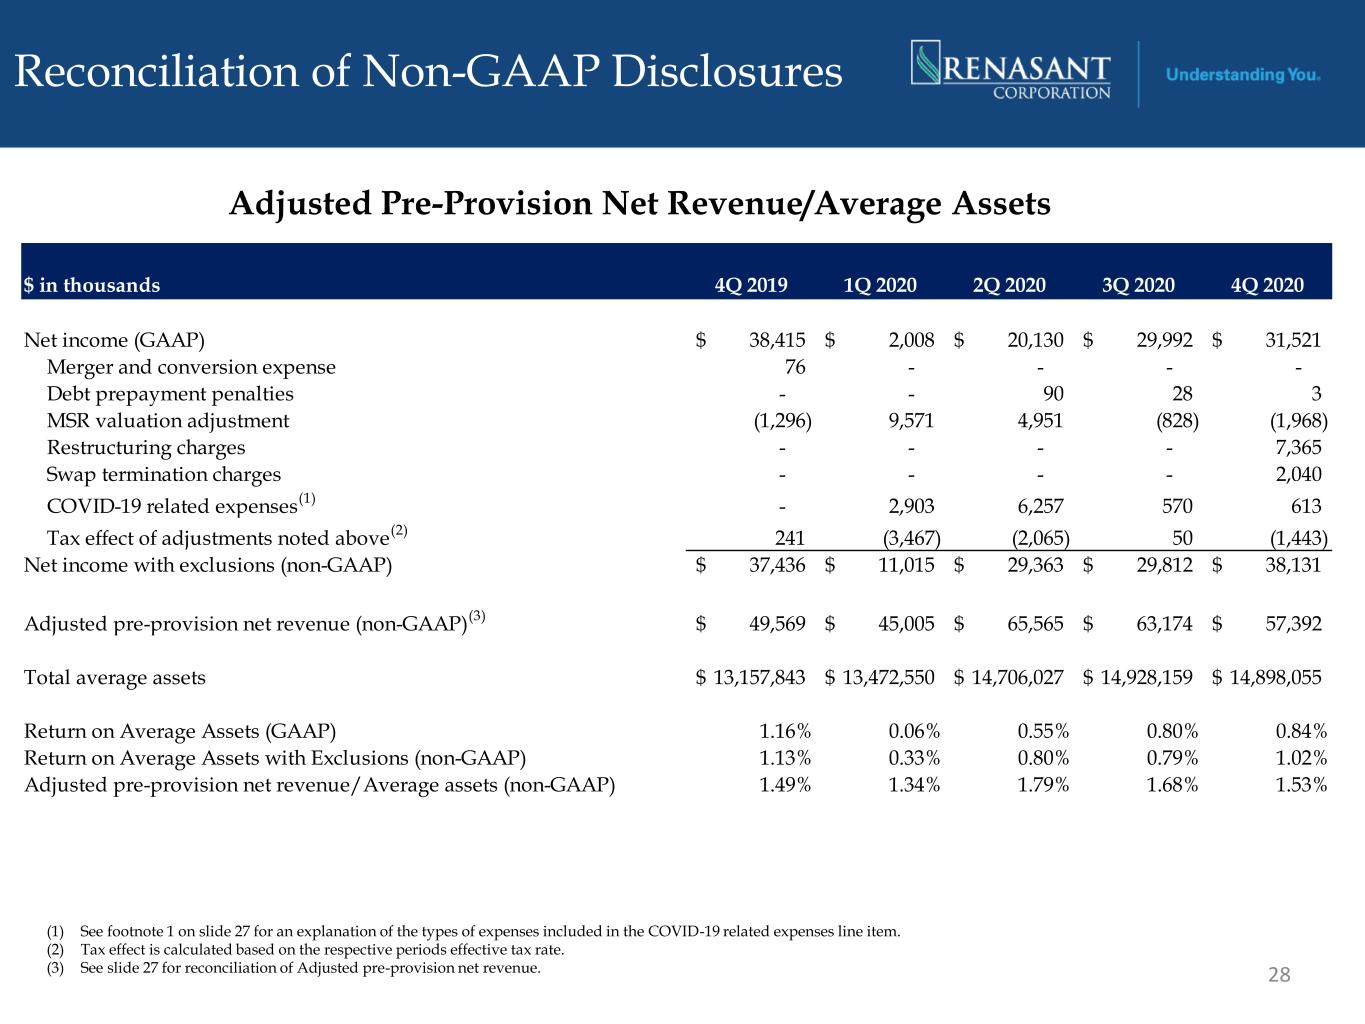
Reconciliation of Non-GAAP Disclosures Adjusted Pre-Provision Net Revenue/Average Assets 28 $ in thousands 4Q 2019 1Q 2020 2Q 2020 3Q 2020 4Q 2020 Net income (GAAP) 38,415$ 2,008$ 20,130$ 29,992$ 31,521$ Merger and conversion expense 76 - - - - Debt prepayment penalties - - 90 28 3 MSR valuation adjustment (1,296) 9,571 4,951 (828) (1,968) Restructuring charges - - - - 7,365 Swap termination charges - - - - 2,040 COVID-19 related expenses (1) - 2,903 6,257 570 613 Tax effect of adjustments noted above (2) 241 (3,467) (2,065) 50 (1,443) Net income with exclusions (non-GAAP) 37,436$ 11,015$ 29,363$ 29,812$ 38,131$ Adjusted pre-provision net revenue (non-GAAP) (3) 49,569$ 45,005$ 65,565$ 63,174$ 57,392$ Total average assets 13,157,843$ 13,472,550$ 14,706,027$ 14,928,159$ 14,898,055$ Return on Average Assets (GAAP) 1.16% 0.06% 0.55% 0.80% 0.84% Return on Average Assets with Exclusions (non-GAAP) 1.13% 0.33% 0.80% 0.79% 1.02% Adjusted pre-provision net revenue/Average assets (non-GAAP) 1.49% 1.34% 1.79% 1.68% 1.53% (1) See footnote 1 on slide 27 for an explanation of the types of expenses included in the COVID-19 related expenses line item. (2) Tax effect is calculated based on the respective periods effective tax rate. (3) See slide 27 for reconciliation of Adjusted pre-provision net revenue.
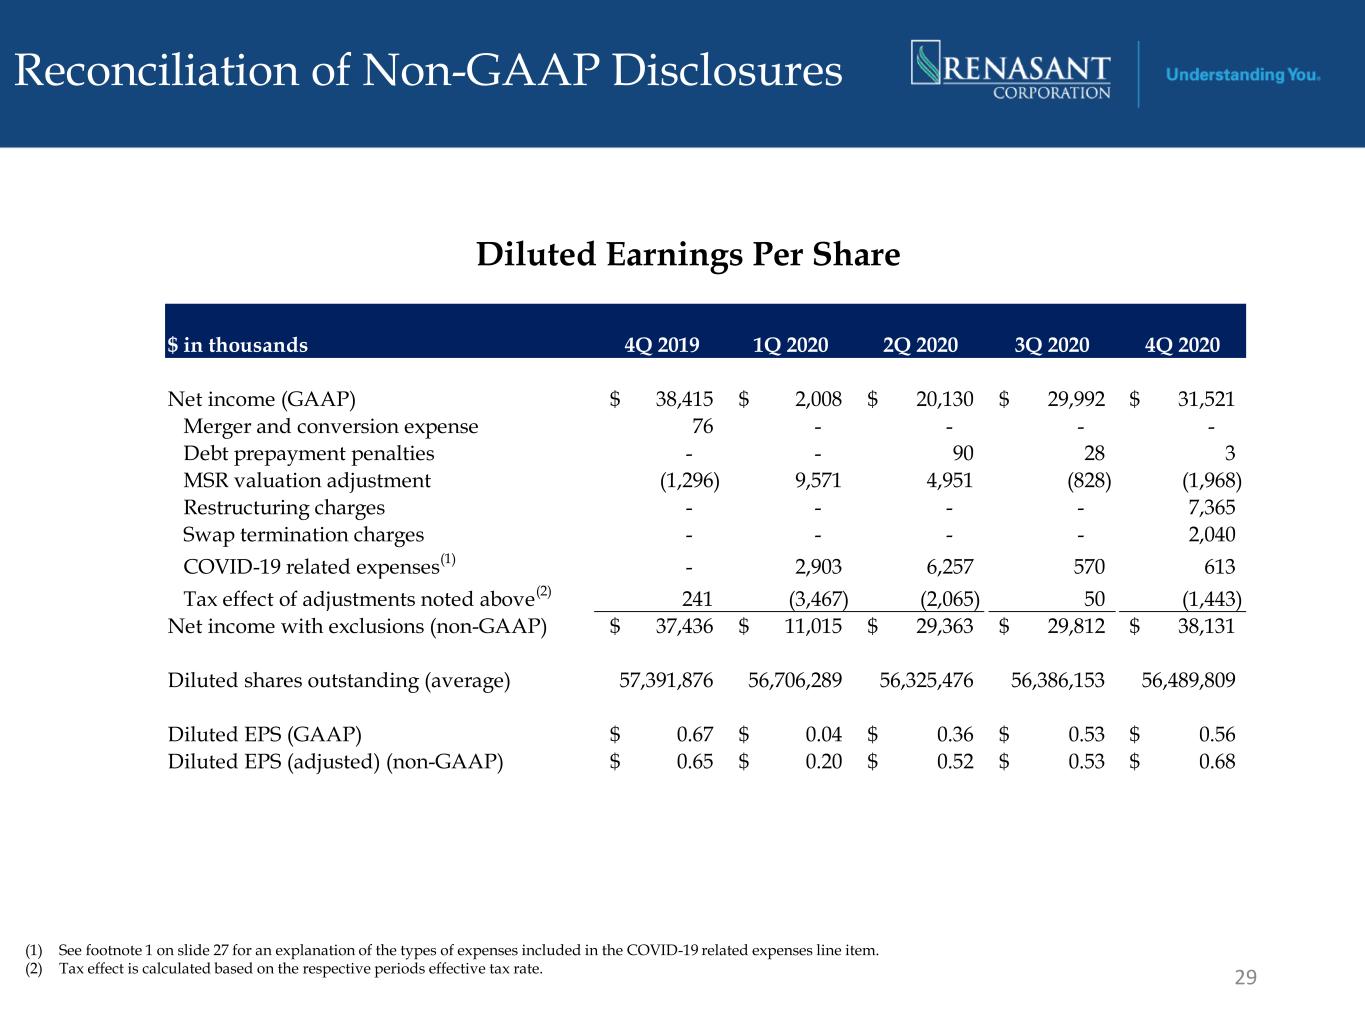
Reconciliation of Non-GAAP Disclosures 29 Diluted Earnings Per Share $ in thousands 4Q 2019 1Q 2020 2Q 2020 3Q 2020 4Q 2020 Net income (GAAP) 38,415$ 2,008$ 20,130$ 29,992$ 31,521$ Merger and conversion expense 76 - - - - Debt prepayment penalties - - 90 28 3 MSR valuation adjustment (1,296) 9,571 4,951 (828) (1,968) Restructuring charges - - - - 7,365 Swap termination charges - - - - 2,040 COVID-19 related expenses (1) - 2,903 6,257 570 613 Tax effect of adjustments noted above (2) 241 (3,467) (2,065) 50 (1,443) Net income with exclusions (non-GAAP) 37,436$ 11,015$ 29,363$ 29,812$ 38,131$ Diluted shares outstanding (average) 57,391,876 56,706,289 56,325,476 56,386,153 56,489,809 Diluted EPS (GAAP) 0.67$ 0.04$ 0.36$ 0.53$ 0.56$ Diluted EPS (adjusted) (non-GAAP) 0.65$ 0.20$ 0.52$ 0.53$ 0.68$ (1) See footnote 1 on slide 27 for an explanation of the types of expenses included in the COVID-19 related expenses line item. (2) Tax effect is calculated based on the respective periods effective tax rate.
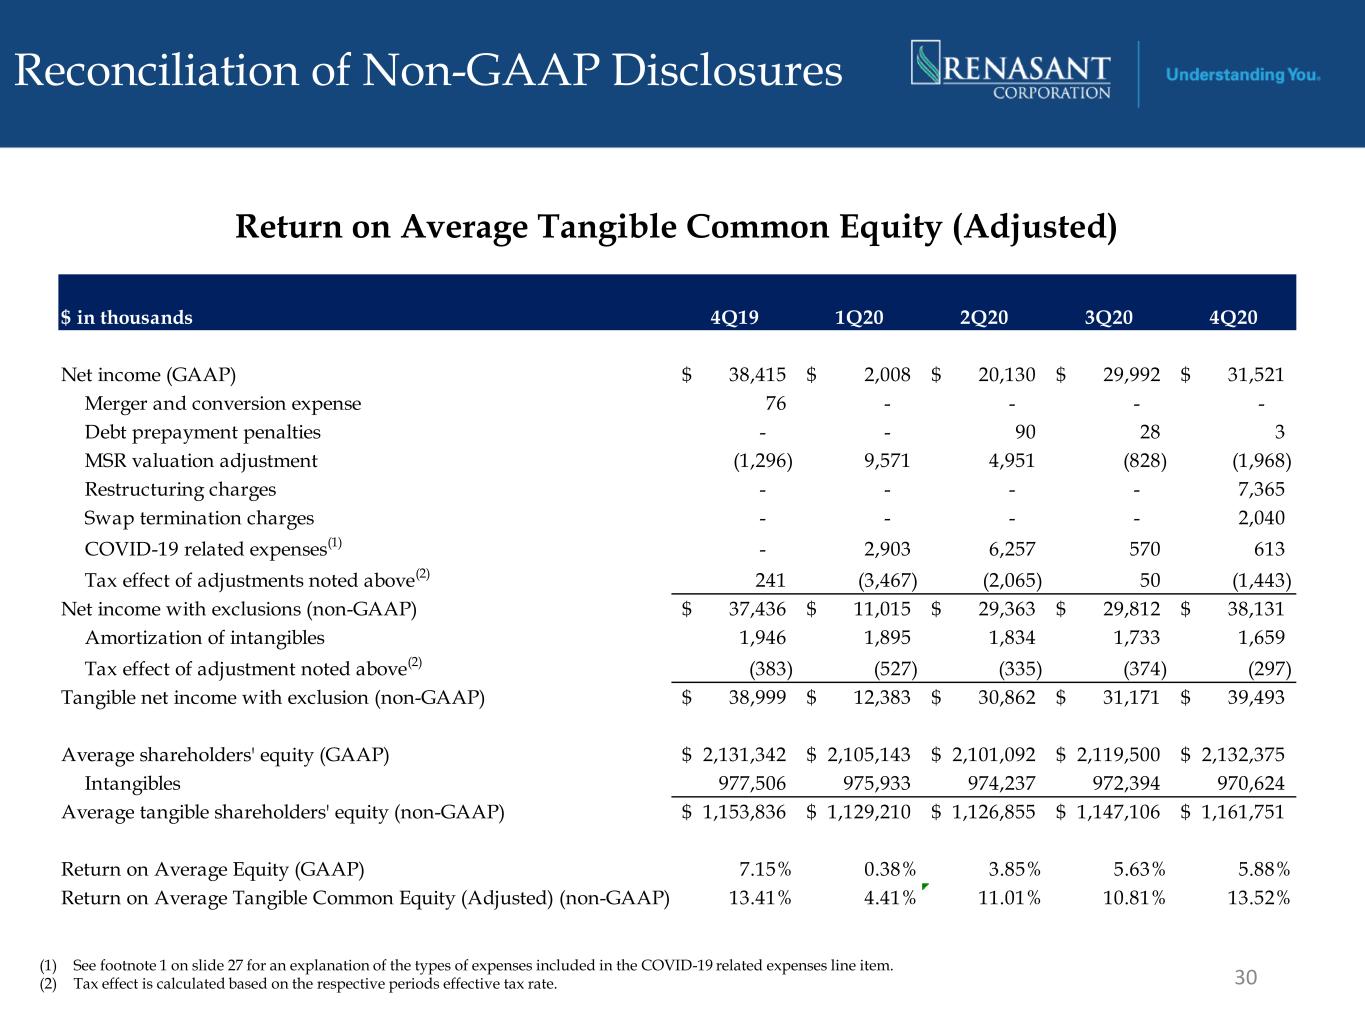
Reconciliation of Non-GAAP Disclosures 30 Return on Average Tangible Common Equity (Adjusted) $ in thousands 4Q19 1Q20 2Q20 3Q20 4Q20 Net income (GAAP) 38,415$ 2,008$ 20,130$ 29,992$ 31,521$ Merger and conversion expense 76 - - - - Debt prepayment penalties - - 90 28 3 MSR valuation adjustment (1,296) 9,571 4,951 (828) (1,968) Restructuring charges - - - - 7,365 Swap termination charges - - - - 2,040 COVID-19 related expenses (1) - 2,903 6,257 570 613 Tax effect of adjustments noted above (2) 241 (3,467) (2,065) 50 (1,443) Net income with exclusions (non-GAAP) 37,436$ 11,015$ 29,363$ 29,812$ 38,131$ Amortization of intangibles 1,946 1,895 1,834 1,733 1,659 Tax effect of adjustment noted above (2) (383) (527) (335) (374) (297) Tangible net income with exclusion (non-GAAP) 38,999$ 12,383$ 30,862$ 31,171$ 39,493$ Average shareholders' equity (GAAP) 2,131,342$ 2,105,143$ 2,101,092$ 2,119,500$ 2,132,375$ Intangibles 977,506 975,933 974,237 972,394 970,624 Average tangible shareholders' equity (non-GAAP) 1,153,836$ 1,129,210$ 1,126,855$ 1,147,106$ 1,161,751$ Return on Average Equity (GAAP) 7.15% 0.38% 3.85% 5.63% 5.88% Return on Average Tangible Common Equity (Adjusted) (non-GAAP) 13.41% 4.41% 11.01% 10.81% 13.52% (1) See footnote 1 on slide 27 for an explanation of the types of expenses included in the COVID-19 related expenses line item. (2) Tax effect is calculated based on the respective periods effective tax rate.

Reconciliation of Non-GAAP Disclosures Core Net Interest Income (FTE) and Core Net Interest Margin 31 $ in thousands 4Q 2019 1Q 2020 2Q 2020 3Q 2020 4Q 2020 Net interest income (FTE) (GAAP) 110,856$ 108,316$ 107,457$ 107,885$ 110,024$ Less: Net interest income collected on problem loans 152 218 384 282 128 Accretable yield recognized on purchased loans 6,661 5,469 4,700 4,949 4,130 Interest income on PPP loans - - 5,886 7,449 10,271 Core net interest income (FTE) (non-GAAP) 104,043$ 102,629$ 96,487$ 95,205$ 95,495$ Total average earning assets 11,277,000$ 11,609,477$ 12,776,644$ 13,034,422$ 13,059,967$ Less: Average PPP loans - - 866,078 1,305,229 1,252,990 Adjusted total average earning assets (non-GAAP) 11,277,000$ 11,609,477$ 11,910,566$ 11,729,193$ 11,806,977$ Net interest margin (GAAP) 3.90% 3.75% 3.38% 3.29% 3.35% Core net interest margin (non-GAAP) 3.66% 3.56% 3.26% 3.23% 3.22%
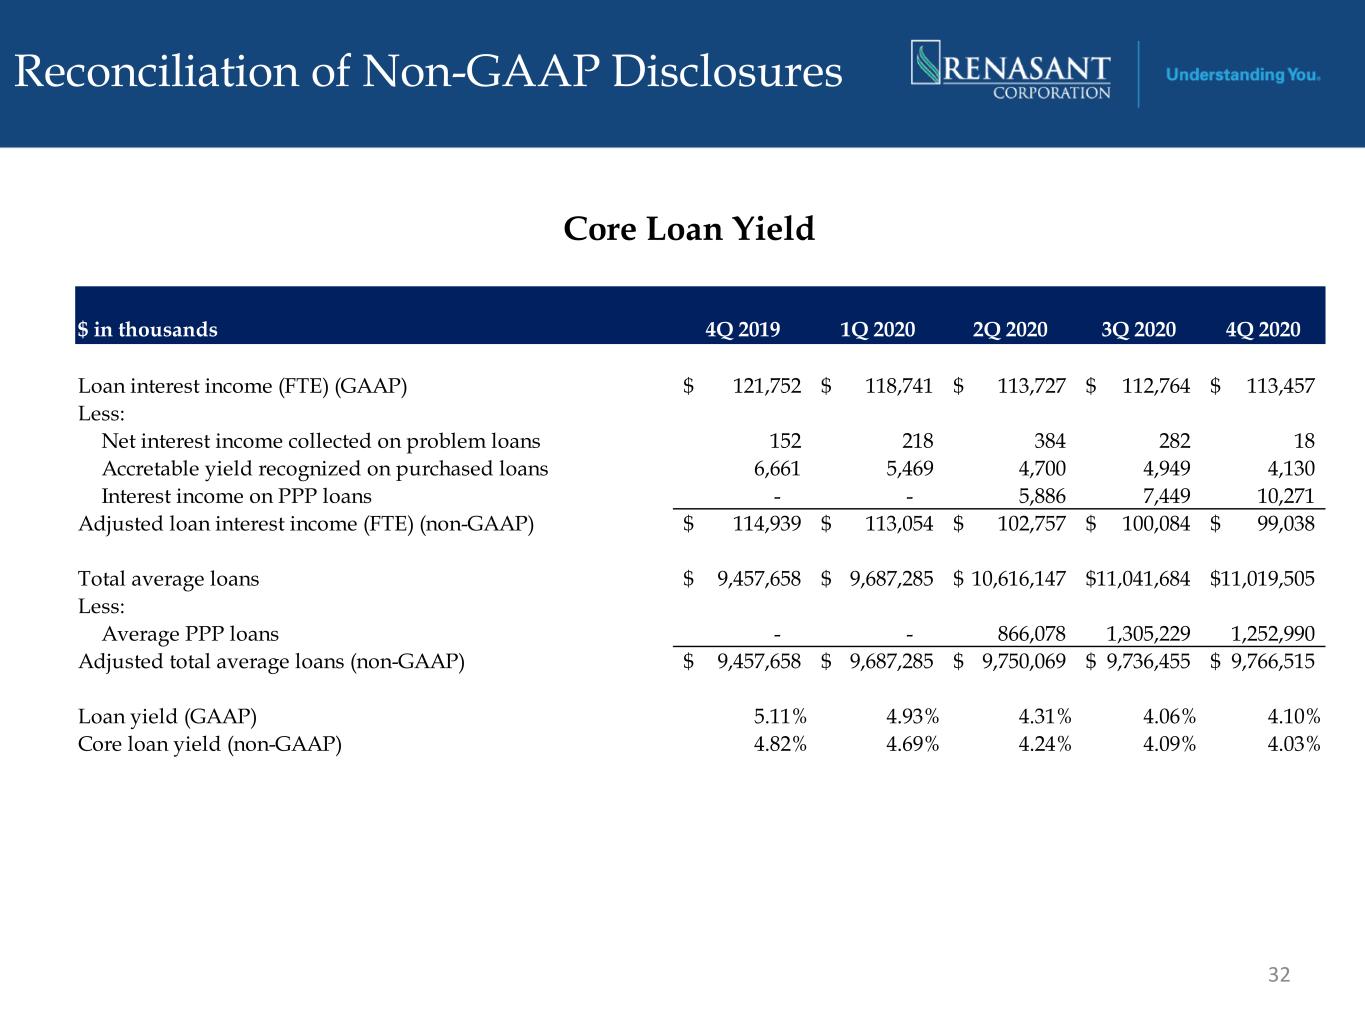
Reconciliation of Non-GAAP Disclosures Core Loan Yield 32 $ in thousands 4Q 2019 1Q 2020 2Q 2020 3Q 2020 4Q 2020 Loan interest income (FTE) (GAAP) 121,752$ 118,741$ 113,727$ 112,764$ 113,457$ Less: Net interest income collected on problem loans 152 218 384 282 18 Accretable yield recognized on purchased loans 6,661 5,469 4,700 4,949 4,130 Interest income on PPP loans - - 5,886 7,449 10,271 Adjusted loan interest income (FTE) (non-GAAP) 114,939$ 113,054$ 102,757$ 100,084$ 99,038$ Total average loans 9,457,658$ 9,687,285$ 10,616,147$ 11,041,684$ 11,019,505$ Less: Average PPP loans - - 866,078 1,305,229 1,252,990 Adjusted total average loans (non-GAAP) 9,457,658$ 9,687,285$ 9,750,069$ 9,736,455$ 9,766,515$ Loan yield (GAAP) 5.11% 4.93% 4.31% 4.06% 4.10% Core loan yield (non-GAAP) 4.82% 4.69% 4.24% 4.09% 4.03%
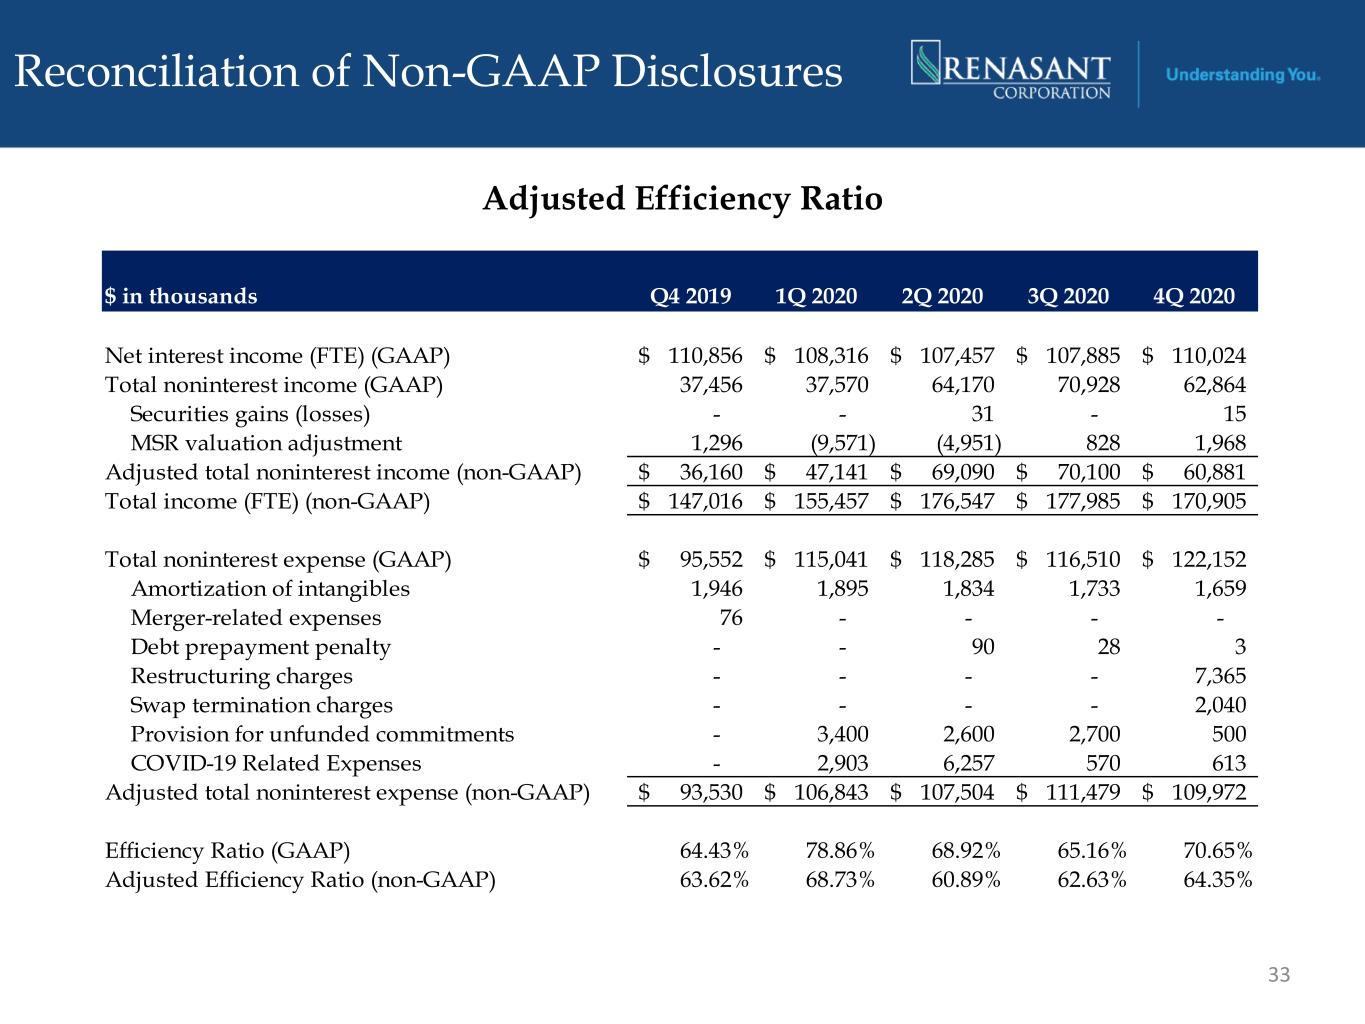
Reconciliation of Non-GAAP Disclosures Adjusted Efficiency Ratio 33 $ in thousands Q4 2019 1Q 2020 2Q 2020 3Q 2020 4Q 2020 Net interest income (FTE) (GAAP) 110,856$ 108,316$ 107,457$ 107,885$ 110,024$ Total noninterest income (GAAP) 37,456 37,570 64,170 70,928 62,864 Securities gains (losses) - - 31 - 15 MSR valuation adjustment 1,296 (9,571) (4,951) 828 1,968 Adjusted total noninterest income (non-GAAP) 36,160$ 47,141$ 69,090$ 70,100$ 60,881$ Total income (FTE) (non-GAAP) 147,016$ 155,457$ 176,547$ 177,985$ 170,905$ Total noninterest expense (GAAP) 95,552$ 115,041$ 118,285$ 116,510$ 122,152$ Amortization of intangibles 1,946 1,895 1,834 1,733 1,659 Merger-related expenses 76 - - - - Debt prepayment penalty - - 90 28 3 Restructuring charges - - - - 7,365 Swap termination charges - - - - 2,040 Provision for unfunded commitments - 3,400 2,600 2,700 500 COVID-19 Related Expenses - 2,903 6,257 570 613 Adjusted total noninterest expense (non-GAAP) 93,530$ 106,843$ 107,504$ 111,479$ 109,972$ Efficiency Ratio (GAAP) 64.43% 78.86% 68.92% 65.16% 70.65% Adjusted Efficiency Ratio (non-GAAP) 63.62% 68.73% 60.89% 62.63% 64.35%
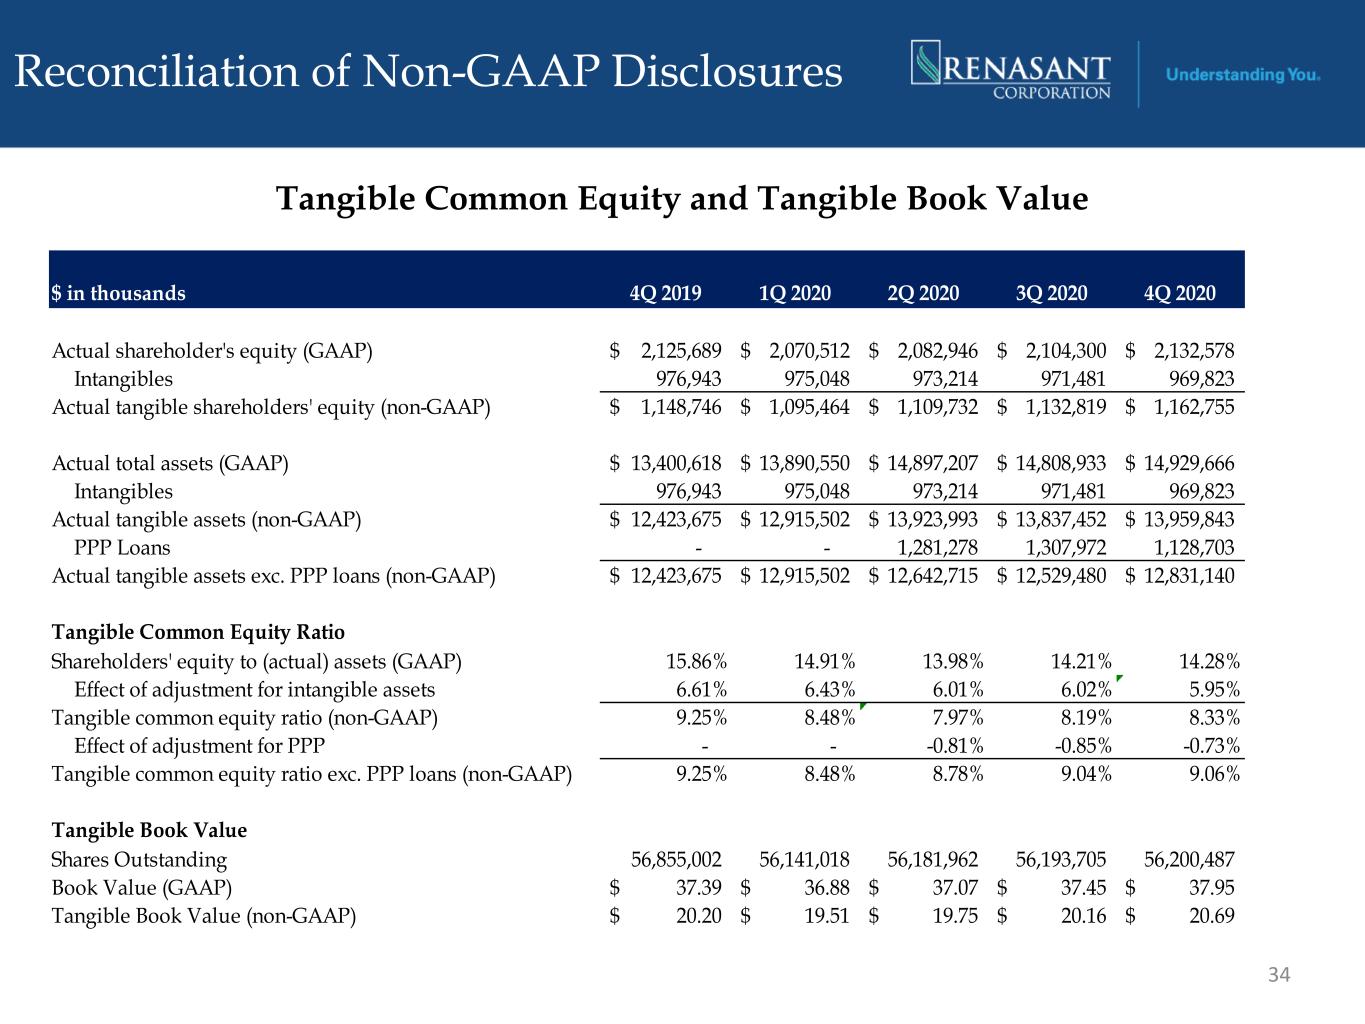
Reconciliation of Non-GAAP Disclosures Tangible Common Equity and Tangible Book Value 34 $ in thousands 4Q 2019 1Q 2020 2Q 2020 3Q 2020 4Q 2020 Actual shareholder's equity (GAAP) 2,125,689$ 2,070,512$ 2,082,946$ 2,104,300$ 2,132,578$ Intangibles 976,943 975,048 973,214 971,481 969,823 Actual tangible shareholders' equity (non-GAAP) 1,148,746$ 1,095,464$ 1,109,732$ 1,132,819$ 1,162,755$ Actual total assets (GAAP) 13,400,618$ 13,890,550$ 14,897,207$ 14,808,933$ 14,929,666$ Intangibles 976,943 975,048 973,214 971,481 969,823 Actual tangible assets (non-GAAP) 12,423,675$ 12,915,502$ 13,923,993$ 13,837,452$ 13,959,843$ PPP Loans - - 1,281,278 1,307,972 1,128,703 Actual tangible assets exc. PPP loans (non-GAAP) 12,423,675$ 12,915,502$ 12,642,715$ 12,529,480$ 12,831,140$ Tangible Common Equity Ratio Shareholders' equity to (actual) assets (GAAP) 15.86% 14.91% 13.98% 14.21% 14.28% Effect of adjustment for intangible assets 6.61% 6.43% 6.01% 6.02% 5.95% Tangible common equity ratio (non-GAAP) 9.25% 8.48% 7.97% 8.19% 8.33% Effect of adjustment for PPP - - -0.81% -0.85% -0.73% Tangible common equity ratio exc. PPP loans (non-GAAP) 9.25% 8.48% 8.78% 9.04% 9.06% Tangible Book Value Shares Outstanding 56,855,002 56,141,018 56,181,962 56,193,705 56,200,487 Book Value (GAAP) 37.39$ 36.88$ 37.07$ 37.45$ 37.95$ Tangible Book Value (non-GAAP) 20.20$ 19.51$ 19.75$ 20.16$ 20.69$


