
Exhibit 99.1 Investor Presentation November 2021
Important Information Forward Looking Statements This presentation may contain various statements about Renasant Corporation (“Renasant,” “we,” “our,” or “us”) that constitute “forward-looking statements” within the meaning of Section 27A of the Securities Act of 1933, as amended, and Section 21E of the Securities Exchange Act of 1934, as amended. Statements preceded by, followed by or that otherwise include the words “believes,” “expects,” “projects,” “anticipates,” “intends,” “estimates,” “plans,” “potential,” “possible,” “may increase,” “may fluctuate,” “will likely result,” and similar expressions, or future or conditional verbs such as “will,” “should,” “would” and “could,” are generally forward-looking in nature and not historical facts. Forward-looking statements include information about our future financial performance, business strategy, projected plans and objectives and are based on the current beliefs and expectations of management. We believe these forward-looking statements are reasonable, but they are all inherently subject to significant business, economic and competitive risks and uncertainties, many of which are beyond our control. In addition, these forward-looking statements are subject to assumptions about future business strategies and decisions that are subject to change. Actual results may differ from those indicated or implied in the forward-looking statements; such differences may be material. Prospective investors are cautioned that any forward-looking statements are not guarantees of future performance and involve risks and uncertainties. Investors should not place undue reliance on these forward-looking statements, which speak only as of the date they are made. Important factors currently known to management that could cause our actual results to differ materially from those in forward-looking statements include the following: (i) the continued impact of the COVID-19 pandemic and related governmental response measures on the U.S. economy and the economies of the markets in which we operate; (ii) the Company’s ability to efficiently integrate acquisitions into its operations, retain the customers of these businesses, grow the acquired operations and realize the cost savings expected from an acquisition to the extent and in the timeframe anticipated by management; (iii) the effect of economic conditions and interest rates on a national, regional or international basis; (iv) timing and success of the implementation of changes in operations to achieve enhanced earnings or effect cost savings; (v) competitive pressures in the consumer finance, commercial finance, insurance, financial services, asset management, retail banking, mortgage lending and auto lending industries; (vi) the financial resources of, and products available from, competitors; (vii) changes in laws and regulations as well as changes in accounting standards; (viii) changes in policy by regulatory agencies; (ix) changes in the securities and foreign exchange markets; (x) the Company’s potential growth, including its entrance or expansion into new markets, and the need for sufficient capital to support that growth; (xi) changes in the quality or composition of the Company’s loan or investment portfolios, including adverse developments in borrower industries or in the repayment ability of individual borrowers; (xii) an insufficient allowance for credit losses as a result of inaccurate assumptions; (xiii) general economic, market or business conditions, including the impact of inflation; (xiv) changes in demand for loan products and financial services; (xv) concentration of credit exposure; (xvi) changes or the lack of changes in interest rates, yield curves and interest rate spread relationships; (xvii) increased cybersecurity risk, including potential network breaches, business disruptions or financial losses; (xviii) civil unrest, natural disasters, epidemics and other catastrophic events in the Company’s geographic area; (xix) the impact, extent and timing of technological changes; and (xx) other circumstances, many of which are beyond management’s control. Management believes that the assumptions underlying our forward-looking statements are reasonable, but any of the assumptions could prove to be inaccurate. Investors are urged to carefully consider the risks described in Renasant’s filings with the Securities and Exchange Commission (“SEC”) from time to time, which are available at www.renasant.com and the SEC’s website at www.sec.gov. We undertake no obligation, and specifically disclaim any obligation, to update or revise our forward-looking statements, whether as a result of new information or to reflect changed assumptions, the occurrence of unanticipated events or changes to future operating results over time, except as required by federal securities laws. 2
Important Information, cont. Non-GAAP Financial Information In addition to results presented in accordance with generally accepted accounting principles in the United States of America (“GAAP”), this press release contains non-GAAP financial measures, namely, loans excluding Paycheck Protection Program (“PPP”) loans, core loan yield, the ratio of tangible equity to tangible assets (that is, the “tangible common equity ratio”), certain asset quality ratios (namely, loans 30-89 past due to total loans, classified loans to total loans, nonperforming assets to total assets, net charge-offs to average loans and the allowance for credit losses to total loans) in each case excluding PPP loans, adjusted pre-provision net revenue and the ratio thereof to average assets, adjusted earnings, the return on average tangible assets and on average tangible common equity, core net interest income and margin, the adjusted efficiency ratio and pre-tax core net income. These non-GAAP financial measures adjust GAAP financial measures to exclude intangible assets and/or certain charges (such as, among others, COVID-19 related expenses, restructuring charges and asset valuation adjustments) with respect to which the Company is unable to accurately predict when these charges will be incurred or, when incurred, the amount thereof or, with respect to core loan yield and its asset quality measures, to exclude the Company’s PPP loans. With respect to COVID-19 related expenses in particular, management added these expenses as a charge to exclude when calculating non-GAAP financial measures because the expenses included within this line item are readily quantifiable and possess the same characteristics with respect to management’s inability to accurately predict the timing or amount thereof as the other charges excluded when calculating non-GAAP financial measures. Management uses these non-GAAP financial measures when evaluating capital utilization and adequacy; with respect to the core loan yield and certain asset quality measures, management excludes PPP loans, which bear an interest rate fixed by Small Business Administration (“SBA”) regulations and are both forgivable and guaranteed by the SBA, to more clearly measure loan yields affected by competitive factors and potential loss in the Company’s loan portfolio and the coverage therefor. In addition, the Company believes that these non- GAAP financial measures facilitate the making of period-to-period comparisons and are meaningful indicators of its operating performance, particularly because these measures are widely used by industry analysts for companies with merger and acquisition activities. Also, because intangible assets such as goodwill and the core deposit intangible, charges such as restructuring charges and COVID-19 related expenses, and the amount of PPP loans can vary extensively from company to company and, as to intangible assets, are excluded from the calculation of a financial institution’s regulatory capital, the Company believes that the presentation of this non-GAAP financial information allows readers to more easily compare the Company’s results to information provided in other regulatory reports and the results of other companies. Reconciliations of these non- GAAP financial measures to the most directly comparable GAAP financial measures are included in the tables at the end of this release under the caption “Reconciliation of Non-GAAP Disclosures”. None of the non-GAAP financial information that we have included in this presentation is intended to be considered in isolation or as a substitute for any measure prepared in accordance with GAAP. Investors should note that, because there are no standardized definitions for the calculations as well as the results, our calculations may not be comparable to similarly-titled measures presented by other companies. Also, there may be limits in the usefulness of these measures to investors. As a result, we encourage readers to consider our consolidated financial statements in their entirety and not to rely on any single financial measure. 3
Overview of Renasant Corporation

Experienced Leadership Team E. Robinson McGraw • Chairman of the Board since 2005 Executive Chairman • President (2000-2016) and CEO (2000-2018) Age: 74 Years of Experience: 47• General Counsel prior to becoming President and CEO Years at Renasant: 47 C. Mitchell Waycaster • President since 2016 and CEO since 2018 President, Chief Executive Officer • Elected to the Federal Reserve Bank of St. Louis Board of Directors in 2020 & Director Age: 62 • Chief Administrative Officer (2007-2016) Years of Experience: 42 Years at Renasant: 42• Mississippi Division President, EVP of Retail Banking, and Credit Administrator Kevin D. Chapman • COO since 2018 Chief Operating Officer • CFO (2011- August 2020) Age: 46 Years of Experience: 23 • Chief Strategy Officer (2011) Years at Renasant: 16 • Corporate Controller and Chief Accounting Officer (2006-2011) • CFO since August 2020 James C. Mabry IV Chief Financial Officer • EVP of Mergers & Acquisitions and Investor Relations at South State Corp. (2015-2020) Age: 64 • nCino Board of Directors (2012-2015) Years of Experience: 38 Years at Renasant: 1• Managing Director at KBW, a Stifel Company, focusing on M&A, strategic advisory, and capital markets for banking clients David L. Meredith • Chief Credit Officer since 2018 Chief Credit Officer • Co-Chief Credit Officer (2015-2018) Age: 54 Years of Experience: 32 • Divisional Chief Credit Officer (2013-2015) Years at Renasant: 11 • Senior Credit Officer (2010-2013) 5

Overview Winston-Salem Company Snapshot 81 Nashville 95 Knoxville Greensboro 40 TENNESSEE 77 Raleigh 24 75 ARKANSAS Memphis NORTH CAROLINA Charlotte Chattanooga 40 Greenville 85 Huntsville 65 Tupelo Columbia 95 $16.2B $10.0B $13.3B $2.2B Birmingham Atlanta 20 SOUTH CAROLINA GEORGIA Assets Loans Deposits Equity MISSISSIPPI ALABAMA Charleston 20 Columbus Jackson 75 Montgomery Savannah 59 65 Branch (162) (1) Mobile YTD Total Revenue 10 Loan Production Office (7) 55 Tallahassee Mortgage (21) Jacksonville LOUISIANA 95 2% Insurance (8) Financial Services (2) FLORIDA Orlando 21% Loans & Deposits by State 3% Loans Deposits 74% TN TN MS 17% 13% 23% MS 37% Community Banking GA Wealth Management GA AL 35% 32% 22% Mortgage FL AL Insurance 6% 12% Note: Financial data as of September 30, 2021 6 (1) Year-to-date total revenue is calculated as net interest income plus noninterest income. FL 3%

Strong Southern Recovery The South Will Likely Recover Employment Losses First (Employment Recovery by Region) (1) Unemployment Rate by Region (%) 6.55% 6.16% 4.83% 4.85% Recovery Northeast Midwest Q32022 West South West Midwest Northeast Employment YoY Change (%) Q42022 3.8% 3.2% 3.3% 3.1% 2.9% 2.6% 2.4% 2023 2.1% South (4.9%) (6.3%) (6.4%) (8.8%) 2020 / 2019 2021 / 2020 2022 / 2021 • The post-pandemic Southern migration has created a GDP YoY Change (%) housing boom, providing a strong base of employment 5.7% 5.3% 5.2% 4.6% in the construction industry and overall economic 3.9% 3.3% 3.3% 2.9% growth • Visa expects Southern markets to return to pre- (2.4%) (3.3%) pandemic employment levels by the end of 2022, (3.8%) (4.9%) 2020 / 2019 2021 / 2020 2022 / 2021 leading the national recovery Source: VISA Business and Economic Insights – U.S. Regional Economic Outlook, August 2021; U.S. Bureau of Labor Statistics (including forward looking estimates) 7 (1) State unemployment rate population weighted by region; data as of September 2021
Investment Highlights • Building on a 117 year history • 200 banking, lending, mortgage, wealth management and insurance offices in vibrant markets across 7 Southeastern states • Experienced and tenured team attracting new talent • Proven track record of successful acquisitions and de novo expansion • Profitable throughout the 2008 financial crisis • Strong balance sheet with an emphasis on liquidity, core funding, meaningful credit reserves and a granular and diverse loan portfolio • Legacy of proactive portfolio management and conservative credit underwriting • Stable low-cost core deposit base • Diverse sources of noninterest income • Engaged Board with a focus on risk management 8

Market Expansion Since 2010 KeyWorth Bank American Trust First M&F Brand Group (1) Atlanta, GA Bank Corporation Holdings, Inc. Roswell, GA Kosciusko, MS Lawrenceville, GA Crescent Bank and Heritage (1) Metropolitan Trust Financial RBC (USA) BancGroup, Inc. Jasper, GA Group, Inc. Trust Unit Ridgeland, MS Albany, GA Birmingham, AL 2010 2011 2012 2013 2015 2016 2017 2018 2019 2020 2021 ü Maryville, TN ü Mobile, AL ü Columbus, MS ü Jonesborough, TN ü Destin, FL ü Pensacola, FL ü Fairhope, AL ü Montgomery,ü Bristol, TN AL ü Johnson City, ü Starkville, MS TN ü Tuscaloosa, AL 9 (1) FDIC-assisted transaction De novo Expansions Acquisitions

Recognition of Our Efforts Jersey Sponsor of Nashville Soccer Newsweek 2021 Recognition Club Newsweek names Renasant as the Demonstrates Renasant as a strong Best Big Bank in Mississippi for culturally relevant bank in one of the 2022 fastest growing markets in the Southeast Renasant Convention Center Located in Memphis, TN, this 300,000 square foot state of the art Forbes 2021 Recognition multipurpose space is home to - Best Bank in Georgia conferences, concerts and galas rd - 3 Best Bank in Mississippi - Among the Worlds Best Banks 10

Commitment to Environmental, Social & Governance We firmly believe that prudent, inclusive, long-term focused management and governance are good for shareholders, customers, and employees. We are firmly committed to treating prospective and existing customers, our employees, and our communities in a manner that is equitable, transparent, fair and consistent. How We Operate Employees Communities Ethics, Compliance, and ESG Equity, Diversity, and Inclusion Financial Education Oversight • We have established a nine • Engagements include youth member Social Responsibility, mentorship, credit rehabilitation • Board of Directors and Executive Diversity and Inclusion workshops, small business Leadership Oversight committee, which includes our technical assistance, and home CEO and other senior leadership ownership education • Ethics Compliance Program employees, to develop a designed to implement the Renasant Roots comprehensive roadmap for our requirements of our Code of • Supports increased community collective success Business Conduct and Ethics service through volunteer Learning and Development partnerships and creating value • Whistleblower Policy and Programs • Dedicated learning and in serving our low-to-moderate development team that serves as income communities • Data Privacy and Security Oversight a strategic partner across all our Rise with Renasant lines of business • Lead by the Technology • Renasant’s women’s Committee of the Board• All our employees receive empowerment initiative supports regular, ongoing job-specific female leaders, achievers, and training to ensure they have the innovators in our communities skills required to work confidently and the enhance their knowledge and expertise over 11 time

Financial Condition

Third Quarter Highlights • Net income of $40.1 million and diluted earnings per share (“EPS”) of $0.71 • Repurchased approximately 612,000 shares of common stock for $21.3 million at a weighted average price of $34.82 • Mortgage production remained strong during the quarter with gain on sale margins declining from the second quarter • Allowance for credit losses to total loans decreased to 1.70%, and excluding (1) Paycheck Protection Program (“PPP”) loans, to 1.71% • Net charge-offs were $1.1 million, and the ratio of nonperforming loans to (1) total loans was 0.57%, and excluding PPP loans was 0.57% • Loans, excluding PPP loans, grew quarter over quarter at an annualized (1) growth rate of 1.87% • Deposits increased $139 million quarter over quarter, and noninterest-bearing deposits represent 33.89% of total deposits as of the third quarter Financial data as of September 30, 2021. 13 (1) Allowance for credit losses to total loans (excluding PPP loans), nonperforming loans to total loans (excluding PPP loans), and total loans (excluding PPP loans) are non- GAAP financial measures. See slide 51 in the appendix for a reconciliation of these non-GAAP financial measures to GAAP.

Total Assets $16,156 $16,022 $16,000 $15,623 $14,930 $15,000 $14,809 $14,000 $13,000 $12,000 $11,000 $10,000 Q3 2020 Q4 2020 Q1 2021 Q2 2021 Q3 2021 14 Dollars in millions

Loans and Yields 4.24% 4.24% 4.11% 4.09% 4.10% 4.06% 4.03% 4.01% 3.94% 3.89% $11,085 $10,934 $10,688 $10,149 $10,017 3Q 2020 4Q 2020 1Q 2021 2Q 2021 3Q 2021 1-4 Family Mortgage Commercial Mortgage Construction Other* C&I PPP Loan Yield Core Loan Yield** Dollars in millions * Other loans are comprised of installment loans to individuals and lease financing, which both have historically constituted less than 5% of the total loan portfolio. ** Core Loan Yield is a non-GAAP financial measure. See slide 48 in the appendix for a description of the exclusions and a reconciliation of this non-GAAP financial measure to 15 GAAP.
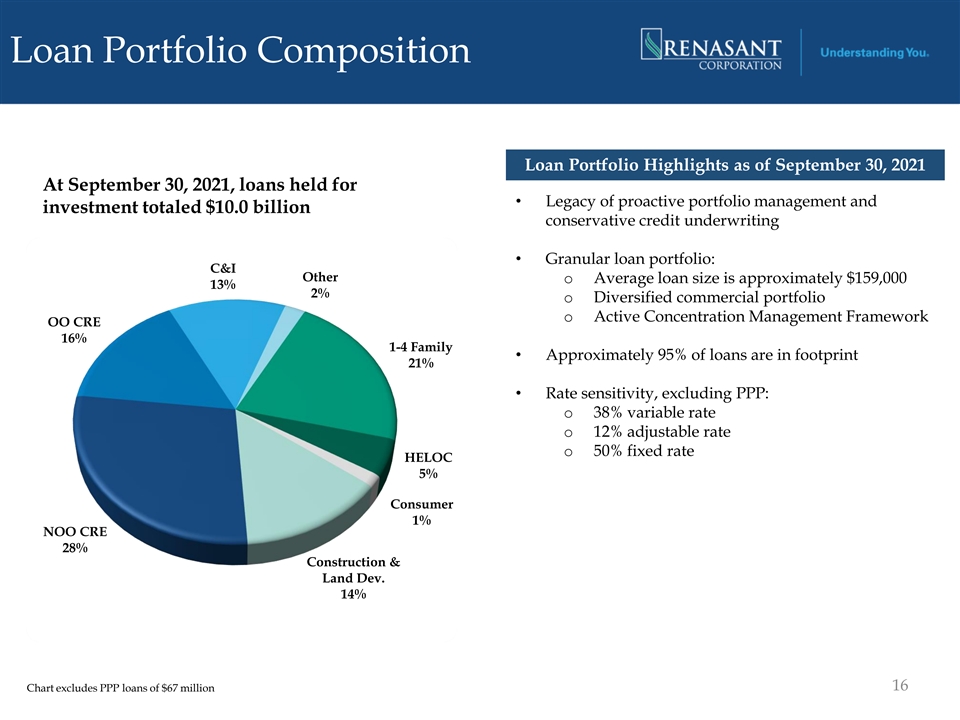
Loan Portfolio Composition Loan Portfolio Highlights as of September 30, 2021 At September 30, 2021, loans held for • Legacy of proactive portfolio management and investment totaled $10.0 billion conservative credit underwriting • Granular loan portfolio: C&I Other o Average loan size is approximately $159,000 13% 2% o Diversified commercial portfolio o Active Concentration Management Framework OO CRE 16% 1-4 Family • Approximately 95% of loans are in footprint 21% • Rate sensitivity, excluding PPP: o 38% variable rate o 12% adjustable rate o 50% fixed rate HELOC 5% Consumer 1% NOO CRE 28% Construction & Land Dev. 14% 16 Chart excludes PPP loans of $67 million

Diversified Loan Portfolio 17 Chart excludes PPP loans of $67 million

ADC and CRE Loan Concentration Levels CRE Loans (Const. & Perm) as a Percentage of ADC Loans as a Percentage of Bank Risk Based Capital Bank Risk Based Capital 100% 300% 87% 83% 81% 79% 250% 78% 80% 76% 73% 200% 60% 150% 40% 100% 20% 50% 0% 0% 18

Deposit Mix and Pricing $13,255 $13,115 $12,737 $12,059 $11,934 0.40% 0.33% 0.27% 0.24% 0.21% 3Q 2020 4Q 2020 1Q 2021 2Q 2021 3Q 2021 Noninterest-bearing Interest-bearing Savings Time Cost of deposits 19 Dollars in millions
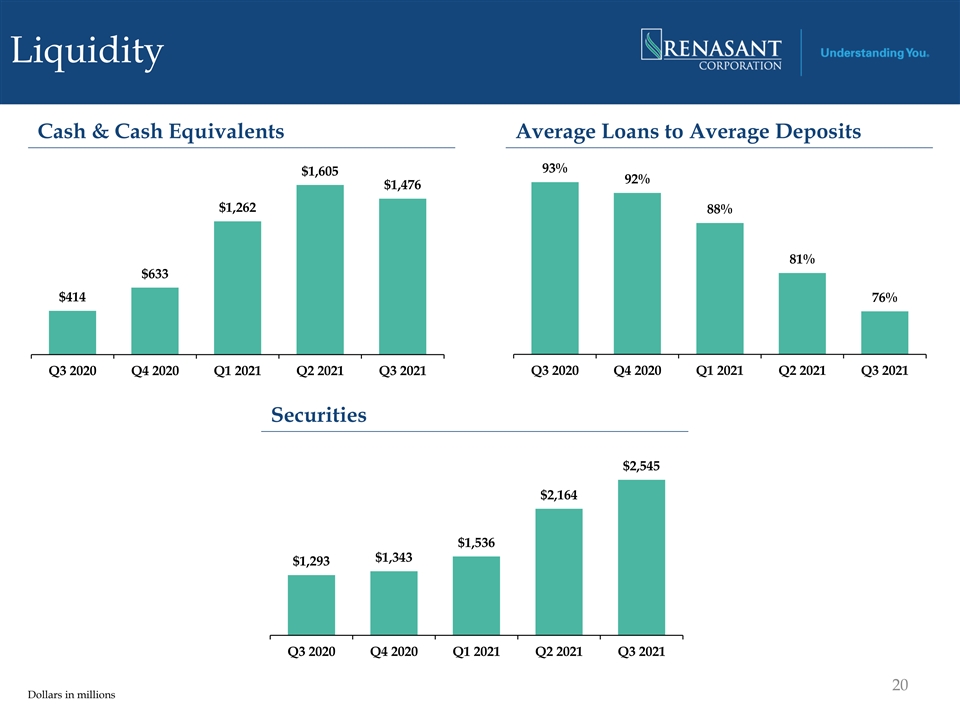
Liquidity Cash & Cash Equivalents Average Loans to Average Deposits $1,800 $1 93% $1,605 92% $1,600 $1,476 $1 $1,400 $1,262 88% $1,200 $1 $1,000 81% $800 $633 $1 $600 $414 76% $400 $1 $200 $0 $1 Q3 2020 Q4 2020 Q1 2021 Q2 2021 Q3 2021 Q3 2020 Q4 2020 Q1 2021 Q2 2021 Q3 2021 Securities $3,000 $2,545 $2,500 $2,164 $2,000 $1,536 $1,500 $1,343 $1,293 $1,000 $500 Q3 2020 Q4 2020 Q1 2021 Q2 2021 Q3 2021 20 Dollars in millions

Securities Portfolio Composition Highlights <1% • Market value of $2.54B 2% • Taxable equivalent yield of 1.59% 15% • Average life of 5.2 years 37% • 85% of securities portfolio is U.S. government agency or Treasury issued (1) • 98% of the municipal portfolio is rated AA or better 45% Agency MBS Agency CMO Municipal US Treasuries Other Financial data as of September 30, 2021 21 (1) As rated by S&P, Moody’s or Fitch

Liquidity Sources of Liquidity as of September 30, 2021 Outstanding / Remaining Usage Available Pledged Availability Percentage Total FHLB Line $4,790 $812 $3,978 17.0 % Brokered Deposits* 2,651 -- 2,651 0.0 Pledgeable Securities 2,172 558 1,614 25.7 Unsecured Bank Line 150 -- 150 0.0 Secured Bank Line 20 -- 20 0.0 Total Bank Sources $9,783 $1,370 $8,413 14.0 % Unsecured Bank Line $10 -- $10 0.0 % Secured Bank Line 3 -- 3 0.0 Securities 2 2 -- 100.0 Cash 131 8 123 6.1 Total Holding Company Sources $146 $10 $136 6.8 % • 3Q 2021 deposit growth of $139 million from Q2 2021 was primarily driven by non- interest bearing deposits • As of September 30, 2021 Bank Total Capital was $1.57B compared to the minimum amount to be considered well capitalized of $1.17B 22 Dollars in millions *Brokered deposits cannot exceed 20% of total deposits per policy

Interest Rate Sensitivity • The following table summarizes the forecasted impact on net interest income given an immediate change in interest rates at the specified levels based on forecasted assumptions of prepayment speeds, nominal interest rates and loan and deposit repricing rates • Assumptions are based on current economic conditions, historical interest rate cycles and other factors deemed to be relevant Net Interest Income Impact Interest Rate Scenario Year 1 Year 2 + 200bps 16.9% 22.9% + 100bps 8.6% 12.2% 23 Financial data as of September 30, 2021. Refer to SEC filings for further information on assumptions used for forecasting purposes
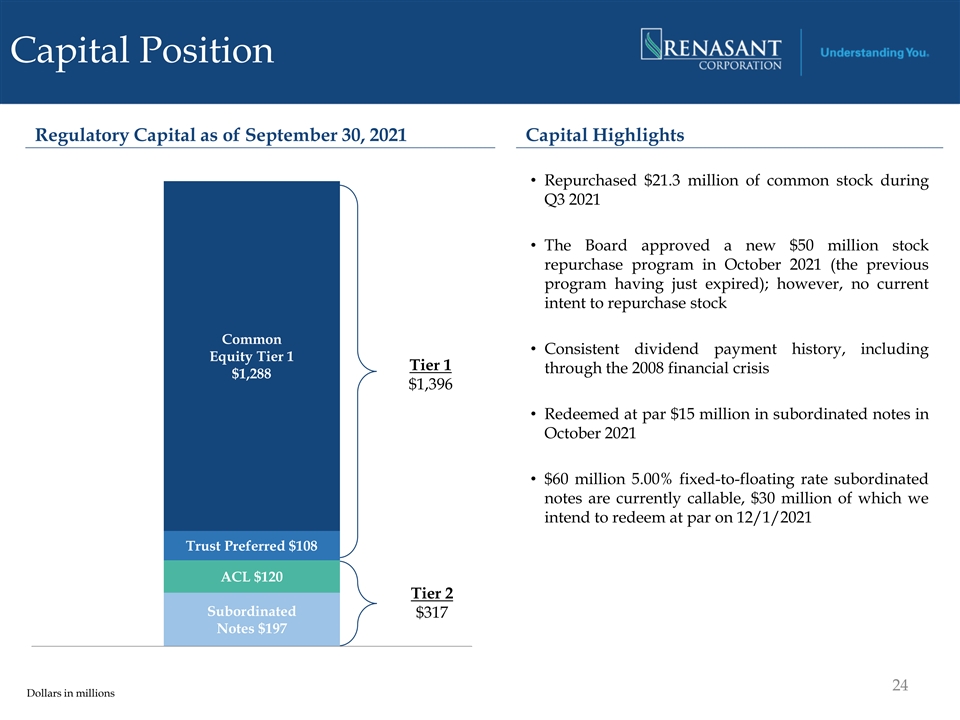
Capital Position Regulatory Capital as of September 30, 2021 Capital Highlights • Repurchased $21.3 million of common stock during Q3 2021 • The Board approved a new $50 million stock repurchase program in October 2021 (the previous program having just expired); however, no current intent to repurchase stock Common • Consistent dividend payment history, including Equity Tier 1 Tier 1 through the 2008 financial crisis $1,288 $1,396 • Redeemed at par $15 million in subordinated notes in October 2021 • $60 million 5.00% fixed-to-floating rate subordinated notes are currently callable, $30 million of which we intend to redeem at par on 12/1/2021 Trust Preferred $108 ACL $120 Tier 2 Subordinated $317 Notes $197 1 24 Dollars in millions
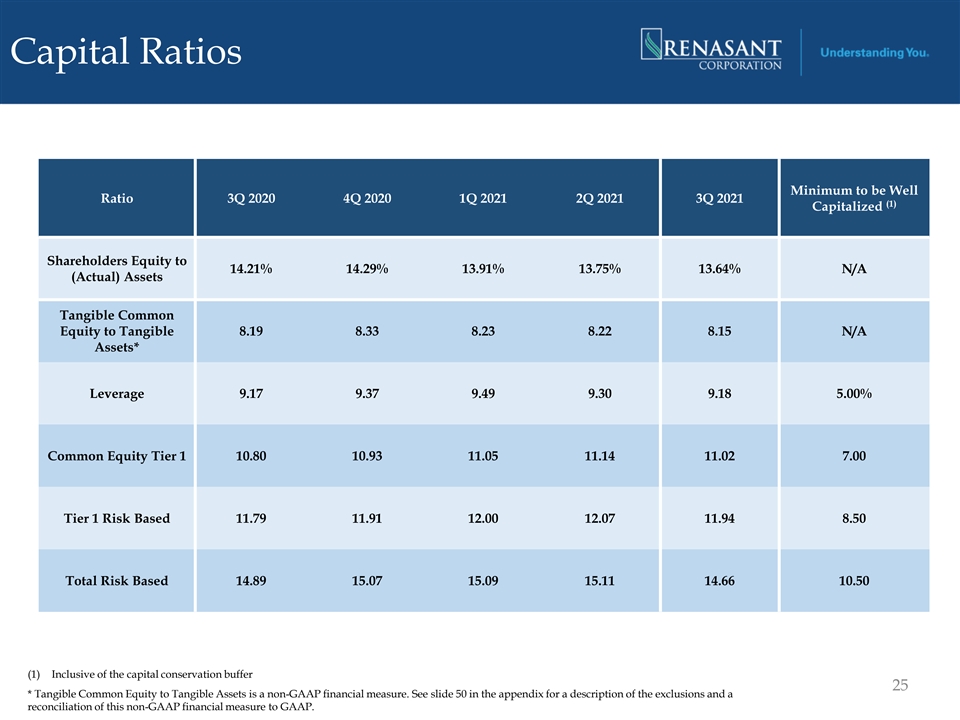
Capital Ratios Strong Capital Position Minimum to be Well Ratio 3Q 2020 4Q 2020 1Q 2021 2Q 2021 3Q 2021 (1) Capitalized Shareholders Equity to 14.21% 14.29% 13.91% 13.75% 13.64% N/A (Actual) Assets Tangible Common Equity to Tangible 8.19 8.33 8.23 8.22 8.15 N/A Assets* Leverage 9.17 9.37 9.49 9.30 9.18 5.00% Common Equity Tier 1 10.80 10.93 11.05 11.14 11.02 7.00 Tier 1 Risk Based 11.79 11.91 12.00 12.07 11.94 8.50 Total Risk Based 14.89 15.07 15.09 15.11 14.66 10.50 (1) Inclusive of the capital conservation buffer 25 * Tangible Common Equity to Tangible Assets is a non-GAAP financial measure. See slide 50 in the appendix for a description of the exclusions and a reconciliation of this non-GAAP financial measure to GAAP.

Asset Quality
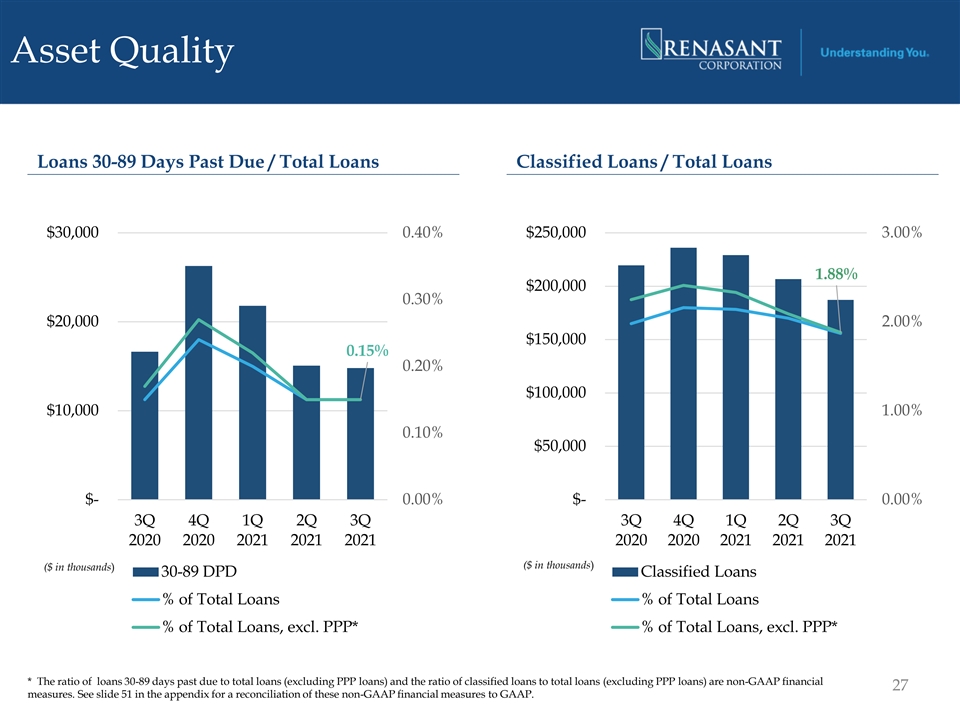
Asset Quality Loans 30-89 Days Past Due / Total Loans Classified Loans / Total Loans $30,000 0.40% $250,000 3.00% 1.88% $200,000 0.30% $20,000 2.00% $150,000 0.15% 0.20% $100,000 $10,000 1.00% 0.10% $50,000 $- 0.00% $- 0.00% 3Q 4Q 1Q 2Q 3Q 3Q 4Q 1Q 2Q 3Q 2020 2020 2021 2021 2021 2020 2020 2021 2021 2021 ($ in thousands) ($ in thousands) 30-89 DPD Classified Loans % of Total Loans % of Total Loans % of Total Loans, excl. PPP* % of Total Loans, excl. PPP* * The ratio of loans 30-89 days past due to total loans (excluding PPP loans) and the ratio of classified loans to total loans (excluding PPP loans) are non-GAAP financial 27 measures. See slide 51 in the appendix for a reconciliation of these non-GAAP financial measures to GAAP.

Asset Quality NPAs / Total Assets Net Charge-Offs / Average Loans $10,000 0.60% $75,000 2.50% 0.50% 2.00% $7,500 $50,000 0.40% 1.50% $5,000 0.30% 1.00% $25,000 0.20% 0.50% $2,500 0.04% 0.38% 0.10% $- 0.00% 3Q 4Q 1Q 2Q 3Q $- 0.00% 2020 2020 2021 2021 2021 3Q 4Q 1Q 2Q 3Q 2020 2020 2021 2021 2021 OREO ($ in thousands) ($ in thousands) Net charge-offs Nonperforming loans % of Total Avg Loans % of Total Assets % of Avg Loans, excl. PPP* % of Assets, excl. PPP* * Nonperforming assets to total assets (excluding PPP loans) and net charge-offs to average loans (excluding PPP loans) are non-GAAP financial measures. See slide 52 in the 28 appendix for a reconciliation of these non-GAAP financial measures to GAAP.

ACL Metrics Allowance / Total Loans Allowance / Nonperforming Loans $180,000 1.90% $180,000 400% 1.71% 1.80% 300% $170,000 $170,000 350% 1.70% $160,000 1.70% 1.60% $160,000 300% $150,000 1.50% $150,000 250% $140,000 1.40% 3Q 4Q 1Q 2Q 3Q 2020 2020 2021 2021 2021 $140,000 200% ($ in thousands) ($ in thousands) Allowance 3Q 4Q 1Q 2Q 3Q 2020 2020 2021 2021 2021 % of Total Loans Allowance % of Total NPLs % of Total Loans, excl. PPP* * Allowance for credit losses to total loans (excluding PPP loans) is a non-GAAP financial measure. See slide 51 in the appendix for a reconciliation of this non-GAAP financial 29 measure to GAAP.
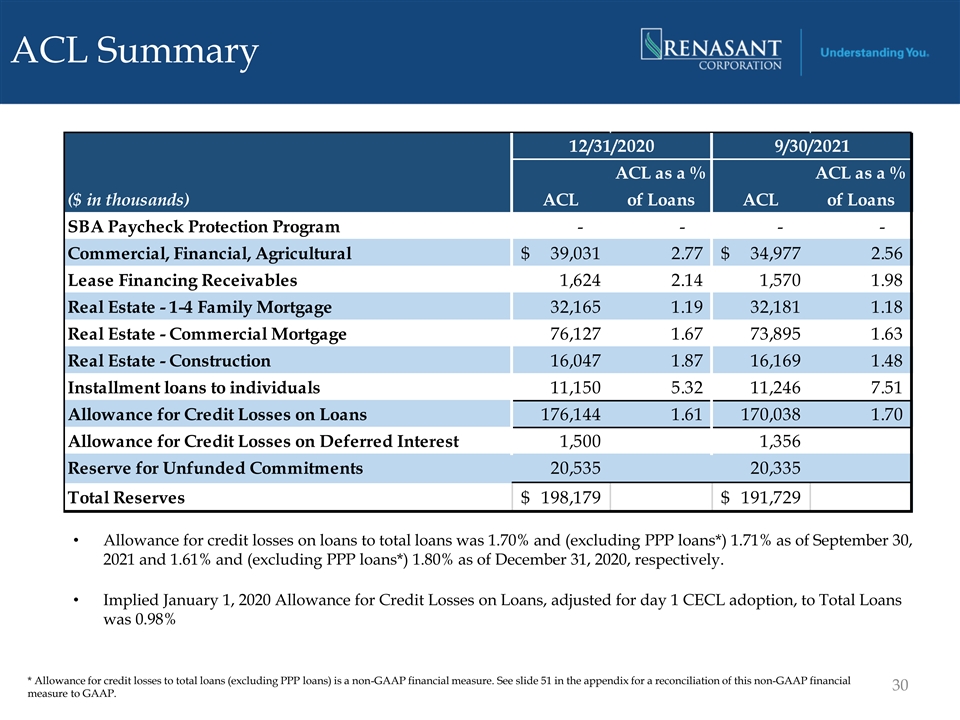
ACL Summary 12/31/2020 9/30/2021 ACL as a % ACL as a % ($ in thousands) ACL of Loans ACL of Loans SBA Paycheck Protection Program - - - - Commercial, Financial, Agricultural $ 39,031 2.77 $ 34,977 2.56 Lease Financing Receivables 1,624 2.14 1,570 1.98 Real Estate - 1-4 Family Mortgage 32,165 1.19 32,181 1.18 Real Estate - Commercial Mortgage 76,127 1 .67 73,895 1.63 Real Estate - Construction 16,047 1.87 16,169 1 .48 Installment loans to individuals 11,150 5 .32 11,246 7 .51 Allowance for Credit Losses on Loans 176,144 1 .61 1 70,038 1 .70 Allowance for Credit Losses on Deferred Interest 1,500 1,356 Reserve for Unfunded Commitments 20,535 20,335 Total Reserves $ 198,179 $ 191,729 • Allowance for credit losses on loans to total loans was 1.70% and (excluding PPP loans*) 1.71% as of September 30, 2021 and 1.61% and (excluding PPP loans*) 1.80% as of December 31, 2020, respectively. • Implied January 1, 2020 Allowance for Credit Losses on Loans, adjusted for day 1 CECL adoption, to Total Loans was 0.98% * Allowance for credit losses to total loans (excluding PPP loans) is a non-GAAP financial measure. See slide 51 in the appendix for a reconciliation of this non-GAAP financial 30 measure to GAAP.

Loss Absorption Capacity ($ in thousands) 9/30/2021 Allowance for Credit Losses on Loans $ 170,038 Reserve for Unfunded Commitments 20,335 Purchase Accounting Discounts 16,997 Total Loss Absorption Capacity $ 207,370 Total Loss Absorption Capacity 1.71% Excluding PPP* 31 * Allowance to total loans (excluding PPP loans) is a non-GAAP financial measure. See slide 51 in the appendix for a reconciliation of this non-GAAP financial measure to GAAP.

Profitability

Net Income & Adjusted Pre- Provision Net Revenue* 1.68% 1.66% 1.53% 1.24% 1.23% 1.54% 1.04% 0.99% 0.80% 0.84% $63.2 $62.3 $57.4 $50.2 $48.8 $57.9 $40.9 $40.1 $31.5 $30.0 3Q 2020 4Q 2020 1Q 2021 2Q 2021 3Q 2021 Net Income PPNR (Non-GAAP)* ROAA PPNR/Avg Assets (Non-GAAP)* Dollars in millions *Adjusted Pre-Provision Net Revenue and Adjusted Pre-Provision Net Revenue/Average Assets are non-GAAP financial measures. See slides 42 and 44 in the appendix for a 33 description of the exclusions and a reconciliation of these non-GAAP financial measures to GAAP.
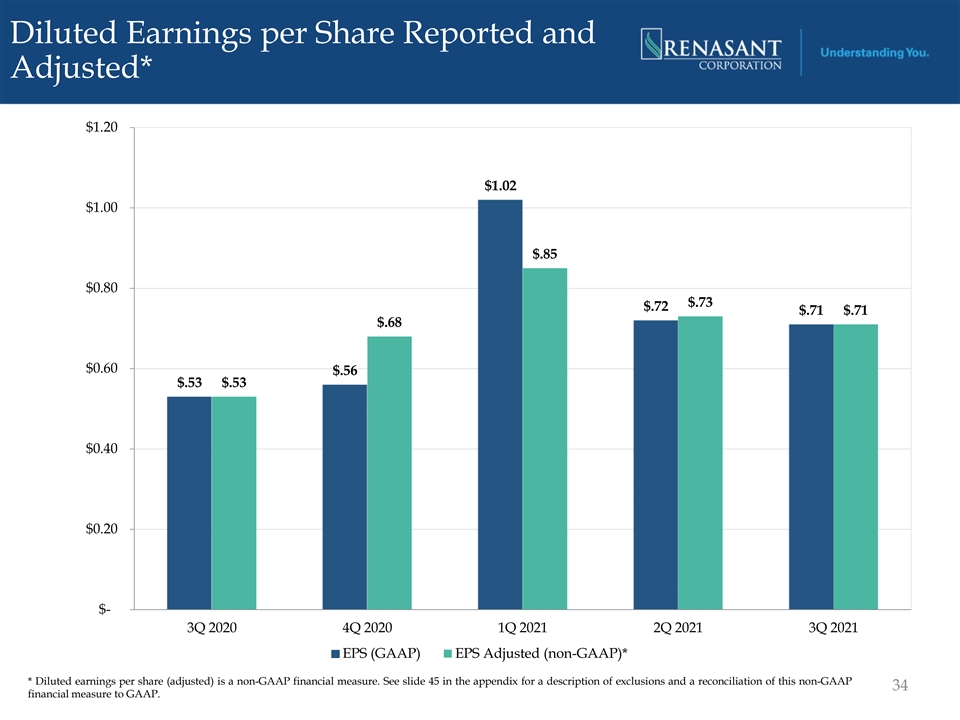
Diluted Earnings per Share Reported and Adjusted* $1.20 $1.02 $1.00 $.85 $0.80 $.73 $.72 $.71 $.71 $.68 $0.60 $.56 $.53 $.53 $0.40 $0.20 $- 3Q 2020 4Q 2020 1Q 2021 2Q 2021 3Q 2021 EPS (GAAP) EPS Adjusted (non-GAAP)* * Diluted earnings per share (adjusted) is a non-GAAP financial measure. See slide 45 in the appendix for a description of exclusions and a reconciliation of this non-GAAP 34 financial measure to GAAP.

Profitability Ratios Return on Average Assets (ROAA) Return on Average Equity (ROAE) 1.80% 18.00% 16.68% 1.60% 1.54% 16.00% 13.64% 13.52% 1.40% 14.00% 13.13% 1.29% 1.20% 12.00% 10.81% 10.81% 1.04% 1.04% 1.02% 0.99% 0.99% 1.00% 10.00% 0.84% 0.80% 0.79% 0.80% 8.00% 7.40% 7.16% 5.88% 5.63% 0.60% 6.00% 0.40% 4.00% 0.20% 2.00% 0.00% 0.00% 3Q 2020 4Q 2020 1Q 2021 2Q 2021 3Q 2021 3Q 2020 4Q 2020 1Q 2021 2Q 2021 3Q 2021 ROAA (GAAP) ROAA (Adjusted) (non-GAAP)* ROAE (GAAP) ROTCE (Adjusted) (non-GAAP)* * ROAA (Adjusted) and ROTCE (Adjusted) are non-GAAP financial measures. See slides 44 and 46 in the appendix for a description of the exclusions and a reconciliation 35 of these non-GAAP financial measures to GAAP.
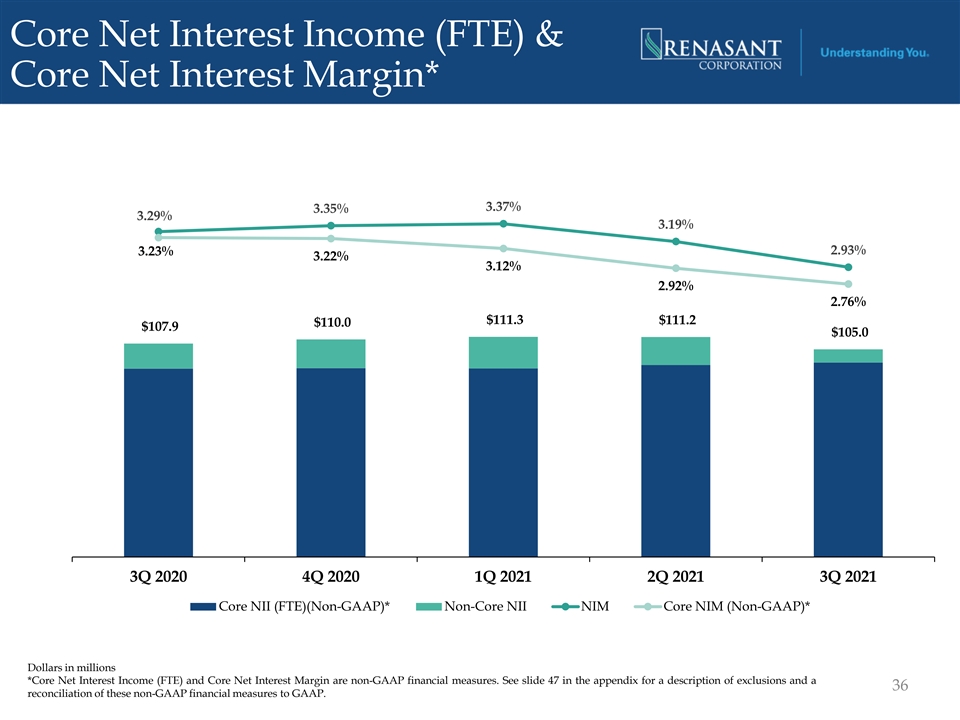
Core Net Interest Income (FTE) & Core Net Interest Margin* 3.37% 3.35% 3.29% 3.19% 2.93% 3.23% 3.22% 3.12% 2.92% 2.76% $111.3 $111.2 $110.0 $107.9 $105.0 3Q 2020 4Q 2020 1Q 2021 2Q 2021 3Q 2021 Core NII (FTE)(Non-GAAP)* Non-Core NII NIM Core NIM (Non-GAAP)* Dollars in millions *Core Net Interest Income (FTE) and Core Net Interest Margin are non-GAAP financial measures. See slide 47 in the appendix for a description of exclusions and a 36 reconciliation of these non-GAAP financial measures to GAAP.
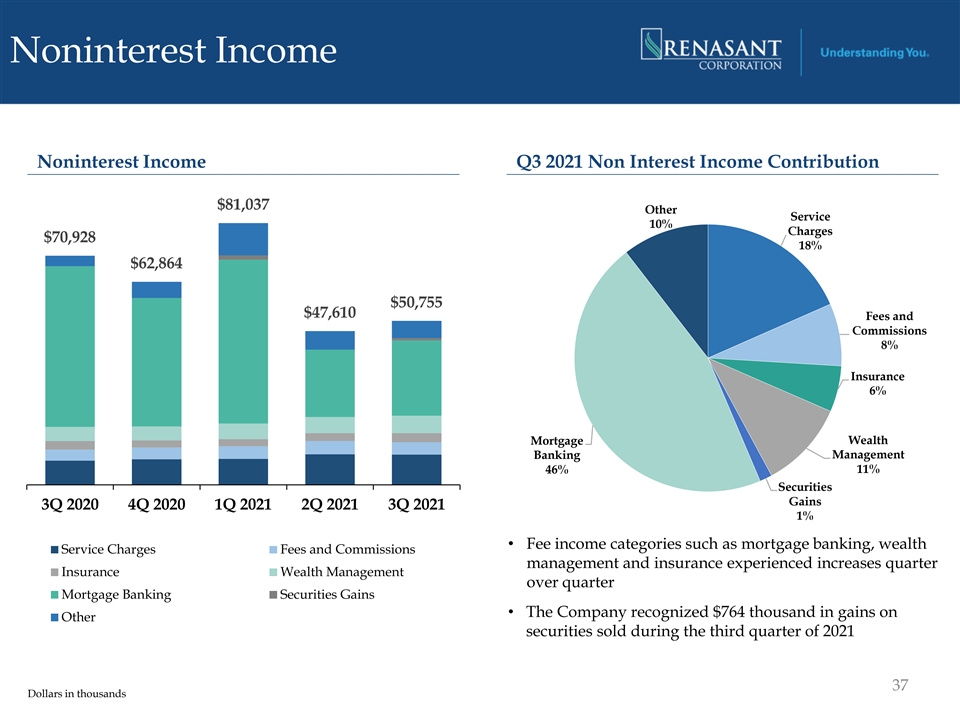
Noninterest Income Noninterest Income Q3 2021 Non Interest Income Contribution $81,037 Other Service 10% Charges $70,928 18% $62,864 $50,755 $47,610 Fees and Commissions 8% Insurance 6% Wealth Mortgage Banking Management 46% 11% Securities Gains 3Q 2020 4Q 2020 1Q 2021 2Q 2021 3Q 2021 1% • Fee income categories such as mortgage banking, wealth Service Charges Fees and Commissions management and insurance experienced increases quarter Insurance Wealth Management over quarter Mortgage Banking Securities Gains • The Company recognized $764 thousand in gains on Other securities sold during the third quarter of 2021 37 Dollars in thousands
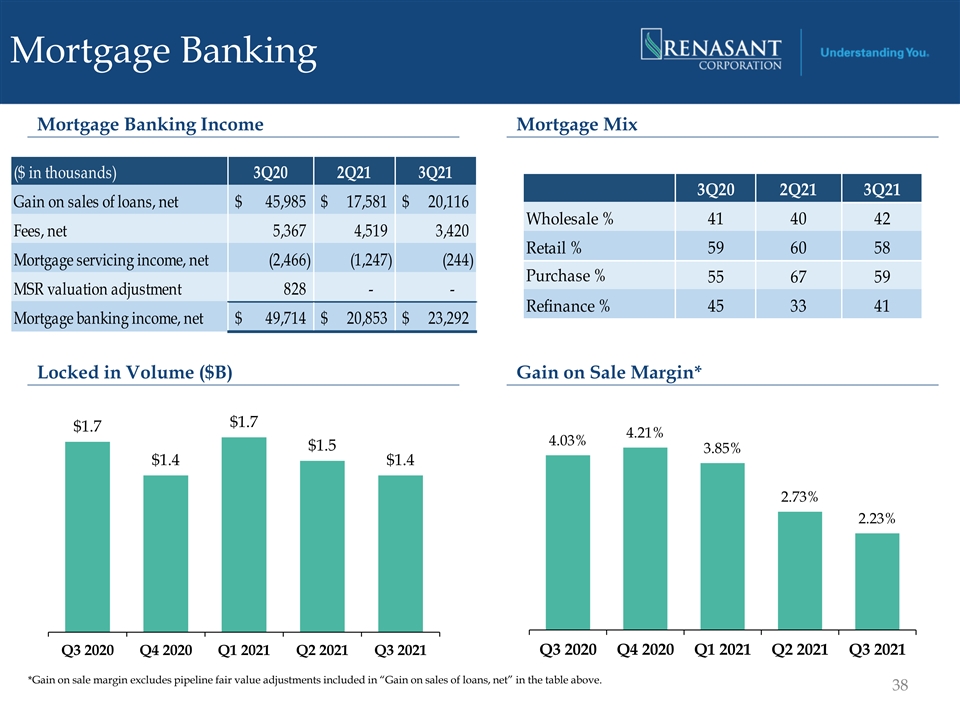
Mortgage Banking Mortgage Banking Income Mortgage Mix ($ in thousands) 3Q20 2Q21 3Q21 3Q20 2Q21 3Q21 Gain on sales of loans, net $ 45,985 $ 17,581 $ 20,116 Wholesale % 41 40 42 Fees, net 5,367 4,519 3,420 Retail % 59 60 58 Mortgage servicing income, net (2,466) (1,247) (244) Purchase % 55 67 59 MSR valuation adjustment 828 - - Refinance % 45 33 41 Mortgage banking income, net $ 4 9,714 $ 20,853 $ 23,292 Locked in Volume ($B) Gain on Sale Margin* $2 $1.7 $2 $1.7 4.21% 4.03% $1.5 $2 3.85% $1.4 $1.4 $1 $1 2.73% $1 2.23% $1 $1 $0 $0 $- Q3 2020 Q4 2020 Q1 2021 Q2 2021 Q3 2021 Q3 2020 Q4 2020 Q1 2021 Q2 2021 Q3 2021 *Gain on sale margin excludes pipeline fair value adjustments included in “Gain on sales of loans, net” in the table above. 38

Efficiency Ratio 71% 68% 67% 67% 66% 65% 64% 64% 63% 60% Q3 2020 Q4 2020 Q1 2021 Q2 2021 Q3 2021 Efficiency Ratio (GAAP) Adjusted Efficiency Ratio (non-GAAP)* *Adjusted Efficiency Ratio is a non-GAAP financial measure. See slide 49 in the appendix for a description of exclusions and a reconciliation of this non- 39 GAAP financial measure to GAAP.
Appendix
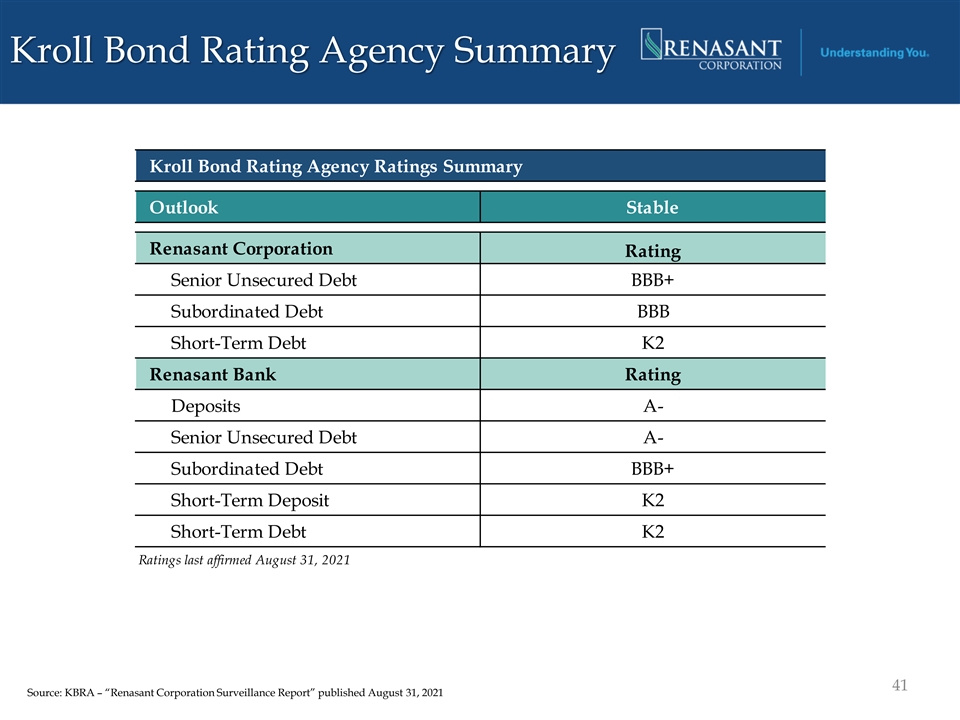
Kroll Bond Rating Agency Summary Kroll Bond Rating Agency Ratings Summary Outlook Stable Renasant Corporation Rating Senior Unsecured Debt BBB+ Subordinated Debt BBB Short-Term Debt K2 Renasant Bank Rating Deposits A- Senior Unsecured Debt A- Subordinated Debt BBB+ Short-Term Deposit K2 Short-Term Debt K2 Ratings last affirmed August 31, 2021 41 Source: KBRA – “Renasant Corporation Surveillance Report” published August 31, 2021

Reconciliation of Non-GAAP Disclosures Adjusted Pre-Provision Net Revenue $ in thousands 3Q 2020 4Q 2020 1Q 2021 2Q 2021 3Q 2021 Net income (GAAP) $ 29,992 $ 31,521 $ 57,908 $ 40,867 $ 40,063 Income taxes 7,612 6,818 16,842 7,545 11,185 Provision for credit losses (including unfunded commitments) 25,800 11,000 - - (1,400) Pre-provision net revenue (non-GAAP) $ 63,404 $ 49,339 $ 74,750 $ 48,412 $ 49,848 Debt prepayment penalties 28 3 - - - MSR valuation adjustment (828) (1,968) (13,561) - - Restructuring charges - 7,365 292 15 - Swap termination charges - 2,040 - - - (1) COVID-19 related expenses 570 613 785 370 323 Adjusted pre-provision net revenue (non-GAAP) $ 63,174 $ 57,392 $ 62,266 $ 48,797 $ 50,171 (1) Primarily consists of employee overtime and employee benefit accruals directly related to the response to the COVID-19 pandemic and federal legislation enacted to address the pandemic, such as the CARES Act, and expenses associated with supplying branches with protective equipment and sanitation supplies (such as floor 42 markings and cautionary signage for branches, face coverings and hand sanitizer) as well as more frequent and rigorous branch cleaning.
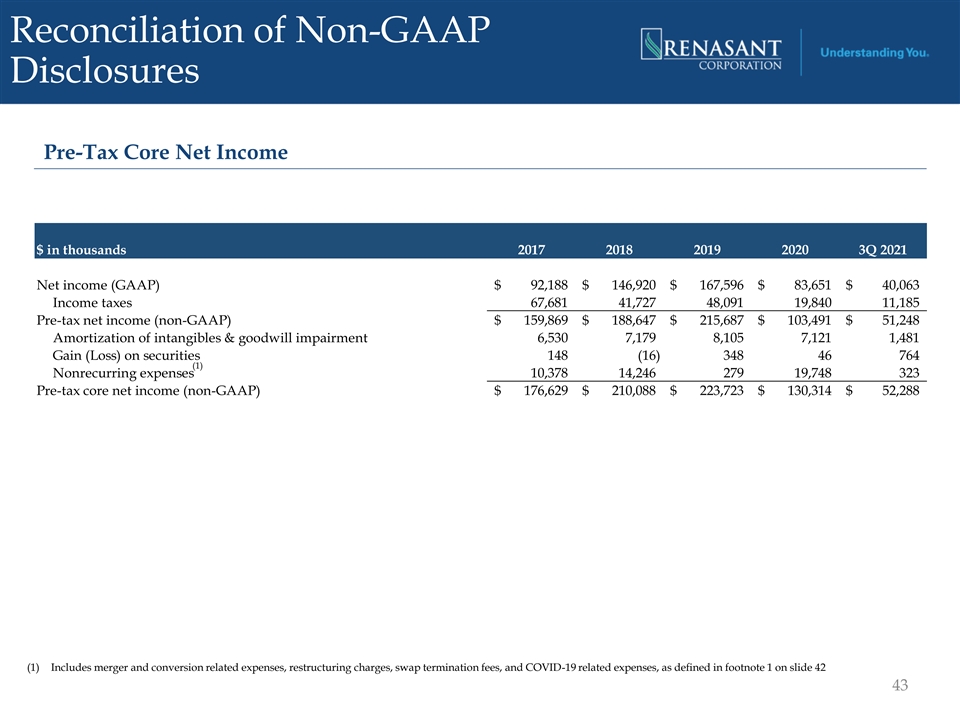
Reconciliation of Non-GAAP Disclosures Pre-Tax Core Net Income $ in thousands 2017 2018 2019 2020 3Q 2021 Net income (GAAP) $ 92,188 $ 146,920 $ 167,596 $ 83,651 $ 40,063 Income taxes 67,681 41,727 48,091 19,840 11,185 Pre-tax net income (non-GAAP) $ 159,869 $ 188,647 $ 215,687 $ 103,491 $ 51,248 Amortization of intangibles & goodwill impairment 6,530 7,179 8,105 7,121 1,481 Gain (Loss) on securities 148 (16) 348 46 764 (1) Nonrecurring expenses 10,378 14,246 279 19,748 323 Pre-tax core net income (non-GAAP) $ 176,629 $ 210,088 $ 223,723 $ 130,314 $ 52,288 (1) Includes merger and conversion related expenses, restructuring charges, swap termination fees, and COVID-19 related expenses, as defined in footnote 1 on slide 42 43

Reconciliation of Non-GAAP Disclosures Adjusted Pre-Provision Net Revenue / Average Assets $ in thousands 3Q 2020 4Q 2020 1Q 2021 2Q 2021 3Q 2021 Net income (GAAP) $ 29,992 $ 31,521 $ 57,908 $ 40,867 $ 40,063 Debt prepayment penalties 28 3 - - - MSR valuation adjustment (828) (1,968) (13,561) - - Restructuring charges - 7,365 292 15 - Swap termination charges - 2,040 - - - (1) COVID-19 related expenses 570 613 785 370 323 (2) Tax effect of adjustments noted above 50 (1,443) 2,820 (83) (71) Net income with exclusions (non-GAAP) $ 29,812 $ 38,131 $ 48,244 $ 41,169 $ 40,315 (3) Adjusted pre-provision net revenue (non-GAAP) $ 63,174 $ 57,392 $ 62,266 $ 48,796 $ 50,171 Total average assets $ 14,928,159 $ 14,898,055 $ 15,203,691 $ 15,831,018 $ 16,130,149 Return on Average Assets (GAAP) 0.80% 0.84% 1.54% 1.04% 0.99% Return on Average Assets (Adjusted) (non-GAAP) 0.79% 1.02% 1.29% 1.04% 0.99% Adjusted pre-provision net revenue/Average assets (non-GAAP) 1.68% 1.53% 1.66% 1.24% 1.23% (1) See footnote 1 on slide 42 for an explanation of the types of expenses included in the COVID-19 related expenses line item. (2) Tax effect is calculated based on the respective periods’ effective tax rate. 44 (3) See slide 42 for a reconciliation of Adjusted pre-provision net revenue.
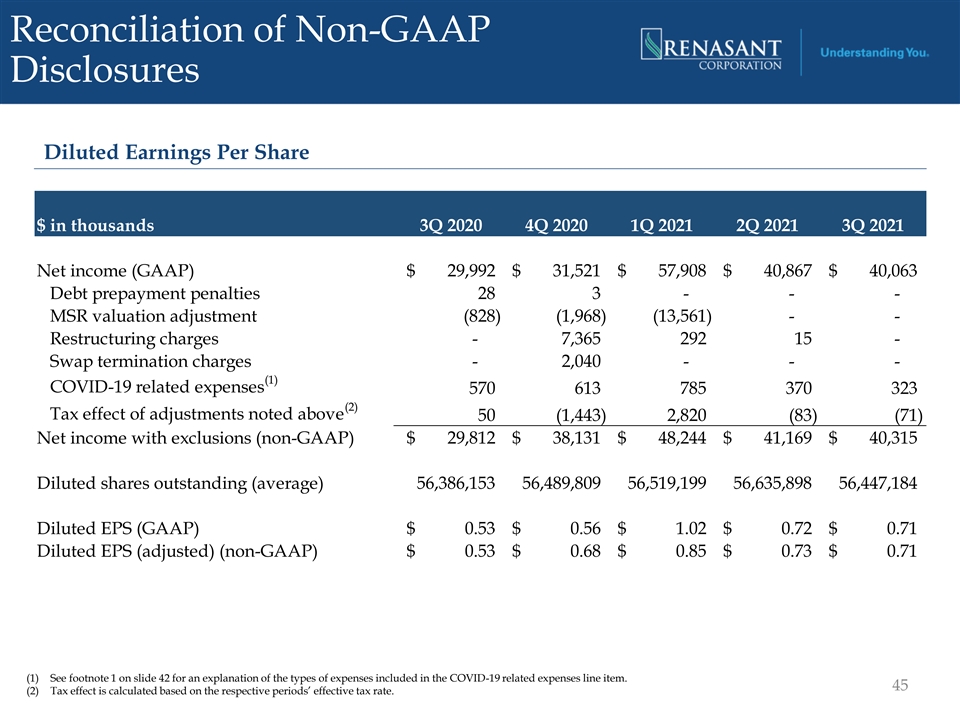
Reconciliation of Non-GAAP Disclosures Diluted Earnings Per Share $ in thousands 3Q 2020 4Q 2020 1Q 2021 2Q 2021 3Q 2021 Net income (GAAP) $ 29,992 $ 31,521 $ 57,908 $ 40,867 $ 40,063 Debt prepayment penalties 28 3 - - - MSR valuation adjustment (828) (1,968 ) (13,56 1) - - Restructuring charges - 7,365 292 15 - Swap termination charges - 2,040 - - - (1) COVID-19 related expenses 570 613 785 370 323 (2) Tax effect of adjustments noted above 50 (1,443) 2,820 (83) (71) Net income with exclusions (non-GAAP) $ 29,812 $ 38,131 $ 48,244 $ 41,169 $ 40,315 Diluted shares outstanding (average) 56,386,153 56,489,809 56,519,199 56,635,898 56,447,184 Diluted EPS (GAAP) $ 0.53 $ 0.56 $ 1.02 $ 0.72 $ 0.71 Diluted EPS (adjusted) (non-GAAP) $ 0.53 $ 0.68 $ 0.85 $ 0.73 $ 0.71 (1) See footnote 1 on slide 42 for an explanation of the types of expenses included in the COVID-19 related expenses line item. 45 (2) Tax effect is calculated based on the respective periods’ effective tax rate.
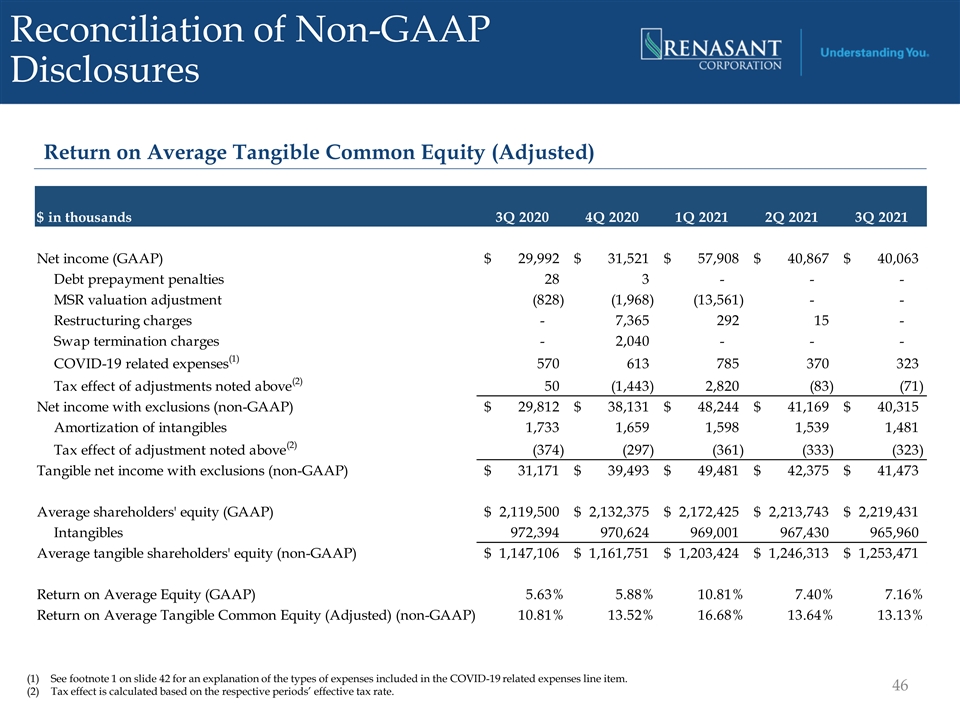
Reconciliation of Non-GAAP Disclosures Return on Average Tangible Common Equity (Adjusted) $ in thousands 3Q 2020 4Q 2020 1Q 2021 2Q 2021 3Q 2021 Net income (GAAP) $ 2 9,992 $ 3 1,521 $ 5 7,908 $ 4 0,867 $ 40,063 Debt prepayment penalties 28 3 - - - MSR valuation adjustment (828) (1,968) (13,561) - - Restructuring charges - 7,365 292 15 - Swap termination charges - 2,040 - - - (1) COVID-19 related expenses 570 613 785 370 323 (2) Tax effect of adjustments noted above 50 (1,443) 2,820 (83) (71) Net income with exclusions (non-GAAP) $ 29,812 $ 3 8,131 $ 48,244 $ 41,169 $ 40,315 Amortization of intangibles 1,733 1 ,659 1 ,598 1,539 1 ,481 (2) Tax effect of adjustment noted above (374) (297) (361) (333) (323) Tangible net income with exclusions (non-GAAP) $ 3 1,171 $ 3 9,493 $ 49,481 $ 42,375 $ 4 1,473 Average shareholders' equity (GAAP) $ 2 ,119,500 $ 2 ,132,375 $ 2,172,425 $ 2,213,743 $ 2,219,431 Intangibles 9 72,394 970,624 969,001 967,430 9 65,960 Average tangible shareholders' equity (non-GAAP) $ 1,147,106 $ 1,161,751 $ 1 ,203,424 $ 1,246,313 $ 1 ,253,471 Return on Average Equity (GAAP) 5.63% 5.88% 10.81% 7.40% 7.16% Return on Average Tangible Common Equity (Adjusted) (non-GAAP) 10.81% 13.52% 16.68% 13.64% 13.13% (1) See footnote 1 on slide 42 for an explanation of the types of expenses included in the COVID-19 related expenses line item. 46 (2) Tax effect is calculated based on the respective periods’ effective tax rate.
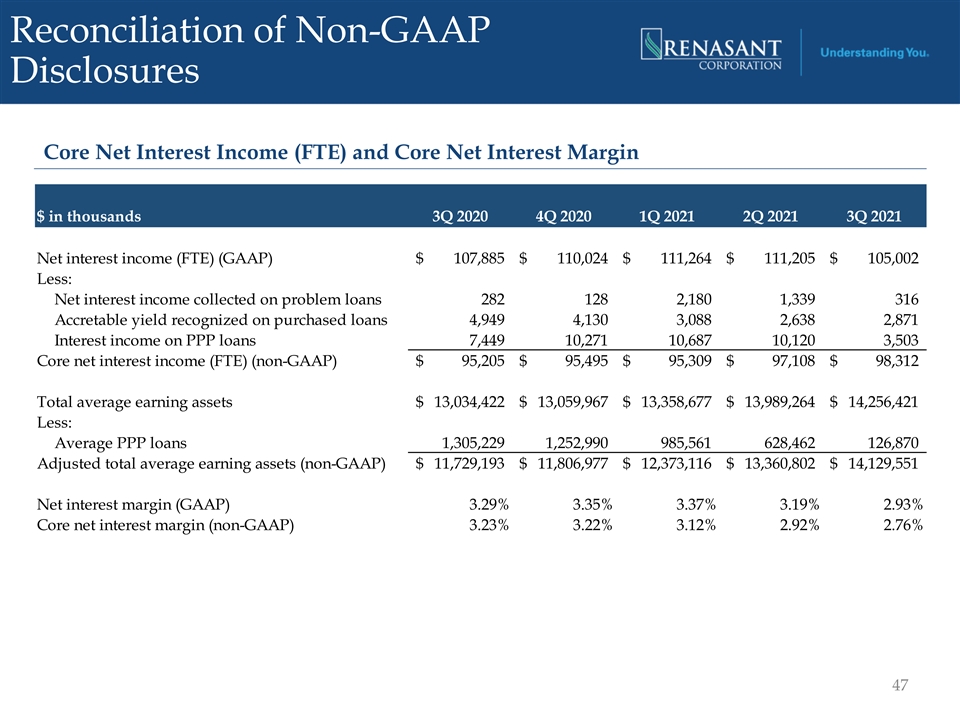
Reconciliation of Non-GAAP Disclosures Core Net Interest Income (FTE) and Core Net Interest Margin $ in thousands 3Q 2020 4Q 2020 1Q 2021 2Q 2021 3Q 2021 Net interest income (FTE) (GAAP) $ 107,885 $ 110,024 $ 111,264 $ 111,205 $ 105,002 Less: Net interest income collected on problem loans 282 128 2,180 1,339 316 Accretable yield recognized on purchased loans 4,949 4,130 3,088 2,638 2,871 Interest income on PPP loans 7,449 10,271 10,687 10,120 3,503 Core net interest income (FTE) (non-GAAP) $ 95,205 $ 95,495 $ 95,309 $ 97,108 $ 98,312 Total average earning assets $ 13,034,422 $ 13,059,967 $ 13,358,677 $ 13,989,264 $ 14,256,421 Less: Average PPP loans 1,305,229 1,252,990 985,561 628,462 126,870 Adjusted total average earning assets (non-GAAP) $ 11,729,193 $ 11,806,977 $ 12,373,116 $ 13,360,802 $ 14,129,551 Net interest margin (GAAP) 3.29% 3.35% 3.37% 3.19% 2.93% Core net interest margin (non-GAAP) 3.23% 3.22% 3.12% 2.92% 2.76% 47

Reconciliation of Non-GAAP Disclosures Core Loan Yield $ in thousands 3Q 2020 4Q 2020 1Q 2021 2Q 2021 3Q 2021 Loan interest income (FTE) (GAAP) $ 112,764 $ 113,457 $ 113,072 $ 110,785 $ 103,769 Less: Net interest income collected on problem loans 282 128 2,180 1,339 316 Accretable yield recognized on purchased loans 4,949 4,130 3,088 2,638 2,871 Interest income on PPP loans 7,449 10,271 10,687 10,120 3,503 Adjusted loan interest income (FTE) (non-GAAP) $ 100,084 $ 98,928 $ 97,117 $ 96,688 $ 97,079 Total average loans $ 11,041,684 $ 11,019,505 $ 10,802,991 $ 10,478,121 $ 10,017,742 Less: Average PPP loans 1,305,229 1,252,990 985,561 628,462 126,870 Adjusted total average loans (non-GAAP) $ 9,736,455 $ 9,766,515 $ 9,817,430 $ 9,849,659 $ 9,890,872 Loan yield (GAAP) 4.06% 4.10% 4.24% 4.24% 4.11% Core loan yield (non-GAAP) 4.09% 4.03% 4.01% 3.94% 3.89% 48
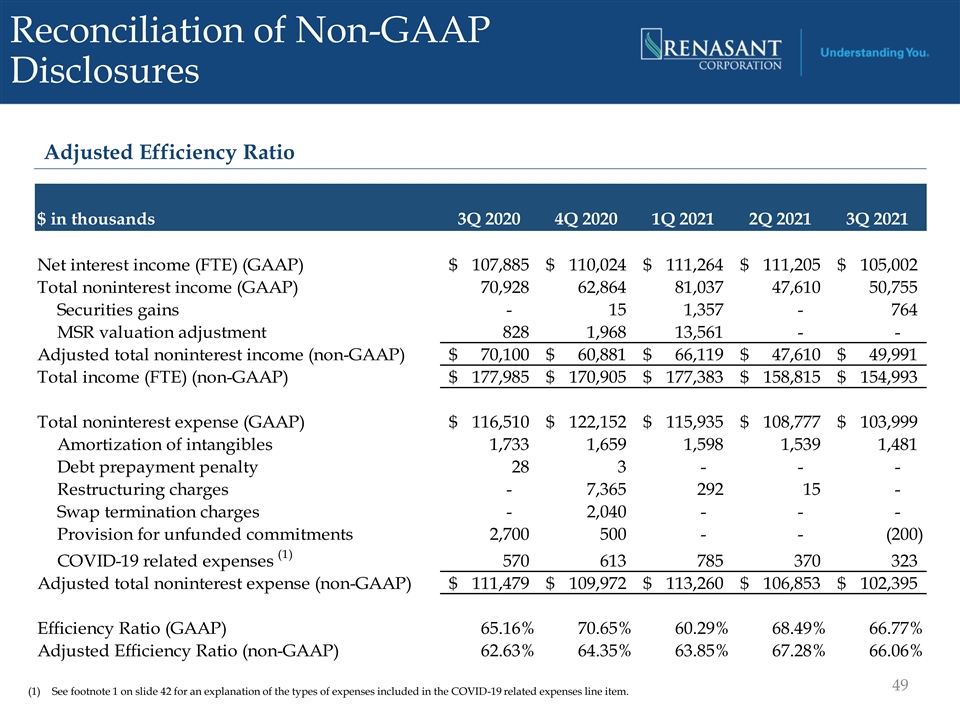
Reconciliation of Non-GAAP Disclosures Adjusted Efficiency Ratio $ in thousands 3Q 2020 4Q 2020 1Q 2021 2Q 2021 3Q 2021 Net interest income (FTE) (GAAP) $ 107,885 $ 110,024 $ 111,264 $ 111,205 $ 105,002 Total noninterest income (GAAP) 70,928 62,864 81,037 47,610 50,755 Securities gains - 15 1,357 - 764 MSR valuation adjustment 828 1,968 13,561 - - Adjusted total noninterest income (non-GAAP) $ 70,100 $ 60,881 $ 66,119 $ 47,610 $ 49,991 Total income (FTE) (non-GAAP) $ 177,985 $ 170,905 $ 177,383 $ 158,815 $ 154,993 Total noninterest expense (GAAP) $ 116,510 $ 122,152 $ 115,935 $ 108,777 $ 103,999 Amortization of intangibles 1,733 1,659 1,598 1,539 1,481 Debt prepayment penalty 28 3 - - - Restructuring charges - 7,365 292 15 - Swap termination charges - 2,040 - - - Provision for unfunded commitments 2,700 500 - - (200) (1) COVID-19 related expenses 570 613 785 370 323 Adjusted total noninterest expense (non-GAAP) $ 111,479 $ 109,972 $ 113,260 $ 106,853 $ 102,395 Efficiency Ratio (GAAP) 65.16% 70.65% 60.29% 68.49% 66.77% Adjusted Efficiency Ratio (non-GAAP) 62.63% 64.35% 63.85% 67.28% 66.06% 49 (1) See footnote 1 on slide 42 for an explanation of the types of expenses included in the COVID-19 related expenses line item.

Reconciliation of Non-GAAP Disclosures Tangible Common Equity and Tangible Book Value $ in thousands 3Q 2020 4Q 2020 1Q 2021 2Q 2021 3Q 2021 Actual shareholders' equity (GAAP) $ 2,104,300 $ 2,132,733 $ 2,173,701 $ 2,203,807 $ 2,203,944 Intangibles 971,481 969,823 968,225 966,686 965,205 Actual tangible shareholders' equity (non-GAAP) $ 1,132,819 $ 1,162,910 $ 1,205,476 $ 1,237,121 $ 1,238,739 Actual total assets (GAAP) $ 14,808,933 $ 14,929,612 $ 15,622,571 $ 16,022,386 $ 16,155,550 Intangibles 971,481 969,823 968,225 966,686 965,205 Actual tangible assets (non-GAAP) $ 13,837,452 $ 13,959,789 $ 14,654,346 $ 15,055,700 $ 15,190,345 PPP Loans 1,307,972 1,128,703 860,864 246,931 67,802 Actual tangible assets exc. PPP loans (non-GAAP) $ 12,529,480 $ 12,831,086 $ 13,793,482 $ 14,808,769 $ 15,122,543 Tangible Common Equity Ratio Shareholders' equity to (actual) assets (GAAP) 14.21% 14.29% 13.91% 13.75% 13.64% Effect of adjustment for intangible assets 6.02% 5.96% 5.68% 5.53% 5.49% Tangible common equity ratio (non-GAAP) 8.19% 8.33% 8.23% 8.22% 8.15% Effect of adjustment for PPP loans (0.85%) (0.73%) (0.51%) (0.13%) (0.04%) Tangible common equity ratio exc. PPP loans (non-GAAP) 9.04% 9.06% 8.74% 8.35% 8.19% Tangible Book Value Shares Outstanding 56,193,705 56,200,487 56,294,346 56,350,878 55,747,407 Book Value (GAAP) $ 37.45 $ 37.95 $ 38.61 $ 39.11 $ 39.53 Tangible Book Value (non-GAAP) $ 20.16 $ 20.69 $ 21.41 $ 21.95 $ 22.22 50

Reconciliation of Non-GAAP Disclosures Asset Quality Ratios (Excluding PPP Loans) $ in thousands Q3 2020 Q4 2020 1Q 2021 2Q 2021 3Q 2021 Total loans (GAAP) $ 11,084,738 $ 10,933,647 $ 10,688,408 $ 10,149,242 $ 10,016,824 Less: PPP loans 1,307,972 1,128,703 860,864 246,931 67,462 Adjusted total loans (non-GAAP) $ 9,776,766 $ 9,804,944 $ 9,827,544 $ 9,902,311 $ 9,949,362 Loans 30-89 Days Past Due 16,644 26,286 21,801 15,077 14,806 Loans 30-89 Days Past Due / Total Loans 0.15% 0.24% 0.20% 0.15% 0.15% 0.17% 0.27% 0.22% 0.15% 0.15% Loans 30-89 Days Past Due / Total Loans excluding PPP loans (non-GAAP) Classified Loans 219,583 236,062 229,244 206,724 187,223 Classified Loans / Total Loans 1.98% 2.16% 2.14% 2.04% 1.87% Classified Loans / Total Loans excluding PPP loans (non-GAAP) 2.25% 2.41% 2.33% 2.09% 1.88% Nonperforming Loans 45,796 55,470 56,105 56,536 56,740 Nonperforming Loans / Total Loans 0.41% 0.51% 0.52% 0.56% 0.57% Nonperforming Loans / Total Loans excluding PPP loans (non-GAAP) 0.47% 0.57% 0.57% 0.57% 0.57% Allowance for Credit Losses on Loans 168,098 176,144 173,106 172,354 170,038 ACL / Total Loans 1.52% 1.61% 1.62% 1.70% 1.70% ACL / Total Loans excluding PPP loans (non-GAAP) 1.72% 1.80% 1.76% 1.74% 1.71% 51

Reconciliation of Non-GAAP Disclosures Asset Quality Ratios (Excluding PPP Loans), continued $ in thousands Q3 2020 Q4 2020 Q1 2021 Q2 2021 Q3 2021 Total average loans (GAAP) $ 11,041,684 $ 11,019,505 $ 10,802,991 $ 10,478,121 $ 10,017,742 Less: Average PPP loans 1,305,229 1,252,990 985,561 628,462 126,870 Adjusted total average loans (non-GAAP) $ 9,736,455 $ 9,766,515 $ 9,817,430 $ 9,849,659 $ 9,890,872 Total assets (GAAP) $ 14,808,933 $ 14,929,612 $ 15,622,571 $ 16,022,386 $ 16,155,550 Less: PPP loans 1,307,972 1,128,703 860,864 246,931 67,462 Adjusted total assets (non-GAAP) $ 13,500,961 $ 13,800,909 $ 14,761,707 $ 15,775,455 $ 16,088,088 Nonperforming Assets 53,948 61,442 62,076 61,475 61,445 Nonperforming Assets / Total Assets 0.36% 0.41% 0.40% 0.38% 0.38% Nonperforming Assets / Total Assets excluding PPP loans (non-GAAP) 0.40% 0.45% 0.42% 0.39% 0.38% Net charge-offs 389 954 3,038 752 1,116 Annualized Net charge-offs / Average Loans 0.01% 0.03% 0.11% 0.03% 0.04% Annualized Net charge-offs / Average Loans excluding PPP loans (non-GAAP) 0.02% 0.04% 0.13% 0.03% 0.04% 52

53


