
ENTERGY STATISTICAL REPORT
AND INVESTOR GUIDE
2009
At Entergy, we are adaptable in our pursuit of growth and relentless
in our drive to safely deliver clean, reliable, and affordable power
to our customers. These are among the strengths of our organization.
We deliberately apply Entergy’s distinctive strengths to overcome external challenges
and advance steadily toward our long-term aspirations. We have assembled
the statistics and facts in this report to support your review and analysis of Entergy’s
results over the last five years. This information is available in electronic
form, with Excel spreadsheets, in order to facilitate easier access and analysis.
Entergy Investor Relations
Entergy Corporation is an integrated energy company engaged primarily in electric
power production and retail distribution operations. Entergy owns and operates power
plants with approximately 30,000 megawatts of electric generating capacity, and it is
the second-largest nuclear generator in the United States. Entergy delivers electricity to
2.7 million utility customers in Arkansas, Louisiana, Mississippi and Texas. Entergy has
annual revenues of more than $10 billion and more than 15,000 employees.
| | | | | | |
| TABLE OF CONTENTS | | | | Note: The Excel Tab labels correspond to the page numbers in the PDF version of the 2009 Statistical Report. |
| | | Excel Tab | | | | Excel Tab |
| | | |
ABOUT THIS PUBLICATION | | Page 2 | | UTILITY SECURITIES DETAIL | | Page 31 |
FORWARD-LOOKING INFORMATION | | Page 2 | | Utility Long-Term Debt and Preferred Stock | | Page 31 |
FINANCIAL MEASURES | | Page 2 | | Entergy Arkansas, Inc. | | Page 31 |
ENTERGY AT A GLANCE | | Pages 3 – 4 | | Entergy Gulf States Louisiana, L.L.C. | | Page 32 |
EXECUTIVE PROFILES | | Pages 5 – 6 | | Entergy Louisiana, LLC | | Page 33 |
| | | | Entergy Mississippi, Inc. | | Page 34 |
ENTERGY CORPORATION AND SUBSIDIARIES | | | | Entergy New Orleans, Inc. | | Page 34 |
Selected Financial and Operating Data | | Page 7 | | Entergy Texas, Inc. | | Page 35 |
Selected Financial Data | | Page 7 | | System Energy Resources, Inc. | | Page 35 |
Utility Electric Operating Data | | Page 7 | | UTILITY STATISTICAL INFORMATION | | Page 36 |
Employees | | Page 7 | | Utility Total Capability | | Page 36 |
Owned and Leased Capability | | Page 7 | | Utility Selected Operating Data | | Page 36 |
Consolidated Quarterly Financial Metrics | | Page 8 | | Utility Consolidating Information | | Page 37 |
Consolidated Annual Financial Metrics | | Page 8 | | Entergy Arkansas, Inc. | | Pages 38 – 39 |
Consolidated Financial Results | | Page 9 | | Entergy Gulf States Louisiana, L.L.C. | | Pages 40 |
Consolidated Quarterly Results | | Page 9 | | Entergy Texas, Inc. | | Pages 41 |
Consolidated Quarterly Special Items | | Page 10 | | Entergy Louisiana, LLC | | Pages 43 – 44 |
Consolidated Annual Results | | Page 11 | | Entergy Mississippi, Inc. | | Pages 45 – 46 |
Consolidated Annual Special Items | | Page 12 | | Entergy New Orleans, Inc. | | Pages 47 – 48 |
Description of Special Items | | Page 13 | | System Energy Resources, Inc. | | Page 48 |
Consolidated Statements of Income | | Page 14 | | Utility Nuclear Plant Statistics | | Page 49 |
Consolidating Income Statement | | Page 15 | | UTILITY REGULATORY INFORMATION | | Page 50 |
Consolidated Balance Sheets | | Pages 16 – 17 | | Regulatory Commissions | | Page 50 |
Consolidating Balance Sheet | | Pages 18 – 19 | | Commission/Council Members | | Page 50 |
Consolidated Statements of Cash Flow | | Pages 20 – 21 | | Select Utility Regulatory Mechanisms | | Page 51 |
Cash Flow Information by Business | | Page 21 | | Utility Electric and Gas Fuel Recovery Mechanisms | | Page 52 |
Consolidated Statements of Retained Earnings, Comprehensive Income and Paid–In Capital | | Page 22 | | | | |
| | | COMPETITIVE BUSINESSES | | |
Consolidated Capital Expenditures | | Page 23 | | Total Capacity | | Page 53 |
Entergy Corporation Securities Detail | | Page 23 | | | | |
Entergy Corporation Long-Term Debt | | Page 23 | | ENTERGY NUCLEAR (NON-UTILITY) | | |
Securities Ratings (Outlook) | | Page 23 | | Entergy Nuclear Quarterly Financial Metrics | | Page 53 |
| | | | Entergy Nuclear Annual Financial Metrics | | Page 53 |
UTILITY | | | | Entergy Nuclear Quarterly Operational Metrics | | Page 53 |
Utility Quarterly Financial Metrics | | Page 24 | | Entergy Nuclear Annual Operational Metrics | | Page 53 |
Utility Annual Financial Metrics | | Page 24 | | Entergy Nuclear Plant Statistics | | Page 54 |
Utility Capital Expenditures | | Page 24 | | Entergy Nuclear Plant Uprates | | Page 54 |
Utility Securities Ratings (Outlook) | | Page 24 | | Entergy Nuclear Securities Detail | | Page 55 |
Utility Financial Results | | Page 25 | | | | |
Utility/Parent/Other Consolidating Income Statement | | Page 25 | | NON-NUCLEAR WHOLESALE ASSETS | | |
| | | Non-Nuclear Wholesale Assets Plant Statistics | | Page 55 |
Utility/Parent/Other Consolidating Balance Sheet | | Pages 26 – 27 | | Non-Nuclear Wholesale Assets Securities Detail | | Page 55 |
Utility Selected Annual Financial Metrics | | Pages 28 – 30 | | | | |
| | | | DEFINITIONS OF OPERATIONAL MEASURES AND GAAP AND NON-GAAP FINANCIAL MEASURES | | Page 56 |
| | | | REG G RECONCILIATIONS | | |
| | | |
| | | | Pro Forma Financial Results | | Pages 57 – 65 |
| | | | Financial Measures | | Pages 66 – 76 |
| | | |
| | | | INVESTOR INFORMATION | | Page 77 |
Table of Contents
ABOUT THIS PUBLICATION
This publication is unaudited and should be used in conjunction with Entergy’s 2009 Annual Report to Shareholders and Form 10-K filed with the Securities and Exchange Commission. It has been prepared for information purposes and is not intended for use in connection with any sale or purchase of, or any offer to buy, any securities of Entergy Corporation or its subsidiaries.
FORWARD-LOOKING INFORMATION
In this report and from time to time, Entergy Corporation makes statements concerning its expectations, beliefs, plans, objectives, goals, strategies, and future events or performance. Such statements are “forward-looking statements” within the meaning of the Private Securities Litigation Reform Act of 1995. Words such as “may,” “will,” “could,” “project,” “believe,” “anticipate,” “intend,” “expect,” “estimate,” “continue,” “potential,” “plan,” “predict,” “forecast,” and other similar words or expressions are intended to identify forward-looking statements but are not the only means to identify these statements. Although Entergy believes that these forward-looking statements and the underlying assumptions are reasonable, it cannot provide assurance that they will prove correct. Any forward-looking statement is based on information current as of the date of this report and speaks only as of the date on which such statement is made. Except to the extent required by the federal securities laws, Entergy undertakes no obligation to publicly update or revise any forward-looking statements, whether as a result of new information, future events, or otherwise.
Forward-looking statements involve a number of risks and uncertainties. There are factors that could cause actual results to differ materially from those expressed or implied in the forward-looking statements, including those factors discussed or incorporated by reference in (a) Item 1A. Risk Factors in the 2009 Form 10-K, (b) Management’s Financial Discussion and Analysis in the 2009 Form 10-K, and (c) the following factors (in addition to others described elsewhere in this report and in subsequent securities filings):
— resolution of pending and future rate cases and negotiations, including various performance-based rate discussions and other regulatory proceedings, including those related to Entergy’s System Agreement, Entergy’s utility supply plan, recovery of storm costs, and recovery of fuel and purchased power costs
— changes in utility regulation, including the beginning or end of retail and wholesale competition, the ability to recover net utility assets and other potential stranded costs, the operations of the independent coordinator of transmission for Entergy’s utility service territory, and the application of more stringent transmission reliability requirements or market power criteria by the Federal Energy Regulatory Commission (FERC)
— changes in regulation of nuclear generating facilities and nuclear materials and fuel, including possible shutdown of nuclear generating facilities, particularly those owned or operated by the Non-Utility Nuclear business
— resolution of pending or future applications for license renewals or modifications of nuclear generating facilities
— the performance of and deliverability of power from Entergy’s generation resources, including the capacity factors at its nuclear generating facilities
— Entergy’s ability to develop and execute on a point of view regarding future prices of electricity, natural gas, and other energy-related commodities
— prices for power generated by Entergy’s merchant generating facilities, the ability to hedge, sell power forward or otherwise reduce the market price risk associated with those facilities, including the Non-Utility Nuclear plants, and the prices and availability of fuel and power Entergy must purchase for its Utility customers, and Entergy’s ability to meet credit support requirements for fuel and power supply contracts
— volatility and changes in markets for electricity, natural gas, uranium, and other energy-related commodities
— changes in law resulting from federal or state energy legislation or legislation subjecting energy derivatives used in hedging and risk management transactions to governmental regulation
— changes in environmental, tax, and other laws, including requirements for reduced emissions of sulfur, nitrogen, carbon, mercury, and other substances, and changes in costs of compliance with environmental and other laws and regulation
— uncertainty regarding the establishment of interim or permanent sites for spent nuclear fuel and nuclear waste storage and disposal
— variations in weather and the occurrence of hurricanes and other storms and disasters, including uncertainties associated with efforts to remediate the effects of hurricanes and ice storms (including most recently, Hurricane Gustav and Hurricane Ike in 2008 and the January 2009 ice storm in Arkansas) and recovery of costs associated with restoration, including accessing funded storm reserves, federal and local cost recovery mechanisms, securitization, and insurance
— effects of climate change, and environmental and other regulatory obligations intended to compel reductions in carbon dioxide emissions
— Entergy’s ability to manage its capital projects and operation and maintenance costs
— Entergy’s ability to purchase and sell assets at attractive prices and on other attractive terms
— the economic climate, and particularly economic conditions in Entergy’s Utility service territory and the Northeast United States
— the effects of Entergy’s strategies to reduce tax payments
— changes in the financial markets, particularly those affecting the availability of capital and Entergy’s ability to refinance existing debt, execute share repurchase programs, and fund investments and acquisitions
— actions of rating agencies, including changes in the ratings of debt and preferred stock, changes in general corporate ratings, and changes in the rating agencies’ ratings criteria
— changes in inflation and interest rates
— the effect of litigation and government investigations or proceedings
— advances in technology
— the potential effects of threatened or actual terrorism and war
— Entergy’s ability to attract and retain talented management and directors
— changes in accounting standards and corporate governance
— declines in the market prices of marketable securities and resulting funding requirements for Entergy’s defined benefit pension and other postretirement benefit plans
— changes in decommissioning trust fund values or earnings or in the timing of or cost to decommission nuclear plant sites
— the ability to successfully complete merger, acquisition, or divestiture plans, regulatory or other limitations imposed as a result of merger, acquisition, or divestiture, and the success of the business following a merger, acquisition, or divestiture
— risks and uncertainties associated with unwinding the business infrastructure associated with the contemplated Non-Utility Nuclear spin-off, joint venture and related transactions.
FINANCIAL MEASURES
Financial performance measures shown in this report include those calculated and presented in accordance with generally accepted accounting principles (GAAP), as well as those that are considered non-GAAP measures. This report includes non-GAAP measures of operational earnings, operational return on average invested capital, operational return on average common or members’ equity, operational net margin, operational price to earnings ratio and operational common dividend payout ratio, as well as gross liquidity, net debt to net capital, net debt to net capital with off-balance sheet liabilities, pro forma financial results reflecting reconsolidation of Entergy New Orleans, Inc., and pro forma financial results and financial measures (average common equity, return on average common equity, debt to capital ratio, cash flow interest coverage) reflecting the jurisdictional separation of Entergy Gulf States, Inc. into Entergy Gulf States Louisiana, L.L.C. and Entergy Texas, Inc., when describing Entergy’s results of operations and financial performance. We have prepared reconciliations of these measures to the most directly comparable GAAP measures. Reconciliations can be found on pages 9, 11, and 57 – 76.
2
ENTERGY AT A GLANCE
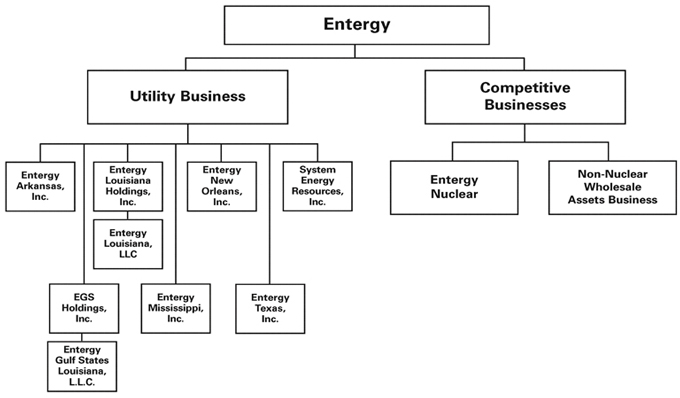
CORPORATE STRUCTURE
| | | | |
| CORPORATE PROFILE | | | | BUSINESS SEGMENTS |
| Entergy Corporation is a Fortune 500 integrated energy company engaged primarily in electric power production and retail distribution operations. | | | | Entergy’s five year results in this report are presented in three business segments: |
| — Approximately 30,000 MW electric generating capacity | | | | — Utility |
| — 2nd-largest U.S. nuclear generator | | | | — Entergy Nuclear (non-utility nuclear business) |
| — 2.7 million utility customers | | | | — Non-Nuclear Wholesale Assets Business |
| — More than $10 billion annual revenues | | | | |
| — More than 15,000 employees | | | | Entergy Nuclear and the Non-Nuclear Wholesale Assets Business |
| — 102 electric generating units operated | | | | are referred to as Entergy’s Competitive Businesses. |
3
ENTERGY CORPORATION AND SUBSIDIARIES
BUSINESS SEGMENTS (CONTINUED)
UTILITY
Entergy’s utility companies generate, transmit, distribute, and sell electric power, and operate a small natural gas distribution business.
— Six electric utilities with 2.7 million customers
— Four states – Arkansas, Louisiana, Mississippi, Texas
— 22,000 MW generating capacity
— Two gas utilities with 188,000 customers
ENTERGY ARKANSAS, INC. (EAI)
Entergy Arkansas generates, transmits, distributes, and sells electric power to 689,000 retail customers in portions of Arkansas.
ENTERGY GULF STATES LOUISIANA, L.L.C. (EGSL)(a)
Entergy Gulf States Louisiana generates, transmits, distributes, and sells electric power to 379,000 retail customers in portions of Louisiana. Entergy Gulf States Louisiana also provides natural gas utility service to 92,000 customers in the Baton Rouge, Louisiana area.
ENTERGY LOUISIANA, LLC (ELL)
Entergy Louisiana generates, transmits, distributes, and sells electric power to 663,000 retail customers in portions of Louisiana.
ENTERGY MISSISSIPPI, INC. (EMI)
Entergy Mississippi generates, transmits, distributes, and sells electric power to 435,000 retail customers in portions of Mississippi.
ENTERGY NEW ORLEANS, INC. (ENOI)(b)
Entergy New Orleans generates, transmits, distributes, and sells electric power to 150,000 retail customers in the city of New Orleans, Louisiana. Entergy New Orleans also provides natural gas utility service to 96,000 customers in the city of New Orleans.
ENTERGY TEXAS, INC. (ETI)(a)
Entergy Texas generates, transmits, distributes, and sells electric power to 403,000 retail customers in portions of Texas.
SYSTEM ENERGY RESOURCES, INC. (SERI)
System Energy owns or leases 90 percent of the Grand Gulf 1 nuclear generating facility. System Energy sells power and capacity from Grand Gulf 1 at wholesale to Entergy Arkansas, Entergy Louisiana, Entergy Mississippi, and Entergy New Orleans.
UTILITY NUCLEAR PLANTS
Entergy owns and operates five nuclear units at four plant sites to serve its regulated utility business: Arkansas Nuclear One (ANO) Units 1 and 2 near Russellville, Arkansas; Grand Gulf Nuclear Station in Port Gibson, Mississippi; River Bend Station in St. Francisville, Louisiana; and Waterford 3 in Taft, Louisiana.
| (a) | Effective December 31, 2007, Entergy Gulf States, Inc. completed a jurisdictional separation into two vertically integrated utility companies, one operating under the sole retail jurisdiction of the PUCT, Entergy Texas, Inc., and the other operating under the sole retail jurisdiction of the LPSC, Entergy Gulf States Louisiana, L.L.C., Entergy Gulf States Louisiana, L.L.C. is the successor for financial reporting purposes to Entergy Gulf States, Inc. |
| (b) | On September 23, 2005, Entergy New Orleans filed a voluntary petition for reorganization under Chapter 11 of the U.S. Bankruptcy Code to protect customers and ensure continued progress in restoring power and gas service to New Orleans after Hurricane Katrina. As a result of the bankruptcy filing, Entergy discontinued the consolidation of Entergy New Orleans retroactive to January 1, 2005. Entergy New Orleans emerged from Chapter 11 bankruptcy effective May 8, 2007, pursuant to the Confirmation Order from the Bankruptcy Court confirming Entergy New Orleans’ Plan of Reorganization. With confirmation of the plan of reorganization, Entergy reconsolidated Entergy New Orleans in the second quarter its 2007, retroactive to January 1, 2007. |
ENTERGY NUCLEAR
Entergy’s non-utility nuclear business owns and operates six nuclear units in the northern United States. This business is primarily focused on selling power produced by those plants to wholesale customers. This business also provides operations and management services to nuclear power plants owned by other utilities in the United States.
— Six units in northern U.S.
— Pilgrim Nuclear Station in Plymouth, Massachusetts
— James A. FitzPatrick in Oswego, New York
— Indian Point Units 2 and 3 in Buchanan, New York
— Vermont Yankee in Vernon, Vermont
— Palisades Nuclear Energy Plant in South Haven, Michigan
— 4,998 MW owned generating capacity
— 800 MW under management services contract
— Cooper Nuclear Station located near Brownville, Nebraska
— Contracts (ongoing and completed) with other nuclear owners to manage decommissioning for 2 plants and license renewal for 6 plants
NON-NUCLEAR WHOLESALE ASSETS BUSINESS
Entergy’s Non-Nuclear Wholesale Assets business sells to wholesale customers the electric power produced by power plants that it owns or controls (1,353 net MW generating capacity) while it focuses on improving performance and exploring sales or restructuring opportunities for its power plants. Such opportunities are evaluated consistent with Entergy’s market-based point of view.
4
ENTERGY CORPORATION AND SUBSIDIARIES
EXECUTIVE PROFILES
WAYNE LEONARD – CHAIRMAN AND CHIEF EXECUTIVE OFFICER
Wayne Leonard became Entergy’s chairman and chief executive officer on August 1, 2006 after serving as chief executive officer since January 1, 1999. Leonard joined Entergy in April 1998 as president and chief operating officer of the company’s domestic business, and he assumed additional responsibility for international operations in August 1998. Under Leonard, Entergy has achieved the highest total shareholder return in the industry over the last 11 years. In 2009, for the eighth consecutive year, Entergy was named to the Dow Jones Sustainability World Index and one of only two U.S. utilities listed.Institutional Investor magazine recently ranked Leonard the top CEO in the power industry and Entergy the top electric utility in the country. In 2008, Entergy received a Platts Award of Excellence for its standout performance year after year over the past decade. In 2002 and 2005 Entergy was honored to receive the electric power industry’s highest honor, the Edison Award, from the Edison Electric Institute. The Platts Global Energy Awards named Leonard 2003 CEO of the Year and Leonard has been a CEO of the Year finalist for the past nine consecutive years. Prior to joining Entergy, Leonard was president of Cinergy’s Energy Commodities Strategic Business Unit and president of Cinergy Capital Trading.
LEO DENAULT – EXECUTIVE VICE PRESIDENT AND CHIEF FINANCIAL OFFICER
Leo Denault became executive vice president and chief financial officer in February 2004. He was previously vice president of corporate development and strategic planning. Denault joined Entergy in March 1999 as vice president, corporate development. Denault assumed responsibility for the areas of strategic planning, the Office of the Chief Risk Officer, and strategic pricing and transmission services in 2002. Prior to joining Entergy, Denault was vice president of corporate development at Cinergy Corporation, where he reviewed every major investment transaction, including the acquisition of generation, distribution and trading businesses in the United States and abroad.
ROD WEST – EXECUTIVE VICE PRESIDENT AND CHIEF ADMINISTRATIVE OFFICER
Rod West was named executive vice president and chief administrative officer for Entergy in June 2010. West is responsible for the legal, human resources and administration, and external affairs departments. West’s appointment was part of a company reorganization that was designed to enhance organizational effectiveness and performance and better meet the needs of customers. He previously served as president and chief executive officer of Entergy New Orleans, Inc. after serving as director of Entergy New Orleans’ metro distribution operations. West’s primary responsibility during 2006 was restoring New Orleans’ electric distribution system after the devastation brought by Hurricane Katrina. Prior to joining Entergy in April 1999 as senior regulatory counsel, West was senior attorney in the New Orleans office of Vial, Hamilton, Koch and Knox, L.L.P., having previously spent five years with the New Orleans-based firm of Jones, Walker, Waechter, Poitevent, Carrere & Denegre, L.L.P.
RICHARD SMITH – PRESIDENT, ENTERGY WHOLESALE COMMODITY BUSINESS
Rick Smith was named president of Entergy’s wholesale commodity business unit in June 2010. The new organization is aimed at strengthening local regulatory presence in the Northeast and consolidating commercial and risk functions for Entergy’s wholesale commodity business associated with non-utility generation. Smith previously served as president and chief operating officer from April 2007 until June 2010. Prior to being named president and COO, Smith was group president of utility operations. Smith joined Entergy in September 1999 as senior vice president, transition management and later served as president of retail operations. Prior to joining Entergy, Smith was president of Cinergy Resources, Inc., a non-regulated retail supply business. Prior to that, he served for three years as vice president of finance for Cinergy’s Energy Services business unit.
GARY TAYLOR – GROUP PRESIDENT, UTILITY OPERATIONS
Gary Taylor became group president, utility operations in April 2007. He is responsible for the regulated utility financial results, along with operational results of electric and natural gas distribution and customer service. In addition, Taylor oversees utility regulatory support and regulated retail activities. He joined Entergy in March 2000 as chief operating officer of Entergy’s Nuclear South region and became chief executive officer of Entergy’s nuclear business in April 2003. Prior to joining Entergy, Taylor had been vice president of nuclear operations at South Carolina Electric & Gas Company, a subsidiary of SCANA Corporation, since 1995.
MARK SAVOFF – CHIEF OPERATING OFFICER
Mark Savoff was named chief operating officer in June 2010. Savoff is responsible for nuclear operations as well as the business operations of fossil generation, transmission operations, system safety and environment, supply chain, system planning, and performance management. He is also responsible for three key initiatives: safety, compliance, environmental policy, generation portfolio transformation and Entergy Continuous Improvement. Prior to being named COO, Savoff served as executive vice president of operations, a position he held since joining the company in December 2003. Prior to joining Entergy, Savoff was vice president and corporate officer at GE Power Systems, Nuclear Energy. Before assuming his role as vice president, Nuclear Energy, he was General Manager of GE’s global nuclear fuel business and led the turnaround of GE’s global nuclear services business. He also served as president, Reuter-Stokes, a GE subsidiary.
JOHN HERRON – PRESIDENT, CEO & CHIEF NUCLEAR OFFICER OF ENTERGY NUCLEAR
John Herron became president, CEO, and chief nuclear officer of Entergy Nuclear in December 2009. He is responsible for all of Entergy’s nuclear plants located throughout New York, Massachusetts, Vermont, Michigan, Louisiana, Mississippi and Arkansas, as well as management of the Cooper Nuclear Station for the State of Nebraska. Herron was previously senior vice president for nuclear operations. Herron joined Entergy in 2001 as vice president, operations at Waterford 3. He then moved to New York as senior vice president of Indian Point in February 2002. Herron began his career in nuclear operations in 1979 at Vermont Yankee. In 1994, he became plant manager at Cooper Nuclear Station. He then joined Tennessee Valley Authority as plant manager at Sequoyah Nuclear Plant and then site vice president at TVA’s Browns Ferry Nuclear Plant.
5
ENTERGY CORPORATION AND SUBSIDIARIES
EXECUTIVE PROFILES (CONTINUED)
ROBERT SLOAN – EXECUTIVE VICE PRESIDENT,
GENERAL COUNSEL AND SECRETARY
Robert Sloan joined Entergy in 2003. Before joining Entergy, Sloan was vice president and general counsel at GE Industrial Systems. Prior to his role at GE Industrial Systems, Sloan was a managing partner in the Brussels office of McKenna and Cuneo LLP. Sloan was previously vice president and director of the Sovereign Credit Management Division at the First National Bank of Chicago and later a partner with the Pepper, Hamilton & Sheetz law firm in Washington, D.C. He also was general counsel of the Multinational Force and Observers. Sloan also worked on nuclear non-proliferation and politico-military matters in the U.S. State Department’s Office of Legal Adviser. Prior to this position, he was general counsel to the Minority at the U. S. Senate Permanent Subcommittee on Investigations.
TERRY SEAMONS Ph.D. – SENIOR VICE PRESIDENT, HUMAN RESOURCES AND ADMINISTRATION
Terry Seamons joined Entergy in 2007, bringing a wealth of experience from RHR International, a management consulting firm specializing in linking managerial effectiveness, organizational performance and business strategy. He holds a doctorate in psychology. His expertise includes individual and group assessment and development with a particular emphasis on team development. His work at RHR took him to Europe, South America and all over Asia, and he has designed and conducted cross-national team sessions in Europe and Japan. Seamons has experience working with organizations in industries including utilities, banking, insurance, retail, manufacturing, chemical, education and government.
RENAE CONLEY – EXECUTIVE VICE PRESIDENT DESIGNATE, HUMAN RESOURCES AND ADMINISTRATION
Renae Conley was named executive vice president, human resources and administration in June 2010, becoming effective in 2011. She will assist Seamons, senior vice president, human resources and administration, until the transition is complete and he retires at the end of 2011. She had previously served as president and chief executive officer of Entergy’s Louisiana utilities between 2000 and 2010. Entergy Louisiana and Entergy Gulf States Louisiana together serve over one million customers, and comprise the largest electric utility in the state. Prior to joining Entergy in 1999 as vice president of investor relations, Conley was president of Cincinnati Gas & Electric Company, a subsidiary of Cinergy Corp. Conley also served as president and CEO of Cadence, a joint venture of Cinergy and other utilities that provides energy management services. At Cinergy, Conley was also general manager of corporate communications and investor relations.
ENTERGY CORPORATION AND SUBSIDIARIES
UTILITY OPERATING COMPANY PRESIDENTS
JOE DOMINO – PRESIDENT & CEO, ENTERGY TEXAS
Joe Domino became president and CEO of Entergy Texas in 1998. He is responsible for Entergy Texas’ electric distribution system, customer service, economic development, regulatory and governmental affairs. Prior to being named president, he served as director of Entergy’s distribution operations in Texas and Southwest Louisiana. Domino joined Gulf States Utilities in 1970 as a planning engineer and was appointed director of Southern Region fossil plants in 1994.
HALEY FISACKERLY – PRESIDENT & CEO, ENTERGY MISSISSIPPI
Haley Fisackerly became president and CEO of Entergy Mississippi in June 2008. He is responsible for Entergy Mississippi’s electric distribution system, customer service, economic development, regulatory and governmental affairs. Prior to being named president, Fisackerly was vice president of governmental and regulatory affairs for Entergy Nuclear. Prior to that, he was Entergy Mississippi’s vice president of customer operations. Fisackerly joined Entergy in 1995 in federal governmental affairs in Washington D.C. and later moved to Little Rock, AR, where he was director of system regulatory strategy. Prior to joining Entergy, Fisackerly served for several years on the staff of U.S. Senator Thad Cochran.
HUGH McDONALD – PRESIDENT & CEO, ENTERGY ARKANSAS
Hugh McDonald became president and CEO of Entergy Arkansas in 2000. He is responsible for Entergy Arkansas’ electric distribution system, customer service, economic development, regulatory and governmental affairs. Prior to becoming Entergy Arkansas’ president, he led Entergy’s Retail Operations. McDonald joined Entergy in 1982 at the Waterford 3 nuclear plant. In 1989, he became executive assistant to the chairman of Entergy Louisiana / Entergy New Orleans and then led Entergy Louisiana’s Total Quality initiative until 1993. During Entergy’s merger with Gulf States Utilities, McDonald served as special projects director for the integration of the transmission, distribution, and customer service organizations. McDonald has also held the positions of division manager, Entergy Mississippi and director of regulatory affairs, Entergy Texas.
BILL MOHL – PRESIDENT & CEO, ENTERGY LOUISIANA LLC AND ENTERGY GULF STATES LOUISIANA L.L.C.
Bill Mohl became president and CEO of Entergy Louisiana and Entergy Gulf States Louisiana in June 2010. He is responsible for the Louisiana utilities’ electric and gas distribution systems, customer service, economic development, regulatory and governmental affairs. Mohl was previously vice president, system planning and operations. Mohl joined Entergy in 2002 where he was responsible for the procurement of all limited- and long-term fuel and generation resources and in 2007 added responsibility for system planning and operations. Mohl began his career at Public Service Company of Colorado, now an affiliate of Xcel Energy, before moving to Koch Industries where he held a number of leadership roles in various gas and power businesses.
CHARLES RICE – PRESIDENT & CEO, ENTERGY NEW ORLEANS
Charles Rice became president and CEO of Entergy New Orleans in June 2010. He is responsible for Entergy New Orleans’ electric distribution system, customer service, economic development, regulatory and governmental affairs. Rice was previously director, regulatory affairs. After his first legal private practice position in Louisiana with Jones, Walker, Waechter, Poitevent, Carrere & Denegre, L.L.P, Rice joined Entergy’s legal department in 2000 as senior counsel and then as manager of labor relations litigation support in human resources. Rice was recruited into New Orleans city government in 2002 as the city attorney and later took the role of chief administrative officer for the City of New Orleans In 2005, Barrasso, Usdin, Kupperman, Freeman & Sarver, L.L.C. recruited him back to private practice, where he was named partner. Returning to Entergy in 2009, Rice served as director of utility strategy. He then served as director of regulatory affairs for Entergy New Orleans.
6
SELECTED FINANCIAL AND OPERATING DATA
SELECTED FINANCIAL DATA
| | | | | | | | | | | | | | | | | | | |
| (In millions, except percentages, per share amounts, and ratios) | | 2009 | | | 2008 | | | 2007 | | | 2006(a) | | 2005(a) | |
GAAP MEASURES | | | | | | | | | | | | | | | | | | | |
Operating Revenues | | $ | 10,746 | | | $ | 13,094 | | | $ | 11,484 | | | $ | 10,932 | | $ | 10,106 | |
As-Reported Net Income | | $ | 1,231 | | | $ | 1,221 | | | $ | 1,135 | | | $ | 1,133 | | $ | 898 | |
As-Reported Earnings Per Share | | $ | 6.30 | | | $ | 6.20 | | | $ | 5.60 | | | $ | 5.36 | | $ | 4.19 | |
Shares of Common Stock Outstanding: | | | | | | | | | | | | | | | | | | | |
End of Year | | | 189.1 | | | | 189.4 | | | | 193.1 | | | | 202.7 | | | 207.5 | |
Weighted Average – Diluted | | | 195.8 | | | | 201.0 | | | | 202.8 | | | | 211.5 | | | 214.4 | |
Return on Average Invested Capital – As-Reported | | | 7.7% | | | | 8.1% | | | | 8.3% | | | | 8.5% | | | 7.2% | |
Return on Average Common Equity – As-Reported | | | 14.9% | | | | 15.4% | | | | 14.1% | | | | 14.2% | | | 11.2% | |
Net Cash Flow Provided by Operating Activities | | $ | 2,933 | | | $ | 3,324 | | | $ | 2,560 | | | $ | 3,448 | | $ | 1,468 | |
Year-End Closing Market Price Per Share of Common Stock | | $ | 81.84 | | | $ | 83.13 | | | $ | 119.52 | | | $ | 92.32 | | $ | 68.65 | |
Book Value Per Share at End of Year | | $ | 45.54 | | | $ | 42.07 | | | $ | 40.71 | | | $ | 40.45 | | $ | 37.31 | |
Market Value of Equity at End of Year | | $ | 15,477 | | | $ | 15,741 | | | $ | 23,082 | | | $ | 18,710 | | $ | 14,247 | |
Price to Earnings Ratio – As-Reported | | | 12.99 | | | | 13.41 | | | | 21.34 | | | | 17.24 | | | 16.39 | |
Common Dividend Paid Per Share | | $ | 3.00 | | | $ | 3.00 | | | $ | 2.58 | | | $ | 2.16 | | $ | 2.16 | |
Common Dividend Payout Ratio – As-Reported | | | 48% | | | | 48% | | | | 46% | | | | 40% | | | 52% | |
| | | | | |
NON-GAAP MEASURES | | | | | | | | | | | | | | | | | | | |
Operational Earnings | | $ | 1,302 | | | $ | 1,276 | | | $ | 1,167 | | | $ | 998 | | $ | 943 | |
Operational Earnings Per Share | | $ | 6.67 | | | $ | 6.51 | | | $ | 5.76 | | | $ | 4.72 | | $ | 4.40 | |
Special Items Per Share | | $ | (0.37 | ) | | $ | (0.31 | ) | | $ | (0.16 | ) | | $ | 0.64 | | $ | (0.21 | ) |
Return on Average Invested Capital – Operational | | | 8.1% | | | | 8.4% | | | | 8.5% | | | | 7.7% | | | 7.5% | |
Return on Average Common Equity – Operational | | | 15.7% | | | | 16.1% | | | | 14.5% | | | | 12.5% | | | 11.8% | |
Price to Earnings Ratio – Operational | | | 12.27 | | | | 12.77 | | | | 20.75 | | | | 19.56 | | | 15.61 | |
Common Dividend Payout Ratio – Operational | | | 45% | | | | 46% | | | | 45% | | | | 46% | | | 49% | |
| | | | | | | | | | | | | | | | | | | | |
(a) 2006 and 2005 reflect deconsolidation of Entergy New Orleans, Inc. UTILITY ELECTRIC OPERATING DATA(a) | | | | | | | | | | | | | | | | | | | |
| | | 2009 | | | 2008 | | | 2007 | | | 2006 | | 2005 | |
Retail Kilowatt-Hour Sales (millions) | | | 99,148 | | | | 100,609 | | | | 102,013 | | | | 100,422 | | | 99,865 | |
Peak Demand (megawatts) | | | 21,009 | | | | 21,241 | | | | 22,001 | | | | 20,887 | | | 21,391 | |
Retail Customers – Year End (thousands) | | | 2,719 | | | | 2,689 | | | | 2,668 | | | | 2,595 | | | 2,629 | |
| | | | | | | | | | | | | | | | | | | | |
(a) Includes Entergy New Orleans, Inc. | | | | | | | | | | | | | | | | | | | |
EMPLOYEES | | | | | | | | | | | | | | | | | | | |
| | | 2009 | | | 2008 | | | 2007 | | | 2006 | | 2005 | |
| | | | | |
Total Employees – Year End | | | 15,181 | | | | 14,669 | | | | 14,322 | | | | 13,814 | | | 14,136 | |
| | | | | | | | | | | | | | | | | | | | |
OWNED AND LEASED CAPABILITY (MW)(a)
| | | | | | | | | | | | | | | | | | | | |
| | | Entergy
Arkansas | | Entergy
Gulf States
Louisiana | | Entergy
Louisiana | | Entergy
Mississippi | | Entergy
New Orleans | | Entergy
Texas | | System
Energy | | Entergy
Nuclear(c) | | Non-
Nuclear
Wholesale(d) | | Total |
Gas/Oil | | 1,682 | | 1,988 | | 4,693 | | 2,803 | | 745 | | 2,274 | | - | | - | | 1,092 | | 15,277 |
Coal | | 1,208 | | 363 | | - | | 420 | | - | | 269 | | - | | - | | 181 | | 2,441 |
| | | | | | | | | | | | | | | | | | | | | |
Total Fossil | | 2,890 | | 2,351 | | 4,693 | | 3,223 | | 745 | | 2,543 | | - | | - | | 1,273 | | 17,718 |
| | | | | | | | | | | | | | | | | | | | | |
Nuclear | | 1,839 | | 978 | | 1,176 | | - | | - | | - | | 1,133 | | 4,998 | | - | | 10,124 |
Other(b) | | 70 | | - | | - | | - | | - | | - | | - | | - | | 80 | | 150 |
| | | | | | | | | | | | | | | | | | | | | |
Total | | 4,799 | | 3,329 | | 5,869 | | 3,223 | | 745 | | 2,543 | | 1,133 | | 4,998 | | 1,353 | | 27,992 |
| | | | | | | | | | | | | | | | | | | | | |
| (a) | Owned and Leased Capability is the dependable load carrying capability as demonstrated under actual operating conditions based on the primary fuel (assuming no curtailments) that each station was designed to utilize. |
| (b) | Other includes Hydro and Wind. |
| (c) | Reflects Net MW in Operation. Net MW in Operation is the installed capacity owned and operated. |
| (d) | Reflects nameplate rating of generating unit. |
7
CONSOLIDATED ENTERGY CORPORATION AND SUBSIDIARIES DATA
CONSOLIDATED QUARTERLY FINANCIAL METRICS
| | | | | | | | | | | | | | | | | | | | | | | |
| | | 2009 | | 2008 | | YTD % CHANGE | |
| | | 1Q | | 2Q | | 3Q | | 4Q | | YTD | | 1Q | | 2Q | | 3Q | | 4Q | | YTD | |
GAAP MEASURES | | | | | | | | | | | | | | | | | | | | | | | |
As-Reported Net Income ($ millions) | | 235.3 | | 226.8 | | 455.2 | | 313.8 | | 1,231.1 | | 308.7 | | 271.0 | | 470.3 | | 170.6 | | 1,220.6 | | 0.9 | |
Return on Average Invested Capital – As-Reported (%)* | | 7.6 | | 7.5 | | 7.1 | | 7.7 | | 7.7 | | 8.8 | | 8.6 | | 8.1 | | 8.1 | | 8.1 | | (4.9 | ) |
Return on Average Common Equity – As-Reported (%)* | | 14.1 | | 13.7 | | 13.2 | | 14.9 | | 14.9 | | 15.9 | | 16.3 | | 15.6 | | 15.4 | | 15.4 | | (3.3 | ) |
Net Margin – As-Reported (%)* | | 8.8 | | 9.0 | | 9.7 | | 11.5 | | 11.5 | | 10.6 | | 10.2 | | 9.7 | | 9.3 | | 9.3 | | 23.7 | |
Cash Flow Interest Coverage (# times)* | | 6.5 | | 6.7 | | 5.5 | | 6.1 | | 6.1 | | 4.9 | | 5.0 | | 7.0 | | 6.5 | | 6.5 | | (6.2 | ) |
Revolver Capacity ($ millions) | | 725 | | 1,585 | | 1,647 | | 1,464 | | 1,464 | | 1,503 | | 826 | | 374 | | 645 | | 645 | | 127.0 | |
Total Debt ($ millions) | | 12,034 | | 11,510 | | 11,522 | | 12,014 | | 12,014 | | 11,292 | | 11,768 | | 12,656 | | 12,279 | | 12,279 | | (2.2 | ) |
Debt to Capital Ratio (%) | | 57.4 | | 55.9 | | 56.7 | | 57.4 | | 57.4 | | 58.6 | | 60.7 | | 60.4 | | 59.7 | | 59.7 | | (3.9 | ) |
Debt to Capital Ratio, Excluding Securitization Debt (%) | | 56.7 | | 55.3 | | 56.1 | | 55.6 | | 55.6 | | 57.9 | | 60.0 | | 59.8 | | 59.1 | | 59.1 | | (5.9 | ) |
Off-Balance Sheet Liabilities ($ millions) | | 573 | | 569 | | 567 | | 646 | | 646 | | 642 | | 638 | | 637 | | 574 | | 574 | | 12.5 | |
| | | | | | | | | | | |
NON-GAAP MEASURES | | | | | | | | | | | | | | | | | | | | | | | |
Operational Earnings ($ millions) | | 252.5 | | 244.0 | | 470.7 | | 334.9 | | 1,302.1 | | 308.7 | | 289.2 | | 487.3 | | 190.7 | | 1,275.9 | | 2.1 | |
Return on Average Invested Capital – Operational (%)* | | 8.0 | | 7.8 | | 7.5 | | 8.1 | | 8.1 | | 9.0 | | 8.8 | | 8.4 | | 8.4 | | 8.4 | | (3.6 | ) |
Return on Average Common Equity – Operational (%)* | | 15.0 | | 14.6 | | 14.1 | | 15.7 | | 15.7 | | 16.3 | | 17.0 | | 16.4 | | 16.1 | | 16.1 | | (2.5 | ) |
Net Margin – Operational (%)* | | 9.4 | | 9.6 | | 10.3 | | 12.1 | | 12.1 | | 10.8 | | 10.6 | | 10.2 | | 9.7 | | 9.7 | | 24.7 | |
Total Gross Liquidity ($ millions) | | 2,528 | | 2,866 | | 2,778 | | 3,174 | | 3,174 | | 2,419 | | 1,912 | | 2,930 | | 2,565 | | 2,565 | | 23.7 | |
Net Debt to Net Capital Ratio, Excluding Securitization Debt (%) | | 52.6 | | 52.2 | | 53.4 | | 51.5 | | 51.5 | | 55.7 | | 57.6 | | 54.1 | | 54.8 | | 54.8 | | (6.0 | ) |
Net Debt to Net Capital Ratio Including Off-Balance Sheet Liabilities, Excluding Securitization Debt (%) | | 54.0 | | 53.6 | | 54.8 | | 53.1 | | 53.1 | | 57.2 | | 59.0 | | 55.7 | | 56.2 | | 56.2 | | (5.5 | ) |
| | | | | | | | | | | | | | | | | | | | | | | | |
| * | Rolling twelve months. Totals may not foot due to rounding. |
CONSOLIDATED ANNUAL FINANCIAL METRICS
| | | | | | | | | | |
| | | 2009 | | 2008 | | 2007 | | 2006(a) | | 2005(a) |
GAAP MEASURES | | | | | | | | | | |
As-Reported Net Income ($ millions) | | 1,231 | | 1,221 | | 1,135 | | 1,133 | | 898 |
Return on Average Invested Capital – As-Reported (%) | | 7.7 | | 8.1 | | 8.3 | | 8.5 | | 7.2 |
Return on Average Common Equity – As-Reported (%) | | 14.9 | | 15.4 | | 14.1 | | 14.2 | | 11.2 |
Net Margin – As-Reported (%) | | 11.5 | | 9.3 | | 9.9 | | 10.4 | | 8.9 |
Cash Flow Interest Coverage (# times) | | 6.1 | | 6.5 | | 5.0 | | 7.2 | | 4.0 |
Revolver Capacity ($ millions) | | 1,464 | | 645 | | 1,730 | | 2,770 | | 2,545 |
Total Debt ($ millions) | | 12,014 | | 12,279 | | 11,123 | | 9,356 | | 9,288 |
Debt to Capital Ratio (%) | | 57.4 | | 59.7 | | 57.6 | | 52.3 | | 53.1 |
Debt to Capital Ratio, Excluding Securitization Debt (%) | | 55.6 | | 59.1 | | 56.9 | | 52.3 | | 53.1 |
Off-Balance Sheet Liabilities ($ millions) | | | | | | | | | | |
Debt of Joint Ventures – Entergy’s Share | | 116 | | 125 | | 135 | | 146 | | 214 |
Leases – Entergy’s Share | | 530 | | 449 | | 523 | | 519 | | 564 |
| | | | | | | | | | | |
Total | | 646 | | 574 | | 658 | | 665 | | 778 |
| | | | | |
NON-GAAP MEASURES | | | | | | | | | | |
Operational Earnings ($ millions) | | 1,302 | | 1,276 | | 1,167 | | 998 | | 943 |
Return on Average Invested Capital – Operational (%) | | 8.1 | | 8.4 | | 8.5 | | 7.7 | | 7.5 |
Return on Average Common Equity – Operational (%) | | 15.7 | | 16.1 | | 14.5 | | 12.5 | | 11.8 |
Net Margin – Operational (%) | | 12.1 | | 9.7 | | 10.2 | | 9.1 | | 9.3 |
Total Gross Liquidity ($ millions) | | 3,174 | | 2,565 | | 2,984 | | 3,786 | | 3,128 |
Net Debt to Net Capital Ratio, Excluding Securitization Debt (%) | | 51.5 | | 54.8 | | 53.9 | | 49.4 | | 51.5 |
Net Debt to Net Capital Ratio Including Off-Balance Sheet | | | | | | | | | | |
Liabilities, Excluding Securitization Debt (%) | | 53.1 | | 56.2 | | 55.5 | | 51.3 | | 53.7 |
| | | | | | | | | | | |
| (a) | 2006 and 2005 reflect deconsolidation of Entergy New Orleans, Inc. |
8
FINANCIAL RESULTS
ENTERGY CORPORATION CONSOLIDATED QUARTERLY RESULTS – GAAP TO NON-GAAP RECONCILIATION
| | | | | | | | | | | | | | | | | | | | | | | | | | | | | | | | | |
| | | 2009 | | | 2008 | | | YTD CHANGE | |
| ($/share) | | 1Q | | | 2Q | | | 3Q | | | 4Q | | | YTD | | | 1Q | | | 2Q | | | 3Q | | | 4Q | | | YTD | | |
AS-REPORTED | | | | | | | | | | | | | | | | | | | | | | | | | | | | | | | | | |
Utility/Parent/Other | | 0.32 | | | 0.68 | | | 1.32 | | | 0.56 | | | 2.88 | | | 0.48 | | | 0.62 | | | 1.47 | | | (0.38 | ) | | 2.22 | | | 0.66 | |
| | | | | | | | | | | | | | | | | | | | | | | | | | | | | | | | | | |
Competitive Businesses | | | | | | | | | | | | | | | | | | | | | | | | | | | | | | | | | |
Entergy Nuclear | | 0.91 | | | 0.40 | | | 1.02 | | | 0.89 | | | 3.22 | | | 1.12 | | | 0.73 | | | 1.05 | | | 1.14 | | | 3.97 | | | (0.75 | ) |
Non-Nuclear Wholesale Assets | | (0.03 | ) | | 0.06 | | | (0.02 | ) | | 0.19 | | | 0.20 | | | (0.04 | ) | | 0.02 | | | (0.11 | ) | | 0.13 | | | 0.01 | | | 0.19 | |
| | | | | | | | | | | | | | | | | | | | | | | | | | | | | | | | | | |
Total Competitive Businesses | | 0.88 | | | 0.46 | | | 1.00 | | | 1.08 | | | 3.42 | | | 1.08 | | | 0.75 | | | 0.94 | | | 1.27 | | | 3.98 | | | (0.56 | ) |
| | | | | | | | | | | | | | | | | | | | | | | | | | | | | | | | | | |
CONSOLIDATED AS-REPORTED EARNINGS | | 1.20 | | | 1.14 | | | 2.32 | | | 1.64 | | | 6.30 | | | 1.56 | | | 1.37 | | | 2.41 | | | 0.89 | | | 6.20 | | | 0.10 | |
| | | | | | | | | | | |
LESS SPECIAL ITEMS | | | | | | | | | | | | | | | | | | | | | | | | | | | | | | | | | |
Utility/Parent/Other | | (0.05 | ) | | (0.01 | ) | | (0.03 | ) | | (0.05 | ) | | (0.14 | ) | | - | | | (0.09 | ) | | (0.09 | ) | | (0.05 | ) | | (0.21 | ) | | 0.07 | |
| | | | | | | | | | | | | | | | | | | | | | | | | | | | | | | | | | |
Competitive Businesses | | | | | | | | | | | | | | | | | | | | | | | | | | | | | | | | | |
Entergy Nuclear | | (0.04 | ) | | (0.08 | ) | | (0.05 | ) | | (0.06 | ) | | (0.23 | ) | | - | | | - | | | - | | | (0.04 | ) | | (0.10 | ) | | (0.13 | ) |
Non-Nuclear Wholesale Assets | | - | | | - | | | - | | | - | | | - | | | - | | | - | | | - | | | (0.01 | ) | | - | | | - | |
| | | | | | | | | | | | | | | | | | | | | | | | | | | | | | | | | | |
Total Competitive Businesses | | (0.04 | ) | | (0.08 | ) | | (0.05 | ) | | (0.06 | ) | | (0.23 | ) | | - | | | - | | | - | | | (0.05 | ) | | (0.10 | ) | | (0.13 | ) |
| | | | | | | | | | | | | | | | | | | | | | | | | | | | | | | | | | |
TOTAL SPECIAL ITEMS | | (0.09 | ) | | (0.09 | ) | | (0.08 | ) | | (0.11 | ) | | (0.37 | ) | | - | | | (0.09 | ) | | (0.09 | ) | | (0.10 | ) | | (0.31 | ) | | (0.06 | ) |
| | | | | | | | | | | |
OPERATIONAL | | | | | | | | | | | | | | | | | | | | | | | | | | | | | | | | | |
Utility/Parent/Other | | 0.37 | | | 0.69 | | | 1.35 | | | 0.61 | | | 3.02 | | | 0.48 | | | 0.71 | | | 1.56 | | | (0.33 | ) | | 2.43 | | | 0.59 | |
| | | | | | | | | | | | | | | | | | | | | | | | | | | | | | | | | | |
Competitive Businesses | | | | | | | | | | | | | | | | | | | | | | | | | | | | | | | | | |
Entergy Nuclear | | 0.95 | | | 0.48 | | | 1.07 | | | 0.95 | | | 3.45 | | | 1.12 | | | 0.73 | | | 1.05 | | | 1.18 | | | 4.07 | | | (0.62 | ) |
Non-Nuclear Wholesale Assets | | (0.03 | ) | | 0.06 | | | (0.02 | ) | | 0.19 | | | 0.20 | | | (0.04 | ) | | 0.02 | | | (0.11 | ) | | 0.14 | | | 0.01 | | | 0.19 | |
| | | | | | | | | | | | | | | | | | | | | | | | | | | | | | | | | | |
Total Competitive Businesses | | 0.92 | | | 0.54 | | | 1.05 | | | 1.14 | | | 3.65 | | | 1.08 | | | 0.75 | | | 0.94 | | | 1.32 | | | 4.08 | | | (0.43 | ) |
| | | | | | | | | | | | | | | | | | | | | | | | | | | | | | | | | | |
CONSOLIDATED OPERATIONAL EARNINGS | | 1.29 | | | 1.23 | | | 2.40 | | | 1.75 | | | 6.67 | | | 1.56 | | | 1.46 | | | 2.50 | | | 0.99 | | | 6.51 | | | 0.16 | |
| | | | | | | | | | | | | | | | | | | | | | | | | | | | | | | | | | |
| | | | | | | | | | | |
Weather Impact | | (0.02 | ) | | (0.01 | ) | | 0.03 | | | (0.01 | ) | | (0.01 | ) | | (0.03 | ) | | 0.05 | | | (0.01 | ) | | (0.03 | ) | | (0.02 | ) | | 0.01 | |
| | | | | | | | | | | | | | | | | | | | | | | | | | | | | | | | | | |
| | | | | | | | | | | |
SHARES OF COMMON STOCK | | | | | | | | | | | | | | | | | | | | | | | | | | | | | | | | | |
OUTSTANDING (in millions) | | | | | | | | | | | | | | | | | | | | | | | | | | | | | | | | | |
End of Period | | 196.1 | | | 196.1 | | | 188.9 | | | 189.1 | | | 189.1 | | | 191.9 | | | 190.5 | | | 189.9 | | | 189.4 | | | 189.4 | | | (0.3 | ) |
Weighted Average - Diluted | | 198.1 | | | 198.2 | | | 195.9 | | | 191.3 | | | 195.8 | | | 198.3 | | | 197.9 | | | 195.0 | | | 198.3 | | | 201.0 | | | (5.2 | ) |
| | | | | | | | | | | | | | | | | | | | | | | | | | | | | | | | | | |
Totals may not foot due to rounding and dilution effect of the unsuccessful remarketing of the equity units in February 2009.
9
FINANCIAL RESULTS
ENTERGY CORPORATION CONSOLIDATED QUARTERLY SPECIAL ITEMS (Shown as Positive/(Negative) Impact on Earnings)
| | | | | | | | | | | | | | | | | | | | | | | | | | | | | | | | |
| | | 2009 | | | 2008 | | | YTD | |
| ($/share) | | 1Q | | | 2Q | | | 3Q | | | 4Q | | | YTD | | | 1Q | | 2Q | | | 3Q | | | 4Q | | | YTD | | | CHANGE | |
UTILITY/PARENT/OTHER | | | | | | | | | | | | | | | | | | | | | | | | | | | | | | | | |
SPECIAL ITEMS | | | | | | | | | | | | | | | | | | | | | | | | | | | | | | | | |
Dilution effect - unsuccessful remarketing | | - | | | - | | | - | | | - | | | - | | | - | | - | | | - | | | 0.05 | | | 0.07 | | | (0.07 | ) |
Non-utility nuclear spin-off expenses | | (0.05 | ) | | (0.01 | ) | | (0.03 | ) | | (0.05 | ) | | (0.14 | ) | | - | | (0.09 | ) | | (0.09 | ) | | (0.10 | ) | | (0.28 | ) | | 0.14 | |
| | | | | | | | | | | | | | | | | | | | | | | | | | | | | | | | | |
Total | | (0.05 | ) | | (0.01 | ) | | (0.03 | ) | | (0.05 | ) | | (0.14 | ) | | - | | (0.09 | ) | | (0.09 | ) | | (0.05 | ) | | (0.21 | ) | | 0.07 | |
| | | | | | | | | | | | | | | | | | | | | | | | | | | | | | | | | |
COMPETITIVE BUSINESSES | | | | | | | | | | | | | | | | | | | | | | | | | | | | | | | | |
SPECIAL ITEMS | | | | | | | | | | | | | | | | | | | | | | | | | | | | | | | | |
Entergy Nuclear | | | | | | | | | | | | | | | | | | | | | | | | | | | | | | | | |
Dilution effect - unsuccessful remarketing | | - | | | - | | | - | | | - | | | - | | | - | | - | | | - | | | (0.04 | ) | | (0.10 | ) | | 0.10 | |
Non-utility nuclear spin-off dis-synergies | | (0.04 | ) | | (0.08 | ) | | (0.05 | ) | | (0.06 | ) | | (0.23 | ) | | - | | - | | | - | | | - | | | - | | | (0.23 | ) |
Non-Nuclear Wholesale Assets | | | | | | | | | | | | | | | | | | | | | | | | | | | | | | | | |
Dilution effect - unsuccessful remarketing | | - | | | - | | | - | | | - | | | - | | | - | | - | | | - | | | (0.01 | ) | | - | | | - | |
| | | | | | | | | | | | | | | | | | | | | | | | | | | | | | | | | |
Total | | (0.04 | ) | | (0.08 | ) | | (0.05 | ) | | (0.06 | ) | | (0.23 | ) | | - | | - | | | - | | | (0.05 | ) | | (0.10 | ) | | (0.13 | ) |
| | | | | | | | | | | | | | | | | | | | | | | | | | | | | | | | | |
| | | | | | | | | | | |
TOTAL SPECIAL ITEMS | | (0.09 | ) | | (0.09 | ) | | (0.08 | ) | | (0.11 | ) | | (0.37 | ) | | - | | (0.09 | ) | | (0.09 | ) | | (0.10 | ) | | (0.31 | ) | | (0.06 | ) |
| | | | | | | | | | | | | | | | | | | | | | | | | | | | | | | | | |
| | | |
| | | 2009 | | | 2008 | | | YTD | |
| ($ millions) | | 1Q | | | 2Q | | | 3Q | | | 4Q | | | YTD | | | 1Q | | 2Q | | | 3Q | | | 4Q | | | YTD | | | CHANGE | |
UTILITY/PARENT/OTHER | | | | | | | | | | | | | | | | | | | | | | | | | | | | | | | | |
SPECIAL ITEMS | | | | | | | | | | | | | | | | | | | | | | | | | | | | | | | | |
Dilution effect - unsuccessful remarketing | | - | | | - | | | - | | | - | | | - | | | - | | - | | | - | | | - | | | - | | | - | |
Non-utility nuclear spin-off expenses | | (10.6 | ) | | (2.1 | ) | | (5.2 | ) | | (9.1 | ) | | (27.0 | ) | | - | | (18.3 | ) | | (17.1 | ) | | (20.0 | ) | | (55.4 | ) | | 28.4 | |
| | | | | | | | | | | | | | | | | | | | | | | | | | | | | | | | | |
Total | | (10.6 | ) | | (2.1 | ) | | (5.2 | ) | | (9.1 | ) | | (27.0 | ) | | - | | (18.3 | ) | | (17.1 | ) | | (20.0 | ) | | (55.4 | ) | | 28.4 | |
| | | | | | | | | | | | | | | | | | | | | | | | | | | | | | | | | |
COMPETITIVE BUSINESSES | | | | | | | | | | | | | | | | | | | | | | | | | | | | | | | | |
SPECIAL ITEMS | | | | | | | | | | | | | | | | | | | | | | | | | | | | | | | | |
Entergy Nuclear | | | | | | | | | | | | | | | | | | | | | | | | | | | | | | | | |
Dilution effect - unsuccessful remarketing | | - | | | - | | | - | | | - | | | - | | | - | | - | | | - | | | - | | | - | | | - | |
Non-utility nuclear spin-off dis-synergies | | (6.6 | ) | | (15.1 | ) | | (10.3 | ) | | (12.0 | ) | | (44.0 | ) | | - | | - | | | - | | | - | | | - | | | (44.0 | ) |
Non-Nuclear Wholesale Assets | | | | | | | | | | | | | | | | | | | | | | | | | | | | | | | | |
Dilution effect - unsuccessful remarketing | | - | | | - | | | - | | | - | | | - | | | - | | - | | | - | | | - | | | - | | | - | |
| | | | | | | | | | | | | | | | | | | | | | | | | | | | | | | | | |
Total | | (6.6 | ) | | (15.1 | ) | | (10.3 | ) | | (12.0 | ) | | (44.0 | ) | | - | | - | | | - | | | - | | | - | | | (44.0 | ) |
| | | | | | | | | | | | | | | | | | | | | | | | | | | | | | | | | |
| | | | | | | | | | | |
TOTAL SPECIAL ITEMS | | (17.2 | ) | | (17.2 | ) | | (15.5 | ) | | (21.1 | ) | | (71.0 | ) | | - | | (18.3 | ) | | (17.1 | ) | | (20.0 | ) | | (55.4 | ) | | (15.6 | ) |
| | | | | | | | | | | | | | | | | | | | | | | | | | | | | | | | | |
Totals may not foot due to rounding and dilution effect of the unsuccessful remarketing of the equity units.
10
FINANCIAL RESULTS
ENTERGY CORPORATION CONSOLIDATED ANNUAL RESULTS – GAAP TO NON-GAAP RECONCILIATION
| | | | | | | | | | | | | | | |
| ($/share) | | 2009 | | | 2008 | | | 2007 | | | 2006 | | | 2005 | |
AS-REPORTED | | | | | | | | | | | | | | | |
| | | | | |
Utility/Parent/Other | | 2.88 | | | 2.22 | | | 2.67 | | | 3.97 | | | 2.82 | |
| | | | | | | | | | | | | | | | |
Competitive Businesses | | | | | | | | | | | | | | | |
Entergy Nuclear | | 3.22 | | | 3.97 | | | 2.66 | | | 1.46 | | | 1.32 | |
Non-Nuclear Wholesale Assets | | 0.20 | | | 0.01 | | | 0.27 | | | (0.07 | ) | | 0.05 | |
| | | | | | | | | | | | | | | | |
Total Competitive Businesses | | 3.42 | | | 3.98 | | | 2.93 | | | 1.39 | | | 1.37 | |
| | | | | | | | | | | | | | | | |
CONSOLIDATED AS-REPORTED EARNINGS | | 6.30 | | | 6.20 | | | 5.60 | | | 5.36 | | | 4.19 | |
| | | | | |
LESS SPECIAL ITEMS | | | | | | | | | | | | | | | |
Utility/Parent/Other | | (0.14 | ) | | (0.21 | ) | | (0.07 | ) | | 0.77 | | | (0.21 | ) |
| | | | | | | | | | | | | | | | |
Competitive Businesses | | | | | | | | | | | | | | | |
Entergy Nuclear | | (0.23 | ) | | (0.10 | ) | | (0.09 | ) | | - | | | - | |
Non-Nuclear Wholesale Assets | | - | | | - | | | - | | | (0.13 | ) | | - | |
| | | | | | | | | | | | | | | | |
Total Competitive Businesses | | (0.23 | ) | | (0.10 | ) | | (0.09 | ) | | (0.13 | ) | | - | |
| | | | | | | | | | | | | | | | |
TOTAL SPECIAL ITEMS | | (0.37 | ) | | (0.31 | ) | | (0.16 | ) | | 0.64 | | | (0.21 | ) |
| | | | | |
OPERATIONAL | | | | | | | | | | | | | | | |
Utility/Parent/Other | | 3.02 | | | 2.43 | | | 2.74 | | | 3.20 | | | 3.03 | |
| | | | | | | | | | | | | | | | |
Competitive Businesses | | | | | | | | | | | | | | | |
Entergy Nuclear | | 3.45 | | | 4.07 | | | 2.75 | | | 1.46 | | | 1.32 | |
Non-Nuclear Wholesale Assets | | 0.20 | | | 0.01 | | | 0.27 | | | 0.06 | | | 0.05 | |
| | | | | | | | | | | | | | | | |
Total Competitive Businesses | | 3.65 | | | 4.08 | | | 3.02 | | | 1.52 | | | 1.37 | |
| | | | | | | | | | | | | | | | |
CONSOLIDATED OPERATIONAL EARNINGS | | 6.67 | | | 6.51 | | | 5.76 | | | 4.72 | | | 4.40 | |
| | | | | | | | | | | | | | | | |
| | | | | |
Weather Impact | | (0.01 | ) | | (0.02 | ) | | 0.11 | | | 0.07 | | | 0.10 | |
| | | | | | | | | | | | | | | | |
11
FINANCIAL RESULTS
ENTERGY CORPORATION CONSOLIDATED ANNUAL SPECIAL ITEMS (Shown as Positive/(Negative) Impact on Earnings)
| | | | | | | | | | | | | | | |
| ($/share) | | 2009 | | | 2008 | | | 2007 | | | 2006 | | | 2005 | |
UTILITY/PARENT/OTHER SPECIAL ITEMS | | | | | | | | | | | | | | | |
Non-utility nuclear spin-off expenses | | (0.14 | ) | | (0.28 | ) | | - | | | - | | | - | |
Dilution effect - unsuccessful remarketing | | - | | | 0.07 | | | - | | | - | | | - | |
Nuclear alignment | | - | | | - | | | (0.07 | ) | | - | | | - | |
ENOI results | | - | | | - | | | - | | | 0.02 | | | - | |
Entergy-Koch, LP gain | | - | | | - | | | - | | | 0.26 | | | - | |
Restructuring - Entergy-Koch, LP distribution | | - | | | - | | | - | | | 0.49 | | | - | |
Retail business impairment reserve | | - | | | - | | | - | | | - | | | (0.12 | ) |
Retail business discontinued operations | | - | | | - | | | - | | | - | | | (0.09 | ) |
| | | | | | | | | | | | | | | | |
Total | | (0.14 | ) | | (0.21 | ) | | (0.07 | ) | | 0.77 | | | (0.21 | ) |
| | | | | | | | | | | | | | | | |
COMPETITIVE BUSINESSES SPECIAL ITEMS | | | | | | | | | | | | | | | |
Entergy Nuclear | | | | | | | | | | | | | | | |
Non-utility nuclear spin-off dis-synergies | | (0.23 | ) | | - | | | - | | | - | | | - | |
Dilution effect - unsuccessful remarketing | | - | | | (0.10 | ) | | - | | | - | | | - | |
Nuclear alignment | | - | | | - | | | (0.09 | ) | | - | | | - | |
Non-Nuclear Wholesale Assets write-off of tax capital losses | | - | | | - | | | - | | | (0.13 | ) | | - | |
| | | | | | | | | | | | | | | | |
Total | | (0.23 | ) | | (0.10 | ) | | (0.09 | ) | | (0.13 | ) | | - | |
| | | | | | | | | | | | | | | | |
| | | | | |
TOTAL SPECIAL ITEMS | | (0.37 | ) | | (0.31 | ) | | (0.16 | ) | | 0.64 | | | (0.21 | ) |
| | | | | | | | | | | | | | | | |
| | | | | |
| ($ millions) | | 2009 | | | 2008 | | | 2007 | | | 2006 | | | 2005 | |
UTILITY/PARENT/OTHER SPECIAL ITEMS | | | | | | | | | | | | | | | |
Non-utility nuclear spin-off expenses | | (27.0 | ) | | (55.4 | ) | | - | | | - | | | - | |
Nuclear alignment | | - | | | - | | | (13.6 | ) | | - | | | - | |
ENOI results | | - | | | - | | | - | | | 4.1 | | | - | |
Entergy-Koch, LP gain | | - | | | - | | | - | | | 55.0 | | | - | |
Restructuring - Entergy-Koch, LP distribution | | - | | | - | | | - | | | 104.0 | | | - | |
Retail business impairment reserve | | - | | | - | | | - | | | - | | | (25.8 | ) |
Retail business discontinued operations | | - | | | - | | | - | | | (0.5 | ) | | (18.9 | ) |
| | | | | | | | | | | | | | | | |
Total | | (27.0 | ) | | (55.4 | ) | | (13.6 | ) | | 162.6 | | | (44.7 | ) |
| | | | | | | | | | | | | | | | |
COMPETITIVE BUSINESSES SPECIAL ITEMS | | | | | | | | | | | | | | | |
Entergy Nuclear | | | | | | | | | | | | | | | |
Non-utility nuclear spin-off dis-synergies | | (44.0 | ) | | - | | | - | | | - | | | - | |
Nuclear alignment | | - | | | - | | | (18.4 | ) | | - | | | - | |
Non-Nuclear Wholesale Assets write-off of tax capital losses | | - | | | - | | | - | | | (27.7 | ) | | - | |
| | | | | | | | | | | | | | | | |
Total | | (44.0 | ) | | - | | | (18.4 | ) | | (27.7 | ) | | - | |
| | | | | | | | | | | | | | | | |
| | | | | |
TOTAL SPECIAL ITEMS | | (71.0 | ) | | (55.4 | ) | | (32.0 | ) | | 134.9 | | | (44.7 | ) |
| | | | | | | | | | | | | | | | |
12
FINANCIAL RESULTS
DESCRIPTION OF ENTERGY CORPORATION CONSOLIDATED SPECIAL ITEMS
| | |
| | | MAIN EARNINGS CATEGORY |
UTILITY/PARENT/OTHER SPECIAL ITEMS | | |
Non-utility nuclear spin-off expenses | | Operating expenses: Other operation and maintenance |
Dilution effect – unsuccessful remarketing(a) | | Diluted earnings per share |
Nuclear alignment | | Operating expenses: Other operation and maintenance |
ENOI results | | Other income: equity in earnings (loss) of unconsolidated equity affiliates |
Entergy-Koch, LP gain | | Other income: equity in earnings (loss) of unconsolidated equity affiliates |
Restructuring – Entergy-Koch, LP distribution | | Income taxes |
Retail business impairment reserve | | Discontinued operations |
Retail business discontinued operations | | Discontinued operations |
| | | |
| |
COMPETITIVE BUSINESSES SPECIAL ITEMS | | |
Entergy Nuclear | | |
Non-utility nuclear spin-off dis-synergies | | Operating expenses: Other operation and maintenance |
| | Operating expenses: Depreciation |
| | Interest and Other Charges: Other interest |
Dilution effect – unsuccessful remarketing(a) | | Diluted earnings per share |
Nuclear alignment | | Operating expenses: Other operation and maintenance |
Non-Nuclear Wholesale Assets write-off of tax capital losses | | Income taxes |
| | | |
| (a) | Entergy had 10,000,000 equity units outstanding as of December 31, 2008, that obligated the holders to purchase a certain number of shares of Entergy common stock for a stated price no later than February 17, 2009. Under the terms of the purchase contracts, Entergy attempted to remarket the notes payable associated with the equity units in February 2009 but was unsuccessful, the note holders put the notes to Entergy, Entergy retired the notes, and Entergy issued 6,598,000 shares of common stock in the settlement of the purchase contracts. |
13
FINANCIAL RESULTS
CONSOLIDATED STATEMENTS OF INCOME (unaudited)
| | | | | | | | | | | | | | | |
| In thousands, except share data, for the years ended December 31, | | 2009 | | | 2008 | | | 2007 | | | 2006(a) | | | 2005(a) | |
OPERATING REVENUES: | | | | | | | | | | | | | | | |
Electric | | $7,880,016 | | | $10,073,160 | | | $9,046,301 | | | $9,063,135 | | | $8,446,830 | |
Natural gas | | 172,213 | | | 241,856 | | | 206,073 | | | 84,230 | | | 77,660 | |
Competitive businesses | | 2,693,421 | | | 2,778,740 | | | 2,232,024 | | | 1,784,793 | | | 1,581,757 | |
| | | | | | | | | | | | | | | | |
Total | | 10,745,650 | | | 13,093,756 | | | 11,484,398 | | | 10,932,158 | | | 10,106,247 | |
| | | | | | | | | | | | | | | | |
OPERATING EXPENSES: | | | | | | | | | | | | | | | |
Operating and maintenance: | | | | | | | | | | | | | | | |
Fuel, fuel-related expenses, and gas purchased for resale | | 2,309,831 | | | 3,577,764 | | | 2,934,833 | | | 3,144,073 | | | 2,176,015 | |
Purchased power | | 1,395,203 | | | 2,491,200 | | | 1,986,950 | | | 2,138,237 | | | 2,521,247 | |
Nuclear refueling outage expenses | | 241,310 | | | 221,759 | | | 180,971 | | | 169,567 | | | 162,653 | |
Other operation and maintenance | | 2,750,810 | | | 2,742,762 | | | 2,649,654 | | | 2,335,364 | | | 2,122,206 | |
Decommissioning | | 199,063 | | | 189,409 | | | 167,898 | | | 145,884 | | | 143,121 | |
Taxes other than income taxes | | 503,859 | | | 496,952 | | | 489,058 | | | 428,561 | | | 382,521 | |
Depreciation and amortization | | 1,082,775 | | | 1,030,860 | | | 963,712 | | | 887,792 | | | 856,377 | |
Other regulatory charges (credits) – net | | (21,727 | ) | | 59,883 | | | 54,954 | | | (122,680 | ) | | (49,882 | ) |
| | | | | | | | | | | | | | | | |
Total | | 8,461,124 | | | 10,810,589 | | | 9,428,030 | | | 9,126,798 | | | 8,314,258 | |
| | | | | | | | | | | | | | | | |
OPERATING INCOME | | 2,284,526 | | | 2,283,167 | | | 2,056,368 | | | 1,805,360 | | | 1,791,989 | |
| | | | | | | | | | | | | | | | |
OTHER INCOME: | | | | | | | | | | | | | | | |
Allowance for equity funds used during construction | | 59,545 | | | 44,523 | | | 42,742 | | | 39,894 | | | 45,736 | |
Interest and dividend income | | 236,628 | | | 197,872 | | | 238,911 | | | 198,835 | | | 150,479 | |
Other than temporary impairment losses | | (86,069 | ) | | (49,656 | ) | | (4,914 | ) | | - | | | - | |
Equity in earnings (loss) of unconsolidated equity affiliates | | (7,793 | ) | | (11,684 | ) | | 3,176 | | | 93,744 | | | 985 | |
Miscellaneous – net | | (32,603 | ) | | (11,768 | ) | | (24,860 | ) | | 16,114 | | | 14,251 | |
| | | | | | | | | | | | | | | | |
Total | | 169,708 | | | 169,287 | | | 255,055 | | | 348,587 | | | 211,451 | |
| | | | | | | | | | | | | | | | |
INTEREST AND OTHER CHARGES: | | | | | | | | | | | | | | | |
Interest on long-term debt | | 520,716 | | | 500,898 | | | 506,089 | | | 498,451 | | | 440,334 | |
Other interest – net | | 82,963 | | | 133,290 | | | 155,995 | | | 75,502 | | | 64,646 | |
Allowance for borrowed funds used during construction | | (33,235 | ) | | (25,267 | ) | | (25,032 | ) | | (23,931 | ) | | (29,376 | ) |
| | | | | | | | | | | | | | | | |
Total | | 570,444 | | | 608,921 | | | 637,052 | | | 550,022 | | | 475,604 | |
| | | | | | | | | | | | | | | | |
INCOME FROM CONTINUING OPERATIONS BEFORE INCOME TAXES | | 1,883,790 | | | 1,843,533 | | | 1,674,371 | | | 1,603,925 | | | 1,527,836 | |
Income taxes | | 632,740 | | | 602,998 | | | 514,417 | | | 443,044 | | | 559,284 | |
| | | | | | | | | | | | | | | | |
INCOME FROM CONTINUING OPERATIONS | | 1,251,050 | | | 1,240,535 | | | 1,159,954 | | | 1,160,881 | | | 968,552 | |
LOSS FROM DISCONTINUED OPERATIONS | | | | | | | | | | | | | | | |
(net of income tax expense (benefit) of $67 and $(24,051), respectively) | | - | | | - | | | - | | | (496 | ) | | (44,794 | ) |
| | | | | | | | | | | | | | | | |
CONSOLIDATED NET INCOME | | 1,251,050 | | | 1,240,535 | | | 1,159,954 | | | 1,160,385 | | | 923,758 | |
| | | | | | | | | | | | | | | | |
Preferred dividend requirements of subsidiaries | | 19,958 | | | 19,969 | | | 25,105 | | | 27,783 | | | 25,427 | |
| | | | | | | | | | | | | | | | |
NET INCOME ATTRIBUTABLE TO ENTERGY CORPORATION | | $1,231,092 | | | $1,220,566 | | | $1,134,849 | | | $1,132,602 | | | $898,331 | |
| | | | | | | | | | | | | | | | |
Basic earnings (loss) per average common share: | | | | | | | | | | | | | | | |
Continuing operations | | $6.39 | | | $6.39 | | | $5.77 | | | $5.46 | | | $4.49 | |
Discontinued operations | | - | | | - | | | - | | | - | | | $(0.21) | |
Basic earnings (loss) per average common share | | $6.39 | | | $6.39 | | | $5.77 | | | $5.46 | | | $4.27 | |
Diluted earnings (loss) per average common share: | | | | | | | | | | | | | | | |
Continuing operations | | $6.30 | | | $6.20 | | | $5.60 | | | $5.36 | | | $4.40 | |
Discontinued operations | | - | | | - | | | - | | | - | | | $(0.21) | |
Diluted earnings (loss) per average common share | | $6.30 | | | $6.20 | | | $5.60 | | | $5.36 | | | $4.19 | |
Dividends declared per common share | | $3.00 | | | $3.00 | | | $2.58 | | | $2.16 | | | $2.16 | |
Average number of common shares outstanding: | | | | | | | | | | | | | | | |
Basic | | 192,772,032 | | | 190,925,613 | | | 196,572,945 | | | 207,456,838 | | | 210,141,887 | |
Diluted | | 195,838,068 | | | 201,011,588 | | | 202,780,283 | | | 211,452,455 | | | 214,441,362 | |
| | | | | | | | | | | | | | | | |
| (a) | 2006 and 2005 reflect deconsolidation of Entergy New Orleans, Inc. |
Certain prior year data has been reclassified to conform with current year presentation.
14
FINANCIAL RESULTS
2009 CONSOLIDATING INCOME STATEMENT (unaudited)
| | | | | | | | | | | | |
| In thousands, except share data, for the year ended December 31, 2009. | | UTILITY/
PARENT/
OTHER | | | COMPETITIVE
BUSINESSES | | | ELIMINATIONS | | | CONSOLIDATED | |
OPERATING REVENUES: | | | | | | | | | | | | |
Electric | | $7,883,140 | | | $ - | | | $ (3,124) | | | $7,880,016 | |
Natural gas | | 172,213 | | | - | | | - | | | 172,213 | |
Competitive businesses | | 29,953 | | | 2,686,806 | | | (23,338) | | | 2,693,421 | |
| | | | | | | | | | | | | |
Total | | 8,085,306 | | | 2,686,806 | | | (26,462 | ) | | 10,745,650 | |
| | | | | | | | | | | | | |
| | | | |
OPERATING EXPENSES: | | | | | | | | | | | | |
Operating and maintenance: | | | | | | | | | | | | |
Fuel, fuel-related expenses, and gas purchased for resale | | 2,026,893 | | | 284,191 | | | (1,253 | ) | | 2,309,831 | |
Purchased power | | 1,356,418 | | | 62,586 | | | (23,801 | ) | | 1,395,203 | |
Nuclear refueling outage expenses | | 105,016 | | | 136,293 | | | - | | | 241,310 | |
Other operation and maintenance | | 1,851,090 | | | 901,585 | | | (1,864 | ) | | 2,750,810 | |
Decommissioning | | 99,683 | | | 99,380 | | | - | | | 199,063 | |
Taxes other than income taxes | | 403,957 | | | 99,903 | | | - | | | 503,859 | |
Depreciation and amortization | | 933,758 | | | 149,017 | | | - | | | 1,082,775 | |
Other regulatory (credits) - net | | (21,727 | ) | | - | | | - | | | (21,727 | ) |
| | | | | | | | | | | | | |
Total | | 6,755,088 | | | 1,732,955 | | | (26,918 | ) | | 8,461,124 | |
| | | | | | | | | | | | | |
| | | | |
OPERATING INCOME | | 1,330,218 | | | 953,851 | | | 456 | | | 2,284,526 | |
| | | | | | | | | | | | | |
| | | | |
OTHER INCOME (DEDUCTIONS): | | | | | | | | | | | | |
Allowance for equity funds used during construction | | 59,545 | | | - | | | - | | | 59,545 | |
Interest and dividend income | | 153,400 | | | 211,805 | | | (128,577) | | | 236,628 | |
Other than temporary impairment losses | | - | | | (86,069 | ) | | - | | | (86,069 | ) |
Equity in (loss) of unconsolidated equity affiliates | | (3,327 | ) | | (4,466 | ) | | - | | | (7,793 | ) |
Miscellaneous – net | | (11,998 | ) | | (20,149 | ) | | (456) | | | (32,603 | ) |
| | | | | | | | | | | | | |
Total | | 197,620 | | | 101,121 | | | (129,033 | ) | | 169,708 | |
| | | | | | | | | | | | | |
| | | | |
INTEREST AND OTHER CHARGES: | | | | | | | | | | | | |
Interest on long-term debt | | 511,451 | | | 9,265 | | | - | | | 520,716 | |
Other interest – net | | 162,370 | | | 49,170 | | | (128,577) | | | 82,963 | |
Allowance for borrowed funds used during construction | | (33,235 | ) | | - | | | - | | | (33,235 | ) |
| | | | | | | | | | | | | |
Total | | 640,586 | | | 58,435 | | | (128,577 | ) | | 570,444 | |
| | | | | | | | | | | | | |
INCOME BEFORE INCOME TAXES | | 887,252 | | | 996,537 | | | - | | | 1,883,790 | |
Income taxes | | 308,552 | | | 324,187 | | | - | | | 632,740 | |
| | | | | | | | | | | | | |
| | | | |
CONSOLIDATED NET INCOME | | 578,700 | | | 672,350 | | | - | | | 1,251,050 | |
| | | | | | | | | | | | | |
Preferred dividend requirements of subsidiaries | | 17,329 | | | 2,629 | | | - | | | 19,958 | |
| | | | | | | | | | | | | |
| | | | |
NET INCOME ATTRIBUTABLE TO ENTERGY CORPORATION | | $ 561,371 | | | $ 669,721 | | | $ - | | | $1,231,092 | |
| | | | | | | | | | | | | |
Earnings Per Average Common Share: | | | | | | | | | | | | |
Basic | | $2.91 | | | $3.48 | | | $ - | | | $6.39 | |
Diluted | | $2.88 | | | $3.42 | | | $ - | | | $6.30 | |
| | | | | | | | | | | | | |
Totals may not foot due to rounding.
15
FINANCIAL RESULTS
CONSOLIDATED BALANCE SHEETS (unaudited)
| | | | | | | | | | | | | | | |
| In thousands, as of December 31, | | 2009 | | | 2008 | | | 2007 | | | 2006(a) | | | 2005(a) | |
ASSETS | | | | | | | | | | | | | | | |
CURRENT ASSETS: | | | | | | | | | | | | | | | |
Cash and cash equivalents: | | | | | | | | | | | | | | | |
Cash | | $ 85,861 | | | $ 115,876 | | | $ 126,652 | | | $ 117,379 | | | $ 221,773 | |
Temporary cash investments | | 1,623,690 | | | 1,804,615 | | | 1,127,076 | | | 898,773 | | | 361,047 | |
| | | | | | | | | | | | | | | | |
Total cash and cash equivalents | | 1,709,551 | | | 1,920,491 | | | 1,253,728 | | | 1,016,152 | | | 582,820 | |
| | | | | | | | | | | | | | | | |
Securitization recovery trust account | | 13,098 | | | 12,062 | | | 19,273 | | | - | | | - | |
Notes receivable – Entergy New Orleans DIP loan | | - | | | - | | | - | | | 51,934 | | | 90,000 | |
Notes receivable | | - | | | - | | | - | | | 699 | | | 3,227 | |
Accounts receivable: | | | | | | | | | | | | | | | |
Customer | | 553,692 | | | 734,204 | | | 610,724 | | | 552,376 | | | 763,993 | |
Allowance for doubtful accounts | | (27,631 | ) | | (25,610 | ) | | (25,789 | ) | | (19,348 | ) | | (30,805 | ) |
Other | | 152,303 | | | 206,627 | | | 303,060 | | | 345,400 | | | 324,876 | |
Accrued unbilled revenues | | 302,463 | | | 282,914 | | | 288,076 | | | 249,165 | | | 477,570 | |
| | | | | | | | | | | | | | | | |
Total accounts receivable | | 980,827 | | | 1,198,135 | | | 1,176,071 | | | 1,127,593 | | | 1,535,634 | |
| | | | | | | | | | | | | | | | |
Deferred fuel costs | | 126,798 | | | 167,092 | | | - | | | - | | | 543,927 | |
Accumulated deferred income taxes | | - | | | 7,307 | | | 38,117 | | | 11,680 | | | - | |
Fuel inventory – at average cost | | 196,855 | | | 216,145 | | | 208,584 | | | 193,098 | | | 206,195 | |
Materials and supplies – at average cost | | 825,702 | | | 776,170 | | | 692,376 | | | 604,998 | | | 610,932 | |
Deferred nuclear refueling outage costs | | 225,290 | | | 221,803 | | | 172,936 | | | 147,521 | | | 164,152 | |
System agreement cost equalization | | 70,000 | | | 394,000 | | | 268,000 | | | - | | | - | |
Prepayments and other | | 386,040 | | | 247,184 | | | 129,162 | | | 171,759 | | | 325,795 | |
| | | | | | | | | | | | | | | | |
Total | | 4,534,161 | | | 5,160,389 | | | 3,958,247 | | | 3,325,434 | | | 4,062,682 | |
| | | | | | | | | | | | | | | | |
| | | | | |
OTHER PROPERTY AND INVESTMENTS: | | | | | | | | | | | | | | | |
Investment in affiliates – at equity | | 39,580 | | | 66,247 | | | 78,992 | | | 229,089 | | | 296,784 | |
Decommissioning trust funds | | 3,211,183 | | | 2,832,243 | | | 3,307,636 | | | 2,858,523 | | | 2,606,765 | |
Non-utility property – at cost (less accumulated depreciation) | | 247,664 | | | 231,115 | | | 220,204 | | | 212,726 | | | 228,833 | |
Other | | 120,273 | | | 107,939 | | | 82,563 | | | 47,115 | | | 81,535 | |
| | | | | | | | | | | | | | | | |
Total | | 3,618,700 | | | 3,237,544 | | | 3,689,395 | | | 3,347,453 | | | 3,213,917 | |
| | | | | | | | | | | | | | | | |
| | | | | |
PROPERTY, PLANT AND EQUIPMENT: | | | | | | | | | | | | | | | |
Electric | | 36,343,772 | | | 34,495,406 | | | 32,959,022 | | | 30,713,284 | | | 29,161,027 | |
Property under capital lease | | 783,096 | | | 745,504 | | | 740,095 | | | 730,182 | | | 727,565 | |
Natural gas | | 314,256 | | | 303,769 | | | 300,767 | | | 92,787 | | | 86,794 | |
Construction work in progress | | 1,547,319 | | | 1,712,761 | | | 1,054,833 | | | 786,147 | | | 1,524,085 | |
Nuclear fuel under capital lease | | 527,521 | | | 465,374 | | | 361,502 | | | 336,017 | | | 271,615 | |
Nuclear fuel | | 739,827 | | | 636,813 | | | 665,620 | | | 494,759 | | | 436,646 | |
| | | | | | | | | | | | | | | | |
Total property, plant and equipment | | 40,255,791 | | | 38,359,627 | | | 36,081,839 | | | 33,153,176 | | | 32,207,732 | |
Less – accumulated depreciation and amortization | | 16,866,389 | | | 15,930,513 | | | 15,107,569 | | | 13,715,099 | | | 13,010,687 | |
| | | | | | | | | | | | | | | | |
Property, plant and equipment – net | | 23,389,402 | | | 22,429,114 | | | 20,974,270 | | | 19,438,077 | | | 19,197,045 | |
| | | | | | | | | | | | | | | | |
| | | | | |
DEFERRED DEBITS AND OTHER ASSETS: | | | | | | | | | | | | | | | |
Regulatory assets: | | | | | | | | | | | | | | | |
Regulatory asset for income taxes - net | | 619,500 | | | 581,719 | | | 595,743 | | | 740,110 | | | 735,221 | |
Other regulatory assets | | 3,647,154 | | | 3,615,104 | | | 2,971,399 | | | 2,768,352 | | | 2,133,724 | |
Deferred fuel costs | | 172,202 | | | 168,122 | | | 168,122 | | | 168,122 | | | 120,489 | |
Long-term receivables | | - | | | - | | | - | | | 19,349 | | | 25,572 | |
Goodwill | | 377,172 | | | 377,172 | | | 377,172 | | | 377,172 | | | 377,172 | |
Other | | 1,006,306 | | | 1,047,654 | | | 908,654 | | | 898,662 | | | 991,835 | |
| | | | | | | | | | | | | | | | |
Total | | 5,822,334 | | | 5,789,771 | | | 5,021,090 | | | 4,971,767 | | | 4,384,013 | |
| | | | | | | | | | | | | | | | |
| | | | | |
TOTAL ASSETS | | $37,364,597 | | | $36,616,818 | | | $33,643,002 | | | $31,082,731 | | | $30,857,657 | |
| | | | | | | | | | | | | | | | |
| (a) | 2006 and 2005 reflect deconsolidation of Entergy New Orleans, Inc. |
Certain prior year data has been reclassified to conform with current year presentation.
16
FINANCIAL RESULTS
CONSOLIDATED BALANCE SHEETS (unaudited)
| | | | | | | | | | | | | | |
| In thousands, as of December 31, | | 2009 | | | 2008 | | | 2007 | | 2006(a) | | | 2005(a) | |
LIABILITIES AND EQUITY | | | | | | | | | | | | | | |
CURRENT LIABILITIES: | | | | | | | | | | | | | | |
Currently maturing long-term debt | | $ 711,957 | | | $ 544,460 | | | $ 996,757 | | $ 181,576 | | | $ 103,517 | |
Notes payable | | 30,031 | | | 55,034 | | | 25,037 | | 25,039 | | | 40,041 | |
Accounts payable | | 998,228 | | | 1,475,745 | | | 1,031,300 | | 1,122,596 | | | 1,655,787 | |
Customer deposits | | 323,342 | | | 302,303 | | | 291,171 | | 248,031 | | | 222,206 | |
Taxes accrued | | - | | | 75,210 | | | - | | 187,324 | | | 188,159 | |
Accumulated deferred income taxes | | 48,584 | | | - | | | - | | - | | | 143,409 | |
Interest accrued | | 192,283 | | | 187,310 | | | 187,968 | | 160,831 | | | 154,855 | |
Deferred fuel costs | | 219,639 | | | 183,539 | | | 54,947 | | 73,031 | | | - | |
Obligations under capital leases | | 212,496 | | | 162,393 | | | 152,615 | | 153,246 | | | 130,882 | |
Pension and other postretirement liabilities | | 55,031 | | | 46,288 | | | 34,795 | | 41,912 | | | - | |
System agreement cost equalization | | 187,204 | | | 460,315 | | | 268,000 | | - | | | - | |
Other | | 215,202 | | | 273,297 | | | 214,164 | | 271,544 | | | 473,510 | |
| | | | | | | | | | | | | | | |
Total | | 3,193,997 | | | 3,765,894 | | | 3,256,754 | | 2,465,130 | | | 3,112,366 | |
| | | | | | | | | | | | | | | |
NON-CURRENT LIABILITIES: | | | | | | | | | | | | | | |
Accumulated deferred income taxes and taxes accrued | | 7,422,319 | | | 6,565,770 | | | 6,379,679 | | 5,820,700 | | | 5,282,759 | |
Accumulated deferred investment tax credits | | 308,395 | | | 325,570 | | | 343,539 | | 358,550 | | | 376,550 | |
Obligations under capital leases | | 354,233 | | | 343,093 | | | 220,438 | | 188,033 | | | 175,005 | |
Other regulatory liabilities | | 421,985 | | | 280,643 | | | 490,323 | | 449,237 | | | 408,667 | |
Decommissioning and asset retirement cost liabilities | | 2,939,539 | | | 2,677,495 | | | 2,489,061 | | 2,023,846 | | | 1,923,971 | |
Transition to competition | | - | | | - | | | - | | 79,098 | | | 79,101 | |
Accumulated provisions | | 141,315 | | | 147,452 | | | 133,406 | | 88,902 | | | 144,880 | |
Pension and other postretirement liabilities | | 2,241,039 | | | 2,177,993 | | | 1,361,326 | | 1,410,433 | | | 1,118,964 | |
Long-term debt | | 10,705,738 | | | 11,174,289 | | | 9,728,135 | | 8,798,087 | | | 8,824,493 | |
Preferred stock with sinking fund | | - | | | - | | | - | | 10,500 | | | 13,950 | |
Other | | 711,334 | | | 880,998 | | | 1,066,508 | | 847,415 | | | 1,202,706 | |
| | | | | | | | | | | | | | | |
Total | | 25,245,897 | | | 24,573,303 | | | 22,212,415 | | 20,074,801 | | | 19,551,046 | |
| | | | | | | | | | | | | | | |
| | | | | |
Commitments and Contingencies | | | | | | | | | | | | | | |
| | | | | |
Subsidiaries preferred stock without sinking fund | | 217,343 | | | 217,029 | | | 217,162 | | 244,913 | | | 345,974 | |
| | | | | |
EQUITY: | | | | | | | | | | | | | | |
Common shareholders’ equity: | | | | | | | | | | | | | | |
Common stock, $.01 par value, authorized 500,000,000 shares; issued 254,752,788 shares in 2009, 248,174,087 shares in 2008, 2007, 2006 and 2005 | | 2,548 | | | 2,482 | | | 2,482 | | 2,482 | | | 2,482 | |
Paid-in capital | | 5,370,042 | | | 4,869,303 | | | 4,850,769 | | 4,827,265 | | | 4,817,637 | |
Retained earnings | | 8,043,122 | | | 7,382,719 | | | 6,735,965 | | 6,113,042 | | | 5,433,931 | |
Accumulated other comprehensive income (loss) | | (75,185 | ) | | (112,698 | ) | | 8,320 | | (100,512 | ) | | (343,819 | ) |
Less – treasury stock, at cost (65,634,580 shares in 2009; 58,815,518 shares in 2008; 55,053,847 shares in 2007; 45,506,311 shares in 2006; 40,644,602 shares in 2005) | | 4,727,167 | | | 4,175,214 | | | 3,734,865 | | 2,644,390 | | | 2,161,960 | |
| | | | | | | | | | | | | | | |
Total common shareholders’ equity | | 8,613,360 | | | 7,966,592 | | | 7,862,671 | | 8,197,887 | | | 7,748,271 | |
| | | | | | | | | | | | | | | |
Subsidiaries preferred stock without sinking fund | | 94,000 | | | 94,000 | | | 94,000 | | 100,000 | | | 100,000 | |
| | | | | | | | | | | | | | | |
Total | | 8,707,360 | | | 8,060,592 | | | 7,956,671 | | 8,297,887 | | | 7,848,271 | |
| | | | | | | | | | | | | | | |
| | | | | |
TOTAL LIABILITIES AND EQUITY | | $37,364,597 | | | $36,616,818 | | | $33,643,002 | | $31,082,731 | | | $30,857,657 | |
| | | | | | | | | | | | | | | |
| (a) | 2006 and 2005 reflect deconsolidation of Entergy New Orleans, Inc. |
Certain prior year data has been reclassified to conform with current year presentation.
17
FINANCIAL RESULTS
2009 CONSOLIDATING BALANCE SHEET (unaudited)
| | | | | | | | | | | | |
| In thousands, as of December 31, 2009. | | UTILITY/
PARENT/
OTHER | | | COMPETITIVE
BUSINESSES | | | ELIMINATIONS | | | CONSOLIDATED | |
ASSETS | | | | | | | | | | | | |
CURRENT ASSETS: | | | | | | | | | | | | |
Cash and cash equivalents: | | | | | | | | | | | | |
Cash | | $ 82,155 | | | $ 3,706 | | | $ - | | | $ 85,861 | |
Temporary cash investments – at cost, | | 1,208,025 | | | 415,665 | | | - | | | 1,623,690 | |
| | | | | | | | | | | | | |
Total cash and cash equivalents | | 1,290,180 | | | 419,371 | | | - | | | 1,709,551 | |
| | | | | | | | | | | | | |
Securitization recovery trust account | | 13,098 | | | - | | | - | | | 13,098 | |
Notes receivable | | 203,916 | | | 1,760,420 | | | (1,964,336 | ) | | - | |
Accounts receivable: | | | | | | | | | | | | |
Customer | | 331,936 | | | 221,756 | | | - | | | 553,692 | |
Allowance for doubtful accounts | | (27,428 | ) | | (203 | ) | | - | | | (27,631 | ) |
Associated companies | | 25,381 | | | 117,483 | | | (142,864 | ) | | - | |
Other | | 137,968 | | | 14,335 | | | - | | | 152,303 | |
Accrued unbilled revenues | | 302,463 | | | - | | | - | | | 302,463 | |
| | | | | | | | | | | | | |
Total accounts receivable | | 770,320 | | | 353,371 | | | (142,864 | ) | | 980,827 | |
| | | | | | | | | | | | | |
Deferred fuel costs | | 126,798 | | | - | | | - | | | 126,798 | |
Accumulated deferred income taxes | | - | | | - | | | - | | | - | |
Fuel inventory – at average cost | | 194,827 | | | 2,028 | | | - | | | 196,855 | |
Materials and supplies – at average cost | | 526,543 | | | 299,159 | | | - | | | 825,702 | |
Deferred nuclear refueling outage costs | | 106,428 | | | 118,862 | | | - | | | 225,290 | |
System agreement cost equalization | | 70,000 | | | - | | | - | | | 70,000 | |
Prepayments and other | | 79,084 | | | 417,960 | | | (111,004 | ) | | 386,040 | |
| | | | | | | | | | | | | |
Total | | 3,381,194 | | | 3,371,171 | | | (2,218,204 | ) | | 4,534,161 | |
| | | | | | | | | | | | | |
| | | | |
OTHER PROPERTY AND INVESTMENTS: | | | | | | | | | | | | |
Investment in affiliates – at equity | | 6,871,604 | | | 1,042,565 | | | (7,874,589 | ) | | 39,580 | |
Decommissioning trust funds | | 1,325,863 | | | 1,885,320 | | | - | | | 3,211,183 | |
Non-utility property – at cost (less accumulated depreciation) | | 239,956 | | | 7,708 | | | - | | | 247,664 | |
Other | | 110,645 | | | 9,628 | | | - | | | 120,273 | |
| | | | | | | | | | | | | |
Total | | 8,548,068 | | | 2,945,221 | | | (7,874,589 | ) | | 3,618,700 | |
| | | | | | | | | | | | | |
| | | | |
PROPERTY, PLANT AND EQUIPMENT: | | | | | | | | | | | | |
Electric | | 32,446,351 | | | 3,897,421 | | | - | | | 36,343,772 | |
Property under capital lease | | 783,096 | | | - | | | - | | | 783,096 | |
Natural gas | | 314,256 | | | - | | | - | | | 314,256 | |
Construction work in progress | | 1,133,823 | | | 413,496 | | | - | | | 1,547,319 | |
Nuclear fuel under capital lease | | 527,521 | | | - | | | - | | | 527,521 | |
Nuclear fuel | | 219,317 | | | 520,510 | | | - | | | 739,827 | |
| | | | | | | | | | | | | |
Total property, plant and equipment | | 35,424,364 | | | 4,831,427 | | | - | | | 40,255,791 | |
Less – accumulated depreciation and amortization | | 16,159,041 | | | 707,348 | | | - | | | 16,866,389 | |
| | | | | | | | | | | | | |
Property, plant and equipment – net | | 19,265,323 | | | 4,124,079 | | | - | | | 23,389,402 | |
| | | | | | | | | | | | | |
| | | | |
DEFERRED DEBITS AND OTHER ASSETS: | | | | | | | | | | | | |
Regulatory assets: | | | | | | | | | | | | |
Regulatory asset for income taxes—net | | 619,500 | | | - | | | - | | | 619,500 | |
Other regulatory assets | | 3,647,154 | | | - | | | - | | | 3,647,154 | |
Deferred fuel costs | | 172,202 | | | - | | | - | | | 172,202 | |
Goodwill | | 374,099 | | | 3,073 | | | - | | | 377,172 | |
Other | | 649,258 | | | 873,457 | | | (516,409 | ) | | 1,006,306 | |
| | | | | | | | | | | | | |
Total | | 5,462,213 | | | 876,530 | | | (516,409 | ) | | 5,822,334 | |
| | | | | | | | | | | | | |
TOTAL ASSETS | | $ 36,656,798 | | | $ 11,317,001 | | | $ (10,609,202 | ) | | $ 37,364,597 | |
| | | | | | | | | | | | | |
Totals may not foot due to rounding.
18
FINANCIAL RESULTS
2009 CONSOLIDATING BALANCE SHEET (unaudited)
| | | | | | | | | | | |
| In thousands, as of December 31, 2009. | | UTILITY/
PARENT/
OTHER | | | COMPETITIVE
BUSINESSES | | ELIMINATIONS | | | CONSOLIDATED | |
LIABILITIES AND EQUITY | | | | | | | | | | | |
CURRENT LIABILITIES: | | | | | | | | | | | |
Currently maturing long-term debt | | $ 681,016 | | | $ 30,941 | | $ - | | | $ 711,957 | |
Notes payable: | | | | | | | | | | | |
Associated companies | | 1,964,336 | | | - | | (1,964,336 | ) | | - | |
Other | | 30,031 | | | - | | - | | | 30,031 | |
Accounts payable: | | | | | | | | | | | |
Associated companies | | 130,229 | | | 10,612 | | (140,841 | ) | | - | |
Other | | 753,362 | | | 244,866 | | - | | | 998,228 | |
Customer deposits | | 323,092 | | | 250 | | - | | | 323,342 | |
Taxes accrued | | 107,944 | | | - | | (107,944 | ) | | - | |
Accumulated deferred income taxes | | 48,584 | | | - | | - | | | 48,584 | |
Interest accrued | | 191,375 | | | 908 | | - | | | 192,283 | |
Deferred fuel costs | | 219,639 | | | - | | - | | | 219,639 | |
Obligations under capital leases | | 212,496 | | | - | | - | | | 212,496 | |
Pension and other postretirement liabilities | | 49,912 | | | 5,119 | | - | | | 55,031 | |
System agreement cost equalization | | 187,204 | | | - | | - | | | 187,204 | |
Other | | 54,279 | | | 163,983 | | (3,060 | ) | | 215,202 | |
| | | | | | | | | | | | |
Total | | 4,953,499 | | | 456,679 | | (2,216,181 | ) | | 3,193,997 | |
| | | | | | | | | | | | |
| | | | |
NON-CURRENT LIABILITIES: | | | | | | | | | | | |
Accumulated deferred income taxes and taxes accrued | | 4,609,839 | | | 2,812,480 | | - | | | 7,422,319 | |
Accumulated deferred investment tax credits | | 308,395 | | | - | | - | | | 308,395 | |
Obligations under capital leases | | 354,233 | | | - | | - | | | 354,233 | |
Other regulatory liabilities | | 421,985 | | | - | | - | | | 421,985 | |
Decommissioning and asset retirement cost liabilities | | 1,618,845 | | | 1,320,694 | | - | | | 2,939,539 | |
Accumulated provisions | | 132,225 | | | 9,090 | | - | | | 141,315 | |
Pension and other postretirement liabilities | | 1,771,350 | | | 469,689 | | - | | | 2,241,039 | |
Long-term debt | | 10,549,181 | | | 156,557 | | - | | | 10,705,738 | |
Other | | 451,438 | | | 786,443 | | (526,547 | ) | | 711,334 | |
| | | | | | | | | | | | |
Total | | 20,217,491 | | | 5,554,953 | | (526,547 | ) | | 25,245,897 | |
| | | | | | | | | | | | |
| | | | |
Commitments and Contingencies | | | | | | | | | | | |
| | | | |
Subsidiaries preferred stock without sinking fund | | 186,510 | | | 82,953 | | (52,120 | ) | | 217,343 | |
| | | | |
EQUITY: | | | | | | | | | | | |
Common shareholders’ equity: | | | | | | | | | | | |
Common stock, $.01 par value, authorized 500,000,000 shares; issued 254,752,788 shares in 2009 | | 2,163,815 | | | 982,040 | | (3,143,307 | ) | | 2,548 | |
Paid-in capital | | 8,915,541 | | | 1,882,103 | | (5,427,602 | ) | | 5,370,042 | |
Retained earnings | | 5,103,166 | | | 2,316,101 | | 623,855 | | | 8,043,122 | |
Accumulated other comprehensive income (loss) | | (130,057 | ) | | 54,872 | | - | | | (75,185 | ) |
Less – treasury stock, at cost (65,634,580 shares in 2009) | | 4,847,167 | | | 12,700 | | (132,700 | ) | | 4,727,167 | |
| | | | | | | | | | | | |
Total common shareholders’ equity | | 11,205,298 | | | 5,222,416 | | (7,814,354 | ) | | 8,613,360 | |
| | | | | | | | | | | | |
Subsidiaries preferred stock without sinking fund | | 94,000 | | | - | | - | | | 94,000 | |
| | | | | | | | | | | | |
Total | | 11,299,298 | | | 5,222,416 | | (7,814,354 | ) | | 8,707,360 | |
| | | | | | | | | | | | |
| | | | |
TOTAL LIABILITIES AND EQUITY | | $36,656,798 | | | $ 11,317,001 | | $ (10,609,202 | ) | | $37,364,597 | |
| | | | | | | | | | | | |
Totals may not foot due to rounding.
19
FINANCIAL RESULTS
CONSOLIDATED STATEMENTS OF CASH FLOW (unaudited)
| | | | | | | | | | | | | | | |
| In thousands, for the years ended December 31, | | 2009 | | | 2008 | | | 2007 | | | 2006(a) | | | 2005(a) | |
OPERATING ACTIVITIES: | | | | | | | | | | | | | | | |
Consolidated net income | | $ 1,251,050 | | | $ 1,240,535 | | | $ 1,159,954 | | | $ 1,160,385 | | | $ 923,758 | |
Adjustments to reconcile consolidated net income to net cash flow provided by operating activities: | | | | | | | | | | | | | | | |
Reserve for regulatory adjustments | | (508 | ) | | (8,285 | ) | | (15,574 | ) | | 36,352 | | | (82,033 | ) |
Other regulatory charges (credits) – net | | (21,727 | ) | | 59,883 | | | 54,954 | | | (122,680 | ) | | (49,882 | ) |
Depreciation, amortization, and decommissioning | | 1,281,838 | | | 1,220,269 | | | 1,131,610 | | | 1,035,153 | | | 1,001,852 | |
Deferred income taxes, investment tax credits, and non-current taxes accrued | | 864,684 | | | 333,948 | | | 476,241 | | | 738,643 | | | 487,804 | |
Equity in earnings (loss) of unconsolidated equity affiliates – net of dividends | | 7,793 | | | 11,684 | | | (3,176 | ) | | 4,436 | | | 4,315 | |
Provisions for asset impairments and restructuring charges | | - | | | - | | | - | | | - | | | 39,767 | |
Changes in working capital: | | | | | | | | | | | | | | | |
Receivables | | 116,444 | | | 78,653 | | | (62,646 | ) | | 408,042 | | | (367,351 | ) |
Fuel inventory | | 19,291 | | | (7,561 | ) | | (10,445 | ) | | 13,097 | | | (83,125 | ) |
Accounts payable | | (14,251 | ) | | (23,225 | ) | | (103,048 | ) | | (83,884 | ) | | 303,194 | |
Taxes accrued | | (75,210 | ) | | 75,210 | | | (187,324 | ) | | (835 | ) | | (33,306 | ) |
Interest accrued | | 4,974 | | | (652 | ) | | 11,785 | | | 5,975 | | | 15,133 | |
Deferred fuel | | 72,314 | | | (38,500 | ) | | 912 | | | 582,947 | | | (236,801 | ) |
Other working capital accounts | | (228,210 | ) | | (72,372 | ) | | (73,269 | ) | | 64,479 | | | (45,653 | ) |
Provision for estimated losses and reserves | | (12,030 | ) | | 12,462 | | | (59,292 | ) | | 39,822 | | | (3,704 | ) |
Changes in other regulatory assets | | (415,157 | ) | | (324,211 | ) | | 254,736 | | | (454,458 | ) | | (311,934 | ) |
Changes in pensions and other postretirement liabilities | | 71,789 | | | 828,160 | | | (56,224 | ) | | 333,381 | | | - | |
Other | | 10,074 | | | (61,670 | ) | | 40,576 | | | (313,016 | ) | | (94,226 | ) |
| | | | | | | | | | | | | | | | |
Net cash flow provided by operating activities | | 2,933,158 | | | 3,324,328 | | | 2,559,770 | | | 3,447,839 | | | 1,467,808 | |
| | | | | | | | | | | | | | | | |
| | | | | |
INVESTING ACTIVITIES: | | | | | | | | | | | | | | | |
Construction / capital expenditures | | (1,931,245 | ) | | (2,212,255 | ) | | (1,578,030 | ) | | (1,633,268 | ) | | (1,458,086 | ) |
Allowance for equity funds used during construction | | 59,545 | | | 44,523 | | | 42,742 | | | 39,894 | | | 45,736 | |
Nuclear fuel purchases | | (525,474 | ) | | (423,951 | ) | | (408,732 | ) | | (326,248 | ) | | (314,414 | ) |
Proceeds from sale / leaseback of nuclear fuel | | 284,997 | | | 297,097 | | | 169,066 | | | 135,190 | | | 184,403 | |
Proceeds from sale of assets and businesses | | 39,554 | | | 30,725 | | | 13,063 | | | 77,159 | | | - | |
Payment for purchase of plant | | - | | | (266,823 | ) | | (336,211 | ) | | (88,199 | ) | | (162,075 | ) |
Insurance proceeds received for property damages | | 53,760 | | | 130,114 | | | 83,104 | | | 18,828 | | | - | |
Changes in transition charge account | | (1,036 | ) | | 7,211 | | | (19,273 | ) | | - | | | - | |
NYPA value sharing payment | | (72,000 | ) | | (72,000 | ) | | - | | | - | | | - | |
Increase (decrease) in other investments | | 94,154 | | | (72,833 | ) | | 41,720 | | | (6,353 | ) | | 9,905 | |
Purchases of other temporary investments | | - | | | - | | | - | | | - | | | (1,591,025 | ) |
Liquidation of other temporary investments | | - | | | - | | | - | | | - | | | 1,778,975 | |
Proceeds from nuclear decommissioning trust fund sales | | 2,570,523 | | | 1,652,277 | | | 1,583,584 | | | 777,584 | | | 944,253 | |
Investment in nuclear decommissioning trust funds | | (2,667,172 | ) | | (1,704,181 | ) | | (1,708,764 | ) | | (884,123 | ) | | (1,039,824 | ) |
Other regulatory investments | | - | | | - | | | - | | | (38,037 | ) | | (390,456 | ) |
| | | | | | | | | | | | | | | | |
Net cash flow used in investing activities | | (2,094,394 | ) | | (2,590,096 | ) | | (2,117,731 | ) | | (1,927,573 | ) | | (1,992,608 | ) |
| | | | | | | | | | | | | | | | |
| | | | | |
FINANCING ACTIVITIES: | | | | | | | | | | | | | | | |
Proceeds from the issuance of: | | | | | | | | | | | | | | | |
Long-term debt | | 2,003,469 | | | 3,456,695 | | | 2,866,136 | | | 1,837,713 | | | 4,302,570 | |
Preferred equity | | - | | | - | | | 10,000 | | | 73,354 | | | 127,995 | |
Common stock and treasury stock | | 28,198 | | | 34,775 | | | 78,830 | | | 70,455 | | | 106,068 | |
Retirement of long-term debt | | (1,843,169 | ) | | (2,486,806 | ) | | (1,369,945 | ) | | (1,804,373 | ) | | (2,689,206 | ) |
Repurchase of common stock | | (613,125 | ) | | (512,351 | ) | | (1,215,578 | ) | | (584,193 | ) | | (878,188 | ) |
Redemption of preferred stock | | (1,847 | ) | | - | | | (57,827 | ) | | (183,881 | ) | | (33,719 | ) |
Changes in short-term borrowings – net | | (25,000 | ) | | 30,000 | | | - | | | (15,000 | ) | | 39,850 | |
Dividends paid: | | | | | | | | | | | | | | | |
Common stock | | (576,956 | ) | | (573,045 | ) | | (507,327 | ) | | (448,954 | ) | | (453,508 | ) |
Preferred equity | | (19,958 | ) | | (20,025 | ) | | (25,875 | ) | | (28,848 | ) | | (25,472 | ) |
| | | | | | | | | | | | | | | | |
Net cash flow provided by (used in) financing activities | | (1,048,388 | ) | | (70,757 | ) | | (221,586 | ) | | (1,083,727 | ) | | 496,390 | |
| | | | | | | | | | | | | | | | |
Effect of exchange rates on cash and cash equivalents | | (1,316 | ) | | 3,288 | | | 30 | | | (3,207 | ) | | (602 | ) |
| | | | | | | | | | | | | | | | |
Net increase (decrease) in cash and cash equivalents | | (210,940 | ) | | 666,763 | | | 220,483 | | | 433,332 | | | (29,012 | ) |
Cash and cash equivalents at beginning of period | | 1,920,491 | | | 1,253,728 | | | 1,016,152 | | | 582,820 | | | 619,786 | |
| | | | | | | | | | | | | | | | |
Effect of the reconsolidation of Entergy New Orleans on cash and cash equivalents | | - | | | - | | | 17,093 | | | - | | | - | |
Effect of the deconsolidation of Entergy New Orleans on cash and cash equivalents | | - | | | - | | | - | | | - | | | (7,954 | ) |
| | | | | | | | | | | | | | | | |
Cash and cash equivalents at end of period | | $ 1,709,551 | | | $ 1,920,491 | | | $ 1,253,728 | | | $ 1,016,152 | | | $ 582,820 | |
| | | | | | | | | | | | | | | | |
| (a) | 2006 and 2005 reflect deconsolidation of Entergy New Orleans, Inc. |
Certain prior year data has been reclassified to conform with current year presentation.
20
FINANCIAL RESULTS
CONSOLIDATED STATEMENTS OF CASH FLOW (unaudited)
| | | | | | | | | | | | | | | | | |
| In thousands, for the years ended December 31, | | 2009 | | | 2008 | | 2007 | | 2006(a) | | | 2005(a) |
SUPPLEMENTAL DISCLOSURE OF | | | | | | | | | | | | | | | | | |
CASH FLOW INFORMATION: | | | | | | | | | | | | | | | | | |
Cash paid (received) during the period for: | | | | | | | | | | | | | | | | | |
Interest – net of amount capitalized | | $ | 568,417 | | | $ | 612,288 | | $ | 611,197 | | $ | 514,189 | | | $ | 461,345 |
Income taxes | | $ | 43,057 | | | $ | 137,234 | | $ | 376,808 | | $ | (147,435 | ) | | $ | 116,072 |
Noncash financing activities: | | | | | | | | | | | | | | | | | |
Long-tern debt retired (equity unit notes) | | ($ | 500,000 | ) | | $ | - | | $ | - | | $ | - | | | $ | - |
Common stock issued in settlement of equity unit purchase contracts | | $ | 500,000 | | | $ | - | | $ | - | | $ | - | | | $ | - |
| | | | | | | | | | | | | | | | | | |
| (a) | 2006 and 2005 reflect deconsolidation of Entergy New Orleans, Inc. |
CASH FLOW INFORMATION BY BUSINESS
| | | | | | | | | | | | |
| For the years ended December 31, 2009, 2008, 2007, 2006, and 2005. | | UTILITY/
PARENT/
OTHER | | | ENTERGY
NUCLEAR | | | ENERGY
COMMODITY
SERVICES | | | CONSOLIDATED | |
| ($ thousands) | | | | | | | | | | | | |
2009 | | | | | | | | | | | | |
Net cash flow provided by operating activities | | 461,984 | | | 2,434,449 | | | 36,725 | | | 2,933,158 | |
Net cash flow provided by (used in) investing activities | | (110,576 | ) | | (1,978,037 | ) | | (5,781 | ) | | (2,094,394 | ) |
Net cash flow provided by (used in) financing activities | | (528,234 | ) | | (474,028 | ) | | (46,126 | ) | | (1,048,388 | ) |
| | | | |
2008 | | | | | | | | | | | | |
Net cash flow provided by operating activities | | 2,050,984 | | | 1,255,284 | | | 18,060 | | | 3,324,328 | |
Net cash flow provided by (used in) investing activities | | (2,197,024 | ) | | (471,590 | ) | | 78,518 | | | (2,590,096 | ) |
Net cash flow provided by (used in) financing activities | | 811,567 | | | (799,861 | ) | | (82,463 | ) | | (70,757 | ) |
| | | | |
2007 | | | | | | | | | | | | |
Net cash flow provided by (used in) operating activities | | 1,721,098 | | | 879,940 | | | (41,268 | ) | | 2,559,770 | |
Net cash flow provided by (used in) investing activities | | (1,273,575 | ) | | (883,397 | ) | | 39,241 | | | (2,117,731 | ) |
Net cash flow provided by (used in) financing activities | | (260,080 | ) | | 47,705 | | | (9,211 | ) | | (221,586 | ) |
| | | | |
2006(a) | | | | | | | | | | | | |
Net cash flow provided by (used in) operating activities | | 2,708,871 | | | 833,318 | | | (94,350 | ) | | 3,447,839 | |
Net cash flow provided by (used in) investing activities | | (1,487,005 | ) | | (450,219 | ) | | 9,651 | | | (1,927,573 | ) |
Net cash flow provided by (used in) financing activities | | (959,555 | ) | | (211,544 | ) | | 87,372 | | | (1,083,727 | ) |
| | | | |
2005(a) | | | | | | | | | | | | |
Net cash flow provided by (used in) operating activities | | 934,562 | | | 551,263 | | | (18,017 | ) | | 1,467,808 | |
Net cash flow provided by (used in) investing activities | | (1,673,600 | ) | | (368,497 | ) | | 49,489 | | | (1,992,608 | ) |
Net cash flow provided by (used in) financing activities | | 640,489 | | | (110,482 | ) | | (33,617 | ) | | 496,390 | |
| | | | | | | | | | | | | |
| (a) | 2006 and 2005 reflect deconsolidation of Entergy New Orleans, Inc. |
Certain prior year data has been reclassified to conform with current year presentation.
21
FINANCIAL RESULTS
CONSOLIDATED STATEMENTS OF RETAINED EARNINGS, COMPREHENSIVE INCOME, AND PAID–IN CAPITAL (unaudited)
| | | | | | | | | | | | | | | | | | | | | | | | | | | | | | | | | | | | | | | | |
In thousands, for the years ended
December 31, | | 2009 | | | | | | 2008 | | | | | | 2007 | | | | | | 2006 | | | | | | 2005 | | | | |
RETAINED EARNINGS | | | | | | | | | | | | | | | | | | | | | | | | | | | | | | | | | | | | | | | | |
Retained Earnings – Beginning of period | | $ | 7,382,719 | | | | | | | $ | 6,735,965 | | | | | | | $ | 6,113,042 | | | | | | | $ | 5,433,931 | | | | | | | $ | 4,989,826 | | | | | |
Add: | | | | | | | | | | | | | | | | | | | | | | | | | | | | | | | | | | | | | | | | |
Net income attributable to Entergy Corporation | | | 1,231,092 | | | $ | 1,231,092 | | | | 1,220,566 | | | $ | 1,220,566 | | | | 1,134,849 | | | $ | 1,134,849 | | | | 1,132,602 | | | $ | 1,132,602 | | | | 898,331 | | | $ | 898,331 | |
Adjustment related to implementation of new accounting pronouncements | | | 6,365 | | | | | | | | - | | | | | | | | (4,600 | ) | | | | | | | - | | | | | | | | - | | | | | |
| | | | | | | | | | | | | | | | | | | | | | | | | | | | | | | | | | | | | | | | | |
Total | | | 1,237,457 | | | | | | | | 1,220,566 | | | | | | | | 1,130,249 | | | | | | | | 1,132,602 | | | | | | | | 898,331 | | | | | |
| | | | | | | | | | | | | | | | | | | | | | | | | | | | | | | | | | | | | | | | | |
Deduct: | | | | | | | | | | | | | | | | | | | | | | | | | | | | | | | | | | | | | | | | |
Dividends declared on common stock | | | 576,913 | | | | | | | | 573,924 | | | | | | | | 507,326 | | | | | | | | 448,572 | | | | | | | | 453,657 | | | | | |
Capital stock and other expenses | | | 141 | | | | | | | | (112 | ) | | | | | | | - | | | | | | | | 4,919 | | | | | | | | 569 | | | | | |
| | | | | | | | | | | | | | | | | | | | | | | | | | | | | | | | | | | | | | | | | |
Total | | | 577,054 | | | | | | | | 573,812 | | | | | | | | 507,326 | | | | | | | | 453,491 | | | | | | | | 454,226 | | | | | |
| | | | | | | | | | | | | | | | | | | | | | | | | | | | | | | | | | | | | | | | | |
Retained Earnings – End of period | | $ | 8,043,122 | | | | | | | $ | 7,382,719 | | | | | | | $ | 6,735,965 | | | | | | | $ | 6,113,042 | | | | | | | $ | 5,433,931 | | | | | |
| | | | | | | | | | | | | | | | | | | | | | | | | | | | | | | | | | | | | | | | | |
ACCUMULATED OTHER COMPREHENSIVE INCOME (LOSS) | | | | | | | | | | | | | | | | | | | | | | | | | | | | | | | | | | | | | | | | |
Balance at beginning of period: | | | | | | | | | | | | | | | | | | | | | | | | | | | | | | | | | | | | | | | | |
Accumulated derivative instrument fair value changes | | $ | 120,830 | | | | | | | $ | (12,540 | ) | | | | | | $ | (105,578 | ) | | | | | | $ | (392,614 | ) | | | | | | $ | (141,411 | ) | | | | |
Pension and other postretirement liabilities | | | (232,232 | ) | | | | | | | (107,145 | ) | | | | | | | (105,909 | ) | | | | | | | - | | | | | | | | - | | | | | |
Net unrealized investment gains | | | (4,402 | ) | | | | | | | 121,611 | | | | | | | | 104,551 | | | | | | | | 67,923 | | | | | | | | 51,915 | | | | | |
Foreign currency translation | | | 3,106 | | | | | | | | 6,394 | | | | | | | | 6,424 | | | | | | | | 3,217 | | | | | | | | 2,615 | | | | | |
Minimum pension liability | | | - | | | | | | | | - | | | | | | | | - | | | | | | | | (22,345 | ) | | | | | | | (6,572 | ) | | | | |
| | | | | | | | | | | | | | | | | | | | | | | | | | | | | | | | | | | | | | | | | |
Total | | | (112,698 | ) | | | | | | | 8,320 | | | | | | | | (100,512 | ) | | | | | | | (343,819 | ) | | | | | | | (93,453 | ) | | | | |
| | | | | | | | | | | | | | | | | | | | | | | | | | | | | | | | | | | | | | | | | |
Net derivative instrument fair value changes arising during the period (net of tax expense (benefit) of $333, $78,837, $57,185, $187,462, and $(159,236)) | | | (2,887 | ) | | | (2,887 | ) | | | 133,370 | | | | 133,370 | | | | 93,038 | | | | 93,038 | | | | 287,036 | | | | 287,036 | | | | (251,203 | ) | | | (251,203 | ) |
Pension and other postretirement liabilities (net of tax expense (benefit) of $(34,415), $(68,076), $29,994, $(92,419), and $0) | | | (35,707 | ) | | | (35,707 | ) | | | (125,087 | ) | | | (125,087 | ) | | | (1,236 | ) | | | (1,236 | ) | | | (75,805 | ) | | | - | | | | - | | | | - | |
Net unrealized investment gains (net of tax expense (benefit) of $102,845, $(108,049), $23,562, $28,428, and $10,573) | | | 82,929 | | | | 82,929 | | | | (126,013 | ) | | | (126,013 | ) | | | 17,060 | | | | 17,060 | | | | 36,628 | | | | 36,628 | | | | 16,008 | | | | 16,008 | |
Adjustment related to implementation of new accounting pronouncement (net of tax benefit of $(4,921)) | | | (6,365 | ) | | | - | | | | - | | | | - | | | | - | | | | - | | | | - | | | | - | | | | - | | | | - | |
Foreign currency translation (net of tax expense (benefit) of $(246), $(1,770), $(16), $1,122, and $211) | | | (457 | ) | | | (457 | ) | | | (3,288 | ) | | | (3,288 | ) | | | (30 | ) | | | (30 | ) | | | 3,207 | | | | 3,207 | | | | 602 | | | | 602 | |
Minimum pension liability (net of tax expense (benefit) of $0, $0, $0, $(5,911), and $(9,176)) | | | - | | | | - | | | | - | | | | - | | | | - | | | | - | | | | (7,759 | ) | | | (7,759 | ) | | | (15,773 | ) | | | (15,773 | ) |
| | | | | | | | | | | | | | | | | | | | | | | | | | | | | | | | | | | | | | | | | |
Balance at end of period: | | | | | | | | | | | | | | | | | | | | | | | | | | | | | | | | | | | | | | | | |
Accumulated derivative instrument fair value changes | | | 117,943 | | | | | | | | 120,830 | | | | | | | | (12,540 | ) | | | | | | | (105,578 | ) | | | | | | | (392,614 | ) | | | | |
Pension and other postretirement liabilities | | | (267,939 | ) | | | | | | | (232,232 | ) | | | | | | | (107,145 | ) | | | | | | | (105,909 | ) | | | | | | | - | | | | | |
Net unrealized investment gains | | | 72,162 | | | | | | | | (4,402 | ) | | | | | | | 121,611 | | | | | | | | 104,551 | | | | | | | | 67,923 | | | | | |
Foreign currency translation | | | 2,649 | | | | | | | | 3,106 | | | | | | | | 6,394 | | | | | | | | 6,424 | | | | | | | | 3,217 | | | | | |
Minimum pension liability | | | - | | | | | | | | - | | | | | | | | - | | | | | | | | - | | | | | | | | (22,345 | ) | | | | |
| | | | | | | | | | | | | | | | | | | | | | | | | | | | | | | | | | | | | | | | | |
Total | | $ | (75,185 | ) | | | | | | $ | (112,698 | ) | | | | | | $ | 8,320 | | | | | | | $ | (100,512 | ) | | | | | | $ | (343,819 | ) | | | | |
| | | | | | | | | | | | | | | | | | | | | | | | | | | | | | | | | | | | | | | | | |
Add: preferred dividend requirements of subsidiaries | | | | | | | 19,958 | | | | | | | | 19,969 | | | | | | | | 25,105 | | | | | | | | 27,783 | | | | | | | | 25,427 | |
| | | | | | | | | | | | | | | | | | | | | | | | | | | | | | | | | | | | | | | | | |
Comprehensive Income | | | | | | $ | 1,294,928 | | | | | | | $ | 1,119,517 | | | | | | | $ | 1,268,786 | | | | | | | $ | 1,479,497 | | | | | | | $ | 673,392 | |
| | | | | | | | | | | | | | | | | | | | | | | | | | | | | | | | | | | | | | | | | |
| | | | | | | | | | |
PAID-IN CAPITAL | | | | | | | | | | | | | | | | | | | | | | | | | | | | | | | | | | | | | | | | |
Paid-in Capital – Beginning of period | | $ | 4,869,303 | | | | | | | $ | 4,850,769 | | | | | | | $ | 4,827,265 | | | | | | | $ | 4,817,637 | | | | | | | $ | 4,835,375 | | | | | |
Add (Deduct): | | | | | | | | | | | | | | | | | | | | | | | | | | | | | | | | | | | | | | | | |
Issuance of equity units | | | - | | | | | | | | - | | | | | | | | - | | | | | | | | - | | | | | | | | (39,904 | ) | | | | |
Common stock issuances in settlement of equity unit purchase contracts | | | 499,934 | | | | | | | | - | | | | | | | | - | | | | | | | | - | | | | | | | | - | | | | | |
Common stock issuances related to stock plans | | | 805 | | | | | | | | 18,534 | | | | | | | | 23,504 | | | | | | | | 9,628 | | | | | | | | 22,166 | | | | | |
| | | | | | | | | | | | | | | | | | | | | | | | | | | | | | | | | | | | | | | | | |
Total | | $ | 500,739 | | | | | | | $ | 18,534 | | | | | | | $ | 23,504 | | | | | | | $ | 9,628 | | | | | | | $ | (17,738 | ) | | | | |
| | | | | | | | | | | | | | | | | | | | | | | | | | | | | | | | | | | | | | | | | |
Paid-in Capital – End of period | | $ | 5,370,042 | | | | | | | $ | 4,869,303 | | | | | | | $ | 4,850,769 | | | | | | | $ | 4,827,265 | | | | | | | $ | 4,817,637 | | | | | |
| | | | | | | | | | | | | | | | | | | | | | | | | | | | | | | | | | | | | | | | | |
Certain prior year data has been reclassified to conform with current year presentation.
22
CONSOLIDATED CAPITAL EXPENDITURES
HISTORICAL CAPITAL EXPENDITURES
| | | | | | | | | | |
| | | | | | | | | | | |
| ($ millions) | | 2009 | | 2008 | | 2007 | | 2006 | | 2005 |
Utility/Parent/Other | | | | | | | | | | |
Entergy New Orleans | | 62 | | 103 | | 94 | | 76 | | 58 |
All others | | 1,510 | | 2,101 | | 1,225 | | 1,398 | | 1,458 |
Entergy Nuclear | | 430 | | 344 | | 595 | | 303 | | 161 |
Energy Commodity Services | | 1 | | 3 | | - | | 21 | | 1 |
| | | | | | | | | | | |
Total Historical Capital Expenditures | | 2,003 | | 2,551 | | 1,914 | | 1,798 | | 1,678 |
| | | | | | | | | | | |
PLANNED CAPITAL EXPENDITURES
| | | | | | |
| ($ millions) | | 2010 | | 2011 | | 2012 |
Maintenance Capital: | | | | | | |
Utility/Parent/Other | | 785 | | 790 | | 830 |
Entergy Nuclear | | 92 | | 140 | | 123 |
| | | | | | | |
Total Maintenance Capital | | 877 | | 930 | | 953 |
| | | | | | | |
Other Capital Commitments: | | | | | | |
Utility/Parent/Other | | 991 | | 1,578 | | 926 |
Entergy Nuclear | | 349 | | 220 | | 219 |
| | | | | | | |
Total Other Capital Commitments | | 1,340 | | 1,798 | | 1,145 |
| | | | | | | |
Total Planned Capital Expenditures | | 2,217 | | 2,728 | | 2,098 |
| | | | | | | |
The three year capital plan includes $420 million for the installation of scrubbers and low NOx burners at Entergy Arkansas’ White Bluff coal plant which was delayed upon approval of a variance from the October 2013 compliance date by the Arkansas Pollution Control and Ecology Commission.
ENTERGY CORPORATION SECURITIES DETAIL
| | | | | | | | | | | | | | | | | |
| ENTERGY CORPORATION LONG-TERM DEBT | | RATE | | MATURITY
DATE | | FIRST CALL
DATE | | CURRENT OR
FIRST CALL
PRICE | | | | | | | |
| | | | | | | | | AS OF DECEMBER 31, |
| CUSIP | | | | | | | | 2009 | | | 2008 | | 2007 |
| | | | | | | | | | | | | | | | ($ millions) | | |
| | $3.5B Bank Credit Facility | | | | 08/12 | | | | | | 2,566 | | | 3,237 | | 2,251 |
| | Bank Term Loan | | 1.07% | | 06/10 | | | | | | 60 | | | 60 | | 60 |
29364GA*4 | | 6.17% Notes | | 6.17% | | 03/08 | | Now | | MW (T+.50%) | | - | | | - | | 72 |
29364GB*3 | | 6.23% Notes | | 6.23% | | 03/08 | | Now | | MW (T+.50%) | | - | | | - | | 15 |
29364GAC7 | | 6.13% Notes | | 6.13% | | 09/08 | | Now | | MW (T+.50%) | | - | | | - | | 150 |
29364GAA1 | | 7.75% Notes | | 7.75% | | 12/09 | | Now | | MW (T+.50%) | | - | | | 267 | | 267 |
29364GAB9 | | 6.58% Notes | | 6.58% | | 05/10 | | Now | | MW (T+.50%) | | 75 | | | 75 | | 75 |
29364GB@1 | | 6.9% Notes | | 6.9% | | 11/10 | | Now | | MW (T+.50%) | | 140 | | | 140 | | 140 |
29364G202, 29364G301 | | 7.625% Notes(a) | | 7.625% | | 02/11 | | | | | | - | | | 500 | | 500 |
29364GA@2 | | 7.06% Notes | | 7.06% | | 03/11 | | Now | | MW (T+.50%) | | 86 | | | 86 | | 86 |
| | | | | | | | | | | | | | | | | | |
| | Total | | | | | | | | | | 2,927 | | | 4,365 | | 3,616 |
| | | | | | | | | | | | | | | | | | |
| (a) | In December 2005, Entergy Corporation sold 10 million equity units with a stated amount of $50 each. An equity unit consisted of (1) a note, initially due February 2011 and initially bearing interest at an annual rate of 5.75%, and (2) a purchase contract that obligated the holder of the equity unit to purchase for $50 between 0.5705 and 0.7074 shares of Entergy Corporation common stock on or before February 17, 2009. Entergy paid the holders quarterly contract adjustment payments of 1.875% per year on the stated amount of $50 per equity unit. Under the terms of the purchase contracts, Entergy attempted to remarket the notes in February 2009 but was unsuccessful, the note holders put the notes to Entergy, Entergy retired the notes, and Entergy issued 6,598,000 shares of common stock in the settlement of the purchase contracts. |
SECURITIES RATINGS (OUTLOOK)
| | | | |
| | | CORPORATE CREDIT |
| As of June 2010. | | MOODY’S | | S&P |
| Entergy Corporation | | Baa3 (stable) | | BBB (outlook stable) |
23
UTILITY SELECTED DATA
UTILITY QUARTERLY FINANCIAL METRICS
| | | | | | | | | | | | | | | | | | | | | | | | | |
| | | 2009 | | 2008 | | | YTD % | |
| | | 1Q | | | 2Q | | 3Q | | 4Q | | YTD | | 1Q | | 2Q | | 3Q | | 4Q | | YTD | | | CHANGE | |
GAAP MEASURES | | | | | | | | | | | | | | | | | | | | | | | | | |
As-Reported Net Income ($ millions) | | 111.6 | | | 147.2 | | 294.8 | | 137.9 | | 691.6 | | 117.1 | | 159.7 | | 257.8 | | 53.2 | | 587.8 | | | 17.7 | |
Return on Average Invested Capital – | | | | | | | | | | | | | | | | | | | | | | | | | |
As-Reported (%)* | | 6.0 | | | 5.8 | | 5.9 | | 6.4 | | 6.4 | | 7.0 | | 6.9 | | 6.1 | | 6.0 | | 6.0 | | | 6.7 | |
Return on Average Common Equity – | | | | | | | | | | | | | | | | | | | | | | | | | |
As-Reported (%)* | | 8.8 | | | 8.5 | | 8.8 | | 10.1 | | 10.1 | | 10.9 | | 10.9 | | 9.4 | | 8.9 | | 8.9 | | | 13.5 | |
Debt to Capital Ratio (%) | | 53.0 | | | 53.5 | | 53.1 | | 55.6 | | 55.6 | | 51.9 | | 52.1 | | 53.1 | | 53.0 | | 53.0 | | | 4.9 | |
Debt to Capital Ratio, excluding securitization debt (%) | | 52.0 | | | 52.6 | | 52.2 | | 53.2 | | 53.2 | | 50.8 | | 51.0 | | 52.1 | | 52.0 | | 52.0 | | | 2.3 | |
NON-GAAP MEASURES | | | | | | | | | | | | | | | | | | | | | | | | | |
Operational Earnings ($ millions) | | 111.6 | | | 147.2 | | 294.8 | | 137.9 | | 691.6 | | 117.1 | | 159.7 | | 257.8 | | 53.2 | | 587.8 | | | 17.7 | |
Return on Average Invested Capital – | | | | | | | | | | | | | | | | | | | | | | | | | |
Operational (%)* | | 6.0 | | | 5.8 | | 5.9 | | 6.4 | | 6.4 | | 7.1 | | 7.0 | | 6.2 | | 6.0 | | 6.0 | | | 6.7 | |
Return on Average Common Equity – | | | | | | | | | | | | | | | | | | | | | | | | | |
Operational (%)* | | 8.8 | | | 8.5 | | 8.8 | | 10.1 | | 10.1 | | 11.1 | | 11.1 | | 9.6 | | 8.9 | | 8.9 | | | 13.5 | |
Net Debt to Net Capital Ratio, excluding securitization debt (%) | | 50.4 | | | 50.5 | | 49.3 | | 49.2 | | 49.2 | | 49.7 | | 49.8 | | 49.6 | | 50.0 | | 50.0 | | | (1.6 | ) |
| | | | | | | | | | | | | | | | | | | | | | | | | | |
| * | Rolling twelve months. Totals may not foot due to rounding. |
UTILITY ANNUAL FINANCIAL METRICS
| | | | | | | | | | |
| | | 2009 | | 2008 | | 2007 | | 2006(a) | | 2005(a) |
GAAP MEASURES | | | | | | | | | | |
As-Reported Net Income ($ millions) | | 691.6 | | 587.8 | | 682.7 | | 691.2 | | 659.8 |
Return on Average Invested Capital – As-Reported (%) | | 6.4 | | 6.0 | | 6.9 | | 7.2 | | 7.1 |
Return on Average Common Equity – As-Reported (%) | | 10.1 | | 8.9 | | 10.6 | | 11.3 | | 11.4 |
Debt to Capital Ratio (%) | | 55.6 | | 53.0 | | 51.5 | | 51.3 | | 51.8 |
Debt to Capital Ratio, excluding securitization debt (%) | | 53.2 | | 52.0 | | 50.3 | | 51.3 | | 51.8 |
NON-GAAP MEASURES | | | | | | | | | | |
Operational Earnings ($ millions) | | 691.6 | | 587.8 | | 696.4 | | 687.1 | | 659.8 |
Return on Average Invested Capital – Operational (%) | | 6.4 | | 6.0 | | 7.0 | | 7.2 | | 7.1 |
Return on Average Common Equity – Operational (%) | | 10.1 | | 8.9 | | 10.8 | | 11.2 | | 11.4 |
Net Debt to Net Capital Ratio, excluding securitization debt (%) | | 49.2 | | 50.0 | | 47.2 | | 49.1 | | 50.7 |
| | | | | | | | | | | |
| (a) | 2006 and 2005 reflect deconsolidation of Entergy New Orleans, Inc. |
UTILITY HISTORICAL CAPITAL EXPENDITURES(a)
| | | | | | | | | | |
| ($ millions) | | 2009 | | 2008 | | 2007 | | 2006 | | 2005 |
Entergy Arkansas | | 264 | | 584 | | 305 | | 259 | | 317 |
Entergy Gulf States Louisiana(b) | | 274 | | 360 | | 168 | | 159 | | 157 |
Entergy Louisiana | | 468 | | 584 | | 322 | | 449 | | 551 |
Entergy Mississippi | | 131 | | 156 | | 157 | | 240 | | 164 |
Entergy New Orleans | | 62 | | 103 | | 94 | | 76 | | 58 |
Entergy Texas | | 188 | | 284 | | 167 | | 217 | | 214 |
System Energy Resources | | 91 | | 86 | | 84 | | 34 | | 37 |
Other | | 94 | | 31 | | 19 | | 18 | | 7 |
| | | | | | | | | | | |
Total excluding Entergy New Orleans | | 1,510 | | 2,085 | | 1,222 | | 1,376 | | 1,447 |
| | | | | | | | | | | |
Total including Entergy New Orleans | | 1,572 | | 2,188 | | 1,316 | | 1,452 | | 1,505 |
| | | | | | | | | | | |
| (a) | Historical capital expenditures include storm capital spending. |
| (b) | Excludes Entergy Texas capital expenditures. |
Certain prior year data has been reclassified to conform with current year presentation.
UTILITY PLANNED CAPITAL EXPENDITURES(a)
| | | | | | | | | | | | |
| | | 2010 | | 2011 | | 2012 |
| ($ millions) | | MAINTENANCE
CAPITAL | | CAPITAL
COMMITMENTS | | MAINTENANCE
CAPITAL | | CAPITAL
COMMITMENTS | | MAINTENANCE
CAPITAL | | CAPITAL
COMMITMENTS |
Entergy Arkansas | | 188 | | 211 | | 193 | | 346 | | 199 | | 263 |
Entergy Gulf States Louisiana | | 128 | | 127 | | 125 | | 124 | | 130 | | 109 |
Entergy Louisiana | | 146 | | 357 | | 153 | | 776 | | 157 | | 194 |
Entergy Mississippi | | 120 | | 99 | | 126 | | 61 | | 122 | | 66 |
Entergy New Orleans | | 39 | | 47 | | 32 | | 1 | | 33 | | 1 |
Entergy Texas | | 106 | | 74 | | 98 | | 90 | | 114 | | 123 |
System Energy Resources | | 19 | | 51 | | 13 | | 175 | | 20 | | 159 |
Other | | 30 | | 25 | | 43 | | 5 | | 47 | | 11 |
| | | | | | | | | | | | | |
Total | | 776 | | 991 | | 783 | | 1,578 | | 822 | | 926 |
| | | | | | | | | | | | | |
| (a) | Planned capital expenditures do not include storm capital spending. |
UTILITY SECURITIES RATINGS (OUTLOOK)
| | | | | | | | |
| | | MORTGAGE BONDS | | PREFERRED STOCK |
| As of June 2010. | | MOODY’S | | S&P | | MOODY’S | | S&P |
Entergy Arkansas, Inc. | | A3 (stable) | | A– (outlook stable) | | Ba1 | | BB+ |
Entergy Gulf States Louisiana, L.L.C. | | A3 (stable) | | BBB+ (outlook stable) | | Ba1 | | BB+ |
Entergy Louisiana, LLC | | A3 (stable) | | A– (outlook stable) | | Ba1 | | BB+ |
Entergy Mississippi, Inc. | | Baa1 (stable) | | A– (outlook stable) | | Ba2 | | BB+ |
Entergy New Orleans, Inc. | | Baa3 (stable) | | BBB+ (outlook stable) | | B1 | | BB |
Entergy Texas, Inc. | | Baa2 (stable) | | BBB+ (outlook stable) | | n/a | | n/a |
System Energy Resources, Inc. | | Baa2 (stable) | | BBB+ (outlook stable) | | - | | - |
| | | | | | | | | |
24
UTILITY FINANCIAL RESULTS
2009 UTILITY/PARENT/OTHER CONSOLIDATING INCOME STATEMENT (unaudited)
| | | | | | | | | | | | | | | | | | | | | | | | | | | | | | | | | | | | |
In thousands, for the year ending
December 31, 2009. | | EAI | | | EGSL | | | ELL | | | EMI | | | ENOI | | | ETI | | | SERI | | | PARENT/
OTHER
ELIMINATIONS | | | UTILITY/
PARENT/
OTHER | |
OPERATING REVENUES: | | | | | | | | | | | | | | | | | | | | | | | | | | | | | | | | | | | | |
Electric | | $ | 2,211,263 | | | $ | 1,776,610 | | | $ | 2,183,586 | | | $ | 1,177,304 | | | $ | 535,985 | | | $ | 1,563,823 | | | $ | 554,007 | | | $ | (2,119,438 | ) | | $ | 7,883,140 | |
Natural gas | | | - | | | | 67,776 | | | | - | | | | - | | | | 104,437 | | | | - | | | | - | | | | - | | | | 172,213 | |
Competitive businesses | | | - | | | | - | | | | - | | | | - | | | | | | | | - | | | | - | | | | 29,953 | | | | 29,953 | |
| | | | | | | | | | | | | | | | | | | | | | | | | | | | | | | | | | | | | |
Total | | | 2,211,263 | | | | 1,844,386 | | | | 2,183,586 | | | | 1,177,304 | | | | 640,422 | | | | 1,563,823 | | | | 554,007 | | | | (2,089,485 | ) | | | 8,085,306 | |
| | | | | | | | | | | | | | | | | | | | | | | | | | | | | | | | | | | | | |
OPERATING EXPENSES: | | | | | | | | | | | | | | | | | | | | | | | | | | | | | | | | | | | | |
Operation and maintenance: | | | | | | | | | | | | | | | | | | | | | | | | | | | | | | | | | | | | |
Fuel, fuel-related expenses, and gas purchased for resale | | | 298,219 | | | | 251,393 | | | | 428,904 | | | | 340,804 | | | | 196,917 | | | | 449,335 | | | | 63,877 | | | | (2,556 | ) | | | 2,026,893 | |
Purchased power | | | 795,526 | | | | 732,943 | | | | 782,235 | | | | 359,664 | | | | 198,836 | | | | 584,550 | | | | - | | | | (2,097,336 | ) | | | 1,356,418 | |
Nuclear refueling outage expenses | | | 42,148 | | | | 21,787 | | | | 21,895 | | | | - | | | | - | | | | - | | | | 19,186 | | | | - | | | | 105,016 | |
Other operation and maintenance | | | 475,222 | | | | 332,450 | | | | 401,898 | | | | 217,452 | | | | 107,803 | | | | 204,524 | | | | 120,707 | | | | (8,966 | ) | | | 1,851,090 | |
Decommissioning | | | 34,575 | | | | 13,591 | | | | 21,377 | | | | - | | | | - | | | | 195 | | | | 29,451 | | | | 494 | | | | 99,683 | |
Taxes other than income taxes | | | 80,829 | | | | 67,559 | | | | 66,627 | | | | 63,381 | | | | 40,476 | | | | 55,480 | | | | 24,246 | | | | 5,359 | | | | 403,957 | |
Depreciation and amortization | | | 252,742 | | | | 135,489 | | | | 203,791 | | | | 86,872 | | | | 33,943 | | | | 73,840 | | | | 140,056 | | | | 7,025 | | | | 933,758 | |
Other regulatory charges (credits) – net | | | 15,161 | | | | (1,261 | ) | | | (7,561 | ) | | | (57,056 | ) | | | 1,709 | | | | 44,807 | | | | (17,525 | ) | | | (1 | ) | | | (21,727 | ) |
| | | | | | | | | | | | | | | | | | | | | | | | | | | | | | | | | | | | | |
Total | | | 1,994,422 | | | | 1,553,951 | | | | 1,919,166 | | | | 1,011,117 | | | | 579,684 | | | | 1,412,731 | | | | 379,998 | | | | (2,095,981 | ) | | | 6,755,088 | |
| | | | | | | | | | | | | | | | | | | | | | | | | | | | | | | | | | | | | |
OPERATING INCOME | | | 216,841 | | | | 290,435 | | | | 264,420 | | | | 166,187 | | | | 60,738 | | | | 151,092 | | | | 174,009 | | | | 6,496 | | | | 1,330,218 | |
| | | | | | | | | | | | | | | | | | | | | | | | | | | | | | | | | | | | | |
| | | | | | | | | |
OTHER INCOME: | | | | | | | | | | | | | | | | | | | | | | | | | | | | | | | | | | | | |
Allowance for equity funds used during construction | | | 5,219 | | | | 5,426 | | | | 27,990 | | | | 2,964 | | | | 230 | | | | 5,232 | | | | 12,484 | | | | - | | | | 59,545 | |
Interest and dividend income | | | 19,321 | | | | 69,951 | | | | 75,522 | | | | 863 | | | | 3,762 | | | | 47,541 | | | | 4,507 | | | | (68,067 | ) | | | 153,400 | |
Equity in earnings (loss) of unconsolidated equity affiliates | | | - | | | | - | | | | - | | | | - | | | | - | | | | - | | | | - | | | | (3,327 | ) | | | (3,327 | ) |
Miscellaneous – net | | | (3,569 | ) | | | (8,764 | ) | | | (4,425 | ) | | | (564 | ) | | | (1,125 | ) | | | 544 | | | | (1,813 | ) | | | 7,718 | | | | (11,998 | ) |
| | | | | | | | | | | | | | | | | | | | | | | | | | | | | | | | | | | | | |
Total | | | 20,971 | | | | 66,613 | | | | 99,087 | | | | 3,263 | | | | 2,867 | | | | 53,317 | | | | 15,178 | | | | (63,676 | ) | | | 197,620 | |
| | | | | | | | | | | | | | | | | | | | | | | | | | | | | | | | | | | | | |
INTEREST AND OTHER CHARGES: | | | | | | | | | | | | | | | | | | | | | | | | | | | | | | | | | | | | |
Interest on long-term debt | | | 85,484 | | | | 110,819 | | | | 96,353 | | | | 47,414 | | | | 11,628 | | | | 98,957 | | | | 47,422 | | | | 13,374 | | | | 511,451 | |
Other interest – net | | | 6,856 | | | | 7,424 | | | | 7,318 | | | | 3,868 | | | | 5,337 | | | | 7,206 | | | | 148 | | | | 124,213 | | | | 162,370 | |
Allowance for borrowed funds used during construction | | | (3,159 | ) | | | (3,427 | ) | | | (18,059 | ) | | | (1,791 | ) | | | (98 | ) | | | (2,510 | ) | | | (4,192 | ) | | | 1 | | | | (33,235 | ) |
| | | | | | | | | | | | | | | | | | | | | | | | | | | | | | | | | | | | | |
Total | | | 89,181 | | | | 114,816 | | | | 85,612 | | | | 49,491 | | | | 16,867 | | | | 103,653 | | | | 43,378 | | | | 137,588 | | | | 640,586 | |
| | | | | | | | | | | | | | | | | | | | | | | | | | | | | | | | | | | | | |
INCOME BEFORE INCOME TAXES | | | 148,631 | | | | 242,232 | | | | 277,895 | | | | 119,959 | | | | 46,738 | | | | 100,756 | | | | 145,809 | | | | (194,768 | ) | | | 887,252 | |
Income taxes | | | 81,756 | | | | 89,185 | | | | 45,050 | | | | 42,323 | | | | 15,713 | | | | 36,915 | | | | | | | | (2,390 | ) | | | 308,552 | |
| | | | | | | | | | | | | | | | | | | | | | | | | | | | | | | | | | | | | |
CONSOLIDATED NET INCOME | | | 66,875 | | | | 153,047 | | | | 232,845 | | | | 77,636 | | | | 31,025 | | | | 63,841 | | | | 145,809 | | | | (192,378 | ) | | | 578,700 | |
Preferred dividend requirements and other | | | 6,873 | | | | 825 | | | | 6,950 | | | | 2,828 | | | | 965 | | | | - | | | | 96,901 | | | | (98,013 | ) | | | 17,329 | |
| | | | | | | | | | | | | | | | | | | | | | | | | | | | | | | | | | | | | |
EARNINGS APPLICABLE TO COMMON STOCK/EQUITY | | $ | 60,002 | | | $ | 152,222 | | | $ | 225,895 | | | $ | 74,808 | | | $ | 30,060 | | | $ | 63,841 | | | $ | 48,908 | | | $ | (94,365 | ) | | $ | 561,371 | |
| | | | | | | | | | | | | | | | | | | | | | | | | | | | | | | | | | | | | |
Totals may not foot due to rounding.
25
UTILITY FINANCIAL RESULTS
2009 UTILITY/PARENT/OTHER CONSOLIDATING BALANCE SHEET (unaudited)
| | | | | | | | | | | | | | | | | | | | | | | | | | |
In thousands, as of December 31,
2009. | | EAI | | | EGSL | | | ELL | | | EMI | | | ENOI | | | ETI | | | SERI | | PARENT/
OTHER
RECLASS/
ELIMINATIONS | | | UTILITY/
PARENT/
OTHER | |
ASSETS | | | | | | | | | | | | | | | | | | | | | | | | | | |
CURRENT ASSETS: | | | | | | | | | | | | | | | | | | | | | | | | | | |
Cash and cash equivalents: | | | | | | | | | | | | | | | | | | | | | | | | | | |
Cash | | $ 3,336 | | | $ 139 | | | $ 160 | | | $ 1,147 | | | $ 1,179 | | | $ 1,552 | | | $ 926 | | $ 73,716 | | | $ 82,155 | |
Temporary cash investments | | 82,897 | | | 144,321 | | | 151,689 | | | 90,304 | | | 190,012 | | | 199,151 | | | 263,556 | | 86,095 | | | 1,208,025 | |
| | | | | | | | | | | | | | | | | | | | | | | | | | | |
Total cash and cash equivalents | | 86,233 | | | 144,460 | | | 151,849 | | | 91,451 | | | 191,191 | | | 200,703 | | | 264,482 | | 159,811 | | | 1,290,180 | |
| | | | | | | | | | | | | | | | | | | | | | | | | | | |
Securitization recovery trust account | | - | | | - | | | - | | | - | | | - | | | 13,098 | | | - | | - | | | 13,098 | |
Notes receivable | | - | | | - | | | - | | | - | | | - | | | - | | | - | | 203,916 | | | 203,916 | |
Accounts receivable: | | | | | | | | | | | | | | | | | | | | | | | | | | |
Customer | | 93,754 | | | 38,633 | | | 56,978 | | | 50,092 | | | 41,284 | | | 51,194 | | | - | | 1 | | | 331,936 | |
Allowance for doubtful accounts | | (21,853 | ) | | (1,235 | ) | | (1,312 | ) | | (1,018 | ) | | (1,166 | ) | | (844 | ) | | - | | - | | | (27,428 | ) |
Associated companies | | 91,650 | | | 102,807 | | | 110,425 | | | 36,565 | | | 78,670 | | | 75,437 | | | 139,602 | | (609,775 | ) | | 25,381 | |
Other | | 55,381 | | | 22,425 | | | 9,174 | | | 12,842 | | | 2,299 | | | 10,688 | | | 4,479 | | 20,680 | | | 137,968 | |
Accrued unbilled revenues | | 76,126 | | | 56,425 | | | 72,550 | | | 41,137 | | | 20,328 | | | 35,727 | | | - | | 170 | | | 302,463 | |
| | | | | | | | | | | | | | | | | | | | | | | | | | | |
Total account receivable | | 295,058 | | | 219,055 | | | 247,815 | | | 139,618 | | | 141,415 | | | 172,202 | | | 144,081 | | (588,924 | ) | | 770,320 | |
| | | | | | | | | | | | | | | | | | | | | | | | | | | |
Deferred fuel costs | | 122,802 | | | - | | | - | | | - | | | 3,996 | | | - | | | - | | - | | | 126,798 | |
Accumulated deferred income taxes | | - | | | - | | | - | | | 294 | | | 2,584 | | | 59,399 | | | - | | (62,277 | ) | | - | |
Fuel inventory – at average cost | | 15,060 | | | 29,298 | | | - | | | 5,875 | | | 2,533 | | | 54,957 | | | - | | 87,104 | | | 194,827 | |
Materials and supplies – at average cost | | 132,182 | | | 107,531 | | | 127,812 | | | 37,979 | | | 9,674 | | | 30,432 | | | 80,934 | | (1 | ) | | 526,543 | |
Deferred nuclear refueling outage costs | | 34,492 | | | 26,722 | | | 36,783 | | | - | | | - | | | - | | | 8,432 | | (1 | ) | | 106,428 | |
System agreement cost equalization | | 70,000 | | | - | | | - | | | - | | | - | | | - | | | - | | - | | | 70,000 | |
Note receivable – Entergy New Orleans | | - | | | - | | | 9,353 | | | 7,610 | | | - | | | - | | | 25,560 | | (42,523 | ) | | - | |
Debt assumption by Entergy Texas | | - | | | 167,742 | | | - | | | - | | | - | | | - | | | - | | (167,742 | ) | | - | |
Gas hedge contracts | | - | | | - | | | 3,409 | | | - | | | - | | | - | | | - | | (3,409 | ) | | - | |
Prepayments and other | | 32,668 | | | 42,146 | | | 10,633 | | | 2,820 | | | 4,311 | | | 16,357 | | | 70,302 | | (100,153 | ) | | 79,084 | |
| | | | | | | | | | | | | | | | | | | | | | | | | | | |
Total | | 788,495 | | | 736,954 | | | 587,654 | | | 285,647 | | | 355,704 | | | 547,148 | | | 593,791 | | (514,199 | ) | | 3,381,194 | |
| | | | | | | | | | | | | | | | | | | | | | | | | | | |
OTHER PROPERTY AND INVESTMENTS: | | | | | | | | | | | | | | | | | | | | | | | | | | |
Investment in affiliates – at equity | | 11,201 | | | 189,400 | | | 544,994 | | | 5,535 | | | 3,259 | | | 845 | | | - | | 6,116,370 | | | 6,871,604 | |
Decommissioning trust funds | | 440,220 | | | 349,527 | | | 209,070 | | | - | | | - | | | - | | | 327,046 | | - | | | 1,325,863 | |
Non-utility property – at cost less accumulated depreciation) | | 1,435 | | | 146,190 | | | 1,124 | | | 4,864 | | | 1,016 | | | 1,496 | | | - | | 83,831 | | | 239,956 | |
Storm reserve escrow account | | - | | | - | | | - | | | 31,867 | | | 9,499 | | | - | | | - | | (41,366 | ) | | - | |
Other | | 2,976 | | | 11,342 | | | 810 | | | - | | | - | | | 16,309 | | | - | | 79,208 | | | 110,645 | |
| | | | | | | | | | | | | | | | | | | | | | | | | | | |
Total | | 455,832 | | | 696,459 | | | 755,998 | | | 42,266 | | | 13,774 | | | 18,650 | | | 327,046 | | 6,238,043 | | | 8,548,068 | |
| | | | | | | | | | | | | | | | | | | | | | | | | | | |
PROPERTY, PLANT AND EQUIPMENT | | | | | | | | | | | | | | | | | | | | | | | | | | |
Electric | | 7,602,975 | | | 6,855,075 | | | 7,190,609 | | | 3,070,109 | | | 789,367 | | | 3,074,334 | | | 3,324,876 | | 539,006 | | | 32,446,351 | |
Property under capital lease | | 1,364 | | | - | | | 262,111 | | | 6,418 | | | - | | | - | | | 481,065 | | 32,138 | | | 783,096 | |
Natural gas | | - | | | 113,970 | | | - | | | - | | | 199,847 | | | - | | | - | | 439 | | | 314,256 | |
Construction work in progress | | 114,998 | | | 84,161 | | | 509,667 | | | 62,866 | | | 21,148 | | | 82,167 | | | 198,887 | | 59,929 | | | 1,133,823 | |
Nuclear fuel under capital lease | | 173,076 | | | 156,996 | | | 122,011 | | | - | | | - | | | - | | | 75,438 | | - | | | 527,521 | |
Nuclear fuel | | 11,543 | | | 6,005 | | | - | | | - | | | - | | | | | | 9,333 | | 192,436 | | | 219,317 | |
| | | | | | | | | | | | | | | | | | | | | | | | | | | |
Total property, plant and equipment | | 7,903,956 | | | 7,216,207 | | | 8,084,398 | | | 3,139,393 | | | 1,010,362 | | | 3,156,501 | | | 4,089,599 | | 823,948 | | | 35,424,364 | |
Less – accumulated depreciation and amortization | | 3,534,056 | | | 3,714,199 | | | 3,370,225 | | | 1,115,756 | | | 514,609 | | | 1,210,172 | | | 2,315,141 | | 384,883 | | | 16,159,041 | |
| | | | | | | | | | | | | | | | | | | | | | | | | | | |
Property, plant and equipment – net | | 4,369,900 | | | 3,502,008 | | | 4,714,173 | | | 2,023,637 | | | 495,753 | | | 1,946,329 | | | 1,774,458 | | 439,065 | | | 19,265,323 | |
| | | | | | | | | | | | | | | | | | | | | | | | | | | |
DEFERRED DEBITS AND OTHER ASSETS: | | | | | | | | | | | | | | | | | | | | | | | | | | |
Regulatory assets: | | | | | | | | | | | | | | | | | | | | | | | | | | |
Regulatory asset for income taxes – net | | 51,340 | | | 288,313 | | | 132,086 | | | 34,114 | | | - | | | 95,894 | | | 101,915 | | (84,162 | ) | | 619,500 | |
Other regulatory assets | | 746,955 | | | 299,793 | | | 477,020 | | | 251,407 | | | 125,686 | | | 1,232,101 | | | 290,048 | | 224,144 | | | 3,647,154 | |
Deferred fuel costs | | - | | | 100,124 | | | 67,998 | | | - | | | 4,080 | | | - | | | - | | - | | | 172,202 | |
Long-term receivables | | - | | | 967 | | | 1,500 | | | - | | | - | | | - | | | - | | (2,467 | ) | | - | |
Long-term receivables - associated companies | | - | | | - | | | - | | | - | | | - | | | 34,340 | | | - | | (34,340 | ) | | - | |
Goodwill | | - | | | - | | | - | | | - | | | - | | | - | | | - | | 374,099 | | | 374,099 | |
Other | | 23,118 | | | 11,564 | | | 18,762 | | | 19,564 | | | 6,079 | | | 21,176 | | | 11,824 | | 537,171 | | | 649,258 | |
| | | | | | | | | | | | | | | | | | | | | | | | | | | |
Total | | 821,413 | | | 700,761 | | | 697,366 | | | 305,085 | | | 135,845 | | | 1,383,511 | | | 403,787 | | 1,014,445 | | | 5,462,213 | |
| | | | | | | | | | | | | | | | | | | | | | | | | | | |
TOTAL ASSETS | | $6,435,640 | | | $5,636,182 | | | $6,755,191 | | | $2,656,635 | | | $1,001,076 | | | $3,895,638 | | | $3,099,082 | | $7,177,354 | | | $36,656,798 | |
| | | | | | | | | | | | | | | | | | | | | | | | | | | |
Totals may not foot due to rounding.
26
UTILITY FINANCIAL RESULTS
2009 UTILITY/PARENT/OTHER CONSOLIDATING BALANCE SHEET (unaudited)
| | | | | | | | | | | | | | | | | | | | | | | |
In thousands, as of December 31,
2009. | | EAI | | EGSL | | | ELL | | | EMI | | | ENOI | | ETI | | SERI | | PARENT
OTHER/
RECLASS/
ELIMINATIONS | | | UTILITY/
PARENT/
OTHER | |
LIABILITIES AND SHAREHOLDERS’ OR MEMBERS’ EQUITY | | | | | | | | | | | | | | | | | | | | | | | |
CURRENT LIABILITIES: | | | | | | | | | | | | | | | | | | | | | | | |
Currently maturing long-term debt | | $ 100,000 | | $ 11,975 | | | $ 222,326 | | | $ - | | | $ 30,000 | | $ 167,742 | | $ 41,715 | | $ 107,258 | | | $ 681,016 | |
Notes payable: | | | | | | | | | | | | | | | | | | | | | | | |
Associated companies | | - | | - | | | - | | | - | | | 74,230 | | - | | - | | 1,890,106 | | | 1,964,336 | |
Other | | - | | - | | | - | | | - | | | - | | - | | - | | 30,031 | | | 30,031 | |
Accounts payable: | | | | | | | | | | | | | | | | | | | | | | | |
Associated companies | | 107,584 | | 52,622 | | | 56,057 | | | 58,421 | | | 28,138 | | 47,677 | | 5,349 | | (225,619 | ) | | 130,229 | |
Other | | 111,523 | | 91,604 | | | 141,311 | | | 31,176 | | | 23,653 | | 70,147 | | 45,826 | | 238,122 | | | 753,362 | |
Customer deposits | | 67,480 | | 45,645 | | | 82,864 | | | 62,316 | | | 20,505 | | 39,665 | | - | | 4,617 | | | 323,092 | |
Taxes accrued | | - | | - | | | 25,993 | | | 41,603 | | | 1,677 | | 77,581 | | - | | (38,910 | ) | | 107,944 | |
Accumulated deferred income taxes | | 74,794 | | 12,219 | | | 13,349 | | | - | | | - | | - | | 3,040 | | (54,818 | ) | | 48,584 | |
Interest accrued | | 24,104 | | 24,709 | | | 32,955 | | | 19,179 | | | 3,949 | | 30,575 | | 51,257 | | 4,647 | | | 191,375 | |
Deferred fuel costs | | - | | 42,351 | | | 1,633 | | | 72,907 | | | - | | 102,748 | | - | | - | | | 219,639 | |
Obligations under capital leases | | 72,838 | | 30,387 | | | 56,528 | | | - | | | - | | - | | 50,445 | | 2,298 | | | 212,496 | |
Pension and other postretirement liabilities | | - | | 8,021 | | | 9,153 | | | - | | | - | | 935 | | - | | 31,803 | | | 49,912 | |
System agreement cost equalization | | - | | 10,000 | | | 54,000 | | | - | | | 6,000 | | 117,204 | | - | | - | | | 187,204 | |
Gas hedge contracts | | - | | 263 | | | - | | | - | | | - | | - | | - | | (263 | ) | | - | |
Other | | 14,742 | | 8,790 | | | 9,831 | | | 5,399 | | | 5,803 | | 2,674 | | - | | 7,040 | | | 54,279 | |
| | | | | | | | | | | | | | | | | | | | | | | | |
Total | | 573,065 | | 338,586 | | | 706,000 | | | 291,001 | | | 193,955 | | 656,948 | | 197,632 | | 1,996,312 | | | 4,953,499 | |
| | | | | | | | | | | | | | | | | | | | | | | | |
NON-CURRENT LIABILITIES: | | | | | | | | | | | | | | | | | | | | | | | |
Accumulated deferred income taxes and taxes accrued | | 1,493,580 | | 1,345,984 | | | 1,703,272 | | | 578,759 | | | 147,496 | | 740,074 | | 588,722 | | (1,988,048 | ) | | 4,609,839 | |
Accumulated deferred investment tax credits | | 47,909 | | 88,246 | | | 79,650 | | | 7,514 | | | 2,153 | | 22,532 | | 58,231 | | 2,160 | | | 308,395 | |
Obligations under capital leases | | 101,601 | | 126,226 | | | 65,483 | | | 4,949 | | | - | | - | | 24,993 | | 30,981 | | | 354,233 | |
Regulatory liability for income taxes – net | | - | | - | | | - | | | - | | | 58,970 | | - | | - | | (58,970 | ) | | - | |
Other regulatory liabilities | | 101,370 | | 47,423 | | | 45,711 | | | 2,905 | | | 43,148 | | 20,417 | | 197,437 | | (36,426 | ) | | 421,985 | |
Decommissioning and asset retirement cost liabilities | | 566,374 | | 321,158 | | | 298,216 | | | 5,071 | | | 3,174 | | 3,445 | | 421,408 | | (1 | ) | | 1,618,845 | |
Accumulated provisions | | 13,217 | | 14,669 | | | 20,301 | | | 41,403 | | | 15,991 | | 8,710 | | 2,009 | | 15,925 | | | 132,225 | |
Pension and other postretirement liabilities | | 448,421 | | 234,473 | | | 296,347 | | | 111,437 | | | 43,773 | | 78,722 | | 75,448 | | 482,729 | | | 1,771,350 | |
Long-term debt | | 1,518,569 | | 1,614,366 | | | 1,557,226 | | | 845,304 | | | 168,023 | | 1,490,283 | | 703,260 | | 2,652,150 | | | 10,549,181 | |
Gas system rebuild insurance proceeds | | - | | - | | | - | | | - | | | 90,116 | | - | | - | | (90,116 | ) | | - | |
Other | | 43,623 | | 63,292 | | | 71,176 | | | 29,146 | | | 5,911 | | 30,017 | | - | | 208,273 | | | 451,438 | |
| | | | | | | | | | | | | | | | | | | | | | | | |
Total | | 4,334,664 | | 3,855,837 | | | 4,137,382 | | | 1,626,488 | | | 578,755 | | 2,394,200 | | 2,071,508 | | 1,218,657 | | | 20,217,491 | |
| | | | | | | | | | | | | | | | | | | | | | | | |
Commitments and Contingencies | | | | | | | | | | | | | | | | | | | | | | | |
| | | | | | | | | |
Subsidiaries preferred stock without sinking fund | | 116,350 | | - | | | - | | | 50,381 | | | 19,780 | | - | | - | | - | | | 186,510 | |
| | | | | | | | | |
SHAREHOLDERS’ OR MEMBERS’ EQUITY: | | | | | | | | | | | | | | | | | | | | | | | |
Common stock or members’ equity | | 470 | | 1,473,930 | | | 1,837,348 | | | 199,326 | | | 33,744 | | 49,452 | | 789,350 | | (2,219,805 | ) | | 2,163,815 | |
Paid-in capital/capital stock expense and other | | 588,444 | | - | | | - | | | (690 | ) | | 36,294 | | 481,994 | | - | | 7,809,499 | | | 8,915,541 | |
Retained earnings | | 822,647 | | - | | | - | | | 490,129 | | | 138,548 | | 313,044 | | 40,592 | | 3,298,206 | | | 5,103,166 | |
Accumulated other comprehensive income (loss) | | - | | (42,171 | ) | | (25,539 | ) | | - | | | - | | - | | | | (62,347 | ) | | (130,057 | ) |
Less – treasury stock, at cost | | - | | - | | | - | | | - | | | - | | - | | | | 4,847,167 | | | 4,847,167 | |
| | | | | | | | | | | | | | | | | | | | | | | | |
Total | | 1,411,561 | | 1,431,759 | | | 1,811,809 | | | 688,765 | | | 208,586 | | 844,490 | | 829,942 | | 3,978,386 | | | 11,205,298 | |
| | | | | | | | | | | | | | | | | | | | | | | | |
Subsidiaries preferred stock without sinking fund | | - | | 10,000 | | | 100,000 | | | - | | | - | | - | | - | | (16,000 | ) | | 94,000 | |
| | | | | | | | | | | | | | | | | | | | | | | | |
Total | | 1,411,561 | | 1,441,759 | | | 1,911,809 | | | 688,765 | | | 208,586 | | 844,490 | | 829,942 | | 3,962,386 | | | 11,299,298 | |
| | | | | | | | | | | | | | | | | | | | | | | | |
TOTAL LIABILITIES AND SHAREHOLDERS’ OR MEMBERS’ EQUITY | | $6,435,640 | | $5,636,182 | | | $6,755,191 | | | $2,656,635 | | | $1,001,076 | | $3,895,638 | | $3,099,082 | | $ 7,177,354 | | | $36,656,798 | |
| | | | | | | | | | | | | | | | | | | | | | | | |
Totals may not foot due to rounding.
27
UTILITY FINANCIAL RESULTS
UTILITY SELECTED ANNUAL FINANCIAL METRICS
| | | | | | | | | | | | |
| | | 2009 | | | 2008 | | 2007 | | | 2006 | | 2005 |
ENTERGY ARKANSAS, INC. | | | | | | | | | | | | |
As-Reported Earnings ($ millions) | | 60.0 | | | 40.3 | | 132.2 | | | 165.6 | | 166.9 |
Less Special Items ($ millions) | | - | | | - | | (5.9 | ) | | - | | - |
| | | | | | | | | | | | | |
Operational Earnings ($ millions) | | 60.0 | | | 40.3 | | 138.1 | | | 165.6 | | 166.9 |
| | | | | | | | | | | | | |
GAAP MEASURES | | | | | | | | | | | | |
Return on Average Common Equity – As-Reported (%) | | 4.3 | | | 2.9 | | 9.4 | | | 11.6 | | 12.1 |
Return on Average Invested Capital – As-Reported (%) | | 3.7 | | | 3.2 | | 6.5 | | | 7.6 | | 7.6 |
Cash Flow Interest Coverage (# times) | | 5.3 | | | 6.3 | | 5.2 | | | 7.0 | | 7.7 |
Debt to Capital Ratio (%) | | 54.0 | | | 53.5 | | 49.0 | | | 48.1 | | 47.5 |
Total Debt ($ millions) | | 1,793 | | | 1,745 | | 1,442 | | | 1,436 | | 1,400 |
Total Preferred ($ millions) | | 116 | | | 116 | | 116 | | | 116 | | 116 |
Total Equity ($ millions) | | 1,412 | | | 1,400 | | 1,385 | | | 1,434 | | 1,430 |
NON-GAAP MEASURES | | | | | | | | | | | | |
Return on Average Common Equity – Operational (%) | | 4.3 | | | 2.9 | | 9.8 | | | 11.6 | | 12.1 |
Return on Average Invested Capital – Operational (%) | | 3.7 | | | 3.2 | | 6.7 | | | 7.6 | | 7.6 |
Net Debt to Net Capital Ratio (%) | | 52.8 | | | 52.9 | | 49.0 | | | 47.5 | | 47.4 |
| | | | | | | | | | | | | |
| | | | | |
| | | | | | 2007 PRO FORMA(a) | | | | | | | |
ENTERGY GULF STATES LOUISIANA, L.L.C. | | | | | | | | | | | | |
As-Reported Earnings ($ millions) | | 152.2 | | | 143.9 | | 129.9 | | | REFER TO PAGE 30 |
Less Special Items ($ millions) | | - | | | - | | (3.6 | ) | |
| | | | | | | | | | |
Operational Earnings ($ millions) | | 152.2 | | | 143.9 | | 133.5 | | |
| | | | | | | | | | |
GAAP MEASURES | | | | | | | | | |
Return on Average Common Equity – As-Reported (%) | | 11.1 | | | 11.0 | | 10.4 | | |
Return on Average Invested Capital – As-Reported (%) | | 6.6 | | | 6.1 | | 6.8 | | |
Cash Flow Interest Coverage (# times) | | 3.1 | | | 5.4 | | 3.9(c) | | |
Debt to Capital Ratio (%) | | 52.8(b) | | | 51.6(b) | | 51.5(b) | | |
Total Debt ($ millions) | | 1,615(b) | | | 1,418(b) | | 1,381(b) | | |
Total Preferred ($ millions) | | 10 | | | 10 | | 10 | | |
Total Equity ($ millions) | | 1,432 | | | 1,322 | | 1,290 | | |
NON-GAAP MEASURES | | | | | | | | | |
Return on Average Common Equity – Operational (%) | | 11.1 | | | 11.0 | | 10.6 | | |
Return on Average Invested Capital – Operational (%) | | 7.7(b) | | | 8.2(b) | | 8.3(b) | | | | | |
Net Debt to Net Capital Ratio (%) | | 50.5(b) | | | 50.7(b) | | 49.5(b) | | | | | |
| | | | | | | | | | | | | |
(a) Effective December 31, 2007, Entergy Gulf States, Inc. completed a jurisdictional separation into two vertically integrated utility companies: Entergy Texas and Entergy Gulf States Louisiana. The above pro forma metrics for 2007 reflect the results as if the separation had occurred on January 1, 2007. (b) See page 72 for adjusted calculations. (c) See page 73 for Pro Forma calculation. |
| | | | | | | | | | | | |
ENTERGY LOUISIANA, LLC(a) | | | | | | | | | | | | |
As-Reported Earnings ($ millions) | | 225.9 | | | 150.6 | | 136.4 | | | 130.7 | | 128.1 |
Less Special Items ($ millions) | | - | | | - | | (2.2 | ) | | - | | - |
| | | | | | | | | | | | | |
Operational Earnings ($ millions) | | 225.9 | | | 150.6 | | 138.6 | | | 130.7 | | 128.1 |
| | | | | | | | | | | | | |
GAAP MEASURES | | | | | | | | | | | | |
Return on Average Members’ Equity – As-Reported (%) | | 13.2 | | | 9.8 | | 9.8 | | | 10.8 | | 12.0 |
Return on Average Invested Capital – As-Reported (%) | | 8.2 | | | 7.1 | | 7.1 | | | 7.3 | | 7.8 |
Cash Flow Interest Coverage (# times) | | 2.3 | | | 14.0 | | 5.6 | | | 6.1 | | 3.1 |
Debt to Capital Ratio (%) | | 49.9 | | | 46.1 | | 43.4 | | | 46.4 | | 51.3 |
Total Debt ($ millions) | | 1,902 | | | 1,462 | | 1,192 | | | 1,230 | | 1,271 |
Total Preferred ($ millions) | | 100 | | | 100 | | 100 | | | 100 | | 100 |
Total Equity ($ millions) | | 1,812 | | | 1,608 | | 1,454 | | | 1,318 | | 1,105 |
NON-GAAP MEASURES | | | | | | | | | | | | |
Return on Average Members’ Equity – Operational (%) | | 13.2 | | | 9.8 | | 10.0 | | | 10.8 | | 12.0 |
Return on Average Invested Capital – Operational (%) | | 8.2 | | | 7.1 | | 7.2 | | | 7.3 | | 7.8 |
Net Debt to Net Capital Ratio (%) | | 47.8 | | | 43.6 | | 43.4 | | | 46.4 | | 49.2 |
| | | | | | | | | | | | | |
| (a) | Effective December 31, 2005, Entergy Louisiana, LLC, (ELL), a limited liability company organized under the laws of the State of Texas as part of a restructuring involving a Texas statutory merger-by-division, succeeded to all of the regulated utility operations of Entergy Louisiana, Inc. (ELI). ELL was allocated substantially all of the property and other assets of ELI, including all assets used to provide retail and wholesale electric service to ELI’s retail customers. ELL also assumed substantially all of the liabilities of ELI, including all of its debt securities and leases but excluding the outstanding preferred stock of ELI. Current and prior periods reflect metrics for ELL. |
28
UTILITY FINANCIAL RESULTS
UTILITY SELECTED ANNUAL FINANCIAL METRICS (CONTINUED)
| | | | | | | | | | | | | | |
| | | 2009 | | | 2008 | | | 2007 | | | 2006 | | 2005 | |
ENTERGY MISSISSIPPI, INC. | | | | | | | | | | | | | | |
As-Reported Earnings ($ millions) | | 74.8 | | | 56.9 | | | 69.3 | | | 49.5 | | 58.8 | |
Less Special Items ($ millions) | | - | | | - | | | - | | | - | | - | |
| | | | | | | | | | | | | | | |
Operational Earnings ($ millions) | | 74.8 | | | 56.9 | | | 69.3 | | | 49.5 | | 58.8 | |
| | | | | | | | | | | | | | | |
GAAP MEASURES | | | | | | | | | | | | | | |
Return on Average Common Equity – As-Reported (%) | | 11.0 | | | 8.6 | | | 10.9 | | | 8.3 | | 10.6 | |
Return on Average Invested Capital – As-Reported (%) | | 7.2 | | | 6.2 | | | 6.9 | | | 5.9 | | 6.7 | |
Cash Flow Interest Coverage (# times) | | 5.4 | | | 2.7 | | | 4.8 | | | 10.1 | | 1.1 | |
Debt to Capital Ratio (%) | | 53.5 | | | 49.6 | | | 49.9 | | | 54.3 | | 52.7 | |
Total Debt ($ millions) | | 852 | | | 703 | | | 704 | | | 795 | | 695 | |
Total Preferred ($ millions) | | 50 | | | 50 | | | 50 | | | 50 | | 50 | |
Total Equity ($ millions) | | 689 | | | 665 | | | 657 | | | 618 | | 573 | |
NON-GAAP MEASURES | | | | | | | | | | | | | | |
Return on Average Common Equity – Operational (%) | | 11.0 | | | 8.6 | | | 10.9 | | | 8.3 | | 10.6 | |
Return on Average Invested Capital – Operational (%) | | 7.2 | | | 6.2 | | | 6.9 | | | 5.9 | | 6.7 | |
Net Debt to Net Capital Ratio (%) | | 50.7 | | | 49.5 | | | 48.4 | | | 51.9 | | 52.6 | |
| | | | | | | | | | | | | | | |
| | | | | |
ENTERGY NEW ORLEANS, INC. | | | | | | | | | | | | | | |
As-Reported Earnings ($ millions) | | 30.0 | | | 34.0 | | | 23.5 | | | 4.1 | | 0.8 | |
Less Special Items ($ millions) | | - | | | - | | | - | | | - | | - | |
| | | | | | | | | | | | | | | |
Operational Earnings ($ millions) | | 30.0 | | | 34.0 | | | 23.5 | | | 4.1 | | 0.8 | |
| | | | | | | | | | | | | | | |
GAAP MEASURES | | | | | | | | | | | | | | |
Return on Average Common Equity – As-Reported (%) | | 14.3 | | | 17.5 | | | 14.2 | | | 2.7 | | 0.5 | |
Return on Average Invested Capital – As-Reported (%) | | 8.2 | | | 9.5 | | | 7.7 | | | 3.3 | | 1.8 | |
Cash Flow Interest Coverage (# times) | | 9.8 | | | 5.3 | | | 11.5 | | | 5.9 | | (1.9 | ) |
Debt to Capital Ratio (%) | | 54.4 | | | 54.1 | | | 60.6 | | | 61.9 | | 66.4 | |
Total Debt ($ millions) | | | | | | | | | | | | | | |
Not Subject to Compromise ($ millions) | | 272 | | | 273 | | | 304 | | | 282 | | 105 | |
Subject to Compromise ($ millions) | | - | | | - | | | - | | | - | | 230 | |
| | | | | | | | | | | | | | | |
Total Debt ($ millions) | | 272 | | | 273 | | | 304 | | | 282 | | 335 | |
| | | | | | | | | | | | | | | |
Total Preferred ($ millions) | | 20 | | | 20 | | | 20 | | | 20 | | 20 | |
Total Equity ($ millions) | | 209 | | | 211 | | | 177 | | | 154 | | 150 | |
NON-GAAP MEASURES | | | | | | | | | | | | | | |
Return on Average Common Equity – Operational (%) | | 14.3 | | | 17.5 | | | 14.2 | | | 2.7 | | 0.5 | |
Return on Average Invested Capital – Operational (%) | | 8.2 | | | 9.5 | | | 7.7 | | | 3.3 | | 1.8 | |
Net Debt to Net Capital Ratio (%) | | 26.2 | | | 37.0 | | | 51.8 | | | 60.4 | | 62.8 | |
| | | | | | | | | | | | | | | |
| | | | | |
| | | | | | 2007 PRO FORMA(a) | | | | | | | | | |
ENTERGY TEXAS, INC. | | | | | | | | | | | | | | |
As-Reported Net Income ($ millions) | | 63.8 | | | 57.9 | | | 58.9 | | | REFER TO PAGE 30 | |
Less Special Items ($ millions) | | - | | | - | | | - | | |
Operational Earnings ($ millions) | | 63.8 | | | 57.9 | | | 58.9 | | |
GAAP MEASURES | | | | | | | | | | |
Return on Average Common Equity – As-Reported (%) | | 7.3 | | | 6.1 | | | 5.9 | | |
Return on Average Invested Capital – As-Reported (%) | | 5.4 | | | 4.5 | | | 4.9 | | |
Cash Flow Interest Coverage (# times) | | 3.7 | | | 1.1 | | | 3.0 | | |
Debt to Capital Ratio, excluding securitization debt (%) | | 49.3 | (b) | | 53.5 | (b) | | 55.9 | (b) | |
Total Debt ($ millions) | | 820 | (b) | | 1,035 | (b) | | 1,083 | (b) | |
Total Preferred ($ millions) | | - | | | - | | | - | | |
Total Equity ($ millions) | | 844 | | | 900 | (b) | | 854 | (b) | |
NON-GAAP MEASURES | | | | | | | | | | |
Return on Average Common Equity – Operational (%) | | 7.3 | | | 6.6 | (b) | | 7.0 | (b) | |
Return on Average Invested Capital – Operational (%) | | 7.1 | (b) | | 5.5 | (b) | | 5.7 | (b) | |
Net Debt to Net Capital Ratio, excluding securitization debt (%) | | 42.3 | (b) | | 53.4 | (b) | | 47.9 | (b) | |
| (a) | Effective December 31, 2007, Entergy Gulf States, Inc. completed a jurisdictional separation into two vertically integrated utility companies: Entergy Texas and Entergy Gulf States Louisiana. The above pro forma metrics for 2007 reflect the results as if the separation had occurred on January 1, 2007. |
| (b) | See page 72 for adjusted calculations. |
29
UTILITY FINANCIAL RESULTS
UTILITY SELECTED ANNUAL FINANCIAL METRICS (CONTINUED)
| | | | | | | | | | | | |
| | | 2009 | | | 2008 | | 2007 | | | 2006 | | 2005 |
SYSTEM ENERGY RESOURCES, INC. | | | | | | | | | | | | |
As-Reported Net Income ($ millions) | | 48.9 | | | 91.1 | | 136.1 | | | 140.3 | | 111.6 |
Less Special Items ($ millions) | | - | | | - | | (1.9 | ) | | - | | - |
| | | | | | | | | | | | | |
Operational Earnings ($ millions) | | 48.9 | | | 91.1 | | 138.0 | | | 140.3 | | 111.6 |
| | | | | | | | | | | | | |
GAAP MEASURES | | | | | | | | | | | | |
Return on Average Common Equity – As-Reported (%) | | 5.8 | | | 10.6 | | 15.8 | | | 16.0 | | 12.5 |
Return on Average Invested Capital – As-Reported (%) | | 4.4 | | | 7.1 | | 9.8 | | | 9.9 | | 8.1 |
Cash Flow Interest Coverage (# times) | | 10.5 | | | 4.9 | | 4.9 | | | 3.1 | | 5.5 |
Debt to Capital Ratio (%) | | 49.7 | | | 51.2 | | 50.6 | | | 50.6 | | 51.1 |
Total Debt ($ millions) | | 820 | | | 899 | | 882 | | | 879 | | 934 |
Total Preferred ($ millions) | | - | | | - | | - | | | - | | - |
Total Equity ($ millions) | | 830 | | | 856 | | 862 | | | 857 | | 894 |
NON-GAAP MEASURES | | | | | | | | | | | | |
Return on Average Common Equity – Operational (%) | | 5.8 | | | 10.6 | | 16.0 | | | 16.0 | | 12.5 |
Return on Average Invested Capital – Operational (%) | | 4.4 | | | 7.1 | | 9.9 | | | 9.9 | | 8.1 |
Net Debt to Net Capital Ratio (%) | | 40.1 | | | 48.2 | | 47.4 | | | 46.4 | | 49.0 |
| | | | | | | | | | | | | |
| | | | | |
ENTERGY GULF STATES, INC. | | | | | | | | | | | | |
As-Reported Earnings ($ millions) | | | | | | | | | | 208.0 | | 202.3 |
Less Special Items ($ millions) | | | | | | | | | | - | | - |
| | | | | | | | | | | | | |
Operational Earnings ($ millions) | | | | | | | | | | 208.0 | | 202.3 |
| | | | | | | | | | | | | |
GAAP MEASURES | | | | | | | | | | | | |
Return on Average Common Equity – As-Reported (%) | | | | | | | | | | 9.4 | | 10.1 |
Return on Average Invested Capital – As-Reported (%) | | | | | | | | | | 6.4 | | 6.5 |
Cash Flow Interest Coverage (# times) | | | | | | | | | | 6.5 | | 1.5 |
Debt to Capital Ratio (%) | | | | | | | | | | 52.0 | | 51.7 |
Total Debt ($ millions) | | | | | | | | | | 2,442 | | 2,426 |
Total Preferred ($ millions) | | | | | | | | | | 47 | | 47 |
Total Equity ($ millions) | | | | | | | | | | 2,206 | | 2,224 |
NON-GAAP MEASURES | | | | | | | | | | | | |
Return on Average Common Equity – Operational (%) | | | | | | | | | | 9.4 | | 10.1 |
Return on Average Invested Capital – Operational (%) | | | | | | | | | | 6.4 | | 6.5 |
Net Debt to Net Capital Ratio (%) | | | | | | | | | | 50.1 | | 51.4 |
| | | | | | | | | | | | | |
30
UTILITY SECURITIES DETAIL
UTILITY LONG-TERM DEBT AND PREFERRED STOCK
ENTERGY ARKANSAS, INC.
| | | | | | | | | | | | | | | | | | | | | |
BONDS: CUSIP | | | | | | | | MATURITY DATE | | FIRST CALL DATE | | CURRENT OR FIRST CALL PRICE | | AS OF DECEMBER 31, |
| | | | TYPE* | | RATE | | | | | 2009 | | 2008 | | 2007 |
| | | | | | | | | | | | | | | | | (in millions) | | |
29364DAM2 | | 4.50% Series | | M | | 4.50% | | 06/10 | | Now | | MW (T + .25%) | | $ | 100 | | | $ 100 | | $ | 100 |
29364DAN0 | | 5.40% Series | | M | | 5.40% | | 08/13 | | Now | | MW (T + .35%) | | | 300 | | | 300 | | | - |
732835AW3 | | 6.3% Series – Pope County(c) | | G(b) | | 6.3% | | 2016 | | Now | | 100% | | | 20 | | | 20 | | | 20 |
472712ER5 | | 4.6% Series – Jefferson County(c) | | G(b) | | 4.6% | | 2017 | | 6/13/11 | | 100% | | | 55 | | | 55 | | | 55 |
29364DAE0 | | 5.4% Series | | M | | 5.4% | | 05/18 | | Now | | 100% | | | 150 | | | 150 | | | 150 |
29364DAH3 | | 5.0% Series | | M | | 5.0% | | 07/18 | | Now | | 100% | | | 115 | | | 115 | | | 115 |
732835BA0 | | 6.3% Series – Pope County | | G(b) | | 6.3% | | 2020 | | Now | | 100% | | | 120 | | | 120 | | | 120 |
453424BP | | 5.0% Series – Independence County(c) | | G(b) | | 5.0% | | 2021 | | 7/1/10 | | 100% | | | 45 | | | 45 | | | 45 |
29364DAL4 | | 5.66% Series | | M | | 5.66% | | 02/25 | | Now | | MW (T + .20%) | | | 175 | | | 175 | | | 175 |
29364D811 | | 6.7% Series | | M | | 6.7% | | 04/32 | | Now | | 100% | | | 100 | | | 100 | | | 100 |
29364D795 | | 6.0% Series | | M | | 6.0% | | 11/32 | | Now | | 100% | | | 100 | | | 100 | | | 100 |
29364DAJ9 | | 5.9% Series | | M | | 5.9% | | 06/33 | | Now | | MW (T + .25%) | | | 100 | | | 100 | | | 100 |
29364DAK6 | | 6.38% Series | | M | | 6.38% | | 11/34 | | Now | | 100% | | | 60 | | | 60 | | | 60 |
| | | | | | | | | | | | | | | | | | | | | | |
| | Total bonds | | | | | | | | | | | | | 1,439 | | | 1,439 | | | 1,139 |
| | | | | | | | | | | | | | | | | | | | | | |
OTHER LONG-TERM DEBT: | | | | | | | | | | | | | | | | | | | |
| | Long-Term United States Department of Energy Obligation(d) | | | | | | | 181 | | | 180 | | | 177 |
| | Unamortized Premium and Discount – Net | | | | | | | (1) | | | (1) | | | (2) |
| | | | | | | | |
TOTAL LONG-TERM DEBT | | | | | | | | | | | | | 1,619 | | | 1,618 | | | 1,315 |
Less Amount Due Within One Year | | | | | | | | | | | | | 100 | | | - | | | - |
| | | | | | | | | | | | | | | | | | | | | | |
Long-Term Debt Excluding Amount Due Within One Year | | | | | | | | $ | 1,519 | | $ | 1,618 | | $ | 1,315 |
| | | | | | | | | | | | | | | | | | | | | | |
Fair Value of Long-Term Debt(a) | | | | | | | | | | | | $ | 1,463 | | $ | 1,306 | | $ | 1,101 |
| | | | | | | | | | | | | | | | | | | | | | |
*M = Mortgage; G = Governmental | | | | | | | | | | | | | | | | | |
Weighted-average annualized coupon rate | | | | | | | | | | | | | 5.6% | | | 5.6% | | | 5.6% |
| | | | | | | | | | | | | | | | | | | | | | |
| (a) | The fair value excludes long-term DOE obligations of $181 million at Entergy Arkansas and includes debt due within one year. It is determined using bid prices reported by dealer markets and by nationally recognized investment banking firms. |
| (b) | Consists of pollution control revenue bonds and environmental revenue bonds. |
| (c) | The bonds are secured by a series of collateral first mortgage bonds. |
| (d) | Pursuant to the Nuclear Waste Policy Act of 1982, Entergy’s nuclear owner / licensee subsidiaries have contracts with the DOE for spent nuclear fuel disposal service. The contracts include a one-time fee for generation prior to April 7, 1983. Entergy Arkansas is the only Entergy company that generated electric power with nuclear fuel prior to that date and includes the one-time fee, plus accrued interest, in long-term debt. |
Totals may not foot due to rounding.
| | | | | | | | | | | | | | | | | | | | | | |
| | | | | | | SHARES AUTHORIZED AND OUTSTANDING | | | | | | | | CALL PRICE PER SHARE |
PREFERRED STOCK: CUSIP | | | | AS OF DECEMBER 31, | | AS OF DECEMBER 31, | | AS OF DECEMBER 31, |
| | RATE | | 2009 | | 2008 | | 2007 | | 2009 | | 2008 | | 2007 | | | | 2009 |
| | Without sinking fund: | | | | | | | | | | | | | (in millions) | | | | | | | |
| | Cumulative, $100 par value: | | | | | | | | | | | | | | | | | | | | |
29364D209 | | 4.32% Series | | 4.32% | | 70,000 | | 70,000 | | 70,000 | | $ | 7 | | $ 7 | | $ | 7 | | | | $103.65 |
29364D506 | | 4.72% Series | | 4.72% | | 93,500 | | 93,500 | | 93,500 | | | 9 | | 9 | | | 9 | | | | 107.00 |
29364D308 | | 4.56% Series | | 4.56% | | 75,000 | | 75,000 | | 75,000 | | | 8 | | 8 | | | 8 | | | | 102.83 |
29364D407 | | 4.56% 1965 Series | | 4.56% | | 75,000 | | 75,000 | | 75,000 | | | 8 | | 8 | | | 8 | | | | 102.50 |
29364D605 | | 6.08% Series | | 6.08% | | 100,000 | | 100,000 | | 100,000 | | | 10 | | 10 | | | 10 | | | | 102.83 |
| | Cumulative, $25 par value: | | | | | | | | | | | | | | | | | | | | |
29364D787 | | 6.45% Series(a) | | 6.45% | | 3,000,000 | | 3,000,000 | | 3,000,000 | | | 75 | | 75 | | | 75 | | | | - |
| | | | | | | | | | | | | | | | | | | | | | | |
| | Total without sinking fund | | | | 3,413,500 | | 3,413,500 | | 3,413,500 | | $ | 116 | | $116 | | $ | 116 | | | | |
| | | | | | | | | | | | | | | | | | | | | | | |
| (a) | Series is non-callable until April 2011; thereafter callable at par. |
Totals may not foot due to rounding.
31
UTILITY LONG-TERM DEBT AND PREFERRED STOCK
ENTERGY GULF STATES LOUISIANA, L.L.C.
| | | | | | | | | | | | | | | | | | | | | | | |
BONDS:
CUSIP | | | | TYPE* | | RATE | | MATURITY
DATE | | FIRST CALL
DATE | | CURRENT OR
FIRST CALL PRICE | | AS OF DECEMBER 31, | |
| | | | | | | | 2009 | | | 2008 | | | 2007 | |
| | | | | | | | | | | | | | | | | | (in millions) | | | | |
29364LAG7 | | 3.6% Series | | M(c) | | 3.6% | | 06/08 | | Now | | 100% | | $ | - | | | $ - | | | $ | 325 | |
296364LAW2 | | Libor + 0.75% Series | | M(c) | | Libor + 0.75% | | 12/08 | | Now | | 100% | | | - | | | - | | | | 350 | |
29364LAN5 | | Libor + 0.4% Series | | M(c) | | Libor + 0.4% | | 12/09 | | Now | | 100% | | | - | | | 219 | | | | 219 | |
29364LAV4 | | 5.12% Series | | M(c) | | 5.12% | | 08/10 | | Now | | 100% | | | - | | | 100 | | | | 100 | |
128318BL5 | | 5.45% Series – Calcasieu Parish | | G(b,c) | | 5.45% | | 2010 | | Now | | 100% | | | 12 | | | 22 | | | | 22 | |
730816AF9 | | 6.75% Series – Calcasieu Parish | | G(b,c) | | 6.75% | | 2012 | | Now | | 100% | | | 26 | | | 48 | | | | 48 | |
29364LAQ5 | | 4.875% Series | | M(c) | | 4.875% | | 11/11 | | Now | | 100% | | | 200 | | | 200 | | | | 200 | |
29364LAF9 | | 6.0% Series | | M(c) | | 6.0% | | 12/12 | | Now | | 100% | | | - | | | 140 | | | | 140 | |
730816AF9 | | 6.7% Series – Pointe Coupee Parish | | G(b,c) | | 6.7% | | 2013 | | Now | | 100% | | | 9 | | | 17 | | | | 17 | |
450877AJ | | 5.7% Series – Iberville Parish | | G(b,c) | | 5.7% | | 2014 | | Now | | 100% | | | 12 | | | 22 | | | | 22 | |
29364LAS1 | | 5.6% Series | | M(c) | | 5.6% | | 12/14 | | Now | | 100% | | | - | | | 50 | | | | 50 | |
29364LAU6 | | 5.70% Series | | M(c) | | 5.70% | | 06/15 | | Now | | MW (T +. 30%) | | | 200 | | | 200 | | | | 200 | |
952789AQ8 | | 5.8% Series – West Feliciana Parish | | G(b,c) | | 5.8% | | 2015 | | Now | | 100% | | | 15 | | | 28 | | | | 28 | |
952789AW5 | | 7.0% Series – West Feliciana Parish | | G(b,c) | | 7.0% | | 2015 | | Now | | 100% | | | 17 | | | 39 | | | | 39 | |
29364LAN2 | | 5.25% Series | | M(c) | | 5.25% | | 08/15 | | Now | | 100% | | | 92 | | | 200 | | | | 200 | |
952789AR6 | | 5.8% Series – West Feliciana Parish | | G(b,c) | | 5.8% | | 2016 | | Now | | 100% | | | 20 | | | 20 | | | | 20 | |
29365PAM4 | | 6.00% Series | | M | | 6.00% | | 05/18 | | Now | | MW (T + .40%) | | | 375 | | | 375 | | | | - | |
29365PAP7 | | 5.59% Series | | M | | 5.59% | | 10/24 | | Now | | MW (T + .40%) | | | 300 | | | - | | | | - | |
952789BB0 | | 6.6% Series – West Feliciana Parish | | G(b,c) | | 6.6% | | 2028 | | Now | | 100% | | | 22 | | | 40 | | | | 40 | |
29364LAL6 | | 6.2% Series | | M(c) | | 6.2% | | 07/33 | | Now | | MW (T + .15%) | | | 240 | | | 240 | | | | 240 | |
2936LAT9 | | 6.18% Series | | M(c) | | 6.18% | | 03/35 | | Now | | MW (T + .30%) | | | 85 | | | 85 | | | | 85 | |
| | | | | | | | | | | | | | | | | | | | | | | | |
| | Total bonds | | | | | | | | | | | | | 1,625 | | | 2,045 | | | | 2,346 | |
| | | | | | | | | | | | | | | | | | | | | | | | |
OTHER LONG-TERM DEBT: | | | | | | | | | | | | | | | | | | | |
| | Unamortized Premium and Discount – Net | | | | | | | | | | | (2 | ) | | (2 | ) | | | (1 | ) |
| | Other | | | | | | | | | | | | | 4 | | | 4 | | | | 4 | |
| | | | | | | | | | | | | | | | | | | | | | | | |
TOTAL LONG-TERM DEBT | | | | | | | | | | | 1,626 | | | 2,047 | | | | 2,349 | |
Less Amount Due Within One Year | | | | | | | | | | | 12 | | | 219 | | | | 675 | |
| | | | | | | | | | | | | | | | | | | | | | | | |
Long-Term Debt Excluding Amount Due Within One Year | | | | | | | | | | $ | 1,614 | | | $1,828 | | | $ | 1,674 | |
| | | | | | | | | | | | | | | | | | | | | | | | |
Fair Value of Long-Term Debt(a) | | | | | | | | | | $ | 1,638 | | | $1,871 | | | $ | 2,283 | |
| | | | | | | | | | | | | | | | | | | | | | | | |
*M = Mortgage; G = Governmental | | | | | | | | | | | | | | | | | | | |
Weighted-average annualized coupon rate | | | | | | | | | | | 5.8% | | | 5.4% | | | | 5.5% | |
| | | | | | | | | | | | | | | | | | | | | | | | |
| (a) | The fair value includes debt due within one year. It is determined using bid prices reported by dealer markets and by nationally recognized investment banking firms. |
| (b) | Consists of pollution control revenue bonds and environmental revenue bonds. |
| (c) | Entergy Gulf States Louisiana remains primarily liable for all of the long-term debt issued by Entergy Gulf States, Inc. that was outstanding on December 31, 2009, 2008 and 2007. |
| | Under a debt assumption agreement with Entergy Gulf States Louisiana, Entergy Texas assumed approximately 46% of this long-term debt. Entergy Gulf States Louisiana recorded an assumption asset on its balance sheet to reflect the long-term debt assumed by Entergy Texas. |
Totals may not foot due to rounding.
| | | | | | | | | | | | | | | | | | |
| | | | | | | | | | | REDEMPTION
PRICE PER SHARE AS OF DECEMBER 31, |
| PREFERRED MEMBERSHIP INTERESTS: | | | | SHARES AUTHORIZED AND OUTSTANDING AS OF DECEMBER 31, | | AS OF DECEMBER 31, | |
| CUSIP | | RATE | | 2009 | | 2008 | | 2007 | | 2009 | | 2008 | | 2007 | | 2009 |
| | | | | | | | | | | | | | | (in millions) | | | | |
Cumulative, $100 liquidation value | | | | | | | | | | | | | | | | |
| | 8.25% Series(a) | | | | 100,000 | | 100,000 | | 100,000 | | $10 | | $10 | | $10 | | - |
Authorized 6,000,000 shares, $100 par value, cumulative | | | | | | | | | | | | | | | | |
| | | | | | | | | | | | | | | | | | | |
| | Total without sinking fund | | | | 100,000 | | 100,000 | | 100,000 | | $10 | | $10 | | $10 | | |
| | | | | | | | | | | | | | | | | | | |
| (a) | Series is non-callable until January 2016; thereafter callable at par. |
Totals may not foot due to rounding.
32
UTILITY LONG-TERM DEBT AND PREFERRED STOCK
ENTERGY LOUISIANA, LLC
| | | | | | | | | | | | | | | | | | | | | |
BONDS: CUSIP | | | | TYPE* | | RATE | | MATURITY DATE | | FIRST CALL DATE | | CURRENT OR FIRST CALL PRICE | | AS OF DECEMBER 31, |
| | | | | | | | 2009 | | | 2008 | | 2007 |
| | | | | | | | | | | | | | | | | | (in��millions) | | |
29364WAD0 | | 4.67% Series | | M | | 4.67% | | 06/10 | | Now | | MW (T + .20%) | | $ | 55 | | | $ 55 | | $ | 55 |
29364WAG3 | | 5.83% Series | | M | | 5.83% | | 11/10 | | Now | | 100% | | | 150 | | | 150 | | | 150 |
29364WAC2 | | 5.09% Series | | M | | 5.09% | | 11/14 | | Now | | 100% | | | 115 | | | 115 | | | 115 |
29364WAE8 | | 5.56% Series | | M | | 5.56% | | 09/15 | | Now | | MW (T + .25%) | | | 100 | | | 100 | | | 100 |
29364WAJ7 | | 6.50 % Series | | M | | 6.50% | | 09/18 | | Now | | MW (T + .40%) | | | 300 | | | 300 | | | - |
29364WAA6 | | 5.5% Series | | M | | 5.5% | | 04/19 | | Now | | 100% | | | 100 | | | 100 | | | 100 |
788070CD0 | | Auction Rate – St. Charles Parish(c) | | G(b) | | 3.66% | | 2030 | | Now | | 100% | | | - | | | - | | | 60 |
29364WAK4 | | 5.40% Series | | M | | 5.40% | | 11/24 | | Now | | MW (T + .35%) | | | 400 | | | - | | | - |
29364W207 | | 7.6% Series | | M | | 7.6% | | 04/32 | | Now | | 100% | | | 150 | | | 150 | | | 150 |
29364WAB4 | | 6.4% Series | | M | | 6.4% | | 10/34 | | Now | | 100% | | | 70 | | | 70 | | | 70 |
29364WAF5 | | 6.3% Series | | M | | 6.3% | | 09/35 | | Now | | MW (T + .35%) | | | 100 | | | 100 | | | 100 |
| | | | | | | | | | | | | | | | | | | | | | |
| | Total bonds | | | | | | | | | | | | | 1,540 | | | 1,140 | | | 900 |
| | | | | | | | | | | | | | | | | | | | | | |
OTHER LONG-TERM DEBT: | | | | | | | | | | | | | | | | | |
| | Waterford 3 Lease Obligation 7.45% | | 7.45% | | | | | | | | | 241 | | | 248 | | | 248 |
| | Unamortized Premium and Discount – Net | | | | | | | | | | | (2 | ) | | - | | | - |
| | | | | | | | | | | | | | | | | | | | | | |
TOTAL LONG-TERM DEBT | | | | | | | | | | | 1,780 | | | 1,387 | | | 1,148 |
| | | | | | | |
Less Amount Due Within One Year | | | | | | | | | | | 222 | | | - | | | - |
| | | | | | | | | | | | | | | | | | | | | | |
Long-Term Debt Excluding Amount Due Within One Year | | | | | | | | | | $ | 1,557 | | | $1,387 | | $ | 1,148 |
| | | | | | | | | | | | | | | | | | | | | | |
Fair Value of Long-Term Debt(a) | | | | | | | | | | $ | 1,566 | | | $1,085 | | $ | 875 |
| | | | | | | | | | | | | | | | | | | | | | |
*M = Mortgage; G = Governmental | | | | | | | | | | | | | | | | | |
Weighted-average annualized coupon rate | | | | | | | | | | | 6.1% | | | 6.4% | | | 6.2% |
| | | | | | | | | | | | | | | | | | | | | | |
| (a) | The fair value excludes lease obligations of $241 million at Entergy Louisiana and includes debt due within one year. It is determined using bid prices reported by dealer markets and by nationally recognized investment banking firms. |
| (b) | Consists of pollution control revenue bonds and environmental revenue bonds. |
| (c) | The bonds are secured by a series of collateral first mortgage bonds. |
Totals may not foot due to rounding.
ENTERGY LOUISIANA, LLC
| | | | | | | | | | | | | | | | | | |
| PREFERRED MEMBERSHIP INTERESTS: | | | | SHARES AUTHORIZED AND OUTSTANDING
AS OF DECEMBER 31, | | AS OF DECEMBER 31, | | CALL PRICE PER SHARE
AS OF DECEMBER 31, |
| CUSIP | | RATE | | 2009 | | 2008 | | 2007 | | 2009 | | 2008 | | 2007 | | 2009 |
| | | | | | | | | | | | | | | (in millions) | | | | |
| | Without sinking fund: | | | | | | | | | | | | | | | | |
| | Cumulative, $100 liquidation value: | | | | | | | | | | | | | | | | |
293649208 | | 6.95% Series(a) | | 6.95% | | 1,000,000 | | 1,000,000 | | 1,000,000 | | $100 | | $100 | | $100 | | - |
| | | | | | | | | | | | | | | | | | | |
| (a) | Series is non-callable until December 2010; thereafter callable at par. |
33
UTILITY LONG-TERM DEBT AND PREFERRED STOCK
ENTERGY MISSISSIPPI, INC.
| | | | | | | | | | | | | | | | | | | | | | | |
BONDS: CUSIP | | | | TYPE* | | RATE | | MATURITY DATE | | FIRST CALL DATE | | CURRENT OR FIRST CALL PRICE | | AS OF DECEMBER 31, | |
| | | | | | | | 2009 | | | 2008 | | | 2007 | |
| | | | | | | | | | | | | | | | | | (in millions) | | | | |
29364NAM0 | | 4.65% Series | | M | | 4.65% | | 05/11 | | Now | | MW (T + .30%) | | | 80 | | | 80 | | | | 80 | |
29364NAH1 | | 5.15% Series | | M | | 5.15% | | 02/13 | | Now | | MW (T + .20%) | | | 100 | | | 100 | | | | 100 | |
29364NAN8 | | 5.92% Series | | M | | 5.92% | | 02/16 | | Now | | MW (T + .30%) | | | 100 | | | 100 | | | | 100 | |
29364NAK4 | | 4.95% Series | | M | | 4.95% | | 06/18 | | Now | | 100% | | | 95 | | | 95 | | | | 95 | |
29364NAP3 | | 6.64% Series | | M | | 6.64% | | 07/19 | | Now | | MW (T + .50%) | | | 150 | | | - | | | | - | |
605277AF9 | | 4.60% Series –
Mississippi Business Finance Corp.(c) | | G(b)
| | 4.60% | | 2022 | | 10/1/09 | | 100% | | | 16 | | | 16 | | | | 16 | |
453424BN2 | | 4.90 Series – Independence County(c)(d) | | G(b) | | 4.90% | | 2022 | | Now | | 100% | | | 30 | | | 30 | | | | 30 | |
29364N876 | | 6.0% Series | | M | | 6.0% | | 11/32 | | Now | | 100% | | | 75 | | | 75 | | | | 75 | |
29364N868 | | 7.25% Series | | M | | 7.25% | | 12/32 | | Now | | 100% | | | 100 | | | 100 | | | | 100 | |
29364NAL2 | | 6.25% Series | | M | | 6.25% | | 04/34 | | Now | | MW (T + .25%) | | | 100 | | | 100 | | | | 100 | |
| | | | | | | | | | | | | | | | | | | | | | | | |
| | Total bonds | | | | | | | | | | | | | 846 | | | 696 | | | | 696 | |
| | | | | | | | | | | | | | | | | | | | | | | | |
OTHER LONG-TERM DEBT: | | | | | | | | | | | | | | | | | | | |
| | Unamortized Premium and Discount – Net | | | | | | | | | | | | | (1 | ) | | (1 | ) | | | (1 | ) |
| | | | | | | | | | | | | | | | | | | | | | | | |
TOTAL LONG-TERM DEBT | | | | | | | | | | | 845 | | | 695 | | | | 695 | |
Less Amount Due Within One Year | | | | | | | | | | | - | | | - | | | | - | |
| | | | | | | | | | | | | | | | | | | | | | | | |
Long-Term Debt Excluding Amount Due Within One Year | | | | | | | | | | $ | 845 | | | $695 | | | $ | 695 | |
| | | | | | | | | | | | | | | | | | | | | | | | |
Fair Value of Long-Term Debt(a) | | | | | | | | | | $ | 874 | | | $629 | | | $ | 671 | |
| | | | | | | | | | | | | | | | | | | | | | | | |
*M = Mortgage; G = Governmental | | | | | | | | | | | | | | | | | | | |
Weighted-average annualized coupon rate | | | | | | | | | | | 5.9% | | | 5.7% | | | | 5.7% | |
| | | | | | | | | | | | | | | | | | | | | | | | |
| (a) | The fair value includes debt due within one year. It is determined using bid prices reported by dealer markets and by nationally recognized investment banking firms. |
| (b) | Consists of pollution control revenue bonds and environmental revenue bonds. |
| (c) | The bonds are secured by a series of collateral first mortgage bonds. |
| (d) | In April 2008, Entergy Mississippi repurchased its $30 million of Auction Rate Independence County Pollution Control Revenue Bonds due July 2022. In June 2008, Entergy Mississippi remarketed the series and fixed the interest rate to maturity at 4.90%. |
Totals may not foot due to rounding.
| | | | | | | | | | | | | | | | | | | | | |
| PREFERRED STOCK: | | | | | SHARES AUTHORIZED AND OUTSTANDING
AS OF DECEMBER 31, | | AS OF DECEMBER 31, | | CALL PRICE PER SHARE
AS OF DECEMBER 31, | |
| CUSIP | | Rate | | | 2009 | | | 2008 | | 2007 | | 2009 | | 2008 | | 2007 | | 2009 | |
| | | | | | | | | | | | | | | (in millions) | | | |
| | Without sinking fund: | | | | | | | | | | | | | | | | | | | |
| | Cumulative, $100 par value: | | | | | | | | | | | | | | | | | | | |
29364N207 | | 4.36% Series | | 4.36% | | | 59,920 | | | 59,920 | | 59,920 | | $ 6 | | $ 6 | | $ 6 | | $103.88 | |
29364N306 | | 4.56% Series | | 4.56% | | | 43,887 | | | 43,887 | | 43,887 | | 4 | | 4 | | 4 | | 107.00 | |
29364N405 | | 4.92% Series | | 4.92% | | | 100,000 | | | 100,000 | | 100,000 | | 10 | | 10 | | 10 | | 102.88 | |
| | Cumulative, $25 par value: | | | | | | | | | | | | | | | | | | | |
29364N850 | | 6.25% Series(a) | | 6.25% | | | 1,200,000 | | | 1,200,000 | | 1,200,000 | | 30 | | 30 | | 30 | | - | |
| | | | | | | | | | | | | | | | | | | | | | |
| | Total without sinking fund | | | | | 1,403,807 | | | 1,403,807 | | 1,403,807 | | $50 | | $50 | | $50 | | | |
| | | | | | | | | | | | | | | | | | | | | | |
| (a) | Series is non-callable until August 2010; thereafter callable at par. |
Totals may not foot due to rounding.
ENTERGY NEW ORLEANS, INC.
| | | | | | | | | | | | | | | | | | | | |
BONDS: CUSIP | | | | TYPE*
| | RATE | | MATURITY DATE | | FIRST CALL DATE | | CURRENT OR FIRST CALL PRICE | | AS OF DECEMBER 31, |
| | | | | | | | 2009 | | 2008 | | 2007 |
| | | | | | | | | | | | | | | | | (in millions) | | |
29364PAE3 | | 3.875% Series | | M | | 3.88% | | 08/08 | | Now | | MW (T + .25%) | | $ | - | | $- | | $ | 30 |
29364PAL7 | | 4.98% Series | | M | | 4.98% | | 07/10 | | Now | | 101% | | | 30 | | 30 | | | 30 |
29364PAF0 | | 5.25% Series | | M | | 5.25% | | 08/13 | | Now | | MW (T + .25%) | | | 70 | | 70 | | | 70 |
29364PAD5 | | 6.75% Series | | M | | 6.75% | | 10/17 | | Now | | 100% | | | 25 | | 25 | | | 25 |
29364PAK9 | | 5.6% Series | | M | | 5.60% | | 09/24 | | 9/1/08 | | 100% | | | 34 | | 34 | | | 35 |
29364PAJ2 | | 5.65% Series | | M | | 5.65% | | 09/29 | | 9/1/09 | | 100% | | | 39 | | 39 | | | 40 |
| | | | | | | | | | | | | | | | | | | | | |
| | Total bonds | | | | | | | | | | | | $ | 198 | | 199 | | | 230 |
| | | | | | | | | | | | | | | | | | | | | |
OTHER LONG-TERM DEBT: | | | | | | | | | | | | | | | | |
| | Affiliated Notes Payable | | | | | | | | | | | | | 74 | | 74 | | | 74 |
| | Unamortized Premium and Discount – Net | | | | | | | | | | | | | - | | - | | | - |
| | | | | | | | | | | | | | | | | | | | | |
| | | | | | | |
TOTAL LONG-TERM DEBT | | | | | | | | | | | 272 | | 273 | | | 304 |
Less Amount Due Within One Year | | | | | | | | | | | 104 | | - | | | 30 |
| | | | | | | | | | | | | | | | | | | | | |
Long-Term Debt Excluding Amount Due Within One Year | | | | | | | | | | $ | 168 | | $273 | | $ | 274 |
| | | | | | | | | | | | | | | | | | | | | |
Fair Value of Long-Term Debt(a) | | | | | | | | | | $ | 198 | | $179 | | $ | 220 |
| | | | | | | | | | | | | | | | | | | | | |
*M = Mortgage; G = Governmental | | | | | | | | | | | | | | | | |
Weighted-average annualized coupon rate | | | | | | | | | | | 5.5% | | 5.5% | | | 5.3% |
| | | | | | | | | | | | | | | | | | | | | |
| (a) | The fair value excludes affiliate notes payable of $74 million at Entergy New Orleans and includes debt due within one year. It is determined using bid prices reported by dealer markets and by nationally recognized investment banking firms. |
Totals may not foot due to rounding.
| | | | | | | | | | | | | | | | | | | |
| PREFERRED STOCK: | | | | | SHARES AUTHORIZED AND OUTSTANDING
AS OF DECEMBER 31, | | AS OF
DECEMBER 31, | | CALL PRICE PER SHARE
AS OF DECEMBER 31, |
| CUSIP | | RATE | | | 2009 | | 2008 | | 2007 | | 2009 | | 2008 | | 2007 | | 2009 |
| | | | | | | | | | | | | | (in millions) | | |
| | Without sinking fund: | | | | | | | | | | | | | | | | | |
| | Cumulative, $100 par value: | | | | | | | | | | | | | | | | | |
29364P301 | | 4.75% Series | | 4.75% | | | 77,798 | | 77,798 | | 77,798 | | $ 8 | | $ 8 | | $ 8 | | $105.00 |
29364P202 | | 4.36% Series | | 4.36% | | | 60,000 | | 60,000 | | 60,000 | | 6 | | 6 | | 6 | | 104.58 |
29364P400 | | 5.56% Series | | 5.56% | | | 60,000 | | 60,000 | | 60,000 | | 6 | | 6 | | 6 | | 102.59 |
| | | | | | | | | | | | | | | | | | | | |
| | Total without sinking fund | | | | | 197,798 | | 197,798 | | 197,798 | | $20 | | $20 | | $20 | | |
| | | | | | | | | | | | | | | | | | | | |
Totals may not foot due to rounding.
34
UTILITY LONG-TERM DEBT AND PREFERRED STOCK
ENTERGY TEXAS, INC.
| | | | | | | | | | | | | | | | | | | | | | | |
BONDS: CUSIP | | | | TYPE* | | RATE | | MATURITY DATE | | FIRST CALL DATE | | CURRENT OR FIRST CALL PRICE | | AS OF DECEMBER 31, | |
| | | | | | | | 2009 | | | 2008 | | | 2007 | |
| | | | | | | | | | | | | | | | | | (in millions) | | | | |
29364LAG7 | | 3.6% Series | | M(c) | | 3.6% | | 06/08 | | Now | | 100% | | $ | - | | | $ - | | | $ | 148 | |
296364LAW2 | | Libor + 0.75% Series | | M(c) | | Libor + 0.75% | | 12/08 | | Now | | 100% | | | - | | | - | | | | 160 | |
29364LAN5 | | Libor + 0.4% Series | | M(c) | | Libor + 0.4% | | 12/09 | | Now | | 100% | | | - | | | 101 | | | | 101 | |
29364LAV4 | | 5.12% Series | | M(c) | | 5.12% | | 08/10 | | Now | | 100% | | | - | | | 46 | | | | 46 | |
128318BL5 | | 5.45% Series – Calcasieu Parish | | G(b,c) | | 5.45% | | 2010 | | Now | | 100% | | | - | | | 10 | | | | 10 | |
730816AF9 | | 6.75% Series – Calcasieu Parish | | G(b,c) | | 6.75% | | 2012 | | Now | | 100% | | | - | | | 22 | | | | 22 | |
29364LAQ5 | | 4.875% Series | | M(c) | | 4.875% | | 11/11 | | Now | | 100% | | | 28 | | | 92 | | | | 92 | |
29364LAF9 | | 6.0% Series | | M(c) | | 6.0% | | 12/12 | | Now | | 100% | | | - | | | 64 | | | | 64 | |
730816AF9 | | 6.7% Series – Pointe Coupee Parish | | G(b,c) | | 6.7% | | 2013 | | Now | | 100% | | | - | | | 8 | | | | 8 | |
450877AJ | | 5.7% Series – Iberville Parish | | G(b,c) | | 5.7% | | 2014 | | Now | | 100% | | | - | | | 10 | | | | 10 | |
29364LAS1 | | 5.6% Series | | M(c) | | 5.6% | | 12/14 | | Now | | 100% | | | - | | | 23 | | | | 23 | |
29364LAU6 | | 5.70% Series | | M(c) | | 5.70% | | 06/15 | | Now | | MW (T +. 30%) | | | 92 | | | 92 | | | | 92 | |
952789AQ8 | | 5.8% Series – West Feliciana Parish | | G(b,c) | | 5.8% | | 2015 | | Now | | 100% | | | - | | | 13 | | | | 13 | |
952789AW5 | | 7.0% Series – West Feliciana Parish | | G(b,c) | | 7.0% | | 2015 | | Now | | 100% | | | - | | | 22 | | | | 22 | |
29364LAN2 | | 5.25% Series | | M(c) | | 5.25% | | 08/15 | | Now | | 100% | | | - | | | 92 | | | | 92 | |
952789AR6 | | 5.8% Series – West Feliciana Parish | | G(b,c) | | 5.8% | | 2016 | | Now | | 100% | | | 9 | | | 9 | | | | 9 | |
952789BB0 | | 6.6% Series – West Feliciana Parish | | G(b,c) | | 6.6% | | 2028 | | Now | | 100% | | | - | | | 18 | | | | 18 | |
29364LAL6 | | 6.2% Series | | M(c) | | 6.2% | | 07/33 | | Now | | 100% | | | - | | | 110 | | | | 110 | |
2936LAT9 | | 6.18% Series | | M(c) | | 6.18% | | 03/35 | | Now | | MW (T + .30%) | | | 39 | | | 39 | | | | 39 | |
29365TAA2 | | 7.125% Series | | M | | 7.125% | | 02/19 | | Now | | MW (T + .50%) | | | 500 | | | - | | | | - | |
29365T203 | | 7.875% Series | | M | | 7.875% | | 06/39 | | 06/14 | | 100% | | | 150 | | | - | | | | - | |
| | | | | | | | | | | | | | | | | | | | | | | | |
| | Total bonds | | | | | | | | | | | | | 818 | | | 771 | | | | 1,079 | |
| | | | | | | | | | | | | | | | | | | | | | | | |
OTHER LONG-TERM DEBT: | | | | | | | | | | | | | | | | | | | |
| | $100M Bank Credit Facility | | | | 08/12 | | | | | | | | | - | | | 100 | | | | - | |
29365QAA8 | | 5.51% Series Senior Secured, Series A | | 5.51% | | 10/13 | | | | | | | | | 57 | | | 74 | | | | 94 | |
29365QAB6 | | 5.79% Series Senior Secured, Series A | | 5.79% | | 10/18 | | | | | | | | | 122 | | | 122 | | | | 122 | |
29365QAC4 | | 5.93% Series Senior Secured, Series A | | 5.93% | | 6/22 | | | | | | | | | 114 | | | 114 | | | | 114 | |
29365KAA1 | | 2.12% Series Senior Secured | | 2.12% | | 02/16 | | | | | | | | | 183 | | | - | | | | - | |
29365KAB9 | | 3.65% Series Senior Secured | | 3.65% | | 08/19 | | | | | | | | | 145 | | | - | | | | - | |
29365KAC7 | | 4.38% Series Senior Secured | | 4.38% | | 11/23 | | | | | | | | | 219 | | | - | | | | - | |
| | Unamortized Premium and Discount – Net | | | | | | | | | | | | | (4 | ) | | (1 | ) | | | (1 | ) |
| | Other | | | | | | | | | | | | | 5 | | | 5 | | | | 5 | |
| | | | | | | | | | | | | | | | | | | | | | | | |
TOTAL LONG-TERM DEBT | | | | | | | | | | | 1,658 | | | 1,185 | | | | 1,413 | |
Less Amount Due Within One Year | | | | | | | | | | | 168 | | | 101 | | | | 309 | |
| | | | | | | | | | | | | | | | | | | | | | | | |
Long-Term Debt Excluding Amount Due Within One Year | | | | | | | | | | $ | 1,490 | | | $1,084 | | | $ | 1,104 | |
| | | | | | | | | | | | | | | | | | | | | | | | |
Fair Value of Long-Term Debt(a) | | | | | | | | | | $ | 1,747 | | | $1,085 | | | $ | 1,379 | |
| | | | | | | | | | | | | | | | | | | | | | | | |
*M = Mortgage; G = Governmental | | | | | | | | | | | | | | | | | | | |
Weighted-average annualized coupon rate | | | | | | | | | | | 5.6% | | | 5.5% | | | | 5.6% | |
| | | | | | | | | | | | | | | | | | | | | | | | |
| (a) | The fair value includes debt due within one year. It is determined using bid prices reported by dealer markets and by nationally recognized investment banking firms. |
| (b) | Consists of pollution control revenue bonds and environmental revenue bonds. |
| (c) | Entergy Gulf States Louisiana remains primarily liable for all of the long-term debt issued by Entergy Gulf States, Inc. that was outstanding on December 31, 2009 and 2008. Under a debt assumption agreement with Entergy Gulf States Louisiana, Entergy Texas assumed approximately 46% of this long-term debt. Entergy Gulf States Louisiana recorded an assumption asset on its balance sheet to reflect the long-term debt assumed by Entergy Texas. |
Totals may not foot due to rounding.
SYSTEM ENERGY RESOURCES, INC.
| | | | | | | | | | | | | | | | | | | | | | | |
BONDS: CUSIP | | | | TYPE* | | RATE | | MATURITY DATE | | FIRST CALL DATE | | CURRENT OR FIRST CALL PRICE | | AS OF DECEMBER 31, | |
| | | | | | | | 2009 | | | 2008 | | | 2007 | |
| | | | | | | | | | | | | | | | | | (in millions) | | | | |
871911AR4 | | 6.2% Series | | M | | 6.2% | | 10/12 | | Now | | MW (T + .35%) | | | 70 | | | 70 | | | | 70 | |
| | 5.875% Series – | | | | | | | | | | | | | | | | | | | | | |
179423AC2 | | Mississippi Business Finance Corp. | | G(b)
| | 5.875% | | 2022 | | Now | | 100% | | | 216 | | | 216 | | | | 216 | |
| | 5.9% Series – | | | | | | | | | | | | | | | | | | | | | |
605277AC6 | | Mississippi Business Finance Corp. | | G(b)
| | 5.9% | | 2022 | | Now | | 100% | | | 103 | | | 103 | | | | 103 | |
179423AK4 | | 6.2% Series – Claiborne County | | G(b)
| | 6.2% | | 2026 | | Now | | 100% | | | 90 | | | 90 | | | | 90 | |
| | | | | | | | | | | | | | | | | | | | | | | | |
| | Total bonds | | | | | | | | | | | | | 479 | | | 479 | | | | 479 | |
| | | | | | | | | | | | | | | | | | | | | | | | |
OTHER LONG-TERM DEBT: | | | | | | | | | | | | | | | | | | | |
| | Grand Gulf Lease Obligation 5.13% | | | | 5.13% | | | | | | | | | 267 | | | 295 | | | | 322 | |
| | Unamortized Premium and Discount – Net | | | | | | | | | | | | | (1 | ) | | (1 | ) | | | (1 | ) |
| | | | | | | | | | | | | | | | | | | | | | | | |
TOTAL LONG-TERM DEBT | | | | | | | | | | | 745 | | | 773 | | | | 800 | |
Less Amount Due Within One Year | | | | | | | | | | | 42 | | | 28 | | | | 27 | |
| | | | | | | | | | | | | | | | | | | | | | | | |
Long-Term Debt Excluding Amount Due Within One Year | | | | | | | | | | $ | 703 | | | $745 | | | $ | 773 | |
| | | | | | | | | | | | | | | | | | | | | | | | |
Fair Value of Long-Term Debt(a) | | | | | | | | | | $ | 480 | | | $364 | | | $ | 481 | |
| | | | | | | | | | | | | | | | | | | | | | | | |
*M = Mortgage; G = Governmental | | | | | | | | | | | | | | | | | | | |
Weighted-average annualized coupon rate | | | | | | | | | | | 5.7% | | | 5.7% | | | | 5.6% | |
| | | | | | | | | | | | | | | | | | | | | | | | |
| (a) | The fair value excludes lease obligations of $267 million at System Energy and includes debt due within one year. It is determined using bid prices reported by dealer markets and by nationally recognized investment banking firms. |
| (b) | Consists of pollution control revenue bonds and environmental revenue bonds. |
Totals may not foot due to rounding.
35
UTILITY STATISTICAL INFORMATION
UTILITY TOTAL CAPABILITY
| | | | | | | | |
| | | | | | | OWNED & LEASED (MW)(a) | | |
| | | OPERATED | | | OPERATED |
| As of December 31, 2009 | | PLANTS | | UNITS | | | (MW) |
Plants that use fuel type: | | | | | | | | |
Gas/Oil | | 29 | | 75 | | 14,185 | | 14,822 |
Coal | | 3 | | 5 | | 2,260 | | 3,883 |
Petroleum Coke | | 1 | | 2 | | - | | 200 |
| | | | | | | | | |
Total Fossil | | 33 | | 82 | | 16,445 | | 18,905 |
| | | | | | | | | |
Hydro | | 3 | | 7 | | 70 | | 150 |
| | | | | | | | | |
Nuclear | | 4 | | 5 | | 5,126 | | 5,244 |
| | | | | | | | | |
Total Capability | | 40 | | 94 | | 21,641 | | 24,299 |
| | | | | | | | | |
All plants that have units with multiple fuel types are in the Gas & Oil plant count.
| (a) | Owned and Leased Capability is the dependable load carrying capability as demonstrated under actual operating conditions based on the primary fuel (assuming no curtailments) that each station was designed to utilize. |
UTILITY SELECTED OPERATING DATA
| | | | | | | | | | | | | | |
| | | 2009 | | | 2008 | | | 2007 | | 2006 | | | 2005 | |
SOURCES OF ENERGY (GWh)(a) | | | | | | | | | | | | | | |
Net Generation: | | | | | | | | | | | | | | |
Gas & Oil | | 21,767 | | | 24,552 | | | 24,131 | | 18,703 | | | 21,388 | |
Coal | | 15,101 | | | 15,648 | | | 15,035 | | 14,383 | | | 13,502 | |
Nuclear | | 41,851 | | | 37,994 | | | 40,988 | | 41,687 | | | 38,432 | |
Hydro | | 233 | | | 197 | | | 135 | | 74 | | | 97 | |
| | | | | | | | | | | | | | | |
Total Net Generation | | 78,952 | | | 78,391 | | | 80,289 | | 74,847 | | | 73,419 | |
| | | | | | | | | | | | | | | |
Purchased Power: | | | | | | | | | | | | | | |
Affiliated Companies | | 741 | | | 817 | | | 729 | | 1,428 | | | 3,501 | |
Non-affiliated Companies | | 30,708 | | | 32,582 | | | 33,978 | | 36,974 | | | 36,689 | |
| | | | | | | | | | | | | | | |
Total Purchased Power | | 31,449 | | | 33,399 | | | 34,707 | | 38,402 | | | 40,190 | |
| | | | | | | | | | | | | | | |
Total Sources of Energy | | 110,401 | | | 111,790 | | | 114,996 | | 113,249 | | | 113,609 | |
| | | | | | | | | | | | | | | |
USES OF ENERGY (GWh)(a) | | | | | | | | | | | | | | |
Electric Energy Sales: | | | | | | | | | | | | | | |
Residential | | 33,626 | | | 33,047 | | | 33,281 | | 31,665 | | | 31,569 | |
Commercial | | 27,476 | | | 27,340 | | | 27,408 | | 25,079 | | | 24,401 | |
Industrial | | 35,638 | | | 37,843 | | | 38,985 | | 38,339 | | | 37,615 | |
Governmental | | 2,408 | | | 2,379 | | | 2,339 | | 1,580 | | | 1,568 | |
| | | | | | | | | | | | | | | |
Total Retail | | 99,148 | | | 100,609 | | | 102,013 | | 96,663 | | | 95,153 | |
| | | | | | | | | | | | | | | |
Sales for Resale | | 4,862 | | | 5,401 | | | 6,145 | | 10,803 | | | 11,459 | |
| | | | | | | | | | | | | | | |
Unbilled Energy | | 631 | | | (264 | ) | | 277 | | (167 | ) | | (823 | ) |
| | | | | | | | | | | | | | | |
Total Electric Energy Sales | | 104,641 | | | 105,746 | | | 108,435 | | 107,299 | | | 105,790 | |
| | | | | | | | | | | | | | | |
Line Losses and Company Usage | | 5,760 | | | 6,044 | | | 6,561 | | 5,950 | | | 7,819 | |
| | | | | | | | | | | | | | | |
Total Uses of Energy | | 110,401 | | | 111,790 | | | 114,996 | | 113,249 | | | 113,609 | |
| | | | | | | | | | | | | | | |
| | | | | | | | | | | | | | |
Peak Demand (MW) | | 21,009 | | | 21,241 | | | 22,001 | | 20,887 | | | 21,391 | |
Operational Summer Capacity at Peak (MW) | | 23,578 | | | 24,844 | | | 23,996 | | 22,087 | | | 22,247 | |
Annual System Load Factor (%) | | 60 | | | 59 | | | 59 | | 62 | | | 59 | |
Retail Electric Sales Growth Rate (%)(a) | | (1.5 | ) | | (1.4 | ) | | 5.5 | | 1.6 | | | (1.1 | ) |
Retail Electric Sales Weather-Adjusted Growth Rate (%)(a) | | (1.5 | ) | | (0.5 | ) | | 6.0 | | 1.9 | | | (2.7 | ) |
Regional Gross Domestic Product Rate (%) | | (0.6 | ) | | 2.8 | | | 3.6 | | 4.4 | | | 3.8 | |
National Gross Domestic Product Rate (%) | | (2.5 | ) | | 0.4 | | | 2.1 | | 2.7 | | | 3.1 | |
Average Fuel Cost (cents/KWh)(a) | | | | | | | | | | | | | | |
Natural Gas | | 5.64 | | | 10.28 | | | 8.05 | | 7.75 | | | 9.91 | |
Nuclear Fuel | | 0.66 | | | 0.60 | | | 0.57 | | 0.51 | | | 0.49 | |
Coal | | 2.04 | | | 2.06 | | | 1.86 | | 1.76 | | | 1.57 | |
Fuel Oil | | - | | | 19.45 | | | 14.13 | | 13.34 | | | 7.05 | |
Purchased Power | | 5.29 | | | 7.92 | | | 6.27 | | 5.48 | | | 6.37 | |
| | | | | | | | | | | | | | | |
| (a) | 2006 and 2005 reflect deconsolidation of Entergy New Orleans, Inc. |
Totals may not foot due to rounding.
36
UTILITY STATISTICAL INFORMATION
2009 CONSOLIDATING UTILITY ELECTRIC STATISTICAL INFORMATION
| | | | | | | | | | | | | | | | | | | | | |
| | | EAI | | EGSL | | ELL | | EMI | | ENOI | | ETI | | SERI | | ELIMINATIONS | | | TOTAL | | % |
ELECTRIC OPERATING REVENUES ($ thousands) | | | | | | | | | | | | | | | |
Residential | | 768,500 | | 393,490 | | 669,084 | | 466,632 | | 167,794 | | 533,146 | | - | | - | | | 2,998,646 | | 38% |
Commercial | | 474,543 | | 354,038 | | 456,274 | | 395,444 | | 166,454 | | 336,876 | | - | | - | | | 2,183,629 | | 28% |
Industrial | | 433,321 | | 383,272 | | 664,377 | | 146,608 | | 37,225 | | 332,303 | | - | | - | | | 1,997,106 | | 25% |
Governmental | | 21,731 | | 17,625 | | 35,760 | | 37,740 | | 69,306 | | 22,797 | | - | | - | | | 204,959 | | 2% |
| | | | | | | | | | | | | | | | | | | | | | |
Total Retail | | 1,698,095 | | 1,148,425 | | 1,825,495 | | 1,046,424 | | 440,779 | | 1,225,122 | | - | | - | | | 7,384,340 | | 93% |
| | | | | | | | | | | | | | | | | | | | | | |
Sales for Resale | | 452,424 | | 579,358 | | 256,596 | | 76,605 | | 88,010 | | 303,682 | | 553,991 | | (2,104,211 | ) | | 206,455 | | 3% |
Other | | 60,743 | | 48,827 | | 101,495 | | 54,275 | | 7,196 | | 35,019 | | 16 | | (18,350 | ) | | 289,221 | | 4% |
| | | | | | | | | | | | | | | | | | | | | | |
Total | | 2,211,263 | | 1,776,610 | | 2,183,586 | | 1,177,304 | | 535,985 | | 1,563,823 | | 554,007 | | (2,122,561 | ) | | 7,880,016 | | 100% |
| | | | | | | | | | | | | | | | | | | | | | |
FUEL REVENUES (included in above revenues) | | | | | | | | | | | | | | | |
Residential | | 127,137 | | 177,483 | | 287,909 | | 179,338 | | 62,017 | | 250,230 | | - | | - | | | 1,084,114 | | 34% |
Commercial | | 95,959 | | 175,960 | | 194,759 | | 158,937 | | 72,121 | | 186,662 | | - | | - | | | 884,398 | | 28% |
Industrial | | 104,226 | | 251,212 | | 435,112 | | 70,679 | | 19,103 | | 229,164 | | - | | - | | | 1,109,496 | | 35% |
Governmental | | 4,416 | | 7,341 | | 15,388 | | 13,614 | | 31,866 | | 11,479 | | - | | - | | | 84,104 | | 3% |
| | | | | | | | | | | | | | | | | | | | | | |
Total Retail | | 331,738 | | 611,996 | | 933,168 | | 422,568 | | 185,107 | | 677,535 | | - | | - | | | 3,162,112 | | 100% |
| | | | | | | | | | | | | | | | | | | | | | |
SOURCES OF ENERGY (GWh) | | | | | | | | | | | | | | | |
Net Generation: | | | | | | | | | | | | | | | | | | | | | |
Gas & Oil | | 1,003 | | 1,705 | | 7,090 | | 3,583 | | 2,202 | | 6,184 | | - | | - | | | 21,767 | | 20% |
Coal | | 7,955 | | 2,472 | | - | | 2,847 | | - | | 1,827 | | - | | - | | | 15,101 | | 14% |
Nuclear | | 15,168 | | 7,836 | | 8,949 | | - | | - | | - | | 9,898 | | - | | | 41,851 | | 38% |
Hydro | | 233 | | - | | - | | - | | - | | - | | - | | - | | | 233 | | 0% |
| | | | | | | | | | | | | | | | | | | | | | |
Total Net Generation | | 24,359 | | 12,013 | | 16,039 | | 6,430 | | 2,202 | | 8,011 | | 9,898 | | - | | | 78,952 | | 72% |
| | | | | | | | | | | | | | | | | | | | | | |
Purchased Power: | | | | | | | | | | | | | | | |
Affiliated Companies | | 3,776 | | 6,768 | | 7,818 | | 6,127 | | 3,760 | | 6,349 | | - | | (33,857 | ) | | 741 | | 0% |
Non-affiliated Companies | | 4,968 | | 9,720 | | 7,644 | | 1,752 | | 590 | | 6,034 | | - | | - | | | 30,708 | | 28% |
| | | | | | | | | | | | | | | | | | | | | | |
Total Purchased Power | | 8,744 | | 16,488 | | 15,462 | | 7,879 | | 4,350 | | 12,383 | | - | | (33,857 | ) | | 31,449 | | 27% |
| | | | | | | | | | | | | | | | | | | | | | |
Total Sources of Energy | | 33,103 | | 28,501 | | 31,501 | | 14,309 | | 6,552 | | 20,394 | | 9,898 | | (33,857 | ) | | 110,401 | | 100% |
| | | | | | | | | | | | | | | | | | | | | | |
USES OF ENERGY (GWh) | | | | | | | | | | | | | | | |
Electric Energy Sales: | | | | | | | | | | | | | | | | | | | | | |
Residential | | 7,464 | | 5,090 | | 8,684 | | 5,358 | | 1,577 | | 5,453 | | - | | - | | | 33,626 | | 34% |
Commercial | | 5,817 | | 5,058 | | 5,867 | | 4,756 | | 1,813 | | 4,165 | | - | | - | | | 27,476 | | 28% |
Industrial | | 6,376 | | 7,601 | | 13,386 | | 2,178 | | 526 | | 5,570 | | - | | - | | | 35,638 | | 36% |
Governmental | | 269 | | 213 | | 459 | | 405 | | 805 | | 258 | | - | | - | | | 2,408 | | 2% |
| | | | | | | | | | | | | | | | | | | | | | |
Total Retail | | 19,926 | | 17,962 | | 28,396 | | 12,697 | | 4,721 | | 15,446 | | - | | - | | | 99,148 | | 100% |
| | | | | | | | | | | | | | | | | | | | | | |
Sales for Resale | | 11,611 | | 9,630 | | 1,621 | | 528 | | 1,543 | | 3,861 | | 9,898 | | (33,830 | ) | | 4,862 | | - |
| | | | | | | | | | | | | | | | | | | | | | |
Unbilled Energy | | 111 | | 149 | | 164 | | 74 | | 29 | | 104 | | - | | | | | 631 | | - |
| | | | | | | | | | | | | | | | | | | | | | |
Total Electric Energy Sales | | 31,648 | | 27,741 | | 30,181 | | 13,299 | | 6,293 | | 19,411 | | 9,898 | | (33,830 | ) | | 104,641 | | - |
| | | | | | | | | | | | | | | | | | | | | | |
Line Losses and Company Usage | | 1,455 | | 760 | | 1,320 | | 1,010 | | 259 | | 983 | | - | | (27 | ) | | 5,760 | | - |
| | | | | | | | | | | | | | | | | | | | | | |
Total Uses of Energy | | 33,103 | | 28,501 | | 31,501 | | 14,309 | | 6,552 | | 20,394 | | 9,898 | | (33,857 | ) | | 110,401 | | - |
| | | | | | | | | | | | | | | | | | | | | | |
AVERAGE ELECTRIC REVENUE (cents/KWh) | | | | | | | | | | | | | | | |
Residential | | 10.30 | | 7.73 | | 7.70 | | 8.71 | | 10.64 | | 9.78 | | - | | - | | | 8.92 | | - |
Commercial | | 8.16 | | 7.00 | | 7.78 | | 8.31 | | 9.18 | | 8.09 | | - | | - | | | 7.95 | | - |
Industrial | | 6.80 | | 5.04 | | 4.96 | | 6.73 | | 7.08 | | 5.97 | | - | | - | | | 5.60 | | - |
Governmental | | 8.08 | | 8.27 | | 7.79 | | 9.32 | | 8.61 | | 8.84 | | - | | - | | | 8.51 | | - |
| | | | | | | | | | | | | | | | | | | | | | |
NUMBER OF RETAIL ELECTRIC CUSTOMERS (as of December 31, 2009) | | | | | | | | | | | | | | | |
Residential | | 580,672 | | 324,285 | | 575,388 | | 365,804 | | 132,602 | | 352,682 | | - | | - | | | 2,331,433 | | 86% |
Commercial | | 87,929 | | 49,319 | | 74,608 | | 62,613 | | 13,064 | | 43,375 | | - | | - | | | 330,908 | | 12% |
Industrial | | 20,118 | | 3,436 | | 7,247 | | 2,749 | | 2,311 | | 4,896 | | - | | - | | | 40,757 | | 1% |
Governmental | | 661 | | 1,652 | | 5,539 | | 4,259 | | 1,747 | | 2,159 | | - | | - | | | 16,017 | | 1% |
| | | | | | | | | | | | | | | | | | | | | | |
Total Retail Customers | | 689,380 | | 378,692 | | 662,782 | | 435,425 | | 149,724 | | 403,112 | | - | | - | | | 2,719,115 | | 100% |
| | | | | | | | | | | | | | | | | | | | | | |
Totals may not foot due to rounding.
37
UTILITY STATISTICAL INFORMATION
ENTERGY ARKANSAS, INC.
| | | | | | | | | | | | |
| | | 2009 | | | 2008 | | 2007 | | 2006 | | 2005 | |
ELECTRIC OPERATING REVENUES ($ thousands) | | | | | | | | | | | | |
Residential | | 768,500 | | | 755,780 | | 689,885 | | 705,998 | | 620,327 | |
Commercial | | 474,543 | | | 462,599 | | 408,561 | | 417,914 | | 347,641 | |
Industrial | | 433,321 | | | 461,486 | | 406,984 | | 435,931 | | 361,879 | |
Governmental | | 21,731 | | | 21,043 | | 18,972 | | 19,390 | | 17,722 | |
| | | | | | | | | | | | | |
Total Retail | | 1,698,095 | | | 1,700,908 | | 1,524,402 | | 1,579,233 | | 1,347,569 | |
| | | | | | | | | | | | | |
Sales for Resale | | 452,424 | | | 572,350 | | 458,372 | | 472,509 | | 403,090 | |
Other | | 60,743 | | | 55,091 | | 50,191 | | 40,941 | | 38,397 | |
| | | | | | | | | | | | | |
Total Electric Operating Revenues | | 2,211,263 | | | 2,328,349 | | 2,032,965 | | 2,092,683 | | 1,789,056 | |
| | | | | | | | | | | | | |
| | | | | |
FUEL REVENUES (included in above revenues) | | | | | | | | | | | | |
Residential | | 127,137 | | | 142,415 | | 124,582 | | 183,931 | | 107,585 | |
Commercial | | 95,959 | | | 111,657 | | 92,056 | | 139,330 | | 81,478 | |
Industrial | | 104,226 | | | 135,772 | | 115,077 | | 179,291 | | 103,181 | |
Governmental | | 4,416 | | | 5,129 | | 4,308 | | 6,521 | | 4,034 | |
| | | | | | | | | | | | | |
Total Retail Fuel Revenues | | 331,738 | | | 394,973 | | 336,023 | | 509,073 | | 296,278 | |
| | | | | | | | | | | | | |
| | | | | |
SOURCES OF ENERGY (GWh) | | | | | | | | | | | | |
Net Generation: | | | | | | | | | | | | |
Gas & Oil | | 1,003 | | | 300 | | 89 | | 54 | | 266 | |
Coal | | 7,955 | | | 8,273 | | 7,935 | | 7,226 | | 6,899 | |
Nuclear | | 15,168 | | | 14,168 | | 15,486 | | 15,233 | | 13,681 | |
Hydro | | 233 | | | 197 | | 135 | | 74 | | 97 | |
| | | | | | | | | | | | | |
Total Net Generation | | 24,359 | | | 22,938 | | 23,645 | | 22,587 | | 20,943 | |
| | | | | | | | | | | | | |
Purchased Power: | | | | | | | | | | | | |
Affiliated Companies | | 3,776 | | | 3,480 | | 3,636 | | 3,898 | | 4,731 | |
Non-affiliated Companies | | 4,968 | | | 6,164 | | 5,790 | | 7,107 | | 5,858 | |
| | | | | | | | | | | | | |
Total Purchased Power | | 8,744 | | | 9,644 | | 9,426 | | 11,005 | | 10,589 | |
| | | | | | | | | | | | | |
Total Sources of Energy | | 33,103 | | | 32,582 | | 33,071 | | 33,592 | | 31,532 | |
| | | | | | | | | | | | | |
| | | | | |
USES OF ENERGY (GWh) | | | | | | | | | | | | |
Electric Energy Sales: | | | | | | | | | | | | |
Residential | | 7,464 | | | 7,678 | | 7,725 | | 7,655 | | 7,653 | |
Commercial | | 5,817 | | | 5,875 | | 5,945 | | 5,816 | | 5,730 | |
Industrial | | 6,376 | | | 7,211 | | 7,424 | | 7,587 | | 7,334 | |
Governmental | | 269 | | | 274 | | 277 | | 273 | | 288 | |
| | | | | | | | | | | | | |
Total Retail | | 19,926 | | | 21,038 | | 21,371 | | 21,331 | | 21,005 | |
| | | | | | | | | | | | | |
Sales for Resale | | 11,611 | | | 10,049 | | 9,836 | | 10,608 | | 8,658 | |
| | | | | | | | | | | | | |
Unbilled Energy | | 111 | | | 13 | | 35 | | 21 | | (83 | ) |
| | | | | | | | | | | | | |
Total Electric Energy Sales | | 31,648 | | | 31,100 | | 31,242 | | 31,960 | | 29,580 | |
| | | | | | | | | | | | | |
Line Losses and Company Usage | | 1,455 | | | 1,482 | | 1,829 | | 1,632 | | 1,952 | |
| | | | | | | | | | | | | |
Total Uses of Energy | | 33,103 | | | 32,582 | | 33,071 | | 33,592 | | 31,532 | |
| | | | | | | | | | | | | |
| | | | | |
AVERAGE ELECTRIC REVENUE (cents/KWh) | | | | | | | | | | | | |
Residential | | 10.30 | | | 9.84 | | 8.93 | | 9.22 | | 8.11 | |
Commercial | | 8.16 | | | 7.87 | | 6.87 | | 7.19 | | 6.07 | |
Industrial | | 6.80 | | | 6.40 | | 5.48 | | 5.75 | | 4.93 | |
Governmental | | 8.08 | | | 7.68 | | 6.85 | | 7.10 | | 6.16 | |
| | | | | | | | | | | | | |
| | | | | |
NUMBER OF RETAIL ELECTRIC CUSTOMERS | | | | | | | | | | | | |
(as of December 31) | | | | | | | | | | | | |
Residential | | 580,672 | | | 578,664 | | 576,975 | | 572,865 | | 571,168 | |
Commercial | | 87,929 | | | 87,322 | | 86,532 | | 84,768 | | 82,508 | |
Industrial | | 20,118 | | | 20,922 | | 20,040 | | 21,026 | | 20,364 | |
Governmental | | 661 | | | 640 | | 618 | | 662 | | 643 | |
| | | | | | | | | | | | | |
Total Retail Customers | | 689,380 | | | 687,548 | | 684,165 | | 679,321 | | 674,683 | |
| | | | | | | | | | | | | |
Totals may not foot due to rounding.
38
UTILITY STATISTICAL INFORMATION
ENTERGY ARKANSAS, INC.
GENERATION PORTFOLIO
| | | | | | | | | | | | | | | | | | | | |
| | | | | | | | | | | | | | | TOTAL PLANT – 2009 | |
| PLANT | | UNIT | | OWNERSHIP | | COMMERCIAL
OPERATION | | OWNED &
LEASED
CAPABILITY
(MW)(a) | | FUEL TYPE | | PURPOSE | | NET
GENERATION
(MWH) | | | EXPENSES
PER NET
MWH | | TOTAL
PRODUCTION
EXPENSE
($000) | |
Cecil Lynch | | 2 | | 100% | | 1949 | | - | | Gas/Oil | | Reserve | | 20,068 | | | 163.9 | | 3,290 | |
| | 3 | | 100% | | 1954 | | 110 | | Gas/Oil | | Peaking | | | | | | | | |
| | | | | | | | | | | | | | | | | | | | | |
Harvey Couch | | 1 | | 100% | | 1943 | | - | | Gas/Oil | | Reserve | | 44,513 | | | 252.4 | | 11,237 | |
| | 2 | | 100% | | 1954 | | 125 | | Gas/Oil | | Peaking | | | | | | | | |
| | | | | | | | | | | | | | | | | | | | | |
Lake Catherine | | 1 | | 100% | | 1950 | | 47 | | Gas/Oil | | Peaking | | 132,235 | | | 89.6 | | 11,848 | |
| | 2 | | 100% | | 1950 | | 45 | | Gas/Oil | | Peaking | | | | | | | | |
| | 3 | | 100% | | 1953 | | 96 | | Gas/Oil | | Peaking | | | | | | | | |
| | 4 | | 100% | | 1970 | | 532 | | Gas/Oil | | Peaking | | | | | | | | |
| | | | | | | | | | | | | | | | | | | | | |
Hamilton Moses | | 1 | | 100% | | 1951 | | 67 | | Gas/Oil | | Peaking | | 2,263 | | | 530.3 | | 1,200 | |
| | 2 | | 100% | | 1951 | | 70 | | Gas/Oil | | Peaking | | | | | | | | |
| | | | | | | | | | | | | | | | | | | | | |
Mabelvale | | 1 | | 100% | | 1970 | | 14 | | Gas/Oil | | Peaking | | 896 | | | 667.4 | | 598 | |
| | 2 | | 100% | | 1970 | | 14 | | Gas/Oil | | Peaking | | | | | | | | |
| | 3 | | 100% | | 1970 | | 14 | | Gas/Oil | | Peaking | | | | | | | | |
| | 4 | | 100% | | 1970 | | 14 | | Gas/Oil | | Peaking | | | | | | | | |
| | | | | | | | | | | | | | | | | | | | | |
Robert Ritchie | | 1 | | 100% | | 1961 | | - | | Gas/Oil | | Reserve | | (137 | ) | | 6,489.1 | | (889 | ) |
| | 3 | | 100% | | 1970 | | 16 | | Gas/Oil | | Peaking | | - | | | - | | 6 | |
| | | | | | | | | | | | | | | | | | | | | |
Ouachita | | 1 | | 100% | | 2002 | | 250 | | Gas | | Intermediate | | 803,178 | | | 50.3 | | 40,377 | |
| | 2 | | 100% | | 2002 | | 263 | | Gas | | Intermediate | | | | | | | | |
| | | | | | | | | | | | | | | | | | | | | |
Independence | | 1 | | 31.5% | | 1983 | | 263 | | Coal | | Base | | 1,671,412 | | | 22.7 | | 37,985 | |
| | | | | | | | | | | | | | | | | | | | | |
White Bluff | | 1 | | 57% | | 1980 | | 465 | | Coal | | Base | | 6,283,965 | | | 24.0 | | 150,663 | |
| | 2 | | 57% | | 1981 | | 480 | | Coal | | Base | | | | | | | | |
| | | | | | | | | | | | | | | | | | | | | |
Cecil Lynch | | Diesel | | 100% | | 1967 | | 5 | | Oil | | Peaking | | - | | | - | | 39 | |
| | | | | | | | | | | | | | | | | | | | | |
Carpenter | | 1 | | 100% | | 1932 | | 29 | | Hydro | | Peaking | | 186,133 | | | 7.2 | | 1,337 | |
| | 2 | | 100% | | 1932 | | 30 | | Hydro | | Peaking | | | | | | | | |
| | | | | | | | | | | | | | | | | | | | | |
Remmel | | 1 | | 100% | | 1925 | | 4 | | Hydro | | Peaking | | 46,388 | | | 16.1 | | 746 | |
| | 2 | | 100% | | 1925 | | 3 | | Hydro | | Peaking | | | | | | | | |
| | 3 | | 100% | | 1925 | | 4 | | Hydro | | Peaking | | | | | | | | |
| | | | | | | | | | | | | | | | | | | | | |
Arkansas | | | | | | | | | | | | | | | | | | | | |
Nuclear One | | 1 | | 100% | | 1974 | | 842 | | Nuclear PWR(b) | | Base | | 15,168,172 | | | 18.5 | | 280,385 | |
| | 2 | | 100% | | 1980 | | 997 | | Nuclear PWR(b) | | Base | | | | | | | | |
| | | | | | | | | | | | | | | | | | | | | |
Total | | | | | | | | 4,799 | | | | | | 24,359,086 | | | 22.1 | | 538,822 | |
| | | | | | | | | | | | | | | | | | | | | |
| (a) | Owned and Leased Capability is the dependable load carrying capability as demonstrated under actual operating conditions based on the primary fuel (assuming no curtailments) that each station was designed to utilize. |
| (b) | PWR = Pressurized Water Reactor. |
ENTERGY GULF STATES, INC.
HISTORICAL DATA PRIOR TO SEPARATION(a)
| | | | | | | | |
| | | 2007 | | 2006 | | | 2005 | |
SOURCES OF ENERGY (GWh) | | | | | | | | |
Net Generation: | | | | | | | | |
Gas & Oil | | 7,669 | | 7,036 | | | 9,320 | |
Coal | | 4,074 | | 4,460 | | | 4,077 | |
Nuclear | | 7,188 | | 7,461 | | | 7,808 | |
Hydro | | - | | - | | | - | |
| | | | | | | | | |
Total Net Generation | | 18,931 | | 18,957 | | | 21,205 | |
| | | | | | | | | |
Purchased Power: | | | | | | | | |
Affiliated Companies | | 5,514 | | 4,664 | | | 3,521 | |
Non-affiliated Companies | | 17,658 | | 18,690 | | | 17,500 | |
| | | | | | | | | |
Total Purchased Power | | 23,172 | | 23,354 | | | 21,021 | |
| | | | | | | | | |
Total Sources of Energy | | 42,103 | | 42,311 | | | 42,226 | |
| | | | | | | | | |
| | | |
USES OF ENERGY (GWh) | | | | | | | | |
Electric Energy Sales: | | | | | | | | |
Louisiana | | | | | | | | |
Residential | | 4,934 | | 4,899 | | | 4,817 | |
Commercial | | 4,895 | | 4,836 | | | 4,608 | |
Industrial | | 9,101 | | 9,150 | | | 9,317 | |
Governmental | | 204 | | 199 | | | 197 | |
Texas | | | | | | | | |
Residential | | 5,281 | | 5,211 | | | 5,207 | |
Commercial | | 4,085 | | 4,002 | | | 3,878 | |
Industrial | | 5,911 | | 5,915 | | | 5,650 | |
Governmental | | 244 | | 255 | | | 244 | |
| | | | | | | | | |
Total Retail | | 34,655 | | 34,467 | | | 33,918 | |
| | | | | | | | | |
Sales for Resale | | 5,388 | | 6,155 | | | 6,017 | |
| | | | | | | | | |
Unbilled Energy | | 125 | | (148 | ) | | (286 | ) |
| | | | | | | | | |
Total Electric Energy Sales | | 40,168 | | 40,474 | | | 39,649 | |
| | | | | | | | | |
Line Losses and Company Usage | | 1,935 | | 1,837 | | | 2,577 | |
| | | | | | | | | |
Total Uses of Energy | | 42,103 | | 42,311 | | | 42,226 | |
| | | | | | | | | |
| (a) | Effective December 31, 2007, Entergy Gulf States, Inc. completed a jurisdictional separation into two vertically integrated utility companies, one operating under the sole retail jurisdiction of the PUCT, Entergy Texas, Inc., and the other operating under the sole retail jurisdiction of the LPSC, Entergy Gulf States Louisiana, L.L.C., Entergy Gulf States Louisiana, L.L.C. is the successor for financial reporting purposes to Entergy Gulf States, Inc. Certain historical data by separate company is unavailable. |
Totals may not foot due to rounding.
39
UTILITY STATISTICAL INFORMATION
ENTERGY GULF STATES LOUISIANA, L.L.C.(a)
| | | | | | | | | | | |
| | | 2009 | | 2008 | | | 2007 | | 2006 | | 2005 |
ELECTRIC OPERATING REVENUES ($ thousands) | | | | | | | | | | | |
Residential | | 393,490 | | 553,527 | | | 497,782 | | 522,227 | | 457,498 |
Commercial | | 354,038 | | 520,214 | | | 452,930 | | 476,537 | | 406,921 |
Industrial | | 383,272 | | 672,213 | | | 620,472 | | 686,295 | | 625,709 |
Governmental | | 17,625 | | 24,964 | | | 21,710 | | 22,520 | | 19,562 |
| | | | | | | | | | | | |
Total Retail | | 1,148,425 | | 1,770,918 | | | 1,592,894 | | 1,707,579 | | 1,509,690 |
| | | | | | | | | | | | |
Sales for Resale | | 579,358 | | 824,404 | | | | | | | |
Other | | 48,827 | | 37,630 | | | REFER TO PAGE 39 |
Total Electric Operating Revenues | | 1,776,610 | | 2,632,952 | | | | | | | |
| | | | | |
FUEL REVENUES (included in above revenues) | | | | | | | | | | | |
Residential | | 177,483 | | 345,071 | | | 277,105 | | 284,937 | | 266,854 |
Commercial | | 175,960 | | 343,938 | | | 271,015 | | 280,628 | | 252,200 |
Industrial | | 251,212 | | 546,603 | | | 476,015 | | 508,048 | | 477,232 |
Governmental | | 7,341 | | 14,572 | | | 11,120 | | 11,459 | | 10,645 |
| | | | | | | | | | | | |
Total Retail Fuel Revenues | | 611,996 | | 1,250,184 | | | 1,035,255 | | 1,085,072 | | 1,006,931 |
| | | | | | | | | | | | |
| | | | | |
SOURCES OF ENERGY (GWh) | | | | | | | | | | | |
Net Generation: | | | | | | | | | | | |
Gas & Oil | | 1,705 | | 1,951 | | | REFER TO PAGE 39 |
Coal | | 2,472 | | 2,615 | | |
Nuclear | | 7,836 | | 6,334 | | |
Hydro | | - | | - | | |
Total Net Generation | | 12,013 | | 10,900 | | |
Purchased Power: | | | | | | |
Affiliated Companies | | 6,768 | | 7,725 | | |
Non-affiliated Companies | | 9,720 | | 9,607 | | |
Total Purchased Power | | 16,488 | | 17,332 | | |
Total Sources of Energy | | 28,501 | | 28,232 | | |
| | | | | |
USES OF ENERGY (GWh) | | | | | | | | | | | |
Electric Energy Sales: | | | | | | | | | | | |
Residential | | 5,090 | | 4,888 | | | 4,934 | | 4,899 | | 4,817 |
Commercial | | 5,058 | | 4,973 | | | 4,895 | | 4,836 | | 4,608 |
Industrial | | 7,601 | | 8,416 | | | 9,101 | | 9,150 | | 9,317 |
Governmental | | 213 | | 215 | | | 204 | | 199 | | 197 |
| | | | | | | | | | | | |
Total Retail | | 17,962 | | 18,492 | | | 19,134 | | 19,084 | | 18,939 |
| | | | | | | | | | | | |
Sales for Resale | | 9,630 | | 9,014 | | | REFER TO PAGE 39 |
Unbilled Energy | | 149 | | (138 | ) | |
Total Electric Energy Sales | | 27,741 | | 27,368 | | |
Line Losses and Company Usage | | 760 | | 864 | | |
Total Uses of Energy | | 28,501 | | 28,232 | | |
| | | | | | | | | | | | |
AVERAGE ELECTRIC REVENUE (cents/KWh) | | | | | | | | | | | |
Residential | | 7.73 | | 11.32 | | | 10.09 | | 10.66 | | 9.50 |
Commercial | | 7.00 | | 10.46 | | | 9.25 | | 9.85 | | 8.83 |
Industrial | | 5.04 | | 7.99 | | | 6.82 | | 7.50 | | 6.72 |
Governmental | | 8.27 | | 11.61 | | | 10.64 | | 11.34 | | 9.94 |
| | | | | | | | | | | | |
| | | | | |
NUMBER OF RETAIL ELECTRIC CUSTOMERS | | | | | | | | | | | |
(as of December 31) | | | | | | | | | | | |
Residential | | 324,285 | | 320,745 | | | 317,001 | | 311,739 | | 305,714 |
Commercial | | 49,319 | | 48,636 | | | 47,749 | | 46,351 | | 45,421 |
Industrial | | 3,436 | | 3,761 | | | 4,320 | | 4,558 | | 4,268 |
Governmental | | 1,652 | | 1,666 | | | 1,642 | | 1,528 | | 1,457 |
| | | | | | | | | | | | |
Total Retail Customers | | 378,692 | | 374,808 | | | 370,712 | | 364,176 | | 356,860 |
| | | | | | | | | | | | |
| (a) | Effective December 31, 2007, Entergy Gulf States, Inc. completed a jurisdictional separation into two vertically integrated utility companies, one operating under the sole retail jurisdiction of the PUCT, Entergy Texas, Inc., and the other operating under the sole retail jurisdiction of the LPSC, Entergy Gulf States Louisiana, L.L.C., Entergy Gulf States Louisiana, L.L.C. is the successor for financial reporting purposes to Entergy Gulf States, Inc. Certain historical data by separate company is unavailable. Page 39 reflects historical data prior to the separation. |
| | Totals may not foot due to rounding. |
40
UTILITY STATISTICAL INFORMATION
ENTERGY TEXAS, INC.(a)
| | | | | | | | | | | |
| | | 2009 | | 2008 | | | 2007 | | 2006 | | 2005 |
ELECTRIC OPERATING REVENUES ($ thousands) | | | | | | | | | | | |
Residential | | 533,146 | | 606,133 | | | 544,254 | | 599,494 | | 502,135 |
Commercial | | 336,876 | | 416,798 | | | 364,322 | | 406,198 | | 327,287 |
Industrial | | 332,303 | | 489,165 | | | 414,036 | | 463,640 | | 388,285 |
Governmental | | 22,797 | | 26,872 | | | 23,583 | | 26,609 | | 21,693 |
| | | | | | | | | | | | |
Total Retail | | 1,225,122 | | 1,538,968 | | | 1,346,195 | | 1,495,941 | | 1,239,400 |
| | | | | | | | | | | | |
Sales for Resale | | 303,682 | | 441,314 | | | REFER TO PAGE 39 |
Other | | 35,019 | | 31,976 | | |
Total Electric Operating Revenues | | 1,563,823 | | 2,012,258 | | |
FUEL REVENUES (included in above revenues) | | | | | | |
Residential | | 250,230 | | 328,397 | | | 281,118 | | 351,457 | | 268,957 |
Commercial | | 186,662 | | 255,759 | | | 213,574 | | 266,062 | | 199,093 |
Industrial | | 229,164 | | 363,208 | | | 298,219 | | 350,788 | | 284,032 |
Governmental | | 11,479 | | 15,446 | | | 12,946 | | 16,802 | | 12,465 |
| | | | | | | | | | | | |
Total Retail Fuel Revenues | | 677,535 | | 962,810 | | | 805,857 | | 985,109 | | 764,547 |
| | | | | | | | | | | | |
| | | | | |
SOURCES OF ENERGY (GWh) | | | | | | | | | | | |
Net Generation: | | | | | | | | | | | |
Gas & Oil | | 6,184 | | 6,046 | | | REFER TO PAGE 39 |
Coal | | 1,827 | | 1,933 | | |
Nuclear | | - | | - | | |
Hydro | | - | | - | | |
Total Net Generation | | 8,011 | | 7,979 | | |
Purchased Power: | | | | | | |
Affiliated Companies | | 6,349 | | 5,696 | | |
Non-affiliated Companies | | 6,034 | | 6,530 | | |
Total Purchased Power | | 12,383 | | 12,226 | | |
Total Sources of Energy | | 20,394 | | 20,205 | | |
USES OF ENERGY (GWh) | | | | | | |
Electric Energy Sales: | | | | | | |
Residential | | 5,453 | | 5,245 | | | 5,280 | | 5,211 | | 5,207 |
Commercial | | 4,165 | | 4,092 | | | 4,085 | | 4,002 | | 3,878 |
Industrial | | 5,570 | | 5,948 | | | 5,911 | | 5,915 | | 5,650 |
Governmental | | 258 | | 248 | | | 246 | | 255 | | 244 |
| | | | | | | | | | | | |
Total Retail | | 15,446 | | 15,533 | | | 15,522 | | 15,383 | | 14,979 |
| | | | | | | | | | | | |
Sales for Resale | | 3,861 | | 3,858 | | | REFER TO PAGE 39 |
Unbilled Energy | | 104 | | (64 | ) | |
Total Electric Energy Sales | | 19,411 | | 19,327 | | |
Line Losses and Company Usage | | 983 | | 878 | | |
Total Uses of Energy | | 20,394 | | 20,205 | | |
AVERAGE ELECTRIC REVENUE (cents/KWh) | | | | | | |
Residential | | 9.78 | | 11.56 | | | 10.31 | | 11.50 | | 9.64 |
Commercial | | 8.09 | | 10.19 | | | 8.92 | | 10.15 | | 8.44 |
Industrial | | 5.97 | | 8.22 | | | 7.00 | | 7.84 | | 6.87 |
Governmental | | 8.84 | | 10.84 | | | 9.63 | | 10.41 | | 8.88 |
| | | | | | | | | | | | |
| | | | | |
NUMBER OF RETAIL ELECTRIC CUSTOMERS | | | | | | | | | | | |
(as of December 31) | | | | | | | | | | | |
Residential | | 352,682 | | 346,533 | | | 344,704 | | 336,652 | | 335,089 |
Commercial | | 43,375 | | 42,005 | | | 41,963 | | 40,806 | | 40,887 |
Industrial | | 4,896 | | 4,532 | | | 4,934 | | 5,013 | | 4,911 |
Governmental | | 2,159 | | 2,112 | | | 2,085 | | 2,052 | | 2,017 |
| | | | | | | | | | | | |
Total Retail Customers | | 403,112 | | 395,182 | | | 393,686 | | 384,523 | | 382,904 |
| | | | | | | | | | | | |
| (a) | Effective December 31, 2007, Entergy Gulf States, Inc. completed a jurisdictional separation into two vertically integrated utility companies, one operating under the sole retail jurisdiction of the PUCT, Entergy Texas, Inc., and the other operating under the sole retail jurisdiction of the LPSC, Entergy Gulf States Louisiana, L.L.C., Entergy Gulf States Louisiana, L.L.C. is the successor for financial reporting purposes to Entergy Gulf States, Inc. Certain historical data by separate company is unavailable. Page 39 reflects historical data prior to the separation. |
| | Totals may not foot due to rounding. |
41
UTILITY STATISTICAL INFORMATION
ENTERGY GULF STATES LOUISIANA, L.L.C.
GENERATION PORTFOLIO
| | | | | | | | | | | | | | | | | | | | | |
| | | | | | | | | | | | | | | TOTAL PLANT – 2009 | |
| PLANT | | UNIT | | OWNERSHIP | | COMMERCIAL
OPERATION | | OWNED &
LEASED
CAPABILITY
(MW)(a) | | FUEL TYPE | | PURPOSE | | NET
GENERATION
(MWH) | | | EXPENSES
PER NET
MWH | | | TOTAL
PRODUCTION
EXPENSE
($000) | |
LA Station 2 | | 7 | | 100% | | 1950 | | - | | Gas | | Reserve | | - | | | - | | | 374 | |
| | 8 | | 100% | | 1950 | | - | | Gas | | Reserve | | | | | | | | | |
| | 9 | | 100% | | 1953 | | - | | Gas | | Reserve | | | | | | | | | |
| | | | | | | | | | | | | | | | | | | | | | |
Willow Glen | | 1 | | 100% | | 1960 | | 152 | | Gas/Oil | | Peaking | | 396,567 | | | 74.3 | | | 29,473 | |
| | 2 | | 100% | | 1964 | | 195 | | Gas/Oil | | Peaking | | | | | | | | | |
| | 3 | | 100% | | 1968 | | - | | Gas | | Reserve | | | | | | | | | |
| | 4 | | 100% | | 1973 | | 470 | | Gas/Oil | | Peaking | | | | | | | | | |
| | 5 | | 100% | | 1976 | | - | | Gas/Oil | | Reserve | | | | | | | | | |
| | | | | | | | | | | | | | | | | | | | | | |
Roy S. Nelson | | 3 | | 100% | | 1960 | | 153 | | Gas/Oil | | Intermediate | | 1,135,263 | | | 59.4 | | | 67,473 | |
| | 4 | | 100% | | 1970 | | 450 | | Gas/Oil | | Intermediate | | | | | | | | | |
| | | | | | | | | | | | | | | | | | | | | | |
Calcasieu | | 1 | | 100% | | 2000 | | 150 | | Gas | | Peaking | | 89,120 | | | 135.8 | | | 12,099 | |
| | 2 | | 100% | | 2001 | | 160 | | Gas | | Peaking | | | | | | | | | |
| | | | | | | | | | | | | | | | | | | | | | |
Ouachita | | 3 | | 100% | | 2002 | | 258 | | Gas | | Intermediate | | 83,410 | | | 47.6 | | | 3,967 | |
| | | | | | | | | | | | | | | | | | | | | | |
Roy S. Nelson | | 6 | | 40% | | 1982 | | 221 | | Coal | | Base | | 1,416,852 | | | 34.2 | | | 48,436 | |
| | | | | | | | | | | | | | | | | | | | | | |
Big Cajun 2 | | 3 | | 24% | | 1983 | | 142 | | Coal | | Base | | 1,055,283 | | | 25.5 | | | 26,874 | |
| | | | | | | | | | | | | | | | | | | | | | |
River Bend | | 1 | | 100%(c) | | 1986 | | 978 | | Nuclear BWR(b) | | Base | | 7,836,049 | | | 21.4 | | | 168,278 | |
| | | | | | | | | | | | | | | | | | | | | | |
Total | | | | | | | | 3,329 | | | | | | 12,012,544 | | | 29.7 | | | 356,974 | |
| | | | | | | | | | | | | | | | | | | | | | |
ENTERGY TEXAS, INC.
GENERATION PORTFOLIO
| | | | | | | | | | | | | | | | | | |
| | | | | | | | | | | | | | | TOTAL PLANT – 2009 |
| PLANT | | UNIT | | OWNERSHIP | | COMMERCIAL
OPERATION | | OWNED &
LEASED
CAPABILITY
(MW)(a) | | FUEL TYPE | | PURPOSE | | NET
GENERATION
(MWH) | | EXPENSES
PER NET
MWH | | TOTAL
PRODUCTION
EXPENSE
($000) |
Roy S. Nelson | | 6 | | 30% | | 1982 | | 164 | | Coal | | Base | | 1,047,239 | | 36.2 | | 37,927 |
| | | | | | | | | | | | | | | | | | | |
Big Cajun 2 | | 3 | | 18% | | 1983 | | 105 | | Coal | | Base | | 779,991 | | 25.5 | | 19,868 |
| | | | | | | | | | | | | | | | | | | |
Lewis Creek | | 1 | | 100% | | 1970 | | 230 | | Gas/Oil | | Intermediate | | 1,741,243 | | 51.0 | | 88,833 |
| | 2 | | 100% | | 1971 | | 230 | | Gas/Oil | | Intermediate | | | | | | |
| | | | | | | | | | | | | | | | | | | |
Sabine | | 1 | | 100% | | 1962 | | 212 | | Gas/Oil | | Intermediate | | 4,442,173 | | 50.2 | | 222,849 |
| | 2 | | 100% | | 1962 | | 212 | | Gas/Oil | | Intermediate | | | | | | |
| | 3 | | 100% | | 1966 | | 390 | | Gas/Oil | | Intermediate | | | | | | |
| | 4 | | 100% | | 1974 | | 530 | | Gas | | Intermediate | | | | | | |
| | 5 | | 100% | | 1979 | | 470 | | Gas/Oil | | Intermediate | | | | | | |
| | | | | | | | | | | | | | | | | | | |
Total | | | | | | | | 2,543 | | | | | | 8,010,646 | | 46.1 | | 369,477 |
| | | | | | | | | | | | | | | | | | | |
| (a) | Owned and Leased Capability is the dependable load carrying capability as demonstrated under actual operating conditions based on the primary fuel (assuming no curtailments) that each station was designed to utilize. |
| (b) | BWR = Boiling Water Reactor. |
| (c) | 30% of River Bend is not subject to rate regulation by the Public Utility Commission of Texas, the Louisiana Public Service Commission, nor various municipal authorities. |
42
UTILITY STATISTICAL INFORMATION
ENTERGY LOUISIANA, LLC
| | | | | | | | | | | | | | |
| | | 2009 | | | 2008 | | | 2007 | | 2006 | | | 2005 | |
| | | | | | | | | | | | | | | |
ELECTRIC OPERATING REVENUES ($ thousands) | | | | | | | | | | | | | | |
Residential | | 669,084 | | | 967,445 | | | 853,780 | | 797,197 | | | 827,926 | |
Commercial | | 456,274 | | | 659,880 | | | 578,025 | | 532,999 | | | 538,683 | |
Industrial | | 664,377 | | | 1,061,887 | | | 871,853 | | 809,237 | | | 834,320 | |
Governmental | | 35,760 | | | 51,064 | | | 43,550 | | 40,454 | | | 40,813 | |
| | | | | | | | | | | | | | | |
Total Retail | | 1,825,495 | | | 2,740,276 | | | 2,347,208 | | 2,179,887 | | | 2,241,742 | |
| | | | | | | | | | | | | | | |
Sales for Resale | | 256,596 | | | 261,218 | | | 318,001 | | 227,391 | | | 352,544 | |
Other | | 101,495 | | | 49,800 | | | 72,343 | | 43,980 | | | 55,895 | |
| | | | | | | | | | | | | | | |
Total Electric Operating Revenues | | 2,183,586 | | | 3,051,294 | | | 2,737,552 | | 2,451,258 | | | 2,650,181 | |
| | | | | | | | | | | | | | | |
| | | | | |
FUEL REVENUES (included in above revenues) | | | | | | | | | | | | | | |
Residential | | 287,909 | | | 530,363 | | | 415,883 | | 374,595 | | | 430,830 | |
Commercial | | 194,759 | | | 358,257 | | | 280,200 | | 249,803 | | | 277,180 | |
Industrial | | 435,112 | | | 780,147 | | | 614,448 | | 545,040 | | | 588,943 | |
Governmental | | 15,388 | | | 27,782 | | | 21,305 | | 19,313 | | | 21,022 | |
| | | | | | | | | | | | | | | |
Total Retail Fuel Revenues | | 933,168 | | | 1,696,549 | | | 1,331,836 | | 1,188,751 | | | 1,317,975 | |
| | | | | | | | | | | | | | | |
| | | | | |
SOURCES OF ENERGY (GWh) | | | | | | | | | | | | | | |
Net Generation: | | | | | | | | | | | | | | |
Gas & Oil | | 7,090 | | | 8,930 | | | 8,784 | | 7,486 | | | 8,968 | |
Coal | | - | | | - | | | - | | - | | | - | |
Nuclear | | 8,949 | | | 9,037 | | | 9,893 | | 9,270 | | | 7,885 | |
Hydro | | - | | | - | | | - | | - | | | - | |
| | | | | | | | | | | | | | | |
Total Net Generation | | 16,039 | | | 17,967 | | | 18,677 | | 16,756 | | | 16,853 | |
| | | | | | | | | | | | | | | |
Purchased Power: | | | | | | | | | | | | | | |
Affiliated Companies | | 7,818 | | | 5,996 | | | 6,025 | | 6,612 | | | 6,027 | |
Non-affiliated Companies | | 7,644 | | | 7,511 | | | 7,484 | | 7,945 | | | 8,212 | |
| | | | | | | | | | | | | | | |
Total Purchased Power | | 15,462 | | | 13,507 | | | 13,509 | | 14,557 | | | 14,239 | |
| | | | | | | | | | | | | | | |
Total Sources of Energy | | 31,501 | | | 31,474 | | | 32,186 | | 31,313 | | | 31,092 | |
| | | | | | | | | | | | | | | |
USES OF ENERGY (GWh) | | | | | | | | | | | | | | |
Electric Energy Sales: | | | | | | | | | | | | | | |
Residential | | 8,684 | | | 8,487 | | | 8,646 | | 8,513 | | | 8,559 | |
Commercial | | 5,867 | | | 5,784 | | | 5,848 | | 5,680 | | | 5,554 | |
Industrial | | 13,386 | | | 13,162 | | | 13,209 | | 12,759 | | | 12,348 | |
Governmental | | 459 | | | 459 | | | 446 | | 435 | | | 428 | |
| | | | | | | | | | | | | | | |
Total Retail | | 28,396 | | | 27,892 | | | 28,149 | | 27,387 | | | 26,889 | |
| | | | | | | | | | | | | | | |
Sales for Resale | | 1,621 | | | 2,233 | | | 2,411 | | 2,470 | | | 2,560 | |
| | | | | | | | | | | | | | | |
Unbilled Energy | | 164 | | | (118 | ) | | 124 | | (25 | ) | | (379 | ) |
| | | | | | | | | | | | | | | |
Total Electric Energy Sales | | 30,181 | | | 30,007 | | | 30,684 | | 29,832 | | | 29,070 | |
| | | | | | | | | | | | | | | |
Line Losses and Company Usage | | 1,320 | | | 1,467 | | | 1,502 | | 1,481 | | | 2,022 | |
| | | | | | | | | | | | | | | |
Total Uses of Energy | | 31,501 | | | 31,474 | | | 32,186 | | 31,313 | | | 31,092 | |
| | | | | | | | | | | | | | | |
| | | | | |
AVERAGE ELECTRIC REVENUE (cents/KWh) | | | | | | | | | | | | | | |
Residential | | 7.70 | | | 11.40 | | | 9.87 | | 9.32 | | | 9.67 | |
Commercial | | 7.78 | | | 11.41 | | | 9.88 | | 9.33 | | | 9.70 | |
Industrial | | 4.96 | | | 8.07 | | | 6.60 | | 6.34 | | | 6.76 | |
Governmental | | 7.79 | | | 11.13 | | | 9.76 | | 9.18 | | | 9.53 | |
| | | | | | | | | | | | | | | |
| | | | | |
NUMBER OF RETAIL ELECTRIC CUSTOMERS | | | | | | | | | | | | | | |
(as of December 31) | | | | | | | | | | | | | | |
Residential | | 575,388 | | | 571,301 | | | 568,893 | | 560,462 | | | 539,912 | |
Commercial | | 74,608 | | | 73,617 | | | 73,012 | | 71,029 | | | 66,897 | |
Industrial | | 7,247 | | | 7,592 | | | 8,374 | | 8,563 | | | 7,005 | |
Governmental | | 5,539 | | | 5,387 | | | 5,229 | | 4,858 | | | 4,494 | |
| | | | | | | | | | | | | | | |
Total Retail Customers | | 662,782 | | | 657,897 | | | 655,508 | | 644,912 | | | 618,308 | |
| | | | | | | | | | | | | | | |
Totals may not foot due to rounding.
43
UTILITY STATISTICAL INFORMATION
ENTERGY LOUISIANA, LLC
GENERATION PORTFOLIO
| | | | | | | | | | | | | | | | | | |
| | | | | | | | | | | | | | | TOTAL PLANT – 2009 |
| PLANT | | UNIT | | OWNERSHIP | | COMMERCIAL
OPERATION | | OWNED &
LEASED
CAPABILITY
(MW)(a) | | FUEL TYPE | | PURPOSE | | NET
GENERATION
(MWH) | | EXPENSES
PER NET
MWH | | TOTAL
PRODUCTION
EXPENSE
($000) |
Buras | | 8 | | 100% | | 1971 | | 12 | | Gas/Oil | | Peaking | | 1,064 | | 405.1 | | 431 |
| | | | | | | | | | | | | | | | | | | |
Little Gypsy | | 1 | | 100% | | 1961 | | 238 | | Gas/Oil | | Intermediate | | 2,165,485 | | 61.7 | | 133,564 |
| | 2 | | 100% | | 1966 | | 415 | | Gas/Oil | | Intermediate | | | | | | |
| | 3 | | 100% | | 1969 | | 525 | | Gas/Oil | | Intermediate | | | | | | |
| | | | | | | | | | | | | | | | | | | |
Monroe | | 10 | | 100% | | 1961 | | - | | Gas | | Reserve | | - | | - | | 293 |
| | 11 | | 100% | | 1965 | | - | | Gas | | Reserve | | | | | | |
| | 12 | | 100% | | 1968 | | - | | Gas | | Reserve | | | | | | |
| | | | | | | | | | | | | | | | | | | |
Ninemile Point | | 1 | | 100% | | 1951 | | - | | Gas/Oil | | Reserve | | 2,728,414 | | 63.3 | | 172,810 |
| | 2 | | 100% | | 1953 | | - | | Gas/Oil | | Reserve | | | | | | |
| | 3 | | 100% | | 1955 | | 125 | | Gas/Oil | | Intermediate | | | | | | |
| | 4 | | 100% | | 1971 | | 710 | | Gas/Oil | | Intermediate | | | | | | |
| | 5 | | 100% | | 1973 | | 740 | | Gas/Oil | | Intermediate | | | | | | |
| | | | | | | | | | | | | | | | | | | |
Perryville | | 1 | | 100% | | 2002 | | 535 | | Gas | | Intermediate | | 1,628,415 | | 41.2 | | 67,091 |
| | 2 | | 100% | | 2001 | | 156 | | Gas | | Peaking | | | | | | |
| | | | | | | | | | | | | | | | | | | |
Sterlington | | 6 | | 100% | | 1958 | | 212 | | Gas/Oil | | Peaking | | 19,468 | | 235.0 | | 4,575 |
| | 7 | | 100% | | 1974 | | 174 | | Gas/Oil | | Peaking | | | | | | |
| | | | | | | | | | | | | | | | | | | |
Waterford | | 1 | | 100% | | 1975 | | 411 | | Gas/Oil | | Intermediate | | 547,182 | | 89.7 | | 49,054 |
| | 2 | | 100% | | 1975 | | 405 | | Gas/Oil | | Intermediate | | | | | | |
| | 4 | | 100% | | 2009 | | 35 | | Oil | | Peaking | | - | | - | | - |
| | | | | | | | | | | | | | | | | | | |
Waterford | | 3 | | 100% | | 1985 | | 1,176 | | Nuclear PWR(b) | | Base | | 8,948,903 | | 19.7 | | 175,556 |
| | | | | | | | | | | | | | | | | | | |
Total | | | | | | | | 5,869 | | | | | | 16,038,931 | | 37.6 | | 603,374 |
| | | | | | | | | | | | | | | | | | | |
| (a) | Owned and Leased Capability is the dependable load carrying capability as demonstrated under actual operating conditions based on the primary fuel (assuming no curtailments) that each station was designed to utilize. |
| (b) | PWR = Pressurized Water Reactor. |
44
UTILITY STATISTICAL INFORMATION
ENTERGY MISSISSIPPI, INC.
| | | | | | | | | | | | | | |
| | | 2009 | | | 2008 | | 2007 | | | 2006 | | | 2005 | |
ELECTRIC OPERATING REVENUES ($ thousands) | | | | | | | | | | | | | | |
Residential | | 466,632 | | | 555,913 | | 500,097 | | | 568,435 | | | 503,232 | |
Commercial | | 395,444 | | | 481,878 | | 427,545 | | | 484,297 | | | 420,507 | |
Industrial | | 146,608 | | | 199,453 | | 185,119 | | | 235,281 | | | 209,270 | |
Governmental | | 37,740 | | | 44,336 | | 40,417 | | | 45,433 | | | 40,605 | |
| | | | | | | | | | | | | | | |
Total Retail | | 1,046,424 | | | 1,281,580 | | 1,153,178 | | | 1,333,446 | | | 1,173,614 | |
| | | | | | | | | | | | | | | |
Sales for Resale | | 76,605 | | | 128,753 | | 171,710 | | | 80,445 | | | 98,885 | |
Other | | 54,275 | | | 51,849 | | 47,914 | | | 36,117 | | | 34,041 | |
| | | | | | | | | | | | | | | |
Total Electric Operating Revenues | | 1,177,304 | | | 1,462,182 | | 1,372,802 | | | 1,450,008 | | | 1,306,543 | |
| | | | | | | | | | | | | | | |
FUEL REVENUES (included in above revenues) | | | | | | | | | | | | | | |
Residential | | 179,338 | | | 281,916 | | 215,446 | | | 316,861 | | | 251,338 | |
Commercial | | 158,937 | | | 252,867 | | 192,289 | | | 280,819 | | | 220,024 | |
Industrial | | 70,679 | | | 121,026 | | 100,293 | | | 157,157 | | | 128,483 | |
Governmental | | 13,614 | | | 21,352 | | 16,605 | | | 24,908 | | | 19,440 | |
| | | | | | | | | | | | | | | |
Total Retail Fuel Revenues | | 422,568 | | | 677,161 | | 524,633 | | | 779,745 | | | 619,285 | |
| | | | | | | | | | | | | | | |
SOURCES OF ENERGY (GWh) | | | | | | | | | | | | | | |
Net Generation: | | | | | | | | | | | | | | |
Gas & Oil | | 3,583 | | | 5,257 | | 5,734 | | | 4,127 | | | 2,834 | |
Coal | | 2,847 | | | 2,827 | | 3,026 | | | 2,697 | | | 2,526 | |
Nuclear | | - | | | - | | - | | | - | | | - | |
Hydro | | - | | | - | | - | | | - | | | - | |
| | | | | | | | | | | | | | | |
Total Net Generation | | 6,430 | | | 8,084 | | 8,760 | | | 6,824 | | | 5,360 | |
| | | | | | | | | | | | | | | |
Purchased Power: | | | | | | | | | | | | | | |
Affiliated Companies | | 6,127 | | | 4,903 | | 4,602 | | | 5,327 | | | 4,924 | |
Non-affiliated Companies | | 1,752 | | | 2,083 | | 2,706 | | | 3,232 | | | 5,119 | |
| | | | | | | | | | | | | | | |
Total Purchased Power | | 7,879 | | | 6,986 | | 7,308 | | | 8,559 | | | 10,043 | |
| | | | | | | | | | | | | | | |
Total Sources of Energy | | 14,309 | | | 15,070 | | 16,068 | | | 15,383 | | | 15,403 | |
| | | | | | | | | | | | | | | |
USES OF ENERGY (GWh) | | | | | | | | | | | | | | |
Electric Energy Sales: | | | | | | | | | | | | | | |
Residential | | 5,358 | | | 5,354 | | 5,474 | | | 5,387 | | | 5,333 | |
Commercial | | 4,756 | | | 4,841 | | 4,872 | | | 4,746 | | | 4,630 | |
Industrial | | 2,178 | | | 2,565 | | 2,771 | | | 2,927 | | | 2,967 | |
Governmental | | 405 | | | 411 | | 421 | | | 417 | | | 411 | |
| | | | | | | | | | | | | | | |
Total Retail | | 12,697 | | | 13,171 | | 13,538 | | | 13,477 | | | 13,341 | |
| | | | | | | | | | | | | | | |
Sales for Resale | | 528 | | | 935 | | 1,493 | | | 900 | | | 936 | |
| | | | | | | | | | | | | | | |
Unbilled Energy | | 74 | | | 23 | | (22 | ) | | (15 | ) | | (75 | ) |
| | | | | | | | | | | | | | | |
Total Electric Energy Sales | | 13,299 | | | 14,129 | | 15,009 | | | 14,362 | | | 14,202 | |
| | | | | | | | | | | | | | | |
Line Losses and Company Usage | | 1,010 | | | 941 | | 1,059 | | | 1,021 | | | 1,201 | |
| | | | | | | | | | | | | | | |
Total Uses of Energy | | 14,309 | | | 15,070 | | 16,068 | | | 15,383 | | | 15,403 | |
| | | | | | | | | | | | | | | |
AVERAGE ELECTRIC REVENUE (cents/KWh) | | | | | | | | | | | | | | |
Residential | | 8.71 | | | 10.38 | | 9.14 | | | 10.55 | | | 9.44 | |
Commercial | | 8.31 | | | 9.95 | | 8.78 | | | 10.20 | | | 9.08 | |
Industrial | | 6.73 | | | 7.78 | | 6.68 | | | 8.04 | | | 7.05 | |
Governmental | | 9.32 | | | 10.79 | | 9.60 | | | 10.90 | | | 9.88 | |
| | | | | | | | | | | | | | | |
NUMBER OF RETAIL ELECTRIC CUSTOMERS | | | | | | | | | | | | | | |
(as of December 31) | | | | | | | | | | | | | | |
Residential | | 365,804 | | | 362,649 | | 361,725 | | | 357,564 | | | 359,538 | |
Commercial | | 62,613 | | | 62,556 | | 63,642 | | | 62,594 | | | 60,826 | |
Industrial | | 2,749 | | | 2,827 | | 3,109 | | | 3,014 | | | 2,739 | |
Governmental | | 4,259 | | | 4,208 | | 4,096 | | | 4,066 | | | 3,856 | |
| | | | | | | | | | | | | | | |
Total Retail Customers | | 435,425 | | | 432,240 | | 432,572 | | | 427,238 | | | 426,959 | |
| | | | | | | | | | | | | | | |
Totals may not foot due to rounding.
45
UTILITY STATISTICAL INFORMATION
ENTERGY MISSISSIPPI, INC.
GENERATION PORTFOLIO
| | | | | | | | | | | | | | | | | | | | | |
| | | | | | | | | | | | | | | TOTAL PLANT – 2009 | |
| PLANT | | UNIT | | OWNERSHIP | | COMMERCIAL
OPERATION | | OWNED &
LEASED
CAPABILITY
(MW)(a) | | FUEL TYPE | | PURPOSE | | NET
GENERATION
(MWH) | | | EXPENSES
PER NET
MWH | | | TOTAL
PRODUCTION
EXPENSE
($000) | |
Attala | | 1 | | 100% | | 2001 | | 455 | | Gas | | Intermediate | | 1,621,018 | | | 40.3 | | | 65,273 | |
| | | | | | | | | | | | | | | | | | | | | | |
Baxter Wilson | | 1 | | 100% | | 1967 | | 500 | | Gas/Oil | | Intermediate | | 1,635,212 | | | 58.6 | | | 95,879 | |
| | 2 | | 100% | | 1971 | | 676 | | Gas/Oil | | Intermediate | | | | | | | | | |
| | | | | | | | | | | | | | | | | | | | | | |
Delta | | 1 | | 100% | | 1953 | | 90 | | Gas/Oil | | Peaking | | (1,304 | ) | | 774.5 | | | (1,010 | ) |
| | 2 | | 100% | | 1953 | | 87 | | Gas/Oil | | Peaking | | | | | | | | | |
| | | | | | | | | | | | | | | | | | | | | | |
Gerald Andrus | | 1 | | 100% | | 1975 | | 712 | | Gas/Oil | | Intermediate | | 255,212 | | | 99.2 | | | 25,310 | |
| | | | | | | | | | | | | | | | | | | | | | |
Natchez | | 1 | | 100% | | 1951 | | - | | Gas/Oil | | Reserve | | (1 | ) | | (160,000.0 | ) | | 160 | |
| | | | | | | | | | | | | | | | | | | | | | |
Rex Brown | | 1 | | 100% | | 1948 | | - | | Gas | | Reserve | | 72,446 | | | 170.6 | | | 12,361 | |
| | 3 | | 100% | | 1951 | | 70 | | Gas/Oil | | Peaking | | | | | | | | | |
| | 4 | | 100% | | 1959 | | 203 | | Gas/Oil | | Intermediate | | | | | | | | | |
| | 5 | | 100% | | 1968 | | 10 | | Oil | | Peaking | | | | | | | | | |
| | | | | | | | | | | | | | | | | | | | | | |
Independence | | 1 | | 25% | | 1983 | | 209 | | Coal | | Base | | 2,847,033 | | | 21.5 | | | 61,076 | |
| | 2 | | 25% | | 1984 | | 211 | | Coal | | Base | | | | | | | | | |
| | | | | | | | | | | | | | | | | | | | | | |
Total | | | | | | | | 3,223 | | | | | | 6,429,616 | | | 40.3 | | | 259,049 | |
| | | | | | | | | | | | | | | | | | | | | | |
| (a) | Owned and Leased Capability is the dependable load carrying capability as demonstrated under actual operating conditions based on the primary fuel (assuming no curtailments) that each station was designed to utilize. |
46
UTILITY STATISTICAL INFORMATION
ENTERGY NEW ORLEANS, INC.
| | | | | | | | | | | | |
| | | 2009 | | | 2008 | | 2007 | | 2006 | | | 2005 |
ELECTRIC OPERATING REVENUES ($ thousands) | | | | | | | | | | | | |
Residential | | 167,794 | | | 171,584 | | 142,497 | | 105,924 | | | 150,409 |
Commercial | | 166,454 | | | 193,552 | | 181,438 | | 165,066 | | | 145,321 |
Industrial | | 37,225 | | | 48,378 | | 46,697 | | 44,582 | | | 31,597 |
Governmental | | 69,306 | | | 79,973 | | 72,467 | | 59,399 | | | 59,450 |
| | | | | | | | | | | | | |
Total Retail | | 440,779 | | | 493,487 | | 443,099 | | 374,971 | | | 386,777 |
| | | | | | | | | | | | | |
Sales for Resale | | 88,010 | | | 162,769 | | 103,843 | | 91,283 | | | 138,528 |
Other | | 7,196 | | | 16,684 | | 10,516 | | 4,812 | | | 10,711 |
| | | | | | | | | | | | | |
Total Electric Operating Revenues | | 535,985 | | | 672,940 | | 557,458 | | 471,066 | | | 536,016 |
| | | | | | | | | | | | | |
FUEL REVENUES (included in above revenues) | | | | | | | | | | | | |
Residential | | 62,017 | | | 92,401 | | 71,496 | | 51,865 | | | 59,361 |
Commercial | | 72,121 | | | 117,282 | | 101,932 | | 92,894 | | | 64,164 |
Industrial | | 19,103 | | | 32,171 | | 28,745 | | 28,952 | | | 17,044 |
Governmental | | 31,866 | | | 50,803 | | 42,750 | | 34,839 | | | 28,496 |
| | | | | | | | | | | | | |
Total Retail Fuel Revenues | | 185,107 | | | 292,657 | | 244,923 | | 208,550 | | | 169,065 |
| | | | | | | | | | | | | |
SOURCES OF ENERGY (GWh) | | | | | | | | | | | | |
Net Generation: | | | | | | | | | | | | |
Gas & Oil | | 2,202 | | | 2,068 | | 1,855 | | 773 | | | 1,661 |
Coal | | - | | | - | | - | | - | | | - |
Nuclear | | - | | | - | | - | | - | | | - |
Hydro | | - | | | - | | - | | - | | | - |
| | | | | | | | | | | | | |
Total Net Generation | | 2,202 | | | 2,068 | | 1,855 | | 773 | | | 1,661 |
| | | | | | | | | | | | | |
Purchased Power: | | | | | | | | | | | | |
Affiliated Companies | | 3,760 | | | 3,391 | | 3,428 | | 4,445 | | | 4,024 |
Non-affiliated Companies | | 590 | | | 687 | | 340 | | 41 | | | 1,232 |
| | | | | | | | | | | | | |
Total Purchased Power | | 4,350 | | | 4,078 | | 3,768 | | 4,486 | | | 5,256 |
| | | | | | | | | | | | | |
Total Sources of Energy | | 6,552 | | | 6,146 | | 5,623 | | 5,259 | | | 6,917 |
| | | | | | | | | | | | | |
USES OF ENERGY (GWh) | | | | | | | | | | | | |
Electric Energy Sales: | | | | | | | | | | | | |
Residential | | 1,577 | | | 1,394 | | 1,221 | | 914 | | | 1,616 |
Commercial | | 1,813 | | | 1,774 | | 1,763 | | 1,666 | | | 1,798 |
Industrial | | 526 | | | 541 | | 568 | | 547 | | | 498 |
Governmental | | 805 | | | 774 | | 747 | | 632 | | | 800 |
| | | | | | | | | | | | | |
Total Retail | | 4,721 | | | 4,483 | | 4,299 | | 3,759 | | | 4,712 |
| | | | | | | | | | | | | |
Sales for Resale | | 1,543 | | | 1,361 | | 1,010 | | 1,298 | | | 2,041 |
| | | | | | | | | | | | | |
Unbilled Energy | | 29 | | | 20 | | 15 | | (1 | ) | | 135 |
| | | | | | | | | | | | | |
Total Electric Energy Sales | | 6,293 | | | 5,864 | | 5,324 | | 5,056 | | | 6,888 |
| | | | | | | | | | | | | |
Line Losses and Company Usage | | 259 | | | 282 | | 299 | | 203 | | | 29 |
| | | | | | | | | | | | | |
Total Uses of Energy | | 6,552 | | | 6,146 | | 5,623 | | 5,259 | | | 6,917 |
| | | | | | | | | | | | | |
AVERAGE ELECTRIC REVENUE (cents/KWh) | | | | | | | | | | | | |
Residential | | 10.64 | | | 12.31 | | 11.67 | | 11.59 | | | 9.31 |
Commercial | | 9.18 | | | 10.91 | | 10.29 | | 9.91 | | | 8.08 |
Industrial | | 7.08 | | | 8.94 | | 8.22 | | 8.15 | | | 6.34 |
Governmental | | 8.61 | | | 10.33 | | 9.70 | | 9.40 | | | 7.43 |
| | | | | | | | | | | | | |
NUMBER OF RETAIL ELECTRIC CUSTOMERS | | | | | | | | | | | | |
(as of December 31) | | | | | | | | | | | | |
Residential | | 132,602 | | | 124,432 | | 115,523 | | 83,300 | | | 152,429 |
Commercial | | 13,064 | | | 12,622 | | 12,211 | | 10,000 | | | 14,220 |
Industrial | | 2,311 | | | 2,514 | | 2,765 | | 1,000 | | | 1,161 |
Governmental | | 1,747 | | | 1,381 | | 1,308 | | 700 | | | 858 |
| | | | | | | | | | | | | |
Total Retail Customers | | 149,724 | | | 140,949 | | 131,807 | | 95,000 | | | 168,668 |
| | | | | | | | | | | | | |
Totals may not foot due to rounding.
47
UTILITY STATISTICAL INFORMATION
ENTERGY NEW ORLEANS, INC.
GENERATION PORTFOLIO
| | | | | | | | | | | | | | | | | | | |
| | | | | | | | | | | | | | | TOTAL PLANT – 2009 | |
| PLANT | | UNIT | | OWNERSHIP | | COMMERCIAL
OPERATION | | OWNED &
LEASED
CAPABILITY
(MW)(a) | | FUEL TYPE | | PURPOSE | | NET
GENERATION
(MWH) | | EXPENSES
PER NET
MWH | | TOTAL
PRODUCTION
EXPENSE
($000) | |
A. B. Paterson | | 3 | | 100% | | 1950 | | - | | Gas/Oil | | Reserve | | - | | - | | 400 | |
| | 4 | | 100% | | 1954 | | - | | Gas/Oil | | Reserve | | | | | | | |
| | | | | | | | | | | | | | | | | | | | |
Michoud | | 1 | | 100% | | 1957 | | - | | Gas/Oil | | Reserve | | 2,202,251 | | 54.7 | | 120,429 | |
| | 2 | | 100% | | 1963 | | 230 | | Gas/Oil | | Intermediate | | | | | | | |
| | 3 | | 100% | | 1967 | | 515 | | Gas/Oil | | Intermediate | | | | | | | |
| | | | | | | | | | | | | | | | | | | | |
A. B. Paterson | | 5 | | 100% | | 1967 | | - | | Oil | | Reserve | | - | | - | | 114 | |
| | | | | | | | | | | | | | | | | | | | |
Total | | | | | | | | 745 | | | | | | 2,202,251 | | 54.9 | | 120,943 | |
| | | | | | | | | | | | | | | | | | | | |
| (a) | Owned and Leased Capability is the dependable load carrying capability as demonstrated under actual operating conditions based on the primary fuel (assuming no curtailments) that each station was designed to utilize. |
SYSTEM ENERGY RESOURCES, INC.
| | | | | | | | | | | | | | | |
| | | 2009 | | | 2008 | | | 2007 | | | 2006 | | | 2005 | |
ELECTRIC OPERATING REVENUES ($ thousands) | | 554,007 | | | 528,998 | | | 553,193 | | | 555,459 | | | 533,929 | |
| | | | | | | | | | | | | | | | |
SOURCES OF ENERGY (GWh) | | | | | | | | | | | | | | | |
Net Generation: | | | | | | | | | | | | | | | |
Gas & Oil | | - | | | - | | | - | | | - | | | - | |
Coal | | - | | | - | | | - | | | - | | | - | |
Nuclear | | 9,898 | | | 8,455 | | | 8,421 | | | 9,723 | | | 9,058 | |
Hydro | | - | | | - | | | - | | | - | | | - | |
| | | | | | | | | | | | | | | | |
Total Net Generation | | 9,898 | | | 8,455 | | | 8,421 | | | 9,723 | | | 9,058 | |
| | | | | | | | | | | | | | | | |
Purchased Power | | - | | | - | | | - | | | - | | | - | |
| | | | | | | | | | | | | | | | |
Total Sources of Energy | | 9,898 | | | 8,455 | | | 8,421 | | | 9,723 | | | 9,058 | |
| | | | | | | | | | | | | | | | |
USES OF ENERGY (GWh) | | | | | | | | | | | | | | | |
Electric Energy Sales | | 9,898 | | | 8,475 | | | 8,440 | | | 9,727 | | | 9,070 | |
| | | | | | | | | | | | | | | | |
Unbilled Energy | | - | | | - | | | - | | | - | | | - | |
| | | | | | | | | | | | | | | | |
Line Losses and Company Usage | | - | | | (20 | ) | | (19 | ) | | (4 | ) | | (12 | ) |
| | | | | | | | | | | | | | | | |
Total Uses of Energy | | 9,898 | | | 8,455 | | | 8,421 | | | 9,723 | | | 9,058 | |
| | | | | | | | | | | | | | | | |
Totals may not foot due to rounding.
SYSTEM ENERGY RESOURCES, INC.
GENERATION PORTFOLIO
| | | | | | | | | | | | | | | | | | | |
| | | | | | | | | | | | | | | TOTAL PLANT – 2009 | |
| PLANT | | UNIT | | OWNERSHIP | | COMMERCIAL
OPERATION | | OWNED &
LEASED
CAPABILITY
(MW)(a) | | FUEL TYPE | | PURPOSE | | NET
GENERATION
(MWH) | | EXPENSES
PER NET
MWH | | TOTAL
PRODUCTION
EXPENSE
($000) | |
Grand Gulf | | 1 | | 90% | | 1985 | | 1,133 | | Nuclear
BWR(b) | | Base | | 9,898,398 | | 17.7 | | 176,441 | |
| | | | | | | | | | | | | | | | | | | | |
Total | | | | | | | | 1,133 | | | | | | 9,898,398 | | 17.7 | | 176,441 | |
| | | | | | | | | | | | | | | | | | | | |
| (a) | Owned and Leased Capability is the dependable load carrying capability as demonstrated under actual operating conditions based on the primary fuel (assuming no curtailments) that each station was designed to utilize. |
| (b) | BWR = Boiling Water Reactor. |
48
UTILITY STATISTICAL INFORMATION
UTILITY NUCLEAR PLANT STATISTICS
The following table shows plant performance for 2005 – 2009 based on 18/24 month operating cycle.
| | | | | | | | | | | |
| CAPABILITY FACTOR (%) | | 2009 | | | 2008 | | 2007 | | 2006 | | 2005 |
ANO | | 90.9 | | | 92.6 | | 92.8 | | 88.3 | | 88.5 |
Grand Gulf | | 92.1 | | | 85.4 | | 89.5 | | 91.9 | | 93.3 |
River Bend | | 94.2 | | | 81.8 | | 88.1 | | 90.9 | | 85.8 |
Waterford 3 | | 91.4 | | | 90.6 | | 91.5 | | 93.5 | | 89.0 |
| | | | | | | | | | | | |
Entergy Southeast Average | | 91.9 | | | 88.6 | | 90.9 | | 90.6 | | 89.2 |
| | | | | | | | | | | | |
Industry Average | | 90.2 | | | 90.7 | | 91.1 | | 90.5 | | 90.1 |
| | | | | | | | | | | | |
The following table shows plant performance for 2009 and averages for four three-year periods. |
| PRODUCTION COST ($/MWh)(a) | | 2009 | | | 2006–2008 | | 2005–2007 | | 2004–2006 | | 2003–2005 |
ANO | | 18.5 | | | 16.3 | | 16.0 | | 15.5 | | 15.1 |
Grand Gulf | | 17.7 | | | 16.6 | | 15.3 | | 14.2 | | 13.7 |
River Bend | | 21.4 | | | 22.4 | | 20.1 | | 18.8 | | 17.9 |
Waterford 3 | | 19.7 | | | 16.9 | | 16.7 | | 15.9 | | 16.0 |
| | | | | | | | | | | | |
Entergy Southeast Average | | 19.1 | | | 17.5 | | 16.7 | | 15.9 | | 15.5 |
| | | | | | | | | | | | |
Industry Average | | 20.3 | | | 18.5 | | 17.6 | | 16.9 | | 16.5 |
| | | | | | | | | | | | |
| (a) | Fuel and non-fuel operation and maintenance expenses according to accounting standards that directly relate to the production of electricity per MWh. |
INDIVIDUAL PLANT INFORMATION
| | | | | | | | | | | | | | |
| | | ANO | | GRAND GULF | | | RIVER BEND | | | WATERFORD 3 | |
| | | UNIT 1 | | | UNIT 2 | | | | | | | | | |
Owner | | Entergy
Arkansas |
| | Entergy
Arkansas | | System Energy-90%
South Mississippi
Electric Power
Association-10% |
| | Entergy
Gulf States
Louisiana |
| | Entergy
Louisiana |
|
| | | | | | | | | | | | | | | |
Commercial Operation Date | | December 74 | | | March 80 | | July 85 | | | June 86 | | | September 85 | |
License Expiration Date | | 5/20/34 | | | 7/17/38 | | 11/1/24 | | | 8/29/25 | | | 12/18/24 | |
| | | | | | | | | | | | | | | |
Architect/Engineer | | Bechtel Power | | | Bechtel Power | | Bechtel Power | | | Stone & Webster | | | Ebasco | |
| | | | | | | | | | | | | | | |
Reactor Manufacturer | | Babcox &
Wilcox |
| | Combustion
Engineering | | General
Electric |
| | General
Electric |
| | Combustion
Engineering |
|
Reactor Type | | PWR | | | PWR | | BWR | | | BWR | | | PWR | |
Turbine Generator Manufacturer | | Westinghouse | | | General Electric | | Kraftwerk Union | | | General Electric | | | Westinghouse | |
| | | | | | | | | | | | | | | |
Owned and Leased Capability (MW)(a) | | 842 | | | 997 | | 1,133 | | | 978 | (c) | | 1,176 | |
| | | | | | | | | | | | | | | |
Refueling Data: | | | | | | | | | | | | | | |
Last Date | | 10/26/08-
12/12/08 |
| | 9/1/09-
9/25/09 | | 9/21/08-
10/23/08 |
| | 9/20/09-
10/18/09 |
| | 10/19/09-
12/4/09 |
|
Number of Days | | 47 | | | 24 | | 31 | | | 28 | | | 46 | |
Next Scheduled Refueling | | Spring 10 | | | Spring 11 | | Spring 10 | | | Spring 11 | | | Spring 11 | |
2009 Capability Factor (%) | | 89.0 | | | 92.8 | | 92.1 | | | 94.2 | | | 91.4 | |
| | | | | | | | | | | | | | | |
($ millions as of December 31, 2009) | | | | | | | | | | | | | | |
Net Book Value | | 1,149 | (b) | | | | 1,369 | | | 1,498 | (c) | | 1,355 | |
Decommissioning Trust Fund Balance | | 440 | (b) | | | | 327 | | | 350 | (c) | | 209 | |
Decommissioning Liability | | 560 | (b) | | | | 421 | | | 313 | (c) | | 287 | |
| | | | | | | | | | | | | | | |
| (a) | Owned and Leased Capability is the dependable load carrying capability as demonstrated under actual operating conditions based on the primary fuel (assuming no curtailments) that each station was designed to utilize. |
| (b) | ANO Units 1 and 2 are reported together. |
| (c) | 30% of River Bend is not subject to rate regulation by the Public Utility Commission of Texas, the Louisiana Public Service Commission, nor various municipal authorities, and is included in non-utility property on the balance sheet. The decommissioning trust fund balance and decommissioning liability include amounts for the 30% not subject to rate regulation. |
49
UTILITY REGULATORY INFORMATION
STATE REGULATORY COMMISSIONS
| | | | | | | | | | |
| | | ARKANSAS | | LOUISIANA | | MISSISSIPPI | | NEW ORLEANS | | TEXAS |
Commission | | Arkansas Public Service Commission | | Louisiana Public Service Commission | | Mississippi Public Service Commission | | New Orleans City Council | | Public Utility Commission of Texas |
| | | | | | | | | | | |
Number of Commissioners | | 3 | | 5 | | 3 | | 7 | | 3 |
| | | | | | | | | | | |
Method of Selection | | Appointed by Governor | | Elected | | Elected | | Elected | | Appointed by Governor |
| | | | | | | | | | | |
Term of Office | | 6 years – staggered | | 6 years – staggered | | 4 years – concurrent | | 4 years – concurrent (2 term limit) | | 6 years – staggered |
| | | | | | | | | | | |
Chair / President | | Appointed by Governor | | Selected by peers – 1 year term | | Rotates every 1 - 2 years, as determined by members | | Selected by peers from two at-large seats | | Appointed by Governor |
| | | | | | | | | | | |
COMMISSION/COUNCIL MEMBERS
| | | | | | |
| | | PARTY | | SERVICE BEGAN | | CURRENT
TERM ENDS |
ARKANSAS | | | | | | |
Paul Suskie – Chair | | Democrat | | 1/07 | | 1/13 |
Colette Honorable | | Democrat | | 10/07 | | 1/11 |
Olan W. Reeves | | unknown | | 1/09 | | 1/15 |
| | | | | | | |
LOUISIANA | | | | | | |
Lambert Boissiere III - Chairman | | Democrat | | 1/05 | | 12/10 |
Eric Skrmetta | | Republican | | 1/09 | | 12/14 |
Clyde C. Holloway | | Republican | | 4/09 | | 12/10 |
James M. Field | | Republican | | 12/96 | | 12/12 |
Foster L. Campbell, Jr. | | Democrat | | 1/03 | | 12/14 |
| | | | | | | |
MISSISSIPPI | | | | | | |
Leonard Bentz | | Republican | | 4/06 | | 12/11 |
Lynn Posey | | Democrat | | 1/08 | | 12/11 |
Brandon Presley | | Democrat | | 1/08 | | 12/11 |
| | | | | | | |
NEW ORLEANS | | | | | | |
Arnie Fielkow – President (Re-elected for term beginning 5/10) | | Democrat | | 5/06 | | 5/14 |
Jacquelyn Brechtel Clarkson (Re-elected for term beginning 5/10) | | Democrat | | 11/07 | | 5/14 |
Shelley Midura | | Democrat | | 5/06 | | 5/10 |
Susan Guidry (Term begins 5/10) | | Democrat | | 5/10 | | 5/14 |
Stacy S. Head (Re-elected for term beginning 5/10) | | Democrat | | 5/06 | | 5/14 |
James Carter | | Democrat | | 5/06 | | 5/10 |
Kristen Palmer (Term begins 5/10) | | Democrat | | 5/10 | | 5/14 |
Cynthia Hedge-Morrell (Re-elected for term beginning 5/10) | | Democrat | | 4/05 | | 5/14 |
Cynthia Willard-Lewis | | Democrat | | 5/02 | | 5/10 |
Jon Johnson (Term begins 5/10) | | Democrat | | 5/10 | | 5/14 |
| | | | | | | |
TEXAS | | | | | | |
Barry Smitherman – Chair | | Republican | | 4/04 | | 8/13 |
Donna L. Nelson | | Republican | | 8/08 | | 8/15 |
Kenneth W. Anderson Jr. | | Republican | | 9/08 | | 8/11 |
| | | | | | | |
50
SELECT UTILITY REGULATORY MECHANISMS
| | | | | | | | |
| COMPANY | | LAST FILED
RATE BASE
($ billions) | | ALLOWED ROE (%) | | JURISDICTIONAL REGULATORY MECHANISMS |
EAI | | 4.0
6/30/09 with
known and
measurable
changes
through 6/30/10 | | 10.2 | | Rate Case | | •No fixed schedule for rate filings. EAI filed its last rate case on September 4, 2009. •On May 28, 2010, the APSC approved a settlement in the EAI rate case. Key elements of the settlement include: an approximate $63.7 million base rate increase (after removing $10.1 million for securitization of ice storm) and a 10.2% allowed return on equity (up from 9.9%). New base rates will become effective with the first billing cycle of July 2010. |
| | | | | | | | | |
EGSL | | 2.3 Electric
12/31/2009 0.05 Gas 9/30/2009 | | 9.9 – 11.4 Electric 10.65 midpoint +/- 75 bps 60/40 customer/ company sharing | | FRP | | •Annual filing in May; any change in rates typically effective in September. •In October 2009, the LPSC approved an uncontested settlement extending the FRP regulatory process for an additional three years. The new FRP was adopted for the 2008-2010 test years and retains the 10.65% electric ROE midpoint with a +/- 75 bp bandwidth and a recovery mechanism for Commission-approved capacity additions. Earnings outside the bandwidth are allocated prospectively, 60% to customers and 40% to the company. As part of the settlement, the LPSC implemented a one-time rate reset to achieve its midpoint electric ROE for the 2008 test year filing. All parties committed to work together to attempt to develop a transmission rider. |
| | | | 10.0 – 11.0 Gas 10.5 midpoint +/- 50 bps | | RSP | | •In July 2005, the LPSC approved the EGSL gas Rate Stabilization Plan (RSP) which specified a 10.5% gas ROE midpoint with a +/- 50 bp bandwidth. Outside the bandwidth, rate changes are determined as follows: +/- 200 bps, rates changed by 50% of difference necessary to bring earned return to end point of band; if more than +/- 200 bps, rates changed 100% to eliminate differential in excess of 200 bps and then same as if within +/- 200 bps. |
| | | | | | | | | |
ELL | | 3.0
12/31/2009 | | 9.45 – 11.05 10.25 midpoint +/- 80 bps 60/40 customer/ company sharing | | FRP | | •Annual filing in May; any change in rates typically effective in September. •In October 2009, the LPSC approved an uncontested settlement extending the FRP regulatory process for an additional three years. The new FRP was adopted for the 2008-2010 test years and retains the 10.25% ROE midpoint with a +/- 80 bp bandwidth and a recovery mechanism for Commission-approved capacity additions. Earnings outside of the bandwidth are allocated prospectively, 60% to customers and 40% to the company. As part of the settlement, the LPSC implemented a one-time rate reset to achieve its midpoint ROE for the 2008 test year filing. All parties committed to work together to attempt to develop a transmission rider. |
| | | | | | | | | |
EMI | | 1.5
12/31/2009 | | 10.79 – 13.05 11.92 midpoint (subject to review / approval) Formulaic ROE reset Up to 200 bps on ROE (depends on capital ratios) for price, satisfaction and reliability | | FRP | | •Annual filing in March; any change in rates typically effective the first billing cycle of June. •On March 4, 2010, the MPSC approved modifications to EMI’s FRP that (1) aligns EMI’s FRP more closely with the FRPs of the other regulated gas and electric utilities in Mississippi, (2) resets the ROE and bandwidth based upon performance ratings, (3) rescores the performance adjustment factors, (4) eliminates the current $14.5 million revenue adjustment limit and changes the 2% of revenues limit to a 4% limit, with any adjustment over 2% requiring a hearing, and (5) directs EMI to phase-out the summer / winter rate differential in residential rates over two years. On March 15, 2010, EMI filed its first evaluation report under its new FRP for the 2009 test year. |
| | | | | | | | | |
ENOI | | 0.3 Electric
12/31/2009 0.08 Gas 12/31/2009 | | 10.7 – 11.5 Electric 11.1 midpoint +/- 40 bps 10.25 – 11.25 Gas 10.75 midpoint +/- 50 bps Earnings outside bandwidth reset to midpoint ROE | | FRP FRP | | •Annual filing in May; any change in rates typically effective in first billing cycle of October •On April 2, 2009, the City Council of New Orleans approved a comprehensive settlement. A new three-year formula rate plan was adopted, with terms including an 11.1% electric ROE midpoint with a +/- 40 bp bandwidth and a 10.75% gas ROE midpoint with a +/- 50 bp bandwidth. Earnings outside the bandwidth reset to the midpoint ROE. |
| | | | | | | | | |
ETI | | 1.6
6/30/09 adjusted test year | | 10.00 Stipulated as a reasonable ROE in rate case settlement | | Rate Case | | •On March 11, 2009, the Public Utility Commission of Texas approved the unanimous settlement in ETI’s September 2007 rate case which implemented rates effective January 28, 2009, for usage beginning December 19, 2008. •On December 30, 2009, ETI filed a rate case requesting an 11.5% ROE based upon a June 30, 2009 test year. On February 18, 2010, the Administrative Law Judge issued an order approving a unanimous settlement on interim rates and the procedural schedule reached with the parties in the rate case. The procedural schedule calls for hearings in July 2010, with a final order to be issued November 1, 2010 and permanent rates to be effective relating back to service rendered on / after September 13, 2010. |
| | | | | | | | | |
SERI | | 1.2
monthly filing | | 10.94 | | | | •Real-time recovery mechanism. |
| | | | | | | | | |
TOTAL | | 14.1 | | | | | | |
| | | | | | | | | |
51
UTILITY ELECTRIC AND GAS FUEL RECOVERY MECHANISMS
| | | | | | | | | | | | | |
| | | DEFERRED FUEL BALANCE AS OF DECEMBER 31, |
| COMPANY | | 2009 | | | 2008 | | 2007 | | 2006 | | 2005 | | FUEL RECOVERY MECHANISM |
| | | | | | | | ($ millions) | | | | | | |
EAI | | 122.8 | | | 119.1 | | 114.8 | | 2.2 | | 204.2 | | Annual reset in April based on prior calendar year fuel and purchased power costs adjusted for nuclear refueling outages and projected sales plus any under- or over-recovered fuel balance for the prior calendar year. |
| | | | | | | | | | | | | | |
EGSL | | 57.8 | | | 8.1 | | 105.8 | | 119.5 | | 121.2 | | Electric: Monthly reset based on fuel and purchased power costs from two months prior plus surcharge or credit for 1/12 of under- or over-recovered fuel balance. |
| | | | | | |
| | | | | | | | | | | | | Gas: Monthly reset based on estimated gas costs plus a surcharge with an annual reset calculated by taking the over- or under- recovered balance at the end of June and dividing by the projected sales for the next 12 months. |
| | | | | | | | | | | | | | |
ELL | | 66.4 | | | (23.6) | | 19.2 | | 114.3 | | 21.9 | | Monthly reset based on fuel and purchased power costs from two months prior plus surcharge or credit for 1/12 of under- or over-recovered fuel balance. |
| | | | | | | | | | | | | | |
EMI | | (72.9 | ) | | 5.0 | | (76.6) | | (95.2) | | 114.0 | | Quarterly reset based on projected fuel and purchased power costs and projected sales plus any under- or over-recovered fuel balance from the second prior quarter. |
| | | | | | | | | | | | | | |
ENOI | | 8.1 | | | 21.8 | | 17.3 | | 19.0 | | 30.6 | | Electric: On April 2, 2009 the New Orleans City Council approved a new Fuel Adjustment Clause tariff that calculates a monthly rate based on fuel and purchased power costs from two months prior. A surcharge or credit will be calculated on any under- or over-recovered fuel balance based on the most recent 12 months actual kWh sales. Under the new tariff Grand Gulf non-fuel costs are recovered through base rates. Any incremental monthly Grand Gulf non-fuel costs are included in the Fuel Adjustment Clause. Resource Plan non-fuel costs are collected through the Fuel Adjustment Clause. The new tariff became effective on June 1, 2009. |
| | | | | | |
| | | | | | | | | | | | | Gas: Monthly reset based on estimated gas costs plus a surcharge or credit for the under- or over-recovered fuel balance based on the most recent 12 months Mcf sales. |
| | | | | | | | | | | | | | |
ETI | | (102.7 | ) | | 21.2 | | (67.3) | | (45.6) | | 203.2 | | Semi-annual reset of fuel factor in March and September based on the market price of natural gas plus surcharge or refund for material under- or over-recoveries based on actual costs. |
| | | | | | | | | | | | | | |
Total | | 79.5 | | | 151.6 | | 113.2 | | 114.2 | | 695.1 | | |
| | | | | | | | | | | | | | |
Totals may not foot due to rounding.
52
COMPETITIVE BUSINESSES
TOTAL CAPACITY
| | | | | | | | | | | | | |
| | | OPERATED | | | | | OWNED CAPACITY(c) |
| As of December 31, 2009. | | PLANTS | | UNITS | | MW | | | | | MW | | % |
Gas/Oil | | 2 | | 2 | | 1,094 | (b) | | | | 1,092 | | 17 |
Coal | | - | | - | | - | (b) | | | | 181 | | 3 |
| | | | | | | | | | | | | | |
Total Fossil | | 2 | | 2 | | 1,094 | | | | | 1,273 | | 20 |
| | | | | | | | | | | | | | |
Wind | | - | | - | | - | | | | | 80 | | 1 |
Nuclear | | 6 | | 7 | | 5,798 | (a) | | | | 4,998 | | 79 |
| | | | | | | | | | | | | | |
Total Capacity | | 8 | | 9 | | 6,892 | | | | | 6,351 | | 100 |
| | | | | | | | | | | | | | |
| (a) | Operated capacity includes management services contracts. |
| (b) | Excludes units operated by Entergy’s utility companies. |
| (c) | Includes capacity under power purchase agreements. |
ENTERGY NUCLEAR (NON-UTILITY)
ENTERGY NUCLEAR QUARTERLY FINANCIAL METRICS
| | | | | | | | | | | | | | | | | | | | | | | | | | | | | | | | |
| | | 2009 | | | 2008 | | | | |
| | | 1Q | | | 2Q | | | 3Q | | 4Q | | | YTD | | | 1Q | | | 2Q | | | 3Q | | | 4Q | | | YTD | | | % CHANGE | |
GAAP MEASURES | | | | | | | | | | | | | | | | | | | | | | | | | | | | | | | | |
As-Reported Net Income ($ millions) | | 180.9 | | | 80.2 | | | 200.4 | | 169.5 | | | 631.0 | | | 221.7 | | | 143.6 | | | 205.3 | | | 226.6 | | | 797.3 | | | (21 | ) |
Return on Average Invested Capital – As-Reported (%)* | | 18.7 | | | 17.3 | | | 15.8 | | 14.1 | | | 14.1 | | | 18.4 | | | 18.8 | | | 18.2 | | | 20.2 | | | 20.2 | | | (30 | ) |
Return on Average Common Equity – As-Reported (%)* | | 19.0 | | | 17.5 | | | 15.8 | | 14.0 | | | 14.0 | | | 19.7 | | | 20.0 | | | 18.9 | | | 20.9 | | | 20.9 | | | (33 | ) |
Debt to Capital Ratio (%) | | 4.6 | | | 4.5 | | | 4.1 | | 3.7 | | | 3.7 | | | 7.4 | | | 7.4 | | | 5.7 | | | 5.1 | | | 5.1 | | | (27 | ) |
NON-GAAP MEASURES | | | | | | | | | | | | | | | | | | | | | | | | | | | | | | | | |
Operational Earnings ($ millions) | | 187.5 | | | 95.3 | | | 210.7 | | 181.5 | | | 675.0 | | | 221.7 | | | 143.6 | | | 205.3 | | | 226.6 | | | 797.3 | | | (15 | ) |
Return on Average Invested Capital – Operational (%)* | | 18.8 | | | 17.8 | | | 16.5 | | 15.1 | | | 15.1 | | | 18.9 | | | 19.3 | | | 18.6 | | | 20.2 | | | 20.2 | | | (25 | ) |
Return on Average Common Equity – Operational (%)* | | 19.2 | | | 18.0 | | | 16.6 | | 15.0 | | | 15.0 | | | 20.3 | | | 20.5 | | | 19.4 | | | 20.9 | | | 20.9 | | | (28 | ) |
Net Debt to Net Capital Ratio (%) | | (5.8 | ) | | (7.1 | ) | | 1.1 | | (4.5 | ) | | (4.5 | ) | | (9.4 | ) | | (14.1 | ) | | (24.0 | ) | | (4.8 | ) | | (4.8 | ) | | (6 | ) |
| | | | | | | | | | | | | | | | | | | | | | | | | | | | | | | | | |
Totals may not foot due to rounding.
ENTERGY NUCLEAR ANNUAL FINANCIAL METRICS
| | | | | | | | | | | | | |
| | | 2009 | | | 2008 | | | 2007 | | | 2006 | | 2005 |
GAAP MEASURES | | | | | | | | | | | | | |
As-Reported Net Income ($ millions) | | 631.0 | | | 797.3 | | | 539.2 | | | 309.5 | | 282.6 |
Return on Average Invested Capital – As-Reported (%) | | 14.1 | | | 20.2 | | | 16.0 | | | 11.7 | | 11.6 |
Return on Average Common Equity – As-Reported (%) | | 14.0 | | | 20.9 | | | 17.4 | | | 14.0 | | 13.6 |
Debt to Capital Ratio (%) | | 3.7 | | | 5.1 | | | 9.7 | | | 14.2 | | 19.5 |
NON-GAAP MEASURES | | | | | | | | | | | | | |
Operational Earnings ($ millions) | | 675.0 | | | 797.3 | | | 557.6 | | | 309.5 | | 282.6 |
Return on Average Invested Capital – Operational (%) | | 15.1 | | | 20.2 | | | 16.6 | | | 11.7 | | 11.6 |
Return on Average Common Equity – Operational (%) | | 15.0 | | | 20.9 | | | 18.0 | | | 14.0 | | 13.6 |
Net Debt to Net Capital Ratio (%) | | (4.5 | ) | | (4.8 | ) | | (1.9 | ) | | 2.3 | | 12.4 |
| | | | | | | | | | | | | | |
ENTERGY NUCLEAR QUARTERLY OPERATIONAL METRICS
| | | | | | | | | | | | | | | | | | | | | | | | | | | | | | | | | |
| | | 2009 | | 2008 | | YTD | |
| | | 1Q | | 2Q | | 3Q | | 4Q | | YTD | | 1Q | | 2Q | | 3Q | | 4Q | | YTD | | % CHANGE | |
Net MW in Operation | | | 4,998 | | | 4,998 | | | 4,998 | | | 4,998 | | | 4,998 | | | 4,998 | | | 4,998 | | | 4,998 | | | 4,998 | | | 4,998 | | - | |
Average Realized Price/MWh | | $ | 63.84 | | $ | 59.22 | | $ | 61.70 | | $ | 59.43 | | $ | 61.07 | | $ | 61.47 | | $ | 58.22 | | $ | 61.59 | | $ | 56.69 | | $ | 59.51 | | 3 | |
Production Cost/MWh(a) | | $ | 23.14 | | $ | 24.30 | | $ | 22.57 | | $ | 23.20 | | $ | 23.26 | | $ | 19.98 | | $ | 23.11 | | $ | 21.77 | | $ | 22.77 | | $ | 21.88 | | 6 | |
Non-Fuel O&M Expense/Purchased Power per MWh(a) | | $ | 22.44 | | $ | 25.33 | | $ | 22.11 | | $ | 23.60 | | $ | 23.30 | | $ | 20.20 | | $ | 23.42 | | $ | 21.19 | | $ | 23.06 | | $ | 21.95 | | 6 | |
Billed GWh | | | 10,074 | | | 8,980 | | | 10,876 | | | 11,052 | | | 40,981 | | | 10,760 | | | 10,145 | | | 10,316 | | | 10,489 | | | 41,710 | | (2 | ) |
Capacity Factor | | | 92% | | | 81% | | | 100% | | | 99% | | | 93% | | | 97% | | | 92% | | | 95% | | | 94% | | | 95% | | (2 | ) |
| | | | | | | | | | | | | | | | | | | | | | | | | | | | | | | | | | |
ENTERGY NUCLEAR ANNUAL OPERATIONAL METRICS
| | | | | | | | | | | | | | | |
| | | 2009 | | 2008 | | 2007 | | 2006 | | 2005 |
Net MW in Operation | | | 4,998 | | | 4,998 | | | 4,998 | | | 4,200 | | | 4,105 |
Average Realized Price/MWh | | $ | 61.07 | | $ | 59.51 | | $ | 52.69 | | $ | 44.33 | | $ | 42.26 |
Production Cost/MWh(a)(b) | | $ | 23.26 | | $ | 21.88 | | $ | 21.19 | | $ | 19.50 | | $ | 18.94 |
Non-Fuel O&M Expense/Purchased Power per MWh(a)(b) | | $ | 23.30 | | $ | 21.95 | | $ | 22.86 | | $ | 21.37 | | $ | 20.56 |
Billed GWh | | | 40,981 | | | 41,710 | | | 37,570 | | | 34,847 | | | 33,641 |
Capacity Factor | | | 93% | | | 95% | | | 89% | | | 95% | | | 93% |
| | | | | | | | | | | | | | | | |
| (a) | 2009 excludes the effect of the non-utility nuclear spin-off dis-synergies special item at Entergy Nuclear. |
| (b) | 2007 excludes the effect of the non-utility nuclear alignment special item at Entergy Nuclear. |
Totals may not foot due to rounding.
53
ENTERGY NUCLEAR (NON-UTILITY)
ENTERGY NUCLEAR PLANT STATISTICS
| | | | | | | | | | | | | | | | |
| | | JAMES A. FITZPATRICK | | | INDIAN POINT | | | PALISADES NUCLEAR PLANT | | PILGRIM NUCLEAR STATION | | | VERMONT YANKEE |
| | | | UNIT 2 | | | UNIT 3 | | | | |
Entergy Purchase Date | | 11/21/00 | | | 9/6/01 | | | 11/21/00 | | | 4/11/07 | | 7/13/99 | | | 7/31/02 |
Commercial Operation Date | | July 75 | | | August 74 | | | August 76 | | | December 71 | | December 72 | | | November 72 |
License Expiration Date | | 10/17/34 | | | 9/28/13 | | | 12/15/15 | | | 3/24/31 | | 6/8/12 | | | 3/21/12 |
| | | | | | | | | | | | | | | | | |
Architect/Engineer | | Stone & | | | United | | | United | | | Combustion | | Bechtel | | | Ebasco |
| | Webster | | | Engineers & | | | Engineers & | | | Engineering | | Power | | | |
| | | | | Constructors | | | Constructors | | | | | | | | |
| | | | | | | | | | | | | | | | | |
Reactor Manufacturer | | General | | | Westinghouse | | | Westinghouse | | | Combustion | | General | | | General |
| | Electric | | | | | | | | | Engineering | | Electric | | | Electric |
Reactor Type | | BWR | | | PWR | | | PWR | | | PWR | | BWR | | | BWR |
Turbine Generator Manufacturer | | General
Electric |
| | Westinghouse | | | Westinghouse | | | Westinghouse | | General Electric | | | General Electric |
| | | | | | | | | | | | | | | | | |
Net MWs in Operation (MW) | | 838 | | | 1,028 | | | 1,041 | | | 798 | | 688 | | | 605 |
(as of December 31, 2009) | | | | | | | | | | | | | | | | |
| | | | | | | | | | | | | | | | | |
Refueling Data: | | | | | | | | | | | | | | | | |
Last Date | | 9/15/08 –
10/9/08 |
| | 3/25/08 –
4/20/08 |
| | 3/11/09 –
4/15/09 |
| | 3/22/09 –
5/02/09 | | 4/17/09 –
5/18/09 |
| | 10/19/08 –
11/10/08 |
Number of Days | | 26 | | | 26 | | | 36 | | | 41 | | 31 | | | 22 |
Next Scheduled Refueling | | Fall 10 | | | Spring 10 | | | Spring 11 | | | Fall 10 | | Spring 11 | | | Spring 10 |
2009 Capacity Factor | | 99% | | | 99% | | | 85% | | | 88% | | 90% | | | 100% |
| | | | | | | | | | | | | | | | | |
($ millions as of December 31, 2009) | | | | | | | | | | | | | | | | |
Net Book Value | | 417 | | | 952 | | | 626 | | | 737 | | 253 | | | 333 |
Decommissioning Trust Fund Balance | | (a | ) | | 602 | (b) | | (a | ) | | 245 | | 609 | | | 428 |
Decommissioning Liability | | (a | ) | | 430 | (b) | | (a | ) | | 266 | | 309 | | | 314 |
| | | | | | | | | | | | | | | | | |
Nearest Market Hub | | NYISO | | | NYISO | | | NYISO | | | MISO | | NEPOOL | | | NEPOOL |
| | Zone A(c) | | | Zone G(d) | | | Zone G(d) | | | Cinergy | | Mass Hub | | | Mass Hub |
Capacity Zone (ICAP/UCAP) | | NYISO | | | NYISO | | | NYISO | | | n/a | | NEPOOL | | | NEPOOL |
| | Rest of State | | | Rest of State | | | Rest of State | | | | | | | | |
| | | | | | | | | | | | | | | | | |
| (a) | NYPA retained the decommissioning trusts and decommissioning liability. NYPA and Entergy executed decommissioning agreements, specifying their decommissioning obligations. NYPA has the right to require Entergy to assume the decommissioning liability provided that it assigns the corresponding decommissioning trust, up to a specified level, to Entergy. If the decommissioning liability is retained by NYPA, Entergy will perform the decommissioning of the plants at a price equal to the lesser of a pre-specified level or the amount in the decommissioning trusts. Entergy believes that the amounts available to it under either scenario are sufficient to cover the future decommissioning costs without any additional contributions to the trusts. |
| (b) | Includes amount for Indian Point 1. Indian Point 1 has been shut down and in safe storage since the 1970s. |
| (c) | James A. FitzPatrick physically located in NYISO Zone C. |
| (d) | Indian Point physically located in NYISO Zone H. |
ENTERGY NUCLEAR PLANT UPRATES
(MW)
| | | | | | | | | | | | | | |
| | | CAPACITY
12/31/04(b) | | 2005 | | 2006 | | 2007 | | 2008 | | 2009 | | CAPACITY
12/31/2009 |
FitzPatrick | | 838 | | - | | - | | - | | - | | - | | 838 |
Indian Point 2 | | 1,028 | | - | | - | | - | | - | | - | | 1,028 |
Indian Point 3 | | 994 | | 47 | | - | | - | | - | | - | | 1,041 |
Palisades(a) | | 798 | | - | | - | | - | | - | | - | | 798 |
Pilgrim | | 688 | | - | | - | | - | | - | | - | | 688 |
Vermont Yankee | | 510 | | - | | 95 | | - | | - | | - | | 605 |
| | | | | | | | | | | | | | | |
Total | | 4,856 | | 47 | | 95 | | - | | - | | - | | 4,998 |
| | | | | | | | | | | | | | | |
| (b) | 2004 included 57 MW of uprates - FitzPatrick 13 MW and Indian Point 2 44 MW. |
54
ENTERGY NUCLEAR (NON-UTILITY)
ENTERGY NUCLEAR SECURITIES DETAIL
LONG-TERM DEBT:
NOTE TO NEW YORK POWER AUTHORITY (NYPA) RELATING TO THE PURCHASE OF FITZPATRICK AND INDIAN POINT 3
| | | | | | | | | | | | |
| ($ thousands) | | LONG-TERM DEBT(a) | | INTEREST
EXPENSE | | ADDITIONAL LTD
RELATED TO
PURCHASE OF IP2 | | INTEREST
EXPENSE | | TOTAL ENDING
LONG-TERM
DEBT | | TOTAL
INTEREST
EXPENSE |
2000 | | 744,405 | | 3,869 | | - | | - | | 744,405 | | 3,869 |
2001 | | 682,512 | | 35,392 | | 74,402 | | 1,190 | | 756,914 | | 36,582 |
2002 | | 604,420 | | 32,540 | | 79,220 | | 3,628 | | 683,640 | | 36,168 |
2003 | | 441,845 | | 27,387 | | 72,863 | | 3,643 | | 514,708 | | 31,030 |
2004 | | 379,405 | | 21,275 | | 66,200 | | 3,337 | | 445,605 | | 24,612 |
2005 | | 313,968 | | 18,277 | | 59,218 | | 3,018 | | 373,186 | | 21,295 |
2006 | | 245,390 | | 15,137 | | 51,900 | | 2,682 | | 297,289 | | 17,819 |
2007 | | 173,445 | | 11,845 | | 44,231 | | 2,331 | | 217,676 | | 14,176 |
2008 | | 161,932 | | 8,412 | | 36,194 | | 1,963 | | 198,127 | | 10,375 |
2009 | | 149,771 | | 7,839 | | 27,772 | | 1,577 | | 177,543 | | 9,416 |
2010 | | 137,026 | | 7,255 | | 18,945 | | 1,173 | | 155,971 | | 8,428 |
2011 | | 123,669 | | 6,643 | | 9,694 | | 750 | | 133,363 | | 7,393 |
2012 | | 109,681 | | 6,012 | | - | | 305 | | 109,681 | | 6,317 |
2013 | | 95,011 | | 5,331 | | - | | - | | 95,011 | | 5,331 |
2014 | | 79,638 | | 4,627 | | - | | - | | 79,638 | | 4,627 |
2015 | | 61,027 | | 3,889 | | - | | - | | 61,027 | | 3,889 |
2016 – 2035 Average | | - | | 1,755 | | - | | - | | - | | 1,755 |
| | | | | | | | | | | | | |
| (a) | Includes plant, fuel, and license extension payments. Payments for plant and fuel are made annually on 11/21 (anniversary of close). As of 9/30/03, the entire fuel note has been paid off. Life extension payments made on anniversary of license expiration. |
Totals may not foot due to rounding.
NON-NUCLEAR WHOLESALE ASSETS
NON-NUCLEAR WHOLESALE ASSETS PLANT STATISTICS
| | | | | | | | | | | | | | | | |
| PLANT | | LOCATION | | NERC
REGION | | COMMERCIAL
OPERATION | | OWNERSHIP
INTEREST | | NET
MW | | TOTAL
MW | | FUEL TYPE
TECHNOLOGY | | PURPOSE |
Independence – Unit 2 | | Newark, AR | | SERC | | 1983 | | 14% | | 121 | | 842 | | Coal | | Base |
Nelson 6 (PPA) | | Westlake, LA | | SERC | | 1982 | | 11% | | 60 | | 550 | | Coal | | Base |
Harrison County | | Marshall, TX | | SPP | | 2003 | | 61% | | 335 | | 550 | | Combined Cycle | | Intermediate |
RS Cogen | | Lake Charles, LA | | SERC | | 2002 | | 50% | | 213 | | 425 | | CCGT Cogen | | Base QF |
Ritchie – Unit 2 | | Helena, AR | | SERC | | 1968 | | 100% | | 544 | | 544 | | Gas/Oil | | Peaking |
Top of Iowa | | Worth County, IA | | MAPP | | 2001 | | 50% | | 40 | | 80 | | Wind | | Renewable |
White Deer | | Amarillo, TX | | SPP | | 2001 | | 50% | | 40 | | 80 | | Wind | | Renewable |
| | | | | | | | | | | | | | | | | |
Total | | | | | | | | | | 1,353 | | 3,071 | | | | |
| | | | | | | | | | | | | | | | | |
NON-NUCLEAR WHOLESALE ASSETS SECURITIES DETAIL
DEBT:
| | | | | | | | | | | |
| OUTSTANDING AS OF DECEMBER 31, | | | | | | | | | | | |
| (ENTERGY’S SHARE) | | 2009 | | | 2008 | | 2007 | | MATURITY | | RATE |
| | | | | (in millions) | | | | | | |
RS Cogen Senior Project Debt | | | | | | | | | | | |
Bank Portion(a) | | $51 | | | $55 | | $60 | | 10/17/18 | | LIBOR + 1.625% |
Institutional Portion | | $38 | | | $38 | | $38 | | 10/15/22 | | Fixed 8.73% |
Debt Service Reserve Letter of Credit(b) | | $ 1 | | | $ - | | $ - | | 1 month to 6 months | | LIBOR + 1.625% |
RS Cogen Subordinated Debt | | $13 | | | $13 | | $14 | | 10/17/17 | | LIBOR + 4.50% |
Top Deer Senior Project Debt | | $13 | | | $19 | | $24 | | 06/30/13 | | Fixed 5.55% |
| | | | | | | | | | | | |
| (a) | RS Cogen spread on bank portion increases over time from 1.375% to 2.375%. |
| (b) | RS Cogen spread on Debt Service Reserve Letter of Credit Loan increases over time from 1.375% to 1.875%. The DSR LC fee was 1.375% in the first term and 1.625% in the second term, including 2009. The DSR LC is borrowed for interest periods of 1 month to 6 months as needed. The DSR LC was repaid on January 29, 2010. |
| | | | | | | | | | | | | | | |
| PREFERRED STOCK: | | | | SHARES OUTSTANDING
AS OF DECEMBER 31, | | AS OF DECEMBER 31, |
| | | RATE(a) | | 2009 | | 2008 | | 2007 | | 2009 | | 2008 | | | 2007 |
| | | | | | | | | | | | (in millions | ) | | |
Authorized 1,000,000 shares, $1 par value, cumulative | | | | | | | | | | | | | | | |
Without Sinking Fund: | | | | | | | | | | | | | | | |
Entergy Asset Management, | | 8.95% | | 305,240 | | 297,376 | | 297,376 | | $29.4 | | $29.7 | | | $29.7 |
8.95% rate(a) | | | | | | | | | | | | | | | |
Other | | - | | - | | - | | - | | 1.5 | | 0.8 | | | 1.0 |
| | | | | | | | | | | | | | | | |
Total without sinking fund | | | | 305,240 | | 297,376 | | 297,376 | | $30.9 | | $30.5 | | | $30.7 |
| | | | | | | | | | | | | | | | |
| (a) | Entergy Asset Management’s stockholders’ agreement provides that each December 31 either Entergy Asset Management or the preferred shareholders may request that the preferred dividend rate be reset. |
55
DEFINITIONS OF OPERATIONAL MEASURES AND GAAP AND NON-GAAP FINANCIAL MEASURES
| | |
| NUCLEAR OPERATIONAL MEASURES | | |
| Net MW in operation | | Installed capacity owned or operated by Entergy Nuclear |
| Average realized price per MWh | | As-reported revenue per MWh billed for all non-utility nuclear operations, excluding revenue from the amortization of the Palisades below-market PPA |
| Production cost per MWh | | Fuel and non-fuel operation and maintenance expenses according to accounting standards that directly relate to the production of electricity per MWh |
| Non-fuel O&M expense/purchased power per MWh | | Operation, maintenance and refueling expenses and purchased power per MWh billed, excluding fuel |
| GWh billed | | Total number of GWh billed to all customers |
| Capability factor | | The percentage of the maximum energy generation a plant is capable of supplying to the grid, limited only by factors within control of plant management; a high capability factor indicates effective plant programs and practices to minimize unplanned energy losses and to optimize planned outages |
| Capacity factor | | Normalized percentage of the period that the plant generates power |
| Refueling outage duration | | Number of days lost for scheduled refueling outage during the period |
|
| Financial measures defined in the below table include measures prepared in accordance with generally accepted accounting principles (GAAP), as well as non-GAAP measures. Non-GAAP measures are included in this report in order to provide metrics that remove the effect of less routine financial impacts from commonly used financial metrics. |
| |
| FINANCIAL MEASURES – GAAP | | |
| Return on average invested capital – as-reported | | 12-months rolling Net Income adjusted to include preferred dividends and tax-effected interest expense divided by average invested capital |
| Return on average common equity – as-reported | | 12-months rolling Net Income divided by average common equity |
| Net margin – as-reported | | 12-months rolling Net Income divided by 12-months rolling revenue |
| Cash flow interest coverage | | 12-months cash flow from operating activities plus 12-months rolling interest paid, divided by interest expense |
| Book value per share | | Common equity divided by end of period shares outstanding |
| Revolver capacity | | Amount of undrawn capacity remaining on corporate and subsidiary revolvers |
| Total debt | | Sum of short-term and long-term debt, notes payable, capital leases, and preferred stock with sinking fund on the balance sheet, less non-recourse debt, if any |
| Project debt | | Financing at subsidiaries to support specific projects |
| Debt of joint ventures (Entergy’s share) | | Debt issued by business joint ventures at non-nuclear wholesale assets |
| Leases (Entergy’s share) | | Operating leases held by subsidiaries capitalized at implicit interest rate |
| Debt to capital | | Gross debt divided by total capitalization |
| Securitization debt | | Debt associated with securitization bonds issued to recover storm costs from hurricanes Rita, Ike and Gustav at Entergy Texas |
| |
| FINANCIAL MEASURES – NON-GAAP | | |
| Operational earnings | | As-reported Net Income applicable to common stock adjusted to exclude the impact of special items |
| Return on average invested capital – operational | | 12-months rolling operational Net Income adjusted to include preferred dividends and tax-effected interest expense divided by average invested capital |
| Return on average common equity – operational | | 12-months rolling operational Net Income divided by average common equity |
| Net margin – operational | | 12-months rolling operational Net Income divided by 12-months rolling revenue |
| Total gross liquidity | | Sum of cash and revolver capacity |
| Debt to capital, excluding securitization debt | | Gross debt divided by total capitalization, excluding securitization debt |
| Net debt to net capital, excluding securitization debt | | Gross debt less cash and cash equivalents divided by total capitalization less cash and cash equivalents, excluding securitization debt |
| Net debt including off-balance sheet liabilities, excluding securitization debt | | Sum of gross debt and off-balance sheet debt less cash and cash equivalents divided by sum of total capitalization and off-balance sheet debt less cash and cash equivalents; both gross debt and total capitalization are also adjusted to exclude securitization debt |
56
REG G RECONCILIATIONS
PRO FORMA FINANCIAL RESULTS (Reflects Reconsolidation of Entergy New Orleans) (unaudited)
| | | | | | | | | | | | | | | | | | | | | | | | | | |
| RECONCILIATION OF GAAP TO NON-GAAP | | | | | | | | | | | | | | | | | | |
| 2005 PRO FORMA INCOME STATEMENT | | UTILITY/PARENT/OTHER | | | | | CONSOLIDATED | |
| | | | | | | |
In thousands, for the year ended December 31,
2005. | | GAAP | | | ENOI
ADJUSTMENT* | | | PRO FORMA | | | | | GAAP | | | ENOI
ADJUSTMENT* | | | PRO FORMA | |
OPERATING REVENUES: | | | | | | | | | | | | | | | | | | | | | | | | | | |
Electric | | $ | 8,449,281 | | | $ | 211,307 | | | $ | 8,660,588 | | | | | $ | 8,446,830 | | | $ | 211,307 | | | $ | 8,658,136 | |
Natural gas | | | 77,660 | | | | 137,310 | | | | 214,970 | | | | | | 77,660 | | | | 137,310 | | | | 214,970 | |
Competitive businesses | | | 46,003 | | | | - | | | | 46,003 | | | | | | 1,581,757 | | | | - | | | | 1,581,757 | |
| | | | | | | | | | | | | | | | | | | | | | | | | | | |
Total | | | 8,572,944 | | | | 348,617 | | | | 8,921,561 | | | | | | 10,106,247 | | | | 348,617 | | | | 10,454,863 | |
| | | | | | | | | | | | | | | | | | | | | | | | | | | |
| | | | | | | |
OPERATING EXPENSES: | | | | | | | | | | | | | | | | | | | | | | | | | | |
Operating and Maintenance: | | | | | | | | | | | | | | | | | | | | | | | | | | |
Fuel, fuel-related expenses, and gas purchased for resale | | | 1,941,887 | | | | 217,365 | | | | 2,159,252 | | | | | | 2,176,015 | | | | 217,365 | | | | 2,393,380 | |
Purchased power | | | 2,559,536 | | | | (46,740 | ) | | | 2,512,796 | | | | | | 2,521,247 | | | | (46,740 | ) | | | 2,474,506 | |
Nuclear refueling outage expenses | | | 73,966 | | | | - | | | | 73,966 | | | | | | 162,653 | | | | - | | | | 162,653 | |
Other operation and maintenance | | | 1,458,596 | | | | 86,227 | | | | 1,544,823 | | | | | | 2,122,206 | | | | 86,227 | | | | 2,208,432 | |
Decommissioning | | | 83,910 | | | | - | | | | 83,910 | | | | | | 143,121 | | | | - | | | | 143,121 | |
Taxes other than income taxes | | | 325,766 | | | | 41,538 | | | | 367,304 | | | | | | 382,521 | | | | 41,538 | | | | 424,059 | |
Depreciation and amortization | | | 789,654 | | | | 33,975 | | | | 823,629 | | | | | | 856,377 | | | | 33,975 | | | | 890,352 | |
Other regulatory charges (credits) – net | | | (49,882 | ) | | | 3,181 | | | | (46,701 | ) | | | | | (49,882 | ) | | | 3,181 | | | | (46,701 | ) |
| | | | | | | | | | | | | | | | | | | | | | | | | | | |
Total | | | 7,183,433 | | | | 335,545 | | | | 7,518,978 | | | | | | 8,314,258 | | | | 335,545 | | | | 8,649,802 | |
| | | | | | | | | | | | | | | | | | | | | | | | | | | |
| | | | | | | |
OPERATING INCOME | | | 1,389,511 | | | | 13,072 | | | | 1,402,583 | | | | | | 1,791,989 | | | | 13,072 | | | | 1,805,061 | |
| | | | | | | | | | | | | | | | | | | | | | | | | | | |
| | | | | | | |
OTHER INCOME (DEDUCTIONS): | | | | | | | | | | | | | | | | | | | | | | | | | | |
Allowance for equity funds used during construction | | | 45,736 | | | | 3,229 | | | | 48,965 | | | | | | 45,736 | | | | 3,229 | | | | 48,965 | |
Interest and dividend income | | | 125,237 | | | | 89 | | | | 125,326 | | | | | | 150,479 | | | | 89 | | | | 150,568 | |
Equity in earnings (loss) of unconsolidated equity affiliates | | | 10,462 | | | | (768 | ) | | | 9,694 | | | | | | 985 | | | | (768 | ) | | | 217 | |
Miscellaneous – net | | | (19,030 | ) | | | (4,110 | ) | | | (23,140 | ) | | | | | 14,251 | | | | (4,110 | ) | | | 10,141 | |
| | | | | | | | | | | | | | | | | | | | | | | | | | | |
Total | | | 162,405 | | | | (1,560 | ) | | | 160,845 | | | | | | 211,451 | | | | (1,560 | ) | | | 209,891 | |
| | | | | | | | | | | | | | | | | | | | | | | | | | | |
| | | | | | | |
INTEREST AND OTHER CHARGES: | | | | | | | | | | | | | | | | | | | | | | | | | | |
Interest on long-term debt | | | 427,055 | | | | 10,153 | | | | 437,208 | | | | | | 440,334 | | | | 10,153 | | | | 450,487 | |
Other interest – net | | | 79,612 | | | | 1,696 | | | | 81,308 | | | | | | 64,646 | | | | 1,696 | | | | 66,342 | |
Allowance for borrowed funds used during construction | | | (29,376 | ) | | | (2,609 | ) | | | (31,985 | ) | | | | | (29,376 | ) | | | (2,609 | ) | | | (31,985 | ) |
| | | | | | | | | | | | | | | | | | | | | | | | | | | |
Total | | | 477,291 | | | | 9,240 | | | | 486,531 | | | | | | 475,604 | | | | 9,240 | | | | 484,844 | |
| | | | | | | | | | | | | | | | | | | | | | | | | | | |
INCOME FROM CONTINUING OPERATIONS BEFORE INCOME TAXES | | | 1,074,625 | | | | 2,272 | | | | 1,076,897 | | | | | | 1,527,836 | | | | 2,272 | | | | 1,530,108 | |
Income taxes | | | 403,671 | | | | 1,790 | | | | 405,461 | | | | | | 559,284 | | | | 1,790 | | | | 561,074 | |
| | | | | | | | | | | | | | | | | | | | | | | | | | | |
INCOME FROM CONTINUING OPERATIONS | | | 670,954 | | | | 482 | | | | 671,436 | | | | | | 968,552 | | | | 482 | | | | 969,034 | |
| | | | | | | |
LOSS FROM DISCONTINUED OPERATIONS
(net of income tax expense of $(24,051)) | | | (44,794 | ) | | | - | | | | (44,794 | ) | | | | | (44,794 | ) | | | - | | | | (44,794 | ) |
| | | | | | | | | | | | | | | | | | | | | | | | | | | |
| | | | | | | |
CONSOLIDATED NET INCOME | | | 626,160 | | | | 482 | | | | 626,642 | | | | | | 923,758 | | | | 482 | | | | 924,240 | |
| | | | | | | | | | | | | | | | | | | | | | | | | | | |
Preferred dividend requirements of subsidiaries | | | 22,007 | | | | 482 | | | | 22,489 | | | | | | 25,427 | | | | 482 | | | | 25,909 | |
NET INCOME ATTRIBUTABLE TO ENTERGY CORPORATION | | $ | 604,153 | | | $ | - | | | $ | 604,153 | | | | | $ | 898,331 | | | $ | - | | | $ | 898,331 | |
| | | | | | | | | | | | | | | | | | | | | | | | | | | |
| * | Adjustment to reflect reconsolidation of Entergy New Orleans, Inc. |
Totals may not foot due to rounding.
Certain prior year data has been reclassified to conform with current year presentation.
57
REG G RECONCILIATIONS
PRO FORMA FINANCIAL RESULTS (Reflects Reconsolidation of Entergy New Orleans) (unaudited)
| | | | | | | | | | | | | | | | | | | | | | | | | | |
| RECONCILIATION OF GAAP TO NON-GAAP | | | | | | | | | | | | | | | | | | |
| 2005 PRO FORMA BALANCE SHEET | | UTILITY/PARENT/OTHER | | | | | CONSOLIDATED | |
| In thousands, as of December 31, 2005. | | GAAP | | | ENOI
ADJUSTMENT* | | | PRO FORMA | | | | | GAAP | | | ENOI
ADJUSTMENT* | | | PRO FORMA | |
ASSETS | | | | | | | | | | | | | | | | | | | | | | | | | | |
CURRENT ASSETS: | | | | | | | | | | | | | | | | | | | | | | | | | | |
Cash and cash equivalents: | | | | | | | | | | | | | | | | | | | | | | | | | | |
Cash | | $ | 207,135 | | | $ | 48,056 | | | $ | 255,191 | | | | | $ | 221,773 | | | $ | 48,056 | | | $ | 269,829 | |
Temporary cash investments – at cost, | | | 127,786 | | | | - | | | | 127,786 | | | | | | 361,047 | | | | - | | | | 361,047 | |
| | | | | | | | | | | | | | | | | | | | | | | | | | | |
Total cash and cash equivalents | | | 334,921 | | | | 48,056 | | | | 382,977 | | | | | | 582,820 | | | | 48,056 | | | | 630,876 | |
| | | | | | | | | | | | | | | | | | | | | | | | | | | |
Notes receivable – Entergy New Orleans DIP loan | | | 90,000 | | | | (90,000 | ) | | | - | | | | | | 90,000 | | | | (90,000 | ) | | | - | |
Notes receivable | | | 575,873 | | | | - | | | | 575,873 | | | | | | 3,227 | | | | - | | | | 3,227 | |
Accounts receivable: | | | | | | | | | | | | | | | | | | | | | | | | | | |
Customer | | | 629,717 | | | | 82,052 | | | | 711,769 | | | | | | 763,993 | | | | 82,052 | | | | 846,045 | |
Allowance for doubtful accounts | | | (28,635 | ) | | | (25,422 | ) | | | (54,057 | ) | | | | | (30,805 | ) | | | (25,422 | ) | | | (56,227 | ) |
Associated companies | | | 33,851 | | | | - | | | | 33,851 | | | | | | - | | | | - | | | | - | |
Other | | | 296,286 | | | | (96,208 | ) | | | 200,078 | | | | | | 324,876 | | | | (96,208 | ) | | | 228,668 | |
Accrued unbilled revenues | | | 477,570 | | | | 23,698 | | | | 501,268 | | | | | | 477,570 | | | | 23,698 | | | | 501,268 | |
| | | | | | | | | | | | | | | | | | | | | | | | | | | |
Total account receivables | | | 1,408,789 | | | | (15,880 | ) | | | 1,392,909 | | | | | | 1,535,634 | | | | (15,880 | ) | | | 1,519,754 | |
| | | | | | | | | | | | | | | | | | | | | | | | | | | |
Deferred fuel costs | | | 543,927 | | | | 30,593 | | | | 574,520 | | | | | | 543,927 | | | | 30,593 | | | | 574,520 | |
Fuel inventory – at average cost | | | 204,382 | | | | 8,048 | | | | 212,430 | | | | | | 206,195 | | | | 8,048 | | | | 214,243 | |
Materials and supplies – at average cost | | | 369,397 | | | | 8,961 | | | | 378,358 | | | | | | 610,932 | | | | 8,961 | | | | 619,893 | |
Deferred nuclear refueling outage costs | | | 70,545 | | | | - | | | | 70,545 | | | | | | 164,152 | | | | - | | | | 164,152 | |
Prepayments and other | | | 301,387 | | | | 2,140 | | | | 303,527 | | | | | | 325,795 | | | | 2,140 | | | | 327,935 | |
| | | | | | | | | | | | | | | | | | | | | | | | | | | |
Total | | | 3,899,221 | | | | (8,082 | ) | | | 3,891,139 | | | | | | 4,062,682 | | | | (8,082 | ) | | | 4,054,600 | |
| | | | | | | | | | | | | | | | | | | | | | | | | | | |
| | | | | | | |
OTHER PROPERTY AND INVESTMENTS: | | | | | | | | | | | | | | | | | | | | | | | | | | |
Investment in affiliates – at equity | | | 8,198,240 | | | | (149,929 | ) | | | 8,048,311 | | | | | | 296,784 | | | | (149,929 | ) | | | 146,855 | |
Decommissioning trust funds | | | 1,136,006 | | | | - | | | | 1,136,006 | | | | | | 2,606,765 | | | | - | | | | 2,606,765 | |
Non-utility property – at cost
(less accumulated depreciation) | | | 226,264 | | | | 1,107 | | | | 227,371 | | | | | | 228,833 | | | | 1,107 | | | | 229,940 | |
Other | | | 35,594 | | | | - | | | | 35,594 | | | | | | 81,535 | | | | - | | | | 81,535 | |
| | | | | | | | | | | | | | | | | | | | | | | | | | | |
Total | | | 9,596,104 | | | | (148,822 | ) | | | 9,447,282 | | | | | | 3,213,917 | | | | (148,822 | ) | | | 3,065,095 | |
| | | | | | | | | | | | | | | | | | | | | | | | | | | |
| | | | | | | |
PROPERTY, PLANT AND EQUIPMENT: | | | | | | | | | | | | | | | | | | | | | | | | | | |
Electric | | | 27,176,956 | | | | 691,045 | | | | 27,868,001 | | | | | | 29,161,027 | | | | 691,045 | | | | 29,852,072 | |
Property under capital lease | | | 727,565 | | | | - | | | | 727,565 | | | | | | 727,565 | | | | - | | | | 727,565 | |
Natural gas | | | 86,794 | | | | 189,207 | | | | 276,001 | | | | | | 86,794 | | | | 189,207 | | | | 276,001 | |
Construction work in progress | | | 1,291,374 | | | | 202,353 | | | | 1,493,727 | | | | | | 1,524,085 | | | | 202,353 | | | | 1,726,438 | |
Nuclear fuel under capital lease | | | 271,615 | | | | - | | | | 271,615 | | | | | | 271,615 | | | | - | | | | 271,615 | |
Nuclear fuel | | | 101,403 | | | | - | | | | 101,403 | | | | | | 436,646 | | | | - | | | | 436,646 | |
| | | | | | | | | | | | | | | | | | | | | | | | | | | |
Total property, plant and equipment | | | 29,655,707 | | | | 1,082,605 | | | | 30,738,312 | | | | | | 32,207,732 | | | | 1,082,605 | | | | 33,290,337 | |
Less – accumulated depreciation and amortization | | | 12,730,545 | | | | 428,053 | | | | 13,158,598 | | | | | | 13,010,687 | | | | 428,053 | | | | 13,438,740 | |
| | | | | | | | | | | | | | | | | | | | | | | | | | | |
Property, plant and equipment – net | | | 16,925,162 | | | | 654,552 | | | | 17,579,714 | | | | | | 19,197,045 | | | | 654,552 | | | | 19,851,597 | |
| | | | | | | | | | | | | | | | | | | | | | | | | | | |
| | | | | | | |
DEFERRED DEBITS AND OTHER ASSETS: | | | | | | | | | | | | | | | | | | | | | | | | | | |
Regulatory assets: | | | | | | | | | | | | | | | | | | | | | | | | | | |
Regulatory asset for income taxes - net | | | 735,221 | | | | (52,229 | ) | | | 682,992 | | | | | | 735,221 | | | | (52,229 | ) | | | 682,992 | |
Other regulatory assets | | | 2,133,724 | | | | 171,133 | | | | 2,304,857 | | | | | | 2,133,724 | | | | 171,133 | | | | 2,304,857 | |
Deferred fuel costs | | | 120,489 | | | | - | | | | 120,489 | | | | | | 120,489 | | | | - | | | | 120,489 | |
Long-term receivables | | | 25,572 | | | | 1,812 | | | | 27,384 | | | | | | 25,572 | | | | 1,812 | | | | 27,384 | |
Goodwill | | | 374,099 | | | | - | | | | 374,099 | | | | | | 377,172 | | | | - | | | | 377,172 | |
Other | | | 841,068 | | | | 17,322 | | | | 858,390 | | | | | | 991,835 | | | | 17,322 | | | | 1,009,157 | |
| | | | | | | | | | | | | | | | | | | | | | | | | | | |
Total | | | 4,230,173 | | | | 138,038 | | | | 4,368,211 | | | | | | 4,384,013 | | | | 138,038 | | | | 4,522,051 | |
| | | | | | | | | | | | | | | | | | | | | | | | | | | |
| | | | | | | |
TOTAL ASSETS | | $ | 34,650,660 | | | $ | 635,686 | | | $ | 35,286,346 | | | | | $ | 30,857,657 | | | $ | 635,686 | | | $ | 31,493,343 | |
| | | | | | | | | | | | | | | | | | | | | | | | | | | |
| * | Adjustment to reflect reconsolidation of Entergy New Orleans, Inc. |
Totals may not foot due to rounding.
Certain prior year data has been reclassified to conform with current year presentation.
58
REG G RECONCILIATIONS
PRO FORMA FINANCIAL RESULTS (Reflects Reconsolidation of Entergy New Orleans) (unaudited)
| | | | | | | | | | | | | | | | | | |
| RECONCILIATION OF GAAP TO NON-GAAP | | | | | | | | | | | | | | | | | | |
| 2005 PRO FORMA BALANCE SHEET | | UTILITY/PARENT/OTHER | | | CONSOLIDATED | |
| In thousands, as of December 31, 2005. | | GAAP | | | ENOI
ADJUSTMENT* | | | PRO FORMA | | | GAAP | | | ENOI
ADJUSTMENT* | | | PRO FORMA | |
LIABILITIES AND EQUITY | | | | | | | | | | | | | | | | | | |
CURRENT LIABILITIES: | | | | | | | | | | | | | | | | | | |
Currently maturing long-term debt | | $ 22,989 | | | $ - | | | $ 22,989 | | | $ 103,517 | | | $ - | | | $ 103,517 | |
Notes payable: | | | | | | | | | | | | | | | | | | |
Associated companies | | 926,271 | | | - | | | 926,271 | | | - | | | - | | | - | |
Other | | 40,041 | | | 15,000 | | | 55,041 | | | 40,041 | | | 15,000 | | | 55,041 | |
Accounts payable: | | | | | | | | | | | | | | | | | | |
Associated companies | | 77,793 | | | - | | | 77,793 | | | - | | | - | | | - | |
Other | | 1,494,385 | | | 240,601 | | | 1,734,986 | | | 1,655,787 | | | 240,601 | | | 1,896,388 | |
Customer deposits | | 222,044 | | | 16,930 | | | 238,974 | | | 222,206 | | | 16,930 | | | 239,136 | |
Taxes accrued | | 316,659 | | | (378 | ) | | 316,281 | | | 188,159 | | | (378 | ) | | 187,781 | |
Accumulated deferred income taxes | | 143,409 | | | 1,898 | | | 145,307 | | | 143,409 | | | 1,898 | | | 145,307 | |
Interest accrued | | 153,269 | | | 2,668 | | | 155,937 | | | 154,855 | | | 2,668 | | | 157,523 | |
Obligations under capital leases | | 130,882 | | | - | | | 130,882 | | | 130,882 | | | - | | | 130,882 | |
Other | | 66,367 | | | 2,018 | | | 68,385 | | | 473,510 | | | 2,018 | | | 475,528 | |
| | | | | | | | | | | | | | | | | | | |
Total | | 3,594,109 | | | 278,737 | | | 3,872,846 | | | 3,112,366 | | | 278,737 | | | 3,391,103 | |
| | | | | | | | | | | | | | | | | | | |
| | | | | | |
NON–CURRENT LIABILITIES: | | | | | | | | | | | | | | | | | | |
Accumulated deferred income taxes and taxes accrued | | 5,248,739 | | | 68,617 | | | 5,317,356 | | | 5,282,759 | | | 68,617 | | | 5,351,376 | |
Accumulated deferred investment tax credits | | 376,550 | | | 3,570 | | | 380,120 | | | 376,550 | | | 3,570 | | | 380,120 | |
Obligations under capital leases | | 175,005 | | | - | | | 175,005 | | | 175,005 | | | - | | | 175,005 | |
Other regulatory liabilities | | 408,667 | | | 591 | | | 409,258 | | | 408,667 | | | 591 | | | 409,258 | |
Decommissioning and asset retirement cost liabilities | | 1,161,830 | | | 2,421 | | | 1,164,251 | | | 1,923,971 | | | 2,421 | | | 1,926,392 | |
Transition to competition | | 79,101 | | | - | | | 79,101 | | | 79,101 | | | - | | | 79,101 | |
Accumulated provisions | | 74,234 | | | 7,889 | | | 82,123 | | | 144,880 | | | 7,889 | | | 152,769 | |
Pension and other postretirement liabilities | | 874,793 | | | 26,049 | | | 900,842 | | | 1,118,964 | | | 26,049 | | | 1,145,013 | |
Long-term debt | | 8,791,811 | | | 226,603 | | | 9,018,414 | | | 8,824,493 | | | 226,603 | | | 9,051,096 | |
Preferred stock with sinking fund | | 13,950 | | | - | | | 13,950 | | | 13,950 | | | - | | | 13,950 | |
Other | | 1,161,820 | | | 1,429 | | | 1,163,249 | | | 1,202,706 | | | 1,429 | | | 1,204,135 | |
| | | | | | | | | | | | | | | | | | | |
Total | | 18,366,500 | | | 337,169 | | | 18,703,669 | | | 19,551,046 | | | 337,169 | | | 19,888,215 | |
| | | | | | | | | | | | | | | | | | | |
| | | | | | |
Commitments and Contingencies | | | | | | | | | | | | | | | | | | |
| | | | | | |
Subsidiaries preferred stock without sinking fund | | 411,321 | | | 19,780 | | | 431,101 | | | 345,974 | | | 19,780 | | | 365,754 | |
| | | | | | |
EQUITY: | | | | | | | | | | | | | | | | | | |
Common shareholders’ equity: | | | | | | | | | | | | | | | | | | |
Common stock, $.01 par value, authorized 500,000,000 shares; issued 248,174,087 shares in 2005 | | 2,205,191 | | | - | | | 2,205,192 | | | 2,482 | | | - | | | 2,482 | |
Paid–in capital | | 6,653,879 | | | - | | | 6,653,879 | | | 4,817,637 | | | - | | | 4,817,637 | |
Retained earnings | | 5,717,919 | | | - | | | 5,717,919 | | | 5,433,931 | | | - | | | 5,433,931 | |
Accumulated other comprehensive loss | | (16,300 | ) | | - | | | (16,300 | ) | | (343,819 | ) | | - | | | (343,819 | ) |
Less – treasury stock, at cost (40,644,602 shares in 2005) | | 2,281,960 | | | - | | | 2,281,960 | | | 2,161,960 | | | - | | | 2,161,960 | |
| | | | | | | | | | | | | | | | | | | |
Total common shareholders’ equity | | 12,278,730 | | | - | | | 12,278,730 | | | 7,748,271 | | | - | | | 7,748,271 | |
| | | | | | | | | | | | | | | | | | | |
Subsidiaries preferred stock without sinking fund | | - | | | - | | | - | | | 100,000 | | | - | | | 100,000 | |
| | | | | | | | | | | | | | | | | | | |
Total | | 12,278,730 | | | - | | | 12,278,730 | | | 7,848,271 | | | - | | | 7,848,271 | |
| | | | | | | | | | | | | | | | | | | |
| | | | | | |
TOTAL LIABILITIES AND EQUITY | | $34,650,660 | | | $635,686 | | | $35,286,346 | | | $30,857,657 | | | $635,686 | | | $31,493,343 | |
| | | | | | | | | | | | | | | | | | | |
| * | Adjustment to reflect reconsolidation of Entergy New Orleans, Inc. |
Totals may not foot due to rounding.
Certain prior year data has been reclassified to conform with current year presentation.
59
REG G RECONCILIATIONS
PRO FORMA FINANCIAL RESULTS (Reflects Reconsolidation of Entergy New Orleans) (unaudited)
RECONCILIATION OF GAAP TO NON-GAAP
2005 PRO FORMA STATEMENT OF CASH FLOW
| | | | | | | | | |
| | | CONSOLIDATED | |
| In thousands, for the year ended December 31, 2005. | | GAAP | | | ENOI
ADJUSTMENT* | | | PRO FORMA | |
OPERATING ACTIVITIES: | | | | | | | | | |
Consolidated net income | | $ 923,758 | | | $ 700 | | | $ 924,458 | |
Adjustments to reconcile consolidated net income to net cash flow provided by operating activities: | | | | | | | | | |
Reserve for regulatory adjustments | | (82,033 | ) | | (142 | ) | | (82,175 | ) |
Other regulatory charges (credits) – net | | (49,882 | ) | | 3,181 | | | (46,701 | ) |
Depreciation, amortization, and decommissioning | | 1,001,852 | | | 33,975 | | | 1,035,827 | |
Deferred income taxes and investment tax credits | | 487,804 | | | 236,100 | | | 723,904 | |
Equity in earnings (loss) of unconsolidated equity affiliates – net of dividends | | 4,315 | | | (4,532 | ) | | (217 | ) |
Provisions for asset impairments and restructuring charges | | 39,767 | | | - | | | 39,767 | |
Changes in working capital: | | | | | | | | - | |
Receivables | | (367,351 | ) | | 61,359 | | | (305,992 | ) |
Fuel inventory | | (83,125 | ) | | (3,867 | ) | | (86,992 | ) |
Accounts payable | | 303,194 | | | (5,392 | ) | | 297,802 | |
Taxes accrued | | (33,306 | ) | | (211,082 | ) | | (244,388 | ) |
Interest accrued | | 15,133 | | | (2,089 | ) | | 13,044 | |
Deferred fuel | | (236,801 | ) | | (28,034 | ) | | (264,835 | ) |
Other working capital accounts | | (45,653 | ) | | (6,568 | ) | | (52,221 | ) |
Provision for estimated losses and reserves | | (3,704 | ) | | (1,632 | ) | | (5,336 | ) |
Changes in other regulatory assets | | (311,934 | ) | | (59,707 | ) | | (371,641 | ) |
Other | | (94,226 | ) | | (21,751 | ) | | (115,977 | ) |
| | | | | | | | | | |
Net cash flow provided by (used in) operating activities | | 1,467,808 | | | (9,481 | ) | | 1,458,327 | |
| | | | | | | | | | |
INVESTING ACTIVITIES: | | | | | | | | | |
Construction/capital expenditures | | (1,458,086 | ) | | (57,640 | ) | | (1,515,726 | ) |
Allowance for equity funds used during construction | | 45,736 | | | 3,229 | | | 48,965 | |
Nuclear fuel purchases | | (314,414 | ) | | - | | | (314,414 | ) |
Proceeds from sale/leaseback of nuclear fuel | | 184,403 | | | - | | | 184,403 | |
Payment for purchase of plant | | (162,075 | ) | | - | | | (162,075 | ) |
Increase in other investments | | 9,905 | | | 90,000 | | | 99,905 | |
Purchase of other temporary investments | | (1,591,025 | ) | | - | | | (1,591,025 | ) |
Liquidation of other temporary investments | | 1,778,975 | | | - | | | 1,778,975 | |
Proceeds from nuclear decommissioning trust fund sales | | 944,253 | | | - | | | 944,253 | |
Investment in nuclear decommissioning trust funds | | (1,039,824 | ) | | - | | | (1,039,824 | ) |
Other regulatory investments | | (390,456 | ) | | - | | | (390,456 | ) |
| | | | | | | | | | |
Net cash flow provided by (used in) investing activities | | (1,992,608 | ) | | 35,589 | | | (1,957,019 | ) |
| | | | | | | | | | |
FINANCING ACTIVITIES: | | | | | | | | | |
Proceeds from the issuance of: | | | | | | | | | |
Long-term debt | | 4,302,570 | | | 29,783 | | | 4,332,353 | |
Preferred stock | | 127,995 | | | - | | | 127,995 | |
Common stock and treasury stock | | 106,068 | | | - | | | 106,068 | |
Retirement of long-term debt | | (2,689,206 | ) | | (30,065 | ) | | (2,719,271 | ) |
Repurchase of common stock | | (878,188 | ) | | - | | | (878,188 | ) |
Redemption of preferred stock | | (33,719 | ) | | - | | | (33,719 | ) |
Changes in credit line borrowings – net | | 39,850 | | | 15,000 | | | 54,850 | |
Dividends paid: | | | | | | | | | |
Common stock | | (453,508 | ) | | - | | | (453,508 | ) |
Preferred stock | | (25,472 | ) | | (724 | ) | | (26,196 | ) |
| | | | | | | | | | |
Net cash flow used in financing activities | | 496,390 | | | 13,994 | | | 510,384 | |
| | | | | | | | | | |
Effect of exchange rates on cash and cash equivalents | | (602 | ) | | - | | | (602 | ) |
| | | | | | | | | | |
Net increase (decrease) in cash and cash equivalents | | (29,012 | ) | | 40,102 | | | 11,090 | |
Cash and cash equivalents at beginning of period | | 619,786 | | | - | | | 619,786 | |
| | | | | | | | | | |
Effect of the deconsolidation of Entergy New Orleans on cash and cash equivalents | | (7,954 | ) | | 7,954 | | | - | |
| | | | | | | | | | |
Cash and cash equivalents at end of period | | $ 582,820 | | | $ 48,056 | | | $ 630,876 | |
| | | | | | | | | | |
| | | |
SUPPLEMENTAL DISCLOSURE OF CASH FLOW INFORMATION: | | | | | | | | | |
| | | |
Cash paid (received) during the period for: | | | | | | | | | |
| | | |
Interest – net of amount capitalized | | $ 461,345 | | | $ - | | | $ 461,345 | |
| | | |
Income taxes | | $ 116,072 | | | $ (18,000) | | | $ 98,072 | |
| | | | | | | | | | |
* Adjustment to reflect reconsolidation of Entergy New Orleans, Inc.
Totals may not foot due to rounding.
Certain prior year data has been reclassified to conform with current year presentation.
60
REG G RECONCILIATIONS
PRO FORMA FINANCIAL RESULTS (Reflects Reconsolidation of Entergy New Orleans) (unaudited)
| | | | | | | | | | | | | | | | | | |
| RECONCILIATION OF GAAP TO NON-GAAP | | | | | | | | | | | | | | | | | | |
| 2006 PRO FORMA INCOME STATEMENT | | UTILITY/PARENT/OTHER | | | CONSOLIDATED | |
| | | | | | |
In thousands, for the year ended December 31,
2006. | | GAAP | | | ENOI
ADJUSTMENT* | | | PRO FORMA | | | GAAP | | | ENOI
ADJUSTMENT* | | | PRO FORMA | |
OPERATING REVENUES: | | | | | | | | | | | | | | | | | | |
Electric | | $9,065,800 | | | $204,989 | | | $9,270,789 | | | $ 9,063,135 | | | $204,989 | | | $ 9,268,124 | |
Natural gas | | 84,230 | | | 100,088 | | | 184,318 | | | 84,230 | | | 100,088 | | | 184,318 | |
Competitive businesses | | 39,817 | | | - | | | 39,817 | | | 1,784,793 | | | - | | | 1,784,793 | |
| | | | | | | | | | | | | | | | | | | |
Total | | 9,189,847 | | | 305,077 | | | 9,494,924 | | | 10,932,158 | | | 305,077 | | | 11,237,235 | |
| | | | | | | | | | | | | | | | | | | |
| | | | | | |
OPERATING EXPENSES: | | | | | | | | | | | | | | | | | | |
Operating and Maintenance: | | | | | | | | | | | | | | | | | | |
Fuel, fuel-related expenses, and gas purchased for resale | | 2,880,857 | | | 157,535 | | | 3,038,392 | | | 3,144,073 | | | 157,535 | | | 3,301,608 | |
Purchased power | | 2,120,770 | | | (43,647 | ) | | 2,077,123 | | | 2,138,237 | | | (43,647 | ) | | 2,094,590 | |
Nuclear refueling outage expenses | | 78,110 | | | - | | | 78,110 | | | 169,567 | | | - | | | 169,567 | |
Other operation and maintenance | | 1,614,002 | | | 100,094 | | | 1,714,096 | | | 2,335,364 | | | 100,094 | | | 2,435,458 | |
Decommissioning | | 82,912 | | | 169 | | | 83,081 | | | 145,884 | | | 169 | | | 146,053 | |
Taxes other than income taxes | | 363,897 | | | 34,953 | | | 398,850 | | | 428,561 | | | 34,953 | | | 463,514 | |
Depreciation and amortization | | 808,517 | | | 31,465 | | | 839,982 | | | 887,792 | | | 31,465 | | | 919,257 | |
Other regulatory charges (credits) – net | | (122,680 | ) | | 4,160 | | | (118,520 | ) | | (122,680 | ) | | 4,160 | | | (118,520 | ) |
| | | | | | | | | | | | | | | | | | | |
Total | | 7,826,385 | | | 284,729 | | | 8,111,114 | | | 9,126,798 | | | 284,729 | | | 9,411,527 | |
| | | | | | | | | | | | | | | | | | | |
| | | | | | |
OPERATING INCOME | | 1,363,462 | | | 20,348 | | | 1,383,810 | | | 1,805,360 | | | 20,348 | | | 1,825,708 | |
| | | | | | | | | | | | | | | | | | | |
| | | | | | |
OTHER INCOME (DEDUCTIONS): | | | | | | | | | | | | | | | | | | |
Allowance for equity funds used during construction | | 39,894 | | | 3,078 | | | 42,972 | | | 39,894 | | | 3,078 | | | 42,972 | |
Interest and dividend income | | 163,717 | | | (6,722 | ) | | 156,995 | | | 198,835 | | | (6,722 | ) | | 192,113 | |
Equity in earnings (loss) of unconsolidated equity affiliates | | 95,366 | | | (4,057 | ) | | 91,309 | | | 93,744 | | | (4,057 | ) | | 89,687 | |
Miscellaneous – net | | 555 | | | (543 | ) | | 12 | | | 16,114 | | | (543 | ) | | 15,571 | |
| | | | | | | | | | | | | | | | | | | |
Total | | 299,532 | | | (8,244 | ) | | 291,288 | | | 348,587 | | | (8,244 | ) | | 340,343 | |
| | | | | | | | | | | | | | | | | | | |
| | | | | | |
INTEREST AND OTHER CHARGES: | | | | | | | | | | | | | | | | | | |
Interest on long-term debt | | 489,282 | | | 4,069 | | | 493,351 | | | 498,451 | | | 4,069 | | | 502,520 | |
Other interest – net | | 99,196 | | | 4,175 | | | 103,371 | | | 75,502 | | | 4,175 | | | 79,677 | |
Allowance for borrowed funds used during construction | | (23,931 | ) | | (2,477 | ) | | (26,408 | ) | | (23,931 | ) | | (2,477 | ) | | (26,408 | ) |
| | | | | | | | | | | | | | | | | | | |
Total | | 564,547 | | | 5,767 | | | 570,314 | | | 550,022 | | | 5,767 | | | 555,789 | |
| | | | | | | | | | | | | | | | | | | |
| | | | | | |
INCOME FROM CONTINUING OPERATIONS BEFORE INCOME TAXES | | 1,098,447 | | | 6,337 | | | 1,104,784 | | | 1,603,925 | | | 6,337 | | | 1,610,262 | |
| | | | | | |
Income taxes | | 234,789 | | | 5,051 | | | 239,840 | | | 443,044 | | | 5,051 | | | 448,095 | |
| | | | | | | | | | | | | | | | | | | |
| | | | | | |
INCOME FROM CONTINUING OPERATIONS | | 863,658 | | | 1,286 | | | 864,944 | | | 1,160,881 | | | 1,286 | | | 1,162,167 | |
| | | | | | |
LOSS FROM DISCONTINUED OPERATIONS (net of income tax expense of $67) | | (496 | ) | | - | | | (496 | ) | | (496 | ) | | - | | | (496 | ) |
| | | | | | | | | | | | | | | | | | | |
| | | | | | |
CONSOLIDATED NET INCOME | | 863,162 | | | 1,286 | | | 864,448 | | | 1,160,385 | | | 1,286 | | | 1,161,671 | |
| | | | | | | | | | | | | | | | | | | |
Preferred dividend requirements of subsidiaries | | 24,363 | | | 1,286 | | | 25,649 | | | 27,783 | | | 1,286 | | | 29,069 | |
| | | | | | | | | | | | | | | | | | | |
| | | | | | |
NET INCOME ATTRIBUTABLE TO ENTERGY CORPORATION | | $ 838,799 | | | $ - | | | $ 838,799 | | | $ 1,132,602 | | | $ - | | | $ 1,132,602 | |
| | | | | | | | | | | | | | | | | | | |
| * | Adjustment to reflect reconsolidation of Entergy New Orleans, Inc. |
Totals may not foot due to rounding.
Certain prior year data has been reclassified to conform with current year presentation.
61
REG G RECONCILIATIONS
PRO FORMA FINANCIAL RESULTS (Reflects Reconsolidation of Entergy New Orleans) (unaudited)
| | | | | | | | | | | | | | | | | | |
RECONCILIATION OF GAAP TO NON-GAAP
2006 PRO FORMA BALANCE SHEET | | UTILITY/PARENT/OTHER | | | CONSOLIDATED | |
| In thousands, as of December 31, 2006. | | GAAP | | | ENOI
ADJUSTMENT* | | | PRO FORMA | | | GAAP | | | ENOI
ADJUSTMENT* | | | PRO FORMA | |
ASSETS | | | | | | | | | | | | | | | | | | |
CURRENT ASSETS: | | | | | | | | | | | | | | | | | | |
Cash and cash equivalents: | | | | | | | | | | | | | | | | | | |
Cash | | $ 95,468 | | | $ 3,886 | | | $ 99,354 | | | $ 117,379 | | | $ 3,886 | | | $ 121,265 | |
Temporary cash investments | | 499,942 | | | 13,207 | | | 513,149 | | | 898,773 | | | 13,207 | | | 911,980 | |
| | | | | | | | | | | | | | | | | | | |
Total cash and cash equivalents | | 595,410 | | | 17,093 | | | 612,503 | | | 1,016,152 | | | 17,093 | | | 1,033,245 | |
| | | | | | | | | | | | | | | | | | | |
Notes receivable – Entergy New Orleans DIP loan | | 51,934 | | | (51,934 | ) | | - | | | 51,934 | | | (51,934 | ) | | - | |
Notes receivable | | 266,717 | | | - | | | 266,717 | | | 699 | | | - | | | 699 | |
Accounts receivable: | | | | | | | | | | | | | | | | | | |
Customer | | 410,512 | | | 58,999 | | | 469,511 | | | 552,376 | | | 58,999 | | | 611,375 | |
Allowance for doubtful accounts | | (19,348 | ) | | (10,563 | ) | | (29,911 | ) | | (19,348 | ) | | (10,563 | ) | | (29,911 | ) |
Associated companies | | (5,099 | ) | | - | | | (5,099 | ) | | - | | | - | | | - | |
Other | | 312,654 | | | (86,258 | ) | | 226,396 | | | 345,400 | | | (86,258 | ) | | 259,142 | |
Accrued unbilled revenues | | 249,165 | | | 23,758 | | | 272,923 | | | 249,165 | | | 23,758 | | | 272,923 | |
| | | | | | | | | | | | | | | | | | | |
Total account receivable | | 947,884 | | | (14,064 | ) | | 933,820 | | | 1,127,593 | | | (14,064 | ) | | 1,113,529 | |
| | | | | | | | | | | | | | | | | | | |
Accumulated deferred income taxes | | 10,498 | | | (2,924 | ) | | 7,574 | | | 11,680 | | | (2,924 | ) | | 8,756 | |
Fuel inventory – at average cost | | 189,829 | | | 5,041 | | | 194,870 | | | 193,098 | | | 5,041 | | | 198,139 | |
Materials and supplies – at average cost | | 408,279 | | | 7,825 | | | 416,104 | | | 604,998 | | | 7,825 | | | 612,823 | |
Deferred nuclear refueling outage costs | | 65,349 | | | - | | | 65,349 | | | 147,521 | | | - | | | 147,521 | |
Prepayments and other | | 150,134 | | | 5,640 | | | 155,774 | | | 171,759 | | | 5,640 | | | 177,399 | |
| | | | | | | | | | | | | | | | | | | |
Total | | 2,686,034 | | | (33,323 | ) | | 2,652,711 | | | 3,325,434 | | | (33,323 | ) | | 3,292,111 | |
| | | | | | | | | | | | | | | | | | | |
| | | | | | |
OTHER PROPERTY AND INVESTMENTS: | | | | | | | | | | | | | | | | | | |
Investment in affiliates – at equity | | 7,725,189 | | | (153,988 | ) | | 7,571,201 | | | 229,089 | | | (153,988 | ) | | 75,101 | |
Decommissioning trust funds | | 1,274,676 | | | - | | | 1,274,676 | | | 2,858,523 | | | - | | | 2,858,523 | |
Non-utility property – at cost | | | | | | | | | | | | | | | | | | |
(less accumulated depreciation) | | 208,956 | | | 1,107 | | | 210,063 | | | 212,726 | | | 1,107 | | | 213,833 | |
Other | | 39,868 | | | - | | | 39,868 | | | 47,115 | | | - | | | 47,115 | |
| | | | | | | | | | | | | | | | | | | |
Total | | 9,248,689 | | | (152,881 | ) | | 9,095,808 | | | 3,347,453 | | | (152,881 | ) | | 3,194,572 | |
| | | | | | | | | | | | | | | | | | | |
| | | | | | |
PROPERTY, PLANT AND EQUIPMENT: | | | | | | | | | | | | | | | | | | |
Electric | | 28,405,556 | | | 698,081 | | | 29,103,637 | | | 30,713,284 | | | 698,081 | | | 31,411,365 | |
Property under capital lease | | 730,182 | | | - | | | 730,182 | | | 730,182 | | | - | | | 730,182 | |
Natural gas | | 92,787 | | | 186,932 | | | 279,719 | | | 92,787 | | | 186,932 | | | 279,719 | |
Construction work in progress | | 609,431 | | | 21,824 | | | 631,255 | | | 786,147 | | | 21,824 | | | 807,971 | |
Nuclear fuel under capital lease | | 336,017 | | | - | | | 336,017 | | | 336,017 | | | - | | | 336,017 | |
Nuclear fuel | | 140,357 | | | - | | | 140,357 | | | 494,759 | | | - | | | 494,759 | |
| | | | | | | | | | | | | | | | | | | |
Total property, plant and equipment | | 30,314,330 | | | 906,837 | | | 31,221,167 | | | 33,153,176 | | | 906,837 | | | 34,060,013 | |
Less – accumulated depreciation and amortization | | 13,366,710 | | | 446,673 | | | 13,813,383 | | | 13,715,099 | | | 446,673 | | | 14,161,772 | |
| | | | | | | | | | | | | | | | | | | |
Property, plant and equipment – net | | 16,947,620 | | | 460,164 | | | 17,407,784 | | | 19,438,077 | | | 460,164 | | | 19,898,241 | |
| | | | | | | | | | | | | | | | | | | |
| | | | | | |
DEFERRED DEBITS AND OTHER ASSETS: | | | | | | | | | | | | | | | | | | |
Regulatory assets: | | | | | | | | | | | | | | | | | | |
Regulatory asset for income taxes – net | | 740,110 | | | (71,870 | ) | | 668,240 | | | 740,110 | | | (71,870 | ) | | 668,240 | |
Other regulatory assets | | 2,768,352 | | | 295,440 | | | 3,063,792 | | | 2,768,352 | | | 295,440 | | | 3,063,792 | |
Deferred fuel costs | | 168,122 | | | - | | | 168,122 | | | 168,122 | | | - | | | 168,122 | |
Long-term receivables | | 19,349 | | | 936 | | | 20,285 | | | 19,349 | | | 936 | | | 20,285 | |
Goodwill | | 374,099 | | | - | | | 374,099 | | | 377,172 | | | - | | | 377,172 | |
Other | | 736,461 | | | 4,824 | | | 741,285 | | | 898,662 | | | 4,824 | | | 903,486 | |
| | | | | | | | | | | | | | | | | | | |
Total | | 4,806,493 | | | 229,330 | | | 5,035,823 | | | 4,971,767 | | | 229,330 | | | 5,201,097 | |
| | | | | | | | | | | | | | | | | | | |
| | | | | | |
TOTAL ASSETS | | $33,688,836 | | | $ 503,290 | | | $34,192,126 | | | $31,082,731 | | | $503,290 | | | $31,586,021 | |
| | | | | | | | | | | | | | | | | | | |
| * | Adjustment to reflect reconsolidation of Entergy New Orleans, Inc. |
Totals may not foot due to rounding.
Certain prior year data has been reclassified to conform with current year presentation.
62
REG G RECONCILIATIONS
PRO FORMA FINANCIAL RESULTS (Reflects Reconsolidation of Entergy New Orleans) (unaudited)
| | | | | | | | | | | | | | | | | | | | | | | | |
RECONCILIATION OF GAAP TO NON-GAAP 2006 PRO FORMA BALANCE SHEET | | UTILITY/PARENT/OTHER | | | CONSOLIDATED | |
| In thousands, as of December 31, 2006. | | GAAP | | | ENOI
ADJUSTMENT* | | | PRO FORMA | | | GAAP | | | ENOI
ADJUSTMENT* | | | PRO FORMA | |
LIABILITIES AND EQUITY CURRENT LIABILITIES: | | | | | | | | | | | | | | | | | | | | | | | | |
Currently maturing long-term debt | | $ | 93,335 | | | $ | - | | | $ | 93,335 | | | $ | 181,576 | | | $ | - | | | $ | 181,576 | |
Notes payable: | | | | | | | | | | | | | | | | | | | | | | | | |
Associated companies | | | 979,198 | | | | - | | | | 979,198 | | | | - | | | | - | | | | - | |
Other | | | 25,039 | | | | - | | | | 25,039 | | | | 25,039 | | | | - | | | | 25,039 | |
Accounts payable: | | | | | | | | | | | | | | | | | | | | | | | | |
Associated companies | | | 69,355 | | | | - | | | | 69,355 | | | | - | | | | - | | | | - | |
Other | | | 901,434 | | | | 59,034 | | | | 960,468 | | | | 1,122,596 | | | | 59,034 | | | | 1,181,630 | |
Customer deposits | | | 248,031 | | | | 14,808 | | | | 262,839 | | | | 248,031 | | | | 14,808 | | | | 262,839 | |
Taxes accrued | | | 167,060 | | | | 2,087 | | | | 169,147 | | | | 187,324 | | | | 2,087 | | | | 189,411 | |
Interest accrued | | | 159,527 | | | | 18,004 | | | | 177,531 | | | | 160,831 | | | | 18,004 | | | | 178,835 | |
Deferred fuel costs | | | 73,031 | | | | (18,996 | ) | | | 54,035 | | | | 73,031 | | | | (18,996 | ) | | | 54,035 | |
Obligations under capital leases | | | 153,246 | | | | - | | | | 153,246 | | | | 153,246 | | | | - | | | | 153,246 | |
Pension and other postretirement liabilities | | | 39,008 | | | | 16 | | | | 39,024 | | | | 41,912 | | | | 16 | | | | 41,928 | |
Other | | | 100,501 | | | | 6,138 | | | | 106,639 | | | | 271,544 | | | | 6,138 | | | | 277,682 | |
| | | | | | | | | | | | | | | | | | | | | | | | | |
Total | | | 3,008,765 | | | | 81,091 | | | | 3,089,856 | | | | 2,465,130 | | | | 81,091 | | | | 2,546,221 | |
| | | | | | | | | | | | | | | | | | | | | | | | | |
| | | | | | |
NON–CURRENT LIABILITIES: | | | | | | | | | | | | | | | | | | | | | | | | |
Accumulated deferred income taxes and taxes accrued | | | 5,451,700 | | | | 98,884 | | | | 5,550,584 | | | | 5,820,700 | | | | 98,884 | | | | 5,919,584 | |
Accumulated deferred investment tax credits | | | 358,550 | | | | 3,157 | | | | 361,707 | | | | 358,550 | | | | 3,157 | | | | 361,707 | |
Obligations under capital leases | | | 188,033 | | | | - | | | | 188,033 | | | | 188,033 | | | | - | | | | 188,033 | |
Other regulatory liabilities | | | 449,237 | | | | - | | | | 449,237 | | | | 449,237 | | | | - | | | | 449,237 | |
Decommissioning and asset retirement cost liabilities | | | 1,249,482 | | | | 2,591 | | | | 1,252,073 | | | | 2,023,846 | | | | 2,591 | | | | 2,026,437 | |
Transition to competition | | | 79,098 | | | | - | | | | 79,098 | | | | 79,098 | | | | - | | | | 79,098 | |
Accumulated provisions | | | 81,053 | | | | 8,384 | | | | 89,437 | | | | 88,902 | | | | 8,384 | | | | 97,286 | |
Pension and other postretirement liabilities | | | 1,125,707 | | | | 60,034 | | | | 1,185,741 | | | | 1,410,433 | | | | 60,034 | | | | 1,470,467 | |
Long-term debt | | | 8,560,534 | | | | 226,619 | | | | 8,787,153 | | | | 8,798,087 | | | | 226,619 | | | | 9,024,706 | |
Preferred stock with sinking fund | | | 10,500 | | | | - | | | | 10,500 | | | | 10,500 | | | | - | | | | 10,500 | |
Other | | | 1,173,844 | | | | 2,750 | | | | 1,176,594 | | | | 847,415 | | | | 2,750 | | | | 850,165 | |
| | | | | | | | | | | | | | | | | | | | | | | | | |
Total | | | 18,727,738 | | | | 402,419 | | | | 19,130,157 | | | | 20,074,801 | | | | 402,419 | | | | 20,477,220 | |
| | | | | | | | | | | | | | | | | | | | | | | | | |
| | | | | | |
Commitments and Contingencies | | | | | | | | | | | | | | | | | | | | | | | | |
| | | | | | |
Subsidiaries preferred stock without sinking fund | | | 310,751 | | | | 19,780 | | | | 330,531 | | | | 244,913 | | | | 19,780 | | | | 264,693 | |
| | | | | | |
EQUITY: | | | | | | | | | | | | | | | | | | | | | | | | |
Common shareholders’ equity: | | | | | | | | | | | | | | | | | | | | | | | | |
Common stock, $.01 par value, authorized 500,000,000 shares; issued 248,174,087 shares in 2006 | | | 2,228,350 | | | | - | | | | 2,228,350 | | | | 2,482 | | | | - | | | | 2,482 | |
Paid–in capital | | | 6,668,007 | | | | - | | | | 6,668,007 | | | | 4,827,265 | | | | - | | | | 4,827,265 | |
Retained earnings | | | 5,592,532 | | | | - | | | | 5,592,532 | | | | 6,113,042 | | | | - | | | | 6,113,042 | |
Accumulated other comprehensive loss | | | (82,917 | ) | | | - | | | | (82,917 | ) | | | (100,512 | ) | | | - | | | | (100,512 | ) |
Less – treasury stock, at cost (45,506,311 shares in 2006) | | | 2,764,390 | | | | - | | | | 2,764,390 | | | | 2,644,390 | | | | - | | | | 2,644,390 | |
| | | | | | | | | | | | | | | | | | | | | | | | | |
Total common shareholders’ equity | | | 11,641,582 | | | | - | | | | 11,641,582 | | | | 8,197,887 | | | | - | | | | 8,197,887 | |
| | | | | | | | | | | | | | | | | | | | | | | | | |
Subsidiaries preferred stock without sinking fund | | | - | | | | - | | | | - | | | | 100,000 | | | | - | | | | 100,000 | |
| | | | | | | | | | | | | | | | | | | | | | | | | |
Total | | | 11,641,582 | | | | - | | | | 11,641,582 | | | | 8,297,887 | | | | - | | | | 8,297,887 | |
| | | | | | | | | | | | | | | | | | | | | | | | | |
| | | | | | |
TOTAL LIABILITIES AND EQUITY | | $ | 33,688,836 | | | $ | 503,290 | | | $ | 34,192,126 | | | $ | 31,082,731 | | | $ | 503,290 | | | $ | 31,586,021 | |
| | | | | | | | | | | | | | | | | | | | | | | | | |
| * | Adjustment to reflect reconsolidation of Entergy New Orleans, Inc. |
Totals may not foot due to rounding.
Certain prior year data has been reclassified to conform with current year presentation.
63
REG G RECONCILIATIONS
PRO FORMA FINANCIAL RESULTS (Reflects Reconsolidation of Entergy New Orleans) (unaudited)
| | | | | | | | | | | | |
RECONCILIATION OF GAAP TO NON-GAAP 2006 PRO FORMA STATEMENT OF CASH FLOW | | CONSOLIDATED | |
| In thousands, for the year ended December 31, 2006. | | GAAP | | | ENOI
ADJUSTMENT* | | | PRO FORMA | |
OPERATING ACTIVITIES: | | | | | | | | | | | | |
Consolidated net income | | $ | 1,160,385 | | | $ | - | | | $ | 1,160,385 | |
Adjustments to reconcile consolidated net income to net cash flow provided by operating activities: | | | | | | | | | | | | |
Reserve for regulatory adjustments | | | 36,352 | | | | (20 | ) | | | 36,332 | |
Other regulatory credits – net | | | (122,680 | ) | | | 4,160 | | | | (118,520 | ) |
Depreciation, amortization, and decommissioning | | | 1,035,153 | | | | 31,634 | | | | 1,066,787 | |
Deferred income taxes, investment tax credits, and non-current taxes accrued | | | 738,643 | | | | 54,395 | | | | 793,038 | |
Equity in earnings (loss) of unconsolidated equity affiliates – net of dividends | | | 4,436 | | | | 4,057 | | | | 8,493 | |
Provisions for asset impairments and restructuring charges | | | | | | | - | | | | - | |
Changes in working capital: | | | | | | | | | | | - | |
Receivables | | | 408,042 | | | | (1,817 | ) | | | 406,225 | |
Fuel inventory | | | 13,097 | | | | 3,007 | | | | 16,104 | |
Accounts payable | | | (83,884 | ) | | | 10,855 | | | | (73,029 | ) |
Taxes accrued | | | (835 | ) | | | 2,464 | | | | 1,629 | |
Interest accrued | | | 5,975 | | | | 15,337 | | | | 21,312 | |
Deferred fuel | | | 582,947 | | | | 11,597 | | | | 594,544 | |
Other working capital accounts | | | 64,479 | | | | (1,447 | ) | | | 63,032 | |
Provision for estimated losses and reserves | | | 39,822 | | | | 496 | | | | 40,318 | |
Changes in other regulatory assets | | | (454,458 | ) | | | (55,607 | ) | | | (510,065 | ) |
Changes in pensions and other postretirement liabilities | | | 333,381 | | | | 34,001 | | | | 367,382 | |
Other | | | (313,016 | ) | | | (19,284 | ) | | | (332,300 | ) |
| | | | | | | | | | | | | |
Net cash flow provided by operating activities | | | 3,447,839 | | | | 93,828 | | | | 3,541,667 | |
| | | | | | | | | | | | | |
INVESTING ACTIVITIES: | | | | | | | | | | | | |
Construction/capital expenditures | | | (1,633,268 | ) | | | (80,792 | ) | | | (1,714,060 | ) |
Allowance for equity funds used during construction | | | 39,894 | | | | 3,078 | | | | 42,972 | |
Nuclear fuel purchases | | | (326,248 | ) | | | - | | | | (326,248 | ) |
Proceeds from sale/leaseback of nuclear fuel | | | 135,190 | | | | - | | | | 135,190 | |
Proceeds from sale of assets and businesses | | | 77,159 | | | | - | | | | 77,159 | |
Payment for purchase of plant | | | (88,199 | ) | | | - | | | | (88,199 | ) |
Insurance proceeds received for property damages | | | 18,828 | | | | 4,664 | | | | 23,492 | |
Decrease in other investments | | | (6,353 | ) | | | (36,458 | ) | | | (42,811 | ) |
Proceeds from nuclear decommissioning trust fund sales | | | 777,584 | | | | - | | | | 777,584 | |
Investment in nuclear decommissioning trust funds | | | (884,123 | ) | | | - | | | | (884,123 | ) |
Other regulatory investments | | | (38,037 | ) | | | - | | | | (38,037 | ) |
| | | | | | | | | | | | | |
Net cash flow used in investing activities | | | (1,927,573 | ) | | | (109,508 | ) | | | (2,037,081 | ) |
| | | | | | | | | | | | | |
FINANCING ACTIVITIES: | | | | | | | | | | | | |
Proceeds from the issuance of: | | | | | | | | | | | | |
Long-term debt | | | 1,837,713 | | | | (6 | ) | | | 1,837,707 | |
Preferred stock | | | 73,354 | | | | - | | | | 73,354 | |
Common stock and treasury stock | | | 70,455 | | | | - | | | | 70,455 | |
Retirement of long-term debt | | | (1,804,373 | ) | | | - | | | | (1,804,373 | ) |
Repurchase of common stock | | | (584,193 | ) | | | - | | | | (584,193 | ) |
Redemption of preferred stock | | | (183,881 | ) | | | - | | | | (183,881 | ) |
Changes in credit line borrowings – net | | | (15,000 | ) | | | (15,000 | ) | | | (30,000 | ) |
Dividends paid: | | | | | | | | | | | - | |
Common stock | | | (448,954 | ) | | | - | | | | (448,954 | ) |
Preferred stock | | | (28,848 | ) | | | (277 | ) | | | (29,125 | ) |
| | | | | | | | | | | | | |
Net cash flow used in financing activities | | | (1,083,727 | ) | | | (15,283 | ) | | | (1,099,010 | ) |
| | | | | | | | | | | | | |
Effect of exchange rates on cash and cash equivalents | | | (3,207 | ) | | | - | | | | (3,207 | ) |
| | | | | | | | | | | | | |
Net increase (decrease) in cash and cash equivalents | | | 433,332 | | | | (30,963 | ) | | | 402,369 | |
Cash and cash equivalents at beginning of period | | | 582,820 | | | | 48,056 | | | | 630,876 | |
| | | | | | | | | | | | | |
Cash and cash equivalents at end of period | | $ | 1,016,152 | | | $ | 17,093 | | | $ | 1,033,245 | |
| | | | | | | | | | | | | |
SUPPLEMENTAL DISCLOSURE OF CASH FLOW INFORMATION: | | | | | | | | | | | | |
Cash paid (received) during the period for: | | | | | | | | | | | | |
Interest – net of amount capitalized | | $ | 514,189 | | | $ | - | | | $ | 514,189 | |
| | | | | | | | | | | | | |
Income taxes | | $ | (147,435 | ) | | $ | (57,193 | ) | | $ | (204,628 | ) |
| | | | | | | | | | | | | |
| * | Adjustment to reflect reconsolidation of Entergy New Orleans, Inc. |
Totals may not foot due to rounding.
Certain prior year data has been reclassified to conform with current year presentation.
64
REG G RECONCILIATIONS
PRO FORMA FINANCIAL RESULTS (Reflects Jurisdictional Split of Entergy Gulf States, Inc.) (unaudited)
| | | | | | | | | |
RECONCILIATION OF GAAP TO NON-GAAP 2007 PRO FORMA INCOME STATEMENT | | ENTERGY GULF STATES | | | | | | ENTERGY GULF STATES | |
| In thousands, for the year ended December 31, 2007. | | LOUISIANA
GAAP | | | ADJUSTMENT* | | | LOUISIANA
PRO FORMA | |
| | | |
OPERATING REVENUES: | | | | | | | | | |
Electric | | $ 3,448,008 | | | $(1,238,442 | ) | | $ 2,209,566 | |
Natural gas | | 86,604 | | | - | | | 86,604 | |
| | | | | | | | | | |
Total | | 3,534,612 | | | (1,238,442 | ) | | 2,296,170 | |
| | | | | | | | | | |
| | | |
OPERATING EXPENSES: | | | | | | | | | |
Operating and maintenance: | | | | | | | | | |
Fuel, fuel-related expenses, and gas purchased for resale | | 867,081 | | | (546,413 | ) | | 320,668 | |
Purchased power | | 1,339,986 | | | (232,938 | ) | | 1,107,048 | |
Nuclear refueling outage expenses | | 12,212 | | | - | | | 12,212 | |
Other operation and maintenance | | 548,999 | | | (179,119 | ) | | 369,880 | |
Decommissioning | | 11,728 | | | (173 | ) | | 11,555 | |
Taxes other than income taxes | | 132,489 | | | (50,615 | ) | | 81,874 | |
Depreciation and amortization | | 208,648 | | | (68,172 | ) | | 140,476 | |
Other regulatory charges (credits) – net | | 29,923 | | | (16,808 | ) | | 13,115 | |
| | | | | | | | | | |
Total | | 3,151,066 | | | (1,094,238 | ) | | 2,056,828 | |
| | | | | | | | | | |
| | | |
OPERATING INCOME | | 383,546 | | | (144,204 | ) | | 239,342 | |
| | | | | | | | | | |
| | | |
OTHER INCOME: | | | | | | | | | |
Allowance for equity funds used during construction | | 11,666 | | | (3,295 | ) | | 8,371 | |
Interest and dividend income | | 75,425 | | | 28,715 | | | 104,140 | |
Miscellaneous – net | | 1,724 | | | 600 | | | 2,324 | |
| | | | | | | | | | |
Total | | 88,815 | | | 26,020 | | | 114,835 | |
| | | | | | | | | | |
| | | |
INTEREST AND OTHER CHARGES: | | | | | | | | | |
Interest on long-term debt | | 149,464 | | | (14,231 | ) | | 135,233 | |
Other interest – net | | 13,945 | | | (10,907 | ) | | 3,038 | |
Allowance for borrowed funds used during construction | | (7,528 | ) | | 2,126 | | | (5,402 | ) |
| | | | | | | | | | |
Total | | 155,881 | | | (23,012 | ) | | 132,869 | |
| | | | | | | | | | |
| | | |
INCOME BEFORE INCOME TAXES | | 316,480 | | | (95,172 | ) | | 221,308 | |
Income taxes | | 123,701 | | | (36,249 | ) | | 87,452 | |
| | | | | | | | | | |
| | | |
NET INCOME | | 192,779 | | | (58,923 | ) | | 133,856 | |
Preferred distribution requirements and other | | 3,968 | | | - | | | 3,968 | |
| | | | | | | | | | |
| | | |
EARNINGS APPLICABLE TO COMMON EQUITY | | $ 188,811 | | | $ (58,923 | ) | | $ 129,888 | |
| | | | | | | | | | |
| * | Adjustment to reflect as if the transactions implementing the Entergy Gulf States, Inc. jurisdictional split had occurred as of January 1, 2007. |
65
REG G RECONCILIATIONS
CONSOLIDATED FINANCIAL MEASURES – RECONCILIATION OF GAAP TO NON-GAAP MEASURES
2005-2009
| | | | | | | | | | | | | | |
| ($ millions) | | 2009 | | | 2008 | | | 2007 | | | 2006(a) | | 2005(a) | |
As-Reported Net Income (A) | | 1,231 | | | 1,221 | | | 1,135 | | | 1,133 | | 898 | |
Preferred dividends | | 20 | | | 20 | | | 25 | | | 28 | | 25 | |
Tax-effected interest expense | | 351 | | | 374 | | | 392 | | | 339 | | 293 | |
| | | | | | | | | | | | | | | |
As-Reported Net Income including preferred dividends and tax-effected interest expense (B) | | 1,602 | | | 1,615 | | | 1,552 | | | 1,499 | | 1,217 | |
Special items (C) | | (71 | ) | | (55 | ) | | (32 | ) | | 135 | | (45 | ) |
Operational earnings including preferred dividends and tax-effected interest expense (B-C) | | 1,673 | | | 1,670 | | | 1,584 | | | 1,364 | | 1,262 | |
Operational earnings (A-C) | | 1,302 | | | 1,276 | | | 1,167 | | | 998 | | 943 | |
Average invested capital (D) | | 20,748 | | | 19,927 | | | 18,721 | | | 17,688 | | 16,850 | |
Average common equity (E) | | 8,290 | | | 7,915 | | | 8,030 | | | 7,970 | | 8,020 | |
Operating revenues (F) | | 10,746 | | | 13,094 | | | 11,484 | | | 10,932 | | 10,106 | |
| | | | | |
Gross debt (G) | | 12,014 | | | 12,279 | | | 11,123 | | | 9,356 | | 9,288 | |
Less securitization debt (H) | | 838 | | | 310 | | | 330 | | | - | | - | |
Gross debt, excluding securitization debt (G-H) | | 11,176 | | | 11,969 | | | 10,793 | | | 9,356 | | 9,288 | |
Less cash and cash equivalents (I) | | 1,710 | | | 1,920 | | | 1,254 | | | 1,016 | | 583 | |
Net debt, excluding securitization debt (G-H-I) | | 9,466 | | | 10,049 | | | 9,539 | | | 8,340 | | 8,705 | |
| | | | | |
Total capitalization (J) | | 20,939 | | | 20,557 | | | 19,297 | | | 17,899 | | 17,477 | |
Less securitization debt (K) | | 838 | | | 310 | | | 330 | | | - | | - | |
Total capitalization, excluding securitization debt (J-K) | | 20,101 | | | 20,247 | | | 18,967 | | | 17,899 | | 17,477 | |
Less cash and cash equivalents (L) | | 1,710 | | | 1,920 | | | 1,254 | | | 1,016 | | 583 | |
Net capitalization, excluding securitization debt (J-K-L) | | 18,391 | | | 18,327 | | | 17,713 | | | 16,883 | | 16,894 | |
| | | | | |
Off-balance sheet liabilities (M) | | 646 | | | 574 | | | 658 | | | 665 | | 778 | |
Revolver capacity (N) | | 1,464 | | | 645 | | | 1,730 | | | 2,770 | | 2,545 | |
Gross liquidity (I+N) | | 3,174 | | | 2,565 | | | 2,984 | | | 3,786 | | 3,128 | |
| | | | | |
($ per share) | | | | | | | | | | | | | | |
As-Reported earnings per share (O) | | 6.30 | | | 6.20 | | | 5.60 | | | 5.36 | | 4.19 | |
Operational earnings per share (P) | | 6.67 | | | 6.51 | | | 5.76 | | | 4.72 | | 4.40 | |
Common dividend paid per share (Q) | | 3.00 | | | 3.00 | | | 2.58 | | | 2.16 | | 2.16 | |
Year-end closing market price per share of common stock (R) | | 81.84 | | | 83.13 | | | 119.52 | | | 92.32 | | 68.65 | |
| | | | | |
(%) | | | | | | | | | | | | | | |
Return on average invested capital – As-Reported (B/D) | | 7.7 | | | 8.1 | | | 8.3 | | | 8.5 | | 7.2 | |
Return on average invested capital – Operational ((B-C)/D) | | 8.1 | | | 8.4 | | | 8.5 | | | 7.7 | | 7.5 | |
Return on average common equity – As-Reported (A/E) | | 14.9 | | | 15.4 | | | 14.1 | | | 14.2 | | 11.2 | |
Return on average common equity – Operational ((A-C)/E) | | 15.7 | | | 16.1 | | | 14.5 | | | 12.5 | | 11.8 | |
Net margin – As-Reported (A/F) | | 11.5 | | | 9.3 | | | 9.9 | | | 10.4 | | 8.9 | |
Net margin – Operational ((A-C)/F) | | 12.1 | | | 9.7 | | | 10.2 | | | 9.1 | | 9.3 | |
Debt to capital ratio (G/J) | | 57.4 | | | 59.7 | | | 57.6 | | | 52.3 | | 53.1 | |
Debt to capital ratio, excluding securitization debt ((G-H)/(J-K)) | | 55.6 | | | 59.1 | | | 56.9 | | | 52.3 | | 53.1 | |
Net debt to net capital ratio, excluding securitization debt ((G-H-I)/(J-K-L)) | | 51.5 | | | 54.8 | | | 53.9 | | | 49.4 | | 51.5 | |
Net debt to net capital ratio including off-balance sheet liabilities, excluding securitization debt ((G-H-I+M)/(J-K-L+M)) | | 53.1 | | | 56.2 | | | 55.5 | | | 51.3 | | 53.7 | |
| | | | | |
Common dividend payout ratio – As-Reported (Q/O) | | 48 | | | 48 | | | 46 | | | 40 | | 52 | |
Common dividend payout ratio – Operational (Q/P) | | 45 | | | 46 | | | 45 | | | 46 | | 49 | |
| | | | | |
(ratio) | | | | | | | | | | | | | | |
Price to earnings ratio – As-Reported (R/O) | | 12.99 | | | 13.41 | | | 21.34 | | | 17.24 | | 16.39 | |
Price to earnings ratio – Operational (R/P) | | 12.27 | | | 12.77 | | | 20.75 | | | 19.56 | | 15.61 | |
| | | | | | | | | | | | | | | |
| (a) | 2006 and 2005 reflect deconsolidation of Entergy New Orleans, Inc. |
Calculations may differ due to rounding.
66
REG G RECONCILIATIONS
CONSOLIDATED FINANCIAL MEASURES – RECONCILIATION OF GAAP TO NON-GAAP MEASURES
1Q08-4Q09
| | | | | | | | | | | | | | | | | | | | | | | | |
| ($ millions) | | 1Q09 | | | 2Q09 | | | 3Q09 | | | 4Q09 | | | 1Q08 | | | 2Q08 | | | 3Q08 | | | 4Q08 | |
For the quarter: | | | | | | | | | | | | | | | | | | | | | | | | |
As-Reported Net Income (A) | | 235.3 | | | 226.8 | | | 455.2 | | | 313.8 | | | 308.7 | | | 271.0 | | | 470.3 | | | 170.6 | |
Less special items (B) | | (17.2 | ) | | (17.2 | ) | | (15.5 | ) | | (21.1 | ) | | - | | | (18.3 | ) | | (17.1 | ) | | (20.1 | ) |
| | | | | | | | | | | | | | | | | | | | | | | | | |
Operational earnings (A-B) | | 252.5 | | | 244.0 | | | 470.7 | | | 334.9 | | | 308.7 | | | 289.2 | | | 487.3 | | | 190.7 | |
| | | | | | | | |
As-Reported Net Income rolling 12 months (C) | | 1,147 | | | 1,103 | | | 1,088 | | | 1,231 | | | 1,231 | | | 1,235 | | | 1,244 | | | 1,221 | |
Preferred dividends | | 20 | | | 20 | | | 20 | | | 20 | | | 24 | | | 23 | | | 21 | | | 20 | |
Tax-effected interest expense | | 366 | | | 368 | | | 361 | | | 351 | | | 396 | | | 390 | | | 375 | | | 374 | |
| | | | | | | | | | | | | | | | | | | | | | | | | |
As-Reported Net Income, rolling 12 months including preferred dividends and tax-effected interest expense (D) | | 1,533 | | | 1,491 | | | 1,469 | | | 1,602 | | | 1,651 | | | 1,648 | | | 1,640 | | | 1,615 | |
| | | | | | | | |
Special items in prior quarters | | (55 | ) | | (54 | ) | | (54 | ) | | (49 | ) | | (32 | ) | | (32 | ) | | (50 | ) | | (35 | ) |
| | | | | | | | |
Special items 1Q08 through 4Q09 | | | | | | | | | | | | | | | | | | | | | | | | |
Utility/Parent/Other | | | | | | | | | | | | | | | | | | | | | | | | |
Non-utility nuclear spin-off expenses | | (11 | ) | | (2 | ) | | (5 | ) | | (9 | ) | | - | | | (18 | ) | | (17 | ) | | (20 | ) |
Entergy Nuclear | | | | | | | | | | | | | | | | | | | | | | | | |
Non-utility nuclear spin-off dis-synergies | | (7 | ) | | (15 | ) | | (10 | ) | | (12 | ) | | - | | | - | | | - | | | - | |
Total special items (E) | | (72 | ) | | (71 | ) | | (69 | ) | | (71 | ) | | (32 | ) | | (50 | ) | | (67 | ) | | (55 | ) |
| | | | | | | | |
Operational earnings, rolling 12 months including preferred dividends and tax-effected interest expense (D-E) | | 1,605 | | | 1,562 | | | 1,538 | | | 1,673 | | | 1,683 | | | 1,698 | | | 1,707 | | | 1,670 | |
Operational earnings, rolling 12 months (C-E) | | 1,219 | | | 1,174 | | | 1,157 | | | 1,302 | | | 1,263 | | | 1,285 | | | 1,311 | | | 1,276 | |
Average invested capital (F) | | 20,126 | | | 19,995 | | | 20,629 | | | 20,748 | | | 18,790 | | | 19,244 | | | 20,236 | | | 19,927 | |
Average common equity (G) | | 8,152 | | | 8,045 | | | 8,230 | | | 8,290 | | | 7,756 | | | 7,555 | | | 7,973 | | | 7,915 | |
Operating revenues, rolling 12 months (H) | | 13,018 | | | 12,275 | | | 11,248 | | | 10,746 | | | 11,655 | | | 12,150 | | | 12,825 | | | 13,094 | |
| | | | | | | | |
Gross debt (I) | | 12,034 | | | 11,510 | | | 11,522 | | | 12,014 | | | 11,292 | | | 11,768 | | | 12,656 | | | 12,279 | |
Less securitization debt (J) | | 310 | | | 301 | | | 301 | | | 838 | | | 329 | | | 318 | | | 318 | | | 310 | |
Gross debt, excluding securitization debt (I-J) | | 11,724 | | | 11,209 | | | 11,221 | | | 11,176 | | | 10,963 | | | 11,450 | | | 12,338 | | | 11,969 | |
Less cash and cash equivalents (K) | | 1,803 | | | 1,281 | | | 1,131 | | | 1,710 | | | 916 | | | 1,086 | | | 2,556 | | | 1,920 | |
Net debt, excluding securitization debt (I-J-K) | | 9,921 | | | 9,928 | | | 10,090 | | | 9,466 | | | 10,047 | | | 10,364 | | | 9,782 | | | 10,049 | |
| | | | | | | | |
Total capitalization (L) | | 20,975 | | | 20,588 | | | 20,315 | | | 20,939 | | | 19,276 | | | 19,401 | | | 20,944 | | | 20,557 | |
Less securitization debt (M) | | 310 | | | 301 | | | 301 | | | 838 | | | 329 | | | 318 | | | 318 | | | 310 | |
Total capitalization, excluding securitization debt (L-M) | | 20,665 | | | 20,287 | | | 20,014 | | | 20,101 | | | 18,947 | | | 19,083 | | | 20,626 | | | 20,247 | |
Less cash and cash equivalents (N) | | 1,803 | | | 1,281 | | | 1,131 | | | 1,710 | | | 916 | | | 1,086 | | | 2,556 | | | 1,920 | |
Net capitalization, excluding securitization debt (L-M-N) | | 18,862 | | | 19,006 | | | 18,883 | | | 18,391 | | | 18,031 | | | 17,997 | | | 18,070 | | | 18,327 | |
| | | | | | | | |
Off-balance sheet liabilities (O) | | 573 | | | 569 | | | 567 | | | 646 | | | 642 | | | 638 | | | 637 | | | 574 | |
Revolver capacity (P) | | 725 | | | 1,585 | | | 1,647 | | | 1,464 | | | 1,503 | | | 826 | | | 374 | | | 645 | |
Gross liquidity (K+P) | | 2,528 | | | 2,866 | | | 2,778 | | | 3,174 | | | 2,419 | | | 1,912 | | | 2,930 | | | 2,565 | |
| | | | | | | | |
(%) | | | | | | | | | | | | | | | | | | | | | | | | |
Return on average invested capital –
As-Reported (D/F) | | 7.6 | | | 7.5 | | | 7.1 | | | 7.7 | | | 8.8 | | | 8.6 | | | 8.1 | | | 8.1 | |
Return on average invested capital –
Operational ((D-E)/F) | | 8.0 | | | 7.8 | | | 7.5 | | | 8.1 | | | 9.0 | | | 8.8 | | | 8.4 | | | 8.4 | |
Return on average common equity –
As-Reported (C/G) | | 14.1 | | | 13.7 | | | 13.2 | | | 14.9 | | | 15.9 | | | 16.3 | | | 15.6 | | | 15.4 | |
Return on average common equity –
Operational ((C-E)/G) | | 15.0 | | | 14.6 | | | 14.1 | | | 15.7 | | | 16.3 | | | 17.0 | | | 16.4 | | | 16.1 | |
Net margin – As-Reported (C/H) | | 8.8 | | | 9.0 | | | 9.7 | | | 11.5 | | | 10.6 | | | 10.2 | | | 9.7 | | | 9.3 | |
Net margin – Operational ((C-E)/H) | | 9.4 | | | 9.6 | | | 10.3 | | | 12.1 | | | 10.8 | | | 10.6 | | | 10.2 | | | 9.7 | |
Debt to capital ratio (I/L) | | 57.4 | | | 55.9 | | | 56.7 | | | 57.4 | | | 58.6 | | | 60.7 | | | 60.4 | | | 59.7 | |
Debt to capital ratio, excluding securitization debt ((I-J)/(L-M)) | | 56.7 | | | 55.3 | | | 56.1 | | | 55.6 | | | 57.9 | | | 60.0 | | | 59.8 | | | 59.1 | |
Net debt to net capital ratio,
excluding securitization debt ((I-J-K)/(L-M-N)) | | 52.6 | | | 52.2 | | | 53.4 | | | 51.5 | | | 55.7 | | | 57.6 | | | 54.1 | | | 54.8 | |
Net debt to net capital including off-balance
sheet liabilities, excluding securitization debt
((I-J-K+O)/(L-M-N+O)) | | 54.0 | | | 53.6 | | | 54.8 | | | 53.1 | | | 57.2 | | | 59.0 | | | 55.7 | | | 56.2 | |
| | | | | | | | | | | | | | | | | | | | | | | | | |
Calculations may differ due to rounding.
67
REG G RECONCILIATIONS
UTILITY FINANCIAL MEASURES – RECONCILIATION OF GAAP TO NON-GAAP MEASURES
2005-2009
| | | | | | | | | | | | |
| ($ millions) | | 2009 | | | 2008 | | 2007 | | | 2006(a) | | 2005(a) |
As-Reported Net Income (A) | | 691.6 | | | 587.8 | | 682.7 | | | 691.2 | | 659.8 |
Preferred dividends | | 17.3 | | | 17.3 | | 21.7 | | | 24.4 | | 22.0 |
Tax-effected interest expense | | 284.3 | | | 261.6 | | 259.8 | | | 246.8 | | 224.0 |
| | | | | | | | | | | | | |
As-Reported Net Income including preferred dividends and tax-effected interest expense (B) | | 993.3 | | | 866.7 | | 964.2 | | | 962.3 | | 905.8 |
| | | | | |
Utility special items | | | | | | | | | | | | |
Nuclear alignment | | - | | | - | | (13.7 | ) | | - | | - |
ENOI Results | | - | | | - | | - | | | 4.1 | | - |
Total special items (C) | | - | | | - | | (13.7 | ) | | 4.1 | | - |
| | | | | |
Operational earnings including preferred dividends and tax-effected interest expense (B-C) | | 993.3 | | | 866.7 | | 977.9 | | | 958.2 | | 905.8 |
Operational earnings (A-C) | | 691.6 | | | 587.8 | | 696.4 | | | 687.1 | | 659.8 |
Average invested capital (D) | | 15,580 | | | 14,441 | | 13,903 | | | 13,254 | | 12,738 |
Average common equity (E) | | 6,828 | | | 6,618 | | 6,440 | | | 6,132 | | 5,786 |
| | | | | |
Gross debt (F) | | 9,107 | | | 7,836 | | 7,249 | | | 6,786 | | 6,990 |
Less securitization debt (G) | | 838 | | | 310 | | 330 | | | - | | - |
Gross debt, excluding securitization debt (F-G) | | 8,269 | | | 7,526 | | 6,919 | | | 6,786 | | 6,990 |
Less cash and cash equivalents (H) | | 1,239 | | | 566 | | 801 | | | 564 | | 301 |
Net debt, excluding securitization debt (F-G-H) | | 7,030 | | | 6,960 | | 6,118 | | | 6,222 | | 6,689 |
| | | | | |
Total capitalization (I) | | 16,367 | | | 14,794 | | 14,088 | | | 13,266 | | 13,502 |
Less securitization debt (J) | | 838 | | | 310 | | 330 | | | - | | - |
Total capitalization, excluding securitization debt (I-J) | | 15,529 | | | 14,484 | | 13,758 | | | 13,266 | | 13,502 |
Less cash and cash equivalents (K) | | 1,239 | | | 566 | | 801 | | | 564 | | 301 |
Net capitalization, excluding securitization debt (I-J-K) | | 14,290 | | | 13,918 | | 12,957 | | | 12,702 | | 13,201 |
| | | | | |
(%) | | | | | | | | | | | | |
Return on average invested capital – As-Reported (B/D) | | 6.4 | | | 6.0 | | 6.9 | | | 7.2 | | 7.1 |
Return on average invested capital – Operational ((B-C)/D) | | 6.4 | | | 6.0 | | 7.0 | | | 7.2 | | 7.1 |
Return on average common equity – As-Reported (A/E) | | 10.1 | | | 8.9 | | 10.6 | | | 11.3 | | 11.4 |
Return on average common equity – Operational ((A-C)/E) | | 10.1 | | | 8.9 | | 10.8 | | | 11.2 | | 11.4 |
Debt to capital ratio (F/I) | | 55.6 | | | 53.0 | | 51.5 | | | 51.3 | | 51.8 |
Debt to capital ratio, excluding securitization debt ((F-G)/(I-J)) | | 53.2 | | | 52.0 | | 50.3 | | | 51.3 | | 51.8 |
Net debt to net capital ratio, excluding securitization debt ((F-G-H)/(I-J-K)) | | 49.2 | | | 50.0 | | 47.2 | | | 49.1 | | 50.7 |
| | | | | | | | | | | | | |
| (a) | 2006 and 2005 reflect deconsolidation of Entergy New Orleans, Inc. |
Calculations may differ due to rounding.
68
REG G RECONCILIATIONS
UTILITY FINANCIAL MEASURES – RECONCILIATION OF GAAP TO NON-GAAP MEASURES
1Q08-4Q09
| | | | | | | | | | | | | | | | | | | |
| ($ millions) | | 1Q09 | | 2Q09 | | 3Q09 | | 4Q09 | | 1Q08 | | | 2Q08 | | | 3Q08 | | | 4Q08 |
As-Reported Net Income (A) | | 111.6 | | 147.2 | | 294.8 | | 137.9 | | 117.1 | | | 159.7 | | | 257.8 | | | 53.2 |
Less special items (B) | | - | | - | | - | | - | | - | | | - | | | - | | | - |
| | | | | | | | | | | | | | | | | | | | |
Operational earnings (A-B) | | 111.6 | | 147.2 | | 294.8 | | 137.9 | | 117.1 | | | 159.7 | | | 257.8 | | | 53.2 |
| | | | | | | | |
As-Reported Net Income-rolling 12 months (C) | | 582.3 | | 569.9 | | 606.8 | | 691.6 | | 695.4 | | | 706.9 | | | 631.6 | | | 587.8 |
Preferred dividends | | 17.3 | | 17.3 | | 17.3 | | 17.3 | | 20.7 | | | 19.6 | | | 18.4 | | | 17.3 |
Tax-effected interest expense | | 265.0 | | 273.7 | | 278.7 | | 284.3 | | 257.1 | | | 257.2 | | | 251.6 | | | 261.6 |
| | | | | | | | | | | | | | | | | | | | |
As-Reported Net Income, rolling 12 months including preferred dividends and tax-effected interest expense (D) | | 864.6 | | 860.9 | | 902.8 | | 993.3 | | 973.2 | | | 983.7 | | | 901.6 | | | 866.7 |
| | | | | | | | |
Special items in prior quarters | | - | | - | | - | | - | | (13.7 | ) | | (13.7 | ) | | (13.7 | ) | | - |
Special items 1Q08 through 4Q09 | | - | | - | | - | | - | | - | | | - | | | - | | | - |
Total special items (E) | | - | | - | | - | | - | | (13.7 | ) | | (13.7 | ) | | (13.7 | ) | | - |
| | | | | | | | |
Operational earnings, rolling 12 months including preferred dividends and tax-effected interest expense (D-E) | | 864.6 | | 860.9 | | 902.8 | | 993.3 | | 986.8 | | | 997.4 | | | 915.3 | | | 866.7 |
Operational earnings, rolling 12 months (C-E) | | 582.3 | | 569.9 | | 606.8 | | 691.6 | | 709.1 | | | 720.6 | | | 645.3 | | | 587.8 |
Average invested capital (F) | | 14,500 | | 14,835 | | 15,391 | | 15,580 | | 13,813 | | | 14,157 | | | 14,707 | | | 14,441 |
Average common equity (G) | | 6,609 | | 6,718 | | 6,931 | | 6,828 | | 6,407 | | | 6,509 | | | 6,692 | | | 6,618 |
| | | | | | | | |
Gross debt (H) | | 7,943 | | 8,216 | | 8,289 | | 9,107 | | 7,278 | | | 7,457 | | | 8,069 | | | 7,836 |
Less securitization debt (I) | | 310 | | 301 | | 301 | | 838 | | 329 | | | 318 | | | 318 | | | 310 |
Gross debt, excluding securitization debt (H-I) | | 7,633 | | 7,915 | | 7,988 | | 8,269 | | 6,949 | | | 7,139 | | | 7,751 | | | 7,526 |
Less cash and cash equivalents (J) | | 490 | | 621 | | 881 | | 1,239 | | 284 | | | 330 | | | 740 | | | 566 |
Net debt, excluding securitization debt (H-I-J) | | 7,143 | | 7,294 | | 7,107 | | 7,030 | | 6,665 | | | 6,809 | | | 7,011 | | | 6,960 |
| | | | | | | | |
Total capitalization (K) | | 14,980 | | 15,355 | | 15,599 | | 16,367 | | 14,020 | | | 14,314 | | | 15,183 | | | 14,794 |
Less securitization debt (L) | | 310 | | 301 | | 301 | | 838 | | 329 | | | 318 | | | 318 | | | 310 |
Total capitalization, excluding securitization debt (K-L) | | 14,670 | | 15,054 | | 15,298 | | 15,529 | | 13,691 | | | 13,996 | | | 14,865 | | | 14,484 |
Less cash and cash equivalents (M) | | 490 | | 621 | | 881 | | 1,239 | | 284 | | | 330 | | | 740 | | | 566 |
Net capitalization, excluding securitization debt (K-L-M) | | 14,180 | | 14,433 | | 14,417 | | 14,290 | | 13,407 | | | 13,666 | | | 14,125 | | | 13,918 |
| | | | | | | | |
(%) | | | | | | | | | | | | | | | | | | | |
Return on average invested capital – As-Reported (D/F) | | 6.0 | | 5.8 | | 5.9 | | 6.4 | | 7.0 | | | 6.9 | | | 6.1 | | | 6.0 |
Return on average invested capital – Operational ((D-E)/F) | | 6.0 | | 5.8 | | 5.9 | | 6.4 | | 7.1 | | | 7.0 | | | 6.2 | | | 6.0 |
Return on average common equity – As-Reported (C/G) | | 8.8 | | 8.5 | | 8.8 | | 10.1 | | 10.9 | | | 10.9 | | | 9.4 | | | 8.9 |
Return on average common equity – Operational ((C-E)/G) | | 8.8 | | 8.5 | | 8.8 | | 10.1 | | 11.1 | | | 11.1 | | | 9.6 | | | 8.9 |
Debt to capital ratio (H/K) | | 53.0 | | 53.5 | | 53.1 | | 55.6 | | 51.9 | | | 52.1 | | | 53.1 | | | 53.0 |
Debt to capital ratio, excluding securitization debt ((H-I)/(K-L)) | | 52.0 | | 52.6 | | 52.2 | | 53.2 | | 50.8 | | | 51.0 | | | 52.1 | | | 52.0 |
Net debt to net capital ratio, excluding securitization debt ((H-I-J)/(K-L-M)) | | 50.4 | | 50.5 | | 49.3 | | 49.2 | | 49.7 | | | 49.8 | | | 49.6 | | | 50.0 |
| | | | | | | | | | | | | | | | | | | | |
Calculations may differ due to rounding.
69
REG G RECONCILIATIONS
ENTERGY ARKANSAS FINANCIAL MEASURES – RECONCILIATION OF GAAP TO NON-GAAP MEASURES
2005-2009
| | | | | | | | | | | | |
| ($ millions) | | 2009 | | | 2008 | | 2007 | | | 2006 | | 2005 |
As-Reported Earnings (A) | | 60.0 | | | 40.3 | | 132.2 | | | 165.6 | | 166.9 |
Preferred dividends | | 6.9 | | | 6.9 | | 6.9 | | | 7.6 | | 7.8 |
Tax-effected interest expense | | 54.9 | | | 52.0 | | 53.4 | | | 50.8 | | 47.1 |
| | | | | | | | | | | | | |
As-Reported Earnings including preferred dividends and tax-effected interest expense (B) | | 121.8 | | | 99.2 | | 192.5 | | | 224.0 | | 221.8 |
| | | | | |
Special items | | | | | | | | | | | | |
Nuclear Alignment | | - | | | - | | (5.9 | ) | | - | | - |
Total special items (C) | | - | | | - | | (5.9 | ) | | - | | - |
| | | | | |
Operational earnings including preferred dividends and tax-effected interest expense (B-C) | | 121.8 | | | 99.2 | | 198.4 | | | 224.0 | | 221.8 |
Operational earnings (A-C) | | 60.0 | | | 40.3 | | 138.1 | | | 165.6 | | 166.9 |
Average invested capital (D) | | 3,291 | | | 3,102 | | 2,965 | | | 2,967 | | 2,920 |
Average common equity (E) | | 1,406 | | | 1,392 | | 1,409 | | | 1,432 | | 1,378 |
| | | | | |
Gross debt (F) | | 1,793 | | | 1,745 | | 1,442 | | | 1,436 | | 1,400 |
Less cash and cash equivalents (G) | | 86 | | | 40 | | 0.2 | | | 35 | | 9 |
Net debt (F-G) | | 1,707 | | | 1,705 | | 1,441 | | | 1,401 | | 1,391 |
| | | | | |
Total capitalization (H) | | 3,321 | | | 3,261 | | 2,942 | | | 2,987 | | 2,946 |
Less cash and cash equivalents (I) | | 86 | | | 40 | | 0.2 | | | 35 | | 9 |
Net capitalization (H-I) | | 3,235 | | | 3,221 | | 2,942 | | | 2,952 | | 2,937 |
| | | | | |
(%) | | | | | | | | | | | | |
Return on average invested capital – As-Reported (B/D) | | 3.7 | | | 3.2 | | 6.5 | | | 7.6 | | 7.6 |
Return on average invested capital – Operational ((B-C)/D) | | 3.7 | | | 3.2 | | 6.7 | | | 7.6 | | 7.6 |
Return on average common equity – As-Reported (A/E) | | 4.3 | | | 2.9 | | 9.4 | | | 11.6 | | 12.1 |
Return on average common equity – Operational ((A-C)/E) | | 4.3 | | | 2.9 | | 9.8 | | | 11.6 | | 12.1 |
Debt to capital ratio (F/H) | | 54.0 | | | 53.5 | | 49.0 | | | 48.1 | | 47.5 |
Net debt to net capital ratio ((F-G)/(H-I)) | | 52.8 | | | 52.9 | | 49.0 | | | 47.5 | | 47.4 |
| | | | | | | | | | | | | |
ENTERGY GULF STATES FINANCIAL MEASURES – RECONCILIATION OF GAAP TO NON-GAAP MEASURES
2005-2006
| | | | |
| ($ millions) | | 2006 | | 2005 |
As-Reported Earnings (A) | | 208.0 | | 202.3 |
Preferred dividends | | 4.0 | | 4.2 |
Tax-effected interest expense | | 88.0 | | 71.2 |
| | | | | |
As-Reported Earnings including preferred dividends and tax-effected interest expense (B) | | 300.0 | | 277.7 |
| | |
Special items | | - | | - |
| | |
Total special items (C) | | - | | - |
| | |
Operational earnings including preferred dividends and tax-effected interest expense (B-C) | | 300.0 | | 277.7 |
Operational earnings (A-C) | | 208.0 | | 202.3 |
Average invested capital (D) | | 4,699 | | 4,304 |
Average common equity (E) | | 2,217 | | 2,005 |
| | |
Gross debt (F) | | 2,442 | | 2,426 |
Less cash and cash equivalents (G) | | 180 | | 25 |
Net debt (F-G) | | 2,262 | | 2,401 |
| | |
Total capitalization (H) | | 4,695 | | 4,697 |
Less cash and cash equivalents (I) | | 180 | | 25 |
Net capitalization (H-I) | | 4,515 | | 4,672 |
| | |
(%) | | | | |
Return on average invested capital – As-Reported (B/D) | | 6.4 | | 6.5 |
Return on average invested capital – Operational ((B-C)/D) | | 6.4 | | 6.5 |
Return on average common equity – As-Reported (A/E) | | 9.4 | | 10.1 |
Return on average common equity – Operational ((A-C)/E) | | 9.4 | | 10.1 |
Debt to capital ratio (F/H) | | 52.0 | | 51.7 |
Net debt to net capital ratio ((F-G)/(H-I)) | | 50.1 | | 51.4 |
| | | | | |
Calculations may differ due to rounding.
70
REG G RECONCILIATIONS
ENTERGY GULF STATES LOUISIANA FINANCIAL MEASURES – RECONCILIATION OF GAAP TO NON-GAAP MEASURES
2007-2009
| | | | | | | | | | | | | |
| ($ millions) | | 2009 | | | 2008 | | | 2007 | | | 2006 | | 2005 |
As-Reported Earnings (A) | | 152.2 | | | 143.9 | | | 129.9 | (a) | | REFER TO PAGE 70 |
Preferred dividends | | 0.8 | | | 0.8 | | | 4.0 | (a) | |
Tax-effected interest expense | | 70.7 | | | 78.1 | | | 81.8 | (a) | |
| | | | | | | | | | | |
As-Reported Earnings including preferred dividends and tax-effected interest expense (B) | | 223.8 | | | 222.8 | | | 215.7 | | |
Special items | | | | | | | | | | |
Nuclear Alignment | | - | | | - | | | (3.6 | ) | |
Total special items (C) | | - | | | - | | | (3.6 | ) | |
Operational earnings including preferred dividends and tax-effected interest expense (B-C) | | 223.8 | | | 222.8 | | | 219.3 | | |
Operational earnings (A-C) | | 152.2 | | | 143.9 | | | 133.5 | | |
Average invested capital (D) | | 3,372 | | | 3,640 | | | 3,186 | | |
Average common equity (E) | | 1,377 | | | 1,306 | | | 1,254 | (b) | |
Gross debt (F) | | 1,615 | (b) | | 1,418 | (b) | | 1,381 | (b) | |
Less cash and cash equivalents (G) | | 144 | | | 49 | | | 108 | | |
Net debt (F-G) | | 1,471 | | | 1,369 | | | 1,273 | | |
Total capitalization (H) | | 3,057 | (b) | | 2,750 | (b) | | 2,681 | (b) | |
Less cash and cash equivalents (I) | | 144 | | | 49 | | | 108 | | |
Net capitalization (H-I) | | 2,913 | | | 2,701 | | | 2,573 | | |
(%) | | | | | | | | | | |
Return on average invested capital – As-Reported (B/D) | | 6.6 | | | 6.1 | | | 6.8 | | |
Return on average invested capital – Operational ((B-C)/D) | | 7.7 | (b) | | 8.2 | (b) | | 8.3 | (b) | |
Return on average common equity – As-Reported (A/E) | | 11.1 | | | 11.0 | | | 10.4 | | |
Return on average common equity – Operational ((A-C)/E) | | 11.1 | | | 11.0 | | | 10.6 | | |
Debt to capital ratio (F/H) | | 52.8 | (b) | | 51.6 | (b) | | 51.5 | (b) | |
Net debt to net capital ratio ((F-G)/(H-I)) | | 50.5 | (b) | | 50.7 | (b) | | 49.5 | (b) | |
| | | | | | | | | | | |
ENTERGY TEXAS – RECONCILIATION OF GAAP TO NON-GAAP MEASURES 2007-2009 |
| ($ millions) | | 2009 | | | 2008 | | | 2007 | | | 2006 | | 2005 |
As-Reported Net Income (A) | | 63.8 | | | 57.9 | | | 58.9 | | | REFER TO PAGE 70 |
Preferred dividends | | - | | | - | | | - | | |
Tax-effected interest expense | | 63.9 | | | 48.0 | | | 51.2 | | |
| | | | | | | | | | | |
As-Reported Net Income including preferred dividends and tax-effected interest expense (B) | | 127.7 | | | 105.9 | | | 110.1 | | |
Special items | | | | | | | | | | |
| | - | | | - | | | - | | |
Total special items (C) | | - | | | - | | | - | | |
Operational earnings including preferred dividends and tax-effected interest expense (B-C) | | 127.7 | | | 105.9 | | | 110.1 | | |
Operational earnings (A-C) | | 63.8 | | | 57.9 | | | 58.9 | | |
Average invested capital (D) | | 2,374 | | | 2,331 | | | 2,245 | | |
Average common equity (E) | | 872 | | | 952 | | | 996 | | |
Gross debt, excluding securitization debt (F) | | 820 | (b) | | 1,035 | (b) | | 1,083 | (b) | |
Less cash and cash equivalents (G) | | 201 | | | 2 | | | 297 | | |
Net debt, excluding securitization debt (F-G) | | 619 | | | 1,033 | | | 786 | | |
Total capitalization, excluding securitization debt (H) | | 1,664 | (b) | | 1,935 | (b) | | 1,937 | (b) | |
Less cash and cash equivalents (I) | | 201 | | | 2 | | | 297 | | |
Net capitalization, excluding securitization debt (H-I) | | 1,463 | | | 1,933 | | | 1,640 | | |
(%) | | | | | | | | | | |
Return on average invested capital – As-Reported (B/D) | | 5.4 | | | 4.5 | | | 4.9 | | |
Return on average invested capital – Operational ((B-C)/D) | | 7.1 | (b) | | 5.5 | (b) | | 5.7 | (b) | |
Return on average common equity – As-Reported (A/E) | | 7.3 | | | 6.1 | | | 5.9 | | |
Return on average common equity – Operational ((A-C)/E) | | 7.3 | | | 6.6 | (b) | | 7.0 | (b) | |
Debt to capital ratio, excluding securitization debt (F/H) | | 49.3 | (b) | | 53.5 | (b) | | 55.9 | (b) | |
Net debt to net capital ratio, excluding securitization debt ((F-G)/(H-I)) | | 42.3 | (b) | | 53.4 | (b) | | 47.9 | (b) | |
| | | | | | | | | | | |
| (a) | See page 65 for the Pro Forma EGSL Income Statement. |
| (b) | See page 72 for adjusted calculations. |
Calculations may differ due to rounding.
Page 71
REG G RECONCILIATIONS
ENTERGY GULF STATES AND ENTERGY TEXAS FINANCIAL MEASURES – RECONCILIATION OF GAAP TO NON-GAAP MEASURES
| | | | | | | | | | | | | | | | | | |
EGSL PRO FORMA AVERAGE COMMON EQUITY 2007 | | | | | | | | | (D) | | | (E) | | | (D-E) | |
| ($ millions) | | | | | | | | | | | EGSI
2006
PER 10-K | | | ADJUSTMENTS | | | EGSL 2006 PRO FORMA | |
Shareholders Equity: | | | | | | | | | | | | | | | | | | |
Preferred membership interests without sinking fund (A) | | | | | | | | | | | 47 | | | (1 | ) | | 48 | |
Members’ equity | | | | | | | | | | | 2,225 | | | 988 | | | 1,238 | |
Accumulated other comprehensive loss | | | | | | | | | | | (20 | ) | | - | | | (20 | ) |
| | | | | | | | | | | | | | | | | | | |
Total Equity (B) | | | | | | | | | | | 2,253 | | | 987 | | | 1,266 | |
| | | | | | | |
2006 Pro Forma Total Common Equity (B–A) | | | | | | | | | | | | | | | | | 1,218 | |
2007 Total Common Equity (C) | | | | | | | | | | | | | | | | | 1,290 | |
2007 Average Common Equity ((C)+(B–A))/2 | | | | | | | | | | | | | | | | | 1,254 | |
| | | | | | | | | | | | | | | | | | | |
| | | | |
EGSL/ETI AVERAGE INVESTED CAPITAL
AND RETURN ON AVERAGE INVESTED
CAPITAL | | 2009 | | | 2008 | | | | | 2007 PRO FORMA | |
| ($ millions) | | ETI | | EGSL | | | ETI | | EGSL | | | | | ETI | | | EGSL | |
As-Reported Net Income (A) | | 63.8 | | 152.2 | | | 57.9 | | 143.9 | | | | | 58.9 | | | 129.9 | (a) |
Preferred dividends | | - | | 0.8 | | | - | | 0.8 | | | | | - | | | 4.0 | (a) |
Tax-effected interest expense | | 63.9 | | 70.7 | | | 48.0 | | 78.1 | | | | | 51.2 | | | 81.8 | (a) |
| | | | | | | | | | | | | | | | | | | |
As-Reported Net Income including preferred dividends and tax-effected interest expense (B) | | 127.7 | | 223.8 | | | 105.9 | | 222.8 | | | | | 110.1 | | | 215.7 | |
Total Special Items (C) | | - | | - | | | - | | - | | | | | - | | | (3.6 | ) |
| | | | | | | | | | | | | | | | | | | |
Operational earnings including preferred dividends and tax-effected interest expense (B-C) | | 127.7 | | 223.8 | | | 105.9 | | 222.8 | | | | | 110.1 | | | 219.3 | |
| | | | | | | |
Average Invested Capital (D) | | 2,374 | | 3,372 | | | 2,331 | | 3,640 | | | | | 2,245 | | | 3,186 | |
Less Average Securitization Debt (E) | | 574 | | - | | | 320 | | - | | | | | 165 | | | - | |
Less Average Equity Infusion from Parent (F) | | - | | - | | | 75 | | - | | | | | 150 | | | - | |
Less Average Assumption Debt (G) | | - | | 469 | | | - | | 925 | | | | | - | | | 540 | |
| | | | | | | | | | | | | | | | | | | |
Adjusted Average Invested Capital (D-E-F-G) | | 1,799 | | 2,904 | | | 1,936 | | 2,715 | | | | | 1,931 | | | 2,646 | |
| | | | | | | |
ROIC – As-Reported (B/D) | | 5.4% | | 6.6% | | | 4.5% | | 6.1% | | | | | 4.9% | | | 6.8% | |
ROIC – Operational ((B-C)/(D-E-F-G) | | 7.1% | | 7.7% | | | 5.5% | | 8.2% | | | | | 5.7% | | | 8.3% | |
| | | | | | | | | | | | | | | | | | | |
| | |
| ETI AVERAGE COMMON EQUITY AND RETURN ON AVERAGE COMMON EQUITY | | | | | | | |
| ($ millions) | | | | | | | | | | | 2009 | | | 2008 | | | 2007 PRO FORMA | |
As-Reported Net Income (A) | | | | | | | | | | | 63.8 | | | 57.9 | | | 58.9 | |
Total Special Items (B) | | | | | | | | | | | - | | | - | | | - | |
| | | | | | | | | | | | | | | | | | |
Operational Earnings (A–B) | | | | | | | | | | | 63.8 | | | 57.9 | | | 58.9 | |
| | | | | | | |
Average Common Equity (C) | | | | | | | | | | | 872.3 | | | 952.2 | | | 996.1 | |
Less Average Equity Infusion from Parent | | | | | | | | | | | - | | | 75.0 | | | 150.0 | |
| | | | | | | | | | | | | | | | | | | |
Adjusted Average Common Equity (D) | | | | | | | | | | | 872.3 | | | 877.2 | | | 846.1 | |
| | | | | | | |
ROE – As-Reported (A/C) | | | | | | | | | | | 7.3% | | | 6.1% | | | 5.9% | |
ROE – Operational ((A–B)/D) | | | | | | | | | | | 7.3% | | | 6.6% | | | 7.0% | |
| | | | | | | | | | | | | | | | | | | |
| | | | |
| EGSL/ETI DEBT TO CAPITAL RATIO | | 2009 | | | 2008 | | | | | 2007 PRO FORMA | |
| ($ millions) | | ETI | | EGSL | | | ETI | | EGSL | | | | | ETI | | | EGSL | |
Currently maturing long-term debt | | 168 | | 12 | | | 101 | | 220 | | | | | 309 | | | 675 | |
Notes Payable | | - | | - | | | 160 | | - | | | | | - | | | - | |
Obligations under capital leases – current | | - | | 30 | | | - | | 24 | | | | | - | | | 29 | |
Obligations under capital leases – non-current | | - | | 126 | | | - | | 116 | | | | | - | | | 82 | |
Long-term debt | | 1,490 | | 1,614 | | | 1,084 | | 1,828 | | | | | 1,104 | | | 1,674 | |
| | | | | | | | | | | | | | | | | | | |
Total debt before adjustments (A) | | 1,658 | | 1,783 | | | 1,345 | | 2,188 | | | | | 1,413 | | | 2,460 | |
Less debt assumption by ETI (EGSL) (B) | | - | | 168 | | | - | | 770 | | | | | - | | | 1,079 | |
Less securitization debt (ETI) (C) | | 838 | | - | | | 310 | | - | | | | | 330 | | | - | |
| | | | | | | | | | | | | | | | | | | |
Adjusted total debt (A-B-C) | | 820 | | 1,615 | | | 1,035 | | 1,418 | | | | | 1,083 | | | 1,381 | |
Shareholders’ equity (D) | | 844 | | 1,432 | | | 900 | | 1,322 | | | | | 1,004 | | | 1,290 | |
Less return of parent equity infusion in beginning of 08 | | - | | - | | | - | | - | | | | | 150 | | | - | |
| | | | | | | | | | | | | | | | | | | |
Adjusted Common Equity (E) | | 844 | | 1,432 | | | 900 | | 1,322 | | | | | 854 | | | 1,290 | |
Preferred membership interests without sinking fund (F) | | - | | 10 | | | - | | 10 | | | | | - | | | 10 | |
Adjusted total capital (A-B-C)+(E+F) | | 1,664 | | 3,057 | | | 1,935 | | 2,750 | | | | | 1,937 | | | 2,681 | |
Debt/Capital Ratio (A-B-C)/((A-B-C)+(E+F)) | | 49.3% | | 52.8% | | | 53.5% | | 51.6% | | | | | 55.9% | | | 51.5% | |
| | | | | | | | | | | | | | | | | | | |
| | | | |
EGSL/ETI NET DEBT TO NET CAPITAL
RATIO | | 2009 | | | 2008 | | | | | 2007 PRO FORMA | |
| ($ millions) | | ETI | | EGSL | | | ETI | | EGSL | | | | | ETI | | | EGSL | |
Currently maturing long-term debt | | 168 | | 12 | | | 101 | | 220 | | | | | 309 | | | 675 | |
Notes Payable | | - | | - | | | 160 | | - | | | | | - | | | - | |
Obligations under capital leases – current | | - | | 30 | | | - | | 24 | | | | | - | | | 29 | |
Obligations under capital leases – non-current | | - | | 126 | | | - | | 116 | | | | | - | | | 82 | |
Long-term debt | | 1,490 | | 1,614 | | | 1,084 | | 1,828 | | | | | 1,104 | | | 1,674 | |
| | | | | | | | | | | | | | | | | | | |
Total debt before adjustments (A) | | 1,658 | | 1,783 | | | 1,345 | | 2,188 | | | | | 1,413 | | | 2,460 | |
Less debt assumption by ETI (EGSL) (B) | | - | | 168 | | | - | | 770 | | | | | - | | | 1,079 | |
Less securitization debt (ETI) (C) | | 838 | | - | | | 310 | | - | | | | | 330 | | | - | |
| | | | | | | | | | | | | | | | | | | |
Adjusted total debt (A-B-C) | | 820 | | 1,615 | | | 1,035 | | 1,418 | | | | | 1,083 | | | 1,381 | |
Less cash and cash equivalents (D) | | 201 | | 144 | | | 2 | | 49 | | | | | 297 | | | 108 | |
| | | | | | | | | | | | | | | | | | | |
Net Debt (A-B-C-D) | | 619 | | 1,471 | | | 1,033 | | 1,369 | | | | | 786 | | | 1,273 | |
| | | | | | | |
Shareholders’ equity (E) | | 844 | | 1,432 | | | 900 | | 1,322 | | | | | 1,004 | | | 1,290 | |
Less return of parent equity infusion in beginning of 08 | | - | | - | | | - | | - | | | | | 150 | | | - | |
| | | | | | | | | | | | | | | | | | | |
Adjusted Common Equity (F) | | 844 | | 1,432 | | | 900 | | 1,322 | | | | | 854 | | | 1,290 | |
Preferred membership interests without sinking fund (G) | | - | | 10 | | | - | | 10 | | | | | - | | | 10 | |
Adjusted total capital (A-B-C)+(F+G) | | 1,664 | | 3,057 | | | 1,935 | | 2,750 | | | | | 1,937 | | | 2,681 | |
Less cash and cash equivalents (D) | | 201 | | 144 | | | 2 | | 49 | | | | | 297 | | | 108 | |
| | | | | | | | | | | | | | | | | | | |
Net Capitalization (A-B-C)+(F+G)-(D) | | 1,463 | | 2,913 | | | 1,933 | | 2,701 | | | | | 1,640 | | | 2,573 | |
Net Debt/Net Capital Ratio (A-B-C-D)/((A-B-C)+(F+G)-(D)) | | 42.3% | | 50.5% | | | 53.4% | | 50.7% | | | | | 47.9% | | | 49.5% | |
| | | | | | | | | | | | | | | | | | | |
| (a) | See page 65 for the Pro Forma EGSL Income Statement. |
Calculations may differ due to rounding.
72
REG G RECONCILIATIONS
ENTERGY GULF STATES AND ENTERGY TEXAS FINANCIAL MEASURES – RECONCILIATION OF GAAP TO NON-GAAP MEASURES (continued)
EGSL PRO FORMA CASH FLOW INTEREST COVERAGE
2007
| | | | | | | | | |
| ($ thousands) | | (A)
EGSL(a)
PER 2007 10-K | | | (B)
ETI
PER FORM 10 | | | (A-B)
EGSL
PRO FORMA | |
Net Income | | 192,779 | | | 58,921 | | | 133,858 | |
Adjustments to reconcile net income to net cash flow provided by operating activities: | | | | | | | | | |
Reserve for regulatory adjustments | | 363 | | | (363 | ) | | 726 | |
Other regulatory charges (credits) – net | | 29,923 | | | 16,808 | | | 13,115 | |
Depreciation, amortization, and decommissioning | | 220,376 | | | 68,345 | | | 152,031 | |
Deferred income taxes, investment tax credits, and non-current taxes accrued | | 98,734 | | | 218,873 | | | (120,139 | ) |
Changes in working capital: | | | | | | | | | |
Receivables | | (261,538 | ) | | (230,481 | ) | | (31,057 | ) |
Fuel inventory | | (18,377 | ) | | (10,939 | ) | | (7,438 | ) |
Accounts payable | | 38,685 | | | (1,328 | ) | | 40,013 | |
Taxes accrued | | (27,781 | ) | | 4,936 | | | (32,717 | ) |
Interest accrued | | 22,963 | | | 10,030 | | | 12,933 | |
Deferred fuel costs | | 35,363 | | | 21,619 | | | 13,744 | |
Other working capital accounts | | 197,802 | | | 86,598 | | | 111,204 | |
Provision for estimated losses and reserves | | (91,241 | ) | | (568 | ) | | (90,673 | ) |
Changes in other regulatory assets | | 116,317 | | | (21,038 | ) | | 137,355 | |
Other | | 6,372 | | | (45,422 | ) | | 51,794 | |
| | | | | | | | | | |
Net Cash Flow from Operating Activities | | 560,740 | | | 175,991 | | | 384,749 | |
| | | | | | | | | | |
EGSL Pro Forma Net Cash Flow from Operating Activities | | | | | (C | ) | | 384,749 | |
Cash Paid During Period for Interest – net of amount capitalized | | | | | (D | ) | | 131,280 | |
Operating Cash Flow before Interest Payments | | | | | (C+D | ) | | 516,029 | |
Interest and Other Charges | | | | | (E | ) | | 132,869 | (a) |
Pro Forma Cash Flow Interest Coverage | | | | | ((C+D)/E) | | | 3.9 | |
| | | | | | | | | | |
| (a) | Entergy Gulf States Louisiana, L.L.C. (EGSL) is the successor for financial reporting purposes to Entergy Gulf States, Inc. EGSL’s Cash Flow Statement for the year ended 2007 includes the operations of Entergy Texas, Inc. |
ENTERGY LOUISIANA FINANCIAL MEASURES – RECONCILIATION OF GAAP TO NON-GAAP MEASURES
2005-2009
| | | | | | | | | | | | |
| ($ millions) | | 2009 | | | 2008 | | 2007 | | | 2006 | | 2005 |
As-Reported Earnings (A) | | 225.9 | | | 150.6 | | 136.4 | | | 130.7 | | 128.1 |
Preferred dividends | | 7.0 | | | 7.0 | | 7.0 | | | 7.0 | | - |
Tax-effected interest expense | | 52.7 | | | 51.1 | | 48.2 | | | 50.5 | | 48.6 |
| | | | | | | | | | | | | |
As-Reported Earnings including preferred dividends and tax-effected interest expense (B) | | 285.6 | | | 208.7 | | 191.5 | | | 188.2 | | 176.6 |
| | | | | |
Special items | | | | | | | | | | | | |
Nuclear alignment | | - | | | - | | (2.2 | ) | | - | | - |
Total special items (C) | | - | | | - | | (2.2 | ) | | - | | - |
| | | | | |
Operational earnings including preferred dividends and tax-effected interest expense (B-C) | | 285.6 | | | 208.7 | | 193.7 | | | 188.2 | | 176.6 |
Operational earnings (A-C) | | 225.9 | | | 150.6 | | 138.6 | | | 130.7 | | 128.1 |
Average invested capital (D) | | 3,491 | | | 2,958 | | 2,697 | | | 2,562 | | 2,263 |
Average members’ equity (E) | | 1,710 | | | 1,531 | | 1,386 | | | 1,212 | | 1,069 |
| | | | | |
Gross debt (F) | | 1,902 | | | 1,462 | | 1,192 | | | 1,230 | | 1,271 |
Less cash and cash equivalents (G) | | 152 | | | 139 | | 0.3 | | | 3 | | 105 |
Net debt (F-G) | | 1,750 | | | 1,323 | | 1,192 | | | 1,227 | | 1,166 |
| | | | | |
Total capitalization (H) | | 3,813 | | | 3,170 | | 2,746 | | | 2,648 | | 2,476 |
Less cash and cash equivalents (I) | | 152 | | | 139 | | 0.3 | | | 3 | | 105 |
Net capitalization (H-I) | | 3,662 | | | 3,031 | | 2,745 | | | 2,645 | | 2,371 |
| | | | | |
(%) | | | | | | | | | | | | |
Return on average invested capital – As-Reported (B/D) | | 8.2 | | | 7.1 | | 7.1 | | | 7.3 | | 7.8 |
Return on average invested capital – Operational ((B-C)/D) | | 8.2 | | | 7.1 | | 7.2 | | | 7.3 | | 7.8 |
Return on average members’ equity – As-Reported (A/E) | | 13.2 | | | 9.8 | | 9.8 | | | 10.8 | | 12.0 |
Return on average members’ equity – Operational ((A-C)/E) | | 13.2 | | | 9.8 | | 10.0 | | | 10.8 | | 12.0 |
Debt to capital ratio (F/H) | | 49.9 | | | 46.1 | | 43.4 | | | 46.4 | | 51.3 |
Net debt to net capital ratio ((F-G)/(H-I)) | | 47.8 | | | 43.6 | | 43.4 | | | 46.4 | | 49.2 |
| | | | | | | | | | | | | |
Calculations may differ due to rounding.
73
REG G RECONCILIATIONS
ENTERGY MISSISSIPPI FINANCIAL MEASURES – RECONCILIATION OF GAAP TO NON-GAAP MEASURES
2005-2009
| | | | | | | | | | | |
| ($ millions) | | 2009 | | | 2008 | | 2007 | | 2006 | | 2005 |
As-Reported Earnings (A) | | 74.8 | | | 56.9 | | 69.3 | | 49.5 | | 58.8 |
Preferred dividends | | 2.8 | | | 2.8 | | 2.8 | | 2.8 | | 3.3 |
Tax-effected interest expense | | 30.5 | | | 27.7 | | 27.4 | | 29.9 | | 25.3 |
| | | | | | | | | | | | |
As-Reported Earnings including preferred dividends and tax-effected interest expense (B) | | 108.1 | | | 87.4 | | 99.5 | | 82.2 | | 87.4 |
| | | | | |
Special items | | - | | | - | | - | | - | | - |
| | | | | |
Total special items (C) | | - | | | - | | - | | - | | - |
| | | | | |
Operational earnings including preferred dividends and tax-effected interest expense (B-C) | | 108.1 | | | 87.4 | | 99.5 | | 82.2 | | 87.4 |
Operational earnings (A-C) | | 74.8 | | | 56.9 | | 69.3 | | 49.5 | | 58.8 |
Average invested capital (D) | | 1,505 | | | 1,415 | | 1,437 | | 1,391 | | 1,301 |
Average common equity (E) | | 677 | | | 661 | | 637 | | 595 | | 555 |
| | | | | |
Gross debt (F) | | 852 | | | 703 | | 704 | | 795 | | 695 |
Less cash and cash equivalents (G) | | 91 | | | 1 | | 41 | | 73 | | 5 |
Net debt (F-G) | | 760 | | | 702 | | 664 | | 722 | | 690 |
| | | | | |
Total capitalization (H) | | 1,591 | | | 1,419 | | 1,411 | | 1,463 | | 1,319 |
Less cash and cash equivalents (I) | | 91 | | | 1 | | 41 | | 73 | | 5 |
Net capitalization (H-I) | | 1,499 | | | 1,418 | | 1,371 | | 1,390 | | 1,314 |
| | | | | |
(%) | | | | | | | | | | | |
Return on average invested capital – As-Reported (B/D) | | 7.2 | | | 6.2 | | 6.9 | | 5.9 | | 6.7 |
Return on average invested capital – Operational ((B-C)/D) | | 7.2 | | | 6.2 | | 6.9 | | 5.9 | | 6.7 |
Return on average common equity – As-Reported (A/E) | | 11.0 | | | 8.6 | | 10.9 | | 8.3 | | 10.6 |
Return on average common equity – Operational ((A-C)/E) | | 11.0 | | | 8.6 | | 10.9 | | 8.3 | | 10.6 |
Debt to capital ratio (F/H) | | 53.5 | | | 49.6 | | 49.9 | | 54.3 | | 52.7 |
Net debt to net capital ratio ((F-G)/(H-I)) | | 50.7 | | | 49.5 | | 48.4 | | 51.9 | | 52.6 |
| | | | | | | | | | | | |
ENTERGY NEW ORLEANS FINANCIAL MEASURES – RECONCILIATION OF GAAP TO NON-GAAP MEASURES
2005-2009
| | | | | | | | | | | |
| ($ millions) | | 2009 | | | 2008 | | 2007 | | 2006 | | 2005 |
As-Reported Earnings (A) | | 30.0 | | | 34.0 | | 23.5 | | 4.1 | | 0.8 |
Preferred dividends | | 1.0 | | | 1.0 | | 1.1 | | 1.3 | | 0.5 |
Tax-effected interest expense | | 10.4 | | | 12.7 | | 12.4 | | 10.4 | | 6.7 |
| | | | | | | | | | | | |
As-Reported Earnings including preferred dividends and tax-effected interest expense (B) | | 41.4 | | | 47.7 | | 37.0 | | 15.8 | | 8.0 |
| | | | | |
Special items | | - | | | - | | - | | - | | - |
| | | | | |
Total special items (C) | | - | | | - | | - | | - | | - |
| | | | | |
Operational earnings including preferred dividends and tax-effected interest expense (B-C) | | 41.4 | | | 47.7 | | 37.0 | | 15.8 | | 8.0 |
Operational earnings (A-C) | | 30.0 | | | 34.0 | | 23.5 | | 4.1 | | 0.8 |
Average invested capital (D) | | 502 | | | 503 | | 478 | | 480 | | 454 |
Average common equity (E) | | 210 | | | 194 | | 166 | | 152 | | 152 |
| | | | | |
Gross debt (F) | | 272 | | | 273 | | 304 | | 282 | | 335 |
Less cash and cash equivalents (G) | | 191 | | | 137 | | 92 | | 17 | | 48 |
Net debt (F-G) | | 81 | | | 136 | | 212 | | 265 | | 287 |
| | | | | |
Total capitalization (H) | | 501 | | | 504 | | 501 | | 456 | | 505 |
Less cash and cash equivalents (I) | | 191 | | | 137 | | 92 | | 17 | | 48 |
Net capitalization (H-I) | | 309 | | | 367 | | 409 | | 438 | | 457 |
| | | | | |
(%) | | | | | | | | | | | |
Return on average invested capital – As-Reported (B/D) | | 8.2 | | | 9.5 | | 7.7 | | 3.3 | | 1.8 |
Return on average invested capital – Operational ((B-C)/D) | | 8.2 | | | 9.5 | | 7.7 | | 3.3 | | 1.8 |
Return on average common equity – As-Reported (A/E) | | 14.3 | | | 17.5 | | 14.2 | | 2.7 | | 0.5 |
Return on average common equity – Operational ((A-C)/E) | | 14.3 | | | 17.5 | | 14.2 | | 2.7 | | 0.5 |
Debt to capital ratio (F/H) | | 54.4 | | | 54.1 | | 60.6 | | 61.9 | | 66.4 |
Net debt to net capital ratio ((F-G)/(H-I)) | | 26.2 | | | 37.0 | | 51.8 | | 60.4 | | 62.8 |
| | | | | | | | | | | | |
Calculations may differ due to rounding.
74
REG G RECONCILIATIONS
SYSTEM ENERGY RESOURCES FINANCIAL MEASURES – RECONCILIATION OF GAAP TO NON-GAAP MEASURES
2005-2009
| | | | | | | | | | | | |
| ($ millions) | | 2009 | | | 2008 | | 2007 | | | 2006 | | 2005 |
As-Reported Net Income (A) | | 48.9 | | | 91.1 | | 136.1 | | | 140.3 | | 111.6 |
Preferred dividends | | - | | | - | | - | | | - | | - |
Tax-effected interest expense | | 26.7 | | | 33.9 | | 34.5 | | | 36.5 | | 36.9 |
| | | | | | | | | | | | | |
As-Reported Net Income including preferred dividends and tax-effected interest expense (B) | | 75.6 | | | 125.0 | | 170.6 | | | 176.8 | | 148.5 |
| | | | | |
Special items | | | | | | | | | | | | |
Nuclear Alignment | | - | | | - | | (1.9 | ) | | - | | - |
Total special items (C) | | - | | | - | | (1.9 | ) | | - | | - |
| | | | | |
Operational earnings including preferred dividends and tax-effected interest expense (B-C) | | 75.6 | | | 125.0 | | 172.5 | | | 176.8 | | 148.5 |
Operational earnings (A-C) | | 48.9 | | | 91.1 | | 138.0 | | | 140.3 | | 111.6 |
Average invested capital (D) | | 1,703 | | | 1,750 | | 1,740 | | | 1,782 | | 1,831 |
Average common equity (E) | | 843 | | | 859 | | 860 | | | 876 | | 894 |
| | | | | |
Gross debt (F) | | 820 | | | 899 | | 882 | | | 879 | | 934 |
Less cash and cash equivalents (G) | | 264 | | | 103 | | 105 | | | 135 | | 76 |
Net debt (F-G) | | 556 | | | 796 | | 777 | | | 744 | | 858 |
| | | | | |
Total capitalization (H) | | 1,650 | | | 1,755 | | 1,744 | | | 1,736 | | 1,827 |
Less cash and cash equivalents (I) | | 264 | | | 103 | | 105 | | | 135 | | 76 |
Net capitalization (H-I) | | 1,386 | | | 1,652 | | 1,639 | | | 1,601 | | 1,751 |
| | | | | |
(%) | | | | | | | | | | | | |
Return on average invested capital – As-Reported (B/D) | | 4.4 | | | 7.1 | | 9.8 | | | 9.9 | | 8.1 |
Return on average invested capital – Operational ((B-C)/D) | | 4.4 | | | 7.1 | | 9.9 | | | 9.9 | | 8.1 |
Return on average common equity – As-Reported (A/E) | | 5.8 | | | 10.6 | | 15.8 | | | 16.0 | | 12.5 |
Return on average common equity – Operational ((A-C)/E) | | 5.8 | | | 10.6 | | 16.0 | | | 16.0 | | 12.5 |
Debt to capital ratio (F/H) | | 49.7 | | | 51.2 | | 50.6 | | | 50.6 | | 51.1 |
Net debt to net capital ratio ((F-G)/(H-I)) | | 40.1 | | | 48.2 | | 47.4 | | | 46.4 | | 49.0 |
| | | | | | | | | | | | | |
ENTERGY NUCLEAR FINANCIAL MEASURES – RECONCILIATION OF GAAP TO NON-GAAP MEASURES
2005-2009
| | | | | | | | | | | | | |
| ($ millions) | | 2009 | | | 2008 | | | 2007 | | | 2006 | | 2005 |
As-Reported Net Income (A) | | 631.0 | | | 797.3 | | | 539.2 | | | 309.5 | | 282.6 |
Preferred dividends | | - | | | - | | | - | | | - | | - |
Tax-effected interest expense | | 34.4 | | | 33.2 | | | 21.4 | | | 29.2 | | 31.3 |
| | | | | | | | | | | | | | |
As-Reported Net Income including preferred dividends and tax-effected interest expense (B) | | 665.4 | | | 830.4 | | | 560.6 | | | 338.7 | | 313.9 |
| | | | | |
Special items | | | | | | | | | | | | | |
Nuclear alignment | | - | | | - | | | (18.4 | ) | | - | | - |
Non-utility nuclear spin-off dis-synergies | | (44.0 | ) | | - | | | - | | | - | | - |
Total special items (C) | | (44.0 | ) | | - | | | (18.4 | ) | | - | | - |
| | | | | |
Operational earnings including preferred dividends and tax-effected interest expense (B-C) | | 709.4 | | | 830.4 | | | 579.0 | | | 338.7 | | 313.9 |
Operational earnings (A-C) | | 675.0 | | | 797.3 | | | 557.6 | | | 309.5 | | 282.6 |
Average invested capital (D) | | 4,703 | | | 4,115 | | | 3,498 | | | 2,893 | | 2,717 |
Average common equity (E) | | 4,498 | | | 3,822 | | | 3,092 | | | 2,413 | | 2,083 |
| | | | | |
Gross debt (F) | | 187 | | | 222 | | | 364 | | | 448 | | 512 |
Less cash and cash equivalents (G) | | 393 | | | 413 | | | 429 | | | 384 | | 212 |
Net debt (F-G) | | (206 | ) | | (191 | ) | | (65 | ) | | 64 | | 300 |
| | | | | |
Total capitalization (H) | | 5,014 | | | 4,393 | | | 3,837 | | | 3,159 | | 2,626 |
Less cash and cash equivalents (I) | | 393 | | | 413 | | | 429 | | | 384 | | 212 |
Net capitalization (H-I) | | 4,620 | | | 3,980 | | | 3,408 | | | 2,775 | | 2,414 |
| | | | | |
(%) | | | | | | | | | | | | | |
Return on average invested capital – As-Reported (B/D) | | 14.1 | | | 20.2 | | | 16.0 | | | 11.7 | | 11.6 |
Return on average invested capital – Operational ((B-C)/D) | | 15.1 | | | 20.2 | | | 16.6 | | | 11.7 | | 11.6 |
Return on average common equity – As-Reported (A/E) | | 14.0 | | | 20.9 | | | 17.4 | | | 14.0 | | 13.6 |
Return on average common equity – Operational ((A-C)/E) | | 15.0 | | | 20.9 | | | 18.0 | | | 14.0 | | 13.6 |
Debt to capital ratio (F/H) | | 3.7 | | | 5.1 | | | 9.7 | | | 14.2 | | 19.5 |
Net debt to net capital ratio ((F-G)/(H-I)) | | (4.5 | ) | | (4.8 | ) | | (1.9 | ) | | 2.3 | | 12.4 |
| | | | | | | | | | | | | | |
Calculations may differ due to rounding.
75
REG G RECONCILIATIONS
ENTERGY NUCLEAR FINANCIAL MEASURES – RECONCILIATION OF GAAP TO NON-GAAP MEASURES
1Q08-4Q09
| | | | | | | | | | | | | | | | | | | | | | | | |
| ($ millions) | | 1Q09 | | | 2Q09 | | | 3Q09 | | | 4Q09 | | | 1Q08 | | | 2Q08 | | | 3Q08 | | | 4Q08 | |
For the quarter: | | | | | | | | | | | | | | | | | | | | | | | | |
As-Reported Net Income (A) | | 180.9 | | | 80.2 | | | 200.4 | | | 169.5 | | | 221.7 | | | 143.6 | | | 205.3 | | | 226.6 | |
Less special items (B) | | (6.6 | ) | | (15.1 | ) | | (10.3 | ) | | (12.0 | ) | | - | | | - | | | - | | | - | |
| | | | | | | | | | | | | | | | | | | | | | | | | |
Operational earnings (A-B) | | 187.5 | | | 95.3 | | | 210.7 | | | 181.5 | | | 221.7 | | | 143.6 | | | 205.3 | | | 226.6 | |
| | | | | | | | |
As-Reported Net Income, rolling 12 months (C) | | 756.5 | | | 693.1 | | | 688.2 | | | 631.0 | | | 632.7 | | | 667.6 | | | 712.0 | | | 797.3 | |
Preferred dividends | | - | | | - | | | - | | | - | | | - | | | - | | | - | | | - | |
Tax-effected interest expense | | 33.3 | | | 33.7 | | | 35.2 | | | 34.4 | | | 24.1 | | | 29.8 | | | 32.5 | | | 33.2 | |
| | | | | | | | | | | | | | | | | | | | | | | | | |
As-Reported Net Income, rolling 12 months including preferred dividends and tax-effected interest expense (D) | | 789.8 | | | 726.7 | | | 723.4 | | | 665.4 | | | 656.9 | | | 697.4 | | | 744.6 | | | 830.4 | |
| | | | | | | | |
Special items in prior quarters | | - | | | - | | | - | | | - | | | (18.4 | ) | | (18.4 | ) | | (18.4 | ) | | - | |
Special items 1Q08 through 4Q09 | | (6.6 | ) | | (21.7 | ) | | (32.0 | ) | | (44.0 | ) | | - | | | - | | | - | | | - | |
Total special items (E) | | (6.6 | ) | | (21.7 | ) | | (32.0 | ) | | (44.0 | ) | | (18.4 | ) | | (18.4 | ) | | (18.4 | ) | | - | |
| | | | | | | | |
Operational earnings, rolling 12 months including preferred dividends and tax-effected interest expense (D-E) | | 796.4 | | | 748.4 | | | 755.4 | | | 709.4 | | | 675.2 | | | 715.8 | | | 762.9 | | | 830.4 | |
Operational earnings, rolling 12 months (C-E) | | 763.1 | | | 714.7 | | | 720.1 | | | 675.0 | | | 651.1 | | | 686.0 | | | 730.4 | | | 797.3 | |
Average invested capital (F) | | 4,232 | | | 4,211 | | | 4,570 | | | 4,703 | | | 3,569 | | | 3,709 | | | 4,099 | | | 4,115 | |
Average common equity (G) | | 3,983 | | | 3,966 | | | 4,350 | | | 4,498 | | | 3,204 | | | 3,344 | | | 3,771 | | | 3,822 | |
| | | | | | | | |
Gross debt (H) | | 215 | | | 216 | | | 201 | | | 187 | | | 283 | | | 274 | | | 240 | | | 222 | |
Less cash and cash equivalents (I) | | 456 | | | 517 | | | 150 | | | 393 | | | 588 | | | 693 | | | 1,013 | | | 413 | |
Net debt (H-I) | | (241 | ) | | (301 | ) | | 51 | | | (206 | ) | | (305 | ) | | (420 | ) | | (773 | ) | | (191 | ) |
| | | | | | | | |
Total capitalization (J) | | 4,630 | | | 4,744 | | | 4,899 | | | 5,014 | | | 3,834 | | | 3,678 | | | 4,242 | | | 4,393 | |
Less cash and cash equivalents (K) | | 456 | | | 517 | | | 150 | | | 393 | | | 588 | | | 693 | | | 1,013 | | | 413 | |
Net capital (J-K) | | 4,174 | | | 4,227 | | | 4,749 | | | 4,620 | | | 3,246 | | | 2,984 | | | 3,229 | | | 3,980 | |
| | | | | | | | |
(%) | | | | | | | | | | | | | | | | | | | | | | | | |
Return on average invested capital – As-Reported (D/F) | | 18.7 | | | 17.3 | | | 15.8 | | | 14.1 | | | 18.4 | | | 18.8 | | | 18.2 | | | 20.2 | |
Return on average invested capital – Operational ((D-E)/F) | | 18.8 | | | 17.8 | | | 16.5 | | | 15.1 | | | 18.9 | | | 19.3 | | | 18.6 | | | 20.2 | |
Return on average common equity – As-Reported (C/G) | | 19.0 | | | 17.5 | | | 15.8 | | | 14.0 | | | 19.7 | | | 20.0 | | | 18.9 | | | 20.9 | |
Return on average common equity – Operational ((C-E)/G) | | 19.2 | | | 18.0 | | | 16.6 | | | 15.0 | | | 20.3 | | | 20.5 | | | 19.4 | | | 20.9 | |
Debt to capital ratio (H/J) | | 4.6 | | | 4.5 | | | 4.1 | | | 3.7 | | | 7.4 | | | 7.4 | | | 5.7 | | | 5.1 | |
Net debt to net capital ratio ((H-I)/(J-K)) | | (5.8 | ) | | (7.1 | ) | | 1.1 | | | (4.5 | ) | | (9.4 | ) | | (14.1 | ) | | (24.0 | ) | | (4.8 | ) |
| | | | | | | | | | | | | | | | | | | | | | | | | |
Calculations may differ due to rounding.
76
ENTERGY CORPORATION AND SUBSIDIARIES
INVESTOR NEWS
Entergy’s quarterly earnings results, webcasts, presentations, and other news and information of investor interest may be obtained by visiting the investor information page on Entergy’s corporate Web site at entergy.com or calling Entergy Shareholder Direct at 1-888-ENTERGY (368-3749).
INVESTOR RELATIONS
Security analysts, portfolio managers, and other members of the financial community may contact:
Michele Lopiccolo
Vice President, Investor Relations
Telephone: 504-576-4879
E–mail: mlopicc@entergy.com
SHAREHOLDER ACCOUNT INFORMATION
BNY Mellon Shareowner Services is Entergy’s transfer agent, registrar, dividend disbursing agent, and dividend reinvestment and stock purchase plan agent. Shareholders of record with questions about lost certificates, lost or missing dividend checks or notifications of change of address should contact:
BNY Mellon Shareowner Services
480 Washington Boulevard
Jersey City, NJ 07310
Telephone: 1-800-333-4368
Internet address: www.bnymellon.com/shareowner/isd
CORPORATE GOVERNANCE
Entergy’s Corporate Governance Guidelines, Board Committee Charters for the Corporate Governance, Audit, and Personnel Committees, and Entergy’s Code of Conduct may be accessed electronically by selecting the investor information page on Entergy’s corporate Web site at entergy.com.
ADDITIONAL INFORMATION
For copies of the above Corporate Governance documents, Entergy’s 10-K and 10-Q reports filed with the Securities and Exchange Commission, or for other investor information, call 1-888-ENTERGY or write to:
Entergy Corporation
Investor Relations
P.O. Box 61000
New Orleans, LA 70161
COMMON STOCK INFORMATION
The company’s common stock is listed on the New York and Chicago exchanges under the symbol “ETR” (CUSIP 29364G10). The Entergy share price is reported daily in the financial press under “Entergy” in most listings of New York Stock Exchange securities. Entergy common stock is a component of the following indices: S&P 500, S&P Utilities Index, Philadelphia Utility Index and the NYSE Composite Index, among others.
As of January 30, 2010, there were 189,198,163 shares of Entergy common stock outstanding. Shareholders of record totaled 38,480, and approximately 133,934 investors held Entergy stock in “street name” through a broker.
CERTIFICATIONS
In May 2009, Entergy’s Chief Executive Officer certified to the New York Stock Exchange that he was not aware of any violation of the NYSE corporate governance listing standards. Also, Entergy filed certifications regarding the quality of the company’s public disclosure, required by Section 302 of the Sarbanes-Oxley Act of 2002, as exhibits to its Report on Form 10-K for the fiscal year ended December 31, 2009.
ENTERGY COMMON STOCK PRICES
The high and low trading prices for each quarterly period in 2009 and 2008 were as follows (in dollars):
| | | | | | | | | | |
| | | | | 2009 | | 2008 |
| QUARTER | | | | HIGH | | LOW | | HIGH | | LOW |
1 | | | | 86.61 | | 59.87 | | 127.48 | | 99.45 |
2 | | | | 78.78 | | 63.39 | | 123.27 | | 107.94 |
3 | | | | 82.39 | | 71.76 | | 122.88 | | 83.78 |
4 | | | | 84.44 | | 76.10 | | 89.76 | | 61.93 |
| | | | | | | | | | | |
DIVIDEND PAYMENTS
The Board of Directors declares dividends quarterly and sets the record and payment dates. Subject to Board discretion, those dates for 2010 are:
| | | | |
| DECLARATION DATE | | RECORD DATE | | PAYMENT DATE |
January 29 | | February 11 | | March 1 |
April 3 | | May 12 | | June 1 |
July 30 | | August 12 | | September 1 |
October 29 | | November 12 | | December 1 |
| | | | | |
Quarterly dividend payments (in cents-per-share):
| | | | | | | | | | |
| QUARTER | | 2010 | | 2009 | | 2008 | | 2007 | | 2006 |
1 | | 75 | | 75 | | 75 | | 54 | | 54 |
2 | | 83 | | 75 | | 75 | | 54 | | 54 |
3 | | | | 75 | | 75 | | 75 | | 54 |
4 | | | | 75 | | 75 | | 75 | | 54 |
| | | | | | | | | | | |
PREFERRED STOCK DIVIDEND PAYMENTS
The board of directors for each preferred stock issuer declares preferred dividends quarterly and sets the record and payment dates. Subject to their discretion, those dates for 2010 are:
| | | | |
| OPERATING COMPANIES | | RECORD DATE | | PAYMENT DATE |
Entergy Arkansas, Inc. | | 12/27/09 | | 1/1/10 |
| | 3/31/10 | | 4/1/10 |
| | 6/30/10 | | 7/1/10 |
| | 9/30/10 | | 10/1/10 |
| | | | | |
Entergy Gulf States Louisiana, L.L.C. | | 2/28/10 | | 3/15/10 |
| | 5/31/10 | | 6/15/10 |
| | 8/30/10 | | 9/15/10 |
| | 11/30/10 | | 12/15/10 |
| | | | | |
Entergy Louisiana, LLC | | 2/28/10 | | 3/15/10 |
| | 5/31/10 | | 6/15/10 |
| | 8/30/10 | | 9/15/10 |
| | 11/30/10 | | 12/15/10 |
| | | | | |
Entergy Mississippi, Inc. | | 1/28/10 | | 2/1/10 |
| | 4/23/10 | | 5/1/10 |
| | 7/31/10 | | 8/1/10 |
| | 10/30/10 | | 11/1/10 |
| | | | | |
Entergy New Orleans, Inc. | | 12/27/09 | | 1/1/10 |
| | 3/31/10 | | 4/1/10 |
| | 6/30/10 | | 7/1/10 |
| | 9/30/10 | | 10/1/10 |
| | | | | |
77